Exhibit 99.2
First Quarter 2010 Supplemental Data
The Doctors Building Three — Hoffman Estates, IL
All amounts shown in this report are unaudited and in U.S. dollars unless otherwise noted.
Ventas, Inc.
First Quarter 2010 Supplemental Data
Table of Contents
| | | | | |
Portfolio Overview | | | | |
| | | | | |
| Triple-Net, Managed and Loan Portfolio | | | 1-2 | |
| | | | | |
| Property Type and Operator Revenue/NOI Concentration Charts | | | 3 | |
| | | | | |
| Private Pay Owned Asset Composition Trend | | | 4 | |
| | | | | |
| Revenue Rollover Schedule | | | 5 | |
| | | | | |
| Company Development Data | | | 6 | |
| | | | | |
Triple-Net Leased Portfolio | | | | |
| | | | | |
| Same-Store Cash Flow Coverage and Occupancy Comparison | | | 7 | |
| | | | | |
| Kindred Healthcare Same-Store TTM EBITDARM Coverage Ratios | | | 8 | |
| | | | | |
| Cash Flow Coverage and Occupancy Trend Charts | | | 9-11 | |
| | | | | |
Medical Office Building Portfolio | | | | |
| | | | | |
| Year-over-Year and Sequential Quarter Comparison | | | 12 | |
| | | | | |
| Stabilized Portfolio Net Operating Income and Occupancy Trend Chart | | | 13 | |
| | | | | |
Seniors Housing Operating Portfolio | | | | |
| | | | | |
| Year-over-Year and Sequential Quarter Comparison | | | 14 | |
| | | | | |
| Stabilized Portfolio Net Operating Income, Occupancy and Average Daily Rate Trend Charts | | | 15 | |
| | | | | |
Consolidated Financial Information | | | | |
| | | | | |
| Historical Normalized FFO/Share | | | 16 | |
| | | | | |
| Capitalization | | | 17 | |
| | | | | |
| Debt Maturity Information | | | 18-19 | |
| | | | | |
| Debt Covenants | | | 20-21 | |
| | | | | |
| Consolidated Financial Statements | | | 22-26 | |
| | | | | |
| Funds From Operations (FFO) and Normalized FFO and Funds Available for Distribution (FAD) | | | 27 | |
| | | | | |
| Normalized FFO and FAD Guidance for the Year Ending December 31, 2010 | | | 28 | |
| | | | | |
| Net Debt to Adjusted EBITDA | | | 29 | |
Ventas, Inc.
First Quarter 2010 Supplemental Data
Owned Portfolio — Overview by Type (Dollars in Millions):1
| | | | | | | | | | | | | | | | | | | | | | | | | | | | | | | | | | | | | | | | | | | | | | | | | | | |
| | | | | | | | | | | | | | | | | | | | | | | | | | | | | | | | | Annualized | | | | | | | | | | | Annualized | | | | |
| | | | | | | | | | | | | Number | | | | | | | | | | | | | | | Annualized | | | Operating | | | Total | | | Annualized | | | Operating | | | Total | |
| | | Number of | | | Number of | | of States/ | | | Ventas | | | Cash Flow | | | | | | | NNN | | | Property | | | Annualized | | | NNN | | | Property | | | Annualized | |
| Property Type | | Properties | | | Beds/Units/Square Feet | | Provinces | | | Investment | | | Coverage | | | Occupancy2 | | | Revenue3 | | | Revenue3 | | | Revenue3 | | | NOI3 | | | NOI3 | | | NOI3 | |
| Hospital — Stabilized Triple-Net | | | 40 | | | | 3,517 | | | Beds | | | 17 | | | $ | 345 | | | | 2.4 | x | | | 59.2 | % | | $ | 94 | | | $ | 0 | | | $ | 94 | | | $ | 94 | | | $ | 0 | | | $ | 94 | |
| Skilled Nursing — Stabilized Triple-Net | | | 187 | | | | 22,377 | | | Beds | | | 29 | | | | 809 | | | | 1.9 | x | | | 89.7 | % | | | 179 | | | | 0 | | | | 179 | | | | 179 | | | | 0 | | | | 179 | |
| Seniors Housing — Triple-Net | | | 164 | | | | 16,718 | | | Units | | | 31 | | | | 2,266 | | | | 1.3 | x | | | 88.8 | % | | | 196 | | | | 0 | | | | 196 | | | | 196 | | | | 0 | | | | 196 | |
| Seniors Housing — Operating | | | 80 | | | | 6,553 | | | Units | | | 22 | | | | 2,034 | | | | N/A | | | | 88.4 | % | | | 0 | | | | 371 | | | | 371 | | | | 0 | | | | 116 | | | | 116 | |
| Medical Office — Stabilized | | | 22 | | | | 1,382,697 | | | Square Feet | | | 9 | | | | 308 | | | | N/A | | | | 95.0 | % | | | 0 | | | | 40 | | | | 40 | | | | 0 | | | | 27 | | | | 27 | |
| Medical Office — Lease-Up | | | 4 | | | | 332,053 | | | Square Feet | | | 4 | | | | 56 | | | | N/A | | | | 73.4 | % | | | 0 | | | | 6 | | | | 6 | | | | 0 | | | | 4 | | | | 4 | |
| Other — Stabilized Triple-Net | | | 8 | | | | 122 | | | Beds | | | 1 | | | | 7 | | | | 3.6 | x | | | N/A | | | | 1 | | | | 0 | | | | 1 | | | | 1 | | | | 0 | | | | 1 | |
| | | | | | | | | | | | | | | | | | | | | | | | | | | | | | | | | | | | | | | | | | | |
| Total | | | 505 | | | | | | | | | | 45 | | | $ | 5,826 | | | | 1.8 | x | | | | | | $ | 471 | | | $ | 417 | | | $ | 888 | | | $ | 471 | | | $ | 146 | | | $ | 617 | |
| | | | | | | | | | | | | | | | | | | | | | | | | | | | | | | | | | | | | | | | | | | |
| | | | | | | | | | | | | | | | | | | | | | | | | | | | | | | | | | | | | | | | | | | | | | | | | | | |
| | | | | | | | | | | | | | | | | | | | | | | | | | | | | | 53 | % | | | 47 | % | | | 100 | % | | | 76 | % | | | 24 | % | | | 100 | % |
Loan Portfolio — Overview by Investment (Dollars in Millions):1
| | | | | | | | | | | | | | | | | | | | | | | |
| | | | | | | | | | | | | Borrower/ | | Effective | | | | | | |
| | | Original | | | Outstanding | | | Secured/ | | Asset | | Interest | | | Annualized | | | |
| Borrower | | Investment | | | Principal | | | Unsecured | | Type | | Rate | | | Revenue3 | | | Balance Sheet Line |
| Manor Care | | $ | 99 | | | $ | 112 | | | Secured | | SNF/ALF | | | 6.0 | % | | $ | 6 | | | Loans Receivable |
| HCA | | | 45 | | | | 50 | | | Unsecured | | Hospital | | | 9.7 | % | | | 4 | | | Other Assets |
| Emeritus Senior Living | | | 13 | | | | 14 | | | Secured | | Seniors Housing | | | 12.5 | % | | | 2 | | | Loans Receivable |
| Other — Secured | | | 34 | | | | 32 | | | Secured | | Various | | | 5.6 | % | | | 2 | | | Loans Receivable |
| Other — Unsecured | | | 14 | | | | 15 | | | Unsecured | | Hospital | | | 9.5 | % | | | 1 | | | Other Assets |
| | | | | | | | | | | | | | | | | | | | |
| Total | | $ | 205 | | | $ | 224 | | | | | | | | | | | $ | 15 | | | |
| | | | | | | | | | | | | | | | | | | | |
Owned Portfolio — Overview by State/Province:1
| | | | | | | | | | | | | | | | | | | | | | | | | | | | | | | | | | | | | | | | | | | | | | | | | |
| | | Totals | | | Hospital | | | Skilled Nursing | | | Seniors Housing | | | Medical Office | | | Other | |
| State/Province | | No. | | | % | | | No. | | | Beds | | | No. | | | Beds | | | No. | | | Units | | | No. | | | Sq. Feet | | | No. | | | Beds | |
| California | | | 37 | | | | 7 | % | | | 5 | | | | 455 | | | | 6 | | | | 771 | | | | 26 | | | | 3,301 | | | | 0 | | | | 0 | | | | 0 | | | | 0 | |
| Pennsylvania | | | 34 | | | | 7 | % | | | 2 | | | | 115 | | | | 6 | | | | 797 | | | | 24 | | | | 1,597 | | | | 2 | | | | 111,686 | | | | 0 | | | | 0 | |
| Massachusetts | | | 34 | | | | 7 | % | | | 2 | | | | 109 | | | | 26 | | | | 2,694 | | | | 6 | | | | 856 | | | | 0 | | | | 0 | | | | 0 | | | | 0 | |
| Ohio | | | 30 | | | | 6 | % | | | 0 | | | | 0 | | | | 12 | | | | 1,575 | | | | 16 | | | | 1,153 | | | | 2 | | | | 145,322 | | | | 0 | | | | 0 | |
| Kentucky | | | 29 | | | | 6 | % | | | 2 | | | | 424 | | | | 27 | | | | 3,054 | | | | 0 | | | | 0 | | | | 0 | | | | 0 | | | | 0 | | | | 0 | |
| Florida | | | 26 | | | | 5 | % | | | 6 | | | | 511 | | | | 0 | | | | 0 | | | | 14 | | | | 1,454 | | | | 6 | | | | 206,658 | | | | 0 | | | | 0 | |
| Illinois | | | 24 | | | | 5 | % | | | 4 | | | | 431 | | | | 1 | | | | 82 | | | | 17 | | | | 2,634 | | | | 2 | | | | 164,279 | | | | 0 | | | | 0 | |
| North Carolina | | | 24 | | | | 5 | % | | | 1 | | | | 124 | | | | 16 | | | | 1,802 | | | | 7 | | | | 518 | | | | 0 | | | | 0 | | | | 0 | | | | 0 | |
| Indiana | | | 23 | | | | 5 | % | | | 1 | | | | 59 | | | | 13 | | | | 1,867 | | | | 9 | | | | 1,001 | | | | 0 | | | | 0 | | | | 0 | | | | 0 | |
| Texas | | | 21 | | | | 4 | % | | | 7 | | | | 496 | | | | 0 | | | | 0 | | | | 3 | | | | 261 | | | | 3 | | | | 78,222 | | | | 8 | | | | 122 | |
| All Other | | | 223 | | | | 44 | % | | | 10 | | | | 793 | | | | 80 | | | | 9,735 | | | | 122 | | | | 10,496 | | | | 11 | | | | 1,008,583 | | | | 0 | | | | 0 | |
| | | | | | | | | | | | | | | | | | | | | | | | | | | | | | | | | | | | | |
| Total | | | 505 | | | | 100 | % | | | 40 | | | | 3,517 | | | | 187 | | | | 22,377 | | | | 244 | | | | 23,271 | | | | 26 | | | | 1,714,750 | | | | 8 | | | | 122 | |
| | | | | | | | | | | | | | | | | | | | | | | | | | | | | | | | | | | | | |
| | | |
| 1 | | Totals may not add due to rounding. |
| |
| 2 | | Occupancy shown for Seniors Housing excludes communities in lease-up. Occupancy for triple-net properties is as of 4Q09 and occupancy for operating properties is as of 1Q10. |
| |
| 3 | | Annualized first quarter Ventas revenue/NOI assuming all events occurred at the beginning of the period. Revenue/NOI reflects Ventas’s portion only for joint venture assets. |
1
Ventas, Inc.
First Quarter 2010 Supplemental Data
Owned and Loan Portfolio — Property Type Concentration:1
| | | | | | | | | | | | | | | | | | | | | | | | | | | | | |
| | | Owned | | | | | | | | | | | | | | | | | | | | | |
| | | Property | | | Ventas | | | | | | | Annualized | | | | | | | Annualized | | | | |
| Investment Type | | Count | | | Investment | | | % | | | Rent/Revenue2 | | | % | | | Rent/NOI2 | | | % | |
| Seniors Housing | | | 244 | | | $ | 4,300 | | | | 71 | % | | $ | 567 | | | | 63 | % | | $ | 312 | | | | 49 | % |
| Skilled Nursing | | | 187 | | | | 809 | | | | 13 | % | | | 179 | | | | 20 | % | | | 179 | | | | 28 | % |
| Hospital | | | 40 | | | | 345 | | | | 6 | % | | | 94 | | | | 10 | % | | | 94 | | | | 15 | % |
| Medical Office | | | 26 | | | | 365 | | | | 6 | % | | | 46 | | | | 5 | % | | | 30 | | | | 5 | % |
| Other | | | 8 | | | | 7 | | | NM | | | | 1 | | | NM | | | | 1 | | | NM | |
| Loans | | | N/A | | | | 224 | | | | 4 | % | | | 15 | | | | 2 | % | | | 15 | | | | 2 | % |
| | | | | | | | | | | | | | | | | | | | | | |
| Total | | | 505 | | | $ | 6,050 | | | | 100 | % | | $ | 903 | | | | 100 | % | | $ | 632 | | | | 100 | % |
| | | | | | | | | | | | | | | | | | | | | | |
Owned and Loan Portfolio — Operator Concentration:1
| | | | | | | | | | | | | | | | | | | | | | | | | | | | | |
| | | Owned | | | | | | | | | | | | | | | | | | | | | |
| | | Property | | | Ventas | | | | | | | Annualized | | | | | | | Annualized | | | | |
| Operator/Manager | | Count | | | Investment | | | % | | | Rent/Revenue2 | | | % | | | Rent/NOI2 | | | % | |
| Sunrise Senior Living | | | 79 | | | $ | 2,033 | | | | 34 | % | | $ | 369 | | | | 41 | % | | $ | 116 | | | | 18 | % |
| Brookdale Senior Living | | | 84 | | | | 1,403 | | | | 23 | % | | | 122 | | | | 13 | % | | | 122 | | | | 19 | % |
| Kindred Healthcare | | | 197 | | | | 906 | | | | 15 | % | | | 244 | | | | 27 | % | | | 244 | | | | 39 | % |
| Senior Care | | | 65 | | | | 630 | | | | 10 | % | | | 54 | | | | 6 | % | | | 54 | | | | 9 | % |
| Emeritus Senior Living | | | 11 | | | | 168 | | | | 3 | % | | | 18 | | | | 2 | % | | | 18 | | | | 3 | % |
| Capital Senior Living | | | 11 | | | | 158 | | | | 3 | % | | | 14 | | | | 2 | % | | | 14 | | | | 2 | % |
| NexCore | | | 7 | | | | 154 | | | | 3 | % | | | 21 | | | | 2 | % | | | 13 | | | | 2 | % |
| Manor Care | | | N/A | | | | 112 | | | | 2 | % | | | 6 | | | | 1 | % | | | 6 | | | | 1 | % |
| Formation | | | 11 | | | | 89 | | | | 1 | % | | | 11 | | | | 1 | % | | | 11 | | | | 2 | % |
| HCA | | | 1 | | | | 51 | | | | 1 | % | | | 4 | | | NM | | | | 4 | | | | 1 | % |
| Assisted Living Concepts | | | 8 | | | | 50 | | | | 1 | % | | | 5 | | | | 1 | % | | | 5 | | | | 1 | % |
| Grubb and Ellis | | | 5 | | | | 43 | | | | 1 | % | | | 5 | | | | 1 | % | | | 2 | | | NM | |
| All Other | | | 26 | | | | 253 | | | | 4 | % | | | 31 | | | | 3 | % | | | 23 | | | | 4 | % |
| | | | | | | | | | | | | | | | | | | | | | |
| Total | | | 505 | | | $ | 6,050 | | | | 100 | % | | $ | 903 | | | | 100 | % | | $ | 632 | | | | 100 | % |
| | | | | | | | | | | | | | | | | | | | | | |
Owned Portfolio — State/Province Concentration:1
| | | | | | | | | | | | | | | | | | | | | |
| | | Owned | | | | | | | | | | | | | | |
| | | Property | | | Annualized | | | | | | | Annualized | | | | |
| State/Province | | Count | | | Rent/Revenue2 | | | % | | | Rent/NOI2 | | | % | |
| California | | | 37 | | | $ | 112 | | | | 13 | % | | $ | 79 | | | | 13 | % |
| Illinois | | | 24 | | | | 95 | | | | 11 | % | | | 68 | | | | 11 | % |
| Ontario | | | 9 | | | | 52 | | | | 6 | % | | | 12 | | | | 2 | % |
| Massachusetts | | | 34 | | | | 50 | | | | 6 | % | | | 43 | | | | 7 | % |
| Pennsylvania | | | 34 | | | | 48 | | | | 5 | % | | | 26 | | | | 4 | % |
| New Jersey | | | 10 | | | | 40 | | | | 5 | % | | | 17 | | | | 3 | % |
| Florida | | | 26 | | | | 38 | | | | 4 | % | | | 36 | | | | 6 | % |
| Colorado | | | 16 | | | | 36 | | | | 4 | % | | | 20 | | | | 3 | % |
| Georgia | | | 16 | | | | 30 | | | | 3 | % | | | 17 | | | | 3 | % |
| New York | | | 14 | | | | 30 | | | | 3 | % | | | 19 | | | | 3 | % |
| All Other | | | 285 | | | | 356 | | | | 40 | % | | | 279 | | | | 45 | % |
| | | | | | | | | | | | | | | | |
| Total | | | 505 | | | $ | 888 | | | | 100 | % | | $ | 617 | | | | 100 | % |
| | | | | | | | | | | | | | | | |
| | | |
| 1 | | Dollars in millions. Totals may not add due to rounding. NM = not material. |
| |
| 2 | | Annualized first quarter Ventas revenue/NOI assuming all events occurred at the beginning of the period. Operating asset revenue/NOI reflects Ventas’s portion only for joint venture assets. |
2
Ventas, Inc.
First Quarter 2010 Supplemental Data
| | | |
| 1 | | Annualized first quarter Ventas revenue/NOI assuming all events occurred at the beginning of the period. Operating asset revenue/NOI reflects Ventas’s portion only for joint venture assets. Totals may not add due to rounding. |
3
Ventas, Inc.
First Quarter 2010 Supplemental Data
Private Pay Owned Asset Composition Trend:
Ventas Revenue by Tenant/Operator Underlying Payor Source1
Ventas isnot a Medicaid or Medicare recipient. Graph depicts Ventas’s revenues times
operator’s/tenant’s underlying source revenue percentage.
| | | |
| 1 | | Payor source at asset level for Company’s tenants and operators. 4Q09 is most recent data available. All seniors housing is assumed to be private pay. Totals may not add due to rounding. |
4
Ventas, Inc.
First Quarter 2010 Supplemental Data
Triple-Net and Operating Portfolio Revenue Rollover Schedule Excluding Seniors Housing Housing Operating Communities: 1
| | | | | | | | | | | | | | | | | | | | | | | | | | | | | |
| | | | | | | Lease Rollover Year | |
| | | Totals | | | 2010 | | | 2011 | | | 2012 | | | 2013 | | | 2014 | | | Thereafter | |
Hospital — Stabilized Triple-Net: | | | | | | | | | | | | | | | | | | | | | | | | | | | | |
| Annualized Revenue | | $ | 94.4 | | | | — | | | | — | | | | — | | | $ | 46.9 | | | | — | | | $ | 47.5 | |
| | | | | | | | | | | | | | | | | | | | | | | | | | | | | |
Skilled Nursing — Stabilized Triple-Net: | | | | | | | | | | | | | | | | | | | | | | | | | | | | |
| Annualized Revenue | | | 179.1 | | | | — | | | | — | | | $ | 2.2 | | | | 70.5 | | | $ | 2.8 | | | | 103.6 | |
| | | | | | | | | | | | | | | | | | | | | | | | | | | | | |
Seniors Housing — Stabilized Triple-Net: | | | | | | | | | | | | | | | | | | | | | | | | | | | | |
| Annualized Revenue | | | 196.4 | | | | — | | | | — | | | | 1.7 | | | | — | | | | 0.5 | | | | 194.2 | |
| | | | | | | | | | | | | | | | | | | | | | | | | | | | | |
Medical Office — Stabilized: | | | | | | | | | | | | | | | | | | | | | | | | | | | | |
Annualized Revenue2 | | | 38.7 | | | $ | 3.2 | | | $ | 4.2 | | | | 3.5 | | | | 2.8 | | | | 4.6 | | | | 20.4 | |
| | | | | | | | | | | | | | | | | | | | | | | | | | | | | |
Medical Office — Lease-Up: | | | | | | | | | | | | | | | | | | | | | | | | | | | | |
Annualized Revenue2 | | | 6.8 | | | | 0.1 | | | | 0.5 | | | | — | | | | — | | | | 0.4 | | | | 5.9 | |
| | | | | | | | | | | | | | | | | | | | | | | | | | | | | |
Other — Stabilized Triple-Net: | | | | | | | | | | | | | | | | | | | | | | | | | | | | |
| Annualized Revenue | | | 1.0 | | | | 1.0 | | | | — | | | | — | | | | — | | | | — | | | | — | |
| | | | | | | | | | | | | | | | | | | | | | |
| | | | | | | | | | | | | | | | | | | | | | | | | | | | | |
Total: | | | | | | | | | | | | | | | | | | | | | | | | | | | | |
| Annualized Revenue | | $ | 516.4 | | | $ | 4.3 | | | $ | 4.8 | | | $ | 7.4 | | | $ | 120.2 | | | $ | 8.3 | | | $ | 371.6 | |
| | | | | | | | | | | | | | | | | | | | | | |
| | | | | | | | | | | | | | | | | | | | | | | | | | | | | |
Percent of Total: | | | 100 | % | | | 1 | % | | | 1 | % | | | 1 | % | | | 23 | % | | | 2 | % | | | 72 | % |
| | | |
| 1 | | Annualized first quarter Ventas revenue assuming all events occurred at the beginning of the period. Dollars in millions. Totals may not add due to rounding. |
| |
| 2 | | Company’s partners’ share has not been eliminated from revenue. |
5
Ventas, Inc.
First Quarter 2010 Supplemental Data
Company Development Data:
| | | | | | | | | | | | | | | | | | | | | | | | | | | |
| | | | | | | | | | | | | | | | | Ventas | | | | | | | | | |
| | | | | Ventas | | | | | | | | | | | Estimated/Actual | | Total | | Ventas Fixed | | Expected | |
| | | | | Ownership | | | | | Property | | Number of | | Actual/Projected | | Acquisition | | Development | | Purchase Price | | Stabilized | |
| Status | | Property Name | | % | | | MSA | | Type | | Residents or Beds/Units/Square Feet | | Opening Date | | Date | | Cost1 | | (incl. FPAC)1 | | Yield | |
| In Lease-up | | Sunrise of Thorne Mills on Steeles | | | 80 | % | | Toronto | | IL/AL/ALZ | | 256 Residents / 229 Units / 210,000 SF | | September 2007 | | December 2007 | | Cdn $ | 62.8 | | Cdn $ | 52.7 | | | 8.0%-8.5% | |
6
Ventas, Inc.
First Quarter 2010 Supplemental Data
Same-Store Triple-Net Portfolio Trend Data for Properties Owned for the Full 4th Quarters of 2009 & 2008: 1,2
| | | | | | | | | | | | | | | | | | | | | | | | | | | | | | | | | | | | | |
| | | | | | | Sequential Quarter Comparison | | | Year-Over-Year Comparison | |
| | | | | | | 4Q09 | | | 3Q09 | | | | | | | | | | | 4Q09 | | | 4Q08 | | | | | | | |
| | | Number of | | | Cash Flow | | | Cash Flow | | | 4Q09 | | | 3Q09 | | | Cash Flow | | | Cash Flow | | | 4Q09 | | | 4Q08 | |
| Property Type | | Properties | | | Coverage | | | Coverage | | | Occupancy | | | Occupancy | | | Coverage | | | Coverage | | | Occupancy | | | Occupancy | |
| Hospital | | | 40 | | | | 2.4 | x | | | 2.5 | x | | | 59.2 | % | | | 57.3 | % | | | 2.4 | x | | | 2.5 | x | | | 59.2 | % | | | 59.2 | % |
| Skilled Nursing | | | 186 | | | | 1.9 | x | | | 1.9 | x | | | 89.8 | % | | | 89.6 | % | | | 1.9 | x | | | 2.0 | x | | | 89.8 | % | | | 89.3 | % |
| Seniors Housing | | | 163 | | | | 1.3 | x | | | 1.3 | x | | | 88.8 | % | | | 87.8 | % | | | 1.3 | x | | | 1.3 | x | | | 88.8 | % | | | 88.0 | % |
| Other | | | 8 | | | | 3.6 | x | | | 4.0 | x | | | N/A | | | | N/A | | | | 3.6 | x | | | 4.5 | x | | | N/A | | | | N/A | |
| | | | | | | | | | | | | | | | | | | | | | | | | | | | | | | | | | | | |
| Total | | | 397 | | | | 1.8 | x | | | 1.8 | x | | | | | | | | | | | 1.8 | x | | | 1.8 | x | | | | | | | | |
| | | | | | | | | | | | | | | | | | | | | | | | | | | | | | | | | | | | |
Same-Store Triple-Net Portfolio Trend Data for Properties Owned for the Full 3rd and 4th Quarters of 2009:1,2
| | | | | | | | | | | | | | | | | | | | | |
| | | | | | | Sequential Quarter Comparison | |
| | | | | | | 4Q09 | | | 3Q09 | | | | | | | |
| | | Number of | | | Cash Flow | | | Cash Flow | | | 4Q09 | | | 3Q09 | |
| Property Type | | Properties | | | Coverage | | | Coverage | | | Occupancy | | | Occupancy | |
| Hospital | | | 40 | | | | 2.4 | x | | | 2.5 | x | | | 59.2 | % | | | 57.3 | % |
| Skilled Nursing | | | 187 | | | | 1.9 | x | | | 1.9 | x | | | 89.7 | % | | | 89.6 | % |
| Seniors Housing | | | 163 | | | | 1.3 | x | | | 1.3 | x | | | 88.8 | % | | | 87.8 | % |
| Other | | | 8 | | | | 3.6 | x | | | 4.0 | x | | | N/A | | | | N/A | |
| | | | | | | | | | | | | | | | | | | | |
| Total | | | 398 | | | | 1.8 | x | | | 1.8 | x | | | | | | | | |
| | | | | | | | | | | | | | | | | | | | |
| | | |
| 1 | | Fourth quarter 2009 is most recent quarter available. |
| |
| 2 | | Cash flow coverages are for trailing twelve months or annualized where the Company’s ownership is for a shorter period. |
7
Ventas, Inc.
First Quarter 2010 Supplemental Data
Kindred Healthcare Same-Store TTM EBITDARM Coverage Ratios: 1
| | | | | | | | | | | | | | | | | | | | | |
| Ventas - Kindred | | Number of | | | Sequential Quarter Comparison | | | Year-Over-Year Comparison | |
| Master Lease | | Properties | | | 4Q09 | | | 3Q09 | | | 4Q09 | | | 4Q08 | |
| 1 | | | 81 | | | | 2.3 | x | | | 2.3 | x | | | 2.3 | x | | | 2.3 | x |
| 2 | | | 40 | | | | 1.9 | x | | | 2.0 | x | | | 1.9 | x | | | 2.0 | x |
| 3 | | | 36 | | | | 1.8 | x | | | 1.8 | x | | | 1.8 | x | | | 1.9 | x |
| 4 | | | 40 | | | | 2.3 | x | | | 2.3 | x | | | 2.3 | x | | | 2.3 | x |
| | | | | | | | | | | | | | | | | | | | |
Total | | | 197 | | | | 2.1 | x | | | 2.1 | x | | | 2.1 | x | | | 2.2 | x |
| | | | | | | | | | | | | | | | | | | | |
| | | | | | | | | | | | | | | | | | | | | |
| | | Number of | | | | | | | | | | | | | |
| Property Type | | Properties | | | 4Q09 | | | 3Q09 | | | 4Q09 | | | 4Q08 | |
| Hospital | | | 38 | | | | 2.4 | x | | | 2.5 | x | | | 2.4 | x | | | 2.5 | x |
| Skilled Nursing | | | 159 | | | | 1.9 | x | | | 1.9 | x | | | 1.9 | x | | | 2.0 | x |
| | | | | | | | | | | | | | | | | | | | |
Total | | | 197 | | | | 2.1 | x | | | 2.1 | x | | | 2.1 | x | | | 2.2 | x |
| | | | | | | | | | | | | | | | | | | | |
| | | |
| 1 | | Coverage reflects the ratio of Kindred’s EBITDARM to rent. EBITDARM is defined as earnings before interest, income taxes, depreciation, amortization, rent and management fees. In the calculation of trailing twelve months EBITDARM, intercompany profit pertaining to services provided by Kindred’s PeopleFirst Rehabilitation Division has been eliminated from purchased ancillary expenses within the Ventas portfolio. Fourth quarter 2009 is most recent quarter available. |
8
Ventas, Inc.
First Quarter 2010 Supplemental Data
Triple-Net Leased Portfolio Trends:
Hospital Portfolio Cash Flow Coverage and Occupancy1
| | | |
| 1 | | Cash flow coverages are for trailing twelve months or annualized where the Company’s ownership is for a shorter period. Fourth quarter 2009 is most recent quarter available. |
9
Ventas, Inc.
First Quarter 2010 Supplemental Data
Triple-Net Leased Portfolio Trends:
Skilled Nursing Portfolio Cash Flow Coverage and
Occupancy1
| | | |
| 1 | | Cash flow coverages are for trailing twelve months or annualized where the Company’s ownership is for a shorter period. Fourth quarter 2009 is most recent quarter available. |
10
Ventas, Inc.
First Quarter 2010 Supplemental Data
Triple-Net Leased Portfolio Trends:
Seniors Housing Portfolio Cash Flow Coverage and
Occupancy1
| | | |
| 1 | | Cash flow coverages are for trailing twelve months or annualized where the Company’s ownership is for a shorter period. Fourth quarter 2009 is most recent quarter available. |
11
Ventas, Inc.
First Quarter 2010 Supplemental Data
Medical Office Portfolio Statistics: 1
| | | | | | | | | | | | | | | | | | | | | | | | | |
| | | Year-Over-Year Comparison | |
| | | Stabilized | | | Same-Store Stabilized2,3 | | | Lease-Up | |
| | | 1Q10 | | | 1Q09 | | | 1Q10 | | | 1Q09 | | | 1Q10 | | | 1Q09 | |
| Number of properties: | | | 22 | | | | 19 | | | | 18 | | | | 18 | | | | 4 | | | | 2 | |
Number of square feet:4 | | | 1,382,697 | | | | 1,046,169 | | | | 1,043,437 | | | | 1,042,069 | | | | 332,053 | | | | 181,952 | |
| Average occupancy: | | | 95.0 | % | | | 94.8 | % | | | 94.3 | % | | | 94.7 | % | | | 73.4 | % | | | 61.7 | % |
Average annual rate per square foot:5 | | $ | 30 | | | $ | 29 | | | $ | 29 | | | $ | 29 | | | $ | 30 | | | $ | 37 | |
| | | | |
| Operating revenue: | | $ | 10.2 | | | $ | 7.3 | | | $ | 7.4 | | | $ | 7.3 | | | $ | 2.0 | | | $ | 1.1 | |
| Less expenses: | | | 3.4 | | | | 2.6 | | | | 2.5 | | | | 2.6 | | | | 0.8 | | | | 0.5 | |
| | | | | | | | | | | | | | | | | | | |
| Total NOI: | | | 6.8 | | | | 4.7 | | | | 4.9 | | | | 4.7 | | | | 1.1 | | | | 0.6 | |
| Less Company’s partners’ share: | | | 0.2 | | | | 0.4 | | | | 0.2 | | | | 0.4 | | | | 0.3 | | | | 0.0 | |
| | | | | | | | | | | | | | | | | | | |
| Ventas NOI: | | $ | 6.6 | | | $ | 4.3 | | | $ | 4.7 | | | $ | 4.2 | | | $ | 0.9 | | | $ | 0.6 | |
| | | | | | | | | | | | | | | | | | | |
| | | | |
| Total NOI Margin: | | | 66.9 | % | | | 64.6 | % | | | 66.5 | % | | | 64.5 | % | | | 58.2 | % | | | 59.9 | % |
| | | | | | | | | | | | | | | | | | | | | | | | | |
| | | Sequential Quarter Comparison | |
| | | Stabilized | | | Same-Store Stabilized2,3 | | | Lease-Up | |
| | | 1Q10 | | | 4Q09 | | | 1Q10 | | | 4Q09 | | | 1Q10 | | | 4Q09 | |
| Number of properties: | | | 22 | | | | 21 | | | | 18 | | | | 18 | | | | 4 | | | | 5 | |
Number of square feet:4 | | | 1,382,697 | | | | 1,281,357 | | | | 1,043,437 | | | | 1,042,728 | | | | 332,053 | | | | 432,742 | |
| Average occupancy: | | | 95.0 | % | | | 94.7 | % | | | 94.3 | % | | | 94.4 | % | | | 73.4 | % | | | 74.4 | % |
Average annual rate per square foot:5 | | $ | 30 | | | $ | 30 | | | $ | 29 | | | $ | 29 | | | $ | 30 | | | $ | 30 | |
| | | | |
| Operating revenue: | | $ | 10.2 | | | $ | 8.0 | | | $ | 7.4 | | | $ | 7.3 | | | $ | 2.0 | | | $ | 2.2 | |
| Less expenses: | | | 3.4 | | | | 2.7 | | | | 2.5 | | | | 2.5 | | | | 0.8 | | | | 0.8 | |
| | | | | | | | | | | | | | | | | | | |
| Total NOI: | | | 6.8 | | | | 5.3 | | | | 4.9 | | | | 4.8 | | | | 1.1 | | | | 1.4 | |
| Less Company’s partners’ share: | | | 0.2 | | | | 0.2 | | | | 0.2 | | | | 0.2 | | | | 0.3 | | | | 0.2 | |
| | | | | | | | | | | | | | | | | | | |
| Ventas NOI: | | $ | 6.6 | | | $ | 5.1 | | | $ | 4.7 | | | $ | 4.6 | | | $ | 0.9 | | | $ | 1.2 | |
| | | | | | | | | | | | | | | | | | | |
| | | | |
| Total NOI Margin: | | | 66.9 | % | | | 65.9 | % | | | 66.5 | % | | | 66.0 | % | | | 58.2 | % | | | 63.3 | % |
| | | |
| 1 | | Dollars in millions except for rate data. Totals may not add due to rounding. |
| |
| 2 | | Includes only those MOBs owned for the full period. |
| |
| 3 | | Includes only those MOBs owned in both comparison periods. |
| |
| 4 | | Number of square feet may vary due to BOMA re-measurement. |
| |
| 5 | | Average annual rate includes CAM adjustments. |
12
Ventas, Inc.
First Quarter 2010 Supplemental Data
Medical Office Stabilized Portfolio Trends:
NOI and Occupancy1
| | | |
| 1 | | Total property NOI, does not take into account Company’s partners’ share. |
13
Ventas, Inc.
First Quarter 2010 Supplemental Data
Seniors Housing Operating Portfolio Statistics: 1
| | | | | | | | | | | | | | | | | | | | | | | | | |
| | | Year-Over-Year Comparison | |
| | | Stabilized | | | Same-Store Stabilized2 | | | Lease-Up | |
| | | 1Q10 | | | 1Q09 | | | 1Q10 | | | 1Q09 | | | 1Q10 | | | 1Q09 | |
| Number of properties: | | | 78 | | | | 78 | | | | 78 | | | | 78 | | | | 1 | | | | 1 | |
| Number of units: | | | 6,284 | | | | 6,284 | | | | 6,284 | | | | 6,284 | | | | 229 | | | | 229 | |
| Resident day capacity: | | | 670,230 | | | | 669,690 | | | | 670,230 | | | | 669,690 | | | | 23,040 | | | | 23,040 | |
| Average resident occupancy: | | | 88.4 | % | | | 89.0 | % | | | 88.4 | % | | | 89.0 | % | | | 85.1 | % | | | 63.8 | % |
| Average daily rate / resident fees: | | $ | 178 | | | $ | 170 | | | $ | 178 | | | $ | 170 | | | $ | 141 | | | $ | 121 | |
| | | | |
| Operating revenue: | | $ | 105.4 | | | $ | 101.2 | | | $ | 105.4 | | | $ | 101.2 | | | $ | 2.8 | | | $ | 1.8 | |
| Less expenses: | | | 72.3 | | | | 71.1 | | | | 72.3 | | | | 71.1 | | | | 2.0 | | | | 1.4 | |
| | | | | | | | | | | | | | | | | | | |
| Total NOI: | | | 33.1 | | | | 30.1 | | | | 33.1 | | | | 30.1 | | | | 0.7 | | | | 0.4 | |
| Less Company’s partner’s share: | | | 4.7 | | | | 4.5 | | | | 4.7 | | | | 4.5 | | | | 0.2 | | | | 0.1 | |
| | | | | | | | | | | | | | | | | | | |
| Ventas NOI: | | $ | 28.3 | | | $ | 25.6 | | | $ | 28.3 | | | $ | 25.6 | | | $ | 0.6 | | | $ | 0.3 | |
| | | | | | | | | | | | | | | | | | | |
| | | | |
| Total NOI Margin: | | | 31.4 | % | | | 29.7 | % | | | 31.4 | % | | | 29.7 | % | | | 26.9 | % | | | 22.1 | % |
| | | | | | | | | | | | | | | | | | | | | | | | | |
| | | Sequential Quarter Comparison | |
| | | Stabilized | | | Same-Store Stabilized2 | | | Lease-Up | |
| | | 1Q10 | | | 4Q09 | | | 1Q10 | | | 4Q09 | | | 1Q10 | | | 4Q09 | |
| Number of properties: | | | 78 | | | | 78 | | | | 78 | | | | 78 | | | | 1 | | | | 1 | |
| Number of units: | | | 6,284 | | | | 6,284 | | | | 6,284 | | | | 6,284 | | | | 229 | | | | 229 | |
| Resident day capacity: | | | 670,230 | | | | 685,124 | | | | 670,230 | | | | 685,124 | | | | 23,040 | | | | 23,552 | |
| Average resident occupancy: | | | 88.4 | % | | | 88.8 | % | | | 88.4 | % | | | 88.8 | % | | | 85.1 | % | | | 77.7 | % |
| Average daily rate / resident fees: | | $ | 178 | | | $ | 174 | | | $ | 178 | | | $ | 174 | | | $ | 141 | | | $ | 139 | |
| | | | |
| Operating revenue: | | $ | 105.4 | | | $ | 105.7 | | | $ | 105.4 | | | $ | 105.7 | | | $ | 2.8 | | | $ | 2.5 | |
| Less expenses: | | | 72.3 | | | | 73.0 | | | | 72.3 | | | | 73.0 | | | | 2.0 | | | | 1.9 | |
| | | | | | | | | | | | | | | | | | | |
| Total NOI: | | | 33.1 | | | | 32.7 | | | | 33.1 | | | | 32.7 | | | | 0.7 | | | | 0.6 | |
| Less Company’s partner’s share: | | | 4.7 | | | | 4.9 | | | | 4.7 | | | | 4.9 | | | | 0.2 | | | | 0.1 | |
| | | | | | | | | | | | | | | | | | | |
| Ventas NOI: | | $ | 28.3 | | | $ | 27.8 | | | $ | 28.3 | | | $ | 27.8 | | | $ | 0.6 | | | $ | 0.5 | |
| | | | | | | | | | | | | | | | | | | |
| | | | |
| Total NOI Margin: | | | 31.4 | % | | | 30.9 | % | | | 31.4 | % | | | 30.9 | % | | | 26.9 | % | | | 23.9 | % |
| | | |
| 1 | | Dollars in millions except for rate data. Totals may not add due to rounding. |
| |
| 2 | | Includes only those communities stabilized in both comparison periods. |
14
Ventas, Inc.
First Quarter 2010 Supplemental Data
Seniors Housing Stabilized Operating Portfolio Trends:
| | | |
| 1 | | Total community NOI, does not take into account Company’s partner’s share. |
15
Ventas, Inc.
First Quarter 2010 Supplemental Data
Historical Normalized FFO/Share:1
| | | |
| 1 | | See Company’s public filings for a definition of normalized FFO. |
16
Ventas, Inc.
First Quarter 2010 Supplemental Data
Capitalization:
| | | | | | | | | | | | | | | | | | | | | | | | | |
| | | | | | | | | | | As of | | | | | | | | | | | As of | |
| | | | | | | | | | | March 31, | | | | | | | | | | | December 31, | |
| (In thousands, except per share amounts) | | | | | | | | | | 2010 | | | | | | | | | | | 2009 | |
Debt1 | | | | | | | | | | | | | | | | | | | | | | | | |
| Revolving credit facilities | | | | | | | | | | $ | 38,204 | | | | | | | | | | | $ | 8,466 | |
| Senior / convertible notes | | | | | | | | | | | 1,111,983 | | | | | | | | | | | | 1,109,929 | |
| Mortgage debt | | | | | | | | | | | 1,547,984 | | | | | | | | | | | | 1,551,706 | |
| | | | | | | | | | | | | | | | | | | | | | | |
| Total debt | | | | | | | | | | $ | 2,698,171 | | | | | | | | | | | $ | 2,670,101 | |
| | | | | | | | | | | | | | | | | | | | | | | |
| | | | | | | | | | | | | | | | | | | | | | | | | |
Enterprise Value | | | | | | | | | | | | | | | | | | | | | | | | |
| Total debt | | | | | | | | | | $ | 2,698,171 | | | | | | | | | | | $ | 2,670,101 | |
| Cash, including cash escrows pertaining to debt | | | | | | | | | | | (140,174 | ) | | | | | | | | | | | (114,639 | ) |
| | | | | | | | | | | | | | | | | | | | | | | |
| Net debt | | | | | | | | | | | 2,557,997 | | | | | | | | | | | | 2,555,462 | |
| | | | | | | | | | | | | | | | | | | | | | | | | |
| | | Number of Shares | | | Closing Price | | | | | | | Number of Shares | | | Closing Price | | | | | |
| Common Stock | | | 156,853 | | | $ | 47.48 | | | | 7,447,380 | | | | 156,612 | | | $ | 43.74 | | | | 6,850,209 | |
| | | | | | | | | | | | | | | | | | | | | | | |
| | | | | | | | | | | | | | | | | | | | | | | | | |
Enterprise Value2 | | | | | | | | | | $ | 10,005,377 | | | | | | | | | | | $ | 9,405,671 | |
| | | | | | | | | | | | | | | | | | | | | | | |
| | | | | | | | | | | | | | | | | | | | | | | | | |
Credit Statistics | | | | | | | | | | | | | | | | | | | | | | | | |
| Debt / Enterprise Value | | | | | | | | | | | 27 | % | | | | | | | | | | | 28 | % |
| Secured Debt / Enterprise Value | | | | | | | | | | | 15 | % | | | | | | | | | | | 16 | % |
| Net Debt / Adjusted EBITDA | | | | | | | | | | | 4.1 | x | | | | | | | | | | | 4.1 | x |
| | | | | | | | | | | | | | | | | | | | | | | | | |
| Adjusted EBITDA, annualized | | | | | | | | | | $ | 623,768 | | | | | | | | | | | $ | 625,640 | |
| | | |
| 1 | | Debt balances are net of discounts and fair market value. |
| |
| 2 | | Total debt plus total equity. |
17
Ventas, Inc.
First Quarter 2010 Supplemental Data
Debt Maturity Schedule:1
| | | |
| 1 | | Dollars in millions; data as of March 31, 2010 and excludes normal monthly principal amortization. The Company’s joint venture partners’ pro rata share of total maturities is approximately $143 million. |
18
Ventas, Inc.
First Quarter 2010 Supplemental Data
Debt Summary as of March 31, 2010
Debt Maturities and Scheduled Principal Amortization1
| | | | | | | | | | | | | | | | | | | | | | | | | | | | | | | | | |
| | | Revolving Credit Facilities | | | Senior/Convertible Notes | | | Mortgage Debt | | | Total Debt | |
| Period | | Amount | | | Rate2 | | | Amount | | | Rate2 | | | Amount3 | | | Rate2 | | | Amount | | | Rate2 | |
| | | | | | | | | | | | | |
| 2010 | | $ | — | | | | — | | | $ | 1,375 | | | | 6.8 | % | | $ | 195,924 | | | | 4.4 | % | | $ | 197,299 | | | | 4.4 | % |
| 2011 | | | — | | | | — | | | | 230,000 | | | | 3.9 | % | | | 97,773 | | | | 4.8 | % | | | 327,773 | | | | 4.2 | % |
| 2012 | | | 38,204 | | | | 3.0 | % | | | 82,433 | | | | 9.0 | % | | | 329,403 | | | | 6.2 | % | | | 450,040 | | | | 6.5 | % |
| 2013 | | | — | | | | — | | | | — | | | | — | | | | 168,335 | | | | 5.9 | % | | | 168,335 | | | | 5.9 | % |
| 2014 | | | — | | | | — | | | | 71,654 | | | | 6.6 | % | | | 52,651 | | | | 5.4 | % | | | 124,305 | | | | 6.1 | % |
| 2015 | | | — | | | | — | | | | 142,669 | | | | 7.1 | % | | | 80,619 | | | | 6.0 | % | | | 223,288 | | | | 6.7 | % |
| 2016 | | | — | | | | — | | | | 400,000 | | | | 6.5 | % | | | 204,818 | | | | 6.1 | % | | | 604,818 | | | | 6.4 | % |
| 2017 | | | — | | | | — | | | | 225,000 | | | | 6.8 | % | | | 47,403 | | | | 6.1 | % | | | 272,403 | | | | 6.6 | % |
| 2018 | | | — | | | | — | | | | — | | | | — | | | | 20,297 | | | | 6.5 | % | | | 20,297 | | | | 6.5 | % |
| 2019 | | | — | | | | — | | | | — | | | | — | | | | 257,127 | | | | 5.9 | % | | | 257,127 | | | | 5.9 | % |
| Thereafter | | | — | | | | — | | | | — | | | | — | | | | 82,654 | | | | 5.1 | % | | | 82,654 | | | | 5.1 | % |
| | | | | | | | | | | | | | | | | | | | | | | | | |
| Subtotal | | | 38,204 | | | | 3.0 | % | | | 1,153,131 | | | | 6.3 | % | | | 1,537,004 | | | | 5.7 | % | | | 2,728,339 | | | | 5.9 | % |
| | | | | | | | | | | | | | | | | | | | | | | | | | | | | | | | | |
| Discounts and Fair Market Value, net | | | — | | | | | | | | (41,148 | ) | | | | | | | 10,980 | | | | | | | | (30,168 | ) | | | | |
| | | | | | | | | | | | | | | | | | | | | | | | | | | | | |
| | | | | | | | | | | | | | | | | | | | | | | | | | | | | | | | | |
| Total | | $ | 38,204 | | | | | | | $ | 1,111,983 | | | | | | | $ | 1,547,984 | | | | | | | $ | 2,698,171 | | | | | |
| | | | | | | | | | | | | | | | | | | | | | | | | | | | | |
| | | | | | | | | | | | | | | | | | | | | | | | | | | | | | | | | |
| Weighted Average Maturity in Years | | | 1.4 | | | | | | | | 4.9 | | | | | | | | 5.1 | | | | | | | | 5.0 | | | | | |
| | | | | | | | | | | | | | | | | | | | | | | | | | | | | |
Debt Composition1
| | | | | | | | | | | | | |
| | | March 31, 2010 | |
| | | Amount | | | Rate2 | | | % of Total | |
| Fixed Rate Debt | | | | | | | | | | | | |
| Senior/Convertible Notes | | $ | 1,153,131 | | | | 6.3 | % | | | 42.3 | % |
| Mortgage Debt | | | 1,319,835 | | | | 6.3 | % | | | 48.4 | % |
| | | | | | | | | | | |
| Total Fixed Rate Debt | | $ | 2,472,966 | | | | 6.3 | % | | | 90.6 | % |
| | | | | | | | | | | |
| | | | | | | | | | | | | |
| Variable Rate Debt | | | | | | | | | | | | |
| Revolving Credit Facilities | | $ | 38,204 | | | | 3.0 | % | | | 1.4 | % |
| Mortgage Debt | | | 217,169 | | | | 1.6 | % | | | 8.0 | % |
| | | | | | | | | | | |
| Total Variable Rate Debt | | | 255,373 | | | | 1.8 | % | | | 9.4 | % |
| | | | | | | | | | | |
| Total Debt | | $ | 2,728,339 | | | | 5.9 | % | | | 100.0 | % |
| | | | | | | | | | |
| | | |
| 1 | | Dollars in thousands. |
| |
| 2 | | Rates are based on the cash interest paid on the outstanding debt and do not include amortization of discounts, fair market value or debt costs. |
| |
| 3 | | The Company’s joint venture partners’ pro rata share of total mortgage debt is approximately $159 million. |
19
Ventas, Inc.
First Quarter 2010 Supplemental Data
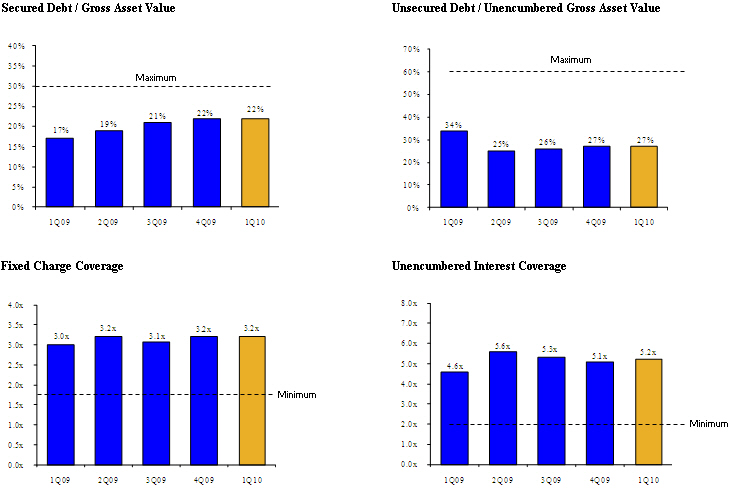
Debt Covenants:
| | | | | | | |
| | | Credit Facilities | |
| | | Required | | 03/31/10 | |
| Total Liabilities / Gross Asset Value | | Not greater than 60% | | | 38 | % |
| Secured Debt / Gross Asset Value | | Not greater than 30% | | | 22 | % |
| Unsecured Debt / Unencumb. Gross Asset Value | | Not greater than 60% | | | 27 | % |
| Fixed Charge Coverage | | Not less than 1.75x | | | 3.2 | x |
| Unencumbered Interest Coverage | | Not less than 2.00x | | | 5.2 | x |
| | | | | | | |
| | | Bonds due 2012 | |
| | | Required | | 03/31/10 | |
| Incurrence of Debt | | Not greater than 60% | | | 31 | % |
| Incurrence of Secured Debt | | Not greater than 40% | | | 10 | % |
| Total Unencumbered Assets | | Not less than 150% | | | 362 | % |
| Consolidated Income Available for Debt Service to Debt Service | | Not less than 2.00x | | | 5.2 | x |
20
Ventas, Inc.
First Quarter 2010 Supplemental Data
Debt Covenants:
21
CONSOLIDATED BALANCE SHEETS
As of March 31, 2010, December 31, 2009, September 30, 2009, June 30, 2009 and March 31, 2009
(In thousands, except per share amounts)
| | | | | | | | | | | | | | | | | | | | | |
| | | March 31, | | | December 31, | | | September 30, | | | June 30, | | | March 31, | |
| | | 2010 | | | 2009 | | | 2009 | | | 2009 | | | 2009 | |
Assets | | | | | | | | | | | | | | | | | | | | |
| Real estate investments: | | | | | | | | | | | | | | | | | | | | |
| Land | | $ | 557,370 | | | $ | 557,276 | | | $ | 557,123 | | | $ | 552,712 | | | $ | 554,286 | |
| Buildings and improvements | | | 5,735,896 | | | | 5,722,837 | | | | 5,641,309 | | | | 5,603,042 | | | | 5,592,051 | |
| Construction in progress | | | 4,370 | | | | 12,508 | | | | 8,611 | | | | 18,319 | | | | 21,176 | |
| | | | | | | | | | | | | | | | |
| | | | 6,297,636 | | | | 6,292,621 | | | | 6,207,043 | | | | 6,174,073 | | | | 6,167,513 | |
| Accumulated depreciation | | | (1,226,252 | ) | | | (1,177,911 | ) | | | (1,126,516 | ) | | | (1,075,293 | ) | | | (1,036,617 | ) |
| | | | | | | | | | | | | | | | |
| Net real estate property | | | 5,071,384 | | | | 5,114,710 | | | | 5,080,527 | | | | 5,098,780 | | | | 5,130,896 | |
| Loans receivable, net | | | 147,725 | | | | 131,887 | | | | 125,410 | | | | 125,106 | | | | 130,076 | |
| | | | | | | | | | | | | | | | |
| Net real estate investments | | | 5,219,109 | | | | 5,246,597 | | | | 5,205,937 | | | | 5,223,886 | | | | 5,260,972 | |
| Cash and cash equivalents | | | 132,729 | | | | 107,397 | | | | 70,889 | | | | 46,523 | | | | 95,806 | |
| Escrow deposits and restricted cash | | | 41,023 | | | | 39,832 | | | | 96,477 | | | | 94,470 | | | | 38,275 | |
| Deferred financing costs, net | | | 27,964 | | | | 29,252 | | | | 27,804 | | | | 29,569 | | | | 29,935 | |
| Other | | | 213,000 | | | | 193,167 | | | | 186,203 | | | | 176,413 | | | | 168,858 | |
| | | | | | | | | | | | | | | | |
| Total assets | | $ | 5,633,825 | | | $ | 5,616,245 | | | $ | 5,587,310 | | | $ | 5,570,861 | | | $ | 5,593,846 | |
| | | | | | | | | | | | | | | | |
| | | | | | | | | | | | | | | | | | | | | |
Liabilities and equity | | | | | | | | | | | | | | | | | | | | |
| Liabilities: | | | | | | | | | | | | | | | | | | | | |
| Senior notes payable and other debt | | $ | 2,698,171 | | | $ | 2,670,101 | | | $ | 2,615,142 | | | $ | 2,616,304 | | | $ | 2,942,401 | |
| Accrued interest | | | 35,773 | | | | 17,974 | | | | 35,481 | | | | 16,952 | | | | 42,121 | |
| Accounts payable and other liabilities | | | 183,574 | | | | 190,445 | | | | 179,753 | | | | 169,964 | | | | 168,082 | |
| Deferred income taxes | | | 252,687 | | | | 253,665 | | | | 254,622 | | | | 255,175 | | | | 255,570 | |
| | | | | | | | | | | | | | | | |
| Total liabilities | | | 3,170,205 | | | | 3,132,185 | | | | 3,084,998 | | | | 3,058,395 | | | | 3,408,174 | |
| | | | | | | | | | | | | | | | | | | | | |
| Commitments and contingencies | | | | | | | | | | | | | | | | | | | | |
| | | | | | | | | | | | | | | | | | | | | |
| Equity: | | | | | | | | | | | | | | | | | | | | |
| Ventas stockholders’ equity: | | | | | | | | | | | | | | | | | | | | |
| Preferred stock, $1.00 par value; 10,000 shares authorized, unissued | | | — | | | | — | | | | — | | | | — | | | | — | |
| Common stock, $0.25 par value; 156,862, 156,627, 156,605, 156,539 and 143,453 shares issued at March 31, 2010, December 31, 2009, September 30, 2009, June 30, 2009 and March 31, 2009, respectively | | | 39,341 | | | | 39,160 | | | | 39,155 | | | | 39,138 | | | | 35,867 | |
| Capital in excess of par value | | | 2,578,577 | | | | 2,573,039 | | | | 2,570,146 | | | | 2,565,933 | | | | 2,267,440 | |
| Accumulated other comprehensive income (loss) | | | 25,154 | | | | 19,669 | | | | 15,080 | | | | (1,411 | ) | | | (18,322 | ) |
| Retained earnings (deficit) | | | (196,972 | ) | | | (165,710 | ) | | | (139,478 | ) | | | (109,012 | ) | | | (117,124 | ) |
| Treasury stock, 10, 15, 0, 0 and 2 shares at March 31, 2010, December 31, 2009, September 30, 2009, June 30, 2009 and March 31, 2009, respectively | | | (467 | ) | | | (647 | ) | | | — | | | | (5 | ) | | | (53 | ) |
| | | | | | | | | | | | | | | | |
| Total Ventas stockholders’ equity | | | 2,445,633 | | | | 2,465,511 | | | | 2,484,903 | | | | 2,494,643 | | | | 2,167,808 | |
| Noncontrolling interest | | | 17,987 | | | | 18,549 | | | | 17,409 | | | | 17,823 | | | | 17,864 | |
| | | | | | | | | | | | | | | | |
| Total equity | | | 2,463,620 | | | | 2,484,060 | | | | 2,502,312 | | | | 2,512,466 | | | | 2,185,672 | |
| | | | | | | | | | | | | | | | |
| Total liabilities and equity | | $ | 5,633,825 | | | $ | 5,616,245 | | | $ | 5,587,310 | | | $ | 5,570,861 | | | $ | 5,593,846 | |
| | | | | | | | | | | | | | | | |
22
CONSOLIDATED STATEMENTS OF INCOME
For the three months ended March 31, 2010 and 2009
(In thousands, except per share amounts)
| | | | | | | | | |
| | | 2010 | | | 2009 | |
Revenues: | | | | | | | | |
| Rental income | | $ | 129,179 | | | $ | 122,398 | |
| Resident fees and services | | | 108,486 | | | | 102,939 | |
| Income from loans and investments | | | 3,617 | | | | 3,281 | |
| Interest and other income | | | 263 | | | | 286 | |
| | | | | | | |
| Total revenues | | | 241,545 | | | | 228,904 | |
| | | | | | | | | |
Expenses: | | | | | | | | |
| Interest | | | 44,300 | | | | 45,930 | |
| Depreciation and amortization | | | 52,476 | | | | 49,498 | |
| Property-level operating expenses | | | 78,879 | | | | 75,468 | |
| General, administrative and professional fees (including non-cash stock-based compensation expense of $3,032 and $3,059 for the three months ended March 31, 2010 and 2009, respectively) | | | 10,683 | | | | 10,598 | |
| Foreign currency gain | | | (106 | ) | | | (6 | ) |
| Loss on extinguishment of debt | | | — | | | | 105 | |
| Merger-related expenses and deal costs | | | 2,319 | | | | 2,054 | |
| | | | | | | |
| Total expenses | | | 188,551 | | | | 183,647 | |
| | | | | | | |
| Income before income taxes, discontinued operations and noncontrolling interest | | | 52,994 | | | | 45,257 | |
| Income tax (expense) benefit | | | (286 | ) | | | 547 | |
| | | | | | | |
| Income from continuing operations | | | 52,708 | | | | 45,804 | |
| Discontinued operations | | | 460 | | | | 29,165 | |
| | | | | | | |
| Net income | | | 53,168 | | | | 74,969 | |
| Net income attributable to noncontrolling interest (net of tax of $419 and $390 for the three months ended March 31, 2010 and 2009, respectively) | | | 549 | | | | 741 | |
| | | | | | | |
| Net income attributable to common stockholders | | $ | 52,619 | | | $ | 74,228 | |
| | | | | | | |
| | | | | | | | | |
Earnings per common share: | | | | | | | | |
| Basic: | | | | | | | | |
| Income from continuing operations attributable to common stockholders | | $ | 0.34 | | | $ | 0.32 | |
| Discontinued operations | | | 0.00 | | | | 0.20 | |
| | | | | | | |
| Net income attributable to common stockholders | | $ | 0.34 | | | $ | 0.52 | |
| | | | | | | |
| Diluted: | | | | | | | | |
| Income from continuing operations attributable to common stockholders | | $ | 0.34 | | | $ | 0.32 | |
| Discontinued operations | | | 0.00 | | | | 0.20 | |
| | | | | | | |
| Net income attributable to common stockholders | | $ | 0.34 | | | $ | 0.52 | |
| | | | | | | |
| | | | | | | | | |
Weighted average shares used in computing earnings per common share: | | | | | | | | |
| Basic | | | 156,453 | | | | 143,091 | |
| Diluted | | | 156,967 | | | | 143,145 | |
| | | | | | | | | |
| Dividends declared per common share | | $ | 0.535 | | | $ | 0.5125 | |
23
QUARTERLY CONSOLIDATED STATEMENTS OF INCOME
(In thousands, except per share amounts)
| | | | | | | | | | | | | | | | | | | | | |
| | | 2010 First | | | 2009 Quarters | |
| | | Quarter | | | Fourth | | | Third | | | Second | | | First | |
| | | | | | | | | | | | | | | | | | | | | |
Revenues: | | | | | | | | | | | | | | | | | | | | |
| Rental income | | $ | 129,179 | | | $ | 126,720 | | | $ | 125,466 | | | $ | 124,612 | | | $ | 122,398 | |
| Resident fees and services | | | 108,486 | | | | 108,205 | | | | 106,515 | | | | 103,399 | | | | 102,939 | |
| Income from loans and investments | | | 3,617 | | | | 3,279 | | | | 3,214 | | | | 3,333 | | | | 3,281 | |
| Interest and other income | | | 263 | | | | 349 | | | | 99 | | | | 108 | | | | 286 | |
| | | | | | | | | | | | | | | | |
| Total revenues | | | 241,545 | | | | 238,553 | | | | 235,294 | | | | 231,452 | | | | 228,904 | |
| | | | | | | | | | | | | | | | | | | | | |
Expenses: | | | | | | | | | | | | | | | | | | | | |
| Interest | | | 44,300 | | | | 44,456 | | | | 43,497 | | | | 43,994 | | | | 45,930 | |
| Depreciation and amortization | | | 52,476 | | | | 51,892 | | | | 50,146 | | | | 48,643 | | | | 49,498 | |
| Property-level operating expenses | | | 78,879 | | | | 78,443 | | | | 76,338 | | | | 72,564 | | | | 75,468 | |
| General, administrative and professional fees (including non-cash stock-based compensation expense of $3,032, $2,667, $3,078, $3,078 and $3,059, respectively) | | | 10,683 | | | | 8,220 | | | | 9,657 | | | | 10,355 | | | | 10,598 | |
| Foreign currency (gain) loss | | | (106 | ) | | | 19 | | | | 32 | | | | 5 | | | | (6 | ) |
| Loss on extinguishment of debt | | | — | | | | — | | | | — | | | | 5,975 | | | | 105 | |
| Merger-related expenses and deal costs | | | 2,319 | | | | 1,565 | | | | 5,894 | | | | 3,502 | | | | 2,054 | |
| | | | | | | | | | | | | | | | |
| Total expenses | | | 188,551 | | | | 184,595 | | | | 185,564 | | | | 185,038 | | | | 183,647 | |
| | | | | | | | | | | | | | | | |
| Income before income taxes, discontinued operations and noncontrolling interest | | | 52,994 | | | | 53,958 | | | | 49,730 | | | | 46,414 | | | | 45,257 | |
| Income tax (expense) benefit | | | (286 | ) | | | 367 | | | | 410 | | | | 395 | | | | 547 | |
| | | | | | | | | | | | | | | | |
| Income from continuing operations | | | 52,708 | | | | 54,325 | | | | 50,140 | | | | 46,809 | | | | 45,804 | |
| Discontinued operations | | | 460 | | | | 453 | | | | 290 | | | | 42,374 | | | | 29,165 | |
| | | | | | | | | | | | | | | | |
| Net income | | | 53,168 | | | | 54,778 | | | | 50,430 | | | | 89,183 | | | | 74,969 | |
| Net income attributable to noncontrolling interest (net of tax of $419, $422, $387, $541 and $390, respectively) | | | 549 | | | | 697 | | | | 625 | | | | 802 | | | | 741 | |
| | | | | | | | | | | | | | | | |
| Net income attributable to common stockholders | | $ | 52,619 | | | $ | 54,081 | | | $ | 49,805 | | | $ | 88,381 | | | $ | 74,228 | |
| | | | | | | | | | | | | | | | |
| | | | | | | | | | | | | | | | | | | | | |
Earnings per common share: | | | | | | | | | | | | | | | | | | | | |
| Basic: | | | | | | | | | | | | | | | | | | | | |
| Income from continuing operations attributable to common stockholders | | $ | 0.34 | | | $ | 0.35 | | | $ | 0.32 | | | $ | 0.30 | | | $ | 0.32 | |
| Discontinued operations | | | 0.00 | | | | 0.00 | | | | 0.00 | | | | 0.27 | | | | 0.20 | |
| | | | | | | | | | | | | | | | |
| Net income attributable to common stockholders | | $ | 0.34 | | | $ | 0.35 | | | $ | 0.32 | | | $ | 0.57 | | | $ | 0.52 | |
| | | | | | | | | | | | | | | | |
| Diluted: | | | | | | | | | | | | | | | | | | | | |
| Income from continuing operations attributable to common stockholders | | $ | 0.34 | | | $ | 0.35 | | | $ | 0.32 | | | $ | 0.30 | | | $ | 0.32 | |
| Discontinued operations | | | 0.00 | | | | 0.00 | | | | 0.00 | | | | 0.27 | | | | 0.20 | |
| | | | | | | | | | | | | | | | |
| Net income attributable to common stockholders | | $ | 0.34 | | | $ | 0.35 | | | $ | 0.32 | | | $ | 0.57 | | | $ | 0.52 | |
| | | | | | | | | | | | | | | | |
| | | | | | | | | | | | | | | | | | | | | |
Weighted average shares used in computing earnings per common share: | | | | | | | | | | | | | | | | | | | | |
| Basic | | | 156,453 | | | | 156,296 | | | | 156,250 | | | | 154,441 | | | | 143,091 | |
| Diluted | | | 156,967 | | | | 156,692 | | | | 156,516 | | | | 154,510 | | | | 143,145 | |
| | | | | | | | | | | | | | | | | | | | | |
| Dividends declared per common share | | $ | 0.535 | | | $ | 0.5125 | | | $ | 0.5125 | | | $ | 0.5125 | | | $ | 0.5125 | |
24
CONSOLIDATED STATEMENTS OF CASH FLOWS
For the three months ended March 31, 2010 and 2009
(In thousands)
| | | | | | | | | |
| | | 2010 | | | 2009 | |
| Cash flows from operating activities: | | | | | | | | |
| Net income | | $ | 53,168 | | | $ | 74,969 | |
| Adjustments to reconcile net income to net cash provided by operating activities: | | | | | | | | |
| Depreciation and amortization (including amounts in discontinued operations) | | | 52,537 | | | | 49,908 | |
| Amortization of deferred revenue and lease intangibles, net | | | (1,549 | ) | | | (1,858 | ) |
| Other amortization expenses | | | 2,154 | | | | 608 | |
| Stock-based compensation | | | 3,032 | | | | 3,059 | |
| Straight-lining of rental income | | | (2,449 | ) | | | (2,938 | ) |
| Loss on extinguishment of debt | | | — | | | | 158 | |
| Net gain on sale of real estate assets (including amounts in discontinued operations) | | | (184 | ) | | | (27,871 | ) |
| Income tax expense (benefit) | | | 286 | | | | (547 | ) |
| Other | | | 53 | | | | 157 | |
| Changes in operating assets and liabilities: | | | | | | | | |
| (Increase) decrease in other assets | | | (3,772 | ) | | | 1,688 | |
| Increase in accrued interest | | | 17,799 | | | | 20,190 | |
| Decrease in accounts payable and other liabilities | | | (5,514 | ) | | | (3,967 | ) |
| | | | | | | |
| Net cash provided by operating activities | | | 115,561 | | | | 113,556 | |
| Cash flows from investing activities: | | | | | | | | |
| Net investment in real estate property | | | (11,860 | ) | | | (8,387 | ) |
| Investment in loans receivable | | | (15,796 | ) | | | (7,373 | ) |
| Proceeds from real estate disposals | | | 754 | | | | 56,614 | |
| Proceeds from loans receivable | | | 1,192 | | | | 1,650 | |
| Capital expenditures | | | (4,295 | ) | | | (3,870 | ) |
| | | | | | | |
| Net cash (used in) provided by investing activities | | | (30,005 | ) | | | 38,634 | |
| Cash flows from financing activities: | | | | | | | | |
| Net change in borrowings under revolving credit facilities | | | 29,089 | | | | (87,046 | ) |
| Proceeds from debt | | | 196 | | | | 9,201 | |
| Repayment of debt | | | (7,807 | ) | | | (74,357 | ) |
| Payment of deferred financing costs | | | (1,113 | ) | | | (9,567 | ) |
| Cash distribution to common stockholders | | | (83,881 | ) | | | (73,546 | ) |
| Contributions from noncontrolling interest | | | 265 | | | | — | |
| Distributions to noncontrolling interest | | | (1,989 | ) | | | (1,414 | ) |
| Other | | | 4,169 | | | | 3,649 | |
| | | | | | | |
| Net cash used in financing activities | | | (61,071 | ) | | | (233,080 | ) |
| | | | | | | |
| Net increase (decrease) in cash and cash equivalents | | | 24,485 | | | | (80,890 | ) |
| Effect of foreign currency translation on cash and cash equivalents | | | 847 | | | | (116 | ) |
| Cash and cash equivalents at beginning of period | | | 107,397 | | | | 176,812 | |
| | | | | | | |
| Cash and cash equivalents at end of period | | $ | 132,729 | | | $ | 95,806 | |
| | | | | | | |
| | | | | | | | | |
| Supplemental schedule of non-cash activities: | | | | | | | | |
| Assets and liabilities assumed from acquisitions: | | | | | | | | |
| Real estate investments | | $ | 496 | | | $ | 8,307 | |
| Utilization of escrow funds held for an Internal Revenue Code Section 1031 exchange | | | — | | | | (9,295 | ) |
| Other assets acquired | | | (355 | ) | | | 82 | |
| Other liabilities | | | 141 | | | | (1,886 | ) |
| Noncontrolling interest | | | — | | | | 980 | |
| | | | | | | | | |
| Debt transferred on the sale of assets | | | — | | | | 38,759 | |
25
QUARTERLY CONSOLIDATED STATEMENTS OF CASH FLOWS
(In thousands)
| | | | | | | | | | | | | | | | | | | | | |
| | | 2010 First | | | 2009 Quarters | |
| | | Quarter | | | Fourth | | | Third | | | Second | | | First | |
| Cash flows from operating activities: | | | | | | | | | | | | | | | | | | | | |
| Net income | | $ | 53,168 | | | $ | 54,778 | | | $ | 50,430 | | | $ | 89,183 | | | $ | 74,969 | |
| Adjustments to reconcile net income to net cash provided by operating activities: | | | | | | | | | | | | | | | | | | | | |
| Depreciation and amortization (including amounts in discontinued operations) | | | 52,537 | | | | 52,092 | | | | 50,347 | | | | 48,907 | | | | 49,908 | |
| Amortization of deferred revenue and lease intangibles, net | | | (1,549 | ) | | | (1,518 | ) | | | (1,564 | ) | | | (1,729 | ) | | | (1,858 | ) |
| Other amortization expenses | | | 2,154 | | | | 2,058 | | | | 1,921 | | | | 1,766 | | | | 608 | |
| Stock-based compensation | | | 3,032 | | | | 2,667 | | | | 3,078 | | | | 3,078 | | | | 3,059 | |
| Straight-lining of rental income | | | (2,449 | ) | | | (2,918 | ) | | | (2,971 | ) | | | (3,052 | ) | | | (2,938 | ) |
| Loss on extinguishment of debt | | | — | | | | — | | | | — | | | | 5,922 | | | | 158 | |
| Net gain on sale of real estate assets (including amounts in discontinued operations) | | | (184 | ) | | | (294 | ) | | | (120 | ) | | | (39,020 | ) | | | (27,871 | ) |
| Income tax expense (benefit) | | | 286 | | | | (367 | ) | | | (410 | ) | | | (395 | ) | | | (547 | ) |
| Other | | | 53 | | | | (178 | ) | | | 99 | | | | (169 | ) | | | 157 | |
| Changes in operating assets and liabilities: | | | | | | | | | | | | | | | | | | | | |
| (Increase) decrease in other assets | | | (3,772 | ) | | | 2,763 | | | | (5,703 | ) | | | (262 | ) | | | 1,688 | |
| Increase (decrease) in accrued interest | | | 17,799 | | | | (17,507 | ) | | | 18,529 | | | | (25,169 | ) | | | 20,190 | |
| (Decrease) increase in accounts payable and other liabilities | | | (5,514 | ) | | | 7,328 | | | | 14,419 | | | | 2,526 | | | | (3,967 | ) |
| | | | | | | | | | | | | | | | |
| Net cash provided by operating activities | | | 115,561 | | | | 98,904 | | | | 128,055 | | | | 81,586 | | | | 113,556 | |
| Cash flows from investing activities: | | | | | | | | | | | | | | | | | | | | |
| Net investment in real estate property | | | (11,860 | ) | | | (21,987 | ) | | | (4,370 | ) | | | (10,971 | ) | | | (8,387 | ) |
| Investment in loans receivable | | | (15,796 | ) | | | (6,430 | ) | | | — | | | | — | | | | (7,373 | ) |
| Proceeds from real estate disposals | | | 754 | | | | 740 | | | | 1,188 | | | | — | | | | 56,614 | |
| Proceeds from loans receivable | | | 1,192 | | | | 120 | | | | 207 | | | | 6,051 | | | | 1,650 | |
| Proceeds from sale of investments | | | — | | | | 5,000 | | | | — | | | | — | | | | — | |
| Capital expenditures | | | (4,295 | ) | | | (6,614 | ) | | | (3,156 | ) | | | (158 | ) | | | (3,870 | ) |
| | | | | | | | | | | | | | | | |
| Net cash (used in) provided by investing activities | | | (30,005 | ) | | | (29,171 | ) | | | (6,131 | ) | | | (5,078 | ) | | | 38,634 | |
| Cash flows from financing activities: | | | | | | | | | | | | | | | | | | | | |
| Net change in borrowings under revolving credit facilities | | | 29,089 | | | | (1,417 | ) | | | (1,528 | ) | | | (202,882 | ) | | | (87,046 | ) |
| Proceeds from debt | | | 196 | | | | 61,480 | | | | 3,087 | | | | 291,914 | | | | 9,201 | |
| Repayment of debt | | | (7,807 | ) | | | (8,642 | ) | | | (13,515 | ) | | | (428,659 | ) | | | (74,357 | ) |
| Payment of deferred financing costs | | | (1,113 | ) | | | (3,233 | ) | | | — | | | | (3,855 | ) | | | (9,567 | ) |
| Issuance of common stock, net | | | — | | | | — | | | | — | | | | 299,201 | | | | — | |
| Cash distribution to common stockholders | | | (83,881 | ) | | | (80,313 | ) | | | (80,271 | ) | | | (80,269 | ) | | | (73,546 | ) |
| Contributions from noncontrolling interest | | | 265 | | | | 576 | | | | 329 | | | | 306 | | | | — | |
| Distributions to noncontrolling interest | | | (1,989 | ) | | | (2,373 | ) | | | (2,472 | ) | | | (3,610 | ) | | | (1,414 | ) |
| Other | | | 4,169 | | | | 692 | | | | (3,454 | ) | | | 1,808 | | | | 3,649 | |
| | | | | | | | | | | | | | | | |
| Net cash used in financing activities | | | (61,071 | ) | | | (33,230 | ) | | | (97,824 | ) | | | (126,046 | ) | | | (233,080 | ) |
| | | | | | | | | | | | | | | | |
| Net increase (decrease) in cash and cash equivalents | | | 24,485 | | | | 36,503 | | | | 24,100 | | | | (49,538 | ) | | | (80,890 | ) |
| Effect of foreign currency translation on cash and cash equivalents | | | 847 | | | | 5 | | | | 266 | | | | 255 | | | | (116 | ) |
| Cash and cash equivalents at beginning of period | | | 107,397 | | | | 70,889 | | | | 46,523 | | | | 95,806 | | | | 176,812 | |
| | | | | | | | | | | | | | | | |
| Cash and cash equivalents at end of period | | $ | 132,729 | | | $ | 107,397 | | | $ | 70,889 | | | $ | 46,523 | | | $ | 95,806 | |
| | | | | | | | | | | | | | | | |
| | | | | | | | | | | | | | | | | | | | | |
| Supplemental schedule of non-cash activities: | | | | | | | | | | | | | | | | | | | | |
| Assets and liabilities assumed from acquisitions: | | | | | | | | | | | | | | | | | | | | |
| Real estate investments | | $ | 496 | | | $ | 59,326 | | | $ | 148 | | | $ | — | | | $ | 8,307 | |
| Utilization of escrow funds held for an Internal Revenue Code Section 1031 exchange | | | — | | | | (55,700 | ) | | | — | | | | — | | | | (9,295 | ) |
| Other assets acquired | | | (355 | ) | | | — | | | | (82 | ) | | | — | | | | 82 | |
| Other liabilities | | | 141 | | | | 1,948 | | | | — | | | | — | | | | (1,886 | ) |
| Noncontrolling interest | | | — | | | | 1,677 | | | | 67 | | | | — | | | | 980 | |
| | | | | | | | | | | | | | | | | | | | | |
| Debt transferred on the sale of assets | | | — | | | | — | | | | — | | | | — | | | | 38,759 | |
26
QUARTERLY FUNDS FROM OPERATIONS (FFO) AND NORMALIZED FFO AND FUNDS AVAILABLE FOR DISTRIBUTION (FAD)
(In thousands, except per share amounts)
| | | | | | | | | | | | | | | | | | | | | |
| | | 2010 First | | | 2009 Quarters | |
| | | Quarter | | | Fourth | | | Third | | | Second | | | First | |
| | | | | | | | | | | | | | | | | | | | | |
| Net income attributable to common stockholders | | $ | 52,619 | | | $ | 54,081 | | | $ | 49,805 | | | $ | 88,381 | | | $ | 74,228 | |
| Adjustments: | | | | | | | | | | | | | | | | | | | | |
| Depreciation and amortization on real estate assets | | | 52,247 | | | | 51,708 | | | | 49,981 | | | | 48,472 | | | | 49,328 | |
| Depreciation on real estate assets related to noncontrolling interest | | | (1,726 | ) | | | (1,653 | ) | | | (1,580 | ) | | | (1,496 | ) | | | (1,620 | ) |
| Discontinued operations: | | | | | | | | | | | | | | | | | | | | |
| Gain on sale of real estate assets | | | (184 | ) | | | (294 | ) | | | (120 | ) | | | (39,020 | ) | | | (27,871 | ) |
| Depreciation and amortization on real estate assets | | | 61 | | | | 200 | | | | 203 | | | | 266 | | | | 410 | |
| | | | | | | | | | | | | | | | |
| FFO | | | 103,017 | | | | 104,042 | | | | 98,289 | | | | 96,603 | | | | 94,475 | |
| Merger-related expenses and deal costs | | | 2,319 | | | | 1,565 | | | | 5,894 | | | | 3,502 | | | | 2,054 | |
| Income tax benefit | | | (133 | ) | | | (789 | ) | | | (797 | ) | | | (936 | ) | | | (937 | ) |
| Loss on extinguishment of debt | | | — | | | | — | | | | — | | | | 5,975 | | | | 105 | |
| | | | | | | | | | | | | | | | |
| Normalized FFO | | | 105,203 | | | | 104,818 | | | | 103,386 | | | | 105,144 | | | | 95,697 | |
| | | | | | | | | | | | | | | | | | | | | |
| Straight-lining of rental income | | | (2,449 | ) | | | (2,918 | ) | | | (2,971 | ) | | | (3,052 | ) | | | (2,938 | ) |
| Routine capital expenditures | | | (597 | ) | | | (4,233 | ) | | | (2,058 | ) | | | (632 | ) | | | (1,144 | ) |
| | | | | | | | | | | | | | | | |
| Normalized FAD | | $ | 102,157 | | | $ | 97,667 | | | $ | 98,357 | | | $ | 101,460 | | | $ | 91,615 | |
| | | | | | | | | | | | | | | | |
| | | | | | | | | | | | | | | | | | | | | |
Per diluted share(1): | | | | | | | | | | | | | | | | | | | | |
| Net income attributable to common stockholders | | $ | 0.34 | | | $ | 0.35 | | | $ | 0.32 | | | $ | 0.57 | | | $ | 0.52 | |
| Adjustments: | | | | | | | | | | | | | | | | | | | | |
| Depreciation and amortization on real estate assets | | | 0.33 | | | | 0.33 | | | | 0.32 | | | | 0.31 | | | | 0.34 | |
| Depreciation on real estate assets related to noncontrolling interest | | | (0.01 | ) | | | (0.01 | ) | | | (0.01 | ) | | | (0.01 | ) | | | (0.01 | ) |
| Discontinued operations: | | | | | | | | | | | | | | | | | | | | |
| Gain on sale of real estate assets | | | (0.00 | ) | | | (0.00 | ) | | | (0.00 | ) | | | (0.25 | ) | | | (0.19 | ) |
| Depreciation and amortization on real estate assets | | | 0.00 | | | | 0.00 | | | | 0.00 | | | | 0.00 | | | | 0.00 | |
| | | | | | | | | | | | | | | | |
| FFO | | | 0.66 | | | | 0.66 | | | | 0.63 | | | | 0.63 | | | | 0.66 | |
| Merger-related expenses and deal costs | | | 0.01 | | | | 0.01 | | | | 0.04 | | | | 0.02 | | | | 0.01 | |
| Income tax benefit | | | (0.00 | ) | | | (0.01 | ) | | | (0.01 | ) | | | (0.01 | ) | | | (0.01 | ) |
| Loss on extinguishment of debt | | | — | | | | — | | | | — | | | | 0.04 | | | | 0.00 | |
| | | | | | | | | | | | | | | | |
| Normalized FFO | | | 0.67 | | | | 0.67 | | | | 0.66 | | | | 0.68 | | | | 0.67 | |
| | | | | | | | | | | | | | | | | | | | | |
| Straight-lining of rental income | | | (0.02 | ) | | | (0.02 | ) | | | (0.02 | ) | | | (0.02 | ) | | | (0.02 | ) |
| Routine capital expenditures | | | (0.00 | ) | | | (0.03 | ) | | | (0.01 | ) | | | (0.00 | ) | | | (0.01 | ) |
| | | | | | | | | | | | | | | | |
| Normalized FAD | | $ | 0.65 | | | $ | 0.62 | | | $ | 0.63 | | | $ | 0.66 | | | $ | 0.64 | |
| | | | | | | | | | | | | | | | |
| | | |
| (1) | | Per share amounts may not add due to rounding. |
Historical cost accounting for real estate assets implicitly assumes that the value of real estate assets diminishes predictably over time. Since real estate values instead have historically risen or fallen with market conditions, many industry investors have considered presentations of operating results for real estate companies that use historical cost accounting to be insufficient by themselves. To overcome this problem, the Company considers FFO and normalized FFO and FAD appropriate measures of performance of an equity REIT. The Company uses the NAREIT definition of FFO. NAREIT defines FFO as net income, computed in accordance with GAAP, excluding gains (or losses) from sales of property, plus real estate depreciation and amortization and after adjustments for unconsolidated partnerships and joint ventures. Adjustments for unconsolidated partnerships and joint ventures will be calculated to reflect FFO on the same basis. The Company defines normalized FFO as FFO excluding certain income and expense items as listed below. Normalized FAD represents normalized FFO excluding straight-line rental adjustments and routine capital expenditures.
FFO and normalized FFO and FAD presented herein are not necessarily comparable to FFO and normalized FFO and FAD presented by other real estate companies due to the fact that not all real estate companies use the same definitions. FFO and normalized FFO and FAD should not be considered as alternatives to net income (determined in accordance with GAAP) as indicators of the Company’s financial performance or as alternatives to cash flow from operating activities (determined in accordance with GAAP) as measures of the Company’s liquidity, nor are FFO and normalized FFO and FAD necessarily indicative of sufficient cash flow to fund all of the Company’s needs. The Company believes that in order to facilitate a clear understanding of the consolidated historical operating results of the Company, FFO and normalized FFO and FAD should be examined in conjunction with net income as presented elsewhere herein.
The Company’s normalized FFO excludes (a) gains and losses on the sales of assets, (b) merger-related costs and expenses and deal costs and expenses, including expenses relating to the Company’s lawsuit against HCP, Inc., (c) the impact of any expenses related to asset impairment and valuation allowances, the write-off of unamortized deferred financing fees, or additional costs, expenses, discounts or premiums incurred as a result of early debt retirement or payment of the Company’s debt and (d) the non-cash effect of income tax benefits/expenses.
27
NORMALIZED FFO AND FAD GUIDANCE FOR THE YEAR ENDING DECEMBER 31, 2010
The following table illustrates the Company’s normalized FFO and FAD per diluted common share guidance for the year ending December 31, 2010:
| | | | | | | | | | | | | |
| | | GUIDANCE | |
| | | For the Year | |
| | | Ending | |
| | | December 31, 2010 | |
| Net income attributable to common stockholders | | $ | 1.38 | | | | – | | | $ | 1.47 | |
| Adjustments: | | | | | | | | | | | | |
| Depreciation and amortization on real estate assets, depreciation related to noncontrolling interest and gain/loss on sale of real estate assets, net | | | 1.28 | | | | – | | | | 1.28 | |
| | | | | | | | | | | |
| FFO | | | 2.66 | | | | – | | | | 2.75 | |
| Adjustments: | | | | | | | | | | | | |
| Income tax benefit (net of noncontrolling interest), gain/loss on extinguishment of debt and merger-related expenses and deal costs, net | | | 0.03 | | | | – | | | | 0.00 | |
| | | | | | | | | | | |
Normalized FFO | | | 2.69 | | | | – | | | | 2.75 | |
| | | | |
| Straight-lining of rental income and routine capital expenditures | | | (0.14 | ) | | | – | | | | (0.13 | ) |
| | | | | | | | | | | |
| Normalized FAD | | $ | 2.55 | | | | – | | | $ | 2.62 | |
| | | | | | | | | | | |
28
NET DEBT TO ADJUSTED EBITDA
The following information considers the pro forma effect on net income, interest and depreciation of the Company’s investments and other capital transactions that were completed during the three months ended March 31, 2010, as if the transactions had been consummated as of the beginning of the period. The following table illustrates net debt to pro forma earnings before interest, taxes, depreciation and amortization (including of non-cash stock-based compensation), excluding merger-related expenses and deal costs and gains or losses on real estate disposals (“Adjusted EBITDA”) (dollars in thousands):
| | | | | |
| Pro forma net income for the three months ended March 31, 2010 | | $ | 53,199 | |
| Add back: | | | | |
| Pro forma interest (including discontinued operations) | | | 44,459 | |
| Pro forma depreciation and amortization (including discontinued operations) | | | 52,581 | |
| Stock-based compensation | | | 3,032 | |
| Income tax expense | | | 286 | |
| Net gain on real estate disposals | | | (184 | ) |
| Other taxes | | | 250 | |
| Merger-related expenses and deal costs | | | 2,319 | |
| | | | |
| Adjusted EBITDA | | $ | 155,942 | |
| | | | |
| Adjusted EBITDA annualized | | $ | 623,768 | |
| | | | |
| | | | | |
| As of March 31, 2010: | | | | |
| Debt | | $ | 2,698,171 | |
| Cash, including cash escrows pertaining to debt | | | (140,174 | ) |
| | | | |
| Net debt | | $ | 2,557,997 | |
| | | | |
| | | | | |
| Net debt to Adjusted EBITDA | | | 4.1 | x |
| | | | |
The Company considers Adjusted EBITDA a profitability measure which indicates the Company’s ability to service debt. The Company considers the net debt to Adjusted EBITDA ratio a useful measure to evaluate the Company’s ability to pay its indebtedness. Adjusted EBITDA presented herein is not necessarily comparable to EBITDA presented by other companies due to the fact that not all companies use the same definition. Adjusted EBITDA should not be considered as an alternative to net income (determined in accordance with GAAP) as an indicator of the Company’s financial performance or as an alternative to cash flow from operating activities (determined in accordance with GAAP) as a measure of the Company’s liquidity, nor is Adjusted EBITDA necessarily indicative of sufficient cash flow to fund all of the Company’s needs. The Company believes that in order to facilitate a clear understanding of the consolidated historical operating results of the Company, Adjusted EBITDA should be examined in conjunction with net income as presented elsewhere herein.
29