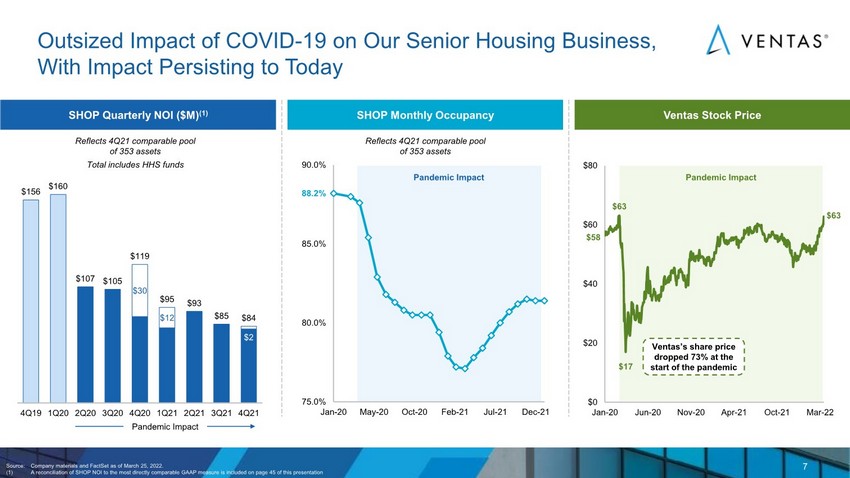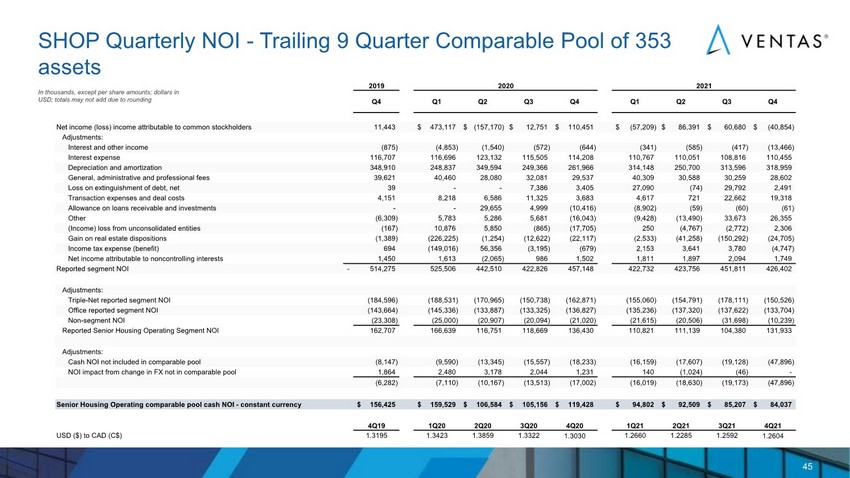
| 45 45 SHOP Quarterly NOI - Trailing 9 Quarter Comparable Pool of 353 assets In thousands, except per share amounts; dollars in USD; totals may not add due to rounding 2019 Q4 Q1 Q2 Q3 Q4 Q1 Q2 Q3 Q4 Net income (loss) income attributable to common stockholders 11,443 473,117 $ (157,170) $ 12,751 $ 110,451 $ (57,209) $ 86,391 $ 60,680 $ (40,854) $ Adjustments: Interest and other income (875) (4,853) (1,540) (572) (644) (341) (585) (417) (13,466) Interest expense 116,707 116,696 123,132 115,505 114,208 110,767 110,051 108,816 110,455 Depreciation and amortization 348,910 248,837 349,594 249,366 261,966 314,148 250,700 313,596 318,959 General, administrative and professional fees 39,621 40,460 28,080 32,081 29,537 40,309 30,588 30,259 28,602 Loss on extinguishment of debt, net 39 - - 7,386 3,405 27,090 (74) 29,792 2,491 Transaction expenses and deal costs 4,151 8,218 6,586 11,325 3,683 4,617 721 22,662 19,318 Allowance on loans receivable and investments - - 29,655 4,999 (10,416) (8,902) (59) (60) (61) Other (6,309) 5,783 5,286 5,681 (16,043) (9,428) (13,490) 33,673 26,355 (Income) loss from unconsolidated entities (167) 10,876 5,850 (865) (17,705) 250 (4,767) (2,772) 2,306 Gain on real estate dispositions (1,389) (226,225) (1,254) (12,622) (22,117) (2,533) (41,258) (150,292) (24,705) Income tax expense (benefit) 694 (149,016) 56,356 (3,195) (679) 2,153 3,641 3,780 (4,747) Net income attributable to noncontrolling interests 1,450 1,613 (2,065) 986 1,502 1,811 1,897 2,094 1,749 Reported segment NOI - 514,275 525,506 442,510 422,826 457,148 422,732 423,756 451,811 426,402 Adjustments: Triple-Net reported segment NOI (184,596) (188,531) (170,965) (150,738) (162,871) (155,060) (154,791) (178,111) (150,526) Office reported segment NOI (143,664) (145,336) (133,887) (133,325) (136,827) (135,236) (137,320) (137,622) (133,704) Non-segment NOI (23,308) (25,000) (20,907) (20,094) (21,020) (21,615) (20,506) (31,698) (10,239) Reported Senior Housing Operating Segment NOI 162,707 166,639 116,751 118,669 136,430 110,821 111,139 104,380 131,933 Adjustments: Cash NOI not included in comparable pool (8,147) (9,590) (13,345) (15,557) (18,233) (16,159) (17,607) (19,128) (47,896) NOI impact from change in FX not in comparable pool 1,864 2,480 3,178 2,044 1,231 140 (1,024) (46) - (6,282) (7,110) (10,167) (13,513) (17,002) (16,019) (18,630) (19,173) (47,896) Senior Housing Operating comparable pool cash NOI - constant currency 156,425 $ 159,529 $ 106,584 $ 105,156 $ 119,428 $ 94,802 $ 92,509 $ 85,207 $ 84,037 $ 4Q19 1Q20 2Q20 3Q20 4Q20 1Q21 2Q21 3Q21 4Q21 USD ($) to CAD (C$) 1.3195 1.3423 1.3859 1.3322 1.3030 1.2660 1.2285 1.2592 1.2604 2020 2021 |