Exhibit 99.1
Ventas, Inc.
Second Quarter 2007 Supplemental Data
Triple-Net, Managed and Secured Loan Portfolio - Overview by Type (Dollars in Millions)1
| | | | | | | | | | | | | | | | | | | | | | | | | | | | |
Property Type | | Number of
Facilities | | Number of
Beds/Units/Square Feet | | Number
of States /
Provinces | | Ventas
Investment | | Cash Flow
Coverage | | Occupancy | | | Annualized
NNN
Revenue2 | | | Annualized
Operating
Property
Revenue3 | | | Total
Annualized
Revenue | |
Hospital - Stabilized Triple-Net | | 42 | | 3,824 | | Beds | | 18 | | $ | 369 | | 3.1x | | 63 | % | | $ | 93 | | | $ | 0 | | | $ | 93 | |
Skilled Nursing - Stabilized Triple-Net | | 197 | | 24,691 | | Beds | | 29 | | $ | 874 | | 1.8x | | 89 | % | | $ | 176 | | | $ | 0 | | | $ | 176 | |
Senior Housing - Triple-Net & Loan | | 178 | | 17,912 | | Units | | 32 | | $ | 2,368 | | 1.2x | | 89 | % | | $ | 203 | | | $ | 0 | | | $ | 203 | |
Senior Housing - Operating | | 78 | | 6,284 | | Units | | 21 | | $ | 1,960 | | N/A | | 92 | % | | $ | 0 | | | $ | 338 | | | $ | 338 | |
Medical Office - Stabilized | | 13 | | 452,227 | | Square Feet | | 7 | | $ | 70 | | N/A | | 97 | % | | $ | 0 | | | $ | 10 | | | $ | 10 | |
Medical Office - Lease-Up | | 1 | | 81,094 | | Square Feet | | 1 | | $ | 15 | | N/A | | 39 | % | | $ | 0 | | | $ | 1 | | | $ | 1 | |
Other - Stabilized Triple-Net | | 8 | | 122 | | Beds | | 1 | | $ | 7 | | 3.7x | | N/A | | | $ | 1 | | | $ | 0 | | | $ | 1 | |
| | | | | | | | | | | | | | | | | | | | | | | | | | | | |
Total | | 517 | | | | | | 45 | | $ | 5,662 | | 1.8x | | | | | $ | 474 | | | $ | 349 | | | $ | 823 | |
| | | | | | | | | | | | | | | | | | | | | | | | | | | | |
| | | | | | | | | | | | | | | | | | | 58 | % | | | 42 | % | | | 100 | % |
Triple-Net, Managed and Secured Loan Portfolio - Overview by State1
| | | | | | | | | | | | | | | | | | | | | | | | | |
| | | Totals | | | Hospital | | Skilled Nursing | | Senior Housing | | Medical Office | | Other |
State | | No. | | % | | | No. | | Beds | | No. | | Beds | | No. | | Units | | No. | | Sq. Feet | | No. | | Beds |
California | | 42 | | 8 | % | | 5 | | 417 | | 9 | | 1,159 | | 28 | | 3,422 | | — | | — | | — | | — |
Massachusetts | | 38 | | 7 | % | | 2 | | 109 | | 26 | | 2,811 | | 10 | | 1,255 | | — | | — | | — | | — |
Ohio | | 35 | | 7 | % | | 1 | | 29 | | 14 | | 1,863 | | 18 | | 1,287 | | 2 | | 143,323 | | — | | — |
Pennsylvania | | 35 | | 7 | % | | 2 | | 115 | | 6 | | 797 | | 25 | | 1,686 | | 2 | | 111,671 | | — | | — |
Kentucky | | 31 | | 6 | % | | 3 | | 760 | | 27 | | 3,085 | | — | | — | | 1 | | 50,000 | | — | | — |
Florida | | 26 | | 5 | % | | 6 | | 491 | | — | | — | | 16 | | 1,636 | | 4 | | 75,730 | | — | | — |
Indiana | | 23 | | 4 | % | | 1 | | 59 | | 13 | | 1,968 | | 9 | | 1,002 | | — | | — | | — | | — |
North Carolina | | 23 | | 4 | % | | 1 | | 124 | | 16 | | 1,836 | | 6 | | 437 | | — | | — | | — | | — |
Illinois | | 21 | | 4 | % | | 4 | | 431 | | — | | — | | 17 | | 2,637 | | — | | — | | — | | — |
Texas | | 20 | | 4 | % | | 7 | | 496 | | — | | — | | 2 | | 215 | | 3 | | 78,624 | | 8 | | 122 |
All Other | | 223 | | 43 | % | | 10 | | 793 | | 86 | | 11,172 | | 125 | | 10,619 | | 2 | | 73,973 | | — | | — |
| �� | | | | | | | | | | | | | | | | | | | | | | | | |
Total | | 517 | | 100 | % | | 42 | | 3,824 | | 197 | | 24,691 | | 256 | | 24,196 | | 14 | | 533,321 | | 8 | | 122 |
| | | | | | | | | | | | | | | | | | | | | | | | | |
1 | Totals may not foot due to rounding. |
2 | Annualized second quarter Ventas revenue assuming all events occurred at the beginning of the period. |
3 | Revenue reflects Ventas’s portion only for joint venture assets. Sunrise results reflect May and June 2007 annualized. |
1
Ventas, Inc.
Second Quarter 2007 Supplemental Data
Triple-Net Owned, Managed and Secured Loan Portfolio - Property Type Concentration (Dollars in Millions)1
| | | | | | | | | | | | | | |
Property Type | | Property
Count | | Ventas
Investment | | % | | | Annualized
Rent/Revenue2 | | % | |
Senior Housing | | 256 | | $ | 4,328 | | 76 | % | | $ | 541 | | 66 | % |
Skilled Nursing | | 197 | | $ | 874 | | 15 | % | | $ | 176 | | 21 | % |
Hospitals | | 42 | | $ | 369 | | 7 | % | | $ | 93 | | 11 | % |
Medical Office | | 14 | | $ | 85 | | 1 | % | | $ | 12 | | 1 | % |
Other | | 8 | | $ | 7 | | NM | | | $ | 1 | | NM | |
| | | | | | | | | | | | | | |
Total | | 517 | | $ | 5,662 | | 100 | % | | $ | 823 | | 100 | % |
| | | | | | | | | | | | | | |
Triple-Net Owned, Managed and Secured Loan Portfolio - Operator Concentration (Dollars in Millions)1
| | | | | | | | | | | | | | |
Operator | | Property
Count | | Ventas
Investment | | % | | | Annualized
Rent/Revenue2 | | % | |
Sunrise Senior Living | | 78 | | $ | 1,960 | | 35 | % | | $ | 338 | | 41 | % |
Brookdale Senior Living | | 83 | | $ | 1,386 | | 24 | % | | $ | 123 | | 15 | % |
Kindred Healthcare | | 203 | | $ | 935 | | 17 | % | | $ | 237 | | 29 | % |
Senior Care | | 66 | | $ | 625 | | 11 | % | | $ | 48 | | 6 | % |
Summerville Senior Living | | 16 | | $ | 196 | | 3 | % | | $ | 18 | | 2 | % |
Capital Senior Living | | 10 | | $ | 153 | | 3 | % | | $ | 13 | | 2 | % |
Genesis Healthcare | | 11 | | $ | 88 | | 2 | % | | $ | 9 | | 1 | % |
Benchmark Assisted Living | | 4 | | $ | 55 | | 1 | % | | $ | 5 | | 1 | % |
Trans Healthcare | | 7 | | $ | 53 | | 1 | % | | $ | 7 | | 1 | % |
CaraVita | | 8 | | $ | 50 | | 1 | % | | $ | 5 | | 1 | % |
All Other | | 31 | | $ | 162 | | 3 | % | | $ | 21 | | 3 | % |
| | | | | | | | | | | | | | |
Total | | 517 | | $ | 5,662 | | 100 | % | | $ | 823 | | 100 | % |
| | | | | | | | | | | | | | |
Triple-Net Owned, Managed and Secured Loan Portfolio - State Concentration (Dollars in Millions)1
| | | | | | | | |
State | | Property
Count | | Annualized
Rent/Revenue2 | | % | |
California | | 42 | | $ | 109 | | 13 | % |
Illinois | | 21 | | $ | 91 | | 11 | % |
Massachusetts | | 38 | | $ | 52 | | 6 | % |
Pennsylvania | | 35 | | $ | 47 | | 6 | % |
Ontario | | 8 | | $ | 42 | | 5 | % |
New Jersey | | 11 | | $ | 38 | | 5 | % |
Florida | | 26 | | $ | 34 | | 4 | % |
Ohio | | 35 | | $ | 30 | | 4 | % |
North Carolina | | 23 | | $ | 27 | | 3 | % |
Georgia | | 14 | | $ | 26 | | 3 | % |
All Other | | 264 | | $ | 328 | | 40 | % |
| | | | | | | | |
Total | | 517 | | $ | 823 | | 100 | % |
| | | | | | | | |
1 | Totals may not foot due to rounding. |
2 | Annualized second quarter Ventas revenue assuming all events occurred at the beginning of the period. Operating asset revenue reflects Ventas’ portion only for joint venture assets. Sunrise results reflect May and June 2007 annualized. |
2
Ventas, Inc.
Second Quarter 2007 Supplemental Data
Operating Portfolio Statistics:1
| | | | | | | | | | | | | | | | | | | | | | |
| | | Medical Office Buildings |
| | | Stabilized | | | Same-Store Stabilized | | | Lease-Up |
| | | 2Q07 | | | 2Q06 | | | 2Q07 | | | 2Q06 | | | 2Q07 | | | 2Q06 |
Number of properties: | | | 11 | | | | 9 | | | | 9 | | | | 9 | | | | 1 | | | — |
Number of square feet: | | | 398,127 | | | | 266,025 | | | | 266,025 | | | | 266,025 | | | | 81,094 | | | — |
Occupancy: | | | 97 | % | | | 99 | % | | | 98 | % | | | 99 | % | | | 39 | % | | — |
Average annual rate per square foot: | | $ | 27 | | | $ | 26 | | | $ | 27 | | | $ | 26 | | | $ | 28 | | | — |
Operating revenue: | | $ | 2.7 | | | $ | 1.8 | | | $ | 1.9 | | | $ | 1.8 | | | $ | 0.2 | | | — |
Less expenses: | | | 1.1 | | | | 0.7 | | | | 0.7 | | | | 0.7 | | | | 0.1 | | | — |
Total NOI: | | | 1.5 | | | | 1.1 | | | | 1.1 | | | | 1.1 | | | | 0.1 | | | — |
Less joint venture share: | | | NM | | | | 0.0 | | | | 0.0 | | | | 0.0 | | | | 0.0 | | | — |
Ventas NOI: | | $ | 1.5 | | | $ | 1.1 | | | $ | 1.1 | | | $ | 1.1 | | | $ | 0.1 | | | — |
| | | | | | | | |
| | | Senior Housing Communities | |
| | | Stabilized
2Q072 | | | Lease-Up
2Q072 | |
Number of properties: | | | 72 | | | | 6 | |
Unit capacity: | | | 11,662 | | | | 906 | |
Resident day capacity: | | | 420,351 | | | | 20,100 | |
Average resident occupancy: | | | 92 | % | | | 63 | % |
Average daily rate / res fees: | | $ | 163 | | | $ | 191 | |
Operating revenue: | | $ | 63.7 | | | $ | 2.4 | |
Less expenses: | | | 42.6 | | | | 2.6 | |
Total NOI: | | | 21.0 | | | | ($0.2 | ) |
Less joint venture share: | | | 3.0 | | | | 0.0 | |
Ventas NOI: | | $ | 18.0 | | | | ($0.2 | ) |
1 | Dollars in millions except for rate data. |
2 | Results reflect May and June 2007 only. |
3
Ventas, Inc.
Second Quarter 2007 Supplemental Data
| | | | |
Ventas - Kindred Master Lease | | Facility
Count | | TTM
EBITDARM
Coverage1,3,5 |
1 | | 83 | | 2.3x |
2 | | 41 | | 2.4x |
3 | | 38 | | 2.1x |
4 | | 41 | | 2.5x |
| | | | |
Portfolio | | 203 | | 2.3x |
| | | | |
| | |
Ventas - Kindred Property Type | | Facility
Count | | TTM
EBITDARM
Coverage1,3 |
Hospitals | | 38 | | 3.2x |
Skilled Nursing | | 165 | | 1.8x |
| | | | |
Portfolio | | 203 | | 2.3x |
| | | | |
| | | | | | | |
Ventas - Kindred Master Lease | | Facility
Count | | TTM
EBITDARM
Coverage2,3 | | Annualized
Post-Reset
Base Rent
Through
April 30, 20074 |
1 | | 83 | | 2.2x | | $ | 94.5 |
2 | | 41 | | 2.2x | | | 55.3 |
3 | | 38 | | 2.0x | | | 38.4 |
4 | | 41 | | 2.4x | | | 40.4 |
| | | | | | | |
Portfolio | | 203 | | 2.2x | | $ | 228.6 |
| | | | | | | |
| | | |
Ventas - Kindred Property Type | | Facility
Count | | TTM
EBITDARM
Coverage2,3 | | Annualized
Post-Reset
Base Rent
Through
April 30, 20074 |
Hospitals | | 38 | | 3.0x | | $ | 83.7 |
Skilled Nursing | | 165 | | 1.7x | | | 144.9 |
| | | | | | | |
Portfolio | | 203 | | 2.2x | | $ | 228.6 |
| | | | | | | |
1 | Trailing twelve months EBITDARM for the period ended March 31, 2007 (the latest available data provided by Kindred) to the Company’s trailing twelve months cash rental revenue. |
2 | Trailing twelve months EBITDARM for the period ended March 31, 2007 (the latest available data provided by Kindred) to $228.6 million in aggregate annual base rent. |
3 | Coverage reflects the ratio of Kindred’s EBITDARM to rent. EBITDARM is defined as earnings before interest, income taxes, depreciation, amortization, rent and management fees. In the calculation of trailing twelve months EBITDARM, intercompany profit pertaining to services provided by Kindred’s PeopleFirst Rehabilitation and Pharmacy Divisions for the twelve months ended March 31, 2007 has been eliminated from purchased ancillary expenses within the Ventas portfolio. |
4 | Numbers in millions and may not foot due to rounding. |
4
Ventas, Inc.
Second Quarter 2007 Supplemental Data
| | | | | | | | | | | | | | | | | | | | | |
| | | | | Lease Rollover Year (Excluding Sunrise Operating Communities) |
| | | Totals | | 2007 | | 2008 | | 2009 | | 2010 | | 2011 | | Thereafter |
Hospital - Stabilized Triple-Net: | | | | | | | | | | | | | | | | | | | | | |
Annualized Revenue1 | | $ | 92.9 | | | — | | | — | | | — | | $ | 42.2 | | | — | | $ | 50.7 |
Skilled Nursing - Stabilized Triple-Net: | | | | | | | | | | | | | | | | | | | | | |
Annualized Revenue1 | | $ | 176.4 | | | — | | $ | 0.9 | | | — | | $ | 79.2 | | | — | | $ | 96.4 |
Senior Housing - Stabilized Triple-Net: | | | | | | | | | | | | | | | | | | | | | |
Annualized Revenue1 | | $ | 201.5 | | | — | | | — | | | — | | | — | | | — | | | 201.5 |
Medical Office - Stabilized: | | | | | | | | | | | | | | | | | | | | | |
Annualized Revenue1 | | $ | 8.5 | | $ | 1.2 | | $ | 1.8 | | $ | 1.2 | | $ | 1.8 | | $ | 0.9 | | $ | 1.7 |
Medical Office - Lease-Up: | | | | | | | | | | | | | | | | | | | | | |
Annualized Revenue1 | | $ | 0.2 | | | — | | | — | | | — | | | — | | | — | | $ | 0.2 |
Other - Stabilized Triple-Net: | | | | | | | | | | | | | | | | | | | | | |
Annualized Revenue1 | | $ | 0.9 | | | — | | | — | | | — | | $ | 0.9 | | | — | | | — |
Total: | | | | | | | | | | | | | | | | | | | | | |
Annualized Revenue1 | | $ | 480.3 | | $ | 1.2 | | $ | 2.7 | | $ | 1.2 | | $ | 124.0 | | $ | 0.9 | | $ | 350.4 |
1 | Annualized second quarter Ventas revenue assuming all events occurred at the beginning of the period. Dollars in millions. Totals may not foot due to rounding. |
5
Ventas, Inc.
Second Quarter 2007 Supplemental Data
| | | | | | | | | | | | | | | | | | |
Property Name | | Company
Ownership
% | | MSA | | Property
Type | | Number of Residents or
Beds/Units/Square Feet | | Actual/Projected
Opening Date | | Total
Development
Cost1 | | Ventas
Fixed
Purchase Price
(incl.
FPAC)1 | | Expected
Stabilized
Yield |
Sunrise of Hillcrest | | 80% | | Dallas | | AL/ALZ | | 90 Residents / 77 Units / 56,500 SF | | June 2006 | | $ | 14.6 | | $ | 12.3 | | 10.0% |
Sunrise of Bloomfield Hills | | 80% | | Detroit | | AL/ALZ | | 92 Residents / 76 Units / 58,600 SF | | June 2006 | | | 21.3 | | | 17.9 | | 10.5% |
Sunrise of Staten Island | | 80% | | New York | | AL/ALZ | | 100 Residents / 78 Units / 63,000 SF | | November 2006 | | | 29.7 | | | 25.0 | | 9.5%-10.0% |
Sunrise of Sandy | | 80% | | Salt Lake City | | AL/ALZ | | 95 Residents / 79 Units / 58,000 SF | | November 2006 | | | 18.0 | | | 15.1 | | 9.5%-10.0% |
Sunrise of Scottsdale | | 80% | | Phoenix | | AL/ALZ | | 95 Residents / 79 Units / 60,000 SF | | March 2007 | | | 20.2 | | | 17.0 | | 9.5%-10.0% |
Sunrise of Rocklin | | 80% | | Sacramento | | AL/ALZ | | 78 Residents / 64 Units / 48,000 SF | | April 2007 | | | 18.6 | | | 15.7 | | 8.25%-8.75% |
Sunrise of Thorne Mills on Steeles | | 80% | | Toronto | | IL/AL/ALZ | | 256 Residents /229 Units / 210,000 SF | | September 2007 | | | 59.8 | | | 50.0 | | 8.0% -8.5% |
Casper Wyoming Hospital & MOB | | 50% | | Casper, WY | | Hosp/MOB | | 28 Beds / N/A Units / 50,132 SF | | May 2008 | | | 28.6 | | | 28.6 | | 10.5% |
6
Staggered Renewal, Long Term NNN Leases Provide Excellent Credit Support 1 Corporate Credit and Long Duration Leases Anchor Portfolio (1) Based on 2Q 2007 Ventas revenue and excludes 12 MOBs. NNN Portfolio 58% Operating Assets 42% Long Term Corporate Credit Anchors Ventas Cash Flows 0.2% 25.9% 2.4% 25.6% 0.6% 4.4% 0.2% 40.7% 0.0% 20.0% 40.0% 60.0% 80.0% 100.0% 2007 2008 2009 2010 2011 2012 2013 2014 2015 2016 2017 2018 After 2018 7 |
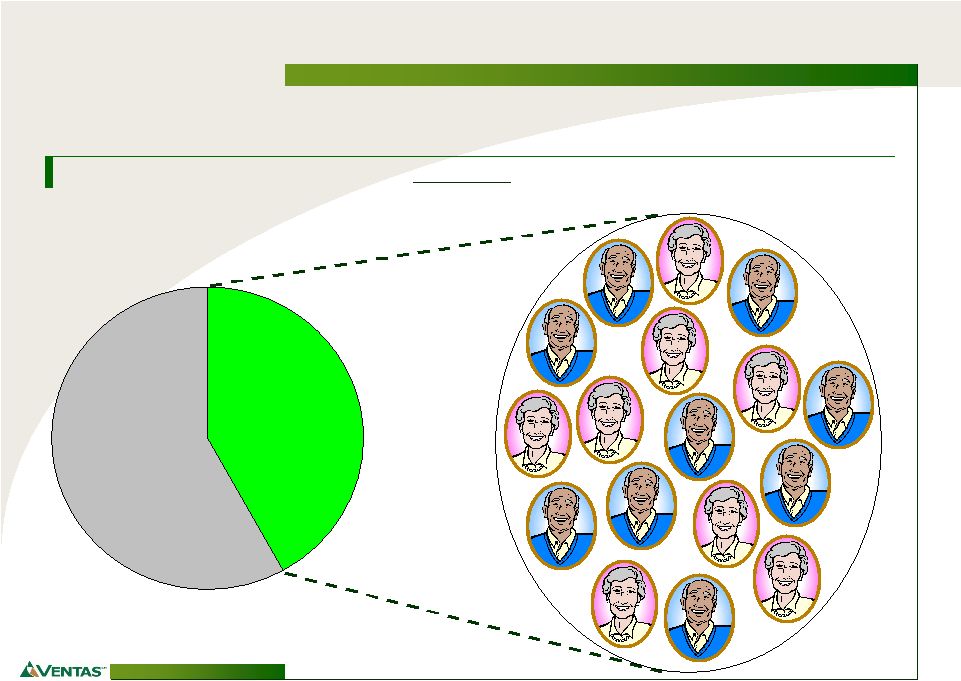
42% of Revenue Derived From 6,500+ Individual Seniors and >100 MOB Tenants Operating Assets Add NOI Granularity & Enhance Enterprise Reliability Other VTR Revenue 58% Senior Housing + MOB Operating Assets 42% 8 |