Exhibit 99.2

Fourth Quarter 2008 Supplemental Data
Sunrise of New City—New City, NY
All amounts shown in this report are unaudited and in U.S. dollars unless otherwise noted.
Ventas, Inc.
Fourth Quarter 2008 Supplemental Data
Table of Contents
| | |
Debt Maturity Schedule | | 1 |
| |
Debt Covenants | | 2-3 |
| |
Triple-Net, Managed and Loan Portfolio | | 4-7 |
| |
Operating Portfolio | | 8-9 |
| |
Kindred Healthcare Same-Store TTM EBITDARM Coverage Ratios | | 10 |
| |
Revenue Rollover Schedule | | 11 |
| |
Company Development Data | | 12 |
Ventas, Inc.
Fourth Quarter 2008 Supplemental Data
Debt Maturity Schedule:1
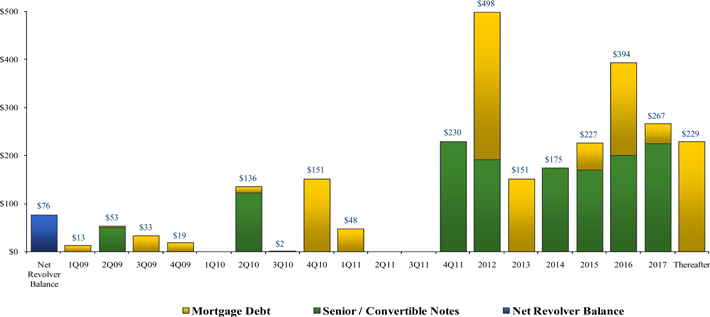
1 | Dollars in millions; data as of February 10, 2009 and excludes normal monthly principal amortization. The Company’s joint venture partners’ pro rata share of total maturities is approximately $141.8 million. Ventas has the ability and intention to extend certain mortgage loans until 2010. |
1
Ventas, Inc.
Fourth Quarter 2008 Supplemental Data
Debt Covenants:

2
Ventas, Inc.
Fourth Quarter 2008 Supplemental Data
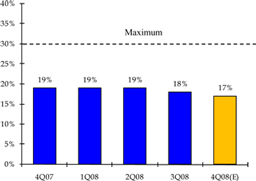
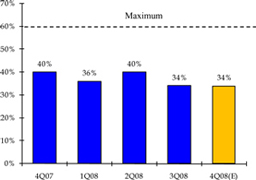
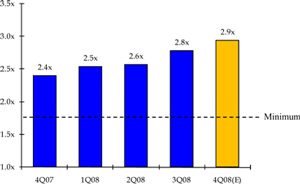
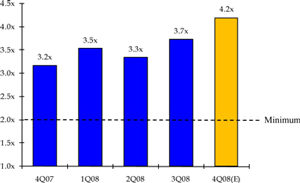
Debt Covenants:
| | |
| Secured Debt / Gross Asset Value | | Unsecured Debt / Unencumbered Gross Asset Value |
| | |
| Fixed Charge Coverage | | Unencumbered Interest Coverage |
3
Ventas, Inc.
Fourth Quarter 2008 Supplemental Data
Owned Portfolio—Overview by Type (Dollars in Millions):1
| | | | | | | | | | | | | | | | | | | | | | | | | | | | | | | | | | | | | | | | |
Property Type | | Number of
Properties | | Number of
Beds/Units/Square Feet | | Number
of States/
Provinces | | Ventas
Investment | | Cash
Flow
Coverage | | Occupancy2 | | | Annualized
NNN
Revenue3 | | | Annualized
Operating
Property
Revenue3 | | | Total
Annualized
Revenue3 | | | Annualized
NNN
NOI3 | | | Annualized
Operating
Property
NOI3 | | | Total
Annualized
NOI3 | |
Hospital—Stabilized Triple-Net | | 40 | | 3,479 | | Beds | | 17 | | $ | 346 | | 2.5x | | 58.0 | % | | $ | 92 | | | $ | 0 | | | $ | 92 | | | $ | 92 | | | $ | 0 | | | $ | 92 | |
Skilled Nursing—Stabilized Triple-Net | | 192 | | 23,358 | | Beds | | 28 | | | 827 | | 2.0x | | 89.1 | % | | | 177 | | | | 0 | | | | 177 | | | | 177 | | | | 0 | | | | 177 | |
Seniors Housing—Triple-Net | | 165 | | 16,751 | | Units | | 31 | | | 2,260 | | 1.3x | | 88.2 | % | | | 194 | | | | 0 | | | | 194 | | | | 194 | | | | 0 | | | | 194 | |
Seniors Housing—Operating | | 79 | | 6,513 | | Units | | 21 | | | 2,033 | | N/A | | 90.7 | % | | | 0 | | | | 359 | | | | 359 | | | | 0 | | | | 109 | | | | 109 | |
Medical Office—Stabilized | | 19 | | 1,046,169 | | Square Feet | | 9 | | | 223 | | N/A | | 95.6 | % | | | 0 | | | | 28 | | | | 28 | | | | 0 | | | | 18 | | | | 18 | |
Medical Office—Lease-Up | | 2 | | 181,952 | | Square Feet | | 2 | | | 42 | | N/A | | 58.9 | % | | | 0 | | | | 3 | | | | 3 | | | | 0 | | | | 1 | | | | 1 | |
Other—Stabilized Triple-Net | | 8 | | 122 | | Beds | | 1 | | | 7 | | 5.0x | | N/A | | | | 1 | | | | 0 | | | | 1 | | | | 1 | | | | 0 | | | | 1 | |
| | | | | | | | | | | | | | | | | | | | | | | | | | | | | | | | | | | | | | | | |
Total | | 505 | | | | | | 45 | | $ | 5,738 | | 1.8x | | | | | $ | 464 | | | $ | 389 | | | $ | 853 | | | $ | 464 | | | $ | 128 | | | $ | 592 | |
| | | | | | | | | | | | | | | | | | | | | | | | | | | | | | | | | | | | | | | | |
| | | | | | | | | | | | | | | | | | | 54 | % | | | 46 | % | | | 100 | % | | | 78 | % | | | 22 | % | | | 100 | % |
Loan Portfolio—Overview by Investment (Dollars in Millions):1
| | | | | | | | | | | | | | | | |
Borrower | | Original
Investment | | Outstanding
Principal | | Secured/
Unsecured | | Borrower/
Asset
Type | | Effective
Interest
Rate | | | Annualized
Revenue3 |
Manor Care | | $ | 99 | | $ | 112 | | Secured | | SNF/ALF | | L + 533 | | | $ | 6 |
HCA | | | 45 | | | 50 | | Unsecured | | Hospital | | 9.2 | % | | | 4 |
Emeritus | | | 10 | | | 10 | | Secured | | ILF/ALF/ALZ | | 8.3 | % | | | 1 |
Other—Secured4 | | | 21 | | | 14 | | Secured | | ALF | | N/A | | | | 0 |
Other—Unsecured | | | 19 | | | 20 | | Unsecured | | Hospital | | 9.1 | % | | | 2 |
| | | | | | | | | | | | | | | | |
Total | | $ | 193 | | $ | 207 | | | | | | | | | $ | 13 |
| | | | | | | | | | | | | | | | |
Owned Portfolio—Overview by State/Province:1
| | | | | | | | | | | | | | | | | | | | | | | | | |
| | | Totals | | | Hospital | | Skilled
Nursing | | Seniors
Housing | | Medical Office | | Other |
State/Province | | No. | | % | | | No. | | Beds | | No. | | Beds | | No. | | Units | | No. | | Sq. Feet | | No. | | Beds |
California | | 40 | | 8 | % | | 5 | | 417 | | 9 | | 1,132 | | 26 | | 3,304 | | 0 | | 0 | | 0 | | 0 |
Pennsylvania | | 35 | | 7 | % | | 2 | | 115 | | 6 | | 797 | | 25 | | 1,649 | | 2 | | 111,671 | | 0 | | 0 |
Massachusetts | | 34 | | 7 | % | | 2 | | 109 | | 26 | | 2,712 | | 6 | | 856 | | 0 | | 0 | | 0 | | 0 |
Ohio | | 30 | | 6 | % | | 0 | | 0 | | 12 | | 1,626 | | 16 | | 1,152 | | 2 | | 143,567 | | 0 | | 0 |
Kentucky | | 29 | | 6 | % | | 2 | | 424 | | 27 | | 3,054 | | 0 | | 0 | | 0 | | 0 | | 0 | | 0 |
Florida | | 26 | | 5 | % | | 6 | | 511 | | 0 | | 0 | | 14 | | 1,453 | | 6 | | 206,641 | | 0 | | 0 |
Indiana | | 23 | | 5 | % | | 1 | | 59 | | 13 | | 1,883 | | 9 | | 1,001 | | 0 | | 0 | | 0 | | 0 |
North Carolina | | 23 | | 5 | % | | 1 | | 124 | | 16 | | 1,818 | | 6 | | 438 | | 0 | | 0 | | 0 | | 0 |
Illinois | | 21 | | 4 | % | | 4 | | 431 | | 0 | | 0 | | 17 | | 2,637 | | 0 | | 0 | | 0 | | 0 |
Texas | | 21 | | 4 | % | | 7 | | 496 | | 0 | | 0 | | 3 | | 262 | | 3 | | 78,622 | | 8 | | 122 |
All Other | | 223 | | 44 | % | | 10 | | 793 | | 83 | | 10,336 | | 122 | | 10,512 | | 8 | | 687,620 | | 0 | | 0 |
| | | | | | | | | | | | | | | | | | | | | | | | | |
Total | | 505 | | 100 | % | | 40 | | 3,479 | | 192 | | 23,358 | | 244 | | 23,264 | | 21 | | 1,228,121 | | 8 | | 122 |
| | | | | | | | | | | | | | | | | | | | | | | | | |
1 | Totals may not add due to rounding. |
2 | Occupancy shown for Seniors Housing excludes communities in lease-up. Occupancy for triple-net properties is as of 3Q08 and occupancy for operating properties is as of 4Q08. |
3 | Annualized fourth quarter Ventas revenue/NOI assuming all events occurred at the beginning of the period. Revenue/NOI reflects Ventas’s portion only for joint venture assets. Excludes assets recently sold to Benchmark and Emeritus, and assets to be sold to the University of Kentucky. |
4 | Outstanding principal is the approximate carrying value. Effective interest rate is the stated contractual rate. |
4
Ventas, Inc.
Fourth Quarter 2008 Supplemental Data
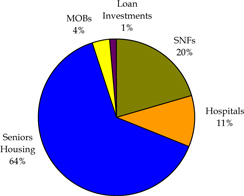
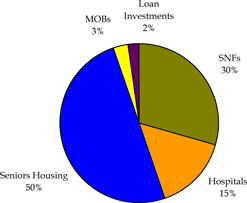
Owned and Loan Portfolio—Property Type Concentration (Dollars in Millions):1
| | | | | | | | | | | | | | | | | | | | |
Investment Type | | Owned
Property
Count | | Ventas
Investment | | % | | | Annualized
Rent/Revenue2 | | % | | | Annualized
Rent/NOI2 | | % | |
| | | | | | | |
| | | | | | | |
Seniors Housing | | 244 | | $ | 4,293 | | 72 | % | | $ | 552 | | 64 | % | | $ | 303 | | 50 | % |
Skilled Nursing | | 192 | | | 827 | | 14 | % | | | 177 | | 20 | % | | | 177 | | 29 | % |
Hospital | | 40 | | | 346 | | 6 | % | | | 92 | | 11 | % | | | 92 | | 15 | % |
Medical Office | | 21 | | | 266 | | 4 | % | | | 31 | | 4 | % | | | 19 | | 3 | % |
Other | | 8 | | | 7 | | NM | | | | 1 | | NM | | | | 1 | | NM | |
Loans | | N/A | | | 207 | | 3 | % | | | 13 | | 1 | % | | | 13 | | 2 | % |
| | | | | | | | | | | | | | | | | | | | |
Total | | 505 | | $ | 5,945 | | 100 | % | | $ | 866 | | 100 | % | | $ | 605 | | 100 | % |
| | | | | | | | | | | | | | | | | | | | |
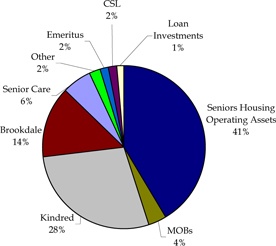
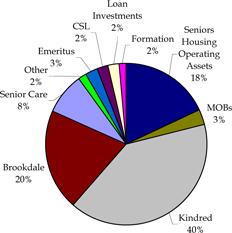
Owned and Loan Portfolio—Operator Concentration (Dollars in Millions):1
| | | | | | | | | | | | | | | | | | | | |
Operator/Manager | | Owned
Property
Count | | Ventas
Investment | | % | | | Annualized
Rent/Revenue2 | | % | | | Annualized
Rent/NOI2 | | % | |
| | | | | | | |
| | | | | | | |
Sunrise Senior Living | | 79 | | $ | 2,033 | | 34 | % | | $ | 359 | | 41 | % | | $ | 109 | | 18 | % |
Brookdale Senior Living | | 83 | | | 1,393 | | 23 | % | | | 122 | | 14 | % | | | 122 | | 20 | % |
Kindred Healthcare | | 203 | | | 935 | | 16 | % | | | 243 | | 28 | % | | | 243 | | 40 | % |
Senior Care | | 66 | | | 625 | | 11 | % | | | 50 | | 6 | % | | | 50 | | 8 | % |
Emeritus Senior Living | | 11 | | | 163 | | 3 | % | | | 16 | | 2 | % | | | 16 | | 3 | % |
Capital Senior Living | | 11 | | | 158 | | 3 | % | | | 14 | | 2 | % | | | 14 | | 2 | % |
Manor Care | | N/A | | | 112 | | 2 | % | | | 6 | | 1 | % | | | 6 | | 1 | % |
NexCore | | 4 | | | 93 | | 2 | % | | | 12 | | 1 | % | | | 7 | | 1 | % |
Formation | | 11 | | | 88 | | 1 | % | | | 9 | | 1 | % | | | 9 | | 1 | % |
Greenfield | | 7 | | | 50 | | 1 | % | | | 5 | | 1 | % | | | 4 | | 1 | % |
Assisted Living Concepts | | 8 | | | 50 | | 1 | % | | | 5 | | 1 | % | | | 5 | | 1 | % |
HCA | | N/A | | | 50 | | 1 | % | | | 4 | | NM | | | | 4 | | 1 | % |
All Other | | 22 | | | 195 | | 3 | % | | | 21 | | 2 | % | | | 15 | | 3 | % |
| | | | | | | | | | | | | | | | | | | | |
Total | | 505 | | $ | 5,945 | | 100 | % | | $ | 866 | | 100 | % | | $ | 605 | | 100 | % |
| | | | | | | | | | | | | | | | | | | | |
Owned Portfolio—State/Province Concentration (Dollars in Millions):1
| | | | | | | | | | | | | | |
State/Province | | Owned
Property
Count | | Annualized
Rent/Revenue2 | | % | | | Annualized
Rent/NOI2 | | % | |
| | | | | |
| | | | | |
California | | 40 | | $ | 113 | | 13 | % | | $ | 79 | | 13 | % |
Illinois | | 21 | | | 90 | | 11 | % | | | 66 | | 11 | % |
Massachusetts | | 34 | | | 48 | | 6 | % | | | 41 | | 7 | % |
Ontario | | 9 | | | 46 | | 5 | % | | | 13 | | 2 | % |
Pennsylvania | | 35 | | | 45 | | 5 | % | | | 23 | | 4 | % |
New Jersey | | 11 | | | 38 | | 4 | % | | | 15 | | 3 | % |
Florida | | 26 | | | 37 | | 4 | % | | | 35 | | 6 | % |
Colorado | | 14 | | | 31 | | 4 | % | | | 17 | | 3 | % |
Georgia | | 16 | | | 31 | | 4 | % | | | 17 | | 3 | % |
North Carolina | | 23 | | | 29 | | 3 | % | | | 21 | | 4 | % |
All Other | | 276 | | | 344 | | 40 | % | | | 265 | | 45 | % |
| | | | | | | | | | | | | | |
Total | | 505 | | $ | 853 | | 100 | % | | $ | 592 | | 100 | % |
| | | | | | | | | | | | | | |
1 | Totals may not add due to rounding. NM = not material. |
2 | Annualized fourth quarter Ventas revenue/NOI assuming all events occurred at the beginning of the period. Operating asset revenue/NOI reflects Ventas’s portion only for joint venture assets. Excludes assets recently sold to Benchmark and Emeritus, and assets to be sold to the University of Kentucky. |
5
Ventas, Inc.
Fourth Quarter 2008 Supplemental Data
Owned and Loan Portfolio—Property Type Concentration:1
Owned and Loan Portfolio—Operator Concentration:1
1 | Annualized fourth quarter Ventas revenue/NOI assuming all events occurred at the beginning of the period. Operating asset revenue/NOI reflects Ventas’s portion only for joint venture assets. Excludes assets recently sold to Benchmark and Emeritus, and assets to be sold to the University of Kentucky. |
6
Ventas, Inc.
Fourth Quarter 2008 Supplemental Data
Same-Store Triple-Net Portfolio Trend Data for Properties Owned for the Full 3rd Quarters of 2008 & 2007:1,2
| | | | | | | | | | | | | | | | | | | | | | | | | | |
| | | | | Sequential Quarter Comparison | | | Year-Over-Year Comparison | |
| | | Number of
Properties | | 3Q08
Cash Flow
Coverage | | | 2Q08
Cash Flow
Coverage | | | 3Q08
Occupancy | | | 2Q08
Occupancy | | | 3Q08
Cash Flow
Coverage | | | 3Q07
Cash Flow
Coverage | | | 3Q08
Occupancy | | | 3Q07
Occupancy | |
Property Type | | | | | | | | | |
| | | | | | | | | |
Hospital | | 40 | | 2.5 | x | | 2.6 | x | | 58.0 | % | | 62.4 | % | | 2.5 | x | | 3.0 | x | | 58.0 | % | | 58.3 | % |
Skilled Nursing | | 192 | | 2.0 | x | | 2.0 | x | | 89.1 | % | | 88.9 | % | | 2.0 | x | | 1.8 | x | | 89.1 | % | | 88.0 | % |
Seniors Housing | | 162 | | 1.3 | x | | 1.3 | x | | 88.2 | % | | 87.0 | % | | 1.3 | x | | 1.3 | x | | 88.2 | % | | 89.4 | % |
Other | | 8 | | 5.0 | x | | 4.9 | x | | N/A | | | N/A | | | 5.0 | x | | 4.2 | x | | N/A | | | N/A | |
| | | | | | | | | | | | | | | | | | | | | | | | | | |
Total | | 402 | | 1.8 | x | | 1.8 | x | | | | | | | | 1.8 | x | | 1.9 | x | | | | | | |
| | | | | | | | | | | | | | | | | | | | | | | | | | |
Same-Store Triple-Net Portfolio Trend Data for Properties Owned for the Full 2nd and 3rd Quarters of 2008:1,2
| | | | | | | | | | | | | | |
| | | | | Sequential Quarter Comparison | |
| | | Number of
Properties | | 3Q08
Cash Flow
Coverage | | | 2Q08
Cash Flow
Coverage | | | 3Q08
Occupancy | | | 2Q08
Occupancy | |
Property Type | | | | | |
| | | | | |
Hospital | | 40 | | 2.5 | x | | 2.6 | x | | 58.0 | % | | 62.4 | % |
Skilled Nursing | | 192 | | 2.0 | x | | 2.0 | x | | 89.1 | % | | 88.9 | % |
Seniors Housing | | 165 | | 1.3 | x | | 1.3 | x | | 88.2 | % | | 87.1 | % |
Other | | 8 | | 5.0 | x | | 4.9 | x | | N/A | | | N/A | |
| | | | | | | | | | | | | | |
Total | | 405 | | 1.8 | x | | 1.8 | x | | | | | | |
| | | | | | | | | | | | | | |
1 | Third quarter is most recent quarter available. |
2 | Cash flow coverages are for trailing-twelve months or annualized where the Company’s ownership is for a shorter period. |
7
Ventas, Inc.
Fourth Quarter 2008 Supplemental Data
Medical Office Operating Portfolio Statistics:1
| | | | | | | | | | | | | | | | | | | | | | | | |
| | | Year-Over-Year Comparison | |
| | | Stabilized | | | Same-Store Stabilized2,3 | | | Lease-Up | |
| | | 4Q08 | | | 4Q074 | | | 4Q08 | | | 4Q074 | | | 4Q08 | | | 4Q07 | |
Number of properties: | | | 19 | | | | 16 | | | | 15 | | | | 15 | | | | 2 | | | | 2 | |
Number of square feet: | | | 1,046,169 | | | | 791,109 | | | | 760,812 | | | | 760,812 | | | | 181,952 | | | | 181,952 | |
Average occupancy: | | | 95.6 | % | | | 95.3 | % | | | 94.4 | % | | | 95.1 | % | | | 58.9 | % | | | 55.7 | % |
Average annual rate per square foot: | | $ | 29 | | | $ | 28 | | | $ | 28 | | | $ | 28 | | | $ | 26 | | | $ | 27 | |
| | | | | | |
Operating revenue: | | $ | 7.6 | | | $ | 5.5 | | | $ | 5.2 | | | $ | 5.3 | | | $ | 0.7 | | | $ | 0.7 | |
Less expenses: | | | 2.6 | | | | 2.4 | | | | 2.1 | | | | 2.4 | | | | 0.4 | | | | 0.6 | |
| | | | | | | | | | | | | | | | | | | | | | | | |
Total NOI: | | | 4.9 | | | | 3.1 | | | | 3.1 | | | | 2.9 | | | | 0.4 | | | | 0.1 | |
Less Company’s partners’ share: | | | 0.4 | | | | 0.0 | | | | 0.0 | | | | 0.0 | | | | 0.0 | | | | 0.0 | |
| | | | | | | | | | | | | | | | | | | | | | | | |
Ventas NOI: | | $ | 4.5 | | | $ | 3.1 | | | $ | 3.1 | | | $ | 2.9 | | | $ | 0.4 | | | $ | 0.1 | |
| | | | | | | | | | | | | | | | | | | | | | | | |
| | | | | | | | | | | | | | | | | | | | | | | | |
| | | Sequential Quarter Comparison | |
| | | Stabilized | | | Same-Store Stabilized2,3 | | | Lease-Up | |
| | | 4Q08 | | | 3Q084 | | | 4Q08 | | | 3Q084 | | | 4Q08 | | | 3Q08 | |
Number of properties: | | | 19 | | | | 19 | | | | 17 | | | | 17 | | | | 2 | | | | 2 | |
Number of square feet: | | | 1,046,169 | | | | 1,046,169 | | | | 870,041 | | | | 870,041 | | | | 181,952 | | | | 181,952 | |
Average occupancy: | | | 95.6 | % | | | 95.6 | % | | | 95.1 | % | | | 95.2 | % | | | 58.9 | % | | | 57.8 | % |
Average annual rate per square foot: | | $ | 29 | | | $ | 27 | | | $ | 29 | | | $ | 27 | | | $ | 26 | | | $ | 26 | |
| | | | | | |
Operating revenue: | | $ | 7.6 | | | $ | 6.3 | | | $ | 6.3 | | | $ | 5.9 | | | $ | 0.7 | | | $ | 0.8 | |
Less expenses: | | | 2.6 | | | | 1.9 | | | | 2.3 | | | | 1.8 | | | | 0.4 | | | | 0.4 | |
| | | | | | | | | | | | | | | | | | | | | | | | |
Total NOI: | | | 4.9 | | | | 4.4 | | | | 4.1 | | | | 4.1 | | | | 0.4 | | | | 0.4 | |
Less Company’s partner’s share: | | | 0.4 | | | | 0.4 | | | | 0.4 | | | | 0.4 | | | | 0.0 | | | | 0.0 | |
| | | | | | | | | | | | | | | | | | | | | | | | |
Ventas NOI: | | $ | 4.5 | | | $ | 4.0 | | | $ | 3.7 | | | $ | 3.7 | | | $ | 0.4 | | | $ | 0.4 | |
| | | | | | | | | | | | | | | | | | | | | | | | |
1 | Dollars in millions except for rate data. Totals may not add due to rounding. |
2 | Includes only those MOBs owned for the full period. |
3 | Includes only those MOBs owned in both comparison periods. |
4 | Restated to include two MOBs previously classified as non-operating. |
8
Ventas, Inc.
Fourth Quarter 2008 Supplemental Data
Seniors Housing Operating Portfolio Statistics:1
| | | | | | | | | | | | | | | | | | | | | | | | |
| | | Year-Over-Year Comparison | |
| | | Stabilized | | | Same-Store Stabilized2 | | | Lease-Up | |
| | | 4Q08 | | | 4Q07 | | | 4Q08 | | | 4Q07 | | | 4Q08 | | | 4Q073 | |
Number of properties: | | | 77 | | | | 72 | | | | 72 | | | | 72 | | | | 2 | | | | 7 | |
Number of units: | | | 6,220 | | | | 5,831 | | | | 5,831 | | | | 5,831 | | | | 293 | | | | 682 | |
Resident day capacity: | | | 677,396 | | | | 633,972 | | | | 633,972 | | | | 633,972 | | | | 30,728 | | | | 55,720 | |
Average resident occupancy: | | | 90.7 | % | | | 93.1 | % | | | 91.0 | % | | | 93.1 | % | | | 63.7 | % | | | 64.7 | % |
Average daily rate / resident fees: | | $ | 167 | | | $ | 171 | | | $ | 168 | | | $ | 171 | | | $ | 140 | | | $ | 169 | |
| | | | | | |
Operating revenue: | | $ | 102.9 | | | $ | 100.8 | | | $ | 96.7 | | | $ | 100.8 | | | $ | 2.7 | | | $ | 6.1 | |
Less expenses: | | | 71.6 | | | | 68.2 | | | | 67.3 | | | | 68.2 | | | | 1.9 | | | | 5.0 | |
| | | | | | | | | | | | | | | | | | | | | | | | |
Total NOI: | | | 31.3 | | | | 32.6 | | | | 29.4 | | | | 32.6 | | | | 0.9 | | | | 1.1 | |
Less Company’s partner’s share: | | | 4.7 | | | | 4.6 | | | | 4.4 | | | | 4.6 | | | | 0.2 | | | | 0.3 | |
| | | | | | | | | | | | | | | | | | | | | | | | |
Ventas NOI: | | $ | 26.6 | | | $ | 28.0 | | | $ | 25.0 | | | $ | 28.0 | | | $ | 0.7 | | | $ | 0.9 | |
| | | | | | | | | | | | | | | | | | | | | | | | |
| |
| | | Sequential Quarter Comparison | |
| | | Stabilized | | | Same-Store Stabilized2 | | | Lease-Up | |
| | | 4Q08 | | | 3Q08 | | | 4Q08 | | | 3Q08 | | | 4Q08 | | | 3Q08 | |
Number of properties: | | | 77 | | | | 76 | | | | 72 | | | | 72 | | | | 2 | | | | 3 | |
Number of units: | | | 6,220 | | | | 6,141 | | | | 5,831 | | | | 5,831 | | | | 293 | | | | 372 | |
Resident day capacity: | | | 677,396 | | | | 668,656 | | | | 633,972 | | | | 633,972 | | | | 30,728 | | | | 39,468 | |
Average resident occupancy: | | | 90.7 | % | | | 91.5 | % | | | 91.0 | % | | | 91.7 | % | | | 63.7 | % | | | 59.1 | % |
Average daily rate / resident fees: | | $ | 167 | | | $ | 171 | | | $ | 168 | | | $ | 172 | | | $ | 140 | | | $ | 160 | |
| | | | | | |
Operating revenue: | | $ | 102.9 | | | $ | 104.9 | | | $ | 96.7 | | | $ | 100.0 | | | $ | 2.7 | | | $ | 3.7 | |
Less expenses: | | | 71.6 | | | | 69.9 | | | | 67.3 | | | | 66.8 | | | | 1.9 | | | | 3.5 | |
| | | | | | | | | | | | | | | | | | | | | | | | |
Total NOI: | | | 31.3 | | | | 34.9 | | | | 29.4 | | | | 33.3 | | | | 0.9 | | | | 0.3 | |
Less Company’s partner’s share: | | | 4.7 | | | | 5.1 | | | | 4.4 | | | | 4.8 | | | | 0.2 | | | | 0.1 | |
| | | | | | | | | | | | | | | | | | | | | | | | |
Ventas NOI: | | $ | 26.6 | | | $ | 29.8 | | | $ | 25.0 | | | $ | 28.5 | | | $ | 0.7 | | | $ | 0.2 | |
| | | | | | | | | | | | | | | | | | | | | | | | |
1 | Dollars in millions except for rate data. Totals may not add due to rounding. |
2 | Includes only those communities stabilized in both comparison periods. |
3 | 4Q07 occupancy and average daily rate have been corrected. |
9
Ventas, Inc.
Fourth Quarter 2008 Supplemental Data
Kindred Healthcare Same-Store TTM EBITDARM Coverage Ratios:1
| | | | | | | | | | | | | | |
| | | Number of
Properties | | Sequential Quarter Comparison | | | Year-Over-Year Comparison | |
Ventas - Kindred Master Lease | | | 3Q08 | | | 2Q08 | | | 3Q08 | | | 3Q07 | |
1 | | 83 | | 2.4 | x | | 2.4 | x | | 2.4 | x | | 2.4 | x |
2 | | 41 | | 2.0 | x | | 2.1 | x | | 2.0 | x | | 2.2 | x |
3 | | 38 | | 1.9 | x | | 1.9 | x | | 1.9 | x | | 1.9 | x |
4 | | 41 | | 2.3 | x | | 2.3 | x | | 2.3 | x | | 2.4 | x |
| | | | | | | | | | | | | | |
Total | | 203 | | 2.2 | x | | 2.2 | x | | 2.2 | x | | 2.2 | x |
| | | | | | | | | | | | | | |
| | | | | |
Property Type | | Number of
Properties | | 3Q08 | | | 2Q08 | | | 3Q08 | | | 3Q07 | |
Hospitals | | 38 | | 2.5 | x | | 2.7 | x | | 2.5 | x | | 3.0 | x |
Skilled Nursing Facilities | | 165 | | 2.0 | x | | 2.0 | x | | 2.0 | x | | 1.8 | x |
| | | | | | | | | | | | | | |
Total | | 203 | | 2.2 | x | | 2.2 | x | | 2.2 | x | | 2.2 | x |
| | | | | | | | | | | | | | |
1 | Coverage reflects the ratio of Kindred’s EBITDARM to rent. EBITDARM is defined as earnings before interest, income taxes, depreciation, amortization, rent and management fees. In the calculation of trailing twelve months EBITDARM, intercompany profit pertaining to services provided by Kindred’s PeopleFirst Rehabilitation and Pharmacy Divisions has been eliminated from purchased ancillary expenses within the Ventas portfolio. Third quarter is most recent quarter available. |
10
Ventas, Inc.
Fourth Quarter 2008 Supplemental Data
Triple-Net and Operating Portfolio Revenue Rollover Schedule Excluding Sunrise Operating Communities:1
| | | | | | | | | | | | | | | | | | | | | |
| | | | | Lease Rollover Year |
| | | Totals | | 2009 | | 2010 | | 2011 | | 2012 | | 2013 | | Thereafter |
Hospital—Stabilized Triple-Net: | | | | | | | | | | | | | | | | | | | | | |
Annualized Revenue | | $ | 92.0 | | | — | | $ | 43.5 | | | — | | | — | | $ | 45.8 | | $ | 2.7 |
| | | | | | | |
Skilled Nursing—Stabilized Triple-Net: | | | | | | | | | | | | | | | | | | | | | |
Annualized Revenue | | | 177.1 | | | — | | | 81.5 | | | — | | | 1.4 | | | 72.9 | | | 21.3 |
| | | | | | | |
Seniors Housing—Stabilized Triple-Net: | | | | | | | | | | | | | | | | | | | | | |
Annualized Revenue | | | 193.5 | | | — | | | — | | | — | | | 2.7 | | | — | | | 190.9 |
| | | | | | | |
Medical Office—Stabilized: | | | | | | | | | | | | | | | | | | | | | |
Annualized Revenue2 | | | 27.3 | | | 2.5 | | | 3.5 | | | 3.3 | | | 2.5 | | | 1.8 | | | 13.7 |
| | | | | | | |
Medical Office—Lease-Up: | | | | | | | | | | | | | | | | | | | | | |
Annualized Revenue2 | | | 3.0 | | | — | | | — | | | 0.1 | | | 0.2 | | | 0.2 | | | 2.5 |
| | | | | | | |
Other—Stabilized Triple-Net: | | | | | | | | | | | | | | | | | | | | | |
Annualized Revenue | | | 1.0 | | | — | | | 1.0 | | | — | | | — | | | — | | | — |
| | | | | | | | | | | | | | | | | | | | | |
| | | | | | | |
Total: | | | | | | | | | | | | | | | | | | | | | |
Annualized Revenue | | $ | 493.9 | | $ | 2.5 | | $ | 129.4 | | $ | 3.5 | | $ | 6.8 | | $ | 120.6 | | $ | 231.1 |
| | | | | | | | | | | | | | | | | | | | | |
1 | Annualized fourth quarter Ventas revenue assuming all events occurred at the beginning of the period. Dollars in millions. Totals may not add due to rounding. Excludes assets recently sold to Benchmark and Emeritus, and assets to be sold to the University of Kentucky. |
2 | Company’s Partners’ share has not been eliminated from revenue. |
11
Ventas, Inc.
Fourth Quarter 2008 Supplemental Data
Company Development Data:
| | | | | | | | | | | | | | | | | | | | | | |
Status | | Property Name | | Company
Ownership
% | | MSA | | Property
Type | | Number of
Residents or Beds/Units/Square Feet | | Actual/Projected
Opening Date | | Ventas
Estimated/Actual
Acquisition
Date | | Total
Development
Cost1 | | Ventas Fixed
Purchase Price
(incl. FPAC)1 | | Expected
Stabilized
Yield |
| In Lease-up | | Sunrise of Rocklin | | 80% | | Sacramento | | AL/ALZ | | 78 Residents / 64 Units / 48,000 SF | | April 2007 | | April 2007 | | $ | 18.6 | | $ | 15.7 | | 8.25%-8.75% |
| In Lease-up | | Sunrise of Thorne Mills on Steeles | | 80% | | Toronto | | IL/AL/ALZ | | 256 Residents / 229 Units / 210,000 SF | | September 2007 | | December 2007 | | | 62.8 Cdn | | | 52.7 Cdn | | 8.0%-8.5% |
| In Development | | Bon Secours Greenville MOB2 | | 95% | | Greenville | | MOB | | 97,795 RSF | | July 2009 | | September 2008 | | $ | 25.0 | | | N/A | | 7.8%-8.2% |
| In Development | | Parker II MOB2 | | 95% | | Denver | | MOB | | 75,087 RSF | | November 2009 | | October 2008 | | | 20.0 | | | N/A | | 7.5%-7.7% |
| To Be Acquired | | Carroll MOB2 | | 90% | | Baltimore | | MOB | | 77,242 RSF | | December 2009 | | November 2011 | | | 21.0 | | | N/A | | 8.0%-8.5% |
2 | Development cost is estimated cost to Ventas, subject to adjustments. |
12