I am pleased to report The First of Long Island Corporation once again had record earnings, growing to almost $13.5 million, or $1.84 per share in 2009. In addition, our dividend increased 15%, or 10 cents per share. This is noteworthy, because many banks had to cut or eliminate their dividend due to capital concerns.
2009 was a year of growth. Our total assets grew $413.6 million, or 32.8%, and deposits grew $377.2 million, or 41.9%. A portion of our deposit growth was deployed into loans, which grew $169.5 million, or 25.8%, with the balance being deployed into securities.
During the year, our Bank opened two new branches, a Commercial Banking Unit (CBU) in Port Jefferson Station in the first quarter, and a full-service branch in Bayville during the third quarter. In the fourth quarter, we converted our Valley Stream CBU into a full-service branch. These three initiatives were a significant part of our deposit and overall balance sheet growth along with a successful IRA campaign and increased recognition of our brand as we integrated a number of marketing initiatives into a disciplined sales management program. Additionally, the Bank developed 19 new middle market relationships with firms doing in excess of $10 million in sales, and 41 new relationships with firms doing between $1 million and $10 million in sales, which we believe resulted from the market's recognition of ou r brand of banking. We are confident these 60 new commercial relationships will add real franchise value to our institution and additional core deposits.
During 2009, unemployment, foreclosures and bankruptcies continued to rise at disturbing rates. As we enter 2010, we do not feel we are out of the woods in terms of the economic environment; however, our credit quality as of December 31, 2009 remained excellent as evidenced by having only two non-performing loans in the portfolio for $432,000. This is only .05% of our total loans. Credit quality remains a daily focus of the senior management team at The First National Bank of Long Island. This is certainly not a time to let down our guard. Obviously, the banking industry is experiencing increased delinquencies and non-performing loans in our present economic circumstances. Regardless of our vigilance, we are not immune to the environment.
During 2010, we intend to open four more branches in our marketplace: full-service branches in Sea Cliff and Cold Spring Harbor in the first quarter, and full-service branches in Bellmore and East Meadow in the second quarter. We are mitigating the risks associated with branch expansion by opening very small branches that generally have fixed rents for a ten-year period and relatively small variable costs. It is an environment in which we must remain judicious. Based on our assessment of existing economic conditions, we currently plan to slow loan growth and be less assertive with deposit rate promotions. In addition, we plan to continue employing measures designed to preserve capital.
The design and formatting of our new branches hopefully relays the consistent and identifiable values of our organization, which is to give warm and friendly service to our customers. We have not gone with the cubicle and plasma screen look, but rather have designed our branches with soft lighting, rich woods and perhaps a fireplace, the type of environment in which we would like our customers to continue to conduct their business...warm, personal and friendly.
By the end of 2010, we expect to be serving our marketplace with 33 locations. We hope you will have an opportunity to visit one of our new sites. It is not our plan to become a growth machine, but rather to be measured and disciplined in how we expand, invest and seek returns for our shareholders. I admit that our approach is not necessarily unique, but I do believe the level of service offered by our Bank differentiates us within the marketplace.
Besides credit quality, we are acutely aware that we must protect the Bank from the risks associated with rising interest rates. This will be another challenge for the industry in the not too distant future. We believe The First of Long Island Corporation is well positioned to meet this challenge. We continue to attend to what we feel is necessary to mitigate risk, balance growth, and create value, with a long-term view as to what is best for our investors.
Michael N. Vittorio
Colleen A. Vogelsberg
Colleen M. DeStefano
Carol A. Kolesar
John J. Mulder Jr.
Frank M. Plesche
Elizabeth A. Materia
Cathy C. O’Malley
Mary T. Sullivan
Vincent P. Bartilucci
Mary T. Sullivan
Henry C. Suhr
Kirk B. Thomas
Kathleen M. Crowe
Sandy F. Buttacy
Robert A. Pizza
Joyce C. Graber
Judith A. Ferdinand
Doris M. Burkett
Frances A. Koslow
The following is selected consolidated financial data for the past five years. This data should be read in conjunction with the information contained under the caption “Management’s Discussion and Analysis of Financial Condition and Results of Operations” and the accompanying consolidated financial statements and related notes.
The Corporation’s Common Stock trades on The Nasdaq Capital Market tier of The Nasdaq Stock Market under the symbol FLIC. The following table sets forth high and low sales prices for the years ended December 31, 2009 and 2008.
At December 31, 2009, there were 587 stockholders of record of the Corporation’s Common Stock. The number of stockholders of record includes banks and brokers who act as nominees, each of whom may represent more than one stockholder.
Allen E. Busching
Paul T. Canarick
Paul Todd, Inc.
Alexander L. Cover
William H.J. Hoefling
Howard Thomas Hogan Jr., Esq.
John T. Lane
J.P. Morgan & Co.
J. Douglas Maxwell Jr.
Stephen V. Murphy
S.V. Murphy & Co., Inc.
Walter C. Teagle III
Teagle Management, Inc.
Michael N. Vittorio
From left to right (Standing): Alexander L. Cover, Stephen V. Murphy, William H.J. Hoefling, Howard Thomas Hogan Jr., Esq., Michael N. Vittorio, Allen E. Busching and J. Douglas Maxwell Jr.
From left to right (Sitting): Paul T. Canarick, Walter C. Teagle III and John T. Lane
Michael N. Vittorio
Sallyanne K. Ballweg
Mark D. Curtis
Brian J. Keeney
Donald L. Manfredonia
From left to right (standing): Mark D. Curtis, John Grasso, Michael N. Vittorio, Richard Kick and Brian J. Keeney; (Sitting): Sallyanne K. Ballweg and Donald L. Manfredonia
During a time when many throughout the financial services sector struggled to remain viable for yet another day, our strength and stability enabled The First National Bank of Long Island to remain focused on our solid strategy for market growth and branch expansion.
Expanding our footprint in key markets is an integral element of our blueprint for success for the Bank, and for the affluent households and businesses we serve. By strategically strengthening our presence in those communities where our key clients live and work, we continue to provide the superior financial products and services to meet their personal and business banking needs.
With a growing branch network that currently consists of 31 branches, we are enhancing our brand presence as the Bank “Where Everyone Knows Your Name™” and bolstering our reputation as a stable, regional bank. Our branches are designed to meet the needs of each specific market area, from commercial banking centers in Manhattan and select service banking centers in Lake Success and Smithtown, to full-service branches across Nassau and Suffolk.
From left to right (standing): Michele DiPietro, Teller; Nicole Blennau, Customer Service Representative and Vivette Simon, Head Teller
From left to right (sitting): Toni Valente, Vice President & Branch Manager and Susan Pickrodt, Assistant Branch Manager
In 2009, we opened a new, full-service branch in Bayville, as well as a new commercial banking office in the heart of the thriving business community of Port Jefferson Station. We also converted our Valley Stream office from a commercial banking center to a full-service branch to meet the needs of the people and businesses in that community. As a result, we’ve successfully grown our deposits and strengthened our banking relationships throughout our network.
This is a strategy we plan to continue in 2010. As of March 8, we have opened two new full-service branches in Sea Cliff and Cold Spring Harbor on Long Island’s upscale north shore. Within the next several months, these branches will be joined by two more in Bellmore and East Meadow.
Our market commitment will continue – and grow stronger – as we look into strategically expanding our footprint within the affluent communities of Nassau and Suffolk and build a blueprint for success for our future, and that of our clients.
From left to right: John Grasso, Executive Vice President; Pat LaGrasta, Head Teller; Elizabeth Materia, Vice President & Branch Manager; Feroza G. Mehta, Customer Service Representative/Administrative Assistant; Keith DeCuir, Assistant Vice President & Branch Manager; Michael N. Vittorio, President & CEO; and Sallyanne K. Ballweg, Senior Executive Vice President
A 30-year banking industry veteran, Jerry Scansarole made the move from a “big” bank to The First National Bank of Long Island’s select service banking center in Lake Success nearly four years ago. This transition from the “mass market” to a more specialized, individualized approach to banking has been an exciting one, according to Jerry, particularly during these challenging economic times.
“While the recent events in our industry have made for a more challenging climate, there are also more opportunities in terms of the financial services and strategies we can provide. I work with affluent individuals and principals of large corporations, rather than the broader mass market, and help them develop strategies to maximize their banking and investments. We offer them access to a wide variety of products and services that fit their needs and goals. This specialized approach – and the quality of our service – is something other banks simply can’t beat.”
This service-driven approach is part of Jerry’s “blueprint for success” for his branch, which has seen deposit balances more than double since 2006.
“There are opportunities for select service banking centers like ours to give our clients access to the alternative investment vehicles they seek, and generate additional revenue for the Bank.”
Christina Marotta’s “blueprint for success” can be found in the bond she’s created with each of her personal and business banking customers since she began managing the full-service Greenvale branch in 2006.
“We always go above and beyond for our customers. I take the time to get to know my customers, both on a business and a personal level. This helps me establish a bond. Many of our customers feel they are part of our bank family - they truly are ‘valued’ customers,” Christina explains. “The quality of service we offer is unlike any other, and that extends all the way up to senior management. If I ever need the executives to join me in meeting a customer, they will make themselves available.”
That’s what Christina attributes to her own growth and The First National Bank of Long Island’s continued growth despite a challenging and increasingly competitive business environment.
“Our clients come to us for personal service and we deliver. I meet with my customers at least once a month and will gladly travel to their offices to help them solve a problem.”
Donald L. Manfredonia – Executive Vice President Senior Lending Officer – Commercial Lending
A senior lending officer here since 1982, Donald Manfredonia has been part of the team that has helped The First National Bank of Long Island evolve into an almost $1.7 billion regional bank, but he still gets his biggest enjoyment helping business customers create their own “blueprint for success.”
“We work one-on-one with our customers to help them become more successful. There have been many instances where the bank has enabled customers to achieve their goals and grow their business or expand their network of opportunities,” Don says. “One client we brought in during the early 1990s came to us with $2 million in sales. We loaned him the money to buy another company and now the business is recording $25 to $30 million in sales. Our loan catapulted them to grow to 10 times their original size – and they are still our customer. Our hands-on approach, understanding of our clients’ business and philosophy and management agility enable us to structure deals that make sense for all parties involved.”
While Don views the Bank’s growth in recent years as exciting and stimulating, since it gives the bank the ability to do more for its customers, he also holds steadfast to its responsibility to the stockholders, which requires a disciplined, responsible approach to lending.
“We’ve always taken a measured and disciplined approach to lending money. Our clients realize we are their partner and a company they can rely on for support, despite whatever is going on in the economy.”
Rockville Centre’s Branch Manager, Linda Roldan, has only been a part of The First National Bank of Long Island for about 18 months, but the former “big bank” Branch Manager who began her career in 1990 has seen significant growth in the technology and service options during that time.
“The Bank has not only been expanding its network but also giving customers new, off-site banking options – from remote deposit scanners and an upgraded web site to e-statements and other ‘green’ initiatives,” she explains. “But what sets us apart is our personal touch and our accessibility. I was recently working on establishing a relationship with a library that was looking to leave its financial institution because the executives were concerned about its stability. I shared our information with them and to show just how personal we are, the Bank’s President and CEO came with me to welcome this new customer to our institution.”
“Personally, what I find to be most important is to give our customers options. They can come to me with an issue and I’ll outline the various options available to help resolve it.”
M A N A G E M E N T ' S D I S C U S S I O N A N D A N A L Y S I S O F
F I N A N C I A L C O N D I T I O N A N D R E S U L T S O F O P E R A T I O N S
The following is management's discussion and analysis of certain significant factors that have affected the Corporation’s financial condition and operating results during the periods included in the accompanying consolidated financial statements, and should be read in conjunction with such financial statements. The Corporation’s financial condition and operating results principally reflect those of its wholly-owned subsidiary, The First National Bank of Long Island, and subsidiaries wholly-owned by the Bank, either directly or indirectly, The First of Long Island Agency, Inc., FNY Service Corp (“FNY”)., and The First of Long Island REIT, Inc. (“REIT”). The consolidated entity is referred to as the “Corporation” and the Bank and its subsidiaries are collectively referred to as the “Bank.” The Bank’s primary service area is Nassau and Suffolk Counties, Long Island. However, the Bank has three commercial banking branches in Manhattan and may open additional Manhattan branches in the future.
Overview
Overview – 2009 Versus 2008. The Corporation earned $1.84 per share in 2009, an increase of 6 cents, or 3.4%, over $1.78 earned in 2008. Cash dividends per share grew by 10 cents, or 15.2%, from 66 cents per share in 2008 to 76 cents this year.
The Bank’s core business of gathering deposits and making loans was strong in 2009. Total deposits grew by $377.2 million, or 41.9%, and gross loans grew by $169.5 million, or 25.8%. Two thirds of the overall deposit growth came from savings and money market products, with most of the remaining growth occurring in time deposits. Contributing to deposit growth were new branch openings and expansion of existing branches, competitively priced deposit products, a high level of customer service and deposit rate promotions. In addition, management believes that uncertainty in the equity markets and the negative publicity surrounding money center banks also played a role.
Loan growth, the primary driver of earnings growth in 2009, principally occurred in what management considers to be lower risk loan categories including multifamily commercial mortgages, owner occupied commercial mortgages, and first lien residential mortgages with ten to fifteen year terms. By contrast, management considers construction and land development loans to be high risk and has purposely not grown this category. Construction and land development loans amounted to only $3.1 million, or .4% of gross loans, at year-end 2009. Loan growth occurred in 2009 as part of management’s continued efforts to improve the Bank’s current and future earnings prospects by making loans a larger portion of the overall balance sheet.
The Bank has not originated nor does it hold any subprime or alt-A mortgages in its loan portfolio, nor has it originated any loans that management would otherwise consider to be high risk. The credit quality of the Bank’s loan portfolio remains excellent as evidenced by, among other things, a very low level of delinquent and nonaccrual loans. Nonaccrual loans amounted to $432,000 at year-end 2009, or .05% of gross loans. Total loans past due 30 days or more, including nonaccrual loans, plus troubled debt restructurings amounted to $2.7 million at year-end 2009, or .32% of gross loans. In addition, the Bank had no foreclosed real estate at year-end 2009. The credit quality of the Bank’s securities portfolio also remains e xcellent. All of the Bank’s mortgage securities are backed by mortgages underwritten on conventional terms, and 96% of these securities and underlying mortgages represent full faith and credit obligations of the U.S. government. As full faith and credit obligations, the U.S. government guarantees the timely payment of principal and interest thereon. Substantially all of the remaining debt securities in the Bank’s portfolio, consisting almost exclusively of municipal securities, are rated A or better by major rating agencies.
National and local economic conditions remained unfavorable throughout 2009. Furthermore, management believes that economic conditions will not improve considerably in 2010, and any improvement beyond 2010 will occur slowly over an extended period of time. In addition the Bank has grown its loan portfolio at a compound annual growth rate of 19% over the last five years and its loan portfolio is primarily comprised of commercial and residential real estate loans concentrated on Long Island and in New York City. Based on these and other factors, and despite the fact that the Bank has a very low level of identified problem loans, in closing the fourth quarter of this year management decided to increase the Bank’s allowance for loan losses relative to g ross loans. The Bank’s allowance for loan losses at year-end 2009 is $10.3 million, or 1.25% of gross loans, compared to $6.1 million, or .92% of gross loans, at year-end 2008. Going forward, management will continue to carefully assess the adequacy of the Bank’s allowance for loan losses in light of a variety of factors including national and local economic conditions and the specific composition and characteristics of the Bank’s loan portfolio. Depending on this assessment, and absent any significant increase in identified problem loans, management may continue to increase the Bank’s allowance for loan losses relative to gross loans. In addition, based on its assessment of current economic conditions, management currently plans to significantly slow loan growth and be less assertive in terms of deposit rate promotions. On an ongoing basis management will continue to assess loan and deposit growth and may change its current plan based on, among other things, current economic conditions, levels of problem loans and the Bank’s capital ratios.
The Bank’s capital ratios trended down in 2009 due to overall balance sheet growth and growth in the Bank’s loan portfolio, but still exceed the current regulatory criteria for a well-capitalized bank. Total stockholders’ equity before accumulated other comprehensive income or loss grew by $8.7 million in 2009 versus $3.4 million in 2008. The larger growth in 2009 is primarily attributable to the fact that the Corporation significantly reduced its share repurchases in order to preserve and build capital in light of the unfavorable economic climate. In addition, on an ongoing basis the Corporation will continue to assess the level of its cash dividend and may, based on its capital preservation goals or otherwise, depart from its historical dividend trend in light of current economic conditions and a variety of other factors which include but are not limited the Bank’s overall balance sheet growth, loan growth and capital ratios.
Net interest margin declined in 2009 because the rates available for investments in loans and securities declined, and rapid deposit growth resulted in the need to temporarily invest excess cash in low yielding balances with correspondent banks until better yielding loans and securities could be originated or purchased. Margin also declined because management shortened the average duration of the Bank’s taxable securities portfolio as a prudent measure to, among other things, protect the Bank’s net interest income in the event of an increase in interest rates. Noninterest income increased by $1.5 million, or 23.6%, in 2009 because of increases in service charge income and gains on sales of securities of $.5 million and $1.2 million, respectively. &# 160;FDIC insurance expense increased by $1,630,000, or from $558,000 in 2008 to $2,188,000 this year. The increase was caused by failures in the industry and their adverse impact on the deposit insurance fund (“DIF”). Pension plan expense increased by $1,041,000, or from $576,000 in 2008 to $1,617,000 this year. The increase resulted from a decline in long-term interest rates and the poor performance of the equity markets in 2008. Management believes that further increases in FDIC insurance expense resulting from special assessments and/or an increase in the base assessment rate are likely. Defined benefit pension plan expense will decline by $675,000 in 2010 as a result of improved performance of the equity markets in 2009.
The Corporation’s effective tax rate, or income tax expense as a percentage of book income, declined from 26.3% in 2008 to 18.8% this year. The decline is attributable to a restructuring of the ownership of the Corporation’s REIT entity in December 2008 and a significant increase this year in the size of the Bank’s tax-exempt municipal securities portfolio. The REIT restructuring, which reduced the Corporation’s 2009 income tax burden by approximately $700,000, was done in response to a change in New York State tax law in 2008. The law change deprived the Corporation in 2008 of the tax benefit that had traditionally been derived from its REIT entity and the restructuring restored that benefit. The Bank significantly incr eased the size of its tax-exempt municipal securities portfolio this year in response to provisions of the American Recovery and Reinvestment Act of 2009 which enabled the Bank to buy certain tax-exempt securities at what it believes to be attractive yields without the usual limitations imposed by the federal alternative minimum tax.
In the first quarter of 2009, the Bank opened a commercial banking office in Port Jefferson Station, Long Island. Subsequently in 2009, a full service branch was opened in Bayville, Long Island and the Valley Stream commercial banking office was converted to a full service branch. In January 2010, the Bank opened a full service branch in Sea Cliff, Long Island, and in March 2010 opened another full service branch in Cold Spring Harbor, Long Island. Continued branch expansion in targeted markets on Long Island and in Manhattan remains a key strategic initiative.
Overview – 2008 Versus 2007. Earnings per share increased by 17.9%, or $.27 per share, from $1.51 in 2007 to $1.78 in 2008. Net income increased by $1,480,000 from $11,482,000 in 2007 to $12,962,000 in 2008. Returns on average assets (“ROA”) and equity (“ROE”) were 1.10% and 12.87%, respectively, in 2008 as compared to 1.14% and 11.67% in 2007. The improvement in ROE is attributable to increased earnings and share repurchases made pursuant to the Corporation’s share repurchase program.
Earnings increased in 2008 largely because of loan growth. From year-end 2007 to year-end 2008 total loans grew by $132.6 million, or 25.2%. Commercial mortgages were up $103.5 million, or 61.0%, traditional residential mortgage loans were up $21.7 million, or 11.1%, and home equity loans were up $18.1 million, or 22.1%. The loan growth resulted from management’s continued efforts to improve the Bank’s current and future earnings prospects by making loans a larger portion of the overall balance sheet. The growth was partially funded by a $31.3 million increase in deposits, with the balance being funded by an increase in overnight borrowings.
Also contributing to the increase in earnings was a borrowing and investing strategy undertaken in the latter part of 2007 and continued in 2008. This strategy, which accounts for $127 million of the borrowings under repurchase agreements at December 31, 2008, is primarily responsible for the increase in investment securities of $81.9 million when comparing year-end 2008 to 2007. The borrowings were undertaken to increase current earnings and, for those borrowings with embedded interest rate caps (“caps”), protect the Bank’s future earnings in the event of an increase in interest rates.
A decline in interest rates in 2008 is yet another important factor that contributed to the increase in earnings. Earnings increased because the Bank’s interest-bearing deposits are generally shorter in duration than its interest-earning assets and therefore reprice faster in a changing rate environment. In addition, short-term interest rates, which are the primary driver of the rates paid by the Bank on its deposit products, declined more than intermediate and longer-term interest rates, which are the primary drivers of the yields available to the Bank on the repricing and origination of loans and purchase of securities.
The Corporation continued its share repurchase program in 2008. Under the program, the Corporation purchased 296,479 shares, representing 4.0% of total shares outstanding at the beginning of the year. This compares to 180,800 shares purchased in 2007, or 2.4% of total shares outstanding at the start of the year. The share repurchase program has historically enhanced earnings per share and return on average stockholders’ equity. The program is estimated to have contributed four cents more to earnings per share in 2008 than 2007. The larger contribution to earnings per share in 2008 is attributable to the full-year impact of the shares purchased in 2007 plus the pro rata impact of the shares purchased throughout 2008.
The positive impact on earnings of loan growth, the borrowing and investing strategy, the decline in interest rates and the share repurchase program was partially offset by an increase in noninterest expense of $2.3 million and, as previously discussed, the loss of the tax benefit associated with the Corporation’s REIT entity. The major components of the increase in noninterest expense are a $458,000 increase in FDIC deposit insurance expense, a $460,000 increase in retirement plan expense, and personnel costs and other expenses of branch expansion.
Net Interest Income
Average Balance Sheet; Interest Rates and Interest Differential. The following table sets forth the average daily balances for each major category of assets, liabilities and stockholders’ equity as well as the amounts and average rates earned or paid on each major category of interest-earning assets and interest-bearing liabilities.
| | | 2009 | | | 2008 | | | 2007 | |
| | | Average | | | Interest/ | | | Average | | | Average | | | Interest/ | | | Average | | | Average | | | Interest/ | | | Average | |
| | | Balance | | | Dividends | | | Rate | | | Balance | | | Dividends | | | Rate | | | Balance | | | Dividends | | | Rate | |
| Assets: | | (dollars in thousands) | |
| Federal funds sold and overnight investments | | $ | 374 | | | $ | - | | | | - | % | | $ | 19,362 | | | $ | 480 | | | | 2.48 | % | | $ | 30,166 | | | $ | 1,505 | | | | 4.99 | % |
| Investment securities: | | | | | | | | | | | | | | | | | | | | | | | | | | | | | | | | | | | | |
| Taxable | | | 443,559 | | | | 18,926 | | | | 4.27 | | | | 386,404 | | | | 18,857 | | | | 4.88 | | | | 289,040 | | | | 13,529 | | | | 4.68 | |
| Nontaxable (1) | | | 181,084 | | | | 11,508 | | | | 6.36 | | | | 143,121 | | | | 9,373 | | | | 6.55 | | | | 146,341 | | | | 9,639 | | | | 6.59 | |
| Loans (1) (2) | | | 716,569 | | | | 39,780 | | | | 5.55 | | | | 572,356 | | | | 34,193 | | | | 5.97 | | | | 480,166 | | | | 31,632 | | | | 6.59 | |
| Total interest-earning assets (1) | | | 1,341,586 | | | | 70,214 | | | | 5.23 | | | | 1,121,243 | | | | 62,903 | | | | 5.61 | | | | 945,713 | | | | 56,305 | | | | 5.96 | |
| Allowance for loan losses | | | (6,357 | ) | | | | | | | | | | | (4,947 | ) | | | | | | | | | | | (4,167 | ) | | | | | | | | |
| Net interest-earning assets | | | 1,335,229 | | | | | | | | | | | | 1,116,296 | | | | | | | | | | | | 941,546 | | | | | | | | | |
| Cash and due from banks | | | 42,962 | | | | | | | | | | | | 32,524 | | | | | | | | | | | | 32,672 | | | | | | | | | |
| Premises and equipment, net | | | 16,937 | | | | | | | | | | | | 11,587 | | | | | | | | | | | | 9,374 | | | | | | | | | |
| Other assets | | | 18,504 | | | | | | | | | | | | 21,248 | | | | | | | | | | | | 19,648 | | | | | | | | | |
| | | $ | 1,413,632 | | | | | | | | | | | $ | 1,181,655 | | | | | | | | | | | $ | 1,003,240 | | | | | | | | | |
| Liabilities and Stockholders' Equity: | | | | | | | | | | | | | | | | | | | | | | | | | | | | | | | | | | | | |
| Savings and money market deposits | | $ | 501,125 | | | | 5,287 | | | | 1.06 | | | $ | 364,974 | | | | 4,576 | | | | 1.25 | | | $ | 320,539 | | | | 4,768 | | | | 1.49 | |
| Time deposits | | | 266,216 | | | | 6,485 | | | | 2.44 | | | | 236,820 | | | | 6,782 | | | | 2.86 | | | | 220,196 | | | | 10,081 | | | | 4.58 | |
| Total interest-bearing deposits | | | 767,341 | | | | 11,772 | | | | 1.53 | | | | 601,794 | | | | 11,358 | | | | 1.89 | | | | 540,735 | | | | 14,849 | | | | 2.75 | |
| Short-term borrowings | | | 40,663 | | | | 221 | | | | .54 | | | | 48,379 | | | | 746 | | | | 1.54 | | | | 20,856 | | | | 896 | | | | 4.30 | |
| Long-term debt | | | 153,466 | | | | 6,341 | | | | 4.13 | | | | 108,896 | | | | 4,639 | | | | 4.26 | | | | 11,849 | | | | 524 | | | | 4.42 | |
| Total interest-bearing liabilities | | | 961,470 | | | | 18,334 | | | | 1.91 | | | | 759,069 | | | | 16,743 | | | | 2.21 | | | | 573,440 | | | | 16,269 | | | | 2.84 | |
| Checking deposits | | | 334,487 | | | | | | | | | | | | 317,696 | | | | | | | | | | | | 327,686 | | | | | | | | | |
| Other liabilities | | | 6,908 | | | | | | | | | | | | 4,180 | | | | | | | | | | | | 3,712 | | | | | | | | | |
| | | | 1,302,865 | | | | | | | | | | | | 1,080,945 | | | | | | | | | | | | 904,838 | | | | | | | | | |
| Stockholders' equity | | | 110,767 | | | | | | | | | | | | 100,710 | | | | | | | | | | | | 98,402 | | | | | | | | | |
| | | $ | 1,413,632 | | | | | | | | | | | $ | 1,181,655 | | | | | | | | | | | $ | 1,003,240 | | | | | | | | | |
| Net interest income (1) | | | | | | $ | 51,880 | | | | | | | | | | | $ | 46,160 | | | | | | | | | | | $ | 40,036 | | | | | |
| Net interest spread (1) | | | | | | | | | | | 3.32 | % | | | | | | | | | | | 3.40 | % | | | | | | | | | | | 3.12 | % |
| Net interest margin (1) | | | | | | | | | | | 3.87 | % | | | | | | | | | | | 4.12 | % | | | | | | | | | | | 4.23 | % |
(1) | Tax-equivalent basis. Interest income on a tax-equivalent basis includes the additional amount of interest income that would have been earned if the Corporation's investment in tax-exempt loans and investment securities had been made in loans and investment securities subject to Federal income taxes yielding the same after-tax income. The tax-equivalent amount of $1.00 of nontaxable income was $1.52 in each period presented, based on a Federal income tax rate of 34%. |
| (2) | For the purpose of these computations, nonaccruing loans are included in the daily average loan amounts outstanding. |
Rate/Volume Analysis. The following table sets forth the effect of changes in volumes, rates, and rate/volume on tax-equivalent interest income, interest expense and net interest income.
| | | Year Ended December 31, | |
| | | 2009 versus 2008 | | | 2008 versus 2007 | |
| | | Increase (decrease) due to changes in: | | | Increase (decrease) due to changes in: | |
| | | | | | | | | Rate/ | | | Net | | | | | | | | | Rate/ | | | Net | |
| | | Volume | | | Rate | | | Volume (1) | | | Change | | | Volume | | | Rate | | | Volume (1) | | | Change | |
| | | (in thousands) | |
| Interest Income: | | | | | | | | | | | | | | | | | | | | | | | | |
| Federal funds sold and overnight investments. | | $ | (471 | ) | | $ | (480 | ) | | $ | 471 | | | $ | (480 | ) | | $ | (539 | ) | | $ | (757 | ) | | $ | 271 | | | $ | (1,025 | ) |
| Investment securities: | | | | | | | | | | | | | | | | | | | | | | | | | | | | | | | | |
| Taxable | | | 2,789 | | | | (2,370 | ) | | | (350 | ) | | | 69 | | | | 4,557 | | | | 577 | | | | 194 | | | | 5,328 | |
| Nontaxable | | | 2,486 | | | | (278 | ) | | | (73 | ) | | | 2,135 | | | | (212 | ) | | | (55 | ) | | | 1 | | | | (266 | ) |
| Loans | | | 8,615 | | | | (2,419 | ) | | | (609 | ) | | | 5,587 | | | | 6,073 | | | | (2,947 | ) | | | (565 | ) | | | 2,561 | |
| Total interest income | | | 13,419 | | | | (5,547 | ) | | | (561 | ) | | | 7,311 | | | | 9,879 | | | | (3,182 | ) | | | (99 | ) | | | 6,598 | |
| | | | | | | | | | | | | | | | | | | | | | | | | | | | | | | | | |
| Interest Expense: | | | | | | | | | | | | | | | | | | | | | | | | | | | | | | | | |
| Savings and money market deposits | | | 1,707 | | | | (725 | ) | | | (271 | ) | | | 711 | | | | 661 | | | | (749 | ) | | | (104 | ) | | | (192 | ) |
| Time deposits | | | 842 | | | | (1,013 | ) | | | (126 | ) | | | (297 | ) | | | 761 | | | | (3,775 | ) | | | (285 | ) | | | (3,299 | ) |
| Short-term borrowings | | | (119 | ) | | | (483 | ) | | | 77 | | | | (525 | ) | | | 1,182 | | | | (574 | ) | | | (758 | ) | | | (150 | ) |
| Long-term debt | | | 1,899 | | | | (140 | ) | | | (57 | ) | | | 1,702 | | | | 4,292 | | | | (19 | ) | | | (158 | ) | | | 4,115 | |
| Total interest expense | | | 4,329 | | | | (2,361 | ) | | | (377 | ) | | | 1,591 | | | | 6,896 | | | | (5,117 | ) | | | (1,305 | ) | | | 474 | |
| | | | | | | | | | | | | | | | | | | | | | | | | | | | | | | | | |
| Increase (decrease) in net interest income | | $ | 9,090 | | | $ | (3,186 | ) | | $ | (184 | ) | | $ | 5,720 | | | $ | 2,983 | | | $ | 1,935 | | | $ | 1,206 | | | $ | 6,124 | |
| (1) | Represents the change not solely attributable to change in rate or change in volume but a combination of these two factors. The rate/volume variance could be allocated between the volume and rate variances shown in the table based on the absolute value of each to the total for both. |
Net Interest Income – 2009 Versus 2008
Net interest income on a tax-equivalent basis increased by $5,720,000 or from $46,160,000 in 2008 to $51,880,000 this year. The most significant reason for the increase is growth in the Bank’s loan portfolio, which, on an average balance basis, grew by $144.2 million, or 25.2%. Loan growth was funded by an increase in interest-bearing deposits, which, on an average balance basis, grew by $165.5 million, or 27.5%. Deposit growth in excess of that needed to grow loans was mostly invested in a combination of taxable and nontaxable securities. Also contributing to the growth in net interest income was a 30 basis point reduction in the overall cost of deposits and borrowings in 2009 resulting from the steady decline in market interest rates in 2008 and the Bank’s ability to lower its deposit rates throughout 2009 in response to more rational pricing in its marketplace.
The positive impact of loan growth and lower deposit and borrowing costs was partially offset by a decline in rates available for investments in loans and securities. Other offsetting factors were management shortened the average duration of the Bank’s taxable securities portfolio as a prudent measure to, among other things, protect the Bank’s net interest income in the event of an increase in interest rates, and the Bank’s need to temporarily invest excess cash resulting from rapid deposit growth in low yielding balances with correspondent banks until better yielding loans and securities could be originated or purchased. These offsetting factors are the principal causes of the 38 basis point reduction in the overall yield on interest-earning assets in 2009.
While net interest income increased in 2009, net interest spread declined by 8 basis points as the yield on interest-earning assets declined more than the cost of deposits and borrowings. Net interest margin declined even more than net interest spread, or by 38 basis points, because a significant portion of the Corporation’s interest-earning assets are funded by noninterest-bearing liabilities and capital. For these assets, a reduction in yield has no offsetting reduction in interest cost and therefore results in a corresponding reduction in net interest margin. Also negatively impacting net interest margin were deposit rate promotions associated with new branch openings, expansion of existing branches and management’s desire to grow certain categories o f deposits.
Net Interest Income – 2008 Versus 2007
Net interest income on a tax-equivalent basis increased by $6,124,000, or from $40,036,000 in 2007 to $46,160,000 in 2008. The most significant reason for the increase in net interest income was growth in the Bank’s loan portfolio. On an average balance basis, total loans grew by $92.2 million in 2008, or 19.2%. A majority of the growth in average loan balances was funded by an increase of $61.1 million in average interest bearing deposits and the remainder was funded by an increase in average borrowings.
Also contributing to the increase in net interest income was a borrowing and investing strategy undertaken in the latter part of 2007 and continued in 2008. This strategy, which accounts for the $127 million of long-term debt at December 31, 2008, is primarily responsible for the increase in average long-term debt of $97 million and the increase in average taxable investment securities of $97.4 million when comparing 2008 to 2007. Of the total borrowings under this strategy, $75 million have embedded interest rate caps with a notional amount of $120 million. The borrowings without caps were undertaken to increase current earnings by taking advantage of the spread between borrowing and investing rates for similar duration instruments. The borrow ings with caps also added to earnings, but to a lesser extent because they include the cost of the caps, and were primarily undertaken to protect the Bank’s future earnings in the event of an increase in interest rates.
A decline in interest rates in 2008 was yet another important factor that contributed to the increase in net interest income. Net interest income increased because the Bank’s interest-bearing deposit liabilities are generally shorter in duration than its interest-earning assets and therefore reprice faster in a changing rate environment. In addition, short-term interest rates, which are the primary driver of the rates paid by the Bank on its deposit products, declined more than intermediate and longer-term interest rates, which are the primary drivers of the yields available to the Bank on the repricing and origination of loans and purchase of securities. When comparing 2008 to 2007, the overall yield on interest-earning assets declined by 35 basis points whil e the overall cost of deposits decreased by 86 basis points.
The investment securities purchased with borrowed funds had a higher overall yield than the Bank’s existing securities portfolio. This is the primary reason that the yield on the Bank’s taxable securities portfolio increased by 20 basis points when comparing 2008 to 2007.
Although net interest spread increased by 28 basis points in 2008, net interest margin declined by 11 basis points. The decline in net interest margin occurred largely because the margin on the borrowing and investing strategy is less than the margin on the balance of the Bank’s interest-earning assets and interest-bearing liabilities. In addition, the return on noninterest-bearing checking balances and capital decreased due to the lower yield on interest-earning assets. Excluding the borrowing and investing strategy, net interest margin for 2008 would have increased versus 2007 and the increase in net interest spread would have been greater.
Noninterest Income, Noninterest Expense, and Income Taxes
Noninterest income includes service charges on deposit accounts, Investment Management Division income, gains or losses on sales of securities, and all other items of income, other than interest, resulting from the business activities of the Corporation. Noninterest income increased by $1,485,000, or 23.6%, from $6,281,000 in 2008 to $7,766,000 in 2009. The increase is almost entirely due to a $1,180,000 increase in net gains on sales of available-for-sale securities and a $518,000 increase in service charge income, as partially offset by a $219,000 decrease in Investment Management Division income. The gains on sales of securities resulted from the sale of approximately $49 million of available-for-sale securities. The proceeds of the sale were generally reinvested in securities having a lo nger duration and average yield slightly higher than the securities sold. Service charge income increased primarily as a result of an increase in return check charges. Investment Management Division income is down primarily as a result of a market related decrease in the value of assets under management.
Noninterest income increased by $699,000, or 12.5%, from $5,582,000 in 2007 to $6,281,000 in 2008. The increase is principally due to a $482,000 increase in net gains on sales of available-for-sale securities, a $198,000 increase in other noninterest income and a $102,000 increase in service charge income. The increase in other noninterest income is primarily attributable to small increases in miscellaneous consumer fees. Service charge income increased as a result of an increase in maintenance and activity charges.
Noninterest expense is comprised of salaries, employee benefits, occupancy and equipment expense and other operating expenses incurred in supporting the various business activities of the Corporation. Noninterest expense was $34,840,000 and $29,689,000 in 2009 and 2008, respectively, representing increases over prior year amounts of $5,151,000, or 17.3%, and $2,305,000, or 8.4%.
The increase in noninterest expense for 2009 is comprised of increases in other operating expenses of $2,053,000, or 33.8%, employee benefits expense of $1,228,000, or 26.7%, occupancy and equipment expense of $1,038,000, or 20.8%, and salaries of $832,000, or 5.9%. The increase in other operating expenses is largely attributable to a $1,630,000 increase in FDIC deposit insurance expense caused by failures in the industry. Such failures resulted in an increase in the FDIC’s base assessment rates for 2009 and an industry wide special assessment of 5 basis points on total assets minus Tier 1 capital as of June 30, 2009. The special assessment cost the Bank approximately $648,000. Management believes that higher base assessment rates, additional special assessments, or both are likely in 2010 and future years. Please refer to the section titled “Legislation and Regulatory Matters” for a further discussion on this topic.
The increase in employee benefits expense is largely the result of a $1,041,000 increase in pension plan expense. The increase resulted from a decline in long-term interest rates and the poor performance of the equity markets in 2008. Defined benefit pension plan expense will decline by $675,000 in 2010 as a result of improved performance of the equity markets in 2009. Occupancy and equipment expense increased primarily due to branch expansion, technology upgrades, and maintenance of facilities. The increase in salaries expense is primarily due to normal annual salary adjustments and additions to staff related to branch expansion.
The increase in noninterest expense for 2008 is comprised of increases in other operating expenses of $730,000, or 13.7%, employee benefits expense of $608,000, or 15.2%, occupancy and equipment expense of $567,000, or 12.8%, and salaries of $400,000, or 2.9%. The increase in other operating expenses is largely attributable to a $458,000 increase in FDIC deposit insurance expense. The increase in employee benefits expense is largely the result of an increase in retirement plan expense. Occupancy and equipment expense increased primarily due to branch openings and branch expansion. The increase in salaries expense is due to normal annual salary adjustments, additions to staff related to branch expansion, and severance payments, as largely offset by staff reductions accomplished through attrit ion.
Income tax expense as a percentage of book income (“effective tax rate”) was 18.8% in 2009, 26.3% in 2008 and 20.1% in 2007. Despite state income taxes, the benefit of tax-exempt income causes the effective tax rate to be considerably lower than the statutory Federal income tax rate of 34%. The increase in the effective tax rate in 2008 is the result of the Corporation losing the tax benefit derived from its REIT entity and tax-exempt income representing a smaller percentage of income before income taxes. The loss of the REIT tax benefit resulted from a change in New York State tax law effective January 1, 2008. In December 2008, the ownership of the REIT entity within the consolidated group was changed to once again obtain favorable tax treatment. This change, combined with an i ncrease in tax-exempt income, caused the effective tax rate to decrease in 2009.
Application of Critical Accounting Policies
In preparing the consolidated financial statements, management is required to make estimates and assumptions that affect the reported asset and liability balances and revenue and expense amounts. Our determination of the allowance for loan losses is a critical accounting estimate because it is based on our subjective evaluation of a variety of factors at a specific point in time and involves difficult and complex judgments about matters that are inherently uncertain. In the event that management’s estimate needs to be adjusted based on, among other things, additional information that comes to light after the estimate is made or changes in circumstances, such adjustment could result in the need for a significantly different allowance for loan losses and thereby materially impact, either positively or negativ ely, the Bank’s results of operations.
The Bank’s Management Loan Committee, which is chaired by the Senior Lending Officer, meets on a quarterly basis and is responsible for determining the allowance for loan losses after considering, among other things, the results of credit reviews performed by the Bank’s loan review officer. In addition, and in consultation with the Bank’s Chief Financial Officer, the Management Loan Committee is responsible for implementing and maintaining policies and procedures surrounding the calculation of the required allowance. The Bank’s allowance for loan losses is subject to periodic examination by the Office of the Comptroller of the Currency, the Bank’s primary federal banking regulator, whose safety and soundness examination includes a determination as to its adequacy to absorb probable i ncurred losses.
The first step in determining the allowance for loan losses is to identify loans in the Bank’s portfolio that are individually deemed to be impaired. In doing so, subjective judgments need to be made regarding whether or not it is probable that a borrower will be unable to pay all principal and interest due according to contractual terms. Once a loan is identified as being impaired, management uses the fair value of the underlying collateral and/or the discounted value of expected future cash flows to determine the amount of the impairment loss, if any, that needs to be included in the overall allowance for loan losses. In estimating the fair value of real estate collateral management utilizes appraisals and also makes qualitative judgments based on, among other things, its knowledge of the local real estate market and analyses of current economic conditions and trends. Estimating the fair value of collateral other than real estate is also subjective in nature and sometimes requires difficult and complex judgments. Determining expected future cash flows can be more subjective than determining fair values. Expected future cash flows could differ significantly, both in timing and amount, from the cash flows actually received over the loan’s remaining life.
In addition to estimating losses for loans individually deemed to be impaired, management also estimates collective impairment losses for pools of loans that are not specifically reviewed. Statistical information regarding the Bank’s historical loss experience over a period of time is the starting point in making such estimates. However, future losses could vary significantly from those experienced in the past and accordingly management periodically adjusts its historical loss experience to reflect current conditions. In doing so, management considers a variety of general qualitative factors and then subjectively determines the weight to assign to each in estimating losses. The factors include, among others, national and local economic conditions and trends, environmental risks, trends in volume and terms of loans, concentrations of credit, changes in lending policies and procedures, and experience, ability, and depth of the Bank’s lending staff. Because of the nature of the factors and the difficulty in assessing their impact, management’s resulting estimate of losses may not accurately reflect actual losses in the portfolio.
Although the allowance for loan losses has two separate components, one for impairment losses on individual loans and one for collective impairment losses on pools of loans, the entire allowance for loan losses is available to absorb realized losses as they occur whether they relate to individual loans or pools of loans.
Asset Quality
The Corporation has identified certain assets as risk elements. These assets include nonaccruing loans, foreclosed real estate, loans that are contractually past due 90 days or more as to principal or interest payments and still accruing and troubled debt restructurings. These assets present more than the normal risk that the Corporation will be unable to eventually collect or realize their full carrying value. Information about the Corporation’s risk elements is as follows:
| | | December 31, | |
| | | 2009 | | | 2008 | | | 2007 | | | 2006 | | | 2005 | |
| | | (dollars in thousands) | |
| Nonaccrual loans | | $ | 432 | | | $ | 112 | | | $ | 257 | | | $ | 135 | | | $ | 151 | |
| Loans past due 90 days or more and still accruing | | | - | | | | 42 | | | | 95 | | | | 50 | | | | - | |
| Foreclosed real estate | | | - | | | | - | | | | - | | | | - | | | | - | |
| Total nonperforming assets | | | 432 | | | | 154 | | | | 352 | | | | 185 | | | | 151 | |
| Troubled debt restructurings | | | 200 | | | | - | | | | - | | | | - | | | | - | |
| Total risk elements | | $ | 632 | | | $ | 154 | | | $ | 352 | | | $ | 185 | | | $ | 151 | |
| | | | | | | | | | | | | | | | | | | | | |
| Nonaccrual loans as a percentage of total loans | | | .05 | % | | | .02 | % | | | .05 | % | | | .03 | % | | | .04 | % |
| Nonperforming assets as a percentage of total loans and foreclosed real estate | | | .05 | % | | | .02 | % | | | .07 | % | | | .04 | % | | | .04 | % |
| Risk elements as a percentage of total loans and foreclosed real estate | | | .08 | % | | | .02 | % | | | .07 | % | | | .04 | % | | | .04 | % |
| | | | | | | | | | | | | | | | | | | | | |
| | | Year Ended December 31, | |
| | | | 2009 | | | 2008 | | | 2007 | | | 2006 | | | 2005 | |
| | | (in thousands) | |
| Gross interest income on nonaccrual loans: | | | | | | | | | | | | | | | | | | | | |
| Amount that would have been recorded during the year under original terms | | $ | 24 | | | $ | 10 | | | $ | 13 | | | $ | 12 | | | $ | 9 | |
| Actual amount recorded during the year | | | 16 | | | | - | | | | 10 | | | | - | | | | 4 | |
| | | | | | | | | | | | | | | | | | | | | |
| Commitments for additional funds - nonaccrual, restructured, past due loans | | None | | | None | | | None | | | None | | | None | |
Allowance and Provision for Loan Losses
The allowance for loan losses grew by $4,270,000 during 2009, amounting to $10,346,000, or 1.25% of total loans, at December 31, 2009 as compared to $6,076,000, or .92% of total loans, at December 31, 2008. During 2009, the Bank had loan chargeoffs and recoveries of $175,000 and $160,000, respectively, and recorded a $4,285,000 provision for loan losses. As previously discussed, in the fourth quarter of 2009 management decided to increase the Bank’s allowance for loan losses relative to gross loans in recognition of, among other things, continuing unfavorable national and local economic conditions, robust loan growth and the high concentration of real estate loans in the Bank’s portfolio.
The allowance for loan losses is an amount that management currently believes will be adequate to absorb probable incurred losses in the Bank’s loan portfolio. In determining the allowance for loan losses, there is not an exact amount but rather a range for what constitutes an appropriate allowance. As more fully discussed in the “Application of Critical Accounting Policies” section of this discussion and analysis of financial condition and results of operations, the process for estimating credit losses and determining the allowance for loan losses as of any balance sheet date is subjective in nature and requires material estimates. Actual results could differ significantly from those estimates.
The following table sets forth changes in the Bank’s allowance for loan losses.
| | | Year ended December 31, | |
| | | 2009 | | | 2008 | | | 2007 | | | 2006 | | | 2005 | |
| | | (dollars in thousands) | |
| | | | | | | | | | | | | | | | |
| Balance, beginning of year | | $ | 6,076 | | | $ | 4,453 | | | $ | 3,891 | | | $ | 3,282 | | | $ | 2,808 | |
| Loans charged off: | | | | | | | | | | | | | | | | | | | | |
| Commercial and industrial | | | 162 | | | | 275 | | | | - | | | | 65 | | | | - | |
| Other | | | 13 | | | | 50 | | | | 14 | | | | 11 | | | | 25 | |
| | | | 175 | | | | 325 | | | | 14 | | | | 76 | | | | 25 | |
| Recoveries of loans charged off: | | | | | | | | | | | | | | | | | | | | |
| Commercial and industrial | | | 148 | | | | - | | | | - | | | | - | | | | - | |
| Other | | | 12 | | | | 3 | | | | 1 | | | | 15 | | | | 29 | |
| | | | 160 | | | | 3 | | | | 1 | | | | 15 | | | | 29 | |
| Net (chargeoffs) recoveries | | | (15 | ) | | | (322 | ) | | | (13 | ) | | | (61 | ) | | | 4 | |
| Provision for loan losses | | | 4,285 | | | | 1,945 | | | | 575 | | | | 670 | | | | 470 | |
| Balance, end of year | | $ | 10,346 | | | $ | 6,076 | | | $ | 4,453 | | | $ | 3,891 | | | $ | 3,282 | |
| Ratio of net chargeoffs or recoveries to average loans outstanding | | | .00 | % | | | .06 | % | | | .00 | % | | | .01 | % | | | .00 | % |
The following table sets forth the allocation of the Bank’s total allowance for loan losses by loan type.
| | | December 31, | |
| | | 2009 | | | 2008 | | | 2007 | | | 2006 | | | 2005 | |
| | | | | | % of | | | | | | % of | | | | | | % of | | | | | | % of | | | | | | % of | |
| | | | | | Loans | | | | | | Loans | | | | | | Loans | | | | | | Loans | | | | | | Loans | |
| | | | | | To Total | | | | | | To Total | | | | | | To Total | | | | | | To Total | | | | | | To Total | |
| | | Amount | | | Loans | | | Amount | | | Loans | | | Amount | | | Loans | | | Amount | | | Loans | | | Amount | | | Loans | |
| | | (dollars in thousands) | |
| | | | | | | | | | | | | | | | | | | | | | | | | | | | | | | |
| Commercial and industrial | | $ | 971 | | | | 5.9 | % | | $ | 933 | | | | 8.1 | % | | $ | 874 | | | | 11.7 | % | | $ | 833 | | | | 12.3 | % | | $ | 827 | | | | 12.4 | % |
| Commercial mortgages | | | 5,932 | | | | 49.5 | | | | 3,011 | | | | 41.5 | | | | 1,785 | | | | 32.3 | | | | 1,464 | | | | 30.7 | | | | 1,095 | | | | 28.3 | |
| Residential mortgages | | | 2,242 | | | | 30.1 | | | | 1,227 | | | | 32.9 | | | | 1,026 | | | | 37.1 | | | | 914 | | | | 38.7 | | | | 843 | | | | 42.0 | |
| Home equity loans | | | 1,102 | | | | 13.4 | | | | 706 | | | | 15.5 | | | | 551 | | | | 15.8 | | | | 497 | | | | 14.9 | | | | 348 | | | | 14.0 | |
| Construction loans | | | 43 | | | | .4 | | | | 100 | | | | 1.4 | | | | 116 | | | | 2.2 | | | | 89 | | | | 2.2 | | | | 71 | | | | 1.9 | |
| Other | | | 56 | | | | .7 | | | | 99 | | | | .6 | | | | 101 | | | | .9 | | | | 94 | | | | 1.2 | | | | 98 | | | | 1.4 | |
| | | $ | 10,346 | | | | 100.0 | % | | $ | 6,076 | | | | 100.0 | % | | $ | 4,453 | | | | 100.0 | % | | $ | 3,891 | | | | 100.0 | % | | $ | 3,282 | | | | 100.0 | % |
The amount of future chargeoffs and provisions for loan losses will be affected by, among other things, economic conditions on Long Island and in New York City. Such conditions could affect the financial strength of the Bank’s borrowers and will affect the value of real estate collateral securing the Bank’s mortgage loans. Loans secured by real estate represent approximately 93% of the Bank’s total loans outstanding at December 31, 2009. Most of these loans were made to borrowers domiciled on Long Island and in New York City. Over the last year or so, general economic conditions on Long Island have deteriorated and residential real estate values have declined. More recently, commercial real estate values have also declined and commercial real estate vacancies hav e trended up. This could cause some of the Bank’s borrowers to be unable to make the required contractual payments on their loans and the Bank to be unable to realize the full carrying value of such loans through foreclosure. However, management believes that the Bank’s underwriting policies are relatively conservative and, as a result, the Bank should be less affected than the overall market.
Future provisions and chargeoffs could also be affected by environmental impairment of properties securing the Bank’s mortgage loans. At the present time, management is not aware of any environmental pollution originating on or near properties securing the Bank’s loans that would materially affect the carrying value of such loans.
Off-Balance Sheet Arrangements and Contractual Obligations
The Corporation’s off-balance sheet arrangements and contractual obligations at December 31, 2009 are summarized in the table that follows. Unused home equity lines comprise a substantial portion of the amount shown for commitments to extend credit. Since some of the commitments to extend credit and letters of credit are expected to expire without being drawn upon and, with respect to unused home equity lines, can be frozen, reduced or terminated by the Bank based on the financial condition of the borrower, the total commitment amounts shown in the table do not necessarily represent future cash requirements. The amounts shown for long-term debt are based on the contractual maturities of such borrowings and include scheduled principal and interest payments.� 0; The interest payments do not reflect any reduction in payments that the Bank could get from interest rate caps embedded in certain repurchase agreements. Some of these repurchase agreements can be terminated by the purchaser prior to contractual maturity (see Note F to the Corporation’s 2009 consolidated financial statements for more detailed disclosures regarding repurchase agreements). The Corporation believes that its current sources of liquidity are more than sufficient to fulfill the obligations it has at December 31, 2009 pursuant to off-balance sheet arrangements and contractual obligations.
| | | | | | Amount of Commitment Expiration Per Period | |
| | | | | | | | | Over | | | Over | | | | |
| | | Total | | | One | | | One Year | | | Three Years | | | Over | |
| | | Amounts | | | Year | | | Through | | | Through | | | Five | |
| | | Committed | | | or Less | | | Three Years | | | Five Years | | | Years | |
| | | (in thousands) | |
| | | | | | | | | | | | | | | | |
| Commitments to extend credit | | $ | 118,272 | | | $ | 42,554 | | | $ | 13,887 | | | $ | 7,701 | | | $ | 54,130 | |
| Standby letters of credit | | | 3,023 | | | | 2,605 | | | | 418 | | | | - | | | | - | |
| Commercial letters of credit | | | 435 | | | | 435 | | | | - | | | | - | | | | - | |
| Long-term debt | | | 191,922 | | | | 6,577 | | | | 84,259 | | | | 41,130 | | | | 59,956 | |
| Operating lease obligations | | | 9,769 | | | | 1,364 | | | | 2,617 | | | | 1,686 | | | | 4,102 | |
| Purchase obligations | | | 1,338 | | | | 348 | | | | 678 | | | | 312 | | | | - | |
| Time deposits | | | 308,784 | | | | 220,834 | | | | 32,458 | | | | 39,304 | | | | 16,188 | |
| | | $ | 633,543 | | | $ | 274,717 | | | $ | 134,317 | | | $ | 90,133 | | | $ | 134,376 | |
Commitments to extend credit and letters of credit arise in the normal course of the Bank’s business of meeting the financing needs of its customers and involve, to varying degrees, elements of credit risk in excess of the amount recognized in the consolidated balance sheets.
The Bank's exposure to credit loss in the event of nonperformance by the other party to financial instruments for commitments to extend credit, standby letters of credit, and commercial letters of credit is represented by the contractual notional amount of these instruments. The Bank uses the same credit policies in making commitments to extend credit and generally uses the same credit policies for letters of credit as it does for on-balance-sheet instruments.
Commitments to extend credit are legally binding agreements to lend to a customer as long as there is no violation of any condition established in the contract. Home equity lines generally expire ten years from their date of origination. Other real estate loan commitments generally expire within 60 days and commercial loan commitments generally expire within one year. The amount of collateral obtained, if any, by the Bank upon extension of credit is based on management’s credit evaluation of the borrower. Collateral held varies but may include mortgages on commercial and residential real estate, security interests in business assets, deposit accounts with the Bank or other financial institutions, and securities.
Standby letters of credit are conditional commitments issued by the Bank to assure the performance or financial obligations of a customer to a third party. The credit risk involved in issuing standby letters of credit is essentially the same as that involved in extending loans to customers. The Bank generally holds collateral and/or obtains personal guarantees supporting these commitments. Commercial letters of credit are conditional commitments issued by the Bank to assure the payment by a customer to a supplier. The Bank generally obtains personal guarantees supporting these commitments.
The purchase obligations shown in the preceding table are pursuant to contracts that the Bank has with providers of data processing services. Required pension plan contributions for years beyond 2010 are not presently known and are therefore not included in the table. For the Plan year ending September 30, 2010, the Bank has no minimum required pension contribution and a maximum tax deductible contribution of $3,742,000. The Bank expects to make a contribution within that range by September 30, 2010, but the amount of such contribution has not yet been determined.
Capital
The Corporation’s capital management policy is designed to build and maintain capital levels that exceed regulatory standards. Under current regulatory capital standards, banks are classified as well capitalized, adequately capitalized or undercapitalized. Under such standards, a well-capitalized bank is one that has a total risk-based capital ratio equal to or greater than 10%, a Tier 1 risk-based capital ratio equal to or greater than 6%, and a Tier 1 leverage capital ratio equal to or greater than 5%. The Bank’s total risk-based capital, Tier 1 risk-based capital and Tier 1 leverage capital ratios of 15.56%, 14.31% and 7.06%, respectively, at December 31, 2009 exceed the requirements for a well-capitalized bank. The Corporation (on a consolidated basis) is subject to minimum risk-based and leverage capital re quirements, which the Corporation exceeds as of December 31, 2009.
Total stockholders' equity increased by $13,930,000, from $102,532,000 at December 31, 2008 to $116,462,000 at December 31, 2009. The increase is primarily comprised of net income of $13,463,000, unrealized gains on available-for-sale securities of $3,725,000, and a $1,528,000 increase in the funded status of the Bank’s pension plan, as partially offset by $5,477,000 in cash dividends declared.
Stock Repurchase Program and Market Liquidity. Since 1988, the Corporation has had a stock repurchase program under which it has purchased from time to time shares of its own common stock in market or private transactions. Under a plan approved by the Board of Directors in 2008, the Corporation purchased 37,443 shares in 2009 and can purchase 76,568 shares in the future. The details of the Corporation’s purchases under the stock repurchase program during the fourth quarter of 2009 are set forth in the table that follows.
| Period | | Total Number of Shares Purchased | | | Average Price Paid Per Share | | | Total Number of Shares Purchased as Part of Publicly Announced Plans or Programs (1) | | | Maximum Number of Shares that May Yet Be Purchased Under the Plans or Programs (1) | |
| October 1, 2009 to October 31, 2009 | | | 3,276 | | | $ | 26.15 | | | | 3,276 | | | | 79,306 | |
| November 1, 2009 to November 30, 2009 | | | 102 | | | $ | 24.09 | | | | 102 | | | | 79,204 | |
| December 1, 2009 to December 31, 2009 | | | 2,636 | | | $ | 24.41 | | | | 2,636 | | | | 76,568 | |
| (1) | All shares purchased by the Corporation under its stock repurchase program in the fourth quarter of 2009 were purchased under a 200,000 share plan approved by the Corporation’s Board of Directors on February 21, 2008 and publicly announced on February 22, 2008. The Corporation’s share repurchase plans do not have fixed expiration dates. |
The Corporation periodically reevaluates whether it wants to continue purchasing shares of its own common stock in open market transactions under the safe harbor provisions of Rule 10b-18 or otherwise. The Corporation significantly reduced its share repurchases in 2009 in order to preserve and build capital.
Russell 3000 and 2000 Indexes. The Corporation’s common stock was added to the Russell 3000 and Russell 2000 Indexes when they were reconstituted in June 2009. At that point the average market capitalization of companies in the Russell 2000 Index was $732 million, the median market capitalization was $306 million, the capitalization of the largest company in the index was $1.7 billion, and the capitalization of the smallest company in the index was $78 million. The Corporation’s market capitalization as of December 31, 2009 was approximately $182 million.
The Corporation believes that inclusion in the Russell indexes has positively impacted the price, trading volume and liquidity of its common stock. Conversely, if the Corporation’s market capitalization falls below the minimum necessary to be included in the indexes at any future reconstitution date, the opposite could occur.
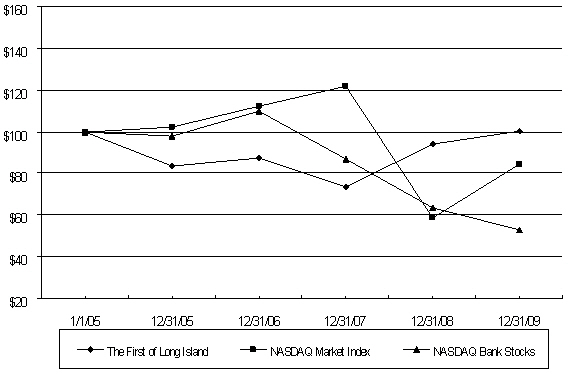
Performance Graph. The following graph compares the Corporation's total stockholder return over a 5-year measurement period with the NASDAQ Market Index and the NASDAQ Bank Stocks Index.
COMPARISON OF FIVE-YEAR CUMULATIVE TOTAL RETURN
THE FIRST OF LONG ISLAND CORPORATION,
NASDAQ BANK STOCKS INDEX AND NASDAQ MARKET INDEX
Assumes $100 Invested on January 1, 2005
Assumes Dividends Reinvested
Fiscal Year Ended December 31, 2009
Cash Flows and Liquidity
Cash Flows. The Corporation’s primary sources of cash are deposit growth, maturities and amortization of loans and investment securities, operations and borrowing. The Corporation uses cash from these and other sources to fund loan growth, purchase investment securities, expand and improve its physical facilities, pay cash dividends and repurchase common stock under the Corporation’s share repurchase program. During 2009, the Corporation’s cash and cash equivalent position increased by $11,904,000. The increase occurred primarily because cash provided by deposit growth, long-term borrowings, and maturities, redemptions and sales of investment securities exceeded the cash used to grow the loan and se curities portfolios, repay short-term Federal Home Loan Bank advances, improve physical facilities and pay cash dividends.
Strong deposit inflows during 2009 significantly outpaced loan growth. Management used the excess funds primarily to purchase short-term collateralized mortgage obligations (“CMOs”) and high-grade municipal securities. As a result, the Bank’s CMO and municipal security portfolios increased by approximately $181.5 million, or 80%, and $68.9 million, or 48%, respectively. The short-term CMOs are expected to provide cash flows in the near term that can be used to fund loan growth or pay down borrowings. The provisions of the American Recovery and Reinvestment Act of 2009 enabled the Bank to purchase certain municipal securities without the usual limitations imposed by the federal alternative minimum tax. These purchase s were made at what the Bank believes to be attractive tax-exempt yields.
Liquidity. The Bank has both internal and external sources of liquidity that can be used to fund loan growth and accommodate deposit outflows. The Bank’s primary internal sources of liquidity are its overnight investments, investment securities designated as available-for-sale, and maturities and monthly payments on its investment securities and loan portfolios. At December 31, 2009, the Bank had approximately $321 million in unencumbered available-for-sale securities.
The Bank is a member of the Federal Reserve Bank of New York (“FRB”) and the Federal Home Loan Bank of New York (“FHLB”), has repurchase agreements in place with a number of brokerage firms and commercial banks and has federal funds lines with several commercial banks. In addition to customer deposits, the Bank’s primary external sources of liquidity are secured borrowings from the FRB, FHLB and repurchase agreement counterparties. In addition, the Bank can purchase overnight federal funds under its existing lines. However, the Bank’s FRB membership, FHLB membership, repurchase agreements and federal funds lines do not represent legal commitments to extend credit to the Bank. The amount that the Bank can potentially borrow is currently dependent on, among other things, the amount of unencumbered eligible securities and loans that the Bank can use as collateral and the collateral margins required by the lenders. At December 31, 2009, the Bank had unencumbered securities and loans of over $1 billion that are eligible collateral for borrowings.
Market Risk
The Bank invests in interest-earning assets which are funded by interest-bearing deposits and borrowings, noninterest-bearing deposits and capital. The Bank’s results of operations are subject to risk resulting from interest rate fluctuations in general and having assets and liabilities that have different maturity, repricing and prepayment/withdrawal characteristics. The Bank defines interest rate risk as the risk that the Bank's earnings and/or net portfolio value (present value of expected future cash flows from assets less the present value of expected future cash flows from liabilities) will change when interest rates change. The principal objective of the Bank’s asset/liability management activities is to maximize net interest income while at the same time maintain acceptable levels o f interest rate and liquidity risk and facilitate the funding needs of the Bank.
Because the Bank’s loans and investment securities generally reprice slower than its interest-bearing liabilities, an immediate increase in interest rates uniformly across the yield curve should initially have a negative effect on net interest income. However, if the Bank does not increase the rates paid on its deposit accounts as quickly or in the same amount as increases in market interest rates and/or owns interest rate caps that are in-the-money at the time of the interest rate increase or become in-the-money as a result of the increase, the magnitude of the negative impact will decline and the impact could even be positive. Over a longer period of time, and assuming that interest rates remain stable after the initial rate increase and the Bank purchases securities and originates loans at yields higher than those maturing and reprices loans at higher yields, the impact of an increase in interest rates should be positive. This occurs primarily because with the passage of time more loans and investment securities will reprice at the higher rates and there will be no offsetting increase in interest expense for those loans and investment securities funded by noninterest-bearing checking deposits and capital.
Conversely, a decrease in interest rates uniformly across the yield curve should initially have a positive impact on the Bank’s net interest income. Furthermore, if the Bank owns interest rate floors that are in-the-money at the time of the interest rate decrease or become in-the-money as a result of the decrease, the magnitude of the positive impact should increase. However, if the Bank does not or cannot decrease the rates paid on its deposit accounts as quickly or in the same amount as decreases in market interest rates, regardless of whether or not it owns interest rate floors, the magnitude of the positive impact will decline and could even be negative.
If interest rates decline, or have declined, and are sustained at the lower levels and, as a result, the Bank purchases securities at lower yields and loans are originated or repriced at lower yields, the impact on net interest income should be negative because a significant portion of the Bank’s average interest-earning assets are funded by noninterest-bearing checking deposits and capital.
The Bank monitors and controls interest rate risk through a variety of techniques including the use of interest rate sensitivity models and traditional repricing gap analysis. Through use of the models, the Bank projects future net interest income and then estimates the effect on projected net interest income of various changes in interest rates and balance sheet growth rates. The Bank also uses the models to calculate the change in net portfolio value over a range of interest rate change scenarios.
Traditional gap analysis involves arranging the Bank’s interest-earning assets and interest-bearing liabilities by repricing periods and then computing the difference, or gap, between the assets and liabilities which are estimated to reprice during each time period and cumulatively through the end of each time period.
Both interest rate sensitivity modeling and gap analysis involve a variety of significant estimates and assumptions and are done at a specific point in time. Interest rate sensitivity modeling requires, among other things, estimates of: (1) how much and when yields and costs on individual categories of interest-earning assets and interest-bearing liabilities will change because of projected changes in market interest rates; (2) future cash flows; (3) discount rates; and (4) decay or runoff rates for nonmaturity deposits such as checking, savings, and money market accounts.
Gap analysis requires estimates as to when individual categories of interest-sensitive assets and liabilities will reprice and assumes that assets and liabilities assigned to the same repricing period will reprice at the same time and in the same amount. Like sensitivity modeling, gap analysis does not fully take into account the fact that the repricing of some assets and liabilities is discretionary and subject to competitive and other pressures.
Changes in the estimates and assumptions made for interest rate sensitivity modeling and gap analysis could have a significant impact on projected results and conclusions. Therefore, these techniques may not accurately reflect the actual impact of changes in the interest rate environment on the Bank’s net interest income or net portfolio value.
The table that follows summarizes the Corporation's cumulative interest repricing gap at December 31, 2009 based upon significant estimates and assumptions that the Corporation believes to be reasonable. The table arranges interest-earning assets and interest-bearing liabilities according to the period in which they contractually mature or, if earlier, are estimated to repay or reprice. Repayment and repricing estimates are based on internal data and management’s assumptions about factors that are inherently uncertain. These factors include, among others, prepayment speeds, changes in market interest rates and the Bank’s response thereto, early withdrawal of deposits and competition. The balances of non-maturity deposit products have been included in categories beyond three month s in the table because management believes, based on past experience and its knowledge of current competitive pressures, that the repricing of these products will lag market changes in interest rates to varying degrees. The table does not reflect any protection against interest rate changes that the Corporation may have as a result of its ownership of derivative instruments such as interest rate caps or floors. The only such instruments that the Corporation owns at December 31, 2009 are the interest rate caps disclosed in Note F to the Corporation’s December 31, 2009 consolidated financial statements.
| | | Repricing Period | |
| | | | | | Over | | | Over | | | | | | Over | | | | | | | | | | |
| | | | | | Three | | | Six | | | | | | One Year | | | | | | | | | | |
| | | Three | | | Months | | | Months | | | Total | | | Through | | | Over | | | Non- | | | | |
| | | Months | | | Through | | | Through | | | Within | | | Five | | | Five | | | interest- | | | | |
| | | or Less | | | Six Months | | | One Year | | | One Year | | | Years | | | Years | | | Sensitive | | | Total | |
| Assets: | | (in thousands) | |
| Overnight Investments | | $ | 219 | | | $ | - | | | $ | - | | | $ | 219 | | | $ | - | | | $ | - | | | $ | - | | | $ | 219 | |
| Investment securities | | | 44,539 | | | | 44,036 | | | | 83,420 | | | | 171,995 | | | | 297,463 | | | | 286,710 | | | | 11,605 | | | | 767,773 | |
| Loans | | | 200,637 | | | | 38,087 | | | | 76,170 | | | | 314,894 | | | | 418,295 | | | | 93,163 | | | | (9,032 | ) | | | 817,320 | |
| Other assets | | | 12,637 | | | | - | | | | 12,167 | | | | 24,804 | | | | - | | | | - | | | | 65,053 | | | | 89,857 | |
| | | | 258,032 | | | | 82,123 | | | | 171,757 | | | | 511,912 | | | | 715,758 | | | | 379,873 | | | | 67,626 | | | | 1,675,169 | |
| Liabilities & Stockholders' Equity: | | | | | | | | | | | | | | | | | | | | | | | | | | | | | | | | |
| Checking deposits | | | - | | | | - | | | | - | | | | - | | | | - | | | | - | | | | 333,853 | | | | 333,853 | |
| Savings & money market deposits | | | 509,334 | | | | 10,024 | | | | 20,048 | | | | 539,406 | | | | 95,507 | | | | - | | | | - | | | | 634,913 | |
| Time deposits, $100,000 and over | | | 128,737 | | | | 20,909 | | | | 21,187 | | | | 170,833 | | | | 38,348 | | | | 7,818 | | | | - | | | | 216,999 | |
| Time deposits, other | | | 25,786 | | | | 13,620 | | | | 10,595 | | | | 50,001 | | | | 33,414 | | | | 8,370 | | | | - | | | | 91,785 | |
| Borrowed funds | | | 111,407 | | | | - | | | | - | | | | 111,407 | | | | 107,000 | | | | 55,000 | | | | - | | | | 273,407 | |
| Other liabilities | | | - | | | | - | | | | - | | | | - | | | | - | | | | - | | | | 7,750 | | | | 7,750 | |
| Stockholders' equity | | | - | | | | - | | | | - | | | | - | | | | - | | | | - | | | | 116,462 | | | | 116,462 | |
| | | | 775,264 | | | | 44,553 | | | | 51,830 | | | | 871,647 | | | | 274,269 | | | | 71,188 | | | | 458,065 | | | | 1,675,169 | |
| Interest-rate sensitivity gap | | $ | (517,232 | ) | | $ | 37,570 | | | $ | 119,927 | | | $ | (359,735 | ) | | $ | 441,489 | | | $ | 308,685 | | | $ | (390,439 | ) | | $ | - | |
| Cumulative interest-rate sensitivity gap | | $ | (517,232 | ) | | $ | (479,662 | ) | | $ | (359,735 | ) | | $ | (359,735 | ) | | $ | 81,754 | | | $ | 390,439 | | | $ | - | | | $ | - | |
As shown in the preceding table, the Bank has a significant volume of deposit accounts and borrowings that are subject to repricing as short-term interest rates change. Since the amount of these liabilities outweighs the assets held by the Bank whose pricing is tied to short-term interest rates, an increase in short-term interest rates should negatively impact the Bank’s net interest income in the near term. The interest rate caps owned by the Bank at December 31, 2009 may help to reduce the negative impact. In addition, the Bank can reduce the magnitude of the negative impact by not increasing the rates paid on its deposit accounts as quickly or in the same amount as market increases in the overnight funds rate, the prime lending rate, or other short-term rates. Conversely, a decrease in short-term interest rates should positively impact the Bank’s net interest income in the near term. However, if short-term rates decline and the Bank cannot, due to competitive pressures and/or the absolute level of rates, decrease its deposit rates as quickly or in the same amount as decreases in market interest rates, the magnitude of the positive impact will decline and the impact could even be negative.
The table that follows is provided pursuant to the market risk disclosure rules set forth in Item 305 of Regulation S-K of the Securities and Exchange Commission (“SEC”). The information provided in the following table is based on significant estimates and assumptions and constitutes, like certain other statements included herein, a forward-looking statement. The base case information in the table shows (1) an estimate of the Corporation’s net portfolio value at December 31, 2009 arrived at by discounting estimated future cash flows at current market rates and (2) an estimate of net interest income on a tax-equivalent basis for the year ending December 31, 2010 assuming that maturing assets or liabilities are replaced with new balances of the same type, in the same amount, and at current rate levels and re pricing balances are adjusted to current rate levels. For purposes of the base case, nonmaturity deposits are included in the calculation of net portfolio value at their carrying amount. The rate change information in the table shows estimates of net portfolio value at December 31, 2009 and net interest income on a tax-equivalent basis for the year ending December 31, 2010 assuming rate changes of plus 100 and 200 basis points and minus 100 and 200 basis points. The changes in net portfolio value from the base case have not been tax affected. In addition, cash flows for nonmaturity deposits are based on a decay or runoff rate of six years. Also, rate changes are assumed to be shock or immediate changes and occur uniformly across the yield curve regardless of the duration to maturity or repricing of specific assets and liabilities. In projecting future net interest income under the indicated rate change scenarios, activity is simulated by replacing maturi ng balances with new balances of the same type, in the same amount, but at the assumed rate level and adjusting repricing balances to the assumed rate level.
Based on the foregoing assumptions and as depicted in the table that follows, an immediate increase in interest rates of 100 or 200 basis points would have a negative effect on net interest income over a one-year time period. This is principally because the Bank’s interest-bearing deposit accounts are assumed to reprice faster than its loans and investment securities. However, if the Bank does not increase the rates paid on its deposit accounts as quickly or in the same amount as increases in market interest rates, the magnitude of the negative impact will decline. If the Bank does not increase its deposit rates at all, the impact should be positive. Over a longer period of time, and assuming that interest rates remain stable after the initial rate increase and the Bank purchases secur ities and originates loans at yields higher than those maturing and reprices loans at higher yields, the impact of an increase in interest rates should be positive. This occurs primarily because with the passage of time more loans and investment securities will reprice at the higher rates and there will be no offsetting increase in interest expense for those loans and investment securities funded by noninterest-bearing checking deposits and capital. Generally, the reverse should be true of an immediate decrease in interest rates of 100 or 200 basis points. However, the positive impact of a decline in interest rates of 100 or 200 basis points is currently constrained by the fact that the annual percentage yield on many of the Bank’s deposit products is below 2% and for some products even below 1%.
| | | Net Portfolio Value at | | | Net Interest Income | |
| | | December 31, 2009 | | | for 2010 | |
| | | | | | Percent | | | | | | Percent | |
| | | | | | Change | | | | | | Change | |
| | | | | | From | | | | | | From | |
| Rate Change Scenario | | Amount | | | Base Case | | | Amount | | | Base Case | |
| | | (dollars in thousands) | |
| | | | | | | | | | | | | |
| + 200 basis point rate shock | | $ | 80,260 | | | | (19.4 | )% | | $ | 46,434 | | | | (20.4 | )% |
| + 100 basis point rate shock | | | 89,654 | | | | (10.0 | ) | | | 52,397 | | | | (10.2 | ) |
| Base case (no rate change) | | | 99,591 | | | | - | | | | 58,360 | | | | - | |
| - 100 basis point rate shock | | | 110,152 | | | | 10.6 | | | | 63,889 | | | | 9.5 | |
| - 200 basis point rate shock | | | 121,684 | | | | 22.2 | | | | 63,567 | | | | 8.9 | |
Legislation and Regulatory Matters
Under current law, the FDIC is required to keep the Deposit Insurance Fund (“DIF”) at a level between 1.15% and 1.50% of insured deposits and set an informal target within that range to guide its policy. The current target level is 1.25%. The DIF has been severely depleted by recent Bank failures. The DIF balance, which is a negative $20.9 billion at December 31, 2009, would need to be increased by $82.9 billion to be at the statutory minimum of 1.15% of insured deposits. Under current law, the FDIC must replenish the DIF to the statutory minimum by the first quarter of 2014. In addition, the Obama administration has recently suggested that it may be appropriate to consider raising the target level to a level above 1.50% in order to maintain positive DIF balances durin g future economic downturns. Management believes that replenishment of the DIF to the statutory minimum or some higher amount by the first quarter of 2014 is likely to require higher assessment rates, additional special assessments or both. The implementation of such measures by the FDIC could have a significant adverse impact on the Bank’s future results of operations.
The provisions of the American Recovery and Reinvestment Act of 2009 enabled the Bank to purchase certain municipal securities issued in 2009 at what the Bank believes to be attractive yields without the usual limitations imposed by the federal alternative minimum tax (“AMT”). The provisions of the Act enable the Bank to make such purchases again in 2010. However, beginning in 2011, the Bank’s purchase of tax-exempt municipal securities will once again be subject to the limitations of the AMT. This could have an adverse impact on the income the Bank is able to earn on its securities portfolio.
The New York State Department of Taxation and Finance has undertaken a project to reform the State’s corporate income tax system that would, among other things, revamp general corporation tax law under Article 9-A and merge into Article 9-A bank tax law under Article 32. The proposed changes would be effective for tax years beginning on or after January 1, 2011. If enacted into law, the changes could have a material adverse impact on the Bank’s results of operations because they could result in a significant reduction or elimination of the tax benefit that the Corporation receives from FNY and the REIT and otherwise cause the Corporation’s New York State tax burden to increase.
Commercial checking deposits currently account for approximately 19% of the Corporation’s total deposits. Congress has been considering legislation that would allow corporate customers to cover checks by sweeping funds from interest-bearing deposit accounts each business day and repeal the prohibition of the payment of interest on corporate checking deposits. Either could have a material adverse impact on the Corporation’s future results of operations.
Significant legislation is pending regarding systemic risk and regulatory reform of the banking industry that could impact the Corporation. In particular, the House of Representatives approved a regulatory reform bill, HR 4173, in December 2009. The bill combines several pieces of legislation designed to improve the regulatory system’s framework and avoid a repeat of the financial crisis. Legislation addressing these issues is also being discussed in the Senate. The impact of these initiatives on the Bank is currently uncertain.
The SEC is currently considering the incorporation of International Financial Reporting Standards (“IFRS”) into the U.S. financial reporting system and is scheduled to make a determination by 2011. If IFRS is adopted by the SEC, the first time that U.S. companies would report under IFRS would be no earlier than 2015. The Corporation is evaluating the impact of the adoption of IFRS on its results of operations, financial position and disclosures.
Forward Looking Statements
“Management’s Discussion and Analysis of Financial Condition and Results of Operations” contains various forward-looking statements with respect to financial performance and other business matters. Such statements are generally contained in sentences including the words “may” or “expect” or “could” or “should” or “would” or “believe”. The Corporation cautions that these forward-looking statements are subject to numerous assumptions, risks and uncertainties, and therefore actual results could differ materially from those contemplated by the forward-looking statements. In addition, the Corporation assumes no duty to update forward-looking statements.
MANAGEMENT’S REPORT ON INTERNAL CONTROL OVER FINANCIAL REPORTING
The management of The First of Long Island Corporation is responsible for establishing and maintaining adequate internal control over financial reporting, based on the criteria established in Internal Control—Integrated Framework issued by the Committee of Sponsoring Organizations of the Treadway Commission (“COSO”). The First of Long Island Corporation’s system of internal control over financial reporting was designed by or under the supervision of the Corporation’s chief executive officer and chief financial officer to provide reasonable assurance regarding the reliability of the preparation of the Corporation’s financial statements for external and regulatory reporting purposes, in accordance with U.S. generally accepted accounting principles. Because of its inherent limitat ions, internal control over financial reporting may not prevent or detect misstatements. Also, projections of any evaluation of effectiveness to future periods are subject to the risk that controls may become inadequate because of changes in conditions, or that the degree of compliance with the policies or procedures may deteriorate.
The First of Long Island Corporation’s management assessed the effectiveness of the Corporation’s internal control over financial reporting as of December 31, 2009, based on the criteria established in Internal Control—Integrated Framework issued by COSO. Based on the assessment, management determined that, as of December 31, 2009, the Corporation’s internal control over financial reporting is effective. Crowe Horwath LLP, an independent registered public accounting firm, has expressed an opinion of the effectiveness of the Corporation’s internal control over financial reporting as of December 31, 2009 in their report which appears on page 61.
March 16, 2010
/s/ MICHAEL N. VITTORIO
Michael N. Vittorio
President & Chief Executive Officer
/s/ MARK D. CURTIS
Mark D. Curtis
Senior Vice President & Treasurer
C O N S O L I D A T E D B A L A N C E S H E E T S | |
| | | | | | | |
| | | December 31, | |
| | | 2009 | | | 2008 | |
| Assets: | | | | | | |
| Cash and due from banks | | $ | 33,123,000 | | | $ | 20,924,000 | |
| Overnight investments | | | 219,000 | | | | 514,000 | |
| Cash and cash equivalents | | | 33,342,000 | | | | 21,438,000 | |
| | | | | | | | | |
| Investment securities: | | | | | | | | |
| Held-to-maturity, at amortized cost (fair value of $133,233,000 and $172,640,000) | | | 128,979,000 | | | | 169,480,000 | |
| Available-for-sale, at fair value (amortized cost of $627,189,000 and $373,346,000) | | | 638,794,000 | | | | 378,773,000 | |
| | | | 767,773,000 | | | | 548,253,000 | |
| Loans: | | | | | | | | |
| Commercial and industrial | | | 48,891,000 | | | | 53,555,000 | |
| Secured by real estate: | | | | | | | | |
| Commercial mortgages | | | 409,681,000 | | | | 273,097,000 | |
| Residential mortgages | | | 248,888,000 | | | | 216,654,000 | |
| Home equity | | | 109,010,000 | | | | 99,953,000 | |
| Construction and land development | | | 3,050,000 | | | | 9,175,000 | |
| Other | | | 5,763,000 | | | | 3,761,000 | |
| | | | 825,283,000 | | | | 656,195,000 | |
| Net deferred loan origination costs | | | 2,383,000 | | | | 1,939,000 | |
| | | | 827,666,000 | | | | 658,134,000 | |
| Allowance for loan losses | | | (10,346,000 | ) | | | (6,076,000 | ) |
| | | | 817,320,000 | | | | 652,058,000 | |
| | | | | | | | | |
| Federal Home Loan Bank stock, at cost | | | 7,882,000 | | | | 6,199,000 | |
| Bank premises and equipment, net | | | 18,090,000 | | | | 12,593,000 | |
| Prepaid income taxes.. | | | 179,000 | | | | - | |
| Deferred income tax benefits | | | - | | | | 1,638,000 | |
| Bank-owned life insurance | | | 12,167,000 | | | | 11,650,000 | |
| Prepaid FDIC assessment | | | 5,331,000 | | | | - | |
| Other assets | | | 13,085,000 | | | | 7,780,000 | |
| | | $ | 1,675,169,000 | | | $ | 1,261,609,000 | |
| Liabilities: | | | | | | | | |
| Deposits: | | | | | | | | |
| Checking | | $ | 333,853,000 | | | $ | 324,138,000 | |
| Savings and money market | | | 634,913,000 | | | | 384,047,000 | |
| Time, $100,000 and over | | | 216,999,000 | | | | 134,050,000 | |
| Time, other | | | 91,785,000 | | | | 58,102,000 | |
| | | | 1,277,550,000 | | | | 900,337,000 | |
| Short-term borrowings | | | 111,407,000 | | | | 124,122,000 | |
| Long-term debt | | | 162,000,000 | | | | 127,000,000 | |
| Accrued expenses and other liabilities | | | 6,002,000 | | | | 7,543,000 | |
| Current income taxes payable | | | - | | | | 75,000 | |
| Deferred income taxes payable | | | 1,748,000 | | | | - | |
| | | | 1,558,707,000 | | | | 1,159,077,000 | |
| Commitments and Contingent Liabilities (Note M) | | | | | | | | |
| | | | | | | | | |
| Stockholders' Equity: | | | | | | | | |
| Common stock, par value $.10 per share: | | | | | | | | |
| Authorized, 20,000,000 shares; | | | | | | | | |
| Issued and outstanding, 7,213,056 and 7,194,747 shares | | | 721,000 | | | | 719,000 | |
| Surplus | | | 2,043,000 | | | | 1,354,000 | |
| Retained earnings | | | 110,047,000 | | | | 102,061,000 | |
| | | | 112,811,000 | | | | 104,134,000 | |
| Accumulated other comprehensive income (loss) net of tax | | | 3,651,000 | | | | (1,602,000 | ) |
| | | | 116,462,000 | | | | 102,532,000 | |
| | | $ | 1,675,169,000 | | | $ | 1,261,609,000 | |
See notes to consolidated financial statements
| C O N S O L I D A T E D S T A T E M E N T S O F I N C O M E | |
| | | | | | | | | | |
| | | Year Ended December 31, | |
| | | 2009 | | | 2008 | | | 2007 | |
| Interest and dividend income: | | | | | | | | | |
| Loans | | $ | 39,753,000 | | | $ | 34,163,000 | | | $ | 31,627,000 | |
| Investment securities: | | | | | | | | | | | | |
| Taxable | | | 18,926,000 | | | | 18,857,000 | | | | 13,529,000 | |
| Nontaxable | | | 7,595,000 | | | | 6,186,000 | | | | 6,362,000 | |
| Federal funds sold and overnight investments | | | - | | | | 480,000 | | | | 1,505,000 | |
| | | | 66,274,000 | | | | 59,686,000 | | | | 53,023,000 | |
| Interest expense: | | | | | | | | | | | | |
| Savings and money market deposits | | | 5,287,000 | | | | 4,576,000 | | | | 4,768,000 | |
| Time deposits | | | 6,485,000 | | | | 6,782,000 | | | | 10,081,000 | |
| Short-term borrowings | | | 221,000 | | | | 746,000 | | | | 896,000 | |
| Long-term debt | | | 6,341,000 | | | | 4,639,000 | | | | 524,000 | |
| | | | 18,334,000 | | | | 16,743,000 | | | | 16,269,000 | |
| Net interest income | | | 47,940,000 | | | | 42,943,000 | | | | 36,754,000 | |
| Provision for loan losses | | | 4,285,000 | | | | 1,945,000 | | | | 575,000 | |
| Net interest income after provision for loan losses | | | 43,655,000 | | | | 40,998,000 | | | | 36,179,000 | |
| | | | | | | | | | | | | |
| Noninterest income: | | | | | | | | | | | | |
| Investment Management Division income | | | 1,484,000 | | | | 1,703,000 | | | | 1,786,000 | |
| Service charges on deposit accounts | | | 3,503,000 | | | | 2,985,000 | | | | 2,883,000 | |
| Net gains (losses) on sales of available-for-sale securities | | | 1,428,000 | | | | 248,000 | | | | (234,000 | ) |
| Other | | | 1,351,000 | | | | 1,345,000 | | | | 1,147,000 | |
| | | | 7,766,000 | | | | 6,281,000 | | | | 5,582,000 | |
| Noninterest expense: | | | | | | | | | | | | |
| Salaries | | | 14,869,000 | | | | 14,037,000 | | | | 13,637,000 | |
| Employee benefits | | | 5,827,000 | | | | 4,599,000 | | | | 3,991,000 | |
| Occupancy and equipment expense | | | 6,025,000 | | | | 4,987,000 | | | | 4,420,000 | |
| Other operating expenses | | | 8,119,000 | | | | 6,066,000 | | | | 5,336,000 | |
| | | | 34,840,000 | | | | 29,689,000 | | | | 27,384,000 | |
| | | | | | | | | | | | | |
| Income before income taxes | | | 16,581,000 | | | | 17,590,000 | | | | 14,377,000 | |
| Income tax expense | | | 3,118,000 | | | | 4,628,000 | | | | 2,895,000 | |
| Net Income | | $ | 13,463,000 | | | $ | 12,962,000 | | | $ | 11,482,000 | |
| | | | | | | | | | | | | |
| Weighted average: | | | | | | | | | | | | |
| Common shares | | | 7,203,064 | | | | 7,225,530 | | | | 7,553,495 | |
| Dilutive stock options and restricted stock units | | | 106,520 | | | | 69,012 | | | | 73,740 | |
| | | | 7,309,584 | | | | 7,294,542 | | | | 7,627,235 | |
| Earnings per share: | | | | | | | | | | | | |
| Basic | | $ | 1.87 | | | $ | 1.79 | | | $ | 1.52 | |
| Diluted | | $ | 1.84 | | | $ | 1.78 | | | $ | 1.51 | |
| | | | | | | | | | | | | |
| Cash dividends declared per share | | $ | .76 | | | $ | .66 | | | $ | .58 | |
See notes to consolidated financial statements
C O N S O L I D A T E D S T A T E M E N T O F C H A N G E S | |
| I N S T O C K H O L D E R S' E Q U I T Y | |
| | | | | | | | | | | | | | | | | | | | | | |
| | | | | | | | | | | | | | | | | | Accumulated | | | | |
| | | | | | | | | | | | | | | | | | Other | | | | |
| | | | | | | | | | | | Compre- | | | | | | Compre- | | | | |
| | | Common Stock | | | | | | hensive | | | Retained | | | hensive | | | | |
| | | Shares | | | Amount | | | Surplus | | | Income | | | Earnings | | | Income (Loss) | | | Total | |
| Balance, January 1, 2007 | | | 3,793,575 | | | $ | 379,000 | | | $ | 525,000 | | | | | | $ | 95,122,000 | | | $ | (465,000 | ) | | $ | 95,561,000 | |
| Net Income | | | | | | | | | | | | | | $ | 11,482,000 | | | | 11,482,000 | | | | | | | | 11,482,000 | |
| Other comprehensive income, net of tax and reclassification adjustment | | | | | | | | | | | | | | | 2,164,000 | | | | | | | | 2,164,000 | | | | 2,164,000 | |
| Comprehensive income | | | | | | | | | | | | | | $ | 13,646,000 | | | | | | | | | | | | | |
| Repurchase of common stock | | | (183,015 | ) | | | (18,000 | ) | | | (3,701,000 | ) | | | | | | | | | | | | | | | (3,719,000 | ) |
| Common stock issued under stock compensation plans, including tax benefit | | | 39,202 | | | | 4,000 | | | | 766,000 | | | | | | | | | | | | | | | | 770,000 | |
| 2-for-1 stock split | | | 3,804,623 | | | | 380,000 | | | | | | | | | | | | (380,000 | ) | | | | | | | | |
| Stock-based compensation | | | | | | | | | | | 506,000 | | | | | | | | | | | | | | | | 506,000 | |
| Cash dividends declared | | | | | | | | | | | | | | | | | | | (4,380,000 | ) | | | | | | | (4,380,000 | ) |
| Transfer from retained earnings to surplus | | | | | | | | | | | 2,000,000 | | | | | | | | (2,000,000 | ) | | | | | | | | |
| Balance, December 31, 2007 | | | 7,454,385 | | | | 745,000 | | | | 96,000 | | | | | | | | 99,844,000 | | | | 1,699,000 | | | | 102,384,000 | |
| Net Income | | | | | | | | | | | | | | $ | 12,962,000 | | | | 12,962,000 | | | | | | | | 12,962,000 | |
| Other comprehensive loss, net of tax and reclassification adjustment | | | | | | | | | | | | | | | (3,301,000 | ) | | | | | | | (3,301,000 | ) | | | (3,301,000 | ) |
| Comprehensive income | | | | | | | | | | | | | | $ | 9,661,000 | | | | | | | | | | | | | |
| Repurchase of common stock | | | (298,322 | ) | | | (30,000 | ) | | | (5,734,000 | ) | | | | | | | | | | | | | | | (5,764,000 | ) |
| Common stock issued under stock compensation plans, including tax benefit | | | 38,684 | | | | 4,000 | | | | 542,000 | | | | | | | | | | | | | | | | 546,000 | |
| Stock-based compensation | | | | | | | | | | | 450,000 | | | | | | | | | | | | | | | | 450,000 | |
| Cash dividends declared | | | | | | | | | | | | | | | | | | | (4,745,000 | ) | | | | | | | (4,745,000 | ) |
| Transfer from retained earnings to surplus | | | | | | | | | | | 6,000,000 | | | | | | | | (6,000,000 | ) | | | | | | | | |
| Balance, December 31, 2008 | | | 7,194,747 | | | | 719,000 | | | | 1,354,000 | | | | | | | | 102,061,000 | | | | (1,602,000 | ) | | | 102,532,000 | |
| Net Income | | | | | | | | | | | | | | $ | 13,463,000 | | | | 13,463,000 | | | | | | | | 13,463,000 | |
| Other comprehensive income, net of tax and reclassification adjustment | | | | | | | | | | | | | | | 5,253,000 | | | | | | | | 5,253,000 | | | | 5,253,000 | |
| Comprehensive income | | | | | | | | | | | | | | $ | 18,716,000 | | | | | | | | | | | | | |
| Repurchase of common stock | | | (37,443 | ) | | | (4,000 | ) | | | (953,000 | ) | | | | | | | | | | | | | | | (957,000 | ) |
| Common stock issued under stock compensation plans, including tax benefit | | | 55,752 | | | | 6,000 | | | | 961,000 | | | | | | | | | | | | | | | | 967,000 | |
| Stock-based compensation | | | | | | | | | | | 681,000 | | | | | | | | | | | | | | | | 681,000 | |
| Cash dividends declared | | | | | | | | | | | | | | | | | | | (5,477,000 | ) | | | | | | | (5,477,000 | ) |
| Balance, December 31, 2009 | | | 7,213,056 | | | $ | 721,000 | | | $ | 2,043,000 | | | | | | | $ | 110,047,000 | | | $ | 3,651,000 | | | $ | 116,462,000 | |
See notes to consolidated financial statements
| C O N S O L I D A T E D S T A T E M E N T S O F C A S H F L O W S | |
| | | | | | | | | | |
| | | Year Ended December 31, | |
| | | 2009 | | | 2008 | | | 2007 | |
| Cash Flows From Operating Activities: | | | | | | | | | |
| Net income | | $ | 13,463,000 | | | $ | 12,962,000 | | | $ | 11,482,000 | |
| Adjustments to reconcile net income to net cash provided by operating activities: | | | | | | | | | | | | |
| Provision for loan losses | | | 4,285,000 | | | | 1,945,000 | | | | 575,000 | |
| Deferred income tax credit | | | (72,000 | ) | | | (229,000 | ) | | | - | |
| Depreciation and amortization | | | 2,154,000 | | | | 1,831,000 | | | | 1,536,000 | |
| Premium amortization on investment securities, net | | | 2,353,000 | | | | 544,000 | | | | 358,000 | |
| Net losses (gains) on sales of available-for-sale securities | | | (1,428,000 | ) | | | (248,000 | ) | | | 234,000 | |
| Stock-based compensation expense | | | 681,000 | | | | 450,000 | | | | 506,000 | |
| Accretion of cash surrender value on bank-owned life insurance | | | (517,000 | ) | | | (492,000 | ) | | | (449,000 | ) |
| Decrease (increase) in prepaid income taxes | | | (179,000 | ) | | | - | | | | 240,000 | |
| Increase in prepaid FDIC assessment | | | (5,331,000 | ) | | | - | | | | - | |
| Increase in other assets | | | (2,772,000 | ) | | | (2,355,000 | ) | | | (1,159,000 | ) |
| Decrease in accrued expenses and other liabilities | | | (1,689,000 | ) | | | (27,000 | ) | | | (17,000 | ) |
| Increase (decrease) in income taxes payable | | | (75,000 | ) | | | 38,000 | | | | 37,000 | |
| Net cash provided by operating activities | | | 10,873,000 | | | | 14,419,000 | | | | 13,343,000 | |
| | | | | | | | | | | | | |
| Cash Flows From Investing Activities: | | | | | | | | | | | | |
| Proceeds from sales of available-for-sale securities | | | 50,697,000 | | | | 36,993,000 | | | | 14,578,000 | |
| Proceeds from maturities and redemptions of investment securities: | | | | | | | | | |
| Held-to-maturity | | | 42,608,000 | | | | 28,410,000 | | | | 43,537,000 | |
| Available-for-sale | | | 147,347,000 | | | | 66,569,000 | | | | 95,708,000 | |
| Purchase of investment securities: | | | | | | | | | | | | |
| Held-to-maturity | | | (2,068,000 | ) | | | (4,637,000 | ) | | | (18,477,000 | ) |
| Available-for-sale | | | (452,851,000 | ) | | | (206,897,000 | ) | | | (145,049,000 | ) |
| Net increase in loans to customers | | | (169,547,000 | ) | | | (132,917,000 | ) | | | (76,087,000 | ) |
| Net increase in Federal Home Loan Bank stock | | | (1,683,000 | ) | | | (5,015,000 | ) | | | - | |
| Purchases of bank premises and equipment | | | (7,651,000 | ) | | | (3,502,000 | ) | | | (3,763,000 | ) |
| Net cash used in investing activities | | | (393,148,000 | ) | | | (220,996,000 | ) | | | (89,553,000 | ) |
| | | | | | | | | | | | | |
| Cash Flows From Financing Activities: | | | | | | | | | | | | |
| Net increase in total deposits | | | 377,213,000 | | | | 31,299,000 | | | | 44,241,000 | |
| Net increase (decrease) in short-term borrowings | | | (12,715,000 | ) | | | 112,012,000 | | | | (16,033,000 | ) |
| Proceeds from long-term debt | | | 35,000,000 | | | | 47,000,000 | | | | 80,000,000 | |
| Proceeds from exercise of stock options | | | 901,000 | | | | 525,000 | | | | 694,000 | |
| Tax benefit of stock options | | | 66,000 | | | | 21,000 | | | | 76,000 | |
| Repurchase and retirement of common stock | | | (957,000 | ) | | | (5,764,000 | ) | | | (3,719,000 | ) |
| Cash dividends paid | | | (5,329,000 | ) | | | (4,575,000 | ) | | | (5,342,000 | ) |
| Net cash provided by financing activities | | | 394,179,000 | | | | 180,518,000 | | | | 99,917,000 | |
| Net increase (decrease) in cash and cash equivalents | | | 11,904,000 | | | | (26,059,000 | ) | | | 23,707,000 | |
| Cash and cash equivalents, beginning of year | | | 21,438,000 | | | | 47,497,000 | | | | 23,790,000 | |
| Cash and cash equivalents, end of year | | $ | 33,342,000 | | | $ | 21,438,000 | | | $ | 47,497,000 | |
| | | | | | | | | | | | | |
| Supplemental Schedule of Noncash Financing Activities: | | | | | | | | | | | | |
| Cash dividends payable | | $ | 1,443,000 | | | $ | 1,295,000 | | | $ | 1,125,000 | |
The Corporation made interest payments of $17,365,000, $17,159,000, and $15,590,000 and income tax payments of $3,377,000, $4,797,000, and $2,541,000 in 2009, 2008 and 2007, respectively.
See notes to consolidated financial statements
N O T E S T O C O N S O L I D A T E D F I N A N C I A L S T A T E M E N T S
NOTE A – SUMMARY OF SIGNIFICANT ACCOUNTING POLICIES
The consolidated financial statements include the accounts of The First of Long Island Corporation (the “Corporation”) and its wholly-owned subsidiary, The First National Bank of Long Island (the “Bank”), and subsidiaries wholly-owned by the Bank, either directly or indirectly, The First of Long Island Agency, Inc., FNY Service Corp., and The First of Long Island REIT, Inc. (the “REIT”). The Corporation’s financial condition and operating results principally reflect those of the Bank and its subsidiaries. All intercompany balances and amounts have been eliminated. In preparing the consolidated financial statements, management is required to make estimates and assumptions that affect the reported asset and liability balances, revenue and expense amounts, and the disclosure of contingent assets and liabilities. Actual results could differ significantly from those estimates.
The accounting and reporting policies of the Corporation reflect banking industry practice and conform to generally accepted accounting principles in the United States. The following is a summary of the Corporation’s significant accounting policies.
Investment Securities
Current accounting standards require that investment securities be classified as held-to-maturity, trading, or available-for-sale. The trading category is not applicable to any securities in the Bank's portfolio because the Bank does not buy or hold debt or equity securities principally for the purpose of selling in the near term. Held-to-maturity securities are those debt securities which the Bank has the intent and ability to hold to maturity, and are reported at amortized cost. Available-for-sale securities are those debt and equity securities which are neither held-to-maturity securities nor trading securities and are reported at fair value, with unrealized gains and losses, net of the related income tax effect, included in other comprehensive income.
Interest on investment securities includes amortization or accretion of purchase premium or discount. Premiums and discounts on securities are amortized or accreted on the level-yield method. Realized gains and losses on the sale of securities are determined using the specific identification method.
The Bank evaluates declines in fair value below the amortized cost basis for individual securities. In estimating other than temporary declines, management considers: (1) the length of time and extent that fair value has been less than cost, (2) the financial condition and near term prospects of the issuer, and (3) whether the Bank intends to sell, or it is more likely than not that it will be required to sell, before recovery of its amortized cost basis. If a decline in fair value is judged to be other than temporary, the cost basis of the individual security is written down to fair value as a new cost basis and the amount of the write-down is included in earnings as a realized loss. The new cost basis is not changed for subsequent recoveries, if any, in fair value. Subsequent increases in the fair value of available-for-sale securities are included in other comprehensive income and subsequent decreases in fair value, if not an other-than-temporary impairment, are also included in other comprehensive income.
Loans and Allowance for Loan Losses
Loans are reported at their outstanding principal balance less any chargeoffs and the allowance for loan losses and plus or minus net deferred loan costs and fees, respectively. Interest on loans is credited to income based on the principal amount outstanding. Direct loan origination costs, net of loan origination fees, are deferred and recognized in interest income using the level-yield method without anticipating prepayments.
The accrual of interest income on loans is discontinued when a loan becomes 90 days past due as to principal or interest payments and any accrued but unpaid interest is reversed against current period income unless the loan is well secured and in the process of collection. The valuation allowance for nonaccrual and other impaired loans is reported within the overall allowance for loan losses. At December 31, 2009, the Bank had nonaccrual loans of $432,000 and no loans past due 90 days or more as to principal and interest payments and still accruing. At December 31, 2008, the Bank had nonaccrual loans of $112,000 and loans past due 90 days or more as to principal and interest payments and still accruing of $42,000.
The allowance for loan losses is established through provisions for loan losses charged against income. Amounts deemed to be uncollectible are charged against the allowance for loan losses, and subsequent recoveries, if any, are credited to the allowance.
The allowance for loan losses is an amount that management currently believes will be adequate to absorb probable incurred losses in the Bank’s loan portfolio. The process for estimating credit losses and determining the allowance for loan losses as of any balance sheet date is subjective in nature and requires material estimates. Actual results could differ significantly from those estimates. In determining the allowance for loan losses, there is not an exact amount but rather a range for what constitutes an appropriate allowance.
In estimating losses the Bank reviews individual loans in its portfolio and, for those loans deemed to be impaired, measures impairment losses based on either the fair value of collateral or the discounted value of expected future cash flows. A loan is considered to be impaired when, based on current information and events, it is probable that the Bank will be unable to collect the scheduled principal and interest when due according to the contractual terms of the loan agreement. Estimated losses for loans that are not specifically reviewed are determined on a pooled basis using the Bank’s historical loss experience adjusted to reflect current conditions. In adjusting historical loss experience, management considers a variety of factors including levels of and trends in delinquencies and nonaccru ing loans; trends in volume and terms of loans; changes in lending policies and procedures; experience, ability and depth of lending staff; national and local economic conditions; concentrations of credit; and environmental risks. The allowance for loan losses is comprised of impairment losses on the loans specifically reviewed plus estimated losses on the pools of loans that are not specifically reviewed.
Bank Premises and Equipment
Land is carried at cost. Other Bank premises and equipment are carried at cost, less accumulated depreciation and amortization. Buildings are depreciated using the straight-line method over their estimated useful lives, which range from thirty-one to forty years. Building improvements are depreciated using the straight-line method over the then remaining lives of the buildings or their estimated useful lives, whichever is shorter. Leasehold improvements are amortized using the straight-line method over the remaining lives of the leases or their estimated useful lives, whichever is shorter. The lives of the respective leases range between five and twenty years. Furniture, fixtures, and equipment are depreciated using the straight-line method over their estimated useful l ives, which range from three to ten years.
Bank-owned Life Insurance
The Bank is the owner and beneficiary of insurance policies on the lives of certain executives. Bank-owned life insurance is recorded at the lower of its cash surrender value or the amount that can be realized.
Federal Home Loan Bank Stock
The Bank is a member of the Federal Home Loan Bank of New York (“FHLB”) and as such is required to own a certain amount of stock based on membership and the level of FHLB advances. FHLB stock is carried at cost, classified as a restricted stock, and periodically evaluated for impairment based on the prospects for the ultimate recovery of cost. Cash dividends, if any, are reported as income.
Long-term Assets
Premises and equipment, intangible assets, and other long-term assets, if any, are reviewed for impairment when events indicate that their carrying amount may not be recoverable from future undiscounted cash flows. If impaired, the assets are recorded at fair value.
Checking Deposits
Each of the Bank’s commercial checking accounts has a related noninterest-bearing sweep account. The sole purpose of the sweep accounts is to reduce the reserve balances that the Bank is required to maintain with the Federal Reserve Bank, and thereby increase funds available for investment. Although the sweep accounts are classified as savings accounts for regulatory purposes, they are included in checking deposits in the accompanying consolidated balance sheets.
Income Taxes
A current tax liability or asset is recognized for the estimated taxes payable or refundable on tax returns for the current year. A deferred tax liability or asset is recognized for the estimated future tax effects attributable to temporary differences and carryforwards. The measurement of deferred tax assets is reduced, if necessary, by the amount of any tax benefits that, based on available evidence, are not expected to be realized. The measurement of current and deferred tax liabilities and assets is based on provisions of the enacted tax law. The effects of future changes in tax laws or rates are not considered. The Corporation recognizes interest and/or penalties related to income tax matters in noninterest income or noninterest expense as appropriate.
Loss Contingencies
Loss contingencies, including claims and legal actions arising in the ordinary course of business, are recorded as liabilities when the likelihood of loss is probable and an amount or range of loss can be reasonably estimated. Management is not currently aware of any loss contingencies that will have a material effect on the Corporation’s consolidated financial statements.
Stockholders’ Equity
Earnings Per Share. Basic earnings per share excludes dilution and is computed by dividing net income by the weighted average number of common shares outstanding for the period. Diluted earnings per share reflects the potential dilution that could occur if outstanding stock options and restricted stock units (“RSUs”) were converted into shares of common stock that then shared in the earnings of the Corporation. Diluted earnings per share is computed by dividing net income by the weighted average number of common shares and dilutive stock options and RSUs. There were 64,300, 275,762 and 308,420 antidilutive stock options at December 31, 2009, 2008 and 2007, respectively, and no antidilutive RSUs. Other than the st ock options and RSUs described in Note J and the Rights described in Note I, the Corporation has no securities that could be converted into common stock nor does the Corporation have any contracts that could result in the issuance of common stock.
Stock Repurchase Program. Since 1988, the Corporation has had a stock repurchase program under which it is authorized to purchase shares of its own common stock in market or private transactions. At December 31, 2009, and in accordance with prior approval by its Board of Directors, the Corporation was authorized to purchase 76,568 shares of stock. Share repurchases are financed through available corporate cash.
Shares Tendered Upon The Exercise of Stock Options. The line captioned repurchase and retirement of common stock in the Consolidated Statement of Changes in Stockholders’ Equity includes common stock tendered upon the exercise of stock options of 1,843 shares in 2008 with a value of $40,000, and 2,215 shares in 2007 with a value of $43,000. No shares of common stock were tendered upon the exercise of stock options in 2009.
Stock-based Compensation
The Corporation has a stock-based compensation plan as more fully described in Note J. Compensation cost is recognized for stock options and RSUs issued to employees based on the grant date fair value of the award. The cost is recognized over the period during which an employee is required to provide service in exchange for the award which is usually the vesting period.
Comprehensive Income
Comprehensive income includes net income and other comprehensive income. Other comprehensive income includes revenues, expenses, gains, and losses that under generally accepted accounting principles are included in comprehensive income but excluded from net income. Other comprehensive income for the Corporation consists of unrealized holding gains or losses on available-for-sale securities and changes in the funded status of the Bank’s defined benefit pension plan, both net of related income taxes. Accumulated other comprehensive income is recognized as a separate component of stockholders’ equity.
The components of other comprehensive income (loss) and the related tax effects are as follows:
| | | 2009 | | | 2008 | | | 2007 | |
| | | (in thousands) | |
| Unrealized holding gains on available-for-sale securities: | | | | | | | | | |
| Change arising during period | | $ | 7,606 | | | $ | 2,921 | | | $ | 2,118 | |
| Reclassification adjustment for (gains) losses included in net income | | | (1,428 | ) | | | (248 | ) | | | 234 | |
| Net unrealized gains on available-for-sale securities | | | 6,178 | | | | 2,673 | | | | 2,352 | |
| Tax effect | | | 2,453 | | | | 1,061 | | | | 933 | |
| | | | 3,725 | | | | 1,612 | | | | 1,419 | |
| | | | | | | | | | | | | |
| Change in funded status of pension plan: | | | | | | | | | | | | |
| Change arising during period | | | 2,510 | | | | (8,172 | ) | | | 1,220 | |
| Amortization of prior service cost included in pension expense | | | 23 | | | | 25 | | | | 20 | |
| | | | 2,533 | | | | (8,147 | ) | | | 1,240 | |
| Tax effect | | | 1,005 | | | | (3,234 | ) | | | 495 | |
| | | | 1,528 | | | | (4,913 | ) | | | 745 | |
| Other comprehensive income (loss) | | $ | 5,253 | | | $ | (3,301 | ) | | $ | 2,164 | |
The following sets forth the components of accumulated other comprehensive income, net of tax:
| | | | | | Current | | | | |
| | | Balance | | | Period | | | Balance | |
| | | 12/31/08 | | | Change | | | 12/31/09 | |
| | | (in thousands) | |
| Unrealized holding gains on available-for-sale securities | | $ | 3,273 | | | $ | 3,725 | | | $ | 6,998 | |
| Unrealized actuarial gains (losses) on pension plan | | | (4,875 | ) | | | 1,528 | | | | (3,347 | ) |
| Total accumulated cther comprehensive Income (loss) | | $ | (1,602 | ) | | $ | 5,253 | | | $ | 3,651 | |
Embedded Derivative Instruments
Under generally accepted accounting principles, changes in the fair value of embedded derivative instruments with economic characteristics and risks that are clearly and closely related to the economic characteristics and risks of the related host contracts are not recognized in earnings in the period of change. Generally, all other embedded derivative instruments, unless they are embedded in contracts that are remeasured at fair value with changes in fair value reported in earnings as they occur, are accounted for as fair value hedges, cash flow hedges, foreign currency hedges or nonhedging instruments.
Operating Segments
While senior management monitors the revenue streams of the Bank’s various products and services, the identifiable segments are not material and operations are managed and financial performance is evaluated on a company-wide basis. Accordingly, all of the financial operations are considered by senior management to be aggregated in one reportable operating segment.
Investment Management Division
Assets held in a fiduciary capacity are not assets of the Corporation and, accordingly, are not included in the accompanying consolidated financial statements. The Investment Management Division records fees on the accrual basis.
Reclassifications
Some items in the prior year financial statements were reclassified to conform to the current presentation.
Subsequent Events
The Corporation’s management has evaluated subsequent events through March 16, 2010, which is the date of issuance of these financial statements.
Adoption of New Accounting Pronouncements
In December 2007, the Financial Accounting Standards Board (“FASB”) issued Statement of Financial Accounting Standards (“SFAS”) No. 160 “Noncontrolling Interest in Consolidated Financial Statements, an amendment of ARB No. 51” (“SFAS No. 160”), which is now a part of FASB Accounting Standards Codification (“ASC”) 810 “Consolidation.” This standard changes the accounting and reporting for minority interests. Under SFAS No. 160, minority interests are recharacterized as noncontrolling interests and classified as a component of equity within the consolidated balance sheet. SFAS No. 160 is effective as of the beginning of the first fiscal year beginning on or after December 15, 2008. The adopti on of this Standard on January 1, 2009 had no impact on the Corporation’s consolidated financial statements.
In March 2008, the FASB issued SFAS No. 161 “Disclosures about Derivative Instruments and Hedging Activities – an amendment of SFAS No. 133” (“SFAS No. 161”), which is now a part of ASC 815 “Derivatives and Hedging.” SFAS No. 161 requires enhanced disclosures about an entity’s derivative and hedging activities and thereby improves the transparency of financial reporting. SFAS No. 161 is effective for financial statements issued for fiscal years and interim periods beginning after November 15, 2008. The adoption of this Standard on January 1, 2009 had no impact on the Corporation’s disclosures.
In February 2008, the FASB issued Staff Position (“FSP”) 157-2 “Effective Date of FASB Statement No. 157”, which is now a part of ASC 820 “Fair Value Measurements and Disclosures.” This FSP delayed the effective date of SFAS No. 157 for all nonfinancial assets and nonfinancial liabilities, except those that are periodically recognized or disclosed at fair value, to fiscal years beginning after November 15, 2008. The adoption of FSP 157-2 on January 1, 2009 had no impact on the Corporation’s consolidated financial statements.
In February 2008, the FASB issued FSP FAS 140-3 “Accounting for Transfers of Financial Assets and Repurchase Financing Transactions”, which is now a part of ASC 860 “Transfers and Servicing.” This FSP resolves questions about the accounting for repurchase financings. This FSP is effective for repurchase financings in which the initial transfer is entered into in fiscal years beginning after November 15, 2008. The adoption of FSP FAS 140-3 on January 1, 2009 had no impact on the Corporation’s consolidated financial statements.
In June 2008, the FASB issued FSP EITF 03-6-1 “Determining Whether Instruments Granted in Share-Based Payment Transactions Are Participating Securities”, which is now a part of ASC 260 “Earnings per Share.” This FSP addresses whether instruments granted in share-based payment transactions are participating securities prior to vesting and, therefore, need to be included in the earnings allocation in computing earnings per share under the two-class method described in paragraphs 60 and 61 of SFAS No. 128, “Earnings per Share.” FSP EITF 03-6-1 is effective for financial statements issued for fiscal years and interim periods beginning after December 15, 2008. The adoption of FSP EITF 03-6-1 on January 1, 2009 had no impact on the Corporation’s consolidated financia l statements.
In December 2008, the FASB issued FSP FAS 132(R)-1 “Employers’ Disclosures about Postretirement Benefit Plan Assets”, which is now a part of ASC 715 “Compensation – Retirement Benefits.” This FSP amends FASB Statement No. 132 (revised 2003), “Employers’ Disclosures about Pensions and Other Postretirement Benefits”, to provide guidance on an employer’s disclosures about plan assets of a defined benefit pension or other postretirement plan. This FSP is effective for financial statements issued for fiscal years ending after December 15, 2009. The adoption of FSP FAS 132(R)-1 on December 31, 2009 resulted in the disclosures included under “Fair Value of Plan Assets” in Note K to the consolidated financial statements.
In April 2009, the FASB issued FSP FAS No. 115-2 and 124-2 “Recognition and Presentation of Other-than-temporary Impairments", which is now a part of ASC 320 “Investments – Debt and Equity Securities.” FSP FAS No. 115-2 and 124-2 amends existing guidance for determining whether impairment is other-than-temporary for debt securities. This FSP requires an entity to assess whether it intends to sell, or it is more likely than not that it will be required to sell a security in an unrealized loss position before recovery of its amortized cost basis. If either of these criteria is met, the entire difference between amortized cost and fair value is recognized in earnings. For securities that do not meet the aforementioned criteria, the amount of impairment recognized in earn ings is limited to the amount related to credit losses, while impairment related to other factors is recognized in other comprehensive income. Additionally, the FSP expands and increases the frequency of existing disclosures about other-than-temporary impairments for debt and equity securities. This FSP is effective for interim and annual reporting periods ending after June 15, 2009. The adoption of FSP FAS No. 115-2 and 124-2 on April 1, 2009 resulted in the disclosures included under the caption “Other-than-temporary Impairment” in Note B to the consolidated financial statements.
In April 2009, the FASB issued FSP FAS No. 157-4 “Determining Fair Value When the Volume and Level of Activity for the Asset or Liability Have Significantly Decreased and Identifying Transactions That Are Not Orderly”, which is now a part of ASC 820 “Fair Value Measurements and Disclosures.” This FSP emphasizes that even if there has been a significant decrease in the volume and level of activity, the objective of a fair value measurement remains the same. Fair value is the price that would be received to sell an asset or paid to transfer a liability in an orderly transaction (that is, not a forced liquidation or distressed sale) between market participants. The FSP provides a number of factors to consider when evaluating whether there has been a significant decrease in the volu me and level of activity for an asset or liability in relation to normal market activity. In addition, when transactions or quoted prices are not considered orderly, adjustments to those prices based on the weight of available information may be needed to determine the appropriate fair value. The FSP also requires increased disclosures. This FSP is effective for interim and annual reporting periods ending after June 15, 2009, and shall be applied prospectively. The adoption of FSP FAS No. 157-4 on June 30, 2009 resulted in the disclosures included under the caption “Financial Instruments Recorded at Fair Value” in Note N to the consolidated financial statements but did not impact the Corporation’s results of operations or financial position.
In April 2009, the FASB issued FSP FAS 141(R)-1 “Accounting for Assets Acquired and Liabilities Assumed in a Business Combination That Arise from Contingencies”, which is now a part of ASC 805 “Business Combinations.” FSP FAS 141(R)-1 amends and clarifies FASB Statement No. 141 (revised 2007), “Business Combinations”, to address application issues raised by preparers, auditors, and members of the legal profession on initial recognition and measurement, subsequent measurement and accounting, and disclosure of assets and liabilities arising from contingencies in a business combination. FSP FAS 141(R)-1 is effective for assets or liabilities arising from contingencies in business combinations for which the acquisition date is on or after the beginning of the first annua l reporting period beginning on or after December 15, 2008. The adoption of this standard in 2009 has had no impact on the Corporation’s financial position or results of operations because the Corporation has had no business combinations to which the standard would apply.
In May 2009, the FASB issued SFAS No. 165 “Subsequent Events”, which is now a part of ASC 855 “Subsequent Events.” The objective of this statement is to establish general standards of accounting for and disclosure of events that occur after the balance sheet date but before financial statements are issued or are available to be issued. SFAS No. 165 is effective for interim and annual reporting periods ending after June 15, 2009. The adoption of SFAS No. 165 on April 1, 2009 resulted in the disclosure included under the caption “Subsequent Events” in Note A to the consolidated financial statements
In June 2009, the FASB issued Accounting Standards Update (“ASU”) 2009-01 “Topic 105-Generally Accepted Accounting Principles - amendments based on Statement of Financial Accounting Standards No. 168 - The FASB Accounting Standards Codification™ and the Hierarchy of Generally Accepted Accounting Principles.” The ASC has become the source of authoritative U.S. generally accepted accounting principles (“GAAP”) recognized by the FASB to be applied by nongovernmental entities. Rules and interpretive releases of the Securities and Exchange Commission (“SEC”) under authority of federal securities laws are also sources of authoritative GAAP for SEC registrants. On the effective date of this Statement, the ASC supersedes all then-existing non-SEC accounting and r eporting standards. All other nongrandfathered non-SEC accounting literature not included in the ASC became nonauthoritative. This Statement is effective for financial statements issued for interim and annual periods ending after September 15, 2009.
In August 2009, the FASB issued ASU 2009-05 “Measuring Liabilities at Fair Value.” The objective of this ASU is to provide guidance on the fair value measurement of liabilities. ASU 2009-05 is effective for the first reporting period (including interim periods) beginning after issuance. The adoption of ASU 2009-05 on October 1, 2009 had no impact on the Corporation’s consolidated financial statements.
In January 2010, the FASB issued ASU 2010-02 “Accounting and Reporting for Decreases in Ownership of a Subsidiary – a Scope Clarification.” This ASU provides amendments to ASC 810 “Consolidation” and related guidance within U.S. GAAP. This ASU is effective for interim and annual periods ending after December 15, 2009. The amendments in ASU 2010-02 had no impact on the Corporation’s results of operations, financial position or disclosures.
In January 2010, the FASB issued ASU 2010-05 “Escrowed Share Arrangements and the Presumption of Compensation.” This ASU codifies EITF Topic D-110 “Escrowed Share Arrangements and the Presumption of Compensation”, which is now included in ASC 718 “Compensation – Stock Compensation.” The amendments in ASU 2010-05 had no impact on the Corporation’s results of operations, financial position or disclosures.
Impact of Not Yet Effective Authoritative Accounting Pronouncements
In June 2009, the FASB issued SFAS No. 166 “Accounting for Transfers of Financial Assets – an amendment of FASB Statement No. 140”, which is now part of ASC 860 “Transfers and Servicing.” The objective of this Statement is to improve the relevance, representational faithfulness, and comparability of the information that a reporting entity provides in its financial reports about a transfer of financial assets; the effects of a transfer on its financial position, financial performance, and cash flows; and a transferor’s continuing involvement in transferred financial assets. SFAS No. 166 is effective for financial statements issued for fiscal years and interim periods beginning after November 15, 2009. The recognition and measurement provisions of this statement s hall be applied to transfers that occur on or after the effective date. The adoption of SFAS No. 166 on January 1, 2010 did not impact the Corporation’s consolidated financial statements.
In June 2009, the FASB issued SFAS No. 167 “Amendments to FASB Interpretation No. 46(R)”, which is now part of ASC 810 “Consolidations.” The objective of this Statement is to improve financial reporting by enterprises involved with variable interest entities. The Statement addresses the effects on certain provisions of FASB Interpretation No. 46(R) “Consolidation of Variable Interest Entities” as a result of the elimination of the qualifying special-purpose entity concept in FASB Statement No. 166. SFAS No. 167 is effective for financial statements issued for fiscal years and interim periods beginning after November 15, 2009. The adoption of SFAS No. 167 on January 1, 2010 did not impact the Corporation’s consolidated financial statements.
In January 2010, the FASB issued ASU 2010-06 “Improving Disclosures about Fair Value Measurements.” This ASU requires more robust disclosures about the different classes of assets and liabilities measured at fair value, the valuation techniques and inputs used, the activity in Level 3 fair value measurements, and the transfers between Levels 1, 2 and 3. This ASU is effective for interim and annual periods beginning after December 15, 2009, except for disclosures regarding the roll forward of activity in Level 3 fair value measurements. Those disclosures are effective for interim and annual periods beginning after December 15, 2010. Management is currently evaluating the impact of ASU 2010-06 on the Corporation’s disclosures.
NOTE B – INVESTMENT SECURITIES
The following table sets forth the amortized cost and estimated fair values of the Bank’s investment securities at December 31, 2009 and 2008.
| | | 2009 | |
| | | | | | Gross | | | Gross | | | | |
| | | Amortized | | | Unrealized | | | Unrealized | | | Fair | |
| | | Cost | | | Gains | | | Losses | | | Value | |
| Held-to-Maturity Securities: | | (in thousands) | |
| State and municipals | | $ | 57,875 | | | $ | 1,924 | | | $ | (48 | ) | | $ | 59,751 | |
| Pass-through mortgage securities | | | 16,882 | | | | 604 | | | | - | | | | 17,486 | |
| Collateralized mortgage obligations | | | 54,222 | | | | 1,774 | | | | - | | | | 55,996 | |
| | | $ | 128,979 | | | $ | 4,302 | | | $ | (48 | ) | | $ | 133,233 | |
| Available-for-Sale Securities: | | | | | | | | | | | | | | | | |
| U.S. government agencies | | $ | 5,000 | | | $ | 8 | | | $ | - | | | $ | 5,008 | |
| State and municipals | | | 150,509 | | | | 4,378 | | | | (374 | ) | | | 154,513 | |
| Pass-through mortgage securities | | | 122,186 | | | | 4,349 | | | | (113 | ) | | | 126,422 | |
| Collateralized mortgage obligations | | | 349,494 | | | | 4,450 | | | | (1,093 | ) | | | 352,851 | |
| | | $ | 627,189 | | | $ | 13,185 | | | $ | (1,580 | ) | | $ | 638,794 | |
| | | 2008 | |
| | | | | | | Gross | | | Gross | | | | | |
| | | Amortized | | | Unrealized | | | Unrealized | | | Fair | |
| | | Cost | | | Gains | | | Losses | | | Value | |
| Held-to-Maturity Securities: | | (in thousands) | |
| State and municipals | | $ | 66,817 | | | $ | 1,708 | | | $ | (228 | ) | | $ | 68,297 | |
| Pass-through mortgage securities | | | 20,802 | | | | 447 | | | | (1 | ) | | | 21,248 | |
| Collateralized mortgage obligations | | | 81,861 | | | | 1,330 | | | | (96 | ) | | | 83,095 | |
| | | $ | 169,480 | | | $ | 3,485 | | | $ | (325 | ) | | $ | 172,640 | |
| Available-for-Sale Securities: | | | | | | | | | | | | | | | | |
| U.S. government agencies | | $ | 33,555 | | | $ | 130 | | | $ | - | | | $ | 33,685 | |
| State and municipals | | | 74,625 | | | | 2,375 | | | | (359 | ) | | | 76,641 | |
| Pass-through mortgage securities | | | 122,465 | | | | 2,324 | | | | (19 | ) | | | 124,770 | |
| Collateralized mortgage obligations | | | 142,701 | | | | 1,052 | | | | (76 | ) | | | 143,677 | |
| | | $ | 373,346 | | | $ | 5,881 | | | $ | (454 | ) | | $ | 378,773 | |
Substantially all of the Corporation’s municipal securities are rated A or better. The Corporation’s pass-through mortgage security portfolio at December 31, 2009 is comprised of $121,665,000, $20,173,000 and $1,466,000 issued by the Government National Mortgage Association (“GNMA”), the Federal National Mortgage Association (“FNMA”), and the Federal Home Loan Mortgage Corporation (“FHLMC”), respectively. Each issuer’s pass-through securities are backed by residential mortgages conforming to its underwriting guidelines and each issuer guarantees the timely payment of principal and interest on its securities. All of the Corporation’s collateralized mortgage obligations (“CMOs”) were issued by GNMA and such securites are backed by GN MA residential pass-through mortgage securities. GNMA guarantees the timely payment of principal and interest on its CMOs and the underlying pass-through mortgage securities. Obligations of GNMA represent full faith and credit obligations of the U.S. government (the “Government”), while obligations of FNMA, which is a corporate instrumentality of the Government, and FHLMC, which is a Government sponsored corporation, do not. FNMA and FHLMC have been placed into conservatorship by their primary regulator, the Federal Housing Finance Agency (“FHFA”) who also acts as conservator. In conjunction with the conservatorship, the U.S. Department of the Treasury entered into Preferred Stock Purchase Agreements with FNMA and FHLMC to ensure that each of these entities maintains positive net worth, and established new borrowing facilities for these entities intended to serve as an ultimate liquidity backstop. The Preferred Stock Purchase Agre ements and borrowing facilities serve to protect the existing and future holders of FNMA and FHLMC mortgage securities and other debt instruments.
At December 31, 2009 and 2008, investment securities with a carrying value of $378,913,000 and $365,134,000, respectively, were pledged as collateral to secure public deposits and borrowed funds.
Securities With Unrealized Losses. The following table sets forth securities with unrealized losses at December 31, 2009 and 2008 presented by length of time the securities have been in a continuous unrealized loss position.
| | | 2009 | |
| | | Less than | | | 12 Months | | | |
| | | 12 Months | | | or More | | | Total | |
| | | Fair | | | Unrealized | | | Fair | | | Unrealized | | | Fair | | | Unrealized | |
| | | Value | | | Loss | | | Value | | | Loss | | | Value | | | Loss | |
| | | (in thousands) | |
| State and municipals | | $ | 25,403 | | | $ | (421 | ) | | $ | 100 | | | $ | (1 | ) | | $ | 25,503 | | | $ | (422 | ) |
| Pass-through mortgage securities | | | 13,132 | | | | (112 | ) | | | 13 | | | | (1 | ) | | | 13,145 | | | | (113 | ) |
| Collateralized mortgage obligations | | | 107,781 | | | | (1,093 | ) | | | - | | | | - | | | | 107,781 | | | | (1,093 | ) |
| Total temporarily impaired | | $ | 146,316 | | | $ | (1,626 | ) | | $ | 113 | | | $ | (2 | ) | | $ | 146,429 | | | $ | (1,628 | ) |
| | | 2008 | |
| | | Less than | | | 12 Months | | | |
| | | 12 Months | | | or More | | | Total | |
| | | Fair | | | Unrealized | | | Fair | | | Unrealized | | | Fair | | | Unrealized | |
| | | Value | | | Loss | | | Value | | | Loss | | | Value | | | Loss | |
| | | (in thousands) | |
| State and municipals | | $ | 19,839 | | | $ | (555 | ) | | $ | 1,769 | | | $ | (32 | ) | | $ | 21,608 | | | $ | (587 | ) |
| Pass-through mortgage securities | | | 895 | | | | (19 | ) | | | 16 | | | | (1 | ) | | | 911 | | | | (20 | ) |
| Collateralized mortgage obligations | | | 34,391 | | | | (75 | ) | | | 9,337 | | | | (97 | ) | | | 43,728 | | | | (172 | ) |
| Total temporarily impaired | | $ | 55,125 | | | $ | (649 | ) | | $ | 11,122 | | | $ | (130 | ) | | $ | 66,247 | | | $ | (779 | ) |
Unrealized losses reflected in the preceding tables have not been included in results of operations because the affected securities are of high credit quality, the Company does not intend to sell them, nor is it more likely than not that it will be required to sell them before recovery of their amortized cost basis, and the decline in fair value is largely due to an increase in interest rates since the time the securities were purchased. The losses on these securities are expected to dissipate as they approach their maturity dates and/or if interest rates decline.
Other-than-temporary Impairment. Management evaluates investment securities for other-than-temporary impairment (“OTTI”) at least on a quarterly basis. In determining OTTI, management considers many factors, including: (1) the length of time and the extent to which the fair value has been less than cost; (2) the financial condition and near-term prospects of the issuer; (3) whether the market decline was affected by macroeconomic conditions; and (4) whether management has the intent to sell the debt security or more likely than not will be required to sell the debt security before its anticipated recovery. The assessment of whether an other-than-temporary decline exists involves a high degree of subjectivity and judgment and is based on the information available to management at a point in time.
When OTTI occurs, management considers whether it intends to sell, or, more likely than not, will be required to sell a security in an unrealized loss position before recovery of its amortized cost basis. If either of these criteria is met, the entire difference between amortized cost and fair value is recognized in earnings. For securities that do not meet the aforementioned criteria, the amount of impairment recognized in earnings is limited to the amount related to credit losses, while impairment related to other factors is recognized in other comprehensive income.
Sales of Available-for-Sale Securities. Sales of available-for-sale securities were as follows:
| | | 2009 | | | 2008 | | | 2007 | |
| | | (in thousands) | |
| Proceeds | | $ | 50,697 | | | $ | 36,993 | | | $ | 14,578 | |
| | | | | | | | | | | | | |
| Gross gains | | | 1,428 | | | | 287 | | | | 17 | |
| Gross losses | | | - | | | | (39 | ) | | | (251 | ) |
| Net gains (losses) | | $ | 1,428 | | | $ | 248 | | | $ | (234 | ) |
The tax provision (benefit) related to these net realized gains and losses was $567,000, $98,000 and $(93,000) in 2009, 2008 and 2007, respectively.
Maturities and Average Yields. The following table sets forth the maturities and weighted average yields of the Bank’s investment securities at December 31, 2009.
| | | Principal Maturing (1) | |
| | | Within | | | After One But | | | After Five But | | | After | |
| | | One Year | | | Within Five Years | | | Within Ten Years | | | Ten Years | |
| | | Amount | | | Yield | | | Amount | | | Yield | | | Amount | | | Yield | | | Amount | | | Yield | |
| | | (dollars in thousands) | |
| Held-to-Maturity Securities (Amortized Cost) | | | | | | | | | | | | | | | | | | | | | | | | |
State and municipals (2) | | $ | 4,928 | | | | 6.41 | % | | $ | 12,884 | | | | 7.08 | % | | $ | 25,348 | | | | 6.13 | % | | $ | 14,715 | | | | 6.21 | % |
Pass-through mortgage securities | | | 2 | | | | 6.18 | | | | 9,127 | | | | 3.91 | | | | 1,521 | | | | 5.18 | | | | 6,232 | | | | 3.74 | |
| Collateralized mortgage obligations | | | - | | | | - | | | | - | | | | - | | | | - | | | | - | | | | 54,222 | | | | 4.97 | |
| | | $ | 4,930 | | | | 6.41 | % | | $ | 22,011 | | | | 5.77 | % | | $ | 26,869 | | | | 6.08 | % | | $ | 75,169 | | | | 5.11 | % |
| | | Principal Maturing (1) | |
| | | Within | | | After One But | | | After Five But | | | After | |
| | | One Year | | | Within Five Years | | | Within Ten Years | | | Ten Years | |
| | | Amount | | | Yield | | | Amount | | | Yield | | | Amount | | | Yield | | | Amount | | | Yield | |
| | | (dollars in thousands) | |
| Held-to-Maturity Securities (Fair Value) | | | | | | | | | | | | | | | | | | | | | | | | |
State and municipals (2) | | $ | 4,993 | | | | 6.41 | % | | $ | 13,410 | | | | 7.08 | % | | $ | 26,391 | | | | 6.13 | % | | $ | 14,957 | | | | 6.21 | % |
| Pass-through mortgage securities | | | 2 | | | | 6.18 | | | | 9,358 | | | | 3.91 | | | | 1,627 | | | | 5.18 | | | | 6,499 | | | | 3.74 | |
| Collateralized mortgage obligations | | | - | | | | - | | | | - | | | | - | | | | - | | | | - | | | | 55,996 | | | | 4.97 | |
| | | $ | 4,995 | | | | 6.41 | % | | $ | 22,768 | | | | 5.77 | % | | $ | 28,018 | | | | 6.08 | % | | $ | 77,452 | | | | 5.11 | % |
| | | Principal Maturing (1) | |
| | | Within | | | After One But | | | After Five But | | | After | |
| | | One Year | | | Within Five Years | | | Within Ten Years | | | Ten Years | |
| | | Amount | | | Yield | | | Amount | | | Yield | | | Amount | | | Yield | | | Amount | | | Yield | |
| | | (dollars in thousands) | |
| Available-for-Sale Securities (Fair Value) | | | | | | | | | | | | | | | | | | | | | | | | |
U.S. government agencies | | $ | - | | | | - | % | | $ | - | | | | - | % | | $ | 5,008 | | | | 4.50 | % | | $ | - | | | | - | % |
State and municipals (2) | | | 405 | | | | 7.06 | | | | 17,257 | | | | 7.10 | | | | 16,067 | | | | 6.75 | | | | 120,784 | | | | 6.44 | |
Pass-through mortgage securities | | | - | | | | - | | | | 74 | | | | 3.04 | | | | 4,417 | | | | 5.59 | | | | 121,931 | | | | 5.01 | |
| Collateralized mortgage obligations | | | - | | | | - | | | | - | | | | - | | | | - | | | | - | | | | 352,851 | | | | 3.32 | |
| | | $ | 405 | | | | 7.06 | % | | $ | 17,331 | | | | 7.07 | % | | $ | 25,492 | | | | 6.11 | % | | $ | 595,566 | | | | 4.30 | % |
| (1) | Maturities shown are stated maturities, except in the case of municipal securities which are shown at the earlier of their stated maturity or pre-refunded dates. Securities backed by mortgages, which include the pass-through mortgage securities and collateralized mortgage obligations shown above, are expected to have substantial periodic repayments resulting in weighted average lives considerably shorter than would be surmised from the above table. |
| (2) | Yields on tax-exempt state and municipal securities have been computed on a tax-equivalent basis. |
NOTE C – LOANS
The following table sets forth changes in the Bank’s allowance for loan losses.
| | | Year ended December 31, | |
| | | 2009 | | | 2008 | | | 2007 | |
| | | (dollars in thousands) | |
| Balance, beginning of year | | $ | 6,076 | | | $ | 4,453 | | | $ | 3,891 | |
| Loans charged off: | | | | | | | | | | | | |
| Commercial and industrial | | | 162 | | | | 275 | | | | - | |
| Other | | | 13 | | | | 50 | | | | 14 | |
| | | | 175 | | | | 325 | | | | 14 | |
| Recoveries of loans charged off: | | | | | | | | | | | | |
| Commercial and industrial | | | 148 | | | | - | | | | - | |
| Other | | | 12 | | | | 3 | | | | 1 | |
| | | | 160 | | | | 3 | | | | 1 | |
| Net chargeoffs | | | (15 | ) | | | (322 | ) | | | (13 | ) |
| Provision for loan losses | | | 4,285 | | | | 1,945 | | | | 575 | |
| Balance, end of year | | $ | 10,346 | | | $ | 6,076 | | | $ | 4,453 | |
| Ratio of net chargeoffs to average loans outstanding | | | .00 | % | | | .06 | % | | | .00 | % |
The following tables set forth information regarding individually impaired loans.
| | | December 31, | | | | |
| | | 2009 | | | 2008 | | | | |
| | | (in thousands) | | | | |
| Impaired loans at year end: | | | | | | | | | |
| With no allocated allowance for loan losses | | $ | 432 | | | $ | 744 | | | | |
| With an allocated allowance for loan losses | | | 45 | | | | 1,455 | | | | |
| | | $ | 477 | | | $ | 2,199 | | | | |
| | | | | | | | | | | | |
| Amount of allocated allowance for loan losses | | $ | 45 | | | $ | 355 | | | | |
| | | | | | | | | | | | |
| | | Year ended December 31, | |
| | | 2009 | | | 2008 | | | 2007 | |
| | | (in thousands) | |
| Average of individually impaired loans during year | | $ | 241 | | | $ | 1,975 | | | $ | 1,538 | |
| Interest income recognized while impaired | | | 22 | | | | 158 | | | | 115 | |
Interest income recorded by the Corporation during 2009, 2008 and 2007 on loans considered to be impaired was generally recognized using the accrual method of accounting.
Nonaccrual loans and loans past due 90 days or more and still accruing are as follows:
| | | December 31, | |
| | | 2009 | | | 2008 | |
| | | (in thousands) | |
| Nonaccrual loans | | $ | 432 | | | $ | 112 | |
| Loans past due 90 days or more and still accruing | | | - | | | | 42 | |
| | | $ | 432 | | | $ | 154 | |
Certain directors, including their immediate families and companies in which they are principal owners, and executive officers were loan customers of the Bank during 2009 and 2008. The aggregate amount of these loans was $2,182,000 and $2,374,000 at December 31, 2009 and 2008, respectively. During 2009, $17,000 of new loans to such persons were made and repayments totaled $209,000. There were no loans to directors or executive officers which were nonaccruing at December 31, 2009 or 2008.
NOTE D – PREMISES AND EQUIPMENT
Bank premises and equipment consist of the following:
| | | December 31, | |
| | | 2009 | | | 2008 | |
| | | (in thousands) | |
| | | | | | | |
| Land | | $ | 2,892 | | | $ | 1,650 | |
| Buildings and improvements | | | 10,668 | | | | 7,741 | |
| Leasehold improvements | | | 5,215 | | | | 4,654 | |
| Furniture and equipment | | | 16,838 | | | | 15,265 | |
| Construction in process | | | 2,226 | | | | 932 | |
| | | | 37,839 | | | | 30,242 | |
| Accumulated depreciation and amortization | | | (19,749 | ) | | | (17,649 | ) |
| | | $ | 18,090 | | | $ | 12,593 | |
Buildings occupied by two of the Bank’s branch offices are leased from a director of the Corporation and the Bank. The leases, which expire on October 31, 2012 and December 31, 2019, provide for base rents for the year ending December 31, 2010 of $33,147 and $33,014. In addition to base rent, the Bank is responsible for its proportionate share of the real estate taxes on one of the leased properties. The Corporation believes that the foregoing is comparable to the rents that would be charged by an unrelated third party.
NOTE E – DEPOSITS
The following table sets forth the remaining maturities of the Bank’s time deposits.
| | | Amount | |
| | | Less than | | | $100,000 or | | | | |
| | | $100,000 | | | More | | | Total | |
| | | (in thousands) | |
| | | | | | | | | | | |
| 2010 | | $ | 50,001 | | | $ | 170,833 | | | $ | 220,834 | |
| 2011 | | | 10,531 | | | | 11,217 | | | | 21,748 | |
| 2012 | | | 4,731 | | | | 5,979 | | | | 10,710 | |
| 2013 | | | 8,026 | | | | 8,482 | | | | 16,508 | |
| 2014 | | | 10,126 | | | | 12,670 | | | | 22,796 | |
| Thereafter | | | 8,370 | | | | 7,818 | | | | 16,188 | |
| | | $ | 91,785 | | | $ | 216,999 | | | $ | 308,784 | |
The aggregate amount of deposit account overdrafts included in other loans on the consolidated balance sheet was $1,314,000 and $876,000 at December 31, 2009 and 2008, respectively.
NOTE F – BORROWED FUNDS
The following table summarizes borrowed funds at December 31, 2009 and 2008.
| | | December 31, | |
| | | 2009 | | | 2008 | |
| Short-term borrowings: | | (in thousands) | |
| Securities sold under repurchase agreements | | $ | 13,907 | | | $ | 18,122 | |
| Federal Home Loan Bank advances | | | 97,500 | | | | 106,000 | |
| | | | 111,407 | | | | 124,122 | |
| Long-term debt: | | | | | | | | |
| Securities sold under repurchase agreements | | | 127,000 | | | | 127,000 | |
| Federal Home Loan Bank advances | | | 35,000 | | | | - | |
| | | | 162,000 | | | | 127,000 | |
| | | | | | | | | |
| | | $ | 273,407 | | | $ | 251,122 | |
Accrued interest payable on borrowed funds is included in “accrued expenses and other liabilities” in the Consolidated Balance Sheets, and amounted to $728,000 and $621,000 at December 31, 2009 and 2008, respectively.
Securities Sold Under Repurchase Agreements. Securities sold under repurchase agreements are financing arrangements with contractual maturities between one day and nine years and are collateralized by municipal and mortgage-backed securities. With the exception of those repurchase agreements with embedded interest rate caps as described hereinafter, securities sold under repurchase agreements have fixed rates of interest. At maturity, the securities underlying the agreements will be returned to the Bank. The following table sets forth information concerning securities sold under repurchase agreements.
| | | 2009 | | | 2008 | |
| | | (dollars in thousands) | |
| Average daily balance during the year | | $ | 143,387 | | | $ | 130,010 | |
| Average interest rate during the year | | | 3.88 | % | | | 3.89 | % |
| Maximum month-end balance during the year | | $ | 148,194 | | | $ | 151,439 | |
| Weighted average interest rate at year-end | | | 3.87 | % | | | 3.82 | % |
The agreements are collateralized by securities with a carrying value of approximately $151 million at December 31, 2009. The following table summarizes the contractual maturities and weighted average interest rates of securities sold under repurchase agreements at December 31, 2009.
| | | | | | Weighted | |
| | | | | | Average | |
| Contractual Maturity | | Amount | | | Rate | |
| (dollars in thousands) | |
| Overnight | | $ | 13,907 | | | | 0.39 | % |
| | | | | | | | | |
| 2011 | | | 12,000 | | | | 2.92 | |
| 2012 | | | 50,000 | | | | 4.47 | |
| 2013 | | | 10,000 | | | | 4.19 | |
| Thereafter | | | 55,000 | | | | 4.37 | |
| | | | 127,000 | | | | 4.25 | |
| | | $ | 140,907 | | | | 3.87 | % |
The repurchase agreements maturing in 2012 are callable in 2010, those maturing in 2013 are callable in 2011 and those maturing after 2013 are callable beginning 2010.
$75 million of the repurchase agreements have embedded interest rate caps with a notional amount of $120 million and a weighted average LIBOR strike rate of 4.46%. The interest rate on the repurchase agreements will, as a result of the embedded caps, be reduced on a quarterly basis by the excess, if any, of 3 month LIBOR at the beginning of the quarter over the strike rate on the cap. However, the interest rate on the repurchase agreements can never go below zero. Since the economic characteristics and risks of the embedded caps are clearly and closely related to the economic characteristics and risks of the repurchase agreements, changes in the fair value of the caps are not recognized in earnings in the period of change.
Because the Bank’s loans and investment securities generally reprice slower than its interest-bearing liabilities, an immediate increase in interest rates uniformly across the yield curve should initially have a negative effect on net interest income. The purpose of the embedded interest rate caps is to potentially reduce the Corporation’s exposure in the event of an increase in interest rates.
Federal Home Loan Bank Advances. FHLB advances are collateralized by CMOs and pass-through mortgage securities with a carrying amount of approximately $139 million at December 31, 2009. Each advance is non-amortizing and, for those advances with a term greater than one day, subject to a prepayment penalty. The following table sets forth information concerning FHLB advances.
| | | December 31, | |
| | | 2009 | | | 2008 | |
| | | (dollars in thousands) | |
| Average daily balance during the year | | $ | 50,668 | | | $ | 21,306 | |
| Average interest rate during the year | | | 1.97 | % | | | .93 | % |
| Maximum month-end balance during the year | | $ | 132,500 | | | $ | 110,000 | |
| Weighted average interest rate at year-end | | | 1.07 | % | | | .44 | % |
The following table summarizes the contractual maturities and weighted average interest rates of FHLB advances at December 31, 2009.
| | | | | | Weighted | |
| | | | | | Average | |
| Contractual Maturity | | Amount | | | Rate | |
| | | (in thousands) | | | | | |
| Overnight | | $ | 97,500 | | | | 0.32 | % |
| | | | | | | | | |
| 2012 | | | 10,000 | | | | 2.24 | |
| 2014 | | | 25,000 | | | | 3.50 | |
| | | | 35,000 | | | | 3.14 | |
| | | $ | 132,500 | | | | 1.07 | % |
Other Borrowings. The Bank had no other borrowings at December 31, 2009 or 2008. In 2009 and 2008, the average balance of other borrowings amounted to $74,000 and $5,959,000, respectively, with average interest rates of .51% and 2.22%, respectively. The funds were borrowed predominantly at the Federal Reserve Bank discount window.
NOTE G – INCOME TAXES
The Corporation, the Bank, and the Bank’s subsidiaries with the exception of the REIT, file a consolidated federal income tax return. Income taxes charged to earnings in 2009, 2008, and 2007 had effective tax rates of 18.8%, 26.3%, and 20.1%, respectively. The following table sets forth a reconciliation of the statutory Federal income tax rate to the Corporation’s effective tax rate.
| | | Year Ended December 31, | |
| | | 2009 | | | 2008 | | | 2007 | |
| Statutory federal income tax rate | | | 34.0 | % | | | 34.0 | % | | | 34.0 | % |
| State and local income taxes, net of federal income tax benefit | | | 1.1 | | | | 5.5 | | | | 1.4 | |
| Tax-exempt income, net of disallowed cost of funding | | | (16.6 | ) | | | (12.6 | ) | | | (15.1 | ) |
| Other | | | 0.3 | | | | (0.6 | ) | | | (0.2 | ) |
| | | | 18.8 | % | | | 26.3 | % | | | 20.1 | % |
The increase in the effective tax rate in 2008 is the result of the Corporation losing the tax benefit derived from its REIT entity and tax-exempt income representing a smaller percentage of income before income taxes. The loss of the REIT tax benefit resulted from a change in New York State tax law effective January 1, 2008. In December 2008, the ownership of the REIT entity within the consolidated group was changed to once again obtain favorable tax treatment. This change, combined with an increase in tax-exempt income, caused the effective tax rate to decrease in 2009.
Provision for Income Taxes. The following table sets forth the components of the provision for income taxes.
| | | Year Ended December 31, | |
| | | 2009 | | | 2008 | | | 2007 | |
| Current: | | (in thousands) | |
| Federal | | $ | 2,852 | | | $ | 3,388 | | | $ | 2,607 | |
| State and local | | | 338 | | | | 1,469 | | | | 288 | |
| | | | 3,190 | | | | 4,857 | | | | 2,895 | |
| Deferred: | | | | | | | | | | | | |
| Federal | | | (16 | ) | | | (217 | ) | | | (9 | ) |
| State and local | | | (56 | ) | | | (12 | ) | | | 9 | |
| | | | (72 | ) | | | (229 | ) | | | - | |
| | | $ | 3,118 | | | $ | 4,628 | | | $ | 2,895 | |
Net Deferred Tax Asset or Liability. The following table sets forth the components of the Bank’s net deferred tax asset or liability.
| | | December 31, | |
| | | 2009 | | | 2008 | |
| Deferred tax assets: | | (in thousands) | |
| Allowance for loan losses | | $ | 3,830 | | | $ | 2,041 | |
| Pension obligation | | | - | | | | 1,193 | |
| Stock-based compensation | | | 693 | | | | 423 | |
| Supplemental executive retirement expense | | | 13 | | | | 23 | |
| Directors' retirement expense | | | 84 | | | | 87 | |
| Accrued rent expense | | | 79 | | | | 53 | |
| Other | | | 31 | | | | 21 | |
| | | | 4,730 | | | | 3,841 | |
| Valuation allowance | | | - | | | | - | |
| | | | 4,730 | | | | 3,841 | |
| Deferred tax liabilities: | | | | | | | | |
| Prepaid pension | | | 1,354 | | | | - | |
| Unrealized gains on available-for-sale securities | | | 4,607 | | | | 2,154 | |
| Depreciation | | | 517 | | | | 49 | |
| | | | 6,478 | | | | 2,203 | |
| Net deferred tax asset (liability) | | $ | (1,748 | ) | | $ | 1,638 | |
The Corporation had no unrecognized tax benefits as of December 31, 2009.
The Corporation is subject to U.S. federal income tax as well as New York State and New York City income taxes. The Corporation is subject to examination by taxing authorities for years after 2005 and did not incur any amounts for interest and penalties due taxing authorities for the years ended December 31, 2009, 2008 or 2007.
NOTE H – REGULATORY MATTERS
Minimum Regulatory Capital Requirements. The Corporation (on a consolidated basis) and the Bank are subject to various regulatory capital requirements administered by the federal banking agencies. Failure to meet minimum capital requirements can initiate certain mandatory and possibly additional discretionary actions by the regulators that, if undertaken, could have a direct material effect on the Corporation’s and Bank’s financial statements. Under capital adequacy guidelines and, with respect to the Bank, the regulatory framework for prompt corrective action, the Corporation and the Bank must meet specific capital guidelines that involve quantitative measures of th eir assets, liabilities, and certain off-balance-sheet items as calculated under regulatory accounting practices. The capital amounts and classification are also subject to qualitative judgments by the regulators about components, risk weightings, and other factors.
Quantitative measures established by regulation to ensure capital adequacy require the Corporation and the Bank to maintain minimum amounts and ratios of total and Tier 1 capital to risk weighted assets and Tier 1 capital to average assets. Tier 1 capital, risk weighted assets and average assets are as defined by regulation. The required minimums for the Corporation and Bank are set forth in the table that follows.
As of December 31, 2009, the most recent notification from the Federal Deposit Insurance Corporation categorized the Bank as well capitalized under the regulatory framework for prompt corrective action. To be categorized as well capitalized, an institution must maintain minimum total risk-based, Tier 1 risk-based, and Tier 1 leverage ratios as set forth in the table that follows. There are no conditions or events since the notification that management believes have changed the Bank’s category. The Corporation’s and the Bank’s actual capital amounts and ratios at December 31, 2009 and 2008 are also presented in the table.
| | | 2009 | |
| | | | | | | | | Minimum | | | Minimum To Be Well | |
| | | | | | | | | Capital | | | Capitalized Under Prompt | |
| | | Actual Capital | | | Requirement | | | Corrective Action Provisions | |
| | | (dollars in thousands) | |
| | | Amount | | | Ratio | | | Amount | | | Ratio | | | Amount | | | Ratio | |
| Total Capital to Risk Weighted Assets: | | | | | | | | | | | | | | | | | | |
| Consolidated | | $ | 122,272 | | | | 15.80 | % | | $ | 61,906 | | | | 8.00 | % | | | N/A | | | | N/A | |
| Bank | | | 120,372 | | | | 15.56 | | | | 61,892 | | | | 8.00 | | | $ | 77,365 | | | | 10.00 | % |
| Tier 1 Capital to Risk Weighted Assets: | | | | | | | | | | | | | | | | | | | | | | | | |
| Consolidated | | | 112,591 | | | | 14.55 | | | | 30,953 | | | | 4.00 | | | | N/A | | | | N/A | |
| Bank | | | 110,693 | | | | 14.31 | | | | 30,946 | | | | 4.00 | | | | 46,419 | | | | 6.00 | |
| Tier 1 Capital to Average Assets: | | | | | | | | | | | | | | | | | | | | | | | | |
| Consolidated | | | 112,591 | | | | 7.19 | | | | 62,670 | | | | 4.00 | | | | N/A | | | | N/A | |
| Bank | | | 110,693 | | | | 7.06 | | | | 62,703 | | | | 4.00 | | | | 78,378 | | | | 5.00 | |
| | | 2008 | |
| | | | | | | | | Minimum | | | Minimum To Be Well | |
| | | | | | | | | Capital | | | Capitalized Under Prompt | |
| | | Actual Capital | | | Requirement | | | Corrective Action Provisions | |
| | | (dollars in thousands) | |
| | | Amount | | | Ratio | | | Amount | | | Ratio | | | Amount | | | Ratio | |
| Total Capital to Risk Weighted Assets: | | | | | | | | | | | | | | | | | | |
| Consolidated | | $ | 109,990 | | | | 17.79 | % | | $ | 49,470 | | | | 8.00 | % | | | N/A | | | | N/A | |
| Bank | | | 106,748 | | | | 17.27 | | | | 49,435 | | | | 8.00 | | | $ | 61,794 | | | | 10.00 | % |
| Tier 1 Capital to Risk Weighted Assets: | | | | | | | | | | | | | | | | | | | | | | | | |
| Consolidated | | | 103,914 | | | | 16.80 | | | | 24,735 | | | | 4.00 | | | | N/A | | | | N/A | |
| Bank | | | 100,672 | | | | 16.29 | | | | 24,718 | | | | 4.00 | | | | 37,076 | | | | 6.00 | |
| Tier 1 Capital to Average Assets: | | | | | | | | | | | | | | | | | | | | | | | | |
| Consolidated | | | 103,914 | | | | 8.29 | | | | 50,144 | | | | 4.00 | | | | N/A | | | | N/A | |
| Bank | | | 100,672 | | | | 8.03 | | | | 50,127 | | | | 4.00 | | | | 62,659 | | | | 5.00 | |
Other Matters. The Corporation’s principal source of funds for dividend payments is dividends received from the Bank. Banking regulations limit the amount of dividends that may be paid by the Bank without prior approval of regulatory agencies. Under these regulations, the amount of dividends that the Bank may pay in any calendar year is limited to the current year’s net profits, combined with the retained net profits of the preceding two years, subject to the minimum capital requirements described above. During 2010, the Bank could, without prior approval, declare dividends of approximately $12,295,000 plus any 2010 net profits retained to the date of the dividend declaration.
Regulation D of the Board of Governors of The Federal Reserve System requires banks to maintain reserves against certain deposit balances. The Bank’s average reserve requirement for 2009 was approximately $6,802,000.
Under national banking laws and related statutes, the Bank is limited as to the amount it may loan to the Corporation, unless such loans are collateralized by specified obligations. At December 31, 2009, the maximum amount available for transfer from the Bank to the Corporation in the form of loans approximated $17,184,000.
NOTE I – SHAREHOLDER PROTECTION RIGHTS PLAN
On July 18, 2006, the Board of Directors of the Corporation (the “Board”) unanimously determined to renew the Corporation’s Shareholder Protection Rights Plan and declared a distribution of one right (“Right”) for each share of the Corporation’s common stock (the “Common Stock”) outstanding on August 1, 2006.
In the absence of an event of the type described below, the Rights will be evidenced by and trade with the Common Stock and will not be exercisable. However, the Rights will separate from the Common Stock and become exercisable following the earlier of (1) the tenth business day, or such later date as the Board may decide, after any person or persons (collectively referred to as “person”) commences a tender offer that would result in such person holding a total of 20% or more of the outstanding Common Stock, or (2) ten business days after, or such earlier or later date as the Board may decide, the announcement by the Corporation that any person has acquired 20% or more of the outstanding Common Stock.
When separated from the Common Stock, each Right will entitle the holder to purchase one share of Common Stock for $75 (the “Exercise Price”). However, in the event that the Corporation has announced that any person has acquired 20% or more of the outstanding Common Stock, the Rights owned by that person will be automatically void and each other Right will automatically become a right to buy, for the Exercise Price, that number of shares of Common Stock having a market value of twice the Exercise Price. Also, if any person acquires 20% or more of the outstanding Common Stock, the Board can require that, in lieu of exercise, each outstanding Right be exchanged for one share of Common Stock.
The Rights may be redeemed by action of the Board at a price of $.01 per Right at any time prior to announcement by the Corporation that any person has acquired 20% or more of the outstanding Common Stock. The Exercise Price and the number of Rights outstanding are subject to adjustment to prevent dilution. The Rights expire ten years from the date of their issuance.
NOTE J – STOCK-BASED COMPENSATION
The Corporation has two share-based compensation plans which are described below. The Corporation’s 2006 Stock Compensation Plan (the “2006 Plan”) was approved by its shareholders on April 18, 2006 as a successor to the 1996 Stock Option and Appreciation Rights Plan (the “1996 Plan”). The 2006 Plan permits the granting of stock options, stock appreciation rights, restricted stock, and restricted stock units (“RSUs”) to employees and non-employee directors for up to 600,000 shares of common stock of which 268,670 shares remain available for grant at December 31, 2009. The number of awards that can be granted under the 2006 Plan to any one person in any one fiscal year is limited to 70,000 shares. Under the terms of the 2006 Plan, stock options and sto ck appreciation rights can not have an exercise price that is less than 100% of the fair market value of one share of the underlying common stock on the date of grant. The term and/or vesting of awards made under the 2006 Plan will be determined from time to time in accordance with rules adopted by the Corporation’s Compensation Committee and be in compliance with the applicable provisions, if any, of the Internal Revenue Code. Thus far, the Compensation Committee has used a five year vesting period and a ten year term for stock options granted under the 2006 Plan and has made the ability to convert RSUs into shares of common stock and the related conversion ratio contingent upon the financial performance of the Corporation in the third year of the three calendar year period beginning in the year in which the RSUs were awarded. Notwithstanding anything to the contrary in any award agreement, awards under the 2006 Plan will become immediately exercisable or will im mediately vest, as the case may be, in the event of a change in control and, in accordance with the terms of the related award agreements, all awards granted to date under the 2006 Plan will become immediately exercisable or will immediately vest, as applicable, in the event of retirement, total and permanent disability, or death.
The Corporation’s 1996 Plan permitted the granting of stock options, with or without stock appreciation rights attached, and stand alone stock appreciation rights to employees and non-employee directors for up to 1,080,000 shares of common stock. The number of stock options and stock appreciation rights that could have been granted under the 1996 Plan to any one person in any one fiscal year was limited to 50,000. Each option granted under the 1996 Plan was granted at a price equal to the fair market value of one share of the Corporation’s stock on the date of grant. Options granted under the 1996 Plan on or before December 31, 2000 became exercisable in whole or in part commencing six months from the date of grant and ending ten years after the date of grant. Options granted und er the 1996 Plan in January 2005 became exercisable in whole or in part commencing ninety days from the date of grant and ending ten years after the date of grant. By the terms of their grant, all other options under the 1996 Plan were granted with a three year vesting period and a ten year expiration date.
Fair Value of Stock Option Awards. The grant date fair value of option awards is estimated on the date of grant using the Black-Scholes option pricing model. The fair values of awards made in 2009, 2008 and 2007, as well as the assumptions utilized in determining such values, are as follows:
| | | 2009 | | | 2008 | | | 2007 | |
| Grant date fair value | | $ | 7.79 | | | $ | 6.72 | | | $ | 6.05 | |
| Expected volatility | | | 47.08 | % | | | 45.42 | % | | | 25.24 | % |
| Expected dividends | | | 3.21 | % | | | 3.24 | % | | | 2.06 | % |
| Expected term (in years) | | | 6.82 | | | | 6.82 | | | | 6.70 | |
| Risk-free interest rate | | | 1.52 | % | | | 3.49 | % | | | 4.53 | % |
Expected volatility was based on historical volatility for the expected term of the options. The Corporation used historical data to estimate the expected term of options granted. The risk-free interest rate is the implied yield at the time of grant on U.S. Treasury zero-coupon issues with a remaining term equal to the expected term of the options.
Fair Value of Restricted Stock Units. The fair value of restricted stock units is based on the market price of the shares underlying the awards on the grant date, discounted for dividends which are not paid on restricted stock units.
Compensation Expense. Compensation expense for stock options is recognized ratably over the five-year vesting period or the period from the grant date to the participant’s eligible retirement date, whichever is shorter. Compensation expense for RSUs is recognized over the three-year performance period and adjusted periodically throughout the period to reflect the estimated number of shares of the Corporation’s common stock into which the RSUs will ultimately be convertible. However, if the period between the grant date and the grantee’s eligible retirement date is less than three years, compensation expense is recognized ratably over this shorter period. In determining compensation expense for options and RSUs outstanding and not yet vested, the Corporation assumes, based on prior experience, that no forfeitures will occur. The Corporation recorded compensation expense for share-based payments of $681,000, $450,000 and $506,000 in 2009, 2008 and 2007, respectively, and related income tax benefits of $270,000, $178,000 and $200,000, respectively.
Stock Option Activity. On January 20, 2009, the Corporation’s Board of Directors granted 66,427 nonqualified stock options under the 2006 Plan. The options were granted at a price equal to the fair market value of one share of the Corporation’s stock on the date of grant.
A summary of options outstanding under the Corporation’s stock compensation plans as of December 31, 2009 and changes during the year then ended is presented below.
| | | | | | | Weighted- | | | | |
| | | | Weighted- | | | Average | | | Aggregate | |
| | | | Average | | | Remaining | | | Intrinsic | |
| | Number of | | Exercise | | | Contractual | | | Value | |
| | Options | | Price | | | Term (yrs.) | | | (in thousands) | |
| Outstanding at January 1, 2009 | | | 500,282 | | | $ | 19.04 | | | | | | | | | |
| Granted | | | 66,427 | | | | 22.42 | | | | | | | | | |
| Exercised | | | (55,752 | ) | | | 16.16 | | | | | | | | | |
| Forfeited or expired | | | (14,238 | ) | | | 22.83 | | | | | | | | | |
| Outstanding at December 31, 2009 | | | 496,719 | | | $ | 19.71 | | | | 5.63 | | | $ | 2,751 | |
| Exercisable at December 31, 2009 | | | 317,839 | | | $ | 19.08 | | | | 4.30 | | | $ | 1,960 | |
The total intrinsic value of options exercised in 2009, 2008, and 2007 was $556,000, $232,000 and $371,000, respectively.
Restricted Stock Activity. On January 20, 2009, the Corporation’s Board of Directors granted 20,960 RSUs under the 2006 Plan. The Corporation’s financial performance for 2011 will determine the number of shares of common stock, if any, into which the RSUs will ultimately be converted. In the table that follows, the number of RSUs granted represents the maximum number of shares into which the RSUs can be converted. A summary of the status of the Corporation’s nonvested shares as of December 31, 2009 and changes during the year then ended is presented below.
| | | | | | Weighted- | |
| | | | | | Average | |
| | | Number of | | | Grant-Date | |
| | | Shares | | | Fair Value | |
| Nonvested at January 1, 2009 | | | 46,070 | | | $ | 19.10 | |
| Granted | | | 20,960 | | | | 20.28 | |
| Vested | | | (13,997 | ) | | | 21.06 | |
| Forfeited | | | (10,673 | ) | | | 21.06 | |
| Nonvested at December 31, 2009 | | | 42,360 | | | $ | 18.49 | |
The total fair value of RSUs vested during the years ended December 31, 2009 and 2008 was $343,000 and $26,000, respectively. No RSUs vested during the year ended December 31, 2007.
Unrecognized Compensation Cost. As of December 31, 2009, there was $1,196,000 of total unrecognized compensation cost related to nonvested equity awards. The cost is expected to be recognized over a weighted-average period of 1.41 years.
Cash Received and Tax Benefits Realized. Cash received from option exercises in 2009, 2008 and 2007 was $901,000, $525,000 and $694,000, respectively. The actual tax benefit realized for the tax deductions from option exercises in 2009, 2008 and 2007 was $66,000, $21,000 and $76,000, respectively.
Other. No cash was used to settle stock options in 2009 or 2008. The Corporation uses newly issued shares to settle stock option exercises and currently plans to use newly issued shares upon the conversion of restricted stock units.
NOTE K – RETIREMENT PLANS
The Bank has a 401(k) plan, defined benefit pension plan and supplemental executive retirement plan. Employees are immediately eligible to participate in the 401(k) plan provided they are at least 18 years of age. Participants may elect to contribute, on a tax-deferred basis, up to 100% of gross compensation, as defined, subject to the limitations of Section 401(k) of the Internal Revenue Code. The Bank may, at its sole discretion, make matching contributions to each participant's account based on the amount of the participant's tax deferred contributions. Participants are fully vested in their elective contributions and, after five years of participation in the 401(k) plan, are fully vested (20% vesting per year) in the matching contributions, if any, made by the Bank. Matching contributions were $325,000, $291,000 and $279,000 for 2009, 2008 and 2007, respectively.
The provisions of the Bank’s defined benefit pension plan (the “Pension Plan” or the “Plan”) are governed by the rules and regulations contained in the Prototype Plan of the New York State Bankers Retirement System (the “Retirement System”) and the Retirement System Adoption Agreement executed by the Bank. The Retirement System is overseen by a Board of Trustees (the “Trustees”) who meet quarterly and, among other things, set the investment policy guidelines. For investment purposes, the Pension Plan’s contributions are pooled with the contributions of the other participants in the Retirement System. Assets of the Pension Plan are invested in various debt and equity securities as set forth in thi s note under the captions “Plan Assets” and “Fair Value of Plan Assets.” Employees are eligible to participate in the Pension Plan after attaining 21 years of age and completing 12 full months of service. Pension benefits are generally based on a percentage of average annual compensation during the period of creditable service. The Bank makes annual contributions to the Pension Plan in an amount sufficient to fund these benefits and participants contribute 2% of their compensation. The Bank’s funding method, the unit credit actuarial cost method, is consistent with the funding requirements of federal law and regulations. Employees become fully vested after four years of participation in the Pension Plan (no vesting occurs during the four-year period).
Significant Actuarial Assumptions. The following tables set forth the significant actuarial assumptions used to determine the benefit obligations at year-end 2009, 2008 and 2007 and the benefit cost for each of the Plan years then ended.
| Weighted average assumptions used to determine the benefit obligation at year end | | 2009 | | 2008 | | 2007 |
| Discount rate | | 5.89% | | 6.00% | | 5.75% |
| Rate of increase in compensation levels | | 3.50% | | 3.50% | | 5.00% |
| | | | | | | |
| Weighted average assumptions used to determine net pension cost | 2009 | | 2008 | | 2007 |
| Discount rate | | 6.00% | | 5.75% | | 5.75% |
| Rate of increase in compensation levels | | 3.50% | | 5.00% | | 5.00% |
| Expected long-term rate of return on plan assets | | 7.50% | | 7.00% | | 7.00% |
Funded Status of The Plan. The following table sets forth the change in the projected benefit obligation and Plan assets for each Plan year and, as of the end of each Plan year, the funded status of the Plan and accumulated benefit obligation.
| | | 2009 | | | 2008 | | | 2007 | |
| Change in projected benefit obligation | | (in thousands) | |
| Projected benefit obligation at beginning of year | | $ | 18,744 | | | $ | 16,139 | | | $ | 14,727 | |
| Service cost before plan participant contributions | | | 1,284 | | | | 1,551 | | | | 1,053 | |
| Expenses | | | (139 | ) | | | (183 | ) | | | (146 | ) |
| Interest cost | | | 1,103 | | | | 1,137 | | | | 829 | |
| Benefits paid | | | (646 | ) | | | (794 | ) | | | (503 | ) |
| Assumption changes | | | 277 | | | | 428 | | | | - | |
| Experience loss (gain) and other | | | (18 | ) | | | 466 | | | | 179 | |
| Projected benefit obligation at end of year | | | 20,605 | | | | 18,744 | | | | 16,139 | |
| | | | | | | | | | | | | |
| Change in plan assets | | | | | | | | | | | | |
| Fair value of plan assets at beginning of year | | | 16,030 | | | | 19,864 | | | | 16,772 | |
| Actual return on plan assets | | | 3,352 | | | | (5,567 | ) | | | 2,558 | |
| Employer contributions | | | 5,500 | | | | 2,427 | | | | 1,000 | |
| Plan participant contributions | | | 210 | | | | 283 | | | | 183 | |
| Benefits paid | | | (646 | ) | | | (794 | ) | | | (503 | ) |
| Expenses | | | (139 | ) | | | (183 | ) | | | (146 | ) |
| Fair value of plan assets at end of year | | | 24,307 | | | | 16,030 | | | | 19,864 | |
| | | | | | | | | | | | | |
| Funded status at end of year | | $ | 3,702 | | | $ | (2,714 | ) | | $ | 3,725 | |
| | | | | | | | | | | | | |
| Accumulated Benefit Obligation | | $ | 18,417 | | | $ | 16,404 | | | $ | 12,944 | |
The 2007 information in the above table is as of and for the twelve month period ended September 30, 2007. The information presented for 2008 is as of and for the fifteen month period ended December 31, 2008.
For the Plan year ending September 30, 2010, the Bank has no minimum required pension contribution and a maximum tax deductible contribution of $3,742,000. The Bank expects to make a contribution within that range by September 30, 2010, but the amount of such contribution has not yet been determined.
The net actuarial loss and prior service cost included in accumulated other comprehensive income as of December 31 are as follows:
| | | 2009 | | | 2008 | |
| | | (in thousands) | |
| Net actuarial loss | | $ | (5,443 | ) | | $ | (7,953 | ) |
| Prior service cost | | | (109 | ) | | | (132 | ) |
| | | $ | (5,552 | ) | | $ | (8,085 | ) |
Plan Assets. The Retirement System's overall investment strategy is to have approximately 97% of its investments for long-term growth and 3% for near-term benefit payments, with a wide diversification of asset types, fund strategies, and fund managers. The target allocations for Plan assets are shown in the table that follows.
The weighted average expected long term rate of return is estimated based on current trends in the Plan assets as well as expected future rates of returns on those assets. The following methodologies were used in determining the long term rate of return:
| | · | Equity securities - dividend discount model, the smoothed earnings yield model and the equity risk premium model. |
| | · | Fixed income securities - current yield-to-maturity and forecasts of future yields. |
| | · | Other financial instruments – applying judgment to a comparison of the specific investment’s risk to that of fixed income and equity instruments. |
The long-term rate of return considers historical returns and adjusts them to reflect future expectations. Such adjustments are based on, among other things, forecasts by economists of long-term inflation and GDP growth, earnings growth and per capita income.
The Plan is currently prohibited from investing in the following instruments:
| | · | Equity securities – securities in emerging market countries as defined by the Morgan Stanley Emerging Markets Index, short sales, unregistered securities and margin purchases. |
| | · | Fixed income securities – securities of BBB quality or less, CMOs that have an inverse floating rate and whose payments don’t include principal or which aren’t certified or guaranteed by the U.S. Government, asset backed securities that aren’t issued or guaranteed by the U.S. or its agencies or instrumentalities, non-agency residential subprime or alt-A mortgage-backed securities and structured notes. |
| | · | Other financial instruments – unhedged currency exposure in countries not defined as “high income economies” by the World Bank. |
The following table sets forth the Plan asset allocations at December 31, 2009 and 2008 versus the target allocations and the expected long-term rate of return by asset category.
| | | Target | | | Percentage of Plan Assets at December 31, | | | Range of Weighted Average Expected Long-term | |
| | | Allocation | | | 2009 | | | 2008 | | | Rates of Return | |
| Cash equivalents | | 0 - 20% | | | | 13.6 | % | | | 10.0 | % | | 0 -.15% | |
| Equity securities | | 40 - 60 | | | | 45.9 | | | | 48.0 | | | 4% - 6% | |
| Fixed income securities | | 40 - 60 | | | | 40.5 | | | | 41.4 | | | 2% - 3% | |
| Other financial instruments | | 0 - 5 | | | | - | | | | 0.6 | | | - | |
| | | | | | | | 100.0 | % | | | 100.0 | % | | 7% - 8% | |
Fair Value of Plan Assets. The fair value of the Plan assets at December 31, 2009, by asset category, is as follows:
| | | | | | Fair Value Measurements at December 31, 2009 Using: | |
| | | Total | | | Quoted Prices in Active Markets for Identical Assets (Level 1) | | | Significant Other Observable Inputs (Level 2) | | | Significant Unobservable Inputs (Level 3) | |
| | | (in thousands) | |
| Cash equivalents: | | | | | | | | | | | | |
| Short term investment funds | | $ | 3,295 | | | $ | - | | | $ | 3,295 | | | $ | - | |
| Equities: | | | | | | | | | | | | | | | | |
| Common stock | | | 10,878 | | | | 10,878 | | | | - | | | | - | |
| Depository receipts | | | 152 | | | | 152 | | | | - | | | | - | |
| Other equities | | | 121 | | | | 121 | | | | - | | | | - | |
| | | | 11,151 | | | | 11,151 | | | | - | | | | - | |
| Fixed income securities: | | | | | | | | | | | | | | | | |
| Government securities | | | 4,049 | | | | - | | | | 4,049 | | | | - | |
| Securities backed by mortgages | | | 3,358 | | | | - | | | | 3,358 | | | | - | |
| Corporate bonds | | | 2,318 | | | | - | | | | 2,318 | | | | - | |
| Other fixed income securities | | | 136 | | | | - | | | | 136 | | | | - | |
| | | | 9,861 | | | | - | | | | 9,861 | | | | - | |
| | | $ | 24,307 | | | $ | 11,151 | | | $ | 13,156 | | | $ | - | |
The definition of Level 1, 2 and 3 fair value measurements is included in Note N to these consolidated financial statements.
At December 31, 2009, the Plan’s short term investment funds were invested in the State Street Bank & Trust Company Short Term Investment Fund. This represented approximately 13.6% of the Plan’s investments.
The following table sets forth a reconciliation of all Plan assets measured at fair value using Level 3 inputs for the year ended December 31, 2009.
| | | Plan Assets | |
| | | (in thousands) | |
| Balance of Level 3 assets at January 1, 2009 | | $ | 96 | |
| Actual return on plan assets: | | | | |
| Relating to assets still held at reporting date | | | - | |
| Relating to assets sold during the period | | | (3 | ) |
| Purchases, sales and settlements | | | (93 | ) |
| Transfers in and/or out of Level 3 | | | - | |
| Balance of Level 3 assets at December 31, 2009 | | $ | - | |
Net Pension Cost. The following table sets forth the components of net periodic pension cost.
| | | 2009 | | | 2008 | | | 2007 | |
| | | (in thousands) | |
| Service cost, net of plan participant contributions | | $ | 1,074 | | | $ | 1,014 | | | $ | 870 | |
| Interest cost | | | 1,103 | | | | 910 | | | | 829 | |
| Expected return on plan assets | | | (1,218 | ) | | | (1,368 | ) | | | (1,159 | ) |
| Amortization of prior service cost | | | 23 | | | | 20 | | | | 20 | |
| Amortization of net actuarial loss | | | 635 | | | | - | | | | - | |
| Net pension cost | | $ | 1,617 | | | $ | 576 | | | $ | 560 | |
The estimated prior service costs and net actuarial loss for the defined benefit pension plan that will be amortized from accumulated other comprehensive income into net periodic benefit cost in 2010 are $23,000 and $322,000, respectively.
Estimated Future Benefit Payments. The following benefit payments, which reflect expected future service as appropriate, are expected to be made by the Plan.
| Year | | Amount | |
| | | (in thousands) | |
| 2010 | | $ | 831 | |
| 2011 | | | 918 | |
| 2012 | | | 1,032 | |
| 2013 | | | 1,166 | |
| 2014 | | | 1,319 | |
| 2015-2019 | | | 8,606 | |
The Bank’s Supplemental Executive Retirement Plan (“SERP”) currently covers the Bank’s CEO. The benefit under the SERP is equal to the additional amount that the CEO would be entitled to under the Pension and 401(k) plans in the absence of Internal Revenue Code limitations. SERP expense was $74,000, $150,000 and $72,000 in 2009, 2008 and 2007, respectively.
NOTE L – OTHER OPERATING EXPENSES
Expenses included in other operating expenses which exceed one percent of the aggregate of total interest income and noninterest income in one or more of the years shown are as follows:
| | | 2009 | | | 2008 | | | 2007 | |
| | | (in thousands) | |
| | | | | | | | | | |
| FDIC assessment | | $ | 2,188 | | | $ | 558 | | | $ | 100 | |
| Computer services | | | 1,507 | | | | 1,229 | | | | 1,171 | |
NOTE M – COMMITMENTS AND CONTINGENT LIABILITIES
Financial Instruments With Off-Balance-Sheet Risk. The Bank is a party to financial instruments with off-balance-sheet risk in the normal course of business to meet the financing needs of its customers. These financial instruments include commitments to extend credit, standby letters of credit, and commercial letters of credit. These instruments involve, to varying degrees, elements of credit risk in excess of the amount recognized in the consolidated balance sheets.
The Bank's exposure to credit loss in the event of nonperformance by the other party to financial instruments for commitments to extend credit, standby letters of credit, and commercial letters of credit is represented by the contractual notional amount of these instruments. The Bank uses the same credit policies in making commitments to extend credit and generally uses the same credit policies for letters of credit as it does for on-balance-sheet instruments. At December 31, financial instruments whose contract amounts represent credit risk are as follows:
| | | 2009 | | | 2008 | |
| | | Fixed | | | Variable | | | Fixed | | | Variable | |
| | | Rate | | | Rate | | | Rate | | | Rate | |
| | | (in thousands) | |
| | | | | | | | | | | | | |
| Commitments to extend credit | | $ | 22,638 | | | $ | 95,634 | | | $ | 5,348 | | | $ | 111,305 | |
| Standby letters of credit | | | 3,023 | | | | - | | | | 3,641 | | | | - | |
| Commercial letters of credit | | | 435 | | | | - | | | | - | | | | - | |
Commitments to extend credit are legally binding agreements to lend to a customer as long as there is no violation of any condition established in the contract. Unused home equity lines comprise a substantial portion of the Bank’s variable rate loan commitments. Since some of the commitments to extend credit are expected to expire without being drawn upon and, with respect to unused home equity lines, can be frozen, reduced or terminated by the Bank based on the financial condition of the borrower, the total commitment amounts do not necessarily represent future cash requirements. Home equity lines generally expire ten years from their date of origination, other real estate loan commitments generally expire within 60 days and commercial loan commitments generally expire within one year. � 0;At December 31, 2009, the Bank’s fixed rate loan commitments are to make loans with interest rates ranging from 4.24% to 5.50% and maturities ranging from 9 years to 30 years. The amount of collateral obtained, if any, by the Bank upon extension of credit is based on management’s credit evaluation of the borrower. Collateral held varies but may include mortgages on commercial and residential real estate, security interests in business assets, deposit accounts with the Bank or other financial institutions, and securities.
Standby letters of credit are conditional commitments issued by the Bank to assure the performance or financial obligations of a customer to a third party. The Bank's standby letters of credit extend through February 2011. The credit risk involved in issuing standby letters of credit is essentially the same as that involved in extending loans to customers. The Bank generally holds collateral and/or obtains personal guarantees supporting these commitments. The extent of collateral held for these commitments at December 31, 2009 varied from 0% to 100% and averaged 81%. Standby letters of credit are considered financial guarantees and are recorded at fair value.
Commercial letters of credit are conditional commitments issued by the Bank to assure the payment by a customer to a supplier. The credit risk involved in issuing commercial letters of credit is the same as that discussed in the preceding paragraph for standby letters of credit. The Bank generally holds collateral and/or obtains personal guarantees supporting these commitments. Collateral held for these commitments at December 31, 2009 averaged 34%. The commercial letters of credit outstanding at December 31, 2009 extend through March 2010.
Concentrations of Credit Risk. Most of the Bank’s loans, personal and commercial, are to borrowers who are domiciled on Long Island and in New York City, and most of the Bank's real estate loans involve mortgages on Long Island and New York City properties. In addition, the Bank’s loan portfolio includes a significant concentration of multifamily loans that amounted to approximately $185 million at December 31, 2009. As a result, the income of many of the Bank’s borrowers and the value of and cash flows from collateral securing a majority of the Bank’s mortgage loans is largely dependent on the Long Island and New York City economies.
Lease Commitments. At December 31, 2009, minimum annual rental commitments under noncancelable operating leases are as follows:
| Year | | Amount | |
| | | (in thousands) | |
| 2010 | | $ | 1,364 | |
| 2011 | | | 1,324 | |
| 2012 | | | 1,293 | |
| 2013 | | | 940 | |
| 2014 | | | 746 | |
| Thereafter | | | 4,102 | |
| | | $ | 9,769 | |
The Bank has various renewal options on the above leases. Rent expense, including amounts paid for real estate taxes and common area maintenance, was $1,307,000, $1,204,000 and $1,006,000 in 2009, 2008 and 2007, respectively.
Employment Contracts. Currently, all of the Bank’s executive officers have employment contracts with the Corporation under which they are entitled to severance compensation in the event of an involuntary termination of employment or resignation of employment following a change in control. The terms of these contracts currently range from one to three years and, unless the Corporation gives written notice of non-extension within the time frames set forth in the contracts, are automatically extended at the expiration of each year for an additional period of one year, thus resulting in new terms of between one and three years. The current aggregate annual salaries prov ided for in these contracts is approximately $1,692,500.
NOTE N – FAIR VALUE OF FINANCIAL INSTRUMENTS
Financial Instruments Recorded at Fair Value. When measuring fair value, the Corporation uses a fair value hierarchy which is designed to maximize the use of observable inputs and minimize the use of unobservable inputs. The hierarchy involves three levels of inputs that may be used to measure fair value:
Level 1: Quoted prices (unadjusted) in active markets for identical assets or liabilities that the Corporation has the ability to access at the measurement date.
Level 2: Significant other observable inputs other than Level 1 prices such as quoted prices for similar assets or liabilities in active markets; quoted prices for identical or similar assets or liabilities in markets that are not active; or inputs other than quoted prices that are observable or can be corroborated by observable market data.
Level 3: Significant unobservable inputs that reflect the Corporation’s own assumptions about the assumptions that market participants would use in pricing an asset or liability.
The fair values of the Corporation’s investment securities designated as available-for-sale are currently determined on a recurring basis using matrix pricing (Level 2 inputs). Matrix pricing, which is a mathematical technique widely used in the industry to value debt securities, does not rely exclusively on quoted prices for the specific securities but rather on the relationship of such securities to other benchmark quoted securities.
The fair values of the Corporation’s available-for-sale securities are summarized below.
| | | | | Fair Value Measurements at December 31, 2009 Using: | |
| | | | | | Quoted Prices | | | Significant | | | | |
| | | | | | in Active | | | Other | | | Significant | |
| | | | | | Markets for | | | Observable | | | Unobservable | |
| | | | | | Identical Assets | | | Inputs | | | Inputs | |
| | | Total | | | (Level 1) | | | (Level 2) | | | (Level 3) | |
| | | (in thousands) | |
| Available-for-Sale Securities: | | | | | | | | | | | | |
| U.S. government agencies | | $ | 5,008 | | | $ | - | | | $ | 5,008 | | | $ | - | |
| State and municipals | | | 154,513 | | | | - | | | | 154,513 | | | | - | |
| Pass-through mortgage securities | | | 126,422 | | | | - | | | | 126,422 | | | | - | |
| Collateralized mortgage obligations | | | 352,851 | | | | - | | | | 352,851 | | | | - | |
| | | $ | 638,794 | | | $ | - | | | $ | 638,794 | | | $ | - | |
| | | | | Fair Value Measurements at December 31, 2008 Using: | |
| | | | | | Quoted Prices | | | Significant | | | |
| | | | | | in Active | | | Other | | Significant | |
| | | | | | Markets for | | | Observable | | Unobservable | |
| | | | | | Identical Assets | | | Inputs | | Inputs | |
| | | Total | | | (Level 1) | | | (Level 2) | | (Level 3) | |
| | | (in thousands) | |
| Available-for-Sale Securities: | | | | | | | | | | | | |
| U.S. government agencies | | $ | 33,685 | | | $ | - | | | $ | 33,685 | | | $ | - | |
| State and municipals | | | 76,641 | | | | - | | | | 76,641 | | | | - | |
| Pass-through mortgage securities | | | 124,770 | | | | - | | | | 124,770 | | | | - | |
| Collateralized mortgage obligations | | | 143,677 | | | | - | | | | 143,677 | | | | - | |
| | | $ | 378,773 | | | $ | - | | | $ | 378,773 | | | $ | - | |
From time to time, the fair values of some of the Corporation’s impaired loans with specific allocations of the allowance for loan losses are determined using real estate appraisals. These appraisals may utilize a single valuation approach or a combination of approaches including comparable sales and the income approach. Adjustments are sometimes made in the appraisal process by the appraisers to adjust for differences between the comparable sales and income data available.
The Corporation’s impaired loans recorded at fair value are summarized below.
| | | | | Fair Value Measurements Using: | |
| | | Total | | | Quoted Prices in Active Markets for Identical Assets (Level 1) | | | Significant Other Observable Inputs (Level 2) | | | Significant Unobservable Inputs (Level 3) | |
| | | (in thousands) | |
| Impaired loans: | | | | | | | | | | | | |
| December 31, 2009 | | $ | - | | | $ | - | | | $ | - | | | $ | - | |
| December 31, 2008 | | | 900 | | | | - | | | | 900 | | | | - | |
Impaired loans measured at fair value at December 31, 2008 had a carrying amount of $1,000,000 and a related valuation allowance of $100,000. The valuation allowance was established in 2008 through a provision for loan losses charged against income.
Financial Instruments Not Recorded at Fair Value. Fair value estimates are made at a specific point in time. Such estimates are generally subjective in nature and dependent upon a number of significant assumptions associated with each financial instrument or group of similar financial instruments, including estimates of discount rates, risks associated with specific financial instruments, estimates of future cash flows, and relevant available market information. Changes in assumptions could significantly affect the estimates. In addition, fair value estimates do not reflect the value of anticipated future business, premiums or discounts that could result from offering for sale at one time the Corporation’s enti re holdings of a particular financial instrument, or the tax consequences of realizing gains or losses on the sale of financial instruments. The following table sets forth the carrying amounts and estimated fair values of financial instruments that are not recorded at fair value in the Corporation’s financial statements at December 31, 2009 and 2008.
| | | 2009 | | | 2008 | |
| | | Carrying/ | | | | | | Carrying/ | | | | |
| | | Contract | | | | | | Contract | | | | |
| | | Amount | | | Fair Value | | | Amount | | | Fair Value | |
| | | (in thousands) | |
| Financial Assets: | | | | | | | | | | | | |
| Cash and cash equivalents | | $ | 33,342 | | | $ | 33,342 | | | $ | 21,438 | | | $ | 21,438 | |
| Held-to-maturity securities | | | 128,979 | | | | 133,233 | | | | 169,480 | | | | 172,640 | |
| Loans | | | 817,320 | | | | 814,465 | | | | 651,158 | | | | 654,293 | |
| Federal Home Loan Bank stock | | | 7,882 | | | | 7,882 | | | | 6,199 | | | | 6,199 | |
| Restricted stocks (included in other assets) | | | 467 | | | | 467 | | | | 467 | | | | 467 | |
| Accrued interest receivable | | | 7,584 | | | | 7,584 | | | | 6,156 | | | | 6,156 | |
| | | | | | | | | | | | | | | | | |
| Financial Liabilities: | | | | | | | | | | | | | | | | |
| Checking deposits | | | 333,853 | | | | 333,853 | | | | 324,138 | | | | 324,138 | |
| Savings and money market deposits | | | 634,913 | | | | 634,913 | | | | 384,047 | | | | 384,047 | |
| Time deposits | | | 308,784 | | | | 315,073 | | | | 192,152 | | | | 193,330 | |
| Short-term borrowings | | | 111,407 | | | | 111,407 | | | | 124,122 | | | | 124,122 | |
| Long-term debt | | | 162,000 | | | | 173,981 | | | | 127,000 | | | | 142,224 | |
| Accrued interest payable | | | 2,019 | | | | 2,019 | | | | 1,051 | | | | 1,051 | |
The following methods and assumptions are used by the Corporation in measuring the fair value of financial instruments disclosed in the preceding table.
Cash and cash equivalents. The recorded book value of cash and cash equivalents is their fair value.
Investment securities. Fair values are based on quoted prices for similar assets in active markets or derived principally from observable market data.
Loans. Fair values are estimated for portfolios of loans with similar financial characteristics. The total loan portfolio is first divided into adjustable and fixed rate interest terms. For adjustable rate loans that are subject to immediate repricing, the recorded book value less the related allowance for loan losses is a reasonable estimate of fair value. For adjustable rate loans that are subject to repricing over time and fixed rate loans, fair value is calculated by discounting anticipated future repricing amounts or cash flows using discount rates equivalent to the rates at which the Bank would currently make loans which are similar with regard to collateral, maturity, and the type of borrower. The discounted value of the repricing amounts and cash flows is reduced by the related allowance for loan losses to arrive at an estimate of fair value.
Federal Home Loan Bank stock. The recorded book value of Federal Home Loan Bank stock is its fair value because Federal Home Loan Bank of New York stock is redeemable at cost.
Deposit liabilities. The fair value of deposits with no stated maturity, such as checking deposits, money market deposits, and savings deposits, is equal to their recorded book value. The fair value of time deposits is based on the discounted value of contractual cash flows. The discount rate is equivalent to the rate currently offered by the Bank for deposits of similar size, type and maturity.
Borrowed funds. For short-term borrowings maturing within ninety days, the recorded book value is a reasonable estimate of fair value. The fair value of long-term debt, including repurchase agreements with embedded derivative instruments, is based on quoted prices for similar instruments in active markets or the discounted value of contractual cash flows. The discount rate is equivalent to the rate currently charged for borrowings of similar type and maturity.
Accrued interest receivable and payable. For these short-term instruments, the recorded book value is a reasonable estimate of fair value.
Off-balance-sheet Items. The fair value of off-balance sheet items is not considered to be material.
NOTE O – PARENT COMPANY FINANCIAL INFORMATION
Condensed financial information for The First of Long Island Corporation (parent company only) is as follows:
| CONDENSED BALANCE SHEETS | | December 31, | |
| | | 2009 | | | 2008 | |
| Assets: | | (in thousands) | |
| Cash and due from banks | | $ | 2,484 | | | $ | 3,975 | |
| Investment in subsidiary bank, at equity | | | 114,563 | | | | 99,290 | |
| Prepaid income taxes | | | 163 | | | | 137 | |
| Deferred income tax benefits | | | 693 | | | | 423 | |
| Other assets | | | 2 | | | | 2 | |
| | | $ | 117,905 | | | $ | 103,827 | |
| Liabilities: | | | | | | | | |
| Cash dividends payable | | $ | 1,443 | | | $ | 1,295 | |
| | | | | | | | | |
| Stockholders' equity: | | | | | | | | |
| Common stock | | | 721 | | | | 719 | |
| Surplus | | | 2,043 | | | | 1,354 | |
| Retained earnings | | | 110,047 | | | | 102,061 | |
| | | | 112,811 | | | | 104,134 | |
| Accumulated other comprehensive income (loss) net of tax | | | 3,651 | | | | (1,602 | ) |
| | | | 116,462 | | | | 102,532 | |
| | | $ | 117,905 | | | $ | 103,827 | |
| CONDENSED STATEMENTS OF INCOME | | Year ended December 31, | |
| | | 2009 | | | 2008 | | | 2007 | |
| Income: | | (in thousands) | |
| Dividends from subsidiary bank | | $ | 4,000 | | | $ | 11,100 | | | $ | 8,300 | |
| Interest on deposits with subsidiary bank | | | 26 | | | | 43 | | | | 118 | |
| Other | | | - | | | | 1 | | | | 5 | |
| | | | 4,026 | | | | 11,144 | | | | 8,423 | |
| Expenses: | | | | | | | | | | | | |
| Salaries | | | 681 | | | | 450 | | | | 506 | |
| Other operating expenses | | | 269 | | | | 278 | | | | 303 | |
| | | | 950 | | | | 728 | | | | 809 | |
| | | | | | | | | | | | | |
| Income before income taxes | | | 3,076 | | | | 10,416 | | | | 7,614 | |
| Income tax benefit | | | (367 | ) | | | (272 | ) | | | (271 | ) |
| Income before undistributed earnings of subsidiary bank | | | 3,443 | | | | 10,688 | | | | 7,885 | |
| Equity in undistributed earnings | | | 10,020 | | | | 2,274 | | | | 3,597 | |
| Net income | | $ | 13,463 | | | $ | 12,962 | | | $ | 11,482 | |
| CONDENSED STATEMENTS OF CASH FLOWS | | Year ended December 31, | |
| | | 2009 | | | 2008 | | | 2007 | |
| Cash Flows From Operating Activities: | | (in thousands) | |
| Net income | | $ | 13,463 | | | $ | 12,962 | | | $ | 11,482 | |
| Adjustments to reconcile net income to net cash provided by operating activities: | | | | | | | | | | | | |
| Undistributed earnings of subsidiary bank | | | (10,020 | ) | | | (2,274 | ) | | | (3,597 | ) |
| Deferred income tax credit | | | (270 | ) | | | (168 | ) | | | (187 | ) |
| Stock-based compensation expense | | | 681 | | | | 450 | | | | 506 | |
| Decrease (increase) in prepaid income taxes | | | (26 | ) | | | 23 | | | | (61 | ) |
| Increase in other assets | | | - | | | | - | | | | (2 | ) |
| Net cash provided by operating activities | | | 3,828 | | | | 10,993 | | | | 8,141 | |
| | | | | | | | | | | | | |
| Cash Flows From Financing Activities: | | | | | | | | | | | | |
| Repurchase and retirement of common stock | | | (957 | ) | | | (5,764 | ) | | | (3,719 | ) |
| Proceeds from exercise of stock options | | | 901 | | | | 525 | | | | 694 | |
| Tax benefit of stock options | | | 66 | | | | 21 | | | | 76 | |
| Cash dividends paid | | | (5,329 | ) | | | (4,575 | ) | | | (5,342 | ) |
| Net cash used in financing activities | | | (5,319 | ) | | | (9,793 | ) | | | (8,291 | ) |
| Net increase (decrease) in cash and cash equivalents* | | | (1,491 | ) | | | 1,200 | | | | (150 | ) |
| Cash and cash equivalents, beginning of year | | | 3,975 | | | | 2,775 | | | | 2,925 | |
| Cash and cash equivalents, end of year | | $ | 2,484 | | | $ | 3,975 | | | $ | 2,775 | |
| | | | | | | | | | | | | |
| Supplemental Schedule of Noncash Financing Activities: | | | | | | | | | | | | |
| Cash dividends payable | | $ | 1,443 | | | $ | 1,295 | | | $ | 1,125 | |
*Cash and cash equivalents is defined as cash and due from banks and includes the checking and money market accounts with the Corporation’s wholly-owned bank subsidiary.
NOTE P – QUARTERLY FINANCIAL DATA (Unaudited)
| | | First | | | Second | | | Third | | | Fourth | | | | |
| | | Quarter | | | Quarter | | | Quarter | | | Quarter | | | Total | |
| 2009 | | (in thousands, except per share data) | |
| Interest income | | $ | 15,522 | | | $ | 15,752 | | | $ | 16,995 | | | $ | 18,005 | | | $ | 66,274 | |
| Interest expense | | | 3,931 | | | | 4,731 | | | | 4,743 | | | | 4,929 | | | | 18,334 | |
| Net interest income | | | 11,591 | | | | 11,021 | | | | 12,252 | | | | 13,076 | | | | 47,940 | |
| Provision for loan losses (credit) | | | (168 | ) | | | 274 | | | | 530 | | | | 3,649 | | | | 4,285 | |
| Noninterest income before net securities gains | | | 1,576 | | | | 1,575 | | | | 1,561 | | | | 1,626 | | | | 6,338 | |
| Net gains on sales of securities | | | - | | | | 947 | | | | 317 | | | | 164 | | | | 1,428 | |
| Noninterest expense | | | 8,259 | | | | 8,948 | | | | 8,528 | | | | 9,105 | | | | 34,840 | |
| Income before income taxes | | | 5,076 | | | | 4,321 | | | | 5,072 | | | | 2,112 | | | | 16,581 | |
| Income taxes | | | 1,148 | | | | 913 | | | | 1,167 | | | | (110 | ) | | | 3,118 | |
| Net income | | | 3,928 | | | | 3,408 | | | | 3,905 | | | | 2,222 | | | | 13,463 | |
| Earnings per share: | | | | | | | | | | | | | | | | | | | | |
| Basic | | | .55 | | | | .47 | | | | .54 | | | | .31 | | | | 1.87 | |
| Diluted | | | .54 | | | | .47 | | | | .53 | | | | .30 | | | | 1.84 | |
| Comprehensive income (loss) | | | 6,197 | | | | 1,695 | | | | 11,199 | | | | (375 | ) | | | 18,716 | |
| | | | | | | | | | | | | | | | | | | | | |
| 2008 | | | | | | | | | | | | | | | | | | | | |
| Interest income | | $ | 14,161 | | | $ | 14,662 | | | $ | 15,061 | | | $ | 15,802 | | | $ | 59,686 | |
| Interest expense | | | 4,584 | | | | 4,107 | | | | 4,016 | | | | 4,036 | | | | 16,743 | |
| Net interest income | | | 9,577 | | | | 10,555 | | | | 11,045 | | | | 11,766 | | | | 42,943 | |
| Provision for loan losses | | | 164 | | | | 261 | | | | 462 | | | | 1,058 | | | | 1,945 | |
| Noninterest income before net securities gains | | | 1,437 | | | | 1,503 | | | | 1,563 | | | | 1,530 | | | | 6,033 | |
| Net gains on sales of securities | | | 91 | | | | 9 | | | | 109 | | | | 39 | | | | 248 | |
| Noninterest expense | | | 7,336 | | | | 7,263 | | | | 7,237 | | | | 7,853 | | | | 29,689 | |
| Income before income taxes | | | 3,605 | | | | 4,543 | | | | 5,018 | | | | 4,424 | | | | 17,590 | |
| Income taxes | | | 748 | | | | 1,236 | | | | 1,450 | | | | 1,194 | | | | 4,628 | |
| Net income | | | 2,857 | | | | 3,307 | | | | 3,568 | | | | 3,230 | | | | 12,962 | |
| Earnings per share: | | | | | | | | | | | | | | | | | | | | |
| Basic | | | .39 | | | | .46 | | | | .50 | | | | .45 | | | | 1.79 | |
| Diluted | | | .39 | | | | .45 | | | | .49 | | | | .44 | | | | 1.78 | |
| Comprehensive income | | | 3,775 | | | | 37 | | | | 4,539 | | | | 1,310 | | | | 9,661 | |
REPORT OF INDEPENDENT REGISTERED PUBLIC ACCOUNTING FIRM
The First of Long Island Corporation
Glen Head, New York
We have audited the accompanying consolidated balance sheets of The First of Long Island Corporation as of December 31, 2009 and 2008, and the related statements of income, changes in stockholders' equity, and cash flows for each of the years in the three-year period ended December 31, 2009. We also have audited The First of Long Island Corporation’s internal control over financial reporting as of December 31, 2009, based on criteria established in Internal Control – Integrated Framework issued by the Committee of Sponsoring Organizations of the Treadway Commission (COSO). The First of Long Island Corporation’s management is responsible for these financial statements, for maintaining effective internal control over financial reporting, and for its assessment of the effectiveness of internal contr ol over financial reporting, included in the accompanying Management’s Report on Internal Control over Financial Reporting. Our responsibility is to express an opinion on these consolidated financial statements and an opinion on the company's internal control over financial reporting based on our audits.
We conducted our audits in accordance with the standards of the Public Company Accounting Oversight Board (United States). Those standards require that we plan and perform the audits to obtain reasonable assurance about whether the consolidated financial statements are free of material misstatement and whether effective internal control over financial reporting was maintained in all material respects. Our audits of the consolidated financial statements included examining, on a test basis, evidence supporting the amounts and disclosures in the consolidated financial statements, assessing the accounting principles used and significant estimates made by management, and evaluating the overall financial statement presentation. Our audit of internal control over financial reporting included obtaining an understanding of internal control over financial reporting, assessing the risk that a material weakness exists, and testing and evaluating the design and operating effectiveness of internal control based on the assessed risk. Our audits also included performing such other procedures as we considered necessary in the circumstances. We believe that our audits provide a reasonable basis for our opinions.
A company's internal control over financial reporting is a process designed to provide reasonable assurance regarding the reliability of financial reporting and the preparation of financial statements for external purposes in accordance with generally accepted accounting principles. A company's internal control over financial reporting includes those policies and procedures that (1) pertain to the maintenance of records that, in reasonable detail, accurately and fairly reflect the transactions and dispositions of the assets of the company; (2) provide reasonable assurance that transactions are recorded as necessary to permit preparation of financial statements in accordance with generally accepted accounting principles, and that receipts and expenditures of the company are being made only in accordance with authorizations of management and directors of the company; and (3) provide reasonable assurance regarding prevention or timely detection of unauthorized acquisition, use, or disposition of the company's assets that could have a material effect on the consolidated financial statements.
Because of its inherent limitations, internal control over financial reporting may not prevent or detect misstatements. In addition, projections of any evaluation of effectiveness to future periods are subject to the risk that controls may become inadequate because of changes in conditions, or that the degree of compliance with the policies or procedures may deteriorate.
In our opinion, the consolidated financial statements referred to above present fairly, in all material respects, the financial position of The First of Long Island Corporation as of December 31, 2009 and 2008, and the results of its operations and its cash flows for each of the years in the three-year period ended December 31, 2009, in conformity with accounting principles generally accepted in the United States of America. Also in our opinion, The First of Long Island Corporation maintained, in all material respects, effective internal control over financial reporting as of December 31, 2008, based on criteria established in Internal Control – Integrated Framework issued by the Committee of Sponsoring Organizations of the Treadway Commission (COSO).
| | /s/Crowe Horwath LLP |
| | Crowe Horwath LLP |
Livingston, New Jersey
March 16, 2010
[PHOTO OMITTED]
Officers & Official Staff
Officers - The First of Long Island Corporation
Michael N. Vittorio
President & Chief Executive Officer
Sallyanne K. Ballweg
Senior Vice President & Secretary
Mark D. Curtis
Senior Vice President & Treasurer
John Grasso
Senior Vice President
Brian J. Keeney
Senior Vice President
Richard Kick
Senior Vice President
Donald L. Manfredonia
Senior Vice President
Wayne B. Drake
Assistant Treasurer
Kitty W. Craig
Chief Auditor
Official Staff - The First National Bank of Long Island
ADMINISTRATION
Michael N. Vittorio
President & Chief Executive Officer
Sallyanne K. Ballweg
Senior Executive Vice President
AUDITING
Kitty W. Craig
Vice President and Chief Auditor
BRANCH ADMINISTRATION
John Grasso
Executive Vice President
Richard P. Perro
Senior Vice President
Linda Cutter
Vice President
Albert T. Ghelarducci
Vice President
COMMERCIAL BANKING
James P. Johnis
Senior Vice President
NASSAU COUNTY REGIONAL OFFICE
(COMMERCIAL BANKING)
Albert Arena
Vice President
Robert F. Eisen
Vice President
Dante D. Mancini
Vice President
Jane F. Reed
Vice President
SUFFOLK COUNTY REGIONAL OFFICE
(COMMERCIAL BANKING)
Margaret M. Curran-Rusch
Vice President
Stephen Durso
Vice President
Richard B. Smith
Vice President
NEW YORK CITY REGIONAL OFFICE
(COMMERCIAL BANKING)
Alessandro Scichilone
Vice President
PERSONAL BANKERS
(COMMERCIAL BANKING)
Janine Chaisty
Vice President
Patricia A. DeMasi
Vice President
COMMERCIAL LENDING
Donald L. Manfredonia
Executive Vice President
Paul J. Daley
Senior Vice President
John G. Fitzpatrick
Vice President
Ivan G. Nunez
Vice President
John J. Reilly
Vice President
Kevin J. Talty
Vice President
COMPLIANCE AND PROCEDURES
Louis A. Antoniello
Vice President
CREDIT DEPARTMENT
Anne Marie Stefanucci
Vice President
DATA PROCESSING
Jose Diaz
Vice President
DEPOSIT OPERATIONS
Carmela Lalonde
Assistant Cashier
FINANCE
Mark D. Curtis
Executive Vice President
Wayne B. Drake
Senior Vice President
Howard F. Hoeberlein
Senior Vice President
Matthew J. Mankowski
Vice President
GENERAL SERVICES
Daniel Sapanara
Vice President
HUMAN RESOURCES
Susan J. Hempton
Vice President
INFORMATION TECHNOLOGY SERVICES
Conrad Lissade
Vice President
INVESTMENT MANAGEMENT DIVISION
Brian J. Keeney
Executive Vice President
Josephine Buckley
Vice President
Jane Carmody
Vice President
Sharon E. Pazienza
Vice President
LOAN CENTER
Robert B. Jacobs
Vice President
MARKETING
Laura C. Ierulli
Vice President
OPERATIONS ADMINISTRATION
Richard Kick
Executive Vice President
Betsy Gustafson
Senior Vice President
RESIDENTIAL MORTGAGE
Frederick T. Hughes
Vice President
COUNSEL
Schupbach, Williams & Pavone LLP
INDEPENDENT REGISTERED PUBLIC ACCOUNTING FIRM
Crowe Horwath LLP
ANNUAL REPORT ON FORM 10-K
A copy of the Corporation’s annual report on Form 10-K for 2009, filed with the Securities and Exchange Commission, may be obtained without charge upon written request to Mark D. Curtis, Senior Vice President and Treasurer, The First of Long Island Corporation, 10 Glen Head Road, PO Box 67, Glen Head, New York 11545-0067.
EXECUTIVE OFFICE
The First of Long Island Corporation
10 Glen Head Road
Glen Head, New York 11545
(516) 671-4900
www.fnbli.com
TRANSFER AGENT AND REGISTRAR
Registrar and Transfer Company
10 Commerce Drive
Cranford, New Jersey 07016-3572
(800) 368-5948
www.rtco.com
ANNUAL MEETING NOTICE
The Annual Meeting of Stockholders will be held at The Carltun, Eisenhower Park, East Meadow, N.Y. on Tuesday, April 20, 2010 at 3:30 P.M.
Business Advisory Board
[PHOTO OMITTED]
Joseph R. Albanese, Esq.
Managing Partner
Albanese & Albanese LLP
[PHOTO OMITTED]
Howard Annenberg
President & CEO
Shannen Promotions, Inc.
[PHOTO OMITTED]
Nicola Arena
Chairman & CEO
Mediterranean Shipping Co. (USA), Inc.
[PHOTO OMITTED]
Richard Arote Sr.
President
A.D.E. Systems, Inc./Air Distribution Enterprises, Inc.
[PHOTO OMITTED]
Beverly J. Bell, Esq.
Humes & Wagner, LLP
[PHOTO OMITTED]
Thomas Burke
Chief Executive Officer
Ophthalmic Consultants of Long Island
[PHOTO OMITTED]
Emil V. Cianciulli, Esq.
Partner
Cianciulli, Meng & Panos, P.C.
[PHOTO OMITTED]
Michael DeVivo
President
MRZ Trucking Corporation
[PHOTO OMITTED]
Bernard Esquenet
Chief Executive Officer
The Ruhof Corp.
[PHOTO OMITTED]
Robert Giambalvo, CPA
President
Giambalvo, Giammarese & Stalzer, CPAs, P.C.
[PHOTO OMITTED]
Kevin J. Harding, Esq.
Partner
Harding and Harding
[PHOTO OMITTED]
Herbert Kotler, Esq.
[PHOTO OMITTED]
Melvin F. Lazar, CPA
Founder
Lazar Levine & Felix LLP
[PHOTO OMITTED]
Wallace Leinheardt, Esq.
Jaspan Schlesinger LLP
[PHOTO OMITTED]
Linda Levy, CPA
Tax Consultant
[PHOTO OMITTED]
James Lynch, Esq.
[PHOTO OMITTED]
John I. Martinelli
Principal
Owen Petersen & Co., LLP
[PHOTO OMITTED]
Susan Hirschfeld Mohr
President
J. W. Hirschfeld Agency, Inc.
[PHOTO OMITTED]
James Panos, Esq.
Partner
Cianciulli, Meng & Panos, P.C.
[PHOTO OMITTED]
John G. Passarelli, M.D., F.A.A.O.
Medical Director
Long Island Eye Surgery Center
Long Island Eye Surgical Care, P.C.
[PHOTO OMITTED]
Jay Pitti
President
Merrick House & Gardens
[PHOTO OMITTED]
Melvin Schreiber, CPA
Moses & Schreiber
[PHOTO OMITTED]
Arthur C. Schupbach, Esq.
Partner
Schupbach, Williams & Pavone, LLP
[PHOTO OMITTED]
Frank Shahery
Director of Marketing
Convermat Corporation
[PHOTO OMITTED]
Lloyd Straus
President & COO
North American Partners in Anesthesia, LLP
[PHOTO OMITTED]
H. Craig Treiber
Chairman & CEO
Treiber Insurance Group
[PHOTO OMITTED]
Sal Turano
President
Abstracts Incorporated
[PHOTO OMITTED]
Arthur Ventura
President
Badge Agency, Inc.
[PHOTO OMITTED]
George J. Walsh, Esq.
Thompson Hine LLP
[PHOTO OMITTED]
Robert A. Wilkie, Esq.
Wilkie & Wilkie
[PHOTO OMITTED]
Mark Wurzel
President
Calico Cottage, Inc.
Business of the Corporation
The First of Long Island Corporation (“Corporation”) is a one-bank holding company organized under the laws of the State of New York. Its primary business is the operation of its sole subsidiary, The First National Bank of Long Island (“Bank”).
The Bank was organized in 1927 under national banking laws and became the sole subsidiary of the Corporation under a plan of reorganization effected April 30, 1984.
The Bank is a full-service commercial bank which provides a broad range of financial services to individual, professional, corporate, institutional and government customers through its thirty-one branch system on Long Island and in Manhattan.
The First of Long Island Agency, Inc. was organized in 1994 under the laws of the State of New York, as a subsidiary of the Bank to conduct business as a licensed insurance agency engaged in the sale of mutual funds and insurance, primarily fixed annuity products.
The Bank is subject to regulation and supervision of the Federal Reserve Board, the Comptroller of the Currency, and the Federal Deposit Insurance Corporation which also insures its deposits. The Comptroller of the Currency is the primary banking agency responsible for regulating the subsidiary Bank. In addition, the Corporation is subject to the regulations and supervision of the Federal Reserve Board and the Securities and Exchange Commission.
The First National Bank of Long Island
“Where Everyone Knows Your Name ™”
Long Island (516) 671-4900
Manhattan (212) 566-1500
www.fnbli.com
67