The investment securities purchased with borrowed funds had a higher overall yield than the Bank’s existing securities portfolio. This is the primary reason that the yield on the Bank’s taxable securities portfolio increased by 20 basis points when comparing 2008 to 2007.
Although net interest spread increased by 28 basis points in 2008, net interest margin declined by 11 basis points. The decline in net interest margin occurred largely because the margin on the borrowing and investing strategy is less than the margin on the balance of the Bank’s interest-earning assets and interest-bearing liabilities. In addition, the return on noninterest-bearing checking balances and capital decreased due to the lower yield on interest-earning assets. Excluding the borrowing and investing strategy, net interest margin for 2008 would have increased versus 2007 and the increase in net interest spread would have been greater.
Competition for deposits in the Bank’s market area could continue to exert downward pressure on net interest margin and net interest spread. Furthermore, new branch openings should cause the Bank’s overall cost of deposits to trend upward because new branches will have a competitively priced deposit base rather than a base consisting of a mix of historically and competitively priced deposits as found in the Bank’s established branches. The “Market Risk” section of this discussion and analysis of financial condition and results of operations includes a more complete discussion of the impact of interest rate movements on the Bank’s net interest income.
Net interest income on a tax-equivalent basis increased by $744,000, or from $39,292,000 in 2006 to $40,036,000 in 2007. The most significant reason for the growth in net interest income was that management used proceeds from the maturity and paydown of taxable securities to fund loan growth and thereby moved money from a lower to a higher yielding asset category. In 2007, average total loan balances grew by $61.4 million, or 14.7%, and represented 50.8% of average interest earning assets compared to 45.3% in 2006.
In 2007, the yield on interest-earning assets increased by 31 basis points. Important reasons for the increase were the shift from securities to loans, the purchase of securities at yields better than those currently in portfolio, and the better yields realized on securities purchased as part of the portfolio restructuring conducted late in 2006. The higher overall yield on interest-earning assets resulted in an increase in net interest income on those interest-earning assets funded by checking deposits and capital, since checking deposits and capital have no associated interest cost. Although checking balances decreased by approximately $3.2 million when comparing year-end 2007 to year-end 2006, on an average balance basis checking deposits were up by $6.2 million, or 1.9%, in 2007 versus 2006. Although competition in the Bank’s market area and higher interest rates have caused the rate of growth in checking deposits to trend down in recent years, a significant portion of the Bank’s interest-earning assets continues to be funded by such deposits.
As a partial offset to the increase in net interest income realized on interest-earning assets funded by checking deposits and capital, the Bank’s net interest spread declined by 21 basis points in 2007 thus causing a decrease in net interest income on those interest-earning assets funded by interest-bearing liabilities. Net interest spread declined in the presence of a yield curve characterized by short-term interest rates that were approximately the same or higher than intermediate and longer-term interest rates. This negatively impacted the Bank’s net interest spread because short-term interest rates are a key driver of the Bank’s deposit rates and intermediate and longer-term interest rates are key drivers of the yields that can be earned by the Bank on loans and securities. Net interest spread was also negatively impacted by increased competition for loans and deposits in the Bank’s market area which put upward pressure on deposit pricing, downward pressure on loan pricing and made core deposit growth challenging. With upward pressure on deposit pricing, funds migrated from the Bank’s lower yielding savings and money market products to its higher priced savings and money market products and competitively priced time deposits. This accounts for the downward trend in savings and money market balances and upward trend in time deposits experienced in recent years.
Noninterest income includes service charges on deposit accounts, Investment Management Division income, gains or losses on sales of securities, and all other items of income, other than interest, resulting from the business activities of the Corporation. Noninterest income increased by $699,000, or 12.5%, from $5,582,000 in 2007 to $6,281,000 in 2008. The increase is principally due to a $482,000 increase in net gains on sales of available-for-sale securities, a $198,000 increase in other noninterest income and a $102,000 increase in service charge income. The increase in other noninterest income is primarily attributable to small increases in miscellaneous consumer fees. Service charge income increased as a result of an increase in maintenance and activity charges.
Excluding net losses on sales of securities, noninterest income decreased by $117,000, or 2.0%, from $5,933,000 in 2006 to $5,816,000 in 2007. The decrease is primarily due to a decrease in service charge income of $179,000 largely caused by reductions in maintenance and activity and returned check charges.
Noninterest expense is comprised of salaries, employee benefits, occupancy and equipment expense and other operating expenses incurred in supporting the various business activities of the Corporation. Noninterest expense was $29,689,000 and $27,384,000 in 2008 and 2007, respectively, representing increases over prior year amounts of $2,305,000, or 8.4%, and $717,000, or 2.7%.
The increase in noninterest expense for 2008 is comprised of increases in other operating expenses of $730,000, or 13.7%, employee benefits expense of $608,000, or 15.2%, occupancy and equipment expense of $567,000, or 12.8%, and salaries of $400,000, or 2.9%. The increase in other operating expenses is largely attributable to a $458,000 increase in FDIC deposit insurance expense. Based on the FDIC’s base assessment rates for 2009 and a recently adopted emergency special assessment of 20 basis points on deposits as of June 30, 2009, the Bank currently estimates that its FDIC insurance expense will increase by approximately $2,800,000 in 2009. The increase in employee benefits expense is largely the result of an increase in retirement plan expense. Based primarily on the poor performance of the equity markets in 2008, pension expense will increase by approximately $1,025,000 in 2009. Occupancy and equipment expense increased primarily due to branch openings and branch expansion. The increase in salaries expense is due to normal annual salary adjustments, additions to staff related to branch expansion, and severance payments, as largely offset by staff reductions accomplished through attrition.
The increase in noninterest expense for 2007 is largely comprised of an increase in salaries of $1,074,000, or 8.5%, and an increase in occupancy and equipment expense of $379,000, or 9.4%, as partially offset by a decrease in employee benefits of $695,000, or 14.8%. In addition to normal salary adjustments, the increase in salaries expense principally resulted from an increase in lending and business development staff, staffing for new branches, and an increase in stock-based compensation expense. A significant reason for the increase in stock-based compensation expense is additional equity awards in 2007 as well as the timing and terms of such equity awards. The increase in occupancy and equipment expense is largely attributable to the opening of the Smithtown branch in the fourth quarter of 2006 and investments in new technology. Significant reasons for the decrease in employee benefits expense are the discontinuation of profit sharing contributions beginning in 2007 and a reduction in the number of SERP plan participants in 2007.
Income tax expense as a percentage of book income (“effective tax rate”) was 26.3% in 2008, 20.1% in 2007 and 19.9% in 2006. Despite state income taxes, the benefit of tax-exempt income causes the effective tax rate to be considerably lower than the statutory Federal income tax rate of 34%. The increase in the effective tax rate in 2008 is the result of the Corporation losing the tax benefit derived from its REIT entity and tax-exempt income now representing a smaller percentage of income before income taxes. The loss of the REIT tax benefit resulted from a change in New York State tax law effective January 1, 2008. In December 2008, the ownership of the REIT entity within the consolidated group was changed to once again obtain favorable tax treatment. This change, combined with the implementation of other tax planning strategies, should reduce 2009 taxes by approximately $800,000.
Application of Critical Accounting Policies
In preparing the consolidated financial statements, management is required to make estimates and assumptions that affect the reported asset and liability balances and revenue and expense amounts. Our determination of the allowance for loan losses is a critical accounting estimate because it is based on our subjective evaluation of a variety of factors at a specific point in time and involves difficult and complex judgments about matters that are inherently uncertain. In the event that management’s estimate needs to be adjusted based on, among other things, additional information that comes to light after the estimate is made or changes in circumstances, such adjustment could result in the need for a significantly different allowance for loan losses and thereby materially impact, either positively or negatively, the Bank’s results of operations.
The Bank’s Reserve Committee, which is chaired by the Senior Lending Officer, meets on a quarterly basis and is responsible for determining the allowance for loan losses after considering, among other things, the results of credit reviews performed by the Bank’s loan review officers. In addition, and in consultation with the Bank’s Chief Financial Officer, the Reserve Committee is responsible for implementing and maintaining policies and procedures surrounding the calculation of the required allowance. The Bank’s allowance for loan losses is subject to periodic examination by the Office of the Comptroller of the Currency, the Bank’s primary federal banking regulator, whose safety and soundness examination includes a determination as to its adequacy to absorb probable incurred losses.
The first step in determining the allowance for loan losses is to identify loans in the Bank’s portfolio that are individually deemed to be impaired. In doing so, subjective judgments need to be made regarding whether or not it is
35
probable that a borrower will be unable to pay all principal and interest due according to contractual terms. Once a loan is identified as being impaired, management uses the fair value of the underlying collateral and/or the discounted value of expected future cash flows to determine the amount of the impairment loss, if any, that needs to be included in the overall allowance for loan losses. In estimating the fair value of real estate collateral, management utilizes appraisals and also makes qualitative judgments based on, among other things, its knowledge of the local real estate market and analyses of current economic conditions. Estimating the fair value of collateral other than real estate is also subjective in nature and sometimes requires difficult and complex judgments. Determining expected future cash flows can be more subjective than determining fair values. Expected future cash flows could differ significantly, both in timing and amount, from the cash flows actually received over the loan’s remaining life.
In addition to estimating losses for loans individually deemed to be impaired, management also estimates collective impairment losses for pools of loans that are not specifically reviewed. Statistical information regarding the Bank’s historical loss experience over a period of time is the starting point in making such estimates. However, future losses could vary significantly from those experienced in the past and accordingly management periodically adjusts its historical loss experience to reflect current conditions. In doing so, management considers a variety of general qualitative factors and then subjectively determines the weight to assign to each in estimating losses. The factors include, among others, national and local economic conditions, environmental risks, trends in volume and terms of loans, concentrations of credit, changes in lending policies and procedures, and experience, ability, and depth of the Bank’s lending staff. Because of the nature of the factors and the difficulty in assessing their impact, management’s resulting estimate of losses may not accurately reflect actual losses in the portfolio.
Although the allowance for loan losses has two separate components, one for impairment losses on individual loans and one for collective impairment losses on pools of loans, the entire allowance for loan losses is available to absorb realized losses as they occur whether they relate to individual loans or pools of loans.
Asset Quality
The Corporation has identified certain assets as risk elements. These assets include nonaccruing loans, foreclosed real estate, loans that are contractually past due 90 days or more as to principal or interest payments and still accruing and troubled debt restructurings. These assets present more than the normal risk that the Corporation will be unable to eventually collect or realize their full carrying value. Information about the Corporation’s risk elements is as follows:
| | | | | | | | | | | | | | | | |
| | December 31, | |
| |
| |
| | 2008 | | 2007 | | 2006 | | 2005 | | 2004 | |
| |
| |
| |
| |
| |
| |
| | (dollars in thousands) | |
Nonaccrual loans | | $ | 112 | | $ | 257 | | $ | 135 | | $ | 151 | | $ | — | |
Loans past due 90 days or more and still accruing | | | 42 | | | 95 | | | 50 | | | — | | | 18 | |
Foreclosed real estate | | | — | | | — | | | — | | | — | | | — | |
| |
|
| |
|
| |
|
| |
|
| |
|
| |
Total nonperforming assets | | | 154 | | | 352 | | | 185 | | | 151 | | | 18 | |
Troubled debt restructurings | | | — | | | — | | | — | | | — | | | — | |
| |
|
| |
|
| |
|
| |
|
| |
|
| |
Total risk elements | | $ | 154 | | $ | 352 | | $ | 185 | | $ | 151 | | $ | 18 | |
| |
|
| |
|
| |
|
| |
|
| |
|
| |
| | | | | | | | | | | | | | | | |
Nonaccrual loans as a percentage of total loans | | | .02 | % | | .05 | % | | .03 | % | | .04 | % | | .00 | % |
| |
|
| |
|
| |
|
| |
|
| |
|
| |
Nonperforming assets as a percentage of total loans and foreclosed real estate | | | .02 | % | | .07 | % | | .04 | % | | .04 | % | | .01 | % |
| |
|
| |
|
| |
|
| |
|
| |
|
| |
Risk elements as a percentage of total loans and foreclosed real estate | | | .02 | % | | .07 | % | | .04 | % | | .04 | % | | .01 | % |
| |
|
| |
|
| |
|
| |
|
| |
|
| |
| | | | | | | | | | | | | | | | |
| | Year Ended December 31, | |
| |
| |
| | 2008 | | 2007 | | 2006 | | 2005 | | 2004 | |
| |
| |
| |
| |
| |
| |
| | (in thousands) | |
Gross interest income on nonaccrual loans: | | | | | | | | | | | | | | | | |
Amount that would have been recorded during the year under original terms | | $ | 10 | | $ | 13 | | $ | 12 | | $ | 9 | | $ | — | |
| | | | | | | | | | | | | | | | |
Actual amount recorded during the year | | | — | | | 10 | | | — | | | 4 | | | — | |
| | | | | | | | | | | | | | | | |
Commitments for additional funds - - Nonaccrual, restructured, past due loans | | | None | | | None | | | None | | | None | | | None | |
36
Allowance and Provision for Loan Losses
The allowance for loan losses grew by $1,623,000 during 2008, amounting to $6,076,000, or .92% of total loans, at December 31, 2008 as compared to $4,453,000, or .85% of total loans, at December 31, 2007. During 2008, the Bank had loan chargeoffs and recoveries of $325,000 and $3,000, respectively, and recorded a $1,945,000 provision for loan losses. The provision for loan losses increased by $1,370,000 in 2008 primarily because of more loan growth in 2008, a $275,000 chargeoff on one commercial loan, the establishment of a $200,000 impairment reserve on another commercial loan, and a deterioration in local economic conditions. The chargeoff and establishment of the impairment reserve occurred in the fourth quarter.
The allowance for loan losses is an amount that management currently believes will be adequate to absorb probable incurred losses in the Bank’s loan portfolio. In determining the allowance for loan losses, there is not an exact amount but rather a range for what constitutes an appropriate allowance. As more fully discussed in the “Application of Critical Accounting Policies” section of this discussion and analysis of financial condition and results of operations, the process for estimating credit losses and determining the allowance for loan losses as of any balance sheet date is subjective in nature and requires material estimates. Actual results could differ significantly from those estimates.
The following table sets forth changes in the Bank’s allowance for loan losses.
| | | | | | | | | | | | | | | | |
| | Year ended December 31, | |
| |
| |
| | 2008 | | 2007 | | 2006 | | 2005 | | 2004 | |
| |
| |
| |
| |
| |
| |
| | (dollars in thousands) | |
| | | |
Balance, beginning of year | | $ | 4,453 | | $ | 3,891 | | $ | 3,282 | | $ | 2,808 | | $ | 2,452 | |
| |
|
| |
|
| |
|
| |
|
| |
|
| |
Loans charged off: | | | | | | | | | | | | | | | | |
Commercial and industrial | | | 275 | | | — | | | 65 | | | — | | | 12 | |
Other | | | 50 | | | 14 | | | 11 | | | 25 | | | 33 | |
| |
|
| |
|
| |
|
| |
|
| |
|
| |
| | | 325 | | | 14 | | | 76 | | | 25 | | | 45 | |
| |
|
| |
|
| |
|
| |
|
| |
|
| |
Recoveries of loans charged off: | | | | | | | | | | | | | | | | |
Commercial and industrial | | | — | | | — | | | — | | | — | | | 7 | |
Other | | | 3 | | | 1 | | | 15 | | | 29 | | | 38 | |
| |
|
| |
|
| |
|
| |
|
| |
|
| |
| | | 3 | | | 1 | | | 15 | | | 29 | | | 45 | |
| |
|
| |
|
| |
|
| |
|
| |
|
| |
Net (chargeoffs) recoveries | | | (322 | ) | | (13 | ) | | (61 | ) | | 4 | | | — | |
Provision for loan losses | | | 1,945 | | | 575 | | | 670 | | | 470 | | | 356 | |
| |
|
| |
|
| |
|
| |
|
| |
|
| |
Balance, end of year | | $ | 6,076 | | $ | 4,453 | | $ | 3,891 | | $ | 3,282 | | $ | 2,808 | |
| |
|
| |
|
| |
|
| |
|
| |
|
| |
Ratio of net chargeoffs or recoveries to average loans outstanding | | | .06 | % | | .00 | % | | .01 | % | | .00 | % | | .00 | % |
| |
|
| |
|
| |
|
| |
|
| |
|
| |
The following table sets forth the allocation of the Bank’s total allowance for loan losses by loan type.
| | | | | | | | | | | | | | | | | | | | | | | | | | | | | | | |
| | December 31, | |
| |
| |
| | 2008 | | 2007 | | 2006 | | 2005 | | 2004 | |
| |
| |
| |
| |
| |
| |
| | Amount | | % of
Loans
To Total
Loans | | Amount | | % of
Loans
To Total
Loans | | Amount | | % of
Loans
To Total
Loans | | Amount | | % of
Loans
To Total
Loans | | Amount | | % of
Loans
To Total
Loans | |
| |
| |
| |
| |
| |
| |
| |
| |
| |
| |
| |
| | (dollars in thousands) | |
| | | | | | | | | | | | | | | | | | | | | | | | | | | | | | | |
Commercial and industrial | | $ | 933 | | 8.1 | % | | $ | 874 | | 11.7 | % | | $ | 833 | | 12.3 | % | | $ | 827 | | 12.4 | % | | $ | 789 | | 15.1 | % | |
Commercial mortgages | | | 3,011 | | 41.5 | | | | 1,785 | | 32.3 | | | | 1,464 | | 30.7 | | | | 1,095 | | 28.3 | | | | 865 | | 25.9 | | |
Residential mortgages | | | 1,227 | | 32.9 | | | | 1,026 | | 37.1 | | | | 914 | | 38.7 | | | | 843 | | 42.0 | | | | 790 | | 44.0 | | |
Home equity loans | | | 706 | | 15.5 | | | | 551 | | 15.8 | | | | 497 | | 14.9 | | | | 348 | | 14.0 | | | | 226 | | 12.0 | | |
Construction loans | | | 100 | | 1.4 | | | | 116 | | 2.2 | | | | 89 | | 2.2 | | | | 71 | | 1.9 | | | | 45 | | 1.4 | | |
Other | | | 99 | | .6 | | | | 101 | | .9 | | | | 94 | | 1.2 | | | | 98 | | 1.4 | | | | 93 | | 1.6 | | |
| |
|
| |
| | |
|
| |
| | |
|
| |
| | |
|
| |
| | |
|
| |
| | |
| | $ | 6,076 | | 100.0 | % | | $ | 4,453 | | 100.0 | % | | $ | 3,891 | | 100.0 | % | | $ | 3,282 | | 100.0 | % | | $ | 2,808 | | 100.0 | % | |
| |
|
| |
| | |
|
| |
| | |
|
| |
| | |
|
| |
| | |
|
| |
| | |
The amount of future chargeoffs and provisions for loan losses will be affected by, among other things, economic conditions on Long Island and in New York City. Such conditions could affect the financial strength of the Bank’s borrowers and will affect the value of real estate collateral securing the Bank’s mortgage loans. Loans secured by real estate represent approximately 91% of the Bank’s total loans outstanding at December 31, 2008. Most of these loans were made to borrowers domiciled on Long Island and in New York City. Although local economic conditions had been good
37
and real estate values had grown considerably over a number of years, over the last year or so residential real estate values on Long Island declined and economic conditions deteriorated. The decline and deterioration could continue, and commercial real estate values could also decline. This could cause some of the Bank’s borrowers to be unable to make the required contractual payments on their loans and the Bank to be unable to realize the full carrying value of such loans through foreclosure. However, management believes that the Bank’s underwriting policies are relatively conservative and, as a result, the Bank should be less affected than the overall market.
Future provisions and chargeoffs could also be affected by environmental impairment of properties securing the Bank’s mortgage loans. At the present time, management is not aware of any environmental pollution originating on or near properties securing the Bank’s loans that would materially affect the carrying value of such loans.
Off-Balance Sheet Arrangements and Contractual Obligations
The Corporation’s off-balance sheet arrangements and contractual obligations at December 31, 2008 are summarized in the table that follows. The amounts shown for commitments to extend credit and letters of credit are contingent obligations, some of which are expected to expire without being drawn upon. As a result, the amounts shown for these items do not necessarily represent future cash requirements. The amounts shown for securities sold under repurchase agreements are based on the contractual maturities of such agreements and include scheduled principal and interest payments. The interest payments do not reflect any offset that the Bank could get from interest rate caps embedded in the agreements. Some of these repurchase agreements can be terminated by the purchaser prior to contractual maturity (see Note F to the Corporation’s 2008 consolidated financial statements for more detailed disclosures regarding repurchase agreements). The Corporation believes that its current sources of liquidity are more than sufficient to fulfill the obligations it has at December 31, 2008 pursuant to off-balance sheet arrangements and contractual obligations.
| | | | | | | | | | | | | | | | |
| | | | | Amount of Commitment Expiration Per Period | |
| | | | |
| |
| | Total
Amounts
Committed | | One
Year
or Less | | Over
One Year
Through
Three Years | | Over
Three Years
Through
Five Years | | Over
Five
Years | |
| |
| |
| |
| |
| |
| |
| | (in thousands) | |
| | | |
Commitments to extend credit | | $ | 116,653 | | $ | 48,291 | | $ | 14,392 | | $ | 8,890 | | $ | 45,080 | |
Standby letters of credit | | | 3,641 | | | 3,641 | | | — | | | — | | | — | |
Commercial letters of credit | | | — | | | — | | | — | | | — | | | — | |
Securities sold under repurchase agreements - Long-term | | | 157,970 | | | 5,478 | | | 22,682 | | | 67,592 | | | 62,218 | |
Operating lease obligations | | | 8,974 | | | 1,181 | | | 2,245 | | | 1,794 | | | 3,754 | |
Purchase obligations | | | 1,687 | | | 348 | | | 697 | | | 642 | | | — | |
Time Deposits | | | 192,152 | | | 167,834 | | | 10,513 | | | 13,600 | | | 205 | |
| |
|
| |
|
| |
|
| |
|
| |
|
| |
| | $ | 481,077 | | $ | 226,773 | | $ | 50,529 | | $ | 92,518 | | $ | 111,257 | |
| |
|
| |
|
| |
|
| |
|
| |
|
| |
Commitments to extend credit and letters of credit arise in the normal course of the Bank’s business of meeting the financing needs of its customers and involve, to varying degrees, elements of credit risk in excess of the amount recognized in the consolidated balance sheets.
The Bank’s exposure to credit loss in the event of nonperformance by the other party to financial instruments for commitments to extend credit, standby letters of credit, and commercial letters of credit is represented by the contractual notional amount of these instruments. The Bank uses the same credit policies in making commitments to extend credit and generally uses the same credit policies for letters of credit as it does for on-balance-sheet instruments.
Commitments to extend credit are legally binding agreements to lend to a customer as long as there is no violation of any condition established in the contract. Unused home equity lines, which comprise a substantial portion of these commitments, generally expire ten years from their date of origination. Other real estate loan commitments generally expire within 60 days and commercial loan commitments generally expire within one year. The amount of collateral obtained, if any, by the Bank upon extension of credit is based on management’s credit evaluation of the borrower. Collateral held varies but may include mortgages on commercial and residential real estate, security interests in business assets, deposit accounts with the Bank or other financial institutions, and securities.
Standby letters of credit are conditional commitments issued by the Bank to assure the performance or financial obligations of a customer to a third party. The credit risk involved in issuing standby letters of credit is essentially the same as that involved in extending loans to customers. The Bank generally holds collateral and/or obtains personal
38
guarantees supporting these commitments. Commercial letters of credit are conditional commitments issued by the Bank to assure the payment by a customer to a supplier. The Bank generally obtains personal guarantees supporting these commitments.
The purchase obligations shown in the preceding table are pursuant to contracts that the Bank has with providers of data processing services. Required pension plan contributions for years beyond 2009 are not presently known and are therefore not included in the table. For the Plan year ending September 30, 2009, the Bank has a minimum required pension contribution of $1,119,000 and a maximum tax deductible contribution of $8,765,000. The Bank expects to make a contribution within that range by September 30, 2009, but the amount of such contribution has not yet been determined.
Capital
The Corporation’s capital management policy is designed to build and maintain capital levels that exceed regulatory standards. Under current regulatory capital standards, banks are classified as well capitalized, adequately capitalized or undercapitalized. Under such standards, a well-capitalized bank is one that has a total risk-based capital ratio equal to or greater than 10%, a Tier 1 risk-based capital ratio equal to or greater than 6%, and a Tier 1 leverage capital ratio equal to or greater than 5%. The Bank’s total risk-based capital, Tier 1 risk-based capital and Tier 1 leverage capital ratios of 17.27%, 16.29% and 8.03%, respectively, at December 31, 2008 substantially exceed the requirements for a well-capitalized bank. The Corporation (on a consolidated basis) is subject to minimum risk-based and leverage capital requirements, which the Corporation substantially exceeds as of December 31, 2008.
Total stockholders’ equity increased slightly from $102,384,000 at December 31, 2007 to $102,532,000 at December 31, 2008. The positive impact on stockholders’ equity of net income, unrealized gains on available-for-sale securities, and stock-based compensation transactions was almost entirely offset by stock repurchases, cash dividends declared, and a decrease in the funded status of the Bank’s pension plan.
Stock Repurchase Program and Market Liquidity. Since 1988, the Corporation has had a stock repurchase program under which it has purchased from time to time shares of its own common stock in market or private transactions. Under plans approved by the Board of Directors in 2007 and 2008, the Corporation purchased 296,479 shares in 2008 and can purchase 114,011 shares in the future. The details of the Corporation’s purchases under the stock repurchase program during the fourth quarter of 2008 are set forth in the table that follows.
| | | | | | | | | | | | | | |
Period | | Total
Number of
Shares
Purchased | | Average
Price Paid
Per Share | | Total Number of
Shares Purchased as
Part of Publicly
Announced Plans
or Programs(1) | | Maximum Number of
of Shares that May Yet
Be Purchased Under the
Plans or Programs(1) | |
| |
| |
| |
| |
| |
October 1, 2008 to October 31, 2008 | | — | | | | — | | | — | | | | 116,711 | |
November 1, 2008 to November 30, 2008 | | 2,500 | | | $ | 21.40 | | | 2,500 | | | | 114,211 | |
December 1, 2008 to December 31, 2008 | | 200 | | | $ | 22.08 | | | 200 | | | | 114,011 | |
| |
(1) | All shares purchased by the Corporation under its stock repurchase program in the fourth quarter of 2008 were purchased under a 200,000 share plan approved by the Corporation’s Board of Directors on February 21, 2008 and publicly announced on February 22, 2008. The Corporation’s share repurchase plans do not have fixed expiration dates. |
The stock repurchase program has historically enhanced earnings per share and return on average stockholders’ equity. The program is estimated to have contributed four cents more to earnings per share in 2008 than 2007. The larger contribution to earnings per share this year is attributable to the full-year impact of the shares purchased in 2007 plus the pro rata impact of the shares purchased throughout 2008, taking into account the volume of shares purchased, the price paid per share, and current interest rates.
The Corporation periodically reevaluates whether it wants to continue purchasing shares of its own common stock in open market transactions under the safe harbor provisions of Rule 10b-18 or otherwise. Because the trading volume in the Corporation’s common stock is limited, the Corporation believes that a reduction or discontinuance of its share repurchase program could adversely impact market liquidity for its common stock, the price of its common stock, or both. The publicly reported trading volume in the Corporation’s common stock in 2008 and 2007 was 979,245 and 615,795 shares, respectively. Open market purchases by the Corporation under its share repurchase program accounted for 14.6% of the trading volume in 2008 and 12.2% in 2007.
39
Russell Microcap Index.Frank Russell Company (“Russell”) maintains a family of U.S. equity indices. The indices are reconstituted in June of each year based on market capitalization and do not reflect subjective opinions. All indices are subsets of the Russell 3000E Index, which represents most of the investable U. S. equity market.
The Corporation’s common stock is included in the Russell Microcap Index. When reconstituted in June 2008, the average market capitalization of companies in the Russell Microcap Index was $310 million, the median market capitalization was $169 million, the capitalization of the largest company in the index was $617 million, and the capitalization of the smallest company in the index was $37 million. The Corporation’s market capitalization as of December 31, 2008 was approximately $171 million.
The strong performance of the Corporation’s stock over the last year relative to the overall market should result in its stock being included in the Russell 3000 and 2000 Indexes when they are reconstituted in June 2009. The Corporation believes that migration of its stock from the Russell Microcap to the Russell 3000 and 2000 Indexes could improve the stock’s price, trading volume and liquidity. Conversely, if the Corporation’s market capitalization falls below the minimum necessary to be included in the Russell 3000 and 2000 Indexes or the Russell Microcap Index at any future reconstitution date, the opposite could occur.
Performance Graph. The following graph compares the Corporation’s total stockholder return over a 5-year measurement period with the NASDAQ Market Index and the NASDAQ Bank Stocks Index.
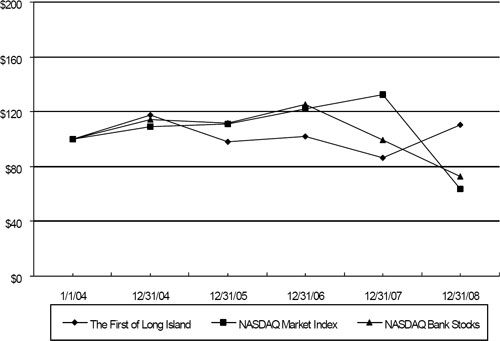
COMPARISON OF FIVE-YEAR CUMULATIVE TOTAL RETURN
THE FIRST OF LONG ISLAND CORPORATION,
NASDAQ BANK STOCKS INDEX AND NASDAQ MARKET INDEX
Assumes $100 Invested on January 1, 2004
Assumes Dividends Reinvested
Fiscal Year Ended December 31, 2008
Cash Flows and Liquidity
Cash Flows.The Corporation’s primary sources of cash are deposit growth, maturities and amortization of loans and investment securities, operations, and borrowing. The Corporation uses cash from these and other sources to fund loan growth, purchase investment securities, pay cash dividends, and repurchase common stock under the Corporation’s share repurchase program. During 2008, the cash needed to grow loans significantly exceeded the cash provided by deposit growth and operations. This is the main reason for the increase in Federal Home Loan Bank advances. Savings and money market products increased during the year, driven partially by new branch openings and the migration of funds
40
from time deposit accounts. As further discussed below, the increase in securities sold under repurchase agreements is primarily a result of the Corporation’s borrowing and investing strategy.
In 2008, the Bank continued to use maturities and paydowns from its investment securities portfolio to fund loan growth. Despite this, the securities portfolio grew by almost $82 million from year-end 2007 to year-end 2008. The growth occurred because the Bank continued with the leveraging program that began in the latter part of 2007, whereby it borrowed an additional $47 million under repurchase agreements and used the resulting proceeds to purchase securities. The leveraging program was undertaken to increase current earnings and also protect the Bank’s future earnings in the event of an increase in interest rates. $75 million of the borrowings have embedded interest rate caps. The purpose of borrowing with embedded interest rate caps is to potentially reduce the negative impact on the Bank’s net interest income that could occur with an increase in interest rates. Additional information regarding the Bank’s sensitivity to changes in interest rates can be found under the caption “Market Risk” in this discussion and analysis of financial condition and results of operations. Additional information regarding the borrowings under repurchase agreements and embedded interest rate caps can be found in Note F to the Corporation’s consolidated financial statements.
The Corporation paid $4,575,000 in cash dividends in 2008, which is $767,000 less than the $5,342,000 paid in 2007. The decrease is primarily due to the change from a semi-annual to a quarterly dividend in 2007 and the resulting payment in 2007 of one semi-annual and three quarterly dividends.
Liquidity. The Bank has both internal and external sources of liquidity that can be used to fund loan growth and accommodate deposit outflows. The Bank’s primary internal sources of liquidity are its overnight investments, investment securities designated as available-for-sale, and maturities and monthly payments on its investment securities and loan portfolios. At December 31, 2008, the Bank had approximately $93 million in unencumbered available-for-sale securities.
The Bank is a member of the Federal Home Loan Bank of New York (“FHLB”) and has repurchase agreements in place with a number of brokerage firms and commercial banks. In addition to customer deposits, the Bank’s primary external sources of liquidity are secured borrowings in the form of FHLB advances and repurchase agreements. However, neither the Bank’s FHLB membership nor repurchase agreements represent legal commitments on the part of the FHLB or repurchase agreement counterparties to extend credit to the Bank. The amount that the Bank can potentially borrow from these parties is currently dependent on, among other things, the amount of unencumbered eligible securities that the Bank can use as collateral. At December 31, 2008, the Bank had unencumbered securities of approximately $183 million that are eligible collateral for borrowing under repurchase agreements. Of these securities, $35 million are eligible collateral for FHLB borrowings. In addition, the Bank is currently working towards increasing its liquidity by obtaining FHLB approval to pledge its residential and commercial mortgages as collateral for borrowings.
The Bank can also purchase overnight federal funds on an unsecured basis under lines with two other commercial banks. These lines in the aggregate amount of $25 million do not represent legal commitments to extend credit on the part of the other banks.
As a backup to borrowing from the FHLB, brokerage firms and other commercial banks, the Bank is eligible to borrow on a secured basis at the Federal Reserve Bank (“FRB”) discount window under the primary credit program. Primary credit, which is normally extended on a very short-term basis, typically overnight, at a rate which is currently between 25 and 50 basis points above the federal funds target rate, is viewed by the FRB as a backup source of short-term funds for sound depository institutions like the Bank. The amount that the Bank can borrow under the primary credit program depends on, among other things, the amount of available eligible collateral.
Market Risk
The Bank invests in interest-earning assets which are funded by interest-bearing deposits and borrowings, noninterest-bearing deposits, and capital. The Bank’s results of operations are subject to risk resulting from interest rate fluctuations generally and having assets and liabilities that have different maturity, repricing, and prepayment/withdrawal characteristics. The Bank defines interest rate risk as the risk that the Bank’s earnings and/or net portfolio value (present value of expected future cash flows from assets less the present value of expected future cash flows from liabilities) will change when interest rates change. The principal objective of the Bank’s asset/liability management activities is to maximize net interest income while at the same time maintain acceptable levels of interest rate and liquidity risk and facilitate the funding needs of the Bank.
Because the Bank’s loans and investment securities generally reprice slower than its interest-bearing liabilities, an immediate increase in interest rates uniformly across the yield curve should initially have a negative effect on net interest income. However, if the Bank does not increase the rates paid on its deposit accounts as quickly or in the same amount as
41
increases in market interest rates and/or owns interest rate caps that are in-the-money at the time of the interest rate increase or become in-the-money as a result of the increase, the magnitude of the negative impact will decline and the impact could even be positive. Over a longer period of time, and assuming that interest rates remain stable after the initial rate increase and the Bank purchases securities and originates loans at yields higher than those maturing and reprices loans at higher yields, the impact of an increase in interest rates should be positive. This occurs primarily because with the passage of time more loans and investment securities will reprice at the higher rates and there will be no offsetting increase in interest expense for those loans and investment securities funded by noninterest-bearing checking deposits and capital.
Conversely, a decrease in interest rates uniformly across the yield curve should initially have a positive impact on the Bank’s net interest income. Furthermore, if the Bank owns interest rate floors that are in-the-money at the time of the interest rate decrease or become in-the-money as a result of the decrease, the magnitude of the positive impact should increase. However, if the Bank does not or cannot decrease the rates paid on its deposit accounts as quickly or in the same amount as decreases in market interest rates, regardless of whether or not it owns interest rate floors, the magnitude of the positive impact will decline and could even be negative.
If interest rates decline, or have declined, and are sustained at the lower levels and, as a result, the Bank purchases securities at lower yields and loans are originated or repriced at lower yields, the impact on net interest income should be negative because a significant portion of the Bank’s average interest-earning assets are funded by noninterest-bearing checking deposits and capital.
The Bank monitors and controls interest rate risk through a variety of techniques including the use of interest rate sensitivity models and traditional repricing gap analysis. Through use of the models, the Bank projects future net interest income and then estimates the effect on projected net interest income of various changes in interest rates and balance sheet growth rates. The Bank also uses the models to calculate the change in net portfolio value over a range of interest rate change scenarios.
Traditional gap analysis involves arranging the Bank’s interest-earning assets and interest-bearing liabilities by repricing periods and then computing the difference, or gap, between the assets and liabilities which are estimated to reprice during each time period and cumulatively through the end of each time period.
Both interest rate sensitivity modeling and gap analysis involve a variety of significant estimates and assumptions and are done at a specific point in time. Interest rate sensitivity modeling requires, among other things, estimates of: (1) how much and when yields and costs on individual categories of interest-earning assets and interest-bearing liabilities will change because of projected changes in market interest rates; (2) future cash flows; (3) discount rates; and (4) decay or runoff rates for nonmaturity deposits such as checking, savings, and money market accounts.
Gap analysis requires estimates as to when individual categories of interest-sensitive assets and liabilities will reprice and assumes that assets and liabilities assigned to the same repricing period will reprice at the same time and in the same amount. Like sensitivity modeling, gap analysis does not fully take into account the fact that the repricing of some assets and liabilities is discretionary and subject to competitive and other pressures.
Changes in the estimates and assumptions made for interest rate sensitivity modeling and gap analysis could have a significant impact on projected results and conclusions. Therefore, these techniques may not accurately reflect the actual impact of changes in the interest rate environment on the Bank’s net interest income or net portfolio value.
The table that follows summarizes the Corporation’s cumulative interest repricing gap at December 31, 2008 based upon significant estimates and assumptions that the Corporation believes to be reasonable. The table arranges interest-earning assets and interest-bearing liabilities according to the period in which they contractually mature or, if earlier, are estimated to repay or reprice. Repayment and repricing estimates are based on internal data and management’s assumptions about factors that are inherently uncertain. These factors include, among others, prepayment speeds, changes in market interest rates and the Bank’s response thereto, early withdrawal of deposits, and competition. The balances of non-maturity deposit products have been included in categories beyond three months in the table because management believes, based on past experience and its knowledge of current competitive pressures, that the repricing of these products will lag market changes in interest rates to varying degrees. The table does not reflect any protection against interest rate changes that the Corporation may have as a result of its ownership of derivative instruments such as interest rate caps or floors. The only such instruments that the Corporation owns at December 31, 2008 are the interest rate caps disclosed in Note F to the Corporation’s December 31, 2008 consolidated financial statements.
42
| | | | | | | | | | | | | | | | | | | | | | | | | |
| | Repricing Period | |
| |
| |
| | Three
Months
or Less | | Over
Three
Months
Through
Six Months | | Over
Six
Months
Through
One Year | | Total
Within
One Year | | Over
One Year
Through
Five
Years | | Over
Five
Years | | Non-
interest-
Sensitive | | Total | |
| |
| |
| |
| |
| |
| |
| |
| |
| |
| | (in thousands) | |
Assets: | | | | | | | | | | | | | | | | | | | | | | | | | |
Federal funds sold & overnight investments | | $ | 514 | | $ | — | | $ | — | | $ | 514 | | $ | — | | $ | — | | $ | — | | $ | 514 | |
Investment securities | | | 30,014 | | | 33,884 | | | 77,036 | | | 140,934 | | | 258,835 | | | 143,057 | | | 5,427 | | | 548,253 | |
Loans | | | 172,449 | | | 29,941 | | | 59,881 | | | 262,271 | | | 313,899 | | | 81,088 | | | (5,200 | ) | | 652,058 | |
Other assets | | | — | | | — | | | — | | | — | | | — | | | — | | | 60,784 | | | 60,784 | |
| |
|
| |
|
| |
|
| |
|
| |
|
| |
|
| |
|
| |
|
| |
| | | 202,977 | | | 63,825 | | | 136,917 | | | 403,719 | | | 572,734 | | | 224,145 | | | 61,011 | | | 1,261,609 | |
| |
|
| |
|
| |
|
| |
|
| |
|
| |
|
| |
|
| |
|
| |
Liabilities & Stockholders’ Equity: | | | | | | | | | | | | | | | | | | | | | | | | | |
Checking deposits | | | — | | | — | | | — | | | — | | | — | | | — | | | 324,138 | | | 324,138 | |
Savings & money market deposits | | | 287,772 | | | 8,069 | | | 16,137 | | | 311,978 | | | 72,069 | | | — | | | — | | | 384,047 | |
Time deposits, $100,000 and over | | | 110,706 | | | 7,717 | | | 5,330 | | | 123,753 | | | 10,197 | | | 100 | | | — | | | 134,050 | |
Time deposits, other | | | 28,105 | | | 11,593 | | | 4,382 | | | 44,080 | | | 13,917 | | | 105 | | | — | | | 58,102 | |
Borrowed funds | | | 124,122 | | | — | | | — | | | 124,122 | | | 72,000 | | | 55,000 | | | — | | | 251,122 | |
Other liabilities | | | — | | | — | | | — | | | — | | | — | | | — | | | 7,618 | | | 7,618 | |
Stockholders’ equity | | | — | | | — | | | — | | | — | | | — | | | — | | | 102,532 | | | 102,532 | |
| |
|
| |
|
| |
|
| |
|
| |
|
| |
|
| |
|
| |
|
| |
| | | 550,705 | | | 27,379 | | | 25,849 | | | 603,933 | | | 168,183 | | | 55,205 | | | 434,288 | | | 1,261,609 | |
| |
|
| |
|
| |
|
| |
|
| |
|
| |
|
| |
|
| |
|
| |
Interest-rate sensitivity gap | | $ | (347,728 | ) | $ | 36,446 | | $ | 111,068 | | $ | (200,214 | ) | $ | 404,551 | | $ | 168,940 | | $ | (373,277 | ) | $ | — | |
| |
|
| |
|
| |
|
| |
|
| |
|
| |
|
| |
|
| |
|
| |
Cumulative interest-rate sensitivity gap | | $ | (347,728 | ) | $ | (311,282 | ) | $ | (200,214 | ) | $ | (200,214 | ) | $ | 204,337 | | $ | 373,277 | | $ | — | | $ | — | |
| |
|
| |
|
| |
|
| |
|
| |
|
| |
|
| |
|
| |
|
| |
As shown in the preceding table, the Bank has a significant volume of deposit accounts and borrowings that are subject to repricing as short-term interest rates change. Since the amount of these liabilities outweighs the assets held by the Bank whose pricing is tied to short-term interest rates, an increase in short-term interest rates should negatively impact the Bank’s net interest income in the near term. The interest rate caps owned by the Bank at December 31, 2008 may help to reduce the negative impact. In addition, the Bank can reduce the magnitude of the negative impact by not increasing the rates paid on its deposit accounts as quickly or in the same amount as market increases in the overnight funds rate, the prime lending rate, or other short-term rates. Conversely, a decrease in short-term interest rates should positively impact the Bank’s net interest income in the near term. However, if short-term rates decline and the Bank cannot, due to competitive pressures and/or the absolute level of rates, decrease its deposit rates in the same amount as market decreases in the federal funds target rate, the prime lending rate, and other short-term rates, the magnitude of the positive impact will decline and the impact could even be negative.
The table that follows is provided pursuant to the market risk disclosure rules set forth in Item 305 of Regulation S-K of the Securities and Exchange Commission. The information provided in the following table is based on significant estimates and assumptions and constitutes, like certain other statements included herein, a forward-looking statement. The base case information in the table shows (1) an estimate of the Corporation’s net portfolio value at December 31, 2008 arrived at by discounting estimated future cash flows at current market rates and (2) an estimate of net interest income on a tax-equivalent basis for the year ending December 31, 2009 assuming that maturing assets or liabilities are replaced with new balances of the same type, in the same amount, and at current rate levels and repricing balances are adjusted to current rate levels. For purposes of the base case, nonmaturity deposits are included in the calculation of net portfolio value at their carrying amount. The rate change information in the table shows estimates of net portfolio value at December 31, 2008 and net interest income on a tax-equivalent basis for the year ending December 31, 2009 assuming rate changes of plus 100 and 200 basis points and minus 100 and 200 basis points. The changes in net portfolio value from the base case have not been tax affected. In addition, cash flows for nonmaturity deposits are based on a decay or runoff rate of eight years. Also, rate changes are assumed to be shock or immediate changes and occur uniformly across the yield curve regardless of the duration to maturity or repricing of specific assets and liabilities. In projecting future net interest income under the indicated rate change scenarios, activity is simulated by replacing maturing balances with new balances of the same type, in the same amount, but at the assumed rate level and adjusting repricing balances to the assumed rate level.
43
Based on the foregoing assumptions and as depicted in the table that follows, an immediate increase in interest rates of 100 or 200 basis points would have a negative effect on net interest income over a one-year time period. This is principally because the Bank’s interest-bearing deposit accounts are assumed to reprice faster than its loans and investment securities. However, if the Bank does not increase the rates paid on its deposit accounts as quickly or in the same amount as increases in market interest rates, the magnitude of the negative impact will decline. If the Bank does not increase its deposit rates at all, the impact should be positive. Over a longer period of time, and assuming that interest rates remain stable after the initial rate increase and the Bank purchases securities and originates loans at yields higher than those maturing and reprices loans at higher yields, the impact of an increase in interest rates should be positive. This occurs primarily because with the passage of time more loans and investment securities will reprice at the higher rates and there will be no offsetting increase in interest expense for those loans and investment securities funded by noninterest-bearing checking deposits and capital. Generally, the reverse should be true of an immediate decrease in interest rates of 100 or 200 basis points. However, the positive impact of a decrease in interest rates of 100 or 200 basis points is currently reduced by the fact that some of the Bank’s deposit products have yields below 1% while others have yields below 2%.
| | | | | | | | | | | | | |
| | Net Portfolio Value at
December 31, 2008 | | Net Interest Income
for 2009 | |
| |
| |
| |
Rate Change Scenario | | Amount | | Percent
Change
From
Base Case | | Amount | | Percent
Change
From
Base Case | |
| |
| |
| |
| |
| |
| | (dollars in thousands) | |
+ 200 basis point rate shock | | $ | 83,957 | | (9.2 | )% | | $ | 44,493 | | (14.9 | )% | |
+ 100 basis point rate shock | | | 88,054 | | (4.7 | ) | | | 48,365 | | (7.5 | ) | |
Base case (no rate change) | | | 92,426 | | — | | | | 52,310 | | — | | |
- 100 basis point rate shock | | | 97,111 | | 5.1 | | | | 56,037 | | 7.1 | | |
- 200 basis point rate shock | | | 104,289 | | 12.8 | | | | 57,163 | | 9.3 | | |
Legislation and Regulatory Matters
Enacted Legislation. In the latter part of 2008, two major pieces of legislation (the “Legislation”) impacting the financial services industry were enacted; the Housing and Economic Recovery Act of 2008 and the Emergency Economic Stabilization Act of 2008. This Legislation was enacted to address the subprime mortgage crisis and in response to capital adequacy, asset quality, management, liquidity, earnings and sensitivity to market risk problems being experienced by a large number of financial institutions. It contains broad changes that impact, either directly or indirectly, the Bank’s business operations. The significant changes brought about by this Legislation include, among others, the following:
| | |
| • | The placing of Fannie Mae and Freddie Mac into conservatorship by their primary regulator, the Federal Housing Finance Agency; |
| | |
| • | A temporary increase through December 31, 2009 in FDIC insurance coverage from $100,000 to $250,000; |
| | |
| • | A temporary guarantee by the FDIC through December 31, 2009 of all transaction account balances, without limitation, which is in addition to and separate from the $250,000 insurance limit under the FDIC’s general deposit insurance regulations. Transaction accounts include traditional checking accounts and funds swept from such accounts to another noninterest-bearing deposit account, NOW accounts paying less than .5% interest, and Interest on Lawyer Accounts; |
| | |
| • | A guarantee by the FDIC of the senior unsecured debt of financial institutions issued through June 30, 2009. The guarantee expires upon maturity of the debt or June 30, 2012, whichever is earlier; |
| | |
| • | A provision that allows the Federal Reserve Bank to pay interest to banks on sterile reserves beginning October 1, 2008, three years earlier than previously permitted; |
| | |
| • | The creation of the $700 billion Troubled Asset Relief Program (“TARP”) within the U.S. Treasury Department to purchase troubled assets from any financial institution through December 31, 2009; |
| | |
| • | As part of the TARP, the $250 billion Capital Purchase Program that enables financial institutions to raise capital by selling senior preferred shares to the federal government. |
44
Financial institutions may opt out of the FDIC’s unlimited guarantee of transaction account balances and the FDIC’s guarantee of senior unsecured debt. In addition, raising capital by selling senior preferred shares to the federal government is voluntary on the part of banks. The Bank did not opt out of the FDIC’s transaction account and senior unsecured debt guarantees and, based on the Bank’s strong capital position, chose not to participate in the Capital Purchase Program. In addition, the Bank has no assets in its loan or securities portfolios that it would consider selling to the Treasury Department under the TARP.
In February 2009, the American Recovery and Reinvestment Act of 2009 (the “Act”) became law. Otherwise known as the Stimulus Plan, the Act is a $787 billion package of spending, tax cuts and tax credits that’s designed to help pull the nation out of the significant current downturn. The provisions of the Act are intended to have significant positive impact on the economy and could significantly impact the Bank’s business on a near and longer-term basis. Also in February 2009, the FDIC took two actions designed to allow the Deposit Insurance Fund to withstand the existing problems in the banking industry. The first was the imposition of an emergency special assessment of 20 basis points on deposits of insured banks and savings associations as of June 30, 2009. The second was adoption of previously proposed changes to its risk-based assessment system. These changes considered, the Bank currently estimates that its FDIC insurance cost will increase by approximately $2,800,000 in 2009.
Pending Legislation. Commercial checking deposits currently account for approximately 27% of the Bank’s total deposits. Congress has been considering legislation that would allow corporate customers to cover checks by sweeping funds from interest-bearing deposit accounts each business day and repeal the prohibition of the payment of interest on corporate checking deposits. Either could have a material adverse impact on the Bank’s future results of operations.
Examination.The Bank was examined by the Office of the Comptroller of the Currency as of September 30, 2008. The examination was a regularly scheduled safety and soundness examination. Management is not aware, nor has it been apprised, of any recommendations by regulatory authorities that would have a material adverse impact on the Corporation’s liquidity, capital resources, or operations.
Impact of Not Yet Effective Authoritative Accounting Pronouncements
In December 2007, the FASB issued SFAS No. 141 (revised 2007) “Business Combinations” (“SFAS No. 141(R)”), which establishes principles and requirements for how an acquirer recognizes and measures in its financial statements the identifiable assets acquired, liabilities assumed, and any noncontrolling interest in an acquiree, including the recognition and measurement of goodwill acquired in a business combination. SFAS No. 141(R) is effective for fiscal years beginning on or after December 15, 2008. Earlier adoption is prohibited. The adoption of this standard is not expected to materially affect the Corporation’s results of operations or financial position.
In December 2007, the FASB issued SFAS No. 160 “Noncontrolling Interest in Consolidated Financial Statements, an amendment of ARB No. 51” (“SFAS No. 160”), which will change the accounting and reporting for minority interests. Under SFAS No. 160, minority interests will be recharacterized as noncontrolling interests and classified as a component of equity within the consolidated balance sheets. SFAS No. 160 is effective as of the beginning of the first fiscal year beginning on or after December 15, 2008. Earlier adoption is prohibited. The adoption of this standard is not expected to materially affect the Corporation’s results of operations or financial position.
In March 2008, the FASB issued SFAS No. 161 “Disclosures about Derivative Instruments and Hedging Activities – an amendment of SFAS No. 133” (“SFAS No. 161”). SFAS No. 161 requires enhanced disclosures about an entity’s derivative and hedging activities and thereby improves the transparency of financial reporting. SFAS No. 161 is effective for financial statements issued for fiscal years and interim periods beginning after November 15, 2008. The adoption of this standard is not expected to materially affect the Corporation’s results of operations or financial position.
In May 2008, the FASB issued SFAS No. 162 “The Hierarchy of Generally Accepted Accounting Principles” (“SFAS No. 162”). This Statement identifies the sources of accounting principles and the framework for selecting the principles to be used in the preparation of financial statements of nongovernmental entities that are presented in conformity with generally accepted accounting principles (“GAAP”) in the United States. This Statement will be effective 60 days following the SEC’s approval of the Public Company Accounting Oversight Board amendments to AU Section 411. The adoption of SFAS No. 162 is not expected to impact the Corporation’s consolidated financial statements.
45
On February 20, 2008, the FASB issued FSP FAS 140-3 “Accounting for Transfers of Financial Assets and Repurchase Financing Transactions” (“FSP 140-3”) to resolve questions about the accounting for repurchase financings. This FSP is effective for repurchase financings in which the initial transfer is entered into in fiscal years beginning after November 15, 2008. The adoption of FSP 140-3 on January 1, 2009 had no impact on the Corporation’s consolidated financial statements.
On April 25, 2008, the FASB issued FSP FAS 142-3 “Determination of the Useful Life of Intangible Assets” (“FSP 142-3”), which amends the list of factors an entity should consider in developing renewal or extension assumptions used in determining the useful life of recognized intangible assets under SFAS No. 142 “Goodwill and Other Intangible Assets.” FSP 142-3 is effective for financial statements issued for fiscal years and interim periods beginning after December 15, 2008. The adoption of FSP 142-3 on January 1, 2009 did not impact the Corporation’s consolidated financial statements.
On May 9, 2008, the FASB issued FSP APB 14-1 “Accounting for Convertible Debt Instruments That May Be Settled in Cash upon Conversion (Including Partial Cash Settlement)” (“FSP 14-1”). FSP 14-1 is effective for financial statements issued for fiscal years and interim periods beginning after December 15, 2008. The adoption of FSP 14-1 on January 1, 2009 had no impact on the Corporation’s consolidated financial statements.
On June 16, 2008, the FASB issued FSP EITF 03-6-1 “Determining Whether Instruments Granted in Share-Based Payment Transactions Are Participating Securities” (“FSP 03-6-1”). The FSP addresses whether instruments granted in share-based payment transactions are participating securities prior to vesting and, therefore, need to be included in the earnings allocation in computing earnings per share under the two-class method described in paragraphs 60 and 61 of SFAS No. 128, Earnings per Share. FSP 03-6-1 is effective for financial statements issued for fiscal years and interim periods beginning after December 15, 2008. The adoption of FSP 03-6-1 on January 1, 2009 had no impact on the Corporation’s consolidated financial statements.
Forward Looking Statements
“Management’s Discussion and Analysis of Financial Condition and Results of Operations” contains various forward-looking statements with respect to financial performance and business matters. Such statements are generally contained in sentences including the words “may” or “expect” or “could” or “should” or “would” or “believe”. The Corporation cautions that these forward-looking statements are subject to numerous assumptions, risks and uncertainties, and therefore actual results could differ materially from those contemplated by the forward-looking statements. In addition, the Corporation assumes no duty to update forward-looking statements.
46
CONSOLIDATED BALANCE SHEETS
| | | | | | | |
| | December 31, | |
| |
| |
| | 2008 | | 2007 | |
| |
| |
| |
Assets: | | | | | | | |
Cash and due from banks | | $ | 20,924,000 | | $ | 25,729,000 | |
Federal funds sold and overnight investments | | | 514,000 | | | 21,768,000 | |
| |
|
| |
|
| |
Cash and cash equivalents | | | 21,438,000 | | | 47,497,000 | |
| |
|
| |
|
| |
| | | | | | | |
Investment securities: | | | | | | | |
Held-to-maturity, at amortized cost (fair value of $172,640,000 and $193,890,000) | | | 169,480,000 | | | 193,234,000 | |
Available-for-sale, at fair value (amortized cost of $373,346,000 and $270,325,000) | | | 378,773,000 | | | 273,080,000 | |
| |
|
| |
|
| |
| | | 548,253,000 | | | 466,314,000 | |
| |
|
| |
|
| |
Loans: | | | | | | | |
Commercial and industrial | | | 53,555,000 | | | 61,317,000 | |
Secured by real estate: | | | | | | | |
Commercial mortgages | | | 273,097,000 | | | 169,621,000 | |
Residential mortgages | | | 216,654,000 | | | 194,926,000 | |
Home equity loans | | | 99,953,000 | | | 81,846,000 | |
Construction loans | | | 9,175,000 | | | 11,751,000 | |
Other | | | 3,761,000 | | | 4,893,000 | |
| |
|
| |
|
| |
| | | 656,195,000 | | | 524,354,000 | |
Net deferred loan origination costs | | | 1,939,000 | | | 1,185,000 | |
| |
|
| |
|
| |
| | | 658,134,000 | | | 525,539,000 | |
Allowance for loan losses | | | (6,076,000 | ) | | (4,453,000 | ) |
| |
|
| |
|
| |
| | | 652,058,000 | | | 521,086,000 | |
| |
|
| |
|
| |
| | | | | | | |
Federal Home Loan Bank stock, at cost | | | 6,199,000 | | | 1,184,000 | |
Bank premises and equipment, net | | | 12,593,000 | | | 10,922,000 | |
Deferred income tax benefits | | | 1,638,000 | | | — | |
Bank-owned life insurance | | | 11,650,000 | | | 11,158,000 | |
Other assets | | | 7,780,000 | | | 10,858,000 | |
| |
|
| |
|
| |
| | $ | 1,261,609,000 | | $ | 1,069,019,000 | |
| |
|
| |
|
| |
Liabilities: | | | | | | | |
Deposits: | | | | | | | |
Checking | | $ | 324,138,000 | | $ | 318,322,000 | |
Savings and money market | | | 384,047,000 | | | 302,158,000 | |
Time, $100,000 and over | | | 134,050,000 | | | 197,554,000 | |
Time, other | | | 58,102,000 | | | 51,004,000 | |
| |
|
| |
|
| |
| | | 900,337,000 | | | 869,038,000 | |
Short-term borrowings | | | 124,122,000 | | | 12,110,000 | |
Long-term debt | | | 127,000,000 | | | 80,000,000 | |
Accrued expenses and other liabilities | | | 7,543,000 | | | 4,686,000 | |
Current income taxes payable | | | 75,000 | | | 37,000 | |
Deferred income taxes payable | | | — | | | 764,000 | |
| |
|
| |
|
| |
| | | 1,159,077,000 | | | 966,635,000 | |
| |
|
| |
|
| |
Commitments and Contingent Liabilities (Note M) | | | | | | | |
| | | | | | | |
Stockholders’ Equity: | | | | | | | |
Common stock, par value $.10 per share: | | | | | | | |
Authorized, 20,000,000 shares; Issued and outstanding, 7,194,747 and 7,454,385 shares | | | 719,000 | | | 745,000 | |
Surplus | | | 1,354,000 | | | 96,000 | |
Retained earnings | | | 102,061,000 | | | 99,844,000 | |
| |
|
| |
|
| |
| | | 104,134,000 | | | 100,685,000 | |
Accumulated other comprehensive income (loss) net of tax | | | (1,602,000 | ) | | 1,699,000 | |
| |
|
| |
|
| |
| | | 102,532,000 | | | 102,384,000 | |
| |
|
| |
|
| |
| | $ | 1,261,609,000 | | $ | 1,069,019,000 | |
| |
|
| |
|
| |
See notes to consolidated financial statements
47
CONSOLIDATED STATEMENTS OF INCOME
| | | | | | | | | | |
| | Year Ended December 31, | |
| |
| |
| | 2008 | | 2007 | | 2006 | |
| |
| |
| |
| |
Interest and dividend income: | | | | | | | | | | |
Loans | | $ | 34,163,000 | | $ | 31,627,000 | | $ | 27,299,000 | |
Investment securities: | | | | | | | | | | |
Taxable | | | 18,857,000 | | | 13,529,000 | | | 14,536,000 | |
Nontaxable | | | 6,186,000 | | | 6,362,000 | | | 6,283,000 | |
Federal funds sold and overnight investments | | | 480,000 | | | 1,505,000 | | | 882,000 | |
| |
|
| |
|
| |
|
| |
| | | 59,686,000 | | | 53,023,000 | | | 49,000,000 | |
| |
|
| |
|
| |
|
| |
Interest expense: | | | | | | | | | | |
Savings and money market deposits | | | 4,576,000 | | | 4,768,000 | | | 4,629,000 | |
Time deposits | | | 6,782,000 | | | 10,081,000 | | | 6,575,000 | |
Short-term borrowings | | | 746,000 | | | 896,000 | | | 1,745,000 | |
Long-term debt | | | 4,639,000 | | | 524,000 | | | — | |
| |
|
| |
|
| |
|
| |
| | | 16,743,000 | | | 16,269,000 | | | 12,949,000 | |
| |
|
| |
|
| |
|
| |
Net interest income | | | 42,943,000 | | | 36,754,000 | | | 36,051,000 | |
|
Provision for loan losses | | | 1,945,000 | | | 575,000 | | | 670,000 | |
| |
|
| |
|
| |
|
| |
Net interest income after provision for loan losses | | | 40,998,000 | | | 36,179,000 | | | 35,381,000 | |
| |
|
| |
|
| |
|
| |
| | | | | | | | | | |
Noninterest income: | | | | | | | | | | |
Investment Management Division income | | | 1,703,000 | | | 1,786,000 | | | 1,728,000 | |
Service charges on deposit accounts | | | 2,985,000 | | | 2,883,000 | | | 3,062,000 | |
Net gains (losses) on sales of available-for-sale securities | | | 248,000 | | | (234,000 | ) | | (635,000 | ) |
Other | | | 1,345,000 | | | 1,147,000 | | | 1,143,000 | |
| |
|
| |
|
| |
|
| |
| | | 6,281,000 | | | 5,582,000 | | | 5,298,000 | |
| |
|
| |
|
| |
|
| |
Noninterest expense: | | | | | | | | | | |
Salaries | | | 14,037,000 | | | 13,637,000 | | | 12,563,000 | |
Employee benefits | | | 4,599,000 | | | 3,991,000 | | | 4,686,000 | |
Occupancy and equipment expense | | | 4,987,000 | | | 4,420,000 | | | 4,041,000 | |
Other operating expenses | | | 6,066,000 | | | 5,336,000 | | | 5,377,000 | |
| |
|
| |
|
| |
|
| |
| | | 29,689,000 | | | 27,384,000 | | | 26,667,000 | |
| |
|
| |
|
| |
|
| |
| | | | | | | | | | |
Income before income taxes | | | 17,590,000 | | | 14,377,000 | | | 14,012,000 | |
Income tax expense | | | 4,628,000 | | | 2,895,000 | | | 2,785,000 | |
| |
|
| |
|
| |
|
| |
Net Income | | $ | 12,962,000 | | $ | 11,482,000 | | $ | 11,227,000 | |
| |
|
| |
|
| |
|
| |
Weighted average: | | | | | | | | | | |
Common shares | | | 7,225,530 | | | 7,553,495 | | | 7,641,424 | |
Dilutive stock options and restricted stock units | | | 69,012 | | | 73,740 | | | 92,244 | |
| |
|
| |
|
| |
|
| |
| | | 7,294,542 | | | 7,627,235 | | | 7,733,668 | |
| |
|
| |
|
| |
|
| |
Earnings per share: | | | | | | | | | | |
Basic | | | $1.79 | | | $1.52 | | | $1.47 | |
| |
|
| |
|
| |
|
| |
Diluted | | | $1.78 | | | $1.51 | | | $1.45 | |
| |
|
| |
|
| |
|
| |
| | | | | | | | | | |
Cash dividends declared per share | | | $.66 | | | $.58 | | | $.50 | |
| |
|
| |
|
| |
|
| |
See notes to consolidated financial statements
48
CONSOLIDATED STATEMENT OF CHANGES
IN STOCKHOLDERS’ EQUITY
| | | | | | | | | | | | | | | | | | | | | | |
| | | | | | | | | | | | | | | | | Accumulated
Other
Compre-
hensive
Income (Loss) | | | | |
| | | | | | | | | | | | | | | | |
| | Common Stock | | Surplus | | Compre-
hensive
Income | | Retained
Earnings | | | | | |
| |
| | | | | | | | |
| | Shares | | Amount | | | | | | Total | |
| |
| |
| |
| |
| |
| |
| |
| |
Balance, January 1, 2006 | | | 3,846,716 | | $ | 385,000 | | $ | 817,000 | | | | | $ | 89,701,000 | | $ | (205,000 | ) | $ | 90,698,000 | |
Net Income | | | | | | | | | | | $ | 11,227,000 | | | 11,227,000 | | | | | | 11,227,000 | |
Repurchase of common stock | | | (67,814 | ) | | (7,000 | ) | | (2,920,000 | ) | | | | | | | | | | | (2,927,000 | ) |
Common stock issued under stock compensation plans, including tax benefit | | | 14,673 | | | 1,000 | | | 418,000 | | | | | | | | | | | | 419,000 | |
Unrealized gains on available-for-sale-securities, net of reclassification adjustment and taxes | | | | | | | | | | | | 447,000 | | | | | | 447,000 | | | 447,000 | |
| | | | | | | | | | |
|
| | | | | | | | | | |
Comprehensive income | | | | | | | | | | | $ | 11,674,000 | | | | | | | | | | |
| | | | | | | | | | |
|
| | | | | | | | | | |
Adjustment to initially apply SFAS No. 158, net of taxes | | | | | | | | | | | | | | | | | | (707,000 | ) | | (707,000 | ) |
Cash dividends declared | | | | | | | | | | | | | | | (3,806,000 | ) | | | | | (3,806,000 | ) |
Stock-based compensation | | | | | | | | | 210,000 | | | | | | | | | | | | 210,000 | |
Transfer from retained earnings to surplus | | | | | | | | | 2,000,000 | | | | | | (2,000,000 | ) | | | | | | |
| |
|
| |
|
| |
|
| | | | |
|
| |
|
| |
|
| |
Balance, December 31, 2006 | | | 3,793,575 | | | 379,000 | | | 525,000 | | | | | | 95,122,000 | | | (465,000 | ) | | 95,561,000 | |
Net Income | | | | | | | | | | | $ | 11,482,000 | | | 11,482,000 | | | | | | 11,482,000 | |
Repurchase of common stock | | | (183,015 | ) | | (18,000 | ) | | (3,701,000 | ) | | | | | | | | | | | (3,719,000 | ) |
Common stock issued under stock compensation plans, including tax benefit | | | 39,202 | | | 4,000 | | | 766,000 | | | | | | | | | | | | 770,000 | |
2-for-1 stock split | | | 3,804,623 | | | 380,000 | | | | | | | | | (380,000 | ) | | | | | | |
Unrealized gains on available-for-sale-securities, net of reclassification adjustment and taxes | | | | | | | | | | | | 1,419,000 | | | | | | 1,419,000 | | | 1,419,000 | |
Change in funded status of pension plan, net of taxes | | | | | | | | | | | | 745,000 | | | | | | 745,000 | | | 745,000 | |
| | | | | | | | | | |
|
| | | | | | | | | | |
Comprehensive income | | | | | | | | | | | $ | 13,646,000 | | | | | | | | | | |
| | | | | | | | | | |
|
| | | | | | | | | | |
Cash dividends declared | | | | | | | | | | | | | | | (4,380,000 | ) | | | | | (4,380,000 | ) |
Stock-based compensation | | | | | | | | | 506,000 | | | | | | | | | | | | 506,000 | |
Transfer from retained earnings to surplus | | | | | | | | | 2,000,000 | | | | | | (2,000,000 | ) | | | | | | |
| |
|
| |
|
| |
|
| | | | |
|
| |
|
| |
|
| |
Balance, December 31, 2007 | | | 7,454,385 | | | 745,000 | | | 96,000 | | | | | | 99,844,000 | | | 1,699,000 | | | 102,384,000 | |
Net Income | | | | | | | | | | | $ | 12,962,000 | | | 12,962,000 | | | | | | 12,962,000 | |
Repurchase of common stock | | | (298,322 | ) | | (30,000 | ) | | (5,734,000 | ) | | | | | | | | | | | (5,764,000 | ) |
Common stock issued under stock compensation plans, including tax benefit | | | 38,684 | | | 4,000 | | | 542,000 | | | | | | | | | | | | 546,000 | |
Unrealized gains on available-for-sale-securities, net of reclassification adjustment and taxes | | | | | | | | | | | | 1,612,000 | | | | | | 1,612,000 | | | 1,612,000 | |
Change in funded status of pension plan, net of taxes | | | | | | | | | | | | (4,913,000 | ) | | | | | (4,913,000 | ) | | (4,913,000 | ) |
| | | | | | | | | | |
|
| | | | | | | | | | |
Comprehensive income | | | | | | | | | | | $ | 9,661,000 | | | | | | | | | | |
| | | | | | | | | | |
|
| | | | | | | | | | |
Cash dividends declared | | | | | | | | | | | | | | | (4,745,000 | ) | | | | | (4,745,000 | ) |
Stock-based compensation | | | | | | | | | 450,000 | | | | | | | | | | | | 450,000 | |
Transfer from retained earnings to surplus | | | | | | | | | 6,000,000 | | | | | | (6,000,000 | ) | | | | | | |
| |
|
| |
|
| |
|
| | | | |
|
| |
|
| |
|
| |
Balance, December 31, 2008 | | | 7,194,747 | | $ | 719,000 | | $ | 1,354,000 | | | | | $ | 102,061,000 | | $ | (1,602,000 | ) | $ | 102,532,000 | |
| |
|
| |
|
| |
|
| | | | |
|
| |
|
| |
|
| |
See notes to consolidated financial statements
49
CONSOLIDATED STATEMENTS OF CASH FLOWS
| | | | | | | | | | |
| | Year Ended December 31, | |
| |
| |
| | 2008 | | 2007 | | 2006 | |
| |
| |
| |
| |
Cash Flows From Operating Activities: | | | | | | | | | | |
Net income | | $ | 12,962,000 | | $ | 11,482,000 | | $ | 11,227,000 | |
Adjustments to reconcile net income to net cash provided by operating activities: | | | | | | | | | | |
Provision for loan losses | | | 1,945,000 | | | 575,000 | | | 670,000 | |
Deferred income tax credit | | | (229,000 | ) | | — | | | (211,000 | ) |
Depreciation and amortization | | | 1,831,000 | | | 1,536,000 | | | 1,363,000 | |
Premium amortization on investment securities, net | | | 544,000 | | | 358,000 | | | 306,000 | |
Net losses (gains) on sales of securities | | | (248,000 | ) | | 234,000 | | | 635,000 | |
Stock-based compensation expense | | | 450,000 | | | 506,000 | | | 210,000 | |
Accretion of cash surrender value on bank-owned life insurance | | | (492,000 | ) | | (449,000 | ) | | (410,000 | ) |
Decrease (increase) in prepaid income taxes | | | — | | | 240,000 | | | (240,000 | ) |
Increase in other assets | | | (2,355,000 | ) | | (1,159,000 | ) | | (1,130,000 | ) |
Increase (decrease) in accrued expenses and other liabilities | | | (27,000 | ) | | (17,000 | ) | | 90,000 | |
Increase (decrease) in income taxes payable | | | 38,000 | | | 37,000 | | | (33,000 | ) |
| |
|
| |
|
| |
|
| |
Net cash provided by operating activities | | | 14,419,000 | | | 13,343,000 | | | 12,477,000 | |
| |
|
| |
|
| |
|
| |
| | | | | | | | | | |
Cash Flows From Investing Activities: | | | | | | | | | | |
Proceeds from sales of available-for-sale securities | | | 36,993,000 | | | 14,578,000 | | | 28,048,000 | |
Proceeds from maturities and redemptions of investment securities: | | | | | | | | | | |
Held-to-maturity | | | 28,410,000 | | | 43,537,000 | | | 49,257,000 | |
Available-for-sale | | | 66,569,000 | | | 95,708,000 | | | 81,996,000 | |
Purchase of investment securities: | | | | | | | | | | |
Held-to-maturity | | | (4,637,000 | ) | | (18,477,000 | ) | | (8,560,000 | ) |
Available-for-sale | | | (206,897,000 | ) | | (145,049,000 | ) | | (88,798,000 | ) |
Net increase in loans to customers | | | (132,917,000 | ) | | (76,087,000 | ) | | (69,034,000 | ) |
Net increase in Federal Home Loan Bank stock | | | (5,015,000 | ) | | — | | | — | |
Purchases of bank premises and equipment | | | (3,502,000 | ) | | (3,763,000 | ) | | (2,475,000 | ) |
Purchase of bank-owned life insurance | | | — | | | — | | | (2,500,000 | ) |
| |
|
| |
|
| |
|
| |
Net cash used in investing activities | | | (220,996,000 | ) | | (89,553,000 | ) | | (12,066,000 | ) |
| |
|
| |
|
| |
|
| |
| | | | | | | | | | |
Cash Flows From Financing Activities: | | | | | | | | | | |
Net increase in total deposits | | | 31,299,000 | | | 44,241,000 | | | 36,786,000 | |
Net increase (decrease) in short-term borrowings | | | 112,012,000 | | | (16,033,000 | ) | | (32,052,000 | ) |
Proceeds from long-term debt | | | 47,000,000 | | | 80,000,000 | | | — | |
Proceeds from exercise of stock options | | | 525,000 | | | 694,000 | | | 402,000 | |
Tax benefit of stock options | | | 21,000 | | | 76,000 | | | 17,000 | |
Repurchase and retirement of common stock | | | (5,764,000 | ) | | (3,719,000 | ) | | (2,927,000 | ) |
Cash dividends paid | | | (4,575,000 | ) | | (5,342,000 | ) | | (3,450,000 | ) |
| |
|
| |
|
| |
|
| |
Net cash provided by (used in) financing activities | | | 180,518,000 | | | 99,917,000 | | | (1,224,000 | ) |
| |
|
| |
|
| |
|
| |
Net increase (decrease) in cash and cash equivalents | | | (26,059,000 | ) | | 23,707,000 | | | (813,000 | ) |
Cash and cash equivalents, beginning of year | | | 47,497,000 | | | 23,790,000 | | | 24,603,000 | |
| |
|
| |
|
| |
|
| |
Cash and cash equivalents, end of year | | $ | 21,438,000 | | $ | 47,497,000 | | $ | 23,790,000 | |
| |
|
| |
|
| |
|
| |
| | | | | | | | | | |
Supplemental Schedule of Noncash Financing Activities: | | | | | | | | | | |
Cash dividends payable | | $ | 1,295,000 | | $ | 1,125,000 | | $ | 2,087,000 | |
The Corporation made interest payments of $17,159,000, $15,590,000, and $12,571,000 and income tax payments of $4,797,000, $2,541,000, and $3,253,000 in 2008, 2007 and 2006, respectively.
See notes to consolidated financial statements
50
NOTES TO CONSOLIDATED FINANCIAL STATEMENTS
NOTE A – SUMMARY OF SIGNIFICANT ACCOUNTING POLICIES
The consolidated financial statements include the accounts of The First of Long Island Corporation (the “Corporation”) and its wholly-owned subsidiary, The First National Bank of Long Island (the “Bank”), and subsidiaries wholly-owned by the Bank, either directly or indirectly, The First of Long Island Agency, Inc., FNY Service Corp., and The First of Long Island REIT, Inc. (the “REIT”). The Corporation’s financial condition and operating results principally reflect those of the Bank and its subsidiaries. All intercompany balances and amounts have been eliminated. In preparing the consolidated financial statements, management is required to make estimates and assumptions that affect the reported asset and liability balances, revenue and expense amounts, and the disclosure of contingent assets and liabilities. Actual results could differ significantly from those estimates.
The accounting and reporting policies of the Corporation reflect banking industry practice and conform to generally accepted accounting principles in the United States. The following is a summary of the Corporation’s significant accounting policies.
Investment Securities
Current accounting standards require that investment securities be classified as held-to-maturity, trading, or available-for-sale. The trading category is not applicable to any securities in the Bank’s portfolio because the Bank does not buy or hold debt or equity securities principally for the purpose of selling in the near term. Held-to-maturity securities are those debt securities which the Bank has the intent and ability to hold to maturity, and are reported at amortized cost. Available-for-sale securities are those debt and equity securities which are neither held-to-maturity securities nor trading securities and are reported at fair value, with unrealized gains and losses, net of the related income tax effect, included in other comprehensive income.
Interest on investment securities includes amortization or accretion of purchase premium or discount. Premiums and discounts on securities are amortized or accreted on the level-yield method. Realized gains and losses on the sale of securities are determined using the specific identification method.
The Bank evaluates declines in fair value below the amortized cost basis for individual securities classified as either available-for-sale or held-to-maturity. In estimating other than temporary declines, management considers: (1) the length of time and extent that fair value has been less than cost, (2) the financial condition and near term prospects of the issuer, and (3) the Bank’s ability and intent to hold the security for a period sufficient to allow for any anticipated recovery in fair value. If a decline in fair value is judged to be other than temporary, the cost basis of the individual security is written down to fair value as a new cost basis and the amount of the write-down is included in earnings as a realized loss. The new cost basis is not changed for subsequent recoveries, if any, in fair value. Subsequent increases in the fair value of available-for-sale securities are included in other comprehensive income and subsequent decreases in fair value, if not an other-than-temporary impairment, are also included in other comprehensive income.
Loans and Allowance For Loan Losses
Loans are reported at their outstanding principal balance less any chargeoffs and the allowance for loan losses and plus or minus net deferred loan costs and fees, respectively. Interest on loans is credited to income based on the principal amount outstanding. Direct loan origination costs, net of loan origination fees, are deferred and recognized in interest income using the level-yield method without anticipating prepayments.
The accrual of interest income on loans is discontinued when a loan becomes 90 days past due as to principal or interest payments and any accrued but unpaid interest is reversed against current period income unless the loan is well secured and in the process of collection. The Bank considers nonaccruing loans to be impaired under Statement of Financial Accounting Standards No. 114 “Accounting by Creditors for Impairment of a Loan” (“SFAS No. 114”) as amended. The valuation allowance for nonaccrual and other impaired loans is reported within the overall allowance for loan losses. At December 31, 2008, the Bank had nonaccrual loans of $112,000 and loans past due 90 days or more as to principal and interest payments and still accruing of $42,000. At December 31, 2007, the Bank had nonaccrual loans of $257,000 and loans past due 90 days or more as to principal and interest payments and still accruing of $95,000.
The allowance for loan losses is established through provisions for loan losses charged against income. Amounts deemed to be uncollectible are charged against the allowance for loan losses, and subsequent recoveries, if any, are credited to the allowance.
51
The allowance for loan losses is an amount that management currently believes will be adequate to absorb probable incurred losses in the Bank’s loan portfolio. The process for estimating credit losses and determining the allowance for loan losses as of any balance sheet date is subjective in nature and requires material estimates. Actual results could differ significantly from those estimates. In determining the allowance for loan losses, there is not an exact amount but rather a range for what constitutes an appropriate allowance.
In estimating losses the Bank reviews individual loans in its portfolio and, for those loans deemed to be impaired, measures impairment losses based on either the fair value of collateral or the discounted value of expected future cash flows. A loan is considered to be impaired when, based on current information and events, it is probable that the Bank will be unable to collect the scheduled principal and interest when due according to the contractual terms of the loan agreement. Estimated losses for loans that are not specifically reviewed are determined on a pooled basis using the Bank’s historical loss experience adjusted to reflect current conditions. In adjusting historical loss experience, management considers a variety of factors including levels of and trends in delinquencies and nonaccruing loans; trends in volume and terms of loans; changes in lending policies and procedures; experience, ability and depth of lending staff; national and local economic conditions; concentrations of credit; and environmental risks. The allowance for loan losses is comprised of impairment losses on the loans specifically reviewed plus estimated losses on the pools of loans that are not specifically reviewed.
Bank Premises and Equipment
Land is carried at cost. Other Bank premises and equipment are carried at cost, less accumulated depreciation and amortization. Buildings are depreciated using the straight-line method over their estimated useful lives, which range between thirty-one and forty years. Building improvements are depreciated using the straight-line method over the then remaining lives of the buildings or their estimated useful lives, whichever is shorter. Leasehold improvements are amortized using the straight-line method over the remaining lives of the leases or their estimated useful lives, whichever is shorter. The lives of the respective leases range between five and twenty years. Furniture, fixtures, and equipment are depreciated using the straight-line method over their estimated useful lives, which range between three and ten years.
Bank-owned Life Insurance
The Bank is the owner and beneficiary of insurance policies on the lives of certain executives. In accordance with Financial Accounting Standards Board Emerging Issues Task Force Issue No. 06-5, bank-owned life insurance is recorded at the lower of its cash surrender value or the amount that can be realized.
Federal Home Loan Bank Stock
The Bank is a member of the Federal Home Loan Bank of New York (“FHLB”) and as such is required to own a certain amount of stock based on membership and the level of FHLB advances. FHLB stock is carried at cost, classified as a restricted stock, and periodically evaluated for impairment based on the ultimate recovery of cost. Cash dividends, if any, are reported as income.
Long-term Assets
Premises and equipment, intangible assets, and other long-term assets, if any, are reviewed for impairment when events indicate that their carrying amount may not be recoverable from future undiscounted cash flows. If impaired, the assets are recorded at fair value.
Checking Deposits
Each of the Bank’s commercial checking accounts has a related noninterest-bearing sweep account. The sole purpose of the sweep accounts is to reduce the reserve balances that the Bank is required to maintain with the Federal Reserve Bank, and thereby increase funds available for investment. Although the sweep accounts are classified as savings accounts for regulatory purposes, they are included in checking deposits in the accompanying consolidated balance sheets.
Income Taxes
A current tax liability or asset is recognized for the estimated taxes payable or refundable on tax returns for the current year. A deferred tax liability or asset is recognized for the estimated future tax effects attributable to temporary differences and carryforwards. The measurement of deferred tax assets is reduced, if necessary, by the amount of any tax benefits that, based on available evidence, are not expected to be realized. The measurement of current and deferred tax liabilities and assets is based on provisions of the enacted tax law. The effects of future changes in tax laws or rates are not considered. The Corporation recognizes interest and/or penalties related to income tax matters in noninterest income or noninterest expense as appropriate.
52
The Corporation adopted FASB Interpretation No. 48 “Accounting for Uncertainty in Income Taxes” (“FIN No. 48”) as of January 1, 2007. FIN No. 48 prescribes a recognition threshold and measurement attribute for the financial statement recognition and measurement of a tax position taken or expected to be taken in a tax return. It also provides guidance on derecognition, classification, interest and penalties, accounting in interim periods, disclosure and transition. The adoption of FIN No. 48 had no impact on the Corporation’s consolidated financial statements.
Loss Contingencies
Loss contingencies, including claims and legal actions arising in the ordinary course of business, are recorded as liabilities when the likelihood of loss is probable and an amount or range of loss can be reasonably estimated. Management is not currently aware of any loss contingencies that will have a material effect on the Corporation’s consolidated financial statements.
Stockholders’ Equity
Earnings Per Share. Basic earnings per share excludes dilution and is computed by dividing net income by the weighted average number of common shares outstanding for the period. Diluted earnings per share reflects the potential dilution that could occur if outstanding stock options and restricted stock units (“RSUs”) were converted into shares of common stock that then shared in the earnings of the Corporation. Diluted earnings per share is computed by dividing net income by the weighted average number of common shares and dilutive stock options and RSUs. There were 275,762, 308,420 and 277,286 antidilutive stock options at December 31, 2008, 2007 and 2006, respectively, and no antidilutive RSUs. Other than the stock options and RSUs described in Note J and the Rights described in Note I, the Corporation has no securities that could be converted into common stock nor does the Corporation have any contracts that could result in the issuance of common stock.
Stock Split.On March 22, 2007, the Corporation announced the declaration of a 2-for-1 stock split which was paid on April 16, 2007. Where applicable, all share and per share amounts included in the consolidated financial statements and notes thereto have been adjusted to reflect the effect of the split.
Stock Repurchase Program. Since 1988, the Corporation has had a stock repurchase program under which it is authorized to purchase shares of its own common stock in market or private transactions. At December 31, 2008, and in accordance with prior approval by its Board of Directors, the Corporation was authorized to purchase 114,011 shares of stock. Share repurchases are financed through available corporate cash.
Shares Tendered Upon The Exercise of Stock Options. The line captioned repurchase and retirement of common stock in the Consolidated Statement of Changes in Stockholders’ Equity includes common stock tendered upon the exercise of stock options of 1,843 shares in 2008 with a value of $40,000, 2,215 shares in 2007 with a value of $43,000, and 2,309 shares in 2006 with a value of $100,000.
Stock-based Compensation
The Corporation has a stock-based compensation plan as more fully described in Note J. Compensation cost is recognized for stock options and RSUs issued to employees, based on the grant date fair value of the award. The cost is recognized over the period during which an employee is required to provide service in exchange for the award (usually the vesting period).
53
Comprehensive Income
Comprehensive income includes net income and other comprehensive income. Other comprehensive income includes revenues, expenses, gains, and losses that under generally accepted accounting principles are included in comprehensive income but excluded from net income. Other comprehensive income for the Corporation consists of unrealized holding gains or losses on available-for-sale securities and changes in the funded status of the Bank’s defined benefit pension plan, both net of related income taxes, which are also recognized as a separate component of stockholders’ equity.
The components of other comprehensive income (loss) and the related tax effects are as follows:
| | | | | | | | | | |
| | 2008 | | 2007 | | 2006 | |
| |
| |
| |
| |
| | (in thousands) | |
Unrealized holding gains on available-for-sale securities: | | | | | | | | | | |
Net unrealized holding gains arising during period | | $ | 2,921 | | $ | 2,118 | | $ | 109 | |
Reclassification adjustment for (gain) losses included in net income | | | (248 | ) | | 234 | | | 635 | |
| |
|
| |
|
| |
|
| |
Net unrealized gains on available-for-sale securities | | | 2,673 | | | 2,352 | | | 744 | |
Tax effect | | | 1,061 | | | 933 | | | 297 | |
| |
|
| |
|
| |
|
| |
| | | 1,612 | | | 1,419 | | | 447 | |
| |
|
| |
|
| |
|
| |
| | | | | | | | | | |
Change in funded status of pension plan: | | | | | | | | | | |
Net unrealized gain (loss) arising during period | | | (8,172 | ) | | 1,220 | | | — | |
Amortization of prior service cost included in pension expense | | | 25 | | | 20 | | | — | |
| |
|
| |
|
| |
|
| |
| | | (8,147 | ) | | 1,240 | | | — | |
Tax effect | | | (3,234 | ) | | 495 | | | — | |
| |
|
| |
|
| |
|
| |
| | | (4,913 | ) | | 745 | | | — | |
| |
|
| |
|
| |
|
| |
| | | | | | | | | | |
Other comprehensive income (loss) | | $ | (3,301 | ) | $ | 2,164 | | $ | 447 | |
| |
|
| |
|
| |
|
| |
| | | | | | | | | | |
Embedded Derivative Instruments
The Corporation accounts for embedded derivative instruments under Statement of Financial Accounting Standards No. 133 “Accounting for Derivative Instruments and Hedging Activities” (“SFAS No. 133”) and related pronouncements. Accordingly, changes in the fair value of embedded derivative instruments with economic characteristics and risks that are clearly and closely related to the economic characteristics and risks of the related host contracts are not recognized in earnings in the period of change. Generally, all other embedded derivative instruments, unless they are embedded in contracts that are remeasured at fair value with changes in fair value reported in earnings as they occur, are accounted for as fair value hedges, cash flow hedges, foreign currency hedges or nonhedging instruments under SFAS No. 133 and related pronouncements.
Fair Values of Financial Instruments
The following methods and assumptions are used by the Corporation in measuring assets and liabilities carried at fair value in its financial statements and for the fair values of financial instruments disclosed herein.
Cash and cash equivalents. The recorded book value of cash and due from banks is their fair value.
Investment securities.Fair values are based on quoted prices for similar assets in active markets or derived principally from observable market data.
Loans. Fair values are estimated for portfolios of loans with similar financial characteristics. The total loan portfolio is first divided into adjustable and fixed rate interest terms. For adjustable rate loans that are subject to immediate repricing, the recorded book value less the related allowance for loan losses is a reasonable estimate of fair value. For adjustable rate loans that are subject to repricing over time and fixed rate loans, fair value is calculated by discounting anticipated future repricing amounts or cash flows using discount rates equivalent to the rates at which the Bank would currently make loans which are similar with regard to collateral, maturity, and the type of borrower. The discounted value of the repricing amounts and cash flows is reduced by the related allowance for loan losses to arrive at an estimate of fair value.
FHLB stock. The recorded book value of FHLB stock is its fair value.
Deposit liabilities.The fair value of deposits with no stated maturity, such as noninterest-bearing demand deposits, money market accounts, and savings accounts, is equal to their recorded book value at December 31 of each year. The fair value of time deposits is based on the discounted value of contractual cash flows. The discount rate is equivalent to the rate currently offered by the Bank for deposits of similar size, type and maturity.
54
Borrowed funds.For repurchase agreements and FHLB advances maturing within ninety days, the recorded book value is a reasonable estimate of fair value. The fair values of longer-term repurchase agreements, including those with embedded derivative instruments, are based on quoted prices for similar instruments in active markets.
Accrued interest receivable and payable.For these short-term instruments, the recorded book value is a reasonable estimate of fair value.
Operating Segments
While senior management monitors the revenue streams of the various products and services, the identifiable segments are not material and operations are managed and financial performance is evaluated on a company-wide basis. Accordingly, all of the financial operations are considered by senior management to be aggregated in one reportable operating segment.
Investment Management Division
Assets held in a fiduciary capacity are not assets of the Corporation and, accordingly, are not included in the accompanying consolidated financial statements. The Investment Management Division records fees on the accrual basis.
Reclassifications
Some items in the prior year financial statements were reclassified to conform to the current presentation.
Adoption of New Accounting Pronouncements
In September 2006, the Financial Accounting Standards Board (“FASB”) issued Statement of Financial Accounting Standards (“SFAS”) No. 157 “Fair Value Measurements” (“SFAS No. 157”). This statement defines fair value, establishes a framework for measuring fair value, and expands disclosures about fair value measurements. The Statement establishes a fair value hierarchy about the assumptions used to measure fair value and clarifies assumptions about risk and the effect of a restriction on the sale or use of an asset. SFAS No. 157 is effective for financial statements issued for fiscal years beginning after November 15, 2007. In February 2008, the FASB issued Staff Position (“FSP”) 157-2, “Effective Date of SFAS No. 157.” This FSP delays the effective date of SFAS No. 157 for all nonfinancial assets and nonfinancial liabilities, except those that are recognized or disclosed at fair value on a recurring basis (at least annually) to fiscal years beginning after November 15, 2008. In October 2008, the FASB issued FSP 157-3, “Determining the Fair Value of a Financial Asset when the Market for That Asset Is Not Active.” This FSP clarifies the application of SFAS No. 157 in a market that is not active. The adoption of SFAS No. 157 on January 1, 2008 did not materially impact the disclosures made in the Corporation’s consolidated financial statements.
In February 2007, the FASB issued SFAS No. 159 “The Fair Value Option for Financial Assets and Financial Liabilities” (“SFAS No. 159”). SFAS No. 159 provides companies with an option to report selected financial assets and liabilities at fair value and establishes presentation and disclosure requirements designed to facilitate comparisons between companies that choose different measurement attributes for similar types of assets and liabilities. The Corporation has not elected the fair value option for any financial assets or financial liabilities.
In September 2006, the FASB Emerging Issues Task Force finalized Issue No. 06-4 “Accounting for Deferred Compensation and Postretirement Benefit Aspects of Endorsement Split-Dollar Life Insurance Arrangements” (“EITF 06-4”). This issue requires that a liability be recorded during the service period when a split-dollar life insurance agreement continues after employment terminates. The required accrued liability will be based on either the post-employment benefit cost for the continuing life insurance or the future death benefit, depending on the contractual terms of the underlying agreement. EITF 06-4 is effective for fiscal years beginning after December 15, 2007. The adoption of EITF 06-4 on January 1, 2008 had no impact on the Corporation’s consolidated financial statements.
On November 5, 2007, the SEC issued Staff Accounting Bulletin (“SAB”) No. 109, “Written Loan Commitments Recorded at Fair Value through Earnings” (“SAB 109”). Previously, SAB 105, “Application of Accounting Principles to Loan Commitments”, stated that in measuring the fair value of a derivative loan commitment, a company should not incorporate the expected net future cash flows related to the associated servicing of the loan. SAB 109 supersedes SAB 105 and indicates that the expected net future cash flows related to the associated servicing of the loan should be included in measuring fair value for all written loan commitments that are accounted for at fair value through earnings. SAB 105 also indicated that internally-developed intangible assets should not be recorded as part of the fair value of a derivative loan commitment, and SAB 109 retains that view. SAB 109 is effective for derivative loan commitments issued or modified in fiscal quarters beginning after December 15, 2007. The adoption of SAB 109 on January 1, 2008 had no impact on the Corporation’s consolidated financial statements.
55
In December 2007, the SEC issued SAB 110, which expresses the views of the SEC regarding the use of a “simplified” method, as discussed in SAB 107, in developing an estimate of expected term of “plain vanilla” share options in accordance with SFAS No. 123(R) “Share-Based Payment.” The SEC concluded that a company could, under certain circumstances, continue to use the simplified method for share option grants after December 31, 2007. The Company does not use the simplified method for share options and therefore SAB 110 had no impact on the Company’s consolidated financial statements.
Impact of Not Yet Effective Authoritative Accounting Pronouncements
In December 2007, the FASB issued SFAS No. 141 (revised 2007) “Business Combinations” (“SFAS No. 141(R)”), which establishes principles and requirements for how an acquirer recognizes and measures in its financial statements the identifiable assets acquired, liabilities assumed, and any noncontrolling interest in an acquiree, including the recognition and measurement of goodwill acquired in a business combination. SFAS No. 141(R) is effective for fiscal years beginning on or after December 15, 2008. Earlier adoption is prohibited. The adoption of this standard is not expected to materially affect the Corporation’s results of operations or financial position.
In December 2007, the FASB issued SFAS No. 160 “Noncontrolling Interest in Consolidated Financial Statements, an amendment of ARB No. 51” (“SFAS No. 160”), which will change the accounting and reporting for minority interests. Under SFAS No. 160, minority interests will be recharacterized as noncontrolling interests and classified as a component of equity within the consolidated balance sheets. SFAS No. 160 is effective as of the beginning of the first fiscal year beginning on or after December 15, 2008. Earlier adoption is prohibited. The adoption of this standard is not expected to materially affect the Corporation’s results of operations or financial position.
In March 2008, the FASB issued SFAS No. 161 “Disclosures about Derivative Instruments and Hedging Activities – an amendment of SFAS No. 133” (“SFAS No. 161”). SFAS No. 161 requires enhanced disclosures about an entity’s derivative and hedging activities and thereby improves the transparency of financial reporting. SFAS No. 161 is effective for financial statements issued for fiscal years and interim periods beginning after November 15, 2008. The adoption of this standard is not expected to materially affect the Corporation’s results of operations or financial position.
In May 2008, the FASB issued SFAS No. 162 “The Hierarchy of Generally Accepted Accounting Principles” (“SFAS No. 162”). This Statement identifies the sources of accounting principles and the framework for selecting the principles to be used in the preparation of financial statements of nongovernmental entities that are presented in conformity with generally accepted accounting principles (“GAAP”) in the United States. This Statement will be effective 60 days following the SEC’s approval of the Public Company Accounting Oversight Board amendments to AU Section 411. The adoption of SFAS No. 162 is not expected to impact the Corporation’s consolidated financial statements.
On February 20, 2008, the FASB issued FSP FAS 140-3 “Accounting for Transfers of Financial Assets and Repurchase Financing Transactions” (“FSP 140-3”) to resolve questions about the accounting for repurchase financings. This FSP is effective for repurchase financings in which the initial transfer is entered into in fiscal years beginning after November 15, 2008. The adoption of FSP 140-3 on January 1, 2009 had no impact on the Corporation’s consolidated financial statements.
On April 25, 2008, the FASB issued FSP FAS 142-3 “Determination of the Useful Life of Intangible Assets” (“FSP 142-3”), which amends the list of factors an entity should consider in developing renewal or extension assumptions used in determining the useful life of recognized intangible assets under SFAS No. 142 “Goodwill and Other Intangible Assets.” FSP 142-3 is effective for financial statements issued for fiscal years and interim periods beginning after December 15, 2008. The adoption of FSP 142-3 on January 1, 2009 did not impact the Corporation’s consolidated financial statements.
On May 9, 2008, the FASB issued FSP APB 14-1 “Accounting for Convertible Debt Instruments That May Be Settled in Cash upon Conversion (Including Partial Cash Settlement)” (“FSP 14-1”). FSP 14-1 is effective for financial statements issued for fiscal years and interim periods beginning after December 15, 2008. The adoption of FSP 14-1 on January 1, 2009 had no impact on the Corporation’s consolidated financial statements.
On June 16, 2008, the FASB issued FSP EITF 03-6-1 “Determining Whether Instruments Granted in Share-Based Payment Transactions Are Participating Securities” (“FSP 03-6-1”). The FSP addresses whether instruments granted in share-based payment transactions are participating securities prior to vesting and, therefore, need to be included in the earnings allocation in computing earnings per share under the two-class method described in paragraphs 60 and 61 of SFAS No. 128, Earnings per Share. FSP 03-6-1 is effective for financial statements issued for fiscal years and interim periods beginning after December 15, 2008. The adoption of FSP 03-6-1 on January 1, 2009 had no impact on the Corporation’s consolidated financial statements.
56
NOTE B – INVESTMENT SECURITIES
The following table sets forth the amortized cost and estimated fair values of the Bank’s investment securities at December 31, 2008 and 2007.
| | | | | | | | | | | | | |
| | 2008 | |
| |
| |
| | | | | | | | | | | | | |
| | Amortized
Cost | | Gross
Unrealized
Gains | | Gross
Unrealized
Losses | | Fair
Value | |
| |
| |
| |
| |
| |
| | (in thousands) | |
Held-to-Maturity Securities: | | | | | | | | | | | | | |
State and municipals | | $ | 66,817 | | $ | 1,708 | | $ | (228 | ) | $ | 68,297 | |
Pass-through mortgage securities | | | 20,802 | | | 447 | | | (1 | ) | | 21,248 | |
Collateralized mortgage obligations | | | 81,861 | | | 1,330 | | | (96 | ) | | 83,095 | |
| |
|
| |
|
| |
|
| |
|
| |
| | $ | 169,480 | | $ | 3,485 | | $ | (325 | ) | $ | 172,640 | |
| |
|
| |
|
| |
|
| |
|
| |
Available-for-Sale Securities: | | | | | | | | | | | | | |
U.S. government agencies | | $ | 33,555 | | $ | 130 | | $ | — | | $ | 33,685 | |
State and municipals | | | 74,625 | | | 2,375 | | | (359 | ) | | 76,641 | |
Pass-through mortgage securities | | | 122,465 | | | 2,324 | | | (19 | ) | | 124,770 | |
Collateralized mortgage obligations | | | 142,701 | | | 1,052 | | | (76 | ) | | 143,677 | |
| |
|
| |
|
| |
|
| |
|
| |
| | $ | 373,346 | | $ | 5,881 | | $ | (454 | ) | $ | 378,773 | |
| |
|
| |
|
| |
|
| |
|
| |
| | | | | | | | | | | | | |
| | 2007 | |
| |
| |
| | Amortized
Cost | | Gross
Unrealized
Gains | | Gross
Unrealized
Losses | | Fair
Value | |
| |
| |
| |
| |
| |
| | (in thousands) | |
Held-to-Maturity Securities: | | | | | | | | | | | | | |
State and municipals | | $ | 67,233 | | $ | 1,327 | | $ | (130 | ) | $ | 68,430 | |
Pass-through mortgage securities | | | 27,119 | | | 146 | | | (264 | ) | | 27,001 | |
Collateralized mortgage obligations | | | 98,882 | | | 388 | | | (811 | ) | | 98,459 | |
| |
|
| |
|
| |
|
| |
|
| |
| | $ | 193,234 | | $ | 1,861 | | $ | (1,205 | ) | $ | 193,890 | |
| |
|
| |
|
| |
|
| |
|
| |
Available-for-Sale Securities: | | | | | | | | | | | | | |
U.S. Treasury | | $ | 5,058 | | $ | — | | $ | (2 | ) | $ | 5,056 | |
U.S. government agencies | | | 49,961 | | | 158 | | | (4 | ) | | 50,115 | |
State and municipals | | | 74,579 | | | 2,070 | | | (27 | ) | | 76,622 | |
Pass-through mortgage securities | | | 92,492 | | | 896 | | | (339 | ) | | 93,049 | |
Collateralized mortgage obligations | | | 48,235 | | | 6 | | | (3 | ) | | 48,238 | |
| |
|
| |
|
| |
|
| |
|
| |
| | $ | 270,325 | | $ | 3,130 | | $ | (375 | ) | $ | 273,080 | |
| |
|
| |
|
| |
|
| |
|
| |
The pass-through mortgage securities shown in the preceding tables were issued by the Government National Mortgage Association (“GNMA”), the Federal National Mortgage Association (“FNMA”), and the Federal Home Loan Mortgage Corporation (“FHLMC”). Each issuer’s pass-through securities are backed by mortgages conforming to its underwriting guidelines and each issuer guarantees the timely payment of principal and interest on its securities. The collateralized mortgage obligations (“CMOs”) shown in the table were also issued by GNMA, FNMA, or FHLMC and all such securities, regardless of the issuer, are backed by GNMA pass-through mortgage securities. Each issuer guarantees the timely payment of principal and interest on its CMOs and GNMA guarantees the timely payment of principal and interest on the underlying pass-through mortgage securities. Obligations of GNMA represent full faith and credit obligations of the U.S. government (the “Government”), while obligations of FNMA, which is a corporate instrumentality of the Government, and FHLMC, which is a Government sponsored corporation, do not. FNMA and FHLMC have been placed into conservatorship by their primary regulator, the Federal Housing Finance Agency (“FHFA”) who also acts as conservator. In conjunction with the conservatorship, the U.S. Department of the Treasury entered into Preferred Stock Purchase Agreements with FNMA and FHLMC to ensure that each of these entities maintains positive net worth, and established new borrowing facilities for these entities intended to serve as an ultimate liquidity backstop. The Preferred Stock Purchase Agreements and borrowing facilities serve to protect the existing and future holders of FNMA and FHLMC mortgage securities and other debt instruments.
At December 31, 2008 and 2007, investment securities with a carrying value of $365,134,000 and $178,925,000, respectively, were pledged as collateral to secure public deposits and borrowed funds.
57
Securities With Unrealized Losses.The following table sets forth securities with unrealized losses at December 31, 2008 and 2007 presented by length of time the securities have been in a continuous unrealized loss position.
| | | | | | | | | | | | | | | | | | | |
| | 2008 | |
| |
| |
| | Less than
12 Months | | 12 Months
or More | | Total | |
| |
| |
| |
| |
| | Fair
Value | | Unrealized
Loss | | Fair
Value | | Unrealized
Loss | | Fair
Value | | Unrealized
Loss | |
| |
| |
| |
| |
| |
| |
| |
| | (in thousands) | |
State and municipals | | $ | 19,839 | | $ | (555 | ) | $ | 1,769 | | $ | (32 | ) | $ | 21,608 | | $ | (587 | ) |
Pass-through mortgage securities | | | 895 | | | (19 | ) | | 16 | | | (1 | ) | | 911 | | | (20 | ) |
Collateralized mortgage obligations | | | 34,391 | | | (75 | ) | | 9,337 | | | (97 | ) | | 43,728 | | | (172 | ) |
| |
|
| |
|
| |
|
| |
|
| |
|
| |
|
| |
Total temporarily impaired | | $ | 55,125 | | $ | (649 | ) | $ | 11,122 | | $ | (130 | ) | $ | 66,247 | | $ | (779 | ) |
| |
|
| |
|
| |
|
| |
|
| |
|
| |
|
| |
| | | | | | | | | | | | | | | | | | | |
| | 2007 | |
| |
| |
| | Less than
12 Months | | 12 Months
or More | | Total | |
| |
| |
| |
| |
| | Fair
Value | | Unrealized
Loss | | Fair
Value | | Unrealized
Loss | | Fair
Value | | Unrealized
Loss | |
| |
| |
| |
| |
| |
| |
| |
| | (in thousands) | |
U.S. Treasury | | $ | 5,056 | | $ | (2 | ) | $ | — | | $ | — | | $ | 5,056 | | $ | (2 | ) |
U.S. government agencies | | | 6,141 | | | (4 | ) | | — | | | — | | | 6,141 | | | (4 | ) |
State and municipals | | | 6,779 | | | (31 | ) | | 9,726 | | | (126 | ) | | 16,505 | | | (157 | ) |
Pass-through mortgage securities | | | 18,660 | | | (97 | ) | | 18,921 | | | (506 | ) | | 37,581 | | | (603 | ) |
Collateralized mortgage obligations | | | 11,119 | | | (154 | ) | | 38,024 | | | (660 | ) | | 49,143 | | | (814 | ) |
| |
|
| |
|
| |
|
| |
|
| |
|
| |
|
| |
Total temporarily impaired | | $ | 47,755 | | $ | (288 | ) | $ | 66,671 | | $ | (1,292 | ) | $ | 114,426 | | $ | (1,580 | ) |
| |
|
| |
|
| |
|
| |
|
| |
|
| |
|
| |
Unrealized losses reflected in the preceding tables have not been included in results of operations because the affected securities are of high credit quality, management has the intent and ability to hold these securities for the foreseeable future, and the decline in fair value is largely due to an increase in interest rates since the time the securities were purchased. The losses on these securities are expected to dissipate as they approach their maturity dates and/or if interest rates decline.
Sales of Available-for-Sale Securities. Sales of available-for-sale securities were as follows:
| | | | | | | | | | |
| | 2008 | | 2007 | | 2006 | |
| |
| |
| |
| |
| | (in thousands) | |
| | | |
Proceeds | | $ | 36,993 | | $ | 14,578 | | $ | 28,048 | |
| |
|
| |
|
| |
|
| |
Gross gains | | | 287 | | | 17 | | | — | |
Gross losses | | | (39 | ) | | (251 | ) | | (635 | ) |
| |
|
| |
|
| |
|
| |
Net gains (losses) | | $ | 248 | | $ | (234 | ) | $ | (635 | ) |
| |
|
| |
|
| |
|
| |
The tax benefit (provision) related to these net realized losses and gains was $(98,000), $93,000 and $254,000 in 2008, 2007 and 2006, respectively.
58
Maturities and Average Yields. The following table sets forth the maturities and weighted average yields of the Bank’s investment securities at December 31, 2008.
| | | | | | | | | | | | | | | | | | | | | | | | | |
| | Principal Maturing(1) | |
| |
| |
| | Within
One Year | | After One But
Within Five Years | | After Five But
Within Ten Years | | After
Ten Years | |
| |
| |
| |
| |
| |
| | Amount | | Yield | | Amount | | Yield | | Amount | | Yield | | Amount | | Yield | |
| |
| |
| |
| |
| |
| |
| |
| |
| |
| | (dollars in thousands) | |
Held-to-Maturity Securities (Amortized Cost) | | | | | | | | | | | | | | | | | | | | | | | | | |
State and municipals (2) | | $ | 7,845 | | | 6.71 | % | $ | 16,077 | | | 7.43 | % | $ | 22,590 | | | 6.07 | % | $ | 20,305 | | | 6.22 | % |
Pass-through mortgage securities | | | 33 | | | 5.85 | | | 11,547 | | | 3.84 | | | 4,036 | | | 4.71 | | | 5,186 | | | 5.36 | |
Collateralized mortgage obligations | | | — | | | — | | | 232 | | | 4.24 | | | — | | | — | | | 81,629 | | | 4.87 | |
| |
|
| |
|
| |
|
| |
|
| |
|
| |
|
| |
|
| |
|
| |
| | $ | 7,878 | | | 6.70 | % | $ | 27,856 | | | 5.92 | % | $ | 26,626 | | | 5.86 | % | $ | 107,120 | | | 5.15 | % |
| |
|
| |
|
| |
|
| |
|
| |
|
| |
|
| |
|
| |
|
| |
| | | | | | | | | | | | | | | | | | | | | | | | | |
| | Principal Maturing(1) | |
| |
| |
| | Within
One Year | | After One But
Within Five Years | | After Five But
Within Ten Years | | After
Ten Years | |
| |
| |
| |
| |
| |
| | Amount | | Yield | | Amount | | Yield | | Amount | | Yield | | Amount | | Yield | |
| |
| |
| |
| |
| |
| |
| |
| |
| |
| | (dollars in thousands) | |
Held-to-Maturity Securities (Fair Value) | | | | | | | | | | | | | | | | | | | | | | | | | |
State and municipals (2) | | $ | 7,973 | | | 6.71 | % | $ | 16,700 | | | 7.43 | % | $ | 23,271 | | | 6.07 | % | $ | 20,353 | | | 6.22 | % |
Pass-through mortgage securities | | | 33 | | | 5.85 | | | 11,680 | | | 3.84 | | | 4,186 | | | 4.71 | | | 5,349 | | | 5.36 | |
Collateralized mortgage obligations | | | — | | | — | | | 233 | | | 4.24 | | | — | | | — | | | 82,862 | | | 4.87 | |
| |
|
| |
|
| |
|
| |
|
| |
|
| |
|
| |
|
| |
|
| |
| | $ | 8,006 | | | 6.70 | % | $ | 28,613 | | | 5.92 | % | $ | 27,457 | | | 5.86 | % | $ | 108,564 | | | 5.15 | % |
| |
|
| |
|
| |
|
| |
|
| |
|
| |
|
| |
|
| |
|
| |
| | | | | | | | | | | | | | | | | | | | | | | | | |
| | Principal Maturing(1) | |
| |
| |
| | Within
One Year | | After One But
Within Five Years | | After Five But
Within Ten Years | | After
Ten Years | |
| |
| |
| |
| |
| |
| | Amount | | Yield | | Amount | | Yield | | Amount | | Yield | | Amount | | Yield | |
| |
| |
| |
| |
| |
| |
| |
| |
| |
| | (dollars in thousands) | |
Available-for-Sale Securities (Fair Value) | | | | | | | | | | | | | | | | | | | | | | | | | |
U.S. government agencies | | $ | — | | | — | % | $ | — | | | — | % | $ | 33,685 | | | 5.24 | % | $ | — | | | — | % |
State and municipals (2) | | | 6,295 | | | 7.11 | | | 27,434 | | | 7.06 | | | 17,661 | | | 6.78 | | | 25,251 | | | 6.45 | |
Pass-through mortgage securities | | | — | | | — | | | — | | | — | | | 20,470 | | | 4.76 | | | 104,300 | | | 5.64 | |
Collateralized mortgage obligations | | | — | | | — | | | — | | | — | | | — | | | — | | | 143,677 | | | 4.56 | |
| |
|
| |
|
| |
|
| |
|
| |
|
| |
|
| |
|
| |
|
| |
| | $ | 6,295 | | | 7.11 | % | $ | 27,434 | | | 7.06 | % | $ | 71,816 | | | 5.48 | % | $ | 273,228 | | | 5.15 | % |
| |
|
| |
|
| |
|
| |
|
| |
|
| |
|
| |
|
| |
|
| |
| |
(1) | Maturities shown are stated maturities, except in the case of municipal securities which are shown at the earlier of their stated maturity or pre-refunded dates. Securities backed by mortgages, which include the pass-through mortgage securities and collateralized mortgage obligations shown above, are expected to have substantial periodic repayments resulting in weighted average lives considerably shorter than would be surmised from the above table. |
| |
(2) | Yields on tax-exempt state and municipal securities have been computed on a tax-equivalent basis. |
59
NOTE C – LOANS
The following table sets forth changes in the Bank’s allowance for loan losses.
| | | | | | | | | | |
| | Year ended December 31, | |
| |
| |
| | 2008 | | 2007 | | 2006 | |
| |
| |
| |
| |
| | (dollars in thousands) | |
Balance, beginning of year | | $ | 4,453 | | $ | 3,891 | | $ | 3,282 | |
| |
|
| |
|
| |
|
| |
Loans charged off: | | | | | | | | | | |
Commercial and industrial | | | 275 | | | — | | | 65 | |
Other | | | 50 | | | 14 | | | 11 | |
| |
|
| |
|
| |
|
| |
| | | 325 | | | 14 | | | 76 | |
| |
|
| |
|
| |
|
| |
Recoveries of loans charged off: | | | | | | | | | | |
Other | | | 3 | | | 1 | | | 15 | |
| |
|
| |
|
| |
|
| |
| | | 3 | | | 1 | | | 15 | |
| |
|
| |
|
| |
|
| |
Net chargeoffs | | | (322 | ) | | (13 | ) | | (61 | ) |
Provision for loan losses | | | 1,945 | | | 575 | | | 670 | |
| |
|
| |
|
| |
|
| |
Balance, end of year | | $ | 6,076 | | $ | 4,453 | | $ | 3,891 | |
| |
|
| |
|
| |
|
| |
| | | | | | | | | | |
Ratio of net chargeoffs to average loans outstanding | | | .06 | % | | .00 | % | | .01 | % |
| |
|
| |
|
| |
|
| |
The following tables set forth information regarding individually impaired loans.
| | | | | | | | | | |
| | December 31, | | | |
| |
| | | |
| | 2008 | | 2007 | | | |
| |
| |
| | | |
| | (in thousands) | | | |
Impaired loans at year end: | | $ | 744 | | $ | 397 | | | | |
With no allocated allowance for loan losses | | | 1,455 | | | 987 | | | | |
| |
|
| |
|
| | | | |
With an allocated allowance for loan losses | | $ | 2,199 | | $ | 1,384 | | | | |
| |
|
| |
|
| | | | |
| | | | | | | | | | |
Amount of allocated allowance for loan losses | | $ | 355 | | $ | 104 | | | | |
| | | | | | | | | | |
| | Year ended December 31, | |
| |
| |
| | 2008 | | 2007 | | 2006 | |
| |
| |
| |
| |
| | (in thousands) | |
Average of individually impaired loans during year | | $ | 1,975 | | $ | 1,538 | | $ | 2,327 | |
Interest income recognized while impaired | | | 158 | | | 115 | | | 180 | |
All interest income recorded by the Corporation during 2008, 2007 and 2006 on loans considered to be impaired was generally recognized using the accrual method of accounting.
Nonaccrual loans and loans past due 90 days or more and still accruing are as follows:
| | | | | | | | | | |
| | December 31, | | | |
| |
| | | |
| | 2008 | | 2007 | | | |
| |
| |
| | | |
| | (in thousands) | | | |
Nonaccrual loans | | $ | 112 | | $ | 257 | | | | |
Loans past due 90 days or more and still accruing | | | 42 | | | 95 | | | | |
| |
|
| |
|
| | | | |
| | $ | 154 | | $ | 352 | | | | |
| |
|
| |
|
| | | | |
Certain directors, including their immediate families and companies in which they are principal owners, and executive officers were loan customers of the Bank during 2008 and 2007. The aggregate amount of these loans was $2,374,000 and $2,554,000 at December 31, 2008 and 2007, respectively. During 2008, $22,000 of new loans to such persons were made and repayments totaled $202,000. There were no loans to directors or executive officers which were nonaccruing at December 31, 2008 or 2007.
60
NOTE D – PREMISES AND EQUIPMENT
Bank premises and equipment consist of the following:
| | | | | | | | | | | |
| | December 31, | |
| |
| |
| | 2008 | | 2007 | |
| |
| |
| |
| | (in thousands) | |
Land | | | $ | 1,650 | | | | $ | 1,650 | | |
Buildings and improvements | | | | 7,741 | | | | | 5,439 | | |
Leasehold improvements | | | | 4,654 | | | | | 4,264 | | |
Furniture and equipment | | | | 15,265 | | | | | 13,741 | | |
Construction in process | | | | 932 | | | | | 1,646 | | |
| |
|
|
|
| |
|
|
|
| |
| | | | 30,242 | | | | | 26,740 | | |
Accumulated depreciation and amortization | | | | (17,649 | ) | | | | (15,818 | ) | |
| |
|
|
|
| |
|
|
|
| |
| | | $ | 12,593 | | | | $ | 10,922 | | |
| |
|
|
|
| |
|
|
|
| |
A building occupied by one of the Bank’s branch offices is leased from a director of the Corporation and the Bank. The lease expires on October 31, 2012 and provides for annual base rent of $32,983 for the year ending October 31, 2009. In addition to base rent, the Bank is responsible for its proportionate share of the real estate taxes on the building in which the leased premises are located. The Corporation believes that the foregoing is comparable to the rent that would be charged by an unrelated third party.
NOTE E – DEPOSITS
The following table sets forth the remaining maturities of the Bank’s time deposits.
| | | | | | | | | | | | | | | | |
| | Amount | |
| |
| |
| | Less than
$100,000 | | $100,000 or
More | | Total | |
| |
| |
| |
| |
| | (in thousands) | |
2009 | | | $ | 44,080 | | | | $ | 123,753 | | | | $ | 167,833 | | |
2010 | | | | 3,975 | | | | | 2,061 | | | | | 6,036 | | |
2011 | | | | 2,543 | | | | | 1,935 | | | | | 4,478 | | |
2012 | | | | 1,522 | | | | | 1,374 | | | | | 2,896 | | |
2013 | | | | 5,877 | | | | | 4,827 | | | | | 10,704 | | |
Thereafter | | | | 105 | | | | | 100 | | | | | 205 | | |
| |
|
|
|
| |
|
|
|
| |
|
|
|
| |
| | | $ | 58,102 | | | | $ | 134,050 | | | | $ | 192,152 | | |
| |
|
|
|
| |
|
|
|
| |
|
|
|
| |
The aggregate amount of deposit account overdrafts included in other loans on the consolidated balance sheet was $876,000 and $1,546,000 at December 31, 2008 and 2007, respectively.
NOTE F – BORROWED FUNDS
The following table summarizes borrowed funds at December 31, 2008 and 2007.
| | | | | | | | | | | |
| | December 31, | |
| |
| |
| | 2008 | | 2007 | |
| |
| |
| |
| | (in thousands) | |
Short-term borrowings: | | | | | | | |
Securities sold under repurchase agreements | | | $ | 18,122 | | | | $ | 12,110 | | |
Federal Home Loan Bank advances | | | | 106,000 | | | | | — | | |
| | |
|
| | | |
|
| | |
| | | | 124,122 | | | | | 12,110 | | |
Long-term debt: | | | | | | | | | | | |
Securities sold under repurchase agreements | | | | 127,000 | | | | | 80,000 | | |
| | |
|
| | | |
|
| | |
| | | $ | 251,122 | | | | $ | 92,110 | | |
| | |
|
| | | |
|
| | |
Accrued interest payable on borrowed funds is included in “accrued expenses and other liabilities” in the Consolidated Balance Sheets, and amounted to $621,000 and $356,000, respectively, at December 31, 2008 and 2007.
61
Securities Sold Under Repurchase Agreements. Securities sold under repurchase agreements are financing arrangements with contractual maturities between one day and ten years that are collateralized by mortgage-backed securities. With the exception of those repurchase agreements with embedded interest rate caps as described hereinafter, securities sold under repurchase agreements have fixed rates of interest. At maturity, the securities underlying the agreements will be returned to the Bank. The following table sets forth information concerning securities sold under repurchase agreements.
| | | | | | | | | | | |
| | 2008 | | 2007 | |
| |
| |
| |
| | (dollars in thousands) | |
|
Average daily balance during the year | | | $ | 130,010 | | | | $ | 31,324 | | |
Average interest rate during the year | | | | 3.89 | % | | | | 4.32 | % | |
Maximum month-end balance during the year | | | $ | 151,439 | | | | $ | 99,058 | | |
Weighted average interest rate at year-end | | | | 3.82 | % | | | | 4.34 | % | |
The following table summarizes the contractual maturities and weighted average interest rates of securities sold under repurchase agreements and the amortized cost and fair value, including accrued interest, of the securities collateralizing the repurchase agreements at December 31, 2008.
| | | | | | | | | | | | | | | | | | | | | | | | | | | | | |
| | | | | | | | Securities Collateral | |
| | | | | | | |
| |
| | Borrowing
Amount | | Weighted
Average
Rate | | Pass-through
Mortgage Securities | | Collateralized
Mortgage Obligations | |
| | |
| |
| |
Contractual Maturity | | | Amortized
Cost | | Fair
Value | | Amortized
Cost | | Fair
Value | |
| |
| |
| |
| |
| |
| |
| |
| | (dollars in thousands) | |
Overnight | | $ | | 18,122 | | | 0.81 | % | | $ | | — | | | $ | | — | | | $ | | 18,652 | | | $ | | 18,905 | | |
| |
|
|
|
| |
| | |
|
|
|
| |
|
|
|
| |
|
|
|
| |
|
|
|
| |
| | | | | | | | | | | | | | | | | | | | | | | | | | | | | |
2011 | | | | 12,000 | | | 2.92 | | | | | | | | | | | | | | | | | | | | | | |
2012 | | | | 50,000 | | | 4.47 | | | | | | | | | | | | | | | | | | | | | | |
2013 | | | | 10,000 | | | 4.19 | | | | | | | | | | | | | | | | | | | | | | |
Thereafter | | | | 55,000 | | | 4.37 | | | | | | | | | | | | | | | | | | | | | | |
| |
|
|
|
| |
| | |
|
|
|
|
|
|
|
|
| |
|
|
|
| |
|
|
|
| |
| | | | 127,000 | | | 4.25 | | | | | 77,660 | | | | | 79,148 | | | | | 70,033 | | | | | 69,178 | | |
| |
|
|
|
| |
| | |
|
|
|
|
|
|
|
|
| |
|
|
|
| |
|
|
|
| |
| | | | | | | | | | | | | | | | | | | | | | | | | | | | | |
| | $ | | 145,122 | | | 3.82 | % | | $ | | 77,660 | | | $ | | 79,148 | | | $ | | 88,685 | | | $ | | 88,083 | | |
| |
|
|
|
| |
| | |
|
|
|
| |
|
|
|
| |
|
|
|
| |
|
|
|
| |
The repurchase agreements maturing in 2012 are callable in 2010, the repurchase agreements maturing in 2013 are callable in 2011, and the repurchase agreements maturing after 2013 are callable beginning in 2010.
$75 million of the repurchase agreements have embedded interest rate caps with a notional amount of $120 million and a weighted average LIBOR strike rate of 4.46%. The interest rate on the repurchase agreements will, as a result of the embedded caps, be reduced on a quarterly basis by the excess, if any, of 3 month LIBOR at the beginning of the quarter over the strike rate on the cap. However, the interest rate on the repurchase agreements can never go below zero. Since the economic characteristics and risks of the embedded caps are clearly and closely related to the economic characteristics and risks of the repurchase agreements, changes in the fair value of the caps are not recognized in earnings in the period of change.
Because the Bank’s loans and investment securities generally reprice slower than its interest-bearing liabilities, an immediate increase in interest rates uniformly across the yield curve should initially have a negative effect on net interest income. The purpose of the embedded interest rate caps is to potentially reduce the Corporation’s exposure in the event of an increase in interest rates.
Federal Home Loan Bank Advances. At December 31, 2008,the Bank had $106,000,000 of outstanding FHLB advances which mature in January 2009 and are collateralized by $111 million of CMOs and pass-through mortgage securities. The following table sets forth information concerning FHLB advances.
| | | | | | | |
| | December 31, | |
| |
| |
| | 2008 | | 2007 | |
| |
| |
| |
| | (dollars in thousands) | |
Average daily balance during the year | | | $ | 21,306 | | | | $ | 1,381 | | |
Average interest rate during the year | | | | 93 | % | | | | 4.86 | % | |
Maximum month-end balance during the year | | | $ | 110,000 | | | | $ | 14,000 | | |
Weighted average interest rate at year-end | | | | 44 | % | | | | N/A | | |
62
Other Borrowings. The Bank had no other borrowings at December 31, 2008 or 2007. In 2008, the average balance of other borrowings amounted to $5,959,000 with an average interest rate of 2.22%. The funds were borrowed predominantly at the Federal Reserve Bank discount window. There were no other borrowing transactions in 2007.
NOTE G – INCOME TAXES
The Corporation, the Bank, and the Bank’s subsidiaries with the exception of the REIT, file a consolidated federal income tax return. Income taxes charged to earnings in 2008, 2007, and 2006 had effective tax rates of 26.3%, 20.1%, and 19.9%, respectively. The following table sets forth a reconciliation of the statutory Federal income tax rate to the Corporation’s effective tax rate.
| | | | | | | | | | |
| | Year Ended December 31, | |
| |
| |
| | 2008 | | 2007 | | 2006 | |
| |
| |
| |
| |
Statutory federal income tax rate | | 34.0 | % | | 34.0 | % | | 34.0 | % | |
State and local income taxes, net of federal income tax benefit | | 5.5 | | | 1.4 | | | .8 | | |
Tax-exempt income, net of disallowed cost of funding | | (12.6 | ) | | (15.1 | ) | | (15.3 | ) | |
Other | | (0.6 | ) | | (0.2 | ) | | .4 | | |
| |
| | |
| | |
| | |
| | 26.3 | % | | 20.1 | % | | 19.9 | % | |
| |
| | |
| | |
| | |
The increase in the effective tax rate in 2008 is the result of the Corporation losing the tax benefit derived from its REIT entity and tax-exempt income now representing a smaller percentage of income before income taxes. The loss of the REIT tax benefit resulted from a change in New York State tax law effective January 1, 2008.
Provision For Income Taxes. The following table sets forth the components of the provision for income taxes.
| | | | | | | | | | | | | | | | |
| | Year Ended December 31, | |
| |
| |
| | 2008 | | 2007 | | 2006 | |
| |
| |
| |
| |
| | (in thousands) | |
Current: | | | | | | | | | | |
Federal | | | $ | 3,388 | | | | $ | 2,607 | | | | $ | 2,800 | | |
State and local | | | | 1,469 | | | | | 288 | | | | | 196 | | |
| | |
|
| | | |
|
| | | |
|
| | |
| | | | 4,857 | | | | | 2,895 | | | | | 2,996 | | |
| | |
|
| | | |
|
| | | |
|
| | |
Deferred: | | | | | | | | | | | | | | | | |
Federal | | | | (217 | ) | | | | (9 | ) | | | | (188 | ) | |
State and local | | | | (12 | ) | | | | 9 | | | | | (23 | ) | |
| | |
|
| | | |
|
| | | |
|
| | |
| | | | (229 | ) | | | | — | | | | | (211 | ) | |
| | |
|
| | | |
|
| | | |
|
| | |
| | | $ | 4,628 | | | | $ | 2,895 | | | | $ | 2,785 | | |
| | |
|
| | | |
|
| | | |
|
| | |
Net Deferred Tax Asset or Liability. The following table sets forth the components of the Bank’s net deferred tax asset or liability.
| | | | | | | | | | | |
| | December 31, | |
| |
| |
| | 2008 | | 2007 | |
| |
| |
| |
| | (in thousands) | |
Deferred tax assets: | | | | | | | |
Allowance for loan losses | | | $ | 2,041 | | | | $ | 1,244 | | |
Pension obligation | | | | 1,193 | | | | | — | | |
Stock-based compensation | | | | 423 | | | | | 255 | | |
Supplemental executive retirement expense | | | | 23 | | | | | 13 | | |
Directors’ retirement expense | | | | 87 | | | | | 91 | | |
Depreciation | | | | — | | | | | 21 | | |
Accrued rent expense | | | | 53 | | | | | — | | |
Other | | | | 21 | | | | | 12 | | |
| | |
| | | |
| | |
| | | | 3,841 | | | | | 1,636 | | |
| | | | | |
Valuation allowance | | | | — | | | | | — | | |
| | |
| | | |
| | |
| | | | 3,841 | | | | | 1,636 | | |
| | |
| | | |
| | |
Deferred tax liabilities: | | | | | | | | | | | |
Prepaid pension | | | | — | | | | | 1,306 | | |
Unrealized gains on available-for-sale securities | | | | 2,154 | | | | | 1,094 | | |
Depreciation | | | | 49 | | | | | — | | |
| | |
| | | |
| | |
| | | | | | | | | | | |
| | | | 2,203 | | | | | 2,400 | | |
| | |
| | | |
| | |
Net deferred tax asset (liability) | | | $ | 1,638 | | | | $ | (764 | ) | |
| | |
| | | |
| | |
63
The Corporation is subject to U.S. federal income tax as well as New York State and New York City income taxes. The Corporation is not subject to examination by taxing authorities for years before 2005 and did not have any amounts accrued for interest and penalties due taxing authorities at December 31, 2008.
NOTE H – REGULATORY MATTERS
Minimum Regulatory Capital Requirements. The Corporation (on a consolidated basis) and the Bank are subject to various regulatory capital requirements administered by the federal banking agencies. Failure to meet minimum capital requirements can initiate certain mandatory and possibly additional discretionary actions by the regulators that, if undertaken, could have a direct material effect on the Corporation’s and Bank’s financial statements. Under capital adequacy guidelines and, with respect to the Bank, the regulatory framework for prompt corrective action, the Corporation and the Bank must meet specific capital guidelines that involve quantitative measures of their assets, liabilities, and certain off-balance-sheet items as calculated under regulatory accounting practices. The capital amounts and classification are also subject to qualitative judgments by the regulators about components, risk weightings, and other factors.
Quantitative measures established by regulation to ensure capital adequacy require the Corporation and the Bank to maintain minimum amounts and ratios (set forth in the following table) of total and Tier 1 capital (as defined in the regulations) to risk weighted assets (as defined) and of Tier 1 capital to average assets (as defined).
As of December 31, 2008, the most recent notification from the Federal Deposit Insurance Corporation categorized the Bank as well capitalized under the regulatory framework for prompt corrective action. To be categorized as well capitalized, an institution must maintain minimum total risk-based, Tier 1 risk-based, and Tier 1 leverage ratios as set forth in the following table. There are no conditions or events since the notification that management believes have changed the Bank’s category. The Corporation’s and the Bank’s actual capital amounts and ratios at December 31, 2008 and 2007 are also presented in the table.
| | | | | | | | | | | | | | | | | | | | | | | | | |
| | 2008 | |
| |
| |
| | Actual Capital | | Minimum
Capital
Requirement | | Minimum To Be Well
Capitalized Under Prompt
Corrective Action Provisions | |
| |
| |
| |
| |
| | (dollars in thousands) | |
| | Amount | | Ratio | | Amount | | Ratio | | Amount | | Ratio | |
| |
| |
| |
| |
| |
| |
| |
Total Capital to Risk Weighted Assets: | | | | | | | | | | | | | | | | | | | | | | | | | |
Consolidated | | | $ | 109,990 | | | 17.79 | % | | | $ | 49,470 | | | 8.00 | % | | | | N/A | | | N/A | | |
Bank | | | | 106,748 | | | 17.27 | | | | | 49,435 | | | 8.00 | | | | $ | 61,794 | | | 10.00 | % | |
Tier 1 Capital to Risk Weighted Assets: | | | | | | | | | | | | | | | | | | | | | | | | | |
Consolidated | | | | 103,914 | | | 16.80 | | | | | 24,735 | | | 4.00 | | | | | N/A | | | N/A | | |
Bank | | | | 100,672 | | | 16.29 | | | | | 24,718 | | | 4.00 | | | | | 37,076 | | | 6.00 | | |
Tier 1 Capital to Average Assets: | | | | | | | | | | | | | | | | | | | | | | | | | |
Consolidated | | | | 103,914 | | | 8.29 | | | | | 50,144 | | | 4.00 | | | | | N/A | | | N/A | | |
Bank | | | | 100,672 | | | 8.03 | | | | | 50,127 | | | 4.00 | | | | | 62,659 | | | 5.00 | | |
| | | | | | | | | | | | | | | | | | | | | | | | | |
| | 2007 | |
| |
| |
| | Actual Capital | | Minimum
Capital
Requirement | | Minimum To Be Well
Capitalized Under Prompt
Corrective Action Provisions | |
| |
| |
| |
| |
| | (dollars in thousands) | |
| | Amount | | Ratio | | Amount | | Ratio | | Amount | | Ratio | |
| |
| |
| |
| |
| |
| |
| |
Total Capital to Risk Weighted Assets: | | | | | | | | | | | | | | | | | | | |
Consolidated | | | $ | 104,918 | | | 20.79 | % | | | $ | 40,379 | | | 8.00 | % | | | | N/A | | | N/A | | |
Bank | | | | 102,850 | | | 20.38 | | | | | 40,377 | | | 8.00 | | | | $ | 50,471 | | | 10.00 | % | |
Tier 1 Capital to Risk Weighted Assets: | | | | | | | | | | | | | | | | | | | | | | | | | |
Consolidated | | | | 100,465 | | | 19.90 | | | | | 20,189 | | | 4.00 | | | | | N/A | | | N/A | | |
Bank | | | | 98,397 | | | 19.50 | | | | | 20,188 | | | 4.00 | | | | | 30,283 | | | 6.00 | | |
Tier 1 Capital to Average Assets: | | | | | | | | | | | | | | | | | | | | | | | | | |
Consolidated | | | | 100,465 | | | 9.53 | | | | | 42,179 | | | 4.00 | | | | | N/A | | | N/A | | |
Bank | | | | 98,397 | | | 9.33 | | | | | 42,171 | | | 4.00 | | | | | 52,714 | | | 5.00 | | |
64
Other Matters. The Corporation’s principal source of funds for dividend payments is dividends received from the Bank. Banking regulations limit the amount of dividends that may be paid without prior approval of regulatory agencies. Under these regulations, the amount of dividends that may be paid in any calendar year is limited to the current year’s net profits, combined with the retained net profits of the preceding two years, subject to the minimum capital requirements described above. During 2009, the Bank could, without prior approval, declare dividends of approximately $5,872,000 plus any 2009 net profits retained to the date of the dividend declaration.
Regulation D of the Board of Governors of The Federal Reserve System requires banks to maintain reserves against certain deposit balances. The Bank’s average reserve requirement for 2008 was approximately $9,644,000.
Under national banking laws and related statutes, the Bank is limited as to the amount it may loan to the Corporation, unless such loans are collateralized by specified obligations. At December 31, 2008, the maximum amount available for transfer from the Bank to the Corporation in the form of loans approximated $14,894,000.
NOTE I – SHAREHOLDER PROTECTION RIGHTS PLAN
On July 18, 2006, the Board of Directors of the Corporation (the “Board”) unanimously determined to renew the Corporation’s Shareholder Protection Rights Plan and declared a distribution of one right (“Right”) for each share of the Corporation’s common stock (the “Common Stock”) outstanding on August 1, 2006.
In the absence of an event of the type described below, the Rights will be evidenced by and trade with the Common Stock and will not be exercisable. However, the Rights will separate from the Common Stock and become exercisable following the earlier of (1) the tenth business day, or such later date as the Board may decide, after any person or persons (collectively referred to as “person”) commences a tender offer that would result in such person holding a total of 20% or more of the outstanding Common Stock, or (2) ten business days after, or such earlier or later date as the Board may decide, the announcement by the Corporation that any person has acquired 20% or more of the outstanding Common Stock.
When separated from the Common Stock, each Right will entitle the holder to purchase one share of Common Stock for $75 (the “Exercise Price”). However, in the event that the Corporation has announced that any person has acquired 20% or more of the outstanding Common Stock, the Rights owned by that person will be automatically void and each other Right will automatically become a right to buy, for the Exercise Price, that number of shares of Common Stock having a market value of twice the Exercise Price. Also, if any person acquires 20% or more of the outstanding Common Stock, the Board can require that, in lieu of exercise, each outstanding Right be exchanged for one share of Common Stock.
The Rights may be redeemed by action of the Board at a price of $.01 per Right at any time prior to announcement by the Corporation that any person has acquired 20% or more of the outstanding Common Stock. The Exercise Price and the number of Rights outstanding are subject to adjustment to prevent dilution. The Rights expire ten years from the date of their issuance.
NOTE J – STOCK-BASED COMPENSATION
The Corporation has two share-based compensation plans which are described below. The Corporation’s 2006 Stock Compensation Plan (the “2006 Plan”) was approved by its shareholders on April 18, 2006 as a successor to the 1996 Stock Option and Appreciation Rights Plan (the “1996 Plan”). The 2006 Plan permits the granting of stock options, stock appreciation rights, restricted stock, and restricted stock units (“RSUs”) to employees and non-employee directors for up to 600,000 shares of common stock of which 342,950 shares remain available for grant at December 31, 2008. The number of awards that can be granted under the 2006 Plan to any one person in any one fiscal year is limited to 70,000 shares. Under the terms of the 2006 Plan, stock options and stock appreciation rights can not have an exercise price that is less than 100% of the fair market value of one share of the underlying common stock on the date of grant. The term and/or vesting of awards made under the 2006 Plan will be determined from time to time in accordance with rules adopted by the Corporation’s Compensation Committee and be in compliance with the applicable provisions, if any, of the Internal Revenue Code. Thus far, the Compensation Committee has used a five year vesting period and a ten year term for stock options granted under the 2006 Plan and has made the ability to convert RSUs into shares of common stock and the related conversion ratio contingent upon the financial performance of the Corporation in the third year of the three calendar year period beginning in the year in which the RSUs were awarded. Notwithstanding anything to the contrary in any award agreement, awards under the 2006 Plan will become immediately exercisable or will immediately vest, as the case may be, in the event of a change in control and, in accordance with the terms of the related award agreements, all awards granted to date under the 2006 Plan will become immediately exercisable or will immediately vest, as applicable, in the event of retirement, total and permanent disability, or death.
65
The Corporation’s 1996 Plan permitted the granting of stock options, with or without stock appreciation rights attached, and stand alone stock appreciation rights to employees and non-employee directors for up to 1,080,000 shares of common stock. The number of stock options and stock appreciation rights that could have been granted under the 1996 Plan to any one person in any one fiscal year was limited to 50,000. Each option granted under the 1996 Plan was granted at a price equal to the fair market value of one share of the Corporation’s stock on the date of grant. Options granted under the 1996 Plan on or before December 31, 2000 became exercisable in whole or in part commencing six months from the date of grant and ending ten years after the date of grant. Options granted under the 1996 Plan in January 2005 became exercisable in whole or in part commencing ninety days from the date of grant and ending ten years after the date of grant. By the terms of their grant, all other options under the 1996 Plan were granted with a three year vesting period and a ten year expiration date. However, vesting is subject to acceleration in the event of a change in control, retirement, death, disability, and certain other limited circumstances.
Fair Value of Stock Option Awards. The grant date fair value of option awards is estimated on the date of grant using the Black-Scholes option pricing model. The values of awards made in 2008, 2007 and 2006, as well as the assumptions utilized in determining such values, are as follows:
| | | | | | | |
| | 2008 | | 2007 | | 2006 | |
| |
| |
| |
| |
Grant date fair value | | $6.72 | | $6.05 | | $5.98 | |
Expected volatility | | 45.42 | % | 25.24 | % | 25.11 | % |
Expected dividends | | 3.24 | % | 2.06 | % | 2.09 | % |
Expected term (in years) | | 6.82 | | 6.70 | | 6.70 | |
Risk-free interest rate | | 3.49 | % | 4.53 | % | 5.07 | % |
Expected volatility was based on historical volatility for the expected term of the options. The Corporation used historical data to estimate the expected term of options granted. The risk-free interest rate is the implied yield at the time of grant on U.S. Treasury zero-coupon issues with a remaining term equal to the expected term of the options.
Fair Value of Restricted Stock Units. The fair value of restricted stock units is based on the market price of the shares underlying the awards on the grant date, discounted for dividends which are not paid on restricted stock units.
Compensation Expense. Compensation expense for stock options is recognized ratably over the five-year vesting period or the period from the grant date to the participant’s eligible retirement date, whichever is shorter. Compensation expense for RSUs is recognized over the three-year performance period and adjusted periodically throughout the period to reflect the estimated number of shares of the Corporation’s common stock into which the RSUs will ultimately be convertible. However, if the period between the grant date and the grantee’s eligible retirement date is less than three years, compensation expense is recognized ratably over this shorter period. For options outstanding and not yet exercisable, the Corporation assumes an annual forfeiture rate of 1.26% in determining compensation expense. The Corporation’s income statement reflects compensation expense for share-based payments of $450,000, $506,000 and $210,000 in 2008, 2007 and 2006, respectively, and related income tax benefits of $178,000, $200,000 and $68,000, respectively.
Stock Option Activity. On January 22, 2008, the Corporation’s board of directors granted 78,451 nonqualified stock options under the 2006 Plan. The options were granted at a price equal to the fair market value of one share of the Corporation’s stock on the date of grant.
A summary of options outstanding under the Corporation’s stock compensation plans as of December 31, 2008 and changes during the year then ended is presented below.
| | | | | | | | | | | |
| | Number of
Options | | Weighted-
Average
Exercise
Price | | Weighted-
Average
Remaining
Contractual
Term (yrs.) | | Aggregate
Intrinsic
Value
(in thousands) | |
| |
| |
| |
| |
| |
Outstanding at January 1, 2008 | | 516,266 | | $ | 18.90 | | | | | | |
Granted | | 78,451 | | | 18.50 | | | | | | |
Exercised | | (37,328 | ) | | 14.07 | | | | | | |
Forfeited or expired | | (57,107 | ) | | 20.26 | | | | | | |
| |
| |
|
| | | | | | |
Outstanding at December 31, 2008 | | 500,282 | | $ | 19.04 | | 5.84 | | $ | 2,364 | |
| |
| |
|
| |
| |
|
| |
Exercisable at December 31, 2008 | | 345,214 | | $ | 18.61 | | 4.73 | | $ | 1,783 | |
| |
| |
|
| |
| |
|
| |
66
The total intrinsic value of options exercised in 2008, 2007, and 2006 was $232,000, $371,000 and $233,000, respectively. The total fair value of options vested during the years ended December 31, 2008, 2007, and 2006 was $194,000, $251,000 and $102,000, respectively.
Restricted Stock Activity. On January 22, 2008, the Corporation’s Board of Directors granted 24,241 RSUs under the 2006 Plan. The Corporation’s financial performance for 2010 will determine the number of shares of common stock, if any, into which the RSUs will ultimately be converted. The maximum number of shares that could be issued upon conversion of the RSUs is reflected as granted shares in the table that follows.
| | | | | | |
| | Number of
Shares | | Weighted-
Average
Grant-Date
Fair Value | |
| |
| |
| |
Nonvested at January 1, 2008 | | 28,306 | | $ | 21.06 | |
Granted | | 24,241 | | | 16.81 | |
Vested | | (1,356 | ) | | 18.99 | |
Forfeited | | (5,121 | ) | | 19.25 | |
| |
| |
|
| |
Nonvested at December 31, 2008 | | 46,070 | | $ | 19.10 | |
| |
| |
|
| |
The total fair value of shares vested during the year ended December 31, 2008 was $26,000. No shares were vested during the years ended December 31, 2007 or 2006.
Unrecognized Compensation Cost. As of December 31, 2008, there was $899,000 of total unrecognized compensation cost related to nonvested equity awards. The cost is expected to be recognized over a weighted-average period of 1.42 years.
Cash Received and Tax Benefits Realized. Cash received from option exercises in 2008, 2007, and 2006 was $525,000, $694,000 and $402,000, respectively. The actual tax benefit realized for the tax deductions from option exercises in 2008, 2007, and 2006 was $21,000, $76,000 and $17,000, respectively.
Other.No cash was used to settle stock options in 2008 or 2007. The Corporation uses newly issued shares to settle stock option exercises and currently plans to use newly issued shares upon the conversion of restricted stock units.
NOTE K – RETIREMENT PLANS
The Bank has a 401(k) plan, defined benefit pension plan and supplemental executive retirement plan. Employees are eligible to participate in the 401(k) plan provided they are at least 21 years of age and have completed one year of service in which they worked 1,000 hours if full-time and 700 hours if part-time. Participants may elect to contribute, on a tax-deferred basis, up to 25% of gross compensation, as defined, subject to the limitations of Section 401(k) of the Internal Revenue Code. The Bank may, at its sole discretion, make matching contributions to each participant’s account based on the amount of the participant’s tax deferred contributions. Participants are fully vested in their elective contributions and, after five years of participation in the 401(k) plan, are fully vested (20% vesting per year) in the matching contributions, if any, made by the Bank. Matching contributions were $291,000, $279,000, and $179,000 for 2008, 2007, and 2006, respectively.
The provisions of the Bank’s defined benefit pension plan (the “Pension Plan” or the “Plan”) are governed by the rules and regulations contained in the Prototype Plan of the New York State Bankers Retirement System (the “Retirement System”) and the Retirement System Adoption Agreement executed by the Bank. The Retirement System is overseen by a Board of Trustees (the “Trustees”) who meet quarterly and, among other things, set the investment policy guidelines. For investment purposes, the Pension Plan’s contributions are pooled with the contributions of the other participants in the Retirement System. Assets of the Pension Plan are invested in various debt and equity securities, the major categories of which are set forth in a table that follows. Employees are eligible to participate in the Pension Plan after attaining 21 years of age and completing 12 full months of service. Pension benefits are generally based on a percentage of average annual compensation during the period of creditable service. The Bank makes annual contributions to the Pension Plan in an amount sufficient to fund these benefits and participants contribute 2% of their compensation. The Bank’s funding method, the unit credit actuarial cost method, is consistent with the funding requirements of federal law and regulations. Employees become fully vested after four years of participation in the Pension Plan (no vesting occurs during the four-year period).
In September 2006, the Financial Accounting Standards Board (FASB) issued SFAS No. 158 “Employers’ Accounting for Defined Benefit Pension and Other Postretirement Plans – an amendment of FASB Statements No. 87, 88, 106 and 132(R).” This Statement requires that defined benefit plan assets and obligations be measured as of the date of
67
the employer’s fiscal year-end, starting in 2008. Through 2007, the Company utilized the early measurement date option available under FASB Statement No. 87 “Employers’ Accounting for Pensions”, and measured the funded status of the defined benefit plan assets and obligations as of September 30 each year. The impact of the change was not material.
Major Categories of Plan Assets. The following table sets forth the major categories of Plan assets as of the last two Plan year ends and the percentage of the total value of Plan assets accounted for by each.
| | | | | |
| | Percentage of Fair Value
of Total Plan Assets at: | |
| |
| |
| | 12/31/08 | | 12/31/07 | |
| |
| |
| |
Equity Securities | | 50 | % | 54 | % |
Debt Securities | | 43 | | 40 | |
All Other Assets | | 7 | | 6 | |
| |
| |
| |
| | 100 | % | 100 | % |
| |
| |
| |
The Retirement System uses two investment management firms, with one firm investing approximately 70% and the other firm investing approximately 30% of the total portfolio. The Retirement System investment objective is to exceed the investment benchmark in each asset category. Each firm operates under a separate written investment policy approved by the Trustees. The mix of equity and debt securities is determined from time to time by the Trustees based on a review of the Retirement System’s requirements.
The current target allocation percentage for equity securities is 60% but may vary from 50% to 70% based on the investment managers’ discretion. The equity portfolio includes, among other things, international securities and equities in a separately managed large cap core equity fund that is permitted to invest in a diversified range of securities in the US equity markets.
The current target allocation percentage for debt securities is 40% but may vary from 30% to 50% at the investment managers’ discretion. Fixed income investments include various debt securities included in a fixed income portfolio and a core bond fixed income fund. The fixed income portfolio operates with guidelines relating to types of debt securities, quality ratings, maturities, and single company and sector allocation limits. The portfolio investments in the core bond fixed income fund are limited to US Dollar denominated, fixed income securities and selective derivatives designed to have attributes similar to such fixed income securities.
Net Pension Cost. The following table sets forth the components of net periodic pension cost.
| | | | | | | | | | |
| | 2008 | | 2007 | | 2006 | |
| |
| |
| |
| |
| | (in thousands) | |
Service cost, net of plan participant contributions | | $ | 1,014 | | $ | 870 | | $ | 785 | |
Interest cost | | | 910 | | | 829 | | | 743 | |
Expected return on plan assets | | | (1,368 | ) | | (1,159 | ) | | (1,001 | ) |
Amortization of prior service cost | | | 20 | | | 20 | | | 20 | |
Amortization of net actuarial loss | | | — | | | — | | | 27 | |
| |
|
| |
|
| |
|
| |
Net pension cost | | $ | 576 | | $ | 560 | | $ | 574 | |
| |
|
| |
|
| |
|
| |
The estimated prior service costs and net actuarial loss for the defined benefit pension plan that will be amortized from accumulated other comprehensive income into net periodic benefit cost over the next fiscal year are $23,000 and $635,000, respectively.
Significant Actuarial Assumptions. The following tables set forth the significant actuarial assumptions used to determine the benefit obligations at year-end 2008, 2007 and 2006 and the benefit cost for each of the Plan years then ended.
| | | | | | | | | | |
Weighted average assumptions used to determine the
benefit obligation at year end | | 2008 | | 2007 | | 2006 | |
| |
| |
| |
| |
Discount rate | | | 6.00% | | | 5.75% | | | 5.75% | |
Rate of increase in compensation levels | | | 3.50% | | | 5.00% | | | 5.00% | |
| | | | | | | | | | |
Weighted average assumptions used to determine net pension cost | | 2008 | | 2007 | | 2006 | |
| |
| |
| |
| |
Discount rate | | | 5.75% | | | 5.75% | | | 5.50% | |
Rate of increase in compensation levels | | | 5.00% | | | 5.00% | | | 5.00% | |
Expected long-term rate of return on plan assets | | | 7.00% | | | 7.00% | | | 7.00% | |
68
The expected long-term rate-of-return on plan assets reflects long-term earnings expectations on the total assets currently in the Retirement System and contributions expected to be received by the Retirement System during the current plan year. In estimating the rate, appropriate consideration is given to historical returns earned by the Retirement System assets and the rates of return expected to be available for reinvestment. Average rates of return over the past 1, 3, 5 and 10 year periods were determined and subsequently adjusted to reflect current capital market assumptions and changes in investment allocations.
Funded Status of The Plan. The following table sets forth the change in the projected benefit obligation and Plan assets for each Plan year and, as of the end of each Plan year, the funded status of the Plan and accumulated benefit obligation.
| | | | | | | | | | |
| | 2008 | | 2007 | | 2006 | |
| |
| |
| |
| |
| | (in thousands) | |
Change in projected benefit obligation | | | | | | | | | | |
Projected benefit obligation at beginning of year | | $ | 16,139 | | $ | 14,727 | | $ | 13,794 | |
Service cost before plan participant contributions | | | 1,551 | | | 1,053 | | | 941 | |
Expenses | | | (183 | ) | | (146 | ) | | (105 | ) |
Interest cost | | | 1,137 | | | 829 | | | 743 | |
Benefits paid | | | (794 | ) | | (503 | ) | | (577 | ) |
Assumption changes | | | 428 | | | — | | | — | |
Experience loss (gain) and other | | | 466 | | | 179 | | | (69 | ) |
| |
|
| |
|
| |
|
| |
Projected benefit obligation at end of year | | | 18,744 | | | 16,139 | | | 14,727 | |
| |
|
| |
|
| |
|
| |
| | | | | | | | | | |
Change in plan assets | | | | | | | | | | |
Fair value of plan assets at beginning of year | | | 19,864 | | | 16,772 | | | 14,501 | |
Actual return on plan assets | | | (5,567 | ) | | 2,558 | | | 1,710 | |
Employer contributions | | | 2,427 | | | 1,000 | | | 1,087 | |
Plan participant contributions | | | 283 | | | 183 | | | 156 | |
Benefits paid | | | (794 | ) | | (503 | ) | | (577 | ) |
Expenses | | | (183 | ) | | (146 | ) | | (105 | ) |
| |
|
| |
|
| |
|
| |
Fair value of plan assets at end of year | | | 16,030 | | | 19,864 | | | 16,772 | |
| |
|
| |
|
| |
|
| |
| | | | | | | | | | |
Funded status at end of year | | $ | (2,714 | ) | $ | 3,725 | | $ | 2,045 | |
| |
|
| |
|
| |
|
| |
| | | | | | | | | | |
Accumulated Benefit Obligation | | $ | 16,404 | | $ | 12,944 | | $ | 11,779 | |
| |
|
| |
|
| |
|
| |
The net amount recognized in the balance sheet as of December 31, 2007 differs from the funded status in the above table due to an accrual of three additional months of pension expense. The Bank has a minimum required contribution to the Pension Plan for the Plan year ending September 30, 2009 of approximately $1,119,000, and its maximum tax deductible contribution is approximately $8,765,000. The Bank expects to make a contribution within that range by September 30, 2009, but the amount of such contribution has not yet been determined.
The net actuarial gain (loss) and prior service cost included in accumulated other comprehensive income as of December 31 consist of the following:
| | | | | | | |
| | 2008 | | 2007 | |
| |
| |
| |
| | (in thousands) | |
Net actuarial gain (loss) | | $ | (7,953 | ) | $ | 219 | |
Prior service cost | | | (132 | ) | | (157 | ) |
| |
|
| |
|
| |
| | $ | (8,085 | ) | $ | 62 | |
| |
|
| |
|
| |
Estimated Future Benefit Payments. The following benefit payments, which reflect expected future service, as appropriate, are expected to be made by the Plan.
| | | | |
Year | | Amount | |
| |
| |
| | (in thousands) | |
2009 | | $ | 732 | |
2010 | | | 797 | |
2011 | | | 879 | |
2012 | | | 991 | |
2013 | | | 1,128 | |
2014-2018 | | | 7,841 | |
69
The Bank’s Supplemental Executive Retirement Program (“SERP”) provides benefits to certain employees, designated by the Compensation Committee of the Board of Directors, whose benefits under the Pension Plan and 401(k) plan are limited by the applicable provisions of the Internal Revenue Code. The benefit under the SERP is equal to the additional amount the employee would be entitled to under the Pension and 401(k) plans in the absence of such Internal Revenue Code limitations. SERP expense was $150,000, $72,000, and $113,000 in 2008, 2007, and 2006, respectively.
NOTE L – OTHER OPERATING EXPENSES
Expenses included in other operating expenses which exceed one percent of the aggregate of totalinterest income and noninterest income in one or more of the years shown are as follows:
| | | | | | | |
| | 2008 | | 2007 | | 2006 | |
| |
| |
| |
| |
| | (in thousands) | |
| | | | | | | |
Computer services | | $1,229 | | $1,171 | | $1,102 | |
Property and liability insurance | | 408 | | 492 | | 633 | |
NOTE M – COMMITMENTS AND CONTINGENT LIABILITIES
Financial Instruments With Off-Balance-Sheet Risk.The Bank is a party to financial instruments with off-balance-sheet risk in the normal course of business to meet the financing needs of its customers. These financial instruments include commitments to extend credit, standby letters of credit, and commercial letters of credit. These instruments involve, to varying degrees, elements of credit risk in excess of the amount recognized in the consolidated balance sheets.
The Bank’s exposure to credit loss in the event of nonperformance by the other party to financial instruments for commitments to extend credit, standby letters of credit, and commercial letters of credit is represented by the contractual notional amount of these instruments. The Bank uses the same credit policies in making commitments to extend credit and generally uses the same credit policies for letters of credit as it does for on-balance-sheet instruments. At December 31, financial instruments whose contract amounts represent credit risk are as follows:
| | | | | | | | | | | | | |
| | 2008 | | 2007 | |
| |
| |
| |
| | Fixed
Rate | | Variable
Rate | | Fixed
Rate | | Variable
Rate | |
| |
| |
| |
| |
| |
| | (in thousands) | |
| | | | | | | | | | | | | |
Commitments to extend credit | | $ | 5,348 | | $ | 111,305 | | $ | 6,461 | | $ | 70,563 | |
Standby letters of credit | | | 3,641 | | | — | | | 5,375 | | | — | |
Commercial letters of credit | | | — | | | — | | | 382 | | | — | |
Commitments to extend credit are legally binding agreements to lend to a customer as long as there is no violation of any condition established in the contract. Since some of these commitments are expected to expire without being drawn upon, the total commitment amounts do not necessarily represent future cash requirements. Unused home equity lines, which comprise a substantial portion of the variable rate commitments, generally expire ten years from their date of origination. Other real estate loan commitments generally expire within 60 days and commercial loan commitments generally expire within one year. The fixed rate loan commitments shown in the table are to make loans with interest rates ranging from 5.50% to 6.50% and maturities ranging from 9 years to 30 years. The amount of collateral obtained, if any, by the Bank upon extension of credit is based on management’s credit evaluation of the borrower. Collateral held varies but may include mortgages on commercial and residential real estate, security interests in business assets, deposit accounts with the Bank or other financial institutions, and securities.
Standby letters of credit are conditional commitments issued by the Bank to assure the performance or financial obligations of a customer to a third party. The Bank’s standby letters of credit extend through December 31, 2009. The credit risk involved in issuing standby letters of credit is essentially the same as that involved in extending loans to customers. The Bank generally holds collateral and/or obtains personal guarantees supporting these commitments. The extent of collateral held for these commitments at December 31, 2008 varied from 0% to 100%, and averaged 45%. Standby letters of credit are considered financial guarantees and are recorded at fair value.
Commercial letters of credit are conditional commitments issued by the Bank to assure the payment by a customer to a supplier. The credit risk involved in issuing commercial letters of credit is the same as that discussed in the preceding paragraph for standby letters of credit. The Bank generally obtains personal guarantees supporting these commitments. There were no commercial letters of credit outstanding as of December 31, 2008.
70
Concentrations of Credit Risk.Most of the Bank’s loans, personal and commercial, are to borrowers who are domiciled on Long Island and in New York City, and most of the Bank’s real estate loans involve mortgages on Long Island and New York City properties. In addition, the Bank’s loan portfolio includes a significant concentration of multifamily loans that amounted to $105,898,000 at December 31, 2008. As a result, the income of many of the Bank’s borrowers and the value of and cash flows from collateral securing a majority of the Bank’s mortgage loans is largely dependent on the Long Island and New York City economies.
Lease Commitments. At December 31, 2008, minimum annual rental commitments under noncancelable operating leases are as follows:
| | | | |
Year | | Amount | |
| |
| |
| | (in thousands) | |
2009 | | $ | 1,181 | |
2010 | | | 1,151 | |
2011 | | | 1,094 | |
2012 | | | 1,063 | |
2013 | | | 731 | |
Thereafter | | | 3,754 | |
| |
|
| |
| | $ | 8,974 | |
| |
|
| |
The Bank has various renewal options on the above leases. Rent expense, including amounts paid for real estate taxes and common area maintenance, was $1,204,000, $1,006,000, and $896,000 in 2008, 2007, and 2006, respectively.
Employment Contracts.Currently, all of the Bank’s executive officers have employment contracts with the Corporation under which they are entitled to severance compensation in the event of an involuntary termination of employment or resignation of employment following a change in control. The terms of these contracts currently range from one to three years and, unless the Corporation gives written notice of non-extension within the time frames set forth in the contracts, are automatically extended at the expiration of each year for an additional period of one year, thus resulting in new terms of between one and three years. The current aggregate annual salaries provided for in these contracts is approximately $1,640,000.
NOTE N – FAIR VALUE OF FINANCIAL INSTRUMENTS
Assets and Liabilities Measured at Fair Value.SFAS No. 157 establishes a fair value hierarchy which requires an entity to maximize the use of observable inputs and minimize the use of unobservable inputs when measuring fair value. SFAS No. 157 describes three levels of inputs that may be used to measure fair value:
| |
| Level 1: Quoted prices (unadjusted) in active markets for identical assets or liabilities that the entity has the ability to access at the measurement date. |
| |
| Level 2: Significant other observable inputs other than Level 1 prices such as quoted prices for similar assets or liabilities in active markets; quoted prices for identical or similar assets or liabilities in markets that are not active; or inputs other than quoted prices that are observable or can be corroborated by observable market data. |
| |
| Level 3: Significant unobservable inputs that reflect a reporting entity’s own assumptions about the assumptions that market participants would use in pricing an asset or liability. |
The fair values of the Corporation’s investment securities designated as available-for-sale are currently determined on a recurring basis using matrix pricing (Level 2 inputs). Matrix pricing, which is a mathematical technique widely used in the industry to value debt securities, does not rely exclusively on quoted prices for the specific securities but rather on the securities’ relationship to other benchmark quoted securities.
The fair values of impaired loans with specific allocations of the allowance for loan losses are generally based on real estate appraisals. These appraisals may utilize a single valuation approach or a combination of approaches including comparable sales and the income approach. Adjustments are sometimes made in the appraisal process by the appraisers to adjust for differences between the comparable sales and income data available.
71
Assets and liabilities measured at fair value on a recurring basis are summarized below.
| | | | | | | | | |
| | | | Fair Value Measurements at December 31, 2008 Using: | |
| | | |
| |
| | Total | | Quoted Prices
in Active
Markets for
Identical
Assets
(Level 1) | | Significant
Other
Observable
Inputs
(Level 2) | | Significant
Unobservable
Inputs
(Level 3) | |
| |
| |
| |
| |
| |
| | (in thousands) | |
| | | | | | | | | |
Available-for-sale securities | | $378,773 | | $ — | | $378,773 | | $ — | |
Assets and liabilities measured at fair value on a nonrecurring basis are summarized below.
| | | | | | | | | |
| | | | Fair Value Measurements at December 31, 2008 Using: | |
| | | |
| |
| | Total | | Quoted Prices
in Active
Markets for
Identical
Assets
(Level 1) | | Significant
Other
Observable
Inputs
(Level 2) | | Significant
Unobservable
Inputs
(Level 3) | |
| |
| |
| |
| |
| |
| | (in thousands) | |
| | | | | | | | | |
Impaired loans | | $1,644 | | $ — | | $900 | | $744 | |
Impaired loans measured at fair value had a carrying amount of $1,744,000 at December 31, 2008 with a valuation allowance of $100,000. The amount included for these loans in the 2008 provision for loan losses was $100,000.
Estimated Fair Value of Financial Instruments. Fair value estimates are made at a specific point in time and are based on existing on and off-balance-sheet financial instruments. Such estimates are generally subjective in nature and dependent upon a number of significant assumptions associated with each financial instrument or group of similar financial instruments, including estimates of discount rates, risks associated with specific financial instruments, estimates of future cash flows, and relevant available market information. Changes in assumptions could significantly affect the estimates. In addition, fair value estimates do not reflect the value of anticipated future business, premiums or discounts that could result from offering for sale at one time the Corporation’s entire holdings of a particular financial instrument, or the tax consequences of realizing gains or losses on the sale of financial instruments. The following table sets forth the carrying/contract amounts and estimated fair values of the Corporation’s financial instruments at December 31, 2008 and 2007.
| | | | | | | | | | | | | |
| | 2008 | | 2007 | |
| |
| |
| |
| | Carrying/
Contract
Amount | | Fair Value | | Carrying/
Contract
Amount | | Fair Value | |
| |
| |
| |
| |
| |
| | (in thousands) | |
Financial Assets: | | | | | | | | | | | | | |
Cash and due from banks | | $ | 20,924 | | $ | 20,924 | | $ | 25,729 | | $ | 25,729 | |
Federal funds sold and overnight investments | | | 514 | | | 514 | | | 21,768 | | | 21,768 | |
Held-to-maturity securities | | | 169,480 | | | 172,640 | | | 193,234 | | | 193,890 | |
Available-for-sale securities | | | 378,773 | | | 378,773 | | | 273,080 | | | 273,080 | |
Loans | | | 652,058 | | | 655,193 | | | 521,086 | | | 528,482 | |
Federal Home Loan Bank stock | | | 6,199 | | | 6,199 | | | 1,184 | | | 1,184 | |
Restricted stocks (included in other assets) | | | 467 | | | 467 | | | 467 | | | 467 | |
Accrued interest receivable | | | 6,156 | | | 6,156 | | | 5,472 | | | 5,472 | |
| | | | | | | | | | | | | |
Financial Liabilities: | | | | | | | | | | | | | |
Checking deposits | | | 324,138 | | | 324,138 | | | 318,322 | | | 318,322 | |
Savings and money market deposits | | | 384,047 | | | 384,047 | | | 302,158 | | | 302,158 | |
Time deposits | | | 192,152 | | | 193,330 | | | 248,558 | | | 248,867 | |
Short-term borrowings | | | 124,122 | | | 124,122 | | | 12,110 | | | 12,110 | |
Long-term debt | | | 127,000 | | | 142,224 | | | 80,000 | | | 82,537 | |
Accrued interest payable | | | 1,051 | | | 1,051 | | | 1,466 | | | 1,466 | |
72
NOTE O – PARENT COMPANY FINANCIAL INFORMATION
Condensed financial information for The First of Long Island Corporation (parent company only) is as follows:
| | | | | | | |
CONDENSED BALANCE SHEETS | | December 31, | |
| |
| |
| | 2008 | | 2007 | |
| |
| |
| |
| | (in thousands) | |
Assets: | | | | | | | |
Cash and due from banks | | $ | 3,975 | | $ | 2,775 | |
Investment in subsidiary bank, at equity | | | 99,290 | | | 100,317 | |
Prepaid income taxes | | | 137 | | | 160 | |
Deferred income tax benefits | | | 423 | | | 255 | |
Other assets | | | 2 | | | 2 | |
| |
|
| |
|
| |
| | $ | 103,827 | | $ | 103,509 | |
| |
|
| |
|
| |
Liabilities: | | | | | | | |
Cash dividends payable | | $ | 1,295 | | $ | 1,125 | |
| |
|
| |
|
| |
| | | | | | | |
Stockholders’ equity: | | | | | | | |
Common stock | | | 719 | | | 745 | |
Surplus | | | 1,354 | | | 96 | |
Retained earnings | | | 102,061 | | | 99,844 | |
| |
|
| |
|
| |
| | | 104,134 | | | 100,685 | |
Accumulated other comprehensive income (loss) net of tax | | | (1,602 | ) | | 1,699 | |
| |
|
| |
|
| |
| | | 102,532 | | | 102,384 | |
| |
|
| |
|
| |
| | $ | 103,827 | | $ | 103,509 | |
| |
|
| |
|
| |
| | | | | | | | | | |
CONDENSED STATEMENTS OF INCOME | | Year ended December 31, | |
| |
| |
| | 2008 | | 2007 | | 2006 | |
| |
| |
| |
| |
| | (in thousands) | |
Income: | | | | | | | | | | |
Dividends from subsidiary bank | | $ | 11,100 | | $ | 8,300 | | $ | 5,590 | |
Interest on deposits with subsidiary bank | | | 43 | | | 118 | | | 26 | |
Other | | | 1 | | | 5 | | | 3 | |
| |
|
| |
|
| |
|
| |
| | | 11,144 | | | 8,423 | | | 5,619 | |
| |
|
| |
|
| |
|
| |
Expenses: | | | | | | | | | | |
Salaries | | | 450 | | | 506 | | | 210 | |
Other operating expenses | | | 278 | | | 303 | | | 236 | |
| |
|
| |
|
| |
|
| |
| | | 728 | | | 809 | | | 446 | |
| |
|
| |
|
| |
|
| |
| | | | | | | | | | |
Income before income taxes | | | 10,416 | | | 7,614 | | | 5,173 | |
Income tax benefit | | | (272 | ) | | (271 | ) | | (151 | ) |
| |
|
| |
|
| |
|
| |
Income before undistributed earnings of subsidiary bank | | | 10,688 | | | 7,885 | | | 5,324 | |
Equity in undistributed earnings | | | 2,274 | | | 3,597 | | | 5,903 | |
| |
|
| |
|
| |
|
| |
Net income | | $ | 12,962 | | $ | 11,482 | | $ | 11,227 | |
| |
|
| |
|
| |
|
| |
73
CONDENSED STATEMENTS OF CASH FLOWS
| | | | | | | | | | |
| | Year ended December 31, | |
| |
| |
| | 2008 | | 2007 | | 2006 | |
| |
| |
| |
| |
| | (in thousands) | |
Cash Flows From Operating Activities: | | | | | | | | | | |
Net income | | $ | 12,962 | | $ | 11,482 | | $ | 11,227 | |
Adjustments to reconcile net income to net cash provided by operating activities: | | | | | | | | | | |
Undistributed earnings of subsidiary bank | | | (2,274 | ) | | (3,597 | ) | | (5,903 | ) |
Deferred income tax credit | | | (168 | ) | | (187 | ) | | (68 | ) |
Stock-based compensation expense | | | 450 | | | 506 | | | 210 | |
Decrease (increase) in prepaid income taxes | | | 23 | | | (61 | ) | | 196 | |
Increase in other assets | | | — | | | (2 | ) | | — | |
| |
|
| |
|
| |
|
| |
Net cash provided by operating activities | | | 10,993 | | | 8,141 | | | 5,662 | |
| |
|
| |
|
| |
|
| |
| | | | | | | | | | |
Cash Flows From Financing Activities: | | | | | | | | | | |
Repurchase and retirement of common stock | | | (5,764 | ) | | (3,719 | ) | | (2,927 | ) |
Proceeds from exercise of stock options | | | 525 | | | 694 | | | 402 | |
Tax benefit of stock options | | | 21 | | | 76 | | | 17 | |
Cash dividends paid | | | (4,575 | ) | | (5,342 | ) | | (3,450 | ) |
| |
|
| |
|
| |
|
| |
Net cash used in financing activities | | | (9,793 | ) | | (8,291 | ) | | (5,958 | ) |
| |
|
| |
|
| |
|
| |
Net increase (decrease) in cash and cash equivalents* | | | 1,200 | | | (150 | ) | | (296 | ) |
Cash and cash equivalents, beginning of year | | | 2,775 | | | 2,925 | | | 3,221 | |
| |
|
| |
|
| |
|
| |
Cash and cash equivalents, end of year | | $ | 3,975 | | $ | 2,775 | | $ | 2,925 | |
| |
|
| |
|
| |
|
| |
| | | | | | | | | | |
Supplemental Schedule of Noncash Financing Activities: | | | | | | | | | | |
Cash dividends payable | | $ | 1,295 | | $ | 1,125 | | $ | 2,087 | |
* Cash and cash equivalents is defined as cash and due from banks and includes the checking and money market accounts with the Corporation’s wholly-owned bank subsidiary.
NOTE P – QUARTERLY FINANCIAL DATA (Unaudited)
| | | | | | | | | | | | | | | | |
| | First
Quarter | | Second
Quarter | | Third
Quarter | | Fourth
Quarter | | Total | |
| |
| |
| |
| |
| |
| |
| | (in thousands, except per share data) | |
2008 | | | | | | | | | | | | | | | | |
Interest income | | $ | 14,161 | | $ | 14,662 | | $ | 15,061 | | $ | 15,802 | | $ | 59,686 | |
Interest expense | | | 4,584 | | | 4,107 | | | 4,016 | | | 4,036 | | | 16,743 | |
Net interest income | | | 9,577 | | | 10,555 | | | 11,045 | | | 11,766 | | | 42,943 | |
Provision for loan losses | | | 164 | | | 261 | | | 462 | | | 1,058 | | | 1,945 | |
Noninterest income before net securities gains | | | 1,437 | | | 1,503 | | | 1,563 | | | 1,530 | | | 6,033 | |
Net gains on sales of securities | | | 91 | | | 9 | | | 109 | | | 39 | | | 248 | |
Noninterest expense | | | 7,336 | | | 7,263 | | | 7,237 | | | 7,853 | | | 29,689 | |
Income before income taxes | | | 3,605 | | | 4,543 | | | 5,018 | | | 4,424 | | | 17,590 | |
Income taxes | | | 748 | | | 1,236 | | | 1,450 | | | 1,194 | | | 4,628 | |
Net income | | | 2,857 | | | 3,307 | | | 3,568 | | | 3,230 | | | 12,962 | |
Earnings per share: | | | | | | | | | | | | | | | | |
Basic | | | .39 | | | .46 | | | .50 | | | .45 | | | 1.79 | |
Diluted | | | .39 | | | .45 | | | .49 | | | .44 | | | 1.78 | |
Comprehensive income | | | 3,775 | | | 37 | | | 4,539 | | | 1,310 | | | 9,661 | |
| | | | | | | | | | | | | | | | |
2007 | | | | | | | | | | | | | | | | |
Interest income | | $ | 12,647 | | $ | 12,846 | | $ | 13,298 | | $ | 14,232 | | $ | 53,023 | |
Interest expense | | | 3,849 | | | 3,758 | | | 4,069 | | | 4,593 | | | 16,269 | |
Net interest income | | | 8,798 | | | 9,088 | | | 9,229 | | | 9,639 | | | 36,754 | |
Provision for loan losses | | | 122 | | | 81 | | | 173 | | | 199 | | | 575 | |
Noninterest income before net securities gains (losses) | | | 1,442 | | | 1,461 | | | 1,454 | | | 1,459 | | | 5,816 | |
Net gains (losses) on sales of securities | | | 17 | | | — | | | — | | | (251 | ) | | (234 | ) |
Noninterest expense | | | 6,921 | | | 6,912 | | | 6,792 | | | 6,759 | | | 27,384 | |
Income before income taxes | | | 3,214 | | | 3,556 | | | 3,718 | | | 3,889 | | | 14,377 | |
Income taxes | | | 586 | | | 716 | | | 742 | | | 851 | | | 2,895 | |
Net income | | | 2,628 | | | 2,840 | | | 2,976 | | | 3,038 | | | 11,482 | |
Earnings per share: | | | | | | | | | | | | | | | | |
Basic | | | .35 | | | .37 | | | .40 | | | .40 | | | 1.52 | |
Diluted | | | .34 | | | .37 | | | .39 | | | .40 | | | 1.51 | |
Comprehensive income | | | 2,835 | | | 1,470 | | | 4,355 | | | 4,986 | | | 13,646 | |
74
MANAGEMENT’S REPORT ON INTERNAL CONTROL OVER FINANCIAL REPORTING
The management of The First of Long Island Corporation is responsible for establishing and maintaining adequate internal control over financial reporting, based on the criteria established in Internal Control—Integrated Framework issued by the Committee of Sponsoring Organizations of the Treadway Commission (COSO). The First of Long Island Corporation’s system of internal control over financial reporting was designed by or under the supervision of the Corporation’s chief executive officer and chief financial officer to provide reasonable assurance regarding the reliability of the preparation of the Corporation’s financial statements for external and regulatory reporting purposes, in accordance with U.S. generally accepted accounting principles. Because of its inherent limitations, internal control over financial reporting may not prevent or detect misstatements. Also, projections of any evaluation of effectiveness to future periods are subject to the risk that controls may become inadequate because of changes in conditions, or that the degree of compliance with the policies or procedures may deteriorate.
The First of Long Island Corporation’s management assessed the effectiveness of the Corporation’s internal control over financial reporting as of December 31, 2008, based on the criteria established in Internal Control—Integrated Framework issued by the Committee of Sponsoring Organizations of the Treadway Commission (COSO). Based on the assessment, management determined that, as of December 31, 2008, the Corporation’s internal control over financial reporting is effective. Crowe Horwath LLP, an independent registered public accounting firm, has expressed an opinion of the effectiveness of the Corporation’s internal control over financial reporting as of December 31, 2008 in their report which appears on page 59.
| |
/s/ MICHAEL N. VITTORIO |
| |
Michael N. Vittorio | |
President & Chief Executive Officer |
| |
/s/ MARK D. CURTIS |
| |
Mark D. Curtis | |
Senior Vice President & Treasurer |
75
REPORT OF INDEPENDENT REGISTERED PUBLIC ACCOUNTING FIRM
The First of Long Island Corporation
Glen Head, New York
We have audited the accompanying consolidated balance sheets of The First of Long Island Corporation as of December 31, 2008 and 2007, and the related statements of income, changes in stockholders’ equity, and cash flows for each of the years in the three-year period ended December 31, 2008. We also have audited The First of Long Island Corporation’s internal control over financial reporting as of December 31, 2008, based on criteria established in Internal Control – Integrated Framework issued by the Committee of Sponsoring Organizations of the Treadway Commission (COSO). The First of Long Island Corporation’s management is responsible for these financial statements, for maintaining effective internal control over financial reporting, and for its assessment of the effectiveness of internal control over financial reporting, included in the accompanying Management’s Report on Internal Control Over Financial Reporting. Our responsibility is to express an opinion on these consolidated financial statements and an opinion on the company’s internal control over financial reporting based on our audits.
We conducted our audits in accordance with the standards of the Public Company Accounting Oversight Board (United States). Those standards require that we plan and perform the audits to obtain reasonable assurance about whether the consolidated financial statements are free of material misstatement and whether effective internal control over financial reporting was maintained in all material respects. Our audits of the consolidated financial statements included examining, on a test basis, evidence supporting the amounts and disclosures in the consolidated financial statements, assessing the accounting principles used and significant estimates made by management, and evaluating the overall financial statement presentation. Our audit of internal control over financial reporting included obtaining an understanding of internal control over financial reporting, assessing the risk that a material weakness exists, and testing and evaluating the design and operating effectiveness of internal control based on the assessed risk. Our audits also included performing such other procedures as we considered necessary in the circumstances. We believe that our audits provide a reasonable basis for our opinions.
A company’s internal control over financial reporting is a process designed to provide reasonable assurance regarding the reliability of financial reporting and the preparation of financial statements for external purposes in accordance with generally accepted accounting principles. A company’s internal control over financial reporting includes those policies and procedures that (1) pertain to the maintenance of records that, in reasonable detail, accurately and fairly reflect the transactions and dispositions of the assets of the company; (2) provide reasonable assurance that transactions are recorded as necessary to permit preparation of financial statements in accordance with generally accepted accounting principles, and that receipts and expenditures of the company are being made only in accordance with authorizations of management and directors of the company; and (3) provide reasonable assurance regarding prevention or timely detection of unauthorized acquisition, use, or disposition of the company’s assets that could have a material effect on the consolidated financial statements.
Because of its inherent limitations, internal control over financial reporting may not prevent or detect misstatements. In addition, projections of any evaluation of effectiveness to future periods are subject to the risk that controls may become inadequate because of changes in conditions, or that the degree of compliance with the policies or procedures may deteriorate.
In our opinion, the consolidated financial statements referred to above present fairly, in all material respects, the financial position of The First of Long Island Corporation as of December 31, 2008 and 2007, and the results of its operations and its cash flows for each of the years in the three-year period ended December 31, 2008, in conformity with accounting principles generally accepted in the United States of America. Also in our opinion, The First of Long Island Corporation maintained, in all material respects, effective internal control over financial reporting as of December 31, 2008, based on criteria established in Internal Control – Integrated Framework issued by the Committee of Sponsoring Organizations of the Treadway Commission (COSO).
| |
| /s/ Crowe Horwath LLP |
|
|
| Crowe Horwath LLP |
Livingston, New Jersey
February 20, 2009
76
|
Officers |
The First of Long Island Corporation |
|
Michael N. Vittorio |
President & Chief Executive Officer |
|
Sallyanne K. Ballweg |
Senior Vice President & Secretary |
|
Mark D. Curtis |
Senior Vice President & Treasurer |
|
John Grasso |
Senior Vice President |
|
Brian J. Keeney |
Senior Vice President |
|
Richard Kick |
Senior Vice President |
|
Donald L. Manfredonia |
Senior Vice President |
|
Wayne B. Drake |
Assistant Treasurer |
|
Kitty W. Craig |
Chief Auditor |
|
Official Staff |
The First National Bank of Long Island |
|
ADMINISTRATION |
|
Michael N. Vittorio |
President & Chief Executive Officer |
|
Sallyanne K. Ballweg |
Senior Executive Vice President |
|
AUDITING |
|
Kitty W. Craig |
Vice President and Chief Auditor |
|
BRANCH ADMINISTRATION |
|
John Grasso |
Executive Vice President |
|
James Clavell |
Senior Vice President |
|
Richard P. Perro |
Senior Vice President |
|
Linda Cutter |
Vice President |
77
|
COMMERCIAL BANKING |
|
James P. Johnis |
Senior Vice President |
|
Janine Chaisty |
Vice President |
|
Patricia A. DeMasi |
Vice President |
|
Albert T. Ghelarducci |
Vice President |
|
Robert A. Pizza |
Vice President |
|
Alessandro Scichilone |
Vice President |
|
NASSAU COUNTY REGIONAL OFFICE |
(COMMERCIAL BANKING) |
|
Albert Arena |
Vice President |
|
Dante D. Mancini |
Vice President |
|
Jane F. Reed |
Vice President |
|
SUFFOLK COUNTY REGIONAL OFFICE |
(COMMERCIAL BANKING) |
|
Margaret M. Curran-Rusch |
Vice President |
|
Stephen Durso |
Vice President |
|
Richard B. Smith |
Vice President |
|
COMMERCIAL LENDING |
|
Donald L. Manfredonia |
Executive Vice President |
|
Paul J. Daley |
Senior Vice President |
|
Ivan G. Nunez |
Vice President |
|
John J. Reilly |
Vice President |
|
Kevin J. Talty |
Vice President |
78
|
COMPLIANCE AND PROCEDURES |
|
Louis A. Antoniello |
Vice President |
|
CREDIT DEPARTMENT |
|
Anne Marie Stefanucci |
Vice President |
|
DATA PROCESSING |
|
Jose Diaz |
Vice President |
|
DEPOSIT OPERATIONS |
|
Carmela Lalonde |
Assistant Cashier |
|
FINANCE |
|
Mark D. Curtis |
Executive Vice President |
|
Wayne B. Drake |
Senior Vice President |
|
Howard F. Hoeberlein |
Senior Vice President |
|
Matthew J. Mankowski |
Vice President |
|
GENERAL SERVICES |
|
Daniel Sapanara |
Vice President |
|
HUMAN RESOURCES |
|
Debbie L. Ryan |
Senior Vice President |
|
Susan J. Hempton |
Vice President |
|
INFORMATION TECHNOLOGY SERVICES |
|
Conrad Lissade |
Assistant Vice President |
|
INVESTMENT MANAGEMENT DIVISION |
|
Brian J. Keeney |
Executive Vice President |
|
Josephine Buckley |
Vice President |
|
Jane Carmody |
Vice President |
|
Sharon E. Pazienza |
Vice President |
79
|
LOAN CENTER |
|
Robert B. Jacobs |
Vice President |
|
MARKETING |
|
Laura C. Ierulli |
Vice President |
|
OPERATIONS ADMINISTRATION |
|
Richard Kick |
Executive Vice President |
|
Betsy Gustafson |
Senior Vice President |
|
RESIDENTIAL MORTGAGE |
|
Frederick T. Hughes |
Vice President |
|
COUNSEL |
Schupbach, Williams & Pavone LLP |
|
INDEPENDENT AUDITORS |
Crowe Horwath LLP |
|
ANNUAL REPORT ON FORM 10-K |
A copy of the Corporation’s annual report on Form 10-K for 2008, filed with the Securities and Exchange Commission, may be obtained without charge upon written request to Mark D. Curtis, Senior Vice President and Treasurer, The First of Long Island Corporation, 10 Glen Head Road, PO Box 67, Glen Head, New York 11545-0067. |
|
EXECUTIVE OFFICE |
The First of Long Island Corporation |
10 Glen Head Road |
Glen Head, New York 11545 |
(516) 671-4900 |
www.fnbli.com |
|
TRANSFER AGENT AND REGISTRAR |
Registrar and Transfer Company |
10 Commerce Drive |
Cranford, New Jersey 07016-3572 |
(800) 368-5948 |
www.rtco.com |
|
ANNUAL MEETING NOTICE |
The Annual Meeting of Stockholders will be held at the Westbury Manor, 1100 Jericho Turnpike, Westbury, N.Y. on Monday, April 20, 2009 at 3:30 P.M. |
80
|
Business Advisory Board |
|
[PHOTO OMITTED] |
Howard Annenberg |
President & CEO |
Shannen Promotions, Inc. |
|
[PHOTO OMITTED] |
Nicola Arena |
Chairman & CEO |
Mediterranean Shipping Co. (USA), Inc. |
|
[PHOTO OMITTED] |
Richard Arote Sr. |
President |
A.D.E. Systems, Inc./Air Distribution Enterprises, Inc. |
|
[PHOTO OMITTED] |
Beverly J. Bell, Esq. |
Humes & Wagner, LLP |
|
[PHOTO OMITTED] |
Thomas Burke |
Chief Executive Officer |
Ophthalmic Consultants of Long Island |
|
[PHOTO OMITTED] |
Emil V. Cianciulli, Esq. |
Partner |
Cianciulli, Meng & Panos, P.C. |
|
[PHOTO OMITTED] |
Michael DeVivo |
Vice President |
MRZ Trucking Corporation |
|
[PHOTO OMITTED] |
Thomas N. Dufek, CPA |
President |
Dufek & Associates |
|
[PHOTO OMITTED] |
Bernard Esquenet |
Chief Executive Officer |
The Ruhof Corp. |
|
[PHOTO OMITTED] |
Robert Giambalvo, CPA |
President |
Giambalvo, Giammarese & Stalzer, CPAs, P.C. |
|
[PHOTO OMITTED] |
Kevin J. Harding, Esq. |
Partner |
Harding and Harding |
|
[PHOTO OMITTED] |
Herbert Kotler, Esq. |
81
|
[PHOTO OMITTED] |
Melvin F. Lazar, CPA |
Founder |
Lazar Levine & Felix LLP |
|
[PHOTO OMITTED] |
Wallace Leinheardt, Esq. |
Jaspan Schlesinger LLP |
|
[PHOTO OMITTED] |
Linda Levy, CPA |
Tax Consultant |
|
[PHOTO OMITTED] |
James Lynch, Esq. |
|
[PHOTO OMITTED] |
John I. Martinelli |
Principal |
Owen Petersen & Co., LLP |
|
[PHOTO OMITTED] |
Christopher T. McGrath, Esq. |
Partner |
Sullivan, Papain, Block, McGrath & Cannavo, P.C. |
|
[PHOTO OMITTED] |
Susan Hirschfeld Mohr |
President |
J. W. Hirschfeld Agency, Inc. |
|
[PHOTO OMITTED] |
James Panos, Esq. |
Partner |
Cianciulli, Meng & Panos, P.C. |
|
[PHOTO OMITTED] |
John G. Passarelli, M.D., F.A.A.O. |
Medical Director |
Long Island Eye Surgery Center |
Long Island Eye Surgical Care, P.C. |
|
[PHOTO OMITTED] |
Jay Pitti |
President |
Merrick House & Gardens |
|
[PHOTO OMITTED] |
Stephen Ruchman |
Ruchman Associates |
|
[PHOTO OMITTED] |
Scott Sammis |
President |
USI Sammis, Inc. |
|
[PHOTO OMITTED] |
Melvin Schreiber, CPA |
Moses & Schreiber |
82
|
[PHOTO OMITTED] |
Arthur C. Schupbach, Esq. |
Partner |
Schupbach, Williams & Pavone, LLP |
|
[PHOTO OMITTED] |
Frank Shahery |
Director of Marketing |
Convermat Corporation |
|
[PHOTO OMITTED] |
Owen T. Smith |
Milleridge Inn |
Former Chief Deputy County |
Executive, Nassau County |
|
[PHOTO OMITTED] |
H. Craig Treiber |
Chairman & CEO |
The Treiber Insurance Group |
|
[PHOTO OMITTED] |
Sal Turano |
President |
Abstracts Incorporated |
|
[PHOTO OMITTED] |
Arthur Ventura |
President |
Badge Agency, Inc. |
|
[PHOTO OMITTED] |
George J. Walsh, Esq. |
Thompson Hine LLP |
|
[PHOTO OMITTED] |
Robert A. Wilkie, Esq. |
Wilkie & Wilkie |
|
[PHOTO OMITTED] |
Mark Wurzel |
President |
Calico Cottage, Inc. |
83
Business of the Corporation
The First of Long Island Corporation (“Corporation”) is a one-bank holding company organized under the laws of the State of New York. Its primary business is the operation of its sole subsidiary, The First National Bank of Long Island (“Bank”).
The Bank was organized in 1927 under national banking laws and became the sole subsidiary of the Corporation under a plan of reorganization effected April 30, 1984.
The Bank is a full service commercial bank which provides a broad range of financial services to individual, professional, corporate, institutional and government customers through its twenty-eight branch system on Long Island and in Manhattan.
The First of Long Island Agency, Inc. was organized in 1994 under the laws of the State of New York, as a subsidiary of the Bank to conduct business as a licensed insurance agency engaged in the sale of mutual funds and insurance, primarily fixed annuity products.
The Bank is subject to regulation and supervision of the Federal Reserve Board, the Comptroller of the Currency, and the Federal Deposit Insurance Corporation which also insures its deposits. The Comptroller of the Currency is the primary banking agency responsible for regulating the subsidiary Bank. In addition, the Corporation is subject to the regulations and supervision of the Federal Reserve Board and the Securities and Exchange Commission.
The First National Bank of Long Island
“Where Everyone Knows Your Name ™”
Long Island (516) 671-4900
Manhattan (212) 566-1500
www.fnbli.com
84