Table of Contents
The information in this prospectus supplement is not complete and may be changed. This prospectus supplement and the accompanying prospectus are not an offer to sell these securities and are not soliciting an offer to buy these securities in any state where this offer or sale is not permitted.
Filed Pursuant to 424(b)(5)
Registration No. 333-135555
Subject to Completion, dated May 4, 2007
PROSPECTUS SUPPLEMENT
(To Prospectus dated June 30, 2006) |
4,614,000 Shares
Bucyrus International, Inc.
Class A Common Stock
We are offering 4,614,000 shares of our common stock. Our common stock trades on The NASDAQ Global Select Market under the symbol “BUCY.” The last reported sale price of our common stock on May 3, 2007 was $65.03 per share.
We intend to use the net proceeds from this offering to repay a portion of our new term loan facility. Affiliates of Lehman Brothers Inc. and J.P. Morgan Securities Inc. are lenders under our new term loan facility and, as such, will receive substantially all of the proceeds from this offering. See “Underwriting—Relationships.”
Investing in our common stock involves risks. See “Risk Factors” beginning on page S-17 of this prospectus supplement.
| Per Share | Total | |||||
Price to the public | $ | $ | ||||
Underwriting discounts and commissions | $ | $ | ||||
Proceeds to us (before expenses) | $ | $ | ||||
We have granted the underwriters a 30-day option to purchase up to an additional 692,100 shares from us on the same terms and conditions as set forth above if the underwriters sell more than 4,614,000 shares of common stock in this offering.
Neither the Securities and Exchange Commission nor any state securities commission has approved or disapproved of these securities or passed on the adequacy or accuracy of this prospectus supplement or the accompanying prospectus. Any representation to the contrary is a criminal offense.
Lehman Brothers, on behalf of the underwriters, expects to deliver the shares on or about , 2007.
Sole Book-Running Manager
LEHMAN BROTHERS
JPMORGAN | STIFEL NICOLAUS |
, 2007
Table of Contents

Table of Contents

Table of Contents
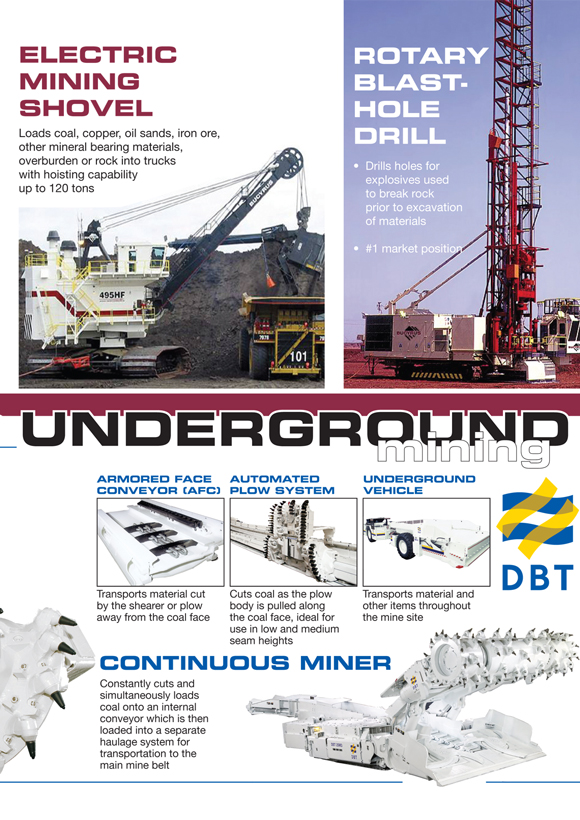
Table of Contents
Prospectus Supplement | Page | |
| S-ii | ||
S-iii | ||
| S-1 | ||
| S-17 | ||
| S-30 | ||
| S-32 | ||
| S-34 | ||
| S-35 | ||
Unaudited Pro Forma Combined Condensed Financial Information | S-36 | |
Selected Historical Consolidated Financial Information of Bucyrus | S-46 | |
Selected Historical Consolidated Financial Information of DBT | S-47 | |
Management’s Discussion and Analysis of Financial Condition and Results of Operations | S-48 | |
| S-64 | ||
| S-77 | ||
| S-79 | ||
Certain Material U.S. Federal Tax Consequences for Non-U.S. Holders | S-84 | |
| S-87 | ||
| S-92 | ||
| S-92 | ||
| S-93 | ||
| F-1 |
Prospectus | Page | |
| 2 | ||
| 3 | ||
| 4 | ||
| 4 | ||
| 5 | ||
| 6 | ||
| 6 | ||
| 7 | ||
| 8 | ||
| 8 | ||
| 9 | ||
| 9 |
You should rely only on the information included or incorporated by reference in this prospectus supplement and the accompanying prospectus. We have not, and the underwriters have not, authorized anyone to provide you with information that is in addition to or different from that contained or incorporated by reference in this prospectus supplement and the accompanying prospectus. We are not, and the underwriters are not, offering to sell these securities in any jurisdiction where the offer or sale is not permitted. You should assume that the information contained or incorporated by reference in this prospectus supplement or the accompanying prospectus is accurate only as of the date of this prospectus supplement or the accompanying prospectus, as the case may be, or in the case of the documents incorporated by reference, the date of such documents regardless of the time of delivery of this prospectus supplement and the accompanying prospectus or any sales of our common stock. Our business, financial condition, results of operations and prospects may have changed since those dates.
The underwriters are offering shares of our common stock subject to various conditions and may reject all or any part of any order. The shares of our common stock should be ready for delivery on or about May , 2007 against payment of immediately available funds.
S-i
Table of Contents
ABOUT THIS PROSPECTUS SUPPLEMENT
This document consists of two parts. The first part is this prospectus supplement, which describes the specific terms of this offering. The second part, the accompanying prospectus, gives more general information, some of which may not apply to this offering. Generally, when we refer only to the “prospectus,” we are referring to both parts combined.
If information in this prospectus supplement is inconsistent with the accompanying prospectus, you should rely on this prospectus supplement. This prospectus supplement, the accompanying prospectus and the documents incorporated into each by reference include important information about us, the shares being offered and other information you should know before investing in our common stock.
All references to the “Company,” “us,” “we” and “our” in this prospectus supplement and the accompanying prospectus mean, unless the context indicates otherwise, Bucyrus International, Inc. together with its consolidated subsidiaries, including DBT GmbH, or DBT. All references to “common stock” in this prospectus supplement mean our Class A common stock, par value $.01 per share. All references to “Bucyrus” in this prospectus supplement are to our surface mining segment and all references to “DBT” are to our underground mining segment.
All references in this prospectus supplement to our consolidated financial statements include, unless the context indicates otherwise, the related notes.
In certain places in this prospectus supplement we have presented financial information of DBT in U.S. dollars, which, for the balance sheet and backlog data, is based on a translation at a representative rate of exchange of Euro 1.00 = U.S. Dollar 1.3203 as of December 29, 2006 and, for the statement of earnings and other financial data, is based on a translation at a representative average 2006 rate of exchange of Euro 1.00 = U.S. Dollar 1.25622. We have presented the DBT order intake information in this prospectus supplement using the following representative rates of exchange: for the first quarter ended March 31, 2007, Euro 1.00 = U.S. Dollar 1.31044, for the fourth quarter ended December 31, 2006, Euro 1.00 = U.S. Dollar 1.28958, for the third quarter ended September 30, 2006, Euro 1.00 = U.S. Dollar 1.27512 and for the first quarter ended March 31, 2006, Euro 1.00 = U.S. Dollar 1.20256. All historical DBT numbers presented in this prospectus supplement in dollars are unaudited.
DBT’s historical consolidated financial statements appearing elsewhere in this prospectus supplement have been prepared in accordance with International Financial Reporting Standards, or IFRS, which differ in certain material respects from United States generally accepted accounting principles, or U.S. GAAP. For a discussion of certain significant differences between IFRS and U.S. GAAP, see note 30 to DBT’s audited consolidated financial statements included elsewhere in this prospectus supplement, which reconciles DBT’s net profits and shareholders’ equity as reported under IFRS to U.S. GAAP. Bucyrus is in the process of reviewing DBT’s accounting policies and financial statement classifications. As a result of this review, it may become necessary to make additional reclassifications to the consolidated financial information of DBT and its subsidiaries on a prospective basis. See “Unaudited Pro Forma Combined Condensed Financial Information.”
This document includes market share and industry data and forecasts that we have obtained from internal company surveys, market research, consultant surveys, publicly available information and industry publications and surveys. Information regarding our surface mining operations, including historical original equipment sales, industry surveys of original equipment installation and industry aftermarket purchasing and sales information are derived primarily from databases maintained by the Parker Bay Company, which specializes in providing market research for the mining and earthmoving equipment industries. Third-party surveys, publications, consultant surveys and forecasts generally state that the information contained therein has been obtained from sources believed to be reliable, but we cannot assure you as to the accuracy and completeness of such information. We have not independently verified any of the data from third-party sources, nor have we ascertained the underlying economic assumptions relied upon therein. Similarly, internal company surveys and reports, industry forecasts and market research, which we believe to be reliable based upon our knowledge of the industry, have not been verified by any independent sources. In addition, we do not know what assumptions regarding general worldwide or country specific economic growth were used in preparing the third-party forecasts cited in this document.
We have registered the following trademarks that are used in this prospectus supplement: Bucyrus, Bucyrus (design mark), DBT and DBT (design mark).
S-ii
Table of Contents
FORWARD-LOOKING STATEMENTS AND CAUTIONARY FACTORS
This prospectus supplement contains statements that constitute “forward-looking statements” within the meaning of the Private Securities Litigation Reform Act of 1995. These forward-looking statements may be identified by the use of predictive, future tense or forward-looking terminology, such as “believes,” “anticipates,” “expects,” “estimates,” “intends,” “may,” “will” or similar terms. The 2007 guidance provided under “Management’s Discussion and Analysis of Financial Condition and Results of Operations—Current 2007 Outlook” constitutes forward-looking statements. You are cautioned that any such forward-looking statements are not guarantees of future performance and involve significant risks and uncertainties, and that actual results may differ materially from those contained in the forward-looking statements as a result of various factors, some of which are unknown. The factors that could cause actual results to differ materially from those anticipated in such forward-looking statements and could adversely affect our actual results of operations and financial condition include, without limitation:
| • | disruption of our plant operations due to equipment failures, natural disasters or other reasons; |
| • | our ability to attract and retain skilled labor; |
| • | our production capacity; |
| • | our ability to purchase component parts or raw materials from key suppliers at acceptable prices and/or on the required time schedule; |
| • | the cyclical nature of the sale of original equipment due to fluctuations in market prices for coal, copper, iron ore and other minerals, changes in general economic conditions, interest rates, customers’ replacement or repair cycles, consolidation in the mining industry and competitive pressures; |
| • | the loss of key customers or key members of management; |
| • | the risks and uncertainties of doing business in foreign countries, including emerging markets, and foreign currency risks; |
| • | the highly competitive nature of our industry; |
| • | our ability to continue to offer products containing innovative technology that meets the needs of our customers; |
| • | costs and risks associated with regulatory compliance and changing regulations affecting the mining industry and/or electric utilities; |
| • | product liability, environmental and other potential litigation; |
| • | work stoppages at our company, our customers, suppliers or providers of transportation; |
| • | our ability to satisfy underfunded pension obligations; |
| • | our ability to effectively and efficiently integrate the operations of DBT and realize expected levels of sales and profit from our acquisition of DBT; |
| • | potential risks, material weaknesses in financial reporting and liabilities of DBT unknown to us; |
| • | our dependence on the commodity price of coal and other conditions in the coal market; |
| • | our reliance on significant customers; |
| • | our experience in the underground mining business, which is less than some of our competitors; and |
| • | our increased levels of debt and debt service obligations relating to our acquisition of DBT. |
The foregoing factors do not constitute an exhaustive list of factors that could cause actual results to differ materially from those anticipated in forward-looking statements, and should be read in conjunction with the other
S-iii
Table of Contents
cautionary statements and risk factors, including those described under the caption “Risk Factors” and elsewhere in this prospectus supplement and under the caption “Forward-Looking Statements and Cautionary Factors” and elsewhere in the accompanying prospectus or those contained in the documents incorporated by reference into this prospectus supplement.
We urge you to consider these factors and to review carefully the “Risk Factors” section in this prospectus supplement for a more complete discussion of the risks of an investment in our common stock. The forward-looking statements included in this prospectus supplement or incorporated by reference into this prospectus supplement are made only as of the date of this prospectus supplement or the date of the incorporated document, and we undertake no obligation to publicly update these statements to reflect subsequent events or circumstances.
S-iv
Table of Contents
This summary highlights information contained elsewhere in this prospectus supplement and the accompanying prospectus. This summary may not contain all of the information that may be important to you. You should read the entire prospectus supplement and the accompanying prospectus carefully before making an investment decision.
Overview
We are a leading designer and manufacturer of high productivity mining equipment for the extraction of coal, copper, iron ore, oil sands and other minerals in major mining centers throughout the world. In addition to the manufacture of original equipment, an important part of our business consists of aftermarket sales, such as supplying parts, maintenance and repair services, and technical advice, as well as refurbishing and relocating older, installed original equipment. On May 4, 2007, we consummated the acquisition of DBT, a subsidiary of RAG Coal International AG, or RAG Coal, for $731.0 million in cash and stock, subject to certain closing adjustments. We paid to RAG Coal $710.0 million in cash, subject to certain closing adjustments, and issued 471,476 shares of our common stock with a market value of $21.0 million at the time of announcement of the acquisition of DBT, or the DBT Acquisition. As a result of the DBT Acquisition, we now operate in two business segments: surface mining (Bucyrus) and underground mining (DBT). We now have manufacturing facilities in Australia, China, Germany, Poland and the United States and service and sales centers in Australia, Brazil, Canada, Chile, China, England, Germany, India, Mexico, Peru, Russia, South Africa and the United States. After giving pro forma effect to the DBT Acquisition as if it had been consummated on January 1, 2006, we had combined sales for 2006 of $1.9 billion, comprised of $1.1 billion (58%) of original equipment sales and $799.1 million (42%) of aftermarket sales. Our pro forma combined backlog was $1.4 billion as of December 31, 2006.
The following charts provide a breakdown of our 2006 pro forma combined sales by geographic region, product/service category and end-market commodity:
2006 Pro Forma Combined Sales Breakdown
Geography | Product/Service | End-Market | ||
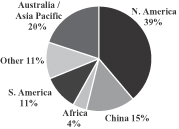 |
| 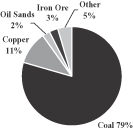 | ||
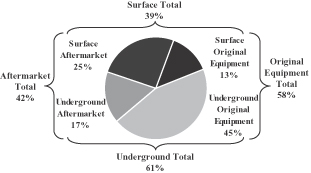
Bucyrus—Surface Mining Equipment and Aftermarket Sales (39% of 2006 Pro Forma Combined Sales)
Bucyrus designs, manufactures and markets draglines, electric mining shovels and rotary blasthole drills, which are used for the surface mining of coal, copper, oil sands, iron ore and other minerals throughout the world. Bucyrus also provides the aftermarket replacement parts and service for this original equipment. Bucyrus’ sales for 2006 were $738.0 million, comprised of $255.7 million (35%) of original equipment sales and $482.3 million (65%) of aftermarket sales. Bucyrus’ backlog was $894.7 million as of December 31, 2006.
S-1
Table of Contents
The table below describes Bucyrus’ surface mining equipment:
Original Equipment | Primary Use | Price Range Per Unit | Average Life | Installed Base Market Position(1) | ||||
Draglines | Remove overburden | $30 - 120 million | 40 years | #1 | ||||
Electric Mining Shovels | Load materials into trucks | $5 - 23 million | 15 years | #2 | ||||
Rotary Blasthole Drills | Drill holes for explosives | $1 - 4.5 million | 15 years | #1 |
(1) | Installed base market positions are based on information from Parker Bay Company. |
DBT—Underground Mining Equipment and Aftermarket Sales (61% of 2006 Pro Forma Combined Sales)
DBT designs, manufactures and markets high technology system solutions for underground coal mining throughout the world. DBT also provides the aftermarket parts and services for these systems. Principal original equipment products include roof support systems, armored face conveyors, automated plow systems, longwall shearers, continuous miners, transportation vehicles, idlers and belt drives. DBT’s sales for 2006 were $1.2 billion, comprised of $856.9 million (73%) of original equipment sales and $316.8 million (27%) of aftermarket sales. DBT’s backlog was $514.3 million as of December 31, 2006.
The table below describes DBT’s underground mining equipment:
Original Equipment | Primary Use | Price Range Per Unit | Average Life | Installed Base Market Position(1) | ||||
Roof Support Systems | Support mine roof | $25 - 35 million | 8 - 10 years | #1 | ||||
Automated Plow Systems | Longwall seam cutting | $9 - 10 million | 8 - 10 years | #1 | ||||
Longwall Shearers | Longwall seam cutting | $2.5 - 3.5 million | 8 - 10 years | #3 | ||||
Armored Face Conveyors | Transport cut material | $5.5 - 9 million | 8 - 10 years | #1 | ||||
Continuous Miners | Room and pillar cutting | $1.2 - 3 million | 10 - 15 years | #2 | ||||
Continuous Haulage Systems | Transport cut material | $1 - 2 million | 10 - 15 years | #1 | ||||
Feeder Breakers | Crush mined material | $0.3 - 0.5 million | 10 - 15 years | #2 | ||||
Underground Vehicles | Transport cut material and other items | $0.3 - 0.6 million | 10 - 15 years | #2 |
(1) | Installed base market positions are for high productivity Western-style mining equipment and are based on management’s estimates. |
Aftermarket Sales
Our combined aftermarket parts and service business is sourced primarily from our large installed original equipment base. We estimate that, on a pro forma basis, the replacement value of our combined installed original equipment base as of December 31, 2006 was approximately $22.0 billion. We believe that our installed base provides the foundation for our aftermarket sales. Customer purchases of aftermarket parts and services over the life of certain of our original equipment can exceed the initial purchase price of that equipment. Additionally, we generally realize higher gross margins on sales of our aftermarket parts than on sales of our original equipment. Because our original equipment tends to operate continuously in all market conditions and has predictable parts and maintenance needs, our aftermarket sales have historically been more stable and more predictable than original equipment sales.
S-2
Table of Contents
DBT Acquisition Strategic Rationale
Expanded Product Portfolio. The DBT Acquisition expands our product portfolio to include underground mining equipment and aftermarket support and enhances our capability to serve a larger segment of the global mining equipment market. According to the World Coal Institute, longwall mining equipment is utilized in approximately 60% of global underground coal mining production worldwide, and longwall mining is the predominant method in many of the high growth mining regions. DBT has the leading market position in longwall mining equipment systems and is an internationally recognized brand in the underground mining and equipment services market. Additionally, DBT has continued to increase its presence in the room and pillar equipment market, and we believe that it has significant opportunity for additional growth in this market.
Increased Installed Original Equipment Base. The DBT Acquisition increases the replacement value of our pro forma combined worldwide installed original equipment base as of December 31, 2006 from approximately $12.6 billion to approximately $22.0 billion. We believe that this increased installed base provides us with significantly greater opportunities to market our aftermarket parts and services. Parts typically earn a higher margin than our original equipment sales. Additionally, DBT’s aftermarket business has lower market share than that of Bucyrus, which we believe presents an opportunity for growth.
Expanded Presence in Potentially High Growth Markets. The DBT Acquisition provides us with an increased strategic presence in markets that we expect will experience substantial mining growth over the next several years, such as China and Russia. Additionally, we anticipate building upon Bucyrus’ presence in India, another market that we believe has high growth potential, to increase DBT’s share of the underground mining equipment market in that country. According to the International Energy Agency’s World Energy Outlook, coal production is expected to grow annually at 4.2%, 1.5% and 3.2% in China, Russia and India, respectively, through 2015.
Advanced Engineering and Innovative Technology. DBT’s products utilize advanced engineering and technology, and we believe that DBT is now a technology leader in the underground mining equipment industry. Specifically, DBT has made significant investments over the last three years to develop its line of longwall shearers and automated plow systems that we believe are technologically advanced products. DBT has made similar investments to develop its line of continuous miners.
For more information regarding the structure of the DBT Acquisition, see “Business—DBT Acquisition.”
Our Industry
The surface and underground mining equipment that we manufacture and service is used primarily in coal, copper, oil sands, iron ore and other mineral mines worldwide. Increased demand for these commodities is generally a function of population growth and continuing improvements in standards of living in many areas of the world. The market for equipment tends to be somewhat cyclical in nature due to market fluctuations for these commodities; however, the aftermarket for parts and services is generally more stable because this expensive, complex equipment is typically kept in continuous operation for eight to 40 years and requires regular maintenance and repair throughout its productive life. According to The Freedonia Group, the global annual market for mining equipment sales was estimated at $17.7 billion in 2004 and is expected to reach $27.5 billion in 2009.
The two primary suppliers of surface mining equipment are Bucyrus and Joy Global Inc.’s P&H Mining Equipment division, or P&H. Similarly, the two primary suppliers of underground mining equipment are DBT and Joy Global’s Joy Mining Machinery division, or Joy Mining. In addition, several niche players compete with limited product lines. We believe that recent consolidation within the mining industry has resulted in higher capitalized companies being better positioned to withstand commodity cycles and adhere to increased supply-side price discipline.
S-3
Table of Contents
Business Strengths
Stable and Profitable Aftermarket Business Driven by an Installed Base of Approximately $22.0 Billion. Aftermarket sales accounted for 42% of our total 2006 pro forma combined sales. On a stand-alone basis, Bucyrus’ aftermarket sales accounted for 65% of its total 2006 sales, and DBT’s aftermarket sales accounted for 27% of its total 2006 sales. Bucyrus’ aftermarket sales have grown at a 10.5% compound annual growth rate over the past 10 years, increasing every year over that period except for one year (1999) in which aftermarket sales declined by approximately 2%. Bucyrus has increased its market share in the supply of aftermarket parts and service for Bucyrus’ existing installed base from approximately 40% in 2002 to approximately 60% in 2006.
Advanced Engineering and Innovative Technology. We believe that innovative technologies enable mines to achieve increased efficiency and increased production levels. As a result, we have focused on developing advanced technologies for our products. For example, by teaming with Siemens Energy & Automation, or Siemens, Bucyrus recently developed a new dragline technology called Direct Drive for Draglines, or D3. D3 is a gearless drive system that enables mines to increase productivity and reduce downtime, maintenance costs and energy consumption. Additionally, in 2006 Bucyrus introduced the innovative 495 Series High-Performance shovels. The improvements to this series enhance shovel operation through increased efficiency and lower maintenance costs. DBT offers an upgraded line of continuous miners, which combine high cutting power with matching conveying and tramming capacity. Independent drive functions help to ensure high reliability and ease of maintenance, while the modular design allows roof bolter equipment to be added to the continuous miner.
Strong Global Fundamentals in Our Major End Markets. Our products are used primarily by large multinational companies and other customers that mine coal, copper, oil sands, iron ore and other minerals. As a result, our continued growth is directly linked to each of these underlying commodity markets. The majority of our major end markets have recently experienced strong market conditions, and prospects for continued growth currently remain positive over the longer term. We believe that large amounts of coal reserves and significant coal infrastructure make transitions from coal to other energy sources more difficult. Additionally, we believe that new clean coal technologies help to mitigate environmental and regulatory concerns, and new technologies, such as gasification and liquefaction, create opportunities for future growth in the use of coal.
Strong Backlog. We believe that our backlog level allows us to more accurately forecast our upcoming sales and plan our production accordingly. We expect our pro forma combined backlog of firm orders of $1.4 billion as of December 31, 2006 to generate relatively predictable 2007 levels of sales and cash flows from original equipment orders and related service and maintenance revenue. Additionally, we continue to experience strong market demand for our original equipment based on preliminary letters of intent to purchase, and indications for potential orders for, our original equipment for delivery through 2009.
Experienced Management Team. We are led by a group of executives with substantial experience at Bucyrus and in the mining industry. Our president and chief executive officer, Timothy W. Sullivan, and our chief financial officer, Craig R. Mackus, have 29 and 30 years of experience with us, respectively. Since our current management team was constituted in 2000, we have increased both sales and operating margins, even during the 2000-2003 period of prolonged weakness in commodity prices and original equipment sales, and have also operated efficiently in the current environment of constrained capacity and strong demand for our products. DBT is led by management with substantial experience in the underground mining industry, including William S. Tate, DBT’s current president and chief executive officer, who has over 30 years of energy experience as an operator and equipment manufacturer and has been with DBT for over eight years, and Luis de Leon, DBT’s current chief financial officer, who has 15 years of international experience in machinery and the systems manufacturing industry and has been with DBT for over 10 years.
S-4
Table of Contents
Business Strategy
Grow Our Aftermarket Business. We continue to increase our focus on the important aftermarket business associated with our installed base of original equipment because of its attractive profit margins and its greater stability and predictability compared to sales of original equipment. We will seek to increase DBT’s market share of aftermarket parts and services by implementing a strategy similar to Bucyrus’ successful aftermarket strategy. In addition, by enhancing aftermarket support, which is critical to maintaining equipment longevity and productivity, we hope to enhance our ability to secure more original equipment orders in the future.
Improve Operating Efficiencies at DBT. We have identified several long-term growth and cost-saving opportunities at DBT that we expect to implement. We expect to focus on additional initiatives in an attempt to realize increased operating efficiencies at DBT, including consolidating some of DBT’s international sales offices with Bucyrus’ sales offices and reducing DBT’s selling, general and administrative expenses and research and development expenses.
Expand Capacity and Productivity Initiatives. We are in the process of completing the third phase of our capacity expansion of Bucyrus’ manufacturing facilities in South Milwaukee, Wisconsin. Assuming that we are able to attract and retain the necessary skilled labor, the expansion is expected to enable us to increase our annual shovel production capacity from 10 machines in 2006 to 16 machines in 2007 and ultimately to 24 machines in 2008, as well as approximately double our manufactured parts capacity. Our expansion also will help provide us with added flexibility to increase dragline production should demand for shovels decline or demand for draglines increase. In addition, we expect that our expansion will provide for improved efficiency and improved workflow through the implementation of an improved production system and lean manufacturing initiatives. We expect our capacity expansion to be substantially completed by the end of the first quarter of 2008.
Focus on Strategic Markets. We believe that certain markets, including China, Russia and India, present significant growth opportunities in both underground and surface mining, and that these countries will be key strategic markets for our business. China has a fast-growing economy with limited domestic energy sources other than coal. According to the World Coal Institute, coal is currently the dominant natural resource used for power generation in China (approximately 77%). China has the third largest coal reserves in the world, and coal-fired power is expected to fuel most of its growth. According to the Methane to Markets Partnership, 90% of coal production in China was mined underground in 2006. To be in a position to compete more effectively in the underground mining market in China, we plan to expand our manufacturing capacity in China, although this expansion process will likely take at least 12 to 18 months to complete, and we expect that it likely will take at least several quarters after completion until we can begin realizing its anticipated benefits. Furthermore, DBT’s presence in Russia and Bucyrus’ presence in India provide additional opportunities for growth. We also intend to continue focusing on the North American and South African coal markets as areas of potential growth for DBT’s room and pillar mining products and services.
S-5
Table of Contents
The Offering
Common stock offered | 4,614,000 shares. |
Approximate number of shares of common stock outstanding after the offering | 36,696,665 shares. |
Listing | The NASDAQ Global Select Market. |
Symbol | BUCY. |
Use of proceeds | We estimate that the net proceeds from this offering will be approximately $286.4 million. We intend to use the net proceeds from this offering to repay a portion of our new $825.0 million term loan facility used to partially finance the DBT Acquisition. See “Use of Proceeds.” |
Affiliates of Lehman Brothers Inc. and J.P. Morgan Securities Inc. are lenders under our new term loan facility and, as such, will receive substantially all of the proceeds from this offering. See “Underwriting—Relationships.” |
Risk factors | See “Risk Factors” and other information included or incorporated by reference in this prospectus supplement and the accompanying prospectus for a discussion of factors you should carefully consider before deciding to invest in shares of our common stock. |
The number of shares of our common stock outstanding after this offering is based on our shares outstanding as of March 31, 2007, together with the 471,476 shares of our common stock issued to consummate the DBT Acquisition on May 4, 2007.
The number of shares of our common stock outstanding after this offering assumes that the offering closed on March 31, 2007 and the underwriters’ option to purchase additional shares is not exercised and excludes:
| • | 9,600 shares of our common stock issuable upon exercise of fully vested stock options at a weighted average exercise price of $8.33 per share as of March 31, 2007; |
| • | 81,774 shares of our common stock issuable upon exercise of 470,150 outstanding stock appreciation rights as of March 31, 2007. Of the 81,774 shares, 8,177 pertain to fully vested and exercisable outstanding stock appreciation rights as of March 31, 2007; and |
| • | 2,466,251 shares of our common stock available for future grants under our equity incentive plans as of March 31, 2007 (including under our Omnibus Incentive Plan 2007 approved at our 2007 annual stockholders meeting). |
If the underwriters exercise their option to purchase additional shares in full, we will issue and sell an additional 692,100 shares and will receive additional proceeds, after underwriting discounts and commissions but before expenses, of $43.1 million, which we expect to use to further reduce our term loan facility. See “Underwriting.”
Our principal executive offices are located at 1100 Milwaukee Avenue, South Milwaukee, Wisconsin 53172. Our phone number is (414) 768-4000.
S-6
Table of Contents
Summary First Quarter 2007 Results
Bucyrus First Quarter 2007 Compared to First Quarter 2006
While Bucyrus’ unaudited financial statements are not yet complete and Bucyrus has not yet filed its quarterly report on Form 10-Q for its first quarter ended March 31, 2007, Bucyrus currently expects to report the following results of operations and balance sheet information for the quarter ended March 31, 2007. The data reported in the following table for the quarter ended March 31, 2006 has been derived from Bucyrus’ unaudited consolidated condensed financial statements, which include all adjustments, consisting only of normal adjustments that management considers necessary for the fair presentation of the consolidated financial position and results of operations for that interim period. You should not consider the results presented in the table below for the first quarter ended March 31, 2007 to be indicative of results for the year ending December 31, 2007, particularly as a result of the DBT Acquisition. This table should be read together with our other financial information, including “Management’s Discussion and Analysis of Financial Condition and Results of Operations,” appearing elsewhere in this prospectus supplement.
| Three months ended March 31, | |||||||
| 2007 | 2006 | ||||||
| (Dollars in thousands) | |||||||
Statement of Earnings Data: | |||||||
Sales | $ | 190,361 | $ | 165,653 | |||
Cost of products sold | 138,283 | 124,780 | |||||
Gross profit | 52,078 | 40,873 | |||||
Selling, general and administrative expenses | 21,194 | 15,460 | |||||
Research and development expenses | 2,548 | 1,922 | |||||
Amortization of intangible assets | 446 | 452 | |||||
Operating earnings | 27,890 | 23,039 | |||||
Interest expense | 1,449 | 645 | |||||
Other (income) expense, net | (23 | ) | 122 | ||||
Earnings before income taxes | 26,464 | 22,272 | |||||
Income tax expense | 8,601 | 7,750 | |||||
Net earnings | $ | 17,863 | $ | 14,522 | |||
Balance Sheet Data: | |||||||
Cash and cash equivalents | $ | 13,285 | $ | 9,575 | |||
Total assets | 627,751 | 600,712 | |||||
Total debt | 94,180 | 82,597 | |||||
Stockholders’ investment | 314,084 | 295,996 | |||||
Other Financial Data: | |||||||
EBITDA(1) | $ | 32,160 | $ | 26,616 | |||
Certain charges deducted in calculating EBITDA(2) | 2,260 | 892 | |||||
(1) | EBITDA is defined as net earnings before interest income, interest expense, income tax expense, depreciation and amortization. EBITDA is presented because (a) we use EBITDA to measure our liquidity and financial performance and (b) we believe EBITDA is frequently used by securities analysts, investors and other interested parties in evaluating the performance and enterprise value of companies in general, and in evaluating the liquidity of companies with significant debt service obligations and their ability to service their indebtedness. Our EBITDA calculation is not an alternative to operating earnings under U.S. GAAP as an indicator of operating performance or of cash flows as a measure of liquidity. Additionally, EBITDA is |
S-7
Table of Contents
not intended to be a measure of free cash flow for management’s discretionary use, as it does not consider certain cash requirements such as interest payments, tax payments and debt service requirements. Because not all companies use identical calculations, this presentation of EBITDA may not be comparable to other similarly titled measures of other companies. The following table reconciles net earnings as shown in Bucyrus’ Unaudited Consolidated Statements of Earnings to EBITDA and reconciles EBITDA to net cash provided by operating activities as shown in Bucyrus’ Unaudited Consolidated Statements of Cash Flows: |
| Three months ended March 31, | ||||||||
| 2007 | 2006 | |||||||
| (Dollars in thousands) | ||||||||
Net earnings | $ | 17,863 | $ | 14,522 | ||||
Interest income | (212 | ) | (114 | ) | ||||
Interest expense | 1,449 | 645 | ||||||
Income tax expense | 8,601 | 7,750 | ||||||
Depreciation | 3,748 | 3,107 | ||||||
Amortization(3) | 711 | 706 | ||||||
EBITDA | 32,160 | 26,616 | ||||||
Changes in assets and liabilities | (15,057 | ) | 23,822 | |||||
Non-cash stock compensation expense | 1,692 | 578 | ||||||
Loss on sales of fixed assets | 95 | 42 | ||||||
Interest income | 212 | 114 | ||||||
Interest expense | (1,449 | ) | (645 | ) | ||||
Income tax expense | (8,601 | ) | (7,750 | ) | ||||
Net cash provided by operating activities | $ | 9,052 | $ | 42,777 | ||||
(2) | The following table shows certain charges that were deducted in calculating EBITDA for each of the periods presented. These items include (a) non-cash stock compensation expense related to Bucyrus’ equity incentive plans, (b) severance expenses for personnel changes in the ordinary course and (c) loss on sales of fixed assets in the ordinary course. We believe this table, when reviewed in connection with our presentation of EBITDA, provides additional information that is useful to our management and investors for measuring comparative operating performance between time periods and among companies. In addition to EBITDA, our management assesses the charges presented in this table when preparing our annual operating budget and financial projections. Specifically, we believe that this table allows our management and investors to assess our operating performance during the periods these charges were incurred on a consistent basis with the periods during which these charges were not incurred. |
| Three months ended March 31, | ||||||
| 2007 | 2006 | |||||
| (Dollars in thousands) | ||||||
Non-cash stock compensation expense | $ | 1,692 | $ | 578 | ||
Severance expenses | 473 | 272 | ||||
Loss on sales of fixed assets | 95 | 42 | ||||
| $ | 2,260 | $ | 892 | |||
(3) | Includes amortization of intangible assets and debt issuance costs. |
S-8
Table of Contents
DBT First Quarter 2007
DBT has not been a United States reporting company and has not historically prepared quarterly financial statements on a basis consistent with the audited financial statements of DBT included elsewhere in this prospectus supplement. As a result, DBT has not prepared financial statements for the first quarters of 2007 or 2006 on a basis that is directly comparable to the DBT audited financial information. Although DBT’s quarterly results are not necessarily indicative of the results to be expected for the remainder of 2007, we expect that DBT’s sales for 2007 will return to more normalized levels than were recognized in the first half of 2006. For the first quarter of 2007, DBT’s order intake, which we define as firm purchase orders booked during the period, was approximately $250 million, a decrease of 18.4% compared to order intake of approximately $296 million for the first quarter of 2006, but an increase of 81.2% and 41.2% compared to DBT’s order intake of approximately $138 million and $177 million for the third and fourth quarters of 2006, respectively. We believe this decrease reflects the fact that the first half of DBT’s 2006 results of operations benefited significantly from an influx of original equipment orders from underground mining customers that had deferred their original equipment purchases during the prolonged prior period of weaker coal commodity prices. We further base our expected decrease in DBT’s 2007 sales on the combination of the recent softening of U.S. coal commodity prices and our projected decreased demand for DBT’s original equipment from the unusually high levels of demand in the last half of 2005 and the first half of 2006. We anticipated and took into account these expected normalized levels of results when we valued and entered into the agreement to acquire DBT and have incorporated these expectations into our estimated range of full year 2007 pro forma combined sales and EBITDA. See “Management’s Discussion and Analysis of Results of Operations and Financial Condition—Current 2007 Outlook.”
S-9
Table of Contents
Summary Financial and Other Data
The following summary historical consolidated financial and other data of Bucyrus for the past three years is derived from Bucyrus’ audited consolidated financial statements. The following summary historical consolidated financial and other data of DBT for the past three years is derived from DBT’s audited consolidated financial statements (except for amounts presented in U.S. dollars, which have not been audited). You should read these tables in conjunction with “Use of Proceeds,” “Selected Historical Consolidated Financial Information of Bucyrus,” “Selected Financial Information of DBT,” “Management’s Discussion and Analysis of Financial Condition and Results of Operations,” and the historical financial statements, including the related notes thereto, included elsewhere in this prospectus supplement.
The summary historical financial information of DBT is presented in thousands of Euros. We also present summary historical financial information of DBT for 2006 in thousands of U.S. dollars, which, for the balance sheet and backlog data, is based on a translation at a representative rate of exchange of Euro 1.00 = U.S. Dollar 1.3203 as of December 29, 2006 and, for the statement of earnings and other financial data, is based on a translation at a representative average 2006 rate of exchange of Euro = U.S. Dollar 1.25622.
DBT’s historical consolidated financial statements appearing elsewhere in this prospectus supplement have been prepared in accordance with IFRS, which differ in certain material respects from U.S. GAAP. For a discussion of certain significant differences between IFRS and U.S. GAAP, see note 30 to DBT’s audited consolidated financial statements included elsewhere in this prospectus supplement, which reconciles DBT’s net profits and shareholders’ equity as reported under IFRS to U.S. GAAP. See “Unaudited Pro Forma Combined Condensed Financial Information.”
The pro forma statement of earnings gives pro forma effect to the DBT Acquisition and the related financing transactions, including this offering, as if those transactions had occurred on January 1, 2006. For more information, see “Unaudited Pro Forma Combined Condensed Financial Information.” The pro forma balance sheet gives pro forma effect to the same transactions as if they had occurred on December 31, 2006.
The pro forma condensed combined financial information is presented for illustrative purposes only and is not necessarily indicative of what the actual combined financial condition or results of operations would have been had the DBT Acquisition been completed on January 1, 2006 or December 31, 2006. The DBT Acquisition will be accounted for as a purchase. The adjustments reflected in the pro forma condensed combined financial information are based on preliminary purchase price allocations and assumptions that we believe are reasonable. These adjustments may change when additional information becomes available. Differences between the preliminary and final purchase price allocations could have a material impact on the pro forma financial information presented. The pro forma condensed combined financial information does not reflect costs we may incur to integrate DBT, and these costs may be material. Accordingly, the pro forma condensed consolidated financial information does not purport to be indicative of the financial condition or results of operations as of the effective date of the DBT Acquisition, as of the date of this prospectus supplement, or as of any other future date or period. This pro forma information is only a summary and should be read together with “Unaudited Pro Forma Condensed Combined Financial Information” and the historical financial statements, the related notes and other financial information of Bucyrus and DBT included or incorporated by reference into this prospectus supplement.
S-10
Table of Contents
Summary Bucyrus Historical Financial Information
| Years ended December 31, | |||||||||
| 2006 | 2005 | 2004 | |||||||
| (Dollars in thousands) | |||||||||
Statement of Earnings Data: | |||||||||
Sales | $ | 738,050 | $ | 575,042 | $ | 454,186 | |||
Cost of products sold | 551,275 | 437,611 | 357,819 | ||||||
Selling, general and administrative expenses | 73,138 | 54,354 | 53,050 | ||||||
Research and development expenses | 10,661 | 7,225 | 5,619 | ||||||
Amortization of intangible assets | 1,792 | 1,801 | 1,817 | ||||||
Operating earnings | 101,184 | 74,051 | 35,881 | ||||||
Interest expense | 3,693 | 4,865 | 11,547 | ||||||
Other expense, net | 217 | 269 | 1,658 | ||||||
Loss on extinguishment of debt | — | — | 7,316 | ||||||
Earnings before income taxes | 97,274 | 68,917 | 15,360 | ||||||
Income tax expense | 26,930 | 15,358 | 9,276 | ||||||
Net earnings | $ | 70,344 | $ | 53,559 | $ | 6,084 | |||
Balance Sheet Data: | |||||||||
Cash and cash equivalents | $ | 9,575 | $ | 12,451 | $ | 20,617 | |||
Total assets | 600,712 | 491,967 | 392,809 | ||||||
Total debt | 82,597 | 68,314 | 103,252 | ||||||
Common stockholders’ investment | 295,996 | 220,900 | 167,068 | ||||||
Other Financial Data: | |||||||||
Capital expenditures | $ | 71,306 | $ | 22,164 | $ | 6,285 | |||
EBITDA(1) | 116,023 | 87,582 | 40,846 | ||||||
Certain charges deducted in calculating EBITDA(2) | 5,867 | 974 | 19,833 | ||||||
Total backlog | 894,749 | 658,612 | 436,317 | ||||||
(1) | Please see page S-7 for a comprehensive discussion of EBITDA and why we believe this non-GAAP measure is useful to measure our liquidity and financial performance. |
S-11
Table of Contents
The following table reconciles net earnings as shown in Bucyrus’ Consolidated Statements of Earnings to EBITDA and reconciles EBITDA to net cash provided by operating activities as shown in Bucyrus’ Consolidated Statements of Cash Flows:
| Years ended December 31, | ||||||||||||
| 2006 | 2005 | 2004 | ||||||||||
| (Dollars in thousands) | ||||||||||||
Net earnings | $ | 70,344 | $ | 53,559 | $ | 6,084 | ||||||
Interest income | (663 | ) | (669 | ) | (316 | ) | ||||||
Interest expense | 3,693 | 4,865 | 11,547 | |||||||||
Income tax expense | 26,930 | 15,358 | 9,276 | |||||||||
Depreciation | 12,892 | 11,681 | 11,061 | |||||||||
Amortization(3) | 2,827 | 2,788 | 3,194 | |||||||||
EBITDA(2) | 116,023 | 87,582 | 40,846 | |||||||||
Changes in assets and liabilities | (39,557 | ) | (18,123 | ) | (22,957 | ) | ||||||
Non-cash stock compensation expense | 4,284 | 180 | 10,076 | |||||||||
Loss on sales of fixed assets | 140 | 273 | 287 | |||||||||
Interest income | 663 | 669 | 316 | |||||||||
Interest expense | (3,693 | ) | (4,865 | ) | (11,547 | ) | ||||||
Income tax expense | (26,930 | ) | (15,358 | ) | (9,276 | ) | ||||||
Loss on extinguishment of debt | — | — | 7,316 | |||||||||
Secondary offering expenses | — | — | 602 | |||||||||
Net cash provided by operating activities | $ | 50,930 | $ | 50,358 | $ | 15,663 | ||||||
Net cash used in investing activities | $ | (70,603 | ) | $ | (22,109 | ) | $ | (6,706 | ) | |||
Net cash provided by (used in) financing activities | $ | 15,134 | $ | (36,299 | ) | $ | 5,188 | |||||
(2) | The following table shows certain charges that were deducted in calculating EBITDA for each of the periods presented. These items include (a) expenses pursuant to a management services agreement with American Industrial Partners, or AIP, our former controlling stockholder, as well as fees paid to AIP or its affiliates and advisors for financial and management services performed for us outside the scope of the management services agreement, which was terminated in July 2004, (b) severance expenses for personnel changes in the ordinary course, (c) non-cash stock compensation expense related to Bucyrus’ equity incentive plans, (d) loss on sales of fixed assets in the ordinary course, (e) loss on extinguishment of debt and (f) secondary offering expenses. We believe this table, when reviewed in connection with our presentation of EBITDA, provides additional information that is useful to our management and investors for measuring comparative operating performance between time periods and among companies. In addition to EBITDA, our management assesses the charges presented in this table when preparing our annual operating budget and financial projections. Specifically, we believe that this table allows our management and investors to assess our operating performance during the periods these charges were incurred on a consistent basis with the periods during which these charges were not incurred. |
S-12
Table of Contents
| Years ended December 31, | |||||||||
| 2006 | 2005 | 2004 | |||||||
| (Dollars in thousands) | |||||||||
AIP management services expenses | $ | — | $ | — | $ | 1,182 | |||
Severance expenses | 1,443 | 521 | 370 | ||||||
Non-cash stock compensation expense | 4,284 | 180 | 10,076 | ||||||
Loss on sales of fixed assets | 140 | 273 | 287 | ||||||
Loss on extinguishment of debt | — | — | 7,316 | ||||||
Secondary offering expenses | — | — | 602 | ||||||
| $ | 5,867 | $ | 974 | $ | 19,833 | ||||
(3) | Includes amortization of intangible assets and debt issuance costs. |
Summary DBT Historical Financial Information
The following summary historical consolidated financial and other data of DBT for the past three years is derived from DBT’s historical consolidated financial statements that have been prepared in accordance with IFRS, which differ in certain material respects from U.S. GAAP. For a discussion of certain significant differences between IFRS and U.S. GAAP, see note 30 to DBT’s audited consolidated financial statements included elsewhere in this prospectus supplement, which reconciles DBT’s net profits and shareholders’ equity as reported under IFRS to U.S. GAAP.
Years ended December 31, | |||||||||||
| 2006(1) | 2006 | 2005 | 2004 | ||||||||
| (Dollars in thousands) | (Euros in thousands) | ||||||||||
Statement of Income Data: | |||||||||||
| Sales | $ | 1,173,680 | €934,295 | €752,453 | €621,108 | ||||||
| Cost of sales | 917,729 | 730,548 | 596,025 | 506,019 | |||||||
| Other operating income | 23,839 | 18,977 | 25,629 | 25,831 | |||||||
| Selling expenses | 60,667 | 48,293 | 52,384 | 49,617 | |||||||
| General and administrative expenses | 93,379 | 74,333 | 60,449 | 50,510 | |||||||
| Other expenses | 13,473 | 10,726 | 9,617 | 10,252 | |||||||
| 112,271 | 89,372 | 59,607 | 30,541 | ||||||||
| Other interest and similar income | 4,993 | 3,975 | 3,065 | 3,650 | |||||||
| Interest and similar expenses | 10,756 | 8,562 | 9,398 | 8,450 | |||||||
| Profit before tax | 106,508 | 84,785 | 53,274 | 25,741 | |||||||
| Income tax | 26,505 | 21,099 | 15,323 | 7,979 | |||||||
| Profit of the year from continuing operations | $ | 80,003 | € 63,686 | € 37,951 | € 17,762 | ||||||
Balance Sheet Data: | |||||||||||
Cash and cash equivalents | $ | 22,536 | € 17,069 | € 25,311 | N/A | ||||||
Total assets | 789,889 | 598,265 | 607,223 | N/A | |||||||
Other financial liabilities | 85,955 | 65,103 | 82,908 | N/A | |||||||
Total shareholders’ equity | 223,548 | 169,316 | 122,002 | N/A | |||||||
Other Financial Data: | |||||||||||
Capital expenditures | $ | 58,748 | € 46,766 | € 14,982 | € 23,999 | ||||||
EBITDA(2) | 128,821 | 102,546 | 73,673 | 45,273 | |||||||
Certain charges (credits) included in calculating EBITDA(3) | 16,762 | 13,344 | (2,389 | ) | (3,893 | ) | |||||
Total backlog | 514,320 | 389,548 | N/A | N/A | |||||||
S-13
Table of Contents
(1) | For convenience, financial information in this column is unaudited and has been converted into U.S. dollars from the comparable information presented in Euros using the representative exchange rates described elsewhere in this prospectus supplement. Total amounts in this column may not correspond to the summation of individual line items due to rounding related to the conversion. |
(2) | Please see page S-7 for a comprehensive discussion of EBITDA and why we believe this non-GAAP measure is useful to measure our liquidity and financial performance. The following table reconciles net earnings as shown in DBT’s Consolidated Statements of Earnings to EBITDA: |
| Years ended December 31, | |||||||||||||
| 2006(1) | 2006 | 2005 | 2004 | ||||||||||
(Dollars in | (Euros in thousands) | ||||||||||||
Profit of the year from continuing operations | $ | 80,003 | € 63,686 | €37,951 | €17,762 | ||||||||
Other interest and similar income | (4,993 | ) | (3,975 | ) | (3,065 | ) | (3,650 | ) | |||||
Interest and similar expenses | 10,756 | 8,562 | 9,398 | 8,450 | |||||||||
Income tax | 26,505 | 21,099 | 15,323 | 7,979 | |||||||||
Depreciation | 15,261 | 12,148 | 12,987 | 13,301 | |||||||||
Amortization(4) | 1,289 | 1,026 | 1,079 | 1,431 | |||||||||
EBITDA(3) | $ | 128,821 | €102,546 | €73,673 | €45,273 | ||||||||
(3) | The following table shows certain charges (credits) that were included in calculating EBITDA for each of the periods presented. These items include (a) a customer accommodation settlement related to temporary technological deficiencies for a newly introduced, high-technology prototype longwall system, which deficiencies have been subsequently rectified, (b) net gains on sales of fixed assets and (c) profit from DBT’s disposition of its DBT Mineral Processing subsidiary. We believe this table, when reviewed in connection with our presentation of EBITDA, provides additional information that is useful to our management and investors for measuring comparative operating performance between time periods and among companies. In addition to EBITDA, our management assesses the charges presented in this table when preparing our annual operating budget and financial projections. We believe that this table allows our management and investors to assess our operating performance during the periods these charges were incurred on a consistent basis with the periods during which these charges were not incurred. |
| Years ended December 31, | |||||||||||||
| 2006(1) | 2006 | 2005 | 2004 | ||||||||||
(Dollars in | (Euros in thousands) | ||||||||||||
Customer accommodation settlement | $ | 22,844 | €18,185 | € — | € — | ||||||||
Net gains on sales of fixed assets | (3,318 | ) | (2,641 | ) | (2,389 | ) | (3,893 | ) | |||||
Profit from disposal of DBT Mineral Processing | (2,764 | ) | (2,200 | ) | — | — | |||||||
| $ | 16,762 | €13,344 | €(2,389 | ) | €(3,893 | ) | |||||||
(4) | Includes amortization of intangible assets. |
S-14
Table of Contents
Summary Pro Forma Financial Information
The pro forma condensed combined financial information is presented for illustrative purposes only and is not necessarily indicative of what the actual combined financial position or results of operations would have been had the DBT Acquisition been completed on January 1, 2006 for the statement of earnings or December 31, 2006 for the balance sheet. This pro forma information is only a summary and should be read together with “Unaudited Pro Forma Combined Condensed Financial Information” and the historical financial statements, the related notes and other financial information of Bucyrus and DBT included elsewhere in this prospectus supplement.
| Year ended December 31, 2006 | |||
| (Dollars in thousands) | |||
Statement of Earnings Data: | |||
Sales | $ | 1,911,730 | |
Cost of products sold | 1,420,239 | ||
Selling, general and administrative expenses | 251,646 | ||
Research and development expenses | 19,881 | ||
Amortization of intangible assets | 10,192 | ||
Operating earnings | 209,772 | ||
Interest expense | 39,534 | ||
Other income, net | 6,904 | ||
Earnings before income taxes | 177,142 | ||
Income tax expense | 57,386 | ||
Net earnings | $ | 119,756 | |
Balance Sheet Data: | |||
Cash and cash equivalents | $ | 17,386 | |
Total assets | 1,977,542 | ||
Long-term debt, less current maturities | 542,077 | ||
Common stockholders’ investment | 604,178 | ||
Other Financial Data: | |||
EBITDA(1) | $ | 252,851 | |
Certain charges deducted in calculating EBITDA(2) | 22,629 | ||
Total backlog | 1,409,609 | ||
S-15
Table of Contents
(1) | Please see page S-7 for a comprehensive discussion of EBITDA and why we believe this non-GAAP financial measure is useful to measure our liquidity and financial performance. Pro forma EBITDA presented below includes adjustments necessary to conform DBT’s financial statements, which are prepared in accordance with IFRS, to U.S. GAAP and to the Company’s accounting policies. These adjustments will cause the component of pro forma EBITDA that is attributable to DBT’s results of operations to differ from the presentation of DBT’s EBITDA in “—Summary DBT Historical Financial Information.” The following table reconciles net earnings as shown in the Unaudited Pro Forma Combined Condensed Statements of Earnings to EBITDA: |
Year ended December 31, | ||||
| (Dollars in thousands) | ||||
Net earnings | $ | 119,756 | ||
Interest income | (5,656 | ) | ||
Interest expense | 39,534 | |||
Income tax expense | 57,386 | |||
Depreciation | 28,404 | |||
Amortization(3) | 13,427 | |||
EBITDA(2) | $ | 252,851 | ||
(2) | The following table shows certain charges (credits) that were included in calculating EBITDA for the period presented. These items include (a) severance expenses for personnel changes in the ordinary course, (b) non-cash stock compensation expense related to Bucyrus’ equity compensation plans, (c) gain on sales of fixed assets, net, (d) a customer accommodation settlement described in footnote 3 to the “Summary DBT Historical Financial Information” table and (e) profit from DBT’s disposition of its DBT Mineral Processing subsidiary. We believe this table, when reviewed in connection with our presentation of EBITDA, provides additional information that is useful to our management and investors for measuring comparative operating performance between time periods and among companies. In addition to EBITDA, our management assesses the charges presented in this table when preparing our annual operating budget and financial projections. Specifically, we believe that this table allows our management and investors to assess our operating performance during the periods these charges were incurred on a consistent basis with the periods during which these charges were not incurred. |
| Year ended December 31, 2006 | ||||
| (Dollars in thousands) | ||||
Severance expenses | $ | 1,443 | ||
Non-cash stock compensation expense | 4,284 | |||
Gain on sales of fixed assets, net | (3,178 | ) | ||
Customer accommodation settlement | 22,844 | |||
Profit from disposal of DBT Mineral Processing | (2,764 | ) | ||
| $ | 22,629 | |||
(3) | Includes amortization of intangible assets and debt issuance costs. |
S-16
Table of Contents
Before making a decision to invest in our common stock, you should carefully consider the risk factors set forth below and all other information contained in this prospectus supplement and the accompanying prospectus, including the documents incorporated by reference and the matters discussed under “Forward-Looking Statements and Cautionary Factors” in this prospectus supplement and in the accompanying prospectus. If any of the events contemplated by the following risks actually occur, our business, financial condition and/or results of operations could be materially adversely affected. As a result of these and other factors, the value of our common stock could decline, and you may lose all or part of your investment.
Risks Related to Our Business
A material disruption to our manufacturing plants could adversely affect our ability to generate revenue.
Bucyrus produces most of its surface mining equipment and aftermarket parts at its manufacturing plants in South Milwaukee and Milwaukee, Wisconsin, while DBT produces most of its underground mining equipment and aftermarket parts at its manufacturing plants in Germany, Pennsylvania and Virginia and, to a lesser extent, in Poland, China, Australia and Alabama. If operations at any of these facilities were to be disrupted as a result of equipment failures, natural disasters, work stoppages, power outages or other reasons, our business, financial condition and/or results of operations could be materially adversely affected. Any of these significant events could require us to make large unanticipated capital expenditures. Interruptions in production could increase our costs and delay our delivery of original equipment and parts in production. Production capacity limits could cause us to reduce or delay sales efforts until production capacity is available. All of our facilities are also subject to the risk of catastrophic loss due to fires, explosions or adverse weather conditions. Lost sales or increased costs that we may experience during the disruption of operations may not be recoverable under our insurance policies, and longer-term business disruptions could result in a loss of customers. If this were to occur, our future sales levels, and therefore our future profitability and cash flow, could be materially adversely affected.
We must attract and retain skilled labor in order to maintain and increase our business.
Our ability to operate profitably and expand our operations, including the realization of the desired benefits of our current production capacity expansion program, depends in part on our ability to attract and retain skilled manufacturing workers, equipment operators, engineers and other technical personnel. Demand for these workers is currently high and the supply is limited, particularly in the case of skilled and experienced machinists, welders and engineers. Also, DBT will face the retirement of a large number of skilled employees over the next five to ten years. As a result, our growth may be limited by the scarcity of skilled labor. Additionally, a significant increase in the wages paid by competing employers could result in a reduction in our skilled labor force, increases in the rates of wages we must pay or both. Further, we may be faced with increased training costs and reduced productivity as we train new employees. If our compensation costs increase or we cannot attract and retain skilled labor, including engineers, machinists and welders, our earnings could be reduced, and production capacity and growth potential could be impaired.
Bucyrus’ production capacity may not be sufficient to meet customer demand.
Bucyrus is currently operating at very high capacity utilization levels. In addition, its backlog of firm orders for surface mining equipment was $894.7 million as of December 31, 2006, compared to $658.6 million as of December 31, 2005. Our current expectations for 2007 assume continued strong global mining growth, as well as continued growth of Bucyrus’ sales. Bucyrus is in the midst of completing the third phase of its expansion program at its South Milwaukee facility that we believe will substantially increase its surface mining equipment production capacity, assuming we can employ sufficient skilled labor. However, production capacity may not be expanded soon enough, or to a sufficient extent, to satisfy customer demand for our surface mining products. If Bucyrus is unable to commit to producing products for its customers within the timeframes they require, then these customers may seek to procure equipment from other sources to meet their project deadlines, which could adversely affect our future sales levels, profitability and cash flow.
S-17
Table of Contents
If we are unable to purchase component parts or raw materials from key suppliers, the prices of component parts or raw materials rise materially, or the costs of shipping products rise materially, our business and results of operations may be materially adversely affected.
Bucyrus purchases all of its alternating current, or AC, drives relating to surface mining equipment and certain other electrical parts pursuant to a 10-year agreement with Siemens. Delays, disruptions or other difficulties procuring parts from Siemens, or our inability to obtain parts from Siemens altogether could have a material adverse effect on our business and results of operations. DBT purchases components of its roof supports from three primary suppliers pursuant to written agreements. The loss of any of these three primary suppliers, or delays, disruptions or other difficulties procuring parts from these suppliers, could have a material adverse effect on DBT’s ability to timely produce its roof supports and other underground mining original equipment and, ultimately, could have a material adverse effect on our business and results of operations. Bucyrus also purchases track links, castings and forgings from suppliers with whom we have longstanding relationships. Although these are not sole source suppliers, the loss of these suppliers could affect our ability to maintain or lower costs.
If we are required to procure alternative sources of supply, our ability to supply parts to our customers when needed could be impaired, we could lose business and our margins and cash flow could be reduced. Also, because we maintain limited production input inventories, even brief unanticipated delays in delivery by suppliers, including those due to capacity constraints, labor disputes, impaired financial condition of suppliers, weather emergencies or other natural disasters, may impair our ability to satisfy our customers and could adversely affect our operations.
In addition, we use substantial quantities of steel in our production processes. If the price of steel or other raw materials increases further and we are unable to recover those price increases, or if availability of certain types of steel decreases and we are not able to acquire sufficient quantities of this steel, we will experience reduced margins. Any significant future delays in obtaining production inputs and other supplies could result in our delay in delivering or producing products for our customers, which could subject us to contractual damage claims or otherwise harm our business and results of operations. In addition, there recently has been consolidation within the steelmaking industry, which could impede our ability to rely on competitive balance and longstanding business relationships to procure steel on favorable terms and in a timely manner.
Bucyrus also purchases component parts and raw materials on terms extended to us by our suppliers based on our overall credit rating. We significantly increased our debt levels to fund the DBT Acquisition. If our credit rating were to change adversely, our suppliers may not be willing or able to continue to extend favorable terms to us, which could negatively impact our cash flow or cause us to incur increased indebtedness under our revolving credit facility.
Some of our contracts require us to bear all costs of shipping and handling to the customer’s site. Because of the size and weight of our goods, these costs can be a significant portion of the total costs of a given contract. If transportation costs rise materially due to fuel prices or other factors, our margins could be reduced.
The industries we serve and our business are subject to significant cyclical fluctuations.
The sale of mining equipment is cyclical in nature and sensitive to a variety of factors, including fluctuations in market prices for coal, copper, oil, iron ore and other minerals, as well as alternatives to these minerals, changes in general economic conditions, interest rates, our customers’ replacement or repair cycles, consolidation in the mining industry and competitive pressures. Many factors affect the supply and demand for coal, minerals and oil and thus may affect the sale of our products and services, including:
| • | commodities prices and changes in those prices; |
| • | the levels of commodity production; |
| • | the levels of mineral inventories; |
S-18
Table of Contents
| • | the expected cost of developing new reserves; |
| • | the cost of conducting mining operations; |
| • | the level of mining activity; |
| • | worldwide economic activity; |
| • | substitution of new or competing inputs and mining methods; |
| • | national government political requirements; |
| • | environmental regulation; and |
| • | tax policies. |
If demand for mining services or mining equipment utilization rates decrease significantly, then demand for our products and services (particularly demand for original equipment, which tends to be closely correlated with the strength of commodity markets and, as a result, tends to be more cyclical than aftermarket sales), will likely decrease. Future decreased demand for original equipment may impact our results of operations to a greater extent than decreased demand in prior periods since we expect the total percentage of our sales derived from the sale of original equipment versus aftermarket parts and services to increase as a result of the DBT Acquisition. As a result of this cyclicality, we have experienced, and in the future could experience, extended periods of reduced sales and margins.
Because our customers’ purchasing patterns are affected by a variety of factors beyond our control, our sales and operating results may fluctuate significantly from period to period. Given the large sales prices of our equipment, one or a limited number of machines may account for a substantial portion of our sales in any particular quarter or other period. Although we recognize sales on a percentage-of-completion basis for most of our original equipment, the timing of one or a small number of contracts in any particular period may nevertheless affect our operating results. In addition, our sales and gross profit may fluctuate depending upon the sizes and the requirements of the particular contracts we enter into in that period.
As a result of the DBT Acquisition, we anticipate that our consolidated sales to coal mining customers will increase substantially, which will make our results of operations more dependent on the commodity price of coal and other conditions in the coal markets.
We anticipate that our consolidated sales to coal mining customers will increase substantially, primarily as a result of the DBT Acquisition. Approximately 96% of DBT’s sales in 2006 were derived from sales to coal mining customers compared to approximately 53% of Bucyrus’ sales for the same period. On a pro forma combined basis, our 2006 sales to coal mining customers accounted for approximately 79% of our total sales. Many of these customers supply coal as fuel for the production of electricity in the United States and other countries. Government regulation of electric utilities may adversely impact the demand for coal to the extent that such regulations cause or require such utilities to select alternative energy sources or technologies as a source of electric power. If a more economical form of electricity generation is discovered, developed or mandated, or if a current alternative source of energy such as nuclear power becomes more widely accepted or cost effective, the demand for our mining equipment could be adversely affected.
In any given year, we rely on significant customers for a large percentage of our sales.
Our business is dependent on securing and maintaining customers by promptly delivering reliable and high-performance products. We do not believe we are dependent upon any single customer; however, on an annual basis a single customer may account for a large percentage of our sales, particularly original equipment sales. In 2006, 2005 and 2004, BHP Billiton, Bucyrus’ single largest customer, accounted for approximately 13%, 14% and 12%, respectively, of its sales. DBT’s largest customer, the Shenhua Group, accounted for approximately 14% of its sales in 2006. The products that Bucyrus or DBT may sell to any particular customer depend on the
S-19
Table of Contents
size of that customer’s capital expenditure budget devoted to mining plans in a particular year and on the results of competitive bids for major projects. Additionally, Bucyrus’ top five customers in each of 2006, 2005 and 2004 collectively accounted for approximately 40%, 38% and 36%, respectively, of its sales. This trend reflects the recent consolidation within the mining industry. In addition, key sectors of the mining industry are dominated by a few enterprises, most of which are our customers. The loss of one or more of our significant customers or significantly reduced sales orders from significant customers could have a material adverse effect on our results of operations.
The loss of key members of our management team could adversely affect our business.
Our success substantially depends upon our ability to attract and retain qualified employees and upon the ability of senior management and other key employees to implement our business strategy and maintain and enhance our customer and supplier relationships. We believe there are only a limited number of available qualified chief executives in our industry. We rely substantially upon the services of our executive officers, and the loss of their services or the services of other members of our management team or our inability to attract or retain other talented personnel could impede the further implementation of our business strategy, which could have a material adverse effect on our business.
We are subject to risks of conducting business in foreign countries, including emerging markets.
We derive the majority of our sales from foreign markets where we have substantial operations. During 2006, Bucyrus generated $556.4 million, or approximately 75%, of its sales outside the United States, and DBT generated a significant percentage of its sales outside the United States. Various political, regulatory or economic factors, or changes in those factors, have the potential to adversely affect our international operations and our financial results. These factors principally include:
| • | tariffs and price controls; |
| • | trade sanctions and embargos; |
| • | reduction in government subsidies; |
| • | import or export licensing requirements; |
| • | economic downturns, civil disturbances or political instability; |
| • | employment regulations; |
| • | nationalism; |
| • | regulations regarding repatriation of earnings; |
| • | ability to enforce contract and intellectual property rights; |
| • | nationalization and expropriation; and |
| • | potentially burdensome taxation. |
In addition, a significant portion of the international businesses of Bucyrus and DBT are conducted in emerging markets located in Asia, Africa and South America. Many of the countries in these regions have developing legal and economic systems, which add a level of uncertainty to our operations in those countries relative to those that would be expected domestically. We believe the DBT Acquisition will increase our combined sales to customers in the developing markets of China and India, which will increase our exposure to the uncertainty associated with the developing governmental, legal and economic systems in those countries. We also plan to expand our manufacturing capacity in China, and the expansion process and the subsequent operation of the manufacturing facility will further increase our exposure to the uncertainties in this emerging market.
The above factors, and related unpredictability, could place the value of our operations and business relationships in overseas markets at risk, which could materially adversely affect our business and results of operations.
S-20
Table of Contents
We are subject to risks related to conducting business in foreign currencies.
As a result of the DBT Acquisition, we are now subject to substantially higher foreign currency exchange risk because DBT sells a significant amount of its products in Euros, while Bucyrus sells most of its products in United States dollars, and we will be reporting our combined consolidated results in United States dollars. As a result, an increase in the value of the United States dollar or the Euro, relative to other nations’ currencies, would decrease the United States dollar or Euro equivalent of DBT’s sales earned without decreasing the United States dollar or Euro value of the expenses associated with its sales.
Additionally, most of our aftermarket parts sales in Australia, South Africa, Brazil and the United Kingdom are denominated in the currencies of those nations, and the majority of our service sales are denominated in these and other local currencies. Although a portion of the expenses of providing overseas services are denominated in local currencies, the cost of goods associated with overseas sales are generally incurred in United States dollars and Euros. As a result, an increase in the value of the United States dollar or the Euro relative to these nations’ currencies would decrease the United States dollar or Euro equivalent of aftermarket sales earned abroad without decreasing the United States dollar or Euro value of a portion of the expenses associated with overseas sales.
Currency controls, devaluations, trade restrictions and other disruptions in currency convertibility and in the market for currency exchange could limit our ability to convert revenues earned abroad into United States dollars or Euros in a timely way. This could adversely affect our ability to service our United States dollar or Euro indebtedness, fund our United States dollar or Euro costs, finance capital expenditures and pay dividends on our common stock. Therefore, our future results of operations may be subject to increased volatility.
We operate in a highly competitive industry.
Methods of competition in our business are diverse and include price, customer relationships, lead times, operating costs, productivity of equipment, design and performance, technology, reliability, warranty, service, delivery and other commercial factors. In electric mining shovels and draglines, Bucyrus competes almost exclusively with P&H, although for certain applications its electric mining shovels may also compete against hydraulic shovels and small electric shovels made by other manufacturers. Bucyrus’ primary competitors in the rotary blasthole drills market are P&H and Atlas Copco AB. In the aftermarket business, Bucyrus competes with P&H, Atlas Copco AB and numerous independent firms that produce copies of the parts manufactured by Bucyrus and other original equipment manufacturers. In the underground mining segment, DBT competes primarily with Joy Mining for the sale of continuous miners, longwall shearers, powered roof supports and other underground mining equipment, as well as with a number of both established and emerging worldwide manufacturers of such equipment. In China and Russia, both Bucyrus and DBT also face competition from regional and domestic equipment manufacturers, including manufacturers owned directly or indirectly by governmental entities. For example, in China, the Shenhua Group, which is the largest customer for mining equipment in China and was DBT’s largest customer in 2006, has announced its intention to manufacture and purchase roof supports through a Chinese joint venture partner in which Shenhua owns an ownership interest. This circumstance could make it more difficult for us to compete effectively in China or realize some of the expected potential benefits of the DBT Acquisition. As those markets and markets in other industrialized countries continue to develop, this competition may increase.
Certain of our competitors, including Joy Global, may be larger than we are or have greater financial, marketing, manufacturing or distribution resources than we do. Demand for our products may be affected by our ability to respond to downward pricing pressure from our competitors or to continue to provide shorter lead time and quicker delivery of our products than our competitors. We cannot assure you that our products will continue to compete successfully with those of our competitors or that we will be able to retain our customer base or improve or maintain our profit margins on customer sales. If we are unable to maintain our profit margins, our results of operations could be materially adversely affected.
S-21
Table of Contents
If we fail to offer technologically advanced equipment to our customers, demand for our products may be materially adversely affected.
We believe that our mining industry customers are focused on improving automation, standardization and consolidation of equipment and mining operations. In that regard, we concentrate on producing technologically advanced equipment that allows our customers to conduct cost-efficient operations. To remain competitive, we believe we must develop new and innovative products on an ongoing basis. If we are unable to continue developing new and innovative products that incorporate technological advancements and meet the evolving requirements of our customers, or if we are unable to successfully bring such products to market, or if our competitors produce and sell equipment that is more technologically advanced than ours, the demand for our mining equipment could be materially adversely affected.
Regulations affecting the mining industry or electric utilities may reduce demand for our products and services.
Our principal customers are mining companies. Many of these customers supply coal as a power generating source for the production of electricity in markets around the world. The operations of these mining companies are geographically diverse and are subject to or affected by a wide array of regulations in the jurisdictions in which they operate, including those with a direct impact on mining activities and those indirectly affecting their businesses, such as applicable environmental laws and regulations governing the operation of coal-fired power plants. As a result of changes in regulations and laws relating to the operation of mines, our customers’ mining operations could be disrupted or curtailed by governmental authorities. The high cost of compliance with mining and environmental regulations may also induce customers to discontinue or limit their mining operations, and may discourage companies from developing new mines. Additionally, government regulation of coal-fired power plants may adversely impact the demand for coal to the extent that such regulations cause electric utilities to select alternative energy sources and technologies as sources of electric power. Domestic and international initiatives to regulate mercury emissions and initiatives targeting acid rain or greenhouse gas emissions could significantly depress coal consumption in Western economies. If demand for coal declines, demand for our products will also decline, which would have a material adverse effect on our business.
Labor disruptions could adversely affect our operations.
As of December 31, 2006, approximately 415 of Bucyrus’ employees in the United States were unionized, and DBT had union contracts in place covering approximately 1,400 employees. Bucyrus’ five and one-half year contract with the United Steel Workers of America representing hourly workers at the South Milwaukee and Milwaukee facilities and its three-year contract with the International Brotherhood of Teamsters, Chauffeurs, Warehousemen and Helpers of America representing workers at its Memphis warehouse facility expire in April 2010 and September 2008, respectively. Many of the collective bargaining agreements relating to DBT’s non-United States employees may be terminated by either the union or the employer association with a one to three month notice period (although these agreements will remain in full force and effect until a new agreement has been reached). After expiration of these agreements, we cannot assure you that we will be able to reach new agreements without a work stoppage or strike, and any new agreements may not be reached on terms satisfactory to us, may be on substantially different terms from our current agreements and may result in increased direct and indirect labor costs. A dispute between our employees and us could divert significant management time and attention and disrupt our operations, and the resulting adverse impact on our relationships with customers could reduce our revenue. Also, a few of our mine site operations and production and other facilities are located in areas of high union concentration or in nations with laws favorable to unionization, and, as a result, such operations and facilities are susceptible to union organizing activity. Additionally, DBT’s obligations under its labor agreements may prevent us from taking actions that we might otherwise deem prudent in connection with the operation of DBT’s business, which could have a material adverse effect on our and/or DBT’s business, financial condition and/or results of operations.
S-22
Table of Contents
In addition, the workforces of many of our suppliers and our transportation providers are unionized. If they are disrupted by labor issues, delivery of parts and materials to us could be reduced or delayed. Many of our customers have unionized work forces, and work stoppages experienced by our customers could cause us to lose sales or incur increased costs.
We may be adversely affected by environmental and safety regulations or concerns.
We are subject to increasingly stringent environmental and occupational health and safety laws and regulations in the countries in which we operate, including laws and regulations governing emissions to air, discharges to water and the generation, handling, storage, transportation, treatment and disposal of, or exposure to, hazardous materials. We cannot assure you that we have always on a historical basis complied, or will continue to comply, with these requirements. If we are not in compliance with these laws and regulations, we may incur remediation obligations or other costs in excess of amounts reserved, or fines, penalties or suspension of production. We may be adversely impacted by costs, liabilities or claims with respect to existing or subsequently acquired operations, under either present laws and regulations or those that may be adopted or imposed in the future. We may incur environmental liabilities relating to DBT’s current properties or properties that had been formerly owned or operated by DBT that may not be covered by indemnification under our Share Purchase Agreement, or with respect to which indemnification may be limited by the Share Purchase Agreement, and there can be no assurance that RAG Coal would be able to satisfy such indemnification obligation at the time we make a claim or at all.
Our operations are also subject to laws requiring the cleanup of contaminated property. If a release of hazardous substances occurs, or has occurred, at or from any of our current or former properties or at a landfill or another location where we have disposed of hazardous materials, we may be held liable for the contamination, and the amount of such liability could be material.
In addition, increased environmental regulation of the mining industry in North America and overseas could increase costs to us or to our customers and adversely affect the sales of our products and future operating results. These requirements may change in the future in a manner that could require us to make capital and other expenditures, which could have a material adverse effect on our business, results of operations and financial condition.
We may have to apply significant cash to meet our unfunded pension obligations, and these obligations are subject to increase.
A substantial majority of Bucyrus’ United States employees participate in its defined benefit pension plans, and Bucyrus also provides certain postretirement benefits. As of December 31, 2006, Bucyrus’ unfunded pension and postretirement benefit liability totaled $44.9 million. Declines in interest rates or the market values of the securities held by the plans, or other adverse changes, could materially increase the underfunded status of Bucyrus’ plans and affect the level and timing of required cash contributions in 2007 and after. In addition, as of December 31, 2006, DBT had $113.4 million in unfunded pension liabilities with respect to its employees, with no assets set aside to fund such obligations.
Our continued success depends in part on our ability to protect our intellectual property.
Our future success depends in part on our ability to protect our intellectual property. We rely principally on nondisclosure agreements and other contractual arrangements and trade secret laws and, to a lesser extent, trademark and patent law, to protect our intellectual property, including jointly developed intellectual property. However, these measures could prove inadequate to protect our intellectual property from infringement by others or to prevent misappropriation of our proprietary rights. In addition, the laws and enforcement mechanisms of some foreign countries do not protect proprietary rights to the same extent as do United States laws. We expect that the expansion by DBT of its manufacturing capacity in China may heighten our risk of intellectual property infringement due to the pervasive nature in that country of independent firms called “will-fitters” that produce
S-23
Table of Contents
copies of the parts manufactured by DBT and other original equipment manufacturers. Our inability to protect our proprietary information and enforce intellectual property rights through infringement or other enforcement proceedings could have a material adverse effect on our business, financial condition and results of operations.
We are, and may be in the future, subject to product liability and other lawsuits related to past and current activities.
The selling and servicing of complex, large scale equipment used in a variety of locations and climates, and integrating a variety of manufactured and purchased components entails an inherent risk of lawsuits and liability relating to the operation and performance of the equipment and the health and safety of the workers who operate and come into contact with it. For example, Bucyrus has been named as a co-defendant as of December 31, 2006, in approximately 290 pending personal injury liability cases alleging damages caused by exposure to asbestos and other substances, and the particular circumstances of many of these cases are difficult to assess because the claims allege exposure to a variety of substances from various sources over varying historical periods and assert the culpability of multiple defendants. DBT is also subject to various product liability and personal injury claims, including those relating to alleged asbestos and silicosis exposure. These types of claims, as well as product liability claims in general, can be expensive to defend and can divert the attention of management and other personnel for long periods of time, regardless of the ultimate outcome. While we maintain product liability and other insurance to cover varying levels of claims of this nature, including varying levels of coverage for the historical periods during which the pending claims of which we are aware allege asbestos exposure, those policies are subject to deductibles and recovery limitations, and there are limitations on events covered by these policies. Also, we cannot assure you that we will be able to obtain insurance on acceptable terms in the future, if at all, or obtain insurance that will provide adequate coverage against potential future claims. These lawsuits and future lawsuits against us could be resolved in a manner that materially and adversely affects our product reputation, business, financial condition and/or results of operations.
We may encounter difficulties in integrating DBT’s operations that may have a material adverse impact on our future growth and operating performance.
Full realization of the expected benefits and synergies of the DBT Acquisition over time will require integration of certain aspects of DBT’s manufacturing, engineering, administrative, sales and marketing and distribution functions, as well as some integration of DBT’s multiple information systems platforms and processes. We initially plan to allow DBT to continue to be operated largely as an independent organization under the supervision of our senior management. We expect to more fully analyze DBT’s internal organizational and operating structure and, where possible, identify appropriate opportunities for further integration and synergies over the longer term. This may be a long and difficult process and may require substantial attention from our management team and involve substantial expenditures and include additional operational expenses. Even if we are able to successfully integrate the operations of DBT, we may not be able to realize the expected benefits and synergies of the DBT Acquisition, either in the amount of time or within the expected time frame, or at all, and the costs of achieving these benefits may be higher than, and the timing may differ from, what we currently expect. Our ability to realize anticipated benefits and synergies from the DBT Acquisition may be affected by a number of factors, including the following:
| • | use of more cash or other financial resources, and additional management time, attention and distraction, on integration and implementation activities than we expect, including restructuring and other exit costs; |
| • | increases in other expenses related to the DBT Acquisition, which may offset any potential cost savings and other synergies from the DBT Acquisition; |
| • | our ability to realize anticipated levels of sales in emerging markets like China and India; and |
| • | our ability to avoid labor disruptions or disputes in connection with any integration. |
S-24
Table of Contents
Any potential cost-saving opportunities may take at least several quarters to begin to implement, and any results of these actions may not be realized for at least several quarters following implementation. We cannot assure you that we will be able to integrate the operations of DBT successfully, that we will be able to realize any anticipated benefits and synergies from the DBT Acquisition or that we will be able to operate the DBT business as profitably as anticipated.
Because of the increase in our debt level and debt service obligations to finance the DBT Acquisition, we may have less cash flow available for our business operations, we could become increasingly vulnerable to general adverse economic and industry conditions and interest rate trends, and our ability to obtain future financing may be limited.
We entered into new $1.225 billion credit facilities to fund the cash purchase price for the DBT Acquisition and refinance certain existing debt and provide us with a revolving credit facility to support our future working capital needs, our operating needs and our capital expenditure plan. We expect that the net proceeds from this offering will be used to repay all of the then outstanding amounts under the revolving credit facilities, with the remainder used to reduce a portion of the term loan facility. See “Use of Proceeds.”
Bucyrus’ long-term debt, less current maturities, as of December 31, 2006 was $82.3 million, which means that borrowings under our new credit facilities will represent significantly increased aggregate debt levels for us. Our ability to make required payments of principal and interest on our increased debt levels will depend on the future performance of the combined businesses of DBT and Bucyrus, which, to a certain extent, is subject to general economic, financial, competitive and other factors that are beyond our control. We cannot assure you that our business will generate sufficient cash flow from operations or that future borrowings will be available under our new credit facilities in an amount sufficient to enable us to service our indebtedness or to fund our other liquidity needs. In addition, our new credit facilities contain financial and restrictive covenants that limit our ability to, among other things, borrow additional funds or take advantage of business opportunities. Our failure to comply with such covenants could result in an event of default that, if not cured or waived, could result in the acceleration of all our indebtedness or otherwise have a material adverse effect on our business, financial condition, results of operations and debt service capability. See “Management’s Discussion and Analysis of Financial Condition and Results of Operations—Liquidity and Capital Resources—Description of New Credit Facilities.”
Our increased level of debt and the more restrictive covenants contained in our new credit facilities could have important consequences for our business, results of operations and/or financial condition, including:
| • | increasing our vulnerability to general adverse economic and industry conditions and detract from our ability to successfully withstand a downturn in our markets or the economy generally; |
| • | requiring us to dedicate a substantial portion of our cash flow from operations to required payments on debt, thereby reducing the availability of such cash flow to fund working capital, capital expenditures, manufacturing capacity expansion, additional business opportunities and other general corporate activities; |
| • | limiting our ability to obtain additional financing in the future to fund working capital, capital expenditures, manufacturing capacity expansion, additional business opportunities and other general corporate requirements; |
| • | limiting our flexibility in planning for, or reacting to, changes in our business and the markets we serve; |
| • | placing us at a competitive disadvantage compared to less leveraged competitors; and |
| • | making us vulnerable to increases in interest rates because debt under our new credit facilities will bear interest at variable rates. |
S-25
Table of Contents
In connection with the DBT Acquisition, we are required to fulfill DBT’s obligations under a collective bargaining agreement, which obligations place certain restrictions on our operation of DBT for a period of time.
Pursuant to the Share Purchase Agreement with RAG Coal, we are required to fulfill certain obligations under a collective bargaining agreement covering DBT’s employees. We are not allowed to, among other things,
| • | move DBT’s corporate headquarters from Lünen, Germany prior to December 31, 2009; |
| • | with certain exceptions, terminate more than 30 DBT employees per year prior to December 31, 2010; or |
| • | dispose of DBT’s German, United States or Australian business units prior to December 31, 2009. |
If DBT’s order intake materially decreases from the order amounts set forth in the business plan during two consecutive fiscal quarters, and negotiations to find a mutually agreed solution which is acceptable to both us and DBT’s employees are unsuccessful, DBT would be able to terminate the collective bargaining agreement. The collective bargaining agreement otherwise terminates on December 31, 2010.
Additionally, to facilitate the DBT Acquisition, we entered into a Shareholders’ Agreement with HMS Hamburg Trust GmbH, or the Hamburg Trust, a German domiciled special purpose financial intermediary. Under the terms of the Shareholders’ Agreement, the Hamburg Trust acquired non-voting equity securities (with no rights to cash flows or dividends) of DBT Holdings GmbH, which is the company that purchased the shares of DBT from RAG Coal pursuant to the Share Purchase Agreement. See “Business—DBT Acquisition.” Pursuant to that Shareholders’ Agreement, we agreed with the Hamburg Trust that, among other things, we would not take action that would result in a breach of or deviation from the collective bargaining agreement without the consent of Hamburg Trust.
These obligations may prevent us from taking actions that we might otherwise deem prudent in connection with the operation of DBT’s business, which could have a material adverse effect on our and/or DBT’s business, financial condition or results of operations.
DBT may have liabilities which are not known to us.
Because our acquisition subsidiary purchased the shares of DBT, it assumed DBT’s liabilities and risks after the closing of the transaction, subject to certain representations and warranties of, and indemnification rights against, RAG Coal. There may be liabilities or risks that we failed, or were unable, to discover, or that we underestimated, in the course of performing our due diligence investigations of DBT. Additionally, DBT has made previous acquisitions and we will be subject to any liabilities and risks relating to these prior acquisitions as well. We cannot assure you that our rights to indemnification contained in our Share Purchase Agreement will be sufficient in amount, scope or duration to fully offset the possible liabilities associated with the business or property acquired. Any such liabilities, individually or in the aggregate, could have a material adverse effect on our business, financial condition or results of operations. As we begin to operate DBT, we may learn additional information about DBT that adversely affects us, such as unknown or contingent liabilities, issues relating to compliance with applicable laws or issues related to ongoing customer relationships or order demand.
To remain compliant with the obligations imposed on us by the Sarbanes-Oxley Act of 2002, we may be required to make significant changes in the internal controls, information systems and technologies or other aspects of DBT’s business.
Section 404 of the Sarbanes-Oxley Act of 2002 requires public companies like ours to review and make certain disclosures regarding their internal controls over financial reporting. We are also required to maintain certain disclosure controls and procedures and to take certain other actions and implement certain other practices and procedures, in order to remain compliant with other sections of the Sarbanes-Oxley Act of 2002, as well as other rules and regulations of the SEC applicable to us. We have in the past undertaken efforts, at substantial
S-26
Table of Contents
cost, to become compliant with these rules and regulations, including the documentation, testing and review of our internal controls over financial reporting under the direction of senior management and the implementation of a system of disclosure controls and procedures. We have not yet been able to adequately test or review the internal controls over financial reporting currently maintained by DBT and, as a result, do not know whether such internal controls are sufficient to allow us to identify significant deficiencies and material weaknesses in their design or operation which are reasonably likely to adversely affect our ability to record, process, summarize and report financial information and/or detect fraud. If DBT’s internal controls over financial reporting are not adequate or in conformity with the requirements of the Sarbanes-Oxley Act of 2002, we may be required to use significant financial and managerial resources to implement a compliant system, or to disclose significant deficiencies or material weaknesses, which may subject us to penalties and other enforcement actions. Additionally, the integration of DBT’s financial reporting systems with our systems may take time and may cause potential delays in our external and internal reporting of our financial results during the first several quarters that we operate DBT. We may also be required to use significant financial and managerial resources to implement a system of disclosure controls and procedures at DBT to ensure that material information relating to DBT is made known to us in a timely fashion. These actions may have a material adverse effect on our business, financial condition or results of operations.
We have entered a new line of business in which certain of our competitors have substantially more experience than we do.
Through the DBT Acquisition, we have entered the market for the production, sale and service of original equipment and spare parts and service for the underground mining industry, including equipment used in longwall mining, room and pillar mining, mineral processing, automation and control, transportation and material handling applications. Prior to the DBT Acquisition, we manufactured and serviced original equipment only for surface mining applications and not for the underground mining industry. We cannot assure you that the business strategies applicable to our operations with respect to surface mining, or the manner in which we have implemented those strategies, will be effective in the underground mining market, or that we will be able to develop and implement alternative successful strategies, including strategies used to increase aftermarket sales and services. If we are unable to effectively manage our underground mining equipment operations or compete against our competitors who are more established in the underground mining industry, our operating results could be materially adversely affected.
Risks Related to Our Common Stock
Anti-takeover provisions in our charter documents and Delaware corporate law may make it difficult for our stockholders to replace or remove our current board of directors and could deter an unsolicited third-party acquisition offer, which may adversely affect the marketability and market price of our common stock.
Provisions in our certificate of incorporation and bylaws, as well as Delaware law, may make it difficult for stockholders to change the composition of our board of directors in any one year, which consequently may make it difficult to change the composition of our management. In addition, the same provisions may make it more difficult and expensive for a third party to pursue a tender offer, change in control or takeover attempt that is opposed by our management and board of directors. Stockholders who might desire to participate in this type of transaction may not have an opportunity to do so. These anti-takeover provisions could substantially impede the ability of stockholders to benefit from a change in control or change our management and board of directors and, as a result, may adversely affect the market price of our common stock and your ability to realize any potential change in control premium.
Additionally, from time to time, our board of directors has considered adopting a stockholder rights plan, and may in the future adopt such a plan. Some investors believe that stockholder rights plans can have the effect of delaying, deferring or preventing a change in control.
S-27
Table of Contents
Our board of directors can issue preferred stock without stockholder approval of the terms of such stock.
Our certificate of incorporation authorizes our board of directors, without stockholder approval, to issue up to 10 million shares of preferred stock in one or more series and to fix the rights, preferences, privileges and restrictions granted to or imposed upon the preferred stock, including voting rights, dividend rights, conversion rights, terms of redemption, liquidation preference, sinking fund terms, subscription rights and the number of shares constituting any series or the designation of a series. Our board of directors can issue preferred stock with voting and conversion rights that could adversely affect the voting power of the holders of common stock, without stockholder approval, including in connection with a stockholder rights plan. No shares of preferred stock are currently outstanding, and we have no present plan to issue any shares of preferred stock.
Our ability to pay dividends is limited by provisions in our credit facilities.
Our new credit facilities limit our ability to pay cash dividends on our capital stock unless we meet specified financial tests or obtain our lenders’ consent. Our current regular quarterly cash dividend rate is $0.05 per share and, while we currently anticipate continuing to pay such regular quarterly cash dividends, any such payment will be at the discretion of our board of directors after taking into account various factors, including our financial condition, operating results, cash needs, growth plans and contractual and other legal restrictions. Accordingly, investors may be required to rely on sales of their common stock after price appreciation, which may or may not occur, as the only, or the primary, way to realize any gains of their investment. Some institutional investors cannot or will not invest in non-dividend paying equity securities. See “Management’s Discussion and Analysis of Financial Condition and Results of Operations—Liquidity and Capital Resources—Description of New Credit Facilities.”
Our common stock is subject to significant price fluctuations.
The trading price of our common stock may be volatile in response to a number of factors, many of which are beyond our control, including actual or anticipated quarterly variations in our financial results, changes in financial estimates for us by securities analysts, announcements by our competitors of significant acquisitions, strategic partnerships, joint ventures or capital commitments announcements by us or others, developments affecting us, our customers and our suppliers and general market volatility. Our common stock may experience increased volatility as a result of our integration of DBT’s operations and as we report financial results for the first several quarters following the consummation of the DBT Acquisition. In addition, our financial results may be below the expectations of securities analysts and investors. If this were to occur, the market price of our common stock could decrease, perhaps significantly. Further, the stock markets in general have experienced substantial price and trading fluctuations. These fluctuations have resulted in volatility in the market prices of securities that often has been unrelated or disproportionate to changes in operating performance. These broad market fluctuations may adversely affect the market price of our common stock.
Shares eligible for future issuance or sale may cause our common stock price to decline, which may negatively impact your investment.
Future issuances or sales of additional shares of our common stock or the perception that such issuances or sales could occur may cause prevailing market prices for shares of our common stock to decline and may adversely affect our ability to raise additional capital at a time and price favorable to us. As of the date of this prospectus supplement, our amended and restated certificate of incorporation provides that we have authority to issue up to 75 million shares of our common stock and up to 10 million shares of our preferred stock. As of March 31, 2007, and including the 471,476 shares issued in the DBT Acquisition, 32,082,665 shares of our common stock and no shares of our preferred stock were outstanding. Also as of such date, there were 2,466,251 shares of our common stock reserved for issuance under our equity incentive plans or pursuant to individual option grants, stock appreciation rights and restricted stock awards. As of March 31, 2007, after giving effect to this offering and the shares issued in the DBT Acquisition, we would have had 36,696,665 shares of our common stock outstanding (37,388,765 shares of common stock outstanding if the underwriters in this offering exercise their option to purchase additional shares in full).
S-28
Table of Contents
We, as well as our executive officers and directors, have agreed to a “lock-up,” meaning that neither we nor they will sell any common stock without the prior consent of Lehman Brothers Inc. on behalf of the underwriters for 90 days following the date of this prospectus supplement. See “Underwriting” for a discussion of the lock-up agreements.
As part of the consideration for the DBT Acquisition, we issued 471,476 shares of our common stock to RAG Coal. Pursuant to the Share Purchase Agreement, with certain limited exceptions, RAG Coal cannot, without our prior written consent, directly or indirectly sell or otherwise transfer (1) any of these shares for a period of one year from the closing date of the DBT Acquisition; (2) more than 30% of these shares prior to the second anniversary of the closing date of the DBT Acquisition; and (3) more than 60% of these shares prior to the third anniversary of the closing date of the DBT Acquisition. Following this period, these shares will be available for sale into the market at any time, subject only to applicable securities laws, rules and regulations. These sales or a perception that these sales may occur could reduce the market price for our common stock. We have agreed with the underwriters in this offering not to waive any of our rights under the Share Purchase Agreement restricting RAG Coal’s ability to sell the shares of our common stock issued in the DBT Acquisition during a 90-day lock-up period commencing on the date of this prospectus supplement without the prior written consent of Lehman Brothers Inc.
S-29
Table of Contents
Based upon an assumed offering price of $65.03 per share, which was the last reported sale price of our common stock on May 3, 2007, we estimate that the net proceeds from this offering, after deducting underwriting discounts and commissions and the estimated offering expenses payable by us, will be approximately $286.4 million. If the underwriters exercise in full their option to purchase up to 692,100 additional shares, we estimate the aggregate net proceeds from the offering will be approximately $329.5 million, after deducting underwriting discounts and commissions and estimated offering expenses. A 10% change in the number of shares of common stock to be sold in this offering would result in a change in net proceeds of $28.7 million, assuming a public offering price of $65.03 per share. Separately, a $1.00 change in the public offering price per share over or under $65.03 (assuming no change in the number of shares offered) would result in a change in net proceeds of $4.4 million.
We intend to use the net proceeds from this offering to repay a portion of our new term loan facility. Affiliates of Lehman Brothers Inc. and J.P. Morgan Securities Inc. are lenders under our new term loan facility and, as such, will receive substantially all of the proceeds from this offering. See “Underwriting—Relationships.” The following table sets forth the estimated sources and uses of funds reflecting the financing of the DBT Acquisition, without taking into account any closing adjustments in connection with the DBT Acquisition, and the use of proceeds from this offering, assuming that both the DBT Acquisition and this offering occurred simultaneously:
Sources of Funds | Uses of Funds | |||||||
| (Dollars in millions) | ||||||||
New revolving credit facility(1) | $ | 23.7 | DBT purchase consideration(5) | $ | 731.0 | |||
New term loan facility(2) | 538.6 | Refinance borrowings under Bucyrus’ prior revolving credit facilities | 110.3 | |||||
Common stock (to public)(3) | 300.0 | |||||||
Common stock (to RAG Coal)(4) | 21.0 | Fees and expenses(6) | 42.0 | |||||
Total Sources | $ | 883.3 | Total Uses | $ | 883.3 | |||
(1) | On May 4, 2007, we borrowed $23.7 million under our new revolving credit facility to partially fund the DBT Acquisition and refinance certain of Bucyrus’ existing indebtedness without taking into account any closing adjustments in connection with the DBT Acquisition. Immediately after the financing and closing of the DBT Acquisition, we expect to have approximately $201.3 million available for borrowings under our revolving credit facility (taking into account $175.0 million of issued letters of credit). Actual outstanding amounts and availability under the revolving credit facility on the date of closing of this offering may be higher or lower than the amounts reflected in this “Use of Proceeds” section after taking into account any closing adjustments in connection with the DBT Acquisition. Our revolving credit facility bears interest at the rate of LIBOR plus 1.75% per annum, subject to potential positive or negative adjustment based on the final syndication of the credit facilities. The debt outstanding under our revolving credit facilities matures on May 4, 2012. See “Management’s Discussion and Analysis of Financial Condition and Results of Operations—Liquidity and Capital Resources—Description of New Credit Facilities.” |
(2) | On May 4, 2007, we also borrowed $825.0 million under our term loan facility to partially fund the DBT Acquisition, without taking into account any closing adjustments in connection with the DBT Acquisition, and refinance certain of Bucyrus’ existing indebtedness. Our term loan facility bears interest at the rate of LIBOR plus 1.75% per annum, subject to potential positive or negative adjustment based on the final syndication of the credit facilities. The debt outstanding under our term loan facility matures on May 4, 2014. See “Management’s Discussion and Analysis of Financial Condition and Results of Operations—Liquidity and Capital Resources—Description of New Credit Facilities.” |
(3) | Assumes that the underwriters have not exercised their option to purchase additional shares. If the underwriters exercise in full their option to purchase up to 692,100 additional shares, we estimate the |
S-30
Table of Contents
aggregate net proceeds from the offering will be approximately $329.5 million, after deducting underwriting discounts and commissions and estimated offering expenses. We expect to use such additional net proceeds to further reduce our term loan facility. |
(4) | Reflects the issuance to RAG Coal of 471,476 shares of our common stock with a market value at the time of announcement of the DBT Acquisition of $21.0 million. |
(5) | Does not take into account or reflect any closing adjustments. |
(6) | Reflects $13.0 million in transaction costs for the DBT Acquisition, $15.4 million in transaction costs for the new credit facilities and $13.6 million in underwriting discounts and commissions and estimated offering expenses for this offering. |
S-31
Table of Contents
The following table sets forth our consolidated cash and capitalization as of December 31, 2006 on an actual basis and as adjusted to give effect to the following:
| • | in the “Pro Forma for the effect of the DBT Acquisition” column, the drawdown of funds under our new term loan facility in connection with the financing of the DBT Acquisition and refinancing certain of Bucyrus’ and DBT’s credit facilities as of December 31, 2006; and |
| • | in the “Pro Forma for the effect of the DBT Acquisition and this offering” column, the drawdown of funds under our new term loan facility in connection with the financing of the DBT Acquisition (excluding any closing adjustments) and refinancing certain of Bucyrus’ and DBT’s credit facilities as of December 31, 2006, the sale of 4,614,000 shares of common stock by us at an assumed public offering price of $65.03 per share (which was the last reported sale price on May 3, 2007) and the application of the net proceeds from this offering as of such date. The application of the net proceeds set forth in the table below is different from the application of the net proceeds from this offering set forth under “Use of Proceeds” because of the different applicable dates and the correspondingly different applicable debt amounts. |
You should read this table in conjunction with “Use of Proceeds,” “Selected Historical Consolidated Financial Information of Bucyrus,” “Selected Financial Information of DBT,” “Management’s Discussion and Analysis of Financial Condition and Results of Operations” and Bucyrus’ and DBT’s historical financial statements, including the related notes thereto, included elsewhere in this prospectus supplement.
| As of December 31, 2006 | ||||||||||||
Historical | Pro Forma for the effect of the DBT Acquisition(1) | Pro Forma for the effect of the DBT Acquisition and this offering(1)(2)(3) | ||||||||||
| (Dollars in thousands, except share data) | ||||||||||||
Cash and cash equivalents | $ | 9,575 | $ | 17,386 | $ | 17,386 | ||||||
Long-term debt, including current maturities: | ||||||||||||
Revolving credit facility | $ | 78,789 | $ | — | $ | — | ||||||
Term loan facility | — | 825,000 | 538,600 | |||||||||
Other | 3,687 | 3,687 | 3,687 | |||||||||
Total long-term debt, including current maturities | 82,476 | 828,687 | 542,287 | |||||||||
Common stockholders’ investment: | ||||||||||||
Class A common stock—par value $0.01 per share, authorized 75,000,000 shares, issued 31,685,767 shares actual, issued 32,157,243 shares pro forma for the DBT Acquisition, issued 36,771,243 pro forma for the DBT Acquisition and equity offering | 317 | 322 | 368 | |||||||||
Additional paid-in capital | 306,981 | 328,758 | 615,112 | |||||||||
Treasury stock, at cost—108,600 shares | (851 | ) | (851 | ) | (851 | ) | ||||||
Accumulated earnings | 13,451 | 13,451 | 13,451 | |||||||||
Accumulated other comprehensive loss | (23,902 | ) | (23,902 | ) | (23,902 | ) | ||||||
Total common stockholders’ investment | 295,996 | 317,778 | 604,178 | |||||||||
Total capitalization (including current maturities) | $ | 378,472 | $ | 1,146,465 | $ | 1,146,465 | ||||||
(1) | Excludes the effect of closing adjustments in connection with the DBT Acquisition. |
(2) | Assumes that the underwriters will not exercise their option to purchase additional shares. If the underwriters exercise their option in full, then we will issue and sell an additional 692,100 shares of |
S-32
Table of Contents
our common stock in this offering, and the additional net proceeds of $43.1 million, after underwriting discounts and commissions but before estimated offering expenses, will be used to further reduce borrowings under our term loan facility. |
(3) | A $1.00 increase or decrease in the public offering price per share (assuming no change in the number of shares offered) would result in a corresponding increase or decrease in total common stockholders’ investment and total capitalization as of December 31, 2006 of $4.4 million. Separately, a 10% increase or decrease in the number of shares of common stock sold, assuming a public offering price of $65.03 per share (the last reported sale price of our common stock on May 3, 2007), would result in increases or decreases in total common stockholders’ investment and total capitalization as of December 31, 2006 of $28.7 million. |
S-33
Table of Contents
Our common stock is traded on The NASDAQ Global Select Market under the symbol “BUCY.” The following table sets forth on a per share basis for the indicated periods the intraday range of high and low per share sale prices for our common stock as reported on The NASDAQ Global Select Market for each of the quarters noted.
| Price Range of Our Common Stock | ||||||
Period | High(1) | Low(1) | ||||
2005 | ||||||
First Quarter | $ | 31.17 | $ | 23.13 | ||
Second Quarter | 26.50 | 21.07 | ||||
Third Quarter | 32.97 | 23.27 | ||||
Fourth Quarter | 36.17 | 25.48 | ||||
2006 | ||||||
First Quarter | $ | 49.40 | $ | 34.59 | ||
Second Quarter | 60.71 | 37.73 | ||||
Third Quarter | 53.41 | 38.56 | ||||
Fourth Quarter | 52.12 | 39.87 | ||||
2007 | ||||||
First Quarter | $ | 56.99 | $ | 45.45 | ||
Second Quarter (through May 3, 2007) | 66.56 | 50.40 | ||||
(1) | Sale prices are adjusted for a three-for-two stock split in the form of a 100% stock dividend, effective March 29, 2006. |
On May 3, 2007, the last reported sale price for our common stock on The NASDAQ Global Select Market was $65.03 per share. As of March 31, 2007, there were approximately 24 holders of record of our common stock.
S-34
Table of Contents
Since becoming a public company in 2004, we have followed a regular practice of paying quarterly cash dividends on our outstanding common stock.Our ability to pay dividends in the future is subject to certain restrictions contained in our new credit facilities. See “Management’s Discussion and Analysis of Financial Condition and Results of Operations—Liquidity and Capital Resources—Description of New Credit Facility.” The payment and amount of future dividends is at the discretion of our board of directors and will depend upon our future earnings, capital requirements, general financial condition, general business conditions and other factors.
We declared dividends per share on our common stock as follows:
Period | Dividend Per Share(1) | ||
2005 | |||
First Quarter | $ | 0.0383 | |
Second Quarter | 0.0383 | ||
Third Quarter | 0.0383 | ||
Fourth Quarter | 0.0383 | ||
2006 | |||
First Quarter | $ | 0.0383 | |
Second Quarter | 0.0500 | ||
Third Quarter | 0.0500 | ||
Fourth Quarter | 0.0500 | ||
2007 | |||
First Quarter | $ | 0.0500 | |
Second Quarter(2) | 0.0500 | ||
(1) | Dividend amounts are adjusted for a three-for-two stock split in the form of a 100% stock dividend, effective March 29, 2006. |
(2) | Our second quarter 2007 dividend will be paid on May 28, 2007 to stockholders of record on May 10, 2007. |
S-35
Table of Contents
UNAUDITED PRO FORMA COMBINED CONDENSED FINANCIAL INFORMATION
The Unaudited Pro Forma Combined Condensed Statement of Earnings for the year ended December 31, 2006 and the Unaudited Pro Forma Combined Condensed Balance Sheet as of December 31, 2006 illustrate the estimated effect of the DBT Acquisition and this offering. The pro forma financial statements are based on certain estimates and assumptions made by our management as to the combined operations of Bucyrus and DBT, which we believe are reasonable. The pro forma financial statements are presented for illustrative purposes only and do not purport to be indicative of the results of operations or financial position of Bucyrus or DBT that actually would have been achieved had the DBT Acquisition and this offering been completed on the assumed dates, or to project our results of operations or financial position for any future date or period. References in this section to the “Company” are to Bucyrus International, Inc. and its consolidated subsidiaries prior to the DBT Acquisition.
The pro forma statement of earnings gives pro forma effect to the funding and closing of the DBT Acquisition and this offering as if each had occurred on January 1, 2006. The pro forma balance sheet gives pro forma effect to the funding and closing of the DBT Acquisition and this offering as if each had occurred on December 31, 2006.
The DBT Acquisition will be accounted for by the purchase method of accounting. Under purchase accounting, the total purchase price will be allocated to the tangible and intangible assets and liabilities assumed based on their respective fair values as of the closing of the DBT Acquisition. The principles of purchase accounting require extensive use of accounting estimates and judgments to allocate the purchase price to the identifiable tangible and intangible assets acquired and liabilities assumed based on their respective fair values. Accordingly, the purchase price allocation in the unaudited pro forma condensed combined financial statements is preliminary and will be adjusted upon completion of the final valuation of the acquired assets. Such adjustments could be significant. The final valuation is expected to be completed as soon as practicable but no later than 12 months after the consummation of the DBT Acquisition. The pro forma financial statements do not reflect the costs that we may incur to integrate DBT, and these costs may be material. DBT’s historical consolidated financial statements appearing elsewhere in this prospectus supplement have been prepared in accordance with IFRS, which differ in certain material respects from U.S. GAAP. For a discussion of certain significant differences between IFRS and U.S. GAAP, see note 30 to DBT’s audited consolidated financial statements included elsewhere in this prospectus supplement, which reconciles DBT’s net profits and shareholders’ equity as reported under IFRS to U.S. GAAP. The financial information in the historical DBT column in each of the Unaudited Pro Forma Combined Condensed Statement of Earnings and the Unaudited Pro Forma Combined Condensed Balance Sheet has been derived from the audited consolidated financial statements of DBT included elsewhere in this prospectus supplement, has been prepared on an IFRS basis and has been adjusted for the following:
| • | to conform the financial information presented to U.S. GAAP, and |
| • | to conform to Bucyrus’ financial statement presentation. |
Bucyrus is in the process of reviewing DBT’s financial statement classifications. As a result of this review, it may become necessary to make additional reclassifications to the consolidated financial information of DBT and its subsidiaries on a prospective basis.
The DBT balance sheet has been translated into U.S. dollars at a rate of Euro 1.00 = U.S. Dollar 1.3203, the exchange rate as of December 29, 2006, and the DBT statement of earnings has been translated into U.S. dollars at a rate of Euro 1.00 = U.S. Dollar 1.25622, the representative average exchange rate for 2006.
The pro forma financial statements should be read in conjunction with the historical financial statements of Bucyrus and DBT, the related notes thereto, and other financial information included elsewhere in this prospectus supplement or incorporated by reference into this prospectus supplement. Also see “Risk Factors” and “Management’s Discussion and Analysis of Financial Condition and Results of Operations.”
S-36
Table of Contents
Unaudited Pro Forma Combined Condensed Statement of Earnings
| Pro Forma Adjustments | |||||||||||||||||||||||
Historical for the Year Ended December 31, 2006 | DBT Acquisition | Pro Forma for the Effect of the DBT Acquisition | Equity Offering | Pro Forma for the Effect of the DBT Acquisition and this Offering | |||||||||||||||||||
| Bucyrus | DBT(1) | ||||||||||||||||||||||
| (Dollars in thousands, except per share amounts) | |||||||||||||||||||||||
Sales | $ | 738,050 | $ | 1,173,680 | $ | — | $ | 1,911,730 | $ | — | $ | 1,911,730 | |||||||||||
Cost of products sold | 551,275 | 868,806 | 158 | (2) | 1,420,239 | — | 1,420,239 | ||||||||||||||||
Gross profit | 186,775 | 304,874 | (158 | ) | 491,491 | — | 491,491 | ||||||||||||||||
Selling, general and administrative expenses | 73,138 | 178,428 | 80 | (3) | 251,646 | — | 251,646 | ||||||||||||||||
Research and development expenses | 10,661 | 9,207 | 13 | (4) | 19,881 | — | 19,881 | ||||||||||||||||
Amortization of intangible assets | 1,792 | 1,099 | 7,301 | (5) | 10,192 | — | 10,192 | ||||||||||||||||
Operating earnings | 101,184 | 116,140 | (7,552 | ) | 209,772 | — | 209,772 | ||||||||||||||||
Interest expense | 3,693 | 6,353 | 48,820 | (6) | 58,866 | (19,332 | )(9) | 39,534 | |||||||||||||||
Other expense (income), net | 217 | (9,321 | ) | 2,200 | (7) | (6,904 | ) | — | (6,904 | ) | |||||||||||||
Earnings before income taxes | 97,274 | 119,108 | (58,572 | ) | 157,810 | 19,332 | 177,142 | ||||||||||||||||
Income tax expense | 26,930 | 45,063 | (21,721 | )(8) | 50,272 | 7,114 | (8) | 57,386 | |||||||||||||||
Net earnings | $ | 70,344 | $ | 74,045 | $ | (36,851 | ) | $ | 107,538 | $ | 12,218 | $ | 119,756 | ||||||||||
Net earnings per share data: | |||||||||||||||||||||||
Basic: | |||||||||||||||||||||||
Net earnings per share | $ | 2.25 | $ | 3.29 | |||||||||||||||||||
Weighted average shares | 31,264,580 | 36,350,056 | |||||||||||||||||||||
Diluted: | |||||||||||||||||||||||
Net earnings per share | $ | 2.23 | $ | 3.27 | |||||||||||||||||||
Weighted average shares | 31,539,761 | 36,625,237 | |||||||||||||||||||||
See accompanying Notes to Unaudited Pro Forma Combined Condensed Statement of Earnings
S-37
Table of Contents
Notes to Unaudited Pro Forma Combined Condensed Statement of Earnings
| (1) | U.S. GAAP and Conforming Accounting Policy Adjustments |
DBT's consolidated financial statements are prepared in accordance with IFRS, which differ in certain material respects from U.S. GAAP. In addition, DBT has adopted certain accounting policies that differ from the Company’s accounting policies. The following schedule summarizes the necessary adjustments to conform DBT's financial statements to U.S. GAAP and to the Company’s accounting policies. The adjustments are based on information contained in DBT's audited consolidated financial statements and related footnotes for the year ended December 31, 2006 and from information obtained as part of the Company's due diligence review. See note 30 to DBT's financial statements of this prospectus supplement for a discussion of the significant differences between IFRS and U.S. GAAP.
| DBT Continuing Operations | DBT Conforming Accounting and U.S. GAAP Adjustments | DBT Adjusted | DBT Adjusted | |||||||
| (Euros in thousands) | (Dollars in thousands) | |||||||||
Sales | €934,295 | € — | €934,295 | $ | 1,173,680 | |||||
Cost of products sold | 730,548 | (38,945 | )(a) | 691,603 | 868,806 | |||||
Gross profit | 203,747 | 38,945 | 242,692 | 304,874 | ||||||
Other operating income | 18,977 | (18,977 | )(b) | — | — | |||||
Selling, general and administrative expenses | 122,626 | 19,410 | (c) | 142,036 | 178,428 | |||||
Research and development expenses | — | 7,329 | (d) | 7,329 | 9,207 | |||||
Other expenses | 10,726 | (10,726 | )(c) | — | — | |||||
Amortization of intangible assets | — | 875 | (e) | 875 | 1,099 | |||||
Operating earnings | 89,372 | 3,080 | 92,452 | 116,140 | ||||||
Interest expense | 8,562 | (3,505 | )(f) | 5,057 | 6,353 | |||||
Other interest and similar income | 3,975 | 3,445 | (g) | 7,420 | 9,321 | |||||
Earnings before income taxes | 84,785 | 10,030 | 94,815 | 119,108 | ||||||
Income tax expense | 21,099 | 14,773 | (h) | 35,872 | 45,063 | |||||
Net earnings | € 63,686 | € (4,743 | ) | € 58,943 | $ | 74,045 | ||||
| (a) | Reflects the following (in thousands): |
Reclassification of interest cost on pension obligations to conform with U.S. GAAP | € | 1,472 | ||
Reclassification of research and development and field service costs to conform to the Company's statement of earnings classification | (25,300 | ) | ||
Reclassification of warranty and personnel related items to conform with the Company's statement of earnings classification | (6,466 | ) | ||
Reclassification of amortization of intangible assets to conform with the Company's statement of earnings classification | (596 | ) | ||
Adjustment to conform pension accounting with U.S. GAAP | (1,315 | ) | ||
Adjustment to conform warranty accounting with U.S. GAAP | 33 | |||
Adjustment to conform accounting for derivatives with U.S. GAAP | (6,773 | ) | ||
| € | (38,945 | ) | ||
S-38
Table of Contents
| (b) | Reflects the reclassification of other income to conform with the Company's statement of earnings classification. |
| (c) | Reflects the following (in thousands): |
Reclassification of interest cost on pension obligations to conform with U.S. GAAP | € | 1,683 | ||
Reclassification of field service costs from cost of products sold to conform with the Company’s statement of earnings classification | 18,000 | |||
Reclassification of foreign currency exchange gains to offset losses and conform with the Company's statement of earnings classification | (4,576 | ) | ||
Reclassification of personnel related items to conform with the Company's statement of earnings classification | (1,849 | ) | ||
Reclassification of other expenses to conform with the Company's statement of earnings classification | 10,726 | |||
Reclassification of amortization of intangible assets to conform with the Company's statement of earnings classification | (430 | ) | ||
Reflects the reclassification of gains on sale of fixed assets to conform with the Company’s statement of earnings classification | (2,641 | ) | ||
Adjustment to conform pension accounting with U.S. GAAP | (1,503 | ) | ||
| € | 19,410 | |||
| (d) | Reflects the following (in thousands): |
Reclassification of interest cost on pension obligations to conform with U.S. GAAP | € | 350 | ||
Reclassification of research and development expense from cost of products sold to conform with the Company's statement of earnings classification | 7,451 | |||
Adjustment to conform accounting for research and development with U.S. GAAP | (158 | ) | ||
Adjustment to conform pension accounting with U.S. GAAP | (314 | ) | ||
| € | 7,329 | |||
| (e) | Reclassification of amortization of intangible assets to conform with the Company's statement of earnings classification. |
| (f) | Reflects the reclassification of interest cost on pension obligations to conform with U.S. GAAP. |
| (g) | Reflects the following (in thousands): |
Reclassification of foreign currency exchange gains to offset losses and conform with the Company's statement of earnings classification | € | (4,576 | ) | |
Reclassification of adjustments to reserves to conform with the Company's statement of earnings classification | (8,315 | ) | ||
Reflects the reclassification of other income to conform with the Company's statement of earnings classification | 18,977 | |||
Reflects the reclassification of gains on sale of fixed assets to conform with the Company’s statement of earnings classification | (2,641 | ) | ||
| € | 3,445 | |||
| (h) | Reflects adjustment to conform accounting for income taxes with U.S. GAAP. |
S-39
Table of Contents
| (2) | Reflects the impact of purchase accounting as follows (in thousands): |
Incremental adjustment to historical depreciation expense based on the estimated fair value of plant and equipment | $ | 158 |
| (3) | Reflects the impact of purchase accounting as follows (in thousands): |
Incremental adjustment to historical depreciation expense based on the estimated fair value of plant and equipment | $ | 80 |
| (4) | Reflects the impact of purchase accounting as follows (in thousands): |
Incremental adjustment to depreciation expense based on the estimated fair value of plant and equipment | $ | 13 |
| (5) | Reflects the impact of purchase accounting as follows (in thousands): |
Incremental adjustment to historical amortization of intangible assets based on the estimated fair value of such assets | $ | 7,301 |
| (6) | Reflects the following (in thousands): |
Interest on the term loan facility at an assumed interest rate of 6.75% | $ | 55,688 | ||
Elimination of historical interest on the Company’s revolving credit facility and DBT's debt | (6,868 | ) | ||
| $ | 48,820 | |||
A 0.125% change in the interest rate payable on the outstanding amount of the term loan facility would change annual interest expense by approximately $1.0 million before the effect of income taxes.
| (7) | Reflects the amortization of the capitalized borrowing costs incurred by the Company in connection with the term loan facility and new revolving credit facilities over the term of the term loan facility. |
| (8) | Pro forma income taxes have been provided for at local statutory rates by tax jurisdiction. |
| (9) | Reflects the following (in thousands): |
Reduction of interest on the portion of the term loan facility that is repaid with proceeds from the equity offering at an assumed interest rate of 6.75% | $ | (19,332 | ) |
A 0.125% change in the interest rate payable on the outstanding amount of the term loan facility would change annual interest expense by approximately $0.4 million before the effect of income taxes.
S-40
Table of Contents
Unaudited Pro Forma Combined Condensed Balance Sheet
| Pro Forma Adjustments | |||||||||||||||||||||||
| Historical as of December 31, 2006 | DBT Acquisition(2)(3) | Pro Forma for DBT Acquisition | Equity Offering | Pro Forma for the Effect of the | |||||||||||||||||||
| Bucyrus | DBT(1) | ||||||||||||||||||||||
| (Dollars in thousands, except per share amounts) | |||||||||||||||||||||||
ASSETS | |||||||||||||||||||||||
CURRENT ASSETS: | |||||||||||||||||||||||
Cash and cash equivalents | $ | 9,575 | $ | 22,536 | $ | (14,725 | )(4) | $ | 17,386 | $ | — | $ | 17,386 | ||||||||||
Receivables—net | 162,535 | 330,887 | (106,799 | )(5) | 386,623 | — | 386,623 | ||||||||||||||||
Inventories | 176,277 | 243,495 | 39,505 | (6) | 459,277 | — | 459,277 | ||||||||||||||||
Other current assets | 28,133 | 11,907 | — | 40,040 | — | 40,040 | |||||||||||||||||
Total Current Assets | 376,520 | 608,825 | (82,019 | ) | 903,326 | — | 903,326 | ||||||||||||||||
OTHER ASSETS: | |||||||||||||||||||||||
Goodwill and intangible assets—net | 75,403 | 4,204 | 601,945 | (6) | 681,552 | — | 681,552 | ||||||||||||||||
Other long-term assets | 23,640 | 30,375 | 15,400 | (7) | 69,415 | — | 69,415 | ||||||||||||||||
Total Other Assets | 99,043 | 34,579 | 617,345 | 750,967 | — | 750,967 | |||||||||||||||||
PROPERTY, PLANT AND EQUIPMENT—NET | 125,149 | 142,574 | 55,526 | (6) | 323,249 | — | 323,249 | ||||||||||||||||
TOTAL ASSETS | $ | 600,712 | $ | 785,978 | $ | 590,852 | $ | 1,977,542 | $ | — | $ | 1,977,542 | |||||||||||
LIABILITIES AND COMMON STOCKHOLDERS' INVESTMENT | |||||||||||||||||||||||
CURRENT LIABILITIES: | |||||||||||||||||||||||
Accounts payable | $ | 83,603 | $ | 96,008 | $ | — | $ | 179,611 | $ | — | $ | 179,611 | |||||||||||
Accrued expenses | 44,121 | 65,223 | — | 109,344 | — | 109,344 | |||||||||||||||||
Liabilities to customers on uncompleted contracts and warranties | 32,233 | 164,666 | — | 196,899 | — | 196,899 | |||||||||||||||||
Other current liabilities | 10,309 | 48,685 | (34,205 | )(8) | 24,789 | — | 24,789 | ||||||||||||||||
Total Current Liabilities | 170,266 | 374,582 | (34,205 | ) | 510,643 | — | 510,643 | ||||||||||||||||
LONG-TERM LIABILITIES | 52,184 | 156,460 | 112,000 | (9) | 320,644 | — | 320,644 | ||||||||||||||||
LONG-TERM DEBT, less current maturities: | 82,266 | 51,343 | 694,868 | (10) | 828,477 | (286,400 | )(14) | 542,077 | |||||||||||||||
COMMON STOCKHOLDERS' INVESTMENT | |||||||||||||||||||||||
Class A common stock—par value $.01 per share, authorized 75,000,000 shares, issued 31,685,767 shares historical, 32,157,243 shares pro forma for the DBT Acquisition and 36,771,243 pro forma for the DBT Acquisition and equity offering | 317 | — | 5 | (11) | 322 | 46 | (15) | 368 | |||||||||||||||
Additional paid-in capital | 306,981 | 81,985 | (60,208 | )(12) | 328,758 | 286,354 | (15) | 615,112 | |||||||||||||||
Treasury stock, at cost—108,600 shares | (851 | ) | — | — | (851 | ) | — | (851 | ) | ||||||||||||||
Accumulated earnings | 13,451 | 121,216 | (121,216 | )(13) | 13,451 | — | 13,451 | ||||||||||||||||
Accumulated other comprehensive income (loss) | (23,902 | ) | 392 | (392 | )(13) | (23,902 | ) | — | (23,902 | ) | |||||||||||||
Total Common Stockholders' Investment | 295,996 | 203,593 | (181,811 | ) | 317,778 | 286,400 | 604,178 | ||||||||||||||||
TOTAL LIABILITIES AND COMMON STOCKHOLDERS' INVESTMENT | $ | 600,712 | $ | 785,978 | $ | 590,852 | $ | 1,977,542 | $ | — | $ | 1,977,542 | |||||||||||
See accompanying Notes to Unaudited Pro Forma Combined Condensed Balance Sheet.
S-41
Table of Contents
Notes to Unaudited Pro Forma Combined Condensed Balance Sheet
| (1) | U.S. GAAP and Conforming Accounting Policy Adjustments |
DBT’s consolidated financial statements are prepared in accordance with IFRS, which differ in certain material respects from U.S. GAAP. In addition, DBT has adopted certain accounting policies that differ from the Company’s accounting policies. The following schedule summarizes the necessary adjustments to conform DBT’s financial statements to U.S. GAAP and to the Company’s accounting policies. The adjustments are based on information contained in DBT’s audited consolidated financial statements and related footnotes for the year ended December 31, 2006 and from information obtained as part of the Company’s due diligence review. See note 30 to DBT’s financial statements of this prospectus supplement for a discussion of the significant differences between IFRS and U.S. GAAP.
| DBT Continuing Operations | DBT Conforming Accounting and U.S. GAAP Adjustments | DBT Adjusted | DBT Adjusted | |||||||||||
| (Euros in thousands) | (Dollars in thousands) | |||||||||||||
ASSETS | ||||||||||||||
CURRENT ASSETS: | ||||||||||||||
Cash and cash equivalents | € | 17,069 | € | — | € | 17,069 | $ | 22,536 | ||||||
Receivables—net | 250,615 | — | 250,615 | 330,887 | ||||||||||
Inventories | 184,424 | — | 184,424 | 243,495 | ||||||||||
Income tax assets | 57 | (57 | )(a) | — | — | |||||||||
Other financial assets | 4,068 | (4,068 | )(a) | — | — | |||||||||
Other current assets | 7,210 | 1,808 | (b) | 9,018 | 11,907 | |||||||||
Assets held for sale | 3,553 | (3,553 | )(a) | — | — | |||||||||
Total Current Assets | 466,996 | (5,870 | ) | 461,126 | 608,825 | |||||||||
OTHER ASSETS: | ||||||||||||||
Goodwill and intangible assets—net | 3,464 | (280 | )(c) | 3,184 | 4,204 | |||||||||
Other long-term assets | 23,006 | — | 23,006 | 30,375 | ||||||||||
Total Other Assets | 26,470 | (280 | ) | 26,190 | 34,579 | |||||||||
PROPERTY, PLANT AND EQUIPMENT—NET | 104,799 | 3,187 | (d) | 107,986 | 142,574 | |||||||||
TOTAL ASSETS | € | 598,265 | € | (2,963 | ) | € | 595,302 | $ | 785,978 | |||||
LIABILITIES AND COMMON STOCKHOLDERS’ INVESTMENT | ||||||||||||||
CURRENT LIABILITIES: | ||||||||||||||
Accounts payable | € | 51,829 | € | 20,888 | (e) | € | 72,717 | $ | 96,008 | |||||
Accrued expenses | 76,154 | (26,754 | )(f) | 49,400 | 65,223 | |||||||||
Liabilities to customers on uncompleted contracts and warranties | 86,478 | 38,241 | (g) | 124,719 | 164,666 | |||||||||
Income taxes | 831 | (831 | )(h) | — | — | |||||||||
Other financial liabilities | 26,216 | (26,216 | )(h) | — | — | |||||||||
Liabilities held for sale | 2,706 | (2,706 | )(h) | — | — | |||||||||
Other current liabilities | 39,553 | (2,679 | )(h) | 36,874 | 48,685 | |||||||||
Total Current Liabilities | 283,767 | (57 | ) | 283,710 | 374,582 | |||||||||
LONG-TERM LIABILITIES | 106,295 | 12,208 | (i) | 118,503 | 156,460 | |||||||||
LONG-TERM DEBT, less current maturities | 38,887 | — | 38,887 | 51,343 | ||||||||||
COMMON STOCKHOLDERS’ INVESTMENT: | ||||||||||||||
Additional paid-in capital(1) | 64,779 | (2,683 | )(j) | 62,096 | 81,985 | |||||||||
Accumulated earnings | 103,709 | (11,900 | )(c) | 91,809 | 121,216 | |||||||||
Minority interest | 531 | (531 | )(i) | — | — | |||||||||
Hedging reserve | 2,484 | (2,484 | )(k) | — | — | |||||||||
Accumulated other comprehensive income (loss) | (2,187 | ) | 2,484 | (k) | 297 | 392 | ||||||||
Total Common Stockholders’ Investment | 169,316 | (15,114 | ) | 154,202 | 203,593 | |||||||||
TOTAL LIABILITIES AND COMMON STOCKHOLDERS’ INVESTMENT | € | 598,265 | € (2,963 | ) | € | 595,302 | $ | 785,978 | ||||||
(1) | Consists of subscribed capital of €21,050 and additional paid-in capital of €43,729. |
S-42
Table of Contents
| (a) | Reflects the reclassification to other current assets to conform with the Company’s balance sheet classification. |
| (b) | Reflects the following (in thousands): |
Reclassification of assets under construction to property, plant and equipment to conform with the Company’s balance sheet classification | € | (5,870 | ) | |
Reclassification of income tax assets, other financial assets and assets held for sale to conform with the Company's balance sheet classification | 7,678 | |||
| € | 1,808 | |||
| (c) | Reflects the following (in thousands): |
Write-off of capitalized research and development costs to conform with U.S. GAAP | € | (280 | ) | |
Adjustment to conform accounting for warranty with U.S. GAAP | 57 | |||
Adjustment to conform accounting for pensions with U.S. GAAP | (4,229 | ) | ||
Adjustment to conform accounting for income taxes with U.S. GAAP | (7,448 | ) | ||
| € | (11,900 | ) | ||
| (d) | Reflects the following (in thousands): |
Reclassification of assets under construction to property, plant and equipment to conform with the Company’s balance sheet classification | € | 5,870 | ||
Adjustment to conform accounting for fixed assets with U.S. GAAP | (2,683 | ) | ||
| € | 3,187 | |||
| (e) | Reflects the reclassification of liability for goods received but not invoiced. |
| (f) | Reflects the following: (in thousands) |
Reclassification of current liabilities and liability for goods received but not invoiced to conform with the Company’s balance sheet classification | € | (20,888 | ) | |
Reclassification of accrued expenses from other current liabilities to conform with the Company’s balance sheet classification | 32,432 | |||
Reclassification of warranty reserve to conform with the Company’s balance sheet classification | (38,298 | ) | ||
| € | (26,754 | ) | ||
| (g) | Reflects the following (in thousands): |
Reclassification of warranty reserve to conform with the Company’s balance sheet classification | € | 38,298 | ||
Adjustment to conform accounting for warranty with U.S. GAAP | (57 | ) | ||
| € | 38,241 | |||
| (h) | Reflects the following: (in thousands) |
Reclassification of income taxes, other financial liabilities and liabilities held for sale to conform with the Company’s balance sheet classification | € | 29,753 | ||
Reclassification of accrued expenses from other current liabilities to conform with the Company’s balance sheet classification | (32,432 | ) | ||
| € | (2,679 | ) | ||
S-43
Table of Contents
| (i) | Reflects the following: (in thousands) |
Reclassification of DBT minority interest from equity | € | 531 | |
Adjustment to conform accounting for pensions with U.S. GAAP | 4,229 | ||
Adjustment to conform accounting for income taxes with U.S. GAAP | 7,448 | ||
| € | 12,208 | ||
| (j) | Reflects the adjustment to conform accounting for fixed assets with U.S. GAAP |
| (k) | Reflects the reclassification of the hedging reserve to conform with the Company’s balance sheet classification. |
| (2) | A summary of sources and uses of proceeds for the DBT Acquisition is as follows (in thousands): |
Sources of Funds: | |||
Proceeds from the term loan facility | $ | 825,000 | |
Total sources of funds | $ | 825,000 | |
Uses of Funds: | |||
Purchase of DBT | $ | 710,000 | |
Repayment of amount outstanding under the Company’s existing revolving credit facility | 78,789 | ||
Debt issuance costs | 15,400 | ||
Transaction costs | 13,000 | ||
Increase to on-hand cash balances | 7,811 | ||
Total uses of funds | $ | 825,000 | |
| (3) | The estimated allocation of the purchase price of DBT is as follows (in thousands): |
Purchase Price: | |||
Cash | $ | 710,000 | |
Issuance of common shares | 21,782 | ||
Liabilities assumed | 496,837 | ||
Deferred tax impact of purchase accounting | 112,000 | ||
Transaction costs | 13,000 | ||
| $ | 1,353,619 | ||
Allocation of Purchase Price: | |||
Cash and cash equivalents | $ | — | |
Receivables | 224,088 | ||
Inventories | 283,000 | ||
Other current assets | 11,907 | ||
Goodwill | 319,149 | ||
Intangible assets | 287,000 | ||
Other long-term assets | 30,375 | ||
Property, plant and equipment | 198,100 | ||
| $ | 1,353,619 | ||
| (4) | Reflects the following (in thousands): |
Elimination of DBT cash and cash equivalents not purchased by the Company | $ | (22,536 | ) | |
Increase to on-hand cash balances | 7,811 | |||
| $ | (14,725 | ) | ||
S-44
Table of Contents
| (5) | Reflects the elimination of DBT receivables not purchased by the Company. |
| (6) | The adjustments reflect the write-up of the assets to their estimated fair market value. |
Inventory has been adjusted to its estimated fair market value as required by Statement of Financial Accounting Standards No. 141. This adjustment primarily relates to finished parts which are being valued at their selling price, less cost to sell, less a selling profit. As this adjustment is directly attributed to the transaction and will not have a continuing impact, it is not reflected in the unaudited pro forma combined condensed statement of earnings. However, this inventory adjustment will result in a charge to cost of products sold in the period subsequent to the consummation of the acquisition of DBT during which the related inventories are sold. The estimated charge, net of tax, is approximately $24 million and will be amortized as a charge to cost of sales during the six to 12 months following the closing of the DBT Acquisition.
Goodwill and intangible assets are accounted for in accordance with Statement of Financial Accounting Standards No. 142, “Goodwill and Other Intangible Assets” (“SFAS 142”). In accordance with SFAS 142, goodwill is no longer subject to amortization. Intangible assets consist of trademarks, customer relationships and technology. Customer relationships and technology have finite lives and are expected to be amortized over a period of 15 to 20 years. Trademarks have indefinite lives and are not subject to amortization.
Plant and equipment will be depreciated over the estimated useful lives of the respective assets using the straight-line method for financial reporting purposes. Estimated useful lives are expected to be 15 years for buildings and eight years for machinery and equipment.
| (7) | Reflects the capitalization of borrowing costs incurred by the Company in connection with the term loan facility and new revolving credit facilities. |
| (8) | Reflects the elimination of DBT debt not assumed by the Company. |
| (9) | Reflects the recording of the deferred tax impact of purchase accounting. |
| (10) | Reflects the proceeds from the term loan facility and elimination of DBT debt not assumed by the Company. |
| (11) | Reflects the issuance of 471,476 shares of common stock for the purchase of DBT. |
| (12) | Reflects the following (dollars in thousands, except per share amounts): |
Issuance of 471,476 shares of common stock for the purchase of DBT based on a per share price of $46.20 | $ | 21,777 | ||
Elimination of DBT additional paid in capital | (81,985 | ) | ||
| $ | (60,208 | ) | ||
| (13) | Reflects the elimination of DBT’s accumulated earnings and accumulated other comprehensive loss. |
| (14) | Reflects the repayment of a portion of the term loan facility with proceeds from the equity offering. |
| (15) | Reflects the issuance of $300.0 million of common stock in this offering (4,614,000 shares based on the May 3, 2007 closing price of $65.03) less $13.6 million in underwriting discounts and commissions and other expenses associated with this offering. |
S-45
Table of Contents
SELECTED HISTORICAL CONSOLIDATED FINANCIAL INFORMATION OF BUCYRUS
The following table presents summary historical consolidated financial and other data for Bucyrus as of and for each of the past five years, which have been derived from Bucyrus’ audited consolidated financial statements. You should read this information together with Bucyrus’ consolidated financial statements, including the related notes, included elsewhere in this prospectus supplement or incorporated by reference herein and “Management’s Discussion and Analysis of Financial Condition and Results of Operations.”
| Years ended December 31, | |||||||||||||||||
| 2006 | 2005 | 2004 | 2003 | 2002 | |||||||||||||
(Dollars in thousands, except per share amounts) | |||||||||||||||||
Statement of Earnings Data: | |||||||||||||||||
Sales | $ | 738,050 | $ | 575,042 | $ | 454,186 | $ | 337,695 | $ | 289,598 | |||||||
Net earnings (loss) | 70,344 | 53,559 | 6,084 | (3,581 | ) | (10,786 | ) | ||||||||||
Net earnings (loss) per share of common stock: | |||||||||||||||||
Basic | 2.25 | 1.76 | 0.26 | (0.21 | ) | (0.63 | ) | ||||||||||
Diluted | 2.23 | 1.71 | 0.25 | (0.21 | ) | (0.63 | ) | ||||||||||
Cash dividends per share of common stock | $ | 0.1883 | $ | 0.1530 | $ | 0.0383 | $ | — | $ | — | |||||||
Balance Sheet Data: | |||||||||||||||||
Total assets | $ | 600,712 | $ | 491,967 | $ | 392,809 | $ | 362,143 | $ | 346,878 | |||||||
Long-term liabilities, including long-term debt | 134,450 | 115,799 | 148,852 | 231,689 | 283,574 | ||||||||||||
S-46
Table of Contents
SELECTED HISTORICAL CONSOLIDATED FINANCIAL INFORMATION OF DBT
The following table presents summary historical financial and other data for DBT as of and for each of the past three years, which have been derived from DBT’s audited consolidated financial statements (except for amounts presented in U.S. dollars, which have not been audited). You should read this information together with DBT’s financial statements, including the related notes, included elsewhere in this prospectus supplement or incorporated by reference herein.
DBT’s historical consolidated financial statements appearing elsewhere in this prospectus supplement have been prepared in accordance with IFRS, which differ in certain material respects from U.S. GAAP. For a discussion of certain significant differences between IFRS and U.S. GAAP, see note 30 to DBT’s audited consolidated financial statements included elsewhere in this prospectus supplement, which reconciles DBT’s net profits and shareholders’ equity as reported under IFRS to U.S. GAAP. See “Unaudited Pro Forma Combined Condensed Financial Information.”
We also present summary historical financial information of DBT for 2006 in thousands of U.S. dollars which, for balance sheet data, is based on a translation at a representative rate of exchange of Euro 1.00 = U.S. Dollar 1.3203 as of December 29, 2006 and, for statement of earnings data, is based on a translation at a representative average 2006 rate of exchange of Euro 1.00 = U.S. Dollar 1.25622.
Years ended December 31, | |||||||||
| 2006(1) | 2006 | 2005 | 2004 | ||||||
| (Dollars in thousands) | (Euros in thousands) | ||||||||
IFRS: | |||||||||
Statement of Earnings Data: | |||||||||
Sales | $ | 1,173,680 | €934,295 | €752,453 | €621,108 | ||||
Operating income | 112,271 | 89,372 | 59,607 | 30,541 | |||||
Profit for the year from continuing operations | 80,004 | 63,686 | 37,951 | 17,762 | |||||
Profit for the year | 88,298 | 70,289 | 41,703 | 21,720 | |||||
Balance Sheet Data: | |||||||||
Total assets | $ | 789,889 | €598,265 | €607,223 | N/A | ||||
Non-current liabilities | 191,684 | 145,182 | 150,616 | N/A | |||||
Shareholders’ equity | 223,548 | 169,316 | 122,002 | N/A | |||||
U.S. GAAP: | |||||||||
Net income | $ | 82,340 | 65,546 | 23,363 | 10,781 | ||||
Shareholders’ equity | $ | 403,060 | 154,202 | 113,541 | N/A | ||||
(1) | For convenience, financial information in this column has been converted into U.S. dollars from the comparable information presented in Euros using the representative exchange rates described above. |
S-47
Table of Contents
MANAGEMENT’S DISCUSSION AND ANALYSIS OF FINANCIAL CONDITION
AND RESULTS OF OPERATIONS
Impact of DBT Acquisition
On May 4, 2007, we consummated the DBT Acquisition for a total purchase price of $731.0 million, including $710.0 million in cash and the issuance of 471,476 shares of our common stock with an initial market value of $21.0 million, subject to certain closing adjustments. The DBT Acquisition will more than double the size of our company based on sales and EBITDA. On a pro forma combined basis, as if the DBT Acquisition had been consummated on January 1, 2006, our 2006 sales would have been $1.9 billion, compared to Bucyrus’ 2006 sales of $738.0 million. Similarly, our 2006 pro forma combined EBITDA would have been $252.9 million, compared to Bucyrus’ 2006 EBITDA of $116.0 million. Our pro forma combined EBITDA includes adjustments necessary to conform DBT’s financial statements, which are prepared in accordance with IFRS, to U.S. GAAP and to Bucyrus’ accounting policies. These adjustments will cause the component of pro forma combined EBITDA that is attributable to DBT’s results of operations to differ from the presentation of DBT’s EBITDA in “Summary—Summary Financial and Other Data—Summary DBT Historical Financial Information” and elsewhere in this prospectus supplement. Our pro forma combined backlog as of December 31, 2006 would have been approximately $1.4 billion, compared to Bucyrus’ approximate $894.7 million as of such date.
The strategic benefits to us from consummating the DBT Acquisition include:
| • | The expansion of our product portfolio to include underground mining equipment and aftermarket support for that equipment, which enhances our capability to serve a larger segment of the global mining equipment market. |
| • | An increase in our pro forma combined worldwide installed original equipment base as of December 31, 2006 to an approximate replacement value of $22.0 billion from Bucyrus’ approximate replacement value of $12.6 billion as of such date. We believe that this increased installed base provides us with significantly greater opportunities to market our aftermarket parts and services. Parts typically earn a higher gross margin than our original equipment sales. Additionally, DBT’s aftermarket service business has lower market share than that of Bucyrus, which we believe presents an opportunity for growth. |
| • | An increased strategic presence in markets that we expect will experience substantial mining growth over the next several years, such as China and Russia. Additionally, we anticipate building upon Bucyrus’ presence in India, another market that we believe has high growth potential, to increase DBT’s share of the underground mining market in that country. |
| • | DBT’s advanced engineering and technology. |
We initially plan to operate DBT largely as an independent organization under the supervision of our senior management. We believe that DBT has a strong senior and mid-level management team that has managed and operated DBT successfully for many years.
While we believe that there are opportunities to consolidate some of DBT’s international sales offices with Bucyrus’ sales offices and to realize increased operating efficiencies at DBT by reducing its levels of selling, general and administrative expenses and research and development expenses, these potential cost saving and synergistic opportunities may take at least several quarters to begin to implement, and any potential benefits from these actions may not be realized for at least several quarters following implementation. We expect to more fully analyze DBT’s internal organizational and operating structure and, where possible, identify appropriate opportunities for further integration and synergies over the longer term.
We expect the DBT Acquisition to impact our future results of operation and financial condition in a number of ways, including the following:
| • | Our reliance on coal as the principal commodity mined by the customers purchasing our equipment will increase from 53% of Bucyrus’ historical 2006 sales to approximately 79% on a pro forma 2006 |
S-48
Table of Contents
combined basis. Approximately 96% of DBT’s 2006 sales were derived from sales to coal mining customers. This means that our future results of operations will be more dependent on coal commodity price levels and conditions in, and other factors affecting, the coal markets. Accordingly, our future results of operations may be subject to more pronounced cyclicality than prior to the DBT Acquisition. |
| • | As a result of the DBT Acquisition, growth in our future results of operations will likely become more dependent upon increasing our sales to emerging markets such as China, Russia and India. This means we will increase our exposure to the uncertainties and risks associated with the developing governmental, legal and economic systems in those countries, as well as nationalism initiatives, tariffs and the other risks of competing in foreign markets. Additionally, to be in a position to compete more cost effectively in the underground mining market in China, we plan to begin expanding our manufacturing capacity in China. This expansion process will likely take at least 12 to 18 months to complete, and we expect that it likely will take at least several quarters after completion until we can begin realizing its anticipated potential benefits. |
| • | DBT’s revenue mix is weighted more towards original equipment sales than to aftermarket parts and services sales compared to Bucyrus’ revenue mix. In 2006, 73% of DBT’s revenue was from sales of original equipment and 27% from aftermarket sales. Bucyrus’ 2006 revenue mix was 35% from original equipment sales and 65% from aftermarket sales. On a pro forma combined basis for 2006, our revenue mix would have been 58% from original equipment sales and 42% from aftermarket sales. Since aftermarket parts sales generally have higher gross margins than original equipment sales, this means that we will likely report lower gross margins in the future than we have in the past. However, we believe that this circumstance affords us a significant opportunity over time to increase the relative percentage of DBT’s aftermarket sales through DBT’s incorporation of the successful strategies and techniques that we have previously implemented at Bucyrus to substantially increase Bucyrus’ level of aftermarket sales. |
| • | As a percent of 2006 sales, and taking into account certain pro forma reclassification adjustments, DBT’s selling, general and administrative expenses were 15.2%, compared to 9.9% in 2006 for Bucyrus. This means that we will likely report higher selling, general and administrative expenses, as a percent of sales, in the future than we have in the past. However, we believe that this circumstance affords us an opportunity to reduce the relative level of DBT’s selling, general and administrative expenses to further enhance our combined profitability over the longer term. |
| • | We will be subject to higher foreign currency exchange risk because DBT transacts a substantial percentage of its business in Euros, while we sell most of our products in United States dollars, and we will be reporting our combined consolidated results in United States dollars. This means that our future results of operations may be subject to increased volatility based on relative changes in foreign currency exchange rates, particularly the Euro/dollar exchange rate. |
| • | We substantially increased our debt levels and debt service obligations to finance the DBT Acquisition. Bucyrus’ total long-term debt as of March 31, 2007 was $93.6 million. After completion of this offering, we expect our total long-term debt to approximate $538.6 million, including the debt incurred to finance the DBT Acquisition, based on the assumptions set forth under “Use of Proceeds,” and without any exercise of the underwriters’ option to purchase additional shares. |
Current 2007 Outlook
After giving pro forma effect to the DBT Acquisition as if it had occurred on January 1, 2007, we estimate our full year 2007 pro forma combined sales to be in the range of $1.9 to $2.0 billion and our full year 2007 pro forma combined EBITDA, without reduction for estimated non-cash stock compensation expense or any customary purchase accounting adjustments resulting from the DBT Acquisition, to be in the range of $255 to $275 million. In making these estimates, Bucyrus is reaffirming its previously announced stand-alone guidance range for 2007 sales of $875 to $925 million and EBITDA, without reduction for estimated non-cash stock
S-49
Table of Contents
compensation expense, of $155 to $165 million. This financial guidance is based on our current expectations for the results of operations of both Bucyrus and DBT for the remainder of 2007, and takes into account that DBT’s 2006 results of operations benefited significantly from an influx of original equipment orders from underground mining customers that had previously deferred their new underground original equipment purchases during the prolonged prior period of weaker coal commodity prices. As a result, and in combination with the recent softening of U.S. coal commodity prices and reduced order intake levels at DBT for the first quarter of 2007 compared to the first quarter of 2006, we believe that it is likely that DBT’s 2007 sales will return to more normalized levels than the unusually high levels recognized in 2006. We anticipated and took this expected normalized level of results into account when we valued and entered into the agreement to acquire DBT.
This financial guidance is an estimate as the date of this prospectus supplement and is based on assumptions believed to be reasonable as of this date. We are providing sales and EBITDA guidance in this format due to the significant impact of the DBT Acquisition on our expected 2007 results of operations, and we do not necessarily intend to regularly issue guidance in this format in the future. We expressly disclaim any current intention to update or revise this guidance, whether as a result of new information, future events or otherwise. For a description of some of the factors that could cause our actual results to differ materially from the guidance reflected above, see “Risk Factors” and “Forward-Looking Statements and Cautionary Factors,” and we cannot assure you that we will achieve our financial guidance.
Business
We are a leading designer and manufacturer of high productivity mining equipment for the extraction of coal, copper, oil sands, iron ore and other minerals in major mining centers throughout the world. In addition to the manufacture of original equipment, we also provide the aftermarket replacement parts and service for this equipment. As a result of our recently completed DBT Acquisition, we now operate in two business segments: surface mining (Bucyrus) and underground mining (DBT). We now have manufacturing facilities in Australia, China, Germany, Poland and the United States and service and sales centers in Australia, Brazil, Canada, China, England, India, Mexico, Peru, Russia, South Africa and the United States. The largest markets for our original equipment and aftermarket parts and service have historically been in Australia, Canada, China, Germany, India, South Africa, South America and the United States. In the future, we expect that the United States, Brazil, Canada, China and India will be increasingly important markets for our surface mining equipment and that the United States and the emerging markets of China, Russia and India will be increasingly important markets for our underground mining equipment.
The market for our original equipment is closely correlated with customer expectations of sustained strength in prices of mined commodities. Growth in demand for these commodities is a function of, among other things, economic activity, population increases and continuing improvements in standards of living in many areas of the world. Market prices for coal, copper, iron ore and oil generally continued to be strong in 2005 and 2006, although certain commodity prices, including coal, moderated or declined slightly during the latter part of 2006 and into 2007. Factors that could support sustained demand for these key commodities in 2007 include continued expected economic growth in China, India and the developing world, as well as renewed economic strength in industrialized countries. As of December 31, 2006, inquiries for our surface mining equipment in all product lines remained at a high level despite the recent moderation in commodity prices, while inquiries for our underground mining equipment had returned to pre-2006 normalized levels. As of December 31, 2006, interest in our surface mining equipment continued to be strong in the oil sands region of Western Canada, and inquiries related to coal, copper and iron ore mines in other areas of the world have also remained strong.
Our aftermarket parts and service operations, which accounted for approximately 42% of our total pro forma 2006 combined sales, tend to be more consistent than our original equipment sales. Our original equipment is typically kept in continuous operation from eight to 40 years by our customers, requiring regular maintenance and repair throughout their productive lives. The size of our pro forma combined installed base of original
S-50
Table of Contents
equipment as of December 31, 2006 was estimated to be approximately $22.0 billion based on estimated replacement value. Our ability to provide on-time delivery of reliable parts and prompt service are important drivers of our aftermarket sales. As of December 31, 2006, aftermarket orders and inquiries continued to remain at high levels as the existing installed fleet of our original equipment is operating at very high utilization levels due to the current demand and increased prices for related mined commodities.
A substantial portion of our sales and operating earnings is attributable to our operations located outside the United States. We generally sell our surface mining original equipment, including that sold directly to foreign customers, and most of our aftermarket parts in United States dollars, and we generally sell our underground mining original equipment in either United States dollars or the Euro. A portion of our aftermarket parts sales are also denominated in the local currencies of Australia, Brazil, Canada, South Africa and the United Kingdom. Aftermarket services are paid for primarily in local currency, which is naturally hedged by our payment of local labor in local currency.
In our surface mining business, as of December 31, 2006, we anticipated increased sales activity for both Bucyrus’ aftermarket parts sales and original equipment sales in 2007 relative to 2006. We expect Bucyrus’ original equipment sales to increase in 2007, driven by customer expectations of sustained strength in the coal, copper, oil sands and iron ore markets, ongoing and rapid industrialization in China and other parts of the developing world, demand for minerals in the developed world and the rising cost of non-coal energy sources. While we expect that the current commodity demand will continue for the near term, original equipment sales may lag behind such increases in commodity prices because of the time needed to acquire the appropriate mining permits and establish the relevant infrastructure. We also expect our aftermarket sales to increase as customers continue the trend of utilizing our parts and services in a broader range of applications on their installed base of original equipment. Strong sales volume and demand as of the end of the year have caused us to hire new employees, and we expect to require additional hiring in 2007.
In our underground mining business, as of December 31, 2006, we anticipate increased sales activity in 2007 for DBT’s aftermarket parts sales as we enhance our selling efforts for these parts and as our customers continue to use our parts and services on our large installed base of original equipment. We anticipate decreased sales activity for our underground mining original equipment in 2007 relative to 2006 because 2006 sales benefited greatly from an influx of original equipment orders from customers that had previously deferred original equipment purchases during the prior period of weaker coal commodity prices.
In response to sustained order strength for surface mining equipment, we are in the process of completing a multi-phase capacity expansion of Bucyrus’ manufacturing facilities in South Milwaukee. The first phase of our expansion provided 110,000 square feet of new space for welding and machining of large electric mining shovel components north of Rawson Avenue and was substantially complete at the end of the third quarter of 2006. The second phase of our expansion program further expanded our new facility north of Rawson Avenue from 110,000 square feet to over 350,000 square feet of welding, machining and outdoor hard-goods storage space. Construction was completed in April 2007. The aggregate cost of phase one and two of our expansion program was approximately $54.0 million, which was financed by borrowings under our then existing revolving credit facility. The third phase of Bucyrus’ expansion program, which we announced in July 2006, is intended to help us meet the continued growth of demand for our surface mining equipment and their components. The third phase includes the renovation and expansion of manufacturing buildings and offices at our existing facilities south of Rawson Avenue. Our focus is on modernizing our facilities and improving manufacturing and administrative efficiencies. The steps for accomplishing phase three are scheduled to maximize manufacturing throughput during both the renovation and construction processes. We expect that phase three construction will cost approximately $58.0 million. The third phase is being financed by borrowings under our revolving credit facility. Assuming that we are able to attract and retain the necessary skilled labor, the expansion, when completed, is expected to enable Bucyrus to increase its annual shovel production capacity from 10 machines in
S-51
Table of Contents
2006 to 16 machines in 2007 and ultimately to 24 machines in 2008, as well as approximately double Bucyrus’ manufactured parts capacity. Bucyrus’ expansion also will help provide it with added flexibility to increase dragline production should demand for shovels decline or demand for draglines increase. In addition, we expect that Bucyrus’ expansion will provide for improved efficiency and improved workflow. We expect Bucyrus’ capacity expansion to be substantially completed by the end of the first quarter of 2008.
Over the past three years, we have increased Bucyrus’ gross profits by reducing manufacturing overhead variances, achieving productivity gains, improving equipment margins and increasing higher margin aftermarket parts and services business. Through December 31, 2006, increasing costs of steel and other raw materials have been more than offset by the higher selling prices of Bucyrus’ products.
Installed Base
Our pro forma combined installed original equipment base of approximately $22.0 billion (calculated by estimated replacement value) as of December 31, 2006, provides the foundation for our future aftermarket sales. Over the life of certain machines, customer purchases of aftermarket parts can exceed the original purchase price of the machine. Additionally, we generally realize higher gross margins on sales of our aftermarket parts than on sales of our original equipment. Moreover, because these machines tend to operate continuously in all market conditions, with expected lives ranging from eight to 40 years, and have predictable parts and maintenance needs, our aftermarket business has historically been more stable and predictable than the market for our original equipment, which is closely correlated with expectations of sustained strength in commodity markets.
Backlog
Our relative backlog level allows us to more accurately forecast our upcoming sales and plan our production accordingly. Our backlog also provides us with a predictive level of expected 2007 future sales and cash flows. Due to the high cost of some original equipment, our backlog is subject to volatility, particularly over relatively short periods. A portion of our backlog is related to multi-year contracts that will generate revenue in future years. The following table shows Bucyrus’ total backlog as of December 31, 2006, 2005 and 2004 and DBT’s total backlog as of December 31, 2006, as well as the portion of Bucyrus’ backlog which is or was expected to be recognized within 12 months of these dates:
| December 31, | |||||||||
| 2006 | 2005 | 2004 | |||||||
| (Dollars in thousands) | |||||||||
Surface Mining: | |||||||||
Next 12 months | $ | 593,828 | $ | 413,131 | $ | 231,455 | |||
Total | 894,749 | 658,612 | 436,317 | ||||||
Underground Mining: | |||||||||
Next 12 months | N/A | N/A | N/A | ||||||
Total | 514,320 | N/A | N/A | ||||||
Pro Forma Combined Total | 1,409,069 | ||||||||
The increase in our surface mining backlog as of December 31, 2006 from December 31, 2005 was primarily due to an increase in original equipment orders, which totaled $486.9 million for 2006. Original equipment orders in 2006 included an 8750AC dragline sale to a customer in Australia. DBT’s sales in 2006 benefited from an influx of original equipment orders from customers that had previously deferred their new underground making equipment purchased during the prolonged prior period of weaker coal commodity prices. As a result, and in combination with the recent softening of U.S. coal commodity prices and the substantially reduced order intake levels at DBT during the last half of 2006 compared to the last half of 2005, DBT’s backlog has decreased.
S-52
Table of Contents
Bucyrus Results of Operations
First Quarter 2007 Compared to First Quarter 2006
While Bucyrus’ unaudited financial statements are not yet complete and Bucyrus has not yet filed its quarterly report on Form 10-Q for its first quarter ended March 31, 2007, Bucyrus currently expects to report the following results of operations and balance sheet information for the quarter ended March 31, 2007. The data reported in the following table for the quarter ended March 31, 2006 and as described in the text below have been derived from Bucyrus’ unaudited consolidated condensed financial statements, which include all adjustments, consisting only of normal adjustments that management considers necessary for the fair presentation of the consolidated financial results of operations for that interim period. You should not consider the results presented in the table or described in the text below for the first quarter ended March 31, 2007 to be indicative of results for the year ending December 31, 2007, particularly as a result of the DBT Acquisition. This table should be read together with our other financial information, including “—Impact of DBT Acquisition” and “—Current 2007 Outlook,” appearing elsewhere in this prospectus supplement.
Three months ended March 31, 2007 | Three months ended March 31, 2006 | % Change in Reported Amounts | |||||||||||||
| Amount | % of Sales | Amount | % of Sales | ||||||||||||
| (Dollars in thousands; unaudited) | |||||||||||||||
Sales | $ | 190,361 | — | $ | 165,653 | — | 14.9 | % | |||||||
Gross profit | 52,078 | 27.4 | % | 40,873 | 24.7 | % | 27.4 | ||||||||
Selling, general and administrative expenses | 21,194 | 11.1 | 15,460 | 9.3 | 37.1 | ||||||||||
Operating earnings | 27,890 | 14.7 | 23,039 | 13.9 | 21.1 | ||||||||||
Net earnings | 17,863 | 9.4 | 14,522 | 8.8 | 23.0 | ||||||||||
Sales for the first quarter of 2007 were $190.4 million, an increase of 14.9% from $165.7 million for the first quarter of 2006. Original equipment sales for the first quarter of 2007 were $78.4 million, an increase of $24.9 million, or 46.6%, from $53.5 million for the first quarter of 2006. Aftermarket parts and service sales for the first quarter of 2007 were $112.0 million, a decrease of $0.2 million from $112.2 million for the first quarter of 2006. Original equipment sales were 41.2% of sales for the first quarter of 2007 compared to 32.3% for the first quarter of 2006. The increase in original equipment sales highlights the ongoing global demand for our products and services, which is being driven by customer expectations of sustained strength in the coal, copper, oil sands and iron ore markets, ongoing and rapid industrialization in parts of the developing world, demand for minerals in the developed world and the rising cost of non-coal energy sources.
Gross profit for the first quarter of 2007 was $52.1 million, or 27.4% of sales, compared with $40.9 million, or 24.7% of sales, for the first quarter of 2006. The increase in gross profit was primarily due to increased original equipment sales as well as improved gross margins on both original equipment and aftermarket parts and services. Gross margin increased as the increasing price of steel and other raw materials was more than offset by the higher selling prices of our products. Gross profit for the first quarter of 2007 and 2006 was reduced by $0.5 million and $0.3 million, respectively, of training costs for employees hired at our new manufacturing facilities in Milwaukee and South Milwaukee. We are continuing to hire and train new employees to support our increased capacity initiatives. Gross profit for the first quarter of 2007 and 2006 was also reduced by $1.3 million of additional depreciation expense in each respective quarter as a result of the purchase price allocation to plant and original equipment in connection with prior acquisitions of companies. Selling, general and administrative expense for the first quarter of 2007 were $21.2 million, or 11.1% of sales, compared with $15.5 million, or 9.3% of sales, for the first quarter of 2006. The dollar amount of selling, general and administrative expenses in the first quarter of 2007 approximated the amount of selling, general and administrative expense recognized in the fourth quarter of 2006.
Operating earnings were $27.9 million for the first quarter of 2007, an increase of 21.1% from $23.0 for the first quarter of 2006. Operating earnings increased primarily due to increased gross profit resulting from increased sales volume.
S-53
Table of Contents
Net earnings for the first quarter of 2007 were $17.9 million, or $0.57 per share, compared with $14.5 million, or $0.47 per share, for the first quarter of 2006.
EBITDA for the first quarter of 2007 was $32.2 million, an increase of 20.8% compared to $26.6 million for the first quarter of 2006. As a percentage of sales, EBITDA for the first quarter of 2007 was 16.9%, compared to 16.1% for the first quarter of 2006. EBITDA is defined as net earnings before interest income, interest expense, income taxes, depreciation and amortization. EBITDA includes the impact of non-cash stock compensation expense, severance expenses and loss on sales of fixed assets. For a reconciliation of net earnings as shown in Bucyrus’ Unaudited Consolidated Statements of Earnings to EBITDA and a reconciliation of net cash provided by operating activities as shown in Bucyrus’ Unaudited Consolidated Statements of Cash Flows to EBITDA, see “Summary—Summary First Quarter 2007 Results.”
As of March 31, 2007, we had aggregate outstanding indebtedness of $94.2 million compared with $82.6 million at December 31, 2006. We had borrowings of $90.5 million under our revolving credit facility as of March 31, 2007, and cash and cash equivalents were $13.3 million as of that date. Capital expenditures for the first quarter of 2007 were $14.8 million, which included $9.1 million related to our previously announced ongoing expansion of our South Milwaukee facilities. The remaining capital expenditures consisted primarily of production machinery at our main manufacturing facility.
As of March 31, 2007, total backlog was $937.6 million, $647.9 million of which is expected to be recognized within the subsequent 12 months. This represents a 4.8% and 9.1% increase from the December 31, 2006 total backlog of $894.7 million and 12-month backlog of $593.8 million, respectively. The backlog increase from December 31, 2006 was primarily due to an increase in original equipment orders, which totaled $140.3 million for the first quarter of 2007. Inquiries for original equipment continue to remain at a high level. Additionally, we have entered into a preliminary, non-binding letter of intent for the potential sale of a dragline and related equipment with a price in excess of $100.0 million to be delivered by 2010. We hope to execute the contract for this potential dragline by early to mid-summer 2007. Since we recognize sales on a percentage of completion basis, the impact of such order, if finalized, would be recognized over a period in excess of one year.
2006 Compared to 2005
| 2006 | 2005 | % Change in Reported Amounts | |||||||||||||
| Amount | % of Sales | Amount | % of Sales | ||||||||||||
| (Dollars in thousands) | |||||||||||||||
Sales | $ | 738,050 | — | $ | 575,042 | — | 28.4 | % | |||||||
Gross profit | 186,775 | 25.3 | % | 137,431 | 23.9 | % | 36.0 | ||||||||
Selling, general and administrative expenses | 73,138 | 9.9 | 54,354 | 9.5 | 34.4 | ||||||||||
Operating earnings | 101,184 | 13.7 | 74,051 | 12.9 | 36.6 | ||||||||||
Net earnings | 70,344 | 9.5 | 53,559 | 9.3 | 31.2 | ||||||||||
Sales
Sales for 2006 were $738.0 million compared with $575.0 million for 2005, an increase of 28.4%. Sales of aftermarket parts and services for 2006 were $482.3 million, an increase of 22.3% from $394.4 million for 2005. Aftermarket sales increased in both the United States and international markets, reflecting our continuing initiatives and strategies to capture additional market share. Aftermarket sales remained strong as customers continued the trend of utilizing our parts and services in a broader range of applications on their installed fleet of machines which are operating at very high utilization levels. Original equipment sales for 2006 were $255.7 million, an increase of 41.6% from $180.6 million for 2005. The increase in our original equipment sales was due to sustained demand for commodities that are surface mined by our original equipment.
Gross Profit
Gross profit for 2006 was $186.8 million, or 25.3% of sales, compared with $137.4 million, or 23.9% of sales, for 2005. The increase in gross profit was primarily due to increased aftermarket and machine sales.
S-54
Table of Contents
Through December 31, 2006, increasing prices of steel and other raw materials have been offset by the higher selling prices of our products. The mix of original equipment and aftermarket sales impacts our gross margin as machine sales generally have lower gross margins than our aftermarket sales. Original equipment sales were 35% of our sales for 2006 compared to 31% for 2005. Gross profit for 2006 and 2005 was reduced by $0.9 million and $1.5 million, respectively, of training costs for employees hired at our new manufacturing facility in Milwaukee. We are continuing to hire and train new employees to support our increased capacity initiatives. Gross profit for 2006 and 2005 was reduced by $5.2 million and $5.3 million, respectively, of additional depreciation expense as a result of the purchase price allocation to plant and original equipment in connection with prior acquisitions of companies.
Selling, General and Administrative Expenses
Selling, general and administrative expenses for 2006 were $73.1 million, or 9.9% of sales, compared with $54.4 million, or 9.5% of sales, for 2005. Selling, general and administrative expenses for 2006 included $4.3 million related to non-cash stock-based employee compensation expenses compared to $0.2 million for 2005. In 2006, selling, general and administrative expenses increased as a result of our hiring of additional employees to support our projected sales growth and increased plant capacity. We expect continued increases in selling, general and administrative expenses due to increased sales volumes. Foreign currency transaction losses for 2006 were $1.0 million compared with a gain of $1.0 million for 2005. We incurred approximately $0.6 million and $1.2 million of consulting expenses during 2006 and 2005, respectively, related to Sarbanes-Oxley Section 404 compliance.
Research and Development Expenses
Research and development expenses for 2006 were $10.7 million compared with $7.2 million for 2005. The increase in 2006 was due to the continuing development of electrical and machine upgrade systems.
Operating Earnings
Operating earnings for 2006 were $101.2 million, or 13.7% of sales, compared with $74.1 million, or 12.9% of sales, for 2005. The improvement in 2006 was primarily due to increased gross profit resulting from increased sales volume.
Interest Expense
Interest expense for 2006 was $3.7 million compared with $4.9 million for 2005. We capitalized $0.8 million of interest during 2006 as a part of the cost of our capacity expansion program. The remaining decrease in interest expense was primarily due to reduced average borrowings in 2006.
Income Taxes
Income tax expense for 2006 was $26.9 million compared to $15.4 million for 2005. U.S. and foreign taxes are calculated at applicable statutory rates. Income tax expense for 2006 was reduced by a net income tax benefit of approximately $4.3 million related to foreign tax credits. The foreign tax credits resulted from the completion of our evaluation of the potential to claim additional foreign tax credits generated in previous tax periods. The lower effective tax rate in 2006 was also due to the mix of our domestic and foreign earnings. Income tax expense for 2005 was reduced by a net income tax benefit of $7.0 million, which consisted of $1.8 million of foreign tax expense related to a foreign dividend distribution and the recognition of an income tax benefit of approximately $8.8 million related to foreign tax credits. Amounts included in income tax expense are further described in Note H to our consolidated financial statements. At December 31, 2006, we had available approximately $10.7 million of federal net operating loss carryforwards. These carryforwards are useable at the rate of $3.6 million per year.
S-55
Table of Contents
2005 Compared to 2004
Sales
Sales for 2005 were $575.0 million compared with $454.2 million for 2004. Sales of aftermarket parts and services for 2005 were $394.4 million, an increase of 22.7% from $321.4 million for 2004. The increase in aftermarket sales reflected our continuing initiatives and strategies to capture additional market share as well as continued strong commodity prices. Aftermarket sales increased in both the United States and international markets. Original equipment sales for 2005 were $180.6 million, an increase of 36.0% from $132.8 million for 2004. The increase in original equipment sales in 2005 was primarily due to increased electric mining shovel sales and the recognition of sales on two draglines that were sold in 2004. Approximately $6.5 million of the increase in sales for 2005 was attributable to a weakening United States dollar, which primarily impacted aftermarket sales (see “Foreign Currency Fluctuations” below).
Gross Profit
Gross profit for 2005 was $137.4 million, or 23.9% of sales, compared with $96.4 million, or 21.2% of sales, for 2004. The increase in our gross profit was primarily due to an increased sales volume and higher gross margins on both original equipment and aftermarket sales. Gross profit for 2005 was reduced by $1.5 million of training costs for employees hired at our new leased manufacturing facility. Gross profit for 2005 and 2004 was also reduced by $5.3 million and $5.2 million, respectively, of additional depreciation expense as a result of purchase price allocation to plant and original equipment in connection with prior acquisitions of companies. Approximately $1.5 million of the increase in 2005 was attributable to a weakening United States dollar (see “Foreign Currency Fluctuations” below).
Selling, General and Administrative Expenses
Selling, general and administrative expenses for 2005 were $54.4 million, or 9.5% of sales, compared with $53.1 million, or 11.7% of sales, for 2004. Selling, general and administrative expense for 2005 included $0.2 million related to non-cash stock-based employee compensation compared to $10.1 million for 2004. Non-cash stock compensation expense in 2004 primarily represented the charge recorded related to stock options issued prior to the completion of our initial public offering. Selling expenses for 2005 increased by $4.5 million from 2004 primarily due to increased sales efforts and higher foreign costs as a result of the weakened U.S. dollar, but remained relatively constant as a percentage of sales. Foreign currency transaction gains for 2005 were $1.0 million compared with gains of $2.7 million for 2004. We incurred approximately $1.2 million of consulting expenses during 2005 related to Sarbanes-Oxley Section 404 compliance.
Research and Development Expenses
Research and development expenses for 2005 were $7.2 million compared with $5.6 million for 2004. The increase in 2005 was in part due to the continuing development of electrical and machine upgrade systems.
Operating Earnings
Operating earnings for 2005 were $74.1 million, or 12.9% of sales, compared with $35.9 million, or 7.9% of sales, for 2004. Operating earnings for 2005 increased from 2004 due to increased gross profit resulting from increased sales volume and higher gross margins on both machines and aftermarket sales. Operating earnings for 2004 were reduced by $10.1 million of non-cash stock compensation expense. Approximately $0.6 million of the increase in operating earnings for 2005 was attributable to a weakening United States dollar (see “Foreign Currency Fluctuations” below).
S-56
Table of Contents
Interest Expense
Interest expense for 2005 was $4.9 million compared with $11.5 million for 2004. The decrease in interest expense in 2005 was primarily due to the refinancing of our capital structure in connection with our initial public offering.
Other Expense
Other expense for 2005 and 2004 was $1.0 million and $2.0 million, respectively. Included in the amount for 2004 was $0.6 million of secondary common stock offering expenses. Debt issuance cost amortization was $1.0 million and $1.4 million for 2005 and 2004, respectively. These amounts included costs related to our credit facilities.
Income Taxes
Income tax expense for 2005 was $15.4 million compared with $9.3 million for 2004. In 2005, U.S. taxable income exceeded available net operating loss carryforwards and income tax expense was recorded. Foreign taxes continue to be recorded at applicable statutory rates. Income tax expense for 2005 was reduced by a net income tax benefit of $7.0 million, which consisted of $1.8 million of foreign tax expense related to a foreign dividend distribution and the recognition of an income tax benefit of approximately $8.8 million related to foreign tax credits. During 2005, we began to quantify the amount of previously unclaimed foreign tax credits which we can utilize in part by amending historical income tax returns. As of December 31, 2005, we had approximately $14.3 million of federal net operating loss carryforwards.
Foreign Currency Fluctuations
The following table summarizes the approximate effect of changes in foreign currency exchange rates on Bucyrus’ sales, gross profit and operating earnings for 2006, 2005 and 2004, in each case compared to the prior year:
| 2006 | 2005 | 2004 | |||||||
| (Dollars in thousands) | |||||||||
Increase in sales | $ | 577 | $ | 6,536 | $ | 11,946 | |||
Increase in gross profit | 321 | 1,528 | 2,103 | ||||||
Increase in operating earnings | 304 | 573 | 246 | ||||||
S-57
Table of Contents
EBITDA
EBITDA is defined as net earnings before interest income, interest expense, income taxes, depreciation and amortization. Bucyrus’ EBITDA for 2006, 2005 and 2004 was $116.0 million, $87.6 million and $40.8 million, respectively. EBITDA is presented because (i) we use EBITDA to measure our liquidity and financial performance and (ii) we believe EBITDA is frequently used by securities analysts, investors and other interested parties in evaluating the performance and enterprise value of companies in general, and in evaluating the liquidity of companies with significant debt service obligations and their ability to service their indebtedness. Our EBITDA calculation is not an alternative to operating earnings under U.S. GAAP as an indicator of operating performance or of cash flows as a measure of liquidity. Additionally, EBITDA is not intended to be a measure of free cash flow for management’s discretionary use, as it does not consider certain cash requirements such as interest payments, tax payments and debt service requirements. Because not all companies use identical calculations, this presentation of EBITDA may not be comparable to other similarly titled measures of other companies. The following table reconciles net earnings as shown in our Consolidated Statements of Earnings to EBITDA and reconciles EBITDA to net cash provided by operating activities as shown in our Consolidated Statements of Cash Flows:
Years ended December 31, | ||||||||||||
| 2006 | 2005 | 2004 | ||||||||||
| (Dollars in thousands) | ||||||||||||
Net earnings | $ | 70,344 | $ | 53,559 | $ | 6,084 | ||||||
Interest income | (663 | ) | (669 | ) | (316 | ) | ||||||
Interest expense | 3,693 | 4,865 | 11,547 | |||||||||
Income tax expense | 26,930 | 15,358 | 9,276 | |||||||||
Depreciation | 12,892 | 11,681 | 11,061 | |||||||||
Amortization(1) | 2,827 | 2,788 | 3,194 | |||||||||
EBITDA(2) | 116,023 | 87,582 | 40,846 | |||||||||
Changes in assets and liabilities | (39,557 | ) | (18,123 | ) | (22,957 | ) | ||||||
Non-cash stock compensation expense | 4,284 | 180 | 10,076 | |||||||||
Loss on sales of fixed assets | 140 | 273 | 287 | |||||||||
Interest income | 663 | 669 | 316 | |||||||||
Interest expense | (3,693 | ) | (4,865 | ) | (11,547 | ) | ||||||
Income tax expense | (26,930 | ) | (15,358 | ) | (9,276 | ) | ||||||
Loss on extinguishment of debt | — | — | 7,316 | |||||||||
Secondary offering expenses | — | — | 602 | |||||||||
Net cash provided by operating activities | $ | 50,930 | $ | 50,358 | $ | 15,663 | ||||||
Net cash used in investing activities | $ | (70,603 | ) | $ | (22,109 | ) | $ | (6,706 | ) | |||
Net cash provided by (used in) financing activities | $ | 15,134 | $ | (36,299 | ) | $ | 5,188 | |||||
(1) | Includes amortization of intangible assets and debt issuance costs. |
(2) | The following table shows certain charges (credits) that were included in calculating EBITDA for each of the periods presented. These items include (a) expenses pursuant to a management services agreement with American Industrial Partners, or AIP, our former controlling stockholder, as well as fees paid to AIP or its affiliates and advisors for services performed for us outside the scope of the management services agreement, which was terminated in July 2004, (b) severance expenses for personnel changes in the ordinary course, (c) non-cash stock compensation expense related to Bucyrus’ equity incentive plans, (d) loss on sales of fixed assets in the ordinary course, (e) loss on extinguishment of debt and (f) secondary offering expenses. We believe this table, when reviewed in connection with our presentation of EBITDA, provides another useful tool to our management and investors for measuring comparative operating performance between time periods and among companies. In addition to EBITDA, our management assesses the adjustments presented in this table when preparing our annual operating budget and financial projections. Specifically, we believe that this table allows our management and investors to assess our operating performance during the periods these charges were incurred on a consistent basis with the periods during which these charges were not incurred. |
S-58
Table of Contents
| Years ended December 31, | |||||||||
| 2006 | 2005 | 2004 | |||||||
| (Dollars in thousands) | |||||||||
AIP management services expenses | $ | — | $ | — | $ | 1,182 | |||
Severance expenses | 1,443 | 521 | 370 | ||||||
Non-cash stock compensation expense | 4,284 | 180 | 10,076 | ||||||
Loss on sales of fixed assets | 140 | 273 | 287 | ||||||
Loss on extinguishment of debt | — | — | 7,316 | ||||||
Secondary offering expenses | — | — | 602 | ||||||
| $ | 5,867 | $ | 974 | $ | 19,833 | ||||
DBT Results of Operations
DBT’s historical consolidated financial statements that appear elsewhere in this prospectus supplement have been prepared in accordance with IFRS, which differ in certain material respects from U.S. GAAP. For a discussion of certain significant differences between IFRS and U.S. GAAP, see note 30 to DBT’s audited consolidated financial statements included elsewhere in this prospectus supplement, which reconciles DBT’s net profits and shareholders’ equity as reported under IFRS to U.S. GAAP. We are in the process of reviewing DBT’s accounting policies and financial statement classifications. As a result of this review, it may become necessary to make additional reclassifications to the consolidated financial information of DBT and its subsidiaries on a prospective basis. See “Unaudited Pro Forma Combined Condensed Financial Information.”
First Quarter 2007
DBT has not been a United States reporting company and has not historically prepared quarterly financial statements on a basis consistent with the audited financial statements of DBT included elsewhere in this prospectus supplement. As a result, DBT has not prepared financial statements for the first quarter of 2007 or 2006 on a basis that is directly comparable to the DBT audited financial information. Although DBT’s quarterly results are not necessarily indicative of the results to be expected for the remainder of 2007, we expect that DBT’s sales for 2007 will return to more normalized levels than were recognized in 2006. For the first quarter of 2007, DBT’s order intake, which we define as firm purchase orders booked during the period, was approximately $250 million, a decrease of 18.4% compared to order intake of approximately $296 million for the first quarter of 2006, but an increase of 81.2% and 41.2% compared to DBT’s order intake of approximately $138 million and $177 million for the third and fourth quarters of 2006, respectively. We believe this decrease reflects the fact that the first half of DBT’s 2006 results of operations benefited significantly from an influx of original equipment orders from underground mining customers that had deferred their original equipment purchases during the prolonged prior period of weaker coal commodity prices. We further base our expected decrease in DBT’s 2007 revenues on the combination of the recent softening of U.S. coal commodity prices and our projected decreased demand for DBT’s original equipment from the unusually high levels of demand in the last half of 2005 and the first half of 2006. We anticipated and took into account these expected normalized levels of results when we valued and entered into the agreement to acquire DBT and have incorporated these expectations into our estimated range of 2007 pro forma combined sales and EBITDA. See “—Current 2007 Outlook.”
2006 Compared to 2005
Sales
Sales for 2006 were €934.3 million, an increase of 24.2% from €752.5 million for 2005. Sales of aftermarket parts and services for 2006 were €252.2 million, an increase of 5.3% from €239.4 million for 2005. Aftermarket sales in 2006 increased in most markets due to the high level of global coal mining activity, although aftermarket sales as a percentage of total sales decreased due to the high level of our original equipment sales in 2006. Original equipment sales for 2006 were €682.1 million, an increase of 33.0% from €513.1 million for 2005. Original equipment sales for 2006 increased in the United States, China and Australia markets, while sales in the Russia market decreased and sales in the Germany market remained relatively flat. The increase in total sales was primarily
S-59
Table of Contents
due to strong demand for our original equipment as a result of high coal commodity prices and demand in the first half of 2006 as well as the pass through of raw material surcharges and favorable pricing of our original equipment and aftermarket parts. Sales in 2006 benefited from an influx of original equipment orders from underground mining customers that had previously deferred their underground original equipment purchases during the prolonged prior period of weaker coal commodity prices.
Earnings Before Interest and Taxes
Earnings before interest and taxes for 2006 was €89.4 million, or 9.6% of sales, compared with €59.6 million, or 7.9% of sales, for 2005. The increase in earnings before interest and taxes in 2006 was primarily due to increased gross profit resulting from increased original equipment sales volume, improved pricing of our products, and an improved mix of original equipment sales, as well as increased absorption of fixed manufacturing costs, reduced by a €18.2 million customer accommodation settlement related to temporary technological deficiencies for a newly introduced, high-technology prototype longwall system, which deficiencies have been subsequently rectified. Selling, general and administrative expenses increased €9.8 million compared with 2005, but decreased to 13% of sales for 2006 compared to 15% of sales for 2005.
2005 Compared to 2004
Sales
Sales for 2005 were €752.5 million, an increase of 21.1% from €621.1 million for 2004. Sales of aftermarket parts and services for 2005 were €239.4 million, an increase of 24.4% from €192.4 million for 2005. Aftermarket sales for 2005 increased in virtually all markets partially due to an increased continuous miner population as a result of the acquisition of . Original equipment sales for 2005 were €513.1 million, an increase of 19.7% from €428.7 million for 2004. Original equipment sales for 2005 increased in the United States, Russia and China markets, with sales in China virtually doubling due to strong AFC plow sales, while sales in the Germany market decreased to approximately half of the 2004 level. The increase in total sales was primarily due to strong demand for our original equipment and aftermarket support as a result of rising coal commodity prices as well as favorable pricing of our original equipment and aftermarket parts.
Earnings Before Interest and Taxes
Earnings before interest and taxes for 2005 was €59.6 million, or 7.9% of sales, compared with €30.5 million, or 4.9% of sales, for 2004. The increase in earnings before interest and taxes in 2005 was primarily due to an increased gross profit resulting from improved pricing of our products, an increase in both aftermarket service and original equipment sales volume and increased absorption of fixed manufacturing costs. Results for 2004 also included certain unfavorable one-time contracts in the China market. Selling, general and administrative expenses increased €12.7 million compared with 2004, but decreased to 15% of sales for 2005 compared to 16% of sales for 2004.
S-60
Table of Contents
EBITDA
The following table reconciles net earnings as shown in DBT’s Consolidated Statements of Earnings to EBITDA:
| Years ended December 31, | ||||||||||||||||
| 2006(1) | 2006 | 2005 | 2004 | |||||||||||||
(Dollars in | (Euros in thousands) | |||||||||||||||
Profit of the year from continuing operations | $ | 80,003 | € | 63,686 | € | 37,951 | € | 17,762 | ||||||||
Other interest and similar income | (4,993 | ) | (3,975 | ) | (3,065 | ) | (3,650 | ) | ||||||||
Interest and similar expenses | 10,756 | 8,562 | 9,398 | 8,450 | ||||||||||||
Income tax | 26,505 | 21,099 | 15,323 | 7,979 | ||||||||||||
Depreciation | 15,261 | 12,148 | 12,987 | 13,301 | ||||||||||||
Amortization(2) | 1,289 | 1,026 | 1,079 | 1,431 | ||||||||||||
EBITDA(3) | $ | 128,821 | € | 102,546 | € | 73,673 | € | 45,273 | ||||||||
(1) | For convenience, financial information in this column is unaudited and has been converted into U.S. dollars from the comparable information presented in Euros using the representative exchange rates described elsewhere in this prospectus supplement. Total amounts in this column may not correspond to the summation of individual line items due to rounding related to the conversion. |
(2) | Includes amortization of intangible assets. |
(3) | The following table shows certain charges (credits) that were included in calculating EBITDA for each of the periods presented. These items include (a) a customer accommodation settlement described under “—DBT Results of Operations—2006 Compared to 2005,” (b) net gains on sales of fixed assets and (c) profit from DBT’s disposition of its DBT Mineral Processing subsidiary. We believe this table, when reviewed in connection with our presentation of EBITDA, provides additional information that is useful to our management and investors for measuring comparative operating performance between time periods and among companies. In addition to EBITDA, our management assesses the charges presented in this table when preparing our annual operating budget and financial projections. We believe that this table allows our management and investors to assess our operating performance during the periods these charges were incurred on a consistent basis with the periods during which these charges were not incurred. |
| Years ended December 31, | ||||||||||||||||
| 2006(1) | 2006 | 2005 | 2004 | |||||||||||||
(Dollars in | (Euros in thousands) | |||||||||||||||
Customer accommodation settlement | $ | 22,844 | € | 18,185 | € | — | € | — | ||||||||
Net gains on sales of fixed assets | (3,318 | ) | (2,641 | ) | (2,389 | ) | (3,893 | ) | ||||||||
Profit from disposal of DBT Mineral Processing | (2,764 | ) | (2,200 | ) | — | — | ||||||||||
| $ | 16,762 | € | 13,344 | € | (2,389 | ) | € | (3,893 | ) | |||||||
(2) | Includes amortization of intangible assets. |
S-61
Table of Contents
Liquidity and Capital Resources
Cash Requirements
During 2007, we anticipate strong cash flows from operations due to continued strength in both surface mining and underground mining aftermarket parts sales, as well as continued high demand for our surface mining original equipment. In expanding markets, customers are generally contractually obligated to make progress payments under purchase contracts for original equipment orders and certain large parts orders. As a result, we do not anticipate significant outside financing requirements to fund production of this original equipment and do not believe that original equipment sales will have a material negative effect on our liquidity, although the issuance of letters of credit reduces the amount available for borrowings under our revolving credit facility. If additional borrowings are necessary during 2007, we believe we have sufficient capacity under our new revolving credit facility. See “—Description of New Credit Facilities” below.
On a pro forma combined basis, our 2006 capital expenditures were $136.0 million compared with $40.9 million for 2005. Included in capital expenditures for 2006 was approximately $56.2 million related to the expansion of our South Milwaukee facilities, of which $3.0 million was paid in early 2007, and approximately $23.8 million for the purchase of DBT’s facility in Lünen, Germany. The remaining expenditures consisted primarily of production machinery at our manufacturing facilities and upgrades to DBT’s customer service facilities. Including the requirements of DBT beginning from and after the May 4, 2007 closing date at the DBT Acquisition, we expect combined Bucyrus/DBT capital expenditures in 2007 to be between $105.0 million and $115.0 million, which includes the continued expansion in South Milwaukee and the upgrade and replacement of our manufacturing equipment to support our increased surface mining sales activity. We believe cash flows from operating activities and funds available under our revolving credit facility, as well as governmental grants and other programs, will be sufficient to fund our expected capital expenditures in 2007.
As of December 31, 2006, on a pro forma combined basis, there were $156.5 million of standby letters of credit outstanding under all of our bank facilities.
As of December 31, 2006, on a pro forma combined basis, our long-term liabilities consisted primarily of warranty and product liability accruals, pension and postretirement benefit accruals and deferred taxes and provisions for employees. As of December 31, 2006, on a pro forma combined basis our unfunded pension and postretirement benefit liability was $158.3 million.
Payments of warranty and product liability claims are not subject to a definitive estimate by year. As of the date of this prospectus supplement, we do not anticipate cash requirements for warranty claims to be materially different than historical funding levels. As of the date of this prospectus supplement, we do not expect to pay any material product liability claims in 2007.
We believe that cash flows from our operations and our revolving credit facility will be sufficient to fund our normal cash requirements for 2007. We also believe that cash flows from our operations will be sufficient to repay any borrowings under our new revolving credit facility and our new term loan facility as necessary.
Description of New Credit Facilities
On May 4, 2007, we entered into new $1.225 billion credit facilities to finance the DBT Acquisition and refinance certain existing indebtedness at both Bucyrus and DBT. Our new credit facilities include a secured revolving credit facility of $400.0 million which matures on May 4, 2012 and an $825.0 million term loan facility with a maturity date of May 4, 2014. In addition, our credit facilities will also provide us with the ability to increase the borrowing capacity by entering into a €50 million unsecured German revolving facility. Bucyrus is the borrower under both the secured revolving credit facility and the term loan facility. The credit facilities replaced our existing $200.0 million revolving credit facility. The secured revolving facility includes a sub-limit for multicurrency revolving borrowings of up to $125.0 million and swing-line borrowings of up to $25.0
S-62
Table of Contents
million. The entire secured revolving credit facility may be used for letters of credit. See “Use of Proceeds” for information regarding borrowings outstanding under our credit facilities after giving effect to the DBT Acquisition and this offering.
Borrowings under the secured revolving credit facility bear interest, payable no less frequently than quarterly, at (1) LIBOR plus 1.75%, for U.S. dollar-denominated LIBOR loans, subject to positive or negative adjustment based on final syndication of the facilities, (2) a base rate determined by reference to the greater of the U.S. prime lending rate and the federal funds rate plus 0.50%, in each case plus 0.75%, for U.S. dollar-denominated base rate loans and (3) EURIBOR plus 1.75%, for Euro-denominated loans. Borrowings under the term loan facility bear interest, payable no less frequently than quarterly, at (a) LIBOR plus 1.75%, for U.S. dollar-denominated LIBOR loans, subject to positive or negative adjustment based on final syndication of the facilities, (2) the base rate plus 0.75%, for U.S. dollar-denominated base rate loans and (3) EURIBOR plus 1.75%, for Euro-denominated loans. The interest rates under the secured revolving credit facility are subject to change based on our total leverage ratio. Under each revolving credit facility, we have agreed to pay a commitment fee based on the unused portion of such facilities, payable quarterly, at rates ranging from 0.25% to 0.50% depending on our total leverage ratio, and when applicable, customary letter of credit fees.
Our obligations under the credit facilities are guaranteed, on a joint and several basis, by certain of our domestic subsidiaries. In addition, our obligations under the secured revolving credit facility and the term loan facility are secured by a security interest in substantially all of our consolidated tangible and intangible domestic assets (subject to certain exceptions), as well as 100% of the outstanding capital stock of our domestic subsidiaries and 65% of the voting stock and 100% of the non-voting stock of certain of our first-tier foreign subsidiaries.
The credit facilities contain operating and financial covenants that, among other things, could limit our ability to obtain additional sources of capital. Our financial covenants require that we maintain a total leverage ratio, calculated on a trailing four-quarter basis, of not more than 4.00 to 1.00 through the end of the quarter ending December 31, 2008 and not more than 3.50 to 1.00 for each measurement period thereafter. The total leverage ratio is calculated as the ratio of consolidated indebtedness (which is net of cash) to consolidated operating profit (which excludes, among other things, certain non-cash charges, as discussed more fully in the credit facilities). As of May 4, 2007, we were in compliance with all covenants and other requirements in our credit facilities.
Our credit facilities require us to prepay outstanding loans with 100% of the net proceeds of the incurrence of certain debt and the making of certain asset sales and 50% (subject to step-downs based on our total leverage ratio) of our excess cash flow.
For further information related to our credit facilities described above, including the operating and financial covenants to which we are subject and related definitions, see our credit agreement, which has been incorporated by reference to this prospectus supplement.
S-63
Table of Contents
Overview
We are a leading designer and manufacturer of high productivity mining equipment for the extraction of coal, copper, iron ore, oil sands and other minerals in major mining centers throughout the world. In addition to the manufacture of original equipment, an important part of our business consists of aftermarket sales, such as supplying parts, maintenance and repair services, and technical advice, as well as refurbishing and relocating older, installed original equipment. As a result of the DBT Acquisition, we now operate in two business segments: surface mining (Bucyrus) and underground mining (DBT). We now have manufacturing facilities in Australia, China, Germany, Poland and the United States and service and sales centers in Australia, Brazil, Canada, Chile, China, England, India, Mexico, Peru, Russia, South Africa and the United States. After giving pro forma effect to the DBT Acquisition as if it had been consummated on January 1, 2006, we had combined sales for 2006 of $1.9 billion, comprised of $1.1 billion (58%) of original equipment sales and $799.1 million (42%) of aftermarket sales. Our pro forma combined backlog was $1.4 billion as of December 31, 2006.
DBT Acquisition
On December 16, 2006, Bucyrus and its special-purpose acquisition subsidiary, DBT Holdings GmBH, or the Purchaser, entered into a Share Purchase Agreement with RAG Coal, pursuant to which the Purchaser agreed to purchase from RAG Coal all of the registered capital of DBT.
On May 4, 2007, we consummated the acquisition of DBT, a subsidiary of RAG Coal, for $731.0 million in cash and shares of our common stock, subject to certain closing adjustments. We paid to RAG Coal $710.0 million in cash, subject to certain closing adjustments, and issued 471,476 shares of our common stock with a market value of $21.0 million at the time of announcement of the DBT Acquisition.
Bucyrus owns 100% of the voting shares of the Purchaser, representing 49.9% of the registered share capital of the Purchaser, and the Hamburg Trust, a German special purpose financial intermediary, owns 100% of the non-voting shares of the Purchaser, representing 50.1% of the registered share capital of the Purchaser. Bucyrus funded the purchase price for DBT and is entitled to 100% of the dividends, cash flow, earnings and all other economic benefits and risks of DBT. In connection with these transactions, Bucyrus entered into an irrevocable forward purchase agreement with the Hamburg Trust, pursuant to which Bucyrus will acquire all of the non-voting shares of the Purchaser held by the Hamburg Trust by no later than December 31, 2009 for €8.0 million (€4.0 million of which will be paid by RAG Coal). Bucyrus and the Hamburg Trust have also entered into a Shareholders’ Agreement, pursuant to which Bucyrus and the Hamburg Trust have agreed to honor certain prior commitments made by DBT regarding facility and employment matters. Pursuant to the Shareholders’ Agreement, the Hamburg Trust will not be permitted to conduct any business or incur any debt.
Based on the provisions of FASB Interpretation No. 46(R), DBT constitutes a variable interest entity. As Bucyrus is the only party with the risks and rewards of ownership, Bucyrus is the primary beneficiary of this variable interest entity and, therefore, Bucyrus will consolidate DBT in its financial statements.
DBT Acquisition Strategic Rationale
Expanded Product Portfolio. The DBT Acquisition expanded our product portfolio to include underground mining equipment and aftermarket support, which enhances our capability to serve a larger segment of the global mining equipment market not previously served by Bucyrus. DBT is an internationally recognized brand in the market for underground mining equipment and services and has the leading market position in longwall mining equipment systems. According to the World Coal Institute, longwall mining equipment is utilized in approximately 60% of global underground coal mining production worldwide and longwall mining is the predominant method used in many of the high growth mining regions. Additionally, DBT has continued to increase its presence in the room and pillar equipment market, and we believe that it has significant opportunity
S-64
Table of Contents
for additional growth in this market. Of our pro forma combined sales for 2006, 61% were from products and services for underground mining and 39% were from products and services for surface mining.
Increased Installed Original Equipment Base. The DBT Acquisition increased our pro forma combined worldwide installed original equipment base as of December 31, 2006 from an approximate replacement value of $12.6 billion to an approximate replacement value of $22.0 billion. We believe that this increased installed base provides us with significantly greater opportunities to market our aftermarket parts and services. Parts typically earn a higher margin than our original equipment sales. Additionally, DBT’s aftermarket business has lower market share than that of Bucyrus, which we believe presents an opportunity for growth.
Expanded Presence in Potentially High Growth Markets. The DBT Acquisition provides us with an increased strategic presence in markets that we expect will experience substantial mining growth over the next several years, such as China and Russia. Additionally, we anticipate building upon Bucyrus’ presence in India, another market that we believe has high growth potential, to increase DBT’s share of the underground mining equipment market in that country. According to the International Energy Agency’s World Energy Outlook, coal production is expected to grow annually at 4.2%, 1.5% and 3.2% in China, Russia and India, respectively, through 2015.
Advanced Engineering and Innovative Technology. DBT’s products utilize advanced engineering and technology, and we believe that DBT is now a technology leader in the underground mining equipment industry. Specifically, DBT has made significant investments to develop its line of longwall shearers and automated plow systems that we believe are technologically advanced products. DBT has made similar investments to develop its line of continuous miners.
Our Industry
The surface and underground mining equipment that we manufacture and service is used primarily in coal, copper, oil sands, iron ore and other mineral mines worldwide. Growth in demand for these commodities is generally a function of population growth and continuing improvements in standards of living in many areas of the world. The market for equipment tends to be somewhat cyclical in nature due to market fluctuations for these commodities; however, the aftermarket for parts and services is generally more stable because this expensive, complex equipment is typically kept in continuous operation for eight to 40 years and requires regular maintenance and repair throughout its productive life. According to The Freedonia Group, the global annual market for mining equipment sales was estimated at $17.7 billion in 2004 and is expected to reach $27.5 billion in 2009.
The two primary suppliers of surface mining equipment are Bucyrus and P&H. Similarly, the two primary suppliers of underground mining equipment are DBT and Joy Mining. In addition, several niche players compete with limited product lines. Our original equipment is primarily used by large multinational companies engaged in mining for a variety of commodities. We believe that recent consolidation within the mining industry has resulted in higher capitalized companies being better positioned to withstand commodity cycles and adhere to increased supply-side price discipline.
Coal. Coal is the world’s most abundant low-cost energy source and is a critical source of energy for many countries. There are two primary types of coal: steam or thermal coal used to generate electricity and coking or metallurgical coal required to produce steel. Coal accounts for approximately 40% of global electricity generation, more than double natural gas, the second largest energy source, according to the Energy Information Administration. Demand for coking coal has recently risen in tandem with the increased demand for steel. The largest coal producing nations in 2006 were China, the United States, India, Australia, South Africa and Russia, according to the World Coal Institute. We believe that large amounts of coal reserves and significant coal infrastructure make transitions from coal to other energy sources more difficult. Additionally, new clean coal technologies help to mitigate environmental and regulatory concerns, and new technologies, such as gasification and liquefaction, create opportunities for future growth in the use of coal.
S-65
Table of Contents
China and India, which together account for 37% of the world’s population as of June 30, 2005 according to the U.S. Census Bureau, have fast-growing economies and limited domestic energy sources other than coal. According to China’s National Development and Reform Commission, China produced approximately 2.4 billion tons of coal in 2005, a 23% increase over 2004. China is expected to produce 2.8 billion tons of coal per year by 2010. According to India’s Ministry of Coal, India produced 422 million tons of coal in 2005.
Copper, Oil Sands, Iron Ore and Other Minerals. Copper is a basic material used in residential and commercial construction, electrical equipment, transportation, industrial machinery and durable consumer goods. Demand for copper is being driven by accelerating economic growth in the developing world and continued consumption in the developed world. According to the International Copper Study Group, worldwide mine production of copper was 16.4 million tons in 2005 and is projected to increase to 17.9 million tons in 2007. Oil sands are a viscous mixture of sand, bitumen, clay and water with the consistency of cold molasses. According to the Canadian Association of Petroleum Producers, the oil sands in the Athabasca region of northern Alberta Canada are believed to contain the equivalent of 315 billion barrels of oil, of which 175 billion has already been established as commercially viable using today’s extraction methods. According to 2005 United States Energy Information Administration data, the oil reserves of Saudi Arabia contain approximately 260 billion barrels. Iron ore is one of the only sources of primary iron used to make steel and is mined in more than 50 countries. The market for iron ore is largely a function of the demand for steel. According to the Australian Bureau of Agricultural and Resource Economics, worldwide production of iron ore in 2005 was 1.5 billion tons and is projected to be 1.6 billion tons in 2006 and 1.8 billion tons in 2007. We have also been successful in selling our equipment for use in the mining of various other minerals, including gold, uranium, diamonds, molybdenum, phosphate and bauxite.
Business Strengths
Stable and Profitable Aftermarket Business Driven by an Installed Base of Approximately $22.0 Billion. Aftermarket sales accounted for 42% of our total 2006 pro forma combined sales. On a stand-alone basis, Bucyrus’ aftermarket sales accounted for 65% of its total 2006 sales and DBT’s aftermarket sales accounted for 27% of its total 2006 sales. Bucyrus’ aftermarket sales have grown at a 10.5% compound annual growth rate, over the past 10 years, increasing every year over that period except for one year (1999) in which aftermarket sales declined by approximately 2%. Bucyrus has increased its market share in the supply of aftermarket parts and service for Bucyrus’ existing installed base from approximately 40% in 2002 to approximately 60% in 2006. Further, our customers have stable demand for our aftermarket products that helps to minimize lost revenues associated with equipment downtime.
Advanced Engineering and Innovative Technology. We believe that innovative technologies enable mines to achieve increased efficiency and increased production levels. As a result, we have focused on developing advanced technologies for our products to increase our customers’ efficiency. For example, by teaming with Siemens Energy & Automation, or Siemens, Bucyrus recently developed a new dragline technology called Direct Drive for Draglines, or D3. D3 is a gearless drive system that enables mines to increase productivity and reduce downtime, maintenance costs and energy consumption. Additionally, in 2006 Bucyrus introduced the innovative 495 Series High-Performance shovels. The improvements to this series enhance shovel operation through increased efficiency and lower maintenance costs. DBT offers an upgraded line of continuous miners, which combines high cutting power with matching conveying and tramming capacity. Independent drive functions help to ensure high reliability and ease of maintenance, while the modular design allows bolter miner equipment to be added to the continuous miner.
Strong Global Fundamentals in Our Major End Markets. Our products are used primarily by customers that mine coal, copper, oil sands, iron ore and other minerals. As a result, our continued growth is directly linked to each of these underlying commodity markets. The majority of our major end markets have recently experienced strong market conditions and prospects for continued growth currently remain positive over the longer term,
S-66
Table of Contents
although there has been a recent softening of coal commodity prices in the United States. We believe that large amounts of coal reserves and significant coal infrastructure make transitions from coal to other energy sources more difficult. Additionally, we believe that new clean coal technologies help to mitigate environmental and regulatory concerns, and new technologies, such as gasification and liquefaction, create opportunities for future growth in the use of coal.
Strong Backlog. We believe that our backlog level allows us to more accurately forecast our upcoming sales and plan our production accordingly. We expect our pro forma combined backlog of firm orders of $1.4 billion as of December 31, 2006 to generate relatively predictable 2007 levels of sales and cash flows associated with the related equipment orders, as well as contracted ancillary service and maintenance revenue. Additionally, we continue to experience strong market demand for our original equipment based on preliminary letters of intent to purchase and indications for potential orders for our original equipment for delivery through 2009.
Experienced Management Team. We are led by a group of executives with substantial experience at Bucyrus and in the mining industry. Our president and chief executive officer, Timothy W. Sullivan, and our chief financial officer, Craig R. Mackus, have 29 and 30 years of experience with us, respectively. Since our current management team was constituted in 2000, we have increased both sales and operating margins, even during the 2000-2003 period of prolonged weakness in commodity prices and original equipment sales, and have also operated efficiently in the current environment of constrained capacity and strong demand for our products. DBT is led by management with substantial experience in the underground mining industry including William S. Tate, DBT’s current president and chief executive officer, who has over 30 years of energy experience as an operator and equipment manufacturer and has been with DBT for over eight years, and Luis de Leon, DBT’s current chief financial officer, who has 15 years of international experience in machinery and the systems manufacturing industry and has been with DBT for over 10 years.
Business Strategy
Grow Our Aftermarket Business. We continue to increase our focus on the important aftermarket business associated with our installed base of original equipment, the replacement value of which was approximately $22.0 billion as of December 31, 2006 on a pro forma combined basis, because of its attractive profit margins and its greater stability and predictability compared to the market for the sale of original equipment. We will seek to increase DBT’s market share of aftermarket parts and services associated with its installed base by implementing a strategy similar to the successful aftermarket strategy executed with respect to Bucyrus’ installed base. In addition, by enhancing aftermarket support, which is critical to maintaining equipment longevity and productivity in the field, we hope to enhance our ability to secure more original equipment orders in the future.
Improve Operating Efficiencies at DBT. We have identified several long-term growth and cost-saving opportunities at DBT that we expect to implement over the longer-term. We expect to focus on additional initiatives over time in an attempt to realize increased operating efficiencies at DBT, including consolidating some of DBT’s international sales offices with Bucyrus’ sales offices and reducing DBT’s levels of selling, general and administrative expenses and research and development expenses.
Expand Capacity and Productivity Initiatives. We are in the process of completing the third phase of our capacity expansion of Bucyrus’ manufacturing facilities in South Milwaukee, Wisconsin. Assuming that we are able to attract and retain the necessary skilled labor, the expansion, when completed, is expected to enable us to increase our annual shovel production capacity from 10 machines in 2006 to 16 machines in 2007 and ultimately to 24 machines in 2008, as well as approximately double our manufactured parts capacity. Our expansion also will help provide us with added flexibility to increase dragline production should demand for shovels decline or demand for draglines increase. In addition, we expect that our expansion will provide for improved efficiency and improved workflow. As part of the expansion, we are implementing an improved production system as well as a number of lean manufacturing initiatives. We expect our capacity expansion to be substantially completed by the end of the first quarter of 2008.
S-67
Table of Contents
Focus On Strategic Markets. We believe that certain markets, including China, Russia and India, present significant growth opportunities in both underground and surface mining, and that these countries will be key strategic markets for our business. China has a fast-growing economy with limited domestic energy sources other than coal. According to the World Coal Institute, coal is currently the dominant natural resource used for power generation in China (approximately 77%). China has the third largest coal reserves in the world, and coal-fired power is expected to fuel most of its growth. According to the Methane to Markets Partnership, 90% of coal production in China was mined underground in 2006. To be in a position to compete more effectively in the underground mining market in China, we plan to expand our manufacturing capacity in China, although this expansion process will likely take at least 12 to 18 months to complete and we expect that it likely will take at least several quarters after completion until we can begin realizing its anticipated benefits. Furthermore, DBT’s presence in Russia and Bucyrus’ presence in India provide additional opportunities for growth. We also intend to continue focusing on the North American and South African coal markets as areas of potential growth for DBT’s room and pillar mining products and services.
Surface Mining
Overview
Bucyrus designs, manufactures and markets draglines, electric mining shovels and rotary blasthole drills used for surface mining and provide the aftermarket replacement parts and service for these machines. We believe that Bucyrus has the largest installed base of this original equipment (we calculate the value of our installed base of original equipment based on its estimated replacement value) in the world and is the leading market provider of draglines and large rotary blasthole drills. Bucyrus’ products are sold to customers throughout the world in nearly every market where surface mining is conducted with modern methods. Bucyrus’ products are continuously evolving as improvements in design and technology emerge, with the goal of providing the customer maximum productivity and cost effectiveness. Bucyrus concentrates on producing technologically advanced machines that enable its customers to conduct cost-efficient operations. Bucyrus manufactures AC drive draglines and electric mining shovels and offers advanced computer control systems which allow technicians at its headquarters to remotely monitor and adjust the operating parameters of suitably equipped machines at locations around the world via the Internet.
Growth in the surface mining industry is driven by increased demand for surface mined commodities such as copper (especially in South America), oil sands (Canada) and coal (China, the United States, India, Australia, South African and Russia). We believe that surface mining of coal in China and India holds potential for long-term growth.
Original equipment sales are closely correlated with the strength of commodity markets and maintain and augment Bucyrus’ almost $12.6 billion installed base as of December 31, 2006. Bucyrus’ installed base of original equipment provides the foundation for its aftermarket activities. Bucyrus’ aftermarket parts and service operations, which historically have been more stable and more profitable than its original equipment sales, have accounted for approximately 72% of its sales over the last 10 years. Over that period and throughout various commodities cycles, Bucyrus’ aftermarket sales have sustained a compound annual sales growth rate of 10%, increasing every year except for 1999, in which sales declined 2%. Bucyrus has established a global presence with a network of 26 sales and service offices located in all countries where major surface mining operations are located. Bucyrus manufactures its machines and the majority of its aftermarket parts at its facilities in South Milwaukee and Milwaukee, Wisconsin. Bucyrus is currently undergoing a multi-phase expansion of its South Milwaukee manufacturing facilities, which is expected to be substantially completed by the first quarter of 2008.
Original Equipment
Bucyrus’ line of surface mining equipment includes draglines, electric mining shovels and rotary blasthole drills.
S-68
Table of Contents
Draglines. Draglines are primarily used in coal mining applications to remove overburden (i.e., the rock and soil that lies above the coal being mined) by dragging a large bucket through the overburden and carrying it away. Bucyrus’ draglines weigh from 500 to 7,500 tons and are typically described in terms of their “bucket size,” which can range from nine to 220 cubic yards. Bucyrus currently offers a full line of models ranging in price from $30.0 million to in excess of $120.0 million per dragline. Draglines are the largest and most expensive type of surface mining equipment but offer customers the lowest cost per ton of material moved. The average life of a dragline is approximately 40 years.
Electric Mining Shovels. Mining shovels are primarily used to load copper, coal, oil sands, iron ore, other mineral bearing materials, overburden or rock into trucks. There are two basic types of mining shovels: electric and hydraulic. Electric mining shovels are able to handle a larger load, allowing them to move greater volumes of rock and minerals, while hydraulic shovels are diesel powered, smaller and more maneuverable. An electric mining shovel offers significantly lower cost per ton of mineral mined over a longer period of time as compared to a hydraulic shovel. Electric mining shovels are characterized in terms of hoisting capability and dipper or load capacity. Bucyrus offers a full line of electric mining shovels, with available hoisting capability of up to 120 tons. Dipper capacities range from seven to 90 cubic yards. Prices range from approximately $5.0 million to $23.0 million per shovel, with the selling price of Bucyrus’ most popular shovels being in the upper part of this range. Bucyrus’ electric mining shovels have an average life of approximately 15 years.
In recent years, Bucyrus has developed the innovative 495 Series High-Performance shovels. The highlights of this series include planetary gear configuration, insulated gate bipolar transistor, or IGBT, electrics and a third rail swing system to enhance shovel operation through increased efficiency and lower maintenance costs. A fully modularized electrical room ships directly to the field to facilitate the field assembly process. Bucyrus is focused on continuous reliability enhancements to support its customers’ needs. Since machine downtime results in lost revenue for customers, shovel availability is vitally important in mining operations.
Rotary Blasthole Drills. Many surface mines require breakage of rock, overburden or ore by blasting with explosives. To accomplish this, it is necessary to bore out a pattern of holes in the ground area to be mined into which explosives are then placed. Rotary blasthole drills are used to drill these holes and are usually described in terms of the diameter of the hole they bore. Bucyrus offers a line of rotary blasthole drills ranging in hole diameter size from 6.0 inches to 17.5 inches and ranging in price from approximately $0.6 million to $4.5 million per drill, depending on machine size and other variable features. The selling price of its most popular drills is in the upper part of this range. The average life of a rotary blasthole drill is approximately 15 years.
Modular design techniques have been applied to blasthole drills to provide ease of maintenance by simplifying equipment change outs and servicing. Bucyrus’ 39HR is a drill with the production capabilities of larger machines and the flexibility, speed and maneuverability of smaller machines. An important flexibility feature of the 39HR drill is its ability to drill under itself at a -15 degree slope. The efficient angle hole drilling is accomplished without the use of back braces, which allows angle adjustments between -15 and +30 degrees, and is the only machine available today with this capability.
Aftermarket Parts and Services
Bucyrus has a comprehensive aftermarket business that supplies replacement and upgrade parts and services for its installed base of original equipment. Customer purchases of aftermarket parts and services over the life of certain of Bucyrus’ original equipment can exceed the initial purchase price of the original equipment. Bucyrus’ aftermarket offerings include engineered replacement parts, maintenance and repair labor, technical advice, refurbishment and relocation of machines, comprehensive structural and mechanical engineering, non-destructive testing, repairs and rebuilds of machine components, product and component upgrades, turnkey erections, equipment operation and complete equipment management under comprehensive, long-term maintenance and repair contracts. Bucyrus also distributes less sophisticated components that are consumed in the normal course
S-69
Table of Contents
of machine operation. A substantial portion of Bucyrus’ international repair and maintenance services are provided through its global network of wholly owned foreign subsidiaries and overseas offices operating in Australia, Brazil, Canada, China, England, India, Peru and South Africa. Bucyrus also maintains a continuous physical presence at certain customers’ domestic and overseas mine sites in some of these countries in connection with its maintenance and repair contract operations.
Bucyrus generally realizes higher margins on sales of its aftermarket parts than on sales of its original equipment. Moreover, because Bucyrus’ original equipment tends to operate continuously in all market conditions with expected lives ranging from 15 to 40 years and have predictable parts and maintenance needs, Bucyrus’ aftermarket business has historically been more stable and predictable than the market for its original equipment, which is closely correlated with expectations of sustained strength in commodity markets.
Large mining customers are increasingly outsourcing the skills involved in maintaining large and complex surface mining equipment. Bucyrus offers comprehensive maintenance and repair contracts to address this trend. Under these contracts, Bucyrus provides all replacement parts, regular maintenance services and necessary repairs for the excavation equipment at a particular mine with an on-site support team. In addition, some of these contracts call for its personnel to operate the equipment being serviced. Maintenance and repair contracts are beneficial to Bucyrus’ customers because they promote high levels of equipment reliability and performance, allowing the customer to concentrate on mining production. Maintenance and repair contracts typically have terms of three to five years with provisions for renewal and early termination. New mines in areas such as Australia, Canada and Peru are Bucyrus’ primary targets for maintenance and repair contracts because it is difficult and expensive for mining companies to establish the necessary infrastructure for ongoing maintenance and repair in remote regions of these countries.
Bucyrus’ aftermarket parts and service sales have generally grown consistently over the past 10 years. For most of its customers, mining continues even during periods of lower commodity prices, maintaining demand for aftermarket parts and services, although competition from independent firms called “will-fitters” that produce copies of the parts manufactured by Bucyrus and other original equipment manufacturers tends to intensify during periods of commodity price weakness. Bucyrus continues to try to improve our performance in key areas such as reducing lead times, increasing on-time delivery and implementing an information technology infrastructure which motivate customers to purchase their aftermarket parts and services from it. Bucyrus believes its emphasis on quality and technology has further increased customer motivation to use more of its aftermarket parts and services. We believe that Bucyrus’ continued focus on on-time delivery, competitive lead times and enhanced information technology systems combined with its comprehensive offerings of quality aftermarket components and installation services and its development of key supplier alliances position it to compete effectively for most aftermarket opportunities.
Customers
Most of Bucyrus’ customers are large multinational corporations with operations in the various major surface mining markets throughout the world. In recent years, customers have reduced their operating costs by employing larger, more efficient machines such as those we produce and have become increasingly sophisticated in their use and understanding of technology. Bucyrus’ focus on incorporating advanced technology such as AC drives and advanced controls has increased customer adoption of our product offerings. Further, we believe that these developments have contributed to increased demand for Bucyrus’ aftermarket parts and service since it is well-equipped to provide the more sophisticated parts, product technical knowledge and service required by customers who use more complex and efficient machines.
Over the past five years, Bucyrus’ customers have conducted their most significant operations in the United States, South America, South Africa, Australia, Canada, China and India. We expect China and India to experience the most growth in surface mining in the future. In the aggregate, sales of Bucyrus’ original equipment were $255.7 million, $180.6 million and $132.8 million and sales of its aftermarket parts and services
S-70
Table of Contents
were $482.3 million, $394.4 million and $321.4 million in 2006, 2005 and 2004, respectively. Bucyrus’ customers use its aftermarket parts and services because its high quality, reliable and durable products, and services that are well suited to the long productive lives of its original equipment. However, some surface mine operators may find it more economical to buy lower quality and less durable parts from will-fitters for original equipment that is near the end of its useful life.
Bucyrus’ customers operate under a high fixed cost structure. Small savings on the initial purchase of original equipment may be offset by less efficient operations and greater down time. Furthermore, its customers’ operations are often conducted in remote areas and the large capital investment and long lead time associated with the purchase and erection of a machine encourages many customers to select more reliable and efficient machines and to keep these machines in continuous operation for as long as possible. As a result, Bucyrus’ customers are focused on quality as well as price and expect it to offer comprehensive aftermarket parts and services to increase efficiency and reduce down time.
Bucyrus does not consider itself to be dependent upon any single customer, although on an annual basis a single customer may account for a meaningful percentage of its sales, particularly original equipment sales. In 2006, 2005 and 2004, one customer, BHP Billiton, accounted for approximately 13%, 14% and 12%, respectively, of its sales. Bucyrus’ top five customers in each of 2006, 2005 and 2004 collectively accounted for approximately 40%, 38% and 36%, respectively, of its sales. We believe this trend reflects the recent consolidation within the mining industry.
Competitors
Bucyrus’ primary global competitor in electric mining shovels and draglines is P&H, although for certain applications its electric mining shovels also compete against hydraulic shovels made by other manufacturers. In rotary blasthole drills, Bucyrus’ primary competitors are P&H and Atlas Copco AB. In China and Russia, Bucyrus also faces limited competition from regional and domestic equipment manufacturers; however, such competition is not material to its core markets. Competition factors are diverse and include price, lead times, operating costs, machine productivity, technological enhancements, design and performance, reliability, service, delivery and other commercial factors. Long standing relationships that Bucyrus and its competitors have with their customers and their decision makers can provide a strong incumbency advantage in retaining business and securing new orders.
For most owners of its machines, Bucyrus is the primary replacement source for highly engineered, integral components. Competition in replacement parts sales consists primarily of will-fitters. Bucyrus’ principal original equipment manufacturer competitor also participates in this business. These copies are generally sold at lower prices for use on older machines and are generally acknowledged to be of lower quality than parts produced by the manufacturer of the original equipment. Bucyrus also faces significant competition from manufacturers and distributors in the sale of consumable replacement parts which it does not manufacture, including wire rope, non-specialized parts and electrical parts, as well as aftermarket services competition from these market participants and local machining and repair shops.
Bucyrus has a variety of programs to attract large volume customers for its replacement parts. Although will-fitters engage in significant price competition in parts sales, we believe that Bucyrus possesses non-price advantages over will-fitters. We believe that Bucyrus’ engineering and manufacturing technology and marketing expertise exceed that of its will-fit competitors, who in many cases are unable to duplicate the exact specifications of its replacement parts. Moreover, the use of replacement parts not manufactured by Bucyrus can void the warranty on a piece of original equipment, which generally runs for one year, with certain components under warranty for longer periods.
In recent years, Bucyrus has received several large orders for the refurbishment and relocation of machines, especially draglines. Its principal original equipment manufacturer competitor also participates in this business, as do several smaller regional companies.
S-71
Table of Contents
Underground Mining
Overview
DBT is a leading supplier of complete system solutions for underground coal mining worldwide and is headquartered in Lünen, Germany. Prior to the completion of the DBT Acquisition, DBT was owned by RAG Coal. We believe DBT is one of the world market leaders in longwall mining equipment, which is the result of comprehensive experience and know-how gained over decades of innovative, high-performance engineering.
The two main methods of underground mining are longwall and room and pillar mining, which differ significantly in their initial investment amount and corresponding output.
Longwall Mining
Longwall mining involves the near complete extraction of hard coal contained in a large rectangular block, or “panel,” using mechanical shearers or plows, after which the mined-out area is allowed to collapse. Room and pillar mining equipment is used to develop a panel by excavating passageways along the panel perimeter. Working under the steel canopies of movable hydraulic roof supports, a coal cutting machine, such as a shearer or a plow, runs back and forth along the “face,” or the exposed part of the panel, taking a cut during each pass. As the shearer or plow cuts into the coal and deposits it onto the conveyor system, self-advancing hydraulic roof supports temporarily hold up the roof. As the shearer or plow proceeds through the coal, the equipment, if automated, signals the roof supports to hydraulically drive the entire longwall system forward while the roof behind the roof supports is allowed to collapse.
The longwall method is chosen if the geological conditions of the coal deposit are favorable (i.e., the coal seams are vast in length and width and with minimal rock intrusions, permitting several large panels to be prepared) or generally if the coal deposits are more than 1,000 feet underground. Longwall mining typically requires an initial mining equipment investment of approximately $50.0 million, and a single longwall operating unit can generate an annual output of approximately two million tons.
Room and Pillar Mining
Hard coal deposits are mined by cutting a network of “rooms” into the coal seam and leaving behind “pillars” of coal to support the roof of the mine either temporarily or permanently in room and pillar mining. This mining method also requires several pieces of equipment that work together in a synchronized fashion; however, they are not mechanically connected to each other as in longwall mining. The process begins with the continuous miners cutting the coal and conveying it through the machine’s conveyor. The coal is then discharged from the back of the continuous miner into haulage vehicles or mobile belt conveyors which transport it to a feeder (or feeder breaker if the material needs to be crushed or down-sized). The coal is then loaded on to a belt system, which takes the coal to the surface. As the continuous miner advances into the coal deposit, a roof bolter drills and installs roof bolts to secure the roof of the mine.
The pillars can equal to up to 50% of the total coal in the seam—although this coal can sometimes be recovered at a later stage, depending on geological conditions. Where this is viable, pillars are partially mined through by the continuous miner as mining retreats back towards the main entries. The room and pillar mining method is used if the coal deposit requires the mine operator to remove the coal in smaller panels. The required initial investment in equipment for room and pillar mining is about $9.0 million, and the corresponding average annual production is approximately 0.4 million tons.
Original Equipment
Historically, DBT has focused on the production of longwall mining equipment. However, through the acquisition of the U.S. mining equipment supplier Long-Airdox in 2001, DBT has complemented its leading
S-72
Table of Contents
position in longwall mining equipment (e.g., hydraulic roof supports and electro-hydraulic controls, automated plow systems, armored face conveyors and crushers) by expanding its product offering to include room and pillar equipment (e.g., continuous miners, feeder breakers, underground utility vehicles, continuous haulage systems, roof bolters and belt systems) and the longwall shearer.
Longwall Equipment. DBT is one of the world’s top producers of longwall mining equipment. The longwall equipment produced by DBT includes hydraulic roof supports and electro-hydraulic controls, automated plow systems, shearers, armored face conveyors and crushers. DBT’s systems can be customized to suit a wide range of mining conditions anywhere in the world, thereby ensuring the ideal combination of safety, operational reliability and productivity at competitive prices.
Hydraulic Roof Supports. Roof supports provide support to the mine roof during longwall mining. The supports advance with the longwall shearer or plow, allowing mine operators to safely control roof falls as the panel is mined. DBT offers a full range of roof supports suitable for mining heights from 0.6 m to 6.0 m with support capacities in excess of 1,200 tons per shield. Roof supports provide a high degree of customization for unique mine attributes: thin, thick, steeply inclined coal seams, weak roofs, soft floors, massive sandstone roofs and geological faults. DBT offers electro-hydraulic roof support systems for automatic sequences or manually operated functions. A complete roof support system can include from 50-175 roof support shields. Prices range from approximately $25.0 million to $35.0 million per roof support system. DBT’s roof supports have an average life of approximately eight to 10 years.
Armored Face Conveyors. Armored face conveyors, or AFCs, are used in longwall mining to transport material cut by the shearer or plow away from the longwall face. AFCs are armored steel pan conveyors that are used to convey mined material both in the longwall face and out of the longwall face. DBT’s AFC systems are designed for a variety of performance requirements in low, medium and high seams and for short and long faces. Several of DBT’s AFC systems have successfully operated in 350 m to 450 m long faces conveying up to 5,000 tons/hour and more (six million tons per year). Prices range from approximately $5.5 million to $9.0 million per AFC system. DBT’s AFC systems have an average life of approximately eight to 10 years.
Longwall Shearers. A longwall shearer moves parallel to the coal or mineral face, cutting into the coal as it moves backward and forward across the face, depositing the coal onto the conveyor system. The shearer is usually a double ended machine with ranging arms at each end and cutter drums mounted on each ranging arm, so the shearer can cut in either direction. DBT offers a wide range of shearer systems for low, medium and high seams from 1.6 m up to 5.8 m, with production rates of up to 5,000 tons/hour. Prices range from approximately $2.5 million to $3.5 million per shearer system. DBT’s shearer systems have an average life of approximately eight to 10 years.
Automated Plow Systems. Fully automated plow systems are a safe and economically attractive method of mining low and medium seam heights. Under this mining technique, the plow body is pulled along the coal face by an endless chain over a plow guide welded to the face conveyor. Plows achieve high traveling speeds (up to three meters per second) and cutting depths of up to 250 mm. Plows have high extraction and loading rates in seams of 0.6 m to 1.8 m results in mining rates of up to 1,500 tons/hour. Prices range from approximately $9.0 million to $10.0 million per automated plow system. DBT’s automated plow systems have an average life of approximately eight to 10 years.
Room and Pillar Equipment. In addition to longwall mining equipment, DBT offers an extensive line of technologically advanced room and pillar equipment. DBT’s room and pillar equipment offerings include continuous miners, feeder breakers, battery- and diesel-powered underground utility vehicles, continuous haulage systems, roof bolters and belt systems. DBT’s continuous miners can be used for both soft- and hard-cutting applications. In recent years, DBT has extensively re-engineered its room and pillar product portfolio.
Continuous Miners. Continuous miners are electric, self-propelled machines that constantly cut material and simultaneously load that material onto an internal conveyor. They then load the material into a haulage vehicle or
S-73
Table of Contents
continuous haulage system for transportation to the main mine belt. DBT’s upgraded range of continuous miners combines high cutting power with matching conveying capacity. Independent drive functions ensure high reliability and ease of maintenance, while the modular design allows bolter miner equipment to be added to the continuous miner where applicable. DBT offers a “seamless” family of continuous miners for both soft and hard cutting applications for seams from 0.8 m to 5.2 m. Due to the severity of the operating environment and continuous usage, these products require extensive aftermarket parts, service and maintenance. Prices range from approximately $1.2 million to $3.0 million per continuous miner. DBT’s continuous miners have an average life of approximately 10 to 15 years.
Continuous Haulage Systems. The continuous haulage system is used to efficiently remove cut coal from the working face to the main mine belts on a continuous basis versus the batch process used by shuttle cars and battery haulers. The system is usually attached to the continuous miner or independently trammed behind the miner. It utilizes chain conveyors that transport the coal through a series of connected bridge structures and ultimately to the main mine belts. DBT systems can be implemented in new or existing operations with capacity of up to 38 tons per minute. Prices range from approximately $1.0 million to $2.0 million per continuous haulage system and DBT’s continuous haulage systems have an average life of approximately 10 to 15 years.
Feeder Breakers. Feeder breakers are a crushing unit that breaks the coal into a smaller size suitable for transportation by the belt conveyor systems or feeding into process facilities. The feeder breakers are often self-contained mobile units with a hopper to take the coal load from an underground utility vehicle. The feeder breaker then crushes the coal to feed onto the belt conveyer. DBT’s underground feeder breakers have a production capacity of up to 1,800 tons per hour with a pick force of 27,200 kg. The units are custom designed to allow maximum discharge rates from the mobile haulers. Prices range from approximately $0.3 million to $0.5 million per feeder breaker and DBT’s feeder breakers have an average life of approximately 10 to 15 years.
Underground Haulage and Utility Vehicles. Underground haulage vehicles are vehicles used to transport material from continuous miners to the main mine belt where the haulage vehicle has self-contained discharge capability to unload material onto the belt. DBT offers both battery-powered and diesel-powered haulage vehicles. Underground utility vehicles are self-loading vehicles used to clean roadways, haul supplies and perform other functions. Prices range from approximately $0.3 million to $0.6 million per underground utility haulage vehicle or underground utility vehicle, and DBT’s underground haulage and utility vehicles have an average life of approximately 10 to 15 years.
Along with its two main product groups, DBT offers solutions in the field of horizontal crushing equipment for coal and non-coal applications such as aggregates typically used in road construction, potash and rock salt. The product range includes size reduction technology for primary crushing and scraper chain conveyors.
Aftermarket Parts and Services
In addition to the production and sale of original equipment, DBT offers a complete range of services including on-site services, repairs, overhauls and spare parts management. DBT supports its customers through the entire equipment life cycle and re-uses the information gathered in this process to further improve equipment productivity as well as to develop new technology and systems, tailored to meet customer needs.
In addition, DBT provides consulting services in emerging markets, such as mine planning, through its subsidiary DBT Mining Engineers. Aftermarket sales accounted for approximately 27% of DBT’s 2006 total sales, with the remaining 73% coming from original equipment sales.
Customers
Over the past five years, DBT’s customers have conducted their most significant operations in the United States, China, South Africa, Australia and India. Multinational coal mining corporations make up the majority of
S-74
Table of Contents
DBT’s customer base. In recent years, DBT’s large and efficient machines have enabled its customers to reduce their operating costs while enhancing their sophistication for the use and understanding of the employed technology. DBT’s largest customer, the Shenhua Group, accounted for approximately 14% of its sales in 2006.
Competitors
DBT is one of only two suppliers worldwide that offer complete system solutions to the underground mining industry (Joy Mining Machinery is the other). DBT’s business, like Bucyrus’, enjoys significant barriers to entry, some of which include large initial capital expenditures required for the machinery to produce the original equipment and replacement parts, the importance of establishing a large global presence and an active installed base to support aftermarket sales, and key patented proprietary technology essential to the productivity and efficiency of its machines.
DBT is now facing increased competition from manufacturers in low cost regions such as China. For example, the Shenhua Group, which is the largest customer for mining equipment in China and was DBT’s largest customer in 2006, has announced its intention to manufacture and purchase roof supports through a Chinese joint venture partner in which Shenhua owns an ownership interest. To better compete in these low-cost regions, DBT has built two manufacturing facilities in China and plans on further expansion in the future. DBT’s other original equipment competitors in other parts of the world are small, regional manufacturers that serve only those regions where they are located. Overall, the market share of these companies is minimal and insignificant.
Competition in parts sales consists primarily of independent firms called “will-fitters,” which produce copies of the parts manufactured by DBT and other original equipment manufacturers. Copies produced by “will-fitters” are generally sold at lower prices, and are generally acknowledged to be of lower quality.
Marketing, Distribution and Sales
Both Bucyrus’ and DBT’s original equipment and aftermarket parts and services are primarily sold directly by its personnel both in the United States and in foreign markets. Sales outside the United States are made through our sales offices located in Australia, Brazil, Canada, Chile, China, England, Germany, India, Mexico, Peru, Russia and South Africa and, in some markets, by our independent sales representatives. Both Bucyrus and DBT typically require a down payment when an agreement is reached for a new machine, and customers then make progress payments throughout the construction of the machine. Lead times for Bucyrus’ large machines generally vary from four to nine months, but a dragline’s lead time can be more than two years. Lead times for DBT’s large machines generally approximate nine months, but a roof support system’s lead time may be 12 months. In addition, Bucyrus’ and DBT’s replacement part sales call for prices in effect at the time of order.
Foreign Operations
We now have manufacturing facilities in Australia, China, Germany, Poland and the United States and service and sales centers in Australia, Brazil, Canada, China, England, India, Mexico, Peru, Russia, South Africa, the United States and Vietnam. Additionally, we employ direct marketing strategies in these markets as well as developing markets such as Indonesia, Jordan, Mauritania and Turkey. A substantial portion of our sales and operating earnings is attributable to operations located outside the United States.
Original equipment sales in foreign markets are supported by our network of foreign subsidiaries and overseas offices that directly market our products and provide ongoing services and replacement parts for original equipment installed abroad. We believe that the availability and convenience of the services provided through our network ensure the efficient operation of our original equipment by our customers, promote higher gross margin aftermarket sales of parts and services, and provide us with a local presence to promote original equipment orders.
We sell most of our surface mining original equipment, including those sold directly to foreign customers, in United States dollars, and we sell most of our underground mining original equipment in either United States
S-75
Table of Contents
dollars or the Euro. We sell most of our underground mining aftermarket parts in either United States dollars or the Euro, also with limited aftermarket parts sales denominated in the local currencies of various foreign markets. We sell most of our surface mining aftermarket parts in United States dollars, with limited aftermarket parts sales denominated, in the local currencies of Australia, Brazil, Canada, South Africa and the United Kingdom. Both surface mining and underground mining aftermarket services are paid primarily in local currency, with a natural partial currency hedge through payment for local labor in local currency. The value, in United States dollars, of Bucyrus’ and DBT’s investments in our foreign subsidiaries and of dividends paid to us by those subsidiaries will be affected by changes in exchange rates. We enter into currency hedges to help mitigate currency exchange risks.
Raw Materials and Supplies
We purchase from outside suppliers raw materials, principally structural steel, castings and forgings required for our manufacturing operations, and other items, such as electrical equipment and, for our underground mining business, roof support components, that are incorporated directly into the end product. Our foreign subsidiaries purchase components and manufacturing services both from local suppliers and from us. Certain additional components are sometimes purchased from suppliers, either to expedite delivery schedules in times of high demand or to reduce costs. Moreover, in countries where local content requirements exist, local subcontractors can occasionally be used to manufacture the required components.
Manufacturing
The design, engineering and manufacturing of most of Bucyrus’ original equipment and manufactured aftermarket parts is done at our South Milwaukee, Wisconsin complex. We are in the process of completing the third phase of expansion at our South Milwaukee manufacturing facilities. DBT’s manufacturing is run parallel to its regional divisions (Europe/Asia, Americas and Australia/Southern Africa) through its global production center. The global production center coordinates DBT’s manufacturing processes worldwide, with all longwall mining equipment being produced in Germany and most of the room and pillar equipment being manufactured in the United States.
Employees
After giving effect to the DBT Acquisition, we employed approximately 6,000 persons. As of December 31, 2006, approximately 415 of Bucyrus’ employees in the United States were unionized, and DBT had union contracts in place covering approximately 1,400 employees. DBT’s workforce at all facilities in Germany, the UK, Australia and South Africa, as well as at the Pulaski plant in the United States, is unionized.
S-76
Table of Contents
Our executive officers and directors, their positions and ages as of May 1, 2007 are as follows:
Name | Age | Title | ||
Timothy W. Sullivan | 53 | President, Chief Executive Officer and Director | ||
Craig R. Mackus | 55 | Chief Financial Officer and Secretary | ||
Kenneth W. Krueger | 50 | Chief Operating Officer | ||
John F. Bosbous | 54 | Treasurer | ||
Theodore C. Rogers | 72 | Chairman of the Board of Directors | ||
Robert L. Purdum | 71 | Director | ||
Edward G. Nelson | 75 | Director | ||
Robert C. Scharp | 60 | Director | ||
Ronald A. Crutcher | 60 | Director | ||
Robert W. Korthals | 73 | Director | ||
Gene E. Little | 63 | Director | ||
Paul W. Jones | 58 | Director |
Timothy W. Sullivan—Mr. Sullivan became our president and chief executive officer in March 2004 and was previously our president and chief operating officer from August 2000 to March 2004. Mr. Sullivan rejoined us in January 2000 as executive vice president. From January 1999 through December 1999, Mr. Sullivan served as president and chief executive officer of United Container Machinery, Inc. From June 1998 through December 1998, Mr. Sullivan was our executive vice president-marketing and from April 1995 through May 1998 was our vice president-marketing and sales. Mr. Sullivan is also a director of Foundations Bank, Pewaukee, Wisconsin (a privately-held community bank). Mr. Sullivan has been a director since 2000.
Craig R. Mackus—Mr. Mackus became our chief financial officer in June 2004 after serving as vice president-finance from October 2002 through June 2004 and as controller from February 1988 through May 2006. He has served as our secretary since May 1996. Mr. Mackus was our division controller and assistant corporate controller from 1985 to 1988, our manager of corporate accounting from 1981 to 1982 and 1984 to 1985, and assistant corporate controller of Western Gear Corporation from 1982 to 1984.
Kenneth W. Krueger—Mr. Krueger joined us as executive vice president in December 2005 and was promoted to chief operating officer in May 2006. Mr. Krueger held the position of senior vice president and chief financial officer with A.O. Smith Corporation, a diversified manufacturer of electrical and water products for residential, commercial and industrial customers, from August 2000 to June 2005. Mr. Krueger held various senior management positions at Eaton Corporation from July 1999 to July 2000 and Rockwell Automation from October 1983 to June 1999. He is also a director of Manitowoc Company, Inc.
John F. Bosbous—Mr. Bosbous has served as our treasurer since March 1998. Mr. Bosbous was assistant treasurer from 1988 to 1998, and assistant to the treasurer from August 1984 to February 1988.
Theodore C. Rogers—Mr. Rogers has been a director since 1997 and chairman of our board of directors since March 2004. Mr. Rogers served as our chief executive officer from December 1999 to March 2004. Mr. Rogers also served as our president from December 1999 to August 2000. Mr. Rogers co-founded American Industrial Partners and has been an officer and director of the firm since 1988. Mr. Rogers was president, chairman, chief executive officer and chief operating officer of NL Industries (a diversified industrial concern) from 1980 to 1987. He is also a director of Central Industrial Supply, Inc. and Great Lakes Carbon LLC.
Robert L. Purdum—Mr. Purdum has been a director since 1997 and is currently a non-voting member of our board’s Compensation Committee. Mr. Purdum was the non-executive chairman of our board from 1997 to March 2004. Mr. Purdum has been a director and a partner of American Industrial Partners since 1996. From November
S-77
Table of Contents
1990 to 1996, Mr. Purdum was chairman and chief executive officer of Armco, Inc. Mr. Purdum retired as Chairman of Armco, Inc. in 1996. Mr. Purdum is also a director of Freedom Bank-Bradenton, FL.
Edward G. Nelson—Mr. Nelson has been a director since 2004. Mr. Nelson is the chairman of our board’s Nominating and Corporate Governance Committee and a member of the Compensation Committee. Mr. Nelson formed Nelson Capital Corp. (a merchant banking firm) in 1985, and has served as its president and chairman of the board since its organization. Mr. Nelson serves as a director of Ohio Star Forge, Inc. and Central Parking Corporation. Mr. Nelson also serves as a trustee of Vanderbilt University and is Honorary Consul General of Japan.
Robert C. Scharp—Mr. Scharp has been a director since July 2005 and is currently a member of our board’s Nominating and Corporate Governance Committee. Mr. Scharp has been chairman of the Mining Advisory Council of Shell Canada Ltd., a large integrated oil company, which reviews all aspects of Shell’s oil sands mining operations in Alberta, Canada since 2003. Mr. Scharp serves as a director of Foundation Coal Holdings, Inc. From early 2002 to March 2003, Mr. Scharp was a director of Horizon Natural Resources. From 1997 to 2001, he was the Chief Executive Officer of Shell Coal Pty. Ltd., which became Anglo Coal Australia Pty. Ltd. Mr. Scharp held various positions with Kerr-McGee from 1975 to 1997.
Ronald A. Crutcher—Dr. Crutcher has been a director since 2004 and is a member of our board’s Audit Committee and the Compensation Committee. Dr. Crutcher has been president of Wheaton College, a private, national liberal arts college, in Norton, Massachusetts, since 2004. From 1999 to 2004, Dr. Crutcher served as provost and executive vice president for academic affairs of Miami University, a public university in Ohio, and from 1994 to 1999 he served as director of the School of Music and the Florence Thelma Hall Centennial Chair in Music at the University of Texas at Austin. He also was vice president of academic affairs and dean of the conservatory at the Cleveland Institute of Music from 1990 to 1994.
Robert W. Korthals—Mr. Korthals has been a director since 2004 and is the chairman of our board’s Compensation Committee and a member of the Audit Committee. Mr. Korthals has been the non-executive chairman of Cadillac Fairview Corporation, a wholly owned subsidiary of the Ontario Teachers’ Pension Plan Board since 1997 and is a director of Cognos Inc., easyhome Ltd., Great Lakes Carbon Income Trust, Mulvihull Exchange Traded Closed End Funds and Jannock Properties Ltd. Mr. Korthals joined the Toronto Dominion Bank in 1967, was appointed president in 1981 and served in that capacity until 1995.
Gene E. Little—Mr. Little has been a director since 2004. Mr. Little is the chairman of our board’s Audit Committee and a member of the Nominating and Corporate Governance Committee. Mr. Little is a director and audit and compensation committee member of Great Lakes Carbon LLC, and a director and member of the audit committee of Huntington Bancshares Incorporated. In 2003, Mr. Little became a director and finance committee member of Walsh University, a private university in Ohio. Mr. Little held various positions with The Timken Company (a global manufacturer of highly engineered bearings, alloy and specialty steel and related components) from 1967 to 2002 and most recently served as its senior vice president finance (the chief financial officer) from 1992 to 2002.
Paul W. Jones—Mr. Jones has been a director since July 2006 and is a member of our board’s Compensation Committee. Mr. Jones has been the chairman of the board, president and chief executive officer of A. O. Smith Corporation, a diversified manufacturer of electrical and water products for residential, commercial and industrial customers, since 2005. Mr. Jones was president and chief operating officer of A. O. Smith Corporation from 2004 to 2005. Prior to joining A. O. Smith Corporation, Mr. Jones was chairman and chief executive officer of U.S. Can Company, Inc., a leading provider of containers for personal care, household, industrial and specialty products, from 1998 to 2002. Mr. Jones was previously president and chief executive officer of Greenfield Industries, Inc. from 1993 to 1998 and president from 1989 to 1992. Mr. Jones is a director of Federal Signal Corporation.
S-78
Table of Contents
The following description of our capital stock does not purport to be complete and is subject to, and is qualified by, our amended and restated certificate of incorporation, or certificate of incorporation, and our amended and restated bylaws, or bylaws, which are filed as exhibits to the registration statement of which this prospectus supplement is a part.
General
As of March 31, 2007, there were approximately 24 holders of record of our common stock. There are no shares of Class B common stock or preferred stock outstanding. Our authorized capital stock consists of:
| • | 75 million shares of Class A common stock, par value $.01 per share; |
| • | 25 million shares of Class B common stock, par value $.01 per share; and |
| • | 10 million shares of preferred stock, par value $.01 per share. |
After this offering there will be 36,696,665 shares of common stock outstanding, excluding the underwriters’ option to purchase additional shares and including the 471,476 shares of our common stock issued to RAG Coal as partial consideration to consummate the DBT Acquisition. We are not authorized to issue additional shares of Class B common stock.
Common Stock
Voting Rights
The holders of our common stock are entitled to one vote per share. The affirmative vote of 80% of the total votes entitled to be cast by the holders of our common stock, is required in order to amend the provisions of our certificate of incorporation relating to: (1) the composition of our board of directors, or board, and the election of directors; (2) calling and holding meetings of our stockholders; (3) procedures for amending our bylaws; and (4) circumstances in which the vote of a supermajority of our stockholders is necessary in order for action to be taken. The affirmative vote of a majority of the total votes entitled to be cast by the holders of our common stock is required to amend the provisions of our certificate of incorporation relating to other matters, or to approve a merger, share exchange, sale of all of our property or our dissolution. Directors are elected by a plurality of the votes cast by the holders of common stock present in person or represented by proxy at a meeting at which a quorum is present. Except as otherwise provided in our certificate of incorporation, all other matters to be voted on by stockholders must be approved by a majority of the votes cast on the matter by the holders of common stock present in person or represented by proxy, at a meeting at which a quorum is present, subject to any voting rights granted to holders of any outstanding shares of preferred stock. Holders of our common stock will not have the right to cumulate votes in elections of directors.
Rights on Liquidation; No Pre-emptive Rights
In the event of our liquidation, dissolution or winding up, holders of our common stock will be entitled to their proportionate share of any assets in accordance with each holder’s holdings remaining after payment of liabilities and any amounts due to other claimants, including the holders of any outstanding shares of preferred stock. Holders of our common stock have no preemptive rights and no right to convert or exchange their common stock into any other securities. Redemption or sinking fund provisions do not apply to our common stock. All outstanding shares of common stock are, and all shares of common stock to be outstanding upon completion of this offering will be, fully paid and non-assessable.
Right to Receive Dividends
Holders of our common stock will share equally on a per share basis in any dividend declared by our board, subject to any preferential rights of holders of any outstanding shares of preferred stock.
S-79
Table of Contents
Preferred Stock
Our certificate of incorporation authorizes our board, without stockholder approval, to issue up to 10 million shares of preferred stock in one or more series and to fix the rights, preferences, privileges and restrictions granted to or imposed upon the preferred stock, including voting rights, dividend rights, conversion rights, terms of redemption, liquidation preference, sinking fund terms, subscription rights and the number of shares constituting any series or the designation of a series. Our board can issue preferred stock with voting and conversion rights that could adversely affect the voting power of the holders of common stock, without stockholder approval. No shares of preferred stock are currently outstanding and we have no present plan to issue any shares of preferred stock.
Classified Board of Directors
Our certificate of incorporation provides for our board to be divided into three classes of directors, as nearly equal in number as possible, serving staggered terms. Approximately one-third of our board is elected each year. Directors serving on our board can only be removed for cause.
The provision for a classified board could prevent a party that acquires control of a majority of the voting power of our outstanding stock from obtaining control of our board until the second annual stockholders meeting following the date the acquiror obtains the controlling interest. The classified board provision could have the effect of discouraging a potential acquiror from making a tender offer for our shares or otherwise attempting to obtain control of us and could increase the likelihood that our incumbent directors will retain their positions.
We believe that a classified board helps to assure the continuity and stability of our board and our business strategies and policies as determined by our board, because a majority of the directors at any given time will have prior experience on our board. If our board is confronted with an unsolicited proposal from a third party that has acquired a block of our voting stock, then the classified board provision should also help to ensure that our board will have sufficient time to review the proposal and appropriate alternatives and to seek the best available result that is believed to be in our stockholders best interests.
Business Combinations
We are governed by Section 203 of the General Corporation Law of the State of Delaware. Section 203, subject to certain exceptions, prohibits a Delaware corporation from engaging in any business combination with any interested stockholder for a period of three years following the time that the stockholder became an interested stockholder, unless:
| • | prior to such time, the board of directors of the corporation approved either the business combination or the transaction which resulted in the stockholder becoming an interested stockholder; |
| • | upon consummation of the transaction that resulted in the stockholder becoming an interested stockholder, the interested stockholder owned at least 85% of the voting stock of the corporation outstanding at the time the transaction commenced, excluding specified shares; or |
| • | at or subsequent to such time, the business combination is approved by the board of directors and authorized at an annual or special meeting of stockholders, and not by written consent, by the affirmative vote of at least 66% of the outstanding voting stock that is not owned by the interested stockholder. |
The application of Section 203 may limit the ability of stockholders to approve a transaction that they may deem to be in their best interests.
In general, Section 203 defines “business combination” to include:
| • | any merger or consolidation involving the corporation and the interested stockholder; |
S-80
Table of Contents
| • | any sale, lease, exchange, mortgage, pledge, transfer or other disposition of 10% or more of the assets of the corporation to or with the interested stockholder; |
| • | subject to certain exceptions, any transaction which results in the issuance or transfer by the corporation of any stock of the corporation to the interested stockholder; |
| • | any transaction involving the corporation which has the effect of increasing the proportionate share of the stock of any class or series of the corporation beneficially owned by the interested stockholder; or |
| • | the receipt by the interested stockholder of the benefit of any loans, advances, guarantees, pledges or other financial benefits provided by or through the corporation. |
In general, Section 203 defines an “interested stockholder” as any person that is:
| • | the owner of 15% or more of the outstanding voting stock of the corporation; |
| • | an affiliate or associate of the corporation and was the owner of 15% or more of the outstanding voting stock of the corporation at any time within three years immediately prior to the relevant date; and |
| • | the affiliates and associates of the above. |
Under specific circumstances, Section 203 makes it more difficult for an “interested stockholder” to effect various business combinations with a corporation for a three-year period, although the stockholders may, by adopting an amendment to the corporation’s certificate of incorporation or bylaws, elect not to be governed by this section, effective 12 months after adoption.
Our certificate of incorporation and bylaws do not exclude us from the restrictions imposed under Section 203. We anticipate that the provisions of Section 203 may encourage companies interested in acquiring us to negotiate in advance with our board of directors since the stockholder approval requirement would be avoided if a majority of the directors then in office approve either the business combination or the transaction that resulted in the stockholder becoming an interested stockholder.
Number of Directors; Removal; Vacancies
Our bylaws provide that the board shall fix the number of directorships. We currently have nine directors serving on the board and our board is divided into three staggered classes, with three directors serving in each class.
Pursuant to our certificate of incorporation and bylaws, each director serves until the next annual meeting for the year in which his or her term expires and until his or her successor is duly elected and qualified, or until his or her earlier death, resignation or removal. Directors may be removed from office only for cause and by the affirmative vote of holders of at least a majority of the voting power of all issued and outstanding capital stock.
Our certificate of incorporation further provides that vacancies resulting from newly created directorships in our board may only be filled by a majority of our board, provided that a quorum is present. Any other vacancy may be filled by a majority of our board, even if less than a quorum is present. Any interim director chosen by the board will hold office in the class for which such director was chosen until the next election.
Stockholder Action; Special Meetings
Our certificate of incorporation provides that stockholder action can be taken at an annual or special meeting of stockholders, and that holders of our common stock do not have the right to act by written consent. Except as otherwise required by law, special meetings of the stockholders can only be called pursuant to a notice given by or at the direction of the chairman of our board, our president or our secretary at the written request of our board or a committee of our board.
S-81
Table of Contents
Stockholder Proposals
At our annual meeting of stockholders, only business that is properly brought before the meeting will be conducted or considered. To be properly brought before our annual meeting of stockholders, business must be specified in the notice of the meeting (or any supplement to that notice), brought before the meeting by or at the direction of the directors (or any duly authorized committee of the board), or properly brought before the meeting by a stockholder. To properly nominate a director, a stockholder must:
| • | be a stockholder of record on the date of the giving of the notice for the meeting; |
| • | be entitled to vote at the meeting; and |
| • | have given timely written notice of the business to our secretary. |
To be timely, a stockholder’s notice must be received by our principal executive offices not less than 90 nor more than 120 days prior to the anniversary date of the immediately preceding annual meeting, provided, however, in the event that the annual meeting is not within 30 days of such anniversary date, timely notice by the stockholder must be received by the close of business on the tenth day following the day on which such notice of the date of the annual meeting was mailed or such public disclosure of the date of the annual meeting was made, whichever first occurs.
A stockholder’s notice must set forth, among other things, as to each matter the stockholder proposes to bring before the meeting:
| • | a brief description of the business proposed to be brought before the meeting and the reason for conducting such business; |
| • | the name and record address of such stockholder; |
| • | the class or series and number of shares that are owned of record or beneficially by the stockholder; |
| • | a description of all arrangements or understandings between such stockholder and any other person or persons (including their names) in connection with the proposal of such business by such stockholder and any material interest of such stockholder in such business; and |
| • | a representation that such stockholder intends to appear in person or by proxy at the meeting to bring such business before the meeting. |
Similarly, at a special meeting of stockholders, only such business as is properly brought before the meeting will be conducted or considered. To be properly brought before a special meeting, business must be specified in the notice of the meeting (or any supplement to that notice) given by or at the direction of the chairman of our board, our president or our secretary at the written request of our board or a committee of our board.
Nomination of Candidates for Election to Our Board
Under our bylaws, only persons that are properly nominated will be eligible for election to be members of our board. To be properly nominated, a director candidate must be nominated at an annual meeting of the stockholders or at any special meeting of stockholders called for the purpose of electing directors by or at the direction of our board or a committee of our board, or properly nominated by a stockholder. To properly nominate a director, a stockholder must:
| • | be a stockholder of record on the date of the giving of the notice for the meeting; |
| • | be entitled to vote at the meeting; and |
| • | have given timely written notice of the business to our secretary. |
S-82
Table of Contents
To be timely, a stockholder’s notice must be delivered to or mailed and received at our principal executive offices (1) not less than 90 nor more than 120 days prior to the anniversary date of the immediately preceding annual meeting, provided, however, in the event that the annual meeting is not within 30 days prior or subsequent to such anniversary date, notice by the stockholder to be timely must be so received not later than the close of business on the tenth day following the day on which such notice of the date of the annual meeting was mailed or such public disclosure of the date of the annual meeting was made, whichever first occurs; and (2) in the case of a special meeting no later than the close of business on the tenth day following the day on which notice of the date of the special meeting was mailed or public disclosure of the date of the annual meeting was made, whichever first occurs.
Amendment of Bylaws
Except as otherwise provided by law, our certificate of incorporation or our bylaws, our bylaws may be amended, altered or repealed at a meeting of the stockholders provided that notice of such amendment, alteration or repeal is contained in the notice of such meeting or a meeting of our board of directors.
All such amendments must be approved by either the holders of 80% of the voting power of common stock or by a majority of the entire board of directors then in office.
Transfer Agent and Registrar
LaSalle Bank N.A. is the transfer agent and registrar for our common stock.
Listing
Our common stock is listed on The NASDAQ Global Select Market under the symbol “BUCY.”
S-83
Table of Contents
CERTAIN MATERIAL U.S. FEDERAL TAX CONSEQUENCES FOR NON-U.S. HOLDERS
The following discussion is a summary of certain United States federal income and estate tax consequences relevant to non-U.S. holders (defined below) with respect to the purchase, ownership and disposition of our common stock. This discussion is based upon the Internal Revenue Code of 1986, as amended, United States Treasury Regulations, or the Treasury Regulations, Internal Revenue Service, or IRS, rulings, and administrative and judicial decisions currently in effect, all of which are subject to change (possibly with retroactive effect) or possible differing interpretations. This discussion is for general information only and is not tax advice. Accordingly, all prospective non-U.S. holders of our common stock should consult their own tax advisors with respect to the United States federal, state, local and non-U.S. tax consequences of an investment in our common stock. No assurance exists that the IRS will not challenge any of the tax consequences described herein, and we have not obtained, nor do we intend to obtain, an opinion of counsel with respect to the United States federal income or estate tax consequences to a non-U.S. holder of our common stock.
This discussion is limited to the tax consequences to those non-U.S. holders who hold our common stock as capital assets (generally, for investment purposes). This discussion does not purport to deal with persons in special tax situations, such as financial institutions, regulated investment companies, real estate investment trusts, tax-exempt organizations, dealers in securities or currencies, traders in securities that elect to mark to market, “controlled foreign corporations,” “passive foreign investment companies,” corporations that accumulate earnings to avoid federal income tax, persons holding shares of our common stock as a hedge against currency risk or as a position in a “straddle” or conversion transaction or persons subject to the alternative minimum tax. This discussion does not address the tax consequences to partnerships or other pass-through entities or persons investing through such partnerships or entities. Also, this discussion does not address all aspects of United States federal income and estate taxation that may be relevant to a particular non-U.S. holder in light of that non-U.S. holder’s individual circumstances nor does it address any aspects of United States state, local, or non-U.S. taxes.
For purposes of this discussion, a “non-U.S. holder” means a beneficial owner of our common stock that is not, for United States federal income tax purposes, (1) a citizen or individual resident of the United States, (2) a corporation (or other entity taxed as a corporation for United States federal income tax purposes) created or organized in the United States or under the laws of the United States, any state thereof or the District of Columbia, (3) an estate the income of which is subject to United States federal income taxation regardless of its source, or (4) a trust whose administration is subject to the primary supervision of a court within the United States and which has one or more United States persons with the authority to control all substantial decisions of the trust or a trust that was in existence on August 20, 1996 that has elected to be treated as a “United States person” (as defined for federal income tax purposes).
If a partnership holds common stock, the tax treatment of a partner will generally depend upon the status of the partner and the activities of the partnership. A partner of a partnership holding our common stock is urged to consult its tax advisors.
PROSPECTIVE INVESTORS CONSIDERING THE PURCHASE OF OUR COMMON STOCK SHOULD CONSULT THEIR TAX ADVISORS CONCERNING THE APPLICATION OF UNITED STATES FEDERAL TAX LAWS TO THEIR PARTICULAR SITUATIONS AS WELL AS ANY CONSEQUENCES ARISING UNDER THE LAWS OF ANY OTHER TAXING JURISDICTION.
Distributions and Dividends
Generally, distributions paid to a non-U.S. holder with respect to our common stock will constitute dividends for United States federal income tax purposes to the extent paid from our current or accumulated earnings and profits, as determined under United States federal income tax principles. If a distribution exceeds our current and accumulated earnings and profits, the excess will be treated as a tax-free return of the non-U.S. holder’s investment, up to such holder’s tax basis in the common stock. Any remaining excess will be treated as capital gain, subject to the tax treatment described below in “Sale, Exchange or Other Taxable Disposition.”
S-84
Table of Contents
Dividends paid to a non-U.S. holder will be subject to a 30% U.S. withholding tax, unless (i) a lower rate is specified by an applicable income tax treaty and the non-U.S. holder provides proper documentation certifying eligibility for treaty benefits (e.g., on an IRS Form W-8BEN or applicable substitute form) or (ii) such dividends are effectively connected with a trade or business carried on by the non-U.S. holder within the United States and the non-U.S. holder provides an IRS Form W-8ECI or applicable substitute form. Dividends effectively connected with such trade or business, and, if a treaty applies, attributable to a permanent establishment or fixed base maintained by such non-U.S. holder in the United States will be subject to regular United States federal income tax on the dividends in the same manner as if the non-U.S. holder were a U.S. person. If dividends are effectively connected with a trade or business of a non-U.S. holder that is a corporation, such corporate non-U.S. holder may be subject to a “branch profits tax” at a 30% rate (or such lower rate as may be specified by an applicable income tax treaty) subject to certain adjustments.
Sale, Exchange or Other Taxable Disposition
A non-U.S. holder generally will not be subject to United States federal income or withholding tax on gain realized on the sale, exchange or other taxable disposition of our common stock so long as:
| • | the gain is not effectively connected with a trade or business carried on by the non-U.S. holder within the United States (or, if an income tax treaty applies, the gain is not attributable to a U.S. permanent establishment or fixed base maintained by such non-U.S. holder in the United States); |
| • | in the case of a non-U.S. holder that is an individual, such holder is not present in the United States for 183 or more days in the taxable year of the sale or disposition; and |
| • | we are not and have not been a United States real property holding corporation for U.S. income tax purposes at any time during the five-year period preceding such sale or other disposition. |
We believe that we have not been and are not currently a United States real property holding corporation, and we do not expect to become one in the future based on anticipated business operations, however, no assurances can be provided in this regard.
United States Federal Estate Tax
Shares of our common stock that are owned or treated as owned by an individual non-U.S. holder at the time of death will be included in the individual’s gross estate for United States federal estate tax purposes, and therefore may be subject to United States federal estate tax, unless an applicable estate tax or other treaty provides otherwise.
Information Reporting and Backup Withholding on Non-U.S. Holders
We must report annually to the IRS and to each non-U.S. holder the amount of dividends paid to such holder and the tax withheld with respect to such dividends, regardless of whether withholding was required. Copies of the information returns reporting such dividends and withholding may also be made available under the provisions of an applicable income tax treaty or agreement to the tax authorities in the country in which the non-U.S. holder resides. United States backup withholding (currently at a rate of 28%) generally will apply on payment of dividends to a non-U.S. holder unless such non-U.S. holder furnishes to the payor an IRS Form W-8BEN (or other applicable form), or otherwise establishes an exemption.
Payment by a U.S. office of a broker of the proceeds of a sale of our common stock is subject to both backup withholding and information reporting unless the non-U.S. holder, or beneficial owner thereof, as applicable, certifies that it is a non-U.S. holder on IRS Form W-8BEN, or otherwise establishes an exemption. Payments of the proceeds from the sale by a non-U.S. holder of our common stock made to or through a foreign office of a broker generally will not be subject to information reporting or backup withholding. However,
S-85
Table of Contents
information reporting requirements (but not backup withholding) generally will apply to a payment made outside the United States of the proceeds of a sale of our common stock through an office outside the United States of a broker (i) that is a U.S. person, (ii) 50% or more of the gross income of which for a specified three-year period is effectively connected with the conduct of a trade or business in the United States, (iii) that is a “controlled foreign corporation,” or (iv) that is a foreign partnership, if at any time during its tax year, one or more of its partners are U.S. persons (as defined in Treasury Regulations) who in the aggregate hold more than 50% of the income or capital interest in the partnership or if, at any time during its tax year, such foreign partnership is engaged in a U.S. trade or business, unless the broker has documentary evidence in its files that the holder or beneficial owner is a non-U.S. holder or the holder or beneficial owner otherwise establishes an exemption.
Backup withholding is not an additional tax. Any amount withheld under the backup withholding rules from a payment to a holder is allowable as a credit against such holder’s United States federal income tax, which may entitle the holder to a refund, provided that the holder timely provides the required information to the IRS.
Each prospective non-U.S. holder of our common stock should consult their tax advisor with respect to the federal, state, local and foreign tax consequences of the acquisition, ownership and disposition of our common stock.
S-86
Table of Contents
Lehman Brothers Inc. is acting as the representative of the underwriters and sole book-running manager of this offering. Under the terms of an underwriting agreement, which we will file as an exhibit to a Current Report on Form 8-K and incorporate by reference in this prospectus supplement and the accompanying prospectus, each of the underwriters named below has severally agreed to purchase from us the respective number of shares of common stock shown opposite its name below:
Underwriters | Number of Shares | |
Lehman Brothers Inc. | ||
J.P. Morgan Securities Inc. | ||
Stifel, Nicolaus & Company, Incorporated | ||
Total | ||
The underwriting agreement provides that the underwriters’ obligation to purchase shares of common stock depends on the satisfaction of the conditions contained in the underwriting agreement including:
| • | the obligation to purchase all of the shares of common stock offered hereby (other than those shares of common stock covered by their option to purchase additional shares as described below), if any of the shares are purchased; |
| • | the representations and warranties made by us to the underwriters are true; |
| • | there is no material change in our business or in the financial markets; and |
| • | we deliver customary closing documents to the underwriters. |
Commissions and Expenses
The following table summarizes the underwriting discounts and commissions we will pay to the underwriters. These amounts are shown assuming both no exercise and full exercise of the underwriters’ option to purchase additional shares. The underwriting fee is the difference between the initial price to the public and the amount the underwriters pay to us for the shares.
| No Exercise | Full Exercise | |||
Per share | ||||
Total | ||||
The representative of the underwriters has advised us that the underwriters propose to offer the shares of common stock directly to the public at the public offering price on the cover of this prospectus supplement and to selected dealers, which may include the underwriters, at such offering price less a selling concession not in excess of $ per share. After the offering, the representative may change the offering price and other selling terms.
The expenses of the offering that are payable by us are estimated to be approximately $850,000 (excluding underwriting discounts and commissions).
Option to Purchase Additional Shares
We have granted the underwriters an option exercisable for 30 days after the date of the underwriting agreement, to purchase, from time to time, in whole or in part, up to an aggregate of 692,100 shares at the public offering price less underwriting discounts and commissions. This option may be exercised if the underwriters sell more than 4,614,000 shares in connection with this offering. To the extent that this option is exercised, each
S-87
Table of Contents
underwriter will be obligated, subject to certain conditions, to purchase its pro rata portion of these additional shares based on the underwriter’s percentage underwriting commitment in the offering as indicated in the table at the beginning of this “Underwriting” section.
Lock-Up Agreements
We and all of our directors and executive officers have agreed that, subject to certain exceptions, without the prior written consent of Lehman Brothers Inc., we will not directly or indirectly (1) offer for sale, sell, pledge, or otherwise dispose of (or enter into any transaction or device that is designed to, or could be expected to, result in the disposition by any person at any time in the future of) any shares of common stock (including, without limitation, shares of common stock that may be deemed to be beneficially owned by us or them in accordance with the rules and regulations of the Securities and Exchange Commission, or SEC, and shares of common stock that may be issued upon exercise of any options) or securities convertible into or exercisable or exchangeable for common stock, (2) enter into any swap or other derivatives transaction that transfers to another, in whole or in part, any of the economic consequences of ownership of the common stock, (3) make any demand for or exercise any right or file or cause to be filed a registration statement, including any amendments thereto, with respect to the registration of any shares of common stock or securities convertible, exercisable or exchangeable into common stock or any of our other securities, or (4) publicly disclose the intention to do any of the foregoing for a period of 90 days after the date of this prospectus supplement. In addition, we have agreed not to waive any of our rights under the DBT Acquisition agreement with RAG Coal restricting RAG Coal’s ability to sell the shares of our common stock issued in the DBT Acquisition during the same 90-day period without the prior written consent of Lehman Brothers Inc.
Lehman Brothers Inc., in its sole discretion, may release the common stock and other securities subject to the lock-up agreements described above in whole or in part at any time with or without notice. When determining whether or not to release common stock and other securities from lock-up agreements, Lehman Brothers Inc. will consider, among other factors, the holder’s reasons for requesting the release, the number of shares of common stock and other securities for which the release is being requested and market conditions at the time.
Indemnification
We have agreed to indemnify the underwriters against certain liabilities, including liabilities under the Securities Act, and to contribute to payments that the underwriters may be required to make for these liabilities.
Stabilization, Short Positions and Penalty Bids
The representative may engage in stabilizing transactions, short sales and purchases to cover positions created by short sales, and penalty bids or purchases for the purpose of pegging, fixing or maintaining the price of the common stock, in accordance with Regulation M under the Securities Exchange Act of 1934:
| • | Stabilizing transactions permit bids to purchase the underlying security so long as the stabilizing bids do not exceed a specified maximum. |
| • | A short position involves a sale by the underwriters of shares in excess of the number of shares the underwriters are obligated to purchase in the offering, which creates the syndicate short position. This short position may be either a covered short position or a naked short position. In a covered short position, the number of shares involved in the sales made by the underwriters in excess of the number of shares they are obligated to purchase is not greater than the number of shares that they may purchase by exercising their option to purchase additional shares. In a naked short position, the number of shares involved is greater than the number of shares in their option to purchase additional shares. The underwriters may close out any short position by either exercising their option to purchase additional shares and/or purchasing shares in the open market. In determining the source of shares to close out the short position, the underwriters will consider, among other things, the price of shares available for |
S-88
Table of Contents
purchase in the open market as compared to the price at which they may purchase shares through their option to purchase additional shares. A naked short position is more likely to be created if the underwriters are concerned that there could be downward pressure on the price of the shares in the open market after pricing that could adversely affect investors who purchase in the offering. |
| • | Syndicate covering transactions involve purchases of the common stock in the open market after the distribution has been completed in order to cover syndicate short positions. |
| • | Penalty bids permit the representatives to reclaim a selling concession from a syndicate member when the common stock originally sold by the syndicate member is purchased in a stabilizing or syndicate covering transaction to cover syndicate short positions. |
These stabilizing transactions, syndicate covering transactions and penalty bids may have the effect of raising or maintaining the market price of our common stock or preventing or retarding a decline in the market price of the common stock. As a result, the price of the common stock may be higher than the price that might otherwise exist in the open market. These transactions may be effected on The NASDAQ Global Select Market or otherwise and, if commenced, may be discontinued at any time.
Neither we nor any of the underwriters make any representation or prediction as to the direction or magnitude of any effect that the transactions described above may have on the price of the common stock. In addition, neither we nor any of the underwriters make representation that the representative will engage in these stabilizing transactions or that any transaction, once commenced, will not be discontinued without notice.
Passive Market Making
In connection with the offering, underwriters and selling group members may engage in passive market making transactions in the common stock on The NASDAQ Global Select Market in accordance with Rule 103 of Regulation M under the Securities Exchange Act of 1934 during the period before the commencement of offers or sales of common stock and extending through the completion of distribution. A passive market maker must display its bids at a price not in excess of the highest independent bid of the security. However, if all independent bids are lowered below the passive market maker’s bid that bid must be lowered when specified purchase limits are exceeded.
Electronic Distribution
A prospectus in electronic format may be made available on the Internet sites or through other online services maintained by one or more of the underwriters and/or selling group members participating in this offering, or by their affiliates. In those cases, prospective investors may view offering terms online and, depending upon the particular underwriter or selling group member, prospective investors may be allowed to place orders online. The underwriters may agree with us to allocate a specific number of shares for sale to online brokerage account holders. Any such allocation for online distributions will be made by the representative on the same basis as other allocations.
Other than the prospectus in electronic format, the information on any underwriter’s or selling group member’s web site and any information contained in any other web site maintained by an underwriter or selling group member is not part of the prospectus or the registration statement of which this prospectus supplement and the accompanying prospectus forms a part, has not been approved and/or endorsed by us or any underwriter or selling group member in its capacity as underwriter or selling group member and should not be relied upon by investors.
Stamp Taxes
If you purchase shares of common stock offered in this prospectus supplement and the accompanying prospectus, you may be required to pay stamp taxes and other charges under the laws and practices of the country
S-89
Table of Contents
of purchase, in addition to the offering price listed on the cover page of this prospectus supplement and the accompanying prospectus.
Relationships
Certain of the underwriters and their related entities have engaged and may engage in commercial and investment banking transactions with us in the ordinary course of their business. They have received customary compensation and expenses for these commercial and investment banking transactions. Lehman Brothers Inc. acted as our financial advisor in connection with the DBT Acquisition. In addition, Lehman Brothers Inc. acted as sole lead arranger and sole book-runner, affiliates of Lehman Brothers Inc. acted as administrative agent, German agent and lenders, and an affiliate of J.P. Morgan Securities Inc. acted as co-syndication agent and lender, under our new credit facilities. Lehman Brothers Inc., its affiliates and an affiliate of J.P. Morgan Securities Inc. received customary fees for such services, and certain of their expenses were reimbursed. Because the net proceeds from this offering will be used to repay amounts outstanding under our credit facilities, affiliates of Lehman Brothers Inc. and J.P. Morgan Securities Inc., as lenders under our credit facilities, will receive substantially all of the proceeds from this offering.
Because of these relationships, this offering is being conducted in accordance with Rule 2710(h) of the National Association of Securities Dealers, or NASD. Because a bona fide independent market exists for our common stock, the NASD does not require that we use a qualified independent underwriter for this offering.
European Selling Restrictions
European Economic Area
In relation to each member state of the European Economic Area that has implemented the Prospectus Directive (each, a relevant member state), with effect from and including the date on which the Prospectus Directive is implemented in that relevant member state (the relevant implementation date), an offer of common stock described in this prospectus supplement may not be made to the public in that relevant member state prior to the publication of a prospectus in relation to the common stock that has been approved by the competent authority in that relevant member state or, where appropriate, approved in another relevant member state and notified to the competent authority in that relevant member state, all in accordance with the Prospectus Directive, except that, with effect from and including the relevant implementation date, an offer of common stock may be offered to the public in that relevant member state at any time:
| • | to any legal entity that is authorized or regulated to operate in the financial markets or, if not so authorized or regulated, whose corporate purpose is solely to invest in securities or |
| • | to any legal entity that has two or more of (1) an average of at least 250 employees during the last financial year; (2) a total balance sheet of more than €43,000,000 and (3) an annual net turnover of more than €50,000,000, as shown in its last annual or consolidated accounts or |
| • | in any other circumstances that do not require the publication of a prospectus pursuant to Article 3 of the Prospectus Directive. |
Each purchaser of common stock described in this prospectus supplement located within a relevant member state will be deemed to have represented, acknowledged and agreed that it is a “qualified investor” within the meaning of Article 2(1)(e) of the Prospectus Directive.
For purposes of this provision, the expression an “offer to the public” in any relevant member state means the communication in any form and by any means of sufficient information on the terms of the offer and the common stock to be offered so as to enable an investor to decide to purchase or subscribe for the common stock, as the expression may be varied in that member state by any measure implementing the Prospectus Directive in that member state, and the expression “Prospectus Directive” means Directive 2003/71/EC and includes any relevant implementing measure in each relevant member state.
S-90
Table of Contents
The sellers of the common stock have not authorized and do not authorize the making of any offer of common stock through any financial intermediary on their behalf, other than offers made by the underwriters with a view to the final placement of the common stock as contemplated in this prospectus supplement. Accordingly, no purchaser of the common stock, other than the underwriters, is authorized to make any further offer of the common stock on behalf of the sellers or the underwriters.
United Kingdom
This prospectus supplement is only being distributed to, and is only directed at, persons in the United Kingdom that are qualified investors within the meaning of Article 2(1)(e) of the Prospectus Directive (“Qualified Investors”) that are also (i) investment professionals falling within Article 19(5) of the Financial Services and Markets Act 2000 (Financial Promotion) Order 2005 (the “Order”) or (ii) high net worth entities, and other persons to whom it may lawfully be communicated, falling within Article 49(2)(a) to (d) of the Order (all such persons together being referred to as “relevant persons”). This prospectus supplement and its contents are confidential and should not be distributed, published or reproduced (in whole or in part) or disclosed by recipients to any other persons in the United Kingdom. Any person in the United Kingdom that is not a relevant persons should not act or rely on this document or any of its contents.
S-91
Table of Contents
The validity of the shares of common stock to be sold pursuant to this prospectus supplement will be passed upon for us by Foley & Lardner LLP, Milwaukee, Wisconsin. Certain legal matters in connection with this offering will be passed upon for the underwriters by Latham & Watkins LLP, New York, New York.
INCORPORATION OF DOCUMENTS BY REFERENCE
We are “incorporating by reference” specified documents that we file with the SEC, which means:
| • | incorporated documents are considered part of this prospectus supplement; |
| • | we are disclosing important information to you by referring you to those documents; and |
| • | information we file with the SEC will automatically update and supersede information contained in this prospectus supplement. |
We incorporate by reference the documents listed below and any future filings we make with the SEC under Sections 13(a), 13(c), 14 or 15(d) of the Exchange Act after the date of this prospectus supplement and before the end of the offering of our common stock pursuant to this prospectus supplement:
| • | our Annual Report on Form 10-K for our year ended December 31, 2006; |
| • | our Current Reports on Form 8-K filed February 16, 2007, February 22, 2007, March 2, 2007, April 27, 2007 and May 2, 2007; and |
| • | that portion of our Registration Statement on Form S-1 (Registration Statement No. 333-120003), filed October 27, 2004, that describes our common stock, and any further amendment or report updating that description. |
Information in this prospectus supplement supersedes related information in the documents listed above, and information in subsequently filed documents supersedes related information in this prospectus supplement, the accompanying prospectus and the incorporated documents.
We will promptly provide, without charge to you, upon written or oral request, a copy of any or all of the documents incorporated by reference in this prospectus supplement, other than exhibits to those documents, unless the exhibits are specifically incorporated by reference in those documents. Requests should be directed to:
Investor Relations
Bucyrus International, Inc.
P.O. Box 500
1100 Milwaukee Avenue
South Milwaukee, Wisconsin 53172
(414) 768-4000
S-92
Table of Contents
WHERE YOU CAN FIND MORE INFORMATION
We file annual, quarterly and current reports and other information with the SEC. We have also filed a registration statement on Form S-3, including exhibits and schedules, under the Securities Act of 1933 with respect to the common stock offered by this prospectus supplement. This prospectus supplement is part of that registration statement, but does not contain all of the information included in the registration statement or the exhibits and schedules. You may read and copy the registration statement and any reports, statements or other information filed by us with the SEC at the SEC’s public reference facility at Room 1580, 100 F Street, N.E., Washington, D.C. 20549.
You may obtain information on the operation of the public reference room by calling the SEC at 1-800-SEC-0330. The SEC also maintains an Internet site at http://www.sec.gov that contains reports and other information regarding issuers like us that file electronically with the SEC. You may also obtain copies of these materials through our Internet site, http://www.bucyrus.com/invest.jsp. We are not including the information contained on our Internet site as a part of, or incorporating it by reference into, this prospectus supplement.
Our common stock is listed on The NASDAQ Global Select Market under the symbol “BUCY,” and reports and other information concerning us can be inspected at The NASDAQ Global Select Market located at One Liberty Plaza, 165 Broadway, New York, New York 10006.
S-93
Table of Contents
| Page Number | ||
Bucyrus International, Inc. Audited Financial Statements | ||
| F-2 | ||
Consolidated Statements of Earnings for the years ended December 31, 2006, 2005 and 2004 | F-3 | |
Consolidated Statements of Comprehensive Income for the years ended December 31, 2006, 2005 and 2004 | F-4 | |
Consolidated Balance Sheets as of December 31, 2006 and 2005 | F-5 | |
| F-6 | ||
Consolidated Statements of Cash Flows for the years ended December 31, 2006, 2005 and 2004 | F-7 | |
Notes to Consolidated Financial Statements for the years ended December 31, 2006, 2005 and 2004 | F-8 | |
DBT GmbH Audited Financial Statements | ||
| F-32 | ||
| F-33 | ||
| F-34 | ||
| F-35 | ||
| F-36 | ||
| F-37 | ||
F-1
Table of Contents
REPORT OF INDEPENDENT REGISTERED PUBLIC ACCOUNTING FIRM
To the Board of Directors and Stockholders of Bucyrus International, Inc.:
We have audited the accompanying consolidated balance sheets of Bucyrus International, Inc. and subsidiaries (the “Company”) as of December 31, 2006 and 2005, and the related consolidated statements of earnings, comprehensive income, common stockholders’ investment, and cash flows for each of the three years in the period ended December 31, 2006. These financial statements are the responsibility of the Company’s management. Our responsibility is to express an opinion on these financial statements based on our audits.
We conducted our audits in accordance with the standards of the Public Company Accounting Oversight Board (United States). Those standards require that we plan and perform the audit to obtain reasonable assurance about whether the financial statements are free of material misstatement. An audit includes examining, on a test basis, evidence supporting the amounts and disclosures in the financial statements. An audit also includes assessing the accounting principles used and significant estimates made by management, as well as evaluating the overall financial statement presentation. We believe that our audits provide a reasonable basis for our opinion.
In our opinion, such consolidated financial statements present fairly, in all material respects, the financial position of Bucyrus International, Inc. and subsidiaries at December 31, 2006 and 2005, and the results of their operations and their cash flows for each of the three years in the period ended December 31, 2006, in conformity with accounting principles generally accepted in the United States of America.
As discussed in Note A to the consolidated financial statements, effective January 1, 2006 the Company changed its method of accounting for share-based compensation to adopt Statement of Financial Accounting Standards No. 123 (revised 2004), “Shared-Based Payment.” As discussed in Notes A, I and J to the consolidated financial statements, effective December 31, 2006 the Company changed its method of accounting for the funded status of their defined benefit pension and postretirement plans to adopt Statement of Financial Accounting Standards No. 158, “Employers’ Accounting for Defined Benefit Pension and Other Postretirement Plans—an amendment of FASB Statements No. 87, 88, 106, and 132(R).”
We have also audited, in accordance with the standards of the Public Company Accounting Oversight Board (United States), the effectiveness of the Company’s internal control over financial reporting as of December 31, 2006, based on the criteria established inInternal Control—Integrated Framework issued by the Committee of Sponsoring Organizations of the Treadway Commission and our report dated February 26, 2007 expressed an unqualified opinion on management’s assessment of the effectiveness of the Company’s internal control over financial reporting and an unqualified opinion on the effectiveness of the Company’s internal control over financial reporting.
Milwaukee, Wisconsin
February 26, 2007
F-2
Table of Contents
BUCYRUS INTERNATIONAL, INC. AND SUBSIDIARIES
CONSOLIDATED STATEMENTS OF EARNINGS
(Dollars in Thousands, Except Per Share Amounts)
| Years Ended December 31, | ||||||||||||
| 2006 | 2005 | 2004 | ||||||||||
Sales | $ | 738,050 | $ | 575,042 | $ | 454,186 | ||||||
Cost of products sold | 551,275 | 437,611 | 357,819 | |||||||||
Gross profit | 186,775 | 137,431 | 96,367 | |||||||||
Selling, general and administrative expenses | 73,138 | 54,354 | 53,050 | |||||||||
Research and development expenses | 10,661 | 7,225 | 5,619 | |||||||||
Amortization of intangible assets | 1,792 | 1,801 | 1,817 | |||||||||
Operating earnings | 101,184 | 74,051 | 35,881 | |||||||||
Interest expense | 3,693 | 4,865 | 11,547 | |||||||||
Other income | (818 | ) | (718 | ) | (321 | ) | ||||||
Other expense | 1,035 | 987 | 1,979 | |||||||||
Loss on extinguishment of debt | — | — | 7,316 | |||||||||
Earnings before income taxes | 97,274 | 68,917 | 15,360 | |||||||||
Income tax expense | 26,930 | 15,358 | 9,276 | |||||||||
Net earnings | $ | 70,344 | $ | 53,559 | $ | 6,084 | ||||||
Net earnings per share data | ||||||||||||
Basic: | ||||||||||||
Net earnings per share | $ | 2.25 | $ | 1.76 | $ | .26 | ||||||
Weighted average shares | 31,264,580 | 30,483,453 | 23,197,292 | |||||||||
Diluted: | ||||||||||||
Net earnings per share | $ | 2.23 | $ | 1.71 | $ | .25 | ||||||
Weighted average shares | 31,539,761 | 31,246,137 | 24,221,550 | |||||||||
See notes to consolidated financial statements.
F-3
Table of Contents
BUCYRUS INTERNATIONAL, INC. AND SUBSIDIARIES
CONSOLIDATED STATEMENTS OF COMPREHENSIVE INCOME
(Dollars in Thousands)
| Years Ended December 31, | ||||||||||
| 2006 | 2005 | 2004 | ||||||||
Net earnings | $ | 70,344 | $ | 53,559 | $ | 6,084 | ||||
Other comprehensive income (loss): | ||||||||||
Foreign currency translation adjustments | 1,215 | (589 | ) | 3,721 | ||||||
Minimum pension liability adjustment, net of income taxes | 4,626 | (2,929 | ) | 8,824 | ||||||
Other comprehensive income (loss) | 5,841 | (3,518 | ) | 12,545 | ||||||
Comprehensive income | $ | 76,185 | $ | 50,041 | $ | 18,629 | ||||
See notes to consolidated financial statements.
F-4
Table of Contents
BUCYRUS INTERNATIONAL, INC. AND SUBSIDIARIES
CONSOLIDATED BALANCE SHEETS
(Dollars in Thousands, Except Per Share Amounts)
| December 31, | ||||||||
| 2006 | 2005 | |||||||
ASSETS | ||||||||
CURRENT ASSETS: | ||||||||
Cash and cash equivalents | $ | 9,575 | $ | 12,451 | ||||
Receivables-net | 162,535 | 155,547 | ||||||
Inventories | 176,277 | 133,476 | ||||||
Deferred income taxes | 11,725 | 18,363 | ||||||
Prepaid expenses and other | 16,408 | 6,982 | ||||||
Total Current Assets | 376,520 | 326,819 | ||||||
OTHER ASSETS: | ||||||||
Goodwill | 47,306 | 47,306 | ||||||
Intangible assets-net | 28,097 | 34,565 | ||||||
Deferred income taxes | 16,117 | 10,355 | ||||||
Other assets | 7,523 | 8,767 | ||||||
Total Other Assets | 99,043 | 100,993 | ||||||
PROPERTY, PLANT AND EQUIPMENT: | ||||||||
Land | 4,099 | 2,331 | ||||||
Buildings and improvements | 55,439 | 18,593 | ||||||
Machinery and equipment | 151,066 | 120,014 | ||||||
Less accumulated depreciation | (85,455 | ) | (76,783 | ) | ||||
Total Property, Plant and Equipment | 125,149 | 64,155 | ||||||
TOTAL ASSETS | $ | 600,712 | $ | 491,967 | ||||
LIABILITIES AND COMMON STOCKHOLDERS’ INVESTMENT | ||||||||
CURRENT LIABILITIES: | ||||||||
Accounts payable | $ | 83,603 | $ | 65,729 | ||||
Accrued expenses | 44,121 | 41,018 | ||||||
Liabilities to customers on uncompleted contracts and warranties | 32,233 | 35,239 | ||||||
Income taxes | 9,978 | 11,943 | ||||||
Short-term obligations | 121 | 939 | ||||||
Current maturities of long-term debt | 210 | 400 | ||||||
Total Current Liabilities | 170,266 | 155,268 | ||||||
LONG-TERM LIABILITIES: | ||||||||
Postretirement benefits | 17,313 | 14,257 | ||||||
Pension and other | 34,871 | 34,567 | ||||||
Total Long-Term Liabilities | 52,184 | 48,824 | ||||||
LONG-TERM DEBT, less current maturities | 82,266 | 66,975 | ||||||
COMMITMENTS AND CONTINGENCIES—Note M | ||||||||
COMMON STOCKHOLDERS’ INVESTMENT: | ||||||||
Class A common stock—par value $.01 per share, authorized 75,000,000 shares, issued 31,685,767 and 30,991,820 shares in 2006 and 2005, respectively | 317 | 310 | ||||||
Additional paid-in capital | 306,981 | 298,079 | ||||||
Unearned restricted stock compensation | — | (466 | ) | |||||
Treasury stock, at cost—108,600 shares | (851 | ) | (851 | ) | ||||
Accumulated earnings (deficit) | 13,451 | (50,963 | ) | |||||
Accumulated other comprehensive loss | (23,902 | ) | (25,209 | ) | ||||
Total Common Stockholders’ Investment | 295,996 | 220,900 | ||||||
TOTAL LIABILITIES AND COMMON STOCKHOLDERS’ INVESTMENT | $ | 600,712 | $ | 491,967 | ||||
See notes to consolidated financial statements.
F-5
Table of Contents
BUCYRUS INTERNATIONAL, INC. AND SUBSIDIARIES
CONSOLIDATED STATEMENTS OF COMMON STOCKHOLDERS’ INVESTMENT
(Dollars in Thousands)
Class A Common Stock | Additional Paid-In Capital | Unearned Restricted Stock Compensation | Treasury Stock | Accumulated Earnings (Deficit) | Accumulated Other Comprehensive Loss | ||||||||||||||||||
Balance at January 1, 2004 | $ | 121 | $ | 149,472 | — | $ | (851 | ) | $ | (104,783 | ) | $ | (34,236 | ) | |||||||||
Initial public offering | 80 | 129,711 | — | — | — | — | |||||||||||||||||
Issuance of restricted stock (36,000 shares) | — | 720 | $ | (720 | ) | — | — | — | |||||||||||||||
Stock compensation expense | — | 10,027 | 49 | — | — | — | |||||||||||||||||
Net earnings | — | — | — | — | 6,084 | — | |||||||||||||||||
Dividends declared | — | — | — | — | (1,151 | ) | |||||||||||||||||
Translation adjustments | — | — | — | — | — | 3,721 | |||||||||||||||||
Minimum pension liability adjustment | — | — | — | — | — | 8,824 | |||||||||||||||||
Balance at December 31, 2004 | 201 | 289,930 | (671 | ) | (851 | ) | (99,850 | ) | (21,691 | ) | |||||||||||||
Issuance of common stock (849,654 shares) | 6 | 3,961 | — | — | — | — | |||||||||||||||||
Income tax effect of stock options exercised | — | 4,316 | — | — | — | — | |||||||||||||||||
Stock compensation expense | — | — | 180 | — | — | — | |||||||||||||||||
Restricted stock forfeited (1,800 shares) | — | (25 | ) | 25 | — | — | — | ||||||||||||||||
Net earnings | — | — | — | — | 53,559 | — | |||||||||||||||||
Dividends declared | — | — | — | — | (4,672 | ) | — | ||||||||||||||||
Translation adjustments | — | — | — | — | — | (589 | ) | ||||||||||||||||
Minimum pension liability adjustment | — | — | — | — | — | (2,929 | ) | ||||||||||||||||
Balance at December 31, 2005 | 207 | 298,182 | (466 | ) | (851 | ) | (50,963 | ) | (25,209 | ) | |||||||||||||
Stock split three-for-two | 103 | (103 | ) | — | — | — | — | ||||||||||||||||
Cash in lieu of fractional shares | — | (98 | ) | — | — | — | — | ||||||||||||||||
Issuance of common stock (438,841 shares) | 4 | 832 | — | — | — | — | |||||||||||||||||
Issuance of nonvested common stock (306,075 shares) | 3 | (3 | ) | — | — | — | — | ||||||||||||||||
Income tax effect of stock options exercised | — | 4,353 | — | — | — | — | |||||||||||||||||
Stock compensation expense | — | 4,284 | — | — | — | — | |||||||||||||||||
Reclassification of unearned compensation to additional paid-in-capital upon adoption of SFAS 123(R)—see Note G | — | (466 | ) | 466 | — | — | — | ||||||||||||||||
Net earnings | — | — | — | — | 70,344 | — | |||||||||||||||||
Dividends declared | — | — | — | — | (5,930 | ) | — | ||||||||||||||||
Translation adjustments | — | — | — | — | — | 1,215 | |||||||||||||||||
Minimum pension liability adjustment, net of income taxes | — | — | — | — | 4,626 | ||||||||||||||||||
Adjustment to initially adopt SFAS No. 158, net of income taxes—see Notes I and J | — | — | — | — | — | (4,534 | ) | ||||||||||||||||
Balance at December 31, 2006 | $ | 317 | $ | 306,981 | $ | — | $ | (851 | ) | $ | 13,451 | $ | (23,902 | ) | |||||||||
See notes to consolidated financial statements.
F-6
Table of Contents
BUCYRUS INTERNATIONAL, INC. AND SUBSIDIARIES
CONSOLIDATED STATEMENTS OF CASH FLOWS
(Dollars in Thousands)
| Years Ended December 31, | ||||||||||||
| 2006 | 2005 | 2004 | ||||||||||
CASH FLOWS FROM OPERATING ACTIVITIES: | ||||||||||||
Net earnings | $ | 70,344 | $ | 53,559 | $ | 6,084 | ||||||
Adjustments to reconcile net earnings to net cash provided by operating activities: | ||||||||||||
Depreciation | 12,892 | 11,681 | 11,061 | |||||||||
Amortization | 2,827 | 2,788 | 3,194 | |||||||||
Stock compensation expense | 4,284 | 180 | 10,076 | |||||||||
Stock issued in payment of director’s fees | 81 | 70 | — | |||||||||
Deferred income taxes | 275 | (9,765 | ) | 3,772 | ||||||||
Tax benefit from exercise of stock options | — | 4,316 | — | |||||||||
Loss on sale of property, plant and equipment | 140 | 273 | 287 | |||||||||
Receipt of government grants for training expenses | 800 | — | — | |||||||||
Loss on extinguishment of debt | — | — | 7,316 | |||||||||
Secondary offering expenses | — | — | 602 | |||||||||
Changes in assets and liabilities: | ||||||||||||
Receivables | (6,443 | ) | (64,729 | ) | (15,023 | ) | ||||||
Inventories | (42,433 | ) | (21,904 | ) | 8,726 | |||||||
Other current assets | (8,840 | ) | (1,112 | ) | 5,473 | |||||||
Other assets | (414 | ) | 1,574 | (3,309 | ) | |||||||
Current liabilities other than income taxes, short-term obligations and current maturities of long-term debt | 13,848 | 72,752 | (14,849 | ) | ||||||||
Income taxes | (1,171 | ) | 7,708 | (1,376 | ) | |||||||
Long-term liabilities other than deferred income taxes | 4,740 | (7,033 | ) | (6,371 | ) | |||||||
Net cash provided by operating activities | 50,930 | 50,358 | 15,663 | |||||||||
CASH FLOWS FROM INVESTING ACTIVITIES: | ||||||||||||
Purchases of property, plant and equipment | (71,306 | ) | (22,164 | ) | (6,285 | ) | ||||||
Proceeds from sale of property, plant and equipment | 517 | 305 | 105 | |||||||||
Other | 186 | (250 | ) | (526 | ) | |||||||
Net cash used in investing activities | (70,603 | ) | (22,109 | ) | (6,706 | ) | ||||||
CASH FLOWS FROM FINANCING ACTIVITIES: | ||||||||||||
Net borrowings from (repayments of) revolving credit facilities | $ | 15,299 | $ | 63,490 | $ | (37,420 | ) | |||||
Proceeds from other bank borrowings and long-term debt | 150 | 643 | 263 | |||||||||
Payments of other bank borrowings and long-term debt | (1,166 | ) | (321 | ) | (393 | ) | ||||||
Proceeds from senior secured term loan | — | — | 100,000 | |||||||||
Retirement of Senior Notes | — | — | (150,000 | ) | ||||||||
Payment of prepayment penalty on Senior Notes | — | — | (5,560 | ) | ||||||||
Payment of deferred interest on Senior Notes owned by Holdings | — | — | (23,660 | ) | ||||||||
Repayment of senior secured term loan | — | (98,750 | ) | (1,250 | ) | |||||||
Receipt of government grants for facilities expansion | 2,000 | — | — | |||||||||
Payment of financing expenses | (268 | ) | (591 | ) | (4,830 | ) | ||||||
Payment of secondary offering expenses | — | — | (602 | ) | ||||||||
Net proceeds from issuance of common stock | 756 | 3,896 | 129,791 | |||||||||
Tax benefit from exercise of stock options | 4,353 | — | — | |||||||||
Dividends paid | (5,892 | ) | (4,666 | ) | (1,151 | ) | ||||||
Payment in lieu of fractional shares—stock split | (98 | ) | — | — | ||||||||
Net cash provided by (used in) financing activities | 15,134 | (36,299 | ) | 5,188 | ||||||||
Effect of exchange rate changes on cash | 1,663 | (116 | ) | 397 | ||||||||
Net increase (decrease) in cash and cash equivalents | (2,876 | ) | (8,166 | ) | �� | 14,542 | ||||||
Cash and cash equivalents at beginning of year | 12,451 | 20,617 | 6,075 | |||||||||
Cash and cash equivalents at end of year | $ | 9,575 | $ | 12,451 | $ | 20,617 | ||||||
SUPPLEMENTAL DISCLOSURES OF CASH FLOW INFORMATION: | ||||||||||||
Cash paid during the period for: | ||||||||||||
Interest | $ | 4,297 | $ | 5,443 | $ | 39,569 | ||||||
Income taxes-net of refunds | 26,735 | 14,462 | 6,976 | |||||||||
SUPPLEMENTAL DISCLOSURES OF CASH FLOW INFORMATION: | ||||||||||||
Capital expenditures related to expansion program included in accounts payable | $ | 3,047 | — | — | ||||||||
See notes to consolidated financial statements.
F-7
Table of Contents
BUCYRUS INTERNATIONAL, INC. AND SUBSIDIARIES
NOTES TO CONSOLIDATED FINANCIAL STATEMENTS
NOTE A—SUMMARY OF ACCOUNTING POLICIES
Nature of Operations
Bucyrus International, Inc. (the “Company”) is a Delaware corporation and a leading manufacturer of surface mining equipment, principally draglines, electric mining shovels and large rotary blasthole drills. Major markets for the surface mining industry are copper, coal, oil sands and iron ore. The Company also has a comprehensive aftermarket business that includes replacement parts, maintenance and other services. The largest markets for the Company’s products and services are in Australia, Canada, China, India, South Africa, South America and the United States.
Use of Estimates
The preparation of the consolidated financial statements in conformity with accounting principles generally accepted in the United States requires management to make estimates and assumptions that affect the reported amounts of assets and liabilities, disclosure of contingent assets and liabilities and the reported amounts of revenues and expenses. Actual results could differ from those estimates.
Principles of Consolidation
The consolidated financial statements include the accounts of all subsidiaries. All significant intercompany transactions, profits and accounts have been eliminated.
Cash Equivalents
All highly liquid investments with maturities of three months or less when purchased are considered to be cash equivalents. The carrying value of these investments approximates fair value.
Inventories
Inventories are stated at lower of cost (first-in, first-out method) or net realizable value. The cost of finished goods and work in progress includes the cost of raw materials, other direct costs and production overheads. Net realizable value is the estimate of the selling price in the ordinary course of business, less the cost of completion and selling. Provision is made to reduce the cost to net realizable value for obsolete and slow-moving inventories. Advances from customers are netted against inventories to the extent of related accumulated costs. Advances in excess of related costs and earnings on uncompleted contracts are classified as a liability to customers. Advances netted against inventory costs were zero and $.4 million at December 31, 2006 and 2005, respectively.
Goodwill and Intangible Assets
Goodwill and intangible assets are accounted for in accordance with Statement of Financial Accounting Standards No. 142, “Goodwill and Other Intangible Assets” (“SFAS 142”) (see Note D).
Intangible assets consist primarily of engineering drawings, bill-of-material listings, software, trademarks and trade names. At December 31, 2005, intangible assets also included $4.6 million related to an adjustment to record an additional minimum pension liability (see Note I). Upon the adoption of SFAS No. 158, “Employers’ Accounting for Defined Benefit Pension and Other Postretirement Plans—an amendment of FASB Statements No. 87, 88, 106, and 132(R)”, on December 31, 2006, an intangible asset related to this adjustment is no longer required.
F-8
Table of Contents
Property, Plant and Equipment
Depreciation is provided over the estimated useful lives of respective assets using the straight-line method for financial reporting and accelerated methods for income tax purposes. Estimated useful lives used for financial reporting purposes range from ten to forty years for buildings and improvements and three to 17 years for machinery and equipment.
Capitalized Interest
Under certain conditions, the Company capitalizes interest as part of the acquisition cost of an asset. Interest is capitalized only during the period of time required to complete and prepare the asset for its intended use. For the year ended December 31, 2006, the Company capitalized $.8 million of interest as a part of the cost of a multi-phase expansion of its manufacturing facilities.
Impairment of Long-Lived Assets
The Company continually evaluates whether events and circumstances have occurred that indicate the remaining estimated useful lives of property, plant and equipment and intangible assets with finite lives may warrant revision or that the remaining balance of each may not be recoverable. The Company accounts for any impairment of long-lived assets in accordance with Statement of Financial Accounting Standards No. 144, “Accounting for the Impairment or Disposal of Long-Lived Assets.”
Foreign Currency Translation
The assets and liabilities of foreign subsidiaries are translated into U.S. dollars using year-end exchange rates. Sales and expenses are translated at average rates during the year. Adjustments resulting from this translation are deferred and reflected as a separate component of Common Stockholders’ Investment. Gains and losses from foreign currency transactions are included in Selling, General and Administrative expenses in the Consolidated Statements of Earnings. Transaction losses totaled $1.0 million for the year ended December 31, 2006, and transaction gains totaled $1.0 million and $2.7 million for the years ended December 31, 2005 and 2004, respectively. Transaction gains and losses on intercompany advances to foreign subsidiaries for which settlement is not planned or anticipated in the foreseeable future are deferred and reflected as a component of Common Stockholders’ Investment.
Comprehensive Income (Loss)
Statement of Financial Accounting Standards No. 130, “Reporting Comprehensive Income,” requires the reporting of comprehensive income (loss) in addition to net income (loss). Comprehensive income (loss) is a more inclusive financial reporting method that includes disclosure of financial information that historically has not been recognized in the calculation of net income (loss). The Company reports comprehensive income (loss) and accumulated other comprehensive loss, which encompasses net income (loss), foreign currency translation adjustments, minimum pension liability adjustments and an adjustment to adopt SFAS No. 158 (see Notes I and J), in the Consolidated Statements of Common Stockholders’ Investment. Information regarding accumulated other comprehensive loss is as follows:
Cumulative Adjustments | Minimum Liability | Adjustment to Adopt SFAS No. 158 | Accumulated Comprehensive | |||||||||||||
| (Dollars in Thousands) | ||||||||||||||||
Balance at January 1, 2004 | $ | (9,028 | ) | $ | (25,208 | ) | $ | — | $ | (34,236 | ) | |||||
Changes—Year ended December 31, 2004 | 3,721 | 8,824 | — | 12,545 | ||||||||||||
Balance at December 31, 2004 | (5,307 | ) | (16,384 | ) | — | (21,691 | ) | |||||||||
Changes—Year ended December 31, 2005 | (589 | ) | (2,929 | ) | — | (3,518 | ) | |||||||||
Balance at December 31, 2005 | (5,896 | ) | (19,313 | ) | — | (25,209 | ) | |||||||||
Changes—Year ended December 31, 2006 | 1,215 | 4,626 | (4,534 | ) | 1,307 | |||||||||||
Balance at December 31, 2006 | $ | (4,681 | ) | $ | (14,687 | ) | $ | (4,534 | ) | $ | (23,902 | ) | ||||
F-9
Table of Contents
Revenue Recognition
Revenue from long-term sales contracts, such as for the manufacture of the Company’s machines and certain replacement parts, is recognized using the percentage-of-completion method prescribed by Statement of Position No. 81-1 due to the length of time to fully manufacture and assemble the Company’s machines or replacement parts. The Company measures revenue recognized based on the ratio of estimated costs incurred to date in relation to total costs to be incurred. The percentage-of-completion method of accounting for these contracts most accurately reflects the status of these uncompleted contracts in the Company’s consolidated financial statements and most accurately measures the matching of revenues with expenses. The Company also has long-term maintenance and repair contracts with customers. Under these contracts, the Company provides all replacement parts, regular maintenance services and necessary repairs for the excavation equipment at a particular mine with an on-site support team. In addition, some of these contracts call for Company personnel to operate the equipment being serviced. Parts consumed and services provided are charged to cost of products sold and sales are calculated and recorded based on the parts and service utilization. The customer is billed monthly and a liability for deferred revenues is recorded if payments received exceed revenues recognized. At the time a loss on a contract becomes known, the amount of the estimated loss is recognized in the consolidated financial statements. Revenue from all other types of sales, primarily sales of aftermarket parts, net of estimated returns and allowances, is recognized in conformity with Staff Accounting Bulletin No. 104, when all of the following circumstances are satisfied: persuasive evidence of an arrangement exists, the price is fixed or determinable, collectibility is reasonably assured, and delivery has occurred or services have been rendered. Criteria for revenue recognition is generally met at the time products are shipped, as the terms are FOB shipping point.
Included in the current portion of liabilities to customers on uncompleted contracts and warranties are advances in excess of related costs and earnings on uncompleted contracts of $25.1 million and $28.9 million at December 31, 2006 and 2005, respectively.
Warranty
Sales of the Company’s products generally carry typical manufacturers’ warranties, the majority of which cover products for one year, based on terms that are generally accepted in the marketplace. The Company records provisions for estimated warranty and other related costs as revenue is recognized based on historical warranty loss experience and periodically adjusts these provisions to reflect actual experience.
Shipping and Handling Fees and Costs
Revenue received from shipping and handling fees is reflected in sales. Shipping fee revenue was insignificant for all periods presented. Shipping and handling costs are included in cost of products sold.
Income Taxes
Deferred taxes are provided to reflect temporary differences between the financial and tax basis of assets and liabilities using presently enacted tax rates and laws. A valuation allowance is recognized if it is more likely than not that some or all of the deferred tax assets will not be realized.
Financial Instruments
Based on Company estimates, the carrying amounts of cash equivalents, receivables, accounts payable, accrued liabilities and variable rate debt approximated fair value at December 31, 2006 and 2005.
Derivative Financial Instruments
The Company has entered into foreign exchange forward contracts in order to manage and preserve the economic value of cash flows in non-functional currencies. At December 31, 2006, the Company’s domestic operations had financial contracts outstanding to purchase 53.8 Australian dollars at a total price of $42.1
F-10
Table of Contents
million, purchase 1.6 million British pounds at a total price of $3.1 million and sell 20.1 million African rands at a total price of $2.8 million. The Company’s operations in South Africa have contracts outstanding to purchase $.5 million at a total price of 3.8 million African rands. Based upon year-end exchange rates, all outstanding contracts are recorded at fair value. The Company conducts its business on a multinational basis in a wide variety of foreign currencies and hedges foreign currency exposures arising from various receivables, liabilities and expected inventory purchases. Derivative instruments that are utilized to hedge the foreign currency risk associated with anticipated inventory purchases in foreign currencies are designated as cash-flow hedges. Gains and losses on these instruments, to the extent that they have been effective, are deferred in other comprehensive income and recognized in earnings when the related inventory is sold. Ineffectiveness related to these hedge relationships is recognized currently in the Consolidated Statements of Earnings and was not significant. The maturity of these instruments does not exceed 12 months.
The Company also uses natural hedges to mitigate risks associated with foreign currency exposures. For example, oftentimes the Company has non-functional currency denominated receivables from customers for which the exposure is partially mitigated by a corresponding non-functional currency payable to a vendor.
Stock Split
On March 8, 2006, the Company’s Board of Directors authorized a three-for-two split of the Company’s Class A common stock. The stock split was paid on March 29, 2006 to Company stockholders of record on March 20, 2006. The Company’s Class A common stock began trading on a split-adjusted basis on March 30, 2006. All references in the accompanying consolidated financial statements and notes thereto to net earnings per share and the number of shares have been adjusted to reflect this stock split, except for the Consolidated Statements of Common Stockholders’ Investment which reflect the stock split by reclassifying from Additional Paid-In Capital to Class A Common Stock an amount equal to the par value of the additional shares issued to effect the stock split.
Accounting for Stock—Based Compensation
The Company adopted Statement of Financial Accounting Standards No. 123 (revised 2004), “Share-Based Payment” (“SFAS 123R”), on January 1, 2006 using the modified prospective application method. Previously, the Company accounted for stock-based compensation arrangements in accordance with Accounting Principles Board Opinion No. 25, “Accounting for Stock Issued to Employees,” as allowed by Statement of Financial Accounting Standards No. 123, “Accounting for Stock-Based Compensation” (“SFAS 123”).
The following table illustrates the effect on net earnings and net earnings per share as if the fair value-based method provided by SFAS 123 had been applied for all outstanding and unvested awards in each period:
| Years Ended December 31, | |||||||
| 2005 | 2004 | ||||||
(Dollars in Thousands, Except Per Share Amounts) | |||||||
Reported net earnings | $ | 53,559 | $ | 6,084 | |||
Add: Stock-based employee compensation expense recorded, net of related tax effects | — | 6,217 | |||||
Deduct: Total stock-based employee compensation expense determined under fair value based method, net of related tax effects | — | (360 | ) | ||||
Pro forma net earnings | $ | 53,559 | $ | 11,941 | |||
Net earnings per share of common stock: | |||||||
As reported: | |||||||
Basic | $ | 1.76 | $ | .26 | |||
Diluted | 1.71 | .25 | |||||
Pro forma: | |||||||
Basic | 1.76 | .51 | |||||
Diluted | 1.71 | .49 | |||||
F-11
Table of Contents
SFAS 123R requires a classification change in the Statement of Cash Flows whereby the income tax benefit from stock option exercises is reported as a financing cash flow rather than as an operating cash flow as previously reported. The $4.4 million excess tax benefit classified as a financing cash inflow for the year ended December 31, 2006 would have been classified as an operating cash inflow prior to the adoption of SFAS 123R. SFAS 123R also requires any remaining debit in Common Stockholders’ Investment related to unearned stock compensation be reclassified to the appropriate equity accounts.
NOTE B—RECEIVABLES
Receivables at December 31, 2006 and 2005 include $77.0 million and $68.2 million, respectively, of revenues from long-term contracts which were not billable at these dates. Billings on long-term contracts are made in accordance with the terms as defined in the individual contracts. The unbilled receivables are for contracts that were near completion as of the balance sheet dates and collection of amounts due was scheduled to be within the next twelve months of such dates.
Current receivables are reduced by an allowance for losses of $.8 million and $1.5 million at December 31, 2006 and 2005, respectively.
NOTE C—INVENTORIES
Inventories consist of the following:
| December 31, | ||||||
| 2006 | 2005 | |||||
| (Dollars in Thousands) | ||||||
Raw materials and parts | $ | 45,392 | $ | 36,526 | ||
Work in process | 30,794 | 12,896 | ||||
Finished products (primarily replacement parts) | 100,091 | 84,054 | ||||
| $ | 176,277 | $ | 133,476 | |||
NOTE D—GOODWILL AND INTANGIBLE ASSETS
In accordance with SFAS 142, goodwill is no longer subject to amortization, but instead is subject to an evaluation for impairment at least annually by applying a two-step fair-value-based test. Additionally, intangible assets with indefinite lives are also no longer amortized but are subject to an evaluation for impairment at least annually by applying a lower-of-cost-or-market test. Intangible assets with finite lives continue to be amortized over a period of 5 to 20 years. For goodwill, the fair value of the Company’s reporting units exceeds the carrying amounts and an impairment charge is not required. The Company also completed an impairment analysis of its indefinite life intangible assets in accordance with the provisions of SFAS 142 and determined that an impairment charge is not required.
F-12
Table of Contents
Intangible assets consist of the following:
| December 31, 2006 | December 31, 2005 | |||||||||||||||||
Weighted Average Life | Gross Amount | Accumulated Amortization | Weighted Average Life | Gross Amount | Accumulated Amortization | |||||||||||||
| (years) | (Dollars in Thousands) | (years) | (Dollars in Thousands) | |||||||||||||||
Amortized intangible assets: | ||||||||||||||||||
Engineering drawings | 20 | $ | 25,500 | $ | (11,818 | ) | 20 | $ | 25,500 | $ | (10,543 | ) | ||||||
Bill of material listings | 20 | 2,856 | (1,324 | ) | 20 | 2,856 | (1,181 | ) | ||||||||||
Software | 10 | 2,288 | (2,121 | ) | 10 | 2,288 | (1,892 | ) | ||||||||||
Other | 5 | 700 | (420 | ) | 5 | 773 | (309 | ) | ||||||||||
| $ | 31,344 | $ | (15,683 | ) | $ | 31,417 | $ | (13,925 | ) | |||||||||
Unamortized intangible assets: | ||||||||||||||||||
Trademarks/Trade names | $ | 12,436 | $ | 12,436 | ||||||||||||||
Intangible pension asset | — | 4,637 | ||||||||||||||||
| $ | 12,436 | $ | 17,073 | |||||||||||||||
At December 31, 2006, the intangible pension asset was no longer reported upon adoption of SFAS No. 158 (see Note I).
The aggregate intangible amortization expense was $1.8 million for each of the years ended December 31, 2006, 2005 and 2004. The estimated future amortization expense of intangible assets is as follows:
| (Dollars in Thousands) | |||
2007 | $ | 1,725 | |
2008 | 1,558 | ||
2009 | 1,418 | ||
2010 | 1,418 | ||
2011 | 1,418 | ||
Future | 8,124 | ||
| $ | 15,661 | ||
NOTE E—ACCRUED EXPENSES
Accrued expenses consist of the following:
| December 31, | ||||||
| 2006 | 2005 | |||||
| (Dollars in Thousands) | ||||||
Wages and salaries | $ | 13,708 | $ | 11,030 | ||
Pension | 373 | 10,182 | ||||
Other | 30,040 | 19,806 | ||||
| $ | 44,121 | $ | 41,018 | |||
F-13
Table of Contents
NOTE F—LONG-TERM DEBT AND FINANCING ARRANGEMENTS
Long-term debt consists of the following:
| December 31, | ||||||||
| 2006 | 2005 | |||||||
| (Dollars in Thousands) | ||||||||
Revolving credit facility | $ | 78,789 | $ | 63,490 | ||||
Other | 3,687 | 3,885 | ||||||
| 82,476 | 67,375 | |||||||
Less current maturities of long-term debt | (210 | ) | (400 | ) | ||||
| $ | 82,266 | $ | 66,975 | |||||
On May 27, 2005, the Company entered into a credit agreement with GMAC Commercial Finance LLC as lead lender which provides for a revolving credit facility and expires on May 27, 2010. In 2006, the amount of the revolving credit facility was increased to $200.0 million from $120.0 million. Interest on borrowed amounts is subject to quarterly adjustments to prime or LIBOR rates as defined in the credit agreement. Borrowings under the revolving credit facility are subject to a borrowing base formula based on the value of eligible receivables and inventory. At December 31, 2006, the Company had $78.8 million of borrowings outstanding under the revolving credit facility at a weighted average interest rate of 6.8%. The amount available for additional borrowings under the revolving credit facility at December 31, 2006 was $69.7 million.
The credit agreement contains covenants limiting the discretion of management with respect to key business matters and places significant restrictions on, among other things, the Company’s ability to incur additional indebtedness, create liens or other encumbrances, make certain payments or investments, loans and guarantees, and sell or otherwise dispose of assets and merge or consolidate with another entity. All of the Company’s domestic assets and the receivables and inventory of the Company’s Canadian subsidiary are pledged as collateral under the senior secured credit facility. In addition, the outstanding capital stock of the Company’s domestic subsidiaries, as well as the capital stock of a majority of the Company’s foreign subsidiaries, are pledged as collateral. The Company is also required to maintain compliance with certain financial covenants, including a leverage ratio (as defined). The Company was in compliance with these covenants as of December 31, 2006.
Previously, the Company had a senior secured credit facility it had entered into upon completion of an initial public offering (“IPO”) on July 28, 2004 (see Note G). The net proceeds from the IPO together with proceeds from other borrowings were used to retire all the Company’s previously outstanding 9 3/4% Senior Notes due 2007 (“Senior Notes”) and accrued interest. Included in the Consolidated Statement of Earnings for the year ended December 31, 2004 was a $7.3 million loss on extinguishment of debt, which consisted of prepayment penalty and the write-off of unamortized deferred financing costs related to the Senior Notes.
The average revolving credit facility borrowings under the Company’s credit agreement for the year ended December 31, 2006 were $59.7 million at a weighted average interest rate of 6.9%, and the maximum borrowing outstanding was $111.8 million. The average borrowings under the revolving portion of the Company’s credit agreement during the period from May 27, 2005 to December 31, 2005 were $81.9 million at a weighted average interest rate of 5.4%, and the maximum borrowing outstanding was $94.2 million.
At December 31, 2006 and 2005, there were $76.2 million and $26.3 million, respectively, of standby letters of credit outstanding under all Company bank facilities.
F-14
Table of Contents
Maturities of long-term debt are as follows for each of the next five years:
| (Dollars in Thousands) | |||
2007 | $ | 210 | |
2008 | 889 | ||
2009 | 189 | ||
2010 | 79,304 | ||
2011 | 219 | ||
NOTE G—COMMON STOCKHOLDERS’ INVESTMENT
At December 31, 2006, the Company’s issued and outstanding shares consist only of Class A common stock. Holders of Class A common stock are entitled to one vote per share on all matters to be voted on by the Company’s common stockholders. On March 8, 2006, the Company’s Board of Directors authorized, and stockholders approved on May 3, 2006 at the 2006 annual meeting of stockholders, an increase in the number of authorized shares of the Company’s Class A common stock to 75,000,000 shares. This increase in authorized shares became effective upon filing the Company’s Amended and Restated Certificate of Incorporation with the State of Delaware on May 3, 2006. At December 31, 2006, the Company also has authorized but not issued 25,000,000 shares of Class B common stock and 10,000,000 shares of preferred stock.
On July 28, 2004, the Company completed an IPO of 18,543,750 shares of its Class A common stock at an offering price of $12 per share, from which the Company received net proceeds, after commissions and expenses, of $129.8 million. Subsequent to the IPO, the Company paid quarterly cash dividends of $.0383 per share (equal to $.153 per year). Effective with the stock split, the Company’s Board of Directors authorized a 30% increase in the quarterly dividend to the amount of $.05 per share per quarter for dividends payable after the date of the March 2006 stock split.
In 2004, the Company’s Board of Directors adopted, and the Company obtained stockholder approval of, the Bucyrus International, Inc. 2004 Equity Incentive Plan (the “2004 Incentive Plan”), which has subsequently been amended and restated. The 2004 Incentive Plan will expire on the tenth anniversary of its effective date, unless terminated earlier by the Company’s Board of Directors. The 2004 Incentive Plan provides for the grant of equity based awards, including restricted (or nonvested) stock, restricted stock units, stock options, stock appreciation rights (“SARs”), and other equity based awards to the Company’s directors, officers, and other employees, advisors and consultants and those of the Company’s subsidiaries who are selected by the compensation committee of the Company’s Board of Directors for participation in the plan. A maximum of three million shares of the Company’s Class A common stock are available for awards under the 2004 Incentive Plan, as amended. The compensation committee of the Company’s Board of Directors will determine all of the terms and conditions of awards under the plan, including whether the vesting or payment of an award will be subject to the attainment of performance goals.
F-15
Table of Contents
On September 22, 2004, the Company issued 36,000 nonvested shares to certain employees pursuant to the 2004 Incentive Plan. These shares become freely transferable and nonforfeitable at the end of four years. During 2005, 1,800 of these nonvested shares were forfeited. In 2006, the Company issued additional nonvested shares to certain employees pursuant to the 2004 Incentive Plan. These shares fully cliff vest on December 31, 2009, although the vesting period may be accelerated based on the attainment of certain defined financial goals of the Company. The Company did attain the defined financial goals for the year ended December 31, 2006 and 25% of the shares fully vested. A summary of the status of the Company’s nonvested shares at December 31, 2006 and changes during the year ended December 31, 2006 is as follows:
| Shares | Weighted-Average Grant Date Fair Value | |||||
Balance at January 1, 2006 | 34,200 | $ | 20.00 | |||
Granted on February 16, 2006 | 180,750 | 39.76 | ||||
Granted on April 25, 2006 | 37,800 | 57.00 | ||||
Forfeited | (48,900 | ) | 39.01 | |||
Shares vested | (5,700 | ) | 20.00 | |||
Balance at December 31, 2006 | 198,150 | $ | 40.39 | |||
Vested or expected to vest | 196,530 | $ | 40.26 | |||
The grant date fair value was based on the fair market value, as defined in the 2004 Incentive Plan, of the Company’s Class A common stock on the date of grant. At December 31, 2006, there was $6.2 million of unrecognized compensation cost related to the nonvested shares granted under the 2004 Incentive Plan. This cost is expected to be recognized over a weighted-average period of 2.9 years. The shares vested or expected to vest as of December 31, 2006 had an aggregate intrinsic value of $7.9 million and a weighted-average remaining contractual term of 2.9 years.
In 2006, the Company also granted premium nonvested shares to certain employees. These shares partially vest if specific performance levels are attained by the Company. Any nonvested premium shares credited to employees will fully cliff vest on December 31, 2009 if the employee is still employed by the Company on that date. The Company did attain the specific performance levels for the year ended December 31, 2006, which resulted in the partial vesting of 25% of the nonvested premium shares. A summary of the status of the Company’s premium nonvested shares at December 31, 2006 and changes during the year ended December 31, 2006 is as follows:
| Shares | Weighted-Average Grant Date Fair Value | |||||
Granted on February 16, 2006 | 90,375 | $ | 39.76 | |||
Granted on April 25, 2006 | 18,900 | 57.00 | ||||
Forfeited | (21,750 | ) | 41.37 | |||
Balance at December 31, 2006 | 87,525 | $ | 43.08 | |||
Vested or expected to vest | 46,442 | $ | 42.74 | |||
At December 31, 2006, there was $1.6 million of unrecognized compensation cost related to the premium nonvested shares, which is expected to be recognized over a period of 3.0 years. The grant date fair value of the nonvested premium shares was based on the fair market value, as defined in the 2004 Incentive Plan, of the Company’s Class A common stock on the date of grant. The shares vested or expected to vest as of December 31, 2006 had an aggregate intrinsic value of $2.0 million and a weighted-average remaining contractual life of 3.0 years.
F-16
Table of Contents
In 2006, the Company also issued SARs to certain employees pursuant to the 2004 Incentive Plan. A summary of the status of the Company’s SARs at December 31, 2006 and changes during the year ended December 31, 2006 is as follows:
| SARs | Weighted-Average Grant Date Fair Value | |||||
Granted on February 16, 2006 | 361,500 | $ | 19.72 | |||
Granted on April 25, 2006 | 75,600 | 28.27 | ||||
Forfeited | (87,000 | ) | 20.52 | |||
Balance at December 31, 2006 | 350,100 | $ | 21.37 | |||
Vested or expected to vest | 346,860 | $ | 21.30 | |||
The SARs vest incrementally over four years and can be settled in shares only. At December 31, 2006, there was $6.2 million of unrecognized compensation cost related to the SARs, which is expected to be recognized over a period of 3.0 years. The SARs vested or expected to vest as of December 31, 2006 had an aggregate intrinsic value of $7.4 million and a weighted-average remaining contractual life of 3.0 years. The grant date fair value of the SARs was calculated using the Black Sholes pricing model. The assumptions used in this model were as follows:
Risk-free interest rate | 4.37 | % | |
Expected volatility | 43.25 | % | |
Expected life | 7 years | ||
Dividend yield | .43 | % |
The risk-free interest rate was based on the current U.S. Treasury rate for a bond of seven years, the expected life of the SARs. The expected volatility was based on the historical activity of the Company’s Class A common stock. The expected life was based on the average of the vesting term of four years and the original contract term of 10 years. The expected dividend yield was based on the annual dividend of $.153 per share which had been paid on the Company’s Class A common stock prior to the stock split.
In 1998, the Company’s Board of Directors adopted, and the Company obtained stockholder approval of, the Bucyrus International, Inc. 1998 Management Stock Option Plan (the “1998 Option Plan”) as part of the compensation and incentive arrangements for certain of the Company’s management employees and those of the Company’s subsidiaries. The 1998 Option Plan provides for the grant of stock options to purchase up to an aggregate of 2.4 million shares of the Company’s Class A common stock at exercise prices to be determined in accordance with the provisions of the 1998 Option Plan. All outstanding options under the 1998 Option Plan became fully vested and exercisable upon completion of the Company’s IPO on July 28, 2004.
F-17
Table of Contents
The following table sets forth the activity and outstanding balances of options issued pursuant to the 1998 Option Plan:
| Options Outstanding | |||||||||
| Number of Options | Weighted Average Exercise Price | Available For Future Grants | |||||||
Balances at January 1, 2004 | 1,527,000 | $ | 3.69 | 12,600 | |||||
Options granted | 102,600 | 18.57 | (102,600 | ) | |||||
Options forfeited | (336,000 | ) | 8.33 | 336,000 | |||||
Balances at December 31, 2004 | 1,293,600 | 3.66 | 246,000 | ||||||
Options exercised | (847,014 | ) | 4.60 | — | |||||
Balances at December 31, 2005 | 446,586 | 1.87 | 246,000 | ||||||
Options exercised | (436,986 | ) | 1.73 | — | |||||
Balances at December 31, 2006 | 9,600 | 8.33 | 246,000 | ||||||
At December 31, 2006, all of the options outstanding were fully vested and exercisable and had a weighted average remaining contractual life of 1.2 years. At December 31, 2005, all of the options outstanding were vested and exercisable and had a weighted average remaining contractual life of 4.9 years. At December 31, 2004, all of the options outstanding were vested and exercisable and had a weighted average remaining contractual life of 6 years.
The weighted average grant date fair value of stock options granted in 2004 under the 1998 Option Plan was $6.27 per option. No options were granted in 2006 or 2005. The fair value of grants in 2004 was estimated on the date of grant using the PEV lattice-based binomial method with the following weighted average assumptions:
| 1998 Option Plan 2004 | |||
Risk-free interest rate | 3.29 | % | |
Expected dividend yield | .77 | % | |
Expected life | 5 years | ||
Calculated volatility | N/A |
NOTE H—INCOME TAXES
Earnings before income taxes consists of the following:
| Years Ended December 31, | |||||||||
| 2006 | 2005 | 2004 | |||||||
| (Dollars in Thousands) | |||||||||
United States | $ | 62,547 | $ | 44,240 | $ | 6,584 | |||
Foreign | 34,727 | 24,677 | 8,776 | ||||||
Total | $ | 97,274 | $ | 68,917 | $ | 15,360 | |||
F-18
Table of Contents
The provision for income tax expense consists of the following:
| Years Ended December 31, | ||||||||||||
| 2006 | 2005 | 2004 | ||||||||||
| (Dollars in Thousands) | ||||||||||||
Foreign income taxes: | ||||||||||||
Current | $ | 12,454 | $ | 10,067 | $ | 3,939 | ||||||
Deferred | (1,478 | ) | (560 | ) | 63 | |||||||
Total | 10,976 | 9,507 | 4,002 | |||||||||
Federal income taxes: | ||||||||||||
Current | 11,729 | 14,215 | 1,606 | |||||||||
Deferred | 3,538 | (10,460 | ) | 3,356 | ||||||||
Total | 15,267 | 3,755 | 4,962 | |||||||||
Other (state and local taxes): | ||||||||||||
Current | 2,472 | 841 | (41 | ) | ||||||||
Deferred | (1,785 | ) | 1,255 | 353 | ||||||||
Total | 687 | 2,096 | 312 | |||||||||
Total income tax expense | $ | 26,930 | $ | 15,358 | $ | 9,276 | ||||||
Total income tax expense differs from amounts expected by applying the federal statutory income tax rate to earnings before income taxes as set forth in the following table:
| Years Ended December 31, | ||||||||||||
| 2006 | 2005 | 2004 | ||||||||||
| (Dollars in Thousands) | ||||||||||||
Tax expense at federal statutory rate | $ | 34,046 | $ | 24,121 | $ | 5,376 | ||||||
Valuation allowance adjustments | (944 | ) | — | 502 | ||||||||
Impact of foreign subsidiary income, tax rates and tax credits | (1,503 | ) | (328 | ) | 3,677 | |||||||
Foreign tax credit carryforward benefit | (4,308 | ) | (8,788 | ) | — | |||||||
State income taxes | 447 | 1,679 | 597 | |||||||||
Extraterritorial income exclusion | (893 | ) | (1,439 | ) | (1,494 | ) | ||||||
Other items | 85 | 113 | 618 | |||||||||
Total income tax expense | $ | 26,930 | $ | 15,358 | $ | 9,276 | ||||||
F-19
Table of Contents
Significant components of deferred tax assets and deferred tax liabilities are as follows:
| December 31, | ||||||||
| 2006 | 2005 | |||||||
| (Dollars in Thousands) | ||||||||
Deferred tax assets: | ||||||||
Postretirement benefits | $ | 6,185 | $ | 5,989 | ||||
Pension benefits | 11,265 | 11,837 | ||||||
Inventory | — | 2,022 | ||||||
Accrued and other liabilities | 9,346 | 7,105 | ||||||
Research and development expenditures | 950 | 1,391 | ||||||
Tax loss carryforward | 8,104 | 9,435 | ||||||
Alternative minimum tax credit carryforward | 479 | 479 | ||||||
Foreign tax credit carryforward | 12,216 | 12,190 | ||||||
Unexercised stock options | 13 | 1,728 | ||||||
Other items | 2,165 | 626 | ||||||
| 50,723 | 52,802 | |||||||
Less valuation allowance | (2,767 | ) | (3,711 | ) | ||||
Total deferred tax assets | 47,956 | 49,091 | ||||||
Deferred tax liabilities: | ||||||||
Excess of book basis over tax basis of property, plant and equipment and intangible assets | (17,757 | ) | (20,888 | ) | ||||
Inventory | (2,844 | ) | — | |||||
Total deferred tax liabilities | (20,601 | ) | (20,888 | ) | ||||
Net deferred tax asset | $ | 27,355 | $ | 28,203 | ||||
The classification of the net deferred tax assets and liabilities is as follows:
| December 31, | ||||||||
| 2006 | 2005 | |||||||
| (Dollars in Thousands) | ||||||||
Current deferred tax asset | $ | 11,725 | $ | 18,363 | ||||
Long-term deferred tax asset | 16,117 | 10,355 | ||||||
Current deferred tax liability | (120 | ) | (182 | ) | ||||
Long-term deferred tax liability | (367 | ) | (333 | ) | ||||
Net deferred tax asset | $ | 27,355 | $ | 28,203 | ||||
The current deferred tax liability is included in Income Taxes and the long-term deferred tax liability is included in Pension and Other in the Company’s consolidated balance sheet.
Prior to the fourth quarter of 2004, a valuation allowance had been used to reduce the net deferred tax assets (after giving effect to deferred tax liabilities) for domestic operations to an amount that is more likely than not to be realized. At December 31, 2004, an analysis was completed and the valuation allowance was reversed based on the determination that it is now more likely than not that all deferred tax assets will be realized. A roll-forward of the valuation allowance is presented below:
Balance at Beginning of Period | Additions - Allowance Established | Deductions - Allowance Used | Balance at End of Period | ||||||||||
| (Dollars In Thousands) | |||||||||||||
Year ended December 31, 2004 | $ | 25,638 | $ | — | $ | 21,927 | $ | 3,711 | |||||
Year ended December 31, 2005 | $ | 3,711 | $ | — | $ | — | $ | 3,711 | |||||
Year ended December 31, 2006 | $ | 3,711 | $ | (944 | ) | $ | — | $ | 2,767 | ||||
F-20
Table of Contents
In 2005, income tax expense included a net income tax benefit of $7.0 million, which consisted of $1.8 million of foreign tax expense related to a foreign dividend distribution and the recognition of an income tax benefit of approximately $8.8 million related to foreign tax credits. In 2005, the Company began to quantify the amount of previously unclaimed foreign tax credits which the Company can utilize in part by amending historical income tax returns. In 2006, the Company completed this evaluation and amended the historical income tax returns, and income tax expense for the year ended December 31, 2006 was reduced by an additional net income tax benefit of approximately $4.3 million related to foreign tax credits.
As of December 31, 2006, the Company had available approximately $10.7 million of federal net operating loss carry forwards (“NOL”) from the years 1991 through 1994 that expire in the years 2007 through 2009, to offset against future federal taxable income. Because the 1994 consummation of the Second Amended Joint Plan of Reorganization of B-E Holdings, Inc. and the Company as modified on December 1, 1994 (the “Amended Plan”) resulted in an “ownership change” within the meaning of Section 382 of the Internal Revenue Code, the use of such NOL is limited to $3.6 million per year.
As of December 31, 2006, the Company also had $78.8 million of state NOL (which expire in the years 2007 through 2019) available to offset future state taxable income in various states.
As of December 31, 2006, the Company also had a federal alternative minimum tax credit carryforward of $.5 million, which carries forward indefinitely. Because this credit carryforward arose prior to the effective date of the Amended Plan, it is subject to the annual limitations discussed above and is not usable until the year 2010.
Cumulative undistributed earnings of foreign subsidiaries that are considered to be permanently reinvested and on which U.S. income taxes have not been provided by the Company, amounted to approximately $61.5 million at December 31, 2006. It is not practicable to estimate the amount of additional tax which would be payable upon repatriation of such earnings; however, due to foreign tax credit limitations, higher effective U.S. income tax rates and foreign withholding taxes, additional taxes could be incurred.
In July 2006, the Financial Accounting Standards Board (“FASB”) issued FASB Interpretation No. 48, “Accounting for Uncertainty in Income Taxes” (“FIN 48”). FIN 48 is an interpretation of FASB Statement No. 109, “Accounting for Income Taxes,” and seeks to reduce the diversity in practice associated with certain aspects of measurement and recognition in accounting for income taxes. In addition, FIN 48 requires expanded disclosure with respect to the uncertainty in income taxes and is effective as of the beginning of the Company’s 2007 year. The Company is currently evaluating the impact, if any, that FIN 48 will have on its financial statements.
NOTE I—PENSION AND RETIREMENT PLANS
The Company has several pension and retirement plans covering substantially all of its employees in the United States. All plans have a measurement date of December 31.
At its October 2006 meeting, the Company’s Board of Directors approved the Bucyrus International, Inc. Supplemental Executive Retirement Plan (“SERP”). The SERP, which became effective on October 20, 2006 and applied to 2006, provides an allocation to the Company’s senior management equal to the amount that cannot be allocated to such employees under the Company’s cash balance pension plan due to the Internal Revenue Service-imposed annual compensation limits imposed by the Internal Revenue Service. Benefits are to be paid under the SERP upon the employee’s separation from service in a lump sum or in 5 or 10 annual installments, as the participating employee elects.
In September 2006, the FASB issued SFAS No. 158, “Employers’ Accounting for Defined Benefit Pension and Other Postretirement Plans—an amendment of FASB Statements No. 87, 88, 106, and 132(R)” (“SFAS No. 158”). SFAS No. 158 requires an employer to recognize the over funded or under funded status of a defined
F-21
Table of Contents
benefit postretirement plan (other than a multiemployer plan) as an asset or liability in its balance sheet and to recognize changes in that funded status in the year in which the changes occur through comprehensive income. SFAS No. 158 also requires an employer to measure the funded status of a plan as of the date of its year-end balance sheet. The impact of adopting SFAS No. 158 at December 31, 2006, as required, was as follows:
| Increase (Decrease) | ||||
| (Dollars in Thousands) | ||||
Intangible assets | $ | (4,141 | ) | |
Liability for pension benefits | 1,345 | |||
Deferred income tax assets | 2,027 | |||
Accumulated other comprehensive income | (3,459 | ) | ||
The following tables set forth the plans’ funded status and amounts recognized in the consolidated financial statements at December 31, 2006 and 2005:
| December 31, | ||||||||
| 2006 | 2005 | |||||||
| (Dollars in Thousands) | ||||||||
Change in projected benefit obligation: | ||||||||
Projected benefit obligation at January 1 | $ | 99,510 | $ | 93,272 | ||||
Service cost | 2,531 | 2,148 | ||||||
Interest cost | 5,220 | 5,294 | ||||||
Plan amendments | — | 537 | ||||||
Actuarial loss | (3,641 | ) | 4,510 | |||||
Benefits paid | (6,812 | ) | (6,251 | ) | ||||
Projected benefit obligation at December 31 | 96,808 | 99,510 | ||||||
Change in plan assets: | ||||||||
Fair value of plan assets at January 1 | 59,870 | 60,008 | ||||||
Actual return on plan assets | 7,925 | 3,588 | ||||||
Employer contributions | 9,601 | 2,525 | ||||||
Benefits paid | (6,812 | ) | (6,251 | ) | ||||
Fair value of plan assets at December 31 | 70,584 | 59,870 | ||||||
Net amount recognized: | ||||||||
Funded status | (26,224) | (39,640 | ) | |||||
Unrecognized prior service cost | — | 4,497 | ||||||
Unrecognized net actuarial loss | — | 32,805 | ||||||
Net amount recognized | $ | (26,224 | ) | $ | (2,338 | ) | ||
Amounts recognized in consolidated balance sheets at December 31: | ||||||||
Current pension liabilities | $ | — | $ | (9,600 | ) | |||
Noncurrent pension liabilities | (26,244 | ) | (28,525 | ) | ||||
Intangible asset | — | 4,637 | ||||||
Accumulated other comprehensive loss | — | 31,150 | ||||||
Net amount recognized | $ | (26,224 | ) | $ | (2,338 | ) | ||
Amounts recognized in accumulated other comprehensive income at December 31: | ||||||||
Net actuarial loss | $ | 24,735 | $ | — | ||||
Net prior service cost | 4,045 | — | ||||||
Net amount recognized | $ | 28,780 | $ | — | ||||
Weighted-average assumptions used to determine benefit obligations at December 31: | ||||||||
Discount rate | 5.75 | % | 5.5 | % | ||||
Rate of compensation increase | 4 | % | 4 | % | ||||
F-22
Table of Contents
The accumulated benefit obligation for all defined benefit pension plans was $95.5 million and $98.0 million at December 31, 2006 and 2005, respectively. Information for pension plans with an accumulated benefit obligation in excess of plan assets was as follows:
| December 31, | ||||||
| 2006 | 2005 | |||||
| (Dollars in Thousands) | ||||||
Projected benefit obligation | $ | 96,808 | $ | 99,510 | ||
Accumulated benefit obligation | 95,463 | 97,994 | ||||
Fair value of plan assets | 70,584 | 59,870 | ||||
The components of net periodic benefit cost are as follows:
| Years Ended December 31, | ||||||||||||
| 2006 | 2005 | 2004 | ||||||||||
| (Dollars in Thousands) | ||||||||||||
Service cost | $ | 2,531 | $ | 2,147 | $ | 1,745 | ||||||
Interest cost | 5,220 | 5,294 | 5,221 | |||||||||
Expected return on plan assets | (5,198 | ) | (5,210 | ) | (4,983 | ) | ||||||
Amortization of prior service cost | 452 | 452 | 206 | |||||||||
Amortization of net actuarial loss | 1,700 | �� | 1,575 | 1,325 | ||||||||
Total benefit cost | $ | 4,705 | $ | 4,258 | $ | 3,514 | ||||||
Weighted-average assumptions used to determine net periodic benefit cost for the year: | ||||||||||||
Discount rate | 5.50 | % | 5.75 | % | 6.25 | % | ||||||
Expected return on plan assets | 8.50 | % | 9 | % | 9 | % | ||||||
Rate of compensation increase | 4 | % | 4 | % | 3.75% - 4 | % | ||||||
In selecting the expected long-term rate of return on assets, the Company considered the average rate of earnings expected on the classes of funds invested or to be invested to provide for the benefits of these plans. This included considering the trusts’ targeted asset allocation for the year and the expected returns likely to be earned over the next 20 years. The assumptions used for the return of each asset class are conservative when compared to long-term historical returns.
The Company’s pension plans’ weighted-average actual and targeted asset allocations by asset category at December 31, 2006 and 2005 are as follows:
| December 31, 2006 | December 31, 2005 | |||||||||||
| Actual | Target | Actual | Target | |||||||||
Asset category: | ||||||||||||
Equity securities | 66 | % | 65 | % | 66 | % | 65 | % | ||||
Debt securities | 34 | % | 35 | % | 34 | % | 35 | % | ||||
Total | 100 | % | 100 | % | 100 | % | 100 | % | ||||
The desired investment objective is a long-term real rate of return on assets that is approximately 6% greater than the assumed rate of inflation measured by the Consumer Price Index, currently assumed to be approximately 3%. The target rate of return for the plans has been based upon an analysis of historical returns supplemented with an economic and structural review of each asset class. The Benefit Plan Committee of the Company realizes that market performance varies and that a 6% real rate of return may not be meaningful during some periods. The Benefit Plan Committee also realizes that historical performance is no guarantee of future performance.
F-23
Table of Contents
To achieve these goals the minimum and maximum allocation ranges for fixed securities and equity securities are as follows:
| Minimum | Maximum | |||||
Equity | 63 | % | 67 | % | ||
Fixed | 33 | % | 37 | % | ||
Cash equivalents | 0 | % | 2 | % |
Investment in international oriented equity funds is limited to a maximum of 18.25% of the equity range.
The Company expects to contribute $9.2 million to its domestic pension plans in 2007.
Estimated future benefit payments from the Company’s pension plans are as follows:
| (Dollars in Thousands) | |||
2007 | $ | 6,952 | |
2008 | 7,277 | ||
2009 | 7,040 | ||
2010 | 8,140 | ||
2011 | 7,688 | ||
2012-2016 | 45,031 | ||
The estimated net loss and prior service cost for the defined benefit pension plans that will be amortized from accumulated other comprehensive income into net periodic benefit cost over the next fiscal year are $1.2 million and $.5 million, respectively.
The Company has 401(k) Savings Plans available to substantially all United States employees. Matching employer contributions are made in accordance with plan provisions subject to certain limitations. Matching employer contributions made were $1.5 million, $1.1 million and $.9 million in 2006, 2005 and 2004, respectively.
NOTE J—POSTRETIREMENT BENEFITS OTHER THAN PENSIONS
The Company provides certain health care benefits to age 65 and life insurance benefits for certain eligible retired United States employees. Substantially all current employees may become eligible for those benefits if they reach early retirement age while working for the Company. The measurement date is December 31.
The impact of adopting SFAS No. 158 at December 31, 2006 as required was as follows:
| Increase (Decrease) | ||||
| (Dollars in Thousands | ||||
Liability for postretirement benefits | $ | 1,705 | ||
Deferred income tax assets | 630 | |||
Accumulated other comprehensive income | (1,075 | ) | ||
F-24
Table of Contents
The following tables set forth the plan’s status and amounts recognized in the consolidated financial statements at December 31, 2006 and 2005:
| December 31, | ||||||||
| 2006 | 2005 | |||||||
| (Dollars in Thousands) | ||||||||
Change in benefit obligation: | ||||||||
Benefit obligation at January 1 | $ | 20,184 | $ | 20,144 | ||||
Service cost | 1,020 | 928 | ||||||
Interest cost | 978 | 1,070 | ||||||
Plan participants’ contributions | 148 | 145 | ||||||
Plan amendments | — | (365 | ) | |||||
Net actuarial (gain) loss | (2,534 | ) | (240 | ) | ||||
Benefits paid | (1,122 | ) | (1,498 | ) | ||||
Benefit obligation at December 31 | 18,674 | 20,184 | ||||||
Change in plan assets: | ||||||||
Fair value of plan assets at January 1 | — | — | ||||||
Employer contributions | 974 | 1,353 | ||||||
Plan participants’ contributions | 148 | 145 | ||||||
Benefits paid | (1,122 | ) | (1,498 | ) | ||||
Fair value of plan assets at December 31 | — | — | ||||||
Net amount recognized: | ||||||||
Funded status | (18,674 | ) | (20,184 | ) | ||||
Unrecognized net actuarial loss | — | 5,838 | ||||||
Unrecognized prior service credit | — | (1,672 | ) | |||||
Net amount recognized | $ | (18,674 | ) | $ | (16,018 | ) | ||
Amounts recognized in consolidated balance sheets at December 31: | ||||||||
Current benefit liability | $ | (1,360 | ) | $ | (1,761 | ) | ||
Long-term benefit liability | (17,314 | ) | (14,257 | ) | ||||
Net amount recognized | $ | (18,674 | ) | $ | (16,018 | ) | ||
Amounts recognized in accumulated other comprehensive income at December 31: | ||||||||
Net actuarial loss | $ | 3,128 | $ | — | ||||
Net prior service credit | (1,423 | ) | — | |||||
Net amount recognized | $ | 1,705 | $ | — | ||||
Weighted-average assumptions used to determine benefit obligations at December 31—discount rate | 5.75 | % | 5.5 | % | ||||
| Years Ended December 31 | ||||||||||||
| 2006 | 2005 | 2004 | ||||||||||
| (Dollars in Thousands) | ||||||||||||
Components of net periodic benefit cost: | ||||||||||||
Service cost | $ | 1,020 | $ | 928 | $ | 770 | ||||||
Interest cost | 978 | 1,070 | 1,142 | |||||||||
Amortization of prior service cost | (249 | ) | (249 | ) | (221 | ) | ||||||
Amortization of net actuarial loss | 175 | 311 | 336 | |||||||||
Net periodic benefit cost | $ | 1,924 | $ | 2,060 | $ | 2,027 | ||||||
Weighted average assumptions used to determine net periodic benefit cost—discount rate | 5.50 | % | 5.75 | % | 6.25 | % | ||||||
Assumed health care cost trend rates: | ||||||||||||
Health care cost trend rate assumed for next year | 6 | % | 7 | % | 8 | % | ||||||
Rate to which the cost trend rate is assumed to decline | 5 | % | 5 | % | 5 | % | ||||||
Year that the rate reaches the ultimate trend rate | 2008 | 2008 | 2008 | |||||||||
F-25
Table of Contents
Assumed health care cost trend rates have a significant effect on the amounts reported for the health care plan. A one percentage point change in assumed health care cost trend rates would have the following effects:
One Percentage Point Increase | One Percentage Point Decrease | ||||||
| (Dollars in Thousands) | |||||||
Effect on total of service and interest cost | $ | 224 | $ | (191 | ) | ||
Effect on postretirement benefit obligation | 1,548 | (1,363 | ) | ||||
The Company expects to contribute approximately $1.3 million for the payment of benefits from its postretirement benefit plan in 2007.
Estimated future benefit payments from the Company’s postretirement benefit plan are as follows:
| (Dollars in Thousands) | |||
2007 | $ | 1,332 | |
2008 | 1,280 | ||
2009 | 1,302 | ||
2010 | 1,444 | ||
2011 | 1,602 | ||
2012-2016 | 9,896 | ||
The estimated net loss and prior service cost that will be amortized from accumulated other comprehensive income into net periodic benefit cost over the next fiscal year are $.1 million and $.2 million, respectively.
NOTE K—CALCULATION OF NET EARNINGS PER SHARE OF COMMON STOCK
Basic net earnings per share of common stock was computed by dividing net earnings by the weighted average number of shares of common stock outstanding. Diluted net earnings per share of common stock was computed by dividing net earnings by the weighted average number of shares of common stock outstanding after giving effect to dilutive securities. The following is a reconciliation of the numerators and the denominators of the basic and diluted net earnings per share of common stock calculations for the years ended December 31, 2006, 2005 and 2004:
| Years Ended December 31, | |||||||||
| 2006 | 2005 | 2004 | |||||||
| (Dollars in Thousands) | |||||||||
Net earnings | $ | 70,344 | $ | 53,559 | $ | 6,084 | |||
Weighted average shares outstanding | 31,264,580 | 30,483,453 | 23,197,292 | ||||||
Basic net earnings per share | $ | 2.25 | $ | 1.76 | $ | .26 | |||
Weighted average shares outstanding | 31,264,580 | 30,483,453 | 23,197,292 | ||||||
Effect of dilutive stock options, nonvested shares, stock appreciation rights and performance shares | 275,181 | 762,684 | 1,024,258 | ||||||
Weighted average shares outstanding—diluted | 31,539,761 | 31,246,137 | 24,221,550 | ||||||
Diluted net earnings per share | $ | 2.23 | $ | 1.71 | $ | .25 | |||
NOTE L—SEGMENT AND GEOGRAPHICAL INFORMATION
The Company designs, manufactures and markets large excavation machinery used for surface mining and supplies replacement parts and services for such machines. The Company manufactures its machines and
F-26
Table of Contents
replacement parts primarily at two locations. There is no significant difference in the production process for machines and replacement parts. The Company’s products are sold primarily to large companies and government-owned entities engaged in the mining of copper, coal, oil sands and iron ore throughout the world. New equipment and replacement parts and services are sold in North America primarily by Company personnel and its domestic subsidiaries, and overseas by Company personnel and through independent sales representatives and the Company’s foreign subsidiaries and offices.
Based on the above, the Company’s operations are classified as one operating segment.
The following table summarizes the Company’s sales:
| Years Ended December 31, | |||||||||
| 2006 | 2005 | 2004 | |||||||
| (Dollars in Thousands) | |||||||||
Machines | $ | 255,739 | $ | 180,587 | $ | 132,780 | |||
Parts and services | 482,311 | 394,455 | 321,406 | ||||||
| $ | 738,050 | $ | 575,042 | $ | 454,186 | ||||
Financial information by geographical area is set forth in the following table. In the case of sales to external customers, the amounts presented represent the sales originating in the respective geographic area.
| Sales to External Customers | Long – Lived Assets | |||||
| (Dollars in Thousands) | ||||||
2006 | ||||||
United States | $ | 379,794 | $ | 112,651 | ||
Africa | 36,527 | 950 | ||||
Australia | 118,896 | 443 | ||||
Chile | 96,344 | 3,570 | ||||
Canada | 50,158 | 5,984 | ||||
Other foreign | 56,331 | 1,551 | ||||
| $ | 738,050 | $ | 125,149 | |||
2005 | ||||||
United States | $ | 306,959 | $ | 51,775 | ||
Africa | 37,509 | 994 | ||||
Australia | 76,151 | 248 | ||||
Chile | 63,398 | 3,929 | ||||
Canada | 41,972 | 6,024 | ||||
Other foreign | 49,053 | 1,185 | ||||
| $ | 575,042 | $ | 64,155 | |||
2004 | ||||||
United States | $ | 241,689 | $ | 41,787 | ||
Africa | 38,933 | 1,004 | ||||
Australia | 45,861 | 260 | ||||
Chile | 58,793 | 3,950 | ||||
Canada | 37,808 | 5,480 | ||||
Other foreign | 31,102 | 1,199 | ||||
| $ | 454,186 | $ | 53,680 | |||
The Company does not consider itself to be dependent upon any single customer or group of customers; however, on an annual basis a single customer may account for a large percentage of sales, particularly new
F-27
Table of Contents
machine sales. In 2006, 2005 and 2004, one customer accounted for approximately 13%, 14% and 12%, respectively, of the Company’s sales.
NOTE M—COMMITMENTS, CONTINGENCIES, CREDIT RISKS AND CONCENTRATIONS
Environmental
The Company’s operations and properties are subject to a broad range of federal, state, local and foreign laws and regulations relating to environmental matters, including laws and regulations governing discharges into the air and water, the handling and disposal of solid and hazardous substances and wastes, and the remediation of contamination associated with releases of hazardous substances at the Company’s facilities and at off-site disposal locations. These laws are complex, change frequently and have tended to become more stringent over time. Future events, such as required compliance with more stringent laws or regulations, more vigorous enforcement policies of regulatory agencies or stricter or different interpretations of existing laws, could require additional expenditures by the Company, which may be material.
Environmental problems have not interfered in any material respect with the Company’s manufacturing operations to date. The Company believes that its compliance with statutory requirements respecting environmental quality will not materially affect its capital expenditures, earnings or competitive position. The Company has an ongoing program to address any potential environmental problems.
Certain environmental laws, such as the Federal Comprehensive Environmental Response, Compensation and Liability Act (“CERCLA”), provide for strict, joint and several liability for investigation and remediation of spills and other releases of hazardous substances. Such laws may apply to conditions at properties currently or formerly owned or operated by an entity or its predecessors, as well as to conditions at properties at which wastes or other contamination attributable to an entity or its predecessors come to be located.
The Company has previously been named as a potentially responsible party under CERCLA and analogous state laws at other sites throughout the United States. The Company believes it has determined its remediation liabilities with respect to the sites discussed above and does not believe that any such remaining liabilities, if any, either individually or in the aggregate, will have a material adverse effect on its business, financial condition, results of operations or cash flows. The Company cannot, however, assure that it will not incur additional liabilities with respect to these sites in the future, the costs of which could be material, nor can it assure that it will not incur remediation liability in the future with respect to sites formerly or currently owned or operated by the Company or with respect to off-site disposal locations, the costs of which could be material.
Over the past three years, expenditures for ongoing compliance, remediation, monitoring and cleanup have been immaterial. While no assurance can be given, the Company believes that expenditures for compliance and remediation will not have a material effect on its future capital expenditures, results of operations or competitive position.
Product Warranty
The Company recognizes the cost associated with its warranty policies on its products as revenue is recognized. The amount recognized is based on historical experience. The following is a reconciliation of the changes in accrued warranty costs for the years ended December 31, 2006 and 2005:
| December 31, | ||||||||
| 2006 | 2005 | |||||||
| (Dollars in Thousands) | ||||||||
Balance at January 1 | $ | 5,977 | $ | 5,452 | ||||
Provision | 4,046 | 2,739 | ||||||
Charges | (4,235 | ) | (2,214 | ) | ||||
Balance at December 31 | $ | 5,788 | $ | 5,977 | ||||
F-28
Table of Contents
Product Liability
The Company is normally subject to numerous product liability claims, many of which relate to products no longer manufactured by the Company or its subsidiaries, and other claims arising in the ordinary course of business in federal and state courts. Such claims are generally related to property damage and to personal injury. The Company’s products are operated by its employees and its customers’ employees and independent contractors at various work sites in the United States and abroad. In the United States, workers’ claims against employers related to workplace injuries are generally limited by state workers’ compensation statutes, but such limitations do not apply to equipment suppliers. The Company has insurance covering most of these claims and has various limits of liability depending on the insurance policy year in question. It is the view of management that the final resolution of these claims and other similar claims which are likely to arise in the future will not individually or in the aggregate have a material effect on the Company’s financial position, results of operations or cash flows, although no assurance to that effect can be given.
Asbestos Liability
The Company has been named as a co-defendant in approximately 290 personal injury liability cases alleging damages due to exposure to asbestos and other substances, involving approximately 567 plaintiffs. The Company does not believe that costs associated with these matters will have a material effect on its financial position, results of operations or cash flows, although no assurance to that effect can be given.
A reconciliation of claims pending at December 31, 2006 and 2005 is as follows:
| December 31, | ||||||
| 2006 | 2005 | |||||
Number of claims pending at January 1 | 309 | 300 | ||||
New claims filed | 6 | 24 | ||||
Claims dismissed, settled or resolved | (25 | ) | (15 | ) | ||
Number of claims pending at December 31 | 290 | 309 | ||||
The average claim settlement amount was immaterial in both years.
Other Litigation
A wholly owned subsidiary of the Company is a defendant in a suit pending in the United States District Court for the Western District of Pennsylvania, brought on June 15, 2002, relating to an incident in which a dragline operated by an employee of a Company subsidiary tipped over. The owner of the dragline has sued an unaffiliated third party on a negligence theory for property damages and business interruption losses in a range of approximately $25.0 million to $27.0 million. The unrelated third party has brought a third-party action against the Company’s subsidiary. The Company’s insurance carriers are defending the claim, but have not conceded that the relevant policies cover the claim. As of December 31, 2006, discovery was ongoing and it is not possible to evaluate the outcome of the claim nor the range of potential loss, if any. Therefore, the Company has not recorded any liability with respect to this litigation.
A wholly owned Australian subsidiary of the Company is a defendant in a lawsuit in Queensland, Australia relating to a contractual claim in which the plaintiff, pursuant to a contract with the Company’s subsidiary, agreed to erect a dragline sold by the Company to a customer for use at its mine site. The plaintiff asserts various contractual claims related to breach of contract damages and other remedies related to its claim that it was owed amounts for services rendered under the contract. This claim was settled by the parties in late 2006, pending finalization of dismissal of the legal proceedings, for AUS $2.7 million (US $2.1 million) plus legal costs, which have not yet been finally assessed. Based on the claim amount and estimated legal costs, the Company has established a reserve for its estimate of the resolution of this matter.
F-29
Table of Contents
The Company is involved in various other litigation arising in the normal course of business. It is the view of management that the Company’s recovery or liability, if any, under pending litigation is not expected to have a material effect on the Company’s financial position, results of operations or cash flows, although no assurance to that effect can be given.
Commitments
The Company has obligations under various operating leases and rental and service agreements. The expense relating to these agreements was $10.1 million in 2006, $8.7 million in 2005 and $6.7 million in 2004. Future minimum annual payments under non-cancelable agreements are as follows:
| (Dollars in Thousands) | |||
2007 | $ | 6,971 | |
2008 | 4,689 | ||
2009 | 4,046 | ||
2010 | 3,226 | ||
2011 | 3,137 | ||
After 2011 | 14,915 | ||
| $ | 36,984 | ||
Management Services Agreement
Prior to the completion of the IPO, American Industrial Partners (“AIP”) provided ongoing financial and management services to the Company utilizing the extensive operating and financial experience of AIP’s principals pursuant to a management services agreement among AIP and the Company. The expense recognized related to this agreement was $1.2 million in 2004. The management services agreement was terminated in July 2004 and all amounts owed AIP under the agreement were paid in full in connection with the completion of the Company’s IPO on July 28, 2004.
Credit Risks
A significant portion of the Company’s sales are to customers whose activities are related to the coal, copper and iron ore mining industries, including some who are located in foreign countries. The Company generally extends credit to these customers and, therefore, collection of receivables may be affected by the mining industry economy and the economic conditions in the countries where the customers are located. However, the Company closely monitors extension of credit and has not experienced significant credit losses. Also, most foreign sales are made to large, well-established companies. The Company generally requires letters of credit on foreign sales to smaller companies.
Concentrations
The Company currently purchases alternating current drives and other electrical parts, an important component of its equipment, from Siemens Energy & Automation, Inc. (“Siemens”). The loss of Siemens, the Company’s only critical sole source supplier, could cause a delay in manufacturing and a possible loss of sales, which could have a material adverse effect on the Company’s business.
F-30
Table of Contents
NOTE N—QUARTERLY RESULTS—UNAUDITED
Quarterly results are as follows:
| Quarters Ended at End of | ||||||||||||
| March | June | September | December | |||||||||
| (Dollars in Thousands, Except Per Share Amounts) | ||||||||||||
Net sales: | ||||||||||||
2006 | $ | 165,653 | $ | 181,804 | $ | 184,980 | $ | 205,613 | ||||
2005 | 105,521 | 140,037 | 157,358 | 172,126 | ||||||||
Gross profit: | ||||||||||||
2006 | $ | 40,873 | $ | 46,934 | $ | 47,894 | $ | 51,074 | ||||
2005 | 29,026 | 30,994 | 36,428 | 40,983 | ||||||||
Net earnings: | ||||||||||||
2006 (1) | $ | 14,522 | $ | 21,558 | $ | 16,720 | $ | 17,544 | ||||
2005 (2) | 9,125 | 10,224 | 12,777 | 21,433 | ||||||||
Basic net earnings per common share: | ||||||||||||
2006 | $ | .47 | $ | .69 | $ | .53 | $ | .56 | ||||
2005 | .30 | .34 | .42 | .70 | ||||||||
Weighted average shares outstanding-basic (in thousands): | ||||||||||||
2006 | 31,192 | 31,285 | 31,289 | 31,291 | ||||||||
2005 | 30,102 | 30,441 | 30,651 | 30,731 | ||||||||
Diluted net earnings per common share: | ||||||||||||
2006 | $ | .46 | $ | .68 | $ | .53 | $ | .56 | ||||
2005 | .29 | .33 | .41 | .69 | ||||||||
Weighted average shares outstanding-diluted (in thousands): | ||||||||||||
2006 | 31,527 | 31,616 | 31,499 | 31,518 | ||||||||
2005 | 31,173 | 31,246 | 31,279 | 31,284 | ||||||||
Dividends per common share—Class A common stock: | ||||||||||||
2006 | $ | .0383 | $ | .05 | $ | .05 | $ | .05 | ||||
2005 | .0383 | .0383 | .0383 | .0383 | ||||||||
| (1) | Net earnings for the quarter ended June 30, 2006 includes a net income tax benefit of approximately $3.7 million related to foreign tax credits (see Note H). |
| (2) | Net earnings for the quarter ended December 31, 2005 includes a net income tax benefit of $7.0 million, which consisted of the recognition of an income tax benefit of approximately $8.8 million related to foreign tax credits and $1.8 million of foreign tax expense related to a foreign dividend distribution (see Note H). |
NOTE O—PENDING ACQUISITION
On December 17, 2006, the Company signed a definitive agreement to acquire DBT GmbH (“DBT”), a subsidiary of RAG Coal International AG (“RAG”). DBT is a leading worldwide supplier of complete system solutions for underground coal mining and manufactures equipment including roof support systems, armored face conveyers, plows, shearers and continuous miners used primarily by customers who mine coal. The Company has agreed to pay $710.0 million in cash and issue to RAG 471,476 shares of the Company’s Class A common stock with an initial market value of $21.0 million (based on the average closing price of the Company’s Class A common stock for the 20-day trading period ended December 14, 2006). The transaction is subject to various closing conditions and regulatory approvals.
F-31
Table of Contents
To the Supervisory Board of DBT GmbH:
We have audited the accompanying consolidated balance sheets of DBT GmbH and subsidiaries (“DBT” or the Company) as of December 31, 2006 and 2005, and the related consolidated statements of income, changes in shareholders’ equity and cash flows for each of the years in the three-year period ended December 31, 2006. These consolidated financial statements are the responsibility of the Company’s management. Our responsibility is to express an opinion on these consolidated financial statements based on our audits.
We conducted our audits in accordance with auditing standards generally accepted in the United States of America. Those standards require that we plan and perform the audit to obtain reasonable assurance about whether the financial statements are free of material misstatement. An audit includes consideration of internal control over financial reporting as a basis for designing audit procedures that are appropriate in the circumstances, but not for the purpose of expressing an opinion on the effectiveness of the Company’s internal control over financial reporting. Accordingly, we express no such opinion. An audit also includes examining, on a test basis, evidence supporting the amounts and disclosures in the financial statements, assessing the accounting principles used and significant estimates made by management, as well as evaluating the overall financial statement presentation. We believe that our audits provide a reasonable basis for our opinion.
In our opinion, the consolidated financial statements referred to above present fairly, in all material respects, the financial position of DBT as of December 31, 2006 and 2005, and the results of their operations and their cash flows for each of the years in the three-year period ended December 31, 2006, in conformity with International Financial Reporting Standards, as adopted by the European Union (“IFRS”).
IFRS, as adopted by the European Union, vary in certain significant respects from U.S. generally accepted accounting principles. Information relating to the nature and effect of such differences is presented in Note 30 to the consolidated financial statements.
Essen, Germany
April 30, 2007
KPMG Deutsche Treuhand-Gesellschaft
Aktiengesellschaft
Wirtschaftsprüfungsgesellschaft
F-32
Table of Contents
Consolidated income statements
Note | 2006 | 2005 | 2004 | |||||||
| €’000 | €’000 | €’000 | ||||||||
A. | Continuing operations | |||||||||
1. | Sales | 3.1 | 934,295 | 752,453 | 621,108 | |||||
2. | Cost of sales | 3.1 | 730,548 | 596,025 | 506,019 | |||||
| 203,747 | 156,428 | 115,089 | ||||||||
3. | Other operating income | 3.2 | 18,977 | 25,629 | 25,831 | |||||
4. | Selling expenses | 48,293 | 52,384 | 49,617 | ||||||
5. | General and administrative expenses | 74,333 | 60,449 | 50,510 | ||||||
6. | Other expenses | 3.3 | 10,726 | 9,617 | 10,252 | |||||
| 89,372 | 59,607 | 30,541 | ||||||||
7. | Other interest and similar income | 3.4 | 3,975 | 3,065 | 3,650 | |||||
8. | Interest and similar expenses | 3.5 | 8,562 | 9,398 | 8,450 | |||||
| -4,587 | -6,333 | -4,800 | ||||||||
9. | Profit before tax | 84,785 | 53,274 | 25,741 | ||||||
10. | Income tax | 4 | 21,099 | 15,323 | 7,979 | |||||
11. | Profit of the year from continuing operations | 63,686 | 37,951 | 17,762 | ||||||
B. | Discontinued operations | |||||||||
| Profit of the year from discontinued operations | 5 | 6,603 | 3,752 | 3,958 | ||||||
C. | Profit of the year | 70,289 | 41,703 | 21,720 | ||||||
| Attributable to: | ||||||||||
| Equity holders of the parent | 70,013 | 41,532 | 21,571 | |||||||
| Minority interest | 276 | 171 | 149 | |||||||
| 70,289 | 41,703 | 21,720 | ||||||||
See accompanying notes to the consolidated financial statements
F-33
Table of Contents
Consolidated balance sheets
Note | December 31, 2006 | December 31, 2005 | ||||||
| €’000 | €’000 | |||||||
| Assets | ||||||||
A. | Non-Current Assets | |||||||
1. | Intangible assets | 6 | 3,464 | 4,015 | ||||
2. | Property, plant and equipment | 7 | 104,799 | 87,891 | ||||
3. | Other investments | 8 | 6,680 | 3,514 | ||||
4. | Deferred tax assets | 4 | 14,579 | 10,494 | ||||
5. | Other receivables | 1,747 | 2,598 | |||||
| 131,269 | 108,512 | |||||||
B. | Current Assets | |||||||
1. | Inventories | 9 | 184,424 | 182,328 | ||||
2. | Income tax assets | 57 | 1,537 | |||||
3. | Trade and other receivables | 10 | 250,615 | 239,221 | ||||
4. | Other financial assets | 11 | 4,068 | 5,568 | ||||
5. | Other assets | 7,210 | 11,472 | |||||
6. | Cash and cash equivalents | 12 | 17,069 | 25,311 | ||||
| 463,443 | 465,437 | |||||||
7. | Assets classified as held for sale | 5 | 3,553 | 33,274 | ||||
| 466,996 | 498,711 | |||||||
| 598,265 | 607,223 | |||||||
Note | December 31, 2006 | December 31, 2005 | ||||||
| k€ | k€ | |||||||
| Equity and Liabilities | ||||||||
| A. | Equity | |||||||
| 1. | Subscribed capital | 13 | 21,050 | 21,050 | ||||
| 2. | Capital reserve | 14 | 43,729 | 32,636 | ||||
| 3. | Retained earnings | 15 | 103,709 | 73,417 | ||||
| 4. | Translation reserve | 16 | -2,187 | 597 | ||||
| 5. | Hedging reserve | 17 | 2,484 | -6,229 | ||||
| Equity attributable to equity holders of the parent | 168,785 | 121,471 | ||||||
| 6. | Minority interest | 18 | 531 | 531 | ||||
| 169,316 | 122,002 | |||||||
| B. | Non-Current Liabilities | |||||||
| 1. | Provisions | 19, 20 | 82,917 | 84,711 | ||||
| 2. | Deferred tax liabilities | 4 | 21,583 | 6,038 | ||||
| 3. | Other financial liabilities | 21 | 38,887 | 59,867 | ||||
| 4. | Other liabilities | 1,795 | 0 | |||||
| 145,182 | 150,616 | |||||||
| C. | Current Liabilities | |||||||
| 1. | Provisions | 19 | 76,154 | 85,754 | ||||
| 2. | Income tax liabilities | 831 | 1,340 | |||||
| 3. | Trade payables | 22 | 51,829 | 56,785 | ||||
| 4. | Financial liabilities | 23 | 26,216 | 23,041 | ||||
| 5. | Advance payments | 24 | 86,478 | 112,013 | ||||
| 6. | Other Liabilities | 25 | 39,553 | 39,387 | ||||
| 281,061 | 318,320 | |||||||
| 7. | Liabilities included in disposal groups classified as held for sale | 5 | 2,706 | 16,285 | ||||
| 283,767 | 334,605 | |||||||
| 598,265 | 607,223 | |||||||
See accompanying notes to the consolidated financial statements
F-34
Table of Contents
Consolidated statements of changes in shareholders’ equity
| Attributable to equity holders of the parent | Minority interest | Total equity | ||||||||||||||
| Subscribed capital | Capital reserves | Retained earnings | Translation reserve | Hedging reserve | Total | |||||||||||
€’000 (Note 13) | €’000 (Note 14) | €’000 (Note 15) | €’000 (Note 16) | €’000 (Note 17) | €’000
| €’000 (Note 18) | €’000
| |||||||||
At January 1, 2004 | 21,050 | 32,636 | 64,680 | -4,713 | 3,353 | 117,006 | 848 | 117,854 | ||||||||
Gains/losses on cash flow hedges taken to equity | 0 | 0 | 0 | 0 | -836 | -836 | 0 | -836 | ||||||||
Purchase of minority interest Georg Schlangen GmbH | 0 | 0 | 0 | 0 | 0 | 0 | -42 | -42 | ||||||||
Exchange differences on translating foreign operations | 0 | 0 | 0 | -2,145 | 0 | -2,145 | 70 | -2,075 | ||||||||
Net loss recognized directly in equity | 0 | 0 | 0 | -2,145 | -836 | -2,981 | 28 | -2,953 | ||||||||
Profit of the year | 0 | 0 | 21,571 | 0 | 0 | 21,571 | 149 | 21,720 | ||||||||
Total recognized income and expense for the period | 0 | 0 | 21,571 | 0 | 0 | 21,571 | 149 | 21,720 | ||||||||
Dividends to shareholders | 0 | 0 | -7,359 | 0 | 0 | -7,359 | 0 | -7,359 | ||||||||
At December 31, 2004/January 1, 2005 | 21,050 | 32,636 | 78,892 | -6,858 | 2,517 | 128,237 | 1,025 | 129,262 | ||||||||
Gains/losses on cash flow hedges taken to equity | 0 | 0 | 0 | 0 | -8,746 | -8,746 | 0 | -8,746 | ||||||||
Purchase of minority interest DBT Polska Sp.zo.o | 0 | 0 | 0 | 0 | 0 | 0 | -754 | -754 | ||||||||
Exchange differences on translating foreign operations | 0 | 0 | 0 | 7,455 | 0 | 7,455 | 89 | 7,544 | ||||||||
Net loss recognized directly in equity | 0 | 0 | 0 | 7,455 | -8,746 | -1,291 | -665 | -1,956 | ||||||||
Profit of the year | 0 | 0 | 41,532 | 0 | 0 | 41,532 | 171 | 41,703 | ||||||||
Total recognized income and expense for the period | 0 | 0 | 41,532 | 7,455 | -8,746 | 40,241 | -494 | 39,747 | ||||||||
Dividends to shareholders | 0 | 0 | -47,007 | 0 | 0 | -47,007 | 0 | -47,007 | ||||||||
At December 31, 2005/January 1, 2006 | 21,050 | 32,636 | 73,417 | 597 | -6,229 | 121,471 | 531 | 122,002 | ||||||||
Gains/losses on cash flow hedges taken to equity | 0 | 0 | 0 | 0 | 8,713 | 8,713 | 0 | 8,713 | ||||||||
Exchange differences on translating foreign operations | 0 | 0 | 0 | -2,784 | 0 | -2,784 | -21 | -2,805 | ||||||||
Net income recognized directly in equity | 0 | 0 | 0 | -2,784 | 8,713 | 5,929 | -21 | 5,908 | ||||||||
Profit of the year | 0 | 0 | 70,013 | 0 | 0 | 70,013 | 276 | 70,289 | ||||||||
Total recognized income and expense for the period | 0 | 0 | 70,013 | -2,784 | 8,713 | 75,942 | 255 | 76,197 | ||||||||
Contribution of capital by RCI | 0 | 11,093 | 0 | 0 | 0 | 11,093 | 0 | 11,093 | ||||||||
Dividends to shareholders | 0 | 0 | -39,721 | 0 | 0 | -39,721 | -255 | -39,976 | ||||||||
At December 31, 2006 | 21,050 | 43,729 | 103,709 | -2,187 | 2,484 | 168,785 | 531 | 169,316 | ||||||||
See accompanying notes to the consolidated financial statements
F-35
Table of Contents
Consolidated cash flow statements
Note | 2006 | 2005 | 2004 | |||||||||
| €’000 | €’000 | €’000 | ||||||||||
A. | Cash flows from operating activities | |||||||||||
| 1. | Profit before tax | 84,785 | 53,274 | 25,741 | ||||||||
| 2. | Depreciation (+) and amortization (-) | 13,174 | 14,066 | 14,732 | ||||||||
| 3. | Foreign exchange gain (-)/losses (+) | 1,406 | -4,130 | -1,503 | ||||||||
| 4. | Investment income (-) | -1 | -1 | -66 | ||||||||
| 5. | Interest expense (+) | 3.5 | 8,562 | 9,398 | 8,450 | |||||||
| 6. | Interest revenue (-) | 3.4 | -3,975 | -3,065 | -3,650 | |||||||
| 7. | Gains (-)/losses (+) on retirements of non-current assets | -4,784 | -2,169 | -3,513 | ||||||||
| 8. | Operating result before changes in working capital | 99,167 | 67,373 | 40,191 | ||||||||
| 9. | Decrease (+)/increase (-) in inventories | 9 | -2,096 | -22,305 | -36,455 | |||||||
| 10. | Decrease (+)/increase (-) in trade receivables and other receivables | 10 | -11,394 | -35,904 | -19,517 | |||||||
| 11. | Decrease (-)/increase (+) in trade payables | 22 | -4,956 | 12,987 | 11,921 | |||||||
| 12. | Proceeds from finance lease receivables | 1,209 | 361 | 249 | ||||||||
| 13. | Changes in other working capital | 32,353 | 83,798 | 4,344 | ||||||||
| 14. | Interest paid (-) | -5,057 | -5,440 | -4,302 | ||||||||
| 15. | Income taxes paid (-)/received (+) | 4 | -22,191 | -11,225 | -1,109 | |||||||
| 16. | Net cash from operating activities (total) | 87,035 | 89,645 | -4,678 | ||||||||
B. | Cash flows from investing activities | |||||||||||
| 1. | Proceeds (+) from disposals of property, plant and equipment | 4,076 | 4,353 | 6,118 | ||||||||
| 2. | Purchase (-) of property, plant and equipment | 7 | -46,766 | -14,982 | -23,999 | |||||||
| 3. | Purchase (-) of intangible assets | 6 | -1,315 | -1,040 | -1,056 | |||||||
| 4. | Acquisition (-) of other investments | 0 | -799 | 0 | ||||||||
| 5. | Disposal of subsidiaries, net cash disposed of | 10,033 | 0 | 0 | ||||||||
| 6. | Acquisition (-) of subsidiaries | -1,900 | -1,238 | -150 | ||||||||
| 7. | Repayments (+)/payments (-) on fixed-term bank deposits | 11 | 3,911 | -3,911 | 0 | |||||||
| 8. | Interest received | 3.4 | 3,975 | 3,065 | 3,650 | |||||||
| 9. | Dividend received | 1 | 1 | 66 | ||||||||
| 10. | Net cash used in investing activities | -27,985 | -14,551 | -15,371 | ||||||||
C. | Cash flows from financing activities | |||||||||||
| 1. | Dividend payments to/contribution of shareholders of the parent (profit and loss transfer agreement) | -47,007 | -7,359 | 1,190 | ||||||||
| 2. | Dividend payments to minority shareholders | -255 | 0 | 0 | ||||||||
| 3. | Repayments (+)/payments (-) from financial relations with RAG Coal International GmbH | -33,977 | -41,553 | 36,275 | ||||||||
| 4. | Repayment of loan from RAG Coal International GmbH | -759 | -847 | -734 | ||||||||
| 5. | Repayment of other borrowings | -660 | -589 | -2,052 | ||||||||
| 6. | Payments of finance lease liabilities | -2,331 | -2,338 | -2,809 | ||||||||
| 7. | Net cash provided by (used in) financing activities | -84,989 | -52,686 | 31,870 | ||||||||
D. | Cash funds at the end of period | |||||||||||
| 1. | Change in cash and cash equivalents | -25,939 | 22,408 | 11,821 | ||||||||
| 2. | Change in cash and cash equivalents due to exchange rate movements | -1,896 | 1,600 | -131 | ||||||||
| 3. | Change in cash and cash equivalents due to changes in scope of consolidation | 0 | -605 | 0 | ||||||||
| 4. | Cash and cash equivalents at beginning of year | 44,959 | 21,556 | 9,866 | ||||||||
| 5. | Cash and cash equivalents at end of year | 17,124 | 44,959 | 21,556 | ||||||||
E. | Cash funds at the end of period | 17,124 | 44,959 | 21,556 | ||||||||
| thereof included in assets classified as held for sale | 5 | 55 | 19,648 | 0 | ||||||||
See accompanying notes to the consolidated financial statements
F-36
Table of Contents
DBT GmbH—Notes to the consolidated financial statements
1. Corporate information
DBT GmbH (DBT) is majority-owned by RAG Coal International GmbH (RCI) with a 94.89% interest and RB Verwaltungsgesellschaft für die Beteiligung an der Rütgerswerke mbH with a 5.11% interest. The headquarters are located in Lünen, Germany.
DBT and its subsidiaries (DBT Group or the Company) are manufacturers and suppliers of complete system solutions for underground coal mining worldwide. The DBT Group manufactures and supplies a full range of equipment from hydraulic shield supports, electro hydraulic controls, conveyors, plows and shearers to crushers, continuous miners, roof bolters, battery-driven scoops, haulers and diesel transport vehicles.
DBT has subsidiaries in various major coal-producing countries with foreign operations currently accounting for approximately 90% of sales.
Signing of the sales and purchase agreement DBT GmbH
In accordance with share purchase agreement dated December 16, 2006 DBT will be sold by its current shareholders in two phases. Under the first phase Bucyrus International Inc., a company publicly listed with the U.S. Securities and Exchange Commission and registered in South Milwaukee, Wisconsin will purchase 49.9% of the shares of DBT GmbH and in the second phase, Bucyrus will purchase the remaining 50.1% not later than December 31, 2009. The second step is based on a forward sale at a fixed price. During this transitional period prior to the second phase, the remaining 50.1% of the shares will be held by Hamburg Trust GmbH, a company held by Prof. H. M. Schulte, owner of Bankhaus Wôlbern in Hamburg.
2. Basis of presentation
DBT GmbH and its subsidiaries are incorporated into the consolidated financial statements of RAG Aktiengesellschaft (RAG—the ultimate parent—). RAG is located at 45128 Essen, Rellinghauser Straße 1-11 and is registered at the commercial register of the Amtsgericht Essen, HRB No. 1712. DBT GmbH is located at 44534 Lünen, Industriestraße 1 and is registered at the commercial register of the Amtsgericht Dortmund, HRB No. 17120.
2.1 Basis of preparation and statement of compliance
The consolidated financial statements of DBT GmbH, Lünen, and all its subsidiaries have been prepared in conformity with International Financial Reporting Standards (IFRS) as adopted by the European Union (E.U.).
The consolidated financial statements are presented in Thousand Euro (€).
The Group’s income statement is prepared using the cost of sales method.
The consolidated financial statements were authorized for issue by the Management Board on April 30, 2007.
Basis of consolidation
The consolidated financial statements include the financial statements of DBT GmbH and its subsidiaries comprising consolidated balance sheets as of December 31, 2006 and 2005 and the related consolidated statements of income, changes in shareholders’ equity and cash flows for each of the years in the three-year period ended December 31, 2006. The subsidiaries’ financial statements are prepared as of the same reporting date of the parent company, using consistent accounting policies.
F-37
Table of Contents
DBT GmbH—Notes to the consolidated financial statements—(Continued)
Subsidiaries are entities controlled by the Group. Control exists when the Group has the power to govern the financial and operating policies of an entity so as to obtain benefit from its activities. Subsidiaries are fully consolidated from the date of acquisition, being the date on which the Group obtains control, and continue to be consolidated until the date such control ceases.
The subsidiaries consolidated with DBT GmbH are:
| % Ownership interest as of December, 31 | ||||||||
Name | Country of incorporation | 2006 | 2005 | 2004 | ||||
DBT Transporttechnik Saar GmbH (1) | Germany | — | 100.00 | 100.00 | ||||
DBT Maschinenfabrik Scharf GmbH (1) | Germany | — | 100.00 | 100.00 | ||||
DBT Automation GmbH (2) | Germany | — | — | 100.00 | ||||
DBT Bergbau-Service GmbH | Germany | 100.00 | 100.00 | 100.00 | ||||
DBT Mining Engineers GmbH | Germany | 100.00 | 100.00 | 100.00 | ||||
DPM Gesellschaft für deutsch polnischen Maschinenhandel und Leasing GmbH | Germany | 100.00 | 100.00 | 100.00 | ||||
DBT China GmbH (3) | Germany | — | 100.00 | 100.00 | ||||
DBT Mineral Processing GmbH (1) | Germany | — | 100.00 | 100.00 | ||||
DBT France S.A.R.L. (4) | France | — | — | 100.00 | ||||
DBT Polska Sp. z o.o. (5) | Poland | 100.00 | 100.00 | 87.00 | ||||
DBT GB Ltd. | Great Britain | 100.00 | 100.00 | 100.00 | ||||
Tangshan DBT Machinery Co. Ltd. | China | 100.00 | 100.00 | 100.00 | ||||
DBT Coal Preparation Equipment and Engineering Ltd. (6) | China | — | 100.00 | 100.00 | ||||
Shenhua DBT Belt Conveyor Co. Ltd. | China | 66.67 | 66.67 | 66.67 | ||||
DBT (Langfang) MINE TECHNIK Co. Ltd. | China | 100.00 | 100.00 | 100.00 | ||||
DBT America Inc. | United States of America | 100.00 | 100.00 | 100.00 | ||||
DBT Australia Pty. Ltd. | Australia | 100.00 | 100.00 | 100.00 | ||||
DBT Australia LAD Pty. Ltd. | Australia | 100.00 | 100.00 | 100.00 | ||||
DBT Diesel Inc. (7) | Australia | — | — | 100.00 | ||||
DBT Africa Pty. Ltd. | South Africa | 100.00 | 100.00 | 100.00 | ||||
| (1) | The shares in DBT Transporttechnik Saar GmbH, DBT Maschinenfabrik Scharf GmbH and DBT Mineral Processing GmbH were sold in 2006. |
| (2) | DBT Automation GmbH merged with DBT GmbH in 2005. |
| (3) | DBT China GmbH merged with DBT GmbH in 2006. |
| (4) | The shares in DBT France S.A.R.L. were sold in 2005. |
| (5) | Since DBT Polska Sp. z o.o. was a consolidated subsidiary of DBT GmbH (87%), the costs of the remaining shares acquired in 2005 (13%) were recognized as goodwill (€ 194). |
| (6) | DBT Coal Preparation Equipment and Engineering Ltd. merged with DBT (Langfang) MINE TECHNIK Co. Ltd. in 2006. |
| (7) | DBT Diesel Inc. was liquidated in 2005. |
Methods of Consolidation
At the acquisition date assets, liabilities and contingent liabilities of the subsidiaries are stated with their fair value. Remaining excess of cost over fair value of net assets acquired is capitalized as goodwill whereas
F-38
Table of Contents
DBT GmbH—Notes to the consolidated financial statements—(Continued)
remaining excess of fair value of net assets acquired over cost is realized affecting the net income since January 1, 2003 which was the transition date of RAG (ultimate parent) according to IFRS 1.24a. In context of the disposition of a business the allocated goodwill is taken into account while calculating the gain or loss from the sale.
All intra-Group balances, transactions, income and expenses and profits and losses resulting from intra-Group transactions are eliminated in consolidation.
Minority interest is presented in the consolidated balance sheet within equity, separately from equity attributable to equity holders of DBT. Minority interest in the profit or loss of the DBT Group is also disclosed separately in the income statement.
2.2 Significant accounting estimates
Estimation uncertainty
The preparation of financial statements requires management to make judgments, estimates and assumptions that affect the application of accounting policies and the reported amounts of assets, liabilities, income and expenses. Actual results may differ from these estimates. Estimates and assumptions are reviewed on an ongoing basis. Revisions to accounting estimates are recognized in the period in which the estimate is revised and in any future periods affected. Management judgment has the greatest impact in the selection of valuation methods and assumptions that underlie the measurement of provisions, the useful life of assets, the impairment of assets, the recoverability of tax assets or the revenue recognition on construction contracts.
Estimates and assumptions
The key assumptions concerning the future and other key sources of estimation uncertainty as of the balance sheet date, that have a significant risk of causing a material adjustment to the carrying amounts of assets and liabilities within the next financial year are discussed below.
Impairment of goodwill
The Group determines whether goodwill is impaired at least annually or more frequently when an indicator of impairment arises during the reporting year. This requires an estimation of the cash-generating units’ fair value or “value in use” to which the goodwill is allocated. Estimating the “value in use” requires management to make an estimate of the expected future cash flows from the cash-generating unit and also to choose an appropriate discount rate in order to calculate the present value of those cash flows.
Deferred tax assets
Deferred tax assets are recognized for all unused tax losses to the extent that it is probable that taxable profit will be available against which the losses can be utilized. Significant judgment is required by management to determine the amount of deferred tax assets that can be recognized, based upon the likely timing and level of future tax profits together with future tax planning strategies.
Pension and other post employment benefits
The cost of defined pension plans and other post employment benefits is determined using actuarial valuations. The actuarial valuation involves making assumptions about discount rates, future salary increases, mortality rates and future pension increases. Due to the long term nature of these plans, such estimates are subject to significant uncertainty.
F-39
Table of Contents
DBT GmbH—Notes to the consolidated financial statements—(Continued)
Warranty provisions
The determination of warranty provisions is based on historical warranty data and a weighting of all possible outcome against their associated probabilities.
Commitments and contingencies
Liabilities for loss contingencies arising from claims, assessments, litigation, fines and penalties and other sources are recorded when it is more likely than not that a liability has been incurred and the amount of the assessment can be reasonably estimated.
Revenue recognition on construction contracts
Certain Group entities conduct a portion of their business under long-term construction contracts which are accounted for using the percentage-of-completion method. These contracts relate to the manufacture of mining equipment, which can take up to 2 years to manufacture and obtain customer acceptance. Under this method, DBT recognizes revenue based on the ratio of estimated costs incurred to date in relation to the total costs to be incurred (the cost-to-cost method). At the time a loss contract becomes known, the amount of estimated loss is recognized under provisions for sales areas. The complexity of the cost estimation process, including loss contracts, requires accurate estimates of total contract costs, remaining costs to completion, total revenues, contract risks and other judgments that affect the amounts recorded in the financial statements. A number of internal and external factors affect these estimates, including future cost of materials, change requests, etc. If the management had used different assumptions in the calculation of the estimate of costs to complete, it is likely that materially different amounts would be reported. The management continually reviews all estimates involved in such construction contracts and adjusts them as necessary.
2.3 Summary of significant accounting policies
The accounting policies set out below have been applied consistently to all periods presented in these consolidated financial statements.
The accounting policies have been applied consistently by all Group entities included in the consolidated financial statements.
Foreign currency translation
The consolidated financial statements are presented in Euro, which is the DBT GmbH’s functional and DBT Group’s presentation currency. Each entity in the Group determines its own functional currency and items included in the financial statements of each entity are measured using that functional currency. Transactions in foreign currencies are initially recorded at the exchange rate at the date of the transaction. Monetary assets and liabilities denominated in foreign currencies are retranslated at the exchange rate at the balance sheet date. All transaction gains and losses are recorded in the income statement. Non-monetary items that are measured in terms of historical cost in a foreign currency are translated using exchange rates as at the dates of the initial transactions.
At the reporting date, the assets and liabilities of the foreign subsidiaries are translated into the presentation currency of DBT Group (Euro) at the exchange rate at the balance sheet date and the income and cash flow statements are translated at the weighted average exchange rates of the year. The exchange differences arising from the translation are recorded in separate component of equity. On disposal of a foreign entity, the cumulative amount recognized in equity relating to that particular foreign operation is recognized in the income statement.
F-40
Table of Contents
DBT GmbH—Notes to the consolidated financial statements—(Continued)
Measurement of fair values of derivatives
Derivative financial instruments are only used to manage operational exposures to foreign exchange risks. All derivative financial instruments are carried at fair value based on discounted cash flow calculations. These calculations take into consideration assumptions based on market data. The derivative financial instruments only consist of foreign currency forwards and foreign currency swaps. Purchases and sales of derivatives are accounted for as of the trade date.
Non-current assets classified as held for sale (or disposal groups) and discontinued operations
Non-current assets (or disposal groups) are classified as held for sale if their carrying amount will be recovered principally through a sale transaction rather than continuing use. The condition is met when the sale is highly probable and the assets classified as held for sale (or the disposal group) are available for immediate sale in the present condition. Management must be committed to the sale, and it is expected that the sale will occur within one year from the date of classification.
Non-current assets classified as held for sale (or disposal groups) are measured at the lower of their carrying amounts or fair value less cost to sell.
Property, plant and equipment
Owned assets
Property, plant and equipment are stated at cost less accumulated depreciation and impairment losses. Such costs include the costs directly attributable to bring the asset to a working condition for its intended use. The cost of self constructed assets include the costs of materials, direct labor, the initial estimate, where relevant, cost of dismantling and removing the items and restoring the site on which they are located, and an appropriate proportion of production overheads.
If an item of property, plant and equipment consists of several components with different useful lives, the individual components are accounted for as separate items of property, plant and equipment.
Depreciation
Depreciation is recognized in the income statement and calculated over the estimated useful lives of the assets on a straight-line basis.
The assets’ useful lives are estimated as follows:
| 2006 | 2005 | 2004 | ||||
Owned buildings | 5 to 40 | 5 to 40 | 5 to 40 | |||
Leased buildings | 30 – 45 | 30 – 45 | 45 | |||
Plant and equipment | 1 to 16 | 1 to 16 | 1 to 16 |
Land is not depreciated. Depreciation methods, useful lives and residual values are reviewed as of each reporting date.
Derecognition
An item of property, plant and equipment is derecognized upon disposal or when no future economic benefits are expected from its use or disposal. Any gain or loss arising on derecognition of the asset (calculated
F-41
Table of Contents
DBT GmbH—Notes to the consolidated financial statements—(Continued)
as the difference between the net disposal proceeds and the carrying amount of the asset) is included in the income statement in the year the asset is derecognized.
Leased assets
Leases in which the Group assumes substantially all the risks and rewards of ownership are classified as finance leases. The property acquired through a finance lease is stated at an amount equal to the lower of its fair value or the present value of the minimum lease payments at inception, less accumulated depreciation and impairment losses.
Leased assets are generally depreciated over the shorter of the lease term or the useful lives, unless the company will take ownership of the asset at the end of the lease term and then, in such cases, are depreciated over the useful lives.
Subsequent costs
Subsequent costs are capitalized in property, plant and equipment if it is probable that the future economic benefits embodied with the subsequent cost will flow to the Group and it can be measured reliably. All other costs are recognized in the income statement as an expense as incurred.
Borrowing costs
Borrowing costs are expensed as incurred and not capitalized.
Intangible assets
Goodwill
For business acquisitions that have occurred since January 1, 2003 (date of the transition to IFRS by ultimate parent RAG) goodwill represents the excess of acquisition cost over the Group’s interest in the net fair value of identifiable assets, liabilities and contingent liabilities.
For acquisitions prior to January 1, 2003 goodwill is recorded as it was recognized under previous GAAP (German GAAP), in accordance with the transition provisions of IFRS 1. Therefore, the classification and accounting treatment of business combinations that occurred prior to January 1, 2003 have not been reconsidered.
Research and development costs
Research costs are expensed as incurred. An intangible asset arising from development expenditures on an individual project is recognized only when the Group can demonstrate the technical feasibility of completing the intangible asset so that it will be available for use or sale, the intention to complete it and the ability to use or sell the asset, how the asset will generate future economic benefits, the ability of resources to complete and the ability to measure reliably the expenditure during the development. Following the initial recognition of the development expenditure, the asset is carried at cost less any accumulated amortization and accumulated impairment losses. The expenditures capitalized are amortized over the period of expected future sales from the related project. The carrying value of development costs is reviewed for impairment annually or when an indicator of impairment arises.
Patents, licenses and other intangible assets
Intangible assets acquired separately are measured on initial recognition at cost. The cost of intangible assets acquired in a business combination is fair value as at the date of acquisition. Following initial recognition,
F-42
Table of Contents
DBT GmbH—Notes to the consolidated financial statements—(Continued)
intangible assets are carried at cost less any accumulated amortization and any impairment losses. The useful life of patents is from two up to fifteen years. Other intangible assets, which include trade marks, licenses and software, have useful lives that vary between two and three years. Purchased software licenses are amortized over an estimated lifetime of two or three years. Intangible assets are amortized over the useful economic life and assessed for impairment whenever there are indicators that the intangible asset may be impaired. The amortization period and the amortization method for an intangible asset are reviewed at least at each reporting date. Changes in the expected useful life or the expected pattern of consumption of future economic benefits embodied in the asset are accounted for by changing the amortization period or method, as appropriate, and treated as changes in accounting estimates.
Impairment of assets
The carrying amounts of the Group’s non-financial assets other than inventories and deferred tax assets are reviewed at each reporting date. The Group assesses whether there are indicators that an asset is impaired. If any such indicators exist, or when annual impairment testing for an asset is required, the Group makes an estimate of the asset’s recoverable amount. An asset’s recoverable amount is the higher of an asset’s fair value less costs to sell and its value in use and is determined for an individual asset, unless the asset does not generate cash inflows that are largely independent of those from other assets or groups of assets in which case it would be measured as part of the cash generating unit. Where the carrying amount of an asset exceeds its recoverable amount, the asset is considered impaired and is written-down to its recoverable amount. In assessing the value in use, the estimated future cash flows are discounted to their present value using a pre-tax discount rate that reflects current market assessments of the time value of money and the risks specific to the asset. The value in use is calculated on the basis of past values, using a three year plan. A cash generating unit is the smallest identifiable asset group that generates cash flows that are largely independent from the other asset groups. For the DBT consolidated financial statements the structure of the cash generating units corresponds to the business units of DBT. Impairment losses from continuing operations are recognized in the consolidated income statement in those expense categories consistent with the function of the impaired asset.
An assessment was performed at each reporting date as to whether there are any indicators that previously recognized impairment losses may no longer exist or may have decreased. If such indicators exist, the recoverable amount is estimated. The reversal of a previously recognized impairment loss is limited by the amount an impairment loss was previously recognized. The increased amount cannot exceed the carrying amount that would have been determined, net of depreciation, had no impairment loss been recognized for the asset in prior years. Such reversal is recognized in the income statement. After such a reversal the depreciation charge is adjusted in future periods to allocate the asset’s revised carrying amount, less any residual value, on a systematic basis over its remaining useful life.
Goodwill impairment
Goodwill is reviewed for impairment annually or more frequently if events or changes in circumstances indicate that the carrying value may be impaired.
Impairment is determined for goodwill by assessing the recoverable amount of the cash-generating unit to which the goodwill relates. Where the recoverable amount is less than the carrying amount of the cash-generating unit to which the goodwill is allocated, an impairment loss is recognized. Impairment losses relating to goodwill cannot be reversed in future periods. The Group performs its annual impairment test of goodwill as at December 31.
In 2006 and 2005 there was no impairment of goodwill. In 2004, there was a goodwill impairment of € 108 (see Note 6).
F-43
Table of Contents
DBT GmbH—Notes to the consolidated financial statements—(Continued)
Inventories
Inventories are valued at the lower of cost and net realizable value. Net realizable value is the estimated selling price in the ordinary course of business, less estimated costs of completion and the estimated costs necessary to make the sale. Cost of inventories includes the transfer from equity of gains and losses on qualifying cash flow hedges in respect of the purchases of raw materials.
Costs incurred in bringing each product to its present location and condition are accounted for as follows:
Raw materials—purchase cost measured using the weighted-average cost method.
Finished goods and work in progress—cost of direct materials and labor and a proportion of manufacturing overheads based on normal operating capacity, excluding borrowing costs.
Borrowing costs are expensed as incurred.
Derecognition of financial assets and liabilities
Financial assets
Financial assets are derecognized when the rights to receive cash flows from the asset have expired or the Group has transferred its rights to receive cash flows from the asset and has transferred substantially all the risks and rewards of the asset or has transferred control of the asset. Gains and losses are recognized in the income statement when the financial assets are derecognized.
Financial liabilities
A financial liability is derecognized when the obligation under the liability is discharged or cancelled or expires.
When the terms of an existing liability are substantially modified (including with the same lender), the original liability is derecognized and a new liability is recognized. The difference in the respective carrying amounts is recognized in the income statement.
Impairment of financial assets
The Group assesses at each reporting date whether a financial asset or group of financial assets are impaired.
Assets carried at amortized cost
If there is objective evidence that assets carried at amortized cost (e.g. loans receivable, other receivables or certain investments in equity instruments) are impaired, an impairment loss is recorded. The amount of the loss is measured as the difference between the asset’s carrying amount and the present value of estimated future cash flows (excluding future credit losses that have not been incurred) discounted at the financial asset’s original effective interest rate. The carrying amount of the asset is reduced and the impairment loss is recognized in the income statement. If no objective evidence of impairment exists for an individual financial asset, the asset is grouped with financial assets that have similar credit risk characteristics and they are collectively assessed for impairment.
If, in a subsequent period, the amount of the impairment loss decreases based on events occurring after the impairment was recognized, the previously recognized impairment loss is reversed and recognized in the income statement, to the extent that the carrying value of the asset does not exceed its amortized cost at the reversal date. During 2006, 2005 and 2004 no impairment losses have been recorded.
F-44
Table of Contents
DBT GmbH—Notes to the consolidated financial statements—(Continued)
Provisions
Provisions are recognized when the Group has a legal or constructive obligation as a result of a past event for which it is probable that there will be an outflow of resources required to settle the obligation and this outflow can be reliably measured. If the Group expects some or all of a provision to be reimbursed, the reimbursement is recognized as a separate asset when it is virtually certain such amount will be received. The expense relating to any provision is presented in the income statement net of any reimbursement.
Provisions are recognized at their expected settlement amount. Long-term provisions are discounted using a current pre-tax rate that reflects, where appropriate, the risks specific to the liability.
Provisions for sales areas
Provisions for sales areas comprise provisions for warranty, onerous contracts and penalties. Provisions for warranty are recognized when the underlying products or services are sold. The provisions are based on historical warranty data and a weighting of all possible outcomes against their associated probabilities.
Provisions for onerous contracts are recognized when the expected benefits to be derived by the Group from a contract are lower than the unavoidable cost of meeting its obligations under the contract. Provisions are recorded based on the lower of the present value of the expected cost of terminating the contract or the present value of the expected net cost of continuing with the contract.
Provisions for losses on contracts accounted for using the percentage-of-completion method are recognized in the provisions for sales areas at the time it becomes known that a contract will result in a loss. The loss is measured at the amount that the total estimated costs exceeds total estimated revenues.
Pensions and other post employment benefits
Defined contribution plans
Obligations for contributions to defined contribution pension plans are recognized as an expense in the income statement as incurred.
Defined benefit plans
Provisions for pensions include postretirement benefits, benefits for disability and benefits for surviving dependents for German entities. There are no pension plans at the foreign subsidiaries. Defined benefit plans are recognized based on the present value of the defined benefit obligation less past service cost not yet recognized and less unrecognized actuarial gains or losses.
The defined pension obligation and other post employment obligations are measured using the projected unit credit actuarial valuation method. This method takes into account pensions and entitlements to pensions known at the balance sheet date as well as future raises of remuneration and pensions.
When the benefits of a plan are amended, the portion of any increase in the defined benefit obligation relating to past services by employees is recognized in the income statement on a straight-line basis over the average period until the benefits become vested. To the extent that the benefits vest immediately, the expense is recognized immediately in the income statement.
All actuarial gains and losses as at January 1, 2003 (the date of RAG transition to IFRS) were recognized in retained earnings. Actuarial gains and losses originating subsequent to January 1, 2003 are recognized as income
F-45
Table of Contents
DBT GmbH—Notes to the consolidated financial statements—(Continued)
or expense when the net cumulative unrecognized actuarial gains and losses at the end of the previous reporting year exceed 10% of the defined benefit obligation at the end of the previous reporting period. These exceeding gains and losses are recognized over the expected average remaining service period of the employees participating in the plans.
Other long-term benefits
Other long-term benefits include long-term service benefits, other than pension plans. These benefits are recognized as an obligation at the amount of future benefit that employees have earned in return for their service in the current and prior periods. Actuarial gains and losses as well as all past service cost are recognized in the income statement immediately.
Advance payments
Advance payments include amounts received in excess of related costs and earnings on uncompleted contracts for contracts that are accounted for using the percentage-of-completion method and amounts received for the sales of goods.
Leases
Contracts are deemed to contain a lease if, at inception, the arrangement is dependent on the use of a specific asset or specific assets and the arrangement conveys a right to use the asset. This lease is accounted for separately from other non-lease elements in an arrangement.
DBT Group as lessee
Leases are accounted for as finance leases, when the lease arrangement transfers substantially all the risks and rewards incidental to ownership of the leased item. Leases are capitalized at the inception of the leased property at the lower of fair value or the present value of the minimum lease payments. Lease payments are apportioned between the finance charges and reduction of the lease liability using the effective interest method. Finance charges are charged directly against income. Capitalized leased assets are generally depreciated over the shorter of the lease term or the useful lives, unless the company will take ownership of the asset at the end of the lease term and then, in such cases, are depreciated over the useful lives.
Other leases are accounted for as operating leases. Operating lease payments are recognized as an expense in the income statement on a straight-line basis over the lease term.
DBT Group as lessor
Leases where the DBT Group retains substantially all the risks and benefits of ownership of the asset are accounted for as operating leases. Initial direct costs incurred in negotiating an operating lease are added to the carrying amount of the leased asset and recognized over the lease term on the same bases as rental income.
Leases, which transfer substantially all the risks and rewards incidental to ownership of the leased item, are accounted for as finance leases. A receivable is recognized at an amount equal to the net investment in the lease. Lease payments are apportioned between the receivable and finance income using the effective interest method.
F-46
Table of Contents
DBT GmbH—Notes to the consolidated financial statements—(Continued)
Revenue recognition
As a manufacturer and supplier of complete system solutions for underground coal mining, the DBT Group offers capital equipment and customer services worldwide. The capital equipment products of DBT Group can be subdivided in two main product lines:
| 1. | Longwall |
| 2. | Room & Pillar |
The main products within the range Longwall are:
| a. | Roof support (shields) |
| b. | Armored face conveyors and plows (AFC/plow) |
| c. | Shearers |
The main products within the range Room & Pillar are:
| d. | Continuous Miners |
| e. | Transportation equipment |
| f. | Belt systems |
Revenues from the sale of shearers and all Room & Pillar products are recognized as product sales, i.e. when the significant risks and rewards of ownership have been transferred to the buyer and the amount of revenue can be measured reliably. Revenue from services, such as maintenance and training, is recognized when services are rendered. No revenue is recognized if there are significant uncertainties regarding recovery of the consideration due or the possible return of goods. Revenue is recognized net of applicable provisions for discounts and allowances.
The manufacture of roof support (shields) and armored face conveyors and plows (AFC/plow) are accounted for using the percentage-of-completion method, which recognizes revenue based on the ratio of estimated costs incurred to date to total estimated cost for each contract (cost-to-cost method). Revenues net of advance payments received are recognized as trade accounts receivable in the balance sheet. Variations in contract work, claims and incentive payments are included in the estimate to complete to the extent that they have been agreed with the customer.
When income of a construction contract cannot be estimated reliably, contract revenue is recognized to the extent that it is probable to be recovered.
Contract costs are recognized as expense in the period in which they are incurred.
If it is probable that total contract costs will exceed total contract revenue, the expected loss is recognized as an expense immediately.
Taxes
The German DBT Group companies were part of RCI’s tax group (with its ultimate parent, RAG) until and including the year 2006. The German tax consolidation system permits groups to be treated as a single entity for corporate income tax purposes and trade tax purposes. A single consolidated annual tax return is prepared and the Group’s parent is liable for the income tax liabilities of the entire Group. In preparing these consolidated
F-47
Table of Contents
DBT GmbH—Notes to the consolidated financial statements—(Continued)
financial statements of the Group, current corporate income taxes are recognized as amounts paid by DBT Group based on the contractual agreements with RCI for 2006. The existing profit and loss transfer agreement terminated as of December 31, 2006. As the German DBT Group companies ceased to be members of RCI’s German tax consolidation group for the years 2007 and later, DBT GmbH and its German subsidiaries will be regarded as a separate tax consolidation group beginning January 1, 2007.
Current tax
Current tax assets and liabilities for the current and prior periods are measured at the amount expected to be recovered from or paid to the taxation authorities. The tax rates and tax laws used to compute the amount are those that are enacted or substantively enacted as of the reporting date.
Deferred tax
Deferred tax is accounted for using the balance sheet liability method, in which temporary differences between the carrying amounts of assets and liabilities for financial reporting purposes and the carrying amounts used for taxation purposes, except for goodwill which is not deductible for tax purposes, the initial recognition of assets or liabilities that affect neither accounting nor taxable profit and differences relating to investments in subsidiaries to the extent that they will probably not reverse in the foreseeable future.
A deferred tax asset is recognized only to the extent that it is probable that future taxable profits will be available against which the asset can be utilized. Deferred tax assets are reduced to the extent that it is no longer probable that the related tax benefit will be realized.
Deferred tax assets and liabilities are measured at the tax rates that are expected to apply to the year when the asset is realized or the liability is settled, based on tax rates (and tax laws) that have been enacted or substantively enacted at the balance sheet date. The tax rate for domestic entities is 26.38% for those companies which entered into a profit and loss transfer agreement with their parent company and are therefore part of the tax group of RCI. It includes the corporate income tax rate of 25% and the solidarity surcharge of 5.5% on the corporate income tax. Companies which are not part of the tax group have to pay an additional trade tax at a rate of 12,6% (after corporate tax) for an overall tax rate of 39%. For foreign entities the individual local tax rates are used. Income tax relating to items recognized directly in equity is recognized directly in equity. Deferred tax assets and deferred tax liabilities are offset, if a legally enforceable right exists to set off current tax assets against current tax liabilities and the deferred taxes relate to the same taxable entity and the same taxation authority.
Value added tax (VAT)
DBT was part of the RAG tax group for VAT until December 31, 2006. With effect as of January 1, 2007 a separate German VAT tax group comprising DBT GmbH itself and its German subsidiaries was established.
Revenues, expenses and assets are recognized excluding VAT except:
| • | where VAT incurred on a purchase of assets or services is not recoverable from the taxation authority, in which case the VAT is recognized as part of asset’s cost of acquisition or as part of expense item as applicable; and |
| • | receivables and payables that are stated including VAT. The net amount of VAT recoverable from, or payable to, the taxation authority is included as part of receivables or payables in the balance sheet. |
F-48
Table of Contents
DBT GmbH—Notes to the consolidated financial statements—(Continued)
Financial instruments
Non derivative financial instruments
Non derivative financial instruments comprise investments in equity instruments, trade and other receivables, cash and cash equivalents, loans and borrowings and trade and other payables. Non derivative financial instruments are recognized initially at fair value plus any directly attributable transaction costs. Subsequent to initial recognition non-derivative financial instruments are generally measured at amortized cost using the effective interest method, less any impairment losses.
Derivative financial instruments and hedging
The Group uses derivative financial instruments such as forward currency contracts and currency swaps to hedge its risks associated with foreign currency fluctuations. Such derivative financial instruments are initially recognized at fair value on the date on which a derivative contract is entered into and are subsequently remeasured at fair value. Derivatives are carried as assets when the fair value is positive and as liabilities when the fair value is negative. Any gains or losses arising from changes in fair value on derivatives that do not qualify for hedge accounting are recorded in the income statement. The market value of the currency swaps is determined based on discounted expected cash flows. Therefore, the current market interest rate for the remaining term of the financial instrument is use in calculating the fair value.
Cash flow hedges
Cash flow hedges which meet the strict criteria for hedge accounting are accounted for as follows:
Cash flow hedges are a hedge of the exposure to variability in cash flows that is attributable to a particular risk associated with a recognized asset or liability or a highly probable forecast transaction and could affect profit or loss. The effective portion of the gain or loss on the hedging instrument is recognized directly in equity, while the ineffective portion is recognized in the income statement.
Amounts recorded in equity are charged to the income statement when the hedged transaction affects profit or loss, such as when hedged financial income or financial expense is recognized or when a forecast sale or purchase occurs. Where the hedged item is the cost of a non-financial asset or liability, the amounts recorded in equity are charged to the initial carrying amount of the non-financial asset or liability.
If the forecast transaction is no longer expected to occur, amounts previously recognized in equity are charged to the income statement. If the hedging instrument expires or is sold, terminated or exercised without replacement or rollover, or if its designation as a hedge is revoked, amounts previously recognized in equity remain in equity until the forecast transaction occurs. If the related transaction is not expected to occur, the amount is charged to the income statement.
2.4 Adoption of IFRS during the year
The Group has adopted the following new and amended IFRS and IFRIC interpretations during the year. Adoption of these revised standards and interpretations did not have any significant effect on the Group’s financial statements. They did however give rise to additional disclosures:
• IAS 19 | Amendment—Employee Benefits | |
• IAS 39 | Amendments—Financial Instruments: Recognition and Measurement |
F-49
Table of Contents
DBT GmbH—Notes to the consolidated financial statements—(Continued)
The principal effects of these changes are as follows:
IAS 19 Employee benefits
As of January 1, 2006 the Group adopted the amendments to IAS 19. As a result, the consolidated financial statements include additional disclosures regarding trends in the assets and liabilities of the defined benefit plans and the assumptions underlying the components of the defined benefit cost. The adoption of IAS 19 had no impact on recognition or measurement, as the Group chose not to apply the new option offered to recognize actuarial gains and losses outside the income statement.
IAS 39 Financial instruments: recognition and measurement
As of January 1, 2006 the Group adopted the amendment to IAS 39 to allow foreign currency risk of a highly probable intragroup forecast transaction to qualify for cash flow hedge accounting treatment, provided that the transaction is denominated in a currency other than the functional currency of the entity entering into that transaction and that the foreign currency risk will affect the consolidated income statement.
IFRSs and IFRIC interpretations not yet effective.
The effects of applying the below mentioned pronouncements on future financial statements are currently being reviewed.
• IFRS 7 | Financial Instruments: Disclosures | |
• Amendment to IAS 1 | Presentation of Financial statements: Capital Disclosures | |
• IFRIC 10 | Interim Financial Reporting and Impairment | |
3. Revenues and expenses
3.1 Sales & cost of sales
| 2006 | 2005 | 2004 | ||||
| €'000 | €'000 | €'000 | ||||
Sales | ||||||
Sales of goods to external customers | 868.085 | 644.035 | 449.578 | |||
Sales of goods to related parties | 63.915 | 106.733 | 170.146 | |||
Services rendered | 2.295 | 1.685 | 1.384 | |||
Total sales from continuing operations | 934.295 | 752.453 | 621.108 | |||
Total sales include revenues from construction contracts using the percentage-of-completion method of € 530.210 (2005: € 388.263, 2004: € 304.926), thereof to related parties of € 10.041 (2005: € 31.958, 2004: € 68.174).
| 2006 | 2005 | 2004 | ||||
| €'000 | €'000 | €'000 | ||||
Cost of sales | ||||||
Cost of material | 562.618 | 446.055 | 375.659 | |||
Personnel expenses | 107.286 | 99.816 | 91.267 | |||
Depreciation | 8.907 | 8.438 | 7.811 | |||
Other operating expenses | 51.737 | 41.716 | 31.282 | |||
Total cost of sales from continuing operations | 730.548 | 596.025 | 506.019 | |||
F-50
Table of Contents
DBT GmbH—Notes to the consolidated financial statements—(Continued)
3.2 Other operating income
| 2006 | 2005 | 2004 | ||||
| €’000 | €’000 | €’000 | ||||
Income from reversal of provisions | 8.314 | 9.524 | 7.264 | |||
Income from foreign currency exchange differences | 4.576 | 5.195 | 3.250 | |||
Net gains from disposal of property, plant and equipment | 2.641 | 2.389 | 3.893 | |||
Profit from disposal of DBT Mineral Processing GmbH (Note 5) | 2.200 | 0 | 0 | |||
Income from previously written-off receivables | 0 | 2.413 | 1.042 | |||
Income from refund by federal guarantee | 0 | 0 | 2.232 | |||
Other miscellaneous income | 1.246 | 6.108 | 8.150 | |||
| 18.977 | 25.629 | 25.831 | ||||
3.3 Other expenses
Other expenses include losses from foreign exchange transactions of € 5.508 (2005: € 226, 2004: € 1.506), valuation allowances for doubtful accounts and other assets of € 130 (2005: € 832, 2004: € 421) and real estate tax levies of € 1.157 (2005: € 1.538, 2004: € 0).
3.4 Other interest and similar income
| 2006 | 2005 | 2004 | ||||
| €’000 | €’000 | €’000 | ||||
Interest income from finance lease | 1.182 | 981 | 567 | |||
Other interest related income | 2.793 | 2.084 | 3.083 | |||
| 3.975 | 3.065 | 3.650 | ||||
Other interest related income includes interest from cash-pooling with RCI of € 2.431 (2005: € 1.462, 2004: € 1.393) (Note 27).
3.5 Interest and similar expenses
| 2006 | 2005 | 2004 | ||||
| €’000 | €’000 | €’000 | ||||
Interest expenses from pensions (Note 20) | 3.505 | 3.957 | 4.148 | |||
Interest expenses from financial liabilities | 2.851 | 3.048 | 990 | |||
Interest expenses from finance leases | 800 | 1.055 | 1.093 | |||
Other interest related expenses | 1.406 | 1.338 | 2.219 | |||
| 8.562 | 9.398 | 8.450 | ||||
Interest expenses from financial liabilities include interest paid to related parties with an amount of € 2.597 (2005: € 2.997, 2004: € 952) (Note 27). Other interest related expenses include mainly interest paid to benevolent funds.
F-51
Table of Contents
DBT GmbH—Notes to the consolidated financial statements—(Continued)
3.6 Depreciation, amortization and costs of inventories included in the consolidated income statement
| 2006 | 2005 | 2004 | ||||
| €’000 | €’000 | €’000 | ||||
| Included in cost of sales: | ||||||
Depreciation and amortization | 8.907 | 8.438 | 7.811 | |||
Write-down of inventories | 6.872 | 6.981 | 2.951 | |||
Included in administrative expenses: | ||||||
Depreciation and amortization | 3.068 | 2.714 | 4.134 | |||
Minimum lease payments recognized as an operating lease expense | 2.388 | 4.369 | 3.970 | |||
Included in selling expenses: | ||||||
Depreciation and amortization | 1.175 | 2.279 | 2.095 | |||
Included in other expenses: | ||||||
Depreciation and amortization | 24 | 635 | 584 | |||
3.7 Employee benefits expense
| 2006 | 2005 | 2004 | ||||
| €’000 | €’000 | €’000 | ||||
Wages and salaries | 151.872 | 143.056 | 128.357 | |||
Social security costs | 17.399 | 16.586 | 15.732 | |||
Current service cost (Note 20) | 776 | 1.367 | 793 | |||
Amortization of actuarial losses (Note 20) | 250 | 0 | 0 | |||
Other personnel expenses | 5.609 | 4.180 | 4.196 | |||
| 175.906 | 165.189 | 149.078 | ||||
Expenses for social security costs include defined contribution plans of € 5.429 in 2006 (2005: € 5.493, 2004: € 6.180).
4. Income taxes
The major components of income tax expense from continuing operations are:
| 2006 | 2005 | 2004 | ||||
| €’000 | €’000 | €’000 | ||||
Current income tax | 15.307 | 11.225 | 1.109 | |||
thereof prior year | -28 | -380 | -220 | |||
Deferred income tax | 5.792 | 4.098 | 6.870 | |||
| 21.099 | 15.323 | 7.979 | ||||
Deferred tax assets on losses carried forward decreased by an amount of € 2.244 (2005: increase € 1.621, 2004: decrease € 1.741). The valuation allowance on deferred tax assets decreased by € 359 (2005: increase € 1.237, 2004: decrease € 1.892). The remaining changes in the net deferred tax position of € -7.520 (2005: € -3.143, 2004: € -6.283) relate to the origination and reversal of temporary differences.
F-52
Table of Contents
DBT GmbH—Notes to the consolidated financial statements—(Continued)
The reconciliation between tax expense and the product of accounting profit multiplied by the average tax rate applicable in Germany for the years 2006, 2005 and 2004 is shown in the table below. The applicable German tax rate of 39% results from corporate income tax of 25%, additional solidarity surcharge of 5.5% and the average trade tax rate. The effect of local trade tax in Germany derives from the fact that the parent company does not charge/credit trade tax by means of allocation for those companies being part of the tax group.
Tax reconciliation
| 2006 | 2005 | 2004 | |||||||
| €’000 | €’000 | €’000 | |||||||
Accounting profit before tax from continuing operations | 84.785 | 53.274 | 25.741 | ||||||
Accounting profit before tax from discontinued operations | 7.105 | 7.816 | 5.269 | ||||||
Accounting profit before tax | 91.890 | 61.090 | 31.010 | ||||||
Tax at the expected tax rate of 39% | 35.837 | 23.825 | 12.094 | ||||||
Effect of local trade tax (not allocated by ultimate parent) | -10.956 | -5.800 | -4.409 | ||||||
Deviation from expected tax rate foreign countries | -616 | -905 | - 841 | ||||||
Change of deferred tax assets on losses carried forward | -1.509 | -1.112 | 945 | ||||||
Non-deductible expenses | 2.014 | 4.689 | 1.325 | ||||||
Tax-free income | -3.065 | -177 | -544 | ||||||
Taxes prior years | -28 | -380 | 272 | ||||||
Other adjustments | -76 | -753 | 449 | ||||||
Effective income tax | 21.601 | 19.387 | 9.291 | ||||||
Effective income tax discontinued operations (Note 5) | -502 | -4.064 | -1.312 | ||||||
Effective income tax continued operations | 21.099 | 15.323 | 7.979 | ||||||
Effective tax rate | 24.9 | % | 28.8 | % | 31.0 | % | |||
The reconciliation between opening and closing balance of the deferred income tax asset is as follows:
| 2006 | 2005 | 2004 | ||||
| €’000 | €’000 | €’000 | ||||
Net deferred tax asset January 1 | 4.456 | 5.160 | 12.089 | |||
Deferred tax expense | -5.792 | -4.098 | -6.870 | |||
Discontinued operations/disposal group | 27 | -971 | 0 | |||
Changes in consolidation group | 0 | -402 | 0 | |||
Net loss on cash flow hedges taken to equity | -3.121 | 3.151 | 239 | |||
Differences attributed to capital reserves | -208 | 0 | 0 | |||
Exchange differences taken to equity | -2.366 | 1.616 | -298 | |||
Net deferred tax position December 31 | -7.004 | 4.456 | 5.160 | |||
F-53
Table of Contents
DBT GmbH—Notes to the consolidated financial statements—(Continued)
The deferred taxes refer to temporary differences in the following balance sheet items or to unused tax losses as follows:
Deferred tax assets December 31, | Deferred tax liabilities December 31, | |||||||||||
| 2006 | 2005 | 2004 | 2006 | 2005 | 2004 | |||||||
| €’000 | €’000 | €’000 | €’000 | €’000 | €’000 | |||||||
Assets | ||||||||||||
Intangible assets | 994 | 1.083 | 1.103 | 0 | 0 | 0 | ||||||
Property, plant and equipment | 78 | 378 | 424 | -3.093 | -3.367 | -2.710 | ||||||
Inventories | 6.607 | 6.814 | 6.027 | -184 | -870 | -32 | ||||||
Receivables and other assets | 9.654 | 2.085 | 2.677 | -31.532 | -15.262 | -13.693 | ||||||
Liabilities | ||||||||||||
Provisions | 11.682 | 11.984 | 10.379 | -926 | -1.257 | -494 | ||||||
Payables and other liabilities | 2.190 | 9.660 | 7.573 | -2.431 | -8.518 | -6.551 | ||||||
Unused tax losses | 1.320 | 3.564 | 1.943 | 0 | 0 | 0 | ||||||
Tax credits | 0 | 0 | 15 | 0 | 0 | 0 | ||||||
Other | 916 | 665 | -338 | -222 | -87 | 16 | ||||||
Deferred taxes (gross) | 33.441 | 36.233 | 29.803 | -38.388 | -29.361 | -23.464 | ||||||
Valuation allowances | -2.057 | -2.416 | -1.179 | 0 | 0 | 0 | ||||||
Offsetting | -16.805 | -23.323 | -19.599 | 16.805 | 23.323 | 19.599 | ||||||
Deferred taxes (net) | 14.579 | 10.494 | 9.025 | -21.583 | -6.038 | -3.865 | ||||||
Deferred tax assets are recognized to the extent that the realization of the respective tax benefit is probable. Based on the profits of the past and the expected profits in the foreseeable future, allowances are accounted for if this criterion is not fulfilled.
The valuation allowances refer to deferred tax assets of DBT GB Ltd. and DPM Gesellschaft für deutsch-polnischen Maschinenhandel und Leasing GmbH. The valuation allowances were recognized as there are insufficient future taxable profits or taxable temporary differences expected for those companies.
The valuation allowance 2006 relates to DBT GB Ltd. in the amount of € -1.768 and DPM Gesellschaft für deutsch-polnischen Maschinenhandel und Leasing GmbH in the amount of € -289. In 2005, it relates to DBT GB Ltd. in the amount of € -2.127 (2004: € -890) and DPM Gesellschaft für deutsch-polnischen Maschinenhandel und Leasing GmbH in the amount of € -289 (2004: € -289).
The Group has tax losses carried forward which arose in the U.K. of € 3.733 (2005: € 7.957, 2004: € 8.930), USA € 573 (2005: € 1.141, 2004: € 2.857) and Australia (LAD) of € 0 (2005: € 2.631, 2004: € 0). The tax losses carried forward in the U.K. and Australia are available indefinitely for offsetting against future taxable profits. The tax losses in the USA are available for offsetting against future taxable profits through 2024.
No deferred tax liabilities have been recognized on undistributed profits of the subsidiaries to the extent they can be considered as being permanently invested. In case of either distribution of these profits—the value of which is not feasible to be determined—or on sale of the respective subsidiary, an additional tax liability might arise.
F-54
Table of Contents
DBT GmbH—Notes to the consolidated financial statements—(Continued)
5. Non-current assets held for sale (or disposal groups) and discontinued operations
Non-current assets and disposal groups
Shenhua DBT Belt Conveyor Co. Ltd.
DBT GmbH holds 67% of the shares in Shenhua DBT Belt Conveyor Co. Ltd. (DBT Shenhua). 33% of the shares are held by the other partner, Shenhua Group Corp. Ltd. During 2006, DBT entered into an agreement to sell 67% ownership in DBT Shenhua to Shenhua Group Corp. Ltd.
DBT Shenhua is classified as a disposal group in accordance with IFRS 5. The company is expected to be sold during the second quarter of 2007.
December 31, 2006 | ||
| €’000 | ||
Assets | ||
Tax assets | 38 | |
Inventories | 1.035 | |
Trade and other receivables | 2.425 | |
Cash and cash equivalents | 55 | |
Assets classified as held for sale | 3.553 | |
Liabilities | ||
Provisions | 295 | |
Trade and other payables | 2.339 | |
Deferred tax liabilities | 72 | |
Liabilities directly associated with assets classified as held for sale | 2.706 | |
Net assets directly associated with disposal group | 847 |
The net assets associated with disposal group were written down by € 740, based on the fair value less costs to sell.
DBT Mineral Processing GmbH
During 2006, the company sold DBT Mineral Processing GmbH to Hazemag & EPR GmbH, Dülmen for € 2.819. A net gain on the sale of € 2.200 was realized (Note 3.2).
October 31, 2006 | ||
| €’000 | ||
Non-current assets | 213 | |
Current assets | 6.048 | |
Equity | 408 | |
Non-current liabilities | 937 | |
Current liabilities | 4.917 | |
Cash flow effect from disposal: | ||
Disposal consideration | 2.819 | |
Less cash/cash equivalents in the subsidiary disposed of | 1 | |
Cash/cash equivalents received upon disposal | 2.818 | |
F-55
Table of Contents
DBT GmbH—Notes to the consolidated financial statements—(Continued)
Discontinued operations
On February 28, 2006 the company sold 100% of its interest in DBT Maschinenfabrik Scharf GmbH (MFS) and its subsidiary DBT Transporttechnik Saar GmbH (DTS) for € 19.740. Management committed to the plan to sell both entities in June 2005 and at December 31, 2005 final negotiations for the sale were in progress. Therefore the company recognized these subsidiaries as discontinued operations in 2005.
| January 1 - February 28, 2006 | January 1 - December 31, 2005 | January 1 - December 31, | ||||
| €’000 | €’000 | €’000 | ||||
Post tax profit of discontinued operations | 623 | 5.517 | 3.958 | |||
Post tax loss recognized on the measurement to fair value less cost to sell | 0 | -1.765 | 0 | |||
Post tax gain on disposal | 5.980 | 0 | 0 | |||
| 6.603 | 3.752 | 3.958 | ||||
The tax income relating to the gain from discontinued operations was € 32 (2005: € 0, 2004: € 0).
The results for the respective reporting years are presented below:
DBT Maschinenfabrik Scharf GmbH
| January 1 - February 28, 2006 | January 1 - December 31, 2005 | January 1 - December 31, | ||||
| €’000 | €’000 | €’000 | ||||
Revenue | 6.095 | 37.411 | 28.250 | |||
Expenses | -4.793 | -33.700 | -29.379 | |||
Gross profit | 1.302 | 3.711 | -1.129 | |||
Other revenues and expenses | -394 | 3.805 | 4.372 | |||
Net finance costs | 71 | 346 | 209 | |||
Profit before taxes from discontinued operations | 979 | 7.862 | 3.452 | |||
Income taxes | -470 | -4.086 | -1.314 | |||
Income from discontinued operations | 509 | 3.776 | 2.138 | |||
DBT Transporttechnik Saar GmbH
January 1 - February 28, | January 1 - December 31, | January 1 - December 31, | ||||
| €’000 | €’000 | €’000 | ||||
Revenue | 1.553 | 10.372 | 10.724 | |||
Expenses | -1.351 | -10.199 | -8.933 | |||
Gross profit | 202 | 173 | 1.791 | |||
Other revenues and expenses | -90 | -235 | 28 | |||
Net finance costs | 2 | 16 | -1 | |||
Profit before taxes from discontinued operations | 114 | -46 | 1.818 | |||
Income taxes | 0 | 22 | 2 | |||
Income from discontinued operations | 114 | -24 | 1.820 | |||
F-56
Table of Contents
DBT GmbH—Notes to the consolidated financial statements—(Continued)
The major classes of assets and liabilities classified as held for sale as at December 31, 2005 are:
DBT Maschinenfabrik Scharf GmbH
December 31, 2005 | ||
| €’000 | ||
Assets | ||
Intangible Assets | 61 | |
Property, plant and equipment | 2.360 | |
Other investments | 68 | |
Tax assets | 229 | |
Inventories | 5.253 | |
Trade and other receivables | 2.789 | |
Cash and cash equivalents | 19.281 | |
Assets classified as held for sale | 30.041 | |
Liabilities | ||
Provisions | 8.798 | |
Trade payables | 4.896 | |
Deferred tax liabilities | 166 | |
Liabilities directly associated with assets classified as held for sale | 13.860 | |
Net assets directly associated with disposal group | 16.181 | |
DBT Transporttechnik Saar GmbH
December 31, 2005 | ||
| €’000 | ||
Assets | ||
Intangible Assets | 11 | |
Property, plant and equipment | 613 | |
Tax assets | 30 | |
Inventories | 1.004 | |
Trade and other receivables | 1.208 | |
Cash and cash equivalents | 367 | |
Assets classified as held for sale | 3.233 | |
Liabilities | ||
Provisions | 1.670 | |
Trade payables | 707 | |
Deferred tax liabilities | 48 | |
Liabilities directly associated with assets classified as held for sale | 2.425 | |
Net assets directly associated with disposal group | 808 | |
F-57
Table of Contents
DBT GmbH—Notes to the consolidated financial statements—(Continued)
The cash flows of the disposed companies are:
DBT Maschinenfabrik Scharf GmbH
January 1 - February 28, | January 1 - December 31, | January 1 - December 31, | ||||
| €’000 | €’000 | €’000 | ||||
Cash flows from operating activities | 1.213 | 9.232 | 10.647 | |||
Cash flows from investing activities | -15 | -268 | -337 | |||
Cash flows from financing activities | -4.364 | 0 | 0 | |||
Change in cash and cash equivalents | -3.166 | 8.964 | 10.310 | |||
Cash and cash equivalents at the beginning of the year | 19.281 | 10.317 | 7 | |||
Cash and cash equivalents at the end of the period | 16.115 | 19.281 | 10.317 | |||
DBT Transporttechnik Saar GmbH
January 1 - February 28, | January 1 - December 31, | January 1 - December 31, | ||||
| €’000 | €’000 | €’000 | ||||
Cash flows from operating activities | 40 | -15 | 1.554 | |||
Cash flows from investing activities | 3 | -76 | -173 | |||
Cash flows from financing activities | 0 | -195 | -733 | |||
Change in cash and cash equivalents | 43 | -286 | 648 | |||
Cash and cash equivalents at the beginning of the year | 367 | 653 | 5 | |||
Cash and cash equivalents at the end of the period | 410 | 367 | 653 | |||
Assets and liabilities of the disposed subsidiaries:
MFS February 28, 2006 | DTS February 28, 2006 | Total | ||||
| €’000 | €’000 | €’000 | ||||
Non-current assets | 3.109 | 836 | 3.945 | |||
Current assets | 10.680 | 2.322 | 13.002 | |||
Equity | 15.296 | 679 | 15.975 | |||
Non-current liabilities | 4.419 | 304 | 4.723 | |||
Current liabilities | 10.189 | 2.585 | 12.774 |
Cash flow effect from disposal:
MFS February 28, 2006 | DTS February 28, 2006 | Total | ||||
| €’000 | €’000 | €’000 | ||||
Disposal consideration | 17.500 | 2.240 | 19.740 | |||
Less cash/cash equivalents in the subsidiaries disposed of | 16.115 | 410 | 16.525 | |||
Cash/cash equivalents received upon disposal | 1.385 | 1.830 | 3.215 | |||
F-58
Table of Contents
DBT GmbH—Notes to the consolidated financial statements—(Continued)
6. Intangible assets
| Goodwill | Development costs | Patents, licences and oth. intangible assets | Total | |||||
| €’000 | €’000 | €’000 | €’000 | |||||
Cost | ||||||||
At January 1, 2005 | 108 | 1.018 | 6.903 | 8.029 | ||||
Effect of changes in exchange rates | 0 | 99 | 346 | 445 | ||||
Changes in consolidation group | 0 | 0 | -4 | -4 | ||||
Additions | 194 | 0 | 846 | 1.040 | ||||
Disposals | 0 | -332 | -709 | -1.041 | ||||
Transfers to assets classified as held for sale | 0 | 0 | -255 | -255 | ||||
At December 31, 2005/January 1, 2006 | 302 | 785 | 7.127 | 8.214 | ||||
Effect of changes in exchange rates | 0 | -67 | -402 | -469 | ||||
Changes in consolidation group | 0 | 0 | -34 | -34 | ||||
Additions | 0 | 0 | 1.315 | 1.315 | ||||
Disposals | 0 | 0 | -667 | -667 | ||||
Additions from(+)/to(-) current assets | 0 | 0 | -100 | -100 | ||||
At December 31, 2006 | 302 | 718 | 7.239 | 8.259 | ||||
Accumulated amortization | ||||||||
January 1, 2005 | 108 | 34 | 3.973 | 4.115 | ||||
Changes in consolidation group | 0 | 0 | -4 | -4 | ||||
Amortization | 0 | 370 | 709 | 1.079 | ||||
Disposals | 0 | -100 | -708 | -808 | ||||
Transfers to assets classified as held for sale | 0 | 0 | -183 | -183 | ||||
At December 31, 2005/January 1, 2006 | 108 | 304 | 3.787 | 4.199 | ||||
Effect of changes in exchange rates | 0 | -17 | -160 | -177 | ||||
Changes in consolidation group | 0 | 0 | -32 | -32 | ||||
Amortization | 0 | 151 | 875 | 1.026 | ||||
Disposals | 0 | 0 | -221 | -221 | ||||
At December 31, 2006 | 108 | 438 | 4.249 | 4.795 | ||||
Net carrying amounts at January 1, 2005 | 0 | 984 | 2.930 | 3.914 | ||||
Net carrying amounts at December 31, 2005/January 1, 2006 | 194 | 481 | 3.340 | 4.015 | ||||
Net carrying amounts at December 31, 2006 | 194 | 280 | 2.990 | 3.464 | ||||
Goodwill resulting from the purchase of the remaining shares of DBT Polska Sp. z o.o. (13%) has been allocated to the cash generating unit capital equipment roof support. The carrying value of goodwill is net of impairment losses with an amount of € 108.
F-59
Table of Contents
DBT GmbH—Notes to the consolidated financial statements—(Continued)
7. Property, plant and equipment
| Land and buildings | Plant and machinery | Other equipment, factory and office equipm. | Construction in process | Total | ||||||
| €’000 | €’000 | €’000 | €’000 | €’000 | ||||||
Cost | ||||||||||
At January 1, 2005 | 76.510 | 73.013 | 37.572 | 0 | 187.095 | |||||
Effect of changes in exchange rates | 3.256 | 1.519 | 499 | 0 | 5.274 | |||||
Changes in consolidation group | -4.931 | -6.118 | -1.137 | 0 | -12.186 | |||||
Additions | 1.556 | 8.538 | 4.888 | 0 | 14.982 | |||||
Disposals | -624 | -7.505 | -4.486 | 0 | -12.615 | |||||
Transfers to assets classified as held for sale | -8.515 | -3.141 | -5.742 | 0 | -17.398 | |||||
At December 31, 2005/January 1, 2006 | 67.252 | 66.306 | 31.594 | 0 | 165.152 | |||||
Effect of changes in exchange rates | -2.111 | -1.419 | -474 | 0 | -4.004 | |||||
Changes in consolidation group | 0 | 0 | -448 | 0 | -448 | |||||
Additions | 24.668 | 7.532 | 4.709 | 9.857 | 46.766 | |||||
Disposals | -20.205 | -2.350 | -2.062 | 0 | -24.617 | |||||
Transfers to assets held for sale | -79 | -451 | -131 | 0 | -661 | |||||
Additions from(+)/to(-) current assets | 88 | 2.756 | 621 | 3.073 | 6.538 | |||||
At December 31, 2006 | 69.613 | 72.374 | 33.809 | 12.930 | 188.726 | |||||
Accumulated depreciation | ||||||||||
At January 1, 2005 | 25.212 | 46.774 | 26.882 | 0 | 98.868 | |||||
Changes in consolidation group | -3.863 | -4.927 | -948 | 0 | -9.738 | |||||
Depreciation | 2.198 | 6.475 | 4.314 | 0 | 12.987 | |||||
Disposals | -316 | -5.891 | -4.224 | 0 | -10.431 | |||||
Transfers to assets classified as held for sale | -7.072 | -2.857 | -4.496 | 0 | -14.425 | |||||
At December 31, 2005/January 1, 2006 | 16.159 | 39.574 | 21.528 | 0 | 77.261 | |||||
Effect of changes in exchange rates | 115 | -187 | -206 | 0 | -278 | |||||
Changes in consolidation group | 0 | 0 | -291 | 0 | -291 | |||||
Depreciation | 1.785 | 6.288 | 4.075 | 0 | 12.148 | |||||
Disposals | -1.344 | -1.370 | -1.937 | 0 | -4.651 | |||||
Transfers to assets held for sale | -10 | -176 | -76 | 0 | -262 | |||||
At December 31, 2006 | 16.705 | 44.129 | 23.093 | 0 | 83.927 | |||||
Net carrying amounts at January 1, 2005 | 51.298 | 26.239 | 10.690 | 0 | 88.227 | |||||
Net carrying amounts at December 31, 2005/January 1, 2006 | 51.093 | 26.732 | 10.066 | 0 | 87.891 | |||||
Net carrying amounts at December 31, 2006 | 52.908 | 28.245 | 10.716 | 12.930 | 104.799 | |||||
The carrying value of property, plant and equipment held under finance leases at December 31, 2006 was € 2.689 (2005: € 18.783). The additions from/to current assets include a reclassification of advance payments. The remaining purchase commitments on construction in process amount to € 741 as of December 31, 2006 (2005: € 0).
F-60
Table of Contents
DBT GmbH—Notes to the consolidated financial statements—(Continued)
8. Other investments
2006 | 2005 | |||
| €’000 | €’000 | |||
Receivables from finance lease | 1.757 | 2.355 | ||
Loans | 832 | 836 | ||
Derivatives | 1.901 | 33 | ||
Other | 2.190 | 290 | ||
| 6.680 | 3.514 | |||
For terms and conditions relating to receivables from finance lease, refer to Note 26 and for derivatives, refer to Note 29.
Terms and conditions of the main loans included are as follows:
Conditions | Maturity | 2006 | 2005 | |||||
| €’000 | €’000 | |||||||
Loan I | Variable, match with credit interest rate; in 2006: 1.75 – 2.0 % p.a. | May 2009 | 249 | 249 | ||||
Loan II | Variable, match with credit interest rate; in 2006: 1.75 – 2.0 % p.a. | Aug 2009 | 550 | 550 |
9. Inventories
| 2006 | 2005 | |||
| €’000 | €’000 | |||
Raw materials | 33.296 | 32.204 | ||
Work in progress | 71.605 | 25.729 | ||
Finished goods | 79.523 | 124.395 | ||
Total inventories | 184.424 | 182.328 | ||
Write-downs of inventories of € 6.872 (2005: € 6.981) were recognized in cost of sales.
10. Trade and other receivables (current)
| 2006 | 2005 | |||
| €’000 | €’000 | |||
Trade receivables related parties | 16.634 | 21.496 | ||
Trade receivables third parties | 139.017 | 174.093 | ||
Other receivables related parties | 80.890 | 25.122 | ||
Other receivables third parties | 14.074 | 18.510 | ||
| 250.615 | 239.221 | |||
The trade receivables include receivables from unfinished construction contracts accounted for using the percentage-of-completion method of € 297.571 (2005: € 173.716), less received advance payments of € 256.779 (2005: € 101.941).
F-61
Table of Contents
DBT GmbH—Notes to the consolidated financial statements—(Continued)
For contracts accounted for using the percentage-of-completion method, the aggregated amount of costs incurred was € 232.518 (2005: € 138.900); the aggregated amount of recognized profits less recognized losses was € 65.052 (2005: € 34.815).
For terms and conditions relating to related party receivables, refer to Note 27.
11. Other financial assets
| 2006 | 2005 | |||
| €’000 | €’000 | |||
Derivatives (Note 29) | 3.264 | 448 | ||
Finance lease | 804 | 1.209 | ||
Fixed-term bank deposits | 0 | 3.911 | ||
| 4.068 | 5.568 | |||
12. Cash and cash equivalents
| 2006 | 2005 | |||
| €’000 | €’000 | |||
Cash at banks and cash equivalents | 17.069 | 25.311 | ||
Cash and cash equivalents include cash at banks, short-term investments with an original maturity of three months or less, cheques and cash on hand.
13. Subscribed capital
| 2006 | 2005 | 2004 | ||||
| €’000 | €’000 | €’000 | ||||
Registered share capital | 21.050 | 21.050 | 21.050 | |||
The registered share capital € 21.050 is fully paid.
14. Capital reserve
| 2006 | 2005 | 2004 | ||||
| €’000 | €’000 | €’000 | ||||
Capital reserve | 43.729 | 32.636 | 32.636 | |||
In 2006 RCI assumed an uncertain liability on behalf of the company. Therefore the amount was recognized in capital reserve, net of taxes. (Note 27)
15. Retained earnings
| 2006 | 2005 | 2004 | ||||
| €’000 | €’000 | €’000 | ||||
Retained earnings | 103.709 | 73.417 | 78.892 | |||
According to the existing profit and loss transfer agreement, dividends were distributed in the amount of € 39.721 (2005: € 47.007, 2004: € 7.359) to RCI and in the amount of € 255 (2005: € 0, 2004: € 0) to Shenhua Group Corp. Ltd. (see also consolidated statement of changes in shareholders’ equity).
F-62
Table of Contents
DBT GmbH—Notes to the consolidated financial statements—(Continued)
16. Translation reserve
| 2006 | 2005 | 2004 | ||||
| €’000 | €’000 | €’000 | ||||
Translation reserve | -2.187 | 597 | -6.858 | |||
The foreign currency translation reserve includes exchange differences arising from the translation of the financial statements of foreign subsidiaries into the Euro as reporting currency.
17. Hedging reserve
| 2006 | 2005 | 2004 | ||||
| €’000 | €’000 | €’000 | ||||
Hedging reserve | 2.484 | -6.229 | 2.517 | |||
The hedging reserve includes the effective portion of gains or losses on derivative financial instruments accounted for as cash flow hedge. On maturity, the cumulative gain or loss is recorded in the income statement or balance sheet as appropriate. Amounts are recorded net of income tax effects.
18. Minority interest
| 2006 | 2005 | 2004 | ||||
| €’000 | €’000 | €’000 | ||||
Shenhua DBT Belt Conveyor Co. Ltd. | 531 | 531 | 320 | |||
DBT Polska Sp. z o.o. | 0 | 0 | 705 | |||
| 531 | 531 | 1.025 | ||||
19. Provisions (current and non-current)
| 2006 | 2005 | |||
| €’000 | €’000 | |||
Pension provisions | 76.797 | 76.596 | ||
Other provisions | 82.274 | 93.869 | ||
| 159.071 | 170.465 | |||
| Provisions for sales areas | Provisions for employees | Misc. provisions | Total | |||||
| €’000 | €’000 | €’000 | €’000 | |||||
Other provisions (current and non-current) | ||||||||
January 1, 2006 | 72.715 | 15.481 | 5.673 | 93.869 | ||||
Change in consolidation group and currency differences | 1.314 | -589 | -3.365 | -2.640 | ||||
Additions | 39.313 | 10.901 | 8.791 | 59.005 | ||||
Reversal | -6.660 | -998 | -3.844 | -11.502 | ||||
Utilisation | -46.962 | -7.064 | -2.137 | -56.163 | ||||
Transfer to liabilities directly associated with assets classified as held for sale | 0 | 0 | -295 | -295 | ||||
December 31, 2006 | 59.720 | 17.731 | 4.823 | 82.274 | ||||
F-63
Table of Contents
DBT GmbH—Notes to the consolidated financial statements—(Continued)
The provisions for warranty of € 55.871 (2005: € 63.108) are included in the provisions for sales areas.
It is expected that the non-current amounts recorded under other provisions will be paid within the next two or three years.
Provisions for sales areas
Provisions for sales areas include provisions for warranty, provisions for onerous contracts and provisions for penalties.
The provisions for warranty mainly relate to individual guarantee risks of the company. Furthermore 1% to 2% of last year’s billings are recorded as warranty provisions. These provisions are based on past experience of the level of repairs. It is expected that most of these costs will be incurred in the next financial year. Assumptions used to calculate the provisions for warranty were based on current sales levels and current information available about returns over a two-year period. The range of legal and contractual warranty periods is 2 to 7 years; some projects/contracts comprise additional warranty-agreements according to performance. The provision for penalties (€ 2.404) is related to deliveries to an Australian customer for which considerable delays are foreseeable.
Miscellaneous Provisions
The miscellaneous provisions include provisions for claims and litigation.
20. Pensions and other post employment benefit plans
Provisions for pension obligations include obligations under benefit plans for pensions, disability and support for surviving dependents. The amount of the obligations normally depends on the length of service and the salary of the employees concerned. Benefit plans of the DBT Group relate only to German companies. These plans are accounted for as defined benefit plans and are wholly unfunded.
The following tables summarize the components of net benefit expense recognized in the consolidated income statement and amounts recognized in the consolidated balance sheet for the respective plans.
Net benefit expense
| 2006 | 2005 | 2004 | ||||
| €’000 | €’000 | €’000 | ||||
Interest cost on benefit obligation (Note 3.5) | 3.505 | 3.957 | 4.148 | |||
Current service cost (Note 3.7) | 776 | 1.367 | 793 | |||
Amortization of actuarial losses (Note 3.7) | 250 | 0 | 0 | |||
Net benefit expense | 4.531 | 5.324 | 4.941 | |||
Pension provisions
| 2006 | 2005 | 2004 | ||||
| €’000 | €’000 | €’000 | ||||
Defined benefit obligation | 85.877 | 87.823 | 87.062 | |||
Unrecognized net actuarial losses | -9.080 | -11.227 | -8.384 | |||
Pension provisions | 76.797 | 76.596 | 78.678 | |||
F-64
Table of Contents
DBT GmbH—Notes to the consolidated financial statements—(Continued)
Changes in the present value of the defined benefit obligation are as follows:
| 2006 | 2005 | 2004 | ||||
| €’000 | €’000 | €’000 | ||||
Opening defined benefit obligation | 87.823 | 87.062 | 77.793 | |||
Interest cost (Note 3.5) | 3.505 | 3.957 | 4.148 | |||
Current service cost (Note 3.7) | 776 | 1.367 | 793 | |||
Amortization of actuarial losses (Note 3.7) | 250 | 0 | 0 | |||
Benefits paid | -4.499 | -5.194 | -4.961 | |||
Plan participants’ contributions | 842 | 683 | 540 | |||
Actuarial gains/losses on obligation | -2.147 | 2.843 | 8.384 | |||
Transfers from RAG-Group companies | 288 | 0 | 365 | |||
Changes in consolidation group | -961 | -627 | 0 | |||
Reclassification as held for sale | 0 | -2.268 | 0 | |||
Closing defined benefit obligation | 85.877 | 87.823 | 87.062 | |||
Principal assumptions used to determine the pension and post-employment benefit obligations for the Group’s plans are shown below:
| 2006 | 2005 | 2004 | ||||
Discount rate: | 4.50% | 4.00% | 4.50% | |||
Future salary increases: | 2.00% | 2.00% | 2.00% | |||
Future pension increases: | 1,00% resp. | 1,00% resp. | 1,00% resp. | |||
| 1.50% | 1.50% | 1.50% |
Most of the plan participants were transferred into a new pension scheme in 2002. This pension scheme contains commitments on personal contributions by plan participants but also includes a future pension increase of 1% p.a. which is guaranteed by the contracting companies.
Experience adjustments arising from plan liabilities for the current annual period and previous periods are as follows:
| 2006 | 2005 | 2004 | |||||||
| €’000 | €’000 | €’000 | |||||||
Experience gain (-) / loss (+) | 1.338 | -2.306 | 478 | ||||||
Effect of changes in assumptions | -3.485 | 5.149 | 8.042 | ||||||
Experience gain (-) / loss (+) as percentage of plan liabilities | 1.74 | % | -3.01 | % | 0.61 | % | |||
F-65
Table of Contents
DBT GmbH—Notes to the consolidated financial statements—(Continued)
21. Financial liabilities (non-current)
Effective interest rate % | Maturity | 2006 | 2005 | |||||
| €’000 | €’000 | |||||||
Obligations under finance lease | 5.375 % – 8.000 % p.a. | 2010 | 1.189 | 18.415 | ||||
Bank loan | official cash rate plus margin 0.65% p.a. – actual rate at 12/31/06 was 6.90 % p.a., (12/31/2005: 5.90% p.a.) | unlimited | 13.780 | 14.278 | ||||
Derivatives (Note 29) | 0 | 1.876 | ||||||
Loan from RCI (Note 27) (non-current portion) | variable due to changes in market conditions; in 2005/2006: 5.25 – 5.5% p.a. | at least $ 1.000 p.a. | 23.918 | 25.298 | ||||
| 38.887 | 59.867 | |||||||
For further information on obligations under finance lease contracts refer to Note 26.
22. Trade payables (current)
| 2006 | 2005 | |||
| €’000 | €’000 | |||
Trade payables to third parties | 51.378 | 56.446 | ||
Trade payables to related parties (Note 27) | 451 | 339 | ||
| 51.829 | 56.785 | |||
Trade payables to third parties contain a variety of obligations, including deposits from customers and accrued sales tax.
23. Financial liabilities (current)
Effective interest rate % | Maturity | 2006 | 2005 | |||||
| €’000 | €’000 | |||||||
Obligations under finance lease contracts (Note 26) | 5.375 % – 8.000 % p.a. | 2007 | 1.344 | 2.331 | ||||
Bank overdrafts | floating rates due to actual market conditions | on demand | 1.176 | 1.417 | ||||
Derivatives (Note 29) | 288 | 8.107 | ||||||
Other financial liabilities | variable due to changes in market conditions; in 2005 /2006: 5.25 – 5.5% p.a. | on demand | 23.408 | 11.186 | ||||
| 26.216 | 23.041 | |||||||
Other financial liabilities include a loan from RCI (Note 27) with an amount of € 23.387 (2005: € 11.186). For terms and conditions refer to Note 21.
F-66
Table of Contents
DBT GmbH—Notes to the consolidated financial statements—(Continued)
24. Advance payments (current)
| 2006 | 2005 | |||
| €’000 | €’000 | |||
Advance payments received from third parties | 78.452 | 109.915 | ||
Advance payments received from related parties (Note 27) | 8.026 | 2.098 | ||
| 86.478 | 112.013 | |||
Advance payments include payments received on uncompleted contracts accounted for using the percentage-of-completion method which where the progress billings in accordance with the contract exceed revenue recognized of € 59.611 (2005: € 33.267).
25. Other liabilities (current)
| 2006 | 2005 | |||
| €’000 | €’000 | |||
Accrued expenses | 32.432 | 22.569 | ||
Liabilities to benevolent funds | 2.483 | 1.926 | ||
Personnel liabilities | 1.737 | 2.607 | ||
Other miscellaneous liabilities | 2.901 | 12.285 | ||
| 39.553 | 39.387 | |||
26. Commitments and contingencies
Operating lease commitments—Group as lessee
At December 31, 2006 and 2005 DBT Group had the following contingent liabilities:
Future minimum lease payments payable under non-cancelable operating leases as at December 31 are as follows:
| 2006 | 2005 | |||
| €’000 | €’000 | |||
Within one year | 860 | 615 | ||
After one year but not more than five years | 1.353 | 792 | ||
More than five years | 163 | 0 | ||
| 2.376 | 1.407 | |||
Finance lease contracts—Group as lessee
Liabilities from finance leases are recognized if the leased asset is in the beneficial ownership of the Group and is capitalized under property, plant and equipment. On December 22, 2006 the formerly leased factory premises in Lünen were purchased with a purchase price of € 18.080. As a result, the finance lease contract for the factory premises in Lünen was terminated.
F-67
Table of Contents
DBT GmbH—Notes to the consolidated financial statements—(Continued)
The reconciliation of future minimum lease payments to their present values and due dates are as follows:
| 2006 | 2005 | |||||||
| Minimum lease payments | Present value of minimum lease payments | Minimum lease payments | Present value of minimum lease payments | |||||
| €’000 | €’000 | |||||||
Within one year | ||||||||
Real estate Lünen | 0 | 0 | 2.306 | 1.312 | ||||
Other | 1.451 | 1.344 | 1.080 | 1.019 | ||||
| 1.451 | 1.344 | 3.386 | 2.331 | |||||
After one year but not more than five years | ||||||||
Real estate Lünen | 0 | 0 | 9.224 | 6.041 | ||||
Other | 1.287 | 1.189 | 2.816 | 2.669 | ||||
| 1.287 | 1.189 | 12.040 | 8.710 | |||||
After five years | ||||||||
Real estate Lünen | 0 | 0 | 11.306 | 9.705 | ||||
Total minimum lease payments | 2.738 | 26.732 | ||||||
Less amounts representing finance charges | 205 | 5.986 | ||||||
Total of present value of minimum lease payments | 2.533 | 2.533 | 20.746 | 20.746 | ||||
Finance lease contracts—Group as lessor
DBT Polska entered in several financial lease contracts as a lessor of shearer equipment. These leases have an average duration of between 4 and 6 years with no renewal options. There are no restrictions placed upon the lessee by entering into the leases. The reconciliation between the gross investment in the leases at the balance sheet date and the present value of future minimum lease payments receivable at the balance sheet date is as follows:
Within one year | After one year but not more than five years | After five years | ||||
| €’000 | €’000 | €’000 | ||||
2006 | ||||||
Present value of minimum lease payments | 804 | 1.757 | 0 | |||
Unearned finance income | 710 | 444 | 0 | |||
Gross investment in the lease | 1.514 | 2.201 | 0 | |||
2005 | ||||||
Present value of minimum lease payments | 1.209 | 2.355 | 0 | |||
Unearned finance income | 1.385 | 948 | 0 | |||
Gross investment in the lease | 2.594 | 3.303 | 0 | |||
F-68
Table of Contents
DBT GmbH—Notes to the consolidated financial statements—(Continued)
Guarantees
DBT Group had the following contingent liabilities as at December 31, 2006:
| • | Contingent liabilities from contractual guarantees of € 50.253 (2005: € 19.359), |
| • | Contingent liabilities from contractual warranties of € 37.644 (2005: € 33.047). |
The contractual guarantees relate to contract fulfillment guarantees of € 43.159 (2005: € 13.964) and employee benefits (insolvency insurance of partial retirement) of € 3.976 (2005: € 2.334), accrued overtime of € 2.000 (2005: € 1.200).
At December 31, 2006 the Group has several warranties outstanding with a maximum exposure of € 37.644 (2005: € 33.047) which cover possible future warranty claims that may occur after the final inspection on sold equipment.
Accruals for those guarantees have not been recorded.
F-69
Table of Contents
DBT GmbH—Notes to the consolidated financial statements—(Continued)
27. Related party disclosures
The consolidated financial statements include the financial statements of DBT GmbH and its subsidiaries. Parent company of the DBT GmbH is RCI, ultimate parent is RAG. Therefore the companies included in the consolidated financial statements of RAG belong to the related parties of DBT Group. The following table provides the total amount of transactions, which have been entered into with related parties for the relevant financial year:
| 2006 | 2005 | |||
| Amounts owed by related parties | Amounts owed by related parties | |||
| €’000 | €’000 | |||
Assets | ||||
Trade receivables (Note 10): | ||||
RAG | 11.052 | 20.416 | ||
Montan-Grundstücksgesellschaft mbH | 898 | 838 | ||
DSK Anthrazit Ibbenbüren GmbH | 4.684 | 218 | ||
Others | 0 | 24 | ||
| 16.634 | 21.496 | |||
Other receivables (Note 10): | ||||
RCI | 80.890 | 25.085 | ||
Others | 0 | 37 | ||
| 80.890 | 25.122 | |||
Total assets owed by related parties | 97.524 | 46.618 | ||
| 2006 | 2005 | |||
| Amounts owed to related parties | Amounts owed to related parties | |||
| €’000 | €’000 | |||
Liabilities | ||||
Trade payables (Note 22): | ||||
RAG | 320 | 60 | ||
RCI | 129 | 0 | ||
RIAG Gebäudemanagement GmbH | 0 | 170 | ||
Montan-Grundstücksgesellschaft mbH | 0 | 42 | ||
Others | 2 | 67 | ||
| 451 | 339 | |||
Advance payments (Note 24): | ||||
RAG | 6.581 | 2.098 | ||
DSK Anthrazit Ibbenbüren GmbH | 1.445 | 0 | ||
| 8.026 | 2.098 | |||
Provisions for sales areas: | ||||
RAG | 12.649 | 16.879 | ||
Other provisions: | ||||
RAG | 1.754 | 0 | ||
Montan-Grundstücksgesellschaft mbH | 0 | 477 | ||
| 1.754 | 477 | |||
Lease liabilities >1 Year (Note 26): | ||||
Montan-Grundstücksgesellschaft mbH | 0 | 15.746 | ||
Lease liabilities <1 Year (Note 26): | ||||
Montan-Grundstücksgesellschaft mbH | 0 | 1.312 | ||
Other financial liabilities current + non-current (Note 21+23): | ||||
RCI | 47.305 | 36.484 | ||
Total liabilities owed to related parties | 70.185 | 73.335 | ||
F-70
Table of Contents
DBT GmbH—Notes to the consolidated financial statements—(Continued)
The trade receivables due from related parties include receivables from construction contracts accounted for using the percentage-of-completion method of € 3.267 (2005: € 3.134), less advance payments of € 478 (2005: € 0).
Sale of products to related parties:
| 2006 | 2005 | 2004 | ||||
| €’000 | €’000 | €’000 | ||||
RAG | 53.650 | 100.633 | 156.576 | |||
DSK Anthrazit Ibbenbüren GmbH | 9.990 | 6.092 | 13.493 | |||
STEAG Saar Energie AG | 275 | 0 | 30 | |||
Others | 0 | 8 | 47 | |||
| 63.915 | 106.733 | 170.146 | ||||
The sales to related parties include revenues from construction contracts accounted for using the percentage-of-completion method of € 10.041 (2005: € 31.958, 2004: € 68.174).
RAG has not charged administration costs in the financial year 2006 to DBT, the contract was terminated at the end of 2005 (2005: € 460, 2004: € 457).
RAG Versicherungsdienst GmbH arranged various insurance contracts for DBT during 2006, 2005 and 2004.
In 2006 DBT Group received € 2.431 (2005: € 1.462, 2004: € 1.393) in interest income and paid € 2.597 (2005: € 2.997, 2004: € 952) in interest expense to RCI.
For the year 2006 € 974 (2005: € 1.044, 2004: € 1.113) interest expense was derived from a finance lease contract with Montan-Grundstücksgesellschaft mbH. This contract was terminated in December 2006.
On December 22, 2006 the formerly leased factory premises in Lünen were purchased with a purchased price of € 18.080. As a result, the finance lease contract with Montan-Grundstücksgesellschaft mbH for the factory premises in Lünen was terminated.
Terms and conditions of transactions with related parties
Outstanding balances at the year-end are unsecured and settlement occurs in cash. There have been no guarantees provided or received for any related party receivables or payables. At December 31, 2006 the Group has not made any provision for doubtful debts relating to amounts owed by related parties (2005: € 0). An assessment is conducted each financial year based on the financial position of the related party and the market in which the related party operates. The financing-accounts with RCI (cash-pooling, loans) were bearing an interest rate of 1.75% p.a. to 2.25% p.a. (deposit balance). USD deposits were bearing an interest of 5.25% p.a. to 5.75% p.a.. All other accounts/balances with related parties are not bearing any interest.
F-71
Table of Contents
DBT GmbH—Notes to the consolidated financial statements—(Continued)
Compensation of key management personnel of the Group
| 2006 | 2005 | |||
| €’000 | €’000 | |||
Short-term employee benefits | 4.579 | 2.096 | ||
Post-employment pension | 88 | 53 | ||
Termination benefits | 500 | 0 | ||
Key management personnel compensation in total | 5.167 | 2.149 | ||
The provisions for pension obligations for key management personnel are at December 31, 2006 € 1.198 (2005: € 1.215).
Warranty settlement
In 2006, RCI agreed to settle a warranty claim raised by a customer of DBT in the amount of $ 23.950 (€ 18.185) on behalf of DBT. That amount is recorded as an expense and a contribution by RCI, net of taxes in an amount of € 11.093.
28. Financial risk management objectives and policies
Objectives and policies
The Group’s principal financial instruments, other than derivatives include loans from RCI, bank loans and overdrafts, finance leases, trade payables, hire purchase contracts and loans given. The main purpose of these financial instruments is to finance the Group’s operations. The Group has various financial assets such as trade receivables and cash and short-term deposits, which arise directly from its operations.
The Group also enters into derivative transactions, primarily forward currency contracts and currency swaps. The purpose is to manage the currency risks arising from the Group’s operations and financing activities.
The Group’s policy does not allow trading in derivatives.
Financial risk management
As a company with global operations, DBT is exposed to a wide range of risks. The main risks arising from the Group’s financial instruments are foreign currency risk, credit risk, liquidity risk and interest rate risk.
DBT’s implemented risk management system is effective in the early recognition, communication and handling of risks. The incorporation of the risk management process in the existing planning, management, control and reporting procedures forms the basis of our risk management system. This includes the analysis of all risks and opportunities as part of strategic and operational planning as well as monthly reporting. The basis is formed by the guidelines of RAG and RCI.
The aim of the risk management system is to identify potential risks which occur as part of our activities in the early stages, to assess their quantitative and qualitative consequences and to initiate appropriate precautions and safety measures. Potential risks that arise from the wide range of legal regulations and laws, decisions and the business processes are based on legal advice of experts, including experts employed by RAG and external experts. If justifiable, legal risks relating to past issues result in recognizing provisions in the balance sheet and the adequacy of such provisions is regularly assessed.
F-72
Table of Contents
DBT GmbH—Notes to the consolidated financial statements—(Continued)
Currency risk
As a result of its international business operations, DBT Group is exposed to exchange rate risks which can impact operating results, financial results and cash flows. For DBT Group currency risks arise from the sale of mining machines and mining equipment which are invoiced in foreign currencies such as the U.S. and Australian dollar.
Contractually agreed foreign currency payments are hedged using cash flow hedges. To reduce the effects of the exchange rate fluctuations, DBT Group continuously assesses its exchange rate risks and manages its risks using derivative financial instruments. The terms of the foreign currency contracts have been negotiated to match the expected cash flows from sales transactions. Changes in the fair values of the cash flow hedges are directly realized in equity, to the extent the hedge is effective. Any ineffective portion is recognized in the income statement.
If the hedging instrument no longer meets the criteria for hedge accounting, expires or is sold, terminated or exercised, then hedge accounting is discontinued prospectively. The cumulative gain or loss previously recognized in equity remains until the forecast transaction occurs. When the hedged item is a non-financial asset, the amount recognized in equity is transferred to the carrying amount of the asset when it is recognized. In other cases the amount recognized in equity is transferred to profit or loss in the same period that the hedged item affects profit or loss.
Credit risk
The Group trades only with recognized, creditworthy third parties. It is the Group’s policy that all customers who wish to trade on credit terms are subject to credit verification procedures and are monitored on an ongoing basis.
In addition, the default risk with external parties is managed through credit sale insurance, letters of credit or commitments on progress payments. Therefore, the Group’s exposure to bad debts is not significant.
Default risks are managed whenever possible through the contract terms e.g. letter of credits or bad debt insurance. Accumulated costs and obligations to suppliers due to work in progress are charged to customers when they occur (progress payments). Credit risk concentrations are minimized by contracting only with highly rated banks and insurance companies.
Liquidity risk
Adequate liquidity at DBT Group is assured through the financial planning policies of RCI.
Interest rate risk
The Group’s exposure to the risk of changes in market interest rates relates primarily to the Group’s long-term debt obligations with floating interest rates.
29. Derivative financial instruments
Derivative financial instruments and hedging activities
Derivative financial instruments are recorded at fair value. The fair value of purchases and sales of derivative financial instruments are entered into the balance sheet on trade date.
F-73
Table of Contents
DBT GmbH—Notes to the consolidated financial statements—(Continued)
The derivatives entered into by the DBT Group are comprised exclusively of forward exchange contracts and currency swaps. The derivatives outstanding at each year end are outlined in the following table. The total derivative volume is defined as the sum of the fair values of all purchase and sales amounts. In general, the fair value of a financial instrument is determined based on the amount that can be realized in a business transaction between parties both independent and willing to enter an agreement at arm’s length. The market value of derivative financial instruments does not consider the effects from the underlying transaction (i.e. pending transactions and anticipated transactions).
The market value of foreign exchange contracts is based on the current ECB-reference rate considering of the respective spread differences for the remaining term as at the trading day and valuation day.
The market value of the currency swaps is determined based on discounted expected cash flows. Therefore, the current market interest rate for the remaining term of the financial instrument is use in calculating the fair value.
DBT Group is exposed to counterparty risk, originating from the non-fulfillment of contractual obligations by the counterparty. To minimize this risk DBT Group enters into derivative transactions with financial institutions which have an A-Rating of Standard & Poors or Moodys at a minimum. Counterparty risks arise from transactions with a positive market value for DBT Group and with a maximum exposure equal to the fair value of the derivative instruments.
| 2006 | 2005 | |||||||
| Assets | Liabilities | Assets | Liabilities | |||||
| €’000 | €’000 | €’000 | €’000 | |||||
Derivatives immediately recognized in income Forward exchange contracts | ||||||||
<1 year | ||||||||
Fair value | 1.502 | 9 | 311 | 1.209 | ||||
Notional amount | 27.832 | 93 | 6.504 | 15.577 | ||||
>1 year | ||||||||
Fair value | 32 | 0 | 0 | 0 | ||||
Notional amount | 417 | 0 | 0 | 0 | ||||
Currency swaps | ||||||||
< 1 year | ||||||||
Fair value | 8 | 44 | 12 | 0 | ||||
Notional amount | 4.287 | 4.990 | 6.375 | 0 | ||||
> 1 year | ||||||||
Fair value | 0 | 0 | 0 | 0 | ||||
Notional amount | 0 | 0 | 0 | 0 | ||||
Cash flow hedges | ||||||||
Forward exchange contracts | ||||||||
< 1 year | ||||||||
Fair value | 1.754 | 235 | 125 | 6.898 | ||||
Notional amount | 42.283 | 4.698 | 27.528 | 121.714 | ||||
> 1 year | ||||||||
Fair value | 1.869 | 0 | 33 | 1.876 | ||||
Notional amount | 48.714 | 0 | 9.283 | 51.260 | ||||
Fair values as of December 31 | ||||||||
<1 year | 3.264 | 288 | 448 | 8.107 | ||||
>1 year | 1.901 | 0 | 33 | 1.876 | ||||
F-74
Table of Contents
DBT GmbH—Notes to the consolidated financial statements—(Continued)
Maturity of hedges | 2006 | 2005 | ||||||||
| Fair value | Notional amount | Fair value | Notional amount | |||||||
| €’000 | €’000 | €’000 | €’000 | |||||||
Expected future sale in | 2006 | 0 | 0 | -6.898 | 121.714 | |||||
| 0 | 0 | 125 | 27.528 | |||||||
| 2007 | 1.754 | 42.283 | -1.514 | 39.595 | ||||||
| -235 | 4.698 | 33 | 9.283 | |||||||
| 2008 | 1.760 | 45.133 | -362 | 11.665 | ||||||
| 2009 | 109 | 3.581 | 0 | 0 | ||||||
| 3.388 | 95.695 | -8.616 | 209.785 | |||||||
| 2006 | 2005 | 2004 | ||||
| €’000 | €’000 | €’000 | ||||
Change in fair values estimated recognized in the consolidated income statement | 76 | 64 | 172 |
In 2006, losses of € 6.772 (2005: gains of € 3.192) on cash flow hedges were charged to the income statement from equity. The amount that was recognized in equity during the year ended December 31, 2006 was € 1.941 (2005: € 5.553).
30. Reconciliation from IFRS to U.S. GAAP
The consolidated financial statements of DBT have been prepared in accordance with IFRS, which vary in certain respects from accounting principles generally accepted in the United States of America (U.S. GAAP).
Application of U.S. GAAP would have affected net profit for each of the years 2006, 2005 and 2004 and shareholders’ equity as of December 31, 2006 and 2005 to the extent described below.
Reconciliation of net profit from IFRS to U.S. GAAP:
| For the years | |||||||||
| 2006 | 2005 | 2004 | |||||||
| €’000 | €’000 | €’000 | |||||||
Profit of the year as reported in the consolidated financial statements under IFRS | 70.289 | 41.703 | 21.720 | ||||||
U.S. GAAP reconciling adjustments | |||||||||
Pensions | (b | ) | 2.147 | -2.843 | -8.384 | ||||
Early retirement benefits | (c | ) | 985 | -87 | -39 | ||||
Development costs | (d | ) | 158 | 581 | -576 | ||||
Warranty provisions | (e | ) | -33 | -513 | 412 | ||||
Derivatives | (f | ) | 6.773 | -11.879 | -1.136 | ||||
Income taxes | (g | ) | -14.773 | -599 | -1.216 | ||||
Net income in accordance with U.S. GAAP | 65.546 | 23.363 | 10.781 | ||||||
F-75
Table of Contents
DBT GmbH—Notes to the consolidated financial statements—(Continued)
Reconciliation of equity from IFRS to U.S. GAAP:
| December 31, | |||||||
| 2006 | 2005 | ||||||
| €’000 | €’000 | ||||||
Equity as reported in the consolidated balance sheets under IFRS | 169.316 | 122.002 | |||||
Less minority interest under IFRS | (h | ) | 531 | 531 | |||
Equity under IFRS without minority interest | 168.785 | 121.471 | |||||
U.S. GAAP reconciling adjustments: | |||||||
Purchase of premises in Lünen | (a | ) | -2.683 | 0 | |||
Pensions | (b | ) | -9.080 | -11.227 | |||
Early retirement benefits | (c | ) | 4.851 | 3.866 | |||
Development costs | (d | ) | -280 | -481 | |||
Warranty provisions | (e | ) | 57 | 98 | |||
Income taxes | (g | ) | -7.448 | -186 | |||
Equity in accordance with U.S. GAAP | 154.202 | 113.541 | |||||
(a) Purchase of premises in Lünen
The Company entered in to a lease agreement with an affiliated company for its premises in Lünen in 2004. This lease was classified as finance lease under IFRS as well as under U.S. GAAP. In the light of the potential sale of the DBT group, DBT purchased the premises from its affiliated company at the end of December 2006. The purchase price was equal to the carrying amount of the premises under the terms of the finance lease but exceeded the unamortized debt. Since the purchase was between entities under common control, DBT continues to carry the assets at amortized cost under U.S. GAAP and recognizes the excess of the purchase price it paid over the balance of unamortized lease liabilities of € 2.683 as capital transaction. Under IFRS, that excess was capitalized as additional cost of the asset.
(b) Pensions
The Company elected to immediately recognize gains and losses in income under U.S. GAAP instead of delaying their recognition. Accordingly, the adoption of SFAS No. 158, Employers’ Accounting for Defined Benefit Pension and Other Postretirement Plans an amendment of FASB Statements No. 87, 88, 106, and 132(R) (“SFAS No. 158”) as of December 31, 2006 did not have an impact on the carrying amount of the defined benefit obligation. SFAS No. 158 requires an employer to recognize the overfunded or underfunded status of a defined benefit postretirement plan (other than a multi-employer plan) as an asset or liability in the balance sheet and to recognize changes in that funded status in the year in which the changes occur through comprehensive income.
As allowed under IFRS 1, the Company initially recorded all unrecognized pension actuarial losses into the retained earnings as of January 1, 2003 the transition date to IFRS. DBT delays recognition of gains and losses under IFRS and only amortizes unrecognized gains or losses over the average remaining service period, if as of the beginning of such year the unrecognized gain or loss exceeds 10% of the projected benefit obligation.
(c) Early retirement benefits
In connection with its voluntary early retirement (Altersteilzeit (“ATZ”)) programs, DBT Group has made enhancements to certain retirement benefits. These enhancements are recognized as termination benefits under IFRS and recorded as expense in full when the obligation arises as part of the defined benefit obligation. Under U.S. GAAP these enhancements to retirement benefits are measured based on the employees who have accepted the offer and systematically recognized as expense and in the projected benefit obligation over the employees’ remaining service period.
F-76
Table of Contents
DBT GmbH—Notes to the consolidated financial statements—(Continued)
(d) Development costs
According toIAS 38 Intangible Assets the cost of research must be expensed as they are incurred and when the technical and economic feasibility of a project can be demonstrated, and further prescribed conditions are satisfied, the costs of the development of the project must be capitalized.
Under U.S. GAAP, pursuant to FAS 2 Accounting for Research and Development Cost general research and development cost that are not covered by separate standards are expensed as they are incurred.
(e) Warranty provisions
For specific warranty issues the Company estimates a range of possible outcomes. If no amount within the range is a better estimate than any other, then the minimum amount should be accrued under U.S. GAAP. In those circumstances, however, IAS 37 requires to use the mid-point of the range as the best estimate. Accordingly, in the absence of a best estimate within a range, the company has accrued the lower end of the range for U.S. GAAP purposes whereas under IFRS, the mid-range has been used.
(f) Derivatives
Under U.S. GAAP, in order for a derivative financial instrument to qualify for hedge accounting, hedge effectiveness must be assessed at least quarterly. Under IFRS, effectiveness must be assessed, at a minimum, as of a reporting date (interim or annual). Prior to 2006, the company had assessed effectiveness on an annual basis as they did not prepare quarterly financial information. As a result, for the periods prior to 2006, all changes in fair value of the derivatives are recorded in the income statement for U.S. GAAP since the company did not prepare the quarterly effectiveness test and, therefore, do not qualify for hedge accounting.
(g) Income taxes
Through the end of 2006, most German DBT Group Companies were member of RCI’s consolidated tax group. As a consequence, income taxes were assessed at the parent level, DBT was not directly subject to income taxes. The tax group is subject to federal corporate income tax and local trade income tax which result in a combined effective tax rate of approximately 39%. However, under the arrangements with DBT, RCI charged allocated corporate income taxes to DBT, but did not allocate any trade income taxes. For purposes of DBT’s separate financial statements under IFRS, the arrangement with RCI was considered and for the years 2004 to 2006 only the corporate tax rate of 26,38% was used to determine DBT’s income tax position at the German DBT Group entities. Under U.S. GAAP, however, the income tax position of DBT is determined as if DBT were a separate entity and filed its own tax returns in Germany. Accordingly, the income taxes at DBT were determined for federal and local income taxes for U.S. GAAP purposes resulting in a higher tax rate of 39%.
Further differences relating to income taxes include the deferred tax effects relating to the valuation differences between IFRS and U.S. GAAP as noted herein. Reconciling items that change the valuation of an asset or liability for U.S. GAAP purposes cause a temporary difference between the book balance and the tax balance sheet or a change therein. Consequently, deferred taxes were recognized or the valuation of existing deferred taxes was adjusted for U.S. GAAP purposes.
(h) Minority interest
Under IFRS, minority interest is classified as a component of equity. Under U.S. GAAP, minority interest is classified outside of Equity.
F-77
Table of Contents
PROSPECTUS
Bucyrus International, Inc.
DEBT SECURITIES
COMMON STOCK
PREFERRED STOCK
WARRANTS
Bucyrus International, Inc. may offer, from time to time, debt securities, common stock, preferred stock, and warrants. In addition, selling shareholders to be named in a prospectus supplement may offer, from time to time, shares of our common stock. We will provide the specific terms of any offering and the offered securities in supplements to this prospectus. Any prospectus supplement may also add, update or change information contained in this prospectus. You should read this prospectus and the accompanying prospectus supplement carefully before you make your investment decision.
This prospectus may not be used to consummate any sales of securities unless accompanied by a prospectus supplement which will describe the method and terms of the offering.
Our common stock is quoted on The NASDAQ National Market under the symbol “BUCY”.
Investing in our securities involves risks. You should carefully consider the “Risk Factors” which may be included in any supplement, or which are incorporated by reference into this prospectus.
We may sell the securities to or through underwriters, to other purchasers, through agents, or through a combination of these methods. The names of any underwriters will be stated in the applicable prospectus supplement.
Neither the Securities and Exchange Commission nor any state securities commission has approved or disapproved of these securities or determined if this prospectus is truthful and complete. Any representation to the contrary is a criminal offense.
The date of this prospectus is June 30, 2006.
Table of Contents
TABLE OF CONTENTS
| Page | ||
| 2 | ||
| 3 | ||
| 4 | ||
| 4 | ||
| 5 | ||
| 6 | ||
| 6 | ||
| 7 | ||
| 8 | ||
| 8 | ||
| 9 | ||
| 9 |
* * *
No person has been authorized to give any information or to make any representation not contained in, or incorporated by reference into, this prospectus or the accompanying prospectus supplement. You must not rely on any unauthorized information or representation. We do not imply or represent by delivering this prospectus that Bucyrus International, Inc., or its business, is unchanged after the date of the prospectus or that the information in this prospectus is correct as of any time after its date.
The information in this prospectus or any prospectus supplement may not contain all of the information that may be important to you. You should read the entire prospectus and any prospectus supplement, as well as the documents incorporated by reference into this prospectus or any accompanying prospectus supplement, before making an investment decision.
i
Table of Contents
This prospectus is part of a registration statement on Form S-3 that we filed with the Securities and Exchange Commission (“SEC”) utilizing a “shelf” registration process. Using this process, we may, from time to time, offer any combination of securities described in this prospectus in one or more offerings and selling shareholders to be named in a prospectus supplement may, from time to time, sell common stock in one or more offerings. This prospectus provides you with a general description of the securities that may be offered. Each time securities are sold, we will provide a prospectus supplement that will contain specific information about the terms of that particular offering. The prospectus supplement may also add, update or change information contained in this prospectus. To obtain additional information that may be important to you, you should also read the exhibits to the registration statement. You should read both this prospectus and any applicable prospectus supplement together with additional information described below under the heading “Where You Can Find More Information” and “Incorporation of Documents by Reference.”
When used in this prospectus and any prospectus supplement, the terms “Bucyrus,” “we,” “our,” “us” and the “Company” refer to Bucyrus International, Inc. and its subsidiaries.
2
Table of Contents
FORWARD-LOOKING STATEMENTS AND CAUTIONARY FACTORS
All statements other than statements of historical facts included or incorporated by reference into this prospectus, including statements regarding our future financial position, business strategy, budgets, projected costs, and plans and objectives for future operations are “forward looking statements” within the meaning of the Private Securities Litigation Reform Act of 1995. These statements are subject to risks and uncertainties that could cause actual results to differ materially from those anticipated as of the date of this prospectus. Forward looking statements generally can be identified by the use of forward looking words such as “may,” “will,” “expect,” “intend,” “estimate,” “anticipate,” “believe,” or “continue” or words of similar meaning.
Some of the factors that could cause such a variance are disclosed in the section “Risk Factors” in the accompanying prospectus supplement and elsewhere in this prospectus and documents incorporated by reference into this prospectus, and include the following, among others:
| • | general economic conditions and growth or contraction of the principal economies in which we operate, including the United States, Canada, Europe, Latin and South America and the Asia-Pacific region; |
| • | our ability to retain significant contracts and customers, to anticipate and react to shifts in customer purchasing patterns, consolidation of customers, changes in business models, and increased competition; |
| • | ability of our suppliers to deliver quality components and products in time for us to meet critical manufacturing and distribution schedules; |
| • | our ability to develop and successfully market new products, to develop, acquire, retain and protect necessary intellectual property rights and to evaluate new technologies; |
| • | ability to attract and retain key talent in all regions and businesses; |
| • | our ability to effectively evaluate potential acquisition transactions, effectuate such transactions at a reasonable price, and integrate the acquired entity and its product offerings; |
| • | ability to plan for and enact business continuation practices in the event of a significant interruption to one of our key operations; |
| • | transaction, translation, and other effects of currency fluctuations; |
| • | availability and cost of raw materials and the ability to control or pass on costs of raw materials and labor; |
| • | our ability to satisfy environmental compliance requirements; |
| • | political, economic, regulatory and environmental/health conditions in foreign countries; |
| • | effects of computer viruses, internet scams or fraud schemes; |
| • | availability of electricity, natural gas and other sources of power; |
| • | interest rate increases; |
| • | adoption of new or revised accounting policies and practices; |
| • | continued successful implementation of an enterprise resource planning system in portions of our business; |
| • | ability and willingness of purchasers to substitute other products for the products that we distribute; |
| • | pricing, purchasing, financing and promotional decisions by intermediaries in our distribution channels; and |
| • | increased price pressure from suppliers. |
We urge you to consider these factors and to review carefully the section “Risk Factors” in the accompanying prospectus supplement for a more complete discussion of the risks of an investment in our securities. The forward looking statements included in this prospectus or incorporated by reference into this prospectus are made only as of the date of this prospectus or the date of the incorporated document, and we undertake no obligation to publicly update these statements to reflect subsequent events or circumstances.
3
Table of Contents
Bucyrus designs, manufactures and markets large excavation machinery used for surface mining, and provides comprehensive aftermarket services, supplying replacement parts and offering maintenance and repair contracts and services for these machines. We manufacture original equipment (“OEM”) products and the majority of aftermarket parts at our facility in South Milwaukee, Wisconsin. Our principal OEM products are draglines, electric mining shovels and rotary blasthole drills, which are used primarily by customers who mine copper, coal, oil sands and iron ore throughout the world. In addition, we provide aftermarket services in mining centers throughout the world, including Australia, Brazil, Canada, Chile, China, India, Peru, South Africa and the United States. The largest markets for mining equipment have been in Australia, Canada, South Africa, South America and the United States. Brazil, Canada, China and India are expected to become increasingly important markets for the Company.
Bucyrus is a Delaware corporation The address and telephone number of our principal offices are 1100 Milwaukee Avenue, P.O. Box 500, South Milwaukee, Wisconsin 53172, telephone (414) 768-4000.
WHERE YOU CAN FIND MORE INFORMATION
Bucyrus files annual, quarterly and current reports, proxy statements and other information with the SEC. We have also filed a registration statement on Form S-3, including exhibits and schedules, under the Securities Act of 1933 with respect to the securities that we may issue from time to time. This prospectus is a part of that registration statement, but does not contain all of the information included in the registration statement or the exhibits and schedules. You may read and copy the registration statement and any reports, statements or other information filed by us with the SEC at the SEC’s public reference facility at:
Room 1580
100 F Street, N.E.
Washington, D.C. 20549
You may obtain information on the operation of the public reference room by calling the SEC at 1-800-SEC-0330. The SEC also maintains a website at http://www.sec.gov that contains reports and other information regarding issuers like us that file electronically with the SEC. You may also obtain copies of these materials through our web site, http://www.bucyrus.com.
Our common stock is quoted on The NASDAQ National Market under the symbol “BUCY” and our SEC filings can also be read at the following address: Nasdaq Operations, 1735 K Street, N.W., Washington, D.C. 20006.
4
Table of Contents
INCORPORATION OF DOCUMENTS BY REFERENCE
The SEC allows us to “incorporate by reference” into this prospectus information that we file with the SEC. This means that:
| • | we can disclose important information to you by referring to other documents that contain that information; |
| • | the information incorporated by reference is considered to be part of this prospectus; and |
| • | any information that we file with the SEC in the future is automatically incorporated into this prospectus and updates and supersedes previously filed information, including information contained in this prospectus. |
We incorporate by reference into this prospectus the following documents and any future filings we make with the SEC under Sections 13(a), 13(c), 14 or 15(d) of the Securities Exchange Act of 1934 after the date of this prospectus until we sell all of the securities that we have registered under the registration statement of which this is a part:
| • | Our Annual Report on Form 10-K for the year ended December 31, 2005, as amended; |
| • | Our Quarterly Report on Form 10-Q for the quarter ended March 31, 2006; |
| • | Our Current Reports on Form 8-K filed February 17, 2006 (excluding information furnished pursuant to Items 2.02 and 7.01), March 10, 2006, May 4, 2006 (excluding information furnished pursuant to Items 2.02 and 7.01), and May 17, 2006; and |
| • | That portion of our Registration Statement on Form 8-A dated July 20, 2004 that describes our Common Stock in Item 1 thereof, which incorporates the description of our Capital Stock contained in our Registration Statement on Form S-1 (Registration Statement No. 333-114326), as amended by Item 5.03 of our Current Report on Form 8-K filed May 4, 2006, and including any future amendment or report filed for the purpose of updating such description. |
You may access a copy of any of these filings, free of charge, at our web site, www.bucyrus.com, or may request a copy of any of these filings, at no cost, by writing to Investor Relations, Bucyrus International, Inc., P.O. Box 500, 1100 Milwaukee Avenue, South Milwaukee, WI 53172.
If we have incorporated by reference any statement or information into this prospectus and we subsequently modify that statement or information, the statement or information incorporated into this prospectus is also modified or superseded in the same manner. This prospectus incorporates by reference any subsequently filed document.
5
Table of Contents
Except as otherwise described in an applicable prospectus supplement, we intend to use the net proceeds from the sale of the securities for one or more of the following purposes:
| • | refinance, in part, existing indebtedness; |
| • | finance, in part, the cost of acquisitions; |
| • | finance capital expenditures and capacity expansion; and/or |
| • | general corporate purposes and working capital. |
Funds which are not required immediately for these purposes may be invested temporarily in short-term marketable securities.
RATIO OF EARNINGS TO FIXED CHARGES
The following table sets forth our ratio of earnings to fixed charges for the three months ended March 31, 2006, and for the five years ended December 31, 2005, 2004, 2003, 2002 and 2001.
| Three Months Ended March 31, 2006 | Years Ended December 31, | |||||||||||||||
| 2005 | 2004 | 2003 | 2002 | 2001 | ||||||||||||
Ratio of Earnings to Fixed Charges | 18.1 | x | 10.3 | x | 2.1 | x | 1.1 | x | — | — | ||||||
For the purposes of computing the ratio of earnings to fixed charges, (1) earnings consist of earnings (loss) before income taxes plus fixed charges and (2) fixed charges consist of interest expense, the estimate of the interest component of rental expense and amortization of capitalized expenses related to indebtedness. Earnings were insufficient to cover fixed charges by approximately $5.7 million and $7.1 million in the years ended December 31, 2002 and 2001, respectively.
6
Table of Contents
SELECTED CONSOLIDATED FINANCIAL DATA
On March 8, 2006, our Board of Directors authorized a three-for-two split of our Class A common stock, which was effective subsequent to the filing of our 2005 Annual Report to Shareholders and Annual Report on Form 10-K with the Securities and Exchange Commission. The stock split was paid on March 29, 2006 to our shareholders of record on March 20, 2006. Our Class A common stock began trading on a split-adjusted basis on March 30, 2006. In addition, our Board of Directors authorized a quarterly dividend of $.05 per share of Class A common stock for dividends payable to shareholders of record on May 18, 2006.
The following table sets forth selected consolidated financial data for our operations as of and for the five fiscal years ended December 31, 2005 restated for all periods to give effect to the stock split. We derived the selected financial information for each of the five years ended December 31, 2001, 2002, 2003, 2004 and 2005 from our audited consolidated financial statements and the related notes thereto.
| Years Ended December 31, | ||||||||||||||||||
| 2005 | 2004 | 2003 | 2002 | 2001 | ||||||||||||||
Consolidated Statement of Operations Data: | ||||||||||||||||||
Net earnings (loss) per share of common stock: | ||||||||||||||||||
Basic | $ | 1.76 | $ | .26 | $ | (.21 | ) | $ | (.63 | ) | $ | (.61 | ) | |||||
Diluted | 1.71 | .25 | (.21 | ) | (.63 | ) | (.61 | ) | ||||||||||
Weighted average shares | ||||||||||||||||||
Basic | 30,483,453 | 23,197,292 | 17,565,468 | 17,227,200 | 17,227,200 | |||||||||||||
Diluted | 31,246,137 | 24,221,550 | 17,565,468 | 17,227,200 | 17,227,200 | |||||||||||||
Cash dividends per common share | $ | .153 | $ | .0383 | — | — | — | |||||||||||
7
Table of Contents
We may issue from time to time, in one or more offerings, the following securities:
| • | debt securities, which may be senior or subordinated; |
| • | shares of common stock, $0.01 par value per share; |
| • | shares of preferred stock, $0.01 par value per share; and |
| • | warrants exercisable for common stock. |
We will set forth in the applicable prospectus supplement a description of the debt securities, common stock, preferred stock or warrants that may be offered under this prospectus. The terms of the offering of securities, the initial offering price and the net proceeds to us will be contained in the prospectus supplement, and other offering material, relating to such offering.
Information about selling shareholders, where applicable, will be set forth in a prospectus supplement, in a post-effective amendment, or in filings we make with the SEC under the Securities Exchange Act of 1934 which are incorporated by reference.
8
Table of Contents
The validity of the securities to be sold pursuant to this prospectus will be passed upon for us by Quarles & Brady LLP, Milwaukee, Wisconsin, counsel to the Company. Legal matters will be passed upon for the underwriters, dealers or agents by counsel we will name in the applicable prospectus supplement.
The consolidated financial statements, the related financial statement schedule, and management’s report on the effectiveness of internal control over financial reporting incorporated in this prospectus by reference from the Company’s Annual Report on Form 10-K for the year ended December 31, 2005 have been audited by Deloitte & Touche LLP, an independent registered public accounting firm, as stated in their reports, which are incorporated herein by reference, and have been so incorporated in reliance upon the reports of such firm given upon their authority as experts in accounting and auditing.
9
Table of Contents
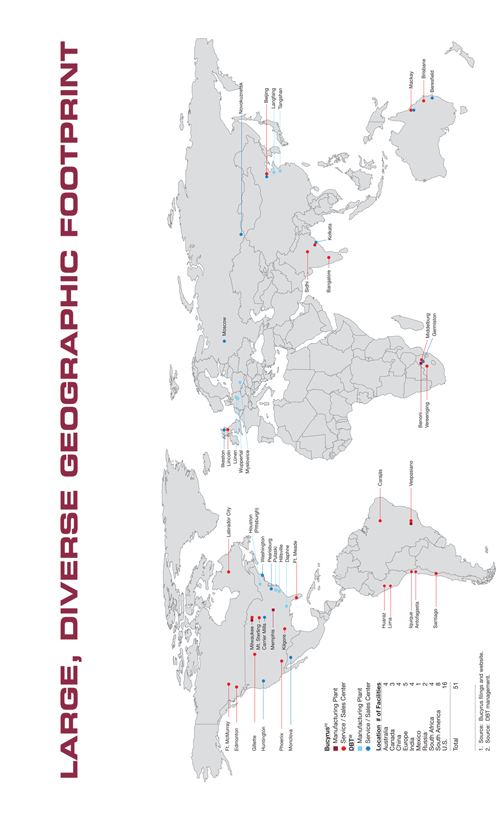
Table of Contents

4,614,000 Shares
Bucyrus International, Inc.
Class A Common Stock
PROSPECTUS SUPPLEMENT
, 2007
Sole Book-Running Manager
LEHMAN BROTHERS
JPMORGAN
STIFEL NICOLAUS