| | OMB APPROVAL |
| | OMB Number: | 3235-0570 |
| | Expires: | November 30, 2005 |
| UNITED STATES | Estimated average burden hours per response. . . . . . . . . . . . . . . . .5.0 |
| SECURITIES AND EXCHANGE COMMISSION | |
| Washington, D.C. 20549 | |
| | | | |
FORM N-CSR
CERTIFIED SHAREHOLDER REPORT OF REGISTERED
MANAGEMENT INVESTMENT COMPANIES
Investment Company Act file number | 811-03980 |
|
Morgan Stanley Institutional Fund Trust |
(Exact name of registrant as specified in charter) |
|
1221 AVENUE OF THE AMERICAS 5TH FLOOR NEW YORK, NY | | 10020 |
(Address of principal executive offices) | | (Zip code) |
|
RONALD E. ROBISON
1221 AVENUE OF THE AMERICAS 5TH FLOOR NEW YORK, NY 10020 |
(Name and address of agent for service) |
|
Registrant’s telephone number, including area code: | 1-800-221-6726 | |
|
Date of fiscal year end: | 9/30 | |
|
Date of reporting period: | 3/31/07 | |
| | | | | | | | |
Form N-CSR is to be used by management investment companies to file reports with the Commission not later than 10 days after the transmission to stockholders of any report that is required to be transmitted to stockholders under Rule 30e-1 under the Investment Company Act of 1940 (17 CFR 270.30e-1). The Commission may use the information provided on Form N-CSR in its regulatory, disclosure review, inspection, and policymaking roles.
A registrant is required to disclose the information specified by Form N-CSR, and the Commission will make this information public. A registrant is not required to respond to the collection of information contained in Form N-CSR unless the Form displays a currently valid Office of Management and Budget (“OMB”) control number. Please direct comments concerning the accuracy of the information collection burden estimate and any suggestions for reducing the burden to Secretary, Securities and Exchange Commission, 450 Fifth Street, NW, Washington, DC 20549-0609. The OMB has reviewed this collection of information under the clearance requirements of 44 U.S.C. Section 3507.
Item 1. Reports to Shareholders.
The Fund’s semi-annual report transmitted to shareholders pursuant to Rule 30e-1 under the Investment Company Act of 1940 is as follows:
Morgan Stanley Investment Management

| Morgan Stanley |
| Institutional Fund Trust |
| |
| Balanced Portfolio | |
| Balanced | |
| | |
| Equity Portfolios | |
| Equities Plus | U.S. Small Cap Value |
| Mid Cap Growth | Value |
| U.S. Mid Cap Value | |
| | |
| Fixed Income Portfolios | |
| Core Fixed Income | Investment Grade Fixed Income |
| Core Plus Fixed Income | Limited Duration |
| High Yield | Long Duration Fixed Income |
| Intermediate Duration | Municipal |
| International Fixed Income | |
| | |
| | March 31, 2007 | |
| | | |
| Semi-Annual Report |
2007 Semi-Annual Report |
| |
March 31, 2007 |
Table of Contents
Shareholders’ Letter | 2 |
Expense Examples | 3 |
Portfolios of Investments | |
Balanced Portfolio: | |
Balanced | 7 |
Equity Portfolios: | |
Equities Plus | 18 |
Mid Cap Growth | 21 |
U.S. Mid Cap Value | 23 |
U.S. Small Cap Value | 25 |
Value | 27 |
Fixed Income Portfolios: | |
Core Fixed Income | 29 |
Core Plus Fixed Income | 36 |
High Yield | 44 |
Intermediate Duration | 50 |
International Fixed Income | 56 |
Investment Grade Fixed Income | 59 |
Limited Duration | 66 |
Long Duration Fixed Income | 73 |
Municipal | 75 |
Statements of Assets & Liabilities | 83 |
Statements of Operations | 91 |
Statements of Changes in Net Assets | 94 |
Statements of Cash Flows | 103 |
Financial Highlights | 105 |
Notes to Financial Statements | 126 |
Trustee and Officer Information | 143 |
This report is authorized for distribution only when preceded or accompanied by prospectuses of the Morgan Stanley Institutional Fund Trust. To receive a prospectus and/or SAI, which contains more complete information such as investment objectives, charges, expenses, policies for voting proxies, risk considerations, and describes in detail each of the Portfolio’s investment policies to the prospective investor, please call 1 (800) 354-8185. Please read the prospectus carefully before you invest or send money. Additionally, you can access portfolio information including performance, characteristics, and investment team commentary through Morgan Stanley Investment Management’s website: www.morganstanley.com/im.
1
2007 Semi-Annual Report |
|
March 31, 2007 (unaudited) |
Shareholders’ Letter
Dear Shareholders:
We are pleased to present to you the Morgan Stanley Institutional Fund Trust’s (the “Fund”) Semi-Annual Report for the six months ended March 31, 2007. Our Fund currently consists of 18 portfolios. The Fund’s portfolios, together with the portfolios of the Morgan Stanley Institutional Fund, Inc., provide investors with a means to help them meet specific investment needs and to allocate their investments among equities (e.g., value and growth; small, medium, and large capitalization), and fixed income (e.g., short, medium, and long duration; investment grade and high yield).
Sincerely,

Ronald E. Robison
President and Principal Executive Officer
April 2007
2
2007 Semi-Annual Report |
| |
March 31, 2007 (unaudited) |
Expense Examples
Expense Examples
As a shareholder of a Portfolio, you may incur two types of costs: (1) transactional costs, including redemption fees; and (2) ongoing costs, including management fees, shareholder servicing fees (in the case of Investment Class), distribution (12b-1) fees (in the case of Adviser Class); and other Portfolio expenses. These examples are intended to help you understand your ongoing costs (in dollars) of investing in each Portfolio and to compare these costs with the ongoing costs of investing in other mutual funds.
The examples are based on an investment of $1,000 invested at the beginning of the six-month period ended March 31, 2007 and held for the entire six-month period.
Actual Expenses
The first line of the tables below provides information about actual account values and actual expenses. You may use the information in this line, together with the amount you invested, to estimate the expenses that you paid over the period. Simply divide your account value by $1,000 (for example, an $8,600 account value divided by $1,000 = 8.6), then multiply the result by the number in the first line under the heading entitled “Expenses Paid During Period” to estimate the expenses you paid on your account during this period.
Please note that “Expenses Paid During Period” are grossed up to reflect Portfolio expenses prior to the effect of Expense Offset (See Note E in the Notes to Financial Statements). Therefore, the annualized net expense ratios may differ from the ratio of expenses to average net assets shown in the Financial Highlights.
Hypothetical Example for Comparison Purposes
The second line of the tables below provides information about hypothetical account values and hypothetical expenses based on a Portfolio’s actual expense ratio and an assumed rate of return of 5% per year before expenses, which is not the Portfolio’s actual return. The hypothetical account values and expenses may not be used to estimate the actual ending account balance or expenses you paid for the period. You may use this information to compare the ongoing costs of investing in a Portfolio and other funds. To do so, compare this 5% hypothetical example with the 5% hypothetical examples that appear in the shareholder reports of the other funds.
Please note that the expenses shown in the table are meant to highlight your ongoing costs only and do not reflect any transactional costs, such as redemption fees. Therefore, the second line of the table is useful in comparing ongoing costs only, and will not help you determine the relative total costs of owning different funds. In addition, if these transactional costs were included, your costs would have been higher.
| | Beginning Account Value | | Ending Account Value | | Expenses Paid During Period* | |
| | October 1, 2006 | | March 31, 2007 | | October 1, 2006 — March 31, 2007 | |
Balanced Portfolio | | | | | | | |
Institutional Class | | | | | | | |
Actual | | $ | 1,000.00 | | $ | 1,073.80 | | $ | 3.21 | |
Hypothetical (5% average annual return before expenses) | | 1,000.00 | | 1,021.84 | | 3.13 | |
Investment Class | | | | | | | |
Actual | | 1,000.00 | | 1,073.20 | | 3.98 | |
Hypothetical (5% average annual return before expenses) | | 1,000.00 | | 1,021.09 | | 3.88 | |
Adviser Class | | | | | | | |
Actual | | 1,000.00 | | 1,071.80 | | 4.49 | |
Hypothetical (5% average annual return before expenses) | | 1,000.00 | | 1,020.59 | | 4.38 | |
| | | | | | | | | | |
* Expenses are equal to Institutional Class’, Investment Class’ and Adviser Class’ annualized net expense ratios of 0.62%, 0.77% and 0.87%, respectively, multiplied by the average account value over the period, multiplied by 182/365 (to reflect the one-half year period).
Equities Plus Portfolio | | | | | | | |
Institutional Class | | | | | | | |
Actual | | $ | 1,000.00 | | $ | 1,076.30 | | $ | 3.11 | |
Hypothetical (5% average annual return before expenses) | | 1,000.00 | | 1,021.94 | | 3.02 | |
Adviser Class | | | | | | | |
Actual | | 1,000.00 | | 1,076.10 | | 4.40 | |
Hypothetical (5% average annual return before expenses) | | 1,000.00 | | 1,020.69 | | 4.28 | |
| | | | | | | | | | |
* Expenses are equal to Institutional Class’ and Adviser Class’ annualized net expense ratios of 0.60% and 0.85%, respectively, multiplied by the average account value over the period, multiplied by 182/365 (to reflect the one-half year period).
3
2007 Semi-Annual Report |
|
March 31, 2007 (unaudited) |
Expense Examples (cont’d)
| | Beginning Account Value | | Ending Account Value | | Expenses Paid During Period* | |
| | October 1, 2006 | | March 31, 2007 | | October 1, 2006 — March 31, 2007 | |
Mid Cap Growth Portfolio | | | | | | | |
Institutional Class | | | | | | | |
Actual | | $ | 1,000.00 | | $ | 1,119.20 | | $ | 3.43 | |
Hypothetical (5% average annual return before expenses) | | 1,000.00 | | 1,021.69 | | 3.28 | |
Adviser Class | | | | | | | |
Actual | | 1,000.00 | | 1,117.60 | | 4.75 | |
Hypothetical (5% average annual return before expenses) | | 1,000.00 | | 1,020.44 | | 4.53 | |
| | | | | | | | | | |
* Expenses are equal to Institutional Class’ and Adviser Class’ annualized net expense ratios of 0.65% and 0.90%, respectively, multiplied by the average account value over the period, multiplied by 182/365 (to reflect the one-half year period).
U.S. Mid Cap Value Portfolio | | | | | | | |
Institutional Class | | | | | | | |
Actual | | $ | 1,000.00 | | $ | 1,149.10 | | $ | 4.88 | |
Hypothetical (5% average annual return before expenses) | | 1,000.00 | | 1,020.39 | | 4.58 | |
Investment Class | | | | | | | |
Actual | | 1,000.00 | | 1,148.20 | | 5.68 | |
Hypothetical (5% average annual return before expenses) | | 1,000.00 | | 1,019.65 | | 5.34 | |
Adviser Class | | | | | | | |
Actual | | 1,000.00 | | 1,147.60 | | 6.21 | |
Hypothetical (5% average annual return before expenses) | | 1,000.00 | | 1,019.15 | | 5.84 | |
| | | | | | | | | | |
* Expenses are equal to Institutional Class’, Investment Class’ and Adviser Class’ annualized net expense ratios of 0.91%, 1.06% and 1.16%, respectively, multiplied by the average account value over the period, multiplied by 182/365 (to reflect the one-half year period).
U.S. Small Cap Value Portfolio | | | | | | | |
Institutional Class | | | | | | | |
Actual | | $ | 1,000.00 | | $ | 1,163.50 | | $ | 6.10 | |
Hypothetical (5% average annual return before expenses) | | 1,000.00 | | 1,019.30 | | 5.69 | |
Adviser Class | | | | | | | |
Actual | | 1,000.00 | | 1,162.10 | | 4.69 | |
Hypothetical (5% average annual return before expenses) | | 1,000.00 | | 1,020.59 | | 4.38 | |
| | | | | | | | | | |
* Expenses are equal to Institutional Class’ and Adviser Class’ annualized net expense ratios of 0.87% and 1.13%, respectively, multiplied by the average account value over the period, multiplied by 182/365 (to reflect the one-half year period).
Value Portfolio | | | | | | | |
Institutional Class | | | | | | | |
Actual | | $ | 1,000.00 | | $ | 1,074.40 | | $ | 3.36 | |
Hypothetical (5% average annual return before expenses) | | 1,000.00 | | 1,021.69 | | 3.28 | |
Investment Class | | | | | | | |
Actual | | 1,000.00 | | 1,074.10 | | 4.14 | |
Hypothetical (5% average annual return before expenses) | | 1,000.00 | | 1,020.94 | | 4.03 | |
Adviser Class | | | | | | | |
Actual | | 1,000.00 | | 1,073.10 | | 4.65 | |
Hypothetical (5% average annual return before expenses) | | 1,000.00 | | 1,020.44 | | 4.53 | |
| | | | | | | | | | |
* Expenses are equal to Institutional Class’, Investment Class’ and Adviser Class’ annualized net expense ratios of 0.65%, 0.80% and 0.90%, respectively, multiplied by the average account value over the period, multiplied by 182/365 (to reflect the one-half year period).
Core Fixed Income Portfolio | | | | | | | |
Institutional Class | | | | | | | |
Actual | | $ | 1,000.00 | | $ | 1,025.10 | | $ | 2.52 | |
Hypothetical (5% average annual return before expenses) | | 1,000.00 | | 1,022.44 | | 2.52 | |
Adviser Class | | | | | | | |
Actual | | 1,000.00 | | 1,023.10 | | 3.78 | |
Hypothetical (5% average annual return before expenses) | | 1,000.00 | | 1,021.19 | | 3.78 | |
| | | | | | | | | | |
* Expenses are equal to Institutional Class’ and Adviser Class’ annualized net expense ratios of 0.50% and 0.75%, respectively, multiplied by the average account value over the period, multiplied by 182/365 (to reflect the one-half year period).
4
2007 Semi-Annual Report |
| |
March 31, 2007 (unaudited) |
Expense Examples (cont’d)
| | Beginning Account Value | | Ending Account Value | | Expenses Paid During Period* | |
| | October 1, 2006 | | March 31, 2007 | | October 1, 2006 — March 31, 2007 | |
Core Plus Fixed Income Portfolio | | | | | | | |
Institutional Class | | | | | | | |
Actual | | $ | 1,000.00 | | $ | 1,028.30 | | $ | 2.28 | |
Hypothetical (5% average annual return before expenses) | | 1,000.00 | | 1,022.69 | | 2.27 | |
Investment Class | | | | | | | |
Actual | | 1,000.00 | | 1,027.60 | | 3.03 | |
Hypothetical (5% average annual return before expenses) | | 1,000.00 | | 1,021.94 | | 3.02 | |
Adviser Class | | | | | | | |
Actual | | 1,000.00 | | 1,026.20 | | 3.54 | |
Hypothetical (5% average annual return before expenses) | | 1,000.00 | | 1,021.44 | | 3.53 | |
| | | | | | | | | | |
* Expenses are equal to Institutional Class’, Investment Class’ and Adviser Class’ annualized net expense ratios of 0.45%, 0.60% and 0.70%, respectively, multiplied by the average account value over the period, multiplied by 182/365 (to reflect the one-half year period).
High Yield Portfolio | | | | | | | |
Institutional Class | | | | | | | |
Actual | | $ | 1,000.00 | | $ | 1,057.60 | | $ | 3.64 | |
Hypothetical (5% average annual return before expenses) | | 1,000.00 | | 1,021.39 | | 3.58 | |
Adviser Class | | | | | | | |
Actual | | 1,000.00 | | 1,057.90 | | 4.93 | |
Hypothetical (5% average annual return before expenses) | | 1,000.00 | | 1,020.14 | | 4.84 | |
| | | | | | | | | | |
* Expenses are equal to Institutional Class’ and Adviser Class’ annualized net expense ratios of 0.71% and 0.96%, respectively multiplied by the average account value over the period, multiplied by 182/365 (to reflect the one-half year period).
Intermediate Duration Portfolio | | | | | | | |
Institutional Class | | | | | | | |
Actual | | $ | 1,000.00 | | $ | 1,025.00 | | $ | 2.83 | |
Hypothetical (5% average annual return before expenses) | | 1,000.00 | | 1,022.14 | | 2.82 | |
Investment Class | | | | | | | |
Actual | | 1,000.00 | | 1,024.40 | | 3.58 | |
Hypothetical (5% average annual return before expenses) | | 1,000.00 | | 1,021.39 | | 3.58 | |
| | | | | | | | | | |
* Expenses are equal to Institutional Class’ and Investment Class’ annualized net expense ratios of 0.56% and 0.71%, respectively, multiplied by the average account value over the period, multiplied by 182/365 (to reflect the one-half year period).
International Fixed Income Portfolio | | | | | | | |
Institutional Class | | | | | | | |
Actual | | $ | 1,000.00 | | $ | 1,032.10 | | $ | 3.19 | |
Hypothetical (5% average annual return before expenses) | | 1,000.00 | | 1,021.79 | | 3.18 | |
| | | | | | | | | | |
* Expenses are equal to Institutional Class’ annualized net expense ratio of 0.63% multiplied by the average account value over the period, multiplied by 182/365 (to reflect the one-half year period).
Investment Grade Fixed Income Portfolio | | | | | | | |
Institutional Class | | | | | | | |
Actual | | $ | 1,000.00 | | $ | 1,025.50 | | $ | 2.58 | |
Hypothetical (5% average annual return before expenses) | | 1,000.00 | | 1,022.39 | | 2.57 | |
Adviser Class | | | | | | | |
Actual | | 1,000.00 | | 1,023.80 | | 3.33 | |
Hypothetical (5% average annual return before expenses) | | 1,000.00 | | 1,021.64 | | 3.33 | |
| | | | | | | | | | |
* Expenses are equal to Institutional Class’ and Adviser Class’ annualized net expense ratios of 0.51% and 0.66%, respectively, multiplied by the average account value over the period, multiplied by 182/365 (to reflect the one-half year period).
Limited Duration Portfolio | | | | | | | |
Institutional Class | | | | | | | |
Actual | | $ | 1,000.00 | | $ | 1,025.40 | | $ | 2.32 | |
Hypothetical (5% average annual return before expenses) | | 1,000.00 | | 1,022.64 | | 2.32 | |
| | | | | | | | | | |
* Expenses are equal to Institutional Class’ annualized net expense ratio of 0.46% multiplied by the average account value over the period, multiplied by 182/365 (to reflect the one-half year period).
5
2007 Semi-Annual Report |
|
March 31, 2007 (unaudited) |
Expense Examples (cont’d)
| | Beginning Account Value | | Ending Account Value | | Expenses Paid During Period* | |
| | October 1, 2006 | | March 31, 2007 | | October 1, 2006 — March 31, 2007 | |
Long Duration Fixed Income Portfolio | | | | | | | |
Institutional Class | | | | | | | |
Actual | | $ | 1,000.00 | | $ | 1,014.40 | | $ | 2.56 | |
Hypothetical (5% average annual return before expenses) | | 1,000.00 | | 1,022.39 | | 2.57 | |
Adviser Class | | | | | | | |
Actual | | 1,000.00 | | 1,012.30 | | 3.81 | |
Hypothetical (5% average annual return before expenses) | | 1,000.00 | | 1,021.14 | | 3.83 | |
| | | | | | | | | | |
* Expenses are equal to Institutional Class’ and Adviser Class’ annualized net expense ratios of 0.51% and 0.76%, respectively multiplied by the average account value over the period, multiplied by 182/365 (to reflect the one-half year period).
Municipal Portfolio | | | | | | | |
Institutional Class | | | | | | | |
Actual | | $ | 1,000.00 | | $ | 1,021.40 | | $ | 2.47 | |
Hypothetical (5% average annual return before expenses) | | 1,000.00 | | 1,022.49 | | 2.47 | |
| | | | | | | | | | |
* Expenses are equal to Institutional Class’ annualized net expense ratio of 0.49% multiplied by the average account value over the period, multiplied by 182/365 (to reflect the one-half year period).
6
2007 Semi-Annual Report |
| |
March 31, 2007 (unaudited) |
Portfolio of Investments
Balanced Portfolio
| | Face | | | |
| | Amount | | Value | |
| | (000) | | (000) | |
Fixed Income Securities (25.2%) | | | | | |
Agency Adjustable Rate Mortgages (1.1%) | | | | | |
Federal National Mortgage Association, | | | | | |
Conventional Pools: | | | | | |
5.10%, 11/1/35 | | $ | 329 | | $ | 327 | |
7.46%, 5/1/36 | | 719 | | 739 | |
7.49%, 7/1/36 - 8/1/36 | | 857 | | 882 | |
Government National Mortgage Association, | | | | | |
Adjustable Rate Mortgages: | | | | | |
5.38%, 2/20/25 - 1/20/28 | | 521 | | 528 | |
5.64%, 1/1/37 | | 322 | | 325 | |
5.76%, 1/1/37 | | 550 | | 554 | |
6.13%, 11/20/25 - 12/20/27 | | 127 | | 129 | |
| | | | 3,484 | |
Agency Fixed Rate Mortgages (3.4%) | | | | | |
Federal Home Loan Mortgage Corp., | | | | | |
Conventional Pools: | | | | | |
10.00%, 9/1/17 | | 25 | | 27 | |
10.50%, 8/1/19 - 12/1/19 | | 76 | | 85 | |
11.00%, 5/1/20 - 9/1/20 | | 36 | | 40 | |
12.00%, 3/1/15 | | 31 | | 35 | |
Gold Pools: | | | | | |
7.50%, 8/1/20 - 11/1/32 | | 478 | | 500 | |
8.00%, 2/1/21 - 8/1/31 | | 400 | | 421 | |
9.50%, 12/1/22 | | 34 | | 37 | |
10.00%, 12/1/19 | | 33 | | 36 | |
Federal National Mortgage Association, | | | | | |
Conventional Pools: | | | | | |
6.50%, 4/1/32 - 7/1/32 | | 347 | | 357 | |
7.00%, 3/1/18 - 10/1/34 | | 1,350 | | 1,405 | |
7.50%, 11/1/29 - 9/1/35 | | 964 | | 1,009 | |
8.00%, 2/1/30 - 5/1/32 | | 430 | | 454 | |
8.50%, 6/1/30 - 12/1/30 | | 260 | | 280 | |
9.50%, 11/1/20 - 4/1/30 | | 283 | | 310 | |
10.00%, 1/1/10 - 1/1/20 | | 38 | | 42 | |
10.50%, 12/1/16 - 4/1/22 | | 178 | | 195 | |
11.50%, 11/1/19 | | 3 | | 3 | |
12.50%, 9/1/15 | | 14 | | 16 | |
April TBA | | | | | |
7.00%, 4/25/37 | | (i)1,025 | | 1,057 | |
May TBA | | | | | |
7.00%, 5/25/37 | | (i)3,125 | | 3,221 | |
Government National Mortgage Association, | | | | | |
Various Pools: | | | | | |
9.50%, 10/15/18 - 11/15/21 | | 99 | | 108 | |
10.00%, 11/15/09 - 12/15/21 | | 286 | | 318 | |
10.50%, 2/15/20 - 12/15/20 | | 56 | | 63 | |
11.00%, 1/15/19 | | 59 | | 65 | |
| | | | 10,084 | |
Asset Backed Corporates (4.0%) | | | | | |
ACE Securities Corp. | | | | | |
5.64%, 5/25/34 | | | (h)78 | | | 78 | |
Aegis Asset Backed Securities Trust | | | | | |
5.43%, 10/25/35 | | (h)8 | | 8 | |
American Express Credit Account Master Trust | | | | | |
5.32%, 10/15/12 | | (h)325 | | 325 | |
5.43%, 12/15/09 | | (h)550 | | 550 | |
Argent Securities, Inc. | | | | | |
5.37%, 10/25/36 | | (h)402 | | 402 | |
Bear Stearns Asset Backed Securities, Inc. | | | | | |
5.44%, 8/25/35 | | (h)58 | | 58 | |
5.52%, 9/25/34 | | (h)61 | | 61 | |
5.54%, 3/25/35 | | (h)114 | | 115 | |
Capital Auto Receivables Asset Trust | | | | | |
3.35%, 2/15/08 | | 55 | | 55 | |
5.38%, 5/15/11 | | (h)575 | | 575 | |
5.40%, 1/15/08 | | (h)30 | | 30 | |
Carrington Mortgage Loan Trust | | | | | |
5.40%, 3/25/47 | | (h)375 | | 375 | |
5.44%, 10/25/35 | | (h)9 | | 9 | |
5.47%, 9/25/35 | | (h)61 | | 61 | |
Citibank Credit Card Issuance Trust | | | | | |
5.34%, 3/22/12 | | (c)(h)400 | | 400 | |
Countrywide Asset Backed Certificates | | | | | |
5.47%, 7/25/25 | | (h)245 | | 246 | |
First Franklin Mortgage Loan Asset Backed Certificates | | | | | |
5.36%, 3/25/37 | | (h)362 | | 362 | |
5.37%, 7/25/36 | | (h)310 | | 310 | |
5.39%, 2/25/36 | | (h)234 | | 234 | |
5.42%, 7/25/35 | | (h)83 | | 83 | |
5.44%, 10/25/35 | | (h)229 | | 229 | |
Fremont Home Loan Owner Trust | | | | | |
5.37%, 10/25/36 | | (h)409 | | 409 | |
GE Capital Credit Card Master Note Trust | | | | | |
5.36%, 9/15/10 | | (h)350 | | 350 | |
GE Dealer Floorplan Master Note Trust | | | | | |
5.40%, 7/20/09 | | (h)450 | | 450 | |
GSAMP Trust | | | | | |
5.39%, 1/25/37 | | (h)343 | | 343 | |
5.40%, 4/25/47 | | 450 | | 450 | |
Lehman Brothers Commercial Mortgage Trust | | | | | |
5.44%, 9/15/21 | | (h)335 | | 335 | |
MBNA Credit Card Master Note Trust | | | | | |
5.46%, 2/15/10 | | (h)500 | | 501 | |
MBNA Master Credit Card Trust | | | | | |
7.80%, 10/15/12 | | 900 | | 976 | |
RAAC Series | | | | | |
5.42%, 9/25/45 | | (h)153 | | 153 | |
Residential Asset Mortgage Products, Inc. | | | | | |
5.39%, 6/25/29 | | (h)396 | | 397 | |
Residential Asset Securities Corp. | | | | | |
5.43%, 2/25/30 | | (h)350 | | 350 | |
The accompanying notes are an integral part of the financial statements.
7
2007 Semi-Annual Report |
|
March 31, 2007 (unaudited) |
Portfolio of Investments (cont’d)
Balanced Portfolio
| | Face | | | |
| | Amount | | Value | |
| | (000) | | (000) | |
Asset Backed Corporates (cont’d) | | | | | |
Securitized Asset Backed Receivables LLC Trust | | | | | |
5.39%, 12/25/35 | | $ | (h)130 | | $ | 130 | |
SLM Student Loan Trust | | | | | |
5.32%, 10/25/14 | | (h)675 | | 675 | |
Soundview Home Equity Loan Trust | | | | | |
5.40%, 1/25/37 | | (h)321 | | 322 | |
5.43%, 2/25/37 | | (h)375 | | 375 | |
Structured Asset Securities Corp. | | | | | |
5.41%, 4/25/37 | | (h)350 | | 350 | |
5.44%, 1/25/37 | | (e)(h)321 | | 321 | |
5.52%, 6/25/35 | | (h)131 | | 131 | |
Terwin Mortgage Trust | | | | | |
5.44%, 7/25/35 | | (e)@— | | @— | |
TXU Electric Delivery Transition Bond Co. | | | | | |
4.81%, 11/17/14 | | 100 | | 100 | |
Wachovia Bank Commercial Mortgage Trust | | | | | |
5.44%, 9/15/21 | | (e)(h)350 | | 350 | |
| | | | 12,034 | |
Collateralized Mortgage Obligations — Agency Collateral Series (0.1%) | | | | | |
Federal Home Loan Mortgage Corp. | | | | | |
Inv FI IO | | | | | |
3.23%, 10/15/29 | | 49 | | 1 | |
20.38%, 11/15/07 | | 2 | | @— | |
Inv FI IO PAC | | | | | |
4.22%, 3/15/08 | | 16 | | @— | |
4.86%, 2/15/08 | | 31 | | @— | |
IO | | | | | |
5.00%, 6/15/17 | | 274 | | 26 | |
6.50%, 3/15/33 | | 164 | | 35 | |
7.50%, 12/1/29 | | 110 | | 30 | |
8.00%, 1/1/28 - 6/1/31 | | 34 | | 7 | |
Federal National Mortgage Association | | | | | |
Inv FI IO | | | | | |
2.23%, 2/17/31 | | 423 | | 22 | |
3.28%, 3/18/30 | | 20 | | @— | |
3.86%, 10/25/07 | | 37 | | @— | |
IO | | | | | |
1.93%, 3/25/36 | | 2,289 | | 49 | |
5.00%, 2/25/15 | | 193 | | 4 | |
5.50%, 6/25/26 | | 60 | | @— | |
6.00%, 8/25/32 - 7/25/33 | | 152 | | 29 | |
6.50%, 6/1/31 - 6/25/33 | | 322 | | 72 | |
7.00%, 4/25/33 | | 107 | | 25 | |
8.00%, 4/1/24 - 12/1/31 | | 405 | | 96 | |
9.00%, 11/1/26 | | 44 | | 11 | |
IO PAC | | | | | |
8.00%, 8/18/27 | | 92 | | 20 | |
Government National Mortgage Association | | | | | |
Inv FI IO | | | | | |
2.68%, 4/16/29 | | 236 | | 13 | |
3.28%, 8/16/29 | | 136 | | 7 | |
| | | | 447 | |
Collateralized Mortgage Obligations — Non Agency Collateral Series (1.0%) | | | | | |
Bear Stearns Structured Products, Inc. | | | | | |
1.00%, 3/27/36 | | | (e)13,517 | | | 538 | |
1.91%, 7/27/36 | | (e)6,234 | | 247 | |
6.00%, 4/25/37 | | (e)7,200 | | 281 | |
Countrywide Alternative Loan Trust | | | | | |
Zero Coupon, 4/25/47 | | 2,225 | | 114 | |
1.83%, 2/25/47 | | 4,580 | | 250 | |
IO | | | | | |
1.54%, 2/25/37 | | 2,050 | | 108 | |
1.70%, 12/20/46 | | 3,801 | | 189 | |
1.73%, 12/20/35 | | (h)2,355 | | 64 | |
1.78%, 3/20/46 | | 1,937 | | 89 | |
1.95%, 3/20/47 | | 3,561 | | 198 | |
2.71%, 12/20/35 | | (h)2,604 | | 125 | |
Countrywide Home Loan Mortgage Pass Through Trust | | | | | |
IO | | | | | |
0.76%, 2/25/35 | | 1,940 | | 42 | |
Greenpoint Mortgage Funding Trust | | | | | |
IO | | | | | |
1.91%, 10/25/45 | | 1,488 | | 45 | |
1.10%, 8/25/45 | | 1,142 | | 35 | |
Harborview Mortgage Loan Trust | | | | | |
IO | | | | | |
0.97%, 6/19/35 | | (h)1,583 | | 36 | |
1.26%, 5/19/35 | | (h)2,298 | | 55 | |
1.63%, 3/19/37 | | (h)1,896 | | 84 | |
PO | | | | | |
3/19/37 | | 1 | | 1 | |
Harborview NIM Corp. | | | | | |
Zero Coupon, 10/20/45 | | (e)(h)328 | | 210 | |
Indymac Index Mortgage Loan Trust | | | | | |
IO | | | | | |
0.91%, 7/25/35 | | (h)1,362 | | 43 | |
Residential Accredit Loans, Inc. | | | | | |
Zero Coupon, 4/25/47 | | (e)2,300 | | 132 | |
| | | | 2,886 | |
Finance (1.6%) | | | | | |
AIG SunAmerica Global Financing VI | | | | | |
6.30%, 5/10/11 | | (e)265 | | 277 | |
American General Finance Corp. | | | | | |
4.63%, 5/15/09 | | 65 | | 64 | |
4.63%, 9/1/10 | | 15 | | 15 | |
AXA Financial, Inc. | | | | | |
6.50%, 4/1/08 | | 60 | | 61 | |
Catlin Insurance Co. Ltd. | | | | | |
7.25% | | (e)(h)(o)100 | | 99 | |
CIT Group, Inc. | | | | | |
3.65%, 11/23/07 | | 80 | | 79 | |
Countrywide Home Loans, Inc. | | | | | |
3.25%, 5/21/08 | | 165 | | 161 | |
Farmers Insurance Exchange | | | | | |
8.63%, 5/1/24 | | (e)290 | | 346 | |
The accompanying notes are an integral part of the financial statements.
8
2007 Semi-Annual Report |
| |
March 31, 2007 (unaudited) |
Portfolio of Investments (cont’d)
Balanced Portfolio
| | Face | | | |
| | Amount | | Value | |
| | (000) | | (000) | |
Finance (cont’d) | | | | | |
General Electric Capital Corp. | | | | | |
4.25%, 12/1/10 | | $ | (c)80 | | $ | 78 | |
HSBC Finance Corp. | | | | | |
5.88%, 2/1/09 | | 345 | | 349 | |
JPMorgan Chase & Co. | | | | | |
7.00%, 11/15/09 | | 255 | | 267 | |
M&I Marshall & Ilsley Bank | | | | | |
3.80%, 2/8/08 | | 190 | | 188 | |
Mantis Reef Ltd. | | | | | |
4.69%, 11/14/08 | | (e)200 | | 198 | |
MBNA Corp. | | | | | |
5.79%, 5/5/08 | | (h)140 | | 141 | |
Nationwide Building Society | | | | | |
4.25%, 2/1/10 | | (e)155 | | 151 | |
Platinum Underwriters Finance, Inc. | | | | | |
7.50%, 6/1/17 | | 100 | | 106 | |
Platinum Underwriters Holdings Ltd. | | | | | |
6.37%, 11/16/07 | | 90 | | 90 | |
Residential Capital Corp. | | | | | |
6.38%, 6/30/10 | | 230 | | 230 | |
SLM Corp. | | | | | |
4.00%, 1/15/10 | | 120 | | 117 | |
St. Paul Travelers Cos., Inc. (The) | | | | | |
5.01%, 8/16/07 | | 125 | | 125 | |
Two-Rock Pass Through Trust | | | | | |
6.30% | | (e)(h)(o)100 | | 99 | |
Unicredit Luxembourg Finance S.A. | | | | | |
5.41%, 10/24/08 | | (e)(h)230 | | 230 | |
USB Capital IX | | | | | |
6.19% | | (h)(o)195 | | 200 | |
Wachovia Capital Trust III | | | | | |
5.80% | | (h)(o)360 | | 365 | |
Washington Mutual, Inc. | | | | | |
8.25%, 4/1/10 | | 175 | | 189 | |
Washington Mutual Preferred Funding II | | | | | |
6.67% | | (e)(h)(o)100 | | 98 | |
World Financial Properties | | | | | |
6.91%, 9/1/13 | | (e)253 | | 265 | |
Xlliac Global Funding | | | | | |
4.80%, 8/10/10 | | (e)155 | | 153 | |
| | | | 4,741 | |
Industrials (1.7%) | | | | | |
ArvinMeritor, Inc. | | | | | |
8.75%, 3/1/12 | | (c)100 | | 104 | |
AT&T Corp. | | | | | |
8.00%, 11/15/31 | | 160 | | 198 | |
Brookfield Asset Management, Inc. | | | | | |
7.13%, 6/15/12 | | 125 | | 134 | |
Caterpillar Financial Services Corp. | | | | | |
3.63%, 11/15/07 | | (h)30 | | 30 | |
5.43%, 8/20/07 | | (h)150 | | 150 | |
Clorox Co. | | | | | |
5.48%, 12/14/07 | | (h)140 | | 140 | |
Comcast Cable Communications, Inc. | | | | | |
6.75%, 1/30/11 | | | 40 | | | 42 | |
ConAgra Foods, Inc. | | | | | |
7.00%, 10/1/28 | �� | 45 | | 48 | |
8.25%, 9/15/30 | | 55 | | 67 | |
Consumers Energy Co. | | | | | |
4.00%, 5/15/10 | | 30 | | 29 | |
4.80%, 2/17/09 | | 80 | | 79 | |
Cooper Industries, Inc. | | | | | |
5.25%, 11/15/12 | | 105 | | 105 | |
CVS/Caremark Corp. | | | | | |
5.75%, 8/15/11 | | 35 | | 36 | |
6.04%, 12/10/28 | | (e)174 | | 177 | |
DaimlerChrysler N.A. Holding Corp. | | | | | |
8.50%, 1/18/31 | | (c)65 | | 81 | |
Delhaize America, Inc. | | | | | |
9.00%, 4/15/31 | | 85 | | 103 | |
Echostar DBS Corp. | | | | | |
6.38%, 10/1/11 | | 145 | | 146 | |
6.63%, 10/1/14 | | 35 | | 35 | |
FBG Finance Ltd. | | | | | |
5.13%, 6/15/15 | | (c)(e)115 | | 111 | |
FedEx Corp. | | | | | |
2.65%, 4/1/07 | | 75 | | 75 | |
Ford Motor Credit Co. | | | | | |
7.25%, 10/25/11 | | 110 | | 107 | |
France Telecom S.A. | | | | | |
8.50%, 3/1/31 | | 120 | | 156 | |
General Motors Acceptance Corp. | | | | | |
6.88%, 9/15/11 | | 365 | | 366 | |
Hewlett-Packard Co. | | | | | |
5.49%, 5/22/09 | | (h)110 | | 110 | |
Home Depot, Inc. | | | | | |
5.48%, 12/16/09 | | (h)55 | | 55 | |
Hospira, Inc. | | | | | |
5.83%, 3/30/10 | | (h)150 | | 150 | |
Hyatt Equities LLC | | | | | |
6.88%, 6/15/07 | | (e)125 | | 125 | |
ICI Wilmington, Inc. | | | | | |
4.38%, 12/1/08 | | 65 | | 64 | |
Interpublic Group of Companies, Inc. | | | | | |
6.25%, 11/15/14 | | 70 | | 66 | |
Lenfest Communications, Inc. | | | | | |
7.63%, 2/15/08 | | 180 | | 183 | |
LG Electronics, Inc. | | | | | |
5.00%, 6/17/10 | | (e)80 | | 79 | |
May Department Stores Co. (The) | | | | | |
6.70%, 7/15/34 | | 105 | | 104 | |
Miller Brewing Co. | | | | | |
4.25%, 8/15/08 | | (e)110 | | 108 | |
Mohawk Industries, Inc. | | | | | |
7.20%, 4/15/12 | | 65 | | 69 | |
Norfolk Southern Corp. | | | | | |
7.35%, 5/15/07 | | 75 | | 75 | |
The accompanying notes are an integral part of the financial statements.
9
2007 Semi-Annual Report |
|
March 31, 2007 (unaudited) |
Portfolio of Investments (cont’d)
Balanced Portfolio
| | Face | | | |
| | Amount | | Value | |
| | (000) | | (000) | |
Industrials (cont’d) | | | | | |
Pilgrim’s Pride Corp. | | | | | |
7.63%, 5/1/15 | | $ | (c)80 | | $ | 80 | |
9.63%, 9/15/11 | | 30 | | 31 | |
Sara Lee Corp. | | | | | |
6.13%, 11/1/32 | | 115 | | 107 | |
SBC Communications Inc. | | | | | |
6.15%, 9/15/34 | | 70 | | 69 | |
Sprint Capital Corp. | | | | | |
8.75%, 3/15/32 | | 15 | | 18 | |
Systems 2001 Asset Trust LLC | | | | | |
6.66%, 9/15/13 | | (e)158 | | 167 | |
Telecom Italia Capital S.A. | | | | | |
4.00%, 1/15/10 | | 155 | | 150 | |
Telefonica Europe BV | | | | | |
8.25%, 9/15/30 | | 125 | | 150 | |
Time Warner, Inc. | | | | | |
5.59%, 11/13/09 | | (h)210 | | 211 | |
Union Pacific Corp. | | | | | |
6.63%, 2/1/08 | | 45 | | 46 | |
6.79%, 11/9/07 | | 35 | | 35 | |
Viacom, Inc. | | | | | |
6.88%, 4/30/36 | | 110 | | 111 | |
WellPoint, Inc. | | | | | |
3.75%, 12/14/07 | | 30 | | 30 | |
Yum! Brands, Inc. | | | | | |
8.88%, 4/15/11 | | 70 | | 79 | |
| | | | 4,991 | |
Mortgages — Other (7.1%) | | | | | |
American Home Mortgage Assets | | | | | |
5.45%, 3/25/47 | | (h)475 | | 474 | |
5.51%, 10/25/46 | | (h)594 | | 595 | |
5.55%, 9/25/46 | | (h)491 | | 493 | |
American Home Mortgage Investment Trust | | | | | |
5.51%, 4/25/37 | | (h)350 | | 350 | |
Banc of America Funding Corp. | | | | | |
5.67%, 9/20/35 | | (h)182 | | 183 | |
Bear Stearns Mortgage Funding Trust | | | | | |
5.57%, 7/25/36 | | (h)387 | | 387 | |
Countrywide Alternative Loan Trust | | | | | |
5.25%, 7/25/46 | | (e)(h)126 | | 126 | |
5.48%, 2/25/47 | | (e)(h)332 | | 331 | |
5.51%, 10/25/46 - 11/25/46 | | (h)676 | | 676 | |
5.58%, 11/20/35 | | (h)187 | | 187 | |
5.59%, 7/25/46 | | (h)297 | | 298 | |
5.63%, 3/20/46 | | 287 | | 288 | |
6.50%, 10/25/46 | | (e)177 | | 176 | |
Countrywide Home Loan Mortgage Pass Through Trust | | | | | |
5.62%, 3/25/35 | | (h)61 | | 61 | |
Deutsche ALT-A Securities, Inc. Alternate Loan Trust | | | | | |
5.47%, 2/25/47 | | (e)585 | | 585 | |
Deutsche ALT-A Securities, Inc., NIM Trust | | | | | |
6.75%, 2/25/47 | | 169 | | 168 | |
Downey Savings & Loan Association Mortgage Loan Trust | | | | | |
5.52%, 10/19/36 | | | (h)476 | | | 478 | |
5.92%, 4/19/46 | | (h)446 | | 446 | |
Federal Home Loan Mortgage Corp. | | | | | |
5.89%, 10/1/36 | | 415 | | 419 | |
Federal National Mortgage Association | | | | | |
5.38%, 12/25/36 | | 289 | | 289 | |
PAC | | | | | |
8.50%, 9/25/20 | | 16 | | 17 | |
Greenpoint Mortgage Funding Trust | | | | | |
5.50%, 1/25/37 | | (h)373 | | 372 | |
5.52%, 3/25/47 | | (h)550 | | 550 | |
5.61%, 2/25/36 | | (h)346 | | 347 | |
5.64%, 3/25/36 | | (h)393 | | 394 | |
Harborview Mortgage Loan Trust | | | | | |
5.41%, 1/19/38 | | (h)176 | | 176 | |
5.47%, 3/19/38 | | (h)371 | | 371 | |
5.50%, 11/19/36 | | (h)484 | | 482 | |
5.51%, 12/19/37 | | (h)549 | | 550 | |
5.52%, 7/21/36 - 3/19/38 | | 676 | | 676 | |
5.53%, 11/19/36 | | (h)489 | | 491 | |
5.55%, 7/19/46 | | (h)338 | | 338 | |
5.57%, 10/19/37 | | (h)385 | | 386 | |
5.61%, 7/19/45 | | (h)125 | | 125 | |
5.70%, 11/19/35 | | (h)214 | | 215 | |
Harborview NIM Corp. | | | | | |
6.41%, 7/22/36 - 3/19/38 | | (e)453 | | 452 | |
Impac CMB Trust | | | | | |
5.57%, 6/25/34 | | (h)128 | | 128 | |
Indymac Index Mortgage Loan Trust | | | | | |
5.42%, 2/25/37 | | (h)391 | | 392 | |
5.44%, 7/25/46 | | (h)525 | | 527 | |
5.57%, 6/25/46 | | (h)466 | | 468 | |
Luminent Mortgage Capital, Inc. | | | | | |
5.56%, 4/25/36 | | (h)292 | | 293 | |
5.57%, 5/25/36 | | (h)270 | | 271 | |
Merrill Lynch Mortgage Investors, Inc. | | | | | |
5.44%, 8/25/35 | | (h)110 | | 110 | |
Mortgage Equity Conversion Asset Trust | | | | | |
5.46%, 2/25/42 | | (h)350 | | 350 | |
Residential Accredit Loans, Inc. | | | | | |
5.48%, 2/25/37 - 3/25/47 | | (h)1,171 | | 1,171 | |
5.51%, 12/25/36 | | (h)418 | | 420 | |
5.55%, 5/25/46 | | (h)207 | | 207 | |
5.58%, 2/25/46 | | (h)136 | | 136 | |
5.59%, 2/25/46 | | (h)149 | | 149 | |
Ryland Acceptance Corp. IV | | | | | |
6.65%, 7/1/11 | | 5 | | 5 | |
Structured Asset Mortgage Investments, Inc. | | | | | |
5.51%, 2/25/36 | | (h)145 | | 145 | |
5.52%, 10/25/36 | | (h)334 | | 335 | |
5.55%, 7/25/36 - 8/25/36 | | (h)922 | | 925 | |
5.59%, 4/25/36 | | (h)517 | | 520 | |
Wamu Alternative Mortgage Pass Through Certificates | | | | | |
5.42%, 5/25/46 | | (h)147 | | 147 | |
The accompanying notes are an integral part of the financial statements.
10
2007 Semi-Annual Report |
| |
March 31, 2007 (unaudited) |
Portfolio of Investments (cont’d)
Balanced Portfolio
| | | | Face | | | |
| | | | Amount | | Value | |
| | | | (000) | | (000) | |
Mortgages — Other (cont’d) | | | | | | | |
5.51%, 7/25/46 | | | | $ | (h)198 | | $ | 198 | |
5.92%, 4/25/46 | | | | (h)343 | | 344 | |
Washington Mutual, Inc. | | | | | | | |
5.57%, 11/25/45 - 12/25/45 | | | | (h)395 | | 396 | |
5.58%, 7/25/44 - 10/25/45 | | | | 158 | | 158 | |
5.59%, 4/25/45 | | | | (h)209 | | 209 | |
5.61%, 8/25/45 | | | | (h)77 | | 77 | |
Zuni Mortgage Loan Trust | | | | | | | |
5.45%, 8/25/36 | | | | (h)319 | | 318 | |
| | | | | | 21,351 | |
Sovereign (0.4%) | | | | | | | |
Citigroup, Inc. | | | | | | | |
Zero Coupon, 7/17/08 | | | | 70 | | 83 | |
Government of Argentina | | | | | | | |
5.83%, 12/31/33 | | | | 280 | | 134 | |
Government of Japan | | | | | | | |
0.30%, 3/20/08 | | JPY | | 85,000 | | 719 | |
United Mexican States | | | | | | | |
9.50%, 12/18/14 | | MXN | | 2,090 | | 211 | |
| | | | | | 1,147 | |
U.S. Treasury Securities (4.4%) | | | | | | | |
U.S. Treasury Bonds | | | | | | | |
6.13%, 8/15/29 | | | | (c)25 | | 29 | |
6.25%, 5/15/30 | | | | (c)4,140 | | 4,906 | |
8.13%, 8/15/19 | | | | (c)2,100 | | 2,743 | |
U.S. Treasury Note | | | | | | | |
3.88%, 2/15/13 | | | | (c)1,170 | | 1,131 | |
U.S. Treasury Strip | | | | | | | |
IO | | | | | | | |
5.06%, 5/15/21 | | | | (c)9,245 | | 4,591 | |
| | | | | | 13,400 | |
Utilities (0.4%) | | | | | | | |
Arizona Public Service Co. | | | | | | | |
5.80%, 6/30/14 | | | | 110 | | 111 | |
CenterPoint Energy Resources Corp. | | | | | | | |
6.25%, 2/1/37 | | | | 35 | | 35 | |
Consolidated Natural Gas Co. | | | | | | | |
6.25%, 11/1/11 | | | | 45 | | 47 | |
Detroit Edison Co. | | | | | | | |
6.13%, 10/1/10 | | | | 60 | | 62 | |
Entergy Gulf States, Inc. | | | | | | | |
3.60%, 6/1/08 | | | | 45 | | 44 | |
5.76%, 12/1/09 | | | | (h)75 | | 75 | |
6.09%, 12/8/08 | | | | (e)(h)105 | | 105 | |
Kinder Morgan Finance Co. | | | | | | | |
5.70%, 1/5/16 | | | | 125 | | 117 | |
NiSource Finance Corp. | | | | | | | |
5.93%, 11/23/09 | | | | (h)85 | | 85 | |
Ohio Power Corp. | | | | | | | |
6.00%, 6/1/16 | | | | 110 | | 114 | |
Plains All American Pipeline LP | | | | | | | |
6.70%, 5/15/36 | | | | 110 | | 113 | |
PSEG Energy Holdings LLC | | | | | | | |
8.63%, 2/15/08 | | | | (c)65 | | 67 | |
Sempra Energy | | | | | | | |
4.62%, 5/17/07 | | | | 75 | | 75 | |
Texas Eastern Transmission LP | | | | | | | |
7.00%, 7/15/32 | | | | 70 | | 78 | |
TXU Energy Co. LLC | | | | | | | |
7.00%, 3/15/13 | | | | 70 | | 73 | |
Wisconsin Electric Power Co. | | | | | | | |
3.50%, 12/1/07 | | | | 30 | | 30 | |
| | | | | | 1,231 | |
Total Fixed Income Securities (Cost $76,994) | | | | | | 75,796 | |
| | | | | | | | | |
| | Shares | | | |
Common Stocks (58.9%) | | | | | |
Aerospace & Defense (1.4%) | | | | | |
Boeing Co. | | 9,450 | | 840 | |
General Dynamics Corp. | | 3,800 | | 290 | |
Honeywell International, Inc. | | 10,200 | | 470 | |
Lockheed Martin Corp. | | 4,450 | | 432 | |
Northrop Grumman Corp. | | 7,110 | | 528 | |
Raytheon Co. | | 16,200 | | 850 | |
Rockwell Collins, Inc. | | 1,200 | | 80 | |
United Technologies Corp. | | 11,800 | | 767 | |
| | | | 4,257 | |
Air Freight & Logistics (0.7%) | | | | | |
C.H. Robinson Worldwide, Inc. | | 17,546 | | 838 | |
Expeditors International Washington, Inc. | | 15,600 | | 644 | |
FedEx Corp. | | 1,850 | | 199 | |
United Parcel Service, Inc. | | 7,000 | | 491 | |
| | | | 2,172 | |
Airlines (0.0%) | | | | | |
Southwest Airlines Co. | | 6,150 | | 90 | |
Automobiles (0.2%) | | | | | |
Ford Motor Co. | | 28,700 | | 227 | |
Honda Motor Co. Ltd. ADR | | 9,410 | | 328 | |
| | | | 555 | |
Beverages (1.1%) | | | | | |
Anheuser-Busch Cos., Inc. | | 5,538 | | 279 | |
Brown-Forman Corp., Class B | | 600 | | 39 | |
Coca-Cola Co. (The) | | 44,684 | | 2,145 | |
Coca-Cola Enterprises, Inc. | | 2,803 | | 57 | |
Pepsi Bottling Group, Inc. | | 1,440 | | 46 | |
PepsiCo., Inc. | | 11,625 | | 739 | |
| | | | 3,305 | |
Biotechnology (0.6%) | | | | | |
Amgen, Inc. | | (a)11,960 | | 668 | |
Applera Corp. - Applied Biosystems Group | | 8,010 | | 237 | |
Biogen Idec, Inc. | | (a)3,336 | | 148 | |
Genentech, Inc. | | (a)6,440 | | 529 | |
Genzyme Corp. | | (a)1,600 | | 96 | |
Gilead Sciences, Inc. | | (a)2,600 | | 199 | |
The accompanying notes are an integral part of the financial statements.
11
2007 Semi-Annual Report |
|
March 31, 2007 (unaudited) |
Portfolio of Investments (cont’d)
Balanced Portfolio
| | | | Value | |
| | Shares | | (000) | |
Biotechnology (cont’d) | | | | | |
Medimmune, Inc. | | (a)1,270 | | $ | 46 | |
| | | | 1,923 | |
Building Products (0.1%) | | | | | |
American Standard Cos., Inc. | | 3,350 | | 178 | |
Masco Corp. | | 8,150 | | 223 | |
| | | | 401 | |
Capital Markets (1.6%) | | | | | |
Bank of New York Co., Inc. (The) | | 2,990 | | 121 | |
Bear Stearns Cos., Inc. (The) | | 1,500 | | 226 | |
Charles Schwab Corp. (The) | | 47,191 | | 863 | |
Franklin Resources, Inc. | | 4,780 | | 578 | |
Goldman Sachs Group, Inc. | | 4,540 | | 938 | |
Lehman Brothers Holdings, Inc. | | 5,874 | | 412 | |
Mellon Financial Corp. | | 1,740 | | 75 | |
Merrill Lynch & Co., Inc. | | 17,760 | | 1,450 | |
Northern Trust Corp. | | 570 | | 34 | |
State Street Corp. | | 2,480 | | 161 | |
| | | | 4,858 | |
Chemicals (0.7%) | | | | | |
Bayer AG ADR | | 23,010 | | 1,472 | |
E.I. du Pont de Nemours & Co. | | 10,390 | | 513 | |
Tronox, Inc. | | 207 | | 3 | |
| | | | 1,988 | |
Commercial Banks (2.4%) | | | | | |
Akbank T.A.S. | | 91,102 | | 609 | |
Ameriprise Financial, Inc. | | 1,760 | | 101 | |
Bank of America Corp. | | 37,670 | | 1,922 | |
Bank Pekao S.A. | | 5,906 | | 525 | |
BB&T Corp. | | 750 | | 31 | |
Comerica, Inc. | | 440 | | 26 | |
Fifth Third Bancorp. | | 11,630 | | 450 | |
KeyCorp. | | 340 | | 13 | |
Komercni Banka A.S. | | 2,718 | | 473 | |
Marshall & Ilsley Corp. | | 670 | | 31 | |
National City Corp. | | 1,220 | | 45 | |
PNC Financial Services Group, Inc. | | 6,820 | | 491 | |
Powszechna Kasa | | 30,873 | | 514 | |
Regions Financial Corp. | | 1,954 | | 69 | |
SunTrust Banks, Inc. | | 510 | | 42 | |
Synovus Financial Corp. | | 1,120 | | 36 | |
Turkiye Garanti Bankasi A.S. | | 94,238 | | 743 | |
Turkiye Is Bankasi | | 124,706 | | 600 | |
U.S. Bancorp | | 3,690 | | 129 | |
Wachovia Corp. | | 3,746 | | 206 | |
Wells Fargo & Co. | | 6,440 | | 222 | |
| | | | 7,278 | |
Commercial Services & Supplies (0.7%) | | | | | |
ACCO Brands Corp. | | (a)376 | | 9 | |
Corporate Executive Board Co. | | 12,195 | | 926 | |
Iron Mountain, Inc. | | (a)21,325 | | 557 | |
Monster Worldwide, Inc. | | (a)12,953 | | 614 | |
| | | | 2,106 | |
Communications Equipment (1.4%) | | | | | |
Alcatel-Lucent ADR | | 30,400 | | | 359 | |
Avaya, Inc. | | (a)3,956 | | 47 | |
Cisco Systems, Inc. | | (a)76,374 | | 1,950 | |
Comverse Technology, Inc. | | (a)2,000 | | 43 | |
Corning, Inc. | | (a)15,125 | | 344 | |
JDS Uniphase Corp. | | (a)1,795 | | 27 | |
Motorola, Inc. | | 27,012 | | 477 | |
QLogic Corp. | | (a)2,114 | | 36 | |
QUALCOMM, Inc. | | 18,424 | | 786 | |
Tellabs, Inc. | | (a)4,500 | | 45 | |
| | | | 4,114 | |
Computers & Peripherals (2.2%) | | | | | |
Apple, Inc. | | (a)17,900 | | 1,663 | |
Dell, Inc. | | (a)28,869 | | 670 | |
EMC Corp. | | (a)27,550 | | 382 | |
Hewlett-Packard Co. | | 38,752 | | 1,555 | |
International Business Machines Corp. | | 19,015 | | 1,792 | |
Lexmark International, Inc., Class A | | (a)1,215 | | 71 | |
Network Appliance, Inc. | | (a)3,629 | | 133 | |
Sun Microsystems, Inc. | | (a)46,134 | | 277 | |
| | | | 6,543 | |
Construction Materials (0.2%) | | | | | |
Cemex SAB de C.V. ADR | | 17,076 | | 559 | |
Consumer Finance (0.6%) | | | | | |
American Express Co. | | 31,487 | | 1,776 | |
Capital One Financial Corp. | | 1,773 | | 134 | |
SLM Corp. | | 300 | | 12 | |
| | | | 1,922 | |
Distributors (0.2%) | | | | | |
Li & Fung Ltd. | | 158,000 | | 496 | |
Diversified Consumer Services (0.0%) | | | | | |
H&R Block, Inc. | | 3,100 | | 65 | |
Diversified Financial Services (3.2%) | | | | | |
Brookfield Asset Management, Inc. | | 43,950 | | 2,297 | |
Chicago Mercantile Exchange Holdings, Inc. | | 1,047 | | 558 | |
Citigroup, Inc. | | 58,725 | | 3,015 | |
Fortress Investment Group LLC | | 1,726 | | 49 | |
JPMorgan Chase & Co. | | 53,946 | | 2,610 | |
Moody’s Corp. | | 18,682 | | 1,159 | |
| | | | 9,688 | |
Diversified Telecommunication Services (0.6%) | | | | | |
AT&T, Inc. | | 420 | | 17 | |
Embarq Corp. | | 4,725 | | 266 | |
France Telecom S.A. ADR | | 13,070 | | 345 | |
Qwest Communications International, Inc. | | (a)100 | | 1 | |
Verizon Communications, Inc. | | 29,634 | | 1,124 | |
| | | | 1,753 | |
Electric Utilities (1.4%) | | | | | |
AES Corp. (The) | | (a)4,400 | | 95 | |
American Electric Power Co., Inc. | | 13,150 | | 641 | |
CEZ 2 | | 10,955 | | 492 | |
Consolidated Edison, Inc. | | 1,300 | | 66 | |
The accompanying notes are an integral part of the financial statements.
12
2007 Semi-Annual Report |
| |
March 31, 2007 (unaudited) |
Portfolio of Investments (cont’d)
Balanced Portfolio
| | | | Value | |
| | Shares | | (000) | |
Electric Utilities (cont’d) | | | | | |
Edison International | | 1,800 | | $ | 89 | |
Entergy Corp. | | 10,345 | | 1,085 | |
Exelon Corp. | | 4,400 | | 302 | |
FirstEnergy Corp. | | 9,350 | | 619 | |
FPL Group, Inc. | | 3,200 | | 196 | |
PPL Corp. | | 2,600 | | 106 | |
Progress Energy, Inc. | | 1,300 | | 66 | |
Southern Co. (The) | | 5,100 | | 187 | |
TXU Corp. | | 3,700 | | 237 | |
| | | | 4,181 | |
Electrical Equipment (0.2%) | | | | | |
Cooper Industries Ltd., Class A | | 1,100 | | 49 | |
Emerson Electric Co. | | 9,100 | | 392 | |
Rockwell Automation, Inc. | | 1,000 | | 60 | |
| | | | 501 | |
Electronic Equipment & Instruments (0.1%) | | | | | |
Agilent Technologies, Inc. | | (a)5,918 | | 199 | |
Jabil Circuit, Inc. | | 3,052 | | 65 | |
Molex, Inc. | | 1,550 | | 44 | |
Sanmina-SCI Corp. | | (a)5,348 | | 19 | |
Solectron Corp. | | (a)12,249 | | 39 | |
| | | | 366 | |
Energy Equipment & Services (0.8%) | | | | | |
Baker Hughes, Inc. | | 3,860 | | 255 | |
BJ Services Co. | | 3,080 | | 86 | |
Halliburton Co. | | 9,968 | | 317 | |
Nabors Industries Ltd. | | (a)2,900 | | 86 | |
Schlumberger Ltd. | | 20,130 | | 1,391 | |
Transocean, Inc. | | (a)2,990 | | 244 | |
| | | | 2,379 | |
Food & Staples Retailing (1.4%) | | | | | |
Costco Wholesale Corp. | | 24,624 | | 1,326 | |
CVS/Caremark Corp. | | 3,840 | | 131 | |
Kroger Co. (The) | | 12,958 | | 366 | |
Rite Aid Corp. | | (a)13,700 | | 79 | |
Safeway, Inc. | | 2,002 | | 73 | |
SUPERVALU, Inc. | | 3,589 | | 140 | |
Sysco Corp. | | 3,090 | | 105 | |
Wal-Mart Stores, Inc. | | 35,364 | | 1,660 | |
Walgreen Co. | | 4,889 | | 225 | |
| | | | 4,105 | |
Food Products (1.1%) | | | | | |
Archer-Daniels-Midland Co. | | 4,402 | | 162 | |
Cadbury Schweppes plc ADR | | 12,740 | | 654 | |
Campbell Soup Co. | | 2,520 | | 98 | |
ConAgra Foods, Inc. | | 10,511 | | 262 | |
General Mills, Inc. | | 2,467 | | 144 | |
Heinz (H.J.) Co. | | 2,559 | | 121 | |
Hershey Co. (The) | | 1,828 | | 100 | |
Kellogg Co. | | 2,593 | | 133 | |
Kraft Foods, Inc., Class A | | 9,750 | | 309 | |
Nestle S.A. (Registered) ADR | | 6,670 | | 646 | |
Sara Lee Corp. | | 5,478 | | | 93 | |
Unilever N.V. (NY Shares) | | 21,470 | | 627 | |
W.M. Wrigley Jr. Co. | | 1,471 | | 75 | |
| | | | 3,424 | |
Gas Utilities (0.0%) | | | | | |
Sempra Energy | | 1,300 | | 79 | |
Health Care Equipment & Supplies (1.5%) | | | | | |
Bard (C.R.), Inc. | | 2,100 | | 167 | |
Bausch & Lomb, Inc. | | 700 | | 36 | |
Baxter International, Inc. | | 9,250 | | 487 | |
Becton Dickinson & Co. | | 3,970 | | 305 | |
Biomet, Inc. | | 3,890 | | 165 | |
Boston Scientific Corp. | | (a)37,985 | | 552 | |
Dade Behring Holdings, Inc. | | 13,023 | | 571 | |
Hospira, Inc. | | (a)1,177 | | 48 | |
Medtronic, Inc. | | 19,020 | | 933 | |
Millipore Corp. | | (a)400 | | 29 | |
St. Jude Medical, Inc. | | (a)6,520 | | 245 | |
Stryker Corp. | | 6,520 | | 433 | |
Thermo Fisher Scientific, Inc. | | (a)1,762 | | 83 | |
Waters Corp. | | (a)640 | | 37 | |
Zimmer Holdings, Inc. | | (a)3,880 | | 332 | |
| | | | 4,423 | |
Health Care Providers & Services (1.8%) | | | | | |
Aetna, Inc. | | 9,840 | | 431 | |
AmerisourceBergen Corp. | | 3,980 | | 210 | |
Cardinal Health, Inc. | | 6,660 | | 486 | |
CIGNA Corp. | | 4,990 | | 712 | |
Express Scripts, Inc. | | (a)2,500 | | 202 | |
Health Management Associates, Inc., Class A | | 4,200 | | 46 | |
Humana, Inc. | | (a)2,500 | | 145 | |
IMS Health, Inc. | | 4,400 | | 130 | |
Manor Care, Inc. | | 1,000 | | 54 | |
McKesson Corp. | | 4,510 | | 264 | |
Medco Health Solutions, Inc. | | (a)3,917 | | 284 | |
Quest Diagnostics, Inc. | | 3,200 | | 160 | |
Tenet Healthcare Corp. | | (a)7,000 | | 45 | |
UnitedHealth Group, Inc. | | 30,610 | | 1,621 | |
WellPoint, Inc. | | (a)8,800 | | 714 | |
| | | | 5,504 | |
Hotels Restaurants & Leisure (1.4%) | | | | | |
Carnival Corp. | | 1,800 | | 84 | |
Harrah’s Entertainment, Inc. | | 650 | | 55 | |
Marriott International, Inc., Class A | | 28,473 | | 1,394 | |
McDonald’s Corp. | | 28,413 | | 1,280 | |
Starbucks Corp. | | (a)2,700 | | 85 | |
Starwood Hotels & Resorts Worldwide, Inc. | | 900 | | 59 | |
Wynn Resorts Ltd. | | 12,280 | | 1,165 | |
Yum! Brands, Inc. | | 1,200 | | 69 | |
| | | | 4,191 | |
Household Products (1.4%) | | | | | |
Clorox Co. | | 2,517 | | 160 | |
Colgate Palmolive Co. | | 6,092 | | 407 | |
Kimberly-Clark Corp. | | 9,040 | | 619 | |
The accompanying notes are an integral part of the financial statements.
13
2007 Semi-Annual Report |
|
March 31, 2007 (unaudited) |
Portfolio of Investments (cont’d)
Balanced Portfolio
| | | | Value | |
| | Shares | | (000) | |
Household Products (cont’d) | | | | | |
Procter & Gamble Co. | | 48,270 | | $ | 3,049 | |
| | | | 4,235 | |
Independent Power Producers & Energy Traders (0.0%) | | | | | |
Constellation Energy Group, Inc. | | 1,300 | | 113 | |
Industrial Conglomerates (2.8%) | | | | | |
3M Co. | | 7,800 | | 596 | |
General Electric Co. | | 143,850 | | 5,087 | |
Siemens AG ADR | | 8,640 | | 926 | |
Textron, Inc. | | 1,250 | | 112 | |
Tyco International Ltd. | | 49,000 | | 1,546 | |
| | | | 8,267 | |
Insurance (2.9%) | | | | | |
ACE Ltd. | | 1,730 | | 99 | |
Aegon N.V. (NY Shares) | | 11,730 | | 234 | |
Aflac, Inc. | | 3,660 | | 172 | |
Allstate Corp. (The) | | 5,040 | | 303 | |
AMBAC Financial Group, Inc. | | 450 | | 39 | |
American International Group, Inc. | | 16,330 | | 1,098 | |
AON Corp. | | 1,300 | | 49 | |
Berkshire Hathaway, Inc., Class B | | (a)333 | | 1,212 | |
Chubb Corp. | | 15,090 | | 780 | |
Cincinnati Financial Corp. | | 425 | | 18 | |
Hartford Financial Services Group, Inc. | | 8,160 | | 780 | |
Lincoln National Corp. | | 2,159 | | 146 | |
Loews Corp. | | 2,860 | | 130 | |
Marsh & McLennan Cos., Inc. | | 39,100 | | 1,145 | |
MBIA, Inc. | | 1,560 | | 102 | |
Metlife, Inc. | | 5,290 | | 334 | |
Principal Financial Group | | 2,670 | | 160 | |
Progressive Corp. (The) | | 6,540 | | 143 | |
Prudential Financial, Inc. | | 3,500 | | 316 | |
St. Paul Travelers Cos., Inc. (The) | | 19,436 | | 1,006 | |
XL Capital Ltd., Class A | | 6,740 | | 471 | |
| | | | 8,737 | |
Internet & Catalog Retail (1.3%) | | | | | |
Amazon.com, Inc. | | (a)38,556 | | 1,534 | |
eBay, Inc. | | (a)68,510 | | 2,271 | |
| | | | 3,805 | |
Internet Software & Services (1.5%) | | | | | |
Google, Inc., Class A | | (a)5,503 | | 2,521 | |
Yahoo!, Inc. | | (a)60,250 | | 1,885 | |
| | | | 4,406 | |
IT Services (0.2%) | | | | | |
Automatic Data Processing, Inc. | | 2,100 | | 102 | |
Electronic Data Systems Corp. | | 2,100 | | 58 | |
First Data Corp. | | 2,100 | | 56 | |
Paychex, Inc. | | 1,300 | | 49 | |
Western Union Co. (The) | | 20,028 | | 440 | |
| | | | 705 | |
Machinery (0.8%) | | | | | |
Caterpillar, Inc. | | 8,100 | | 543 | |
Danaher Corp. | | 3,200 | | 229 | |
Deere & Co. | | 2,250 | | 244 | |
Dover Corp. | | 3,250 | | 159 | |
Eaton Corp. | | 1,900 | | 159 | |
Illinois Tool Works, Inc. | | 7,400 | | 382 | |
Ingersoll-Rand Co. Ltd., Class A | | 6,770 | | 294 | |
ITT Industries, Inc. | | 2,100 | | 127 | |
Paccar, Inc. | | 3,237 | | 237 | |
Parker Hannifin Corp. | | 1,500 | | 129 | |
| | | | 2,503 | |
Media (1.9%) | | | | | |
CBS Corp., Class B | | 75 | | 2 | |
Central European T.V. | | (a)6,600 | | 584 | |
Clear Channel Communications, Inc. | | 5,119 | | 179 | |
Comcast Corp., Class A | | (a)12,315 | | 320 | |
Grupo Televisa S.A. ADR | | 47,736 | | 1,422 | |
Idearc, Inc. | | 135 | | 5 | |
Interpublic Group of Cos., Inc. | | (a)50 | | 1 | |
Live Nation, Inc. | | (a)263 | | 6 | |
McClatchy Co. | | 25 | | 1 | |
McGraw-Hill Cos., Inc. (The) | | 10,049 | | 632 | |
New York Times Co., Class A | | 50 | | 1 | |
Omnicom Group, Inc. | | 50 | | 5 | |
Time Warner, Inc. | | 62,403 | | 1,231 | |
TVN S.A. | | (a)54,982 | | 500 | |
Viacom, Inc. | | (a)20,940 | | 861 | |
Walt Disney Co. | | 150 | | 5 | |
| | | | 5,755 | |
Metals & Mining (0.2%) | | | | | |
Newmont Mining Corp. | | 12,063 | | 507 | |
Multi-Utilities (0.4%) | | | | | |
Ameren Corp. | | 1,300 | | 65 | |
Dominion Resources, Inc./VA | | 1,900 | | 169 | |
DTE Energy Co. | | 1,400 | | 67 | |
Duke Energy Corp. | | 7,828 | | 159 | |
KeySpan Corp. | | 1,400 | | 58 | |
PG&E Corp. | | 3,200 | | 154 | |
Public Service Enterprise Group, Inc. | | 1,300 | | 108 | |
Williams Cos., Inc. | | 13,420 | | 382 | |
| | | | 1,162 | |
Multiline Retail (0.7%) | | | | | |
Sears Holdings Corp. | | (a)11,506 | | 2,073 | |
Office Electronic (0.1%) | | | | | |
Xerox Corp. | | (a)8,454 | | 143 | |
Oil, Gas & Consumable Fuels (6.2%) | | | | | |
Anadarko Petroleum Corp. | | 5,240 | | 225 | |
Apache Corp. | | 3,486 | | 246 | |
Chevron Corp. | | 24,057 | | 1,779 | |
ConocoPhillips | | 27,549 | | 1,883 | |
Devon Energy Corp. | | 4,900 | | 339 | |
EOG Resources, Inc. | | 2,200 | | 157 | |
Exxon Mobil Corp. | | 70,441 | | 5,315 | |
| | | | | | |
The accompanying notes are an integral part of the financial statements.
14
2007 Semi-Annual Report |
| |
March 31, 2007 (unaudited) |
Portfolio of Investments (cont’d)
Balanced Portfolio
| | | | Value | |
| | Shares | | (000) | |
Oil, Gas & Consumable Fuels (cont’d) | | | | | |
Hess Corp. | | 2,710 | | $ | 150 | |
Hugoton Royalty Trust | | 131 | | 3 | |
Kinder Morgan, Inc. | | 1,100 | | 117 | |
LUKOIL ADR | | 10,414 | | 901 | |
Marathon Oil Corp. | | 3,620 | | 358 | |
Monsanto Co. | | 39,940 | | 2,195 | |
OAO Gazprom (Registered) ADR | | 19,276 | | 807 | |
Occidental Petroleum Corp. | | 10,768 | | 531 | |
Royal Dutch Shell plc ADR | | 11,140 | | 739 | |
Spectra Energy Corp. | | 4,114 | | 108 | |
Tupras Turkiye Petrol Rafine | | 30,796 | | 686 | |
Ultra Petroleum Corp. | | (a)29,220 | | 1,552 | |
Valero Energy Corp. | | 5,300 | | 342 | |
XTO Energy, Inc. | | 2,200 | | 121 | |
| | | | 18,554 | |
Personal Products (0.1%) | | | | | |
Avon Products, Inc. | | 5,490 | | 205 | |
Pharmaceuticals (4.4%) | | | | | |
Abbott Laboratories | | 33,806 | | 1,886 | |
Allergan, Inc. | | 1,060 | | 117 | |
Bristol-Myers Squibb Co. | | 51,331 | | 1,425 | |
Eli Lilly & Co. | | 27,050 | | 1,453 | |
Forest Laboratories, Inc. | | (a)2,510 | | 129 | |
GlaxoSmithKline plc ADR | | 5,700 | | 315 | |
Johnson & Johnson | | 23,160 | | 1,396 | |
King Pharmaceuticals, Inc. | | (a)1,030 | | 20 | |
Merck & Co., Inc. | | 15,700 | | 694 | |
Pfizer, Inc. | | 76,941 | | 1,944 | |
Roche Holding AG ADR | | 8,930 | | 786 | |
Sanofi-Aventis ADR | | 4,000 | | 174 | |
Schering-Plough Corp. | | 64,060 | | 1,634 | |
Wyeth | | 25,477 | | 1,275 | |
| | | | 13,248 | |
Road & Rail (0.2%) | | | | | |
Burlington Northern and Santa Fe Railway Co. | | 2,100 | | 169 | |
CSX Corp. | | 3,800 | | 152 | |
Norfolk Southern Corp. | | 2,350 | | 119 | |
Union Pacific Corp. | | 1,550 | | 157 | |
| | | | 597 | |
Semiconductors & Semiconductor Equipment (1.2%) | | | | | |
Advanced Micro Devices, Inc. | | (a)4,022 | | 52 | |
Altera Corp. | | (a)4,329 | | 87 | |
Analog Devices, Inc. | | 3,392 | | 117 | |
Applied Materials, Inc. | | 15,963 | | 292 | |
Broadcom Corp., Class A | | (a)4,730 | | 152 | |
Intel Corp. | | 74,066 | | 1,417 | |
KLA-Tencor Corp. | | 2,010 | | 107 | |
Linear Technology Corp. | | 2,658 | | 84 | |
LSI Logic Corp. | | (a)460 | | 5 | |
Maxim Integrated Products, Inc. | | 3,114 | | 92 | |
Micron Technology, Inc. | | (a)31,856 | | 385 | |
National Semiconductor Corp. | | 4,106 | | 99 | |
Novellus Systems, Inc. | | (a)1,828 | | 59 | |
NVIDIA Corp. | | (a)3,800 | | | 109 | |
Teradyne, Inc. | | (a)1,455 | | 24 | |
Texas Instruments, Inc. | | 15,978 | | 481 | |
Xilinx, Inc. | | 3,160 | | 81 | |
| | | | 3,643 | |
Software (0.5%) | | | | | |
Accelr8 Technology Corp. | | (a)233 | | 1 | |
Adobe Systems, Inc. | | (a)1,400 | | 58 | |
Electronic Arts, Inc. | | (a)900 | | 45 | |
Microsoft Corp. | | 19,800 | | 552 | |
NCR Corp. | | (a)1,008 | | 48 | |
Oracle Corp. | | (a)9,800 | | 178 | |
Symantec Corp. | | (a)40,130 | | 694 | |
| | | | 1,576 | |
Specialty Retail (0.9%) | | | | | |
Abercrombie & Fitch Co., Class A | | 10,753 | | 814 | |
AutoZone, Inc. | | (a)4,774 | | 611 | |
Home Depot, Inc. | | 28,390 | | 1,043 | |
Office Depot, Inc. | | (a)4,720 | | 166 | |
| | | | 2,634 | |
Steel (0.3%) | | | | | |
Nucor Corp. | | 12,473 | | 812 | |
Textiles, Apparel & Luxury Goods (0.2%) | | | | | |
Nike, Inc., Class B | | 6,077 | | 646 | |
Thrifts & Mortgage Finance (0.4%) | | | | | |
Countrywide Financial Corp. | | 1,230 | | 41 | |
Fannie Mae | | 1,700 | | 93 | |
Freddie Mac | | 17,560 | | 1,045 | |
MGIC Investment Corp. | | 225 | | 13 | |
Washington Mutual, Inc. | | 2,010 | | 81 | |
| | | | 1,273 | |
Tobacco (0.7%) | | | | | |
Altria Group, Inc. | | 23,020 | | 2,021 | |
Reynolds American, Inc. | | 1,500 | | 94 | |
UST, Inc. | | 1,012 | | 59 | |
| | | | 2,174 | |
Trading Companies & Distributors (0.0%) | | | | | |
W.W. Grainger, Inc. | | 550 | | 42 | |
Wireless Telecommunication Services (2.0%) | | | | | |
America Movil S.A. de C.V., Series L ADR | | 25,867 | | 1,236 | |
China Mobile Ltd. ADR | | 8,400 | | 377 | |
Crown Castle International Corp. | | (a)15,146 | | 487 | |
Mobile Telesystems OJSC ADR | | 24,400 | | 1,365 | |
Sprint Nextel Corp. | | 33,897 | | 643 | |
Turkcell Iletisim Hizmet A.S. | | 94,238 | | 481 | |
Vimpel-Communications | | 15,800 | | 1,498 | |
| | | | 6,087 | |
Total Common Stocks (Cost $141,920) | | | | 177,128 | |
The accompanying notes are an integral part of the financial statements.
15
2007 Semi-Annual Report |
|
March 31, 2007 (unaudited) |
Portfolio of Investments (cont’d)
Balanced Portfolio
| | | | Value | |
| | Shares | | (000) | |
Investment Companies (7.2%) | | | | | |
iShares MSCI Emerging Markets Index Fund | | 65,694 | | $ | 7,640 | |
iShares MSCI EMU Index Fund | | 100 | | 11 | |
iShares MSCI Hong Kong Index Fund | | 93,300 | | 1,501 | |
iShares MSCI Japan Index Fund | | 18,500 | | 270 | |
iShares MSCI Mexico Index Fund | | 113,233 | | 6,151 | |
iShares MSCI United Kingdom Index Fund | | 99,100 | | 2,385 | |
StreetTRACKS Gold Trust | | 56,700 | | 3,729 | |
Total Investment Companies (Cost $16,616) | | | | 21,687 | |
| | | | | | |
| | No. of | | | |
| | Contracts | | | |
Put Options Purchased (0.0%) | | | | | |
90 Day EuroDollar | | | | | |
6/07 @ $94.25 | | 190 | | 1 | |
6/07 @ $94.50 | | 24 | | @— | |
9/07 @ $94.75 | | 178 | | 27 | |
12/07 @ $94.75 | | 375 | | 61 | |
12/07 @ $94.50 | | 19 | | 1 | |
Total Put Options Purchased (Cost $195) | | | | 90 | |
| | Shares | | | |
Preferred Stock (0.0%) | | | | | |
Mortgages — Other (0.0%) | | | | | |
Home Ownership Funding Corp. | | | | | |
13.33% (Cost $92) | | (a)(e)500 | | 74 | |
| | Face | | | |
| | Amount | | | |
| | (000) | | | |
Short-Term Investments (11.5%) | | | | | |
Short-Term Debt Securities held as Collateral on Loaned Securities (2.6%) | | | | | |
AIG Match Funding Corp., 5.30%, 4/17/07 | | $ | (h)172 | | 172 | |
Alliance & Leicester plc, 5.33%, 4/10/07 | | (h)123 | | 123 | |
Anglo Irish Bank Corp., plc, 5.35%, 7/9/07 | | 60 | | 60 | |
Bancaja, 5.36%, 4/19/07 | | (h)61 | | 61 | |
Bank of America Corp., 5.32%, 4/2/07 | | (h)196 | | 196 | |
Bank of New York Co., Inc., 5.32%, 4/10/07 | | (h)61 | | 61 | |
Bear Stearns & Co., Inc., 5.36%, 4/16/07 | | (h)123 | | 123 | |
BNP Paribas plc, 5.33%, 5/21/07 | | (h)123 | | 123 | |
CAM US Finance S.A. Unipersonal, | | | | | |
5.36%, 7/3/07 | | (h)245 | | 245 | |
CIC, New York, | | | | | |
5.30%, 4/3/07 | | (h)86 | | 86 | |
5.34%, 4/2/07 | | (h)123 | | 123 | |
CIT Group Holdings, 5.37%, 7/18/07 | | (h)221 | | 221 | |
Credit Suisse First Boston, New York, | | | | | |
5.29%, 5/15/07 | | 74 | | 74 | |
5.32%, 4/2/07 | | (h)123 | | 123 | |
Deutsche Bank Securities, Inc., | | | | | |
5.40%, 4/2/07 | | 491 | | 491 | |
5.46%, 4/2/07 | | 1,178 | | 1,178 | |
Dexia Bank, New York, 5.32%, 4/2/07 | | (h)123 | | 123 | |
First Tennessee Bank, 5.33%, 4/17/07 | | (h)61 | | 61 | |
Gemini Securitization Corp., 5.41%, 4/2/07 | | 176 | | 176 | |
Goldman Sachs Group, Inc., | | | | | |
5.37%, 4/16/07 | | | (h)61 | | | 61 | |
5.55%, 4/2/07 | | (h)115 | | 115 | |
HSBC Finance Corp., 5.33%, 4/10/07 | | (h)61 | | 61 | |
Mane Funding Corp., 5.29%, 4/10/07 | | 88 | | 88 | |
Manufacturers & Traders, 5.30%, 4/16/07 | | (h)74 | | 74 | |
Marshall & Ilsley Bank, 5.37%, 12/17/07 | | 123 | | 123 | |
Merrill Lynch & Co., 5.33%, 4/26/07 | | (h)64 | | 64 | |
Metropolitan Life Global Funding, | | | | | |
5.31%, 4/23/07 | | (h)184 | | 184 | |
Natexis Banques Populaires, New York, | | | | | |
5.33%, 4/2/07 | | (h)123 | | 123 | |
5.34%, 4/2/07 | | (h)123 | | 123 | |
National Australia Bank Ltd., 5.31%, 4/10/07 | | (h)93 | | 93 | |
National City Bank Cleveland, 5.32%, 4/2/07 | | (h)61 | | 61 | |
National Rural Utilities Cooperative Finance Corp., | | | | | |
5.31%, 4/2/07 | | (h)245 | | 245 | |
Nationwide Building Society, 5.43%, 6/28/07 | | (h)142 | | 142 | |
Nordea Bank, New York, 5.31%, 4/2/07 | | (h)184 | | 184 | |
Raiffeisen Zentralbank Oesterreich, | | | | | |
5.31%, 6/19/07 | | 73 | | 73 | |
Rheingold Securitization, 5.32%, 5/15/07 | | 109 | | 109 | |
Sedna Finance, Inc., 5.32%, 5/15/07 | | 31 | | 31 | |
Skandi, New York, 5.32%, 4/10/07 | | (h)123 | | 123 | |
Toronto Dominion, New York, 5.32%, 5/29/07 | | (h)123 | | 123 | |
Tulip Funding Corp., 5.36%, 4/30/07 | | 244 | | 244 | |
UBS Securities LLC, 5.40%, 4/2/07 | | 1,206 | | 1,206 | |
Unicredito Delaware, Inc., 5.32%, 4/16/07 | | (h)135 | | 135 | |
Unicredito Italiano Bank (Ireland) plc, | | | | | |
5.34%, 4/10/07 | | (h)86 | | 86 | |
| | | | 7,691 | |
Repurchase Agreement (8.8%) | | | | | |
J.P. Morgan Securities, Inc. 5.28%, dated 3/30/07, due 4/2/07, repurchase price $26,618 | | (f)26,606 | | 26,606 | |
U.S. Treasury Security (0.1%) | | | | | |
U.S. Treasury Bill | | | | | |
4.97%, 7/12/07 | | (j)150 | | 148 | |
Total Short-Term Investments (Cost$34,445) | | | | 34,445 | |
Total Investments (102.8%) (Cost $270,262) — Including $13,213 of Securities Loaned | | | | 309,220 | |
Liabilities in Excess of Other Assets (-2.8%) | | | | (8,431 | ) |
Net Assets (100%) | | | | 300,789 | |
| | | | | | | |
(a) Non-income producing security.
(c) All or a portion of security on loan at March 31, 2007.
(e) 144A security — Certain conditions for public sale may exist. Unless otherwise noted, these securities are deemed to be liquid.
The accompanying notes are an integral part of the financial statements.
16
2007 Semi-Annual Report |
| |
March 31, 2007 (unaudited) |
Portfolio of Investments (cont’d)
Balanced Portfolio
(f) | Represents the Portfolio’s undivided interest in a joint repurchase agreement which has a total value of $1,580,364,000. The repurchase agreement was fully collateralized by U.S. government agency securities at the date of this Portfolio of Investments as follows: Federal Farm Credit Bank, 0.00% to 7.43%, due 5/7/07 to 3/2/21; Federal Home Loan Bank, 0.00% to 6.42%, due 4/2/07 to 3/9/26; Federal Home Loan Mortgage Corp., 0.00% to 7.00%, due 4/2/07 to 3/15/31; Federal National Mortgage Association, 0.00% to 7.13%, due 4/5/07 to 3/17/31; Tennessee Valley Authority, 4.88%, due 12/15/16, which had a total value of $1,611,974,119. The investment in the repurchase agreement is through participation in a joint account with affiliated parties pursuant to exemptive relief received by the Portfolio from the SEC. |
(h) | Variable/Floating Rate Security — Interest rate changes on these instruments are based on changes in a designated base rate. The rates shown are those in effect on March 31, 2007. |
(i) | Security is subject to delayed delivery. |
(j) | All or a portion of the security was pledged to cover margin requirements for futures contracts. |
(o) | Perpetual — Security does not have a predetermined maturity date. Rates for these securities are fixed for a period of time then revert to a floating rate. The interest rate shown is the rate in effect at March 31, 2007. |
@ | Face Amount/Value is less than $500. |
ADR | American Depositary Receipt |
Inv Fl | Inverse Floating Rate — Interest rate fluctuates with an inverse relationship to an associated interest rate. Indicated rate is the effective rate at March 31, 2007. |
IO | Interest Only |
JPY | Japanese Yen |
MXN | Mexican Peso |
PO | Principal Only |
PAC | Planned Amortization Class |
TBA | To Be Announced |
Foreign Currency Exchange Contract Information:
The Portfolio had the following foreign currency exchange contract(s) open at period end:
| | | | | | | | | | Net | |
Currency | | | | | | In | | | | Unrealized | |
to | | | | | | Exchange | | | | Appreciation | |
Deliver | | Value | | Settlement | | For | | Value | | (Depreciation) | |
(000) | | (000) | | Date | | (000) | | (000) | | (000) | |
EUR | 551 | | $ | 738 | | 5/14/07 | | USD | 719 | | $ | 719 | | $ | (19 | ) |
USD | 22,689 | | 22,689 | | 7/16/07 | | CNY | 173,255 | | 22,786 | | 97 | |
| | $ | 23,427 | | | | | | $ | 23,505 | | $ | 78 | |
CNY — Chinese RenMinBi
EUR — Euro
USD — United States Dollar
Futures Contracts:
The Portfolio had the following futures contract(s) open at period end:
| | | | | | | | Net | |
| | | | | | | | Unrealized | |
| | Number | | | | | | Appreciation | |
| | of | | Value | | Expiration | | (Depreciation) | |
| | Contracts | | (000) | | Date | | (000) | |
Long: | | | | | | | | | |
Australian Dollar
10 yr. Bond | | 39 | | $ | 22,870 | | Jun-07 | | $ | (52 | ) |
British Pound
Long Gilt | | 22 | | 4,667 | | Jun-07 | | (48 | ) |
MSCI
Singapore | | 14 | | 733 | | Jun-07 | | 14 | |
Nasdaq 100
(Equity Index) | | 9 | | 1,612 | | Jun-07 | | 20 | |
Tokyo Price Index
(Japanese Yen) | | 19 | | 2,768 | | Jun-07 | | 89 | |
S&P 500 Emini
(U.S. Dollar) | | 9 | | 644 | | Jun-07 | | @— | |
S&P 500 Index
(U.S. Dollar) | | 3 | | 1,073 | | Jun-07 | | 9 | |
U.S. Treasury
10 yr. Note | | 142 | | 15,354 | | Jun-07 | | (8 | ) |
U.S. Treasury
5 yr. Note | | 158 | | 16,716 | | Jun-07 | | (16 | ) |
U.S. Treasury
2 yr. Note | | 80 | | 16,391 | | Jun-07 | | (31 | ) |
U.S. Treasury
Long Bond | | 52 | | 5,785 | | Jun-07 | | (47 | ) |
Short: | | | | | | | | | |
U.S. Treasury
Short Bond | | 9 | | 1,001 | | Jun-07 | | 1 | |
| | | | | | | | $ | (69 | ) |
| | | | | | | | | | | |
Graphic Presentation of Portfolio Holdings
The following graph depicts the Portfolio’s holdings by investment type, as a percentage of total investments.
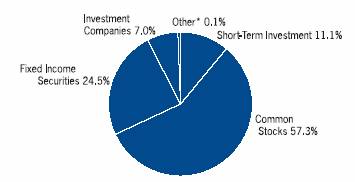
* Investment types which do not appear in the above graph, as well as those which represent less than 5% of total investments, if applicable, are included in the category labeled “Other”.
The accompanying notes are an integral part of the financial statements.
17
2007 Semi-Annual Report |
|
March 31, 2007 (unaudited) |
Portfolio of Investments
Equities Plus Portfolio
| | | | Face | | | |
| | | | Amount | | Value | |
| | | | (000) | | (000) | |
Fixed Income Securities (90.0%) | | | | | | | |
Agency Fixed Rate Mortgages (6.5%) | | | | | | | |
Federal National Mortgage Association, | | | | | | | |
Adjustable Rate Mortgages: | | | | | | | |
6.97%, 3/1/36 | | | | $ | (n)984 | | $ | 1,013 | |
7.01%, 7/1/35 | | | | (n)757 | | 784 | |
| | | | | | 1,797 | |
Asset Backed Corporates (0.2%) | | | | | | | |
Countrywide Asset-Backed NIM Certificates | | | | | | | |
4.50%, 8/25/36 | | | | (e)61 | | 59 | |
Collateralized Mortgage Obligations — Agency Collateral Series (4.5%) | | | | | | | |
Bear Stearns Structured Products, Inc. | | | | | | | |
1.00%, 3/27/36 | | | | (e)5,227 | | 209 | |
1.91%, 7/27/36 | | | | (e)2,375 | | 94 | |
Countrywide Alternative Loan Trust | | | | | | | |
IO | | | | | | | |
1.95%, 3/20/47 | | | | 9,892 | | 549 | |
Residential Accredit Loans, Inc. | | | | | | | |
Zero Coupon, 4/25/47 | | | | (e)850 | | 49 | |
Wamu Alternative Mortgage Pass-Through Certificates | | | | | | | |
IO | | | | | | | |
1.25%, 6/25/46 | | | | 3,148 | | 75 | |
Washington Mutual, Inc. | | | | | | | |
IO | | | | | | | |
0.34%, 9/25/46 | | | | 4,558 | | 46 | |
0.38%, 7/25/46 | | | | 11,212 | | 116 | |
0.52%, 1/25/45 | | | | 6,605 | | 99 | |
| | | | | | 1,237 | |
Collateralized Mortgage Obligation — Non Agency Collateral Series (5.9%) | | | | | | | |
Countrywide Alternative Loan Trust | | | | | | | |
IO | | | | | | | |
1.08%, 9/25/35 | | | | 4,685 | | 103 | |
1.70%, 12/20/46 | | | | 6,995 | | 348 | |
1.85%, 8/25/46 | | | | (h)2,008 | | 80 | |
1.88%, 10/25/35 | | | | 3,632 | | 93 | |
2.25%, 10/25/46 | | | | 12,892 | | 645 | |
3.70%, 7/20/46 | | | | 1,442 | | 56 | |
Countrywide Home Loan Mortgage | | | | | | | |
IO | | | | | | | |
0.68%, 2/25/35 | | | | 1,847 | | 40 | |
1.39%, 2/25/35 | | | | (h)1,998 | | 37 | |
1.67%, 9/25/34 | | | | (h)1,969 | | 44 | |
Harborview Mortgage Loan Trust | | | | | | | |
IO | | | | | | | |
1.69%, 7/19/46 | | | | (h)1,171 | | 42 | |
PO | | | | | | | |
7/19/47 | | | | @— | | @— | |
Harborview NIM Corp. | | | | | | | |
Zero Coupon, 10/20/45 | | | | (e)234 | | 150 | |
| | | | | | 1,638 | |
Finance (0.9%) | | | | | | | |
Popular North America, Inc. | | | | | | | |
5.65%, 4/15/09 | | | | $ | 55 | | $ | 55 | |
USB Capital IX | | | | | | | |
6.19% | | | | (h)(o)60 | | 62 | |
Wachovia Capital Trust III | | | | | | | |
5.80% | | | | (h)(o)130 | | 132 | |
| | | | | | 249 | |
Industrials (0.5%) | | | | | | | |
Telecom Italia Capital S.A. | | | | | | | |
4.00%, 11/15/08 | | | | 65 | | 64 | |
Viacom, Inc. | | | | | | | |
5.75%, 4/30/11 | | | | 60 | | 61 | |
| | | | | | 125 | |
Mortgages — Other (71.4%) | | | | | | | |
American Home Mortgage Assets | | | | | | | |
5.55%, 5/25/46 | | | | (h)(n)784 | | 784 | |
Countrywide Alternative Loan Trust | | | | | | | |
5.51%, 11/25/46 | | | | (h)(n)910 | | 912 | |
5.55%, 7/25/46 | | | | (h)(n)880 | | 883 | |
5.73%, 11/20/35 | | | | (h)715 | | 719 | |
6.68%, 2/25/36 | | | | (h)717 | | 725 | |
6.97%, 11/25/35 | | | | (h)609 | | 621 | |
Federal National Mortgage Association | | | | | | | |
5.89%, 12/25/21 | | | | 82 | | 83 | |
5.94%, 11/25/20 | | | | 21 | | 21 | |
6.09%, 10/25/22 | | | | 49 | | 50 | |
7.47%, 7/1/36 | | | | (n)1,191 | | 1,228 | |
7.49%, 7/1/36 - 8/1/36 | | | | 2,008 | | 2,067 | |
Federal Home Loan Mortgage Corp. | | | | | | | |
5.98%, 10/15/22 | | | | 50 | | 50 | |
6.03%, 3/15/22 - 10/15/22 | | | | 116 | | 116 | |
GS Mortgage Securities Corp. | | | | | | | |
6.25%, 8/25/46 | | | | (e)322 | | 321 | |
6.41%, 6/25/46 | | | | (e)69 | | 69 | |
Harborview Mortgage Loan Trust | | | | | | | |
5.53%, 11/19/36 | | | | (h)267 | | 268 | |
5.65%, 9/19/35 | | | | (h)810 | | 813 | |
5.66%, 1/19/36 | | | | (h)(n)642 | | 643 | |
Harborview NIM Corp. | | | | | | | |
6.41%, 12/19/36 - 3/19/38 | | | | (e)1,141 | | 1,138 | |
Indymac Index NIM Corp. | | | | | | | |
6.65%, 6/25/46 | | | | (e)58 | | 58 | |
Lehman XS Net Interest Margin Notes | | | | | | | |
6.25%, 5/28/46 | | | | (e)49 | | 49 | |
Lehman XS Trust | | | | | | | |
5.66%, 2/25/46 | | | | (h)740 | | 744 | |
Luminent Mortgage Trust | | | | | | | |
5.52%, 10/25/46 | | | | (h)(n)940 | | 943 | |
5.55%, 5/25/46 | | | | (h)(n)739 | | 742 | |
5.57%, 5/25/36 | | | | (h)(n)771 | | 775 | |
5.60%, 2/25/46 | | | | (h)(n)769 | | 771 | |
The accompanying notes are an integral part of the financial statements.
18
2007 Semi-Annual Report |
| |
March 31, 2007 (unaudited) |
Portfolio of Investments (cont’d)
Equities Plus Portfolio
| | | | Face | | | |
| | | | Amount | | Value | |
| | | | (000) | | (000) | |
Mortgages - Other (cont’d) | | | | | | | |
Mastr Adjustable Rate Mortgages Trust | | | | | | | |
5.57%, 4/25/46 | | | | $ | (h)(n)709 | | $ | 712 | |
Novastar Mortgage-Backed Notes | | | | | | | |
5.56%, 9/25/46 | | | | (h)718 | | 721 | |
Residential Accredit Loans, Inc. | | | | | | | |
5.55%, 5/25/46 | | | | (h)(n)897 | | 898 | |
5.59%, 2/25/46 | | | | (h)(n)771 | | 773 | |
Sharps Sp I LLC Net Interest Margin Trust | | | | | | | |
7.00%, 10/25/46 | | | | (e)196 | | 196 | |
Structured Asset Mortgage Investments, Inc. | | | | | | | |
5.55%, 6/25/36 | | | | (h)(n)783 | | 786 | |
| | | | | | 19,679 | |
Utilities (0.1%) | | | | | | | |
Kinder Morgan Finance Co. | | | | | | | |
5.70%, 1/5/16 | | | | 40 | | 37 | |
Total Fixed Income Securities (Cost $24,908) | | | | | | 24,821 | |
| | | | | | | | | |
| | | | No. of | | | |
| | | | Contracts | | | |
Put Options Purchased (0.3%) | | | | | | | |
90 Day EuroDollar | | | | | | | |
6/07 @ $94.25 | | | | 64 | | @— | |
6/07 @ $94.50 | | | | 44 | | @— | |
6/07 @ $94.75 | | | | 40 | | 7 | |
9/07 @ $94.75 | | | | 255 | | 40 | |
12/07 @ $94.50 | | | | 15 | | 1 | |
12/07 @ $94.75 | | | | 249 | | 40 | |
Total Put Options Purchased (Cost $167) | | | | | | 88 | |
| | | | Face | | | |
| | | | Amount | | | |
| | | | (000) | | | |
Short-Term Investment (9.3%) | | | | | | | |
Repurchase Agreement (9.3%) | | | | | | | |
J.P. Morgan Securities, Inc. 5.28%, dated 3/30/07, due 4/2/07, repurchase price $2,551 (Cost $2,550) | | | | $ | (f)2,550 | | 2,550 | |
Total Investments (99.6%) (Cost $27,625) | | | | | | 27,459 | |
Other Assets in Excess of Liabilities (0.4%) | | | | | | 115 | |
Net Assets (100%) | | | | | | $ | 27,574 | |
| | | | | | | | | |
(e) | 144A security — Certain conditions for public sale may exist. Unless otherwise noted, these securities are deemed to be liquid. |
(f) | Represents the Portfolio’s undivided interest in a joint repurchase agreement which has a total value of $1,580,364,000. The repurchase agreement was fully collateralized by U.S. government agency securities at the date of this Portfolio of Investments as follows: Federal Farm Credit Bank, 0.00% to 7.43%, due 5/7/07 to 3/2/21; Federal Home Loan Bank, 0.00% to 6.42%, due 4/2/07 to 3/9/26; Federal Home Loan Mortgage Corp., 0.00% to 7.00%, due 4/2/07 to 3/15/31; Federal National Mortgage Association, 0.00% to 7.13%, due 4/5/07 to 3/17/31; Tennessee Valley Authority, 4.88%, due 12/15/16, which had a total value of $1,611,974,119. The investment in the repurchase agreement is through participation in a joint account with affiliated parties pursuant to exemptive relief received by the Portfolio from the SEC. |
(h) | Variable/Floating Rate Security — Interest rate changes on these instruments are based on changes in a designated base rate. The rates shown are those in effect on March 31, 2007. |
(n) | All or a portion of the security was pledged to cover securities sold short. |
(o) | Perpetual — Security does not have a predetermined maturity date. Rates for these securities are fixed for a period of time then revert to a floating rate. The interest rate shown is the rate in effect at March 31, 2007. |
@ | Face Amount/Value is less than $500. |
IO | Interest Only |
PO | Principal Only |
Futures Contracts:
The Portfolio had the following futures contract(s) open at period end:
| | | | | | | | Net | |
| | | | | | | | Unrealized | |
| | Number | | | | | | Appreciation | |
| | of | | Value | | Expiration | | (Depreciation) | |
| | Contracts | | (000) | | Date | | (000) | |
Long: | | | | | | | | | |
EuroDollar
CME | | 31 | | $ | 7,342 | | Jun-07 | | $ | (3 | ) |
S&P 500 Emini
(U.S. Dollar) | | 6 | | 429 | | Jun-07 | | 4 | |
S&P 500 Index
(U.S. Dollar) | | 76 | | 27,193 | | Jun-07 | | (227 | ) |
U.S. Treasury
2 yr. Note | | 14 | | 2,868 | | Jun-07 | | (4 | ) |
U.S. Treasury
5 yr. Note | | 18 | | 1,904 | | Jun-07 | | @— | |
U.S. Treasury
10 yr. Note | | 27 | | 2,919 | | Jun-07 | | (6 | ) |
U.S. Treasury
Long Bond | | 4 | | 445 | | Jun-07 | | (3 | ) |
| | | | | | | | $ | (239) | |
| | | | | | | | | | | |
The accompanying notes are an integral part of the financial statements.
19
2007 Semi-Annual Report | |
| |
March 31, 2007 (unaudited) | |
Portfolio of Investments (cont’d)
Equities Plus Portfolio
| | | | Face | | | |
| | | | Amount | | Value | |
| | | | (000) | | (000) | |
Securities Sold Short - Debt Instruments | | | | | | | |
Federal National Mortgage Association, | | | | | | | |
April TBA, | | | | | | | |
5.00%, 4/25/36 | | | | $ | 2,150 | | $ | 2,078 | |
5.50%, 4/25/37 | | | | 2,700 | | 2,672 | |
6.00%, 4/25/37 | | | | 4,400 | | 4,433 | |
May TBA, | | | | | | | |
5.00%, 5/25/36 | | | | 2,150 | | 2,077 | |
5.50%, 5/25/36 | | | | 1,100 | | 1,088 | |
(Total Proceeds $12,377) | | | | | | $ | 12,348 | |
| | | | | | | | | |
TBA To Be Announced
Graphic Presentation of Portfolio Holdings
The following graph depicts the Portfolio’s holdings by industry and/or investment type, as a percentage of total investments.
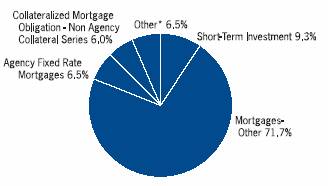
* Industries and/or investment types which do not appear in the above graph, as well as those which represent less than 5% of total investments, if applicable, are included in the category labeled “Other”.
The accompanying notes are an integral part of the financial statements.
20
2007 Semi-Annual Report |
| |
March 31, 2007 (unaudited) |
Portfolio of Investments
Mid Cap Growth Portfolio
| | | | | | Value | |
| | | | Shares | | (000) | |
Common Stocks (98.0%) | | | | | | | |
Auto & Transportation (5.4%) | | | | | | | |
C.H. Robinson Worldwide, Inc. | | | | 1,496,708 | | $ | 71,468 | |
Expeditors International Washington, Inc. | | | | 1,383,657 | | 57,172 | |
| | | | | | 128,640 | |
Consumer Discretionary (44.0%) | | | | | | | |
Abercrombie & Fitch Co., Class A | | | | 928,310 | | 70,254 | |
Amazon.com, Inc. | | | | (a)1,795,842 | | 71,457 | |
Apollo Group, Inc., Class A | | | | (a)800,751 | | 35,153 | |
AutoZone, Inc. | | | | (a)370,773 | | 47,511 | |
Choice Hotels International, Inc. | | | | 671,315 | | 23,785 | |
ChoicePoint, Inc. | | | | (a)1,130,767 | | 42,325 | |
Corporate Executive Board Co. | | | | 1,126,616 | | 85,578 | |
Expedia, Inc. | | | | (a)1,087,114 | | 25,199 | |
Focus Media Holding Ltd. ADR | | | | (a)348,644 | | 27,355 | |
Grupo Televisa S.A. ADR | | | | 2,703,122 | | 80,553 | |
Hilton Hotels Corp. | | | | 718,504 | | 25,837 | |
Intercontinental Hotels Group plc ADR | | | | 1,927,374 | | 47,664 | |
Iron Mountain, Inc. | | | | (a)2,070,979 | | 54,115 | |
ITT Educational Services, Inc. | | | | (a)312,798 | | 25,490 | |
Lamar Advertising Co., Class A | | | | 552,336 | | 34,781 | |
Leucadia National Corp. | | | | 1,220,131 | | 35,896 | |
Li & Fung Ltd. | | | | 14,756,000 | | 46,363 | |
Monster Worldwide, Inc. | | | | (a)1,453,872 | | 68,870 | |
PetSmart, Inc. | | | | 685,408 | | 22,591 | |
Urban Outfitters, Inc. | | | | (a)908,198 | | 24,076 | |
Weight Watchers International, Inc. | | | | 493,198 | | 22,731 | |
Wendy’s International, Inc. | | | | 1,809,133 | | 56,626 | |
Wynn Resorts Ltd. | | | | 718,590 | | 68,165 | |
| | | | | | 1,042,375 | |
Energy (8.2%) | | | | | | | |
Questar Corp. | | | | 272,226 | | 24,286 | |
Southwestern Energy Co. | | | | (a)1,550,220 | | 63,528 | |
Ultra Petroleum Corp. | | | | (a)2,018,224 | | 107,228 | |
| | | | | | 195,042 | |
Financial Services (7.0%) | | | | | | | |
Alleghany Corp. | | | | (a)90,646 | | 33,865 | |
Brown & Brown, Inc. | | | | 831,303 | | 22,462 | |
Calamos Asset Management, Inc., Class A | | | | 1,147,705 | | 25,617 | |
Fortress Investment Group LLC | | | | 100,262 | | 2,876 | |
Janus Capital Group, Inc. | | | | 2,243,232 | | 46,906 | |
Peoples Bank Of Bridgeport, CT | | | | 768,979 | | 34,143 | |
| | | | | | 165,869 | |
Health Care (7.1%) | | | | | | | |
Dade Behring Holdings, Inc. | | | | 1,477,064 | | 64,769 | |
Stericycle, Inc. | | | | (a)579,008 | | 47,189 | |
Techne Corp. | | | | (a)967,632 | | 55,252 | |
| | | | | | 167,210 | |
Investment Company (2.7%) | | | | | | | |
Aeroplan Income Fund | | | | 3,754,819 | | 63,421 | |
Materials & Processing (5.7%) | | | | | | | |
Cabot Corp. | | | | 553,627 | | 26,425 | |
Chaparral Steel Co. | | | | 500,572 | | 29,118 | |
MeadWestvaco Corp. | | | | 721,116 | | 22,239 | |
St. Joe Co. (The) | | | | 439,503 | | $ | 22,990 | |
Texas Industries, Inc. | | | | 455,197 | | 34,381 | |
| | | | | | 135,153 | |
Producer Durables (4.4%) | | | | | | | |
Desarrolladora Homex S.A. de C.V. ADR | | | | (a)625,621 | | 36,255 | |
NVR, Inc. | | | | (a)49,107 | | 32,656 | |
Pentair, Inc. | | | | 1,098,289 | | 34,223 | |
| | | | | | 103,134 | |
Real Estate (0.7%) | | | | | | | |
Forest City Enterprises, Inc. | | | | 248,099 | | 16,419 | |
Technology (9.5%) | | | | | | | |
Baidu.com ADR | | | | (a)270,191 | | 26,087 | |
Crown Castle International Corp. | | | | (a)1,415,009 | | 45,464 | |
Equinix, Inc. | | | | (a)408,590 | | 34,988 | |
NHN Corp. | | | | 161,268 | | 23,655 | |
Salesforce.com, Inc. | | | | (a)865,341 | | 37,054 | |
Tencent Holdings Ltd. | | | | 8,377,000 | | 27,339 | |
Tessera Technologies, Inc. | | | | (a)750,967 | | 29,843 | |
| | | | | | 224,430 | |
Utilities (3.3%) | | | | | | | |
NII Holdings, Inc. | | | | (a)1,070,252 | | 79,391 | |
Total Common Stocks (Cost $1,976,308) | | | | | | 2,321,084 | |
| | | | Face | | | |
| | | | Amount | | | |
| | | | (000) | | | |
Short-Term Investment (2.9%) | | | | | | | |
Repurchase Agreement (2.9%) | | | | | | | |
J.P. Morgan Securities, Inc., 5.28% dated 3/30/07, due 4/2/07, repurchase price $69,484 (Cost $69,453) | | | | $ | (f)69,453 | | 69,453 | |
Total Investments (100.9%) (Cost $2,045,761) | | | | | | 2,390,537 | |
Liabilities in Excess of Other Assets (-0.9%) | | | | | | (21,359 | ) |
Net Assets (100%) | | | | | | $ | 2,369,178 | |
| | | | | | | | | |
(a) | Non-income producing security. |
(f) | Represents the Portfolio’s undivided interest in a joint repurchase agreement which has a total value of $1,580,364,000. The repurchase agreement was fully collateralized by U.S. government agency securities at the date of this Portfolio of Investments as follows: Federal Farm Credit Bank, 0.00% to 7.43%, due 5/7/07 to 3/2/21; Federal Home Loan Bank, 0.00% to 6.42%, due 4/2/07 to 3/9/26; Federal Home Loan Mortgage Corp., 0.00% to 7.00%, due 4/2/07 to 3/15/31; Federal National Mortgage Association, 0.00% to 7.13%, due 4/5/07 to 3/17/31; Tennessee Valley Authority, 4.88%, due 12/15/16, which had a total value of $1,611,974,119. The investment in the repurchase agreement is through participation in a joint account with affiliated parties pursuant to exemptive relief received by the Portfolio from the SEC. |
ADR | American Depositary Receipt |
The accompanying notes are an integral part of the financial statements.
21
2007 Semi-Annual Report | |
| |
March 31, 2007 (unaudited) | |
Portfolio of Investments (cont’d)
Mid Cap Growth Portfolio
Graphic Presentation of Portfolio Holdings
The following graph depicts the Portfolio’s holdings by industry and/or security type, as a percentage of total investments.
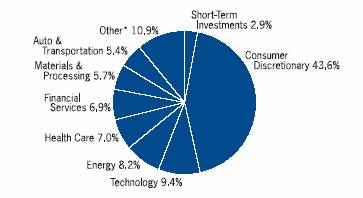
* Industries and/or investment types which do not appear in the above graph, as well as those which represent less than 5% of total investments, if applicable, are included in the category labeled as “Other”.
The accompanying notes are an integral part of the financial statements.
22
2007 Semi-Annual Report |
| |
March 31, 2007 (unaudited) |
Portfolio of Investments
U.S. Mid Cap Value Portfolio
| | | | | | Value | |
| | | | Shares | | (000) | |
Common Stocks (95.1%) | | | | | | | |
Consumer Discretionary (12.1%) | | | | | | | |
Amazon.com, Inc. | | | | (a)49,390 | | $ | 1,965 | |
Apollo Group, Inc., Class A | | | | (a)68,600 | | 3,012 | |
Dow Jones & Co., Inc. | | | | 78,630 | | 2,710 | |
Ford Motor Co. | | | | 200,600 | | 1,583 | |
Newell Rubbermaid, Inc. | | | | 103,220 | | 3,209 | |
Office Depot, Inc. | | | | (a)107,510 | | 3,778 | |
Snap-On, Inc. | | | | 56,770 | | 2,731 | |
| | | | | | 18,988 | |
Consumer Staples (7.1%) | | | | | | | |
ConAgra Foods, Inc. | | | | 146,860 | | 3,658 | |
Estee Lauder Cos., Inc. (The) | | | | 78,000 | | 3,810 | |
Rite Aid Corp. | | | | (a)632,050 | | 3,647 | |
| | | | | | 11,115 | |
Energy (6.4%) | | | | | | | |
Amerada Hess Corp. | | | | 77,340 | | 4,290 | |
Cameron International Corp. | | | | (a)42,490 | | 2,668 | |
El Paso Corp. | | | | 209,300 | | 3,029 | |
| | | | | | 9,987 | |
Financials (25.7%) | | | | | | | |
A.G. Edwards, Inc. | | | | 46,100 | | 3,189 | |
ACE Ltd. | | | | 67,380 | | 3,845 | |
Allied World Assurance Holdings Ltd. (Bermuda) | | | | 90,360 | | 3,863 | |
Amvescap plc ADR | | | | 134,440 | | 2,971 | |
Aspen Insurance Holdings Ltd. | | | | 119,220 | | 3,125 | |
Charles Schwab Corp. (The) | | | | 153,630 | | 2,810 | |
Conseco, Inc. | | | | (a)112,470 | | 1,946 | |
Hudson City Bancorp, Inc. | | | | 268,520 | | 3,673 | |
KKR Financial Corp. REIT | | | | 151,970 | | 4,168 | |
Lazard Ltd. | | | | 69,780 | | 3,502 | |
Marsh & McLennan Cos., Inc. | | | | 140,320 | | 4,110 | |
Northern Trust Corp. | | | | 49,290 | | 2,964 | |
| | | | | | 40,166 | |
Health Care (8.9%) | | | | | | | |
Affymetrix, Inc. | | | | (a)111,500 | | 3,353 | |
Applera Corp. - Applied Biosystems Group (Tracking Stock) | | | | 24,490 | | 724 | |
Beckman Coulter, Inc. | | | | 63,740 | | 4,072 | |
HealthSouth Corp. | | | | (a)123,898 | | 2,603 | |
Owens & Minor, Inc. | | | | 71,300 | | 2,619 | |
Tenet Healthcare Corp. | | | | (a)75,664 | | 487 | |
| | | | | | 13,858 | |
Industrials (7.8%) | | | | | | | |
Goodrich Corp. | | | | 77,950 | | 4,013 | |
McDermott International, Inc. | | | | (a)51,070 | | 2,501 | |
Pitney Bowes, Inc. | | | | 76,270 | | 3,462 | |
Valspar Corp. | | | | 80,550 | | 2,242 | |
| | | | | | 12,218 | |
Information Technology (10.1%) | | | | | | | |
Andrew Corp. | | | | (a)287,030 | | 3,040 | |
Diebold, Inc. | | | | 104,300 | | 4,976 | |
Flextronics International Ltd. | | | | (a)214,907 | | 2,351 | |
Juniper Networks, Inc. | | | | (a)186,740 | | 3,675 | |
Linear Technology Corp. | | | | 54,210 | | $ | 1,712 | |
| | | | | | 15,754 | |
Materials (7.4%) | | | | | | | |
International Flavors & Fragrances, Inc. | | | | 83,248 | | 3,931 | |
Nalco Holding Co. | | | | 147,336 | | 3,521 | |
Sealed Air Corp. | | | | 132,040 | | 4,173 | |
| | | | | | 11,625 | |
Telecommunication Services (2.5%) | | | | | | | |
CenturyTel, Inc. | | | | 86,350 | | 3,902 | |
Utilities (7.1%) | | | | | | | |
Constellation Energy Group, Inc. | | | | 49,915 | | 4,340 | |
NiSource, Inc. | | | | 132,310 | | 3,234 | |
Wisconsin Energy Corp. | | | | 72,600 | | 3,522 | |
| | | | | | 11,096 | |
Total Common Stocks (Cost $127,587) | | | | | | 148,709 | |
Investment Company (1.2%) | | | | | | | |
StreetTRACKS Gold Trust ($1,568) | | | | 29,130 | | 1,916 | |
| | | | Face | | | |
| | | | Amount | | | |
| | | | (000) | | | |
Short-Term Investment (4.1%) | | | | | | | |
Repurchase Agreement (4.1%) | | | | | | | |
J.P. Morgan Securities, Inc., 5.28%, dated 3/30/07, due 4/2/07, repurchase price $6,437 (Cost $6,434) | | | | $ | (f)6,434 | | 6,434 | |
Total Investments (100.4%) (Cost $135,589) | | | | | | 157,059 | |
Liabilities in Excess of Other Assets (-0.4%) | | | | | | (674 | ) |
Net Assets (100%) | | | | | | $ | 156,385 | |
| | | | | | | | | |
(a) | Non-income producing security. |
(f) | Represents the Portfolio’s undivided interest in a joint repurchase agreement which has a total value of $1,580,364,000. The repurchase agreement was fully collateralized by U.S. government agency securities at the date of this Portfolio of Investments as follows: Federal Farm Credit Bank, 0.00% to 7.43%, due 5/7/07 to 3/2/21; Federal Home Loan Bank, 0.00% to 6.42%, due 4/2/07 to 3/9/26; Federal Home Loan Mortgage Corp., 0.00% to 7.00%, due 4/2/07 to 3/15/31; Federal National Mortgage Association, 0.00% to 7.13%, due 4/5/07 to 3/17/31; Tennessee Valley Authority, 4.88%, due 12/15/16, which had a total value of $1,611,974,119. The investment in the repurchase agreement is through participation in a joint account with affiliated parties pursuant to exemptive relief received by the Portfolio from the SEC. |
ADR | American Depositary Receipt |
REIT | Real Estate Investment Trust |
The accompanying notes are an integral part of the financial statements.
23
2007 Semi-Annual Report | |
| |
March 31, 2007 (unaudited) | |
Portfolio of Investments (cont’d)
U.S. Mid Cap Value Portfolio
Graphic Presentation of Portfolio Holdings
The following graph depicts the Portfolio’s holdings by industry and/or security type, as a percentage of total investments.
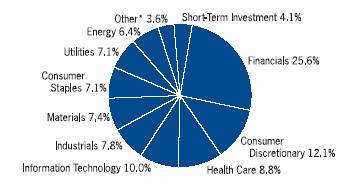
* | Industries and/or security types which do not appear in the above graph, as well as those which represent less than 5% of total investments, if applicable, are included in the category labeled “Other”. |
The accompanying notes are an integral part of the financial statements.
24
2007 Semi-Annual Report |
| |
March 31, 2007 (unaudited) |
Portfolio of Investments
U.S. Small Cap Value Portfolio
| | | | | | Value | |
| | | | Shares | | (000) | |
Common Stocks (94.6%) | | | | | | | |
Basic Resources (5.8%) | | | | | | | |
Albany International Corp., Class A | | | | 311,400 | | $ | 11,192 | |
Cytec Industries, Inc. | | | | 200,600 | | 11,282 | |
Hercules, Inc. | | | | (a)578,235 | | 11,299 | |
Rock-Tenn Co., Class A | | | | 237,400 | | 7,881 | |
Silgan Holdings, Inc. | | | | 155,800 | | 7,963 | |
| | | | | | 49,617 | |
Consumer Durables (2.5%) | | | | | | | |
Dayton Superior Corp. | | | | (a)492,600 | | 5,093 | |
General Cable Corp. | | | | (a)136,400 | | 7,288 | |
Jarden Corp. | | | | (a)235,300 | | 9,012 | |
| | | | | | 21,393 | |
Consumer Services (4.5%) | | | | | | | |
Cenveo, Inc. | | | | (a)591,000 | | 14,361 | |
Consolidated Graphics, Inc. | | | | (a)155,200 | | 11,493 | |
Lin Television Corp., Class A | | | | (a)146,000 | | 2,321 | |
Sinclair Broadcast Group, Inc., Class A | | | | 716,300 | | 11,067 | |
| | | | | | 39,242 | |
Energy (4.9%) | | | | | | | |
Denbury Resources, Inc. | | | | (a)296,000 | | 8,818 | |
St. Mary Land & Exploration Co. | | | | 261,760 | | 9,601 | |
Superior Energy Services, Inc. | | | | (a)354,030 | | 12,204 | |
Universal Compression Holdings, Inc. | | | | (a)176,720 | | 11,960 | |
| | | | | | 42,583 | |
Financial Services (18.5%) | | | | | | | |
AerCap Holdings N.V. | | | | (a)247,100 | | 7,193 | |
Alabama National Bancorporation | | | | 59,800 | | 4,234 | |
Anthracite Capital, Inc. REIT | | | | 869,900 | | 10,439 | |
Conseco, Inc. | | | | (a)628,500 | | 10,873 | |
Employers Holdings, Inc. | | | | (a)387,300 | | 7,754 | |
First Niagara Financial Group, Inc. | | | | 532,200 | | 7,403 | |
FTI Consulting, Inc. | | | | (a)326,300 | | 10,960 | |
Greater Bay Bancorp. | | | | 203,600 | | 5,475 | |
Integra Bank Corp. | | | | 210,100 | | 4,683 | |
LaSalle Hotel Properties, REIT | | | | 147,800 | | 6,852 | |
Max Re Capital Ltd. | | | | 614,940 | | 15,669 | |
MB Financial, Inc. | | | | 207,200 | | 7,461 | |
National Financial Partners Corp. | | | | 149,600 | | 7,018 | |
NYMAGIC, Inc. | | | | 151,100 | | 6,172 | |
Platinum Underwriters Holdings Ltd. | | | | 301,000 | | 9,656 | |
ProAssurance Corp. | | | | (a)204,951 | | 10,483 | |
Provident New York Bancorp., Inc. | | | | 420,700 | | 5,953 | |
TAL International Group, Inc. | | | | 316,602 | | 7,599 | |
United America Indemnity Ltd., Class A | | | | (a)607,930 | | 14,104 | |
| | | | | | 159,981 | |
Food & Tobacco (1.6%) | | | | | | | |
Corn Products International, Inc. | | | | 379,200 | | 13,496 | |
Health Care (6.8%) | | | | | | | |
Apria Healthcare Group, Inc. | | | | (a)482,230 | | 15,552 | |
Bio-Rad Laboratories, Inc., Class A | | | | (a)180,400 | | 12,599 | |
Perrigo Co. | | | | 616,183 | | 10,882 | |
PRA International | | | | (a)284,900 | | 6,143 | |
Sciele Pharma, Inc. | | | | (a)487,600 | | $ | 11,546 | |
West Pharmaceutical Services, Inc. | | | | 44,700 | | 2,076 | |
| | | | | | 58,798 | |
Heavy Industry & Transportation (24.5%) | | | | | | | |
AAR Corp. | | | | (a)202,700 | | 5,586 | |
ACCO Brands Corp. | | | | (a)1,345,920 | | 32,423 | |
Actuant Corp., Class A | | | | 151,100 | | 7,670 | |
Acuity Brands, Inc. | | | | 216,460 | | 11,784 | |
Brink’s Co. (The) | | | | 214,700 | | 13,623 | |
CIRCOR International, Inc. | | | | 299,372 | | 10,688 | |
DRS Technologies, Inc. | | | | 450,100 | | 23,482 | |
Gartner, Inc. | | | | (a)416,900 | | 9,985 | |
Geo Group, Inc. (The) | | | | (a)250,126 | | 11,336 | |
Gevity HR, Inc. | | | | 381,100 | | 7,523 | |
Global Imaging Systems, Inc. | | | | (a)429,000 | | 8,365 | |
MAXIMUS, Inc. | | | | 701,670 | | 24,193 | |
Moog, Inc., Class A | | | | (a)275,800 | | 11,487 | |
Pacer International, Inc. | | | | 321,500 | | 8,661 | |
Stantec, Inc. | | | | (a)329,806 | | 9,007 | |
Watts Water Technologies, Inc., Class A | | | | 277,200 | | 10,542 | |
Wright Express Corp. | | | | (a)164,000 | | 4,974 | |
| | | | | | 211,329 | |
Retail (9.7%) | | | | | | | |
AFC Enterprises, Inc. | | | | (a)699,400 | | 14,023 | |
Central Garden & Pet Co. | | | | (a)457,214 | | 6,753 | |
Central Garden & Pet Co., Class A | | | | (a)353,328 | | 5,194 | |
Denny’s Corp. | | | | (a)2,424,500 | | 11,880 | |
Landry’s Restaurants, Inc. | | | | 223,000 | | 6,601 | |
Lithia Motors, Inc., Class A | | | | 296,155 | | 8,117 | |
Maidenform Brands, Inc. | | | | (a)346,719 | | 7,999 | |
Stage Stores, Inc. | | | | 431,700 | | 10,063 | |
Tween Brands, Inc. | | | | (a)360,600 | | 12,881 | |
| | | | | | 83,511 | |
Technology (11.9%) | | | | | | | |
Adtran, Inc. | | | | 41,500 | | 1,010 | |
Belden CDT, Inc. | | | | 547,850 | | 29,359 | |
Electronics for Imaging, Inc. | | | | (a)740,500 | | 17,365 | |
Microsemi Corp. | | | | (a)350,600 | | 7,296 | |
MSC.Software Corp. | | | | (a)974,400 | | 13,398 | |
MTC Technologies, Inc. | | | | (a)294,727 | | 6,198 | |
Paxar Corp. | | | | (a)453,300 | | 13,010 | |
Tekelec | | | | (a)992,200 | | 14,794 | |
| | | | | | 102,430 | |
Utilities (3.9%) | | | | | | | |
AGL Resources, Inc. | | | | 40,200 | | 1,718 | |
Avista Corp. | | | | 292,821 | | 7,095 | |
Cellcom Israel Ltd. | | | | (a)266,400 | | 4,859 | |
PNM Resources, Inc. | | | | 254,650 | | 8,225 | |
Syniverse Holdings, Inc. | | | | (a)381,800 | | 4,024 | |
UGI Corp. | | | | 268,900 | | 7,182 | |
| | | | | | 33,103 | |
Total Common Stocks (Cost $652,546) | | | | | | $ | 815,483 | |
The accompanying notes are an integral part of the financial statements.
25
2007 Semi-Annual Report | |
| |
March 31, 2007 (unaudited) | |
Portfolio of Investments (cont’d)
U.S. Small Cap Value Portfolio
| | | | Face | | | |
| | | | Amount | | Value | |
| | | | (000) | | (000) | |
Short-Term Investment (5.8%) | | | | | | | |
Repurchase Agreement (5.8%) | | | | | | | |
J.P. Morgan Securities, Inc., 5.28% dated 3/30/07, due 04/02/07, repurchase price $49,745 (Cost $49,723) | | | | $ | (f)49,723 | | $ | 49,723 | |
Total Investments (100.4%) (Cost $702,269) | | | | | | 865,206 | |
Liabilities in Excess of Other Assets (-0.4%) | | | | | | (3,317) | |
Net Assets (100%) | | | | | | $ | 861,889 | |
| | | | | | | | | |
(a) | Non-income producing security. |
(f) | Represents the Portfolio’s undivided interest in a joint repurchase agreement which has a total value of $1,580,364,000. The repurchase agreement was fully collateralized by U.S. government agency securities at the date of this Portfolio of Investments as follows: Federal Farm Credit Bank, 0.00% to 7.43%, due 5/7/07 to 3/2/21; Federal Home Loan Bank, 0.00% to 6.42%, due 4/2/07 to 3/9/26; Federal Home Loan Mortgage Corp., 0.00% to 7.00%, due 4/2/07 to 3/15/31; Federal National Mortgage Association, 0.00% to 7.13%, due 4/5/07 to 3/17/31; Tennessee Valley Authority, 4.88%, due 12/15/16, which had a total value of $1,611,974,119. The investment in the repurchase agreement is through participation in a joint account with affiliated parties pursuant to exemptive relief received by the Portfolio from the SEC. |
REIT | Real Estate Investment Trust |
Graphic Presentation of Portfolio Holdings
The following graph depicts the Portfolio’s holdings by industry and/or security type, as a percentage of total investments.
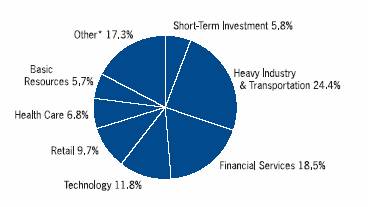
* | Industries and/or security types which do not appear in the above graph, as well as those which represent less than 5% of total investments, if applicable, are included in the category labeled “Other”. |
The accompanying notes are an integral part of the financial statements.
26
2007 Semi-Annual Report |
| |
March 31, 2007 (unaudited) |
Portfolio of Investments
Value Portfolio
| | | | | | Value | |
| | | | Shares | | (000) | |
Common Stocks (97.1%) | | | | | | | |
Consumer Discretionary (11.7%) | | | | | | | |
Clear Channel Communications, Inc. | | | | 100,099 | | $ | 3,507 | |
Comcast Corp., Class A | | | | (a)(c)495,300 | | 12,853 | |
Gannett Co., Inc. | | | | 49,600 | | 2,792 | |
Home Depot, Inc. | | | | 54,200 | | 1,991 | |
Liberty Media Holding Corp. - Capital, Class A | | | | (a)53,600 | | 5,928 | |
Liberty Media Holding Corp. Interactive, Class A | | | | (a)291,000 | | 6,932 | |
Live Nation, Inc. | | | | (a)(c)1 | | @— | |
Lowe’s Cos., Inc. | | | | 74,200 | | 2,337 | |
News Corp., Inc., Class B | | | | (c)282,300 | | 6,908 | |
Time Warner, Inc. | | | | 642,400 | | 12,668 | |
Viacom, Inc., Class B | | | | (a)308,050 | | 12,664 | |
Walt Disney Co. | | | | 15,400 | | 530 | |
| | | | | | 69,110 | |
Consumer Staples (16.7%) | | | | | | | |
Altria Group, Inc. | | | | 121,600 | | 10,678 | |
Anheuser-Busch Cos., Inc. | | | | 86,550 | | 4,367 | |
Cadbury Schweppes plc ADR | | | | 211,000 | | 10,839 | |
Coca-Cola Co. (The) | | | | 312,200 | | 14,986 | |
CVS/Caremark Corp. | | | | 240,000 | | 8,194 | |
Kimberly-Clark Corp. | | | | 181,500 | | 12,431 | |
Kraft Foods, Inc., Class A | | | | (c)273,800 | | 8,668 | |
Unilever N.V. (NY Shares) | | | | 464,900 | | 13,584 | |
Wal-Mart Stores, Inc. | | | | 314,600 | | 14,770 | |
| | | | | | 98,517 | |
Financials (26.8%) | | | | | | | |
Aflac, Inc. | | | | 72,200 | | 3,398 | |
American International Group, Inc. | | | | 94,000 | | 6,319 | |
Bank of America Corp. | | | | 378,300 | | 19,301 | |
Bank of New York Co., Inc. (The) | | | | 199,400 | | 8,086 | |
Barclays plc | | | | (c)21,500 | | 1,224 | |
Berkshire Hathaway, Inc., Class B | | | | (a)(c)950 | | 3,458 | |
Chubb Corp. | | | | 213,980 | | 11,056 | |
Citigroup, Inc. | | | | 450,400 | | 23,123 | |
Fannie Mae | | | | 63,100 | | 3,444 | |
Freddie Mac | | | | 232,300 | | 13,819 | |
Genworth Financial, Inc. | | | | 56,500 | | 1,974 | |
Hartford Financial Services Group, Inc. | | | | 25,500 | | 2,437 | |
JPMorgan Chase & Co. | | | | 156,300 | | 7,562 | |
Merrill Lynch & Co., Inc. | | | | 77,600 | | 6,338 | |
Metlife, Inc. | | | | 79,700 | | 5,033 | |
PNC Financial Services Group, Inc. | | | | 73,900 | | 5,319 | |
SunTrust Banks, Inc. | | | | 22,900 | | 1,902 | |
Torchmark Corp. | | | | 52,900 | | 3,470 | |
Travelers Cos., Inc. | | | | 79,615 | | 4,122 | |
U.S. Bancorp | | | | 91,200 | | 3,189 | |
Wachovia Corp. | | | | 266,000 | | 14,643 | |
Wells Fargo & Co. | | | | (c)261,500 | | 9,003 | |
| | | | | | 158,220 | |
Health Care (19.2%) | | | | | | | |
Abbott Laboratories | | | | 154,100 | | 8,599 | |
Boston Scientific Corp. | | | | (a)303,800 | | 4,417 | |
Bristol-Myers Squibb Co. | | | | 623,700 | | $ | 17,314 | |
Cardinal Health, Inc. | | | | 90,500 | | 6,602 | |
Eli Lilly & Co. | | | | 218,100 | | 11,714 | |
GlaxoSmithKline plc ADR | | | | 254,800 | | 14,080 | |
Pfizer, Inc. | | | | 390,200 | | 9,856 | |
Roche Holding AG ADR | | | | 109,800 | | 9,669 | |
Sanofi-Aventis ADR | | | | 104,500 | | 4,547 | |
Schering-Plough Corp. | | | | 500,400 | | 12,765 | |
Wyeth | | | | 277,500 | | 13,883 | |
| | | | | | 113,446 | |
Industrials (1.4%) | | | | | | | |
General Electric Co. | | | | 176,300 | | 6,234 | |
Southwest Airlines Co. | | | | 141,800 | | 2,084 | |
| | | | | | 8,318 | |
Information Technology (6.7%) | | | | | | | |
Cisco Systems, Inc. | | | | (a)67,300 | | 1,718 | |
Dell, Inc. | | | | (a)323,100 | | 7,499 | |
First Data Corp. | | | | 66,600 | | 1,792 | |
Flextronics International Ltd. | | | | (a)99,600 | | 1,090 | |
Hewlett-Packard Co. | | | | 64,900 | | 2,605 | |
Intel Corp. | | | | 268,100 | | 5,129 | |
International Business Machines Corp. | | | | 53,600 | | 5,052 | |
KLA-Tencor Corp. | | | | 34,200 | | 1,824 | |
McAfee, Inc. | | | | (a)98,900 | | 2,876 | |
Microsoft Corp. | | | | 109,500 | | 3,052 | |
Telefonaktiebolaget LM Ericsson ADR | | | | 52,400 | | 1,943 | |
Texas Instruments, Inc. | | | | 99,200 | | 2,986 | |
Western Union Co. (The) | | | | 101,800 | | 2,234 | |
| | | | | | 39,800 | |
Materials (9.1%) | | | | | | | |
Alcoa, Inc. | | | | 424,300 | | 14,384 | |
E.I. du Pont de Nemours & Co. | | | | 293,000 | | 14,483 | |
International Paper Co. | | | | 556,723 | | 20,265 | |
Rohm & Haas Co. | | | | 85,200 | | 4,406 | |
| | | | | | 53,538 | |
Telecommunication Services (5.3%) | | | | | | | |
AT&T, Inc. | | | | 263,800 | | 10,402 | |
Sprint Nextel Corp. | | | | 124,300 | | 2,357 | |
Verizon Communications, Inc. | | | | 486,900 | | 18,463 | |
| | | | | | 31,222 | |
Utilities (0.2%) | | | | | | | |
American Electric Power Co., Inc. | | | | 29,900 | | 1,458 | |
Total Common Stocks (Cost $505,479) | | | | | | 573,629 | |
| | | | Face | | | |
| | | | Amount | | | |
| | | | (000) | | | |
Short-Term Investments (5.6%) | | | | | | | |
Short-Term Debt Securities held as Collateral on Loaned Securities (3.2%) | | | | | | | |
AIG Match Funding Corp., 5.30%, 4/17/07 | | | | $ | (h)419 | | 419 | |
Alliance & Leicester plc, 5.33%, 4/10/07 | | | | (h)299 | | 299 | |
Anglo Irish Bank Corp., plc, 5.35%, 7/9/07 | | | | 146 | | 146 | |
Bancaja, 5.36%, 4/19/07 | | | | (h)150 | | 150 | |
Bank of America Corp., 5.32%, 4/2/07 | | | | (h)479 | | 479 | |
| | | | | | | | |
The accompanying notes are an integral part of the financial statements.
27
2007 Semi-Annual Report |
| |
March 31, 2007 (unaudited) |
Portfolio of Investments (cont’d)
Value Portfolio
| | | | Face | | | |
| | | | Amount | | Value | |
| | | | (000) | | (000) | |
Short-Term Debt Securities held as Collateral on Loaned Securities (cont’d) | | | | | | | |
Bank of New York Co., Inc., 5.32%, 4/10/07 | | | | $ | (h)150 | | $ | 150 | |
Bear Stearns & Co., Inc., 5.36%, 4/16/07 | | | | (h)300 | | 300 | |
BNP Paribas plc, 5.33%, 5/21/07 | | | | (h)300 | | 300 | |
CAM US Finance S.A. Unipersonal, | | | | | | | |
5.36%, 7/3/07 | | | | (h)599 | | 599 | |
CIC, New York, | | | | | | | |
5.30%, 4/3/07 | | | | (h)210 | | 210 | |
5.34%, 4/2/07 | | | | (h)300 | | 300 | |
CIT Group Holdings, 5.37%, 7/18/07 | | | | (h)539 | | 539 | |
Credit Suisse First Boston, New York, | | | | | | | |
5.29%, 5/15/07 | | | | 300 | | 300 | |
5.32%, 4/2/07 | | | | (h)180 | | 180 | |
Deutsche Bank Securities, Inc., | | | | | | | |
5.40%, 4/2/07 | | | | 2,876 | | 2,876 | |
5.46%, 4/2/07 | | | | 1,198 | | 1,198 | |
Dexia Bank, New York, 5.32%, 4/2/07 | | | | (h)299 | | 299 | |
First Tennessee Bank, 5.33%, 4/17/07 | | | | (h)150 | | 150 | |
Gemini Securitization Corp., 5.41%, 4/2/07 | | | | 431 | | 431 | |
Goldman Sachs Group, Inc., | | | | | | | |
5.37%, 4/16/07 | | | | (h)150 | | 150 | |
5.55%, 4/2/07 | | | | (h)282 | | 282 | |
HSBC Finance Corp., 5.33%, 4/10/07 | | | | (h)150 | | 150 | |
Mane Funding Corp., 5.29%, 4/10/07 | | | | 215 | | 215 | |
Manufacturers & Traders, 5.30%, 4/16/07 | | | | (h)180 | | 180 | |
Marshall & Ilsley Bank, 5.37%, 12/17/07 | | | | 300 | | 300 | |
Merrill Lynch & Co., 5.33%, 4/26/07 | | | | (h)157 | | 157 | |
Metropolitan Life Global Funding, | | | | | | | |
5.31%, 4/23/07 | | | | (h)449 | | 449 | |
Natexis Banques Populaires, New York, | | | | | | | |
5.33%, 4/2/07 | | | | (h)300 | | 300 | |
5.34%, 4/2/07 | | | | (h)300 | | 300 | |
National Australia Bank Ltd., 5.31%, 4/10/07 | | | | (h)228 | | 228 | |
National City Bank Cleveland, 5.32%, 4/2/07 | | | | (h)150 | | 150 | |
National Rural Utilities Cooperative Finance Corp., | | | | | | | |
5.31%, 4/2/07 | | | | (h)599 | | 599 | |
Nationwide Building Society, 5.43%, 6/28/07 | | | | (h)348 | | 348 | |
Nordea Bank, New York, 5.31%, 4/2/07 | | | | (h)449 | | 449 | |
Raiffeisen Zentralbank Oesterreich, | | | | | | | |
5.31%, 6/19/07 | | | | 177 | | 177 | |
Rheingold Securitization, 5.32%, 5/15/07 | | | | 266 | | 266 | |
Sedna Finance, Inc., 5.32%, 5/15/07 | | | | 77 | | 77 | |
Skandi, New York, 5.32%, 4/10/07 | | | | (h)300 | | 300 | |
Toronto Dominion, New York, 5.32%, 5/29/07 | | | | (h)300 | | 300 | |
Tulip Funding Corp., 5.36%, 4/30/07 | | | | 596 | | 596 | |
UBS Securities LLC, 5.40%, 4/2/07 | | | | 2,944 | | 2,944 | |
Unicredito Delaware, Inc., 5.32%, 4/16/07 | | | | (h)329 | | 329 | |
Unicredito Italiano Bank (Ireland) plc, 5.34%, 4/10/07 | | | | (h)210 | | 210 | |
| | | | | | 18,781 | |
Repurchase Agreement (2.4%) | | | | | | | |
J.P. Morgan Securities, Inc., 5.28%, dated 3/30/07, due 04/2/07, repurchase price $13,971 | | | | $ | (f)13,965 | | $ | 13,965 | |
Total Short-Term Investments (Cost $32,746) | | | | | | 32,746 | |
Total Investments (102.7%) (Cost $538,225) — Including $18,537 of Securities Loaned | | | | | | 606,375 | |
Liabilities in Excess of Other Assets (-2.7%) | | | | | | (15,874 | ) |
Net Assets (100%) | | | | | | $ | 590,501 | |
(a) | Non-income producing security. |
(c) | All or a portion of security on loan at March 31, 2007. |
(f) | Represents the Portfolio’s undivided interest in a joint repurchase agreement which has a total value of $1,580,364,000. The repurchase agreement was fully collateralized by U.S. government agency securities at the date of this Portfolio of Investments as follows: Federal Farm Credit Bank, 0.00% to 7.43%, due 5/7/07 to 3/2/21; Federal Home Loan Bank, 0.00% to 6.42%, due 4/2/07 to 3/9/26; Federal Home Loan Mortgage Corp., 0.00% to 7.00%, due 4/2/07 to 3/15/31; Federal National Mortgage Association, 0.00% to 7.13%, due 4/5/07 to 3/17/31; Tennessee Valley Authority, 4.88%, due 12/15/16, which had a total value of $1,611,974,119. The investment in the repurchase agreement is through participation in a joint account with affiliated parties pursuant to exemptive relief received by the Portfolio from the SEC. |
(h) | Variable/Floating Rate Security — Interest rate changes on these instruments are based on changes in a designated base rate. The rates shown are those in effect on March 31, 2007. |
@ | Value is less than $500. |
ADR | American Depositary Receipt |
Graphic Presentation of Portfolio Holdings
The following graph depicts the Portfolio’s holdings by Industry and/or investment type, as a percentage of total investments.

* | Industries and/or investment types which do not appear in the above graph, as well as those which represent less than 5% of total investments, if applicable, are included in the category labeled “Other”. |
The accompanying notes are an integral part of the financial statements.
28
2007 Semi-Annual Report |
|
March 31, 2007 (unaudited) |
Portfolio of Investments
Core Fixed Income Portfolio
| | | | Face | | | |
| | | | Amount | | Value | |
| | | | (000) | | (000) | |
Fixed Income Securities (89.2%) | | | | | | | |
Agency Adjustable Rate Mortgages (0.3%) | | | | | | | |
Government National Mortgage Association, | | | | | | | |
Adjustable Rate Mortgages: | | | | | | | |
5.38%, 2/20/25 - 1/20/28 | | | | $ | 820 | | $ | 830 | |
5.75%, 8/20/25 - 9/20/27 | | | | 217 | | 219 | |
6.13%, 10/20/27 - 12/20/27 | | | | 28 | | 29 | |
| | | | | | 1,078 | |
Agency Fixed Rate Mortgages (12.2%) | | | | | | | |
Federal Home Loan Mortgage Corp., | | | | | | | |
Conventional Pools: | | | | | | | |
5.25%, 3/1/37 | | | | 1,500 | | 1,504 | |
5.70%, 4/1/37 | | | | 1,550 | | 1,557 | |
5.76%, 1/1/37 | | | | 2,350 | | 2,367 | |
5.86%, 10/1/36 | | | | 1,659 | | 1,674 | |
10.00%, 10/1/12 - 11/1/20 | | | | 27 | | 29 | |
11.50%, 8/1/19 | | | | 24 | | 27 | |
Gold Pools: | | | | | | | |
6.50%, 2/1/29 - 4/1/29 | | | | 83 | | 86 | |
7.50%, 2/1/30 - 11/1/31 | | | | 509 | | 533 | |
8.00%, 10/1/29 - 10/1/31 | | | | 470 | | 496 | |
8.50%, 3/31/30 - 7/1/31 | | | | 197 | | 212 | |
10.00%, 6/1/17 - 3/1/21 | | | | 87 | | 94 | |
Federal National Mortgage Association, | | | | | | | |
Conventional Pools: | | | | | | | |
6.50%, 7/1/29 - 2/1/33 | | | | 2,075 | | 2,139 | |
7.00%, 2/1/26 - 6/1/36 | | | | 8,425 | | 8,752 | |
7.46%, 5/1/36 | | | | 1,592 | | 1,636 | |
7.47%, 7/1/36 | | | | 1,315 | | 1,356 | |
7.49%, 7/1/36 | | | | 1,656 | | 1,702 | |
7.50%, 7/1/29 - 9/1/35 | | | | 3,000 | | 3,138 | |
8.00%, 4/1/25 - 8/1/32 | | | | 2,127 | | 2,250 | |
8.50%, 5/1/23 - 5/1/32 | | | | 1,459 | | 1,569 | |
9.00%, 4/1/26 | | | | 398 | | 428 | |
9.50%, 2/1/20 - 8/1/21 | | | | 148 | | 162 | |
10.00%, 8/1/18 - 2/1/25 | | | | 34 | | 37 | |
10.50%, 11/1/10 - 10/1/18 | | | | 39 | | 43 | |
11.00%, 9/1/19 - 9/1/20 | | | | 55 | | 62 | |
11.50%, 11/1/19 | | | | 48 | | 53 | |
April TBA | | | | | | | |
7.00%, 4/25/37 | | | | (i)1,225 | | 1,264 | |
May TBA | | | | | | | |
7.00%, 5/25/37 | | | | (i)3,925 | | 4,045 | |
Government National Mortgage Association, | | | | | | | |
Various Pools: | | | | | | | |
9.00%, 11/15/17 | | | | 36 | | 39 | |
9.50%, 7/15/18 - 12/15/21 | | | | 248 | | 271 | |
10.00%, 9/15/18 - 4/15/25 | | | | 249 | | 275 | |
10.50%, 11/15/14 - 2/15/25 | | | | 452 | | 509 | |
11.00%, 12/15/09 - 7/15/20 | | | | 44 | | 49 | |
11.50%, 4/15/13 - 8/15/13 | | | | 30 | | 34 | |
12.00%, 12/15/12 - 3/15/14 | | | | 7 | | 8 | |
| | | | | | 38,400 | |
Asset Backed Corporates (26.0%) | | | | | | | |
Argent Securities, Inc. | | | | | | | |
5.37%, 10/25/36 | | | | $ | (h)1,781 | | $ | 1,782 | |
American Express Credit Account Master Trust | | | | | | | |
5.32%, 10/15/12 | | | | (h)1,425 | | 1,425 | |
Banc of America Securities Auto Trust | | | | | | | |
3.99%, 8/18/09 | | | | 1,320 | | 1,312 | |
Bayview Financial Acquisition Trust | | | | | | | |
5.43%, 11/28/36 | | | | (h)1,043 | | 1,043 | |
Bear Stearns Asset Backed Securities, Inc. | | | | | | | |
5.44%, 8/25/35 | | | | (h)178 | | 178 | |
5.52%, 9/25/34 | | | | (h)262 | | 263 | |
5.54%, 3/25/35 | | | | (h)334 | | 335 | |
Capital Auto Receivables Asset Trust | | | | | | | |
3.35%, 2/15/08 | | | | 176 | | 175 | |
4.05%, 7/15/09 | | | | 1,449 | | 1,443 | |
4.98%, 5/15/11 | | | | 2,275 | | 2,275 | |
5.03%, 10/15/09 | | | | 1,400 | | 1,398 | |
5.31%, 10/20/09 | | | | (e)2,700 | | 2,703 | |
5.40%, 1/15/08 | | | | (h)95 | | 95 | |
Capital One Auto Finance Trust | | | | | | | |
5.07%, 7/15/11 | | | | 1,200 | | 1,200 | |
Carrington Mortgage Loan Trust | | | | | | | |
5.44%, 10/25/35 | | | | (h)28 | | 28 | |
5.47%, 9/25/35 | | | | (h)179 | | 179 | |
Caterpillar Financial Asset Trust | | | | | | | |
3.90%, 2/25/09 | | | | 773 | | 769 | |
5.57%, 5/25/10 | | | | 1,500 | | 1,511 | |
CIT Equipment Collateral | | | | | | | |
3.50%, 9/20/08 | | | | 173 | | 172 | |
5.07%, 2/20/10 | | | | 1,250 | | 1,251 | |
Citibank Credit Card Issuance Trust | | | | | | | |
5.34%, 3/22/12 | | | | (h)1,725 | | 1,725 | |
6.88%, 11/16/09 | | | | 1,240 | | 1,253 | |
Citicorp Residential | | | | | | | |
5.40%, 9/25/36 | | | | (h)1,513 | | 1,513 | |
CNH Equipment Trust | | | | | | | |
4.02%, 4/15/09 | | | | 840 | | 836 | |
4.27%, 1/15/10 | | | | 1,533 | | 1,522 | |
5.20%, 6/15/10 | | | | 1,050 | | 1,053 | |
Countrywide Asset-Backed Certificates | | | | | | | |
5.43%, 6/25/35 | | | | (h)682 | | 682 | |
5.47%, 7/25/25 | | | | (h)715 | | 715 | |
Daimler Chrysler Auto Trust | | | | | | | |
4.04%, 9/8/09 | | | | 813 | | 809 | |
Fieldstone Mortgage Investment Corp. | | | | | | | |
5.39%, 11/25/36 | | | | (h)1,951 | | 1,952 | |
First Franklin Mortgage Loan Asset Backed Certificates | | | | | | | |
5.37%, 7/25/36 | | | | (h)1,429 | | 1,430 | |
5.39%, 2/25/36 | | | | (h)1,065 | | 1,066 | |
5.42%, 7/25/35 | | | | (h)336 | | 337 | |
5.44%, 10/25/35 | | | | (h)627 | | 628 | |
Ford Credit Auto Owner Trust | | | | | | | |
4.17%, 1/15/09 | | | | 487 | | 485 | |
The accompanying notes are an integral part of the financial statements.
29
2007 Semi-Annual Report |
| |
March 31, 2007 (unaudited) |
Portfolio of Investments (cont’d)
Core Fixed Income Portfolio
| | | | Face | | | |
| | | | Amount | | Value | |
| | | | (000) | | (000) | |
Asset Backed Corporates (cont’d) | | | | | | | |
5.26%, 10/15/10 | | | | $ | 2,150 | | $ | 2,156 | |
Fremont Home Loan Owner Trust | | | | | | | |
5.37%, 10/25/36 | | | | (h)2,102 | | 2,103 | |
GE Dealer Floorplan Master Note Trust | | | | | | | |
5.40%, 7/20/09 | | | | (h)1,300 | | 1,301 | |
GE Equipment Small Ticket LLC | | | | | | | |
4.38%, 7/22/09 | | | | (e)1,101 | | 1,095 | |
4.88%, 10/22/09 | | | | (e)1,375 | | 1,372 | |
GSAMP Trust | | | | | | | |
5.39%, 1/25/37 | | | | (h)1,416 | | 1,417 | |
GS Auto Loan Trust | | | | | | | |
5.37%, 12/15/10 | | | | 2,300 | | 2,309 | |
Harley-Davidson Motorcycle Trust | | | | | | | |
3.76%, 12/17/12 | | | | 1,750 | | 1,715 | |
4.07%, 2/15/12 | | | | 1,125 | | 1,110 | |
Hertz Vehicle Financing LLC | | | | | | | |
4.93%, 2/25/10 | | | | (e)825 | | 823 | |
Honda Auto Receivables Owner Trust | | | | | | | |
3.87%, 4/20/09 | | | | 1,054 | | 1,047 | |
3.93%, 1/15/09 | | | | 478 | | 475 | |
4.85%, 10/19/09 | | | | 1,125 | | 1,123 | |
Hyundai Auto Receivables Trust | | | | | | | |
3.98%, 11/16/09 | | | | 950 | | 943 | |
Lehman Brothers Floating Rate Commercial Mortgage Trust | | | | | | | |
5.44%, 9/15/21 | | | | (e)(h)1,387 | | 1,389 | |
Long Beach Mortgage Loan Trust | | | | | | | |
5.41%, 1/25/36 | | | | (h)408 | | 408 | |
MBNA Master Credit Card Trust USA | | | | | | | |
7.80%, 10/15/12 | | | | 1,480 | | 1,605 | |
National City Auto Receivables Trust | | | | | | | |
2.88%, 5/15/11 | | | | 1,178 | | 1,159 | |
Nationstar Home Equity Loan Trust | | | | | | | |
6.02%, 9/25/36 | | | | (h)1,487 | | 1,488 | |
Nissan Auto Receivables Owner Trust | | | | | | | |
3.99%, 7/15/09 | | | | 1,256 | | 1,248 | |
Novastar Home Equity Loan | | | | | | | |
5.39%, 11/25/36 | | | | (h)1,644 | | 1,645 | |
RAAC Series | | | | | | | |
5.42%, 9/25/45 | | | | (h)491 | | 491 | |
Residential Asset Mortgage Products, Inc. | | | | | | | |
5.39%, 6/25/29 | | | | (h)1,669 | | 1,670 | |
Residential Asset Securities Corp. | | | | | | | |
5.40%, 5/25/30 | | | | (h)1,113 | | 1,113 | |
Securitized Asset Backed Receivables LLC Trust | | | | | | | |
5.40%, 11/25/36 | | | | (h)1,600 | | 1,600 | |
SLM Student Loan Trust | | | | | | | |
5.32%, 10/25/14 | | | | (h)2,900 | | 2,902 | |
Soundview Home Equity Loan Trust | | | | | | | |
5.40%, 1/25/37 | | | | (h)1,423 | | 1,424 | |
5.43%, 2/25/37 | | | | (h)1,450 | | 1,449 | |
Structured Asset Securities Corp. | | | | | | | |
5.52%, 6/25/35 | | | | (h)387 | | 387 | |
Terwin Mortgage Trust | | | | | | | |
5.44%, 7/25/35 | | | | $ | (e)(h)1 | | $ | 1 | |
TXU Electric Delivery Transition Bond Co. | | | | | | | |
4.81%, 11/17/14 | | | | 300 | | 299 | |
USAA Auto Owner Trust | | | | | | | |
3.16%, 2/17/09 | | | | 185 | | 184 | |
3.58%, 2/15/11 | | | | 1,850 | | 1,834 | |
3.90%, 7/15/09 | | | | 590 | | 587 | |
Volkswagen Auto Lease Trust | | | | | | | |
3.82%, 5/20/08 | | | | 358 | | 357 | |
Volkswagen Auto Loan Enhanced Trust | | | | | | | |
4.80%, 7/20/09 | | | | 1,446 | | 1,443 | |
Wachovia Auto Owner Trust | | | | | | | |
2.91%, 4/20/09 | | | | 170 | | 168 | |
4.06%, 9/21/09 | | | | 612 | | 608 | |
Wachovia Bank Commercial Mortgage Trust | | | | | | | |
5.44%, 9/15/21 | | | | (e)(h)1,475 | | 1,476 | |
World Omni Auto Receivables Trust | | | | | | | |
3.29%, 11/12/08 | | | | 92 | | 92 | |
| | | | | | 81,559 | |
Collateralized Mortgage Obligations — Agency Collateral Series (1.1%) | | | | | | | |
Federal Home Loan Mortgage Corp., | | | | | | | |
Inv Fl IO | | | | | | | |
0.63%, 3/15/24 | | | | 523 | | 13 | |
Inv Fl IO PAC | | | | | | | |
3.23%, 10/15/29 | | | | 43 | | 1 | |
IO | | | | | | | |
5.00%, 12/15/16 | | | | 1,160 | | 103 | |
6.00%, 5/1/31 | | | | 687 | | 133 | |
6.50%, 4/1/28 - 5/15/33 | | | | 1,293 | | 275 | |
8.00%, 1/1/28 - 6/1/31 | | | | 78 | | 17 | |
Federal National Mortgage Association, | | | | | | | |
5.38%, 12/25/36 | | | | 1,290 | | 1,290 | |
Inv Fl IO | | | | | | | |
2.23%, 2/17/31 | | | | 375 | | 20 | |
2.78%, 12/25/29 | | | | 23 | | @— | |
2.88%, 10/25/28 | | | | 421 | | 15 | |
IO | | | | | | | |
1.93%, 3/25/36 | | | | 6,620 | | 140 | |
6.00%, 8/25/32 - 11/25/32 | | | | 1,010 | | 128 | |
6.50%, 2/25/33 - 5/25/33 | | | | 1,692 | | 357 | |
7.00%, 4/25/33 | | | | 616 | | 145 | |
8.00%, 4/1/24 - 12/1/31 | | | | 553 | | 131 | |
9.00%, 11/1/26 | | | | 35 | | 8 | |
IO PAC | | | | | | | |
8.00%, 8/18/27 | | | | 33 | | 7 | |
Government National Mortgage Association, | | | | | | | |
Inv Fl IO | | | | | | | |
2.26%, 9/16/31 | | | | 79 | | 4 | |
2.63%, 12/16/25 - 9/16/27 | | | | 692 | | 44 | |
3.18%, 9/20/30 | | | | 87 | | 6 | |
3.28%, 8/16/29 | | | | 447 | | 29 | |
The accompanying notes are an integral part of the financial statements.
30
2007 Semi-Annual Report |
|
March 31, 2007 (unaudited) |
Portfolio of Investments (cont’d)
Core Fixed Income Portfolio
| | | | Face | | | |
| | | | Amount | | Value | |
| | | | (000) | | (000) | |
Collateralized Mortgage Obligations — Agency Collateral Series (cont’d) | | | | | | | |
Washington Mutual, Inc. | | | | | | | |
IO | | | | | | | |
0.34%, 9/25/46 | | | | $ | 57,373 | | $ | 576 | |
| | | | | | 3,442 | |
Collateralized Mortgage Obligations — Non Agency Collateral Series (1.8%) | | | | | | | |
Countrywide Alternative Loan Trust | | | | | | | |
IO | | | | | | | |
1.08%, 9/25/35 | | | | 11,109 | | 245 | |
1.54%, 2/25/37 | | | | 5,810 | | 307 | |
1.70%, 9/25/46 | | | | 16,676 | | 829 | |
1.73%, 12/20/35 | | | | (e)(h)6,867 | | 187 | |
1.78%, 3/20/46 | | | | 5,572 | | 256 | |
1.85%, 8/25/46 | | | | (h)3,970 | | 159 | |
1.95%, 3/20/47 | | | | 15,333 | | 851 | |
2.25%, 10/25/46 | | | | 10,150 | | 508 | |
2.71%, 12/20/35 | | | | (e)(h)7,545 | | 362 | |
6.50%, 10/25/46 | | | | (e)736 | | 735 | |
Greenpoint Mortgage Funding Trust | | | | | | | |
IO | | | | | | | |
1.10%, 8/25/45 | | | | 3,666 | | 112 | |
1.91%, 10/25/45 | | | | 4,365 | | 131 | |
Harborview Mortgage Loan Trust | | | | | | | |
IO | | | | | | | |
0.97%, 6/19/35 | | | | (h)4,353 | | 99 | |
1.26%, 5/19/35 | | | | (h)6,579 | | 157 | |
1.63%, 3/19/37 | | | | (h)5,436 | | 240 | |
1.69%, 7/19/46 | | | | (h)9,572 | | 345 | |
PO | | | | | | | |
3/19/37 | | | | 3 | | 2 | |
7/19/47 | | | | @— | | @— | |
Indymac Index Mortgage Loan Trust | | | | | | | |
IO | | | | | | | |
0.91%, 7/25/35 | | | | (h)4,025 | | 128 | |
| | | | | | 5,653 | |
Finance (6.6%) | | | | | | | |
AIG SunAmerica Global Financing VI | | | | | | | |
6.30%, 5/10/11 | | | | (e)1,185 | | 1,238 | |
American General Finance Corp. | | | | | | | |
4.63%, 5/15/09 | | | | 110 | | 108 | |
4.63%, 9/1/10 | | | | (c)680 | | 668 | |
AXA Financial, Inc. | | | | | | | |
6.50%, 4/1/08 | | | | 230 | | 233 | |
Bank of New York Co., Inc. (The) | | | | | | | |
3.80%, 2/1/08 | | | | 250 | | 247 | |
5.20%, 7/1/07 | | | | 165 | | 165 | |
Catlin Insurance Co. Ltd | | | | | | | |
7.25% | | | | (e)(h)(o)555 | | 552 | |
CIT Group, Inc. | | | | | | | |
4.75%, 8/15/08 | | | | 215 | | 214 | |
Countrywide Home Loans, Inc. | | | | | | | |
3.25%, 5/21/08 | | | | 640 | | 626 | |
Farmers Exchange Capital | | | | | | | |
7.05%, 7/15/28 | | | | (c)(e)165 | | 170 | |
Farmers Insurance Exchange | | | | | | | |
8.63%, 5/1/24 | | | | $ | (e)475 | | $ | 566 | |
General Electric Capital Corp. | | | | | | | |
4.25%, 12/1/10 | | | | (c)230 | | 223 | |
4.75%, 9/15/14 | | | | 60 | | 58 | |
5.88%, 2/15/12 | | | | (c)50 | | 52 | |
HSBC Finance Corp. | | | | | | | |
4.13%, 12/15/08 | | | | 100 | | 98 | |
5.88%, 2/1/09 | | | | 290 | | 293 | |
6.38%, 10/15/11 | | | | 570 | | 595 | |
6.75%, 5/15/11 | | | | 235 | | 248 | |
8.00%, 7/15/10 | | | | 150 | | 163 | |
Huntington National Bank | | | | | | | |
4.38%, 1/15/10 | | | | 250 | | 244 | |
iStar Financial, Inc. | | | | | | | |
5.69%, 3/9/10 | | | | (h)705 | | 706 | |
JPMorgan Chase & Co. | | | | | | | |
6.00%, 2/15/09 | | | | 635 | | 644 | |
M&I Marshall & Ilsley Bank | | | | | | | |
3.80%, 2/8/08 | | | | 575 | | 568 | |
Mantis Reef Ltd. | | | | | | | |
4.69%, 11/14/08 | | | | (e)400 | | 396 | |
MBNA Corp. | | | | | | | |
5.79%, 5/5/08 | | | | (h)615 | | 618 | |
Nationwide Building Society | | | | | | | |
4.25%, 2/1/10 | | | | (e)615 | | 601 | |
Platinum Underwriters Finance, Inc. | | | | | | | |
7.50%, 6/1/17 | | | | 265 | | 281 | |
Platinum Underwriters Holdings Ltd. | | | | | | | |
6.37%, 11/16/07 | | | | 260 | | 259 | |
Popular North American, Inc. | | | | | | | |
5.65%, 4/15/09 | | | | 310 | | 312 | |
Residential Capital Corp. | | | | | | | |
5.84%, 6/9/08 | | | | (h)630 | | 624 | |
6.38%, 6/30/10 | | | | 925 | | 925 | |
SLM Corp. | | | | | | | |
4.00%, 1/15/10 | | | | 485 | | 472 | |
Sovereign Bancorp | | | | | | | |
5.58%, 3/23/10 | | | | (h)935 | | 935 | |
Sovereign Bank | | | | | | | |
4.00%, 2/1/08 | | | | 100 | | 99 | |
St. Paul Travelers Cos., Inc. (The) | | | | | | | |
5.01%, 8/16/07 | | | | 415 | | 414 | |
Two-Rock Pass Through Trust | | | | | | | |
6.30% | | | | (e)(h)(o)315 | | 310 | |
Unicredit Luxembourg Finance S.A. | | | | | | | |
5.41%, 10/24/08 | | | | (e)(h)985 | | 986 | |
USB Capital IX | | | | | | | |
6.19% | | | | (h)(o)760 | | 780 | |
Wachovia Capital Trust III | | | | | | | |
5.80% | | | | (h)(o)1,535 | | 1,555 | |
Washington Mutual Preferred Funding II | | | | | | | |
6.67% | | | | (e)(h)(o)300 | | 295 | |
The accompanying notes are an integral part of the financial statements.
31
2007 Semi-Annual Report |
|
March 31, 2007 (unaudited) |
Portfolio of Investments (cont’d)
Core Fixed Income Portfolio
| | | | Face | | | |
| | | | Amount | | Value | |
| | | | (000) | | (000) | |
Finance (cont’d) | | | | | | | |
Washington Mutual, Inc. | | | | | | | |
8.25%, 4/1/10 | | | | $ | 664 | | $ | 718 | |
World Financial Properties | | | | | | | |
6.91%, 9/1/13 | | | | (e)144 | | 151 | |
6.95%, 9/1/13 | | | | (e)582 | | 612 | |
Xlliac Global Funding | | | | | | | |
4.80%, 8/10/10 | | | | (e)630 | | 622 | |
| | | | | | 20,644 | |
Industrials (5.6%) | | | | | | | |
America West Airlines, Inc. | | | | | | | |
7.10%, 4/2/21 | | | | 577 | | 614 | |
AT&T Corp. | | | | | | | |
8.00%, 11/15/31 | | | | 50 | | 62 | |
Brookfield Asset Management, Inc. | | | | | | | |
7.13%, 6/15/12 | | | | 520 | | 557 | |
Burlington Northern Santa Fe Corp. | | | | | | | |
6.13%, 3/15/09 | | | | 260 | | 264 | |
Caterpillar Financial Services Corp. | | | | | | | |
3.63%, 11/15/07 | | | | 110 | | 109 | |
5.43%, 8/20/07 | | | | (h)580 | | 580 | |
Clorox Co. | | | | | | | |
5.48%, 12/14/07 | | | | (h)620 | | 620 | |
Comcast Cable Communications, Inc. | | | | | | | |
6.75%, 1/30/11 | | | | 265 | | 279 | |
7.13%, 6/15/13 | | | | 175 | | 190 | |
ConAgra Foods, Inc. | | | | | | | |
7.00%, 10/1/28 | | | | 120 | | 128 | |
8.25%, 9/15/30 | | | | (c)285 | | 348 | |
Consumers Energy Co. | | | | | | | |
4.80%, 2/17/09 | | | | 380 | | 377 | |
Cooper Industries, Inc. | | | | | | | |
5.25%, 7/1/07 | | | | 405 | | 404 | |
5.25%, 11/15/12 | | | | 295 | | 295 | |
CVS/Caremark Corp. | | | | | | | |
5.75%, 8/15/11 | | | | 140 | | 143 | |
6.04%, 12/10/28 | | | | (e)746 | | 757 | |
DaimlerChrysler N.A. Holding Corp. | | | | | | | |
8.50%, 1/18/31 | | | | 265 | | 332 | |
FBG Finance Ltd. | | | | | | | |
5.13%, 6/15/15 | | | | (c)(e)490 | | 471 | |
Federated Department Stores, Inc. | | | | | | | |
6.63%, 9/1/08 | | | | 120 | | 122 | |
FedEx Corp. | | | | | | | |
2.65%, 4/1/07 | | | | 215 | | 215 | |
France Telecom S.A. | | | | | | | |
8.50%, 3/1/31 | | | | 505 | | 658 | |
Fred Meyer, Inc. | | | | | | | |
7.45%, 3/1/08 | | | | 450 | | 459 | |
Hewlett Packard Co. | | | | | | | |
5.49%, 5/22/09 | | | | (h)460 | | 461 | |
Hyatt Equities LLC | | | | | | | |
6.88%, 6/15/07 | | | | (e)280 | | 280 | |
ICI Wilmington, Inc. | | | | | | | |
4.38%, 12/1/08 | | | | $ | 300 | | $ | 296 | |
LG Electronics, Inc. | | | | | | | |
5.00%, 6/17/10 | | | | (e)210 | | 207 | |
May Department Stores Co. (The) | | | | | | | |
6.70%, 7/15/34 | | | | (c)455 | | 450 | |
Miller Brewing Co. | | | | | | | |
4.25%, 8/15/08 | | | | (e)475 | | 468 | |
Mohawk Industries, Inc. | | | | | | | |
7.20%, 4/15/12 | | | | 295 | | 313 | |
Norfolk Southern Corp. | | | | | | | |
7.35%, 5/15/07 | | | | 245 | | 245 | |
Raytheon Co. | | | | | | | |
6.15%, 11/1/08 | | | | 46 | | 47 | |
Sara Lee Corp. | | | | | | | |
6.13%, 11/1/32 | | | | 515 | | 477 | |
SBC Communications, Inc. | | | | | | | |
6.15%, 9/15/34 | | | | 250 | | 247 | |
Sprint Capital Corp. | | | | | | | |
8.75%, 3/15/32 | | | | 80 | | 95 | |
Systems 2001 Asset Trust LLC | | | | | | | |
6.66%, 9/15/13 | | | | (e)370 | | 390 | |
Telecom Italia Capital S.A. | | | | | | | |
4.00%, 11/15/08 - 1/15/10 | | | | 650 | | 630 | |
Telefonica Europe BV | | | | | | | |
8.25%, 9/15/30 | | | | 525 | | 631 | |
Textron Financial Corp. | | | | | | | |
4.13%, 3/3/08 | | | | 230 | | 228 | |
5.13%, 2/3/11 | | | | 550 | | 550 | |
The Home Depot, Inc. | | | | | | | |
5.48%, 12/16/09 | | | | (h)280 | | 281 | |
Time Warner, Inc. | | | | | | | |
5.59%, 11/13/09 | | | | (h)895 | | 897 | |
Union Pacific Corp. | | | | | | | |
6.63%, 2/1/08 | | | | 305 | | 308 | |
UnitedHealth Group, Inc. | | | | | | | |
4.13%, 8/15/09 | | | | 265 | | 260 | |
5.43%, 3/2/09 | | | | (h)365 | | 365 | |
Valero Energy Corp. | | | | | | | |
3.50%, 4/1/09 | | | | 345 | | 335 | |
Viacom, Inc. | | | | | | | |
6.88%, 4/30/36 | | | | 475 | | 480 | |
Vodafone Group plc | | | | | | | |
5.44%, 12/28/07 | | | | (h)335 | | 335 | |
Yum! Brands, Inc. | | | | | | | |
8.88%, 4/15/11 | | | | 295 | | 331 | |
| | | | | | 17,591 | |
Mortgages — Other (28.2%) | | | | | | | |
American Home Mortgage Assets | | | | | | | |
5.45%, 3/25/47 | | | | (h)2,025 | | 2,022 | |
5.55%, 9/25/46 | | | | (h)1,472 | | 1,477 | |
5.58%, 10/25/46 | | | | (h)2,354 | | 2,363 | |
Banc of America Funding Corp. | | | | | | | |
5.67%, 9/20/35 | | | | (h)521 | | 523 | |
The accompanying notes are an integral part of the financial statements.
32
2007 Semi-Annual Report |
|
March 31, 2007 (unaudited) |
Portfolio of Investments (cont’d)
Core Fixed Income Portfolio
| | | | Face | | | |
| | | | Amount | | Value | |
| | | | (000) | | (000) | |
Mortgages — Other (cont’d) | | | | | | | |
Bear Stearns Mortgage Funding Trust | | | | | | | |
5.45%, 2/25/37 | | | | $ | (h)1,875 | | $ | 1,875 | |
5.49%, 3/25/37 | | | | (h)1,750 | | 1,750 | |
5.50%, 10/25/36 | | | | (h)1,766 | | 1,756 | |
5.52%, 9/25/36 | | | | (h)2,106 | | 2,100 | |
5.57%, 7/25/36 | | | | (h)1,210 | | 1,208 | |
Countrywide Alternative Loan Trust | | | | | | | |
5.48%, 7/25/46 | | | | (h)773 | | 774 | |
5.49%, 5/25/47 | | | | (h)2,200 | | 2,200 | |
5.57%, 10/25/46 | | | | (h)2,277 | | 2,277 | |
5.58%, 11/20/35 | | | | (h)535 | | 536 | |
5.63%, 3/20/46 | | | | (h)823 | | 824 | |
5.71%, 12/20/35 | | | | (h)1,936 | | 1,944 | |
5.73%, 11/20/35 | | | | (h)787 | | 791 | |
6.68%, 2/25/36 | | | | (h)1,166 | | 1,178 | |
Deutsche ALT-A Securities Alternate Loan Trust | | | | | | | |
5.47%, 2/25/47 | | | | (h)2,437 | | 2,437 | |
Deutsche ALT-A Securities NIM Trust | | | | | | | |
6.75%, 2/25/47 | | | | (e)941 | | 937 | |
Downey Savings & Loan Association Mortgage Loan Trust | | | | | | | |
5.52%, 10/19/36 | | | | (h)1,951 | | 1,956 | |
5.92%, 4/19/46 | | | | (h)1,259 | | 1,260 | |
Gemsco Mortgage Pass Through Certificate | | | | | | | |
8.70%, 11/25/10 | | | | (d)(k)4 | | 4 | |
Greenpoint Mortgage Funding Trust | | | | | | | |
5.50%, 1/25/37 | | | | (h)1,540 | | 1,538 | |
5.50%, 5/25/47 | | | | 2,000 | | 2,000 | |
5.64%, 3/25/36 | | | | (h)1,110 | | 1,112 | |
GS Mortgage Securities Corp. | | | | | | | |
6.25%, 1/25/37 | | | | (e)916 | | 913 | |
GSR Mortgage Loan Trust | | | | | | | |
5.58%, 8/25/46 | | | | (h)1,925 | | 1,930 | |
Harborview Mortgage Loan Trust | | | | | | | |
5.41%, 1/19/38 | | | | (h)681 | | 682 | |
5.45%, 3/19/37 | | | | (h)1,521 | | 1,523 | |
5.47%, 3/19/38 | | | | (h)1,557 | | 1,558 | |
5.50%, 11/19/36 | | | | (h)2,033 | | 2,026 | |
5.51%, 12/19/37 | | | | (h)2,364 | | 2,367 | |
5.52%, 7/21/36 - 3/19/38 | | | | (h)2,797 | | 2,794 | |
5.55%, 7/19/46 | | | | (h)1,081 | | 1,083 | |
5.57%, 10/19/37 | | | | (h)1,177 | | 1,180 | |
5.60%, 11/19/36 | | | | (h)2,001 | | 2,010 | |
5.61%, 7/19/45 | | | | (h)350 | | 351 | |
5.70%, 11/19/35 | | | | (h)611 | | 613 | |
Harborview NIM Corp. | | | | | | | |
6.41%, 3/19/37 - 3/19/38 | | | | (e)1,346 | | 1,312 | |
Indymac Index Mortgage Loan Trust | | | | | | | |
5.44%, 7/25/46 | | | | (h)1,625 | | 1,632 | |
5.53%, 11/25/36 | | | | (h)1,634 | | 1,637 | |
5.54%, 4/25/46 | | | | (h)1,671 | | 1,675 | |
Luminent Mortgage Trust | | | | | | | |
5.52%, 10/25/46 | | | | (h)1,356 | | 1,360 | |
5.55%, 5/25/46 | | | | (h)953 | | 956 | |
5.56%, 4/25/36 | | | | (h)857 | | 860 | |
Mastr Adjustable Rate Mortgage Trust | | | | | | | |
5.57%, 4/25/46 | | | | $ | (h)904 | | $ | 907 | |
Merrill Lynch Mortgage Investors, Inc. | | | | | | | |
5.44%, 8/25/35 | | | | (h)324 | | 325 | |
Residential Accredit Loans, Inc. | | | | | | | |
5.48%, 3/25/47 | | | | (h)2,850 | | 2,850 | |
5.51%, 12/25/36 | | | | (h)1,671 | | 1,680 | |
5.58%, 2/25/46 | | | | (h)381 | | 381 | |
5.59%, 2/25/46 | | | | (h)427 | | 427 | |
5.72%, 10/25/45 | | | | (h)1,557 | | 1,565 | |
Structured Asset Mortgage Investments, Inc. | | | | | | | |
5.51%, 2/25/36 | | | | (h)405 | | 405 | |
5.52%, 10/25/36 | | | | (h)2,051 | | 2,056 | |
5.55%, 7/25/36 - 8/25/36 | | | | (h)4,069 | | 4,083 | |
5.59%, 4/25/36 | | | | (h)1,512 | | 1,519 | |
Wamu Alternative Mortgage Pass-Through Certificates | | | | | | | |
4.98%, 8/25/46 | | | | (h)1,161 | | 1,163 | |
5.92%, 4/25/46 | | | | (h)1,030 | | 1,032 | |
Washington Mutual, Inc. | | | | | | | |
5.40%, 6/25/46 | | | | (h)749 | | 750 | |
5.57%, 11/25/45 - 12/25/45 | | | | (h)1,171 | | 1,173 | |
5.58%, 7/25/44 - 10/25/45 | | | | (h)474 | | 475 | |
5.61%, 8/25/45 | | | | (h)224 | | 225 | |
5.92%, 5/25/46 | | | | (h)1,047 | | 1,047 | |
Zuni Mortgage Loan Trust | | | | | | | |
5.45%, 8/25/36 | | | | (h)975 | | 974 | |
| | | | | | 88,341 | |
U.S. Treasury Securities (5.9%) | | | | | | | |
U.S. Treasury Strips | | | | | | | |
IO | | | | | | | |
4.92%, 2/15/21 | | | | (c)500 | | 252 | |
5.08%, 5/15/21 | | | | (c)36,705 | | 18,226 | |
| | | | | | 18,478 | |
Utilities (1.5%) | | | | | | | |
Ameren Corp. | | | | | | | |
4.26%, 5/15/07 | | | | 460 | | 459 | |
Arizona Public Service Co. | | | | | | | |
5.80%, 6/30/14 | | | | 500 | | 505 | |
Carolina Power & Light Co. | | | | | | | |
5.13%, 9/15/13 | | | | 340 | | 336 | |
CenterPoint Energy Resources Corp. | | | | | | | |
6.25%, 2/1/37 | | | | 135 | | 135 | |
Consolidated Natural Gas Co. | | | | | | | |
6.25%, 11/1/11 | | | | 175 | | 182 | |
Detroit Edison Co. | | | | | | | |
6.13%, 10/1/10 | | | | 235 | | 242 | |
Entergy Gulf States, Inc. | | | | | | | |
3.60%, 6/1/08 | | | | 320 | | 314 | |
5.76%, 12/1/09 | | | | (h)155 | | 155 | |
NiSource Finance Corp. | | | | | | | |
5.93%, 11/23/09 | | | | (h)240 | | 241 | |
Ohio Power Corp. | | | | | | | |
6.00%, 6/1/16 | | | | 460 | | 478 | |
The accompanying notes are an integral part of the financial statements.
33
2007 Semi-Annual Report | |
| |
March 31, 2007 (unaudited) | |
Portfolio of Investments (cont’d)
Core Fixed Income Portfolio
| | | | Face | | | |
| | | | Amount | | Value | |
| | | | (000) | | (000) | |
Utilities (cont’d) | | | | | | | |
Plains All American Pipeline LP | | | | | | | |
6.70%, 5/15/36 | | | | $ | 465 | | $ | 477 | |
Public Service Electric & Gas Co. | | | | | | | |
5.00%, 1/1/13 | | | | 230 | | 226 | |
Sempra Energy | | | | | | | |
4.62%, 5/17/07 | | | | 230 | | 230 | |
Texas Eastern Transmission LP | | | | | | | |
7.00%, 7/15/32 | | | | (c)280 | | 313 | |
Wisconsin Electric Power Co. | | | | | | | |
3.50%, 12/1/07 | | | | 250 | | 247 | |
| | | | | | 4,540 | |
Total Fixed Income Securities (Cost $281,040) | | | | | | 279,726 | |
| | | | | | | | | |
| | | | No. of | | | |
| | | | Contracts | | | |
Put Option Purchased (0.1%) | | | | | | | |
90 Day EuroDollar | | | | | | | |
6/07 @ $94.25 | | | | 690 | | $ | 3 | |
6/07 @ $94.50 | | | | 104 | | 1 | |
6/07 @ $94.75 | | | | 45 | | 8 | |
9/07 @ $94.75 | | | | 167 | | 26 | |
12/07 @ $94.50 | | | | 50 | | 2 | |
12/07 @ $94.75 | | | | 911 | | 148 | |
Total Put Options Purchased (Cost $467) | | | | | | 188 | |
| | | | | | | | |
| | | | Shares | | | |
Preferred Stocks (0.1%) | | | | | | | |
Mortgages — Other (0.1%) | | | | | | | |
Home Ownership Funding Corp. 13.33% (Cost $458) | | | | (e)2,975 | | 440 | |
| | | | Face | | | |
| | | | Amount | | | |
| | | | (000) | | | |
Short-Term Investments (19.9%) | | | | | | | |
Short-Term Debt Securities held as Collateral on Loaned Securities (6.5%) | | | | | | | |
AIG Match Funding Corp., 5.30%, 4/17/07 | | | | $ | (h)459 | | 459 | |
Alliance & Leicester plc, 5.33%, 4/10/07 | | | | (h)328 | | 328 | |
Anglo Irish Bank Corp., plc, 5.35%, 7/9/07 | | | | 159 | | 159 | |
Bancaja, 5.36%, 4/19/07 | | | | (h)164 | | 164 | |
Bank of America Corp., 5.32%, 4/2/07 | | | | (h)524 | | 524 | |
Bank of New York Co., Inc., 5.32%, 4/10/07 | | | | (h)164 | | 164 | |
Bear Stearns & Co., Inc., 5.36%, 4/16/07 | | | | (h)328 | | 328 | |
BNP Paribas plc, 5.33%, 5/21/07 | | | | (h)328 | | 328 | |
CAM US Finance S.A. Unipersonal, | | | | | | | |
5.36%, 7/3/07 | | | | (h)656 | | 656 | |
CIC, New York, | | | | | | | |
5.30%, 4/3/07 | | | | (h)229 | | 229 | |
5.34%, 4/2/07 | | | | (h)328 | | 328 | |
CIT Group Holdings, 5.37%, 7/18/07 | | | | (h)590 | | 590 | |
Credit Suisse First Boston, New York, | | | | | | | |
5.29%, 5/15/07 | | | | 197 | | 197 | |
5.32%, 4/2/07 | | | | (h)328 | | 328 | |
Deutsche Bank Securities, Inc., | | | | | | | |
5.40%, 4/2/07 | | | | $ | 1,311 | | $ | 1,311 | |
5.46%, 4/2/07 | | | | 3,147 | | 3,147 | |
Dexia Bank, New York, 5.32%, 4/2/07 | | | | (h)328 | | 328 | |
First Tennessee Bank, 5.33%, 4/17/07 | | | | (h)164 | | 164 | |
Gemini Securitization Corp., 5.41%, 4/2/07 | | | | 471 | | 471 | |
Goldman Sachs Group, Inc., | | | | | | | |
5.37%, 4/16/07 | | | | (h)164 | | 164 | |
5.55%, 4/2/07 | | | | (h)308 | | 308 | |
HSBC Finance Corp., 5.33%, 4/10/07 | | | | (h)164 | | 164 | |
Mane Funding Corp., 5.29%, 4/10/07 | | | | 235 | | 235 | |
Manufacturers & Traders, 5.30%, 4/16/07 | | | | (h)197 | | 197 | |
Marshall & Ilsley Bank, 5.37%, 12/17/07 | | | | 329 | | 329 | |
Merrill Lynch & Co., 5.33%, 4/26/07 | | | | (h)172 | | 172 | |
Metropolitan Life Global Funding, | | | | | | | |
5.31%, 4/23/07 | | | | (h)492 | | 492 | |
Natexis Banques Populaires, New York, | | | | | | | |
5.33%, 4/2/07 | | | | (h)328 | | 328 | |
5.34%, 4/2/07 | | | | (h)328 | | 328 | |
National Australia Bank Ltd., 5.31%, 4/10/07 | | | | (h)249 | | 249 | |
National City Bank Cleveland, 5.32%, 4/2/07 | | | | (h)164 | | 164 | |
National Rural Utilities Cooperative Finance Corp., | | | | | | | |
5.31%, 4/2/07 | | | | (h)655 | | 655 | |
Nationwide Building Society, 5.43%, 6/28/07 | | | | (h)380 | | 380 | |
Nordea Bank, New York, 5.31%, 4/2/07 | | | | (h)492 | | 492 | |
Raiffeisen Zentralbank Oesterreich, | | | | | | | |
5.31%, 6/19/07 | | | | 194 | | 194 | |
Rheingold Securitization, 5.32%, 5/15/07 | | | | 291 | | 291 | |
Sedna Finance, Inc., 5.32%, 5/15/07 | | | | 84 | | 84 | |
Skandi, New York, 5.32%, 4/10/07 | | | | (h)328 | | 328 | |
Toronto Dominion, New York, 5.32%, 5/29/07 | | | | (h)328 | | 328 | |
Tulip Funding Corp., 5.36%, 4/30/07 | | | | 652 | | 652 | |
UBS Securities LLC, 5.40%, 4/2/07 | | | | 3,221 | | 3,221 | |
Unicredito Delaware, Inc., 5.32%, 4/16/07 | | | | (h)361 | | 361 | |
Unicredito Italiano Bank (Ireland) plc, 5.34% | | | | | | | |
4/10/07 | | | | (h)229 | | 229 | |
| | | | | | 20,548 | |
Repurchase Agreement (13.0%) | | | | | | | |
J.P. Morgan Securities, Inc., 5.28%, dated 3/30/07, due 04/2/07, repurchase price $40,840 | | | | (f)40,822 | | 40,822 | |
U.S. Treasury Security (0.4%) | | | | | | | |
U.S. Treasury Bill | | | | | | | |
4.98%, 7/12/07 | | | | (j)1,105 | | 1,090 | |
Total Short-Term Investments (Cost $62,460) | | | | | | 62,460 | |
Total Investments (109.3%) (Cost $344,425) — Including $19,914 of Securities Loaned | | | | | | 342,814 | |
Liabilities in Excess of Other Assets (-9.3%) | | | | | | (29,078) | |
Net Assets (100%) | | | | | | $ | 313,736 | |
(c) | All or portion of security on loan at March 31, 2007. |
(d) | Security was valued at fair value — At March 31, 2007,the Portfolio held $4,000 of fair valued securities, representing less than 0.05% of net assets. |
(e) | 144A security — Certain conditions for public sale may exist. Unless otherwise noted, these securities are deemed to be liquid. |
The accompanying notes are an integral part of the financial statements.
34
2007 Semi-Annual Report |
|
March 31, 2007 (unaudited) |
Portfolio of Investments (cont’d)
Core Fixed Income Portfolio
(f) | Represents the Portfolio’s undivided interest in a joint repurchase agreement which has a total value of $1,580,364,000. The repurchase agreement was fully collateralized by U.S. government agency securities at the date of this Portfolio of Investments as follows: Federal Farm Credit Bank, 0.00% to 7.43%, due 5/7/07 to 3/2/21; Federal Home Loan Bank, 0.00% to 6.42%, due 4/2/07 to 3/9/26; Federal Home Loan Mortgage Corp., 0.00% to 7.00%, due 4/2/07 to 3/15/31; Federal National Mortgage Association, 0.00% to 7.13%, due 4/5/07 to 3/17/31; Tennessee Valley Authority, 4.88%, due 12/15/16, which had a total value of $1,611,974,119. The investment in the repurchase agreement is through participation in a joint account with affiliated parties pursuant to exemptive relief received by the Portfolio from the SEC. |
(h) | Variable/Floating Rate Security — Interest rate changes on these instruments are based on changes in a designated base rate. The rates shown are those in effect on March 31, 2007. |
(i) | Security is subject to delayed delivery. |
(j) | All or a portion of the security was pledged to cover margin requirements for futures contracts. |
(k) | Security has been deemed illiquid at March 31, 2007. |
(o) | Perpetual — Security does not have a predetermined maturity date. Rates for these securities are fixed for a period of time then revert to a floating rate. The interest rate shown is the rate in effect at March 31, 2007. |
@ | Face Amount/Value is less than $500. |
Inv Fl | Inverse Floating Rate — Interest rate fluctuates with an inverse relationship to an associated interest rate. Indicated rate is the effective rate at March 31, 2007. |
IO | Interest Only |
PO | Principal Only |
PAC | Planned Amortization Class |
TBA | To Be Announced |
Futures Contracts:
The Portfolio had the following futures contract(s) open at period end:
| | | | | | | | Net | |
| | | | | | | | Unrealized | |
| | Number | | | | | | Appreciation | |
| | of | | Value | | Expiration | | (Depreciation) | |
| | Contracts | | (000) | | Date | | (000) | |
Long: | | | | | | | | | |
U.S. Treasury 5yr. Note | | 713 | | $ | 75,433 | | Jun-07 | | $ | 11 | |
U.S. Treasury 10 yr. Note | | 514 | | 55,576 | | Jun-07 | | 15 | |
U.S. Treasury Long Bond | | 219 | | 24,364 | | Jun-07 | | (170 | ) |
U.S. Treasury 2 yr. Note | | 304 | | 62,287 | | Jun-07 | | (114 | ) |
| | | | | | | | $ | (258 | ) |
| | | | | | | | | | | |
Graphic Presentation of Portfolio Holdings
The following graph depicts the Portfolio’s holdings by industry and/or investment type, as a percentage of total investments.

* | Industries and/or investment types which do not appear in the above graph, as well as those which represent less than 5% of total investments, if applicable, are included in the category labeled “Other”. |
The accompanying notes are an integral part of the financial statements.
35
2007 Semi-Annual Report | |
| |
March 31, 2007 (unaudited) | |
Portfolio of Investments
Core Plus Fixed Income Portfolio
| | | | Face | | | |
| | | | Amount | | Value | |
| | | | (000) | | (000) | |
Fixed Income Securities (94.7%) | | | | | | | |
Agency Adjustable Rate Mortgages (4.4%) | | | | | | | |
Federal Home Loan Mortgage Corp.,
Adjustable Rate Mortgages: | | | | | | | |
5.35%, 4/1/37 | | | | $ | 12,063 | | $ | 12,043 | |
5.70%, 3/1/37 | | | | 11,353 | | 11,469 | |
5.76%, 1/1/37 | | | | 18,777 | | 18,915 | |
Federal National Mortgage Association,
Adjustable Rate Mortgages: | | | | | | | |
4.74%, 6/1/36 | | | | 12,472 | | 12,294 | |
7.45%, 5/1/36 | | | | 20,930 | | 21,584 | |
7.47%, 7/1/36 | | | | 14,270 | | 14,716 | |
7.48%, 4/1/36 | | | | 13,405 | | 13,823 | |
7.49%, 7/1/36 - 8/1/36 | | | | 1,226 | | 1,261 | |
Government National Mortgage Association,
Adjustable Rate Mortgages: | | | | | | | |
5.38%, 1/20/25 - 1/20/28 | | | | 10,813 | | 10,953 | |
5.75%, 7/20/25 - 9/20/27 | | | | 1,180 | | 1,194 | |
6.13%, 10/20/25 - 12/20/27 | | | | 1,721 | | 1,743 | |
| | | | | | 119,995 | |
Agency Fixed Rate Mortgages (12.4%) | | | | | | | |
Federal Home Loan Mortgage Corp.,
Conventional Pools: | | | | | | | |
10.00%, 10/1/10 - 11/1/20 | | | | 1,284 | | 1,419 | |
10.50%, 8/1/09 - 10/1/20 | | | | 336 | | 365 | |
11.00%, 12/1/10 - 9/1/20 | | | | 337 | | 371 | |
11.25%, 10/1/11 - 12/1/15 | | | | 155 | | 168 | |
11.50%, 1/1/11 - 12/1/15 | | | | 3 | | 3 | |
11.75%, 4/1/19 | | | | 11 | | 11 | |
12.00%, 10/1/09 - 2/1/15 | | | | 13 | | 14 | |
13.00%, 6/1/19 | | | | 3 | | 4 | |
14.75%, 3/1/10 | | | | 1 | | 1 | |
Gold Pools: | | | | | | | |
6.50%, 3/1/16 - 8/1/33 | | | | 1,793 | | 1,846 | |
7.00%, 2/1/28 - 7/1/32 | | | | 2,243 | | 2,332 | |
7.50%, 8/1/17 - 10/1/32 | | | | 12,081 | | 12,636 | |
8.00%, 11/1/25 - 12/1/31 | | | | 3,494 | | 3,679 | |
8.50%, 3/1/09 - 8/1/31 | | | | 7,510 | | 8,070 | |
9.00%, 7/1/17 | | | | 535 | | 573 | |
9.50%, 1/1/21 - 12/1/22 | | | | 629 | | 682 | |
10.00%, 6/1/17 - 3/1/21 | | | | 424 | | 472 | |
10.50%, 11/1/15 - 4/1/21 | | | | 216 | | 234 | |
12.00%, 10/1/10 | | | | 5 | | 5 | |
Federal National Mortgage Association,
Conventional Pools: | | | | | | | |
6.50%, 11/1/23 - 1/1/34 | | | | 27,852 | | 28,690 | |
7.00%, 11/1/13 - 4/1/36 | | | | 73,029 | | 72,136 | |
7.50%, 11/1/22 - 9/1/35 | | | | 29,260 | | 30,627 | |
8.00%, 2/1/12 - 10/1/32 | | | | 22,648 | | 23,939 | |
8.50%, 11/1/08 - 5/1/32 | | | | 19,931 | | 21,474 | |
9.00%, 12/1/08 - 1/1/22 | | | | 1,195 | | 1,265 | |
10.00%, 9/1/10 - 10/1/25 | | | | 898 | | 989 | |
10.50%, 5/1/12 - 7/1/25 | | | | 880 | | 978 | |
11.00%, 7/1/20 - 11/1/20 | | | | 123 | | 136 | |
9.50%, 11/1/13 - 4/1/30 | | | | 5,160 | | 5,613 | |
11.50%, 1/1/13 - 2/1/20 | | | | $ | 218 | | $ | 242 | |
12.00%, 11/1/15 | | | | 254 | | 280 | |
12.50%, 9/1/15 - 2/1/16 | | | | 39 | | 43 | |
April TBA | | | | | | | |
7.00%, 4/25/37 | | | | (i)3,575 | | 3,688 | |
7.50%, 4/25/36 | | | | (i)11,600 | | 12,024 | |
May TBA | | | | | | | |
7.00%, 5/25/37 | | | | (i)70,950 | | 73,123 | |
Government National Mortgage Association,
Various Pools: | | | | | | | |
9.00%, 12/15/21 - 11/15/24 | | | | 2,126 | | 2,291 | |
9.50%, 8/15/09 - 12/15/19 | | | | 2,074 | | 2,252 | |
10.00%, 11/15/09 - 1/15/26 | | | | 13,498 | | 15,064 | |
10.50%, 7/15/13 - 4/15/25 | | | | 1,594 | | 1,785 | |
11.00%, 12/15/09 - 2/15/25 | | | | 3,576 | | 3,969 | |
11.50%, 4/15/13 - 4/20/19 | | | | 105 | | 117 | |
12.00%, 3/15/11 - 11/15/19 | | | | 1,704 | | 1,926 | |
12.50%, 6/15/10 - 12/15/13 | | | | 8 | | 9 | |
| | | | | | 335,545 | |
Asset Backed Corporates (17.2%) | | | | | | | |
ACE Securities Corp. | | | | | | | |
5.43%, 7/25/35 | | | | (h)9 | | 9 | |
5.64%, 5/25/34 | | | | (h)2,710 | | 2,717 | |
Aegis Asset Backed Securities Trust | | | | | | | |
5.43%, 10/25/35 | | | | (h)3 | | 3 | |
American Express Credit Account Master Trust | | | | | | | |
5.32%, 10/15/12 | | | | (h)13,550 | | 13,550 | |
5.43%, 11/16/09 - 12/15/09 | | | | (h)34,700 | | 34,726 | |
Argent Securities, Inc. | | | | | | | |
5.37%, 10/15/46 | | | | (h)14,455 | | 14,465 | |
Bayview Financial Acquisition Trust | | | | | | | |
6.07%, 9/28/43 | | | | (h)@— | | @— | |
Bear Stearns Asset Backed Securities, Inc. | | | | | | | |
5.44%, 8/25/35 - 11/25/35 | | | | (h)42 | | 42 | |
5.52%, 9/25/34 | | | | (h)3,035 | | 3,038 | |
5.54%, 3/25/35 | | | | (h)3,933 | | 3,936 | |
Capital Auto Receivables Asset Trust | | | | | | | |
3.35%, 2/15/08 | | | | 1,706 | | 1,705 | |
5.38%, 5/15/11 | | | | (h)21,375 | | 21,388 | |
5.40%, 1/15/08 | | | | (h)907 | | 907 | |
Carrington Mortgage Loan Trust | | | | | | | |
5.40%, 3/25/47 | | | | 10,500 | | 10,500 | |
5.44%, 10/25/35 | | | | (h)319 | | 319 | |
5.47%, 9/25/35 | | | | (h)14 | | 14 | |
Citibank Credit Card Issuance Trust | | | | | | | |
5.34%, 3/22/12 | | | | (c)(h)14,550 | | 14,550 | |
5.53%, 2/7/10 | | | | (h)14,100 | | 14,131 | |
6.88%, 11/16/09 | | | | 18,410 | | 18,602 | |
Citicorp Residential Mortgage | | | | | | | |
5.40%, 9/25/36 | | | | (h)102 | | 102 | |
Citigroup Mortgage Loan Trust, Inc. | | | | | | | |
5.39%, 1/25/37 | | | | (h)12,919 | | 12,919 | |
5.73%, 10/25/34 | | | | (h)14 | | 14 | |
| | | | | | | | | | |
The accompanying notes are an integral part of the financial statements.
36
2007 Semi-Annual Report |
|
March 31, 2007 (unaudited) |
Portfolio of Investments (cont’d)
Core Plus Fixed Income Portfolio
| | | | Face | | | |
| | | | Amount | | Value | |
| | | | (000) | | (000) | |
Asset Backed Corporates (cont’d) | | | | | | | |
Conti Mortgage Home Equity Loan Trust | | | | | | | |
8.10%, 8/15/25 | | | | $ | 120 | | $ | 124 | |
Countrywide Asset-Backed Certificates | | | | | | | |
5.47%, 5/25/36 | | | | (h)8,105 | | 8,111 | |
Credit-Based Asset Servicing & Securitization | | | | | | | |
5.42%, 8/25/35 | | | | (h)21 | | 21 | |
5.43%, 8/25/35 | | | | (h)6 | | 6 | |
First Franklin Mortgage Loan Asset Backed Certificates | | | | | | | |
5.37%, 7/25/36 | | | | (h)9,797 | | 9,802 | |
5.39%, 2/25/36 | | | | (h)7,891 | | 7,898 | |
5.42%, 7/25/35 | | | | (h)2,835 | | 2,837 | |
5.44%, 10/25/35 | | | | (h)6,118 | | 6,123 | |
Fremont Home Loan Owner Trust | | | | | | | |
5.37%, 10/25/36 | | | | (h)15,145 | | 15,146 | |
GE Capital Credit Card Master Note Trust | | | | | | | |
5.36%, 9/15/10 | | | | (h)10,825 | | 10,835 | |
5.37%, 6/15/10 | | | | (h)150 | | 150 | |
GE Dealer Floorplan Master Note Trust | | | | | | | |
5.40%, 7/20/09 | | | | (h)15,100 | | 15,114 | |
GSAMP Trust | | | | | | | |
5.39%, 1/25/37 | | | | (h)11,968 | | 11,973 | |
5.44%, 3/25/47 | | | | (h)16,175 | | 16,175 | |
Lehman Brothers Floating Rate Commercial Mortgage Trust | | | | | | | |
5.44%, 9/15/21 | | | | (e)(h)13,492 | | 13,503 | |
Lehman XS Trust | | | | | | | |
5.62%, 2/25/46 | | | | (h)9,835 | | 9,864 | |
Long Beach Mortgage Loan Trust | | | | | | | |
5.41%, 1/25/36 | | | | (h)37 | | 37 | |
MBNA Credit Card Master Note Trust | | | | | | | |
5.46%, 2/16/10 | | | | (h)16,125 | | 16,147 | |
MBNA Master Credit Card Trust USA | | | | | | | |
5.52%, 9/15/09 | | | | (h)125 | | 125 | |
5.90%, 8/15/11 | | | | 19,530 | | 19,896 | |
7.80%, 10/15/12 | | | | 15,505 | | 16,813 | |
Nationstar Home Equity Loan Trust | | | | | | | |
6.02%, 9/25/36 | | | | (h)104 | | 104 | |
Novastar Home Equity Loan | | | | | | | |
5.39%, 11/25/36 | | | | (h)76 | | 76 | |
RAAC Series | | | | | | | |
5.42%, 9/25/45 | | | | (h)5,481 | | 5,486 | |
Residential Asset Mortgage Products, Inc. | | | | | | | |
5.39%, 6/25/29 | | | | (h)14,559 | | 14,568 | |
Securitized Asset Backed Receivables LLC Trust | | | | | | | |
5.39%, 12/25/35 | | | | (h)4,394 | | 4,397 | |
5.40%, 11/25/36 | | | | (h)13,701 | | 13,707 | |
SLM Student Loan Trust | | | | | | | |
5.32%, 10/25/14 | | | | (h)26,215 | | 26,231 | |
Soundview Home Equity Loan Trust | | | | | | | |
5.43%, 2/25/37 | | | | (h)14,825 | | 14,820 | |
Specialty Underwriting & Residential Finance | | | | | | | |
5.44%, 6/25/36 | | | | (h)1,810 | | 1,811 | |
Structured Asset Investment Loan Trust | | | | | | | |
5.39%, 3/25/36 | | | | $ | (h)41 | | $ | 41 | |
Structured Asset Securities Corp. | | | | | | | |
5.41%, 4/25/37 | | | | (h)13,025 | | 13,025 | |
5.52%, 6/25/35 | | | | (h)5,312 | | 5,316 | |
5.67%, 12/25/34 | | | | (h)34 | | 35 | |
Terwin Mortgage Trust | | | | | | | |
5.44%, 7/25/35 | | | | (e)(h)8 | | 8 | |
TXU Electric Delivery Transition Bond Co. | | | | | | | |
4.81%, 11/17/14 | | | | 3,115 | | 3,103 | |
Wachovia Bank Commercial Mortgage Trust | | | | | | | |
5.44%, 9/15/21 | | | | (e)(h)13,125 | | 13,133 | |
| | | | | | 464,198 | |
Collateralized Mortgage Obligations — Agency Collateral Series (2.0%) | | | | | | | |
Bear Stearns Asset Backed Securities | | | | | | | |
IO | | | | | | | |
Zero Coupon, 3/27/36 - 5/25/36 | | | | (e)295,554 | | 6,669 | |
Bear Stearns Structured Products, Inc. | | | | | | | |
1.00%, 3/27/36 | | | | (e)193,165 | | 7,288 | |
IO | | | | | | | |
1.27%, 2/27/36 | | | | (e)140,273 | | 4,229 | |
1.91%, 7/27/36 | | | | (e)204,288 | | 8,092 | |
6.00%, 4/25/37 | | | | (e)255,272 | | 9,945 | |
Federal Home Loan Mortgage Corp., | | | | | | | |
Inv Fl IO | | | | | | | |
20.38%, 11/15/07 | | | | 22 | | 1 | |
Inv Fl IO PAC | | | | | | | |
4.23%, 3/15/08 | | | | 164 | | 2 | |
4.89%, 2/15/08 | | | | 329 | | 4 | |
Inv Fl IO REMIC | | | | | | | |
2.18%, 8/15/30 | | | | 258 | | 10 | |
IO | | | | | | | |
6.00%, 5/1/31 | | | | 7,180 | | 1,389 | |
7.50%, 12/1/29 | | | | 416 | | 112 | |
8.00%, 1/1/28 - 6/1/31 | | | | 3,027 | | 663 | |
Federal National Mortgage Association, | | | | | | | |
Inv Fl IO | | | | | | | |
1.08%, 7/25/34 | | | | 8,832 | | 249 | |
2.88%, 10/25/28 | | | | 6,711 | | 240 | |
3.18%, 7/25/30 | | | | 4,425 | | 244 | |
3.23%, 10/18/30 | | | | 2,505 | | 132 | |
3.86%, 10/25/07 | | | | 388 | | 3 | |
Inv Fl IO REMIC | | | | | | | |
30.76%, 9/25/20 | | | | 58 | | 98 | |
35.16%, 9/25/22 | | | | 97 | | 90 | |
IO | | | | | | | |
1.93%, 3/25/36 | | | | 76,777 | | 1,632 | |
6.00%, 8/25/32 - 7/25/33 | | | | 4,778 | | 935 | |
6.50%, 9/1/29 - 6/25/33 | | | | 27,237 | | 6,097 | |
7.00%, 4/1/32 | | | | 5,558 | | 1,350 | |
8.00%, 4/1/24 - 12/1/31 | | | | 9,980 | | 2,356 | |
8.50%, 10/1/25 | | | | 304 | | 83 | |
9.00%, 11/1/26 | | | | 483 | | 116 | |
The accompanying notes are an integral part of the financial statements.
37
2007 Semi-Annual Report | |
| |
March 31, 2007 (unaudited) | |
Portfolio of Investments (cont’d)
Core Plus Fixed Income Portfolio
| | | | Face | | | |
| | | | Amount | | Value | |
| | | | (000) | | (000) | |
Collateralized Mortgage Obligations — Agency Collateral Series (cont’d) | | | | | | | |
IO PAC | | | | | | | |
8.00%, 9/18/27 | | | | $ | 1,602 | | $ | 337 | |
Government National Mortgage Association, | | | | | | | |
Inv Fl IO | | | | | | | |
2.83%, 5/16/31 | | | | 7,214 | | 533 | |
2.88%, 8/16/31 | | | | 2,516 | | 138 | |
3.28%, 8/16/29 | | | | 360 | | 25 | |
GS Mortgage Securities Corp. | | | | | | | |
IO | | | | | | | |
2.57%, 3/25/36 | | | | (e)(h)28,124 | | 1,107 | |
Kidder Peabody Mortgage Assets Trust | | | | | | | |
IO | | | | | | | |
9.50%, 4/22/18 | | | | 4 | | 1 | |
| | | | | | 54,170 | |
Collateralized Mortgage Obligations — Non Agency Collateral Series (2.2%) | | | | | | | |
Countrywide Alternative Loan Trust | | | | | | | |
Zero Coupon, 4/25/47 | | | | 64,175 | | 3,299 | |
1.83%, 2/25/47 | | | | (e)172,682 | | 9,415 | |
IO | | | | | | | |
1.54%, 2/25/37 | | | | 67,964 | | 3,589 | |
1.70%, 9/25/46 | | | | 140,629 | | 6,989 | |
1.73%, 12/20/35 | | | | (e)(h)74,026 | | 2,016 | |
1.78%, 3/20/46 | | | | 63,865 | | 2,942 | |
1.95%, 3/20/47 | | | | 127,708 | | 7,090 | |
2.71%, 12/20/35 | | | | (e)(h)87,997 | | 4,228 | |
Greenpoint Mortgage Funding Trust | | | | | | | |
IO | | | | | | | |
1.10%, 8/25/45 | | | | 42,787 | | 1,304 | |
1.91%, 10/25/45 | | | | 52,774 | | 1,592 | |
Harborview Mortgage Loan Trust | | | | | | | |
IO | | | | | | | |
0.97%, 6/19/35 | | | | (h)54,758 | | 1,240 | |
1.26%, 5/19/35 | | | | (h)74,232 | | 1,774 | |
1.63%, 3/19/37 | | | | (h)61,521 | | 2,711 | |
PO | | | | | | | |
3/19/37 | | | | 29 | | 22 | |
Harborview NIM Corp. | | | | | | | |
Zero Coupon, 10/20/45 | | | | (e)(h)7,542 | | 4,818 | |
Indymac Index Mortgage Loan Trust | | | | | | | |
IO | | | | | | | |
0.91%, 7/25/35 | | | | (h)47,358 | | 1,502 | |
Residential Accredit Loans, Inc. | | | | | | | |
Zero Coupon, 4/25/47 | | | | (e)99,894 | | 5,744 | |
| | | | | | 60,275 | |
Finance (5.7%) | | | | | | | |
AIG SunAmerica Global Financing VI | | | | | | | |
6.30%, 5/10/11 | | | | (e)9,957 | | 10,404 | |
American General Finance Corp. | | | | | | | |
4.63%, 5/15/09 - 9/1/10 | | | | 2,415 | | 2,383 | |
AXA Financial, Inc. | | | | | | | |
6.50%, 4/1/08 | | | | 5,450 | | 5,510 | |
Catlin Insurance Co., Ltd. | | | | | | | |
7.25% | | | | (e)(h)4,980 | | 4,953 | |
CIT Group, Inc. | | | | | | | |
3.65%, 11/23/07 | | | | $ | 2,385 | | $ | 2,360 | |
7.38%, 4/2/07 | | | | 5 | | 5 | |
Countrywide Home Loans, Inc. | | | | | | | |
3.25%, 5/21/08 | | | | 5,150 | | 5,034 | |
Farmers Exchange Capital | | | | | | | |
7.05%, 7/15/28 | | | | (c)(e)100 | | 103 | |
Farmers Insurance Exchange | | | | | | | |
8.63%, 5/1/24 | | | | (e)6,970 | | 8,309 | |
General Electric Capital Corp. | | | | | | | |
4.25%, 12/1/10 | | | | (c)2,180 | | 2,118 | |
HSBC Finance Corp. | | | | | | | |
4.13%, 12/15/08 | | | | 10 | | 10 | |
5.88%, 2/1/09 | | | | 9,960 | | 10,078 | |
6.38%, 10/15/11 | | | | 60 | | 63 | |
6.75%, 5/15/11 | | | | 735 | | 775 | |
8.00%, 7/15/10 | | | | 1,100 | | 1,193 | |
JPMorgan Chase & Co. | | | | | | | |
6.00%, 2/15/09 | | | | 7,660 | | 7,772 | |
M&I Marshall & Ilsley Bank | | | | | | | |
3.80%, 2/8/08 | | | | 6,390 | | 6,315 | |
Mantis Reef Ltd. | | | | | | | |
4.69%, 11/14/08 | | | | (e)4,615 | | 4,572 | |
MBNA Corp. | | | | | | | |
5.79%, 5/5/08 | | | | (c)(h)4,775 | | 4,799 | |
Metlife, Inc. | | | | | | | |
6.13%, 12/1/11 | | | | 45 | | 47 | |
Nationwide Building Society | | | | | | | |
4.25%, 2/1/10 | | | | (e)5,000 | | 4,883 | |
Platinum Underwriters Finance, Inc. | | | | | | | |
7.50%, 6/1/17 | | | | (c)3,015 | | 3,196 | |
Platinum Underwriters Holdings Ltd. | | | | | | | |
6.37%, 11/16/07 | | | | 2,900 | | 2,888 | |
Residential Capital Corp. | | | | | | | |
6.38%, 6/30/10 | | | | 7,720 | | 7,724 | |
SLM Corp. | | | | | | | |
4.00%, 1/15/10 | | | | (c)3,595 | | 3,501 | |
St. Paul Travelers Cos., Inc. (The) | | | | | | | |
5.01%, 8/16/07 | | | | 4,070 | | 4,063 | |
Two-Rock Pass Through Trust | | | | | | | |
6.30% | | | | (e)(h)(o)2,930 | | 2,886 | |
Unicredit Luxembourg Finance S.A. | | | | | | | |
5.41%, 10/24/08 | | | | (e)(h)8,220 | | 8,225 | |
USB Capital IX | | | | | | | |
6.19% | | | | (h)(o)6,735 | | 6,912 | |
Wachovia Capital Trust Ill | | | | | | | |
5.80% | | | | (h)(o)13,065 | | 13,232 | |
Washington Mutual Bank FA | | | | | | | |
5.50%, 1/15/13 | | | | 25 | | 25 | |
Washington Mutual, Inc. | | | | | | | |
8.25%, 4/1/10 | | | | 5,330 | | 5,762 | |
Washington Mutual Preferred Funding II | | | | | | | |
6.66% | | | | (e)(h)(o)1,300 | | 1,278 | |
The accompanying notes are an integral part of the financial statements.
38
2007 Semi-Annual Report |
|
March 31, 2007 (unaudited) |
Portfolio of Investments (cont’d)
Core Plus Fixed Income Portfolio
| | | | Face | | | |
| | | | Amount | | Value | |
| | | | (000) | | (000) | |
Finance (cont’d) | | | | | | | |
World Financial Properties | | | | | | | |
6.91%, 9/1/13 | | | | $ | (e)1,148 | | $ | 1,206 | |
6.95%, 9/1/13 | | | | (e)7,243 | | 7,617 | |
Xlliac Global Funding | | | | | | | |
4.80%, 8/10/10 | | | | (e)5,360 | | 5,290 | |
| | | | | | 155,491 | |
Industrials (6.4%) | | | | | | | |
America West Airlines, Inc. | | | | | | | |
7.10%, 4/2/21 | | | | 44 | | 47 | |
ArvinMeritor, Inc. | | | | | | | |
8.75%, 3/1/12 | | | | (c)3,695 | | 3,834 | |
AT&T Corp. | | | | | | | |
8.00%, 11/15/31 | | | | 5,300 | | 6,569 | |
Brookfield Asset Management, Inc. | | | | | | | |
7.13%, 6/15/12 | | | | 4,680 | | 5,016 | |
Caterpillar Financial Services Corp. | | | | | | | |
3.63%, 11/15/07 | | | | 1,090 | | 1,079 | |
5.43%, 8/20/07 | | | | (h)4,545 | | 4,547 | |
Clorox Co. | | | | | | | |
5.48%, 12/14/07 | | | | (h)5,160 | | 5,164 | |
Comcast Cable Communications, Inc. | | | | | | | |
6.75%, 1/30/11 | | | | 2,515 | | 2,651 | |
7.13%, 6/15/13 | | | | 1,000 | | 1,085 | |
ConAgra Foods, Inc. | | | | | | | |
7.00%, 10/1/28 | | | | 1,505 | | 1,607 | |
8.25%, 9/15/30 | | | | 1,920 | | 2,344 | |
Consumers Energy Co. | | | | | | | |
4.00%, 5/15/10 | | | | 1,410 | | 1,362 | |
4.80%, 2/17/09 | | | | 2,100 | | 2,082 | |
Cooper Industries, Inc. | | | | | | | |
5.25%, 7/1/07 | | | | 30 | | 30 | |
5.25%, 11/15/12 | | | | 3,490 | | 3,487 | |
CVS/Caremark Corp. | | | | | | | |
5.75%, 8/15/11 | | | | 1,130 | | 1,152 | |
6.04%, 12/10/28 | | | | (e)6,362 | | 6,455 | |
DaimlerChrysler N.A. Holding Corp. | | | | | | | |
7.20%, 9/1/09 | | | | 25 | | 26 | |
8.50%, 1/18/31 | | | | (c)2,320 | | 2,906 | |
Delhaize America, Inc. | | | | | | | |
9.00%, 4/15/31 | | | | 2,790 | | 3,366 | |
Echostar DBS Corp. | | | | | | | |
6.38%, 10/1/11 | | | | 4,850 | | 4,892 | |
6.63%, 10/1/14 | | | | 1,275 | | 1,286 | |
FBG Finance Ltd. | | | | | | | |
5.13%, 6/15/15 | | | | (e)3,825 | | 3,676 | |
FedEx Corp. | | | | | | | |
2.65%, 4/1/07 | | | | 2,565 | | 2,565 | |
Ford Motor Credit Co. | | | | | | | |
7.25%, 10/25/11 | | | | 3,985 | | 3,877 | |
France Telecom S.A. | | | | | | | |
8.50%, 3/1/31 | | | | 4,130 | | 5,383 | |
General Mills, Inc. | | | | | | | |
3.88%, 11/30/07 | | | | 20 | | 20 | |
General Motors Acceptance Corp. | | | | | | | |
6.88%, 9/15/11 | | | | $ | 13,285 | | $ | 13,310 | |
Hewlett Packard Co. | | | | | | | |
5.48%, 5/22/09 | | | | (h)3,825 | | 3,830 | |
Home Depot, Inc. | | | | | | | |
5.47%, 12/16/09 | | | | (h)2,365 | | 2,369 | |
Hospira, Inc. | | | | | | | |
5.83%, 3/30/10 | | | | (h)5,425 | | 5,441 | |
Hyatt Equities LLC | | | | | | | |
6.88%, 6/15/07 | | | | (e)3,370 | | 3,376 | |
ICI Wilmington, Inc. | | | | | | | |
4.38%, 12/1/08 | | | | 2,040 | | 2,011 | |
Interpublic Group of Cos., Inc. | | | | | | | |
6.25%, 11/15/14 | | | | 2,365 | | 2,235 | |
LG Electronics, Inc. | | | | | | | |
5.00%, 6/17/10 | | | | (e)2,765 | | 2,728 | |
May Department Stores Co. (The) | | | | | | | |
6.70%, 7/15/34 | | | | 3,770 | | 3,730 | |
Miller Brewing Co. | | | | | | | |
4.25%, 8/15/08 | | | | (e)3,885 | | 3,827 | |
Mohawk Industries, Inc. | | | | | | | |
7.20%, 4/15/12 | | | | 2,590 | | 2,747 | |
Norfolk Southern Corp. | | | | | | | |
7.35%, 5/15/07 | | | | 2,390 | | 2,394 | |
Pilgrim’s Pride Corp. | | | | | | | |
7.63%, 5/1/15 | | | | 2,540 | | 2,546 | |
9.63%, 9/15/11 | | | | (c)1,240 | | 1,296 | |
Sara Lee Corp. | | | | | | | |
6.13%, 11/1/32 | | | | 4,150 | | 3,848 | |
SBC Communications, Inc. | | | | | | | |
6.15%, 9/15/34 | | | | 3,110 | | 3,071 | |
Sprint Capital Corp. | | | | | | | |
8.75%, 3/15/32 | | | | 845 | | 999 | |
Starwood Hotels & Resorts Worldwide, Inc. | | | | | | | |
7.38%, 5/1/07 | | | | 1,740 | | 1,742 | |
Systems 2001 Asset Trust LLC | | | | | | | |
6.66%, 9/15/13 | | | | (e)5,459 | | 5,758 | |
Telecom Italia Capital S.A. | | | | | | | |
4.00%, 11/15/08 | | | | 5 | | 5 | |
4.00%, 1/15/10 | | | | 5,340 | | 5,162 | |
Telefonica Europe BV | | | | | | | |
8.25%, 9/15/30 | | | | 4,380 | | 5,262 | |
Time Warner, Inc. | | | | | | | |
5.59%, 11/13/09 | | | | (h)7,390 | | 7,407 | |
Union Pacific Corp. | | | | | | | |
6.63%, 2/1/08 | | | | 1,225 | | 1,238 | |
6.79%, 11/9/07 | | | | 1,020 | | 1,027 | |
Verizon New England, Inc. | | | | | | | |
6.50%, 9/15/11 | | | | 2,100 | | 2,192 | |
Viacom, Inc. | | | | | | | |
6.88%, 4/30/36 | | | | 3,720 | | 3,762 | |
WellPoint, Inc. | | | | | | | |
3.75%, 12/14/07 | | | | 1,010 | | 999 | |
The accompanying notes are an integral part of the financial statements.
39
2007 Semi-Annual Report |
|
March 31, 2007 (unaudited) |
Portfolio of Investments (cont’d)
Core Plus Fixed Income Portfolio
| | | | Face | | | |
| | | | Amount | | Value | |
| | | | (000) | | (000) | |
Industrials (cont’d) | | | | | | | |
Yum! Brands, Inc. | | | | | | | |
8.88%, 4/15/11 | | | | $ | 2,390 | | $ | 2,686 | |
| | | | | | 173,506 | |
Mortgages - Other (30.1%) | | | | | | | |
American Express Co. | | | | | | | |
9.63%, 12/1/12 | | | | (d)(k)24 | | 24 | |
American Home Mortgage Assets | | | | | | | |
5.45%, 3/25/47 | | | | (h)15,625 | | 15,599 | |
5.51%, 10/25/46 | | | | (h)22,419 | | 22,461 | |
5.55%, 5/25/46 - 9/25/46 | | | | (h)25,104 | | 25,163 | |
American Home Mortgage Investment Trust | | | | | | | |
5.51%, 4/25/37 | | | | (h)13,000 | | 12,996 | |
American Housing Trust | | | | | | | |
9.55%, 9/25/20 | | | | 32 | | 31 | |
Asset Securitization Corp. | | | | | | | |
7.10%, 8/13/29 | | | | 3 | | 3 | |
Banc of America Funding Corp. | | | | | | | |
5.67%, 9/20/35 | | | | (h)5,745 | | 5,768 | |
Bear Stearns Mortgage Funding Trust | | | | | | | |
5.49%, 3/25/37 | | | | (h)10,194 | | 10,194 | |
5.52%, 9/25/36 | | | | (h)98 | | 98 | |
5.53%, 12/25/36 | | | | (h)17,779 | | 17,804 | |
5.57%, 7/25/36 | | | | (h)12,678 | | 12,663 | |
Bear Stearns Structured Products | | | | | | | |
6.50%, 3/25/36 - 5/27/36 | | | | (e)5,050 | | 4,836 | |
Countrywide Alternative Loan Trust | | | | | | | |
5.47%, 5/20/46 | | | | (h)86 | | 86 | |
5.49%, 5/25/47 | | | | (h)18,475 | | 18,475 | |
5.51%, 10/25/46 | | | | (h)18,932 | | 18,894 | |
5.55%, 7/25/46 | | | | (h)14,176 | | 14,224 | |
5.58%, 11/20/35 | | | | (h)5,934 | | 5,941 | |
5.59%, 5/20/46 - 7/25/46 | | | | (h)15,785 | | 15,861 | |
5.61%, 11/20/35 | | | | (h)5,830 | | 5,837 | |
6.68%, 2/25/36 | | | | (h)90 | | 91 | |
Countrywide Home Loan Mortgage Pass Through Trust | | | | | | | |
5.59%, 4/25/46 | | | | (h)9,580 | | 9,609 | |
5.62%, 4/25/46 | | | | (h)89 | | 90 | |
Deutsche ALT-A Securities, Inc., Alternate Loan Trust | | | | | | | |
5.47%, 2/25/47 | | | | (h)20,766 | | 20,766 | |
Deutsche ALT-A Securities NIM Trust | | | | | | | |
6.75%, 2/25/47 | | | | (e)5,305 | | 5,287 | |
Downey Savings & Loan Association Mortgage Loan Trust | | | | | | | |
5.52%, 10/19/36 | | | | (h)16,035 | | 16,076 | |
5.92%, 4/19/46 | | | | (h)10,830 | | 10,840 | |
Federal Home Loan Mortgage Corp., | | | | | | | |
5.59%, 10/1/36 | | | | 14,697 | | 14,829 | |
PAC | | | | | | | |
9.50%, 4/15/20 | | | | 3 | | 3 | |
Federal National Mortgage Association,
Conventional Pools: | | | | | | | |
7.00%, 9/25/32 | | | | 3,637 | | 3,774 | |
Greenpoint Mortgage Funding Trust | | | | | | | |
5.50%, 5/25/47 | | | | $ | 14,000 | | $ | 14,000 | |
5.64%, 3/25/36 | | | | (h)13,687 | | 13,714 | |
GSR Mortgage Loan Trust | | | | | | | |
5.51%, 8/25/46 | | | | (h)134 | | 134 | |
5.58%, 8/25/46 | | | | (h)15,799 | | 15,843 | |
Harborview Mortgage Loan Trust | | | | | | | |
5.41%, 1/19/38 | | | | (h)5,621 | | 5,629 | |
5.47%, 2/19/46 | | | | (h)12,354 | | 12,365 | |
5.50%, 11/19/36 | | | | (h)22,218 | | 22,139 | |
5.51%, 12/19/37 | | | | (h)19,174 | | 19,202 | |
5.52%, 7/21/36 - 2/19/46 | | | | (h)26,282 | | 26,260 | |
5.53%, 11/19/36 | | | | (h)17,162 | | 17,214 | |
5.55%, 7/19/46 | | | | (h)11,351 | | 11,366 | |
5.56%, 11/19/36 - 3/19/37 | | | | (h)4,364 | | 4,352 | |
5.57%, 10/19/37 | | | | (h)13,934 | | 13,970 | |
5.66%, 1/19/36 | | | | (h)64 | | 64 | |
5.70%, 11/19/35 | | | | (h)6,718 | | 6,746 | |
Harborview NIM Corp. | | | | | | | |
6.41%, 3/19/37 - 3/19/38 | | | | (e)12,496 | | 12,458 | |
Household Bank | | | | | | | |
8.24%, 7/1/08 | | | | (d)(k)@— | | @— | |
Impac CMB Trust | | | | | | | |
5.57%, 6/25/34 | | | | (h)30 | | 30 | |
Indymac Index Mortgage Loan Trust | | | | | | | |
5.42%, 2/25/37 | | | | (h)13,102 | | 13,115 | |
5.44%, 7/25/46 | | | | (h)16,843 | | 16,916 | |
5.53%, 11/25/36 | | | | (h)17,624 | | 17,654 | |
5.57%, 6/25/46 | | | | (h)106 | | 106 | |
5.60%, 7/25/35 | | | | (h)3,524 | | 3,545 | |
5.70%, 10/25/36 | | | | (h)8,565 | | 8,613 | |
Lehman XS Net Interest Margin Notes | | | | | | | |
6.25%, 6/28/46 | | | | (e)4,507 | | 4,496 | |
Luminent Mortgage Trust | | | | | | | |
5.52%, 10/25/46 | | | | (h)15,330 | | 15,372 | |
5.54%, 12/25/36 | | | | (h)19,465 | | 19,488 | |
5.56%, 4/25/36 | | | | (h)9,662 | | 9,696 | |
5.60%, 2/25/46 | | | | (h)77 | | 77 | |
Mastr Adjustable Rate Mortgages Trust | | | | | | | |
5.57%, 4/25/46 | | | | (h)70 | | 70 | |
Merrill Lynch Mortgage Investors, Inc. | | | | | | | |
5.44%, 8/25/35 | | | | (h)3,722 | | 3,726 | |
Mid-State Trust | | | | | | | |
8.33%, 4/1/30 | | | | 82 | | 87 | |
Mortgage Equity Conversion Asset Trust | | | | | | | |
5.46%, 2/25/42 | | | | (h)12,000 | | 12,000 | |
Pelican Homestead Savings Association | | | | | | | |
9.36%, 10/1/07 | | | | (d)(k)23 | | 23 | |
Residential Accredit Loans, Inc. | | | | | | | |
5.46%, 2/25/37 | | | | (h)13,325 | | 13,321 | |
5.48%, 2/25/37 - 3/25/47 | | | | (h)40,755 | | 40,739 | |
5.51%, 12/25/36 | | | | (h)14,744 | | 14,823 | |
5.55%, 6/25/46 | | | | (h)115 | | 115 | |
5.58%, 2/25/46 | | | | (h)5,470 | | 5,477 | |
5.59%, 2/25/46 | | | | (h)4,457 | | 4,459 | |
The accompanying notes are an integral part of the financial statements.
40
2007 Semi-Annual Report |
|
March 31, 2007 (unaudited) |
Portfolio of Investments (cont’d)
Core Plus Fixed Income Portfolio
| | | | Face | | | |
| | | | Amount | | Value | |
| | | | (000) | | (000) | |
Mortgages - Other (cont’d) | | | | | | | |
Ryland Acceptance Corp. IV | | | | | | | |
6.65%, 7/1/11 | | | | $ | 347 | | $ | 346 | |
Structured Adjustable Rate Mortgage Loan Trust | | | | | | | |
5.62%, 9/25/34 | | | | (h)1,586 | | 1,590 | |
Structured Asset Mortgage Investments, Inc. | | | | | | | |
5.51%, 2/25/36 | | | | (h)7,492 | | 7,508 | |
5.52%, 10/25/36 | | | | (h)95 | | 96 | |
5.55%, 8/25/36 | | | | (h)12,506 | | 12,548 | |
5.58%, 5/25/36 | | | | (h)7,130 | | 7,154 | |
5.59%, 4/25/36 | | | | (h)18,134 | | 18,219 | |
Wamu Alternative Mortgage Pass-Through Certificates | | | | | | | |
4.98%, 8/25/46 | | | | (h)11,606 | | 11,627 | |
5.51%, 7/25/46 | | | | (h)66 | | 66 | |
5.52%, 12/25/46 | | | | (h)11,944 | | 11,938 | |
5.92%, 4/25/46 - 5/25/46 | | | | (h)21,146 | | 21,167 | |
Washington Mutual, Inc. | | | | | | | |
5.40%, 6/25/46 | | | | (h)67 | | 67 | |
5.57%, 11/25/45 - 12/25/45 | | | | (h)14,483 | | 14,513 | |
5.58%, 7/25/44 - 10/25/45 | | | | (h)5,246 | | 5,258 | |
5.59%, 4/25/45 | | | | (h)63 | | 63 | |
5.61%, 8/25/45 | | | | (h)2,429 | | 2,432 | |
5.68%, 7/25/45 | | | | (h)43 | | 44 | |
Zuni Mortgage Loan Trust | | | | | | | |
5.45%, 8/25/36 | | | | (h)10,289 | | 10,285 | |
| | | | | | 812,648 | |
Sovereign (1.5%) | | | | | | | |
Citigroup, Inc. | | | | | | | |
Zero Coupon, 7/17/08 | | | | 2,560 | | 3,033 | |
Government of Argentina | | | | | | | |
5.83%, 12/31/33 | | | �� | 9,855 | | 4,730 | |
Government of Japan | | | | | | | |
0.30%, 3/20/08 | | | | JPY | 3,045,000 | | 25,761 | |
United Mexican States | | | | | | | |
9.50%, 12/18/14 | | | | MXN | 75,635 | | 7,632 | |
| | | | | | 41,156 | |
U.S. Treasury Securities (11.2%) | | | | | | | |
U.S. Treasury Bonds | | | | | | | |
5.50%, 8/15/28 | | | | $ | (c)75 | | 81 | |
6.13%, 8/15/29 | | | | (c)64,745 | | 75,322 | |
6.38%, 8/15/27 | | | | (c)16,140 | | 19,121 | |
7.63%, 2/15/25 | | | | (c)655 | | 863 | |
8.13%, 8/15/19 - 8/15/21 | | | | (c)46,325 | | 60,519 | |
U.S. Treasury Notes | | | | | | | |
4.00%, 2/15/14 | | | | (c)300 | | 289 | |
4.25%, 8/15/13 | | | | 1,135 | | 1,116 | |
4.25%, 11/15/13 | | | | (c)1,910 | | 1,875 | |
4.50%, 2/28/11 | | | | (c)1,075 | | 1,074 | |
U.S. Treasury Strips | | | | | | | |
IO | | | | | | | |
4.97%, 11/15/21 | | | | (c)46,300 | | 22,428 | |
5.17%, 5/15/21 | | | | (c)140,140 | | 69,588 | |
U.S. Treasury Strips | | | | | | | |
PO | | | | | | | |
5/15/21 | | | | $ | (c)100,600 | | $ | 50,161 | |
| | | | | | | 302,437 | |
Utilities (1.6%) | | | | | | | |
Arizona Public Service Co. | | | | | | | |
5.80%, 6/30/14 | | | | 3,935 | | 3,975 | |
CenterPoint Energy Resources Corp. | | | | | | | |
6.25%, 2/1/37 | | | | 1,130 | | 1,126 | |
Consolidated Natural Gas Co. | | | | | | | |
6.25%, 11/1/11 | | | | 1,760 | | 1,831 | |
Detroit Edison Co. | | | | | | | |
6.13%, 10/1/10 | | | | 2,035 | | 2,099 | |
Entergy Gulf States, Inc. | | | | | | | |
3.60%, 6/1/08 | | | | 1,705 | | 1,672 | |
5.76%, 12/1/09 | | | | (h)1,995 | | 1,994 | |
6.09%, 12/8/08 | | | | (e)(h)4,225 | | 4,237 | |
Kinder Morgan Finance | | | | | | | |
5.70%, 1/5/16 | | | | 3,970 | | 3,729 | |
| | | | | | | | | | | | |
The accompanying notes are an integral part of the financial statements.
41
2007 Semi-Annual Report | |
| |
March 31, 2007 (unaudited) | |
Portfolio of Investments (cont’d)
Core Plus Fixed Income Portfolio
NiSource Finance Corp. | | | | | | | |
5.93%, 11/23/09 | | | | (h)2,785 | | 2,790 | |
Ohio Power Corp. | | | | | | | |
6.00%, 6/1/16 | | | | 3,605 | | 3,745 | |
Plains All American Pipeline LP | | | | | | | |
6.70%, 5/15/36 | | | | (c)3,635 | | 3,732 | |
PSEG Energy Holdings LLC | | | | | | | |
8.63%, 2/15/08 | | | | (c)2,547 | | 2,607 | |
Public Service Electric & Gas Co. | | | | | | | |
5.00%, 1/1/13 | | | | 20 | | 20 | |
Sempra Energy | | | | | | | |
4.62%, 5/17/07 | | | | 2,565 | | 2,562 | |
Texas Eastern Transmission LP | | | | | | | |
7.00%, 7/15/32 | | | | 2,295 | | 2,567 | |
TXU Energy Co. LLC | | | | | | | |
7.00%, 3/15/13 | | | | 3,155 | | 3,283 | |
Wisconsin Electric Power Co. | | | | | | | |
3.50%, 12/1/07 | | | | 565 | | 558 | |
| | | | | | 42,527 | |
Total Fixed Income Securities (Cost $2,572,157) | | | | | | 2,561,948 | |
| | | | No. of | | | |
| | | | Contracts | | | |
Put Options Purchased (0.1%) | | | | | | | |
90 Day EuroDollar | | | | | | | |
6/07 @ $94.25 | | | | 6,255 | | 32 | |
6/07 @ $94.50 | | | | 854 | | 4 | |
6/07 @ $94.75 | | | | 2,057 | | 360 | |
9/07 @ $94.75 | | | | 4,585 | | 711 | |
12/07 @ $94.50 | | | | 545 | | 23 | |
12/07 @ $94.75 | | | | 11,306 | | 1,837 | |
Total Put Options Purchased (Cost $6,429) | | | | | | 2,967 | |
| | | | | | Value | |
| | | | Shares | | (000) | |
Preferred Stock (0.4%) | | | | | | | |
Mortgages -— Other (0.4%) | | | | | | | |
Home Ownership Funding Corp. | | | | | | | |
13.33% (Cost $8,817) | | | | (e)64,625 | | $ | 9,564 | |
| | | | | | | | |
| | | | Face | | | |
| | | | Amount | | | |
| | | | (000) | | | |
Short-Term Investments (19.8%) | | | | | | | |
Short-Term Debt Securities held as Collateral on Loaned Securities (10.0%) | | | | | | | |
AIG Match Funding Corp., 5.30%, 4/17/07 | | | | $ | (h)6,016 | | 6,016 | |
Alliance & Leicester plc, 5.33%, 4/10/07 | | | | (h)4,297 | | 4,297 | |
Anglo Irish Bank Corp., plc, 5.35%, 7/9/07 | | | | 2,092 | | 2,092 | |
Bancaja, 5.36%, 4/19/07 | | | | (h)2,148 | | 2,148 | |
Bank of America Corp., 5.32%, 4/2/07 | | | | (h)6,875 | | 6,875 | |
Bank of New York Co., Inc., 5.32%, 4/10/07 | | | | (h)2,148 | | 2,148 | |
Bear Stearns & Co., Inc., 5.36%, 4/16/07 | | | | (h)4,297 | | 4,297 | |
BNP Paribas plc, 5.33%, 5/21/07 | | | | (h)4,297 | | 4,297 | |
CAM US Finance S.A. Unipersonal, 5.36%, 7/3/07 | | | | (h)8,593 | | 8,593 | |
CIC, New York, | | | | | | | |
5.30%, 4/3/07 | | | | (h)3,007 | | 3,007 | |
5.34%, 4/2/07 | | | | (h)4,297 | | 4,297 | |
CIT Group Holdings, 5.37%, 7/18/07 | | | | (h)7,734 | | 7,734 | |
Credit Suisse First Boston, New York, | | | | | | | |
5.29%, 5/15/07 | | | | 2,578 | | 2,578 | |
5.32%, 4/2/07 | | | | (h)4,297 | | 4,297 | |
Deutsche Bank Securities, Inc., | | | | | | | |
5.40%, 4/2/07 | | | | 17,187 | | 17,187 | |
5.46%, 4/2/07 | | | | 41,249 | | 41,249 | |
Dexia Bank, New York, 5.32%, 4/2/07 | | | | (h)4,296 | | 4,296 | |
First Tennessee Bank, 5.33%, 4/17/07 | | | | (h)2,148 | | 2,148 | |
Gemini Securitization Corp., 5.41%, 4/2/07 | | | | 6,180 | | 6,180 | |
Goldman Sachs Group, Inc., | | | | | | | |
5.37%, 4/16/07 | | | | (h)2,148 | | 2,148 | |
5.55%, 4/2/07 | | | | (h)4,039 | | 4,039 | |
HSBC Finance Corp., 5.33%, 4/10/07 | | | | (h)2,148 | | 2,148 | |
Mane Funding Corp., 5.29%, 4/10/07 | | | | 3,078 | | 3,078 | |
Manufacturers & Traders, 5.30%, 4/16/07 | | | | (h)2,578 | | 2,578 | |
Marshall & Ilsley Bank, 5.37%, 12/17/07 | | | | 4,309 | | 4,309 | |
Merrill Lynch & Co., 5.33%, 4/26/07 | | | | (h)2,258 | | 2,258 | |
Metropolitan Life Global Funding, | | | | | | | |
5.31%, 4/23/07 | | | | (h)6,445 | | 6,445 | |
Natexis Banques Populaires, New York, | | | | | | | |
5.33%, 4/2/07 | | | | (h)4,297 | | 4,297 | |
5.34%, 4/2/07 | | | | (h)4,297 | | 4,297 | |
National Australia Bank Ltd., 5.31%, 4/10/07 | | | | (h)3,266 | | 3,266 | |
National City Bank Cleveland, 5.32%, 4/2/07 | | | | (h)2,148 | | 2,148 | |
National Rural Utilities Cooperative Finance Corp., | | | | | | | |
5.31%, 4/2/07 | | | | (h)8,594 | | 8,594 | |
Nationwide Building Society, 5.43%, 6/28/07 | | | | (h)4,984 | | 4,984 | |
Nordea Bank, New York, 5.31%, 4/2/07 | | | | (h)6,445 | | 6,445 | |
Raiffeisen Zentralbank Oesterreich, | | | | | | | |
5.31%, 6/19/07 | | | | 2,544 | | 2,544 | |
Rheingold Securitization, 5.32%, 5/15/07 | | | | 3,817 | | 3,817 | |
Sedna Finance, Inc., 5.32%, 5/15/07 | | | | 1,103 | | 1,103 | |
Skandi, New York, 5.32%, 4/10/07 | | | | (h)4,297 | | 4,297 | |
Toronto Dominion, New York, 5.32%, 5/29/07 | | | | (h)4,297 | | 4,297 | |
Tulip Funding Corp., 5.36%, 4/30/07 | | | | $ | 8,554 | | $ | 8,554 | |
UBS Securities LLC, 5.40%, 4/2/07 | | | | 42,227 | | 42,227 | |
Unicredito Delaware, Inc., 5.32%, 4/16/07 | | | | (h)4,727 | | 4,727 | |
Unicredito Italiano Bank (Ireland) plc, | | | | | | | |
5.34%, 4/10/07 | | | | (h)3,007 | | 3,007 | |
| | | | | | 269,343 | |
Repurchase Agreement (9.6%) | | | | | | | |
J.P. Morgan Securities, Inc., 5.28%, dated 3/30/07, due 4/2/07, repurchase price $259,884 | | | | (f)259,770 | | 259,770 | |
U.S. Treasury Security (0.2%) | | | | | | | |
U. S. Treasury Bill | | | | | | | |
4.98%, 7/12/07 | | | | (j)5,580 | | 5,504 | |
Total Short-Term Investments (Cost $534,615) | | | | | | 534,617 | |
Total Investments (115.0%) (Cost $3,122,018) — | | | | | | | |
Including $287,205 of Securities Loaned | | | | | | 3,109,096 | |
Liabilities in Excess of Other Assets (-15.0%) | | | | | | (404,442 | ) |
Net Assets (100%) | | | | | | $ | 2,704,654 | |
| | | | | | | | | | |
(c) | All or a portion of security on loan at March 31, 2007. |
(d) | Security was valued at fair value — At March 31, 2007,the Portfolio held $47,000 of fair valued securities, representing less than 0.05% of net assets. |
(e) | 144A security — Certain conditions for public sale may exist. Unless otherwise noted, these securities are deemed to be liquid. |
(f) | Represents the Portfolio’s undivided interest in a joint repurchase agreement which has a total value of $1,580,364,000. The repurchase agreement was fully collateralized by U.S. government agency securities at the date of this Portfolio of Investments as follows: Federal Farm Credit Bank, 0.00% to 7.43%, due 5/7/07 to 3/2/21; Federal Home Loan Bank, 0.00% to 6.42%, due 4/2/07 to 3/9/26; Federal Home Loan Mortgage Corp., 0.00% to 7.00%, due 4/2/07 to 3/15/31; Federal National Mortgage Association, 0.00% to 7.13%, due 4/5/07 to 3/17/31; Tennessee Valley Authority, 4.88%, due 12/15/16, which had a total value of $1,611,974,119. The investment in the repurchase agreement is through participation in a joint account with affiliated parties pursuant to exemptive relief received by the Portfolio from the SEC. |
(h) | Variable/Floating Rate Security — Interest rate changes on these instruments are based on changes in a designated base rate. The rates shown are those in effect on March 31, 2007. |
(i) | Security is subject to delayed delivery. |
(j) | All or a portion of the security was pledged to cover margin requirements for futures contracts. |
(k) | Security has been deemed illiquid at March 31, 2007. |
(o) | Perpetual — Security does not have a predetermined maturity date.Rates for these securities are fixed for a period of time then revert to afloating rate. The interest rate shown is the rate in effect at March 31, 2007. |
@ | Face Amount/Value is less than $500. |
Inv Fl | Inverse Floating Rate — Interest rate fluctuates with an inverse relationship to an associated interest rate. Indicated rate is the effective rate at March 31, 2007. |
IO | Interest Only |
JPY | Japanese Yen |
MXN | Mexican Peso |
PAC | Planned Amortization Class |
The accompanying notes are an integral part of the financial statements.
42
2007 Semi-Annual Report |
|
March 31, 2007 (unaudited) |
Portfolio of Investments (cont’d)
Core Plus Fixed Income Portfolio
PO | Principal Only |
REMIC | Real Estate Mortgage Investment Conduit |
TBA | To Be Announced |
Foreign Currency Exchange Contract Information:
The Portfolio had the following foreign currency exchange contract(s) open at period end:
| | | | | | | | | | Net | |
Currency | | | | | | In | | | | Unrealized | |
to | | | | | | Exchange | | | | Appreciation | |
Deliver | | Value | | Settlement | | For | | Value | | (Depreciation) | |
(000) | | (000) | | Date | | (000) | | (000) | | (000) | |
EUR | 19,754 | | $ | 26,432 | | 5/14/07 | | USD | 25,758 | | $ | 25,758 | | $ | (674 | ) |
| | | | | | | | | | | | | | | | |
EUR | Euro |
USD | United States Dollar |
Futures Contracts:
The Portfolio had the following futures contract(s) open at period end:
| | | | | | | | Net | |
| | | | | | | | Unrealized | |
| | Number | | | | | | Appreciation | |
| | of | | Value | | Expiration | | (Depreciation) | |
| | Contracts | | (000) | | Date | | (000) | |
Long: | | | | | | | | | |
U.S. Treasury 10 yr. Note | | 8,281 | | $ | 895,383 | | Jun-07 | | $ | 1,705 | |
U.S. Treasury 5 yr. Note | | 3,841 | | 406,366 | | Jun-07 | | (250 | ) |
U.S. Treasury 2 yr. Note | | 3,050 | | 624,916 | | Jun-07 | | (1,170 | ) |
Short: | | | | | | | | | |
U.S. Treasury Bond | | 2,067 | | 229,954 | | Jun-07 | | 299 | |
| | | | | | | | $ | 584 | |
| | | | | | | | | | | |
Graphic Presentation of Portfolio Holdings
The following graph depicts the Portfolio’s holdings by industry and/or investment type, as a percentage of total investments.

* Industries and/or investment types which do not appear in the above graph, as well as those which represent less than 5% of total investments, if applicable, are included in the category labeled “Other”.
The accompanying notes are an integral part of the financial statements.
43
2007 Semi-Annual Report |
| |
March 31, 2007 (unaudited) |
Portfolio of Investments
High Yield Portfolio
| | | | Face | | | |
| | | | Amount | | Value | |
| | | | (000) | | (000) | |
Fixed Income Securities (92.2%) | | | | | | | |
Aerospace (2.0%) | | | | | | | |
Hexcel Corp. | | | | | | | |
6.75%, 2/1/15 | | | | $ | (c)1,655 | | $ | 1,643 | |
K&F Acquisition, Inc. | | | | | | | |
7.75%, 11/15/14 | | | | 2,400 | | 2,562 | |
| | | | | | 4,205 | |
Broadcasting (0.4%) | | | | | | | |
Univision Communications, Inc. PIK | | | | | | | |
9.75%, 3/15/15 | | | | (c)(e)945 | | 946 | |
Cable (4.0%) | | | | | | | |
Cablecom Luxembourg SCA | | | | | | | |
9.38%, 4/15/14 | | | | EUR | (e)900 | | 1,319 | |
Cablevision Systems Corp. | | | | | | | |
9.87%, 4/1/09 | | | | $ | (h)1,930 | | 2,055 | |
CCH I LLC | | | | | | | |
11.00%, 10/1/15 | | | | 652 | | 680 | |
Echostar DBS Corp. | | | | | | | |
6.38%, 10/1/11 | | | | 1,115 | | 1,125 | |
Intelsat Bermuda Ltd. | | | | | | | |
8.87%, 1/15/15 | | | | (e)(h)305 | | 313 | |
Intelsat Subsidiary Holding Co., Ltd. | | | | | | | |
8.63%, 1/15/15 | | | | (c)2,045 | | 2,198 | |
Virgin Media Finance plc | | | | | | | |
8.75%, 4/15/14 | | | | 230 | | 240 | |
9.13%, 8/15/16 | | | | 145 | | 154 | |
PanAmSat Corp. | | | | | | | |
9.00%, 8/15/14 | | | | 307 | | 334 | |
| | | | | | 8,418 | |
Chemicals (7.7%) | | | | | | | |
Berry Plastics Holding Corp. | | | | | | | |
8.88%, 9/15/14 | | | | (c)2,055 | | 2,112 | |
Cognis Deutschland GmbH & Co. KG | | | | | | | |
8.48%, 11/15/13 | | | | EUR | (e)(h)915 | | 1,241 | |
Equistar Chemicals LP | | | | | | | |
10.13%, 9/1/08 | | | | $ | 2,055 | | 2,173 | |
Innophos, Inc. | | | | | | | |
8.88%, 8/15/14 | | | | (c)1,050 | | 1,092 | |
Innophos Investments Holdings, Inc. PIK | | | | | | | |
13.37%, 2/15/15 | | | | (h)502 | | 527 | |
Koppers, Inc. | | | | | | | |
9.88%, 10/15/13 | | | | 490 | | 534 | |
Koppers Industry, Inc. | | | | | | | |
Zero Coupon, 11/15/14 | | | | (c)(g)1,155 | | 978 | |
Millennium America, Inc. | | | | | | | |
9.25%, 6/15/08 | | | | 1,294 | | 1,349 | |
Nalco Co. | | | | | | | |
7.75%, 11/15/11 | | | | (c)975 | | 1,004 | |
8.88%, 11/15/13 | | | | (c)1,375 | | 1,468 | |
Rockwood Specialties Group, Inc. | | | | | | | |
7.63%, 11/15/14 | | | | EUR | 700 | | 977 | |
10.63%, 5/15/11 | | | | $ | 645 | | 684 | |
Terra Capital, Inc. | | | | | | | |
7.00%, 2/1/17 | | | | $ | (c)(e)1,080 | | $ | 1,080 | |
Westlake Chemical Corp. | | | | | | | |
6.63%, 1/15/16 | | | | (c)1,130 | | 1,107 | |
| | | | | | 16,326 | |
Collateralized Mortgage Obligations — Non Agency Collateral Series (1.7%) | | | | | | | |
Bear Stearns Structured Products, Inc. | | | | | | | |
1.00%, 3/27/36 | | | | (e)23,815 | | 899 | |
1.91%, 7/27/36 | | | | (e)18,107 | | 717 | |
6.00%, 4/25/37 | | | | (e)18,450 | | 719 | |
IO | | | | | | | |
1.27%, 2/27/36 | | | | (e)17,384 | | 524 | |
Countrywide Alternative Loan Trust | | | | | | | |
1.83%, 2/25/47 | | | | (e)14,170 | | 772 | |
| | | | | | 3,631 | |
Consumer Products (2.5%) | | | | | | | |
Jarden Corp. | | | | | | | |
7.50%, 5/1/17 | | | | (c)1,310 | | 1,330 | |
Levi Strauss & Co. | | | | | | | |
10.11%, 4/1/12 | | | | (c)(h)2,820 | | 2,876 | |
Oxford Industries, Inc. | | | | | | | |
8.88%, 6/1/11 | | | | 1,145 | | 1,191 | |
| | | | | | 5,397 | |
Diversified Media (3.4%) | | | | | | | |
Advanstar Communications, Inc. | | | | | | | |
10.75%, 8/15/10 | | | | 515 | | 560 | |
CanWest Media, Inc. | | | | | | | |
8.00%, 9/15/12 | | | | (c)2,052 | | 2,134 | |
Dex Media East LLC/Dex Media East Finance Co. | | | | | | | |
12.13%, 11/15/12 | | | | 872 | | 956 | |
Dex Media West LLC/Dex Media Finance Co. | | | | | | | |
9.88%, 8/15/13 | | | | 1,030 | | 1,129 | |
Idearc, Inc. | | | | | | | |
8.00%, 11/15/16 | | | | (e)400 | | 414 | |
Interpublic Group of Companies, Inc. | | | | | | | |
6.25%, 11/15/14 | | | | 750 | | 709 | |
Valassis Communications, Inc. | | | | | | | |
8.25%, 3/1/15 | | | | (c)(e)1,410 | | 1,392 | |
| | | | | | 7,294 | |
Energy (11.7%) | | | | | | | |
Chaparral Energy, Inc. | | | | | | | |
8.50%, 12/1/15 | | | | 1,735 | | 1,722 | |
8.88%, 2/1/17 | | | | (c)(e)240 | | 242 | |
CHC Helicopter Corp. | | | | | | | |
7.38%, 5/1/14 | | | | 2,455 | | 2,400 | |
Chesapeake Energy Corp. | | | | | | | |
6.63%, 1/15/16 | | | | 1,025 | | 1,038 | |
7.50%, 9/15/13 | | | | (c)1,090 | | 1,145 | |
CIE Generale De Geophysique | | | | | | | |
7.50%, 5/15/15 | | | | (c)760 | | 787 | |
El Paso Production Holding Co. | | | | | | | |
7.75%, 6/1/13 | | | | 1,760 | | 1,848 | |
| | | | | | | | | | | | |
The accompanying notes are an integral part of the financial statements.
44
2007 Semi-Annual Report | |
| |
March 31, 2007 (unaudited) | |
Portfolio of Investments (cont’d)
High Yield Portfolio
| | | | Face | | | |
| | | | Amount | | Value | |
| | | | (000) | | (000) | |
Energy (cont’d) | | | | | | | |
Hanover Compressor Co. | | | | | | | |
8.63%, 12/15/10 | | | | $ | 45 | | $ | 47 | |
9.00%, 6/1/14 | | | | 450 | | 489 | |
Hanover Equipment Trust | | | | | | | |
8.50%, 9/1/08 | | | | 972 | | 982 | |
Hilcorp Energy I LP/Hilcorp Finance Co. | | | | | | | |
7.75%, 11/1/15 | | | | (e)2,275 | | 2,247 | |
Husky Oil Co. | | | | | | | |
8.90%, 8/15/28 | | | | (h)1,530 | | 1,600 | |
Kinder Morgan Finance Co. ULC | | | | | | | |
5.70%, 1/5/16 | | | | 1,900 | | 1,784 | |
Magnum Hunter Resources, Inc. | | | | | | | |
9.60%, 3/15/12 | | | | 933 | | 980 | |
Massey Energy Co. | | | | | | | |
6.88%, 12/15/13 | | | | 2,205 | | 2,103 | |
OPTI Canada, Inc. | | | | | | | |
8.25%, 12/15/14 | | | | (e)1,425 | | 1,489 | |
Pacific Energy Partners LP/Pacific Energy Finance Corp. | | | | | | | |
7.13%, 6/15/14 | | | | 1,415 | | 1,479 | |
Pogo Producing Co. | | | | | | | |
6.88%, 10/1/17 | | | | (c)1,440 | | 1,411 | |
Sandridge Energy Debt Conversion Note | | | | | | | |
8.63%, 4/1/15 | | | | 970 | | 987 | |
| | | | | | 24,780 | |
Financial (0.8%) | | | | | | | |
Residential Accredit Loans, Inc. | | | | | | | |
Zero Coupon, 4/25/47 | | | | (e)6,750 | | 388 | |
Residential Capital Corp. | | | | | | | |
6.38%, 6/30/10 | | | | 1,270 | | 1,271 | |
| | | | | | 1,659 | |
Food & Drug (1.3%) | | | | | | | |
CA FM Lease Trust | | | | | | | |
8.50%, 7/15/17 | | | | (e)1,053 | | 1,137 | |
Delhaize America, Inc. | | | | | | | |
9.00%, 4/15/31 | | | | 445 | | 537 | |
8.13%, 4/15/11 | | | | 965 | | 1,060 | |
| | | | | | 2,734 | |
Food & Tobacco (4.1%) | | | | | | | |
Michael Foods, Inc. | | | | | | | |
8.00%, 11/15/13 | | | | 1,170 | | 1,193 | |
Pilgrim’s Pride Corp. | | | | | | | |
7.63%, 5/1/15 | | | | 1,670 | | 1,674 | |
9.63%, 9/15/11 | | | | 2,475 | | 2,586 | |
Reynolds American, Inc. | | | | | | | |
6.50%, 7/15/10 | | | | 1,045 | | 1,077 | |
Smithfield Foods, Inc. | | | | | | | |
7.00%, 8/1/11 | | | | 160 | | 163 | |
7.75%, 5/15/13 | | | | (c)1,000 | | 1,038 | |
8.00%, 10/15/09 | | | | 885 | | 927 | |
| | | | | | 8,658 | |
Forest Products (5.1%) | | | | | | | |
Crown Americas LLC and Crown Americas Capital Corp. | | | | | | | |
7.63%, 11/15/13 | | | | $ | 965 | | $ | 998 | |
Crown European Holdings S.A. | | | | | | | |
6.25%, 9/1/11 | | | | EUR | 520 | | 719 | |
Glatfelter | | | | | | | |
7.13%, 5/1/16 | | | | $ | 205 | | 209 | |
Graham Packaging Co., Inc. | | | | | | | |
8.50%, 10/15/12 | | | | (c)615 | | 627 | |
Graphic Packaging International Corp. | | | | | | | |
9.50%, 8/15/13 | | | | (c)1,745 | | 1,865 | |
Owens-Illinois, Inc. | | | | | | | |
7.50%, 5/15/10 | | | | (c)3,030 | | 3,091 | |
7.35%, 5/15/08 | | | | 60 | | 61 | |
Packaging Corp. Of America | | | | | | | |
4.38%, 8/1/08 | | | | 2,500 | | 2,461 | |
Smurfit Kappa Group | | | | | | | |
10.13%, 10/1/12 | | | | EUR | 480 | | 695 | |
| | | | | | 10,726 | |
Gaming & Leisure (4.7%) | | | | | | | |
Isle of Capri Casinos, Inc. | | | | | | | |
7.00%, 3/1/14 | | | | $ | 2,465 | | 2,428 | |
Las Vegas Sands Corp. | | | | | | | |
6.38%, 2/15/15 | | | | (c)1,340 | | 1,286 | |
MGM Mirage | | | | | | | |
6.00%, 10/1/09 | | | | 3,375 | | 3,396 | |
Station Casinos, Inc. | | | | | | | |
6.00%, 4/1/12 | | | | 970 | | 945 | |
6.88%, 3/1/16 | | | | 1,580 | | 1,456 | |
7.75%, 8/15/16 | | | | 365 | | 376 | |
| | | | | | 9,887 | |
Health Care (8.2%) | | | | | | | |
Community Health Systems, Inc. | | | | | | | |
6.50%, 12/15/12 | | | | 1,160 | | 1,201 | |
DaVita, Inc. | | | | | | | |
6.63%, 3/15/13 | | | | (c)1,170 | | 1,176 | |
Fisher Scientific International, Inc. | | | | | | | |
6.13%, 7/1/15 | | | | 2,450 | | 2,459 | |
Fresenius Medical Care Capital Trust II | | | | | | | |
7.88%, 2/1/08 | | | | 1,361 | | 1,381 | |
Fresenius Medical Care Capital Trust IV | | | | | | | |
7.88%, 6/15/11 | | | | 1,095 | | 1,155 | |
Fresenius Medical Care Capital Trust V | | | | | | | |
7.38%, 6/15/11 | | | | EUR | 450 | | 654 | |
HCA, Inc. | | | | | | | |
5.75%, 3/15/14 | | | | $ | 625 | | 535 | |
6.25%, 2/15/13 | | | | (c)1,570 | | 1,431 | |
6.30%, 10/1/12 | | | | (c)645 | | 605 | |
6.50%, 2/15/16 | | | | (c)1,250 | | 1,070 | |
Ivacare Corp. | | | | | | | |
9.75%, 2/15/15 | | | | (e)235 | | 237 | |
National Mentor Holdings, Inc. | | | | | | | |
11.25%, 7/1/14 | | | | 975 | | 1,070 | |
| | | | | | | | | | |
The accompanying notes are an integral part of the financial statements.
45
2007 Semi-Annual Report | |
| |
March 31, 2007 (unaudited) | |
Portfolio of Investments (cont’d)
High Yield Portfolio
| | | | Face | | | |
| | | | Amount | | Value | |
| | | | (000) | | (000) | |
Health Care (cont’d) | | | | | | | |
Omnicare, Inc. | | | | | | | |
6.75%, 12/15/13 | | | | $ | 880 | | $ | 888 | |
Sun Healthcare Group, Inc. | | | | | | | |
9.13%, 4/15/15 | | | | (e)775 | | 798 | |
Tenet Healthcare Corp. | | | | | | | |
7.38%, 2/1/13 | | | | 670 | | 626 | |
9.88%, 7/1/14 | | | | (c)425 | | 431 | |
VWR International, Inc. | | | | | | | |
6.88%, 4/15/12 | | | | 1,740 | | 1,766 | |
| | | | | | 17,483 | |
Housing (1.0%) | | | | | | | |
Goodman Global Holding Co., Inc. | | | | | | | |
8.36%, 6/15/12 | | | | (h)441 | | 445 | |
Nortek, Inc. | | | | | | | |
8.50%, 9/1/14 | | | | (c)1,780 | | 1,740 | |
| | | | | | 2,185 | |
Information Technology (3.1%) | | | | | | | |
Freescale Semiconductor, Inc. | | | | | | | |
10.13%, 12/15/16 | | | | (c)(e)1,650 | | 1,662 | |
Iron Mountain, Inc. | | | | | | | |
7.75%, 1/15/15 | | | | 790 | | 810 | |
8.63%, 4/1/13 | | | | 2,085 | | 2,156 | |
PGS Solutions, Inc. | | | | | | | |
9.63%, 2/15/15 | | | | (e)775 | | 785 | |
SunGard Data Systems, Inc. | | | | | | | |
9.13%, 8/15/13 | | | | (c)990 | | 1,067 | |
| | | | | | 6,480 | |
Manufacturing (2.3%) | | | | | | | |
Baldor Electric Co. | | | | | | | |
8.63%, 2/15/17 | | | | 560 | | 595 | |
JohnsonDiversey, Inc. | | | | | | | |
9.63%, 5/15/12 | | | | (c)2,095 | | 2,200 | |
9.63%, 5/15/12 | | | | EUR | 55 | | 77 | |
Propex Fabrics, Inc. | | | | | | | |
10.00%, 12/1/12 | | | | $ | 1,210 | | 1,062 | |
RBS Global, Inc., and Rexnord Corp. | | | | | | | |
8.88%, 9/1/16 | | | | (c)(e)1,000 | | 1,015 | |
| | | | | | 4,949 | |
Metals (0.8%) | | | | | | | |
Foundation PA Coal Co. | | | | | | | |
7.25%, 8/1/14 | | | | (c)575 | | 585 | |
GrafTech Finance, Inc. | | | | | | | |
10.25%, 2/15/12 | | | | 1,031 | | 1,088 | |
| | | | | | 1,673 | |
Retail (1.3%) | | | | | | | |
Brown Shoe Co., Inc. | | | | | | | |
8.75%, 5/1/12 | | | | 1,145 | | 1,219 | |
Phillips - Van Heusen | | | | | | | |
7.25%, 2/15/11 | | | | (c)1,400 | | 1,439 | |
| | | | | | 2,658 | |
Services (0.4%) | | | | | | | |
Aramark Corp. | | | | | | | |
8.50%, 2/1/15 | | | | $ | (e)175 | | $ | 183 | |
8.86%, 2/1/15 | | | | (e)(h)85 | | 88 | |
Aramark Services, Inc. | | | | | | | |
5.00%, 6/1/12 | | | | 595 | | 537 | |
| | | | | | 808 | |
Sovereign (0.4%) | | | | | | | |
Mexican Bonos | | | | | | | |
9.50%, 12/18/14 | | | | MXN | 9,120 | | 920 | |
Telecommunications (3.0%) | | | | | | | |
Axtel S.A. | | | | | | | |
11.00%, 12/15/13 | | | | $ | (c)1,438 | | 1,607 | |
Esprit Telecom Group plc | | | | | | | |
10.88%, 6/15/08 | | | | (b)(d)(k)965 | | @— | |
11.00%, 6/15/08 | | | | DEM | (d)(k)2,608 | | @— | |
11.50%, 12/15/07 | | | | EUR | (d)(k)1,669 | | @— | |
11.50%, 12/15/07 | | | | $ | (b)(d)(k)600 | | @— | |
EXDS, Inc. | | | | | | | |
11.63%, 7/15/10 | | | | (b)(c)(d)(k)3,899 | | @— | |
Nordic Telephonen Co. Holdings ApS | | | | | | | |
8.88%, 5/1/16 | | | | (e)465 | | 500 | |
Qwest Communications International, Inc. | | | | | | | |
8.86%, 2/15/09 | | | | (h)1,495 | | 1,517 | |
Qwest Corp. | | | | | | | |
5.63%, 11/15/08 | | | | 355 | | 357 | |
Rhythms NetConnections, Inc. | | | | | | | |
12.75%, 4/15/09 | | | | (b)(d)(k)433 | | @— | |
13.88%, 5/15/08 | | | | (b)(d)(k)12,869 | | @— | |
14.00%, 2/15/10 | | | | (b)(d)(k)11,487 | | @— | |
TDC A/S | | | | | | | |
6.50%, 4/19/12 | | | | EUR | 380 | | 531 | |
Wind Acquisition Finance S.A. | | | | | | | |
10.75%, 12/1/15 | | | | $ | (c)(e)1,620 | | 1,863 | |
| | | | | | 6,375 | |
Transportation (10.5%) | | | | | | | |
ArvinMeritor, Inc. | | | | | | | |
8.75%, 3/1/12 | | | | 1,705 | | 1,769 | |
Asbury Automotive Group, Inc. | | | | | | | |
7.63%, 3/15/17 | | | | (e)555 | | 559 | |
Ford Motor Credit Co. | | | | | | | |
5.80%, 1/12/09 | | | | 1,340 | | 1,315 | |
7.00%, 10/1/13 | | | | (c)2,000 | | 1,862 | |
7.25%, 10/25/11 | | | | 1,475 | | 1,435 | |
General Motors Acceptance Corp. | | | | | | | |
4.38%, 12/10/07 | | | | 1,615 | | 1,595 | |
6.88%, 9/15/11 | | | | 5,285 | | 5,295 | |
6.88%, 8/28/12 | | | | 375 | | 374 | |
General Motors Corp. | | | | | | | |
7.13%, 7/15/13 | | | | (c)710 | | 666 | |
8.38%, 7/15/33 | | | | (c)1,370 | | 1,236 | |
Petro Stopping Centers LP/Petro Financial Corp. | | | | | | | |
9.00%, 2/15/12 | | | | (c)1,955 | | 2,023 | |
| | | | | | | | | | | | |
The accompanying notes are an integral part of the financial statements.
46
2007 Semi-Annual Report | |
| |
March 31, 2007 (unaudited) | |
Portfolio of Investments (cont’d)
High Yield Portfolio
| | | | Face | | | |
| | | | Amount | | Value | |
| | | | (000) | | (000) | |
Transportation (cont’d) | | | | | | | |
Sonic Automotive, Inc. | | | | | | | |
8.63%, 8/15/13 | | | | $ | 2,945 | | $ | 3,077 | |
United Auto Group, Inc. | | | | | | | |
7.75%, 12/15/16 | | | | (e)1,060 | | 1,076 | |
| | | | | | 22,282 | |
Utilities (10.4%) | | | | | | | |
AES Corp. (The) | | | | | | | |
7.75%, 3/1/14 | | | | (c)905 | | 955 | |
8.88%, 2/15/11 | | | | 243 | | 262 | |
9.00%, 5/15/15 | | | | (e)105 | | 113 | |
9.38%, 9/15/10 | | | | 396 | | 433 | |
CMS Energy Corp. | | | | | | | |
7.50%, 1/15/09 | | | | (c)2,785 | | 2,872 | |
Colorado Interstate Gas Co. | | | | | | | |
6.80%, 11/15/15 | | | | 2,880 | | 3,077 | |
Ipalco Enterprises, Inc. | | | | | | | |
8.38%, 11/14/08 | | | | 640 | | 664 | |
8.63%, 11/14/11 | | | | 730 | | 791 | |
Nevada Power Co. | | | | | | | |
8.25%, 6/1/11 | | | | 950 | | 1,049 | |
9.00%, 8/15/13 | | | | 1,045 | | 1,133 | |
Northwest Pipeline Corp. | | | | | | | |
8.13%, 3/1/10 | | | | 475 | | 497 | |
NRG Energy, Inc. | | | | | | | |
7.38%, 1/15/17 | | | | (c)1,200 | | 1,234 | |
Ormat Funding Corp. | | | | | | | |
8.25%, 12/30/20 | | | | (c)1,524 | | 1,551 | |
PSEG Energy Holdings LLC | | | | | | | |
8.63%, 2/15/08 | | | | 1,145 | | 1,172 | |
TXU Corp. | | | | | | | |
6.38%, 1/1/08 | | | | 1,000 | | 1,008 | |
Transcontinental Gas Pipe Line Corp. | | | | | | | |
6.25%, 1/15/08 | | | | 2,300 | | 2,317 | |
TXU Energy Co. LLC | | | | | | | |
7.00%, 3/15/13 | | | | 515 | | 536 | |
Williams Cos., Inc. | | | | | | | |
7.88%, 9/1/21 | | | | 2,160 | | 2,387 | |
| | | | | | 22,051 | |
Wireless Communications (1.4%) | | | | | | | |
American Tower Corp. | | | | | | | |
7.13%, 10/15/12 | | | | (c)900 | | 931 | |
7.50%, 5/1/12 | | | | 1,475 | | 1,538 | |
Rural Cellular Corp. | | | | | | | |
8.25%, 3/15/12 | | | | (c)500 | | 525 | |
| | | | | | 2,994 | |
Total Fixed Income Securities (Cost $215,189) | | | | | | 195,519 | |
| | | | | | | | | |
| | | | Shares | | | |
Common Stocks (0.0%) | | | | | | | |
Media (0.0%) | | | | | | | |
Cyprion Media Network | | | | 94,396 | | 8 | |
Telecommunications (0.0%) | | | | | | | |
Viatel Holding Bermuda Ltd. | | | | (a)7,617 | | @— | |
| | | | | | Value | |
| | | | Shares | | (000) | |
XO Holdings, Inc. | | | | $ | (a)(c)6,978 | | $ | 35 | |
| | | | | | 35 | |
Utilities (0.0%) | | | | | | | |
PNM Resources, Inc. | | | | 854 | | 28 | |
Total Common Stocks (Cost $10,801) | | | | | | 71 | |
Preferred Stocks (0.3%) | | | | | | | |
Broadcasting (0.0%) | | | | | | | |
ION Media Networks, Inc. (Convertible) PIK | | | | (e)44,555 | | 11 | |
Financial (0.3%) | | | | | | | |
Harborview NIM Corp. | | | | | | | |
Zero Coupon, 10/20/45 | | | | (e)(h)1,079 | | 689 | |
Total Preferred Stocks (Cost $699) | | | | | | 700 | |
| | | | | | | | | |
| | | | No. of | | | |
| | | | Contracts | | | |
Put Option Purchased (0.1%) | | | | | | | |
90 Day EuroDollar | | | | | | | |
9/07 @ 94.75 | | | | 438 | | 67 | |
12/07 @ 94.50 | | | | 16 | | 1 | |
12/07 @ 94.75 | | | | 411 | | 67 | |
Total Put Option Purchased (Cost $217) | | | | | | 135 | |
| | | | No. of | | | |
| | | | Warrants | | | |
Warrants (0.0%) | | | | | | | |
Telecommunications (0.0%) | | | | | | | |
XO Holdings, Inc., Series A expiring 1/16/10 | | | | (a)(c)13,962 | | 13 | |
XO Holdings, Inc., Series B expiring 1/16/10 | | | | (a)(c)10,470 | | 5 | |
XO Holdings, Inc., Series C expiring 1/16/10 | | | | (a)(c)10,471 | | 3 | |
| | | | | | 21 | |
Utilities (0.0%) | | | | | | | |
SW Acquisition LP, expiring 4/1/11 | | | | (a)(d)(e)(k)8,020 | | @— | |
| | | | | | | |
Total Warrants (Cost $26) | | | | | | 21 | |
| | | | Face | | | |
| | | | Amount | | | |
| | | | (000) | | | |
Short-Term Investments (29.6%) | | | | | | | |
Short-Term Debt Securities held as Collateral on Loaned Securities (23.2%) | | | | | | | |
AIG Match Funding Corp., 5.30%, 4/17/07 | | | | $ | (h)1,101 | | 1,101 | |
Alliance & Leicester plc, 5.33%, 4/10/07 | | | | (h)786 | | 786 | |
Anglo Irish Bank Corp., plc, 5.35%, 7/9/07 | | | | 383 | | 383 | |
Bancaja, 5.36%, 4/19/07 | | | | (h)393 | | 393 | |
Bank of America Corp., 5.32%, 4/2/07 | | | | (h)1,258 | | 1,258 | |
Bank of New York Co., Inc., 5.32%, | | | | | | | |
4/10/07 | | | | (h)393 | | 393 | |
Bear Stearns & Co., Inc., 5.36%, 4/16/07 | | | | (h)787 | | 787 | |
BNP Paribas plc, 5.33%, 5/21/07 | | | | (h)787 | | 787 | |
CAM US Finance S.A. Unipersonal, | | | | | | | |
5.36%, 7/3/07 | | | | (h)1,573 | | 1,573 | |
CIC, New York, | | | | | | | |
5.30%, 4/3/07 | | | | (h)551 | | 551 | |
5.34%, 4/2/07 | | | | (h)786 | | 786 | |
CIT Group Holdings, 5.37%, 7/18/07 | | | | (h)1,416 | | 1,416 | |
| | | | | | | | |
The accompanying notes are an integral part of the financial statements.
47
2007 Semi-Annual Report | |
| |
March 31, 2007 (unaudited) | |
Portfolio of Investments (cont’d)
High Yield Portfolio
| | | | Face | | | |
| | | | Amount | | Value | |
| | | | (000) | | (000) | |
Short-Term Debt Securities held as Collateral on Loaned Securities (cont’d) | | | | | | | |
Credit Suisse First Boston, New York, | | | | | | | |
5.29%, 5/15/07 | | | | $ | 472 | | $ | 472 | |
5.32%, 4/2/07 | | | | (h)786 | | 786 | |
Deutsche Bank Securities, Inc., | | | | | | | |
5.40%, 4/2/07 | | | | 3,146 | | 3,146 | |
5.46%, 4/2/07 | | | | 7,550 | | 7,550 | |
Dexia Bank, New York, 5.32%, 4/2/07 | | | | (h)786 | | 786 | |
First Tennessee Bank, 5.33%, 4/17/07 | | | | (h)393 | | 393 | |
Gemini Securitization Corp., 5.41%, 4/2/07 | | | | 1,131 | | 1,131 | |
Goldman Sachs Group, Inc., | | | | | | | |
5.37%, 4/16/07 | | | | (h)393 | | 393 | |
5.55%, 4/2/07 | | | | (h)739 | | 739 | |
HSBC Finance Corp., 5.33%, 4/10/07 | | | | (h)393 | | 393 | |
Mane Funding Corp., 5.29%, 4/10/07 | | | | 563 | | 563 | |
Manufacturers & Traders, 5.30%, 4/16/07 | | | | (h)472 | | 472 | |
Marshall & Ilsley Bank, 5.37%, 12/17/07 | | | | 789 | | 789 | |
Merrill Lynch & Co., 5.33%, 4/26/07 | | | | (h)413 | | 413 | |
Metropolitan Life Global Funding, 5.31%, 4/23/07 | | | | (h)1,180 | | 1,180 | |
Natexis Banques Populaires, New York, | | | | | | | |
5.33%, 4/2/07 | | | | (h)787 | | 787 | |
5.34%, 4/2/07 | | | | (h)787 | | 787 | |
National Australia Bank Ltd., 5.31%, 4/10/07 | | | | (h)598 | | 598 | |
National City Bank Cleveland, 5.32%, 4/2/07 | | | | (h)393 | | 393 | |
National Rural Utilities Cooperative Finance | | | | | | | |
Corp., 5.31%, 4/2/07 | | | | (h)1,573 | | 1,573 | |
Nationwide Building Society, 5.43%, 6/28/07 | | | | (h)912 | | 912 | |
Nordea Bank, New York, 5.31%, 4/2/07 | | | | (h)1,180 | | 1,180 | |
Raiffeisen Zentralbank Oesterreich, 5.31%, 6/19/07 | | | | 466 | | 466 | |
Rheingold Securitization, 5.32%, 5/15/07 | | | | 699 | | 699 | |
Sedna Finance, Inc., 5.32%, 5/15/07 | | | | 202 | | 202 | |
Skandi, New York, 5.32%, 4/10/07 | | | | (h)787 | | 787 | |
Toronto Dominion, New York, 5.32%, 5/29/07 | | | | (h)786 | | 786 | |
Tulip Funding Corp., 5.36%, 4/30/07 | | | | 1,566 | | 1,566 | |
UBS Securities LLC, 5.40%, 4/2/07 | | | | 7,729 | | 7,729 | |
Unicredito Delaware, Inc., 5.32%, 4/16/07 | | | | (h)865 | | 865 | |
Unicredito Italiano Bank (Ireland) plc, 5.34% | | | | | | | |
4/10/07 | | | | (h)550 | | 550 | |
| | | | | | 49,300 | |
Repurchase Agreement (6.3%) | | | | | | | |
J.P. Morgan Securities, Inc., | | | | | | | |
5.28%, dated 3/30/07, due 4/2/07, | | | | | | | |
repurchase price $13,336 | | | | (f)13,330 | | 13,330 | |
U.S. Treasury Security (0.1%) | | | | | | | |
U.S. Treasury Bill | | | | | | | |
4.98%, 7/12/07 | | | | (j)160 | | 158 | |
Total Short-Term Investments (Cost $62,788) | | | | | | 62,788 | |
Total Investments (122.2%) (Cost $289,720) — | | | | | | | |
Including $48,378 of Securities Loaned | | | | | | 259,234 | |
Liabilities in Excess of Other Assets (-22.2%) | | | | | | (47,112) | |
Net Assets (100%) | | | | | | $ | 212,122 | |
| | | | | | | | | |
(a) | Non-income producing security |
(b) | Issuer is in default. |
(c) | All or portion of security on loan at March 31, 2007. |
(d) | Security was valued at fair value — At March 31, 2007, the Portfolio held fair valued securities, each valued at less than $500, representing less than 0.05% of net assets. |
(e) | 144A security — Certain conditions for public sale may exist. Unless otherwise noted, these securities are deemed to be liquid. |
(f) | Represents the Portfolio’s undivided interest in a joint repurchase agreement which has a total value of $1,580,364,000. The repurchase agreement was fully collateralized by U.S. government agency securities at the date of this Portfolio of Investments as follows: Federal Farm Credit Bank, 0.00% to 7.43%, due 5/7/07 to 3/2/21; Federal Home Loan Bank, 0.00% to 6.42%, due 4/2/07 to 3/9/26; Federal Home Loan Mortgage Corp., 0.00% to 7.00%, due 4/2/07 to 3/15/31; Federal National Mortgage Association, 0.00% to 7.13%, due 4/5/07 to 3/17/31; Tennessee Valley Authority, 4.88%, due 12/15/16, which had a total value of $1,611,974,119. The investment in the repurchase agreement is through participation in a joint account with affiliated parties pursuant to exemptive relief received by the Portfolio from the SEC. |
(g) | Step Bond — Coupon rate increases in increments to maturity. Rate disclosed is as of March 31, 2007. Maturity date disclosed is the ultimate maturity date. |
(h) | Variable/Floating Rate Security — Interest rate changes on these instruments are based on changes in a designated base rate. The rates shown are those in effect on March 31, 2007. |
(j) | All or a portion of the security was pledged to cover margin requirements for futures contracts. |
(k) | Security has been deemed illiquid at March 31, 2007. |
@ | Face Amount/Value is less than $500. |
EUR | Euro |
DEM | German Mark |
MXN | Mexican Peso |
PIK | Payment-in-Kind |
Foreign Currency Exchange Contract Information:
The Portfolio had the following foreign currency exchange contract(s) open at period end:
| | | | | | | | | | Net | |
Currency | | | | | | In | | | | Unrealized | |
to | | | | | | Exchange | | | | Appreciation | |
Deliver | | Value | | Settlement | | For | | Value | | (Depreciation) | |
(000) | | (000) | | Date | | (000) | | (000) | | (000) | |
EUR | 1,754 | | $ | 2,346 | | 4/30/07 | | USD | 2,285 | | $ | 2,285 | | $ | (60 | ) |
EUR | 2,864 | | 3,830 | | 4/30/07 | | USD | 3,732 | | 3,732 | | (98 | ) |
| | $ | 6,176 | | | | | | $ | 6,017 | | $ | (158 | ) |
EUR — Euro |
USD — United States Dollar |
The accompanying notes are an integral part of the financial statements.
48
2007 Semi-Annual Report | |
| |
March 31, 2007 (unaudited) | |
Portfolio of Investments (cont’d)
High Yield Portfolio
Futures Contracts:
The Portfolio had the following futures contract(s) open at period end:
| | | | | | | | Net | |
| | | | | | | | Unrealized | |
| | Number | | | | | | Appreciation | |
| | of | | Value | | Expiration | | (Depreciation) | |
| | Contracts | | (000) | | Date | | (000) | |
Long: | | | | | | | | | |
| | | | | | | | | | | |
U.S. Treasury 2yr. Note | | 28 | | $ | 5,737 | | Jun-07 | | $ | (11) | |
U.S. Treasury 5 yr. Note | | 264 | | 27,930 | | Jun-07 | | (17) | |
U.S. Treasury 10 yr. Note | | 235 | | 25,409 | | Jun-07 | | (23) | |
| | | | | | | | | |
Short: | | | | | | | | | |
| | | | | | | | | |
U.S. Treasury Bonds | | 139 | | 15,464 | | Jun-07 | | 20 | |
| | | | | | | | $ | (31) | |
Graphic Presentation of Portfolio Holdings
The following graph depicts the Portfolio’s holdings by Industry and/or investment type, as a percentage of total investments.

* Industries and/or investment types which do not appear in the above graph, as well as those which represent less than 5% of total investments, if applicable, are included in the category labeled “Other”.
The accompanying notes are an integral part of the financial statements.
49
2007 Semi-Annual Report |
| |
March 31, 2007 (unaudited) |
Portfolio of Investments
Intermediate Duration Portfolio
| | | | Face | | | |
| | | | Amount | | Value | |
| | | | (000) | | (000) | |
Fixed Income Securities (98.4%) | | | | | | | |
Agency Adjustable Rate Mortgages (0.2%) | | | | | | | |
Government National Mortgage Association, | | | | | | | |
Adjustable Rate Mortgages: | | | | | | | |
5.38%, 3/20/25-1/20/28 | | | | $ | 163 | | $ | 165 | |
5.75%, 7/20/25-9/20/27 | | | | 47 | | 47 | |
6.13%, 11/20/25-11/20/27 | | | | 58 | | 58 | |
| | | | | | 270 | |
Agency Fixed Rate Mortgages (10.2%) | | | | | | | |
Federal Home Loan Mortgage Corp., | | | | | | | |
Conventional Pools: | | | | | | | |
5.35%, 4/1/37 | | | | (h)575 | | 574 | |
5.76%, 1/1/37 | | | | (h)1,050 | | 1,058 | |
11.00%, 7/1/13 | | | | 4 | | 5 | |
Gold Pools: | | | | | | | |
7.00%, 6/1/28-6/1/32 | | | | 103 | | 107 | |
7.50%, 8/1/30-1/1/31 | | | | 120 | | 125 | |
8.00%, 6/1/30-9/1/31 | | | | 505 | | 532 | |
8.50%, 7/1/30-7/1/31 | | | | 78 | | 83 | |
9.50%, 12/1/22 | | | | 20 | | 22 | |
10.00%, 6/1/17 | | | | 21 | | 23 | |
Federal National Mortgage Association, | | | | | | | |
Conventional Pools: | | | | | | | |
6.50%, 7/1/30-5/1/33 | | | | 403 | | 415 | |
7.00%, 1/1/32-11/1/34 | | | | 1,734 | | 1,807 | |
7.50%, 8/1/29-3/1/32 | | | | 896 | | 938 | |
8.00%, 10/1/30-9/1/31 | | | | 130 | | 137 | |
8.50%, 8/1/30 | | | | 8 | | 9 | |
9.50%, 12/1/17-12/1/21 | | | | 401 | | 436 | |
10.00%, 7/1/18-5/1/22 | | | | 13 | | 15 | |
April TBA | | | | | | | |
7.00%, 4/25/35 | | | | (i)1,725 | | 1,780 | |
May TBA | | | | | | | |
7.00%, 5/25/37 | | | | (i)5,725 | | 5,900 | |
Government National Mortgage Association, | | | | | | | |
Various Pools: | | | | | | | |
9.50%, 11/15/16-12/15/21 | | | | 147 | | 160 | |
10.00%, 4/15/16-3/15/25 | | | | 257 | | 286 | |
10.50%, 9/15/17-2/15/18 | | | | 40 | | 45 | |
11.00%, 3/15/10-6/15/20 | | | | 99 | | 109 | |
11.50%, 6/15/13 | | | | 6 | | 7 | |
12.00%, 5/15/14 | | | | 7 | | 8 | |
12.50%, 12/15/10 | | | | 1 | | 1 | |
| | | | | | 14,582 | |
Asset Backed Corporates (30.6%) | | | | | | | |
ACE Securities Corp. | | | | | | | |
5.43%, 7/25/35 | | | | (h)173 | | 173 | |
Argent Securities, Inc. | | | | | | | |
5.37%, 10/15/46 | | | | (h)823 | | 824 | |
Bayview Financial Acquisition Trust | | | | | | | |
5.42%, 11/28/36 | | | | (h)496 | | 496 | |
Bear Stearns Asset Backed Securities, Inc. | | | | | | | |
5.44%, 8/25/35 | | | | $ | (h)222 | | $ | 222 | |
5.52%, 9/25/34 | | | | (h)213 | | 213 | |
Capital Auto Receivables Asset Trust | | | | | | | |
3.35%, 2/15/08 | | | | 110 | | 110 | |
4.05%, 7/15/09 | | | | 1,313 | | 1,308 | |
4.98%, 5/15/11 | | | | 1,075 | | 1,075 | |
5.31%, 10/20/09 | | | | (e)1,250 | | 1,252 | |
Capital One Auto Finance Trust | | | | | | | |
5.07%, 7/15/11 | | | | 575 | | 575 | |
Carrington Mortgage Loan Trust | | | | | | | |
5.47%, 9/25/35 | | | | (h)286 | | 286 | |
Caterpillar Financial Asset Trust | | | | | | | |
3.90%, 2/25/09 | | | | 684 | | 681 | |
5.57%, 5/25/10 | | | | 925 | | 931 | |
CIT Equipment Collateral | | | | | | | |
5.07%, 2/20/10 | | | | 600 | | 601 | |
Citibank Credit Card Issuance Trust | | | | | | | |
5.34%, 3/22/12 | | | | (h)900 | | 900 | |
Citigroup Mortgage Loan Trust, Inc. | | | | | | | |
5.39%, 8/25/36-1/25/37 | | | | (h)1,193 | | 1,193 | |
CNH Equipment Trust | | | | | | | |
4.02%, 4/15/09 | | | | 758 | | 754 | |
4.27%, 1/15/10 | | | | 2,190 | | 2,174 | |
5.20%, 6/15/10 | | | | 500 | | 501 | |
Countrywide Asset-Backed Certificates | | | | | | | |
5.43%, 6/25/35 | | | | (h)827 | | 827 | |
Credit-Based Asset Servicing and Securitization LLC | | | | | | | |
5.38%, 6/25/36 | | | | (h)521 | | 522 | |
5.39%, 1/25/37 | | | | (h)1,005 | | 1,005 | |
Ford Credit Auto Owner Trust | | | | | | | |
5.26%, 10/15/10 | | | | 1,000 | | 1,003 | |
Fremont Home Loan Owner Trust | | | | | | | |
5.37%, 10/25/36 | | | | (h)798 | | 798 | |
GE Equipment Small Ticket LLC | | | | | | | |
4.38%, 7/22/09 | | | | (e)1,446 | | 1,439 | |
4.88%, 10/22/09 | | | | (e)2,125 | | 2,120 | |
GMASMP Trust | | | | | | | |
5.39%, 1/25/37 | | | | 685 | | 685 | |
GS Auto Loan Trust | | | | | | | |
5.37%, 12/15/10 | | | | 925 | | 928 | |
GSAMP Trust | | | | | | | |
5.39%, 12/25/36-1/25/37 | | | | (h)1,504 | | 1,504 | |
Harley-Davidson Motorcycle Trust | | | | | | | |
2.63%, 11/15/10 | | | | 219 | | 217 | |
2.76%, 5/15/11 | | | | 837 | | 829 | |
3.09%, 6/15/10 | | | | 152 | | 152 | |
3.76%, 12/17/12 | | | | 550 | | 539 | |
4.07%, 2/15/12 | | | | 1,150 | | 1,135 | |
4.41%, 6/15/12 | | | | 1,500 | | 1,488 | |
Hertz Vehicle Financing LLC | | | | | | | |
4.93%, 2/25/10 | | | | (e)1,325 | | 1,322 | |
The accompanying notes are an integral part of the financial statements.
50
2007 Semi-Annual Report |
|
March 31, 2007 (unaudited) |
Portfolio of Investments (cont’d)
Intermediate Duration Portfolio
| | | | Face | | | |
| | | | Amount | | Value | |
| | | | (000) | | (000) | |
Asset Backed Corporates (cont’d) | | | | | | | |
Honda Auto Receivables Owner Trust | | | | | | | |
4.85%, 10/19/09 | | | | $ | 1,700 | | $ | 1,696 | |
Hyundai Auto Receivables Trust | | | | | | | |
3.98%, 11/16/09 | | | | 975 | | 968 | |
Irwin Home Equity Corp. | | | | | | | |
5.46%, 6/25/35 | | | | (h)@— | | @— | |
Nationstar Home Equity Loan Trust | | | | | | | |
6.02%, 9/25/36 | | | | (h)692 | | 692 | |
Nissan Auto Receivables Grantor Trust | | | | | | | |
5.44%, 4/15/10 | | | | 1,150 | | 1,157 | |
Nissan Auto Receivables Owner Trust | | | | | | | |
3.99%, 7/15/09 | | | | 1,220 | | 1,213 | |
Residential Asset Securities Corp. | | | | | | | |
5.40%, 5/25/30 | | | | (h)483 | | 483 | |
Securitized Asset Backed Receivables LLC Trust | | | | | | | |
5.40%, 11/25/36 | | | | (h)835 | | 835 | |
SLM Student Loan Trust | | | | | | | |
5.32%, 10/25/14 | | | | (h)950 | | 951 | |
Soundview Home Equity Loan Trust | | | | | | | |
5.40%, 1/25/37 | | | | (h)689 | | 689 | |
Structured Asset Securities Corp. | | | | | | | |
5.52%, 6/25/35 | | | | (h)76 | | 76 | |
Terwin Mortgage Trust | | | | | | | |
5.44%, 7/25/35 | | | | (e)(h)1 | | 1 | |
5.50%, 7/25/36 | | | | (h)8 | | 8 | |
5.79%, 12/25/34 | | | | (h)151 | | 151 | |
TXU Electric Delivery Transition Bond Co. | | | | | | | |
4.81%, 11/17/14 | | | | 175 | | 174 | |
USAA Auto Owner Trust | | | | | | | |
2.67%, 10/15/10 | | | | 692 | | 686 | |
Volkswagen Auto Lease Trust | | | | | | | |
3.82%, 5/20/08 | | | | 295 | | 295 | |
Volkswagen Auto Loan Enhanced Trust | | | | | | | |
4.80%, 7/20/09 | | | | 2,097 | | 2,092 | |
Wachovia Auto Owner Trust | | | | | | | |
4.06%, 9/21/09 | | | | 556 | | 553 | |
Whole Auto Loan Trust | | | | | | | |
2.58%, 3/15/10 | | | | 417 | | 416 | |
World Omni Auto Receivables Trust | | | | | | | |
3.29%, 11/12/08 | | | | 81 | | 81 | |
| | | | | | 43,999 | |
Collateralized Mortgage Obligations- Agency Collateral Series (2.2%) | | | | | | | |
Countrywide Alternative Loan Trust | | | | | | | |
IO | | | | | | | |
1.54%, 2/25/37 | | | | (h)9,825 | | 519 | |
1.73%, 12/20/35 | | | | (h)10,134 | | 276 | |
1.95%, 3/20/47 | | | | (h)6,010 | | 334 | |
2.71%, 12/20/35 | | | | (h)11,153 | | 536 | |
Federal Home Loan Mortgage Corporation | | | | | | | |
Inv Fl IO | | | | | | | |
2.68%, 3/15/32 | | | | (h)497 | | 42 | |
IO | | | | | | | |
5.00%, 9/15/14 | | | | $ | 430 | | $ | 13 | |
6.00%, 5/1/31 | | | | 245 | | 47 | |
6.50%, 4/1/28-8/1/28 | | | | 557 | | 118 | |
7.00%, 2/15/32 | | | | 93 | | 21 | |
8.00%, 1/1/28-6/1/31 | | | | 20 | | 4 | |
IO PAC | | | | | | | |
6.00%, 4/15/32 | | | | 257 | | 31 | |
Federal National Mortgage Association | | | | | | | |
Inv Fl IO | | | | | | | |
2.78%, 12/25/29 | | | | (h)8 | | @— | |
IO | | | | | | | |
6.00%, 5/25/33-6/25/33 | | | | 703 | | 150 | |
6.50%, 6/1/31 | | | | 160 | | 35 | |
7.00%, 4/25/33 | | | | 305 | | 72 | |
8.00%, 5/1/30 | | | | 11 | | 3 | |
9.00%, 11/1/26 | | | | 37 | | 9 | |
IO PAC | | | | | | | |
8.00%, 8/18/27 | | | | 37 | | 8 | |
Government National Mortgage Association | | | | | | | |
Inv Fl IO | | | | | | | |
2.63%, 12/16/25-9/16/27 | | | | (h)302 | | 20 | |
2.68%, 5/16/32 | | | | (h)106 | | 5 | |
Harborview Mortgage Loan Trust | | | | | | | |
IO | | | | | | | |
0.97%, 6/19/35 | | | | (h)8,763 | | 199 | |
1.26%, 5/19/35 | | | | (h)11,271 | | 269 | |
1.63%, 3/19/37 | | | | (h)9,186 | | 405 | |
PO | | | | | | | |
3/19/37 | | | | 4 | | 3 | |
| | | | | | 3,119 | |
Finance (12.3%) | | | | | | | |
AIG SunAmerica Global Financing VI | | | | | | | |
6.30%, 5/10/11 | | | | (e)610 | | 637 | |
American General Finance Corp. | | | | | | | |
4.63%, 5/15/09 | | | | 755 | | 746 | |
AXA Financial, Inc. | | | | | | | |
6.50%, 4/1/08 | | | | 295 | | 298 | |
Bank of America Corp. | | | | | | | |
3.38%, 2/17/09 | | | | 245 | | 238 | |
3.88%, 1/15/08 | | | | 165 | | 163 | |
Bank of New York Co., Inc. (The) | | | | | | | |
3.80%, 2/1/08 | | | | 250 | | 247 | |
5.20%, 7/1/07 | | | | 85 | | 85 | |
Bank One Corp. | | | | | | | |
6.00%, 2/17/09 | | | | 455 | | 462 | |
Catlin Insurance Co., Ltd | | | | | | | |
7.25% | | | | (e)(h)(o)250 | | 249 | |
CIT Group, Inc. | | | | | | | |
3.65%, 11/23/07 | | | | 285 | | 282 | |
4.75%, 8/15/08 | | | | 100 | | 99 | |
Countrywide Home Loans, Inc. | | | | | | | |
3.25%, 5/21/08 | | | | 327 | | 320 | |
The accompanying notes are an integral part of the financial statements.
51
2007 Semi-Annual Report |
| |
March 31, 2007 (unaudited) |
Portfolio of Investments (cont’d)
Intermediate Duration Portfolio
| | | | Face | | | |
| | | | Amount | | Value | |
| | | | (000) | | (000) | |
Finance (cont’d) | | | | | | | |
Farmers Insurance Exchange | | | | | | | |
8.63%, 5/1/24 | | | | $ | (e)300 | | $ | 358 | |
General Electric Capital Corp. | | | | | | | |
4.75%, 9/15/14 | | | | 95 | | 92 | |
5.37%, 3/12/10 | | | | (h)515 | | 515 | |
HSBC Finance Corp. | | | | | | | |
4.13%, 12/15/08 | | | | 90 | | 88 | |
6.40%, 6/17/08 | | | | 270 | | 274 | |
6.75%, 5/15/11 | | | | 285 | | 301 | |
Huntington National Bank (The) | | | | | | | |
4.38%, 1/15/10 | | | | 300 | | 293 | |
iStar Financial, Inc. | | | | | | | |
5.69%, 3/9/10 | | | | (h)320 | | 320 | |
John Hancock Global Funding II | | | | | | | |
7.90%, 7/2/10 | | | | (e)715 | | 774 | |
JPMorgan Chase & Co. | | | | | | | |
6.00%, 2/15/09 | | | | 275 | | 279 | |
M&I Marshall & Ilsley Bank | | | | | | | |
3.80%, 2/8/08 | | | | 410 | | 405 | |
Mantis Reef Ltd. | | | | | | | |
4.69%, 11/14/08 | | | | (e)255 | | 253 | |
MBNA Corp. | | | | | | | |
5.79%, 5/5/08 | | | | (h)625 | | 628 | |
Monumental Global Funding II | | | | | | | |
3.85%, 3/3/08 | | | | (e)760 | | 750 | |
Nationwide Building Society | | | | | | | |
4.25%, 2/1/10 | | | | (e)325 | | 317 | |
Platinum Underwriters Finance, Inc. | | | | | | | |
7.50%, 6/1/17 | | | | 10 | | 11 | |
Platinum Underwriters Holdings Ltd. | | | | | | | |
6.37%, 11/16/07 | | | | 350 | | 349 | |
Popular North America, Inc. | | | | | | | |
5.65%, 4/15/09 | | | | 155 | | 156 | |
Pricoa Global Funding I | | | | | | | |
3.90%, 12/15/08 | | | | (e)795 | | 777 | |
Residential Capital LLC | | | | | | | |
5.84%, 6/9/08 | | | | (h)300 | | 297 | |
6.38%, 6/30/10 | | | | 425 | | 425 | |
Simon Property Group LP | | | | | | | |
6.38%, 11/15/07 | | | | 355 | | 357 | |
SLM Corp. | | | | | | | |
4.00%, 1/15/10 | | | | 230 | | 224 | |
Sovereign Bancorp, Inc. | | | | | | | |
5.58%, 3/23/10 | | | | (h)425 | | 425 | |
Sovereign Bank | | | | | | | |
4.00%, 2/1/08 | | | | 100 | | 99 | |
TIAA Global Markets, Inc. | | | | | | | |
4.13%, 11/15/07 | | | | (e)630 | | 625 | |
Travelers Cos., Inc. (The) | | | | | | | |
5.01%, 8/16/07 | | | | 311 | | 311 | |
Two-Rock Pass Through Trust | | | | | | | |
6.30% | | | | (e)(h)(o)290 | | 286 | |
U.S. Bancorp | | | | | | | |
5.10%, 7/15/07 | | | | $ | 125 | | $ | 125 | |
Unicredit Luxembourg Finance S.A. | | | | | | | |
5.41%, 10/24/08 | | | | (e)(h)470 | | 470 | |
USB Capital IX | | | | | | | |
6.19% | | | | (h)(o)360 | | 369 | |
Wachovia Capital Trust Ill | | | | | | | |
5.80% | | | | (h)(o)720 | | 729 | |
Washington Mutual Preferred Funding II | | | | | | | |
6.66% | | | | (e)(h)(o)300 | | 295 | |
Washington Mutual, Inc. | | | | | | | |
8.25%, 4/1/10 | | | | 365 | | 395 | |
World Financial Properties | | | | | | | |
6.91%, 9/1/13 | | | | (e)876 | | 920 | |
6.95%, 9/1/13 | | | | (e)212 | | 223 | |
Xlliac Global Funding | | | | | | | |
4.80%, 8/10/10 | | | | (e)375 | | 370 | |
| | | | | | 17,711 | |
Industrials (8.7%) | | | | | | | |
America West Airlines, Inc. | | | | | | | |
7.10%, 4/2/21 | | | | 233 | | 247 | |
American Honda Finance Corp. | | | | | | | |
3.85%, 11/6/08 | | | | (e)325 | | 319 | |
AT&T, Inc. | | | | | | | |
5.30%, 11/15/10 | | | | 160 | | 161 | |
Brookfield Asset Management, Inc. | | | | | | | |
7.13%, 6/15/12 | | | | 300 | | 322 | |
Burlington Northern Santa Fe Corp. | | | | | | | |
6.13%, 3/15/09 | | | | 140 | | 142 | |
Caterpillar Financial Services Corp. | | | | | | | |
5.43%, 8/20/07 | | | | (h)280 | | 280 | |
Clorox Co. | | | | | | | |
5.48%, 12/14/07 | | | | (h)485 | | 485 | |
Comcast Cable Communications LLC | | | | | | | |
6.75%, 1/30/11 | | | | 235 | | 248 | |
8.38%, 5/1/07 | | | | 105 | | 105 | |
Comcast LCI Holdings | | | | | | | |
7.63%, 2/15/08 | | | | 40 | | 41 | |
Consumers Energy Co. | | | | | | | |
4.00%, 5/15/10 | | | | 100 | | 97 | |
4.80%, 2/17/09 | | | | 175 | | 174 | |
Cooper Industries, Inc. | | | | | | | |
5.25%, 7/1/07-11/15/12 | | | | 385 | | 385 | |
CVS Lease Pass Through | | | | | | | |
6.04%, 12/10/28 | | | | (e)363 | | 368 | |
CVS/Caremark Corp. | | | | | | | |
3.88%, 11/1/07 | | | | 65 | | 65 | |
5.75%, 8/15/11 | | | | 65 | | 66 | |
Deutsche Telekom International Finance BV | | | | | | | |
7.99%, 6/15/10 | | | | 435 | | 472 | |
FBG Finance Ltd. | | | | | | | |
5.13%, 6/15/15 | | | | (e)255 | | 245 | |
The accompanying notes are an integral part of the financial statements.
52
2007 Semi-Annual Report |
|
March 31, 2007 (unaudited) |
Portfolio of Investments (cont’d)
Intermediate Duration Portfolio
| | | | Face | | | |
| | | | Amount | | Value | |
| | | | (000) | | (000) | |
Industrials (cont’d) | | | | | | | |
Federated Department Stores, Inc. | | | | | | | |
6.63%, 9/1/08 | | | | $ | 80 | | $ | 81 | |
6.30%, 4/1/09 | | | | 265 | | 271 | |
Federated Retail Holdings, Inc. | | | | | | | |
5.90%, 12/1/16 | | | | 380 | | 379 | |
FedEx Corp. | | | | | | | |
5.50%, 8/15/09 | | | | 145 | | 146 | |
France Telecom S.A. | | | | | | | |
7.75%, 3/1/11 | | | | 290 | | 316 | |
Fred Meyer, Inc. | | | | | | | |
7.45%, 3/1/08 | | | | 300 | | 306 | |
General Mills, Inc. | | | | | | | |
3.88%, 11/30/07 | | | | 85 | | 84 | |
Hewlett Packard Co. | | | | | | | |
5.48%, 5/22/09 | | | | (h)215 | | 215 | |
Home Depot, Inc. | | | | | | | |
5.47%, 12/16/09 | | | | (h)105 | | 105 | |
Hyatt Equities LLC | | | | | | | |
6.88%, 6/15/07 | | | | (e)330 | | 331 | |
ICI Wilmington, Inc. | | | | | | | |
4.38%, 12/1/08 | | | | 125 | | 123 | |
Kraft Foods, Inc. | | | | | | | |
5.25%, 6/1/07 | | | | 115 | | 115 | |
LG Electronics, Inc. | | | | | | | |
5.00%, 6/17/10 | | | | (e)165 | | 163 | |
Masco Corp. | | | | | | | |
4.63%, 8/15/07 | | | | 240 | | 239 | |
May Department Stores Co. (The) | | | | | | | |
5.95%, 11/1/08 | | | | 295 | | 298 | |
Miller Brewing Co. | | | | | | | |
4.25%, 8/15/08 | | | | (e)280 | | 276 | |
Mohawk Industries, Inc. | | | | | | | |
7.20%, 4/15/12 | | | | 235 | | 249 | |
Norfolk Southern Corp. | | | | | | | |
7.35%, 5/15/07 | | | | 240 | | 240 | |
Raytheon Co. | | | | | | | |
6.15%, 11/1/08 | | | | 130 | | 132 | |
Sara Lee Corp. | | | | | | | |
2.75%, 6/15/08 | | | | 380 | | 368 | |
Systems 2001 Asset Trust LLC | | | | | | | |
6.66%, 9/15/13 | | | | (e)249 | | 263 | |
Telecom Italia Capital S.A. | | | | | | | |
4.00%, 1/15/10 | | | | 335 | | 324 | |
Textron Financial Corp. | | | | | | | |
4.13%, 3/3/08 | | | | 305 | | 302 | |
5.13%, 2/3/11 | | | | 95 | | 95 | |
Time Warner, Inc. | | | | | | | |
5.59%, 11/13/09 | | | | (h)445 | | 446 | |
Union Pacific Corp. | | | | | | | |
6.63%, 2/1/08 | | | | 416 | | 420 | |
UnitedHealth Group, Inc. | | | | | | | |
4.13%, 8/15/09 | | | | 150 | | 147 | |
5.43%, 3/2/09 | | | | (h)145 | | 145 | |
Valero Energy Corp. | | | | | | | |
3.50%, 4/1/09 | | | | $ | 155 | | $ | 150 | |
Verizon Global Funding Corp. | | | | | | | |
6.13%, 6/15/07 | | | | 445 | | 446 | |
7.25%, 12/1/10 | | | | 140 | | 150 | |
Verizon New England, Inc. | | | | | | | |
6.50%, 9/15/11 | | | | 200 | | 209 | |
Viacom, Inc. | | | | | | | |
5.75%, 4/30/11 | | | | 300 | | 304 | |
Vodafone Group plc | | | | | | | |
5.44%, 12/28/07 | | | | (h)215 | | 215 | |
Yum! Brands, Inc. | | | | | | | |
8.88%, 4/15/11 | | | | 190 | | 214 | |
| | | | | | 12,489 | |
Mortgages - Other (27.8%) | | | | | | | |
American Home Mortgage Assets | | | | | | | |
5.45%, 3/25/47 | | | | (h)925 | | 923 | |
American Home Mortgage Investment | | | | | | | |
5.51%, 4/25/37 | | | | (h)700 | | 700 | |
Banc of America Funding Corp. | | | | | | | |
5.67%, 9/20/35 | | | | (h)391 | | 392 | |
Bear Stearns Mortgage Funding Trust | | | | | | | |
5.48%, 12/25/36 | | | | (h)672 | | 673 | |
5.49%, 3/25/37 | | | | (h)1,025 | | 1,025 | |
5.50%, 10/25/36 | | | | (h)858 | | 854 | |
5.52%, 9/25/36 | | | | (h)980 | | 977 | |
Citigroup Mortgage Loan Trust, Inc. | | | | | | | |
5.40%, 1/25/37 | | | | (h)580 | | 579 | |
Countrywide Alternative Loan Trust | | | | | | | |
5.25%, 7/25/46 | | | | (e)241 | | 240 | |
5.46%, 4/25/47 | | | | (h)995 | | 994 | |
5.51%, 11/25/46 | | | | (h)662 | | 663 | |
5.58%, 11/20/35 | | | | (h)734 | | 735 | |
5.60%, 10/25/35 | | | | (h)103 | | 103 | |
5.71%, 12/20/35 | | | | (e)(h)909 | | 912 | |
6.50%, 10/25/46 | | | | (e)324 | | 323 | |
Countrywide Home Loan Mortgage Pass Through Trust | | | | | | | |
5.59%, 4/25/35 | | | | (h)831 | | 833 | |
5.62%, 3/25/35 | | | | (h)241 | | 242 | |
Deutsche ALT-A Securities, Inc., Alternate Loan Trust | | | | | | | |
5.47%, 2/25/47 | | | | (h)1,097 | | 1,097 | |
Deutsche ALT-A Securities, NIM Trust | | | | | | | |
6.75%, 2/25/47 | | | | (e)434 | | 433 | |
Federal National Mortgage Association | | | | | | | |
5.38%, 12/25/36 | | | | (h)601 | | 600 | |
5.51%, 4/25/37 | | | | 725 | | 728 | |
Greenpoint Mortgage Fund | | | | | | | |
5.50%, 5/25/47 | | | | 1,000 | | 1,000 | |
Greenpoint Mortgage Funding Trust | | | | | | | |
5.51%, 3/25/47 | | | | (h)750 | | 750 | |
5.64%, 3/25/36 | | | | (h)1,844 | | 1,848 | |
GS Mortgage Securities Corp. | | | | | | | |
6.25%, 1/25/37 | | | | (e)410 | | 409 | |
The accompanying notes are an integral part of the financial statements.
53
2007 Semi-Annual Report |
| |
March 31, 2007 (unaudited) |
Portfolio of Investments (cont’d)
Intermediate Duration Portfolio
| | | | Face | | | |
| | | | Amount | | Value | |
| | | | (000) | | (000) | |
Mortgages - Other (cont’d) | | | | | | | |
GSR Mortgage Loan Trust | | | | | | | |
5.58%, 8/25/46 | | | | $ | (h)895 | | $ | 898 | |
Harborview Mortgage Loan Trust | | | | | | | |
5.41%, 1/19/38 | | | | (h)329 | | 330 | |
5.45%, 3/19/37 | | | | (h)711 | | 712 | |
5.47%, 2/19/46 | | | | (h)766 | | 767 | |
5.50%, 11/19/36 | | | | (h)968 | | 965 | |
5.51%, 12/19/37 | | | | (h)1,075 | | 1,076 | |
5.56%, 3/19/37 | | | | (h)1,510 | | 1,513 | |
5.61%, 7/19/45 | | | | (h)450 | | 451 | |
5.70%, 11/19/35 | | | | (h)779 | | 782 | |
Harborview NIM Corp. | | | | | | | |
6.41%, 3/19/37 | | | | (e)284 | | 283 | |
Indymac Index Mortgage Loan Trust | | | | | | | |
5.42%, 2/25/37 | | | | (h)733 | | 734 | |
5.53%, 11/25/36 | | | | (h)697 | | 698 | |
5.54%, 4/25/46 | | | | (h)807 | | 808 | |
Luminent Mortgage Trust | | | | | | | |
5.56%, 4/25/36-10/25/46 | | | | (h)2,316 | | 2,325 | |
Merrill Lynch Mortgage Investors, Inc. | | | | | | | |
5.44%, 8/25/35 | | | | (h)412 | | 413 | |
Residential Accredit Loans, Inc. | | | | | | | |
5.48%, 2/25/46-3/25/47 | | | | (h)2,323 | | 2,323 | |
5.51%, 12/25/36 | | | | (h)811 | | 815 | |
5.58%, 2/25/46 | | | | (h)653 | | 654 | |
5.59%, 2/25/46 | | | | (h)687 | | 687 | |
Structured Asset Mortgage Investments, Inc. | | | | | | | |
5.52%, 10/25/36 | | | | (h)954 | | 956 | |
Washington Mutual, Inc. | | | | | | | |
5.57%, 11/25/45-12/25/45 | | | | (h)1,739 | | 1,743 | |
5.58%, 10/25/45 | | | | (h)636 | | 637 | |
5.59%, 4/25/45 | | | | (h)1,012 | | 1,014 | |
5.61%, 8/25/45 | | | | (h)282 | | 282 | |
| | | | | | 39,899 | |
Sovereign (0.4%) | | | | | | | |
Province of Quebec Canada | | | | | | | |
6.13%, 1/22/11 | | | | 550 | | 573 | |
U.S. Treasury Security (3.9%) | | | | | | | |
U.S. Treasury Note | | | | | | | |
3.88%, 2/15/13 | | | | 5,825 | | 5,628 | |
Utilities (2.1%) | | | | | | | |
Ameren Corp. | | | | | | | |
4.26%, 5/15/07 | | | | 220 | | 220 | |
Appalachian Power Co. | | | | | | | |
3.60%, 5/15/08 | | | | 355 | | 348 | |
Arizona Public Service Co. | | | | | | | |
5.80%, 6/30/14 | | | | 330 | | 333 | |
Carolina Power & Light Co. | | | | | | | |
5.13%, 9/15/13 | | | | 245 | | 242 | |
Columbus Southern Power Co. | | | | | | | |
4.40%, 12/1/10 | | | | 100 | | 97 | |
Consolidated Natural Gas Co. | | | | | | | |
6.25%, 11/1/11 | | | | $ | 160 | | $ | 167 | |
Detroit Edison Co. | | | | | | | |
6.13%, 10/1/10 | | | | 155 | | 160 | |
Entergy Gulf States, Inc. | | | | | | | |
5.76%, 12/1/09 | | | | (h)215 | | 215 | |
NiSource Finance Corp. | | | | | | | |
5.93%, 11/23/09 | | | | (h)165 | | 165 | |
Ohio Power Co. | | | | | | | |
6.00%, 6/1/16 | | | | 190 | | 197 | |
Public Service Electric & Gas Co. | | | | | | | |
5.00%, 1/1/13 | | | | 145 | | 143 | |
Sempra Energy | | | | | | | |
4.62%, 5/17/07 | | | | 145 | | 145 | |
TXU Energy Co. LLC | | | | | | | |
6.13%, 3/15/08 | | | | 125 | | 126 | |
Wisconsin Electric Power Co. | | | | | | | |
3.50%, 12/1/07 | | | | 395 | | 391 | |
| | | | | | 2,949 | |
Total Fixed Income Securities (Cost $141,680) | | | | | | 141,219 | |
Preferred Stock (0.1%) | | | | | | | |
Mortgages - Other (0.1%) | | | | | | | |
Home Ownership Funding Corp. | | | | | | | |
13.33%, (Cost $90) | | | | (e)650 | | 97 | |
| | | | No. of | | | |
| | | | Contracts | | | |
Put Options Purchased (0.1%) | | | | | | | |
90 Day EuroDollar | | | | | | | |
6/07 @ $94.25 | | | | 498 | | 2 | |
6/07 @ $94.75 | | | | 470 | | 76 | |
9/07 @ $94.75 | | | | 37 | | 6 | |
12/07 @ $94.50 | | | | 27 | | 1 | |
Total Put Options Purchased (Cost $267) | | | | | | 85 | |
| | | | Face | | | |
| | | | Amount | | | |
| | | | (000) | | | |
Short-Term Investments (7.7%) | | | | | | | |
Repurchase Agreement (7.0%) | | | | | | | |
J.P. Morgan Securities, Inc., 5.28%, dated 3/30/07, due 4/2/07, repurchase price $10,087 (Cost $10,083) | | | | $ | (f)10,083 | | 10,083 | |
U.S. Treasury Security (0.7%) | | | | | | | |
U.S. Treasury Bill | | | | | | | |
4.92%, 7/12/07 | | | | (j)1,035 | | 1,021 | |
Total Short-Term Investments (Cost $11,104) | | | | | | 11,104 | |
Total Investments (106.3%) (Cost $153,141) | | | | | | 152,505 | |
Liabilities in Excess of Other Assets (-6.3%) | | | | | | (9,052) | |
Net Assets (100%) | | | | | | $ | 143,543 | |
| | | | | | | | | |
(e) 144A security — Certain conditions for public sale may exist. Unless otherwise noted, these securities are deemed to be liquid.
The accompanying notes are an integral part of the financial statements.
54
2007 Semi-Annual Report |
|
March 31, 2007 (unaudited) |
Portfolio of Investments (cont’d)
Intermediate Duration Portfolio
(f) | Represents the Portfolio’s undivided interest in a joint repurchase agreement which has a total value of $1,580,364,000. The repurchase agreement was fully collateralized by U.S. government agency securities at the date of this Portfolio of Investments as follows: Federal Farm Credit Bank, 0.00% to 7.43%, due 5/7/07 to 3/2/21; Federal Home Loan Bank, 0.00% to 6.42%, due 4/2/07 to 3/9/26; Federal Home Loan Mortgage Corp., 0.00% to 7.00%, due 4/2/07 to 3/15/31; Federal National Mortgage Association, 0.00% to 7.13%, due 4/5/07 to 3/17/31; Tennessee Valley Authority, 4.88%, due 12/15/16, which had a total value of $1,611,974,119. The investment in the repurchase agreement is through participation in a joint account with affiliated parties pursuant to exemptive relief received by the Portfolio from the SEC. |
(h) | Variable/Floating Rate Security — Interest rate changes on these instruments are based on changes in a designated base rate. The rates shown are those in effect on March 31, 2007. |
(i) | Security is subject to delayed delivery. |
(j) | All or a portion of the security was pledged to cover margin requirements for futures contracts. |
(o) | Perpetual — Security does not have a predetermined maturity date. Rates for these securities are fixed for a period of time then revert to a floating rate. The interest rate shown is the rate in effect at March 31, 2007. |
@ | Face Amount/Value is less than $500. |
Inv Fl | Inverse Floating Rate — Interest rate fluctuates with an inverse relationship to an associated interest rate. Indicated rate is the effective rate at March 31, 2007. |
IO | Interest Only |
PO | Principal Only |
PAC | Planned Amortization Class |
TBA | To Be Announced |
Futures Contracts:
The Portfolio had the following futures contract(s) open at period end:
| | | | | | | | Net | |
| | | | | | | | Unrealized | |
| | Number | | | | | | Appreciation | |
| | of | | Value | | Expiration | | (Depreciation) | |
| | Contracts | | (000) | | Date | | (000) | |
Long: | | | | | | | | | |
U.S. Treasury 2 yr. Note | | 195 | | $ | 39,954 | | Jun-07 | | $ | (73 | ) |
U.S. Treasury 5 yr. Note | | 168 | | 17,774 | | Jun-07 | | (11 | ) |
U.S. Treasury 10 yr. Note | | 463 | | 50,062 | | Jun-07 | | 135 | |
Short: | | | | | | | | | |
U.S. Treasury Short Bond | | 121 | | 13,461 | | Jun-07 | | 17 | |
| | | | | | | | $ | 68 | |
| | | | | | | | | | | |
Graphic Presentation of Portfolio Holdings
The following graph depicts the Portfolio’s holdings by industry and/or security type, as a percentage of total investments.
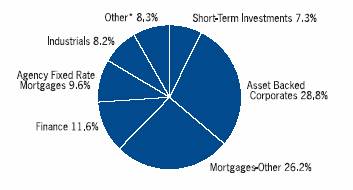
* Industries and/or investment types which do not appear in the above graph, as well as those which represent less than 5% of total investments, if applicable, are included in the category labeled “Other”
The accompanying notes are an integral part of the financial statements.
55
2007 Semi-Annual Report |
| |
March 31, 2007 (unaudited) |
Portfolio of Investments
International Fixed Income Portfolio
| | | | Face | | | |
| | | | Amount | | Value | |
| | | | (000) | | (000) | |
Fixed Income Securities (93.9%) | | | | | | | |
Australia (0.6%) | | | | | | | |
New South Wales Treasury Corp. | | | | | | | |
6.00%, 5/1/12 | | | | AUD | 1,000 | | $ | 796 | |
Telstra Corp Ltd. | | | | | | | |
6.38%, 6/29/11 | | | | EUR | 300 | | 430 | |
| | | | | | 1,226 | |
Austria (4.3%) | | | | | | | |
Oesterreichische Kontrollbank AG | | | | | | | |
1.80%, 3/22/10 | | | | JPY | 300,000 | | 2,611 | |
Republic of Austria | | | | | | | |
3.50%, 7/15/15 | | | | EUR | 5,000 | | 6,413 | |
| | | | | | 9,024 | |
Belgium (3.7%) | | | | | | | |
Government of Belgium | | | | | | | |
3.00%, 9/28/08 | | | | 5,900 | | 7,770 | |
Canada (5.1%) | | | | | | | |
Government of Canada | | | | | | | |
1.90%, 3/23/09 | | | | JPY | 5,500 | | 4,755 | |
3.00%, 6/1/07 | | | | CAD | 500,000 | | 4,332 | |
Quebec Province | | | | | | | |
1.60%, 5/9/13 | | | | JPY | 180,000 | | 1,540 | |
| | | | | | 10,627 | |
Cayman Islands (0.3%) | | | | | | | |
MBNA America European Structured Offerings | | | | | | | |
5.13%, 4/19/08 | | | | EUR | 511 | | 689 | |
Denmark (2.0%) | | | | | | | |
Kingdom of Denmark | | | | | | | |
4.00%, 8/15/08 | | | | DKK | 12,500 | | 2,237 | |
6.00%, 11/15/11 | | | | 10,000 | | 1,941 | |
| | | | | | 4,178 | |
France (8.6%) | | | | | | | |
Alcatel-Lucent | | | | | | | |
4.75%, 1/1/11 | | | | EUR | 2,808 | | 624 | |
Compagnie Generale des Etablissements | | | | | | | |
Michelin | | | | | | | |
6.38%, 12/3/33 | | | | (h)300 | | 423 | |
Crown European Holdings S.A. | | | | | | | |
6.25%, 9/1/11 | | | | 295 | | 408 | |
France Telecom S.A. | | | | | | | |
1.60%, 1/1/09 | | | | 330 | | 447 | |
8.13%, 1/28/33 | | | | 170 | | 308 | |
Government of France O.A.T. | | | | | | | |
5.50%, 4/25/29 | | | | 4,000 | | 6,255 | |
6.50%, 4/25/11 | | | | 6,400 | | 9,324 | |
| | | | | | 17,789 | |
Germany (9.4%) | | | | | | | |
Bundesrepublik Deutschland | | | | | | | |
5.50%, 1/4/31 | | | | 1,900 | | 2,996 | |
6.25%, 1/4/24 | | | | 6,100 | | 10,115 | |
Cognis Deutschland GmbH & Co. KG | | | | | | | |
8.48%, 11/15/13 | | | | (h)440 | | 597 | |
Kreditanstalt fuer Wiederaufbau | | | | | | | |
0.75%, 8/8/08 | | | | EUR | 500 | | $ | 652 | |
2.05%, 9/21/09 | | | | JPY | 440,000 | | 3,840 | |
2.05%, 2/16/26 | | | | 160,000 | | 1,358 | |
| | | | | | 19,558 | |
Ireland (6.0%) | | | | | | | |
Depfa ACS Bank | | | | | | | |
0.75%, 9/22/08 | | | | 430,000 | | 3,652 | |
Government of Ireland | | | | | | | |
4.25%, 10/18/07 | | | | EUR | 6,600 | | 8,826 | |
| | | | | | 12,478 | |
Italy (3.0%) | | | | | | | |
Republic of Italy | | | | | | | |
0.65%, 3/20/09 | | | | JPY | 740,000 | | 6,269 | |
Japan (14.6%) | | | | | | | |
Development Bank of Japan | | | | | | | |
1.60%, 6/20/14 | | | | 600,000 | | 5,141 | |
Government of Japan | | | | | | | |
0.30%, 12/20/07 | | | | 400,000 | | 3,385 | |
1.10%, 9/20/12 | | | | 1,000,000 | | 8,424 | |
1.70%, 6/20/33 | | | | 480,000 | | 3,596 | |
2.40%, 3/20/34 | | | | 430,000 | | 3,712 | |
Japan Bank for International Co-operation | | | | | | | |
0.35%, 3/19/08 | | | | 300,000 | | 2,540 | |
Japan Finance Corp. for Municipal Enterprises | | | | | | | |
2.00%, 5/9/16 | | | | 330,000 | | 2,904 | |
Sharp Corp. | | | | | | | |
Zero Coupon, 9/30/13 | | | | 48,000 | | 438 | |
Sony Corp. | | | | | | | |
Zero Coupon, 12/18/08 | | | | 20,000 | | 198 | |
| | | | | | 30,338 | |
Luxembourg (0.5%) | | | | | | | |
Gaz Capital for Gazprom | | | | | | | |
4.56%, 12/9/12 | | | | EUR | 170 | | 223 | |
Telecom Italia Finance S.A. | | | | | | | |
7.75%, 1/24/33 | | | | 265 | | 428 | |
Tyco International Group S.A. | | | | | | | |
6.13%, 4/4/07 | | | | 270 | | 361 | |
| | | | | | 1,012 | |
Mexico (0.8%) | | | | | | | |
Mexican Bonos | | | | | | | |
9.50%,12/18/14 | | | | MXN | 16,100 | | 1,625 | |
Multi-Country (2.3%) | | | | | | | |
Inter-American Development Bank | | | | | | | |
1.90%, 7/8/09 | | | | JPY | 545,000 | | 4,734 | |
Netherlands (9.2%) | | | | | | | |
Bank Nederlandse Gemeenten | | | | | | | |
0.80%, 9/22/08 | | | | 250,000 | | 2,125 | |
Government of Netherlands | | | | | | | |
4.00%, 1/15/37 | | | | EUR | 5,600 | | 7,143 | |
5.00%, 7/15/12 | | | | 5,000 | | 6,980 | |
3.75%, 1/15/23 | | | | 1,800 | | 2,276 | |
Impress Holdings | | | | | | | |
6.88%, 9/15/13 | | | | 155 | | 214 | |
| | | | | | | | | | |
The accompanying notes are an integral part of the financial statements.
56
2007 Semi-Annual Report |
|
March 31, 2007 (unaudited) |
Portfolio of Investments (cont’d)
International Fixed Income Portfolio
| | | | Face | | | |
| | | | Amount | | Value | |
| | | | (000) | | (000) | |
Netherlands (cont’d) | | | | | | | |
Telefonica Europe B.V. | | | | | | | |
5.88%, 2/14/33 | | | | EUR | 320 | | $ | 450 | |
| | | | | | 19,188 | |
Norway (0.8%) | | | | | | | |
Kingdom of Norway | | | | | | | |
5.50%, 5/15/09 | | | | NOK | 9,400 | | 1,570 | |
Philippines (0.3%) | | | | | | | |
Government of Philippines | | | | | | | |
9.50%, 2/2/30 | | | | $ | 455 | | 605 | |
Poland (2.2%) | | | | | | | |
Poland Government Bond | | | | | | | |
6.25%, 10/24/15 | | | | PLN | 12,300 | | 4,561 | |
Spain (2.0%) | | | | | | | |
Government of Spain | | | | | | | |
5.15%, 7/30/09 | | | | EUR | 3,000 | | 4,106 | |
Sweden (1.5%) | | | | | | | |
Government of Sweden | | | | | | | |
4.00%, 12/1/09 | | | | SEK | 14,000 | | 2,012 | |
Kingdom of Sweden | | | | | | | |
5.25%, 3/15/11 | | | | 5,600 | | 840 | |
Telefonaktiebolaget LM Ericsson | | | | | | | |
6.75%, 11/28/10 | | | | EUR | 230 | | 323 | |
| | | | | | 3,175 | |
United Kingdom (11.9%) | | | | | | | |
Allied Domecq | | | | | | | |
6.63%, 4/18/11 | | | | GBP | 190 | | 382 | |
BAA plc | | | | | | | |
4.50%, 2/15/18 | | | | EUR | 170 | | 222 | |
British Telecommunications plc | | | | | | | |
7.38%, 2/15/11 | | | | 220 | | 325 | |
Government of United Kingdom | | | | | | | |
4.00%, 3/7/09 | | | | GBP | 2,700 | | 5,177 | |
4.25%, 6/7/32 | | | | 800 | | 1,516 | |
United Kingdom Treasury Bond | | | | | | | |
5.00%, 9/7/14 | | | | 8,700 | | 17,040 | |
| | | | | | 24,662 | |
United States (4.8%) | | | | | | | |
Federal National Mortgage Association | | | | | | | |
1.75%, 3/26/08 | | | | JPY | 700,000 | | 6,005 | |
Ford Motor Credit Co. | | | | | | | |
5.75%, 1/12/09 | | | | EUR | 320 | | 422 | |
General Electric Capital Corp. | | | | | | | |
0.75%, 2/5/09 | | | | JPY | 250,000 | | 2,116 | |
General Motors Acceptance Corp. | | | | | | | |
5.38%, 6/6/11 | | | | EUR | 190 | | 249 | |
6.00%, 7/3/08 | | | | 260 | | 350 | |
Omnicom Group, Inc. | | | | | | | |
Zero Coupon, 7/31/32 | | | | $ | 400 | | 414 | |
Wyeth | | | | | | | |
4.88%, 1/15/24 | | | | (h)390 | | 418 | |
| | | | | | 9,974 | |
Total Fixed Income Securities (Cost $190,712) | | | | | | 195,158 | |
Short-Term Investment (4.3%) | | | | | | | |
Repurchase Agreement (4.3%) | | | | | | | |
J.P.Morgan Securities, Inc., 5.28% dated 3/30/07, due 4/2/07, repurchase price $8,845 (Cost $8,841) | | | | $ | (f)8,841 | | $ | 8,841 | |
Total Investments (98.2%) (Cost $199,553) | | | | | | 203,999 | |
Other Assets in Excess of Liabilities (1.8%) | | | | | | 3,770 | |
Net Assets (100%) | | | | | | $ | 207,769 | |
| | | | | | | | | | | |
(f) | Represents the Portfolio’s undivided interest in a joint repurchase agreement which has a total value of $1,580,364,000. The repurchase agreement was fully collateralized by U.S. government agency securities at the date of this Portfolio of Investments as follows: Federal Farm Credit Bank, 0.00% to 7.43%, due 5/7/07 to 3/2/21; Federal Home Loan Bank, 0.00% to 6.42%, due 4/2/07 to 3/9/26; Federal Home Loan Mortgage Corp., 0.00% to 7.00%, due 4/2/07 to 3/15/31; Federal National Mortgage Association, 0.00% to 7.13%, due 4/5/07 to 3/17/31; Tennessee Valley Authority, 4.88%, due 12/15/16, which had a total value of $1,611,974,119. The investment in the repurchase agreement is through participation in a joint account with affiliated parties pursuant to exemptive relief received by the Portfolio from the SEC. |
(h) | Variable/Floating Rate Security - Interest rate changes on these instruments are based on changes in a designated base rate. The rates shown are those in effect on March 31, 2007. |
AUD | Australian Dollar |
CAD | Canadian Dollar |
DKK | Danish Krone |
EUR | Euro |
GBP | British Pound |
JPY | Japanese Yen |
MXN | Mexican New Peso |
NOK | Norwegian Krone |
PLN | Polish Zloty |
SEK | Swedish Krona |
The accompanying notes are an integral part of the financial statements.
57
2007 Semi-Annual Report |
| |
March 31, 2007 (unaudited) |
Portfolio of Investments (cont’d)
International Fixed Income Portfolio
Foreign Currency Exchange Contract Information:
The Portfolio had the following foreign currency exchange contract(s) open at period end:
| | | | | | | | | | Net | |
Currency | | | | | | In | | | | Unrealized | |
to | | | | | | Exchange | | | | Appreciation | |
Deliver | | Value | | Settlement | | For | | Value | | (Depreciation) | |
(000) | | (000) | | Date | | (000) | | (000) | | (000) | |
CAD | 1,100 | | $ | 953 | | 4/10/07 | | USD | 937 | | $ | 937 | | $ | (16 | ) |
CAD | 1,200 | | 1,040 | | 4/10/07 | | USD | 1,042 | | 1,042 | | 2 | |
CHF | 2,365 | | 1,948 | | 4/11/07 | | USD | 1,936 | | 1,936 | | (12 | ) |
DKK | 7,400 | | 1,327 | | 4/11/07 | | USD | 1,296 | | 1,296 | | (31 | ) |
DKK | 7,000 | | 1,255 | | 4/11/07 | | USD | 1,217 | | 1,217 | | (38 | ) |
EUR | 500 | | 668 | | 4/12/07 | | USD | 651 | | 651 | | (17 | ) |
EUR | 385 | | 514 | | 4/16/07 | | USD | 500 | | 500 | | (14 | ) |
EUR | 500 | | 668 | | 4/16/07 | | USD | 652 | | 652 | | (16 | ) |
EUR | 135 | | 180 | | 4/16/07 | | USD | 176 | | 176 | | (4 | ) |
EUR | 300 | | 401 | | 4/16/07 | | USD | 392 | | 392 | | (9 | ) |
EUR | 1,750 | | 2,338 | | 4/16/07 | | USD | 2,294 | | 2,294 | | (44 | ) |
GBP | 775 | | 1,525 | | 4/18/07 | | USD | 1,524 | | 1,524 | | (1 | ) |
GBP | 2,650 | | 5,215 | | 4/18/07 | | USD | 5,222 | | 5,222 | | 7 | |
GBP | 1,625 | | 3,198 | | 4/18/07 | | USD | 3,168 | | 3,168 | | (30 | ) |
GBP | 500 | | 984 | | 4/18/07 | | USD | 978 | | 978 | | (6 | ) |
JPY | 50,000 | | 425 | | 4/12/07 | | USD | 419 | | 419 | | (6 | ) |
JPY | 125,000 | | 1,062 | | 4/12/07 | | USD | 1,041 | | 1,041 | | (21 | ) |
JPY | 995,000 | | 8,454 | | 4/12/07 | | USD | 8,312 | | 8,312 | | (142 | ) |
JPY | 120,000 | | 1,020 | | 4/12/07 | | USD | 997 | | 997 | | (23 | ) |
MXN | 6,875 | | 623 | | 4/10/07 | | USD | 614 | | 614 | | (9 | ) |
PLN | 9,775 | | 3,378 | | 4/12/07 | | USD | 3,270 | | 3,270 | | (108 | ) |
TWD | 26,775 | | 809 | | 4/11/07 | | USD | 812 | | 812 | | 3 | |
USD | 226 | | 226 | | 4/02/07 | | EUR | 170 | | 227 | | 1 | |
USD | 436 | | 436 | | 4/4/07 | | NOK | 2,662 | | 438 | | 2 | |
USD | 509 | | 509 | | 4/8/07 | | KRW | 475,000 | | 505 | | (4 | ) |
USD | 39 | | 39 | | 4/10/07 | | AUD | 50 | | 40 | | 1 | |
USD | 625 | | 625 | | 4/10/07 | | MXN | 6,875 | | 623 | | (2 | ) |
USD | 510 | | 510 | | 4/10/07 | | MYR | 1,775 | | 514 | | 4 | |
USD | 1,921 | | 1,921 | | 4/11/07 | | CHF | 2,365 | | 1,948 | | 27 | |
USD | 96 | | 96 | | 4/11/07 | | SEK | 675 | | 97 | | 1 | |
USD | 8,450 | | 8,450 | | 4/12/07 | | JPY | 1,000,000 | | 8,497 | | 47 | |
USD | 8,669 | | 8,669 | | 4/12/07 | | JPY | 1,025,000 | | 8,710 | | 41 | |
USD | 1,259 | | 1,259 | | 4/12/07 | | JPY | 150,000 | | 1,275 | | 16 | |
USD | 2,138 | | 2,138 | | 4/12/07 | | JPY | 260,000 | | 2,209 | | 71 | |
USD | 413 | | 413 | | 4/12/07 | | JPY | 50,000 | | 425 | | 12 | |
USD | 1,000 | | 1,000 | | 4/12/07 | | JPY | 120,000 | | 1,020 | | 20 | |
USD | 500 | | 500 | | 4/12/07 | | JPY | 60,000 | | 510 | | 10 | |
USD | 553 | | 553 | | 4/12/07 | | JPY | 65,000 | | 552 | | (1 | ) |
USD | 2,119 | | 2,119 | | 4/12/07 | | JPY | 250,000 | | 2,122 | | 3 | |
USD | 784 | | 784 | | 4/12/07 | | SGD | 1,200 | | 791 | | 7 | |
USD | 448 | | 448 | | 4/12/07 | | SGD | 685 | | 452 | | 4 | |
USD | 9,544 | | 9,544 | | 4/16/07 | | EUR | 7,355 | | 9,830 | | 286 | |
USD | 403 | | 403 | | 4/16/07 | | EUR | 310 | | 414 | | 11 | |
USD | 699 | | 699 | | 4/16/07 | | EUR | 535 | | 715 | | 16 | |
USD | 1,029 | | 1,029 | | 4/16/07 | | EUR | 780 | | 1,043 | | 14 | |
USD | 211 | | 211 | | 4/16/07 | | EUR | 160 | | 214 | | 3 | |
USD | 2,011 | | 2,011 | | 4/16/07 | | EUR | 1,525 | | 2,038 | | 27 | |
USD | 1,009 | | 1,009 | | 4/16/07 | | EUR | 765 | | 1,022 | | 13 | |
USD | 627 | | 627 | | 4/16/07 | | EUR | 475 | | 635 | | 8 | |
USD | 318 | | 318 | | 4/16/07 | | EUR | 240 | | 321 | | 3 | |
USD | 960 | | 960 | | 4/16/07 | | EUR | 725 | | 969 | | 9 | |
USD | 2,105 | | 2,105 | | 4/16/07 | | EUR | 1,600 | | 2,137 | | 32 | |
USD | 1,022 | | 1,022 | | 4/16/07 | | HUF | 190,000 | | 1,023 | | 1 | |
USD | 1,506 | | 1,506 | | 4/16/07 | | PLN | 4,375 | | 1,512 | | 6 | |
USD | 930 | | 930 | | 4/16/07 | | PLN | 2,700 | | 933 | | 3 | |
| | | $ | 91,054 | | | | | | | $ | 91,211 | | $ | 157 | |
CHF — Swiss Franc
HUF — Hungarian Forint
KRW — Korean Won
MYR — Malaysian Ringgit
SGD — Singapore Dollar
TWD — Taiwan Dollar
USD — United States Dollar
Futures Contracts:
The Portfolio had the following futures contract(s) open at period end:
| | | | | | | | Net | |
| | | | | | | | Unrealized | |
| | Number | | | | | | Appreciation | |
| | of | | Value | | Expiration | | (Depreciation) | |
| | Contracts | | (000) | | Date | | (000) | |
Short: | | | | | | | | | |
Euro-Bund | | 23 | | $ | 3,531 | | Jun - 07 | | $ | 35 | |
| | | | | | | | | | | |
Graphic Presentation of Portfolio Holdings
The following graph depicts the Portfolio’s holdings by country and/or security type, as a percentage of total investments.
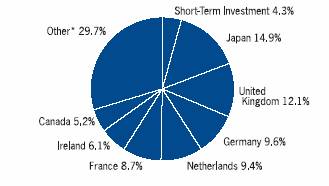
* Countries and/or investment types which do not appear in the above graph, as well as those which represent less than 5% of total investments, if applicable, are included in the category labeled “Other”.
The accompanying notes are an integral part of the financial statements.
58
2007 Semi-Annual Report |
| |
March 31, 2007 (unaudited) |
Portfolio of Investments
Investment Grade Fixed Income Portfolio
| | | | Face | | | |
| | | | Amount | | Value | |
| | | | (000) | | (000) | |
Fixed Income Securities (97.1%) | | | | | | | |
Agency Adjustable Rate Mortgages (0.5%) | | | | | | | |
Government National Mortgage Association, | | | | | | | |
Adjustable Rate Mortgages: | | | | | | | |
5.38%, 2/20/25 - 2/20/28 | | | | $ | 2,038 | | $ | 2,064 | |
5.75%, 7/20/25 | | | | 36 | | 37 | |
6.13%, 11/20/25 - 12/20/27 | | | | 461 | | 468 | |
| | | | | | 2,569 | |
Agency Fixed Rate Mortgages (16.9%) | | | | | | | |
Federal Home Loan Mortgage Corp., | | | | | | | |
Conventional Pools: | | | | | | | |
4.77%, 7/1/35 | | | | 2,613 | | 2,595 | |
5.70%, 4/1/37 | | | | 2,475 | | 2,486 | |
5.76%, 1/1/37 | | | | 3,925 | | 3,954 | |
10.00%, 9/1/17 - 11/1/20 | | | | 42 | | 45 | |
10.25%, 7/1/09 | | | | 6 | | 7 | |
11.00%, 1/1/16 | | | | 16 | | 17 | |
13.00%, 9/1/10 | | | | | | | |
Gold Pools: | | | | | | | |
5.86%, 10/1/36 | | | | 2,950 | | 2,976 | |
6.00%, 2/1/32 - 4/1/32 | | | | 85 | | 86 | |
6.50%, 7/1/25 - 3/1/32 | | | | 408 | | 420 | |
7.00%, 2/1/26 | | | | 23 | | 24 | |
7.50%, 5/1/16 - 6/1/32 | | | | 3,683 | | 3,855 | |
8.00%, 11/1/29 - 10/1/31 | | | | 749 | | 788 | |
8.50%, 12/1/30 | | | | 147 | | 158 | |
10.00%, 10/1/19 - 1/1/21 | | | | 64 | | 71 | |
10.50%, 3/1/16 | | | | 36 | | 38 | |
Federal National Mortgage Association, | | | | | | | |
5.38%, 12/25/36 | | | | 2,113 | | 2,112 | |
7.50%, 9/1/35 | | | | 2,231 | | 2,335 | |
Conventional Pools: | | | | | | | |
6.00%, 10/1/31 - 12/1/31 | | | | 134 | | 136 | |
6.50%, 6/1/26 - 9/1/32 | | | | 1,463 | | 1,506 | |
7.00%, 11/1/25 - 6/1/36 | | | | 24,162 | | 25,084 | |
7.46%, 5/1/36 | | | | 3,735 | | 3,838 | |
7.49%, 7/1/36 - 8/1/36 | | | | 5,877 | | 6,050 | |
7.50%, 5/1/23 - 12/1/32 | | | | 4,052 | | 4,240 | |
8.00%, 2/1/12 - 4/1/32 | | | | 2,849 | | 3,008 | |
8.50%, 4/1/30 - 5/1/32 | | | | 2,482 | | 2,673 | |
9.00%, 2/1/17 | | | | 86 | | 92 | |
9.50%, 8/1/22 | | | | 113 | | 122 | |
10.00%, 3/1/20 - 5/1/22 | | | | 159 | | 174 | |
10.50%, 12/1/17 - 10/1/18 | | | | 41 | | 45 | |
11.00%, 4/1/21 | | | | 62 | | 68 | |
11.25%, 8/1/13 | | | | 45 | | 50 | |
11.50%, 1/1/17 - 11/1/19 | | | | 34 | | 37 | |
April TBA | | | | | | | |
7.00%, 4/25/37 | | | | (i)3,650 | | 3,765 | |
May TBA | | | | | | | |
7.00%, 5/25/37 | | | | (i)11,875 | | 12,239 | |
Government National Mortgage Association, | | | | | | | |
Various Pools: | | | | | | | |
9.00%, 11/15/17 | | | | $ | 193 | | $ | 207 | |
9.50%, 12/15/17 - 9/15/22 | | | | 727 | | 791 | |
10.00%, 11/15/09 - 2/15/25 | | | | 1,146 | | 1,275 | |
10.50%, 3/15/19 | | | | 4 | | 4 | |
11.00%, 3/15/10 - 2/15/16 | | | | 125 | | 140 | |
11.50%, 1/20/18 | | | | 2 | | 2 | |
| | | | | | 87,513 | |
Asset Backed Corporates (27.5%) | | | | | | | |
Aegis Asset Backed Securities Trust | | | | | | | |
5.43%, 10/25/35 | | | | (h)104 | | 104 | |
American Express Credit Account Master Trust | | | | | | | |
5.32%, 10/15/12 | | | | (h)2,375 | | 2,375 | |
5.43%, 12/15/09 | | | | (h)2,000 | | 2,002 | |
Argent Securities, Inc. | | | | | | | |
5.37%, 10/25/36 | | | | (h)3,006 | | 3,008 | |
Banc of America Securities Auto Trust | | | | | | | |
3.99%, 8/18/09 | | | | 2,816 | | 2,800 | |
Bear Stearns Asset Backed Securities, Inc. | | | | | | | |
5.44%, 8/25/35 | | | | (h)438 | | 439 | |
5.52%, 9/25/34 | | | | (h)593 | | 594 | |
5.54%, 3/25/35 | | | | (h)731 | | 731 | |
Capital Auto Receivables Asset Trust | | | | | | | |
4.05%, 7/15/09 | | | | 2,921 | | 2,908 | |
4.98%, 5/15/11 | | | | 3,825 | | 3,825 | |
5.31%, 10/20/09 | | | | (e)4,600 | | 4,606 | |
5.40%, 1/15/08 | | | | (h)209 | | 209 | |
Capital One Auto Finance Trust | | | | | | | |
5.07%, 7/15/11 | | | | 2,025 | | 2,026 | |
Carrington Mortgage Loan Trust | | | | | | | |
5.40%, 3/25/47 | | | | (h)2,700 | | 2,700 | |
5.44%, 10/25/35 | | | | (h)64 | | 64 | |
Caterpillar Financial Asset Trust | | | | | | | |
3.90%, 2/25/09 | | | | 1,636 | | 1,628 | |
5.57%, 5/25/10 | | | | 3,200 | | 3,223 | |
CIT Equipment Collateral | | | | | | | |
3.50%, 9/20/08 | | | | 374 | | 371 | |
Citibank Credit Card Issuance Trust | | | | | | | |
5.34%, 3/22/12 | | | | (c)(h)2,900 | | 2,900 | |
CNH Equipment Trust | | | | | | | |
4.02%, 4/15/09 | | | | 1,779 | | 1,771 | |
4.27%, 1/15/10 | | | | 3,894 | | 3,865 | |
5.20%, 6/15/10 | | | | 1,775 | | 1,779 | |
Countrywide Asset-Backed Certificates | | | | | | | |
5.47%, 7/25/25 | | | | (h)1,589 | | 1,590 | |
Daimler Chrysler Auto Trust | | | | | | | |
4.04%, 9/8/09 | | | | 1,626 | | 1,618 | |
First Franklin Mortgage Loan Asset Backed Certificates | | | | | | | |
5.37%, 7/25/36 | | | | (h)2,135 | | 2,136 | |
5.39%, 2/25/36 | | | | (h)1,534 | | 1,535 | |
5.42%, 7/25/35 | | | | (h)579 | | 580 | |
5.44%, 10/25/35 | | | | (h)1,267 | | 1,268 | |
The accompanying notes are an integral part of the financial statements.
59
2007 Semi-Annual Report |
| |
March 31, 2007 (unaudited) |
Portfolio of Investments (cont’d)
Investment Grade Fixed Income Portfolio
| | | | Face | | | |
| | | | Amount | | Value | |
| | | | (000) | | (000) | |
Asset Backed Corporates (cont’d) | | | | | | | |
Ford Credit Auto Owner Trust | | | | | | | |
4.17%, 1/15/09 | | | | $ | 1,049 | | $ | 1,045 | |
5.05%, 3/15/10 | | | | 1,750 | | 1,748 | |
5.26%, 10/15/10 | | | | 4,000 | | 4,011 | |
Fremont Home Loan Owner Trust | | | | | | | |
5.37%, 10/25/36 | | | | (h)3,504 | | 3,504 | |
GE Dealer Floorplan Master Note Trust | | | | | | | |
5.40%, 7/20/09 | | | | (h)2,500 | | 2,502 | |
GE Equipment Small Ticket LLC | | | | | | | |
4.38%, 7/22/09 | | | | (e)2,591 | | 2,577 | |
4.88%, 10/22/09 | | | | (e)3,075 | | 3,068 | |
GS Auto Loan Trust | | | | | | | |
5.37%, 12/15/10 | | | | 3,375 | | 3,388 | |
GSAMP Trust | | | | | | | |
5.39%, 1/25/37 | | | | (h)2,330 | | 2,331 | |
5.40%, 4/25/47 | | | | 3,100 | | 3,100 | |
Harley-Davidson Motorcycle Trust | | | | | | | |
3.76%, 12/17/12 | | | | 3,800 | | 3,724 | |
4.07%, 2/15/12 | | | | 2,300 | | 2,270 | |
Hertz Vehicle Financing LLC | | | | | | | |
4.93%, 2/25/10 | | | | (e)1,825 | | 1,820 | |
Honda Auto Receivables Owner Trust | | | | | | | |
3.87%, 4/20/09 | | | | 2,127 | | 2,113 | |
3.93%, 1/15/09 | | | | 1,000 | | 995 | |
4.85%, 10/19/09 | | | | 2,475 | | 2,470 | |
Hyundai Auto Receivables Trust | | | | | | | |
3.98%, 11/16/09 | | | | 2,200 | | 2,184 | |
Indymac Residential Asset Backed Trust | | | | | | | |
5.45%, 4/25/37 | | | | (h)2,450 | | 2,450 | |
Lehman Brothers Floating Rate Commercial Mortgage Trust | | | | | | | |
5.44%, 9/15/21 | | | | (h)2,296 | | 2,298 | |
Long Beach Mortgage Loan Trust | | | | | | | |
5.41%, 1/25/36 | | | | (h)880 | | 881 | |
MBNA Credit Card Master Note Trust | | | | | | | |
5.46%, 2/15/10 | | | | (h)3,200 | | 3,204 | |
MBNA Master Credit Card Trust USA | | | | | | | |
5.90%, 8/15/11 | | | | 940 | | 958 | |
7.80%, 10/15/12 | | | | 2,715 | | 2,944 | |
Merrill Auto Trust Securitization | | | | | | | |
4.10%, 8/25/09 | | | | 2,957 | | 2,941 | |
National City Auto Receivables Trust | | | | | | | |
2.88%, 5/15/11 | | | | 2,307 | | 2,269 | |
Nationstar Home Equity Loan Trust | | | | | | | |
6.02%, 9/25/36 | | | | (h)2,196 | | 2,198 | |
Nissan Auto Receivables Owner Trust | | | | | | | |
3.99%, 7/15/09 | | | | 2,584 | | 2,568 | |
RAAC Series | | | | | | | |
5.42%, 9/25/45 | | | | (h)993 | | 994 | |
Residential Asset Mortgage Products, Inc. | | | | | | | |
5.39%, 6/25/29 | | | | (h)2,816 | | 2,818 | |
5.43%, 2/25/30 | | | | 2,400 | | 2,400 | |
Securitized Asset Backed Receivables LLC Trust | | | | | | | |
5.39%, 12/25/35 | | | | $ | (h)838 | | $ | 838 | |
SLM Student Loan Trust | | | | | | | |
5.32%, 10/25/14 | | | | (h)3,525 | | 3,527 | |
Soundview Home Equity Loan Trust | | | | | | | |
5.43%, 2/25/37 | | | | (h)2,625 | | 2,624 | |
Specialty Underwriting & Residential Finance | | | | | | | |
5.44%, 6/25/36 | | | | (h)375 | | 375 | |
Structured Asset Securities Corp. | | | | | | | |
5.52%, 6/25/35 | | | | (h)870 | | 870 | |
Terwin Mortgage Trust | | | | | | | |
5.44%, 7/25/35 | | | | (e)(h)2 | | 2 | |
5.79%, 12/25/34 | | | | (h)410 | | 411 | |
TXU Electric Delivery Transition Bond Co. | | | | | | | |
4.81%, 11/17/14 | | | | 700 | | 697 | |
USAA Auto Owner Trust | | | | | | | |
3.90%, 7/15/09 | | | | 1,376 | | 1,369 | |
Volkswagen Auto Loan Enhanced Trust | | | | | | | |
4.80%, 7/20/09 | | | | 3,109 | | 3,102 | |
Wachovia Auto Owner Trust | | | | | | | |
2.91%, 4/20/09 | | | | 359 | | 356 | |
4.06%, 9/21/09 | | | | 1,260 | | 1,253 | |
Wachovia Bank Commercial Mortgage Trust | | | | | | | |
5.44%, 9/15/21 | | | | (h)2,450 | | 2,451 | |
World Omni Auto Receivables Trust | | | | | | | |
3.29%, 11/12/08 | | | | (c)206 | | 206 | |
| | | | | | 142,509 | |
Collateralized Mortgage Obligations — Agency Collateral Series (0.7%) | | | | | | | |
Federal Home Loan Mortgage Corp. | | | | | | | |
Inv Fl IO | | | | | | | |
0.63%, 3/15/24 | | | | 2,615 | | 67 | |
2.68%, 3/15/32 | | | | 520 | | 44 | |
IO | | | | | | | |
6.00%, 5/1/31 | | | | 1,072 | | 207 | |
6.50%, 4/1/28 - 5/15/33 | | | | 2,003 | | 426 | |
8.00%, 1/1/28 - 6/1/31 | | | | 207 | | 46 | |
IO PAC | | | | | | | |
6.00%, 5/15/30 - 4/15/32 | | | | 1,835 | | 177 | |
PAC | | | | | | | |
10.00%, 6/15/20 | | | | 15 | | 16 | |
Federal National Mortgage Association | | | | | | | |
Inv Fl IO | | | | | | | |
2.78%, 12/25/29 | | | | 37 | | | |
2.88%, 10/25/28 | | | | 404 | | 14 | |
3.13%, 5/18/27 | | | | 787 | | 72 | |
3.20%, 10/25/30 | | | | 206 | | 10 | |
IO | | | | | | | |
6.00%, 8/25/32 - 11/25/32 | | | | 1,569 | | 197 | |
6.50%, 2/25/33 - 6/25/33 | | | | 5,211 | | 1,131 | |
7.00%, 4/25/33 | | | | 768 | | 181 | |
7.50%, 11/1/29 | | | | 1,061 | | 305 | |
8.00%, 4/1/24 - 12/1/31 | | | | 855 | | 203 | |
9.00%, 11/1/26 | | | | 92 | | 22 | |
The accompanying notes are an integral part of the financial statements.
60
2007 Semi-Annual Report |
| |
March 31, 2007 (unaudited) |
Portfolio of Investments (cont’d)
Investment Grade Fixed Income Portfolio
| | | | Face | | | |
| | | | Amount | | Value | |
| | | | (000) | | (000) | |
Collateralized Mortgage Obligations — Agency Collateral Series (cont’d) | | | | | | | |
Government National Mortgage Association | | | | | | | |
Inv Fl IO | | | | | | | |
3.28%, 8/16/29 | | | | $ | 551 | | $ | 34 | |
GS Mortgage Securities Corp. | | | | | | | |
IO | | | | | | | |
2.57%, 3/25/36 | | | | (e)(h)6,312 | | 249 | |
| | | | | | 3,401 | |
Collateralized Mortgage Obligations — Non Agency Collateral Series (1.7%) | | | | | | | |
Countrywide Alternative Loan Trust | | | | | | | |
1.95%, 3/20/47 | | | | 24,978 | | 1,387 | |
2.25%, 10/25/46 | | | | 17,101 | | 856 | |
IO | | | | | | | |
1.54%, 2/25/37 | | | | 12,815 | | 677 | |
1.70%, 12/20/46 | | | | 28,197 | | 1,401 | |
1.73%, 12/20/35 | | | | (e)(h)15,110 | | 412 | |
1.78%, 3/20/46 | | | | 12,330 | | 568 | |
2.71%, 12/20/35 | | | | (e)(h)16,648 | | 800 | |
Greenpoint Mortgage Funding Trust | | | | | | | |
IO | | | | | | | |
1.10%, 8/25/45 | | | | 8,677 | | 264 | |
1.91%, 10/25/45 | | | | 9,672 | | 292 | |
Harborview Mortgage Loan Trust | | | | | | | |
IO | | | | | | | |
0.97%, 6/19/35 | | | | (h)10,006 | | 227 | |
1.26%, 5/19/35 | | | | (h)14,658 | | 350 | |
1.63%, 3/19/37 | | | | (h)12,051 | | 531 | |
1.69%, 7/19/46 | | | | (h)20,586 | | 743 | |
PO | | | | | | | |
3/19/37 | | | | 6 | | 4 | |
7/19/47 | | | | @— | | @— | |
Indymac Index Mortgage Loan Trust | | | | | | | |
IO | | | | | | | |
0.91%, 7/25/35 | | | | (h)8,998 | | 285 | |
| | | | | | 8,797 | |
Finance (7.7%) | | | | | | | |
AIG SunAmerica Global Financing VI | | | | | | | |
6.30%, 5/10/11 | | | | (e)1,910 | | 1,996 | |
American General Finance Corp. | | | | | | | |
4.63%, 9/1/10 | | | | (c)915 | | 898 | |
AXA Financial, Inc. | | | | | | | |
6.50%, 4/1/08 | | | | 760 | | 768 | |
Bank of New York Co., Inc. (The) | | | | | | | |
3.80%, 2/1/08 | | | | 250 | | 247 | |
5.20%, 7/1/07 | | | | 285 | | 285 | |
Bank One Corp. | | | | | | | |
6.00%, 2/17/09 | | | | 1,350 | | 1,370 | |
Caterpillar Financial Services Corp. | | | | | | | |
3.63%, 11/15/07 | | | | 190 | | 188 | |
5.43%, 8/20/07 | | | | (h)895 | | 895 | |
Catlin Insurance Co., Ltd. | | | | | | | |
7.25% | | | | (e)(h)(o)925 | | 920 | |
CIT Group, Inc. | | | | | | | |
4.75%, 8/15/08 | | | | 490 | | 487 | |
7.38%, 4/2/07 | | | | $ | (c)195 | | $ | 195 | |
Citicorp Inc. | | | | | | | |
6.38%, 11/15/08 | | | | 705 | | 719 | |
Countrywide Home Loans, Inc. | | | | | | | |
3.25%, 5/21/08 | | | | 1,150 | | 1,124 | |
Farmers Exchange Capital | | | | | | | |
7.05%, 7/15/28 | | | | (c)(e)675 | | 694 | |
Farmers Insurance Exchange | | | | | | | |
8.63%, 5/1/24 | | | | (e)725 | | 864 | |
General Electric Capital Corp. | | | | | | | |
4.25%, 12/1/10 | | | | (c)445 | | 433 | |
HSBC Finance Corp. | | | | | | | |
4.13%, 12/15/08 | | | | 450 | | 442 | |
5.88%, 2/1/09 | | | | 345 | | 349 | |
6.38%, 10/15/11 | | | | 688 | | 718 | |
6.40%, 6/17/08 | | | | 465 | | 471 | |
6.75%, 5/15/11 | | | | 365 | | 385 | |
Huntington National Bank | | | | | | | |
4.38%, 1/15/10 | | | | 520 | | 508 | |
International Lease Finance Corp. | | | | | | | |
3.75%, 8/1/07 | | | | 500 | | 497 | |
iStar Financial, Inc. | | | | | | | |
5.69%, 3/9/10 | | | | (h)1,175 | | 1,176 | |
JPMorgan Chase & Co. | | | | | | | |
6.00%, 2/15/09 | | | | 640 | | 649 | |
M&I Marshall & Ilsley Bank | | | | | | | |
3.80%, 2/8/08 | | | | 1,365 | | 1,349 | |
Mantis Reef Ltd. | | | | | | | |
4.69%, 11/14/08 | | | | (e)1,100 | | 1,090 | |
MBNA Corp. | | | | | | | |
5.79%, 5/5/08 | | | | (h)995 | | 1,000 | |
Nationwide Building Society | | | | | | | |
4.25%, 2/1/10 | | | | (e)1,065 | | 1,040 | |
Platinum Underwriters Finance, Inc. | | | | | | | |
7.50%, 6/1/17 | | | | 550 | | 583 | |
Platinum Underwriters Holdings Ltd. | | | | | | | |
6.37%, 11/16/07 | | | | 585 | | 583 | |
Popular North America, Inc. | | | | | | | |
5.65%, 4/15/09 | | | | 455 | | 458 | |
Residential Capital Corp. | | | | | | | |
5.84%, 6/9/08 | | | | (h)1,125 | | 1,114 | |
6.38%, 6/30/10 | | | | 1,460 | | 1,461 | |
SLM Corp. | | | | | | | |
4.00%, 1/15/10 | | | | 705 | | 687 | |
Sovereign Bancorp Inc. | | | | | | | |
5.58%, 3/23/10 | | | | (h)1,540 | | 1,541 | |
Sovereign Bank | | | | | | | |
4.00%, 2/1/08 | | | | 105 | | 104 | |
St. Paul Travelers Cos., Inc. (The) | | | | | | | |
5.01%, 8/16/07 | | | | 855 | | 854 | |
Two-Rock Pass Through Trust | | | | | | | |
6.30% | | | | (e)(h)(o)645 | | 635 | |
Unicredit Luxembourg Finance S.A. | | | | | | | |
5.41%, 10/24/08 | | | | (e)(h)1,665 | | 1,666 | |
The accompanying notes are an integral part of the financial statements.
61
2007 Semi-Annual Report |
| |
March 31, 2007 (unaudited) |
Portfolio of Investments (cont’d)
Investment Grade Fixed Income Portfolio
| | | | Face | | | |
| | | | Amount | | Value | |
| | | | (000) | | (000) | |
Finance (cont’d) | | | | | | | |
USB Capital IX | | | | | | | |
6.19% | | | | $ | (h)(o)1,255 | | $ | 1,288 | |
Wachovia Capital Trust Ill | | | | | | | |
5.80% | | | | (e)(h)(o)2,545 | | 2,578 | |
Washington Mutual Bank FA | | | | | | | |
5.50%, 1/15/13 | | | | 170 | | 170 | |
Washington Mutual, Inc. | | | | | | | |
6.67% | | | | (e)(h)(o)300 | | 295 | |
8.25%, 4/1/10 | | | | 920 | | 995 | |
World Financial Properties | | | | | | | |
6.91%, 9/1/13 | | | | (e)1,826 | | 1,918 | |
Xlliac Global Funding | | | | | | | |
4.80%, 8/10/10 | | | | (e)1,110 | | 1,095 | |
| | | | | | 39,782 | |
Industrials (5.9%) | | | | | | | |
America West Airlines, Inc. | | | | | | | |
7.10%, 4/2/21 | | | | 1,107 | | 1,176 | |
Brookfield Asset Management, Inc. | | | | | | | |
7.13%, 6/15/12 | | | | 865 | | 927 | |
Burlington Northern Santa Fe Corp. | | | | | | | |
6.13%, 3/15/09 | | | | 540 | | 548 | |
Clorox Co. | | | | | | | |
5.48%, 12/14/07 | | | | (h)920 | | 921 | |
Comcast Cable Communications, Inc. | | | | | | | |
6.75%, 1/30/11 | | | | 440 | | 464 | |
7.13%, 6/15/13 | | | | 145 | | 157 | |
ConAgra Foods, Inc. | | | | | | | |
7.00%, 10/1/28 | | | | 280 | | 299 | |
8.25%, 9/15/30 | | | | 365 | | 446 | |
Consumers Energy Co. | | | | | | | |
4.80%, 2/17/09 | | | | 625 | | 620 | |
Cooper Industries, Inc. | | | | | | | |
5.25%, 7/1/07-11/15/12 | | | | 1,430 | | 1,428 | |
CVS/Caremark Corp. | | | | | | | |
5.75%, 8/15/11 | | | | 235 | | 240 | |
6.04%, 12/10/28 | | | | (e)1,278 | | 1,297 | |
DaimlerChrysler N.A. Holding Corp. | | | | | | | |
8.50%, 1/18/31 | | | | 430 | | 539 | |
FBG Finance Ltd. | | | | | | | |
5.13%, 6/15/15 | | | | (e)795 | | 764 | |
Federated Department Stores, Inc. | | | | | | | |
6.30%, 4/1/09 | | | | 370 | | 378 | |
FedEx Corp. | | | | | | | |
2.65%, 4/1/07 | | | | 550 | | 550 | |
France Telecom S.A. | | | | | | | |
8.50%, 3/1/31 | | | | (c)790 | | 1,030 | |
Fred Meyer, Inc. | | | | | | | |
7.45%, 3/1/08 | | | | 765 | | 780 | |
Hewlett Packard Co. | | | | | | | |
5.49%, 5/22/09 | | | | (h)785 | | 786 | |
Hyatt Equities LLC | | | | | | | |
6.88%, 6/15/07 | | | | (e)680 | | 681 | |
ICI Wilmington, Inc. | | | | | | | |
4.38%, 12/1/08 | | | | $ | 505 | | $ | 498 | |
LG Electronics, Inc. | | | | | | | |
5.00%, 6/17/10 | | | | (e)520 | | 513 | |
May Department Stores Co. | | | | | | | |
6.70%, 7/15/34 | | | | (c)770 | | 762 | |
Miller Brewing Co. | | | | | | | |
4.25%, 8/15/08 | | | | (e)800 | | 788 | |
Mohawk Industries, Inc. | | | | | | | |
7.20%, 4/15/12 | | | | 450 | | 477 | |
Norfolk Southern Corp. | | | | | | | |
7.35%, 5/15/07 | | | | 505 | | 506 | |
Sara Lee Corp. | | | | | | | |
6.13%, 11/1/32 | | | | (c)850 | | 788 | |
SBC Communications, Inc. | | | | | | | |
6.15%, 9/15/34 | | | | (c)545 | | 538 | |
Sprint Capital Corp. | | | | | | | |
8.75%, 3/15/32 | | | | 220 | | 260 | |
Systems 2001 Asset Trust LLC | | | | | | | |
6.66%, 9/15/13 | | | | (e)1,173 | | 1,237 | |
Telecom Italia Capital S.A. | | | | | | | |
4.00%, 1/15/10 | | | | 1,100 | | 1,063 | |
Telefonica Europe BV | | | | | | | |
8.25%, 9/15/30 | | | | 885 | | 1,063 | |
Textron Financial Corp. | | | | | | | |
4.13%, 3/3/08 | | | | 510 | | 505 | |
5.13%, 2/3/11 | | | | (c)750 | | 750 | |
The Home Depot, Inc. | | | | | | | |
5.48%, 12/16/09 | | | | (h)475 | | 476 | |
Time Warner, Inc. | | | | | | | |
5.59%, 11/13/09 | | | | (h)1,580 | | 1,584 | |
Union Pacific Corp. | | | | | | | |
6.63%, 2/1/08 | | | | 370 | | 374 | |
6.79%, 11/9/07 | | | | 225 | | 227 | |
UnitedHealth Group, Inc. | | | | | | | |
4.13%, 8/15/09 | | | | 440 | | 431 | |
5.43%, 3/2/09 | | | | (h)615 | | 615 | |
Valero Energy Corp. | | | | | | | |
3.50%, 4/1/09 | | | | 575 | | 558 | |
Verizon New England, Inc. | | | | | | | |
6.50%, 9/15/11 | | | | 610 | | 637 | |
Viacom, Inc. | | | | | | | |
6.88%, 4/30/36 | | | | 755 | | 763 | |
Vodafone Group plc | | | | | | | |
5.44%, 12/28/07 | | | | (h)745 | | 745 | |
Yum! Brands, Inc. | | | | | | | |
8.88%, 4/15/11 | | | | 450 | | 506 | |
| | | | | | 30,695 | |
Mortgages — Other (28.6%) | | | | | | | |
American Home Mortgage Assets | | | | | | | |
5.45%, 3/25/47 | | | | (h)3,400 | | 3,394 | |
5.51%, 10/25/46 | | | | (h)4,208 | | 4,216 | |
5.55%, 9/25/46 | | | | (h)3,212 | | 3,224 | |
The accompanying notes are an integral part of the financial statements.
62
2007 Semi-Annual Report |
| |
March 31, 2007 (unaudited) |
Portfolio of Investments (cont’d)
Investment Grade Fixed Income Portfolio
| | | | Face | | | |
| | | | Amount | | Value | |
| | | | (000) | | (000) | |
Mortgages - Other (cont’d) | | | | | | | |
Banc of America Funding Corp. | | | | | | | |
5.67%, 9/20/35 | | | | $ | (h)1,119 | | $ | 1,124 | |
Bear Stearns Mortgage Securities, Inc. | | | | | | | |
5.45%, 2/25/37 | | | | (h)3,125 | | 3,125 | |
5.52%, 9/25/36 | | | | (h)2,547 | | 2,539 | |
5.57%, 7/25/36 | | | | (h)2,661 | | 2,658 | |
California Federal Savings & Loan Association | | | | | | | |
8.80%, 1/25/14 | | | | (k)2 | | 2 | |
Countrywide Alternative Loan Trust | | | | | | | |
5.51%, 10/25/46 - 11/25/46 | | | | (h)5,757 | | 5,756 | |
5.58%, 11/20/35 | | | | (h)1,219 | | 1,220 | |
5.59%, 7/25/46 | | | | (h)1,868 | | 1,876 | |
5.63%, 3/20/46 | | | | (h)1,837 | | 1,841 | |
5.71%, 12/20/35 | | | | (h)2,528 | | 2,539 | |
5.73%, 11/20/35 | | | | (h)1,788 | | 1,799 | |
6.50%, 10/25/46 | | | | (e)1,148 | | 1,147 | |
6.68%, 2/25/36 | | | | (h)2,528 | | 2,555 | |
Deutsche ALT-A Securities Alternate Loan Trust | | | | | | | |
5.47%, 2/25/47 | | | | (h)4,070 | | 4,070 | |
Deutsche ALT-A Securities NIM Trust | | | | | | | |
6.75%, 2/25/47 | | | | (e)1,568 | | 1,562 | |
Downey Savings & Loan Association Mortgage Loan Trust | | | | | | | |
5.52%, 10/19/36 | | | | (h)3,311 | | 3,320 | |
5.92%, 4/19/46 | | | | (h)2,809 | | 2,812 | |
Greenpoint Mortgage Funding Trust | | | | | | | |
5.50%, 1/25/37 | | | | (h)3,603 | | 3,597 | |
5.50%, 5/25/47 | | | | 3,800 | | 3,800 | |
5.51%, 3/25/47 | | | | (h)3,550 | | 3,551 | |
5.64%, 3/25/36 | | | | (h)2,391 | | 2,395 | |
GS Mortgage Securities Corp. | | | | | | | |
6.25%, 1/25/37 | | | | (e)1,519 | | 1,514 | |
GSR Mortgage Loan Trust | | | | | | | |
5.51%, 8/25/46 | | | | (h)3,133 | | 3,137 | |
Harborview Mortgage Loan Trust | | | | | | | |
5.41%, 1/19/38 | | | | (h)1,142 | | 1,143 | |
5.45%, 3/19/37 | | | | (h)2,551 | | 2,554 | |
5.47%, 3/19/38 | | | | (h)2,471 | | 2,473 | |
5.50%, 11/19/36 | | | | (h)3,437 | | 3,425 | |
5.51%, 12/19/37 | | | | (h)3,773 | | 3,778 | |
5.52%, 7/21/36 - 3/19/38 | | | | (h)4,712 | | 4,706 | |
5.55%, 7/19/46 | | | | (h)2,320 | | 2,323 | |
5.57%, 10/19/37 | | | | 2,568 | | 2,575 | |
5.60%, 11/19/36 | | | | (h)3,312 | | 3,328 | |
5.61%, 7/19/45 | | | | (h)799 | | 802 | |
5.70%, 11/19/35 | | | | (h)1,405 | | 1,411 | |
Harborview NIM Corp. | | | | | | | |
6.41%, 3/19/37 - 3/19/38 | | | | (e)2,095 | | 2,089 | |
Indymac Index Mortgage Loan Trust | | | | | | | |
5.42%, 2/25/37 | | | | (h)3,031 | | 3,034 | |
5.44%, 7/25/46 | | | | (h)3,450 | | 3,465 | |
5.53%, 11/25/36 | | | | (h)2,019 | | 2,022 | |
5.70%, 10/25/36 | | | | (h)1,668 | | 1,677 | |
Luminent Mortgage Capital, Inc. | | | | | | | |
5.56%, 4/25/36 | | | | (h)1,909 | | 1,916 | |
Mastr Adjustable Rate Mortgages Trust | | | | | | | |
5.57%, 4/25/46 | | | | $ | (h)2,038 | | $ | 2,046 | |
Merrill Lynch Mortgage Investors, Inc. | | | | | | | |
5.44%, 8/25/35 | | | | (h)748 | | 749 | |
Residential Accredit Loans, Inc. | | | | | | | |
5.48%, 3/25/47 | | | | (h)4,750 | | 4,750 | |
5.51%, 12/25/36 | | | | (h)2,580 | | 2,594 | |
5.55%, 5/25/46 | | | | (h)1,679 | | 1,681 | |
5.58%, 2/25/46 | | | | (h)870 | | 872 | |
5.59%, 2/25/46 | | | | (h)929 | | 929 | |
Ryland Acceptance Corp. IV | | | | | | | |
6.65%, 7/1/11 | | | | 45 | | 45 | |
Structured Asset Mortgage Investments, Inc. | | | | | | | |
5.51%, 2/25/36 | | | | (h)879 | | 881 | |
5.52%, 10/25/36 | | | | (h)2,480 | | 2,486 | |
5.55%, 8/25/36 | | | | (h)2,743 | | 2,752 | |
5.59%, 4/25/36 | | | | (h)3,382 | | 3,398 | |
Wamu Alternative Mortgage Pass-Through Certificates | | | | | | | |
4.98%, 8/25/46 | | | | (h)2,418 | | 2,422 | |
5.92%, 4/25/46 | | | | (h)2,263 | | 2,266 | |
Washington Mutual, Inc. | | | | | | | |
5.40%, 6/25/46 | | | | (h)1,580 | | 1,582 | |
5.42%, 5/25/46 | | | | (h)953 | | 953 | |
5.57%, 11/25/45 - 12/25/45 | | | | (h)2,568 | | 2,573 | |
5.58%, 7/25/44 - 10/25/45 | | | | (h)1,074 | | 1,076 | |
5.61%, 8/25/45 | | | | (h)519 | | 520 | |
Zuni Mortgage Loan Trust | | | | | | | |
5.45%, 8/25/36 | | | | (h)2,099 | | 2,098 | |
| | | | | | 148,167 | |
U.S. Treasury Security (6.0%) | | | | | | | |
U.S. Treasury Strip | | | | | | | |
IO | | | | | | | |
Zero Coupon, 5/15/21 | | | | (c)62,315 | | 30,943 | |
Utilities (1.6%) | | | | | | | |
Ameren Corp. | | | | | | | |
4.26%, 5/15/07 | | | | 685 | | 684 | |
Arizona Public Service Co. | | | | | | | |
5.80%, 6/30/14 | | | | 745 | | 753 | |
Carolina Power & Light Co. | | | | | | | |
5.13%, 9/15/13 | | | | 760 | | 752 | |
CenterPoint Energy Resources Corp. | | | | | | | |
6.25%, 2/1/37 | | | | 225 | | 224 | |
Consolidated Natural Gas Co. | | | | | | | |
6.25%, 11/1/11 | | | | 355 | | 369 | |
Detroit Edison Co. | | | | | | | |
6.13%, 10/1/10 | | | | 380 | | 392 | |
Entergy Gulf States, Inc. | | | | | | | |
3.60%, 6/1/08 | | | | 345 | | 338 | |
5.76%, 12/1/09 | | | | (h)455 | | 455 | |
NiSource Finance Corp. | | | | | | | |
5.93%, 11/23/09 | | | | (h)535 | | 536 | |
Ohio Power Corp. | | | | | | | |
6.00%, 6/1/16 | | | | 740 | | 769 | |
The accompanying notes are an integral part of the financial statements.
63
2007 Semi-Annual Report |
| |
March 31, 2007 (unaudited) |
Portfolio of Investments (cont’d)
Investment Grade Fixed Income Portfolio
| | | | Face | | | |
| | | | Amount | | Value | |
| | | | (000) | | (000) | |
Utilities (cont’d) | | | | | | | |
Plains All American Pipeline LP | | | | | | | |
6.70%, 5/15/36 | | | | $ | 750 | | $ | 770 | |
Public Service Electric & Gas Co. | | | | | | | |
5.00%, 1/1/13 | | | | 580 | | 571 | |
Sempra Energy | | | | | | | |
4.62%, 5/17/07 | | | | 530 | | 529 | |
Texas Eastern Transmission LP | | | | | | | |
7.00%, 7/15/32 | | | | (c)425 | | 475 | |
Wisconsin Electric Power Co. | | | | | | | |
3.50%, 12/1/07 | | | | 540 | | 534 | |
| | | | | | 8,151 | |
Total Fixed Income Securities (Cost $504,066) | | | | | | 502,527 | |
| | | | | | | | | |
| | | | Shares | | | |
Preferred Stock (0.2%) | | | | | | | |
Mortgages — Other (0.2%) | | | | | | | |
Home Ownership Funding Corp. | | | | | | | |
13.33% (Cost $1,110) | | | | (e)7,150 | | 1,058 | |
Put Options Purchased (0.1%) | | | | | | | |
90 Day EuroDollar | | | | | | | |
6/07 @ $94.25 | | | | 1,287 | | 6 | |
6/07 @ $94.50 | | | | 176 | | 1 | |
9/07 @ $94.75 | | | | 276 | | 43 | |
12/07 @ $94.50 | | | | 83 | | 4 | |
12/07 @ $94.75 | | | | 1,479 | | 240 | |
Total Put Options Purchased (Cost $797) | | | | | | 294 | |
| | | | Face | | | |
| | | | Amount | | | |
| | | | (000) | | | |
Short-Term Investments (12.8%) | | | | | | | |
Short-Term Debt Securities held as Collateral on Loaned Securities (5.2%) | | | | | | | |
AIG Match Funding Corp., 5.30%, 4/17/07 | | | | $ | (h)603 | | 603 | |
Alliance & Leicester plc, 5.33%, 4/10/07 | | | | (h)431 | | 431 | |
Anglo Irish Bank Corp., plc, 5.35%, 7/9/07 | | | | 210 | | 210 | |
Bancaja, 5.36%, 4/19/07 | | | | (h)215 | | 215 | |
Bank of America Corp., 5.32%, 4/2/07 | | | | (h)689 | | 689 | |
Bank of New York Co., Inc., 5.32%, | | | | | | | |
4/10/07 | | | | (h)215 | | 215 | |
Bear Stearns & Co., Inc., 5.36%, 4/16/07 | | | | (h)431 | | 431 | |
BNP Paribas plc, 5.33%, 5/21/07 | | | | (h)431 | | 431 | |
CAM US Finance S.A. Unipersonal, | | | | | | | |
5.36%, 7/3/07 | | | | (h)861 | | 861 | |
CIC, New York, | | | | | | | |
5.30%, 4/3/07 | | | | (h)301 | | 301 | |
5.34%, 4/2/07 | | | | (h)431 | | 431 | |
CIT Group Holdings, 5.37%, 7/18/07 | | | | (h)775 | | 775 | |
Credit Suisse First Boston, New York, | | | | | | | |
5.29%, 5/15/07 | | | | 258 | | 258 | |
5.32%, 4/2/07 | | | | (h)431 | | 431 | |
Deutsche Bank Securities, Inc., | | | | | | | |
5.40%, 4/2/07 | | | | 1,722 | | 1,722 | |
5.46%, 4/2/07 | | | | 4,133 | | 4,133 | |
Dexia Bank, New York, 5.32%, 4/2/07 | | | | (h)431 | | 431 | |
First Tennessee Bank, 5.33%, 4/17/07 | | | | (h)215 | | 215 | |
| | | | | | | | |
| | | | Face | | | |
| | | | Amount | | Value | |
| | | | (000) | | (000) | |
Gemini Securitization Corp., 5.41%, | | | | | | | |
4/2/07 | | | | $ | 619 | | $ | 619 | |
Goldman Sachs Group, Inc., | | | | | | | |
5.37%, 4/16/07 | | | | (h)215 | | 215 | |
5.55%, 4/2/07 | | | | (h)405 | | 405 | |
HSBC Finance Corp., 5.33%, 4/10/07 | | | | (h)215 | | 215 | |
Mane Funding Corp., 5.29%, 4/10/07 | | | | 308 | | 308 | |
Manufacturers & Traders, 5.30%, 4/16/07 | | | | (h)258 | | 258 | |
Marshall & Ilsley Bank, 5.37%, 12/17/07 | | | | 432 | | 432 | |
Merrill Lynch & Co., 5.33%, 4/26/07 | | | | (h)226 | | 226 | |
Metropolitan Life Global Funding, | | | | | | | |
5.31%, 4/23/07 | | | | (h)646 | | 646 | |
Natexis Banques Populaires, New York, | | | | | | | |
5.33%, 4/2/07 | | | | (h)431 | | 431 | |
5.34%, 4/2/07 | | | | (h)431 | | 431 | |
National Australia Bank Ltd., 5.31%, | | | | | | | |
4/10/07 | | | | (h)327 | | 327 | |
National City Bank Cleveland, 5.32%, 4/2/07 | | | | (h)215 | | 215 | |
National Rural Utilities Cooperative Finance Corp., | | | | | | | |
5.31%, 4/2/07 | | | | (h)861 | | 861 | |
Nationwide Building Society, 5.43%, | | | | | | | |
6/28/07 | | | | (h)499 | | 499 | |
Nordea Bank, New York, 5.31%, 4/2/07 | | | | (h)646 | | 646 | |
Raiffeisen Zentralbank Oesterreich, | | | | | | | |
5.31%, 6/19/07 | | | | 255 | | 255 | |
Rheingold Securitization, 5.32%, 5/15/07 | | | | 382 | | 382 | |
Sedna Finance, Inc., 5.32%, 5/15/07 | | | | 110 | | 110 | |
Skandi, New York, 5.32%, 4/10/07 | | | | (h)431 | | 431 | |
Toronto Dominion, New York, 5.32%, 5/29/07 | | | | (h)431 | | 431 | |
Tulip Funding Corp., 5.36%, 4/30/07 | | | | 857 | | 857 | |
UBS Securities LLC, 5.40%, 4/2/07 | | | | 4,231 | | 4,231 | |
Unicredito Delaware, Inc., 5.32%, 4/16/07 | | | | (h)474 | | 474 | |
Unicredito Italiano Bank (Ireland) plc, 5.34% | | | | | | | |
4/10/07 | | | | (h)301 | | 301 | |
| | | | | | 26,989 | |
Repurchase Agreement (7.3%) | | | | | | | |
J.P. Morgan Securities, Inc., 5.28%, dated 3/30/07, due 04/2/07, repurchase price $37,997 | | | | (f)37,980 | | 37,980 | |
U.S. Treasury Security (0.3%) | | | | | | | |
U.S. Treasury Bill | | | | | | | |
4.98%, 7/12/07 | | | | (j)1,766 | | 1,766 | |
Total Short-Term Investments (Cost $66,735) | | | | | | 66,735 | |
Total Investments (110.2%) (Cost $572,708) | | | | | | | |
— Including $26,372 of Securities Loaned | | | | | | 570,614 | |
Liabilities in Excess of Other Assets (-10.2%) | | | | | | (53,034) | |
Net Assets (100%) | | | | | | $ | 517,580 | |
| | | | | | | | | |
(c) All or a portion of security on loan at March 31, 2007.
(e) 144A security — Certain conditions for public sale may exist. Unless otherwise noted, these securities are deemed to be liquid.
The accompanying notes are an integral part of the financial statements.
64
2007 Semi-Annual Report |
| |
March 31, 2007 (unaudited) |
Portfolio of Investments (cont’d)
Investment Grade Fixed Income Portfolio
(f) | Represents the Portfolio’s undivided interest in a joint repurchase agreement which has a total value of $1,580,364,000. The repurchase agreement was fully collateralized by U.S. government agency securities at the date of this Portfolio of Investments as follows: Federal Farm Credit Bank, 0.00% to 7.43%, due 5/7/07 to 3/2/21; Federal Home Loan Bank, 0.00% to 6.42%, due 4/2/07 to 3/9/26; Federal Home Loan Mortgage Corp., 0.00% to 7.00%, due 4/2/07 to 3/15/31; Federal National Mortgage Association, 0.00% to 7.13%, due 4/5/07 to 3/17/31; Tennessee Valley Authority, 4.88%, due 12/15/16, which had a total value of $1,611,974,119. The investment in the repurchase agreement is through participation in a joint account with affiliated parties pursuant to exemptive relief received by the Portfolio from the SEC. |
(h) | Variable/Floating Rate Security — Interest rate changes on these instruments are based on changes in a designated base rate. The rates shown are those in effect on March 31, 2007. |
(i) | Security is subject to delayed delivery. |
(j) | All or a portion of the security was pledged to cover margin requirements for futures contracts. |
(k) | Security has been deemed illiquid at March 31, 2007. |
(o) | Perpetual — Security does not have a predetermined maturity date. Rates for these securities are fixed for a period of time then revert to a floating rate. The interest rate shown is the rate in effect at March 31, 2007. |
@ | Face Amount/Value is less than $500. |
Inv Fl | Inverse Floating Rate — Interest rate fluctuates with an inverse relationship to an associated interest rate. Indicated rate is the effective rate at March 31, 2007. |
IO | Interest Only |
PAC | Planned Amortization Class |
PO | Principal Only |
TBA | To be Announced |
Futures Contracts:
The Portfolio had the following futures contract(s) open at period end:
| | | | | | | | Net | |
| | | | | | | | Unrealized | |
| | Number | | | | | | Appreciation | |
| | of | | Value | | Expiration | | (Depreciation) | |
| | Contracts | | (000) | | Date | | (000) | |
Long: | | | | | | | | | | | |
U.S. Treasury 2 yr. Note | | 475 | | $ | 97,323 | | Jun - 07 | | $ | (174 | ) |
U.S. Treasury 5 yr. Note | | 1,137 | | 120,291 | | Jun - 07 | | (22 | ) |
U.S. Treasury 10 yr. Note | | 820 | | 88,663 | | Jun - 07 | | 59 | |
U.S. Treasury Long Bond | | 344 | | 38,270 | | Jun - 07 | | (271 | ) |
| | | | | | | | $ | (408 | ) |
Graphic Presentation of Portfolio Holdings
The following graph depicts the Portfolio’s holdings by Industry and/or investment type, as a percentage of total investments.

* Industries and/or investment types which do not appear in the above graph, as well as those which represent less than 5% of total investments, if applicable, are included in the category labeled as “Other”.
The accompanying notes are an integral part of the financial statements.
65
2007 Semi-Annual Report |
| |
March 31, 2007 (unaudited) |
Portfolio of Investments
Limited Duration Portfolio
| | | | Face | | | |
| | | | Amount | | Value | |
| | | | (000) | | (000) | |
Fixed Income Securities (100.3%) | | | | | | | |
Agency Adjustable Rate Mortgages (4.9%) | | | | | | | |
Federal Home Loan Mortgage Corp., | | | | | | | |
Adjustable Rate Mortgages: | | | | | | | |
3.54%, 7/1/34 | | | | $ | 1,375 | | $ | 1,366 | |
4.35%, 10/1/33 | | | | 6,107 | | 6,126 | |
4.38%, 7/1/35 | | | | 7,809 | | 7,763 | |
Federal National Mortgage Association, | | | | | | | |
Adjustable Rate Mortgages: | | | | | | | |
3.61%, 7/1/34 | | | | 1,444 | | 1,445 | |
3.75%, 6/1/34 | | | | 984 | | 993 | |
4.11%, 2/1/35 | | | | 1,039 | | 1,037 | |
4.21%, 5/1/35 | | | | 4,348 | | 4,413 | |
4.47%, 5/1/35 | | | | 7,691 | | 7,669 | |
4.57%, 4/1/35 | | | | 1,673 | | 1,675 | |
4.71%, 9/1/35 | | | | 4,781 | | 4,743 | |
6.97%, 3/1/36 | | | | 7,482 | | 7,707 | |
7.49%, 8/1/36 | | | | 6,646 | | 6,855 | |
Government National Mortgage Association, | | | | | | | |
Adjustable Rate Mortgages: | | | | | | | |
5.38%, 1/20/25 - 1/20/28 | | | | 579 | | 586 | |
5.75%, 7/20/27 - 9/20/27 | | | | 141 | | 143 | |
6.13%, 12/20/25 - 12/20/27 | | | | 136 | | 138 | |
| | | | | | 52,659 | |
Agency Fixed Rate Mortgages (3.5%) | | | | | | | |
Federal Home Loan Mortgage Corp., | | | | | | | |
Conventional Pools: | | | | | | | |
10.00%, 3/1/11 - 10/1/20 | | | | 113 | | 124 | |
11.00%, 5/1/20 | | | | 7 | | 7 | |
11.50%, 1/1/18 | | | | 19 | | 20 | |
Gold Pools: | | | | | | | |
6.50%, 9/1/19 - 11/1/29 | | | | 213 | | 220 | |
7.00%, 3/1/32 | | | | 4 | | 4 | |
7.50%, 11/1/19 - 11/1/32 | | | | 2,720 | | 2,847 | |
8.50%, 8/1/28 | | | | 76 | | 82 | |
10.00%, 10/1/21 | | | | 10 | | 11 | |
10.50%, 1/1/19 - 10/1/20 | | | | 29 | | 32 | |
11.50%, 8/1/10 | | | | 9 | | 10 | |
12.00%, 6/1/15 - 9/1/15 | | | | 34 | | 38 | |
Federal National Mortgage Association, | | | | | | | |
Conventional Pools: | | | | | | | |
6.50%, 3/1/18 - 10/1/32 | | | | 3,279 | | 3,378 | |
7.00%, 5/1/26 - 12/1/34 | | | | 4,667 | | 4,853 | |
7.50%, 9/1/29 - 7/1/32 | | | | 4,136 | | 4,325 | |
8.00%, 12/1/29 - 8/1/31 | | | | 270 | | 285 | |
9.50%, 11/1/20 | | | | 29 | | 31 | |
10.00%, 12/1/15 - 9/1/16 | | | | 102 | | 110 | |
10.50%, 12/1/16 | | | | 15 | | 17 | |
11.00%, 7/1/20 | | | | 11 | | 12 | |
11.50%, 11/1/19 | | | | 30 | | 33 | |
12.50%, 2/1/15 | | | | 21 | | 23 | |
April TBA | | | | | | | |
7.00%, 4/25/37 | | | | (i)4,375 | | 4,513 | |
May TBA | | | | | | | |
7.00%, 5/25/37 | | | | (i)14,075 | | 14,506 | |
Government National Mortgage Association, | | | | | | | |
Various Pools: | | | | | | | |
9.00%, 11/15/16 - 1/15/17 | | | | $ | 125 | | $ | 135 | |
9.50%, 12/15/17 - 12/15/21 | | | | 222 | | 241 | |
10.00%, 11/15/09 - 7/15/22 | | | | 518 | | 577 | |
10.50%, 8/15/21 | | | | 27 | | 31 | |
11.00%, 1/15/10 - 1/15/21 | | | | 238 | | 264 | |
11.50%, 2/15/13 - 11/15/19 | | | | 154 | | 170 | |
| | | | | | 36,899 | |
Asset Backed Corporates (16.3%) | | | | | | | |
ACE Securities Corp. | | | | | | | |
7.12%, 9/25/33 | | | | (h)567 | | 544 | |
Aegis Asset Backed Securities Trust | | | | | | | |
7.32%, 6/25/34 | | | | (h)2,325 | | 2,303 | |
Amortizing Residential Collateral Trust | | | | | | | |
9.07%, 1/25/33 | | | | (h)133 | | 134 | |
Capital Auto Receivables Asset Trust | | | | | | | |
4.05%, 7/15/09 | | | | 5,683 | | 5,659 | |
4.98%, 5/15/11 | | | | 8,375 | | 8,374 | |
5.31%, 10/20/09 | | | | (e)9,750 | | 9,763 | |
Capital One Auto Finance Trust | | | | | | | |
5.07%, 7/15/11 | | | | 4,250 | | 4,252 | |
Caterpillar Financial Asset Trust | | | | | | | |
5.57%, 5/25/10 | | | | 7,800 | | 7,855 | |
Chase Manhattan Auto Owner Trust | | | | | | | |
2.83%, 9/15/10 | | | | 7,057 | | 6,955 | |
2.94%, 6/15/10 | | | | 1,103 | | 1,092 | |
CIT Equipment Collateral | | | | | | | |
3.50%, 9/20/08 | | | | 1,310 | | 1,300 | |
5.07%, 2/20/10 | | | | 4,675 | | 4,680 | |
CNH Equipment Trust | | | | | | | |
5.20%, 6/15/10 | | | | 3,650 | | 3,659 | |
Countrywide Asset-Backed Certificates | | | | | | | |
4.37%, 11/25/35 | | | | (h)5,561 | | 5,519 | |
4.50%, 8/25/36 | | | | (e)269 | | 259 | |
Daimler Chrysler Auto Trust | | | | | | | |
2.58%, 4/8/09 | | | | 3,936 | | 3,906 | |
Ford Credit Auto Owner Trust | | | | | | | |
5.05%, 3/15/10 | | | | 4,700 | | 4,694 | |
5.26%, 10/15/10 | | | | 5,725 | | 5,741 | |
GE Equipment Small Ticket LLC | | | | | | | |
4.38%, 7/22/09 | | | | (e)5,181 | | 5,153 | |
4.88%, 10/22/09 | | | | (e)7,975 | | 7,956 | |
Harley-Davidson Motorcycle Trust | | | | | | | |
2.63%, 11/15/10 | | | | 1,115 | | 1,102 | |
2.76%, 5/15/11 | | | | 2,180 | | 2,158 | |
3.09%, 6/15/10 | | | | 796 | | 796 | |
3.56%, 2/15/12 | | | | 4,434 | | 4,359 | |
3.76%, 12/17/12 | | | | 9,475 | | 9,285 | |
4.07%, 2/15/12 | | | | 5,600 | | 5,527 | |
4.41%, 6/15/12 | | | | 5,420 | | 5,378 | |
Hertz Vehicle Financing LLC | | | | | | | |
4.93%, 2/25/10 | | | | (e)4,550 | | 4,539 | |
The accompanying notes are an integral part of the financial statements.
66
2007 Semi-Annual Report |
| |
March 31, 2007 (unaudited) |
Portfolio of Investments (cont’d)
Limited Duration Portfolio
| | | | Face | | | |
| | | | Amount | | Value | |
| | | | (000) | | (000) | |
Asset Backed Corporates (cont’d) | | | | | | | |
Home Equity Asset Trust | | | | | | | |
7.42%, 8/25/34 | | | | $ | (h)1,100 | | $ | 1,108 | |
Honda Auto Receivables Owner Trust | | | | | | | |
4.85%, 10/19/09 | | | | 6,950 | | 6,935 | |
Hyundai Auto Receivables Trust | | | | | | | |
2.97%, 5/15/09 | | | | 1,772 | | 1,759 | |
Lehman XS Trust | | | | | | | |
5.62%, 2/25/46 | | | | (h)4,900 | | 4,914 | |
Long Beach Mortgage Loan Trust | | | | | | | |
5.41%, 1/25/36 | | | | (h)2,641 | | 2,643 | |
National City Auto Receivables Trust | | | | | | | |
2.88%, 5/15/11 | | | | 5,909 | | 5,812 | |
New Century Home Equity Loan Trust | | | | | | | |
4.46%, 8/25/35 | | | | (g)2,755 | | 2,732 | |
Park Place Securities, Inc. | | | | | | | |
7.17%, 10/25/34 | | | | (h)3,125 | | 2,761 | |
Securitized Asset Backed Receivables LLC Trust | | | | | | | |
5.39%, 11/25/35 - 12/25/35 | | | | (h)4,673 | | 4,677 | |
Structured Asset Investment Loan Trust | | | | | | | |
8.32%, 6/25/33 | | | | (h)1,775 | | 1,779 | |
USAA Auto Owner Trust | | | | | | | |
2.67%, 10/15/10 | | | | 7,669 | | 7,601 | |
3.58%, 2/15/11 | | | | 3,000 | | 2,974 | |
Volkswagen Auto Lease Trust | | | | | | | |
3.82%, 5/20/08 | | | | 1,325 | | 1,321 | |
Whole Auto Loan Trust | | | | | | | |
2.58%, 3/15/10 | | | | 3,194 | | 3,192 | |
| | | | | | 173,150 | |
Collateralized Mortgage Obligations — Agency Collateral Series (1.7%) | | | | | | | |
Banc of America Mortgage Securities | | | | | | | |
PAC | | | | | | | |
4.97%, 6/25/35 | | | | (h)1,200 | | 1,199 | |
Federal Home Loan Mortgage Corp. | | | | | | | |
7.50%, 9/15/29 | | | | 4,181 | | 4,391 | |
PAC | | | | | | | |
3.50%, 5/15/22 | | | | 2,101 | | 2,075 | |
Federal National Mortgage Association | | | | | | | |
PAC | | | | | | | |
5.50%, 1/25/24 | | | | 3,376 | | 3,371 | |
6.50%, 6/25/35 | | | | 2,680 | | 2,772 | |
GS Mortgage Securities Corp. | | | | | | | |
IO | | | | | | | |
2.57%, 3/25/36 | | | | (e)(h)17,437 | | 686 | |
Washington Mutual, Inc. | | | | | | | |
IO | | | | | | | |
Zero Coupon, 3/25/47 | | | | 131,079 | | 1,936 | |
0.36%, 6/25/44 | | | | 13,499 | | 242 | |
0.37%, 7/25/44 | | | | 23,121 | | 401 | |
0.38%, 10/25/44 | | | | 35,014 | | 613 | |
| | | | | | 17,686 | |
Collateralized Mortgage Obligations — Non Agency Collateral Series (0.9%) | | | | | | | |
Countrywide Alternative Loan Trust | | | | | | | |
IO | | | | | | | |
1.54%, 2/25/37 | | | | $ | 21,701 | | $ | 1,146 | |
1.78%, 3/20/46 | | | | 29,561 | | 1,362 | |
Greenpoint Mortgage Funding Trust | | | | | | | |
IO | | | | | | | |
1.10%, 8/25/45 | | | | 18,280 | | 557 | |
1.91%, 10/25/45 | | | | 23,163 | | 699 | |
Harborview Mortgage Loan Trust | | | | | | | |
IO | | | | | | | |
0.97%, 6/19/35 | | | | (h)23,631 | | 535 | |
1.26%, 5/19/35 | | | | (h)28,808 | | 688 | |
1.58%, 1/19/36 | | | | (h)39,949 | | 999 | |
1.63%, 3/19/37 | | | | (h)28,991 | | 1,277 | |
1.69%, 7/19/46 | | | | (h)50,090 | | 1,808 | |
1.85%, 1/19/36 | | | | (h)15,465 | | 440 | |
PO | | | | | | | |
3/19/37 | | | | 14 | | 10 | |
7/19/47 | | | | @— | | @— | |
Indymac Index Mortgage Loan Trust | | | | | | | |
IO | | | | | | | |
0.91%, 7/25/35 | | | | (h)21,311 | | 676 | |
| | | | | | 10,197 | |
Finance (11.3%) | | | | | | | |
Allstate Life Global Funding Trusts | | | | | | | |
4.50%, 5/29/09 | | | | 690 | | 683 | |
American General Finance Corp. | | | | | | | |
4.63%, 5/15/09 - 9/1/10 | | | | 1,485 | | 1,463 | |
AXA Financial, Inc. | | | | | | | |
6.50%, 4/1/08 | | | | 870 | | 880 | |
Bank of America Corp. | | | | | | | |
3.38%, 2/17/09 | | | | 3,095 | | 3,005 | |
3.88%, 1/15/08 | | | | 1,100 | | 1,088 | |
Bank of New York Co., Inc. (The) | | | | | | | |
5.20%, 7/1/07 | | | | 720 | | 720 | |
Bank One Corp. | | | | | | | |
6.00%, 2/17/09 | | | | 664 | | 674 | |
Capital One Financial Corp. | | | | | | | |
5.62%, 9/10/09 | | | | (h)3,240 | | 3,250 | |
CIT Group, Inc. | | | | | | | |
4.75%, 8/15/08 | | | | 2,270 | | 2,256 | |
Citicorp | | | | | | | |
6.38%, 11/15/08 | | | | 1,055 | | 1,076 | |
Citigroup, Inc. | | | | | | | |
3.63%, 2/9/09 | | | | 2,655 | | 2,592 | |
Countrywide Home Loans, Inc. | | | | | | | |
3.25%, 5/21/08 | | | | 2,760 | | 2,698 | |
General Electric Capital Corp. | | | | | | | |
5.00%, 6/15/07 | | | | 800 | | 799 | |
Goldman Sachs Group, Inc. | | | | | | | |
4.13%, 1/15/08 | | | | 3,435 | | 3,407 | |
The accompanying notes are an integral part of the financial statements.
67
2007 Semi-Annual Report |
| |
March 31, 2007 (unaudited) |
Portfolio of Investments (cont’d)
Limited Duration Portfolio
| | | | Face | | | |
| | | | Amount | | Value | |
| | | | (000) | | (000) | |
Finance (cont’d) | | | | | | | |
Hartford Financial Services Group, Inc. (The) | | | | | | | |
5.55%, 8/16/08 | | | | $ | 3,700 | | $ | 3,717 | |
HBOS Treasury Services | | | | | | | |
5.63%, 7/20/09 | | | | (e)5,400 | | 5,472 | |
HSBC Finance Corp. | | | | | | | |
4.13%, 12/15/08 | | | | 760 | | 747 | |
5.88%, 2/1/09 | | | | 1,580 | | 1,599 | |
6.38%, 10/15/11 | | | | 285 | | 297 | |
6.40%, 6/17/08 | | | | 1,470 | | 1,489 | |
6.75%, 5/15/11 | | | | 630 | | 664 | |
International Lease Finance Corp. | | | | | | | |
4.63%, 6/2/08 | | | | 4,015 | | 3,991 | |
istar Financial, Inc. | | | | | | | |
5.69%, 3/9/10 | | | | (h)2,380 | | 2,383 | |
John Hancock Financial Services, Inc. | | | | | | | |
5.63%, 12/1/08 | | | | 3,365 | | 3,387 | |
John Hancock Global Funding II | | | | | | | |
7.90%, 7/2/10 | | | | (e)625 | | 677 | |
JPMorgan Chase & Co. | | | | | | | |
6.00%, 2/15/09 | | | | 805 | | 817 | |
7.00%, 11/15/09 | | | | 315 | | 330 | |
Mantis Reef Ltd. | | | | | | | |
4.69%, 11/14/08 | | | | (e)2,350 | | 2,328 | |
MBNA Corp. | | | | | | | |
5.63%, 11/30/07 | | | | 1,250 | | 1,253 | |
5.79%, 5/5/08 | | | | (h)1,605 | | 1,613 | |
Metropolitan Life Global Funding I | | | | | | | |
4.63%, 8/19/10 | | | | (e)4,310 | | 4,263 | |
Monumental Global Funding II | | | | | | | |
3.85%, 3/3/08 | | | | (e)2,596 | | 2,562 | |
4.38%, 7/30/09 | | | | (e)2,335 | | 2,298 | |
Platinum Underwriters Holdings Ltd. | | | | | | | |
6.37%, 11/16/07 | | | | 1,650 | | 1,643 | |
Popular North America, Inc. | | | | | | | |
5.65%, 4/15/09 | | | | 2,245 | | 2,260 | |
Pricoa Global Funding I | | | | | | | |
3.90%, 12/15/08 | | | | (e)2,930 | | 2,864 | |
Prudential Funding LLC | | | | | | | |
6.60%, 5/15/08 | | | | (e)1,970 | | 1,992 | |
Residential Capital Corp. | | | | | | | |
6.00%, 2/22/11 | | | | 3,220 | | 3,179 | |
6.38%, 6/30/10 | | | | 3,095 | | 3,096 | |
Santander Central Hispano Issuance Ltd. | | | | | | | |
7.63%, 11/3/09 | | | | 3,900 | | 4,136 | |
Simon Property Group LP | | | | | | | |
6.38%, 11/15/07 | | | | 2,115 | | 2,127 | |
SLM Corp. | | | | | | | |
4.00%, 1/15/10 | | | | 3,825 | | 3,725 | |
Sovereign Bancorp, Inc. | | | | | | | |
5.58%, 3/23/10 | | | | (h)3,160 | | 3,161 | |
Sovereign Bank | | | | | | | |
4.00%, 2/1/08 | | | | 635 | | 628 | |
St. Paul Travelers Cos., Inc. (The) | | | | | | | |
5.01%, 8/16/07 | | | | $ | 1,930 | | $ | 1,927 | |
Suntrust Bank | | | | | | | |
4.55%, 5/25/09 | | | | 4,238 | | 4,195 | |
Unicredit Luxembourg Finance S.A. | | | | | | | |
5.41%, 10/24/08 | | | | (e)(h)4,310 | | 4,313 | |
U.S. Bank N.A. | | | | | | | |
3.70%, 8/1/07 | | | | 350 | | 348 | |
Wachovia Capital Trust Ill | | | | | | | |
5.80% | | | | (h)(o)3,170 | | 3,211 | |
Wachovia Corp. | | | | | | | |
3.63%, 2/17/09 | | | | 1,030 | | 1,004 | |
Washington Mutual, Inc. | | | | | | | |
4.00%, 1/15/09 | | | | 1,130 | | 1,107 | |
8.25%, 4/1/10 | | | | 2,233 | | 2,414 | |
Wells Fargo & Co. | | | | | | | |
3.12%, 8/15/08 | | | | 2,638 | | 2,562 | |
World Financial Properties | | | | | | | |
6.91%, 9/1/13 | | | | (e)2,555 | | 2,684 | |
6.95%, 9/1/13 | | | | (e)787 | | 828 | |
Xlliac Global Funding | | | | | | | |
4.80%, 8/10/10 | | | | (e)2,485 | | 2,452 | |
| | | | | | 120,334 | |
Industrials (11.6%) | | | | | | | |
American Honda Finance Corp. | | | | | | | |
3.85%, 11/6/08 | | | | (e)2,650 | | 2,599 | |
AT&T, Inc. | | | | | | | |
5.46%, 2/5/10 | | | | (h)3,145 | | 3,149 | |
BAE Systems Holdings, Inc. | | | | | | | |
4.75%, 8/15/10 | | | | (e)2,200 | | 2,170 | |
Baxter International, Inc. | | | | | | | |
5.20%, 2/16/08 | | | | 3,405 | | 3,403 | |
Brookfield Asset Management, Inc. | | | | | | | |
8.13%, 12/15/08 | | | | 2,555 | | 2,675 | |
Burlington Northern Santa Fe Corp. | | | | | | | |
6.13%, 3/15/09 | | | | 2,160 | | 2,192 | |
Clorox Co. | | | | | | | |
5.48%, 12/14/07 | | | | (h)2,820 | | 2,822 | |
Comcast Cable Communications Holdings, Inc. | | | | | | | |
6.88%, 6/15/09 | | | | 1,110 | | 1,150 | |
8.38%, 5/1/07 | | | | 1,410 | | 1,413 | |
Comcast Corp. | | | | | | | |
5.85%, 1/15/10 | | | | 900 | | 917 | |
Consumers Energy Co. | | | | | | | |
4.80%, 2/17/09 | | | | 2,345 | | 2,325 | |
Cooper Industries, Inc. | | | | | | | |
5.25%, 7/1/07 | | | | 3,000 | | 2,995 | |
COX Communications, Inc. | | | | | | | |
5.91%, 12/14/07 | | | | (h)1,134 | | 1,138 | |
CVS/Caremark Corp. | | | | | | | |
3.88%, 11/1/07 | | | | 50 | | 50 | |
4.00%, 9/15/09 | | | | 2,710 | | 2,639 | |
DaimlerChrysler N.A. Holding Corp. | | | | | | | |
4.05%, 6/4/08 | | | | 1,140 | | 1,123 | |
The accompanying notes are an integral part of the financial statements.
68
2007 Semi-Annual Report |
| |
March 31, 2007 (unaudited) |
Portfolio of Investments (cont’d)
Limited Duration Portfolio
| | | | Face | | | |
| | | | Amount | | Value | |
| | | | (000) | | (000) | |
Industrials (cont’d) | | | | | | | |
5.77%, 3/13/09 | | | | $ | (h)2,425 | | $ | 2,434 | |
8.00%, 6/15/10 | | | | 85 | | 92 | |
Deutsche Telekom International Finance BV | | | | | | | |
8.00%, 6/15/10 | | | | 2,245 | | 2,435 | |
Federated Department Stores, Inc. | | | | | | | |
6.30%, 4/1/09 | | | | 790 | | 806 | |
6.63%, 9/1/08 | | | | 1,790 | | 1,818 | |
FedEx Corp. | | | | | | | |
2.65%, 4/1/07 | | | | 605 | | 605 | |
5.50%, 8/15/09 | | | | 2,100 | | 2,117 | |
Fred Meyer, Inc. | | | | | | | |
7.45%, 3/1/08 | | | | 2,116 | | 2,157 | |
General Mills, Inc. | | | | | | | |
3.88%, 11/30/07 | | | | 3,070 | | 3,042 | |
Harrahs Operating Co., Inc. | | | | | | | |
7.13%, 6/1/07 | | | | 2,960 | | 2,971 | |
Hewlett Packard Co. | | | | | | | |
5.49%, 5/22/09 | | | | (h)2,165 | | 2,168 | |
Home Depot, Inc. | | | | | | | |
5.48%, 12/16/09 | | | | (h)965 | | 967 | |
Hospira, Inc. | | | | | | | |
5.83%, 3/30/10 | | | | (h)2,130 | | 2,136 | |
Hyatt Equities LLC | | | | | | | |
6.88%, 6/15/07 | | | | (e)1,745 | | 1,748 | |
ICI Wilmington, Inc. | | | | | | | |
4.38%, 12/1/08 | | | | 1,070 | | 1,055 | |
JC Penney Corp., Inc. | | | | | | | |
7.38%, 8/15/08 | | | | 2,610 | | 2,679 | |
Kraft Foods, Inc. | | | | | | | |
4.00%, 10/1/08 | | | | 910 | | 893 | |
5.25%, 6/1/07 | | | | 2,885 | | 2,883 | |
Lenfest Communications, Inc. | | | | | | | |
7.63%, 2/15/08 | | | | 185 | | 188 | |
Masco Corp. | | | | | | | |
4.63%, 8/15/07 | | | | 885 | | 882 | |
May Department Stores Co. (The) | | | | | | | |
3.95%, 7/15/07 | | | | 2,335 | | 2,323 | |
Miller Brewing Co. | | | | | | | |
4.25%, 8/15/08 | | | | (e)3,095 | | 3,049 | |
Mohawk Industries, Inc. | | | | | | | |
6.50%, 4/15/07 | | | | 2,085 | | 2,086 | |
Norfolk Southern Corp. | | | | | | | |
7.35%, 5/15/07 | | | | 1,161 | | 1,163 | |
Oracle Corp. and Ozark Holding, Inc. | | | | | | | |
5.59%, 1/13/09 | | | | (h)4,365 | | 4,372 | |
Raytheon Co. | | | | | | | |
6.15%, 11/1/08 | | | | 935 | | 951 | |
6.75%, 8/15/07 | | | | 403 | | 405 | |
Safeway, Inc. | | | | | | | |
7.50%, 9/15/09 | | | | 1,585 | | 1,666 | |
Sara Lee Corp. | | | | | | | |
2.75%, 6/15/08 | | | | 2,770 | | 2,685 | |
Sealed Air Corp. | | | | | | | |
6.95%, 5/15/09 | | | | $ | (e)440 | | $ | 455 | |
Starwood Hotels & Resorts Worldwide, Inc. | | | | | | | |
7.38%, 5/1/07 | | | | 85 | | 85 | |
Telecom Italia Capital S.A. | | | | | | | |
4.00%, 1/15/10 | | | | 385 | | 372 | |
4.88%, 10/1/10 | | | | 2,400 | | 2,364 | |
Textron Financial Corp. | | | | | | | |
4.13%, 3/3/08 | | | | 3,135 | | 3,106 | |
Time Warner, Inc. | | | | | | | |
5.59%, 11/13/09 | | | | (h)3,310 | | 3,318 | |
6.15%, 5/1/07 | | | | 3,110 | | 3,111 | |
Union Pacific Corp. | | | | | | | |
6.79%, 11/9/07 | | | | 3,150 | | 3,172 | |
UnitedHealth Group, Inc. | | | | | | | |
4.13%, 8/15/09 | | | | 1,065 | | 1,044 | |
5.43%, 3/2/09 | | | | (h)1,090 | | 1,090 | |
Valero Energy Corp. | | | | | | | |
3.50%, 4/1/09 | | | | 3,280 | | 3,183 | |
Verizon Global Funding Corp. | | | | | | | |
6.13%, 6/15/07 | | | | 4,080 | | 4,084 | |
7.25%, 12/1/10 | | | | 1,140 | | 1,219 | |
Viacom, Inc. | | | | | | | |
5.70%, 6/16/09 | | | | (h)1,270 | | 1,274 | |
5.75%, 4/30/11 | | | | 2,145 | | 2,176 | |
Vodafone Group plc | | | | | | | |
5.44%, 12/28/07 | | | | (h)3,800 | | 3,803 | |
WellPoint, Inc. | | | | | | | |
3.75%, 12/14/07 | | | | 1,130 | | 1,118 | |
Yum! Brands, Inc. | | | | | | | |
7.65%, 5/15/08 | | | | 3,110 | | 3,185 | |
| | | | | | 123,695 | |
Mortgages — Other (45.7%) | | | | | | | |
American Home Mortgage Assets | | | | | | | |
5.55%, 5/25/46 | | | | (h)6,625 | | 6,628 | |
5.58%, 10/25/46 | | | | (h)8,773 | | 8,808 | |
American Home Mortgage Investment Trust | | | | | | | |
4.34%, 2/25/44 | | | | (h)1,084 | | 1,085 | |
Ameriquest Mortgage Securities, Inc. | | | | | | | |
6.47%, 8/25/34 | | | | (h)2,675 | | 2,689 | |
Banc of America Funding Corp. | | | | | | | |
6.23%, 9/20/46 | | | | (h)6,903 | | 6,959 | |
Banc of America Mortgage Securities, Inc. | | | | | | | |
3.67%, 7/25/34 | | | | (h)883 | | 879 | |
4.37%, 1/25/35 | | | | (h)4,899 | | 4,850 | |
Bear Stearns Mortgage Funding Trust | | | | | | | |
5.50%, 10/25/36 | | | | (h)6,377 | | 6,340 | |
5.53%, 12/25/36 | | | | (h)6,948 | | 6,966 | |
Citigroup Mortgage Loan Trust, Inc. | | | | | | | |
3.89%, 9/25/34 | | | | (h)3,278 | | 3,321 | |
5.13%, 8/25/34 | | | | (h)1,797 | | 1,820 | |
Countrywide Alternative Loan Trust | | | | | | | |
5.25%, 7/25/46 | | | | (e)1,307 | | 1,302 | |
5.50%, 2/25/35 - 5/25/35 | | | | (h)13,649 | | 13,607 | |
The accompanying notes are an integral part of the financial statements.
69
2007 Semi-Annual Report |
| |
March 31, 2007 (unaudited) |
Portfolio of Investments (cont’d)
Limited Duration Portfolio
| | | | Face | | | |
| | | | Amount | | Value | |
| | | | (000) | | (000) | |
Mortgages — Other (cont’d) | | | | | | | |
5.51%, 11/25/46 | | | | $ | (h)5,335 | | $ | 5,347 | |
5.53%, 2/25/47 | | | | (h)5,408 | | 5,407 | |
5.55%, 8/25/46 | | | | (h)8,276 | | 8,304 | |
5.59%, 5/20/46 | | | | (h)5,807 | | 5,835 | |
5.61%, 11/20/35 | | | | (h)5,537 | | 5,544 | |
5.73%, 11/20/35 | | | | (h)7,833 | | 7,878 | |
6.68%, 2/25/36 | | | | (h)4,070 | | 4,114 | |
Countrywide Home Loan Mortgage Pass Through Trust | | | | | | | |
4.58%, 11/20/34 | | | | (h)1,599 | | 1,590 | |
5.59%, 4/25/46 | | | | (h)4,851 | | 4,866 | |
Downey Savings & Loan Association Mortgage Loan Trust | | | | | | | |
5.52%, 10/19/36 | | | | (h)7,076 | | 7,094 | |
5.57%, 3/19/45 | | | | (h)4,733 | | 4,742 | |
5.62%, 8/19/45 | | | | (h)7,532 | | 7,570 | |
5.69%, 9/19/35 | | | | (h)7,208 | | 7,248 | |
5.92%, 4/19/46 | | | | (h)6,703 | | 6,709 | |
DSLA NIM Corp. | | | | | | | |
5.93%, 4/20/46 | | | | (e)259 | | 259 | |
First Horizon Alternative Mortgage Securities | | | | | | | |
5.50%, 4/25/35 | | | | (h)7,610 | | 7,583 | |
6.00%, 2/25/37 | | | | 7,091 | | 7,133 | |
First Horizon Asset Securities, Inc. | | | | | | | |
3.70%, 6/25/34 | | | | (h)585 | | 590 | |
5.11%, 10/25/34 | | | | (h)1,030 | | 1,032 | |
Greenpoint Mortgage Funding Trust | | | | | | | |
5.55%, 1/25/37 | | | | (h)6,957 | | 6,959 | |
6.98%, 3/25/36 | | | | (h)4,315 | | 4,420 | |
GS Mortgage Securities Corp. | | | | | | | |
6.25%, 1/25/37 - 8/25/46 | | | | (e)5,811 | | 5,796 | |
6.41%, 6/25/46 | | | | (e)606 | | 605 | |
GSR Mortgage Loan Trust | | | | | | | |
5.58%, 8/25/46 | | | | (h)6,803 | | 6,822 | |
Harborview Mortgage Loan Trust | | | | | | | |
5.52%, 9/19/36 - 3/19/38 | | | | (h)10,763 | | 10,777 | |
5.55%, 7/19/46 | | | | (h)5,631 | | 5,638 | |
5.56%, 11/19/36 | | | | (h)8,664 | | 8,639 | |
5.57%, 12/19/36 | | | | (h)9,384 | | 9,421 | |
5.68%, 2/19/36 | | | | (h)5,450 | | 5,468 | |
5.70%, 11/19/35 | | | | (h)2,886 | | 2,898 | |
5.92%, 6/20/35 | | | | (h)1,700 | | 1,720 | |
6.98%, 10/19/35 - 1/19/36 | | | | (h)15,897 | | 16,214 | |
Harborview NIM Corp. | | | | | | | |
5.93%, 2/20/46 | | | | (e)130 | | 129 | |
6.41%, 12/19/36 - 3/19/38 | | | | (e)8,111 | | 8,088 | |
6.41%, 11/19/36 | | | | 2,152 | | 2,148 | |
Indymac Index Mortgage Loan Trust | | | | | | | |
5.57%, 6/25/46 | | | | (h)8,003 | | 8,036 | |
5.82%, 5/25/34 | | | | (h)1,826 | | 1,829 | |
6.65%, 6/25/46 | | | | (e)629 | | 629 | |
Lehman XS Net Interest Margin Notes | | | | | | | |
6.25%, 5/28/46 | | | | (e)625 | | 624 | |
6.50%, 4/28/46 | | | | (e)675 | | 671 | |
Luminent Mortgage Trust | | | | | | | |
5.52%, 10/25/46 | | | | (h)6,911 | | 6,929 | |
5.55%, 5/25/46 | | | | $ | (h)6,611 | | $ | 6,635 | |
5.57%, 5/25/36 | | | | (h)4,978 | | 4,998 | |
Merrill Lynch Mortgage Investors, Inc. | | | | | | | |
3.81%, 7/25/34 | | | | (h)1,073 | | 1,082 | |
Mortgage Equity Conversion Asset Trust | | | | | | | |
5.46%, 2/25/42 | | | | (h)5,125 | | 5,125 | |
Novastar Mortgage-Backed Notes | | | | | | | |
5.56%, 9/25/46 | | | | (h)5,416 | | 5,437 | |
Rali NIM Corp. | | | | | | | |
6.05%, 4/25/46 | | | | (e)618 | | 617 | |
Residential Accredit Loans, Inc. | | | | | | | |
5.48%, 1/25/37 | | | | (h)6,339 | | 6,339 | |
5.49%, 3/25/37 | | | | (h)6,600 | | 6,598 | |
5.51%, 12/25/36 - 2/25/37 | | | | (h)15,331 | | 15,355 | |
5.52%, 1/25/37 | | | | (h)7,987 | | 7,976 | |
5.55%, 5/25/46 - 6/25/46 | | | | (h)16,355 | | 16,360 | |
5.58%, 2/25/46 | | | | (h)2,176 | | 2,179 | |
5.59%, 2/25/46 | | | | (h)9,363 | | 9,380 | |
5.72%, 10/25/45 | | | | (h)5,644 | | 5,672 | |
Sharp SP I LLC Net Interest Margin Trust | | | | | | | |
7.00%, 10/25/46 | | | | (e)623 | | 623 | |
Structured Asset Mortgage Investments, Inc. | | | | | | | |
5.49%, 3/25/37 | | | | (h)5,134 | | 5,127 | |
5.51%, 2/25/36 | | | | (h)3,178 | | 3,185 | |
5.52%, 10/25/36 | | | | (h)7,393 | | 7,412 | |
5.53%, 1/25/37 | | | | (h)6,480 | | 6,489 | |
5.59%, 4/25/36 | | | | (h)8,018 | | 8,055 | |
5.63%, 2/25/36 | | | | (h)3,656 | | 3,673 | |
Wamu Alternative Mortgage Pass Through Certificates | | | | | | | |
4.98%, 8/25/46 | | | | (h)5,803 | | 5,813 | |
5.52%, 12/25/46 | | | | (h)6,687 | | 6,684 | |
5.92%, 4/25/46 - 5/25/46 | | | | (h)16,385 | | 16,400 | |
Washington Mutual, Inc. | | | | | | | |
5.52%, 2/25/47 | | | | (h)6,605 | | 6,621 | |
5.61%, 8/25/45 | | | | (h)1,045 | | 1,046 | |
5.68%, 7/25/45 - 10/25/45 | | | | (h)8,769 | | 8,809 | |
5.96%, 7/25/46 | | | | (h)8,090 | | 8,111 | |
5.98%, 8/25/46 | | | | (h)9,866 | | 9,898 | |
Wells Fargo Mortgage Backed Securities Trust | | | | | | | |
3.46%, 9/25/34 | | | | (h)2,138 | | 2,153 | |
4.11%, 6/25/35 | | | | (h)6,970 | | 6,893 | |
4.58%, 12/25/34 | | | | (h)5,961 | | 5,904 | |
5.39%, 7/25/34 | | | | (h)417 | | 422 | |
| | | | | | 485,630 | |
Utilities (4.4%) | | | | | | | |
Ameren Corp. | | | | | | | |
4.26%, 5/15/07 | | | | 2,280 | | 2,277 | |
Appalachian Power Co. | | | | | | | |
3.60%, 5/15/08 | | | | 1,670 | | 1,639 | |
Baltimore Gas & Electric | | | | | | | |
6.63%, 3/15/08 | | | | 3,500 | | 3,542 | |
Carolina Power & Light Co. | | | | | | | |
6.80%, 8/15/07 | | | | 3,330 | | 3,346 | |
The accompanying notes are an integral part of the financial statements.
70
2007 Semi-Annual Report |
| |
March 31, 2007 (unaudited) |
Portfolio of Investments (cont’d)
Limited Duration Portfolio
| | | | Face | | | |
| | | | Amount | | Value | |
| | | | (000) | | (000) | |
Utilities (cont’d) | | | | | | | |
Columbus Southern Power Co. | | | | | | | |
4.40%, 12/1/10 | | | | $ | 1,750 | | $ | 1,705 | |
Commonwealth Edison Co. | | | | | | | |
3.70%, 2/1/08 | | | | 1,656 | | 1,626 | |
Detroit Edison Co. | | | | | | | |
6.13%, 10/1/10 | | | | 1,195 | | 1,232 | |
Dominion Resources, Inc. | | | | | | | |
5.69%, 5/15/08 | | | | (g)2,340 | | 2,346 | |
Duke Energy Corp. | | | | | | | |
3.75%, 3/5/08 | | | | 1,245 | | 1,228 | |
Enbridge Energy Partners LP | | | | | | | |
4.00%, 1/15/09 | | | | 3,520 | | 3,451 | |
Entergy Gulf States, Inc. | | | | | | | |
3.60%, 6/1/08 | | | | 585 | | 574 | |
5.76%, 12/1/09 | | | | (h)1,225 | | 1,224 | |
6.09%, 12/8/08 | | | | (e)(h)1,170 | | 1,173 | |
FPL Group Capital, Inc. | | | | | | | |
5.55%, 2/16/08 | | | | 3,400 | | 3,404 | |
Keyspan Corp. | | | | | | | |
4.90%, 5/16/08 | | | | 1,300 | | 1,296 | |
NiSource Finance Corp. | | | | | | | |
5.93%, 11/23/09 | | | | (h)1,145 | | 1,147 | |
Pacific Gas & Electric Co. | | | | | | | |
3.60%, 3/1/09 | | | | 2,110 | | 2,055 | |
Peco Energy Co. | | | | | | | |
3.50%, 5/1/08 | | | | 2,940 | | 2,888 | |
Public Service Co. of Colorado | | | | | | | |
6.88%, 7/15/09 | | | | 870 | | 902 | |
Sempra Energy | | | | | | | |
4.75%, 5/15/09 | | | | 3,025 | | 3,001 | |
Southwestern Public Service Co. | | | | | | | |
6.20%, 3/1/09 | | | | 2,260 | | 2,301 | |
Texas-New Mexico Power Co. | | | | | | | |
6.25%, 1/15/09 | | | | 2,700 | | 2,742 | |
Wisconsin Electric Power Co. | | | | | | | |
3.50%, 12/1/07 | | | | 1,340 | | 1,325 | |
| | | | | | 46,424 | |
Total Fixed Income Securities (Cost $1,070,641) | | | | | | 1,066,674 | |
| | | | | | | | | |
| | | | Shares | | | |
Preferred Stock (0.1%) | | | | | | | |
Mortgages — Other 0.1%) | | | | | | | |
Home Ownership Funding Corp. | | | | | | | |
13.33% (Cost $246) | | | | (e)1,800 | | 266 | |
Short-Term Investments (1.0%) | | | | | | | |
Repurchase Agreement (0.9%) | | | | | | | |
J.P. Morgan Securities, Inc., 5.28% dated 3/30/07, due 4/2/07, repurchase price $9,938 | | | | $ | (f)9,934 | | $ | 9,934 | |
U.S. Treasury Security (0.1%) | | | | | | | |
U.S. Treasury Bill | | | | | | | |
4.97%, 7/12/07 | | | | (j)900 | | 888 | |
Total Short-Term Investments (Cost $10,822) | | | | | | 10,822 | |
Total Investments (101.4%) (Cost $1,081,709) | | | | | | 1,077,762 | |
Liabilities in Excess of Other Assets (-1.4%) | | | | | | (14,336) | |
Net Assets (100%) | | | | | | $ | 1,063,426 | |
| | | | | | | | | |
(e) | 144A security — Certain conditions for public sale may exist. Unless otherwise noted, these securities are deemed to be liquid. |
(f) | Represents the Portfolio’s undivided interest in a joint repurchase agreement which has a total value of $1,580,364,000. The repurchase agreement was fully collateralized by U.S. government agency securities at the date of this Portfolio of Investments as follows: Federal Farm Credit Bank, 0.00% to 7.43%, due 5/7/07 to 3/2/21; Federal Home Loan Bank, 0.00% to 6.42%, due 4/2/07 to 3/9/26; Federal Home Loan Mortgage Corp., 0.00% to 7.00%, due 4/2/07 to 3/15/31; Federal National Mortgage Association, 0.00% to 7.13%, due 4/5/07 to 3/17/31; Tennessee Valley Authority, 4.88%, due 12/15/16, which had a total value of $1,611,974,119. The investment in the repurchase agreement is through participation in a joint account with affiliated parties pursuant to exemptive relief received by the Portfolio from the SEC. |
(g) | Step Bond — Coupon rate increases in increments to maturity. Rate disclosed is as of March 31, 2007. Maturity date disclosed is the ultimate maturity date. |
(h) | Variable/Floating Rate Security — Interest rate changes on these instruments are based on changes in a designated base rate. The rates shown are those in effect on March 31, 2007. |
(i) | Security is subject to delayed delivery. |
(j) | All or a portion of the security was pledged to cover margin requirements for futures contracts. |
(o) | Perpetual — Security does not have a predetermined maturity date. Rates for these securities are fixed for a period of time then revert to a floating rate. The interest rate shown is the rate in effect at March 31, 2007. |
@ | Face Amount/Value is less than $500. |
IO | Interest Only |
PAC | Planned Amortization Class |
PO | Principal Only |
TBA | To Be Announced |
The accompanying notes are an integral part of the financial statements.
71
2007 Semi-Annual Report |
| |
March 31, 2007 (unaudited) |
Portfolio of Investments (cont’d)
Limited Duration Portfolio
Futures Contracts:
The Portfolio had the following futures contract(s) open at period end:
| | | | | | | | Net | |
| | | | | | | | Unrealized | |
| | Number | | | | | | Appreciation | |
| | of | | Value | | Expiration | | (Depreciation) | |
| | Contracts | | (000) | | Date | | (000) | |
Long: | | | | | | | | | |
U.S. Treasury 2 yr. Note | | 2,068 | | $ | 423,714 | | Jun-07 | | $ | 510 | |
U.S. Treasury 10 yr. Note | | 699 | | 75,579 | | Jun-07 | | (69 | ) |
Short: | | | | | | | | | |
U.S. Treasury 5 yr. Note | | 85 | | 8,993 | | Jun-07 | | 33 | |
U.S. Treasury Short Bond | | 620 | | 68,975 | | Jun-07 | | 90 | |
EuroDollar CME | | 547 | | 130,289 | | Mar-08 | | (364 | ) |
| | | | | | | | $ | 200 | |
| | | | | | | | | | | |
Graphic Presentation of Portfolio Holdings
The following graph depicts the Portfolio’s holdings by industry and/or investment type, as a percentage of total investments.
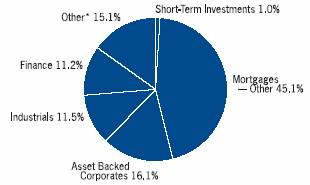
* Industries and/or investment types which do not appear in the above graph, as well as those which represent less than 5% of total investments, if applicable, are included in the category labeled “Other”.
The accompanying notes are an integral part of the financial statements.
72
2007 Semi-Annual Report |
| |
March 31, 2007 (unaudited) |
Portfolio of Investments
Long Duration Fixed Income Portfolio
| | | | Face | | | |
| | | | Amount | | Value | |
| | | | (000) | | (000) | |
Fixed Income Securities (98.8%) | | | | | | | |
Agency Fixed Rate Mortgages (6.8%) | | | | | | | |
Federal Home Loan Mortgage Corp. | | | | | | | |
6.75%, 3/15/31 | | | | $ | 240 | | $ | 289 | |
Federal National Mortgage Association, | | | | | | | |
5.38%, 7/15/16 | | | | 1,150 | | 1,183 | |
Conventional Pools: | | | | | | | |
7.25%, 5/15/30 | | | | 230 | | 291 | |
| | | | | | 1,763 | |
Finance (6.1%) | | | | | | | |
American General Finance Corp. | | | | | | | |
4.63%, 9/1/10 | | | | 110 | | 108 | |
Catlin Insurance Co., Ltd. | | | | | | | |
7.25% | | | | (h)(o)100 | | 99 | |
Countrywide Home Loans, Inc. | | | | | | | |
4.00%, 3/22/11 | | | | 100 | | 95 | |
HSBC Finance Corp. | | | | | | | |
6.38%, 10/15/11 | | | | 220 | | 230 | |
6.75%, 5/15/11 | | | | 10 | | 11 | |
Istar Financial, Inc. | | | | | | | |
5.69%, 3/9/10 | | | | (h)95 | | 95 | |
Nationwide Building Society | | | | | | | |
4.25%, 2/1/10 | | | | 105 | | 103 | |
Platinum Underwriters Finance, Inc. | | | | | | | |
7.50%, 6/1/17 | | | | 15 | | 16 | |
Popular North America, Inc. | | | | | | | |
5.65%, 4/15/09 | | | | 50 | | 50 | |
Residential Capital Corp. | | | | | | | |
5.84%, 6/9/08 | | | | (h)100 | | 99 | |
6.38%, 6/30/10 | | | | 115 | | 115 | |
SLM Corp. | | | | | | | |
4.00%, 1/15/10 | | | | 80 | | 78 | |
Sovereign Bancorp, Inc. | | | | | | | |
5.58%, 3/23/10 | | | | (h)105 | | 105 | |
USB Capital IX | | | | | | | |
6.19% | | | | (h)(o)105 | | 108 | |
Wachovia Capital Trust Ill | | | | | | | |
5.80% | | | | (h)(o)180 | | 182 | |
Washington Mutual Preferred Funding II | | | | | | | |
6.67% | | | | (h)(o)100 | | 98 | |
| | | | | | 1,592 | |
Industrials (9.9%) | | | | | | | |
America West Airlines, Inc. | | | | | | | |
7.10%, 4/2/21 | | | | 80 | | 85 | |
AT&T Corp. | | | | | | | |
8.00%, 11/15/31 | | | | 40 | | 50 | |
BellSouth Corp. | | | | | | | |
6.55%, 6/15/34 | | | | 80 | | 83 | |
Caterpillar Financial Services Corp. | | | | | | | |
5.43%, 8/20/07 | | | | (h)55 | | 55 | |
Clorox Co. | | | | | | | |
5.48%, 12/14/07 | | | | (h)115 | | 115 | |
Comcast Cable Communications LLC | | | | | | | |
7.13%, 6/15/13 | | | | $ | 120 | | $ | 130 | |
ConAgra Foods, Inc. | | | | | | | |
8.25%, 9/15/30 | | | | 60 | | 73 | |
CVS/Caremark Corp. | | | | | | | |
5.75%, 8/15/11 | | | | 25 | | 26 | |
6.04%, 12/10/28 | | | | 129 | | 131 | |
DaimlerChrysler N.A. Holding Corp. | | | | | | | |
8.50%, 1/18/31 | | | | 85 | | 107 | |
France Telecom S.A. | | | | | | | |
8.50%, 3/1/31 | | | | 80 | | 104 | |
Fred Meyer, Inc. | | | | | | | |
7.45%, 3/1/08 | | | | 50 | | 51 | |
General Mills, Inc. | | | | | | | |
3.88%, 11/30/07 | | | | 115 | | 114 | |
Hewlett Packard Co. | | | | | | | |
5.49%, 5/22/09 | | | | (h)130 | | 130 | |
Home Depot, Inc. | | | | | | | |
5.48%, 12/16/09 | | | | (h)40 | | 40 | |
ICI Wilmington, Inc. | | | | | | | |
4.38%, 12/1/08 | | | | 45 | | 44 | |
John Deere Capital Corp. | | | | | | | |
5.41%, 4/15/08 | | | | (h)130 | | 130 | |
Kraft Foods, Inc. | | | | | | | |
6.50%, 11/1/31 | | | | 115 | | 118 | |
May Department Stores Co. (The) | | | | | | | |
6.70%, 7/15/34 | | | | 80 | | 79 | |
Mohawk Industries, Inc. | | | | | | | |
7.20%, 4/15/12 | | | | 50 | | 53 | |
Sara Lee Corp. | | | | | | | |
6.13%, 11/1/32 | | | | 85 | | 79 | |
Sprint Capital Corp. | | | | | | | |
6.13%, 11/15/08 | | | | 80 | | 81 | |
Telecom Italia Capital S.A. | | | | | | | |
7.20%, 7/18/36 | | | | 75 | | 78 | |
Telefonica Europe BV | | | | | | | |
8.25%, 9/15/30 | | | | 85 | | 102 | |
Time Warner, Inc. | | | | | | | |
5.59%, 11/13/09 | | | | (h)135 | | 135 | |
UnitedHealth Group, Inc. | | | | | | | |
5.43%, 3/2/09 | | | | (h)80 | | 80 | |
Valero Energy Corp. | | | | | | | |
3.50%, 4/1/09 | | | | 50 | | 49 | |
Viacom, Inc. | | | | | | | |
6.88%, 4/30/36 | | | | 120 | | 121 | |
Waste Management, Inc. | | | | | | | |
6.88%, 5/15/09 | | | | 110 | | 114 | |
| | | | | | 2,557 | |
U.S. Treasury Securities (73.4%) | | | | | | | |
U.S. Treasury Bonds | | | | | | | |
6.13%, 11/15/27 | | | | 2,425 | | 2,801 | |
6.38%, 8/15/27 | | | | 3,000 | | 3,554 | |
6.50%, 11/15/26 | | | | 3,300 | | 3,949 | |
6.63%, 2/15/27 | | | | 3,500 | | 4,246 | |
The accompanying notes are an integral part of the financial statements.
73
2007 Semi-Annual Report |
| |
March 31, 2007 (unaudited) |
Portfolio of Investments (cont’d)
Long Duration Fixed Income Portfolio
| | | | Face | | | |
| | | | Amount | | Value | |
| | | | (000) | | (000) | |
U.S. Treasury Securities (cont’d) | | | | | | | |
8.13%, 8/15/19 | | | | $ | 3,460 | | $ | 4,520 | |
| | | | | | 19,070 | |
Utilities (2.6%) | | | | | | | |
Ameren Corp. | | | | | | | |
4.26%, 5/15/07 | | | | 115 | | 115 | |
Arizona Public Service Co. | | | | | | | |
5.80%, 6/30/14 | | | | 80 | | 81 | |
CenterPoint Energy Resources Corp. | | | | | | | |
6.25%, 2/1/37 | | | | 25 | | 25 | |
Consumers Energy Co. | | | | | | | |
4.40%, 8/15/09 | | | | 55 | | 54 | |
Detroit Edison Co. | | | | | | | |
6.13%, 10/1/10 | | | | 30 | | 31 | |
Exelon Corp. | | | | | | | |
6.75%, 5/1/11 | | | | 50 | | 52 | |
Ohio Power Co. | | | | | | | |
6.60%, 2/15/33 | | | | 170 | | 180 | |
Plains All American Pipeline LP | | | | | | | |
6.70%, 5/15/36 | | | | 75 | | 77 | |
Texas Eastern Transmission LP | | | | | | | |
7.00%, 7/15/32 | | | | 45 | | 50 | |
| | | | | | 665 | |
Total Fixed Income Securities (Cost $24,915) | | | | | | 25,647 | |
Short-Term Investments (0.2%) | | | | | | | |
Repurchase Agreement (0.0%) | | | | | | | |
J.P. Morgan Securities, Inc., 5.28%, dated 3/30/07, due 4/2/07, repurchase price $15 | | | | (f)15 | | 15 | |
U.S. Treasury Security (0.2%) | | | | | | | |
U.S. Treasury Bill | | | | | | | |
4.99%, 7/12/07 | | | | (j)50 | | 50 | |
Total Short-Term Investments (Cost $64) | | | | | | 65 | |
Total Investments (99.0%) (Cost $24,979) | | | | | | 25,712 | |
Other Assets in Excess of Liabilities (1.0%) | | | | | | 257 | |
Net Assets (100%) | | | | | | $ | 25,969 | |
| | | | | | | | | |
(f) | Represents the Portfolio’s undivided interest in a joint repurchase agreement which has a total value of $1,580,364,000. The repurchase agreement was fully collateralized by U.S. government agency securities at the date of this Portfolio of Investments as follows: Federal Farm Credit Bank, 0.00% to 7.43%, due 5/7/07 to 3/2/21; Federal Home Loan Bank, 0.00% to 6.42%, due 4/2/07 to 3/9/26; Federal Home Loan Mortgage Corp., 0.00% to 7.00%, due 4/2/07 to 3/15/31; Federal National Mortgage Association, 0.00% to 7.13%, due 4/5/07 to 3/17/31; Tennessee Valley Authority, 4.88%, due 12/15/16, which had a total value of $1,611,974,119. The investment in the repurchase agreement is through participation in a joint account with affiliated parties pursuant to exemptive relief received by the Portfolio from the SEC. |
(h) | Variable/Floating Rate Security — Interest rate changes on these instruments are based on changes in a designated base rate. The rates shown are those in effect on March 31, 2007. |
(j) | All or a portion of the security was pledged to cover margin requirements for futures contracts. |
(o) | Perpetual — Security does not have a predetermined maturity date. Rates for these securities are fixed for a period of time then revert to a floating rate. The interest rate shown is the rate in effect at March 31, 2007. |
Futures Contracts:
The Portfolio had the following futures contract(s) open at period end:
| | | | | | | | Net | |
| | | | | | | | Unrealized | |
| | Number | | | | | | Appreciation | |
| | of | | Value | | Expiration | | (Depreciation) | |
| | Contracts | | (000) | | Date | | (000) | |
Long: | | | | | | | | | |
U.S. Treasury 5 yr. Note | | 6 | | $ | 635 | | Jun-07 | | $ | @— | |
U.S. Treasury 10 yr. Note | | 10 | | 1,081 | | Jun-07 | | (1 | ) |
U.S. Treasury Long Bond | | 2 | | 223 | | Jun-07 | | (4 | ) |
Short: | | | | | | | | | |
U.S. Treasury 2 yr. Note | | 5 | | 1,024 | | Jun-07 | | (2 | ) |
| | | | | | | | $ | (7 | ) |
| | | | | | | | | | | |
Graphic Presentation of Portfolio Holdings
The following graph depicts the Portfolio’s holdings by industry and/or investment type, as a percentage of total investments.
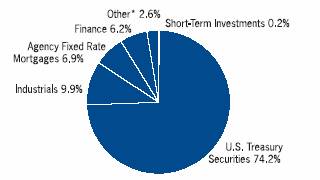
* Industries and/or investment types which do not appear in the above graph, as well as those which represent less than 5% of total investments, if applicable, are included in the category labeled “Other”.
The accompanying notes are an integral part of the financial statements.
74
2007 Semi-Annual Report |
| |
March 31, 2007 (unaudited) |
Portfolio of Investments
Municipal Portfolio
| | | | Face | | | |
| | | | Amount | | Value | |
| | | | (000) | | (000) | |
Fixed Income Securities (98.0%) | | | | | | | |
Collateralized Mortgage Obligations — Agency Collateral Series (0.4%) | | | | | | | |
Federal Home Loan Mortgage Corp. | | | | | | | |
IO | | | | | | | |
6.50%, 3/15/33 | | | | $ | 588 | | $ | 126 | |
IO PAC | | | | | | | |
6.00%, 4/15/32 | | | | 1,411 | | 169 | |
Federal National Mortgage Association | | | | | | | |
Inv FI IO | | | | | | | |
2.78%, 12/25/29 | | | | 17 | | @— | |
3.68%, 3/25/23 | | | | 603 | | 47 | |
IO | | | | | | | |
1.93%, 3/25/36 | | | | 16,916 | | 359 | |
6.00%, 5/25/33 - 8/25/35 | | | | 5,500 | | 1,491 | |
6.50%, 6/1/31 - 5/25/33 | | | | 1,579 | | 339 | |
7.00%, 4/1/32 - 4/25/33 | | | | 679 | | 161 | |
8.00%, 5/1/30 - 6/1/30 | | | | 220 | | 52 | |
Government National Mortgage Association | | | | | | | |
Inv FI IO | | | | | | | |
2.63%, 12/16/25 | | | | 356 | | 21 | |
2.68%, 5/16/32 | | | | 243 | | 12 | |
3.23%, 4/16/19 - 12/16/29 | | | | 862 | | 65 | |
| | | | | | 2,842 | |
Collateralized Mortgage Obligations — Non Agency Collateral Series (3.5%) | | | | | | | |
Bear Stearns Structured Products, Inc. | | | | | | | |
1.00%, 3/27/36 | | | | (e)141,304 | | 5,633 | |
1.91%, 7/27/36 | | | | (e)62,633 | | 2,481 | |
6.00%, 4/25/37 | | | | (e)78,400 | | 3,054 | |
Countrywide Alternative Loan Trust | | | | | | | |
1.83%, 2/25/47 | | | | (e)43,654 | | 2,380 | |
IO | | | | | | | |
1.54%, 2/25/37 | | | | 13,841 | | 731 | |
1.70%, 9/25/46 | | | | 34,943 | | 1,737 | |
1.73%, 12/20/35 | | | | (e)(h)15,923 | | 434 | |
1.78%, 3/20/46 | | | | 13,872 | | 639 | |
1.85%, 8/25/46 | | | | (h)10,564 | | 423 | |
1.95%, 3/20/47 | | | | 35,018 | | 1,944 | |
2.71%, 12/20/35 | | | | (e)(h)17,530 | | 842 | |
Countrywide Home Loan Mortgage Pass Through Trust | | | | | | | |
0.59%, 10/25/34 | | | | (h)12,062 | | 245 | |
Greenpoint Mortgage Funding Trust | | | | | | | |
1.10%, 8/25/45 | | | | 10,144 | | 309 | |
1.86%, 6/25/45 | | | | 11,767 | | 357 | |
Harborview Mortgage Loan Trust | | | | | | | |
IO | | | | | | | |
0.97%, 6/19/35 | | | | (h)10,741 | | 243 | |
1.26%, 5/19/35 | | | | (h)15,287 | | 365 | |
1.63%, 3/19/37 | | | | (h)13,063 | | 576 | |
1.69%, 7/19/46 | | | | (h)22,658 | | 818 | |
PO | | | | | | | |
3/19/37 | | | | 6 | | 5 | |
7/19/47 | | | | @— | | @— | |
Harborview NIM Corp. | | | | | | | |
Zero Coupon, 10/20/45 | | | | (e)3,001 | | 1,917 | |
Indymac Index Mortgage Loan Trust | | | | | | | |
IO | | | | | | | |
0.91%, 7/25/35 | | | | $ | (h)13,911 | | $ | 441 | |
Residential Accredit Loans, Inc. | | | | | | | |
Zero Coupon, 4/25/47 | | | | (e)25,000 | | 1,438 | |
| | | | | | 27,012 | |
Industrials (0.3%) | | | | | | | |
Echostar DBS Corp. | | | | | | | |
6.38%, 10/1/11 | | | | 580 | | 585 | |
6.63%, 10/1/14 | | | | 45 | | 45 | |
Hyatt Equities LLC | | | | | | | |
6.88%, 6/15/07 | | | | (e)360 | | 361 | |
Pilgrim’s Pride Corp. | | | | | | | |
7.63%, 5/1/15 | | | | 730 | | 732 | |
9.63%, 9/15/11 | | | | 335 | | 350 | |
Starwood Hotels & Resorts Worldwide, Inc. | | | | | | | |
7.38%, 5/1/07 | | | | 100 | | 100 | |
| | | | | | 2,173 | |
Municipal Bonds (93.8%) | | | | | | | |
Abilene, TX Health Facilities Development Corp. SAVRS Revenue Bonds (MBIA) | | | | | | | |
3.60%, 9/19/25 | | | | (h)(n)12,050 | | 12,050 | |
Alameda, CA Unified School District General Obligation Bonds (FSA) | | | | | | | |
Zero Coupon, 8/1/33 | | | | 9,915 | | 3,032 | |
Aldine Independent School District General Obligation Bonds (PSFG) | | | | | | | |
5.00%, 2/15/13 | | | | 3,040 | | 3,241 | |
Allegheny County, PA Industrial Development Authority Revenue Bonds | | | | | | | |
4.75%, 12/1/32 | | | | 525 | | 548 | |
Austin, TX Convention Enterprises, Inc., Revenue Bonds | | | | | | | |
6.70%, 1/1/28 | | | | 400 | | 441 | |
Austin, TX Water & Wastewater System Revenue Bonds (MBIA) | | | | | | | |
5.25%, 11/15/13 | | | | 4,100 | | 4,436 | |
Badger TOB Asset Securitization Corp., WI, Revenue Bonds | | | | | | | |
6.13%, 6/1/27 | | | | 1,145 | | 1,224 | |
Berks County, PA, General Obligation Bonds (FGIC) | | | | | | | |
Zero Coupon, 5/15/19 - 11/15/20 | | | | 2,250 | | 1,316 | |
Brazos River Authority, TX Pollution Collateral Revenue Bonds | | | | | | | |
5.40%, 10/1/29 | | | | 325 | | 334 | |
Brunswick County, NC, General Obligation Bonds (FGIC) | | | | | | | |
5.00%, 5/1/17 | | | | 1,700 | | 1,808 | |
Bucks County, PA Water & Sewer Authority Special Obligation Bonds | | | | | | | |
5.50%, 2/1/08 | | | | 5 | | 5 | |
Butler & Sedgwick Counties, KS Unified School District General Obligation Bonds (FSA) | | | | | | | |
5.85%, 9/1/17 | | | | 1,375 | | 1,471 | |
The accompanying notes are an integral part of the financial statements.
75
2007 Semi-Annual Report |
| |
March 31, 2007 (unaudited) |
Portfolio of Investments (cont’d)
Municipal Portfolio
| | | | Face | | | |
| | | | Amount | | Value | |
| | | | (000) | | (000) | |
Municipal Bonds (cont’d) | | | | | | | |
California State Department of Water Resources Power Supply Revenue Bonds (MBIA) | | | | | | | |
5.25%, 5/1/12 | | | | $ | 2,200 | | $ | 2,364 | |
California State General Obligation Bonds | | | | | | | |
5.25%, 2/1/14 | | | | 1,375 | | 1,486 | |
California State Public Works Board Revenue Bonds | | | | | | | |
5.25%, 6/1/13 | | | | 1,150 | | 1,243 | |
5.50%, 6/1/15 | | | | 1,275 | | 1,402 | |
Camden, AL Industrial Development Board Revenue Bonds | | | | | | | |
6.13%, 12/1/24 | | | | 625 | | 684 | |
Carbon County, PA Industrial Development Authority Revenue Bonds | | | | | | | |
6.65%, 5/1/10 | | | | 230 | | 239 | |
Carrollton, TX General Obligation Bonds (FSA) | | | | | | | |
5.13%, 8/15/16 | | | | 1,470 | | 1,550 | |
Center Township, PA Sewer Authority Revenue Bonds (MBIA) | | | | | | | |
Zero Coupon, 4/15/17 | | | | 615 | | 410 | |
Central Michigan University Revenue Bonds (AMBAC) | | | | | | | |
3.60%, 10/1/32 | | | | (h)4,700 | | 4,700 | |
Central Michigan University Revenue Bonds (FGIC) | | | | | | | |
3.35%, 10/1/15 | | | | (h)(n)9,750 | | 9,750 | |
Chandler, AZ Industrial Development Authority Revenue Bonds | | | | | | | |
4.38%, 12/1/35 | | | | 1,400 | | 1,421 | |
Charleston County, SC Hospital Facilities Revenue Bonds SAVRS, University Medical Associates (MBIA) | | | | | | | |
3.60%, 5/15/27 | | | | (h)10,600 | | 10,600 | |
Chelsea, MA Lease Revenue Bonds (FSA) | | | | | | | |
3.65%, 6/6/23 | | | | (h)(n)6,200 | | 6,200 | |
Chelsea, MA Lease Revenue Bonds Series B SAVRS (FSA) | | | | | | | |
3.45%, 6/13/23 | | | | (h)2,400 | | 2,400 | |
Cherokee County, GA School Systems, General Obligation Bonds (MBIA) | | | | | | | |
5.00%, 8/1/13 | | | | 1,000 | | 1,072 | |
Chicago, IL Board of Education General Obligation Bonds (XLCA) | | | | | | | |
3.57%, 3/1/22 | | | | (h)(n)12,525 | | 12,525 | |
Chicago, IL General Obligation Bonds (FGIC) | | | | | | | |
Zero Coupon, 1/1/19 | | | | 4,000 | | 2,443 | |
Children’s Trust Fund Revenue Bonds | | | | | | | |
5.38%, 5/15/33 | | | | 1,875 | | 1,962 | |
5.75%, 7/1/20 | | | | 735 | | 761 | |
Citizens Property Insurance Corp., FL Revenue Bonds (MBIA) | | | | | | | |
5.00%, 3/1/12 | | | | 3,000 | | 3,171 | |
Clark County, NV School District General Obligation Bonds (AMBAC) | | | | | | | |
4.50%, 6/15/11 | | | | 14,000 | | 14,437 | |
Clark County, WA School District No. 117 Camas General Obligation Bonds (FSA) | | | | | | | |
5.00%, 12/1/13 | | | | $ | 1,500 | | $ | 1,609 | |
Clark County, WA School District No. 114 Evergreen General Obligation Bonds (FSA) | | | | | | | |
5.00%, 6/1/13 | | | | 2,500 | | 2,669 | |
Clear Creek, TX Independent School District (PSFG) | | | | | | | |
5.65%, 2/15/19 | | | | 1,000 | | 1,054 | |
Coachella Valley Unified School District, CA General Obligation Bonds (FGIC) | | | | | | | |
Zero Coupon, 8/1/30 | | | | 1,000 | | 350 | |
Colorado E470 Public Highway Authority Revenue Bonds (MBIA) | | | | | | | |
Zero Coupon, 9/1/29 | | | | (n)18,900 | | 7,000 | |
Colorado Educational & Cultural Facilities Authority Revenue Bonds (MBIA) | | | | | | | |
4.38%, 3/1/14 | | | | 1,400 | | 1,447 | |
4.50%, 3/1/15 | | | | 1,600 | | 1,660 | |
4.60%, 3/1/16 | | | | 1,000 | | 1,040 | |
Colorado Health Facilities Authority Revenue Bonds | | | | | | | |
Zero Coupon, 7/15/20 | | | | 1,000 | | 567 | |
Colorado Health Facilities Authority Revenue Bonds SAVRS | | | | (h)3,450 | | 3,450 | |
3.55%, 10/29/20 | | | | | | | |
Commerce, CA Energy Authority Revenue Bonds (MBIA) | | | | 1,355 | | 1,404 | |
5.25%, 7/1/09 | | | | | | | |
Cook County, IL School District General Obligation Bonds (MBIA) | | | | | | | |
Zero Coupon, 12/1/22 | | | | 4,125 | | 2,102 | |
Council Rock, PA School District General Obligation Bonds (MBIA) | | | | | | | |
5.00%, 11/15/19 | | | | 1,285 | | 1,356 | |
Cranberry Township, PA General Obligation Bonds (FGIC) | | | | | | | |
4.80%, 12/1/18 | | | | 1,310 | | 1,362 | |
Crandall, TX Independent School District General Obligation Bonds (PSFG) | | | | | | | |
Zero Coupon, 8/15/19 - 8/15/21 | | | | 4,315 | | 2,414 | |
Crisp County Development Authority Revenue Bonds | | | | | | | |
5.55%, 2/1/15 | | | | 200 | | 215 | |
Crowley TX Independent School District General Obligation Bonds (PSFG) | | | | | | | |
5.00%, 8/1/10 - 8/1/11 | | | | 3,350 | | 3,503 | |
Crown Point, IN Multi-School Building Corp. Revenue Bonds (MBIA) | | | | | | | |
Zero Coupon, 1/15/24 | | | | 5,200 | | 2,504 | |
Cypress-Fairbanks, TX Independent School District General Obligation Bonds (PSFG) | | | | | | | |
4.80%, 2/15/19 | | | | 1,650 | | 1,701 | |
Dallas, TX Area Rapid Transit Revenue Bonds (AMBAC) | | | | | | | |
5.00%, 12/1/11 | | | | 1,915 | | 2,021 | |
Dallas, TX Waterworks & Sewer Systems Revenue Bonds (AMBAC) | | | | | | | |
5.00%, 10/1/12 - 10/1/13 | | | | 15,000 | | 16,032 | |
The accompanying notes are an integral part of the financial statements.
76
2007 Semi-Annual Report |
| |
March 31, 2007 (unaudited) |
Portfolio of Investments (cont’d)
Municipal Portfolio
| | | | Face | | | |
| | | | Amount | | Value | |
| | | | (000) | | (000) | |
Municipal Bonds (cont’d) | | | | | | | |
Dallas County, TX Utility & Reclamation District SAVRS General Obligations Bonds (AMBAC) | | | | | | | |
3.50%, 2/15/29 | | | | $ | (h)(n)17,950 | | $ | 17,950 | |
Delaware County, PA Industrial Development Authority Revenue Bonds | | | | | | | |
6.50%, 1/1/08 | | | | 200 | | 203 | |
Delta County, MI Economic Development Corp. | | | | | | | |
Revenue Bonds | | | | | | | |
6.25%, 4/15/27 | | | | 450 | | 502 | |
Denton, TX Utility System Revenue Bonds (AMBAC) | | | | | | | |
5.00%, 12/1/16 | | | | 1,865 | | 1,953 | |
Detroit, MI City School District General Obligation Bonds (FGIC) | | | | | | | |
5.15%, 5/1/22 | | | | 2,500 | | 2,693 | |
Director of the State of Nevada Department of Business & Industry Revenue Bonds | | | | | | | |
5.63%, 12/1/26 | | | | 1,100 | | 1,218 | |
Director of the State of Nevada Department of Business & Industry Revenue Bonds (AMBAC) | | | | | | | |
Zero Coupon, 1/1/21 - 1/1/23 | | | | 3,845 | | 2,011 | |
Dover, PA Area School District General Obligation Bonds (FGIC) | | | | | | | |
5.00%, 4/1/16 | | | | 1,000 | | 1,046 | |
Duncanville Independent School District, TX, General Obligation Bonds (PSFG) | | | | | | | |
Zero Coupon, 2/15/22 | | | | 4,000 | | 2,095 | |
Eagle, IN - Union Middle School Building Revenue Bonds (AMBAC) | | | | | | | |
4.90%, 7/5/16 | | | | 1,000 | | 1,043 | |
5.00%, 7/5/17 | | | | 1,500 | | 1,573 | |
Eanes, TX Independent School District General Obligation Bonds (PSFG) | | | | | | | |
4.80%, 8/1/19 | | | | 1,365 | | 1,415 | |
East Porter County, IN School Building Corp. Revenue Bonds (MBIA) | | | | | | | |
4.70%, 7/15/12 | | | | 1,025 | | 1,049 | |
Edgewood, TX Independent School District (PSFG) | | | | | | | |
4.75%, 8/15/16 | | | | 1,310 | | 1,365 | |
4.85%, 8/15/17 | | | | 880 | | 913 | |
Elizabeth Forward, PA School District (MBIA) | | | | | | | |
Zero Coupon, 9/1/11 | | | | 1,250 | | 1,055 | |
Essex County, NJ Utility Authority Revenue Bonds (FSA) | | | | | | | |
4.80%, 4/1/14 | | | | 1,005 | | 1,025 | |
Eureka Union School District, CA General Obligation Bonds (MBIA) | | | | | | | |
Zero Coupon, 8/1/28 - 8/1/30 | | | | 5,090 | | 1,847 | |
Everett, WA Water & Sewer Revenue Bonds (MBIA) | | | | | | | |
5.00%, 7/1/13 | | | | 1,630 | | 1,742 | |
Fort Wayne Hospital Authority, IN Revenue Bonds (MBIA) | | | | | | | |
4.70%, 11/15/11 | | | | 1,100 | | 1,135 | |
Fort Worth, TX Water & Sewer Revenue Bonds (FSA) | | | | | | | |
3.44%, 2/15/24 | | | | (h)12,850 | | 12,850 | |
Frisco, TX Independent School District General Obligation Bonds (PSFG) | | | | | | | |
Zero Coupon, 8/15/20 - 8/15/22 | | | | $ | 6,260 | | $ | 3,369 | |
Geneva, IL Industrial Development Revenue Bonds (FSA) | | | | | | | |
4.80%, 5/1/19 | | | | 1,705 | | 1,767 | |
Georgetown County, SC Pollution Control Facility Revenue Bonds | | | | | | | |
5.13%, 2/1/12 | | | | 725 | | 755 | |
Gilliam County, OR Solid Waste Disposal Revenue Bonds | | | | | | | |
4.88%, 7/1/38 | | | | 1,400 | | 1,426 | |
Girard Area, PA School District General Obligation Bonds (FGIC) | | | | | | | |
Zero Coupon, 10/1/18 - 10/1/19 | | | | 950 | | 585 | |
Grand Prairie, TX Independent School District General Obligation Bonds (PSFG) | | | | | | | |
Zero Coupon, 2/15/14 | | | | 2,240 | | 1,703 | |
| | | | | | | |
Grapevine, TX Certificates of Obligation General Obligation Bonds (FGIC) | | | | | | | |
5.75%, 8/15/17 | | | | 1,000 | | 1,066 | |
Greenwood, SC Fifty School Facilities, Inc., Installment Purchase Revenue Bonds (AGC) | | | | | | | |
5.00%, 12/1/11 | | | | 1,000 | | 1,052 | |
Gulf Coast Waste Disposal Authority, TX Revenue Bonds | | | | | | | |
4.55%, 4/1/12 | | | | 830 | | 837 | |
Hawaii State Certificate of Participation General Obligation Bonds (AMBAC) | | | | | | | |
4.80%, 5/1/12 | | | | 1,275 | | 1,307 | |
Hillsborough County, FL, Industrial Development Authority Pollution Control Revenue Bonds | | | | | | | |
4.00%, 5/15/18 | | | | (h)1,625 | | 1,625 | |
Houston, TX Community College Revenue Bonds, Northline Mall Campus Project (AMBAC) | | | | | | | |
4.00%, 4/15/11 - 4/15/12 | | | | 2,865 | | 2,900 | |
Houston, TX General Obligation Bonds (MBIA) | | | | | | | |
5.00%, 3/1/12 | | | | 3,400 | | 3,595 | |
Houston, TX Independent School District General Obligation Bonds (PSFG) | | | | | | | |
5.00%, 2/15/13 | | | | 6,000 | | 6,394 | |
Houston, TX Revenue Bonds (MBIA) | | | | | | | |
5.25%, 5/15/11 | | | | 2,000 | | 2,117 | |
Houston, TX Water & Sewer System Revenue Bonds (FSA) | | | | | | | |
Zero Coupon, 12/1/25 | | | | 12,350 | | 5,459 | |
Illinois Development Finance Authority Revenue Bonds (FGIC) | | | | | | | |
Zero Coupon, 12/1/09 | | | | 2,000 | | 1,810 | |
Illinois Educational Facilities Authority SAVRS Revenue Bonds (MBIA) | | | | | | | |
3.50%, 4/1/28 | | | | (h)11,500 | | 11,500 | |
Illinois Health Facilities Authority Revenue Bonds (MBIA) | | | | | | | |
5.00%, 11/15/12 | | | | 1,000 | | 1,022 | |
The accompanying notes are an integral part of the financial statements.
77
2007 Semi-Annual Report | |
| |
March 31, 2007 (unaudited) | |
Portfolio of Investments (cont’d)
Municipal Portfolio
| | | | Face | | | |
| | | | Amount | | Value | |
| | | | (000) | | (000) | |
Municipal Bonds (cont’d) | | | | | | | |
Illinois Health Facilities Authority Revenue Bonds SAVRS (AMBAC) | | | | | | | |
3.46%, 9/16/24 | | | | $ | (h)(n)21,950 | | $ | 21,950 | |
Indiana Port Commission Revenue Bonds | | | | | | | |
4.10%, 5/1/12 | | | | 3,450 | | 3,450 | |
Indiana State Development Finance Authority Revenue Bonds | | | | | | | |
4.70%, 10/1/31 | | | | (h)100 | | 101 | |
Indiana State University Revenue Bonds (FGIC) | | | | | | | |
5.20%, 10/1/12 | | | | 1,640 | | 1,681 | |
Indiana Transportation Finance Authority Highway Revenue Bonds (AMBAC) | | | | | | | |
Zero Coupon, 12/1/16 | | | | 1,695 | | 1,144 | |
Intermountain Power Agency, UT Power Supply Revenue Bonds | | | | | | | |
Zero Coupon, 7/1/17 | | | | 1,750 | | 1,134 | |
Iowa Finance Authority Revenue Bonds, Private University, Drake University Project (CIFG) | | | | | | | |
5.00%, 4/1/13 | | | | 1,210 | | 1,286 | |
Irving, TX Independent School District General Obligation Bonds (PSFG) | | | | | | | |
Zero Coupon, 2/15/13 | | | | 1,945 | | 1,542 | |
Kane & De Kalb Counties, IL Community Unit School District General Obligation Bonds (AMBAC) | | | | | | | |
Zero Coupon, 12/1/09 | | | | 725 | | 656 | |
Kent State University, OH Revenue Bonds SAVRS (MBIA) | | | | | | | |
3.39%, 5/1/32 | | | | (h)(n)9,275 | | 9,275 | |
King County, WA General Obligation Bonds (MBIA) | | | | | | | |
5.00%, 12/1/19 | | | | 1,075 | | 1,129 | |
Lake County, IL Community Consolidated School District General Obligation Bonds (FGIC) | | | | | | | |
Zero Coupon, 12/1/19 - 12/1/21 | | | | 12,775 | | 7,113 | |
Lakeview, MI Public School District General Obligation Bonds | | | | | | | |
5.00%, 5/1/16 | | | | 1,060 | | 1,113 | |
Lancaster, TX Independent School District General Obligation Bonds (FSA) | | | | | | | |
Zero Coupon, 2/15/09 | | | | 1,795 | | 1,673 | |
Lewisville, TX Independent School District General Obligation Bonds (FGIC) | | | | | | | |
4.00%, 8/15/10 | | | | 4,905 | | 4,959 | |
Long Beach, CA Community College District General Obligation Bonds (FGIC) | | | | | | | |
Zero Coupon, 5/1/14 | | | | 2,465 | | 1,867 | |
Long Island, NY Power Authority Electric System Revenue Bonds (FSA) | | | | | | | |
Zero Coupon, 6/1/16 | | | | 3,700 | | 2,577 | |
Madera, CA Unified School District General Obligation Bonds (FGIC) | | | | | | | |
Zero Coupon, 8/1/26 - 8/1/28 | | | | 7,000 | | 2,863 | |
Madison & Jersey Counties, IL Unit School District General Obligation Bonds (FSA) | | | | | | | |
Zero Coupon, 12/1/20 | | | | 2,900 | | 1,615 | |
Maine Health & Higher Educational Facilities Authority, ME SAVRS Revenue Bonds (FGIC) | | | | | | | |
3.47%, 7/1/14 | | | | $ | (h)(n)5,625 | | $ | 5,625 | |
Maricopa County, AZ Pollution Control | | | | | | | |
2.90%, 6/1/35 | | | | 1,600 | | 1,563 | |
4.00%, 1/1/38 | | | | 350 | | 350 | |
Maryland State Economic Development Corp. Revenue Bonds | | | | | | | |
7.50%, 12/1/14 | | | | 350 | | 382 | |
Massachusetts State Health & Educational Facilities Authority Revenue Bonds (MBIA) | | | | | | | |
3.50%, 10/1/33 | | | | (h)11,900 | | 11,900 | |
Massachusetts State Development Financing Agency Resource Recovery Revenue Bonds | | | | | | | |
6.90%, 12/1/29 | | | | 250 | | 266 | |
Massachusetts State Health & Educational Facilities Authority Revenue Bonds (AMBAC) | | | | | | | |
4.80%, 7/1/12 | | | | 1,665 | | 1,706 | |
Massachusetts State Health & Educational Facilities Authority Revenue Bonds (MBIA) | | | | | | | |
3.50%, 10/1/22 | | | | (h)5,800 | | 5,800 | |
Massachusetts State Water Reserve Authority Revenue Bonds, SAVRS (AMBAC) | | | | | | | |
3.39%, 4/1/29 | | | | (h)(n)19,775 | | 19,775 | |
Maury County, TN Industrial Development Board Solid Waste Disposal Revenue Bonds | | | | | | | |
6.30%, 8/1/18 | | | | 1,075 | | 1,127 | |
Memphis, TN Electric System Revenue Bonds (XLCA) | | | | | | | |
3.44%, 12/1/18 | | | | (h)(n)4,000 | | 4,000 | |
Memphis-Shelby County, TN Airport Authority Special Facilities Revenue Bonds, Federal Express Corp. | | | | | | | |
5.00%, 9/1/09 | | | | 850 | | 864 | |
Memphis-Shelby County, TN Sports Authority Inc. Revenue Bonds, Memphis Arena Project (MBIA) | | | | | | | |
5.00%, 11/1/13 | | | | 1,410 | | 1,516 | |
Merced City, CA School District General Obligation Bonds (MBIA) | | | | | | | |
Zero Coupon, 8/1/28 - 8/1/29 | | | | 4,665 | | 1,736 | |
Metropolitan Pier & Exposition Authority, IL Dedicated State Tax Revenue Bonds (MBIA) | | | | | | | |
Zero Coupon, 6/15/20 - 12/15/23 | | | | 5,175 | | 2,856 | |
Michigan City, IN Area-Wide School Building Corp. Revenue Bonds (FGIC) | | | | | | | |
Zero Coupon, 1/15/17 - 1/15/20 | | | | 6,750 | | 4,261 | |
Michigan State Building Authority Revenue Bonds (MBIA) | | | | | | | |
5.25%, 10/1/10 - 10/1/11 | | | | 3,000 | | 3,172 | |
Michigan State Strategic Fund, Solid Waste Management Project Revenue Bonds | | | | | | | |
4.63%, 12/1/12 | | | | 275 | | 279 | |
Midland, TX Independent School District General Obligation Bonds (FGIC) | | | | | | | |
5.95%, 3/1/18 | | | | 1,225 | | 1,302 | |
Milwaukee, WI Sewer Revenue Bonds (AMBAC) | | | | | | | |
4.88%, 6/1/19 | | | | 2,070 | | 2,144 | |
The accompanying notes are an integral part of the financial statements.
78
2007 Semi-Annual Report |
| |
March 31, 2007 (unaudited) |
Portfolio of Investments (cont’d)
Municipal Portfolio
| | | | Face | | | |
| | | | Amount | | Value | |
| | | | (000) | | (000) | |
Municipal Bonds (cont’d) | | | | | | | |
Montana State Health Facilities Authority Revenue Bonds (AMBAC) | | | | | | | |
3.50%, 2/15/17 | | | | $ | (h)1,800 | | $ | 1,800 | |
Montour, PA School District General Obligation Bonds (MBIA) | | | | | | | |
Zero Coupon, 1/1/13 | | | | 300 | | 239 | |
Morton Grove, IL General Obligation Bonds (FGIC) | | | | | | | |
4.50%, 12/1/13 | | | | 1,480 | | 1,497 | |
Mount San Antonio Community College District, CA General Obligation Bonds (MBIA) | | | | | | | |
Zero Coupon, 8/1/16 - 8/1/17 | | | | 27,555 | | 18,448 | |
Municipal Electric Authority, GA Revenue Bonds, Combustion Turbine Project (XLCA) | | | | | | | |
3.45%, 11/1/29 | | | | (h)2,000 | | 2,000 | |
Nassau County, NY Improvement Bonds General Obligation Bonds (FSA) | | | | | | | |
6.00%, 3/1/17 | | | | 1,275 | | 1,360 | |
Nevada Housing Division Revenue Bonds (FHA) | | | | | | | |
5.30%, 4/1/28 | | | | 5 | | 5 | |
New Jersey Economic Development Authority Revenue Bonds | | | | | | | |
Zero Coupon, 4/1/12 | | | | 625 | | 518 | |
New Orleans, LA Audubon Commission General Obligation Bonds (FSA) | | | | | | | |
5.00%, 10/1/13 | | | | 1,695 | | 1,803 | |
New York City, NY Industrial Development Agency | | | | | | | |
Revenue Bonds (FSA) | | | | | | | |
6.00%, 11/1/15 | | | | 1,485 | | 1,487 | |
New York State Dormitory Authority Revenue Bonds (FSA) | | | | | | | |
5.10%, 2/15/11 | | | | 2,075 | | 2,131 | |
Noblesville, IN High School Building Corp. | | | | | | | |
5.00%, 1/10/12 - 7/10/13 | | | | 4,880 | | 5,197 | |
Noblesville, IN High School Building Corp. Revenue Bonds (AMBAC) | | | | | | | |
Zero Coupon, 2/15/19 | | | | 1,850 | | 1,121 | |
Norman, OK Regional Hospital Authority SAVRS Revenue Bonds (MBIA) | | | | | | | |
3.50%, 9/1/22 | | | | (h)4,350 | | 4,350 | |
North Carolina Municipal Power Agency, Electric Revenue Bonds | | | | | | | |
6.63%, 1/1/10 | | | | 850 | | 910 | |
North Side, IN High School Building Corp. Revenue Bonds (FSA) | | | | | | | |
5.25%, 7/15/13 | | | | 2,910 | | 3,149 | |
North Slope Borough, AK General Obligation Bonds (MBIA) | | | | | | | |
Zero Coupon, 6/30/12 | | | | 2,900 | | 2,365 | |
Norwalk-LA Mirada, CA Unified School District General Obligation Bonds (FGIC) | | | | | | | |
Zero Coupon, 8/1/25 | | | | 8,900 | | 3,978 | |
Ohio State Higher Educational Facility Commission (Denison University) Revenue Bonds (AMBAC) | | | | | | | |
3.39%, 12/1/34 | | | | (h)(n)8,800 | | 8,800 | |
Ohio State Solid Waste Revenue Bonds | | | | | | | |
4.25%, 4/1/33 | | | | $ | 700 | | $ | 686 | |
Okemos, MI Public School District General Obligation Bonds (MBIA) | | | | | | | |
Zero Coupon, 5/1/15 | | | | 900 | | 653 | |
Orange County, FL Health Facilities Authority Revenue Bonds (MBIA) | | | | | | | |
3.57%, 10/15/26 | | | | (h)5,400 | | 5,400 | |
Ouachita Parish, LA West Ouachita Parish School District Revenue Bonds (MBIA) | | | | | | | |
4.70%, 9/1/14 | | | | 1,020 | | 1,051 | |
Pajaro Valley, CA Unified School District Certificate Partnership General Obligation Bonds (FSA) | | | | | | | |
Zero Coupon, 8/1/27 | | | | 2,220 | | 898 | |
Palm Beach County, FL School Board COP | | | | | | | |
5.00%, 8/1/11 - 8/1/12 | | | | 7,770 | | 8,209 | |
Pearland, TX Independent School District General Obligation Bonds (PSFG) | | | | | | | |
4.88%, 2/15/19 | | | | 1,425 | | 1,498 | |
Penn Hills Municipality, PA General Obligation Bonds | | | | | | | |
Zero Coupon, 6/1/12 - 12/1/13 | | | | 2,115 | | 1,647 | |
Pennsylvania Convention Center Authority Revenue Bonds (FGIC) | | | | | | | |
6.70%, 9/1/16 | | | | 500 | | 579 | |
Pennsylvania State Financing Authority School Revenue Bonds, Aliquippa School District | | | | | | | |
Zero Coupon, 6/1/12 | | | | 685 | | 554 | |
Pennsylvania State Public School Building Authority, Marple Newtown School District Project Revenue Bonds (MBIA) | | | | | | | |
4.60%, 3/1/15 | | | | 1,065 | | 1,103 | |
4.70%, 3/1/16 | | | | 715 | | 743 | |
Philadelphia, PA Water & Wastewater Revenue Bonds (AMBAC) | | | | | | | |
5.00%, 8/1/11 - 8/1/13 | | | | 8,005 | | 8,476 | |
Piedmont, SC Municipal Power Agency Revenue Bonds (AMBAC) | | | | | | | |
Zero Coupon, 1/1/31 - 1/1/32 | | | | 22,300 | | 7,497 | |
Pittsburgh, PA Water & Sewer Authority Water & Sewer System Revenue Bonds (FSA) | | | | | | | |
5.00%, 9/1/13 | | | | 1,000 | | 1,071 | |
Pittsburgh, PA Stadium Authority Lease Revenue Bonds | | | | | | | |
6.50%, 4/1/11 | | | | 130 | | 137 | |
Port Authority, NY & NJ Special Obligation Revenue Bonds | | | | | | | |
7.00%, 10/1/07 | | | | 100 | | 101 | |
Rescue Union School District, CA General Obligation Bonds (MBIA) | | | | | | | |
Zero Coupon, 9/1/27 | | | | 2,000 | | 806 | |
Richardson, TX Hotel Occupancy Certificates of Obligation General Obligation Bonds (FGIC) | | | | | | | |
5.75%, 2/15/17 | | | | 1,405 | | 1,484 | |
Richland County, SC Revenue Bonds | | | | | | | |
6.10%, 4/1/23 | | | | 725 | | 791 | |
The accompanying notes are an integral part of the financial statements.
79
2007 Semi-Annual Report | |
| |
March 31, 2007 (unaudited) | |
Portfolio of Investments (cont’d)
Municipal Portfolio
| | | | Face | | | |
| | | | Amount | | Value | |
| | | | (000) | | (000) | |
Municipal Bonds (cont’d) | | | | | | | |
Rincon Valley, CA Union School District General Obligation Bonds (FGIC) | | | | | | | |
Zero Coupon, 8/1/32 - 8/1/35 | | | | $ | 9,675 | | $ | 2,906 | |
Riverside, CA Electric Revenue Bonds (MBIA) | | | | | | | |
5.00%, 10/1/11 - 10/1/12 | | | | 3,380 | | 3,596 | |
Robinson Township, PA Municipal Authority Revenue Bonds | | | | | | | |
6.90%, 5/15/18 | | | | 100 | | 109 | |
Rockport, IN Pollution Control Revenue Bonds SAVRS | | | | | | | |
4.90%, 6/1/25 | | | | (h)455 | | 456 | |
Saginaw Valley State University, MI Revenue Bonds SAVRS (MBIA) | | | | | | | |
3.45%, 7/1/31 | | | | (h)10,700 | | 10,700 | |
Saginaw, MI Hospital Financing Authority Revenue Bonds (MBIA) | | | | | | | |
5.38%, 7/1/19 | | | | 1,265 | | 1,315 | |
Sam Rayburn, TX Municipal Power Agency Revenue Bonds | | | | | | | |
6.00%, 10/1/21 | | | | 650 | | 688 | |
San Antonio County, TX Parking System Revenue Bonds (AMBAC) | | | | | | | |
5.50%, 8/15/17 | | | | 700 | | 734 | |
Sanger, TX Independent School District General Obligation Bonds (PSFG) | | | | | | | |
Zero Coupon, 2/15/19 - 2/15/22 | | | | 4,265 | | 2,381 | |
Santa Ana, CA Unified School District General Obligation Bonds (FGIC) | | | | | | | |
Zero Coupon, 8/1/19 - 8/1/20 | | | | 5,475 | | 3,201 | |
Scranton-Lackawanna, PA Health & Welfare Authority Revenue Bonds | | | | | | | |
6.63%, 7/1/09 | | | | 45 | | 46 | |
Seminole County, FL School Board COP (AMBAC) | | | | | | | |
5.00%, 7/1/11 - 7/1/12 | | | | 6,750 | | 7,116 | |
Spring, TX Independent School District General Obligation Bonds (PSFG) | | | | | | | |
5.00%, 8/15/19 | | | | 1,760 | | 1,842 | |
State of Hawaii General Obligation Bonds (AMBAC) | | | | | | | |
5.00%, 4/1/13 | | | | 8,290 | | 8,874 | |
Steel Valley, PA School District, Allegheny County General Obligation Bonds | | | | | | | |
Zero Coupon, 11/1/11 - 11/1/17 | | | | 1,820 | | 1,376 | |
Texas State Turnpike Authority Revenue Bonds (AMBAC) | | | | | | | |
Zero Coupon, 8/15/18 | | | | 5,700 | | 3,542 | |
Tobacco Securitization Authority of Northern California, Asset Backed Revenue Bonds, Series A-1 | | | | | | | |
4.75%, 6/1/23 | | | | 6,165 | | 6,141 | |
Tobacco Settlement Authority of Washington, Asset Backed Revenue Bonds | | | | | | | |
6.50%, 6/1/26 | | | | 925 | | 1,013 | |
Tobacco Settlement Financing Corp., LA, Asset Backed Revenue Bonds | | | | | | | |
5.50%, 5/15/30 | | | | 1,350 | | 1,410 | |
Tobacco Settlement Financing Corp., NJ, Asset Backed Revenue Bonds | | | | | | | |
4.38%, 6/1/19 | | | | $ | 640 | | $ | 642 | |
Tobacco Settlement Financing Corp., RI, Asset Backed Revenue Bonds | | | | | | | |
6.00%, 6/1/23 | | | | 1,575 | | 1,678 | |
Toledo-Lucas County, OH Port Authority Revenue Bonds | | | | | | | |
6.45%, 12/15/21 | | | | 900 | | 1,091 | |
Tomball, TX Independent School District General Obligation Bonds (PSFG) | | | | | | | |
4.75%, 2/15/15 | | | | 1,205 | | 1,242 | |
Union Elementary School District, CA General Obligation Bonds (MBIA) | | | | | | | |
Zero Coupon, 9/1/27 - 9/1/28 | | | | 8,000 | | 3,206 | |
University of Arkansas Revenue Bonds (FSA) | | | | | | | |
4.90%, 12/1/19 | | | | 2,315 | | 2,433 | |
University of Massachusetts Building Authority Revenue Bonds (AMBAC) | | | | | | | |
5.25%, 11/1/11 | | | | 2,100 | | 2,241 | |
University of Southern Indiana, IN Revenue Bonds (AMBAC) | | | | | | | |
5.00%, 10/1/09 | | | | 1,095 | | 1,131 | |
University Of Utah COP (AMBAC) | | | | | | | |
5.00%, 12/1/11 - 12/1/13 | | | | 4,040 | | 4,297 | |
Upper Darby Township, PA General Obligation Bonds (AMBAC) | | | | | | | |
Zero Coupon, 7/15/11 | | | | 525 | | 445 | |
Utah County, UT Environmental Improvement Revenue Bonds | | | | | | | |
5.05%, 11/1/17 | | | | 170 | | 179 | |
Vancouver, WA Water & Sewer Revenue Bonds (MBIA) | | | | | | | |
4.60%, 6/1/13 | | | | 1,000 | | 1,009 | |
Vermont Educational & Health Buildings Funding Agency SAVRS Revenue Bonds (FGIC) | | | | | | | |
3.44%, 9/12/13 | | | | (h)7,950 | | 7,950 | |
Victor Elementary School District, CA General Obligation Bonds (FGIC) | | | | | | | |
Zero Coupon, 2/1/30 | | | | 2,100 | | 752 | |
Virginia State Peninsula Regional Jail Authority Revenue Bonds (MBIA) | | | | | | | |
5.00%, 10/1/12 - 10/1/13 | | | | 2,705 | | 2,881 | |
Waco, TX Educational Finance Corp. Revenue Bonds SAVRS | | | | | | | |
3.50%, 2/1/32 | | | | (h)(n)12,000 | | 12,000 | |
Wake County Industrial Facilities & Pollution Control Financing Authority, NC Revenue Bonds (AMBAC) | | | | | | | |
3.50%, 5/1/24 | | | | (h)8,400 | | 8,400 | |
Warren, MI Consolidated School District General Obligation Bonds | | | | | | | |
4.15%, 5/1/14 | | | | 1,000 | | 1,019 | |
Washington State Health Care Facilities Revenue Bonds (FSA) | | | | | | | |
4.70%, 10/1/11 | | | | 1,075 | | 1,100 | |
The accompanying notes are an integral part of the financial statements.
80
2007 Semi-Annual Report |
| |
March 31, 2007 (unaudited) |
Portfolio of Investments (cont’d)
Municipal Portfolio
| | | | Face | | | |
| | | | Amount | | Value | |
| | | | (000) | | (000) | |
Municipal Bonds (cont’d) | | | | | | | |
Washington State Health Care Facilities (Fred Hutchinson) SAVRS Revenue Bonds (AMBAC) | | | | | | | |
3.50%, 1/1/27 | | | | $ | (h)7,800 | | $ | 7,800 | |
3.55%, 1/1/33 | | | | (h)11,850 | | 11,850 | |
Washington State Health Care Facilities Authority Revenue Bonds (AMBAC) | | | | | | | |
5.13%, 11/15/11 | | | | 1,000 | | 1,032 | |
Washington State Motor Vehicle Fuel Facilities General Obligation Bonds (AMBAC) | | | | | | | |
Zero Coupon, 6/1/14 - 6/1/16 | | | | 8,160 | | 5,911 | |
Washington State Recreational Facilities General Obligation Bonds (FGIC) | | | | | | | |
Zero Coupon, 1/1/17 | | | | 6,900 | | 4,614 | |
Washoe County, NV General Obligation Bonds (FSA) | | | | | | | |
Zero Coupon, 7/1/18 | | | | 4,235 | | 2,646 | |
Wayne State University, MI Revenue Bonds SAVRS (AMBAC) | | | | | | | |
3.60%, 11/15/32 | | | | (h)(n)5,600 | | 5,600 | |
West Contra Costa Unified School District, CA General Obligation Bonds (FGIC) | | | | | | | |
Zero Coupon, 8/1/25 - 8/1/27 | | | | 23,200 | | 9,795 | |
West Ottawa Public School District, MI General Obligation Bonds | | | | | | | |
5.00%, 5/1/21 | | | | 850 | | 904 | |
West Virginia School Building Authority Revenue Bonds (FGIC) | | | | | | | |
5.00%, 7/1/11 - 7/1/12 | | | | 8,135 | | 8,592 | |
West Virginia University Revenue Bonds (AMBAC) | | | | | | �� | |
Zero Coupon, 4/1/22 - 4/1/24 | | | | 2,000 | | 1,004 | |
Western Michigan University, MI SAVRS Revenue Bonds (AMBAC) | | | | | | | |
3.60%, 11/15/32 | | | | (h)(n)9,550 | | 9,550 | |
Western Michigan University, MI SAVRS Revenue Bonds (MBIA) | | | | | | | |
3.60%, 11/22/30 | | | | (h)(n)9,800 | | 9,800 | |
Will County, IL Community High School District No. 210 General Obligation Bonds, Lincoln Way School Building (FGIC) | | | | | | | |
5.00%, 1/1/11 | | | | 1,155 | | 1,209 | |
William S. Hart Union High School District, CA General Obligation Bonds (FSA) | | | | | | | |
Zero Coupon, 9/1/21 - 9/1/28 | | | | 18,290 | | 9,100 | |
Winnebago County, IL School District General Obligation Bonds (FSA) | | | | | | | |
Zero Coupon, 1/1/14 | | | | 3,600 | | 2,752 | |
Wisconsin State Health & Educational Facilities Authority Revenue Bonds (AMBAC) | | | | | | | |
5.63%, 2/15/12 | | | | 1,000 | | 1,081 | |
York County, PA Hospital Authority Revenue Bonds SAVRS (AMBAC) | | | | | | | |
3.44%, 7/1/21 | | | | (h)7,800 | | 7,800 | |
Ypsilanti, MI School District General Obligation Bonds (FGIC) | | | | | | | |
4.70%, 5/1/12 | | | | 1,115 | | 1,137 | |
| | | | | | 728,771 | |
Total Fixed Income Securities (Cost $735,708) | | | | | | $ | 760,798 | |
| | | | | | | | | |
| | | | No. of | | | |
| | | | Contracts | | | |
Put Options Purchased (0.1%) | | | | | | | |
90 Day EuroDollar | | | | | | | |
6/07 @ $94.25 | | | | 1,601 | | 8 | |
6/07 @ $94.50 | | | | 219 | | 1 | |
6/07 @ $94.75 | | | | 3,413 | | 555 | |
9/07 @ $94.75 | | | | 1,774 | | 275 | |
12/07 @ $94.50 | | | | 165 | | 7 | |
Total Put Options Purchased (Cost $1,777) | | | | | | 846 | |
| | | | Shares | | | |
Preferred Stocks (3.7%) | | | | | | | |
Finance (3.7%) | | | | | | | |
ABN AMRO North America Capital Funding | | | | | | | |
Trust I | | | | (e)5,875 | | 6,092 | |
Federal Home Loan Mortgage Corp. | | | | 88,000 | | 4,660 | |
Goldman Sachs Group, Inc. | | | | 121,000 | | 3,175 | |
International Lease Finance Corp. | | | | 31 | | 3,100 | |
Pitney Bowes International Holdings, Inc. | | | | 34 | | 3,402 | |
Preferred Pass-Through Trust 2006 | | | | (e)3,700,000 | | 3,700 | |
US Bancorp | | | | 178,000 | | 4,651 | |
Total Preferred Stocks (Cost $28,208) | | | | | | 28,780 | |
Short-Term Investments (6.2%) | | | | | | | |
Investment Company (1.5%) | | | | | | | |
Dreyfus Basic Municipal Money Market Fund | | | | 11,355 | | 11,355 | |
| | | | Face | | | |
| | | | Amount | | | |
| | | | (000) | | | |
Repurchase Agreement (4.5%) | | | | | | | |
J.P. Morgan Securities, Inc., 5.28%, | | | | | | | |
dated 3/30/07, due 4/2/07, repurchase price $35,078 | | | | $ | (f)35,063 | | 35,063 | |
U.S. Treasury Security (0.2%) | | | | | | | |
U.S. Treasury Bills | | | | | | | |
4.98%, 07/12/07 | | | | (j)2,000 | | 1,973 | |
Total Short-Term Investments (Cost $48,390) | | | | | | 48,391 | |
Total Investments (108.0%) (Cost $814,083) | | | | | | 838,815 | |
Liabilities in Excess of Other Assets (-8.0%) | | | | | | (61,961) | |
Net Assets (100%) | | | | | | $ | 776,854 | |
| | | | | | | | | |
(e) | 144A security — Certain conditions for public sale may exist. Unless otherwise noted, these securities are deemed to be liquid. |
The accompanying notes are an integral part of the financial statements.
81
2007 Semi-Annual Report | |
| |
March 31, 2007 (unaudited) | |
Portfolio of Investments (cont’d)
Municipal Portfolio
(f) | Represents the Portfolio’s agreement which has a total value of $1,580,364,000. The repurchase agreement was fully collateralized by U.S. government agency securities at the date of this Portfolio of Investments as follows: Federal Farm Credit Bank, 0.00% to 7.43%, due 5/7/07 to 3/2/21; Federal Home Loan Bank, 0.00% to 6.42%, due 4/2/07 to 3/9/26; Federal Home Loan Mortgage Corp., 0.00% to 7.00%, due 4/2/07 to 3/15/31; Federal National Mortgage Association, 0.00% to 7.13%, due 4/5/07 to 3/17/31; Tennessee Valley Authority, 4.88%, due 12/15/16, which had a total value of $1,611,974,119. The investment in the repurchase agreement is through participation in a joint account with affiliated parties pursuant to exemptive relief received by the Portfolio from the SEC. |
(h) | Variable/Floating Rate Security — Interest rate changes on these instruments are based on changes in a designated base rate. The rates shown are those in effect on March 31, 2007. |
(j) | All or a portion of the security was pledged to cover margin requirements for futures contracts. |
(n) | All or a portion of the security was pledged to cover securities sold short. |
@ | Face Amount/Value is less than $500. |
Inv Fl | Inverse Floating Rate — Interest rate fluctuates with an inverse relationship to an associated interest rate. Indicated rate is the effective rate at March 31, 2007. |
IO | Interest Only |
PAC | Planned Amortization Class |
PO | Principal Only |
AMBAC | Ambac Assurance Corp. |
AGC | Assured Guaranty Corp. |
CIFG | CDC IXIS Financial Guaranty |
COP | Certificate of Participation |
FGIC | Financial Guaranty Insurance Co. |
FHA | Federal Housing Administration |
FSA | Financial Security Assurance Inc. |
MBIA | MBIA Insurance Corp. |
PSFG | Permanent School Fund Guaranteed |
SAVRS | Semi-Annual Variable Rate Security |
XLCA | XL Capital Assurance |
Futures Contracts:
The Portfolio had the following futures contract(s) open at period end:
| | | | | | | | Net | |
| | | | | | | | Unrealized | |
| | Number | | | | | | Appreciation | |
| | of | | Value | | Expiration | | (Depreciation) | |
| | Contracts | | (000) | | Date | | (000) | |
Long: | | | | | | | | | |
U.S. Treasury 10 yr. Note | | 2,512 | | $ | 271,610 | | Jun-07 | | $ | 632 | |
| | | | | | | | | | | |
| | | | Face | | | |
| | | | Amount | | Value | |
| | | | (000) | | (000) | |
Securities Sold Short - Debt Instruments | | | | | | | |
Federal National Mortgage Association, April TBA | | | | | | | |
5.50%, 4/25/37 | | | | | | | |
(Total Proceeds $168,557) | | | | $ | 169,800 | | $ | 168,049 | |
| | | | | | | | | |
TBA To Be Announced
Graphic Presentation of Portfolio Holdings
The following graph depicts the Portfolio’s holdings by investment type, as a percentage of total net investments.
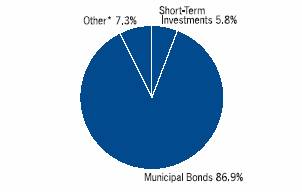
* Investment types which do not appear in the above graph, as well as those which represent less than 5% of total investments, if applicable, are included in the category labeled “Other”.
The accompanying notes are an integral part of the financial statements.
82
2007 Semi-Annual Report |
| |
March 31, 2007 (unaudited) |
Statements of Assets and Liabilities
| | | | Equities | | Mid Cap | | U.S. Mid | |
| | Balanced | | Plus | | Growth | | Cap Value | |
| | Portfolio | | Portfolio | | Portfolio | | Portfolio | |
| | (000) | | (000) | | (000) | | (000) | |
Assets: | | | | | | | | | |
Investments in Securities of Unaffiliated Issuers, at Cost: | | $ | 270,262 | | $ | 27,625 | | $ | 2,045,761 | | $ | 135,589 | |
Foreign Currency, at Cost: | | — | | — | | 1 | | — | |
Investments in Securities of Unaffiliated Issuers, at Value:(1) | | 309,220 | | 27,459 | | 2,390,537 | | 157,059 | |
Foreign Currency, at Value: | | — | | — | | 1 | | — | |
Cash | | 224 | | 46 | | @— | | 1 | |
Receivable for Forward Commitments | | 5,111 | | 12,372 | | — | | — | |
Due from Broker | | 2,019 | | — | | — | | — | |
Receivable for Portfolio Shares Sold | | 454 | | — | | 3,034 | | 205 | |
Receivable for Investments Sold | | 3,461 | | 6 | | 1,312 | | 249 | |
Unrealized Appreciation on Swap Agreements | | 42 | | 6 | | — | | — | |
Unrealized Appreciation on Foreign Currency Exchange Contracts | | 97 | | — | | — | | — | |
Dividends Receivable | | 209 | | — | | 1,099 | | 133 | |
Interest Receivable | | 471 | | 141 | | 20 | | 2 | |
OtherAssets | | 5 | | @— | | 42 | | 1 | |
Total Assets | | 321,313 | | 40,030 | | 2,396,045 | | 157,650 | |
Liabilities: | | | | | | | | | |
Collateral on Securities Loaned, at Value | | 7,691 | | — | | — | | — | |
Payable for Delayed Delivery Commitments | | 10,141 | | — | | — | | — | |
Payable for Investments Purchased | | 1,800 | | 49 | | 22,358 | | 879 | |
Due To Broker | | — | | 10 | | — | | — | |
Unrealized Depreciation on Foreign Currency Exchange Contracts | | 19 | | — | | — | | — | |
Unrealized Depreciation on Swap Agreements | | 94 | | 1 | | — | | — | |
Payable for Portfolio Shares Redeemed | | 320 | | — | | 946 | | 21 | |
Payable for Investment Advisory Fees | | 346 | | 7 | | 2,854 | | 274 | |
Payable for Administration Fees | | 20 | | 2 | | 158 | | 11 | |
Payable for Custodian Fees | | 28 | | 1 | | 61 | | 12 | |
Payable for Trustees’ Fees and Expenses | | 8 | | — | | 29 | | 22 | |
Payable for Distribution Fees — Adviser Class | | 6 | | @— | | 237 | | 3 | |
Payable for Securities Sold Short, at Value (Proceeds $12,377) | | — | | 12,348 | | — | | — | |
Payable for Shareholder Servicing Fees — Investment Class | | 1 | | — | | — | | @— | |
Other Liabilities | | 50 | | 38 | | 224 | | 43 | |
Total Liabilities | | 20,524 | | 12,456 | | 26,867 | | 1,265 | |
Net Assets | | $ | 300,789 | | $ | 27,574 | | $ | 2,369,178 | | $ | 156,385 | |
Net Assets Consist Of: | | | | | | | | | |
Paid-in Capital | | $ | 296,650 | | $ | 26,742 | | $ | 2,669,124 | | $ | 294,463 | |
Undistributed (Distributions in Excess of) Net Investment Income | | 113 | | 435 | | 1,660 | | 244 | |
Accumulated Net Realized Gain (Loss) | | (34,889 | ) | 768 | | (646,382 | ) | (159,792 | ) |
Unrealized Appreciation (Depreciation) on: | | | | | | | | | |
Investments | | 38,958 | | (166 | ) | 344,776 | | 21,470 | |
Foreign Currency Exchange Contracts and Translations | | 78 | | — | | — | | — | |
Futures Contracts | | (69 | ) | (239 | ) | — | | — | |
Securities Sold Short | | — | | 29 | | — | | — | |
Swap Agreements | | (52 | ) | 5 | | — | | — | |
Net Assets | | $ | 300,789 | | $ | 27,574 | | $ | 2,369,178 | | $ | 156,385 | |
The accompanying notes are an integral part of the financial statements.
83
2007 Semi-Annual Report | |
| |
March 31, 2007 (unaudited) | |
Statements of Assets and Liabilities (cont’d)
| | | | Equities | | Mid Cap | | U.S. Mid | |
| | Balanced | | Plus | | Growth | | Cap Value | |
| | Portfolio | | Portfolio | | Portfolio | | Portfolio | |
| | (000) | | (000) | | (000) | | (000) | |
INSTITUTIONAL CLASS: | | | | | | | | | |
Net Assets | | $ | 267,834 | | $ | 27,059 | | $ | 1,241,855 | | $ | 137,977 | |
Shares Outstanding (unlimited number of shares authorized, no par value) (not in 000’s) | | 19,974,024 | | 2,626,694 | | 44,229,994 | | 4,156,018 | |
Net Asset Value, Offering and Redemption Price Per Share | | $ | 13.41 | | $ | 10.30 | | $ | 28.08 | | $ | 33.20 | |
INVESTMENT CLASS: | | | | | | | | | |
Net Assets | | $ | 4,517 | | $ | — | | $ | — | | $ | 3,237 | |
Shares Outstanding (unlimited number of shares authorized, no par value) (not in 000’s) | | 337,355 | | — | | — | | 97,936 | |
Net Asset Value, Offering and Redemption Price Per Share | | $ | 13.39 | | $ | — | | $ | — | | $ | 33.05 | |
ADVISER CLASS: | | | | | | | | | |
Net Assets | | $ | 28,438 | | $ | 515 | | $ | 1,127,323 | | $ | 15,171 | |
Shares Outstanding (unlimited number of shares authorized, no par value) (not in 000’s) | | 2,125,034 | | 50,000 | | 41,195,876 | | 458,924 | |
Net Asset Value, Offering and Redemption Price Per Share | | $ | 13.38 | | $ | 10.29 | | $ | 27.36 | | $ | 33.06 | |
(1) Including: | | | | | | | | | |
Repurchase Agreements, at Value: | | $ | 26,606 | | $ | 2,550 | | $ | 69,453 | | $ | 6,434 | |
Securities on Loan, at Value: | | $ | 13,213 | | $ | — | | $ | — | | $ | — | |
@ Amount is less than $500.
The accompanying notes are an integral part of the financial statements.
84
2007 Semi-Annual Report |
| |
March 31, 2007 (unaudited) |
Statements of Assets and Liabilities
| | U.S. Small | | | | Core Fixed | | Core Plus | |
| | Cap Value | | Value | | Income | | Fixed Income | |
| | Portfolio | | Portfolio | | Portfolio | | Portfolio | |
| | (000) | | (000) | | (000) | | (000) | |
Assets: | | | | | | | | | |
Investments in Securities of Unaffiliated Issuers, at Cost: | | $ | 702,269 | | $ | 538,225 | | $ | 344,425 | | $ | 3,122,018 | |
Foreign Currency, at Cost: | | — | | — | | — | | @— | |
Investments in Securities of Unaffiliated Issuers, at Value:(1) | | 865,206 | | 606,375 | | 342,814 | | 3,109,096 | |
Foreign Currency, at Value: | | — | | — | | — | | @— | |
Cash | | @— | | 1 | | — | | 13,406 | |
Receivable for Portfolio Shares Sold | | 293 | | 308 | | 48 | | 2,585 | |
Receivable For Forward Commitments | | — | | — | | 11,943 | | 140,469 | |
Due from Broker | | — | | — | | 192 | | 1,692 | |
Interest Receivable | | 15 | | 4 | | 1,292 | | 13,727 | |
Unrealized Appreciation on Swap Agreements | | — | | — | | 452 | | 2,831 | |
Receivable for Investments Sold | | — | | 4,231 | | 913 | | 9,405 | |
Dividends Receivable | | 635 | | 949 | | — | | — | |
OtherAssets | | 18 | | 6 | | 6 | | 43 | |
Total Assets | | 866,167 | | 611,874 | | 357,660 | | 3,293,254 | |
Liabilities: | | | | | | | | | |
Collateral on Securities Loaned, at Value | | — | | 18,781 | | 20,548 | | 269,343 | |
Payable for Delayed Delivery Commitments | | — | | — | | 20,728 | | 256,443 | |
Payable for Investments Purchased | | 2,346 | | 1,312 | | 1,774 | | 56,839 | |
Unrealized Depreciation on Foreign Currency Exchange Contracts | | — | | — | | — | | 674 | |
Unrealized Depreciation on Swap Agreements | | — | | — | | 398 | | 1,711 | |
Payable for Portfolio Shares Redeemed | | 397 | | 242 | | 114 | | 889 | |
Payable for Bank Overdraft | | — | | — | | 27 | | — | |
Payable for Investment Advisory Fees | | 1,353 | | 745 | | 249 | | 2,159 | |
Payable for Administration Fees | | 57 | | 40 | | 21 | | 184 | |
Payable for Custodian Fees | | 19 | | 21 | | 9 | | 53 | |
Payable for Trustees’ Fees and Expenses | | 19 | | 25 | | 4 | | 88 | |
Payable for Distribution Fees — Adviser Class | | 10 | | 44 | | 2 | | 27 | |
Payable for Shareholder Servicing Fees — Investment Class | | — | | 10 | | — | | 18 | |
Other Liabilities | | 77 | | 153 | | 50 | | 172 | |
Total Liabilities | | 4,278 | | 21,373 | | 43,924 | | 588,600 | |
Net Assets | | $ | 861,889 | | $ | 590,501 | | $ | 313,736 | | $ | 2,704,654 | |
Net Assets Consist Of: | | | | | | | | | |
Paid-in Capital | | $ | 658,750 | | $ | 506,943 | | $ | 315,033 | | $ | 2,797,402 | |
Undistributed (Distributions in Excess of) Net Investment Income | | 742 | | 2,454 | | 840 | | (19,531 | ) |
Accumulated Net Realized Gain (Loss) | | 39,460 | | 12,954 | | (322 | ) | (61,326 | ) |
Unrealized Appreciation (Depreciation) on: | | | | | | | | | |
Investments | | 162,937 | | 68,150 | | (1,611 | ) | (12,922 | ) |
Foreign Currency Exchange Contracts and Translations | | — | | — | | — | | (673 | ) |
Futures Contracts | | — | | — | | (258 | ) | 584 | |
Swap Agreements | | — | | — | | 54 | | 1,120 | |
Net Assets | | $ | 861,889 | | $ | 590,501 | | $ | 313,736 | | $ | 2,704,654 | |
| | | | | | | | | | | | | | | | | |
The accompanying notes are an integral part of the financial statements.
85
2007 Semi-Annual Report | |
| |
March 31, 2007 (unaudited) | |
Statements of Assets and Liabilities (cont’d)
| | U.S. Small | | | | Core Fixed | | Core Plus | |
| | Cap Value | | Value | | Income | | Fixed Income | |
| | Portfolio | | Portfolio | | Portfolio | | Portfolio | |
| | (000) | | (000) | | (000) | | (000) | |
INSTITUTIONAL CLASS: | | | | | | | | | |
Net Assets | | $ | 813,358 | | $ | 301,569 | | $ | 303,098 | | $ | 2,435,542 | |
Shares Outstanding (unlimited number of shares authorized, no par value) (not in 000’s) | | 29,692,131 | | 16,733,610 | | 28,108,548 | | 212,419,084 | |
Net Asset Value, Offering and Redemption Price Per Share | | $ | 27.39 | | $ | 18.02 | | $ | 10.78 | | $ | 11.47 | |
INVESTMENT CLASS: | | | | | | | | | |
Net Assets | | $ | — | | $ | 79,262 | | $ | — | | $ | 141,140 | |
Shares Outstanding (unlimited number of shares authorized, no par value) (not in 000’s) | | — | | 4,391,833 | | — | | 12,313,130 | |
Net Asset Value, Offering and Redemption Price Per Share | | $ | — | | $ | 18.05 | | $ | — | | $ | 11.46 | |
ADVISER CLASS: | | | | | | | | | |
Net Assets | | $ | 48,531 | | $ | 209,670 | | $ | 10,638 | | $ | 127,972 | |
Shares Outstanding (unlimited number of shares authorized, no par value) (not in 000’s) | | 1,779,346 | | 11,651,451 | | 992,147 | | 11,175,496 | |
Net Asset Value, Offering and Redemption Price Per Share | | $ | 27.27 | | $ | 18.00 | | $ | 10.72 | | $ | 11.45 | |
(1) Including: | | | | | | | | | |
Repurchase Agreements, at Value: | | $ | 49,723 | | $ | 13,965 | | $ | 40,822 | | $ | 259,770 | |
Securities on Loan, at Value: | | $ | — | | $ | 18,537 | | $ | 19,914 | | $ | 287,205 | |
@ Amount is less than $500.
The accompanying notes are an integral part of the financial statements.
86
2007 Semi-Annual Report |
| |
March 31, 2007 (unaudited) |
Statements of Assets and Liabilities
| | | | | | | | Investment | |
| | | | Intermediate | | International | | Grade Fixed | |
| | High Yield | | Duration | | Fixed Income | | Income | |
| | Portfolio | | Portfolio | | Portfolio | | Portfolio | |
| | (000) | | (000) | | (000) | | (000) | |
Assets: | | | | | | | | | |
Investments in Securities of Unaffiliated Issuers, at Cost: | | $ | 289,720 | | $ | 153,141 | | $ | 199,553 | | $ | 572,708 | |
Foreign Currency, at Cost: | | 21 | | — | | — | | — | |
Investments in Securities of Unaffiliated Issuers, at Value:(1) | | 259,234 | | 152,505 | | 203,999 | | 570,614 | |
Foreign Currency, at Value: | | 21 | | — | | — | | — | |
Cash | | 260 | | 18 | | @— | | — | |
Receivable for Delayed Delivery Commitments | | — | | 5,902 | | — | | 25,403 | |
Due from Broker | | — | | — | | 1,785 | | 619 | |
Interest Receivable | | 3,728 | | 732 | | 2,743 | | 2,303 | |
Unrealized Appreciation on Foreign Currency Exchange Contracts | | — | | — | | 711 | | — | |
Unrealized Appreciation on Swap Agreements | | — | | 17 | | — | | 455 | |
Receivable for Investments Sold | | 12 | | 6 | | 227 | | 1,551 | |
Receivable for Portfolio Shares Sold | | 169 | | — | | 72 | | 609 | |
OtherAssets | | 3 | | 2 | | 4 | | 8 | |
Total Assets | | 263,427 | | 159,182 | | 209,541 | | 601,562 | |
Liabilities: | | | | | | | | | |
Collateral on Securities Loaned, at Value | | 49,300 | | — | | — | | 26,989 | |
Payable for Delayed Delivery Commitments | | 789 | | 15,273 | | — | | 50,810 | |
Payable for Investments Purchased | | 609 | | 2 | | 891 | | 4,394 | |
Due To Broker | | 21 | | 57 | | — | | — | |
Unrealized Depreciation on Foreign Currency Exchange Contracts | | 158 | | — | | 554 | | — | |
Unrealized Depreciation on Swap Agreements | | 59 | | 20 | | — | | 702 | |
Payable for Portfolio Shares Redeemed | | 42 | | 74 | | 43 | | 381 | |
Payable for Investment Advisory Fees | | 222 | | 133 | | 189 | | 481 | |
Payable for Administration Fees | | 14 | | 10 | | 14 | | 36 | |
Payable forBank Overdraft | | — | | — | | — | | 108 | |
Payable for Custodian Fees | | 7 | | 6 | | 27 | | 13 | |
Payable for Trustees’ Fees and Expenses | | 22 | | 2 | | 2 | | 14 | |
Payable for Distribution Fees — Adviser Class | | 1 | | — | | — | | @— | |
Payable for Shareholder Servicing Fees — Investment Class | | — | | 17 | | — | | — | |
Other Liabilities | | 61 | | 45 | | 52 | | 54 | |
Total Liabilities | | 51,305 | | 15,639 | | 1,772 | | 83,982 | |
Net Assets | | $ | 212,122 | | $ | 143,543 | | $ | 207,769 | | $ | 517,580 | |
Net Assets Consist Of: | | | | | | | | | |
Paid-in Capital | | $ | 765,051 | | $ | 152,168 | | $ | 204,826 | | $ | 521,942 | |
Undistributed (Distributions in Excess of) Net Investment Income | | 3,133 | | 112 | | (2,001 | ) | (2,108 | ) |
Accumulated Net Realized Gain (Loss) | | (525,333 | ) | (8,166 | ) | 263 | | 495 | |
Unrealized Appreciation (Depreciation) on: | | | | | | | | | |
Investments | | (30,486 | ) | (636 | ) | 4,446 | | (2,094 | ) |
Foreign Currency Exchange Contracts and Translations | | (153 | ) | — | | 200 | | — | |
Futures Contracts | | (31 | ) | 68 | | 35 | | (408 | ) |
Swap Agreements | | (59 | ) | (3 | ) | — | | (247 | ) |
Net Assets | | $ | 212,122 | | $ | 143,543 | | $ | 207,769 | | $ | 517,580 | |
The accompanying notes are an integral part of the financial statements.
87
2007 Semi-Annual Report | |
| |
March 31, 2007 (unaudited) | |
Statements of Assets and Liabilities (cont’d)
| | | | | | | | Investment | |
| | | | Intermediate | | International | | Grade Fixed | |
| | High Yield | | Duration | | Fixed Income | | Income | |
| | Portfolio | | Portfolio | | Portfolio | | Portfolio | |
| | (000) | | (000) | | (000) | | (000) | |
INSTITUTIONAL CLASS: | | | | | | | | | |
Net Assets | | $ | 206,406 | | $ | 8,042 | | $ | 207,769 | | $ | 516,889 | |
Shares Outstanding (unlimited number of shares authorized, no par value) (not in 000’s) | | 19,180,469 | | 795,175 | | 19,968,704 | | 46,408,856 | |
Net Asset Value, Offering and Redemption Price Per Share | | $ | 10.76 | | $ | 10.11 | | $ | 10.40 | | $ | 11.14 | |
INVESTMENT CLASS: | | | | | | | | | |
Net Assets | | $ | — | | $ | 135,501 | | $ | — | | $ | — | |
Shares Outstanding (unlimited number of shares authorized, no par value) (not in 000’s) | | — | | 13,443,967 | | — | | — | |
Net Asset Value, Offering and Redemption Price Per Share | | $ | — | | $ | 10.08 | | $ | — | | $ | — | |
ADVISER CLASS: | | | | | | | | | |
Net Assets | | $ | 5,716 | | $ | — | | $ | — | | $ | 691 | |
Shares Outstanding (unlimited number of shares authorized, no par value) (not in 000’s) | | 529,317 | | — | | — | | 62,044 | |
Net Asset Value, Offering and Redemption Price Per Share | | $ | 10.80 | | $ | — | | $ | — | | $ | 11.13 | |
(1) Including: | | | | | | | | | |
Repurchase Agreements, at Value: | | $ | 13,330 | | $ | 10,083 | | $ | 8,841 | | $ | 37,980 | |
Securities on Loan, at Value: | | $ | 48,378 | | $ | — | | $ | — | | $ | 26,372 | |
@ Amount is less than $500.
The accompanying notes are an integral part of the financial statements.
88
2007 Semi-Annual Report |
| |
March 31, 2007 (unaudited) |
Statements of Assets and Liabilities
| | Limited | | Long Duration | | | |
| | Duration | | Fixed Income | | Municipal | |
| | Portfolio | | Portfolio | | Portfolio | |
| | (000) | | (000) | | (000) | |
Assets: | | | | | | | |
Investments in Securities of Unaffiliated Issuers, at Cost: | | $ | 1,081,709 | | $ | 24,979 | | $ | 814,083 | |
Investments in Securities of Unaffiliated Issuers, at Value:(1) | | 1,077,762 | | 25,712 | | 838,815 | |
Cash | | 292 | | — | | 1,088 | |
Receivable for Delayed Delivery Commitments | | 14,811 | | — | | 168,557 | |
Interest Receivable | | 5,821 | | 308 | | 3,693 | |
Unrealized Appreciation on Swap Agreements | | 560 | | 1 | | 5,453 | |
Receivable for Investments Sold | | — | | — | | 336 | |
Receivable for Portfolio Shares Sold | | 430 | | — | | 1,109 | |
Dividends Receivable | | — | | — | | 99 | |
OtherAssets | | 18 | | @— | | 14 | |
Total Assets | | 1,099,694 | | 26,021 | | 1,019,164 | |
Liabilities: | | | | | | | |
Payable for Delayed Delivery Commitments | | 33,438 | | — | | 43,488 | |
Payable for Investments Purchased | | 671 | | — | | 24,311 | |
Due to Broker | | 333 | | 2 | | 4,868 | |
Unrealized Depreciation on Swap Agreements | | 211 | | 1 | | 604 | |
Payable for Portfolio Shares Redeemed | | 626 | | — | | 180 | |
Payable for Investment Advisory Fees | | 789 | | 3 | | 695 | |
Payable for Administration Fees | | 72 | | 2 | | 52 | |
Payable for Custodian Fees | | 20 | | 2 | | 18 | |
Payable for Trustees’ Fees and Expenses | | 3 | | — | | 2 | |
Payable for Bank Overdraft | | — | | 4 | | — | |
Payable for Distribution Fees — Adviser Class | | — | | @— | | — | |
Payable for Securities Sold Short, at Value (Proceeds $168,557) | | — | | — | | 168,049 | |
Other Liabilities | | 105 | | 38 | | 43 | |
Total Liabilities | | 36,268 | | 52 | | 242,310 | |
Net Assets | | $ | 1,063,426 | | $ | 25,969 | | $ | 776,854 | |
Net Assets Consist Of: | | | | | | | |
Paid-in Capital | | $ | 1,089,681 | | $ | 25,000 | | $ | 746,735 | |
Undistributed (Distributions in Excess of) Net Investment Income | | 4,557 | | 301 | | 628 | |
Accumulated Net Realized Gain (Loss) | | (27,414 | ) | (58 | ) | (1,230 | ) |
Unrealized Appreciation (Depreciation) on: | | | | | | | |
Investments | | (3,947 | ) | 733 | | 24,732 | |
Futures Contracts | | 200 | | (7 | ) | 632 | |
Securities Sold Short | | — | | — | | 508 | |
Swap Agreements | | 349 | | @— | | 4,849 | |
Net Assets | | $ | 1,063,426 | | $ | 25,969 | | $ | 776,854 | |
The accompanying notes are an integral part of the financial statements.
89
2007 Semi-Annual Report | |
| |
March 31, 2007 (unaudited) | |
Statements of Assets and Liabilities (cont’d)
| | Limited | | Long Duration | | | |
| | Duration | | Fixed Income | | Municipal | |
| | Portfolio | | Portfolio | | Portfolio | |
| | (000) | | (000) | | (000) | |
INSTITUTIONAL CLASS: | | | | | | | |
Net Assets | | $ | 1,063,426 | | $ | 25,450 | | $ | 776,854 | |
Shares Outstanding (unlimited number of shares authorized, no par value) (not in 000’s) | | 103,143,586 | | 2,450,000 | | 60,332,413 | |
Net Asset Value, Offering and Redemption Price Per Share | | $ | 10.31 | | $ | 10.39 | | $ | 12.88 | |
INVESTMENT CLASS: | | | | | | | |
Net Assets | | $ | — | | $ | — | | $ | — | |
Shares Outstanding (unlimited number of shares authorized, no par value) (not in 000’s) | | — | | — | | — | |
Net Asset Value, Offering and Redemption Price Per Share | | $ | — | | $ | — | | $ | — | |
ADVISER CLASS: | | | | | | | |
Net Assets | | $ | — | | $ | 519 | | $ | — | |
Shares Outstanding (unlimited number of shares authorized, no par value) (not in 000’s) | | — | | 50,000 | | — | |
Net Asset Value, Offering and Redemption Price Per Share | | $ | — | | $ | 10.38 | | $ | — | |
(1) Including: | | | | | | | |
Repurchase Agreements, at Value: | | $ | 9,934 | | $ | 15 | | $ | 35,063 | |
Securities on Loan, at Value: | | $ | — | | $ | — | | $ | — | |
@ Amount is less than $500.
The accompanying notes are an integral part of the financial statements.
90
2007 Semi-Annual Report |
| |
March 31, 2007 (unaudited) |
Statements of Operations
For the Six Months Ended March 31, 2007
| | | | Equities | | Mid Cap | | U.S. Mid | | U.S. Small | |
| | Balanced | | Plus | | Growth | | Cap Value | | Cap Value | |
| | Portfolio | | Portfolio | | Portfolio | | Portfolio | | Portfolio | |
| | (000) | | (000) | | (000) | | (000) | | (000) | |
Investment Income: | | | | | | | | | | | |
Dividends† | | $ | 1,786 | | $ | — | | $ | 11,092 | | $ | 1,019 | | $ | 3,433 | |
Interest | | 2,707 | | 975 | | 1,430 | | 226 | | 1,098 | |
Total Investment Income | | 4,493 | | 975 | | 12,522 | | 1,245 | | 4,531 | |
Expenses: | | | | | | | | | | | |
Investment Advisory Fees (Note B) | | 700 | | 51 | | 5,550 | | 535 | | 2,671 | |
Administration Fees (Note C) | | 125 | | 11 | | 888 | | 60 | | 324 | |
Custodian Fees (Note E) | | 29 | | 2 | | 55 | | 13 | | 19 | |
Shareholder Reporting Fees | | 34 | | 3 | | 222 | | 9 | | 135 | |
Professional Fees | | 27 | | 28 | | 76 | | 15 | | 35 | |
Proxy Fees | | 5 | | — | | 280 | | — | | 275 | |
Shareholder Servicing Fees — Investment Class Shares (Note D) | | 3 | | — | | — | | 2 | | — | |
Distribution Fees — Adviser Class Shares (Note D) | | 41 | | 1 | | 1,364 | | 18 | | 42 | |
Transfer Agency Fees (Note F) | | 6 | | 3 | | 17 | | 9 | | 6 | |
Trustees’ Fees and Expenses | | 4 | | @— | | 20 | | 3 | | 8 | |
Other Expenses | | 32 | | 27 | | 95 | | 34 | | 59 | |
Total Expenses | | 1,006 | | 126 | | 8,567 | | 698 | | 3,574 | |
Waiver of Investment Advisory Fees (Note B) | | — | | (42 | ) | — | | — | | — | |
Expense Offset (Note E) | | @— | | (2 | ) | @— | | @— | | @— | |
Net Expenses | | 1,006 | | 82 | | 8,567 | | 698 | | 3,574 | |
Net Investment Income (Loss) | | 3,487 | | 893 | | 3,955 | | 547 | | 957 | |
Realized Gain (Loss): | | | | | | | | | | | |
Investments Sold | | 10,046 | | (72 | ) | 144,497 | | 12,567 | | 53,063 | |
Foreign Currency Transactions | | (12 | ) | — | | (84 | ) | — | | — | |
Futures Contracts | | (63 | ) | 2,112 | | — | | 103 | | — | |
Swap Agreements | | 327 | | 4 | | — | | — | | — | |
Net Realized Gain (Loss) | | 10,298 | | 2,044 | | 144,413 | | 12,670 | | 53,063 | |
Change in Unrealized Appreciation (Depreciation): | | | | | | | | | | | |
Investments | | 8,458 | | (167 | ) | 90,198 | | 6,775 | | 66,894 | |
Foreign Currency Exchange Contracts and Translations | | 184 | | — | | — | | — | | — | |
Futures Contracts | | (420 | ) | (806 | ) | — | | — | | — | |
Securities Sold Short | | — | | 39 | | — | | — | | — | |
Swap Agreements | | (68 | ) | 1 | | — | | — | | — | |
Net Change in Unrealized Appreciation (Depreciation) | | 8,154 | | (933 | ) | 90,198 | | 6,775 | | 66,894 | |
Total Net Realized Gain (Loss) and Change in Unrealized Appreciation (Depreciation) | | 18,452 | | 1,111 | | 234,611 | | 19,445 | | 119,957 | |
Net Increase (Decrease) in Net Assets Resulting from Operations | | $ | 21,939 | | $ | 2,004 | | $ | 238,566 | | $ | 19,992 | | $ | 120,914 | |
† Net of $7 and $135, foreign withholding tax for the Balanced and Mid Cap Growth Portfolios, respectively.
@ Amount is less than $500.
The accompanying notes are an integral part of the financial statements.
91
2007 Semi-Annual Report | |
| |
March 31, 2007 (unaudited) | |
Statements of Operations
For the Six Months Ended March 31, 2007
| | | | Core | | Core Plus | | | | | |
| | | | Fixed | | Fixed | | | | Intermediate | |
| | Value | | Income | | Income | | High Yield | | Duration | |
| | Portfolio | | Portfolio | | Portfolio | | Portfolio | | Portfolio | |
| | (000) | | (000) | | (000) | | (000) | | (000) | |
Investment Income: | | | | | | | | | | | |
Dividends | | $ | 6,981 | | $ | 17 | | $ | 358 | | $ | @— | | $ | 4 | |
Interest† | | 573 | | 7,728 | | 67,954 | | 8,802 | | 3,760 | |
Total Investment Income | | 7,554 | | 7,745 | | 68,312 | | 8,802 | | 3,764 | |
Expenses: | | | | | | | | | | | |
Investment Advisory Fees (Note B) | | 1,484 | | 583 | | 4,317 | | 463 | | 273 | |
Administration Fees (Note C) | | 238 | | 124 | | 1,052 | | 88 | | 58 | |
Custodian Fees (Note E) | | 24 | | 10 | | 57 | | 8 | | 7 | |
Shareholder Reporting Fees | | 49 | | 30 | | 130 | | 40 | | 18 | |
Professional Fees | | 31 | | 21 | | 102 | | 26 | | 19 | |
Shareholder Servicing Fees — Investment Class Shares (Note D) | | 57 | | — | | 107 | | @— | | 103 | |
Distribution Fees — Adviser Class Shares (Note D) | | 255 | | 13 | | 156 | | 7 | | — | |
Transfer Agency Fees (Note F) | | 10 | | 4 | | 12 | | 7 | | 3 | |
Trustees’ Fees and Expenses | | 8 | | 3 | | 36 | | 4 | | 2 | |
Proxy Fees | | 33 | | 58 | | 107 | | 117 | | 1 | |
Other Expenses | | 53 | | 34 | | 115 | | 29 | | 25 | |
Total Expenses | | 2,242 | | 880 | | 6,191 | | 789 | | 509 | |
Waiver of Investment Advisory Fees (Note B) | | — | | (89 | ) | — | | — | | — | |
Expense Offset (Note E) | | @— | | (1 | ) | (5 | ) | @— | | @— | |
Net Expenses | | 2,242 | | 790 | | 6,186 | | 789 | | 509 | |
Net Investment Income (Loss) | | 5,312 | | 6,955 | | 62,126 | | 8,013 | | 3,255 | |
Realized Gain (Loss): | | | | | | | | | | | |
Investments Sold | | 15,924 | | 684 | | 14,755 | | 2,483 | | (111 | ) |
Foreign Currency Transactions | | — | | — | | 490 | | 114 | | — | |
Futures Contracts | | — | | 1,690 | | 9,025 | | 84 | | 381 | |
Swap Agreements | | — | | 933 | | 12,470 | | (7 | ) | 5 | |
Net Realized Gain (Loss) | | 15,924 | | 3,307 | | 36,740 | | 2,674 | | 275 | |
Change in Unrealized Appreciation (Depreciation): | | | | | | | | | | | |
Investments | | 20,254 | | (577 | ) | (14,817 | ) | 2,332 | | 361 | |
Foreign Currency Exchange Contracts and Translations | | — | | — | | (671 | ) | (193 | ) | — | |
Futures Contracts | | — | | (1,965 | ) | (8,345 | ) | 48 | | (417 | ) |
Swap Agreements | | — | | (101 | ) | (2,162 | ) | (40 | ) | 3 | |
Net Change in Unrealized Appreciation (Depreciation) | | 20,254 | | (2,643 | ) | (25,995 | ) | 2,147 | | (53 | ) |
Total Net Realized Gain (Loss) and Change in Unrealized Appreciation (Depreciation) | | 36,178 | | 664 | | 10,745 | | 4,821 | | 222 | |
Net Increase (Decrease) in Net Assets Resulting from Operations | | $ | 41,490 | | $ | 7,619 | | $ | 72,871 | | $ | 12,834 | | $ | 3,477 | |
† Net of $ @— foreign withholding tax for the Core Plus Fixed Income Portfolio.
@ Amount is less than $500.
The accompanying notes are an integral part of the financial statements.
92
2007 Semi-Annual Report |
| |
March 31, 2007 (unaudited) |
Statements of Operations
For the Six Months Ended March 31, 2007
| | | | | | | | Long | | | |
| | | | Investment | | | | Duration | �� | | |
| | International | | Grade Fixed | | Limited | | Fixed | | | |
| | Fixed Income | | Income | | Duration | | Income | | Municipal | |
| | Portfolio | | Portfolio | | Portfolio | | Portfolio | | Portfolio | |
| | (000) | | (000) | | (000) | | (000) | | (000) | |
Investment Income: | | | | | | | | | | | |
Dividends | | $ | — | | $ | 39 | | $ | 10 | | $ | — | | $ | 839 | |
Interest† | | 3,113 | | 12,738 | | 28,402 | | 662 | | 13,689 | |
Total Investment Income | | 3,113 | | 12,777 | | 28,412 | | 662 | | 14,528 | |
Expenses: | | | | | | | | | | | |
Investment Advisory Fees (Note B) | | 379 | | 975 | | 1,602 | | 49 | | 1,346 | |
Administration Fees (Note C) | | 81 | | 208 | | 427 | | 10 | | 287 | |
Custodian Fees (Note E) | | 28 | | 13 | | 22 | | 2 | | 15 | |
Shareholder Reporting Fees | | 24 | | 28 | | 87 | | 7 | | 28 | |
Professional Fees | | 21 | | 28 | | 54 | | 21 | | 31 | |
Distribution Fees — Adviser Class Shares (Note D) | | — | | 1 | | — | | 1 | | — | |
Transfer Agency Fees (Note F) | | 3 | | 5 | | 2 | | 3 | | 4 | |
Trustees’ Fees and Expenses | | 2 | | 7 | | 9 | | @— | | 7 | |
Proxy Fees | | 78 | | 19 | | 196 | | @— | | 9 | |
Other Expenses | | 23 | | 37 | | 57 | | 11 | | 42 | |
Total Expenses | | 639 | | 1,321 | | 2,456 | | 104 | | 1,769 | |
Waiver of Investment Advisory Fees (Note B) | | — | | — | | — | | (37 | ) | — | |
Waiver of Distribution Fees — Advisor Class Shares (Note D) | | — | | @— | | — | | — | | — | |
Expense Offset (Note E) | | @— | | (1 | ) | (3 | ) | (1 | ) | @— | |
Net Expenses | | 639 | | 1,320 | | 2,453 | | 66 | | 1,769 | |
Net Investment Income (Loss) | | 2,474 | | 11,457 | | 25,959 | | 596 | | 12,759 | |
Realized Gain (Loss): | | | | | | | | | | | |
Investments Sold | | 583 | | 698 | | (792 | ) | 27 | | 110 | |
Foreign Currency Transactions | | (98 | ) | — | | — | | — | | — | |
Futures Contracts | | (32 | ) | 2,783 | | (975 | ) | (4 | ) | 2,177 | |
Swap Agreements | | — | | 2,912 | | (959 | ) | 2 | | 69 | |
Net Realized Gain (Loss) | | 453 | | 6,393 | | (2,726 | ) | 25 | | 2,356 | |
Change in Unrealized Appreciation (Depreciation): | | | | | | | | | | | |
Investments | | 3,147 | | (953 | ) | 2,094 | | (241 | ) | (1,568 | ) |
Foreign Currency Exchange Contracts and Translations | | 390 | | — | | — | | — | | — | |
Futures Contracts | | 35 | | (3,114 | ) | 841 | | (11 | ) | (1,236 | ) |
Securities Sold Short | | — | | — | | — | | — | | 613 | |
Swap Agreements | | — | | (746 | ) | 883 | | @— | | 2,125 | |
Net Change in Unrealized Appreciation (Depreciation) | | 3,572 | | (4,813 | ) | 3,818 | | (252 | ) | (66 | ) |
Total Net Realized Gain (Loss) and Change in Unrealized Appreciation (Depreciation) | | 4,025 | | 1,580 | | 1,092 | | (227 | ) | 2,290 | |
Net Increase (Decrease) in Net Assets Resulting from Operations | | $ | 6,499 | | $ | 13,037 | | $ | 27,051 | | $ | 369 | | $ | 15,049 | |
† Net of $2 foreign withholding tax for the International Fixed Income Portfolio.
@ Amount is less than $500.
The accompanying notes are an integral part of the financial statements.
93
2007 Semi-Annual Report | |
| |
March 31, 2007 | |
Statements of Changes in Net Assets
| | Balanced | | Equities Plus | | Mid Cap Growth | |
| | Portfolio | | Portfolio | | Portfolio | |
| | Six Months | | Year Ended | | Six Months | | Period Ended | | Six Months | | Year Ended | |
| | Ended March | | September | | Ended March | | September | | Ended March | | September | |
| | 31, 2007 | | 30, | | 31, 2007 | | 30, | | 31, 2007 | | 30, | |
| | (unaudited) | | 2006 | | (unaudited) | | 2006^ | | (unaudited) | | 2006 | |
| | (000) | | (000) | | (000) | | (000) | | (000) | | (000) | |
Increase (Decrease) in Net Assets | | | | | | | | | | | | | |
Operations: | | | | | | | | | | | | | |
Net Investment Income (Loss) | | $ | 3,487 | | $ | 5,769 | | $ | 893 | | $ | 535 | | $ | 3,955 | | $ | (4,667 | ) |
Net Realized Gain (Loss) | | 10,298 | | 24,876 | | 2,044 | | (308 | ) | 144,413 | | 150,838 | |
Net Change in Unrealized Appreciation (Depreciation) | | 8,154 | | (7,443 | ) | (933 | ) | 562 | | 90,198 | | (34,400 | ) |
Net Increase (Decrease) in Net Assets Resulting from Operations | | 21,939 | | 23,202 | | 2,004 | | 789 | | 238,566 | | 121,105 | |
Distributions from and/or in Excess of: | | | | | | | | | | | | | |
Institutional Class: | | | | | | | | | | | | | |
Net Investment Income | | (3,069 | ) | (5,898 | ) | (859 | ) | (147 | ) | (4,826 | ) | — | |
Net Realized Gain | | — | | — | | (919 | ) | — | | — | | — | |
Investment Class: | | | | | | | | | | | | | |
Net Investment Income | | (45 | ) | (86 | ) | — | | — | | — | | — | |
Adviser Class: | | | | | | | | | | | | | |
Net Investment Income | | (373 | ) | (761 | ) | (16 | ) | (3 | ) | (2,109 | ) | — | |
Net Realized Gain | | — | | — | | (18 | ) | — | | — | | — | |
Total Distributions | | (3,487 | ) | (6,745 | ) | (1,812 | ) | (150 | ) | (6,935 | ) | — | |
Capital Share Transactions:(1) | | | | | | | | | | | | | |
Institutional Class: | | | | | | | | | | | | | |
Subscribed | | 32,023 | | 91,029 | | 1,501 | | 25,465 | | 244,188 | | 493,188 | |
Distributions Reinvested | | 3,065 | | 5,886 | | 74 | | — | | 4,628 | | — | |
Redeemed | | (40,125 | ) | (91,232 | ) | (797 | ) | — | | (122,010 | ) | (303,382 | ) |
Investment Class: | | | | | | | | | | | | | |
Subscribed | | 114 | | 216 | | — | | — | | — | | — | |
Distributions Reinvested | | 45 | | 86 | | — | | — | | — | | — | |
Redeemed | | — | | (127 | ) | — | | — | | — | | — | |
Adviser Class: | | | | | | | | | | | | | |
Subscribed | | 1,708 | | 5,388 | | — | | 500 | | 211,111 | | 459,373 | |
Distributions Reinvested | | 373 | | 762 | | — | | — | | 2,084 | | — | |
Redeemed | | (12,592 | ) | (9,038 | ) | — | | — | | (224,474 | ) | (440,176 | ) |
Net Increase (Decrease) in Net Assets Resulting from Capital Share Transactions | | (15,389 | ) | 2,970 | | 778 | | 25,965 | | 115,527 | | 209,003 | |
Redemption Fees | | @— | | @— | | — | | — | | 14 | | 19 | |
Total Increase (Decrease) in Net Assets | | 3,063 | | 19,427 | | 970 | | 26,604 | | 347,172 | | 330,127 | |
Net Assets: | | | | | | | | | | | | | |
Beginning of Period | | 297,726 | | 278,299 | | 26,604 | | — | | 2,022,006 | | 1,691,879 | |
End of Period | | $ | 300,789 | | $ | 297,726 | | $ | 27,574 | | $ | 26,604 | | $ | 2,369,178 | | $ | 2,022,006 | |
Undistributed (Distributions in Excess of) Net Investment Income Included in End of Period Net Assets | | $ | 113 | | $ | 1,510 | | $ | 435 | | $ | 417 | | $ | 1,660 | | $ | 4,640 | |
The accompanying notes are an integral part of the financial statements.
94
2007 Semi-Annual Report |
|
March 31, 2007 |
Statements of Changes in Net Assets (cont’d)
| | Balanced | | Equities Plus | | Mid Cap Growth | |
| | Portfolio | | Portfolio | | Portfolio | |
| | Six Months | | Year Ended | | Six Months | | Period Ended | | Six Months | | Year Ended | |
| | Ended March | | September | | Ended March | | September | | Ended March | | September | |
| | 31, 2007 | | 30, | | 31, 2007 | | 30, | | 31, 2007 | | 30, | |
| | (unaudited) | | 2006 | | (unaudited) | | 2006^ | | (unaudited) | | 2006 | |
| | (000) | | (000) | | (000) | | (000) | | (000) | | (000) | |
(1) | Capital Share Transactions: | | | | | | | | | | | | | |
| Institutional Class: | | | | | | | | | | | | | |
| Shares Subscribed | | 2,439 | | 7,514 | | 143 | | 2,552 | | 8,809 | | 19,562 | |
| Shares Issued on Distributions Reinvested | | 237 | | 484 | | 7 | | — | | 170 | | — | |
| Shares Redeemed | | (3,024 | ) | (7,485 | ) | (75 | ) | — | | (4,478 | ) | (11,916 | ) |
| Net Increase (Decrease in Institutional) Class Shares Outstanding | | (348 | ) | 513 | | 75 | | 2,552 | | 4,501 | | 7,646 | |
| Investment Class: | | | | | | | | | | | | | |
| Shares Subscribed | | 9 | | 18 | | — | | — | | — | | — | |
| Shares Issued on Distributions Reinvested | | 3 | | 7 | | — | | — | | — | | — | |
| Shares Redeemed | | — | | (10 | ) | — | | — | | — | | — | |
| Net Increase (Decrease) in Investment Class Shares Outstanding | | 12 | | 15 | | — | | — | | — | | — | |
| Adviser Class: | | | | | | | | | | | | | |
| Shares Subscribed | | 130 | | 442 | | — | | 50 | | 7,831 | | 18,713 | |
| Shares Issued on Distributions Reinvested | | 29 | | 63 | | — | | — | | 79 | | — | |
| Shares Redeemed | | (958 | ) | (756 | ) | — | | — | | (8,310 | ) | (17,884 | ) |
| Net Increase (Decrease) in Adviser Class Shares Outstanding | | (799 | ) | (251 | ) | — | | 50 | | (400 | ) | 829 | |
^ Equities Plus Portfolio commenced operations on April 26, 2006.
@ Amount is less than $500.
The accompanying notes are an integral part of the financial statements.
95
2007 Semi-Annual Report | |
| |
March 31, 2007 | |
Statements of Changes in Net Assets
| | U.S. Mid Cap Value | | U.S. Small Cap Value | | Value | |
| | Portfolio | | Portfolio | | Portfolio | |
| | Six Months | | Year Ended | | Six Months | | Year Ended | | Six Months | | Year Ended | |
| | Ended March | | September | | Ended March | | September | | Ended March | | September | |
| | 31, 2007 | | 30, | | 31, 2007 | | 30, | | 31, 2007 | | 30, | |
| | (unaudited) | | 2006 | | (unaudited) | | 2006 | | (unaudited) | | 2006 | |
| | (000) | | (000) | | (000) | | (000) | | (000) | | (000) | |
Increase (Decrease) in Net Assets | | | | | | | | | | | | | |
Operations: | | | | | | | | | | | | | |
Net Investment Income (Loss) | | $ | 547 | | $ | 967 | | $ | 957 | | $ | 2,382 | | $ | 5,312 | | $ | 14,992 | |
Net Realized Gain (Loss) | | 12,670 | | 22,333 | | 53,063 | | 70,110 | | 15,924 | | 150,265 | |
Net Change in Unrealized Appreciation (Depreciation) | | 6,775 | | (4,622 | ) | 66,894 | | 24,779 | | 20,254 | | (54,946 | ) |
Net Increase (Decrease) in Net Assets Resulting from Operations | | 19,992 | | 18,678 | | 120,914 | | 97,271 | | 41,490 | | 110,311 | |
Distributions from and/or in Excess of: | | | | | | | | | | | | | |
Institutional Class: | | | | | | | | | | | | | |
Net Investment Income | | (910 | ) | (935 | ) | (2,134 | ) | (4,962 | ) | (3,592 | ) | (6,240 | ) |
Net Realized Gain | | — | | — | | (78,066 | ) | (32,618 | ) | (28,754 | ) | (21,707 | ) |
Investment Class: | | | | | | | | | | | | | |
Net Investment Income | | (15 | ) | (36 | ) | — | | — | | (786 | ) | (1,159 | ) |
Net Realized Gain | | — | | — | | — | | — | | (7,060 | ) | (4,260 | ) |
Adviser Class: | | | | | | | | | | | | | |
Net Investment Income | | (68 | ) | (106 | ) | (17 | ) | (105 | ) | (2,036 | ) | (13,749 | ) |
Net Realized Gain | | — | | — | | (2,990 | ) | (1,102 | ) | (18,579 | ) | (79,388 | ) |
Total Distributions | | (993 | ) | (1,077 | ) | (83,207 | ) | (38,787 | ) | (60,807 | ) | (126,503 | ) |
Capital Share Transactions:(1) | | | | | | | | | | | | | |
Institutional Class: | | | | | | | | | | | | | |
Subscribed | | 15,152 | | 35,071 | | 57,290 | | 423,362 | | 27,852 | | 60,716 | |
Distributions Reinvested | | 871 | | 903 | | 79,964 | | 37,251 | | 27,171 | | 23,658 | |
Redeemed | | (12,819 | ) | (60,948 | ) | (76,193 | ) | (156,849 | ) | (50,950 | ) | (83,459 | ) |
Investment Class: | | | | | | | | | | | | | |
Subscribed | | 463 | | 1,871 | | — | | — | | 14,566 | | 11,824 | |
Distributed Reinvested | | 14 | | 35 | | — | | — | | 7,846 | | 5,419 | |
Redeemed | | (196 | ) | (5,609 | ) | — | | — | | (6,807 | ) | (11,982 | ) |
Adviser Class: | | | | | | | | | | | | | |
Subscribed | | 3,106 | | 5,771 | | 20,544 | | 5,575 | | 21,482 | | 47,095 | |
Distributions Reinvested | | 67 | | 104 | | 3,006 | | 1,207 | | 20,533 | | 93,062 | |
Redeemed | | (3,009 | ) | (20,701 | ) | (3,072 | ) | (7,929 | ) | (13,260 | ) | (1,033,702 | ) |
Net Increase (Decrease) in Net Assets Resulting from Capital Share Transactions | | 3,649 | | (43,503 | ) | 81,539 | | 302,617 | | 48,433 | | (887,369 | ) |
Redemption Fees | | @— | | 1 | | 7 | | 4 | | 2 | | 8 | |
Total Increase (Decrease) in Net Assets | | 22,648 | | (25,901 | ) | 119,253 | | 361,105 | | 29,118 | | (903,553 | ) |
Net Assets: | | | | | | | | | | | | | |
Beginning of Period | | 133,737 | | 159,638 | | 742,636 | | 381,531 | | 561,383 | | 1,464,936 | |
End of Period | | $ | 156,385 | | $ | 133,737 | | $ | 861,889 | | $ | 742,636 | | $ | 590,501 | | $ | 561,383 | |
Undistributed (Distributions in Excess of) Net Investment Income Included in End of Period Net Assets | | $ | 244 | | $ | 690 | | $ | 742 | | $ | 1,936 | | $ | 2,454 | | $ | 3,556 | |
The accompanying notes are an integral part of the financial statements.
96
2007 Semi-Annual Report |
|
March 31, 2007 |
Statements of Changes in Net Assets (cont’d)
| | U.S. Mid Cap Value | | U.S. Small Cap Value | | Value | |
| | Portfolio | | Portfolio | | Portfolio | |
| | Six Months | | Year Ended | | Six Months | | Year Ended | | Six Months | | Year Ended | |
| | Ended March | | September | | Ended March | | September | | Ended March | | September | |
| | 31, 2007 | | 30, | | 31, 2007 | | 30, | | 31, 2007 | | 30, | |
| | (unaudited) | | 2006 | | (unaudited) | | 2006 | | (unaudited) | | 2006 | |
| | (000) | | (000) | | (000) | | (000) | | (000) | | (000) | |
(1) | Capital Share Transactions: | | | | | | | | | | | | | |
| Institutional Class: | | | | | | | | | | | | | |
| Shares Subscribed | | 470 | | 1,292 | | 2,126 | | 17,434 | | 1,516 | | 3,403 | |
| Shares Issued on Distributions Reinvested | | 27 | | 34 | | 3,049 | | 1,576 | | 1,525 | | 1,362 | |
| Shares Redeemed | | (397 | ) | (2,264 | ) | (2,800 | ) | (6,266 | ) | (2,770 | ) | (4,706 | ) |
| Net Increase (Decrease) in Institutional Class Shares Outstanding | | 100 | | (938 | ) | 2,375 | | 12,744 | | 271 | | 59 | |
| Investment Class: | | | | | | | | | | | | | |
| Shares Subscribed | | 14 | | 72 | | — | | — | | 776 | | 663 | |
| Shares Issued on Distributions Reinvested | | #— | | 1 | | — | | — | | 440 | | 312 | |
| Shares Redeemed | | (6 | ) | (204 | ) | — | | — | | (372 | ) | (678 | ) |
| Net Increase (Decrease) in Investment Class Shares Outstanding | | 8 | | (131 | ) | — | | — | | 844 | | 297 | |
| Adviser Class: | | | | | | | | | | | | | |
| Shares Subscribed | | 97 | | 216 | | 765 | | 221 | | 1,159 | | 2,627 | |
| Shares Issued on Distributions Reinvested | | 2 | | 4 | | 115 | | 51 | | 1,153 | | 5,371 | |
| Shares Redeemed | | (94 | ) | (784 | ) | (114 | ) | (324 | ) | (729 | ) | (60,250 | ) |
| Net Increase (Decrease) in Adviser Class Shares Outstanding | | 5 | | (564 | ) | 766 | | (52 | ) | 1,583 | | (52,252 | ) |
@ Amount is less than $500.
# Amount is less than 500 shares.
The accompanying notes are an integral part of the financial statements.
97
2007 Semi-Annual Report | |
| |
March 31, 2007 | |
Statements of Changes in Net Assets
| | Core Fixed | | Core Plus Fixed | | High Yield | |
| | Income Portfolio | | Income Portfolio | | Portfolio | |
| | Six Months | | Year Ended | | Six Months | | Year Ended | | Six Months | | Year Ended | |
| | Ended March | | September | | Ended March | | September | | Ended March | | September | |
| | 31, 2007 | | 30, | | 31, 2007 | | 30, | | 31, 2007 | | 30, | |
| | (unaudited) | | 2006 | | (unaudited) | | 2006 | | (unaudited) | | 2006 | |
| | (000) | | (000) | | (000) | | (000) | | (000) | | (000) | |
Increase (Decrease) in Net Assets | | | | | | | | | | | | | |
Operations: | | | | | | | | | | | | | |
Net Investment Income (Loss) | | $ | 6,955 | | $ | 8,949 | | $ | 62,126 | | $ | 106,191 | | $ | 8,013 | | $ | 16,593 | |
Net Realized Gain (Loss) | | 3,307 | | 1,483 | | 36,740 | | 13,012 | | 2,674 | | (4,637 | ) |
Net Change in Unrealized Appreciation (Depreciation) | | (2,643 | ) | (156 | ) | (25,995 | ) | (19,741 | ) | 2,147 | | 1,683 | |
Net Increase (Decrease) in Net Assets Resulting from Operations | | 7,619 | | 10,276 | | 72,871 | | 99,462 | | 12,834 | | 13,639 | |
Distributions from and/or in Excess of: | | | | | | | | | | | | | |
Institutional Class: | | | | | | | | | | | | | |
Net Investment Income | | (7,704 | ) | (11,417 | ) | (74,891 | ) | (115,657 | ) | (9,449 | ) | (16,732 | ) |
Net Realized Gain | | — | | (2,265 | ) | — | | — | | — | | — | |
Investment Class: | | | | | | | | | | | | | |
Net Investment Income | | — | | — | | (4,542 | ) | (15,864 | ) | — | | (20 | ) |
Net Realized Gain | | — | | — | | — | | — | | — | | — | |
Adviser Class: | | | | | | | | | | | | | |
Net Investment Income | | (247 | ) | (486 | ) | (3,876 | ) | (6,254 | ) | (177 | ) | (408 | ) |
Net Realized Gain | | — | | (102 | ) | — | | — | | — | | — | |
Total Distributions | | (7,951 | ) | (14,270 | ) | (83,309 | ) | (137,775 | ) | (9,626 | ) | (17,160 | ) |
Capital Share Transactions:(1) | | | | | | | | | | | | | |
Institutional Class: | | | | | | | | | | | | | |
Subscribed | | 20,823 | | 130,146 | | 262,147 | | 502,531 | | 10,706 | | 95,830 | |
Distributions Reinvested | | 7,694 | | 13,660 | | 68,696 | | 106,805 | | 8,910 | | 16,107 | |
Redeemed | | (25,097 | ) | (60,428 | ) | (200,185 | ) | (371,452 | ) | (42,462 | ) | (78,251 | ) |
Investment Class: | | | | | | | | | | | | | |
Subscribed | | — | | — | | 3,977 | | 100,710 | | — | | 3,434 | |
Distributions Reinvested | | — | | — | | 4,536 | | 15,855 | | — | | 20 | |
Redeemed | | — | | — | | (9,683 | ) | (273,854 | ) | (896 | ) | (3,788 | ) |
Adviser Class: | | | | | | | | | | | | | |
Subscribed | | 1,484 | | 1,860 | | 10,864 | | 28,690 | | 2,861 | | 4,975 | |
Distributions Reinvested | | 247 | | 588 | | 3,846 | | 6,189 | | 159 | | 377 | |
Redeemed | | (892 | ) | (2,327 | ) | (12,832 | ) | (19,359 | ) | (1,814 | ) | (7,155 | ) |
Net Increase (Decrease) in Net Assets Resulting from Capital Share Transactions | | 4,259 | | 83,499 | | 131,366 | | 96,115 | | (22,536 | ) | 31,549 | |
Redemption Fees | | @— | | @— | | 1 | | 6 | | 1 | | @— | |
Total Increase (Decrease) in Net Assets | | 3,927 | | 79,505 | | 120,929 | | 57,808 | | (19,327 | ) | 28,028 | |
Net Assets: | | | | | | | | | | | | | |
Beginning of Period | | 309,809 | | 230,304 | | 2,583,725 | | 2,525,917 | | 231,449 | | 203,421 | |
End of Period | | $ | 313,736 | | $ | 309,809 | | $ | 2,704,654 | | $ | 2,583,725 | | $ | 212,122 | | $ | 231,449 | |
Undistributed (Distributions in Excess of) Net Investment Income Included in End of Period Net Assets | | $ | 840 | | $ | 3,665 | | $ | (19,531 | ) | $ | 34,506 | | $ | 3,133 | | $ | 4,746 | |
| | | | | | | | | | | | | | | | | | | | | | | | | | | |
The accompanying notes are an integral part of the financial statements.
98
2007 Semi-Annual Report |
|
March 31, 2007 |
Statements of Changes in Net Assets (cont’d)
| | Core Fixed | | Core Plus Fixed | | High Yield | |
| | Income Portfolio | | Income Portfolio | | Portfolio | |
| | Six Months | | Year Ended | | Six Months | | Year Ended | | Six Months | | Year Ended | |
| | Ended March | | September | | Ended March | | September | | Ended March | | September | |
| | 31, 2007 | | 30, | | 31, 2007 | | 30, | | 31, 2007 | | 30, | |
| | (unaudited) | | 2006 | | (unaudited) | | 2006 | | (unaudited) | | 2006 | |
| | (000) | | (000) | | (000) | | (000) | | (000) | | (000) | |
(1) | Capital Share Transactions†: | | | | | | | | | | | | | |
| Institutional Class: | | | | | | | | | | | | | |
| Shares Subscribed | | 1,948 | | 12,248 | | 23,016 | | 44,104 | | 996 | | 9,113 | |
| Shares Issued on Distributions Reinvested | | 721 | | 1,277 | | 6,062 | | 9,394 | | 853 | | 1,550 | |
| Shares Redeemed | | (2,343 | ) | (5,614 | ) | (17,559 | ) | (32,539 | ) | (3,993 | ) | (7,472 | ) |
| Net Increase (Decrease) in Institutional Class Shares Outstanding | | 326 | | 7,911 | | 11,519 | | 20,959 | | (2,144 | ) | 3,191 | |
| Investment Class: | | | | | | | | | | | | | |
| Shares Subscribed | | — | | — | | 349 | | 8,779 | | — | | 325 | |
| Shares Issued on Distributions Reinvested | | — | | — | | 400 | | 1,391 | | — | | 2 | |
| Shares Redeemed | | — | | — | | (854 | ) | (24,341 | ) | (83 | ) | (353 | ) |
| Net Increase (Decrease) in Investment Class Shares Outstanding | | — | | — | | (105 | ) | (14,171 | ) | (83 | ) | (26 | ) |
| Adviser Class: | | | | | | | | | | | | | |
| Shares Subscribed | | 139 | | 174 | | 953 | | 2,508 | | 270 | | 471 | |
| Shares Issued on Distributions Reinvested | | 23 | | 55 | | 340 | | 545 | | 15 | | 36 | |
| Shares Redeemed | | (84 | ) | (217 | ) | (1,129 | ) | (1,698 | ) | (169 | ) | (680 | ) |
| Net Increase (Decrease) in Adviser Class Shares Outstanding | | 78 | | 12 | | 164 | | 1,355 | | 116 | | (173 | ) |
@ Amount is less than $500.
† Capital share transactions prior to November 13, 2006 for the High Yield Portfolio have been restated to reflect the effect of a reverse stock split as described in the Notes to Financial Statements.
The accompanying notes are an integral part of the financial statements.
99
2007 Semi-Annual Report | |
| |
March 31, 2007 | |
Statements of Changes in Net Assets
| | Intermediate Duration | | International Fixed Income | | Investment Grade Fixed | |
| | Portfolio | | Portfolio | | Income Portfolio | |
| | Six Months | | Year Ended | | Six Months | | Year Ended | | Six Months | | Year Ended | |
| | Ended March | | September | | Ended March | | September | | Ended March | | September | |
| | 31, 2007 | | 30, | | 31, 2007 | | 30, | | 31, 2007 | | 30, | |
| | (unaudited) | | 2006 | | (unaudited) | | 2006 | | (unaudited) | | 2006 | |
| | (000) | | (000) | | (000) | | (000) | | (000) | | (000) | |
Increase (Decrease) in Net Assets | | | | | | | | | | | | | |
Operations: | | | | | | | | | | | | | |
Net Investment Income (Loss) | | $ | 3,255 | | $ | 10,730 | | $ | 2,474 | | $ | 3,120 | | $ | 11,457 | | $ | 18,318 | |
Net Realized Gain (Loss) | | 275 | | (6,969 | ) | 453 | | 2,075 | | 6,393 | | 4,974 | |
Net Change in Unrealized Appreciation (Depreciation) | | (53 | ) | 976 | | 3,572 | | (3,592 | ) | (4,813 | ) | (4,464 | ) |
Net Increase (Decrease) in Net Assets Resulting from Operations | | 3,477 | | 4,737 | | 6,499 | | 1,603 | | 13,037 | | 18,828 | |
Distributions from and/or in Excess of: | | | | | | | | | | | | | |
Institutional Class: | | | | | | | | | | | | | |
Net Investment Income | | (257 | ) | (349 | ) | (4,284 | ) | (6,814 | ) | (16,569 | ) | (24,331 | ) |
Net Realized Gain | | — | | — | | (928 | ) | (680 | ) | — | | (2,329 | ) |
Investment Class: | | | | | | | | | | | | | |
Net Investment Income | | (4,008 | ) | (10,127 | ) | — | | — | | — | | — | |
Adviser Class: | | | | | | | | | | | | | |
Net Investment Income | | — | | — | | — | | — | | (22 | ) | (54 | ) |
Net Realized Gain | | — | | — | | — | | — | | — | | (5 | ) |
Total Distributions | | (4,265 | ) | (10,476 | ) | (5,212 | ) | (7,494 | ) | (16,591 | ) | (26,719 | ) |
Capital Share Transactions:(1) | | | | | | | | | | | | | |
Institutional Class: | | | | | | | | | | | | | |
Subscribed | | 32 | | 1,777 | | 29,699 | | 96,944 | | 63,703 | | 155,208 | |
Distributions Reinvested | | 206 | | 292 | | 4,988 | | 7,288 | | 16,019 | | 25,701 | |
Redeemed | | (972 | ) | (2,575 | ) | (23,864 | ) | (60,593 | ) | (84,966 | ) | (146,904 | ) |
Investment Class: | | | | | | | | | | | | | |
Subscribed | | 3,974 | | 100,709 | | — | | — | | — | | — | |
Distributions Reinvested | | 4,008 | | 10,127 | | — | | — | | — | | — | |
Redeemed | | (7,938 | ) | (273,807 | ) | — | | — | | — | | — | |
Adviser Class: | | | | | | | | | | | | | |
Subscribed | | — | | — | | — | | — | | 2 | | 30 | |
Distributions Reinvested | | — | | — | | — | | — | | 21 | | 54 | |
Redeemed | | — | | — | | — | | — | | (106 | ) | (464 | ) |
Net Increase (Decrease) in Net Assets Resulting from Capital Share Transactions | | (690 | ) | (163,477 | ) | 10,823 | | 43,639 | | (5,327 | ) | 33,625 | |
Redemption Fees | | — | | — | | — | | — | | 3 | | @— | |
Total Increase (Decrease) in Net Assets | | (1,478 | ) | (169,216 | ) | 12,110 | | 37,748 | | (8,878 | ) | 25,734 | |
Net Assets: | | | | | | | | | | | | | |
Beginning of Period | | 145,021 | | 314,237 | | 195,659 | | 157,911 | | 526,458 | | 500,724 | |
End of Period | | $ | 143,543 | | $ | 145,021 | | $ | 207,769 | | $ | 195,659 | | $ | 517,580 | | $ | 526,458 | |
Undistributed (Distributions in Excess of) Net Investment Income Included in End of Period Net Assets | | $ | 112 | | $ | 1,693 | | $ | (2,001 | ) | $ | (191 | ) | $ | (2,108 | ) | $ | 7,208 | |
The accompanying notes are an integral part of the financial statements.
100
2007 Semi-Annual Report |
|
March 31, 2007 |
Statements of Changes in Net Assets (cont’d)
| | Intermediate Duration | | International Fixed Income | | Investment Grade Fixed | |
| | Portfolio | | Portfolio | | Income Portfolio | |
| | Six Months | | Year Ended | | Six Months | | Year Ended | | Six Months | | Year Ended | |
| | Ended March | | September | | Ended March | | September | | Ended March | | September | |
| | 31, 2007 | | 30, | | 31, 2007 | | 30, | | 31, 2007 | | 30, | |
| | (unaudited) | | 2006 | | (unaudited) | | 2006 | | (unaudited) | | 2006 | |
| | (000) | | (000) | | (000) | | (000) | | (000) | | (000) | |
(1) | Capital Share Transactions: | | | | | | | | | | | | | |
| Institutional Class: | | | | | | | | | | | | | |
| Shares Subscribed | | 3 | | 175 | | 2,885 | | 9,441 | | 5,765 | | 13,985 | |
| Shares Issued on Distributions Reinvested | | 20 | | 29 | | 483 | | 727 | | 1,451 | | 2,314 | |
| Shares Redeemed | | (96 | ) | (255 | ) | (2,311 | ) | (5,863 | ) | (7,650 | ) | (13,186 | ) |
| Net Increase (Decrease) in Institutional Class Shares Outstanding | | (73 | ) | (51 | ) | 1,057 | | 4,305 | | (434 | ) | 3,113 | |
| Investment Class: | | | | | | | | | | | | | |
| Shares Subscribed | | 394 | | 9,961 | | — | | — | | — | | — | |
| Shares Issued on Distributions Reinvested | | 398 | | 1,006 | | — | | — | | — | | — | |
| Shares Redeemed | | (791 | ) | (27,436 | ) | — | | — | | — | | — | |
| Net Increase (Decrease) in Investment Class Shares Outstanding | | 1 | | (16,469 | ) | — | | — | | — | | — | |
| Adviser Class: | | | | | | | | | | | | | |
| Shares Subscribed | | — | | — | | — | | — | | #— | | 3 | |
| Shares Issued on Distributions Reinvested | | — | | — | | — | | — | | 2 | | 5 | |
| Shares Redeemed | | — | | — | | — | | — | | (9 | ) | (43 | ) |
| Net Increase (Decrease) in Adviser Class Shares Outstanding | | — | | — | | — | | — | | (7 | ) | (35 | ) |
@ Amount is less than $500.
# Amount is less than 500 shares.
The accompanying notes are an integral part of the financial statements.
101
2007 Semi-Annual Report | |
| |
March 31, 2007 | |
Statements of Changes in Net Assets
| | | | | | Long Duration | | | | | |
| | Limited Duration | | Fixed Income | | Municipal | |
| | Portfolio | | Portfolio | | Portfolio | |
| | Six Months | | Year Ended | | Six Months | | Period Ended | | Six Months | | Year Ended | |
| | Ended March | | September | | Ended March | | September | | Ended March | | September | |
| | 31, 2007 | | 30, | | 31, 2007 | | 30, | | 31, 2007 | | 30, | |
| | (unaudited) | | 2006 | | (unaudited) | | 2006^ | | (unaudited) | | 2006 | |
| | (000) | | (000) | | (000) | | (000) | | (000) | | (000) | |
Increase (Decrease) in Net Assets | | | | | | | | | | | | | |
Operations: | | | | | | | | | | | | | |
Net Investment Income (Loss) | | $ | 25,959 | | $ | 45,797 | | $ | 596 | | $ | 225 | | $ | 12,759 | | $ | 17,908 | |
Net Realized Gain (Loss) | | (2,726 | ) | (6,573 | ) | 25 | | (2 | ) | 2,356 | | 4,008 | |
Net Change in Unrealized Appreciation (Depreciation) | | 3,818 | | 4,691 | | (252 | ) | 978 | | (66 | ) | 9,926 | |
Net Increase (Decrease) in Net Assets Resulting from Operations | | 27,051 | | 43,915 | | 369 | | 1,201 | | 15,049 | | 31,842 | |
Distributions from and/or in Excess of: | | | | | | | | | | | | | |
Institutional Class: | | | | | | | | | | | | | |
Net Investment Income | | (29,974 | ) | (44,031 | ) | (510 | ) | — | | (13,976 | ) | (21,892 | ) |
Net Realized Gain | | — | | — | | (79 | ) | — | | — | | — | |
Adviser Class: | | | | | | | | | | | | | |
Net Investment Income | | — | | — | | (10 | ) | — | | — | | — | |
Net Realized Gain | | — | | — | | (2 | ) | — | | — | | — | |
Total Distributions | | (29,974 | ) | (44,031 | ) | (601 | ) | — | | (13,976 | ) | (21,892 | ) |
Capital Share Transactions:(1) | | | | | | | | | | | | | |
Institutional Class: | | | | | | | | | | | | | |
Subscribed | | 68,774 | | 359,275 | | — | | 24,500 | | 150,927 | | 260,411 | |
Distributions Reinvested | | 29,969 | | 43,998 | | — | | — | | 13,534 | | 20,925 | |
Redeemed | | (110,361 | ) | (395,146 | ) | — | | — | | (50,842 | ) | (138,164 | ) |
Adviser Class: | | | | | | | | | | | | | |
Subscribed | | — | | — | | — | | 500 | | — | | — | |
Net Increase (Decrease) in Net Assets Resulting from Capital Share Transactions | | (11,618 | ) | 8,127 | | — | | 25,000 | | 113,619 | | 143,172 | |
Redemption Fees | | — | | — | | — | | — | | @— | | 1 | |
Total Increase (Decrease) in Net Assets | | (14,541 | ) | 8,011 | | (232 | ) | 26,201 | | 114,692 | | 153,123 | |
Net Assets: | | | | | | | | | | | | | |
Beginning of Period | | 1,077,967 | | 1,069,956 | | 26,201 | | — | | 662,162 | | 509,039 | |
End of Period | | $ | 1,063,426 | | $ | 1,077,967 | | $ | 25,969 | | $ | 26,201 | | $ | 776,854 | | $ | 662,162 | |
Undistributed (Distributions in Excess of) Net Investment Income Included in End of Period Net Assets | | $ | 4,557 | | $ | 8,572 | | $ | 301 | | $ | 225 | | $ | 628 | | $ | 2,523 | |
(1) Capital Share Transactions: | | | | | | | | | | | | | |
Institutional Class: | | | | | | | | | | | | | |
Shares Subscribed | | 6,679 | | 34,896 | | — | | 2,450 | | 11,747 | | 20,547 | |
Shares Issued on Distributions Reinvested | | 2,915 | | 4,282 | | — | | — | | 1,054 | | 1,655 | |
Shares Redeemed | | (10,716 | ) | (38,408 | ) | — | | — | | (3,958 | ) | (10,913 | ) |
Net Increase (Decrease) in Institutional Class Shares Outstanding | | (1,122 | ) | 770 | | — | | 2,450 | | 8,843 | | 11,289 | |
Adviser Class: | | | | | | | | | | | | | |
Shares Subscribed | | — | | — | | — | | 50 | | — | | — | |
Net Increase (Decrease) in Adviser Class Shares Outstanding | | — | | — | | — | | 50 | | — | | — | |
| | | | | | | | | | | | | | | | | | | | | | | | | |
^ The Long Duration Fixed Income Portfolio commenced operations on July 21, 2006.
The accompanying notes are an integral part of the financial statements.
102
2007 Semi-Annual Report |
|
March 31, 2007 (unaudited) |
Statements of Cash Flows
For the Six Months Ended March 31, 2007
| | | | Core | | Core Plus | |
| | | | Fixed | | Fixed | |
| | Balanced | | Income | | Income | |
| | Portfolio | | Portfolio | | Portfolio | |
| | (000) | | (000) | | (000) | |
Cash Flows From Operating Activities: | | | | | | | |
Proceeds from Sales and Maturities of Investments | | $ | 66,712 | | $ | 93,365 | | $ | 1,070,110 | |
Purchases of Investments | | (52,225 | ) | (95,282 | ) | (1,112,254 | ) |
Proceeds from Sales of Delayed Delivery Commitments | | 23,511 | | 29,892 | | 499,064 | |
Purchases of Delayed Delivery Commitments | | (22,144 | ) | (32,337 | ) | (491,244 | ) |
Net (Increase) Decrease in Short-Term Investments | | (418 | ) | (1,654 | ) | (84,928 | ) |
Net Realized Gain (Loss) on Foreign Currency Transactions | | (12 | ) | — | | 490 | |
Net Realized Gain (Loss) on Futures Contracts | | (63 | ) | 1,690 | | 9,025 | |
Net Realized Gain (Loss) on Swap Agreements | | 325 | | 933 | | 12,470 | |
Net Investment Income | | 3,487 | | 6,955 | | 62,126 | |
Adjustments to Reconcile Net Investment Income to Net Cash Provided by Operating Activities: | | | | | | | |
Net (Increase) Decrease in Receivables Related to Operations | | 7 | | (141 | ) | (632 | ) |
Net Increase (Decrease) in Payables Related to Operations | | 38 | | (9 | ) | 83 | |
Accretion/Amortization of Discounts and Premiums | | 36 | | 19 | | 463 | |
Net Cash Provided (Used) in Operating Activities | | 19,254 | | 3,431 | | (35,557 | ) |
Cash Flows from Financing Activities: | | | | | | | |
Proceeds from Portfolio Shares Sold | | 33,432 | | 22,295 | | 276,090 | |
Payment on Portfolio Shares Redeemed | | (52,541 | ) | (26,084 | ) | (222,457 | ) |
Cash Dividends and Distributions Paid | | (4 | ) | (10 | ) | (6,231 | ) |
Net Cash Provided (Used) by Financing Activities | | (19,113 | ) | (3,799 | ) | 47,402 | |
Net Increase (Decrease) in Cash | | 141 | | (368 | ) | 11,845 | |
Cash at Beginning of Period | | 83 | | 341 | | 1,561 | |
Cash at End of Period | | $ | 224 | | $ | (27 | ) | $ | 13,406 | |
The accompanying notes are an integral part of the financial statements.
103
2007 Semi-Annual Report | |
| |
March 31, 2007 (unaudited) | |
Statements of Cash Flows
For the Six Months Ended March 31, 2007
| | | | Investment | | | |
| | Intermediate | | Grade Fixed | | Limited | |
| | Duration | | Income | | Duration | |
| | Portfolio | | Portfolio | | Portfolio | |
| | (000) | | (000) | | (000) | |
Cash Flows From Operating Activities: | | | | | | | |
Proceeds from Sales and Maturities of Investments | | $ | 35,984 | | $ | 171,091 | | $ | 283,788 | |
Purchases of Investments | | (46,653 | ) | (141,602 | ) | (293,361 | ) |
Proceeds from Sales of Delayed Delivery Commitments | | 32,842 | | 108,027 | | 85,771 | |
Purchases of Delayed Delivery Commitments | | (25,601 | ) | (114,146 | ) | (78,633 | ) |
Net (Increase) Decrease in Short-Term Investments | | 4,409 | | (19,113 | ) | 19,317 | |
Net Realized Gain (Loss) on Futures Contracts | | 381 | | 2,783 | | (975 | ) |
Net Realized Gain (Loss) on Swap Agreements | | 6 | | 2,912 | | (959 | ) |
Net Investment Income | | 3.,255 | | 11,457 | | 25,959 | |
Adjustments to Reconcile Net Investment Income to Net Cash Provided by Operating Activities: | | | | | | | |
Net (Increase) Decrease in Receivables Related to Operations | | 100 | | (178 | ) | 45 | |
Net Increase (Decrease) in Payables Related to Operations | | 9 | | (9 | ) | (68 | ) |
Accretion/Amortization of Discounts and Premiums | | 37 | | 56 | | 557 | |
Net Cash Provided (Used) in Operating Activities | | 4,769 | | 21,278 | | 41,441 | |
Cash Flows from Financing Activities: | | | | | | | |
Proceeds from Portfolio Shares Sold | | 4,006 | | 63,621 | | 68,680 | |
Payment on Portfolio Shares Redeemed | | (8,839 | ) | (85,047 | ) | (110,449 | ) |
Cash Dividends and Distributions Paid | | (51 | ) | (551 | ) | (5 | ) |
Net Cash Provided (Used) by Financing Activities | | (4,884 | ) | (21,977 | ) | (41,774 | ) |
Net Increase (Decrease) in Cash | | (115 | ) | (699 | ) | (333 | ) |
Cash at Beginning of Period | | 133 | | 591 | | 625 | |
Cash at End of Period | | $ | 18 | | $ | (108 | ) | $ | 292 | |
The accompanying notes are an integral part of the financial statements.
104
2007 Semi-Annual Report | |
| |
March 31, 2007 | |
Financial Highlights
Balanced Portfolio
| | Institutional Class | |
| | Six Months Ended | | Year Ended September 30, | |
Selected Per Share Data and Ratios | | March 31, 2007 | | 2006 | | 2005 | | 2004 | | 2003 | | 2002 | |
| | (unaudited) | | | | | | | | | | | |
Net Asset Value, Beginning of Period | | $ | 12.63 | | $ | 11.95 | | $ | 10.90 | | $ | 10.15 | | $ | 8.78 | | $ | 10.60 | |
Income (Loss) from Investment Operations | | | | | | | | | | | | | |
Net Investment Income† | | 0.15 | | 0.25 | | 0.24 | | 0.18 | | 0.21 | | 0.25 | |
Net Realized and Unrealized Gain (Loss) on Investments | | 0.78 | | 0.72 | | 1.09 | | 0.78 | | 1.47 | | (1.75 | ) |
Total from Investment Operations | | 0.93 | | 0.97 | | 1.33 | | 0.96 | | 1.68 | | (1.50 | ) |
Distributions from and/or in Excess of: | | | | | | | | | | | | | |
Net Investment Income | | (0.15 | ) | (0.29 | ) | (0.28 | ) | (0.21 | ) | (0.31 | ) | (0.32 | ) |
Redemption Fees | | 0.00 | †† | 0.00 | †† | — | | — | | — | | — | |
Net Asset Value, End of Period | | $ | 13.41 | | $ | 12.63 | | $ | 11.95 | | $ | 10.90 | | $ | 10.15 | | $ | 8.78 | |
Total Return | | 7.38 | %‡ | 8.21 | % | 12.33 | % | 9.49 | % | 19.48 | % | (14.60 | )% |
Ratios and Supplemental Data: | | | | | | | | | | | | | |
Net Assets, End of Period (Thousands) | | $ | 267,834 | | $ | 256,754 | | $ | 236,730 | | $ | 203,889 | | $ | 262,960 | | $ | 250,796 | |
Ratio of Expenses to Average Net Assets | | 0.62 | %* | 0.60 | % | 0.62 | % | 0.62 | % | 0.60 | % | 0.59 | % |
Ratio of Net Investment Income to Average Net Assets | | 2.26 | %* | 2.02 | % | 2.11 | % | 1.67 | % | 2.17 | % | 2.37 | % |
Portfolio Turnover Rate^ | | 27 | %‡ | 71 | % | 111 | % | 208 | % | 84 | % | 133 | % |
| | Investment Class | |
| | Six Months Ended | | Year Ended September 30, | |
Selected Per Share Data and Ratios | | March 31, 2007 | | 2006 | | 2005 | | 2004 | | 2003 | | 2002 | |
| | (unaudited) | | | | | | | | | | | |
Net Asset Value, Beginning of Period | | $ | 12.61 | | $ | 11.93 | | $ | 10.89 | | $ | 10.13 | | $ | 8.76 | | $ | 10.61 | |
Income (Loss) from Investment Operations | | | | | | | | | | | | | |
Net Investment Income† | | 0.14 | | 0.23 | | 0.22 | | 0.17 | | 0.18 | | 0.23 | |
Net Realized and Unrealized Gain (Loss) on Investments | | 0.78 | | 0.72 | | 1.08 | | 0.78 | | 1.48 | | (1.78 | ) |
Total from Investment Operations | | 0.92 | | 0.95 | | 1.30 | | 0.95 | | 1.66 | | (1.55 | ) |
Distributions from and/or in Excess of: | | | | | | | | | | | | | |
Net Investment Income | | (0.14 | ) | (0.27 | ) | (0.26 | ) | (0.19 | ) | (0.29 | ) | (0.30 | ) |
Redemption Fees | | 0.00 | †† | 0.00 | †† | — | | — | | — | | — | |
Net Asset Value, End of Period | | $ | 13.39 | | $ | 12.61 | | $ | 11.93 | | $ | 10.89 | | $ | 10.13 | | $ | 8.76 | |
Total Return | | 7.32 | %‡ | 8.07 | % | 12.09 | % | 9.43 | % | 19.28 | % | (15.03 | )% |
Ratios and Supplemental Data: | | | | | | | | | | | | | |
Net Assets, End of Period (Thousands) | | $ | 4,517 | | $ | 4,102 | | $ | 3,706 | | $ | 3,117 | | $ | 8,209 | | $ | 4,925 | |
Ratio of Expenses to Average Net Assets | | 0.77 | %* | 0.75 | % | 0.77 | % | 0.77 | % | 0.75 | % | 0.74 | % |
Ratio of Net Investment Income to Average Net Assets | | 2.10 | %* | 1.87 | % | 1.95 | % | 1.59 | % | 2.02 | % | 2.22 | % |
Portfolio Turnover Rate^ | | 27 | %‡ | 71 | % | 111 | % | 208 | % | 84 | % | 133 | % |
† Per share amount is based on average shares outstanding.
†† Amount is less than $0.005 per share.
‡ Not Annualized
* Annualized
^ The Portfolio’s turnover rate is calculated by dividing the lesser of purchases and sales of securities for a fiscal year by the average monthly value of portfolio securities during such fiscal year. The turnover rate may vary greatly from year to year as well as within a year. The Portfolio turnover rate reflects mortgage pool forward commitments as purchases and sales, which was not the case prior to the year ended September 30, 2004. The inclusion of such securities caused the reported turnover rate to be higher during the period than in previous fiscal years.
The accompanying notes are an integral part of the financial statements.
105
2007 Semi-Annual Report | | |
| | |
March 31, 2007 | | |
Financial Highlights
Balanced Portfolio
| | Adviser Class | |
| | Six Months Ended | | Year Ended September 30, | |
Selected Per Share Data and Ratios | | March 31, 2007 | | 2006 | | 2005 | | 2004 | | 2003 | | 2002 | |
| | (unaudited) | | | | | | | | | | | |
Net Asset Value, Beginning of Period | | $ | 12.61 | | $ | 11.93 | | $ | 10.88 | | $ | 10.13 | | $ | 8.77 | | $ | 10.57 | |
Income (Loss) from Investment Operations | | | | | | | | | | | | | |
Net Investment Income† | | 0.14 | | 0.22 | | 0.22 | | 0.15 | | 0.18 | | 0.22 | |
Net Realized and Unrealized Gain (Loss) on Investments | | 0.76 | | 0.72 | | 1.08 | | 0.78 | | 1.46 | | (1.74 | ) |
Total from Investment Operations | | 0.90 | | 0.94 | | 1.30 | | 0.93 | | 1.64 | | (1.52 | ) |
Distributions from and/or in Excess of: | | | | | | | | | | | | | |
Net Investment Income | | (0.13 | ) | (0.26 | ) | (0.25 | ) | (0.18 | ) | (0.28 | ) | (0.28 | ) |
Redemption Fees | | 0.00 | †† | 0.00 | †† | — | | — | | — | | — | |
Net Asset Value, End of Period | | $ | 13.38 | | $ | 12.61 | | $ | 11.93 | | $ | 10.88 | | $ | 10.13 | | $ | 8.77 | |
Total Return | | 7.18 | %‡ | 7.96 | % | 12.05 | % | 9.27 | % | 19.12 | % | (14.76 | )% |
Ratios and Supplemental Data: | | | | | | | | | | | | | |
Net Assets, End of Period (Thousands) | | $ | 28,438 | | $ | 36,870 | | $ | 37,863 | | $ | 57,322 | | $ | 59,254 | | $ | 51,761 | |
Ratio of Expenses to Average Net Assets | | 0.87 | %* | 0.85 | % | 0.87 | % | 0.87 | % | 0.85 | % | 0.84 | % |
Ratio of Net Investment Income to Average Net Assets | | 2.07 | %* | 1.77 | % | 1.90 | % | 1.42 | % | 1.92 | % | 2.12 | % |
Portfolio Turnover Rate^ | | 27 | %‡ | 71 | % | 111 | % | 208 | % | 84 | % | 133 | % |
† Per share amount is based on average shares outstanding.
†† Amount is less than $0.005 per share.
‡ Not Annualized
* Annualized
^ The Portfolio’s turnover rate is calculated by dividing the lesser of purchases and sales of securities for a fiscal year by the average monthly value of portfolio securities during such fiscal year. The turnover rate may vary greatly from year to year as well as within a year. The Portfolio turnover rate reflects mortgage pool forward commitments as purchases and sales, which was not the case prior to the year ended September 30, 2004. The inclusion of such securities caused the reported turnover rate to be higher during the period than in previous fiscal years.
The accompanying notes are an integral part of the financial statements.
106
2007 Semi-Annual Report | |
| | |
March 31, 2007 | |
| | |
Financial Highlights
Equities Plus Portfolio
| | Institutional Class | |
| | Six Months Ended | | April 26, 2006^ | |
| | March 31, 2007 | | to September | |
Selected Per Share Data and Ratios | | (unaudited) | | 30, 2006 | |
| | | | | |
Net Asset Value, Beginning of Period | | $ | 10.22 | | $ | 10.00 | |
Income (Loss) from Investment Operations | | | | | |
Net Investment Income (Loss)† | | 0.34 | | 0.21 | |
Net Realized and Unrealized Gain (Loss) on Investments | | 0.44 | | 0.07 | |
Total from Investment Operations | | 0.78 | | 0.28 | |
Distributions from and/or in Excess of: | | | | | |
Net Investment Income | | (0.34 | ) | (0.06 | ) |
Net Realized and Unrealized Gain (Loss) on Investments | | (0.36 | ) | — | |
Total from Investment Operations | | (0.70 | ) | (0.06 | ) |
Net Asset Value, End of Period | | $ | 10.30 | | $ | 10.22 | |
Total Return | | 7.63 | %‡ | 2.93 | %‡ |
Ratios and Supplemental Data: | | | | | |
Net Assets, End of Period (Thousands) | | $ | 27,059 | | $ | 26,093 | |
Ratio of Expenses to Average Net Assets (1) | | 0.60 | %* | 0.60 | %* |
Ratio of Net Investment Income (Loss) to Average Net Assets (1) | | 6.59 | %* | 4.97 | %* |
Portfolio Turnover Rate | | 19 | %‡ | 9‡ | % |
(1) Supplemental Information on the Ratios to Average Net Assets: | | | | | |
Ratio Before Expenses Waived/Reimbursed by Adviser: | | | | | |
Expenses to Average Net Assets | | 0.92 | %* | 1.06 | %* |
Net Investment Income (loss) to Average Net Assets | | 6.27 | %* | 4.53 | %* |
| | Adviser Class | |
| | Six Months Ended | | April 26, 2006^ | |
| | March 31, 2007 | | to September | |
Selected Per Share Data and Ratios | | (unaudited) | | 30, 2006 | |
| | | | | |
Net Asset Value, Beginning of Period | | $10.22 | | $10.00 | |
Income (Loss) from Investment Operations | | | | | |
Net Investment Income (Loss)† | | 0.33 | | 0.20 | |
Net Realized and Unrealized Gain (Loss) on Investments | | 0.42 | | 0.08 | |
Total from Investment Operations | | 0.75 | | 0.28 | |
Distributions from and/or in Excess of: | | | | | |
Net Investment Income | | (0.32 | ) | (0.06 | ) |
Net Realized and Unrealized Gain (Loss) on Investments | | (0.36 | ) | — | |
Total from Investment Operations | | (0.68 | ) | (0.06 | ) |
Net Asset Value, End of Period | | $10.29 | | $10.22 | |
Total Return | | 7.61 | %‡ | 2.79 | %‡ |
Ratios and Supplemental Data: | | | | | |
Net Assets, End of Period (Thousands) | | $515 | | $511 | |
Ratio of Expenses to Average Net Assets (2) | | 0.85 | %* | 0.85 | %* |
Ratio of Net Investment Income (Loss) to Average Net Assets (2) | | 6.33 | %* | 4.71 | %* |
Portfolio Turnover Rate | | 19 | %‡ | 9 | %‡ |
(2) Supplemental Information on the Ratios to Average Net Assets: | | | | | |
Ratio Before Expenses Waived/Reimbursed by Adviser: | | | | | |
Expenses to Average Net Assets | | 1.17 | %* | 1.31 | %* |
Net Investment Income (loss) to Average Net Assets | | 6.01 | %* | 4.26 | %* |
^ Commencement of operations
† Per share amount is based on average shares outstanding.
‡ Not annualized
* Annualized
The accompanying notes are an integral part of the financial statements.
107
2007 Semi-Annual Report | | |
| | |
March 31, 2007 | | |
Financial Highlights
Mid Cap Growth Portfolio
| | Institutional Class | |
| | Six Months Ended | | Year Ended September 30, | |
Selected Per Share Data and Ratios | | March 31, 2007 | | 2006 | | 2005 | | 2004 | | 2003 | | 2002 | |
| | (unaudited) | | | | | | | | | | | |
Net Asset Value, Beginning of Period | | $ | 25.21 | | $ | 23.54 | | $ | 18.52 | | $ | 15.42 | | $ | 11.65 | | $ | 14.80 | |
Income (Loss) from Investment Operations | | | | | | | | | | | | | |
Net Investment Income (Loss)† | | 0.07 | | 0.09 | | (0.03 | ) | (0.04 | ) | (0.05 | ) | (0.05 | ) |
Net Realized and Unrealized Gain (Loss) on Investments | | 2.92 | | 1.58 | | 5.05 | | 3.14 | | 3.82 | | (3.10 | ) |
Total from Investment Operations | | 2.99 | | 1.67 | | 5.02 | | 3.10 | | 3.77 | | (3.15 | ) |
Distributions from and/or in Excess of: | | | | | | | | | | | | | |
Net Investment Income | | (0.12 | ) | — | | — | | — | | — | | — | |
Redemption Fees | | 0.00 | †† | 0.00 | †† | — | | — | | — | | — | |
Net Asset Value, End of Period | | $ | 28.08 | | $ | 25.21 | | $ | 23.54 | | $ | 18.52 | | $ | 15.42 | | $ | 11.65 | |
Total Return | | 11.92 | % | 7.05 | %# | 27.11 | % | 20.10 | % | 32.36 | % | (21.28 | )% |
Ratios and Supplemental Data: | | | | | | | | | | | | | |
Net Assets, End of Period (Thousands) | | $ | 1,241,855 | | $ | 1,001,395 | | $ | 755,313 | | $ | 589,479 | | $ | 559,760 | | $ | 438,778 | |
Ratio of Expenses to Average Net Assets | | 0.65 | %* | 0.63 | % | 0.62 | % | 0.63 | % | 0.64 | % | 0.65 | % |
Ratio of Net Investment Income (Loss) to Average Net Assets | | 0.48 | %* | 0.37 | % | (0.12 | )% | (0.23 | )% | (0.37 | )% | (0.35 | )% |
Portfolio Turnover Rate | | 35 | %‡ | 65 | % | 115 | % | 147 | % | 180 | % | 221 | % |
| | Adviser Class | |
| | Six Months Ended | | Year Ended September 30, | |
Selected Per Share Data and Ratios | | March 31, 2007 | | 2006 | | 2005 | | 2004 | | 2003 | | 2002 | |
| | (unaudited) | | | | | | | | | | | |
Net Asset Value, Beginning of Period | | $ | 24.54 | | $ | 22.97 | | $ | 18.12 | | $ | 15.13 | | $ | 11.45 | | $ | 14.59 | |
Income (Loss) from Investment Operations | | | | | | | | | | | | | |
Net Investment Income (Loss)† | | 0.03 | | 0.03 | | (0.08 | ) | (0.08 | ) | (0.08 | ) | (0.09 | ) |
Net Realized and Unrealized Gain (Loss) on Investments | | 2.84 | | 1.54 | | 4.93 | | 3.07 | | 3.76 | | (3.05 | ) |
Total from Investment Operations | | 2.87 | | 1.57 | | 4.85 | | 2.99 | | 3.68 | | (3.14 | ) |
Distributions from and/or in Excess of: | | | | | | | | | | | | | |
Net Investment Income | | (0.05 | ) | — | | — | | — | | — | | — | |
Redemption Fees | | 0.00 | †† | 0.00 | †† | — | | — | | — | | — | |
Net Asset Value, End of Period | | $ | 27.36 | | $ | 24.54 | | $ | 22.97 | | $ | 18.12 | | $ | 15.13 | | $ | 11.45 | |
Total Return | | 11.76 | % | 6.79 | %# | 26.77 | % | 19.76 | % | 32.14 | % | (21.52 | )% |
Ratios and Supplemental Data: | | | | | | | | | | | | | |
Net Assets, End of Period (Thousands) | | $ | 1,127,323 | | $ | 1,020,611 | | $ | 936,566 | | $ | 728,058 | | $ | 531,571 | | $ | 386,206 | |
Ratio of Expenses to Average Net Assets | | 0.90 | %* | 0.88 | % | 0.87 | % | 0.88 | % | 0.89 | % | 0.90 | % |
Ratio of Net Investment Income (Loss) to Average Net Assets | | 0.23 | %* | 0.10 | % | (0.37 | )% | (0.48 | )% | (0.62 | )% | (0.60 | )% |
Portfolio Turnover Rate | | 35 | %‡ | 65 | % | 115 | % | 147 | % | 180 | % | 221 | % |
† Per share amount is based on average shares outstanding.
†† Amount is less than $0.005 per share.
‡ Not Annualized
* Annualized
# The Adviser fully reimbursed the Portfolio for losses incurred resulting from the disposal of investments in violation of restrictions. The impact of this reimbursement is not reflected in the total return shown above. With this reimbursement, the total returns for the Institutional and Adviser Classes would have been 7.09% and 6.84%, respectively.
The accompanying notes are an integral part of the financial statements.
108
2007 Semi-Annual Report | |
| | |
March 31, 2007 | |
| | |
Financial Highlights
U.S. Mid Cap Value Portfolio
| | Institutional Class | |
| | Six Months Ended | | Year Ended September 30, | |
Selected Per Share Data and Ratios | | March 31, 2007 | | 2006 | | 2005 | | 2004 | | 2003 | | 2002 | |
| | (unaudited) | | | | | | | | | | | |
Net Asset Value, Beginning of Period | | $ | 29.09 | | $ | 25.65 | | $ | 21.13 | | $ | 18.07 | | $ | 13.50 | | $ | 16.91 | |
Income (Loss) from Investment Operations | | | | | | | | | | | | | |
Net Investment Income (Loss)† | | 0.12 | | 0.20 | | 0.11 | | 0.12 | | 0.02 | | (0.01 | ) |
Net Realized and Unrealized Gain (Loss) on Investments | | 4.21 | | 3.44 | | 4.50 | | 2.99 | | 4.55 | | (3.38 | ) |
Total from Investment Operations | | 4.33 | | 3.64 | | 4.61 | | 3.11 | | 4.57 | | (3.39 | ) |
Distributions from and/or in Excess of: | | | | | | | | | | | | | |
Net Investment Income | | (0.22 | ) | (0.20 | ) | (0.09 | ) | (0.05 | ) | — | | (0.02 | ) |
Redemption Fees | | 0.00 | †† | 0.00 | †† | — | | — | | — | | — | |
Net Asset Value, End of Period | | $ | 33.20 | | $ | 29.09 | | $ | 25.65 | | $ | 21.13 | | $ | 18.07 | | $ | 13.50 | |
Total Return | | 14.91 | %‡ | 14.27 | % | 21.86 | % | 17.23 | % | 33.85 | % | (20.09 | )% |
Ratios and Supplemental Data: | | | | | | | | | | | | | |
Net Assets, End of Period (Thousands) | | $ | 137,977 | | $ | 118,005 | | $ | 128,084 | | $ | 246,694 | | $ | 441,775 | | $ | 672,507 | |
Ratio of Expenses to Average Net Assets | | 0.91 | %* | 0.90 | % | 0.87 | % | 0.90 | % | 0.88 | % | 0.89 | % |
Ratio of Net Investment Income (Loss) to Average Net Assets | | 0.76 | %* | 0.74 | % | 0.49 | % | 0.57 | % | 0.13 | % | (0.05 | )% |
Portfolio Turnover Rate | | 41 | %‡ | 66 | % | 72 | % | 146 | % | 138 | % | 145 | % |
| | Investment Class | |
| | Six Months Ended | | Year Ended September 30, | |
Selected Per Share Data and Ratios | | March 31, 2007 | | 2006 | | 2005 | | 2004 | | 2003 | | 2002 | |
| | (unaudited) | | | | | | | | | | | |
Net Asset Value, Beginning of Period | | $ | 28.94 | | $ | 25.51 | | $ | 21.00 | | $ | 17.95 | | $ | 13.43 | | $ | 16.83 | |
Income (Loss) from Investment Operations | | | | | | | | | | | | | |
Net Investment Income (Loss)† | | 0.10 | | 0.13 | | 0.08 | | 0.08 | | (0.01 | ) | (0.03 | ) |
Net Realized and Unrealized Gain (Loss) on Investments | | 4.17 | | 3.46 | | 4.47 | | 2.99 | | 4.53 | | (3.37 | ) |
Total from Investment Operations | | 4.27 | | 3.59 | | 4.55 | | 3.07 | | 4.52 | | (3.40 | ) |
Distributions from and/or in Excess of: | | | | | | | | | | | | | |
Net Investment Income | | (0.16 | ) | (0.16 | ) | (0.04 | ) | (0.02 | ) | — | | — | |
Redemption Fees | | 0.00 | †† | 0.00 | †† | — | | — | | — | | — | |
Net Asset Value, End of Period | | $ | 33.05 | | $ | 28.94 | | $ | 25.51 | | $ | 21.00 | | $ | 17.95 | | $ | 13.43 | |
Total Return | | 14.82 | %‡ | 14.10 | % | 21.67 | % | 17.09 | % | 33.66 | % | (20.20 | )% |
Ratios and Supplemental Data: | | | | | | | | | | | | | |
Net Assets, End of Period (Thousands) | | $ | 3,237 | | $ | 2,588 | | $ | 5,611 | | $ | 8,886 | | $ | 13,004 | | $ | 33,100 | |
Ratio of Expenses to Average Net Assets | | 1.06 | %* | 1.05 | % | 1.02 | % | 1.05 | % | 1.03 | % | 1.04 | % |
Ratio of Net Investment Income (Loss) to Average Net Assets | | 0.61 | %* | 0.50 | % | 0.33 | % | 0.42 | % | (0.02 | )% | (0.20 | )% |
Portfolio Turnover Rate | | 41 | %‡ | 66 | % | 72 | % | 146 | % | 138 | % | 145 | % |
† Per share amount is based on average shares outstanding.
†† Amount is less than $0.005 per share.
‡ Not Annualized
* Annualized
The accompanying notes are an integral part of the financial statements.
109
2007 Semi-Annual Report | | |
| | |
March 31, 2007 | | |
Financial Highlights
U.S. Mid Cap Value Portfolio
| | Adviser Class | |
| | Six Months Ended | | Year Ended September 30, | |
| | March 31, 2007 | | 2006 | | 2005 | | 2004 | | 2003 | | 2002 | |
Selected Per Share Data and Ratios | | (unaudited) | | | | | | | | | | | |
Net Asset Value, Beginning of Period | | $ | 28.94 | | $ | 25.48 | | $ | 20.99 | | $ | 17.95 | | $ | 13.44 | | $ | 16.87 | |
Income (Loss) from Investment Operations | | | | | | | | | | | | | |
Net Investment Income (Loss)† | | 0.08 | | 0.13 | | 0.04 | | 0.07 | | (0.02 | ) | (0.05 | ) |
Net Realized and Unrealized Gain (Loss) on Investments | | 4.19 | | 3.43 | | 4.47 | | 2.97 | | 4.53 | | (3.38 | ) |
Total from Investment Operations | | 4.27 | | 3.56 | | 4.51 | | 3.04 | | 4.51 | | (3.43 | ) |
Distributions from and/or in Excess of: | | | | | | | | | | | | | |
Net Investment Income | | (0.15 | ) | (0.10 | ) | (0.02 | ) | (0.00 | )†† | — | | — | |
Redemption Fees | | 0.00 | †† | 0.00 | †† | — | | — | | — | | — | |
Net Asset Value, End of Period | | $ | 33.06 | | $ | 28.94 | | $ | 25.48 | | $ | 20.99 | | $ | 17.95 | | $ | 13.44 | |
Total Return | | 14.76 | %‡ | 14.02 | % | 21.52 | % | 16.95 | % | 33.56 | % | (20.33 | )% |
Ratios and Supplemental Data: | | | | | | | | | | | | | |
Net Assets, End of Period (Thousands) | | $ | 15,171 | | $ | 13,144 | | $ | 25,943 | | $ | 55,340 | | $ | 84,733 | | $ | 99,553 | |
Ratio of Expenses to Average Net Assets | | 1.16 | %* | 1.15 | % | 1.12 | % | 1.15 | % | 1.13 | % | 1.14 | % |
Ratio of Net Investment Income (Loss) to Average Net Assets | | 0.52 | %* | 0.48 | % | 0.18 | % | 0.32 | % | (0.12 | )% | (0.30 | )% |
Portfolio Turnover Rate | | 41 | %‡ | 66 | % | 72 | % | 146 | % | 138 | % | 145 | % |
† Per share amount is based on average shares outstanding.
†† Amount is less than $0.005 per share.
‡ Not Annualized
* Annualized
The accompanying notes are an integral part of the financial statements.
110
2007 Semi-Annual Report | |
| | |
March 31, 2007 | |
| | |
Financial Highlights
U.S. Small Cap Value Portfolio
| | Institutional Class | |
| | Six Months Ended | | Year Ended September 30, | |
Selected Per Share Data and Ratios | | March 31, 2007 | | 2006 | | 2005 | | 2004 | | 2003 | | 2002 | |
| | (unaudited) | | | | | | | | | | | |
Net Asset Value, Beginning of Period | | $ | 26.22 | | $ | 24.41 | | $ | 22.26 | | $ | 18.19 | | $ | 14.04 | | $ | 15.16 | |
Income (Loss) from Investment Operations | | | | | | | | | | | | | |
Net Investment Income (Loss)�� | | 0.03 | | 0.09 | | 0.30 | | 0.04 | | 0.03 | | 0.06 | |
Net Realized and Unrealized Gain (Loss) on Investments | | 4.12 | | 3.04 | | 3.93 | | 4.06 | | 4.18 | | (1.10 | ) |
Total from Investment Operations | | 4.15 | | 3.13 | | 4.23 | | 4.10 | | 4.21 | | (1.04 | ) |
Distributions from and/or in Excess of: | | | | | | | | | | | | | |
Net Investment Income | | (0.08 | ) | (0.17 | ) | (0.01 | ) | (0.03 | ) | (0.06 | ) | (0.05 | ) |
Net Realized Gain | | (2.90 | ) | (1.15 | ) | (2.07 | ) | — | | — | | (0.03 | ) |
Total Distributions | | (2.98 | ) | (1.32 | ) | (2.08 | ) | (0.03 | ) | (0.06 | ) | (0.08 | ) |
Redemption Fees | | 0.00 | †† | 0.00 | †† | — | | — | | — | | — | |
Net Asset Value, End of Period | | $ | 27.39 | | $ | 26.22 | | $ | 24.41 | | $ | 22.26 | | $ | 18.19 | | $ | 14.04 | |
Total Return | | 16.35 | %‡ | 13.42 | % | 19.83 | % | 22.57 | % | 30.09 | % | (6.97 | )% |
Ratios and Supplemental Data: | | | | | | | | | | | | | |
Net Assets, End of Period (Thousands) | | $ | 813,358 | | $ | 716,208 | | $ | 355,671 | | $ | 382,898 | | $ | 536,620 | | $ | 588,803 | |
Ratio of Expenses to Average Net Assets | | 0.87 | %* | 0.81 | % | 0.82 | % | 0.90 | % | 0.89 | % | 0.89 | % |
Ratio of Net Investment Income (Loss) to Average Net Assets | | 0.25 | %* | 0.35 | % | 1.29 | % | 0.18 | % | 0.21 | % | 0.35 | % |
Portfolio Turnover Rate | | 26 | %‡ | 51 | % | 61 | % | 104 | % | 159 | % | 118 | % |
| | Adviser Class | |
| | Six Months Ended | | Year Ended September 30 | |
Selected Per Share Data and Ratios | | March 31, 2007 | | 2006 | | 2005 | | 2004 | | 2003 | | 2002 | |
| | (unaudited) | | | | | | | | | | | |
Net Asset Value, Beginning of Period | | $ | 26.09 | | $ | 24.29 | | $ | 22.20 | | $ | 18.16 | | $ | 14.01 | | $ | 15.13 | |
Income (Loss) from Investment Operations | | | | | | | | | | | | | |
Net Investment Income (Loss)† | | 0.00 | †† | 0.02 | | 0.24 | | (0.02 | ) | (0.01 | ) | 0.02 | |
Net Realized and Unrealized Gain (Loss) on Investments | | 4.10 | | 3.04 | | 3.92 | | 4.06 | | 4.18 | | (1.11 | ) |
Total from Investment Operations | | 4.10 | | 3.06 | | 4.16 | | 4.04 | | 4.17 | | (1.09 | ) |
Distributions from and/or in Excess of: | | | | | | | | | | | | | |
| | | | | | | | | | | | (0.00 | ) |
Net Investment Income | | (0.02 | ) | (0.11 | ) | — | | — | | (0.02 | )†† | | |
Net Realized Gain | | (2.90 | ) | (1.15 | ) | (2.07 | ) | — | | — | | (0.03 | ) |
Total Distributions | | (2.92 | ) | (1.26 | ) | (2.07 | ) | — | | (0.02 | ) | (0.03 | ) |
Redemption Fees | | 0.00 | †† | 0.00 | †† | — | | — | | — | | — | |
Net Asset Value, End of Period | | $ | 27.27 | | $ | 26.09 | | $ | 24.29 | | $ | 22.20 | | $ | 18.16 | | $ | 14.01 | |
Total Return | | 16.21 | %‡ | 13.13 | % | 19.49 | % | 22.30 | % | 29.76 | % | (7.22 | )% |
Ratios and Supplemental Data: | | | | | | | | | | | | | |
Net Assets, End of Period (Thousands) | | $ | 48,531 | | $ | 26,428 | | $ | 25,860 | | $ | 22,530 | | $ | 64,391 | | $ | 51,964 | |
Ratio of Expenses to Average Net Assets | | 1.13 | %* | 1.06 | % | 1.07 | % | 1.15 | % | 1.14 | % | 1.14 | % |
Ratio of Net Investment Income (Loss) to Average Net Assets | | 0.02 | %* | 0.08 | % | 1.06 | % | (0.07 | )% | (0.04 | )% | 0.10 | % |
Portfolio Turnover Rate | | 26 | %‡ | 51 | % | 61 | % | 104 | % | 159 | % | 118 | % |
† Per share amount is based on average shares outstanding.
†† Amount is less than $0.005 per share.
‡ Not annualized
* Annualized
The accompanying notes are an integral part of the financial statements.
111
2007 Semi-Annual Report | | |
| | |
March 31, 2007 | | |
Financial Highlights
Value Portfolio
| | Institutional Class | |
| | Six Months Ended | | Year Ended September 30, | |
Selected Per Share Data and Ratios | | March 31, 2007 | | 2006 | | 2005 | | 2004 | | 2003 | | 2002 | |
| | (unaudited) | | | | | | | | | | | |
Net Asset Value, Beginning of Period | | $ | 18.67 | | $ | 17.89 | | $ | 16.44 | | $ | 13.64 | | $ | 10.65 | | $ | 13.80 | |
Income (Loss) from Investment Operations | | | | | | | | | | | | | |
Net Investment Income (Loss)† | | 0.17 | | 0.37 | | 0.33 | | 0.27 | | 0.19 | | 0.16 | |
Net Realized and Unrealized Gain (Loss) on Investments | | 1.19 | | 2.11 | | 1.40 | | 2.79 | | 2.99 | | (3.14 | ) |
Total from Investment Operations | | 1.36 | | 2.48 | | 1.73 | | 3.06 | | 3.18 | | (2.98 | ) |
Distributions from and/or in Excess of: | | | | | | | | | | | | | |
Net Investment Income | | (0.22 | ) | (0.38 | ) | (0.28 | ) | (0.26 | ) | (0.19 | ) | (0.17 | ) |
Net Realized Gain | | (1.79 | ) | (1.32 | ) | — | | — | | — | | — | |
Total Distributions | | (2.01 | ) | (1.70 | ) | (0.28 | ) | (0.26 | ) | (0.19 | ) | (0.17 | ) |
Redemption Fees | | 0.00 | †† | 0.00 | †† | — | | — | | — | | — | |
Net Asset Value, End of Period | | $ | 18.02 | | $ | 18.67 | | $ | 17.89 | | $ | 16.44 | | $ | 13.64 | | $ | 10.65 | |
Total Return | | 7.44 | %‡ | 14.68 | % | 10.55 | % | 22.56 | % | 30.19 | % | (21.93 | )% |
Ratios and Supplemental Data: | | | | | | | | | | | | | |
Net Assets, End of Period (Thousands) | | $ | 301,569 | | $ | 307,331 | | $ | 293,426 | | $ | 275,494 | | $ | 363,636 | | $ | 456,996 | |
Ratio of Expenses to Average Net Assets | | 0.65 | %* | 0.65 | % | 0.60 | % | 0.63 | % | 0.63 | % | 0.64 | % |
Ratio of Net Investment Income (Loss) to Average Net Assets | | 1.90 | %* | 2.07 | % | 1.88 | % | 1.75 | % | 1.57 | % | 1.09 | % |
Portfolio Turnover Rate | | 19 | %‡ | 26 | % | 38 | % | 95 | % | 65 | % | 42 | % |
| | Investment Class | |
| | Six Months Ended | | Year Ended September 30, | |
Selected Per Share Data and Ratios | | March 31, 2007 | | 2006 | | 2005 | | 2004 | | 2003 | | 2002 | |
| | (unaudited) | | | | | | | | | | | |
Net Asset Value, Beginning of Period | | $ | 18.69 | | $ | 17.91 | | $ | 16.46 | | $ | 13.65 | | $ | 10.65 | | $ | 13.80 | |
Income (Loss) from Investment Operations | | | | | | | | | | | | | |
Net Investment Income (Loss)† | | 0.16 | | 0.34 | | 0.31 | | 0.25 | | 0.17 | | 0.14 | |
Net Realized and Unrealized Gain (Loss) on Investments | | 1.20 | | 2.11 | | 1.39 | | 2.79 | | 3.00 | | (3.15 | ) |
Total from Investment Operations | | 1.36 | | 2.45 | | 1.70 | | 3.04 | | 3.17 | | (3.01 | ) |
Distributions from and/or in Excess of: | | | | | | | | | | | | | |
Net Investment Income | | (0.21 | ) | (0.35 | ) | (0.25 | ) | (0.23 | ) | (0.17 | ) | (0.14 | ) |
Net Realized Gain | | (1.79 | ) | (1.32 | ) | — | | — | | — | | — | |
Total Distributions | | (2.00 | ) | (1.67 | ) | (0.25 | ) | (0.23 | ) | (0.17 | ) | (0.14 | ) |
Redemption Fees | | 0.00 | †† | 0.00 | †† | — | | — | | — | | — | |
Net Asset Value, End of Period | | $ | 18.05 | | $ | 18.69 | | $ | 17.91 | | $ | 16.46 | | $ | 13.65 | | $ | 10.65 | |
Total Return | | 7.41 | %‡ | 14.48 | % | 10.38 | % | 22.37 | % | 30.06 | % | (22.06 | )% |
Ratios and Supplemental Data: | | | | | | | | | | | | | |
Net Assets, End of Period (Thousands) | | $ | 79,262 | | $ | 66,334 | | $ | 58,236 | | $ | 38,742 | | $ | 26,169 | | $ | 19,440 | |
Ratio of Expenses to Average Net Assets | | 0.80 | %* | 0.80 | % | 0.75 | % | 0.78 | % | 0.78 | % | 0.79 | % |
Ratio of Net Investment Income (Loss) to Average Net Assets | | 1.74 | %* | 1.92 | % | 1.73 | % | 1.60 | % | 1.42 | % | 0.94 | % |
Portfolio Turnover Rate | | 19 | %‡ | 26 | % | 38 | % | 95 | % | 65 | % | 42 | % |
† Per share amount is based on average shares outstanding.
†† Amount is less than $0.005 per share.
‡ Not Annualized
* Annualized
The accompanying notes are an integral part of the financial statements.
112
2007 Semi-Annual Report | |
| | |
March 31, 2007 | |
| | |
Financial Highlights
Value Portfolio
| | Adviser Class | |
| | Six Months Ended | | Year Ended September 30, | |
Selected Per Share Data and Ratios | | March 31, 2007 | | 2006 | | 2005 | | 2004 | | 2003 | | 2002 | |
| | (unaudited) | | | | | | | | | | | |
Net Asset Value, Beginning of Period | | $ | 18.64 | | $ | 17.86 | | $ | 16.42 | | $ | 13.62 | | $ | 10.63 | | $ | 13.78 | |
Income (Loss) from Investment Operations | | | | | | | | | | | | | |
Net Investment Income (Loss)† | | 0.15 | | 0.33 | | 0.29 | | 0.23 | | 0.16 | | 0.12 | |
Net Realized and Unrealized Gain (Loss) on Investments | | 1.20 | | 2.10 | | 1.38 | | 2.79 | | 2.99 | | (3.14 | ) |
Total from Investment Operations | | 1.35 | | 2.43 | | 1.67 | | 3.02 | | 3.15 | | (3.02 | ) |
Distributions from and/or in Excess of: | | | | | | | | | | | | | |
Net Investment Income | | (0.20 | ) | (0.33 | ) | (0.23 | ) | (0.22 | ) | (0.16 | ) | (0.13 | ) |
Net Realized Gain | | (1.79 | ) | (1.32 | ) | — | | — | | — | | — | |
Total Distributions | | (1.99 | ) | (1.65 | ) | (0.23 | ) | (0.22 | ) | (0.16 | ) | (0.13 | ) |
Redemption Fees | | 0.00 | †† | 0.00 | †† | — | | — | | — | | — | |
Net Asset Value, End of Period | | $ | 18.00 | | $ | 18.64 | | $ | 17.86 | | $ | 16.42 | | $ | 13.62 | | $ | 10.63 | |
Total Return | | 7.31 | %‡ | 14.38 | % | 10.24 | % | 22.28 | % | 29.87 | % | (22.17 | )% |
Ratios and Supplemental Data: | | | | | | | | | | | | | |
Net Assets, End of Period (Thousands) | | $ | 209,670 | | $ | 187,718 | | $ | 1,113,274 | | $ | 943,182 | | $ | 622,230 | | $ | 534,668 | |
Ratio of Expenses to Average Net Assets | | 0.90 | %* | 0.87 | % | 0.85 | % | 0.88 | % | 0.88 | % | 0.89 | % |
Ratio of Net Investment Income (Loss) to Average Net Assets | | 1.65 | %* | 1.84 | % | 1.63 | % | 1.50 | % | 1.32 | % | 0.84 | % |
Portfolio Turnover Rate | | 19 | %‡ | 26 | % | 38 | % | 95 | % | 65 | % | 42 | % |
| | | | | | | | | | | | | | | | | | | | |
† Per share amount is based on average shares outstanding.
†† Amount is less than $0.005 per share.
‡ Not Annualized
* Annualized
The accompanying notes are an integral part of the financial statements.
113
2007 Semi-Annual Report | | |
| | |
March 31, 2007 | | |
Financial Highlights
Core Fixed Income Portfolio
| | Institutional Class | |
| | Six Months Ended | | Year Ended September 30, | |
Selected Per Share Data and Ratios | | March 31, 2007 | | 2006 | | 2005 | | 2004 | | 2003 | | 2002 | |
| | (unaudited) | | | | | | | | | | | |
Net Asset Value, Beginning of Period | | $ | 10.80 | | $ | 11.09 | | $ | 11.26 | | $ | 11.26 | | $ | 11.46 | | $ | 11.15 | |
Income (Loss) from Investment Operations | | | | | | | | | | | | | |
Net Investment Income† | | 0.24 | | 0.40 | | 0.40 | | 0.33 | | 0.32 | | 0.44 | |
Net Realized and Unrealized Gain (Loss) on Investments | | 0.02 | | 0.00 | †† | 0.07 | | 0.14 | | 0.19 | | 0.42 | |
Total from Investment Operations | | 0.26 | | 0.40 | | 0.47 | | 0.47 | | 0.51 | | 0.86 | |
Distributions from and/or in excess of: | | | | | | | | | | | | | |
Net Investment Income | | (0.28 | ) | (0.57 | ) | (0.45 | ) | (0.47 | ) | (0.51 | ) | (0.55 | ) |
Net Realized Gain | | — | | (0.12 | ) | (0.19 | ) | — | | (0.20 | ) | — | |
Total Distributions | | (0.28 | ) | (0.69 | ) | (0.64 | ) | (0.47 | ) | (0.71 | ) | (0.55 | ) |
Redemption Fees | | 0.00 | †† | 0.00 | †† | —. | | — | | — | | — | |
Net Asset Value, End of Period | | $ | 10.78 | | $ | 10.80 | | $ | 11.09 | | $ | 11.26 | | $ | 11.26 | | $ | 11.46 | |
Total Return | | 2.51 | %‡ | 3.79 | % | 4.35 | % | 4.33 | % | 4.61 | % | 7.98 | % |
Ratios and Supplemental Data: | | | | | | | | | | | | | |
Net Assets, End of Period (Thousands) | | $ | 303,098 | | $ | 299,997 | | $ | 220,350 | | $ | 226,555 | | $ | 320,036 | | $ | 310,546 | |
Ratio of Expenses to Average Net Assets (1) | | 0.50 | %* | 0.50 | % | 0.50 | % | 0.50 | % | 0.50 | % | 0.50 | % |
Ratio of Net Investment Income to Average Net Assets (1) | | 4.48 | %* | 3.71 | % | 3.62 | % | 2.94 | % | 2.82 | % | 3.89 | % |
Portfolio Turnover Rate^ | | 48 | %‡ | 139 | % | 236 | % | 371 | % | 109 | % | 86 | % |
(1) Supplemental Information on the Ratios to Average Net Assets: | | | | | | | | | | | | | |
Ratios Before Expenses Waived/Reimbursed by Adviser: | | | | | | | | | | | | | |
Expenses to Average Net Assets | | 0.56 | %* | 0.56 | % | 0.53 | % | 0.52 | % | 0.51 | % | 0.53 | % |
Net Investment Income to Average Net Assets | | 4.42 | %* | 3.65 | % | 3.59 | % | 2.92 | % | 2.81 | % | 3.86 | % |
† Per share amount is based on average shares outstanding.
†† Amount is less than $0.005 per share.
‡ Not Annualized
* Annualized
^ The Portfolio’s turnover rate is calculated by dividing the lesser of purchases and sales of securities for a fiscal year by the average monthly value of portfolio securities during such fiscal year. The turnover rate may vary greatly from year to year as well as within a year. The Portfolio turnover rate reflects mortgage pool forward commitments as purchases and sales, which was not the case prior to the year ended September 30, 2004. The inclusion of such securities caused the reported turnover rate to be higher during the period than in previous fiscal years.
The accompanying notes are an integral part of the financial statements.
114
2007 Semi-Annual Report | |
| | |
March 31, 2007 | |
| | |
Financial Highlights
Core Fixed Income Portfolio
| | Adviser Class | |
| | Six Months Ended | | Year Ended September 30, | |
Selected Per Share Data and Ratios | | March 31, 2007 | | 2006 | | 2005 | | 2004 | | 2003 | | 2002 | |
| | (unaudited) | | | | | | | | | | | |
Net Asset Value, Beginning of Period | | $ | 10.74 | | $ | 11.03 | | $ | 11.21 | | $ | 11.22 | | $ | 11.42 | | $ | 11.10 | |
Income (Loss) from Investment Operations | | | | | | | | | | | | | |
Net Investment Income† | | 0.23 | | 0.37 | | 0.37 | | 0.30 | | 0.29 | | 0.41 | |
Net Realized and Unrealized Gain (Loss) on Investments | | 0.01 | | 0.01 | | 0.06 | | 0.14 | | 0.19 | | 0.43 | |
Total from Investment Operations | | 0.24 | | 0.38 | | 0.43 | | 0.44 | | 0.48 | | 0.84 | |
Distributions from and/or in excess of: | | | | | | | | | | | | | |
Net Investment Income | | (0.26 | ) | (0.55 | ) | (0.42 | ) | (0.45 | ) | (0.48 | ) | (0.52 | ) |
Net Realized Gain | | — | | (0.12 | ) | (0.19 | ) | 0.00 | | (0.20 | ) | — | |
Total Distributions | | (0.26 | ) | (0.67 | ) | (0.61 | ) | (0.45 | ) | (0.68 | ) | (0.52 | ) |
Redemption Fees | | 0.00 | †† | 0.00 | †† | — | | — | | — | | — | |
Net Asset Value, End of Period | | $ | 10.72 | | $ | 10.74 | | $ | 11.03 | | $ | 11.21 | | $ | 11.22 | | $ | 11.42 | |
Total Return | | 2.31 | %‡ | 3.55 | % | 4.01 | % | 4.12 | % | 4.28 | % | 7.85 | % |
Ratios and Supplemental Data: | | | | | | | | | | | | | |
Net Assets, End of Period (Thousands) | | $ | 10,638 | | $ | 9,812 | | $ | 9,954 | | $ | 9,564 | | $ | 10,585 | | $ | 9,054 | |
Ratio of Expenses to Average Net Assets (1) | | 0.75 | %* | 0.75 | % | 0.75 | % | 0.75 | % | 0.75 | % | 0.75 | % |
Ratio of Net Investment Income to Average Net Assets (1) | | 4.24 | %* | 3.43 | % | 3.37 | % | 2.69 | % | 2.57 | % | 3.64 | % |
Portfolio Turnover Rate^ | | 48 | %‡ | 139 | % | 236 | % | 371 | % | 109 | % | 86 | % |
(1) Supplemental Information on the Ratios to Average Net Assets: | | | | | | | | | | | | | |
Ratios Before Expenses Waived/Reimbursed by Adviser: | | | | | | | | | | | | | |
Expenses to Average Net Assets | | 0.81 | %* | 0.81 | % | 0.78 | % | 0.77 | % | 0.76 | % | 0.78 | % |
Net Investment Income to Average Net Assets | | 4.18 | %* | 3.37 | % | 3.34 | % | 2.67 | % | 2.56 | % | 3.61 | % |
† Per share amount is based on average shares outstanding.
†† Amount is less than $0.005 per share.
‡ Not Annualized
* Annualized
^ The Portfolio’s turnover rate is calculated by dividing the lesser of purchases and sales of securities for a fiscal year by the average monthly value of portfolio for securities during such fiscal year. The turnover rate may vary greatly from year to year as well as within a year. The Portfolio turnover rate reflects mortgage pool forward commitments as purchases and sales, which was not the case prior to the year ended September 30, 2004. The inclusion of such securities caused the reported turnover rate to be higher during the period than in previous fiscal years.
The accompanying notes are an integral part of the financial statements.
115
2007 Semi-Annual Report | |
| |
March 31, 2007 | |
Financial Highlights
Core Plus Fixed Income Portfolio
| | Institutional Class | |
| | Six Months Ended | | Year Ended September 30, | |
| | March 31, 2007 | | 2006 | | 2005 | | 2004 | | 2003 | | 2002 | |
Selected Per Share Data and Ratios | | (unaudited) | | | | | | | | | | | |
Net Asset Value, Beginning of Period | | $ | 11.52 | | $ | 11.69 | | $ | 11.69 | | $ | 11.71 | | $ | 11.82 | | $ | 11.84 | |
Income (Loss) from Investment Operations | | | | | | | | | | | | | |
Net Investment Income† | | 0.27 | | 0.48 | | 0.47 | | 0.38 | | 0.40 | | 0.55 | |
Net Realized and Unrealized Gain (Loss) onInvestments | | 0.05 | | (0.02 | ) | 0.08 | | 0.17 | | 0.31 | | 0.17 | |
Total from Investment Operations | | 0.32 | | 0.46 | | 0.55 | | 0.55 | | 0.71 | | 0.72 | |
Distributions from and/or in Excess of: | | | | | | | | | | | | | |
Net Investment Income | | (0.37 | ) | (0.63 | ) | (0.55 | ) | (0.57 | ) | (0.67 | ) | (0.74 | ) |
Net Realized Gain | | — | | — | | — | | — | | (0.15 | ) | — | |
Total Distributions | | (0.37 | ) | (0.63 | ) | (0.55 | ) | (0.57 | ) | (0.82 | ) | (0.74 | ) |
Redemption Fees | | 0.00 | †† | 0.00 | †† | — | | — | | — | | — | |
Net Asset Value, End of Period | | $ | 11.47 | | $ | 11.52 | | $ | 11.69 | | $ | 11.69 | | $ | 11.71 | | $ | 11.82 | |
Total Return | | 2.83 | %‡ | 4.13 | % | 4.84 | % | 4.80 | % | 6.24 | % | 6.30 | % |
Ratios and Supplemental Data: | | | | | | | | | | | | | |
Net Assets, End of Period (Thousands) | | $ | 2,435,542 | | $ | 2,314,052 | | $ | 2,102,609 | | $ | 2,120,149 | | $ | 2,600,453 | | $ | 3,883,346 | |
Ratio of Expenses to Average Net Assets | | 0.45 | %* | 0.44 | % | 0.45 | % | 0.50 | % | 0.50 | % | 0.50 | % |
Ratio of Net Investment Income to Average Net Assets | | 4.74 | %* | 4.24 | % | 4.04 | % | 3.29 | % | 3.39 | % | 4.69 | % |
Portfolio Turnover Rate^ | | 69 | %‡ | 142 | % | 180 | % | 334 | % | 92 | % | 110 | % |
| | Investment Class | |
| | Six Months Ended | | Year Ended September 30, | |
| | March 31, 2007 | | 2006 | | 2005 | | 2004 | | 2003 | | 2002 | |
Selected Per Share Data and Ratios | | (unaudited) | | | | | | | | | | | |
Net Asset Value, Beginning of Period | | $ | 11.52 | | $ | 11.68 | | $ | 11.69 | | $ | 11.71 | | $ | 11.81 | | $ | 11.84 | |
Income (Loss) from Investment Operations | | | | | | | | | | | | | |
Net Investment Income† | | 0.26 | | 0.45 | | 0.45 | | 0.36 | | 0.37 | | 0.53 | |
Net Realized and Unrealized Gain (Loss) on Investments | | 0.04 | | (0.00 | )†† | 0.07 | | 0.17 | | 0.33 | | 0.16 | |
Total from Investment Operations | | 0.30 | | 0.45 | | 0.52 | | 0.53 | | 0.70 | | 0.69 | |
Distributions from and/or in Excess of: | | | | | | | | | | | | | |
Net Investment Income | | (0.36 | ) | (0.61 | ) | (0.53 | ) | (0.55 | ) | (0.65 | ) | (0.72 | ) |
Net Realized Gain | | — | | — | | — | | — | | (0.15 | ) | — | |
Total Distributions | | (0.36 | ) | (0.61 | ) | (0.53 | ) | (0.55 | ) | (0.80 | ) | (0.72 | ) |
Redemption Fees | | 0.00 | †† | 0.00 | †† | — | | — | | — | | — | |
Net Asset Value, End of Period | | $ | 11.46 | | $ | 11.52 | | $ | 11.68 | | $ | 11.69 | | $ | 11.71 | | $ | 11.81 | |
Total Return | | 2.76 | %‡ | 4.04 | % | 4.61 | % | 4.73 | % | 6.07 | % | 6.08 | % |
Ratios and Supplemental Data: | | | | | | | | | | | | | |
Net Assets, End of Period (Thousands) | | $ | 141,140 | | $ | 142,990 | | $ | 310,592 | | $ | 146,146 | | $ | 114,509 | | $ | 83,308 | |
Ratio of Expenses to Average Net Assets | | 0.60 | %* | 0.59 | % | 0.60 | % | 0.65 | % | 0.65 | % | 0.65 | % |
Ratio of Net Investment Income to Average Net Assets | | 4.64 | %* | 3.96 | % | 3.89 | % | 3.14 | % | 3.24 | % | 4.54 | % |
Portfolio Turnover Rate^ | | 69 | %‡ | 142 | % | 180 | % | 334 | % | 92 | % | 110 | % |
† | | Per share amount is based on average shares outstanding. |
†† | | Amount is less than $0.005 per share. |
‡ | | Not Annualized |
* | | Annualized |
^ | | The Portfolio’s turnover rate is calculated by dividing the lesser of purchases and sales of securities for a fiscal year by the average monthly value of portfolio securities during such fiscal year. The turnover rate may vary greatly from year to year as well as within a year. The Portfolio turnover rate reflects mortgage pool forward commitments as purchases and sales, which was not the case prior to the year ended September 30, 2004. The inclusion of such securities caused the reported turnover rate to be higher during the period than in previous fiscal years. |
The accompanying notes are an integral part of the financial statements.
116
2007 Semi-Annual Report | |
| |
March 31, 2007 | |
Financial Highlights
Core Plus Fixed Income Portfolio
| | Adviser Class | |
| | Six Months Ended | | Year Ended September 30, | |
| | March 31, 2007 | | 2006 | | 2005 | | 2004 | | 2003 | | 2002 | |
Selected Per Share Data and Ratios | | (unaudited) | | | | | | | | | | | |
Net Asset Value, Beginning of Period | | $ | 11.50 | | $ | 11.67 | | $ | 11.68 | | $ | 11.70 | | $ | 11.81 | | $ | 11.83 | |
Income (Loss) from Investment Operations | | | | | | | | | | | | | |
Net Investment Income† | | 0.25 | | 0.46 | | 0.44 | | 0.35 | | 0.36 | | 0.52 | |
Net Realized and Unrealized Gain (Loss) on Investments | | 0.05 | | (0.03 | ) | 0.07 | | 0.17 | | 0.32 | | 0.15 | |
Total from Investment Operations | | 0.30 | | 0.43 | | 0.51 | | 0.52 | | 0.68 | | 0.67 | |
Distributions from and/or in Excess of: | | | | | | | | | | | | | |
Net Investment Income | | (0.35 | ) | (0.60 | ) | (0.52 | ) | (0.54 | ) | (0.64 | ) | (0.69 | ) |
Net Realized Gain | | — | | — | | — | | — | | (0.15 | ) | — | |
Total Distributions | | (0.35 | ) | (0.60 | ) | (0.52 | ) | (0.54 | ) | (0.79 | ) | (0.69 | ) |
Redemption Fees | | 0.00 | †† | 0.00 | †† | — | | — | | — | | — | |
Net Asset Value, End of Period | | $ | 11.45 | | $ | 11.50 | | $ | 11.67 | | $ | 11.68 | | $ | 11.70 | | $ | 11.81 | |
Total Return | | 2.62 | %‡ | 3.97 | % | 4.49 | % | 4.57 | % | 5.99 | % | 6.01 | % |
Ratios and Supplemental Data: | | | | | | | | | | | | | |
Net Assets, End of Period (Thousands) | | $ | 127,972 | | $ | 126,683 | | $ | 112,716 | | $ | 114,841 | | $ | 211,260 | | $ | 200,034 | |
Ratio of Expenses to Average Net Assets | | 0.70 | %* | 0.69 | % | 0.70 | % | 0.75 | % | 0.75 | % | 0.75 | % |
Ratio of Net Investment Income to Average Net Assets | | 4.49 | %* | 4.00 | % | 3.79 | % | 3.04 | % | 3.14 | % | 4.44 | % |
Portfolio Turnover Rate^ | | 69 | %‡ | 142 | % | 180 | % | 334 | % | 92 | % | 110 | % |
† | | Per share amount is based on average shares outstanding. |
†† | | Amount is less than $0.005 per share. |
‡ | | Not Annualized |
* | | Annualized |
^ | | The Portfolio’s turnover rate is calculated by dividing the lesser of purchases and sales of securities for a fiscal year by the average monthly value of portfolio securities during such fiscal year. The turnover rate may vary greatly from year to year as well as within a year. The Portfolio turnover rate reflects mortgage pool forward commitments as purchases and sales, which was not the case prior to the year ended September 30, 2004. The inclusion of such securities caused the reported turnover rate to be higher during the period than in previous fiscal years. |
The accompanying notes are an integral part of the financial statements.
117
2007 Semi-Annual Report |
|
March 31, 2007 |
Financial Highlights
High Yield Portfolio
| | Institutional Class^ | |
| | Six Months Ended | | Year Ended September 30, | |
| | March 31, 2007 | | 2006 | | 2005 | | 2004 | | 2003 | | 2002 | |
Selected Per Share Data and Ratios | | (unaudited) | | | | | | | | | | | |
Net Asset Value, Beginning of Period | | $ | 10.60 | | $ | 10.80 | | $ | 11.18 | | $ | 10.60 | | $ | 8.82 | | $ | 11.50 | |
Income (Loss) from Investment Operations | | | | | | | | | | | | | |
Net Investment Income† | | 0.39 | | 0.76 | | 0.80 | | 0.84 | | 0.86 | | 1.08 | |
Net Realized and Unrealized Gain (Loss) on Investments | | 0.13 | | (0.16 | ) | (0.30 | ) | 0.40 | | 1.54 | | (2.32 | ) |
Total from Investment Operations | | 0.52 | | 0.60 | | 0.50 | | 1.24 | | 2.40 | | (1.24 | ) |
Distributions from and/or in Excess of: | | | | | | | | | | | | | |
Net Investment Income | | (0.36 | ) | (0.80 | ) | (0.88 | ) | (0.66 | ) | (0.62 | ) | (1.44 | ) |
Redemption Fees | | 0.00 | †† | 0.00 | †† | — | | — | | — | | — | |
Net Asset Value, End of Period | | $ | 10.76 | | $ | 10.60 | | $ | 10.80 | | $ | 11.18 | | $ | 10.60 | | $ | 8.82 | |
Total Return | | 5.76 | %‡ | 6.03 | % | 4.63 | % | 12.11 | % | 28.68 | % | (12.33 | )% |
Ratios and Supplemental Data: | | | | | | | | | | | | | |
Net Assets, End of Period (Thousands) | | $ | 206,406 | | $ | 226,162 | | $ | 195,880 | | $ | 314,440 | | $ | 330,990 | | $ | 366,956 | |
Ratio of Expenses to Average Net Assets | | 0.71 | %* | 0.61 | % | 0.62 | % | 0.61 | % | 0.61 | % | 0.59 | % |
Ratio of Net Investment Income to Average Net Assets | | 7.27 | %* | 7.23 | % | 7.37 | % | 7.70 | % | 9.05 | % | 10.13 | % |
Portfolio Turnover Rate | | 22 | %‡ | 58 | % | 55 | % | 89 | % | 97 | % | 79 | % |
| | Investment Class^ | |
| | Six Months Ended | | Year Ended September 30, | |
| | March 31, 2007** | | 2006 | | 2005 | | 2004 | | 2003 | | 2002 | |
Selected Per Share Data and Ratios | | (unaudited) | | | | | | | | | | | |
Net Asset Value, Beginning of Period | | $ | 10.84 | | $ | 10.90 | | $ | 11.24 | | $ | 10.62 | | $ | 8.82 | | $ | 11.50 | |
Income (Loss) from Investment Operations | | | | | | | | | | | | | |
Net Investment Income† | | 0.00 | †† | 0.76 | | 0.80 | | 0.82 | | 0.90 | | 1.06 | |
Net Realized and Unrealized Gain (Loss) on Investments | | 0.00 | †† | (0.16 | ) | (0.32 | ) | 0.42 | | 1.52 | | (2.32 | ) |
Total from Investment Operations | | 0.00 | †† | 0.60 | | 0.48 | | 1.24 | | 2.42 | | (1.26 | ) |
Distributions from and/or in Excess of: | | | | | | | | | | | | | |
Net Investment Income | | — | | (0.66 | ) | (0.82 | ) | (0.62 | ) | (0.62 | ) | (1.42 | ) |
Redemption Fees | | 0.00 | †† | 0.00 | †† | — | | — | | — | | — | |
Net Asset Value, End of Period | | $ | 10.84 | | $ | 10.84 | | $ | 10.90 | | $ | 11.24 | | $ | 10.62 | | $ | 8.82 | |
Total Return | | 0.00 | %‡ | 5.92 | % | 4.43 | % | 12.07 | % | 28.69 | % | (12.54 | )% |
Ratios and Supplemental Data: | | | | | | | | | | | | | |
Net Assets, End of Period (Thousands) | | $ | — | | $ | 896 | | $ | 1,192 | | $ | 1,129 | | $ | 1,329 | | $ | 6,890 | |
Ratio of Expenses to Average Net Assets | | 0.68 | %* | 0.76 | % | 0.77 | % | 0.76 | % | 0.76 | % | 0.74 | % |
Ratio of Net Investment Income to Average Net Assets | | 6.52 | %* | 7.10 | % | 7.20 | % | 7.55 | % | 8.90 | % | 9.98 | % |
Portfolio Turnover Rate | | 22 | %‡ | 58 | % | 55 | % | 89 | % | 97 | % | 79 | % |
† | | Per share amount is based on average shares outstanding. |
†† | | Amount is less than $0.005 per share. |
‡ | | Not Annualized |
* | | Annualized |
** | | On October 3, 2006, the Investment Class was fully liquidated, however, this Class is still active. |
^ | | On November 13, 2006, the Portfolio effected a reverse stock split as described in the Notes to Financial Statements. Per share data prior to this date has been restated to give effect to the reverse stock split. |
The accompanying notes are an integral part of the financial statements.
118
2007 Semi-Annual Report | |
| |
March 31, 2007 | |
Financial Highlights
High Yield Portfolio
| | Adviser Class^ | |
| | Six Months Ended | | Year Ended September 30, | |
| | March 31, 2007 | | 2006 | | 2005 | | 2004 | | 2003 | | 2002 | |
Selected Per Share Data and Ratios | | (unaudited) | | | | | | | | | | | |
Net Asset Value, Beginning of Period | | $ | 10.64 | | $ | 10.84 | | $ | 11.20 | | $ | 10.62 | | $ | 8.80 | | $ | 11.44 | |
Income (Loss) from Investment Operations | | | | | | | | | | | | | |
Net Investment Income† | | 0.38 | | 0.74 | | 0.78 | | 0.80 | | 0.84 | | 1.08 | |
Net Realized and Unrealized Gain (Loss) on Investments | | 0.13 | | (0.18 | ) | (0.28 | ) | 0.42 | | 1.56 | | (2.30 | ) |
Total from Investment Operations | | 0.51 | | 0.56 | | 0.50 | | 1.22 | | 2.40 | | (1.22 | ) |
Distributions from and/or in Excess of: | | | | | | | | | | | | | |
Net Investment Income | | (0.35 | ) | (0.76 | ) | (0.86 | ) | (0.64 | ) | (0.58 | ) | (1.42 | ) |
Redemption Fees | | 0.00 | †† | 0.00 | †† | — | | — | | — | | — | |
Net Asset Value, End of Period | | $ | 10.80 | | $ | 10.64 | | $ | 10.84 | | $ | 11.20 | | $ | 10.62 | | $ | 8.80 | |
Total Return | | 5.79 | %‡ | 5.51 | % | 4.52 | % | 11.86 | % | 28.54 | % | (12.24 | )% |
Ratios and Supplemental Data: | | | | | | | | | | | | | |
Net Assets, End of Period (Thousands) | | $ | 5,716 | | $ | 4,391 | | $ | 6,349 | | $ | 17,923 | | $ | 13,936 | | $ | 13,178 | |
Ratio of Expenses to Average Net Assets | | 0.96 | %* | 0.86 | % | 0.87 | % | 0.86 | % | 0.86 | % | 0.84 | % |
Ratio of Net Investment Income to Average Net Assets | | 7.04 | %* | 7.00 | % | 7.11 | % | 7.45 | % | 8.80 | % | 9.88 | % |
Portfolio Turnover Rate | | 22 | %‡ | 58 | % | 55 | % | 89 | % | 97 | % | 79 | % |
† | | Per share amount is based on average shares outstanding. |
†† | | Amount is less than $0.005 per share. |
‡ | | Not Annualized |
* | | Annualized |
^ | | On November 13, 2006, the Portfolio effected a reverse stock split as described in the Notes to Financial Statements. Per share data prior to this date has been restated to give effect to the reverse stock split. |
The accompanying notes are an integral part of the financial statements.
119
2007 Semi-Annual Report |
|
March 31, 2007 |
Financial Highlights
Intermediate Duration Portfolio
| | Institutional Class | |
| | Six Months Ended | | Year Ended September 30, | |
| | March 31, 2007 | | 2006 | | 2005 | | 2004 | | 2003 | | 2002 | |
Selected Per Share Data and Ratios | | (unaudited) | | | | | | | | | | | |
Net Asset Value, Beginning of Period | | $ | 10.17 | | $ | 10.22 | | $ | 10.40 | | $ | 10.49 | | $ | 10.71 | | $ | 10.37 | |
Income (Loss) from Investment Operations | | | | | | | | | | | | | |
Net Investment Income† | | 0.23 | | 0.42 | | 0.37 | | 0.32 | | 0.28 | | 0.39 | |
Net Realized and Unrealized Gain (Loss) on Investments | | 0.01 | | (0.08 | ) | (0.16 | ) | (0.01 | ) | 0.14 | | 0.43 | |
Total from Investment Operations | | 0.24 | | 0.34 | | 0.21 | | 0.31 | | 0.42 | | 0.82 | |
Distributions from and/or in Excess of: | | | | | | | | | | | | | |
Net Investment Income | | (0.30 | ) | (0.39 | ) | (0.36 | ) | (0.40 | ) | (0.36 | ) | (0.48 | ) |
Net Realized Gain | | — | | — | | (0.03 | ) | — | | (0.28 | ) | — | |
Total Distributions | | (0.30 | ) | (0.39 | ) | (0.39 | ) | (0.40 | ) | (0.64 | ) | (0.48 | ) |
Net Asset Value, End of Period | | $ | 10.11 | | $ | 10.17 | | $ | 10.22 | | $ | 10.40 | | $ | 10.49 | | $ | 10.71 | |
Total Return | | 2.50 | %‡ | 3.33 | % | 2.22 | % | 3.06 | % | 4.12 | % | 8.12 | % |
Ratios and Supplemental Data: | | | | | | | | | | | | | |
Net Assets, End of Period (Thousands) | | $ | 8,042 | | $ | 8,823 | | $ | 9,393 | | $ | 18,828 | | $ | 23,991 | | $ | 63,912 | |
Ratio of Expenses to Average Net Assets | | 0.56 | %* | 0.50 | % | 0.50 | % | 0.53 | % | 0.54 | % | 0.54 | % |
Ratio of Net Investment Income to Average Net Assets | | 4.60 | %* | 4.20 | % | 3.59 | % | 3.07 | % | 2.63 | % | 3.73 | % |
Portfolio Turnover Rate^ | | 55 | %‡ | 70 | % | 146 | % | 211 | % | 89 | % | 61 | % |
| | Institutional Class | |
| | Six Months Ended | | Year Ended September 30, | |
| | March 31, 2007 | | 2006 | | 2005 | | 2004 | | 2003 | | 2002 | |
Selected Per Share Data and Ratios | | (unaudited) | | | | | | | | | | | |
Net Asset Value, Beginning of Period | | $ | 10.13 | | $ | 10.19 | | $ | 10.37 | | $ | 10.46 | | $ | 10.68 | | $ | 10.35 | |
Income (Loss) from Investment Operations | | | | | | | | | | | | | |
Net Investment Income† | | 0.22 | | 0.39 | | 0.33 | | 0.30 | | 0.26 | | 0.37 | |
Net Realized and Unrealized Gain (Loss) on Investments | | 0.02 | | (0.07 | ) | (0.13 | ) | (0.01 | ) | 0.15 | | 0.43 | |
Total from Investment Operations | | 0.24 | | 0.32 | | 0.20 | | 0.29 | | 0.41 | | 0.80 | |
Distributions from and/or in Excess of: | | | | | | | | | | | | | |
Net Investment Income | | (0.29 | ) | (0.38 | ) | (0.35 | ) | (0.38 | ) | (0.35 | ) | (0.47 | ) |
Net Realized Gain | | — | | — | | (0.03 | ) | — | | (0.28 | ) | — | |
Total Distributions | | (0.29 | ) | (0.38 | ) | (0.38 | ) | (0.38 | ) | (0.63 | ) | (0.47 | ) |
Net Asset Value, End of Period | | $ | 10.08 | | $ | 10.13 | | $ | 10.19 | | $ | 10.37 | | $ | 10.46 | | $ | 10.68 | |
Total Return | | 2.44 | %‡ | 3.19 | % | 1.99 | % | 2.86 | % | 3.97 | % | 8.02 | % |
Ratios and Supplemental Data: | | | | | | | | | | | | | |
Net Assets, End of Period (Thousands) | | $ | 135,501 | | $ | 136,198 | | $ | 304,844 | | $ | 138,813 | | $ | 99,441 | | $ | 58,092 | |
Ratio of Expenses to Average Net Assets | | 0.71 | %* | 0.65 | % | 0.65 | % | 0.68 | % | 0.69 | % | 0.69 | % |
Ratio of Net Investment Income to Average Net Assets | | 4.47 | %* | 3.87 | % | 3.22 | % | 2.92 | % | 2.48 | % | 3.58 | % |
Portfolio Turnover Rate^ | | 55 | %‡ | 70 | % | 146 | % | 211 | % | 89 | % | 61 | % |
† | | Per share amount is based on average shares outstanding. |
‡ | | Not Annualized |
* | | Annualized |
^ | | The Portfolio’s turnover rate is calculated by dividing the lesser of purchases and sales of securities for a fiscal year by the average monthly value of portfolio securities during such fiscal year. The turnover rate may vary greatly from year to year as well as within a year. The Portfolio turnover rate reflects mortgage pool forward commitments as purchases and sales, which was not the case prior to the year ended September 30, 2004. The inclusion of such securities caused the reported turnover rate to be higher during the period than in previous fiscal years. |
The accompanying notes are an integral part of the financial statements.
120
2007 Semi-Annual Report | |
| |
March 31, 2007 | |
Financial Highlights
International Fixed Income Portfolio
| | Institutional Class | |
| | Six Months Ended | | Year Ended September 30, | |
| | March 31, 2007 | | 2006 | | 2005 | | 2004 | | 2003 | | 2002 | |
Selected Per Share Data and Ratios | | (unaudited) | | | | | | | | | | | |
Net Asset Value, Beginning of Period | | $ | 10.35 | | $ | 10.81 | | $ | 11.24 | | $ | 11.92 | | $ | 9.88 | | $ | 8.96 | |
Income (Loss) from Investment Operations | | | | | | | | | | | | | |
Net Investment Income | | 0.13† | | 0.21† | | 0.25† | | 0.28† | | 0.38† | | 0.39 | |
Net Realized and Unrealized Gain (Loss) on Investments | | 0.19 | | (0.11 | ) | 0.01 | | 0.63 | | 1.66 | | 0.53 | |
Total from Investment Operations | | 0.32 | | 0.10 | | 0.26 | | 0.91 | | 2.04 | | 0.92 | |
Distributions from and/or in Excess of: | | | | | | | | | | | | | |
Net Investment Income | | (0.22 | ) | (0.51 | ) | (0.69 | ) | (1.59 | ) | — | | — | |
Net Realized Gain | | (0.05 | ) | (0.05 | ) | — | | — | | — | | — | |
Total Distributions | | (0.27 | ) | (0.56 | ) | (0.69 | ) | (1.59 | ) | — | | — | |
Net Asset Value, End of Period | | $ | 10.40 | | $ | 10.35 | | $ | 10.81 | | $ | 11.24 | | $ | 11.92 | | $ | 9.88 | |
Total Return | | 3.21 | %‡ | 1.12 | % | 1.81 | % | 7.95 | % | 20.65 | % | 10.27 | % |
Ratios and Supplemental Data: | | | | | | | | | | | | | |
Net Assets, End of Period (Thousands) | | $ | 207,769 | | $ | 195,659 | | $ | 157,911 | | $ | 154,111 | | $ | 114,932 | | $ | 94,474 | |
Ratio of Expenses to Average Net Assets | | 0.63 | %* | 0.60 | % | 0.55 | % | 0.56 | % | 0.56 | % | 0.60 | % |
Ratio of Net Investment Income to Average Net Assets | | 2.44 | %* | 2.02 | % | 2.17 | % | 2.52 | % | 3.51 | % | 3.44 | % |
Portfolio Turnover Rate | | 27 | %‡ | 69 | % | 38 | % | 15 | % | 41 | % | 38 | % |
† | Per share amount is based on average shares outstanding. |
‡ | Not annualized |
* | Annualized |
The accompanying notes are an integral part of the financial statements.
121
2007 Semi-Annual Report
March 31, 2007
Financial Highlights
Investment Grade Fixed Income Portfolio
| | Institutional Class | |
| | Six Months Ended | | Year Ended September 30, | |
| �� | March 31, 2007 | | 2006 | | 2005 | | 2004 | | 2003 | | 2002 | |
Selected Per Share Data and Ratios | | (unaudited) | | | | | | | | | | | |
Net Asset Value, Beginning of Period | | $ | 11.22 | | $ | 11.42 | | $ | 11.57 | | $ | 11.54 | | $ | 11.57 | | $ | 11.32 | |
Income (Loss) from Investment Operations | | | | | | | | | | | | | |
Net Investment Income† | | 0.24 | | 0.41 | | 0.42 | | 0.34 | | 0.34 | | 0.47 | |
Net Realized and Unrealized Gain (Loss) on Investments | | 0.04 | | (0.00 | )†† | 0.06 | | 0.14 | | 0.23 | | 0.39 | |
Total from Investment Operations | | 0.28 | | 0.41 | | 0.48 | | 0.48 | | 0.57 | | 0.86 | |
Distributions from and/or in Excess of: | | | | | | | | | | | | | |
Net Investment Income | | (0.36 | ) | (0.56 | ) | (0.49 | ) | (0.45 | ) | (0.55 | ) | (0.61 | ) |
Net Realized Gain | | — | | (0.05 | ) | (0.14 | ) | — | | (0.05 | ) | — | |
Total Distributions | | (0.36 | ) | (0.61 | ) | (0.63 | ) | (0.45 | ) | (0.60 | ) | (0.61 | ) |
Redemption Fees | | 0.00 | †† | 0.00 | †† | — | | — | | — | | — | |
Net Asset Value, End of Period | | $ | 11.14 | | $ | 11.22 | | $ | 11.42 | | $ | 11.57 | | $ | 11.54 | | $ | 11.57 | |
Total Return | | 2.55 | %‡ | 3.65 | % | 4.39 | % | 4.36 | % | 4.36 | % | 7.93 | % |
Ratios and Supplemental Data: | | | | | | | | | | | | | |
Net Assets, End of Period (Thousands) | | $ | 516,889 | | $ | 525,680 | | $ | 499,534 | | $ | 527,837 | | $ | 569,593 | | $ | 556,252 | |
Ratio of Expenses to Average Net Assets | | 0.51 | %* | 0.50 | % | 0.50 | % | 0.50 | % | 0.51 | % | 0.51 | % |
Ratio of Net Investment Income to Average Net Assets | | 4.41 | %* | 3.66 | % | 3.67 | % | 2.94 | % | 2.96 | % | 4.15 | % |
Portfolio Turnover Rate^ | | 51 | %‡ | 154 | % | 240 | % | 332 | % | 81 | % | 93 | % |
| | Adviser Class | |
| | | | | | | | | | | | May 20, | |
| | Six Months Ended | | | | | | | | | | 2002** to | |
| | March 31, 2007 | | Year Ended September 30, | | September | |
Selected Per Share Data and Ratios | | (unaudited) | | 2006 | | 2005 | | 2004 | | 2003 | | 30, 2002 | |
Net Asset Value, Beginning of Period | | $ | 11.21 | | $ | 11.42 | | $ | 11.56 | | $ | 11.53 | | $ | 11.57 | | $ | 11.18 | |
Income (Loss) from Investment Operations | | | | | | | | | | | | | |
Net Investment Income† | | 0.24 | | 0.39 | | 0.41 | | 0.32 | | 0.32 | | 0.34 | |
Net Realized and Unrealized Gain (Loss) on Investments | | 0.03 | | (0.01 | ) | 0.06 | | 0.14 | | 0.22 | | 0.15 | |
Total from Investment Operations | | 0.27 | | 0.38 | | 0.47 | | 0.46 | | 0.54 | | 0.49 | |
Distributions from and/or in Excess of: | | | | | | | | | | | | | |
Net Investment Income | | (0.35 | ) | (0.54 | ) | (0.47 | ) | (0.43 | ) | (0.53 | ) | (0.10 | ) |
Net Realized Gain | | — | | (0.05 | ) | (0.14 | ) | — | | (0.05 | ) | — | |
Total Distributions | | (0.35 | ) | (0.59 | ) | (0.61 | ) | (0.43 | ) | (0.58 | ) | (0.10 | ) |
Redemption Fees | | 0.00 | †† | 0.00 | †† | — | | — | | — | | — | |
Net Asset Value, End of Period | | $ | 11.13 | | $ | 11.21 | | $ | 11.42 | | $ | 11.56 | | $ | 11.53 | | $ | 11.57 | |
Total Return | | 2.38 | ‡% | 3.59 | % | 4.23. | % | 4.10 | % | 4.87 | % | 4.40 | %‡ |
Ratios and Supplemental Data: | | | | | | | | | | | | | |
Net Assets, End of Period (Thousands) | | $ | 691 | | $ | 778 | | $ | 1,190 | | $ | 1,400 | | $ | 1,581 | | $ | 1,714 | |
Ratio of Expenses to Average Net Assets (1) | | 0.66 | %* | 0.65 | % | 0.65 | % | 0.65 | % | 0.66 | % | 0.66 | %* |
Ratio of Net Investment Income to Average Net Assets (1) | | 4.28 | %* | 3.46 | % | 3.55 | % | 2.79 | % | 2.81 | % | 4.00 | %* |
Portfolio Turnover Rate^ | | 51 | ‡% | 154 | % | 240 | % | 332 | % | 81 | % | 93 | % |
(1) Supplemental Information on the Ratios to Average Net Assets: | |
Ratios Before Expenses Waived/Reimbursed by Distributor: | | | | | | | | | | | | | |
Expenses to Average Net Assets | | 0.76 | %* | 0.75 | % | 0.75 | % | 0.75 | % | 0.76 | % | 0.76 | %* |
Net Investment Income to Average Net Assets | | 4.18 | %* | 3.36 | % | 3.45 | % | 2.69 | % | 2.71 | % | 3.90 | %* |
† | Per share amount is based on average shares outstanding. |
†† | Amount is less than $0.005 per share. |
‡ | Not annualized |
* | Annualized |
** | Initial offering of Adviser Class shares. |
^ | The Portfolio’s turnover rate is calculated by dividing the lesser of purchases and sales of securities for a fiscal year by the average monthly value of portfolio securities during such fiscal year. The turnover rate may vary greatly from year to year as well as within a year. The Portfolio turnover rate reflects mortgage pool forward commitments as purchases and sales, which was not the case prior to the year ended September 30, 2004. The inclusion of such securities caused the reported turnover rate to be higher during the period than in previous fiscal years. |
The accompanying notes are an integral part of the financial statements.
122
2007 Semi-Annual Report | |
| |
March 31, 2007 | |
Financial Highlights
Limited Duration Portfolio
| | Institutional Class | |
| | Six Months Ended | | Year Ended September 30, | |
| | March 31, 2007 | | 2006 | | 2005 | | 2004 | | 2003 | | 2002 | |
Selected Per Share Data and Ratios | | (unaudited) | | | | | | | | | | | |
Net Asset Value, Beginning of Period | | $ | 10.34 | | $ | 10.34 | | $ | 10.50 | | $ | 10.65 | | $ | 10.69 | | $ | 10.59 | |
Income (Loss) from Investment Operations | | | | | | | | | | | | | |
Net Investment Income | | 0.25 | † | 0.41 | † | 0.30 | † | 0.25 | † | 0.23 | † | 0.39 | |
Net Realized and Unrealized Gain (Loss) on Investments | | 0.01 | | (0.02 | ) | (0.15 | ) | (0.10 | ) | 0.05 | | 0.14 | |
Total from Investment Operations | | 0.26 | | 0.39 | | 0.15 | | 0.15 | | 0.28 | | 0.53 | |
Distributions from and/or in Excess of: | | | | | | | | | | | | | |
Net Investment Income | | (0.29 | ) | (0.39 | ) | (0.31 | ) | (0.28 | ) | (0.27 | ) | (0.43 | ) |
Net Realized Gain | | — | | — | | — | | (0.02 | ) | (0.05 | ) | — | |
Total Distributions | | (0.29 | ) | (0.39 | ) | (0.31 | ) | (0.30 | ) | (0.32 | ) | (0.43 | ) |
Net Asset Value, End of Period | | $ | 10.31 | | $ | 10.34 | | $ | 10.34 | | $ | 10.50 | | $ | 10.65 | | $ | 10.69 | |
Total Return | | 2.54 | ‡% | 3.88 | % | 1.44 | % | 1.47 | % | 2.65 | % | 5.13 | % |
Ratios and Supplemental Data: | | | | | | | | | | | | | |
Net Assets, End of Period (Thousands) | | $ | 1,063,426 | | $ | 1,077,967 | | $ | 1,069,956 | | $ | 957,367 | | $ | 622,801 | | $ | 429,937 | |
Ratio of Expenses to Average Net Assets | | 0.46 | %* | 0.42 | % | 0.42 | % | 0.42 | % | 0.43 | % | 0.44 | % |
Ratio of Net Investment Income to Average Net Assets | | 4.86 | %* | 3.96 | % | 2.92 | % | 2.36 | % | 2.17 | % | 3.45 | % |
Portfolio Turnover Rate^ | | 35 | %‡ | 64 | % | 66 | % | 135 | % | 68 | % | 72 | % |
† | Per share amount is based on average shares outstanding. |
‡ | Not Annualized |
* | Annualized |
^ | The Portfolio’s turnover rate is calculated by dividing the lesser of purchases and sales of securities for a fiscal year by the average monthly value of portfolio securities during such fiscal year. The turnover rate may vary greatly from year to year as well as within a year. The Portfolio turnover rate reflects mortgage pool forward commitments as purchases and sales, which was not the case prior to the year ended September 30, 2004. The inclusion of such securities caused the reported turnover rate to be higher during the period than in previous fiscal years. |
The accompanying notes are an integral part of the financial statements.
123
2007 Semi-Annual Report
March 31, 2007
Financial Highlights
Long Duration Fixed Income Portfolio
| | Institutional Class | |
| | Six Months | | Period From | |
| | Ended | | July 21, 2006^ | |
| | March 31, 2007 | | to September | |
Selected Per Share Data and Ratios | | (unaudited) | | 30, 2006 | |
Net Asset Value, Beginning of Period | | $ | 10.48 | | $ | 10.00 | |
Income (Loss) from Investment Operations | | | | | |
Net Investment Income (Loss)† | | 0.24 | | 0.09 | |
Net Realized and Unrealized Gain (Loss) on Investments | | (0.09 | ) | 0.39 | |
Total from Investment Operations | | 0.15 | | 0.48 | |
Distributions from and/or in excess of: | | | | | |
Net Investment Income | | (0.21 | ) | — | |
Net Realized Gain | | (0.03 | ) | — | |
Total Distributions | | (0.24 | ) | — | |
Net Asset Value, End of Period | | $ | 10.39 | | $ | 10.48 | |
Total Return | | 1.44 | %‡ | 4.80 | %‡ |
Ratios and Supplemental Data: | | | | | |
Net Assets, End of Period (Thousands) | | $ | 25,450 | | $ | 25,677 | |
Ratio of Expenses to Average Net Assets (1) | | 0.50 | %* | 0.50 | %* |
Ratio of Net Investment Income (Loss) to Average Net Assets (1) | | 4.60 | %* | 4.66 | %* |
Portfolio Turnover Rate | | 6 | %‡ | 7 | %‡ |
(1) Supplemental Information on the Ratios to Average Net Assets: | | | | | |
Ratio Before Expenses Waived/Reimbursed by Adviser: | | | | | |
Expenses to Average Net Assets | | 0.80 | %* | 1.52 | %* |
Net Investment Income (Loss) to Average Net Assets | | 4.30 | %* | 3.64 | %* |
| | Adviser Class | |
| | Six Months | | Period From | |
| | Ended | | July 21, 2006^ | |
| | March 31, 2007 | | to September | |
Selected Per Share Data and Ratios | | (unaudited) | | 30, 2006 | |
Net Asset Value, Beginning of Period | | $ | 10.48 | | $ | 10.00 | |
Income (Loss) from Investment Operations | | | | | |
Net Investment Income (Loss)† | | 0.23 | | 0.09 | |
Net Realized and Unrealized Gain (Loss) on Investments | | (0.10 | ) | 0.39 | |
Total from Investment Operations | | 0.13 | | 0.48 | |
Distributions from and/or in excess of: | | | | | |
Net Investment Income | | (0.20 | ) | — | |
Net Realized Gain | | (0.03 | ) | — | |
Total Distributions | | (0.23 | ) | — | |
Net Asset Value, End of Period | | $ | 10.38 | | $ | 10.48 | |
Total Return | | 1.23 | %‡ | 4.80 | %‡ |
Ratios and Supplemental Data: | | | | | |
Net Assets, End of Period (Thousands) | | $ | 519 | | $ | 524 | |
Ratio of Expenses to Average Net Assets (2) | | 0.75 | %* | 0.75 | %* |
Ratio of Net Investment Income (Loss) to Average Net Assets (2) | | 4.35 | %* | 4.40 | %* |
Portfolio Turnover Rate | | 6 | %‡ | 7 | %‡ |
(2) Supplemental Information on the Ratios to Average Net Assets: | | | | | |
Ratio Before Expenses Waived/Reimbursed by Adviser: | | | | | |
Expenses to Average Net Assets | | 1.05 | %* | 1.77 | %* |
Net Investment Income (Loss) to Average Net Assets | | 4.05 | %* | 3.39 | %* |
^ | Commencement of operations |
† | Per share amount is based on average shares outstanding. |
‡ | Not annualized |
* | Annualized |
The accompanying notes are an integral part of the financial statements.
124
2007 Semi-Annual Report | |
| |
March 31, 2007 | |
Financial Highlights
Municipal Portfolio
| | Institutional Class | |
| | Six Months Ended | | Year Ended September 30, | |
| | March 31, 2007 | | 2006 | | 2005 | | 2004 | | 2003 | | 2002 | |
Selected Per Share Data and Ratios | | (unaudited) | | | | | | | | | | | |
Net Asset Value, Beginning of Period | | $ | 12.86 | | $ | 12.66 | | $ | 12.66 | | $ | 12.53 | | $ | 12.49 | | $ | 12.14 | |
Income (Loss) from Investment Operations | | | | | | | | | | | | | |
Net Investment Income | | 0.23 | † | 0.39 | † | 0.40 | † | 0.38 | † | 0.50 | † | 0.47 | |
Net Realized and Unrealized Gain (Loss) on Investments | | 0.04 | | 0.29 | | 0.02 | | 0.14 | | (0.01 | ) | 0.39 | |
Total from Investment Operations | | 0.27 | | 0.68 | | 0.42 | | 0.52 | | 0.49 | | 0.86 | |
Distributions from and/or in Excess of: | | | | | | | | | | | | | |
Net Investment Income | | (0.25 | ) | (0.48 | ) | (0.42 | ) | (0.39 | ) | (0.45 | ) | (0.51 | ) |
Redemption Fees | | 0.00 | †† | 0.00 | †† | — | | — | | — | | — | |
Net Asset Value, End of Period | | $ | 12.88 | | $ | 12.86 | | $ | 12.66 | | $ | 12.66 | | $ | 12.53 | | $ | 12.49 | |
Total Return | | 2.14 | %‡ | 5.53 | % | 3.38 | % | 4.02 | % | 4.19 | % | 7.27 | % |
Ratios and Supplemental Data: | | | | | | | | | | | | | |
Net Assets, End of Period (Thousands) | | $ | 776,854 | | $ | 662,162 | | $ | 509,039 | | $ | 368,686 | | $ | 313,999 | | $ | 245,257 | |
Ratio of Expenses to Average Net Assets (1) | | 0.49 | %* | 0.49 | % | 0.50 | % | 0.50 | % | 0.50 | % | 0.50 | % |
Ratio of Net Investment Income to Average Net Assets (1) | | 3.56 | %* | 3.09 | % | 3.12 | % | 3.01 | % | 4.01 | % | 3.70 | % |
Portfolio Turnover Rate^ | | 14 | %‡ | 43 | % | 34 | % | 105 | % | 47 | % | 72 | % |
(1) Supplemental Information on the Ratios to Average Net Assets: | |
Ratios Before Expenses Waived/Reimbursed by Adviser: | | | | | | | | | | | | | |
Expenses to Average Net Assets | | N/A | | N/A | | N/A | | 0.51 | % | 0.51 | % | 0.52 | % |
Net Investment Income to Average Net Assets | | N/A | | N/A | | N/A | | 3.00 | % | 4.00 | % | 4.14 | % |
† | Per share amount is based on average shares outstanding. |
†† | Amount is less than $0.005 per share. |
‡ | Not Annualized |
* | Annualized |
^ | The Portfolio’s turnover rate is calculated by dividing the lesser of purchases and sales of securities for a fiscal year by the average monthly value of portfolio securities during such fiscal year. The turnover rate may vary greatly from year to year as well as within a year. The Portfolio turnover rate reflects mortgage pool forward commitments as purchases and sales, which was not the case prior to the September 30, 2004. The inclusion of such securities caused the reported turnover rate to be higher during the period than in previous fiscal years. |
The accompanying notes are an integral part of the financial statements.
125
2007 Semi-Annual Report |
| |
March 31, 2007 (unaudited) |
Notes to Financial Statements
Morgan Stanley Institutional Fund Trust (“MSIFT” or the “Fund”) is registered under the Investment Company Act of 1940, as amended (the “1940 Act”), as an open-end investment company. The Fund is comprised of eighteen active portfolios. The accompanying financial statements and financial highlights are those of the Balanced, Equities Plus, Mid Cap Growth, U.S. Mid Cap Value, U.S. Small Cap Value, Value, Core Fixed Income, Core Plus Fixed Income, High Yield, Intermediate Duration, International Fixed Income, Investment Grade Fixed Income, Limited Duration, Long Duration Fixed Income and Municipal Portfolios, all of which except the International Fixed Income Portfolio are considered diversified for purposes of the 1940 Act (each referred to as a “Portfolio”). The financial statements of the remaining portfolios of the Fund are presented separately.
The Fund offers up to three different classes of shares for certain Portfolios — Institutional Class shares, Investment Class shares and Adviser Class shares. Each class of shares has identical voting rights (except shareholders of each Class have exclusive voting rights regarding any matter relating solely to that particular Class of shares), dividend, liquidation and other rights, except each class bears different distribution or service fees as described in Note D.
A. Significant Accounting Policies. The following significant accounting policies are in conformity with U.S. generally accepted accounting principles. Such policies are consistently followed by the Fund in the preparation of the financial statements. U.S. generally accepted accounting principles may require management to make estimates and assumptions that affect the reported amounts and disclosures in the financial statements. Actual results may differ from those estimates.
1. Security Valuation: Bonds and other fixed income securities may be valued according to the broadest and most representative market. In addition, bonds and other fixed income securities may be valued on the basis of prices provided by a pricing service. The prices provided by a pricing service take into account broker dealer market price quotations for institutional size trading in similar groups of securities, security quality, maturity, coupon and other security characteristics as well as any developments related to the specific security. Debt securities purchased with remaining maturities of 60 days or less are valued at amortized cost, if it approximates market value. Equity securities listed on a U.S. exchange are valued at the latest quoted sales price on the valuation date. Equity securities listed or traded on NASDAQ, for which market quotations are available, are valued at the NASDAQ Official Closing Price. Securities listed on a foreign exchange are valued at their closing price, except as noted below. Unlisted and listed equity securities not traded on the valuation date, for which market quotations are readily available, are valued at the mean between the current bid and asked prices obtained from reputable brokers.
All other securities and investments for which market values are not readily available, including restricted securities, and those securities for which it is inappropriate to determine prices in accordance with the aforementioned procedures, are valued at fair value as determined in good faith under procedures adopted by the Board of Trustees (the “Trustees”), although the actual calculations may be done by others. Factors considered in making this determination may include, but are not limited to, information obtained by contacting the issuer, analysts, or the appropriate stock exchange (for exchange-traded securities), analysis of the issuer’s financial statements or other available documents and, if necessary, available information concerning other securities in similar circumstances.
Most foreign markets close before the New York Stock Exchange (NYSE). Occasionally, developments that could affect the closing prices of securities and other assets may occur between the times at which valuations of such securities are determined (that is, close of the foreign market on which the securities trade) and the close of business on the NYSE. If these developments are expected to materially affect the value of the securities, the valuations may be adjusted to reflect the estimated fair value as of the close of the NYSE, as determined in good faith under procedures established by the Trustees.
2. Repurchase Agreements: Each Portfolio may enter into repurchase agreements under which a Portfolio lends excess cash and takes possession of securities with an agreement that the counterparty will repurchase such securities. In connection with transactions in repurchase agreements, a bank as custodian for the Fund takes possession of the underlying securities which are held as collateral, with a market value at least equal to the amount of the repurchase transaction, including principal and accrued interest. To the extent that any repurchase transaction exceeds one business day, the value of the collateral is marked-to-market on a daily basis to determine the adequacy of the collateral. In the event of default on the obligation to repurchase, the Fund has the right to liquidate the collateral and apply the proceeds in satisfaction of the obligation. In the event of default or bankruptcy by the counterparty to the agreement, realization and/or retention of the collateral or proceeds may be subject to legal proceedings.
Pursuant to an exemptive order issued by the Securities and Exchange Commission, the Portfolios may transfer their uninvested cash balances into a joint trading account with other Portfolios of the Fund which invests in one or more repurchase agreements. Any such joint repurchase agreement
126
2007 Semi-Annual Report |
| |
March 31, 2007 (unaudited) |
Notes to Financial Statements (cont’d)
is covered by the same collateral requirements as discussed above.
3. Futures: Financial futures contracts (secured by cash and securities deposited with brokers as “initial margin”) are valued based upon their quoted daily settlement prices; changes in initial settlement value (represented by cash paid to or received from brokers as “variation margin”) are accounted for as unrealized appreciation (depreciation). When futures contracts are closed, the difference between the opening value at the date of purchase and the value at closing is recorded as realized gain or loss in the Statements of Operations. “Due from (to) Broker” includes initial margin and variation margin, as stated in the Statements of Assets & Liabilities. Futures contracts may be used by each Portfolio in order to hedge against unfavorable changes in the value of securities or to attempt to realize profits from the value of the related securities. Futures contracts involve market risk that may exceed the amounts recognized in the Statements of Assets & Liabilities. Risks arise from the possible movements in the prices of securities relating to these instruments. The change in value of futures contracts primarily corresponds with the value of their related securities, but may not precisely correlate with the change in value of such securities. In addition, there is the risk that a Portfolio may not be able to enter into a closing transaction because of an illiquid secondary market.
4. Securities Sold Short: Each Portfolio may sell securities short. A short sale is a transaction in which the Portfolio sells securities it may or may not own, but has borrowed, in anticipation of a decline in the market price of the securities. The Portfolio is obligated to replace the borrowed securities at their market price at the time of replacement. The Portfolio may have to pay a premium to borrow the securities as well as pay any dividends or interest payable on the securities until they are replaced. The Portfolio’s obligation to replace the securities borrowed in connection with a short sale will generally be secured by collateral deposited with the broker that consists of cash, U.S. government securities or other liquid high grade debt obligations. In addition, the Portfolio will either place in a segregated account with its custodian or denote on its custody records an amount of cash, U.S. government securities or other liquid high grade debt obligations equal to the difference, if any, between (1) the market value of the securities sold at the time they were sold short and (2) any cash, U.S. government securities or other liquid high grade debt obligations deposited as collateral with the broker in connection with the short sale (not including the proceeds of the short sale). Short sales by the Portfolios involve certain risks and special considerations. Possible losses from short sales differ from losses that could be incurred from a purchase of a security because losses from short sales may be unlimited, whereas losses from purchases cannot exceed the total amount invested.
5. Swap Agreements: Each Portfolio (other than the Mid Cap Growth Portfolio) may enter into swap agreements to exchange the interest rate on, or return generated by, one nominal instrument for the return generated by another nominal instrument. Cash collateral for swap agreements, if applicable, is deposited with the broker serving as counter-party to the agreement, and is included in “Due from (to) Broker” on the Statements of Assets & Liabilities. The following summarizes swaps entered into by the Portfolios:
Credit Default Swaps: Credit default swaps involve commitments to pay a fixed rate in exchange for payment if a credit event affecting a third party (the referenced company) occurs. Credit events may include a failure to pay interest, bankruptcy, or restructuring. The Portfolio accrues for interim payments on swap contracts on a daily basis, with the net amount recorded within unrealized appreciation (depreciation) of swap contracts on the Statements of Assets and Liabilities. Once interim payments are settled in cash, the net amount is recorded within realized gain (loss) on swaps on the Statements of Operations. Credit default swaps are marked-to-market daily based upon quotations from market makers and the change, if any, is recorded as unrealized appreciation or depreciation in the Statements of Operations.
Interest Rate Swaps: Interest rate swaps involve the exchange of commitments to pay and receive interest based on a notional principal amount. The Portfolio accrues for interim payments on swap contracts on a daily basis, with the net amount recorded within unrealized appreciation (depreciation) of swap contracts on the Statements of Assets and Liabilities. Once interim payments are settled in cash, the net amount is recorded within realized gain (loss) on swaps on the Statements of Operations. In a zero-coupon interest rate swap, payments only occur at maturity, at which time one counterparty pays the total compounded fixed rate over the life of the swap and the other pays the total compounded floating rate that would have been earned had a series of LIBOR investments been rolled over through the life of the swap. The Portfolio amortizes its interest payment obligation over the life of the swap. The amortized portion of this payment is recorded in the Statements of Operations as an adjustment to interest income. The monumentalized portion of this payment is included in “Due from (to) Broker” on the Statements of Assets and Liabilities. Interest rate swaps are marked-to-market daily based upon quotations from market makers
127
2007 Semi-Annual Report | |
| |
March 31, 2007 (unaudited) | |
Notes to Financial Statements (cont’d)
and the change, if any, is recorded as unrealized appreciation or depreciation in the Statements of Operations.
Total Return Swaps: Total return swaps involve commitments to pay interest in exchange for a market-linked return based on a notional amount. To the extent the total return of the security or index underlying the transaction exceeds or falls short of the offsetting interest rate obligation, the Portfolio will receive a payment from or make a payment to the coun-terparty, respectively. Total return swaps are marked-to-market daily based upon quotations from market makers and the change, if any, is recorded as unrealized appreciation or depreciation in the Statements of Operations. Periodic payments received or made at the end of each measurement period, but prior to termination, are recorded as realized gains or losses in the Statements of Operations.
Realized gains or losses on maturity or termination of swaps are presented in the Statements of Operations. Because there is no organized market for these swap agreements, the unrealized gain/loss reported in the Statements of Assets & Liabilities may differ from that which would be realized in the event the Portfolio terminated its position in the agreement. Risks may arise upon entering into these agreements from the potential inability of the counterparties to meet the terms of the agreements and are generally limited to the amount of net interest payments to be received, if any, at the date of default. Risks also arise from potential losses from adverse market movements and such losses could exceed the related amounts shown in the Statements of Assets & Liabilities.
6. Structured Investments: Certain Portfolios may invest in structured investments whose values are linked either directly or inversely to changes in foreign currencies, interest rates, commodities, indices, equity securities or other underlying instruments. A Portfolio uses these securities to increase or decrease its exposure to different underlying instruments and to gain exposure to markets that might be difficult to invest in through conventional securities. Structured investments may be more volatile than their underlying instruments, but any loss is limited to the amount of the original investment.
7. Delayed Delivery Commitments: Each Portfolio may purchase or sell securities on a when-issued or forward commitment basis. Payment and delivery may take place a month or more after the date of the transaction. The price of the underlying securities and the date when the securities will be delivered and paid for are fixed at the time the transaction is negotiated. Liquid securities or cash is designated in an amount at least equal to these commitments. Securities held for this purpose cannot be sold while this strategy is outstanding, unless replaced with other assets. As a result, there is a possibility that as designated assets reach certain levels, a Portfolio may lose some flexibility in managing its investments, responding to shareholder redemption requests, or meeting other current obligations. Such transactions may give rise to a form of leverage. This can cause a Portfolio to be more volatile than if it had not been leveraged, as leverage tends to exaggerate the effect of any increase or decrease in the value of the Portfolio’s securities.
8. Foreign Currency Translation and Foreign Currency Exchange Contracts: The books and records of the Fund are maintained in U.S. dollars. Foreign currency amounts are translated into U.S. dollars at the bid prices of such currencies against U.S. dollars quoted by a bank. Net realized gains (losses) on foreign currency transactions represent net foreign exchange gains (losses) from foreign currency exchange contracts, disposition of foreign currencies, currency gains or losses realized between the trade and settlement dates on securities transactions, and the difference between the amount of investment income and foreign withholding taxes recorded on a Portfolio’s books and the U.S. dollar equivalent of amounts actually received or paid.
A foreign currency exchange contract is an agreement between two parties to buy or sell currency at a set price on a future date. Each Portfolio (except the Core Fixed Income and Long Duration Fixed Income Portfolios) may enter into foreign currency exchange contracts to protect securities and related receivables and payables against future changes in foreign exchange rates and, in certain situations, to gain exposure to foreign currencies. Certain Portfolios may also enter into cross currency hedges which involve the sale of one currency against the positive exposure to a different currency. Cross currency hedges may be used for hedging purposes or to establish an active exposure to the exchange rate between any two currencies. Fluctuations in the value of such contracts are recorded as unrealized appreciation or depreciation; realized gains or losses, which are disclosed in the Statements of Operations, include net gains or losses on contracts which have been terminated by settlements. Risks may arise upon entering into these contracts from the potential inability of counterparties to meet the terms of their contracts and are generally limited to the amount of unrealized gain on the contract, if any, at the date of default. Risks may also arise from unanticipated movements in the value of the foreign currency relative to the U.S. dollar.
Certain Portfolios’ net assets include foreign denominated securities and currency. The net assets of these Portfolios are presented at the foreign exchange rates and market values at the close of the period. The Portfolios do not isolate that portion of the results of operations arising as a result of changes in the foreign exchange rates from the fluctuations
128
2007 Semi-Annual Report |
| |
March 31, 2007 (unaudited) |
Notes to Financial Statements (cont’d)
arising from changes in the market prices of the securities held at period end. Similarly, the Portfolios do not isolate the effect of changes in foreign exchange rates from the fluctuations arising from changes in the market prices of securities sold during the period. Accordingly, the components of realized and unrealized foreign currency gains (losses) representing foreign exchange changes on investments is included in the reported net realized and unrealized gains (losses) on investment transactions and balances. Changes in currency exchange rates will affect the value of and investment income from such securities and currency.
Foreign security and currency transactions may involve certain considerations and risks not typically associated with those of U.S. dollar denominated transactions as a result of, among other factors, the possibly lower level of governmental supervision, relative currency valuation fluctuation, regulation of foreign securities markets and the possibility of political or economic instability.
9. Purchased and Written Options: Certain Portfolios may write covered call and put options on portfolio securities and other financial instruments. Premiums are received and are recorded as liabilities. The liabilities are subsequently adjusted to reflect the current value of the options written. Premiums received from writing options which expire are treated as realized gains. Premiums received from writing options which are exercised or are closed are added to or offset against the proceeds or amount paid on the transaction to determine the net realized gain or loss. By writing a covered call option, a Portfolio, in exchange for the premium, foregoes the opportunity for capital appreciation above the exercise price should the market price of the underlying security increase. By writing a put option, a Portfolio, in exchange for the premium, accepts the risk of having to purchase a security at an exercise price that is above the current market price.
Certain Portfolios may purchase call and put options on their portfolio securities or other financial instruments. Each Portfolio may purchase call options to protect against an increase in the price of the security or financial instrument it anticipates purchasing. Each Portfolio may purchase put options on securities which it holds or other financial instruments to protect against a decline in the value of the security or financial instrument or to close out covered written put positions. Risks may arise from an imperfect correlation between the change in market value of the securities held by the Portfolio and the prices of options relating to the securities purchased or sold by the Portfolio and from the possible lack of a liquid secondary market for an option. The maximum exposure to loss for any purchased option is limited to the premium initially paid for the option.
10. Redemption Fees: Shares of the Balanced, Equities Plus, Mid Cap Growth, U.S. Mid Cap Value, Value, Core Fixed Income, Core Plus Fixed Income, Intermediate Duration, Investment Grade Fixed Income, Limited Duration, Long Duration Fixed Income and Municipal Portfolios redeemed within seven days (30 days with respect to the U.S. Small Cap Value, High Yield and International Fixed Income Portfolios) of purchase may be subject to a 2% redemption fee, payable to the Portfolio. The redemption fee is designed to protect each Portfolio and its shareholders from the effects of short-term trading. These fees, if any, are included on the Statements of Changes in Net Assets.
11. New Accounting Pronouncements: In July 2006, the Financial Accounting Standards Board (FASB) issued Interpretation 48, “Accounting for Uncertainty in Income Taxes — an Interpretation of FASB Statement No. 109” (FIN 48). FIN 48 clarifies the accounting for income taxes by prescribing the minimum recognition threshold a tax position must meet before being recognized in the financial statements. FIN 48 is effective for fiscal years beginning after December 15, 2006 and is to be applied to all open tax years as of the effective date. Recent SEC guidance allows implementing FIN 48 in the Portfolio NAV calculations as late as the Portfolio’s last NAV calculation in the first required financial statement period. As a result, the Fund will incorporate FIN 48 in its next semi annual report. The impact to the Portfolios’ financial statements, if any, is currently being assessed.
In addition, in September 2006, Statement of Financial Accounting Standards No. 157, Fair Value Measurements (SFAS 157), was issued and is effective for fiscal years beginning after November 15, 2007. SFAS 157 defines fair value, establishes a framework for measuring fair value and expands disclosures about fair value measurements. Management is currently evaluating the impact the adoption of SFAS 157 will have on the Portfolios’ financial statement disclosures.
12. Other: Security transactions are accounted for on the date the securities are purchased or sold. Costs used in determining realized gains and losses on the sale of investment securities are those of specific securities sold. Interest income is recognized on the accrual basis.
Discounts and premiums on securities purchased are amortized over their respective lives. Most expenses of the Fund can be directly attributed to a particular Portfolio. Expenses which cannot be directly attributed are apportioned among the Portfolios on the basis of their relative net assets. Income, expenses (other than class specific expenses) and realized and unrealized gains or losses are allocated to each class of shares based upon their relative net assets.
129
2007 Semi-Annual Report
March 31, 2007 (unaudited)
Notes to Financial Statements (cont’d)
B. Investment Advisory Fees. Morgan Stanley Investment Management Inc. (the “Adviser” or “MS Investment Management”), a wholly-owned subsidiary of Morgan Stanley, performs investment advisory services at a fee calculated by applying a quarterly rate based on the annual percentage rate listed below, to each Portfolio’s average daily net assets for the quarter.
| | Annual Investment |
Portfolio | | Advisory Fee |
Balanced | | 0.450% |
Equities Plus | | 0.375% |
Mid Cap Growth | | 0.500% |
U.S. Mid Cap Value | | 0.720% first $1 billion |
| | 0.650% over $1 billion |
U.S. Small Cap Value | | 0.670% first $500 million |
| | 0.645% next $500 million |
| | 0.620% over $1 billion |
Value | | 0.500% first $1 billion |
| | 0.450% next $1 billion |
| | 0.400% next $1 billion |
| | 0.350% over $3 billion |
Core Fixed Income | | 0.375% |
Core Plus Fixed Income | | 0.375% first $1 billion |
| | 0.300% over $1 billion |
High Yield | | 0.420% first $500 million |
| | 0.345% next $250 million |
| | 0.295% next $250 million |
| | 0.270% next $1 billion |
| | 0.245% next $1 billion |
| | 0.220% over $3 billion |
Intermediate Duration | | 0.375% |
International Fixed Income | | 0.375% |
Investment Grade Fixed Income | | 0.375% |
Limited Duration | | 0.300% |
Long Duration Fixed Income | | 0.375% |
Municipal | | 0.375% |
With respect to certain portfolios, the Adviser has voluntarily agreed to reduce the fees payable to it and, if necessary, reimburse the Portfolios for certain expenses, after giving effect to custody fee offsets, so that annual operating expenses will not exceed voluntary expense limitations established for each class of shares as presented in the table below.
| | Voluntary Expense Limitations | |
| | Institutional | | Investment | | Adviser | |
Portfolio | | Class | | Class | | Class | |
Balanced | | — | % | — | % | — | % |
Equities Plus | | 0.600 | | — | | 0.850 | |
Mid Cap Growth | | — | | — | | — | |
U.S. Mid Cap Value | | — | | — | | — | |
U.S. Small Cap Value | | — | | — | | — | |
Value | | — | | — | | — | |
Core Fixed Income | | 0.500 | | 0.500 | | 0.750 | |
Core Plus Fixed Income | | — | | — | | — | |
| | Voluntary Expense Limitations | |
| | Institutional | | Investment | | Adviser | |
Portfolio | | Class | | Class | | Class | |
High Yield | | — | % | — | % | — | % |
Intermediate Duration | | — | | — | | — | |
International Fixed Income | | — | | — | | — | |
Investment Grade Fixed Income | | — | | — | | — | |
Limited Duration | | — | | — | | — | |
Long Duration Fixed Income | | 0.500 | | — | | 0.750 | |
Municipal | | 0.500 | | — | | — | |
Morgan Stanley Investment Management Limited (“MSIM Limited”) serves as Sub-Adviser to the International Fixed Income Portfolio. MSIM Limited is a wholly-owned subsidiary of Morgan Stanley. Under an Investment Sub-Advisory Agreement with the Adviser, MSIM Limited, subject to the control and supervision of the Fund, its officers, Trustees and the Adviser, and in accordance with the investment objectives, policies and restrictions of the Portfolio, makes certain day-today investment decisions for the Portfolio and places certain of the Portfolio’s purchase and sales orders. The Adviser pays MSIM Limited on a monthly basis a portion of the net advisory fees the Adviser receives from the Portfolio.
C. Administration Fees. MS Investment Management (the “Administrator”) also provides the Fund with administration services pursuant to an administration agreement for an annual fee, accrued daily and paid monthly, of 0.08% of each Portfolio’s average daily net assets.
Under an agreement between the Administrator and JPMorgan Investor Services Co. (“JPMIS”), a corporate affiliate of JPMorgan Chase Bank, N.A., JPMIS provides certain administrative services to the Fund. For such services, the Administrator pays JPMIS a portion of the fee the Administrator receives from the Fund. An employee of JPMIS is an officer of the Fund.
D. Distribution and Shareholder Servicing Fees. Morgan Stanley Distribution, Inc. (“MSDI” or the “Distributor”), a wholly-owned subsidiary of the Adviser, serves as the distributor for the Fund. MSDI is a limited-purpose broker/dealer whose only function is to distribute open-end mutual fund shares. The Distributor provides certain classes of shares in each Portfolio with distribution and shareholder services, and receives fees in connection with these services, pursuant to a Distribution Plan and a Shareholder Service Plan (the “Plans”) in accordance with Rule 12b-1 under the 1940 Act.
Under the Plans, the Distributor is entitled to distribution fees and shareholder servicing fees for Adviser Class and Investment Class shares, respectively. The distribution fee is an asset-based fee to compensate the Distributor for distribution efforts and/or servicing of accounts. The Adviser Class of shares pays an annual distribution fee of up to 0.25% of aver-
130
2007 Semi-Annual Report |
| |
March 31, 2007 (unaudited) |
Notes to Financial Statements (cont’d)
age daily net assets of the class for such services under the 12b-1 plan adopted by the Fund. The Investment Class of shares pays an annual shareholder servicing fee of 0.15% of average daily net assets of the class. The shareholder servicing fee is used to support the expenses associated with servicing and maintaining accounts. Both fees are paid directly to MSDI. The distribution fee may be retained by MSDI if an Adviser Class shareholder invests directly through MSDI. Usually the fees are paid by MSDI to external organizations such as 401(k) alliance sponsors, discount brokers and bank trust departments who distribute MSIFT Portfolios to the public. The Distributor has voluntarily agreed to waive 0.10% of the 0.25% distribution fee it is entitled to receive from the Adviser Class Shares’ average daily net assets for the Investment Grade Fixed Income Portfolio.
E. Custodian Fees. JPMorgan Chase Bank, N.A. (the “Custodian”) serves as Custodian for the Fund in accordance with a custodian agreement. The Custodian holds cash, securities, and other assets of the Fund as required by the 1940 Act.
The Fund has entered into an arrangement with its Custodian whereby credits realized on uninvested cash balances were used to offset a portion of each applicable Portfolio’s expenses. These custodian credits are shown as “Expense Offset” on the Statements of Operations.
F. Transfer Agency Fees. JPMIS serves as transfer agent to the Fund pursuant to a Transfer Agency Agreement.
G. Portfolio Investment Activity.
1. Purchases and Sales of Securities: For the six months ended March 31, 2007, purchases and sales of investment securities other than temporary cash investments and long-term U.S. government securities were:
| | Purchases | | Sales | |
Portfolio | | (000) | | (000) | |
Balanced | | $ | 76,824 | | $ | 93,089 | |
Equities Plus | | $ | 5,497 | | $ | 4,726 | |
Mid Cap Growth | | 851,914 | | 753,780 | |
U.S. Mid Cap Value | | 64,394 | | 57,362 | |
U.S. Small Cap Value | | 201,805 | | 233,940 | |
Value | | 106,307 | | 106,069 | |
Core Fixed Income | | 133,163 | | 98,310 | |
Core Plus Fixed Income | | 1,760,916 | | 1,346,526 | |
High Yield | | 41,943 | | 52,422 | |
Intermediate Duration | | 84,110 | | 73,823 | |
International Fixed Income | | 59,003 | | 43,145 | |
Investment Grade Fixed Income | | 259,976 | | 215,476 | |
Limited Duration | | 388,054 | | 375,703 | |
Long Duration Fixed Income | | 2,025 | | 234 | |
Municipal | | 257,063 | | 102,338 | |
For the six months ended March 31, 2007, purchases and sales of long-term U.S. government securities were:
| | Purchases | | Sales | |
Portfolio | | (000) | | (000) | |
Balanced | | $ | 146 | | $ | 150 | |
Core Fixed Income | | — | | 34,510 | |
Core Plus Fixed Income | | 6,738 | | 360,972 | |
High Yield | | 5,214 | | 21,163 | |
International Fixed Income | | — | | 6,999 | |
Investment Grade Fixed Income | | — | | 74,881 | |
Long Duration Fixed Income | | — | | 1,198 | |
| | | | | | | |
2. Transactions with Affiliates: During the six months ended March 31, 2007, the following Portfolios paid brokerage commissions to Morgan Stanley & Co., an affiliated broker/ dealer.
| | Broker | |
| | Commissions | |
Portfolio | | (000) | |
Mid Cap Growth | | $ | 1 | |
U.S. Mid Cap Value | | 3 | |
U.S. Small Cap Value | | 1 | |
Value | | 4 | |
| | | | |
3. Swap Agreements: At March 31, 2007, the following Portfolios had open Swap Agreements:
| | | | | | | | | | Net | |
| | | | | | | | | | Unrealized | |
| | Termina- | | Notional | | | | | | Appreciation | |
| | tion | | Amount | | | | | | (Depreciation) | |
Counterparty | | Date | | (000) | | Type Pay | | Receive | | (000) | |
Balanced Portfolio | | | | | | | | | |
Bank of America | | 3/20/12 | | $ | 220 | | CDS fixed rate of 1.19% | | upon the occurrence of a negative credit event(7) | | $ | (2 | ) |
Citigroup | | 3/20/12 | | 225 | | CDS fixed rate of 0.43% | | upon the occurrence of a negative credit event(1) | | @— | |
| | 3/20/12 | | 430 | | CDS fixed rate of 0.43% | | upon the occurrence of a negative credit event(1) | | @— | |
| | 5/15/21 | | 290 | | ZCS at maturity | | compounded 3 month LIBOR less 7.50 bps | | (6 | ) |
| | 5/15/21 | | 310 | | ZCS at maturity | | compounded 3 month LIBOR less 7.75 bps | | (5 | ) |
| | 5/15/21 | | 320 | | ZCS at maturity | | compounded 3 month LIBOR less 7.25 bps | | (7 | ) |
| | 5/15/21 | | 400 | | ZCS at maturity | | compounded 3 month LIBOR less 7.50 bps | | (7 | ) |
| | 5/15/21 | | 400 | | ZCS at maturity | | compounded 3 month LIBOR less 7.50 bps | | (6 | ) |
| | | | | | | | | | | | | |
131
2007 Semi-Annual Report
March 31, 2007 (unaudited)
Notes to Financial Statements (cont’d)
| | | | | | | | | | Net | |
| | | | | | | | | | Unrealized | |
| | Termina- | | Notional | | | | | | Appreciation | |
| | tion | | Amount | | | | | | (Depreciation) | |
Counterparty | | Date | | (000) | | Type Pay | | Receive | | (000) | |
Balanced Portfolio (cont’d) | | | | | | | | |
| | 5/15/21 | | $ | 575 | | ZCS at maturity | | compounded 3 month LIBOR less 4.50 bps | | $ | 4 | |
| | 5/15/21 | | 575 | | ZCS at maturity | | compounded 3 month LIBOR less 3.00 bps | | 21 | |
| | 5/15/21 | | 1,000 | | ZCS at maturity | | compounded 3 month LIBOR less 7.50 bps | | (19 | ) |
| | 5/15/21 | | 1,150 | | ZCS at maturity | | compounded 3 month LIBOR less 3.75 bps | | 2 | |
| | 5/15/21 | | 2,500 | | ZCS at maturity | | compounded 3 month LIBOR less 8 bps | | (40 | ) |
| | | | | | | | | | | |
Credit Suisse First Boston | | 5/15/21 | | 1,725 | | ZCS at maturity | | compounded 3 month LIBOR | | (1 | ) |
Goldman Sachs | | 6/20/11 | | 1,400 | | CDS fixed rate of 0.75% | | upon the occurrence of a negative credit event(3) | | 1 | |
| | | | | | | | | | | |
| | 12/20/11 | | 120 | | CDS fixed rate of 0.15% | | upon the occurrence of a negative credit event(13) | | 1 | |
| | 12/20/11 | | 250 | | CDS fixed rate of 0.157% | | upon the occurrence of a negative credit event(13) | | 3 | |
| | 12/20/11 | | 1,450 | | CDS fixed rate of 0.75% | | upon the occurrence of a negative credit event(5) | | 6 | |
| | 3/20/12 | | 370 | | CDS fixed rate of 0.10% | | upon the occurrence of a negative credit event(6) | | 1 | |
| | 3/20/12 | | 185 | | CDS fixed rate of 0.22% | | upon the occurrence of a negative credit event(16) | | @— | |
Lehman Brothers | | 12/20/11 | | 175 | | CDS fixed rate of 0.20% | | upon the occurrence of a negative credit event(12) | | 2 | |
| | 12/20/11 | | 370 | | CDS fixed rate of 0.22% | | upon the occurrence of a negative credit event(14) | | 1 | |
| | 12/20/11 | | 350 | | CDS fixed rate of 0.12% | | upon the occurrence of a negative credit event(15) | | @— | |
| | 3/20/12 | | 185 | | CDS upon the occurrence of a negative credit event(8) | | fixed rate of 0.60% | | (1 | ) |
| | 3/20/17 | | 175 | | CDS upon the occurrence of a negative credit event(11) | | fixed rate of 2.20% | | @— | |
| | | | | | | | | | (52 | ) |
Equities Plus | | | | | | | | | | | |
Goldman Sachs | | 6/20/07 | | 65 | | CDS upon the occurrence of a negative credit event(4) | | fixed rate of 2.90% | | @— | |
| | 6/20/11 | | 65 | | CDS upon the occurrence of a negative credit event(17) | | fixed rate of 3.08% | | 3 | |
| | 12/20/11 | | 50 | | CDS fixed rate of 0.15% | | upon the occurrence of a negative credit event(13) | | 1 | |
| | 12/20/11 | | 100 | | CDS fixed rate of 0.157% | | upon the occurrence of a negative credit event(13) | | 1 | |
| | 3/20/12 | | 70 | | CDS fixed rate of 0.10% | | upon the occurrence of a negative credit event(6) | | @— | |
| | 3/20/17 | | 65 | | CDS upon the occurrence of a negative credit event(8) | | fixed rate of 0.57% | | @— | |
| | 3/20/17 | | 65 | | CDS upon the occurrence of a negative credit event(9) | | fixed rate of 2.00% | | (1 | ) |
| | 3/20/12 | | 65 | | CDS fixed rate of 0.22% | | upon the occurrence of a negative credit event(16) | | @— | |
| | 3/20/12 | | 70 | | CDS fixed rate of 0.44% | | upon the occurrence of a negative credit event(2) | | @— | |
JPMorgan Chase | | 12/20/11 | | 70 | | CDS fixed rate of 0.19% | | upon the occurrence of a negative credit event(12) | | 1 | |
| | 12/20/11 | | 140 | | CDS fixed rate of 0.20% | | upon the occurrence of a negative credit event(18) | | — | |
Lehman Brothers | | 12/20/11 | | 70 | | CDS fixed rate of 0.22% | | upon the occurrence of a negative credit event(14) | | @— | |
| | 12/20/11 | | 140 | | CDS fixed rate of 0.12% | | upon the occurrence of a negative credit event(15) | | @— | |
| | | | | | | | | | 5 | |
| | | | | | | | | | | | | |
132
2007 Semi-Annual Report |
| |
March 31, 2007 (unaudited) |
Notes to Financial Statements (cont’d)
| | | | | | | | | | Net | |
| | | | | | | | | | Unrealized | |
| | Termina- | | Notional | | | | | | Appreciation | |
| | tion | | Amount | | | | | | (Depreciation) | |
Counterparty | | Date | | (000) | | Type Pay | | Receive | | (000) | |
Core Fixed Income Portfolio | | | | | | | | |
Bank of America | | 5/15/21 | | $ | 8,300 | | ZCS at maturity | | compounded 3 month LIBOR | | $ | (140 | ) |
Citigroup | | 3/20/12 | | 500 | | CDS fixed rate of 0.43% | | upon the occurrence of a negative credit event(1) | | @— | |
| | 3/20/12 | | 1,000 | | CDS fixed rate of 0.43% | | upon the occurrence of a negative credit event(1) | | 1 | |
| | 5/15/21 | | 2,200 | | ZCS at maturity | | compounded 3 month LIBOR less 3.0 bps | | 81 | |
| | 5/15/21 | | 4,350 | | ZCS at maturity | | compounded 3 month LIBOR less 3.75 bps | | 8 | |
| | 5/15/21 | | 2,175 | | ZCS at maturity | | compounded 3 month LIBOR less 4.5 bps | | 14 | |
| | 5/15/21 | | 6,750 | | ZCS at maturity | | compounded 3 month LIBOR less 4.5bps | | 312 | |
| | 5/15/21 | | 1,190 | | ZCS at maturity | | compounded 3 month LIBOR less 7.25 bps | | (25 | ) |
| | 5/15/21 | | 4,500 | | ZCS at maturity | | compounded 3 month LIBOR less 7.5 bps | | (86 | ) |
| | 5/15/21 | | 1,090 | | ZCS at maturity | | compounded 3 month LIBOR less 7.5 bps | | (22 | ) |
| | 5/15/21 | | 1,500 | | ZCS at maturity | | compounded 3 month LIBOR less 7.5 bps | | (25 | ) |
| | 5/15/21 | | 1,500 | | ZCS at maturity | | compounded 3 month LIBOR less 7.5 bps | | (23 | ) |
| | 5/15/21 | | 1,150 | | ZCS at maturity | | compounded 3 month LIBOR less 7.75 bps | | (20 | ) |
| | 5/15/21 | | 2,000 | | ZCS at maturity | | compounded 3 month LIBOR less 8.0 bps | | (32 | ) |
Goldman Sachs | | 12/20/11 | | 510 | | CDS fixed rate of 0.15% | | upon the occurrence of a negative credit event(13) | | 6 | |
| | 12/20/11 | | 1,050 | | CDS fixed rate of 0.157% | | upon the occurrence of a negative credit event(13) | | 11 | |
| | 3/20/12 | | 1,550 | | CDS fixed rate of 0.10% | | upon the occurrence of a negative credit event(6) | | 2 | |
| | 3/20/12 | | 780 | | CDS fixed rate of 0.22% | | upon the occurrence of a negative credit event(16) | | @— | |
| | 2/15/21 | | 500 | | ZCS at maturity | | compounded 3 month LIBOR | | 1 | |
JPMorgan Chase | | 3/20/11 | | 1,300 | | CDS fixed rate of 0.65% | | upon the occurrence of a negative credit event(1) | | (22 | ) |
| | 3/20/11 | | 800 | | CDS upon the occurrence of a negative credit event(11) | | fixed rate of 2.20% | | @— | |
Lehman Brothers | | 12/20/11 | | 800 | | CDS fixed rate of 0.20% | | upon the occurrence of a negative credit event(12) | | 11 | |
| | 12/20/11 | | 1,600 | | CDS fixed rate of 0.22% | | upon the occurrence of a negative credit event(14) | | 5 | |
| | 12/20/11 | | 1,600 | | CDS fixed rate of 0.12% | | upon the occurrence of a negative credit event(15) | | @— | |
| | 3/20/12 | | 790 | | CDS upon the occurrence of a negative credit event(8) | | fixed rate of 0.60% | | (3 | ) |
| | | | | | 54 | |
Core Plus Fixed Income Portfolio | | | | | | | |
Bank of America | | 3/20/12 | | 7,950 | | CDS fixed rate of 1.19% | | upon the occurrence of a negative credit event(7) | | (69 | ) |
Citigroup | | 3/20/12 | | 8,000 | | CDS fixed rate of 0.43% | | upon the occurrence of a negative credit event(1) | | 7 | |
| | 5/15/21 | | 9,500 | | ZCS at maturity | | compounded 3 month LIBOR less 7.5 bps | | (190 | ) |
| | 5/15/21 | | 9,700 | | ZCS at maturity | | compounded 3 month LIBOR less 7.75 bps | | (168 | ) |
| | 5/15/21 | | 10,000 | | ZCS at maturity | | compounded 3 month LIBOR less 7.5 bps | | (192 | ) |
| | 5/15/21 | | 10,440 | | ZCS at maturity | | compounded 3 month LIBOR less 7.25 bps | | (216 | ) |
| | 5/15/21 | | 16,000 | | ZCS at maturity | | compounded 3 month LIBOR less 4.5 bps | | 739 | |
| | 5/15/21 | | 23,100 | | ZCS at maturity | | compounded 3 month LIBOR less 3.0 bps | | 847 | |
| | 5/15/21 | | 23,150 | | ZCS at maturity | | compounded 3 month LIBOR less 4.5 bps | | 150 | |
| | 5/15/21 | | 46,300 | | ZCS at maturity | | compounded 3 month LIBOR less 3.75 bps | | 85 | |
| | 11/15/21 | | 23,150 | | ZCS at maturity | | compounded 3 month LIBOR less 4.5 bps | | (33 | ) |
| | 11/15/21 | | 23,150 | | ZCS at maturity | | compounded 3 month LIBOR less 4.25 bps | | (40 | ) |
Credit Suisse First Boston | | 5/15/21 | | 23,100 | | ZCS at maturity | | compounded 3 month LIBOR | | 462 | |
| | 5/15/21 | | 69,450 | | ZCS at maturity | | compounded 3 month LIBOR | | (558 | ) |
Goldman Sachs | | 3/20/11 | | 7,700 | | CDS fixed rate of 0.80% | | upon the occurrence of a negative credit event(2) | | (88 | ) |
| | 6/20/11 | | 50,500 | | CDS fixed rate of 0.75% | | upon the occurrence of a negative credit event(3) | | 52 | |
| | | | | | | | | | | | | |
133
2007 Semi-Annual Report |
| |
March 31, 2007 (unaudited) |
Notes to Financial Statements (cont’d)
| | | | | | | | | | Net | |
| | | | | | | | | | Unrealized | |
| | Termina- | | Notional | | | | | | Appreciation | |
| | tion | | Amount | | | | | | (Depreciation) | |
Counterparty | | Date | | (000) | | Type Pay | | Receive | | (000) | |
Core Plus Fixed Income Portfolio (cont’d) | | | | | |
| | | | | | | | | | | |
| | 12/20/11 | | $ | 4,240 | | CDS fixed rate of 0.15% | | upon the occurrence of a negative credit event(13) | | $ | 48 | |
| | 12/20/11 | | 8,800 | | CDS fixed rate of 0.157% | | upon the occurrence of a negative credit event(13) | | 96 | |
| | 3/20/12 | | 13,200 | | CDS fixed rate of 0.10% | | upon the occurrence of a negative credit event(6) | | 13 | |
| | 3/20/12 | | 6,650 | | CDS fixed rate of 0.22% | | upon the occurrence of a negative credit event(16) | | @— | |
JPMorgan Chase | | 3/20/11 | | 7,700 | | CDS fixed rate of 0.65% | | upon the occurrence of a negative credit event(3) | | (129 | ) |
Lehman Brothers | | 12/20/11 | | 6,500 | | CDS fixed rate of 0.20% | | upon the occurrence of a negative credit event(12) | | 88 | |
| | 12/20/11 | | 13,000 | | CDS fixed rate of 0.22% | | upon the occurrence of a negative credit event(14) | | 45 | |
| | 12/20/11 | | 13,000 | | CDS fixed rate of 0.12% | | upon the occurrence of a negative credit event(15) | | @— | |
| | 12/20/11 | | 53,000 | | CDS fixed rate of 0.43% | | upon the occurrence of a negative credit event(5) | | 199 | |
| | 3/20/12 | | 6,670 | | CDS upon the occurrence of a negative credit event(8) | | fixed rate of 0.60% | | (24 | ) |
| | 3/20/17 | | 6,975 | | CDS upon the occurrence of a negative credit event(11) | | fixed rate of 2.20% | | (4 | ) |
| | | | | | | | | | 1,120 | |
High Yield | | | | | | | | | | | |
Goldman Sachs | | 3/20/11 | | 1,000 | | CDS fixed rate of 0.80% | | upon the occurrence of a negative credit event(2) | | (12 | ) |
| | 3/20/17 | | 2,125 | | CDS upon the occurrence of a negative credit event(9) | | fixed rate of 2.00% | | (30 | ) |
JPMorgan Chase | | 3/20/11 | | 1,000 | | CDS fixed rate of 0.65% | | upon the occurrence of a negative credit event(19) | | (17 | ) |
| | | | | | | | | | (59 | ) |
Intermediate Duration Portfolio | | | | | | |
Citigroup | | 3/20/12 | | 200 | | CDS fixed rate of 0.43% | | upon the occurrence of a negative credit event(1) | | @— | |
| | | | | | | | upon the occurrence of a negative credit | | | |
Goldman Sachs | | 12/20/11 | | 250 | | CDS fixed rate of 0.15% | | event(13) | | 3 | |
| | 12/20/11 | | 500 | | CDS fixed rate of 0.157% | | upon the occurrence of a negative credit event(13) | | 6 | |
| | 3/20/12 | | 730 | | CDS fixed rate of 0.10% | | upon the occurrence of a negative credit event(6) | | 1 | |
| | 3/20/12 | | 350 | | CDS fixed rate of 0.22% | | upon the occurrence of a negative credit event(16) | | @— | |
JPMorgan Chase | | 3/20/11 | | 1,100 | | CDS fixed rate of 0.65% | | upon the occurrence of a negative credit event(1) | | (19 | ) |
Lehman Brothers | | 12/20/11 | | 375 | | CDS fixed rate of 0.20% | | upon the occurrence of a negative credit event(12) | | 5 | |
| | 12/20/11 | | 740 | | CDS fixed rate of 0.22% | | upon the occurrence of a negative credit event(14) | | 2 | |
| | 12/20/11 | | 750 | | CDS fixed rate of 0.12% | | upon the occurrence of a negative credit event(15) | | @— | |
| | 3/20/12 | | 355 | | CDS upon the occurrence of a negative credit event(8) | | fixed rate of 0.60% | | (1 | ) |
| | 3/20/17 | | 330 | | CDS upon the occurrence of a negative credit event(11) | | fixed rate of 2.20% | | @— | |
| | | | | | | | | | (3 | ) |
Investment Grade Fixed Income Portfolio | | | | |
Citigroup | | 3/20/12 | | 1,600 | | CDS fixed rate of 0.43% | | upon the occurrence of a negative credit event(1) | | 1 | |
| | 5/15/21 | | 1,850 | | ZCS at maturity | | compounded 3 month LIBOR less 7.5 bps | | (37 | ) |
| | 5/15/21 | | 1,950 | | ZCS at maturity | | compounded 3 month LIBOR less 7.75 bps | | (34 | ) |
| | 5/15/21 | | 2,040 | | ZCS at maturity | | compounded 3 month LIBOR less 7.25 bps | | (42 | ) |
| | 5/15/21 | | 2,700 | | ZCS at maturity | | compounded 3 month LIBOR less 7.5 bps | | (45 | ) |
| | 5/15/21 | | 2,700 | | ZCS at maturity | | compounded 3 month LIBOR less 7.5 bps | | (41 | ) |
| | | | | | | | | | | | | |
134
2007 Semi-Annual Report |
| |
March 31, 2007 (unaudited) |
Notes to Financial Statements (cont’d)
| | | | | | | | | | Net | |
| | | | | | | | | | Unrealized | |
| | | | Notional | | | | | | Appreciation | |
| | Termination | | Amount | | | | | | (Depreciation) | |
Counterparty | | Date | | (000) | | Type Pay | | Receive | | (000) | |
Investment Grade Fixed Income Portfolio (cont’d) | | | | | |
| | 5/15/21 | | $ | 3,475 | | ZCS at maturity | | compounded 3 month LIBOR less 3.0 bps | | $ | 128 | |
| | 5/15/21 | | 3,600 | | ZCS at maturity | | compounded 3 month LIBOR less 4.5 bps | | 23 | |
| | 5/15/21 | | 5,000 | | ZCS at maturity | | compounded 3 month LIBOR less 4.5 bps | | 231 | |
| | 5/15/21 | | 5,000 | | ZCS at maturity | | compounded 3 month LIBOR less 7.5 bps | | (96 | ) |
| | 5/15/21 | | 7,200 | | ZCS at maturity | | compounded 3 month LIBOR less 3.75 bps | | 13 | |
| | 5/15/21 | | 16,000 | | ZCS at maturity | | compounded 3 month LIBOR less 8.0 bps | | (258 | ) |
CreditSuisse First Boston | | 5/15/21 | | 10,800 | | ZCS at maturity | | compounded 3 month LIBOR | | (101 | ) |
| | | | | | | | | | | |
Goldman Sachs | | 3/20/11 | | 1,500 | | CDS fixed rate of 0.80% | | upon the occurrence of a negative credit event(2) | | (17 | ) |
| | 12/20/11 | | 850 | | CDS fixed rate of 0.15% | | upon the occurrence of a negative credit event(13) | | 10 | |
| | 12/20/11 | | 1,750 | | CDS fixed rate of 0.157% | | upon the occurrence of a negative credit event(13) | | 19 | |
| | 3/20/12 | | 2,600 | | CDS fixed rate of 0.10% | | upon the occurrence of a negative credit event(6) | | 3 | |
| | 3/20/12 | | 1,300 | | CDS fixed rate of 0.22% | | upon the occurrence of a negative credit event(16) | | @— | |
JPMorgan Chase | | 3/20/11 | | 1,500 | | CDS fixed rate of 0.65% | | upon the occurrence of a negative credit event(19) | | (25 | ) |
Lehman Brothers | | 12/20/11 | | 1,300 | | CDS fixed rate of 0.20% | | upon the occurrence of a negative credit event(12) | | 18 | |
| | 12/20/11 | | 2,700 | | CDS fixed rate of 0.22% | | upon the occurrence of a negative credit event(14) | | 9 | |
| | 12/20/11 | | 2,600 | | CDS fixed rate of 0.12% | | upon the occurrence of a negative credit event(15) | | @— | |
| | 3/20/12 | | 1,300 | | CDS upon the occurrence of a negative credit event(8) | | fixed rate of 0.60% | | (5 | ) |
| | 3/20/17 | | 1,320 | | CDS upon the occurrence of a negative credit event(11) | | fixed rate of 2.20% | | (1 | ) |
| | | | | | | | | | (247 | ) |
Limited Duration Portfolio | | | | | | | | |
Citigroup | | 3/20/12 | | 2,770 | | CDS fixed rate of 0.43% | | upon the occurrence of a negative credit event(1) | | 2 | |
| | 3/20/12 | | 1,400 | | CDS fixed rate of 0.43% | | upon the occurrence of a negative credit event(1) | | 1 | |
| | 9/19/07 | | 11,000 | | IRS 3 month LIBOR | | fixed rate of 4.25% | | (63 | ) |
| | 10/1/07 | | 11,000 | | IRS 3 month LIBOR | | fixed rate of 4.4725% | | (46 | ) |
| | 9/4/07 | | 16,500 | | IRS 3 month LIBOR | | fixed rate of 4.387% | | (88 | ) |
| | 10/26/07 | | 21,300 | | IRS 3 month LIBOR | | fixed rate of 4.6725% | | 149 | |
Goldman Sachs | | 3/20/10 | | 2,700 | | CDS upon the occurrence of a negative credit event(8) | | fixed rate of 0.35% | | (7 | ) |
| | 3/20/12 | | 2,665 | | CDS fixed rate of 0.22% | | upon the occurrence of a negative credit event(16) | | @— | |
| | 10/5/08 | | 11,000 | | IRS 3 month LIBOR | | fixed rate of 5.074% | | 129 | |
JPMorgan Chase | | 9/22/08 | | 11,000 | | IRS 3 month LIBOR | | fixed rate of 5.225% | | 18 | |
| | 10/13/08 | | 13,500 | | IRS 3 month LIBOR | | fixed rate of 5.203% | | 198 | |
| | 3/12/09 | | 21,500 | | IRS 3 month LIBOR | | fixed rate of 4,962% | | (7 | ) |
| | 6/30/09 | | 10,700 | | IRS 3 month LIBOR | | fixed rate of 5.334% | | 54 | |
Lehman Brothers | | 12/20/11 | | 2,700 | | CDS fixed rate of 0.22% | | upon the occurrence of a negative credit event(14) | | 9 | |
| | | | | | | | | | 349 | |
Long Duration Fixed Income Portfolio | | | | | |
Goldman Sachs | | 3/20/12 | | 125,000 | | CDS fixed rate of 0.11% | | upon the occurrence of a negative credit event(15) | | @— | |
| | 3/20/12 | | 125,000 | | CDS fixed rate of 0.11% | | upon the occurrence of a negative credit event(6) | | @— | |
| | | | | | | | | | | | | |
135
2007 Semi-Annual Report |
| |
March 31, 2007 (unaudited) |
Notes to Financial Statements (cont’d)
| | | | | | | | | | Net | |
| | | | | | | | | | Unrealized | |
| | Termina- | | Notional | | | | | | Appreciation | |
| | tion | | Amount | | | | | | (Depreciation) | |
Counterparty | | Date | | (000) | | Type Pay | | Receive | | (000) | |
Long Duration Fixed Income Portfolio (cont’d) | | | | |
| | 3/20/12 | | $ | 65,000 | | CDS fixed rate of 0.22% | | upon the occurrence of a negative credit event(16) | | $ | @— | |
| | 3/20/12 | | 125,000 | | CDS fixed rate of 0.23% | | upon the occurrence of a negative credit event(18) | | @— | |
| | 3/20/12 | | 65,000 | | CDS fixed rate of 0.26% | | upon the occurrence of a negative credit event(12) | | 1 | |
| | 3/20/12 | | 125,000 | | CDS fixed rate of 0.30% | | upon the occurrence of a negative credit event(14) | | @— | |
| | 3/20/12 | | 125,000 | | CDS fixed rate of 0.39% | | upon the occurrence of a negative credit event(13) | | @— | |
| | 3/20/12 | | 230,000 | | CDS fixed rate of 0.44% | | upon the occurrence of a negative credit event(2) | | @— | |
| | 3/20/17 | | 100,000 | | CDS upon the occurrence of a negative credit event(9) | | fixed rate of 2.00% | | (1 | ) |
Lehman Brothers | | 3/20/12 | | 65,000 | | CDS upon the occurrence of a negative credit event(8) | | fixed rate of 0.60% | | @— | |
| | | | | | | | | | @— | |
Municipal Portfolio | | | | | | | | |
Bank of America | | 8/15/19 | | 10,000 | | ZCS at maturity | | compounded 3 month LIBOR | | 341 | |
| | 2/16/21 | | 50,000 | | ZCS at maturity | | compounded 3 month LIBOR | | 1,742 | |
| | 2/15/22 | | 7,550 | | ZCS at maturity | | compounded 3 month LIBOR | | 271 | |
| | 5/16/22 | | 21,400 | | ZCS at maturity | | compounded 3 month LIBOR | | 774 | |
Citigroup | | 3/20/12 | | 1,170 | | CDS fixed rate of 0.43% | | upon the occurrence of a negative credit event(1) | | 1 | |
| | 3/20/12 | | 700 | | CDS fixed rate of 0.43% | | upon the occurrence of a negative credit event(1) | | @— | |
| | 3/16/27 | | 35,000 | | IRS zero coupon, resets to 3.97% on 11/7/08 | | compounded 3 month LIBOR | | 531 | |
| | 2/15/19 | | 10,000 | | ZCS at maturity | | compounded 3 month LIBOR | | 353 | |
| | 5/15/20 | | 8,000 | | ZCS at maturity | | compounded 3 month LIBOR less 9.75 bps | | 197 | |
| | 8/15/20 | | 5,000 | | ZCS at maturity | | compounded 3 month LIBOR less 6.25 bps | | (61 | ) |
| | 5/15/21 | | 700 | | ZCS at maturity | | compounded 3 month LIBOR less 7.25 bps | | (15 | ) |
| | 5/15/21 | | 640 | | ZCS at maturity | | compounded 3 month LIBOR less 7.50 bps | | (13 | ) |
| | 5/15/21 | | 5,000 | | ZCS at maturity | | compounded 3 month LIBOR less 7.75 bps | | (95 | ) |
| | 2/15/22 | | 4,000 | | ZCS at maturity | | compounded 3 month LIBOR less 10.0 bps | | 71 | |
| | | | | | | | | | | |
Goldman Sachs | | 6/20/10 | | 1,000 | | CDS fixed rate of 0.26% | | upon the occurrence of a negative credit event(6) | | (6 | ) |
| | 12/20/11 | | 1,150 | | CDS fixed rate of 0.15% | | upon the occurrence of a negative credit event(13) | | 13 | |
| | 12/20/11 | | 2,400 | | CDS fixed rate of 0.157% | | upon the occurrence of a negative credit event(13) | | 26 | |
| | 3/20/12 | | 750 | | CDS fixed rate of 0.10% | | upon the occurrence of a negative credit event(6) | | 1 | |
| | 3/20/12 | | 1,885 | | CDS fixed rate of 0.22% | | upon the occurrence of a negative credit event(16) | | @— | |
| | 3/20/17 | | 1,885 | | CDS upon the occurrence of a negative credit event(9) | | fixed rate of 2.00% | | (27 | ) |
| | 3/20/17 | | 1,900 | | CDS upon the occurrence of a negative credit event(8) | | fixed rate of 0.57% | | (9 | ) |
| | 8/15/21 | | 24,500 | | ZCS at maturity | | compounded 3 month LIBOR | | 1,023 | |
| | | | | | upon the occurrence of a negative credit event(17) | | | | | |
JPMorgan Chase | | 12/20/10 | | 1,000 | | CDS | | fixed rate of 4.15% | | 79 | |
| | 11/7/21 | | 44,000 | | IRS zero coupon, resets to 3.96% on 11/7/08 | | compounded 3 month LIBOR | | (252 | ) |
| | | | | | | | | | | |
Lehman Brothers | | 12/20/11 | | 1,700 | | CDS fixed rate of 0.22% | | upon the occurrence of a negative credit event(14) | | 6 | |
| | 12/20/11 | | 1,750 | | CDS fixed rate of 0.20% | | upon the occurrence of a negative credit event(12) | | 24 | |
| | 12/20/11 | | 3,550 | | CDS fixed rate of 0.12% | | upon the occurrence of a negative credit event(15) | | @— | |
| | 2/2/15 | | 65,000 | | IRS fixed rate of 5.10% | | compounded 3 month LIBOR | | (126 | ) |
| | | | | | | | | | $ | 4,849 | |
| | | | | | | | | | | | | |
136
2007 Semi-Annual Report |
| |
March 31, 2007 (unaudited) |
Notes to Financial Statements (cont’d)
(1) | Receipt of $1,000,000 or $10,000,000, in the event of a failure to pay or default, respectively, by the issuer of Tyco International Ltd, Zero Coupon Bond Maturing 11/17/20. |
(2) | Receipt of $1,000,000 or $10,000,000, in the event of a failure to pay or default, respectively, by the issuer of Tyco International Ltd., 6.375% Bond Maturing 10/15/11. |
(3) | Receipt of $1,000,000 in the event of a failure to pay by the Dow Jones CDX North America Investment Grade High Volatility Index, Series 6. |
(4) | Payment of $1,000,000 or $10,000,000, in the event of a failure to pay or default, respectively, by the issuer of Ford Motor Credit Co., 7.00% Bond Maturing 10/1/13. |
(5) | Receipt of $1,000,000 in the event of a failure to pay by the Dow Jones CDX North America Investment Grade High Volatility Index, Series 7. |
(6) | Receipt of $1,000,000 or $10,000,000, in the event of a failure to pay or default, respectively, by the issuer of The Chubb Corp., 6.00% Bond Maturing 11/15/11. |
(7) | Receipt of $1,000,000 or $10,000,000, in the event of a failure to pay or default, respectively, by the issuer of The Gap, Inc., 8.80% Bond Maturing 812/15/08. |
(8) | Payment of $1,000,000 or $10,000,000, in the event of a failure to pay or default, respectively, by the issuer of Countrywide Home Loans, Inc., 4.00% Bond Maturing 3/22/11. |
(9) | Payment of $1,000,000 or $10,000,000, in the event of a failure to pay or default, respectively, by the issuer of Residential Capital, LLC, 6.375% Bond Maturing 6/30/10. |
(11) | Payment of $1,000,000 or $10,000,000, in the event of a failure to pay or default, respectively, by the issuer of Residential Capital, LLC, 6.50% Bond Maturing 4/17/13. |
(12) | Receipt of $1,000,000 or $10,000,000, in the event of a failure to pay or default, respectively, by the issuer of Union Pacific Corp., 6.125% Bond Maturing 1/15/12. |
(13) | Receipt of $1,000,000 or $10,000,000, in the event of a failure to pay or default, respectively, by the issuer of Motorola, Inc., 6.50% Bond Maturing 9/1/25. |
(14) | Receipt of $1,000,000 or $10,000,000, in the event of a failure to pay or default, respectively, by the issuer of Southwest Airlines Co., 6.50% Bond Maturing 3/1/12. |
(15) | Receipt of $1,000,000 or $10,000,000, in the event of a failure to pay or default, respectively, by the issuer of The Hartford Financial Services Group, Inc., 4.75% Bond Maturing 3/1/14. |
(16) | Receipt of $1,000,000 or $10,000,000, in the event of a failure to pay or default, respectively, by the issuer of Dell Inc., 7.10% Bond Maturing 4/15/28. |
(17) | Payment of $1,000,000 or $10,000,000, in the event of a failure to pay or default, respectively, by the issuer of General Motors Acceptance Corp., 6.875% Bond Maturing 8/28/12. |
(18) | Receipt of $1,000,000 or $10,000,000, in the event of a failure to pay or default, respectively, by the issuer of Lehman Brothers Holdings Inc, 6.625% Bond Maturing 1/18/12. |
(19) | Receipt of $1,000,000 or $10,000,000, in the event of a failure to pay or default, respectively, by the issuer of Tyco International Ltd., 2.75% Bond Maturing 1/15/18. |
@ | — Value is less than $500. |
bps | — Basis Points |
CDS | — Credit Default Swap |
IRS | — Interest Rate Swap |
LIBOR | — London Inter Bank Offer Rate |
ZCS | — Zero Coupon Interest Rate Swap |
H. Securities Lending. Certain Portfolios may lend securities to qualified financial institutions, such as broker-dealers, to earn additional income. Any increase or decrease in the fair value of the securities loaned that might occur and any interest earned or dividends declared on those securities during the term of the loan would remain in the Portfolio. Portfolios that lend securities receive cash or securities as collateral in an amount equal to or exceeding 100% of the current fair value of the loaned securities. The collateral is marked to market daily, by the securities lending agent, to ensure that a minimum of 100% collateral coverage is maintained.
Based on pre-established guidelines, the securities lending agent invests any cash collateral that is received in high-quality short-term investments. Securities lending income is generated
137
2007 Semi-Annual Report |
| |
March 31, 2007 (unaudited) |
Notes to Financial Statements (cont’d)
from the earnings on the invested collateral and borrowing fees, less any rebates owed to the borrowers and compensation to the lending agent, and is included in the Portfolios’ Statements of Operations in interest income. Risks in securities lending transactions are that a borrower may not provide additional collateral when required or return the securities when due, and that the value of the short-term investments will be less than the amount of cash collateral plus any rebate that is required to be returned to the borrower. The value of loaned securities and related collateral outstanding at March 31, 2007 are as follows:
| | Value of | | | |
| | Loaned | | Value of | |
| | Securities | | Collateral | |
Portfolio | | (000) | | (000) | |
| | | | | |
Balanced | | $ | 13,213 | | $ | 13,479 | |
Value | | 18,537 | | 18,781 | |
Core Fixed Income | | 19,914 | | 20,548 | |
Core Plus Fixed Income | | 287,205 | | 295,042 | |
High Yield | | 48,378 | | 49,300 | |
Investment Grade Fixed Income | | 26,372 | | 26,989 | |
| | | | | | | |
The following Portfolios had income from securities lending (after rebates to borrowers and allocation to the securities lending agent):
| | Net Interest | |
| | Earned by | |
| | Portfolio | |
Portfolio | | (000) | |
| | | |
Balanced | | $ | 8 | |
Value | | 25 | |
Core Fixed Income | | 18 | |
Core Plus Fixed Income | | 175 | |
High Yield | | 50 | |
Investment Grade Fixed Income | | 27 | |
| | | | |
I. Federal Income Taxes. It is each Portfolio’s intention to continue to qualify as a regulated investment company and distribute all of its taxable income. Accordingly, no provision for Federal income taxes is required in the financial statements. Dividend income and distributions to shareholders are recorded on the ex-dividend date. Interest income is recognized on the accrual basis. Dividends from net investment income, if any, are declared and paid quarterly except for those of the Intermediate Duration, Limited Duration and Municipal Portfolios which are declared and paid monthly and those of the International Fixed Income, Mid Cap Growth, U.S. Mid Cap Value and U.S. Small Cap Value Portfolios which are declared and paid annually. Net realized capital gains are distributed at least annually.
The tax character of the Municipal Portfolio’s ordinary income distributions include tax exempt as well as taxable components. The undistributed ordinary income for the Municipal Portfolio includes tax exempt as well as taxable components.
The tax character for distributions paid may differ from the character of distributions shown on the Statements of Changes in Net Assets due to short-term capital gains being treated as ordinary income for tax purposes. The tax character of distributions paid during fiscal 2006 and 2005 were as follows:
| | 2006 | | 2005 | |
| | Distributions
PaidFrom: | | Distributions
PaidFrom: | |
| | Ordinary | | Long-term | | Ordinary | | Long-term | |
| | Income | | Capital Gain | | Income | | Capital Gain | |
Portfolio | | (000) | | (000) | | (000) | | (000) | |
| | | | | | | | | |
Balanced | | $ | 6,745 | | $ | — | | $ | 6,214 | | $ | — | |
U.S. Mid Cap Value | | 1,077 | | — | | 1,000 | | — | |
U.S. Small Cap Value | | 9,470 | | 29,317 | | 168 | | 35,235 | |
Value | | 21,148 | | 105,355 | | 20,460 | | — | |
Core Fixed Income | | 13,189 | | 1,081 | | 13,772 | | — | |
Core Plus Fixed Income | | 137,775 | | — | | 114,188 | | — | |
Equities Plus | | 150 | | — | | — | | — | |
High Yield | | 17,160 | | — | | 22,613 | | — | |
Intermediate Duration | | 10,476 | | — | | 7,377 | | 311 | |
International Fixed Income | | 7,333 | | 161 | | 9,623 | | — | |
Investment Grade Fixed Income | | 26,432 | | 287 | | 29,390 | | — | |
Limited Duration | | 44,031 | | — | | 30,593 | | — | |
Municipal | | 21,892 | | — | | 14,606 | | — | |
| | | | | | | | | | | | | |
The amount and character of income and gains to be distributed are determined in accordance with income tax regulations which may differ from U.S. generally accepted accounting principles. The book/tax differences are either considered temporary or permanent in nature.
Temporary differences are generally due to differing book and tax treatments in the timing of the recognition of gains or losses on securities, forwards and futures, including Post October losses.
Permanent differences are generally due to REIT adjustments, foreign currency transactions, swap transactions, distribution reclass, paydown adjustments and in-kind redemptions.
138
2007 Semi-Annual Report |
| |
March 31, 2007 (unaudited) |
Notes to Financial Statements (cont’d)
These resulted in the following reclassifications among the Portfolios’ components of net assets September 30, 2006:
| | Accumulated | | | | | |
| | Undistributed | | | | | |
| | (Distributions in | | | | | |
| | Excess of) Net | | Accumulated Net | | | |
| | Investment | | Realized Gain | | Paid-in | |
| | Income (Loss) | | (Loss) | | Capital | |
Portfolio | | (000) | | (000) | | (000) | |
Balanced | | $ | 473 | | $ | (380 | ) | $ | (93 | ) |
Equities Plus | | 32 | | (31 | ) | (1 | ) |
Mid Cap Growth | | — | | (38,575 | ) | 38,575 | |
U.S. Small Cap Value | | (43 | ) | 86 | | (43 | ) |
Value | | — | | (80,766 | ) | 80,766 | |
Core Fixed Income | | 3,733 | | (3,406 | ) | (327 | ) |
Core Plus Fixed Income | | 36,996 | | (34,107 | ) | (2,889 | ) |
High Yield | | 331 | | 4,494 | | (4,825 | ) |
Intermediate Duration | | 383 | | (383 | ) | — | |
International Fixed Income | | 1,142 | | (1,142 | ) | — | |
Investment Grade Fixed Income | | 7,716 | | (7,062 | ) | (654 | ) |
Limited Duration | | 2,262 | | (2,118 | ) | (144 | ) |
Municipal | | 5,060 | | (4,536 | ) | (524 | ) |
| | | | | | | | | | |
At September 30, 2006, the components of distributable earnings on a tax basis were as follows:
| | Undistributed | | Undistributed | |
| | Ordinary | | Long-Term | |
| | Income | | Capital Gain | |
Portfolio | | (000) | | (000) | |
Balanced | | $ | 2,542 | | $ | — | |
Equities Plus | | 476 | | 168 | |
Mid Cap Growth | | 4,668 | | — | |
U.S. Mid Cap Value | | 709 | | — | |
U.S. Small Cap Value | | 13,223 | | 56,717 | |
Value | | 8,348 | | 47,475 | |
Core Fixed Income | | 4,343 | | — | |
Core Plus Fixed Income | | 44,807 | | — | |
High Yield | | 5,501 | | — | |
Intermediate Duration | | 1,689 | | — | |
International Fixed Income | | 3,975 | | — | |
Investment Grade Fixed Income | | 9,378 | | — | |
Limited Duration | | 8,576 | | — | |
Long Duration Fixed Income | | 258 | | 49 | |
Municipal | | 2,746 | | — | |
| | | | | | | |
At March 31, 2007, cost, unrealized appreciation, unrealized depreciation and net unrealized appreciation (depreciation) of components securities for Federal income tax purposes were:
| | | | | | | | Net | |
| | | | | | | | Unrealized | |
| | | | | | | | Appreciation | |
| | Cost | | Appreciation | | Depreciation | | (Depreciation) | |
Portfolio | | (000) | | (000) | | (000) | | (000) | |
| | | | | | | | | | | | | |
Balanced | | $ | 270,262 | | $ | 43,235 | | $ | (4,277 | ) | $ | 38,958 | |
Equities Plus | | 27,625 | | 82 | | (248 | ) | (166 | ) |
Mid Cap Growth | | 2,045,761 | | 397,859 | | (53,083 | ) | 344,776 | |
U.S. Mid Cap Value | | 135,589 | | 23,487 | | (2,017 | ) | 21,470 | |
U.S. Small Cap Value | | 702,269 | | 173,429 | | (10,492 | ) | 162,937 | |
Value | | 538,225 | | 76,904 | | (8,754 | ) | 68,150 | |
Core Fixed Income | | 344,425 | | 1,866 | | (3,477 | ) | (1,611 | ) |
Core Plus Fixed Income | | 3,122,018 | | 26,919 | | (39,841 | ) | (12,922 | ) |
High Yield | | 289,720 | | 6,186 | | (36,672 | ) | (30,486 | ) |
Intermediate Duration | | 153,141 | | 510 | | (1,146 | ) | (636 | ) |
International Fixed Income | | 199,553 | | 7,612 | | (3,166 | ) | 4,446 | |
Investment Grade Fixed Income | | 572,708 | | 2,820 | | (4,914 | ) | (2,094 | ) |
Limited Duration | | 1,081,709 | | 2,139 | | (6,086 | ) | (3,947 | ) |
Long Duration Fixed Income | | 24,979 | | 741 | | (8 | ) | 733 | |
Municipal | | 814,083 | | 28,396 | | (3,664 | ) | 24,732 | |
At September 30, 2006, the following Portfolios had available for Federal income tax purposes unused capital losses, which will expire on the indicated dates:
| | Expiration Date September 30, | |
| | (000) | |
Portfolio | | 2007 | | 2008 | | 2009 | | 2010 | |
Balanced | | $ | — | | $ | — | | $ | — | | $ | 824 | |
Mid Cap Growth | | — | | — | | — | | 487,230 | |
U.S. Mid Cap Value | | — | | — | | — | | 14,755 | |
Core Fixed Income | | — | | — | | — | | — | |
Core Plus Fixed Income | | — | | — | | — | | — | |
High Yield | | 718 | | 12,236 | | 26,962 | | 20,212 | |
Intermediate Duration | | — | | — | | — | | — | |
Investment Grade Fixed Income | | — | | — | | — | | — | |
Limited Duration | | — | | — | | — | | — | |
Municipal | | — | | — | | — | | — | |
| | | | | | | | | | | | | |
139
2007 Semi-Annual Report |
| |
March 31, 2007 (unaudited) |
Notes to Financial Statements (cont’d)
| | Expiration Date September 30, | |
| | (000) | |
Portfolio | | 2011 | | 2012 | | 2013 | | 2014 | | Total | |
| | | | | | | | | | | |
Balanced | | $ | 40,947 | | $ | — | | $ | — | | $ | — | | $ | 41,771 | |
Mid Cap Growth | | 303,325 | | — | | — | | — | | 790,555 | |
U.S. Mid Cap Value | | 157,636 | | — | | — | | — | | 172,391 | |
Core Fixed Income | | — | | — | | — | | 708 | | 708 | |
Core Plus Fixed Income | | 36,930 | | — | | — | | 7,135 | | 44,065 | |
High Yield | | 183,778 | | 205,458 | | 11,840 | | 874 | | 462,078 | |
Intermediate Duration | | — | | — | | 673 | | 1,559 | | 2,232 | |
Investment Grade Fixed Income | | — | | — | | — | | 881 | | 881 | |
Limited Duration | | — | | — | | 8,253 | | 8,229 | | 16,482 | |
Municipal | | — | | 238 | | 1,045 | | — | | 1,283 | |
| | | | | | | | | | | | | | | | |
In addition to the $462,078,000 in unused capital losses attributed to the High Yield Portfolio in the table above, approximately $61,138,000 has been brought forward as a result of the Portfolio’s merger with the MSIF High Yield II Portfolio. The utilization of the capital loss carryforward in subsequent years may be limited pursuant to sections 382 and 383 of the Internal Revenue Code. This acquired capital loss carryforward is expected to expire between 2007-2014.
To the extent that capital loss carryforwards are used to offset any future capital gains realized during the carryforward period as provided by U.S. Federal income tax regulations, no capital gains tax liability will be incurred by a portfolio for gains realized and not distributed. To the extent that capital gains are offset, such gains will not be distributed to the shareholders.
During the year ended September 30, 2006, the following Portfolios utilized capital loss carryforwards for U.S. Federal income tax purposes of approximately:
| | Capital Loss | |
| | Carryforward | |
| | Utilized | |
Portfolio | | (000) | |
Balanced | | $ | 22,763 | |
Mid Cap Growth | | 112,243 | |
U.S. Mid Cap Value | | 21,792 | |
Municipal | | 1,476 | |
| | | | |
Under current tax law, certain capital and net foreign exchange losses realized after October 31 may be deferred and treated as occurring on the first day of the following fiscal year. For the year ended September 30, 2006, the following Portfolios elected to defer capital and currency losses occurring between November 1, 2005 and September 30, 2006 up to the following amounts:
| | Post-October | |
| | Capital | | Currency | |
| | Losses | | Losses | |
Portfolio | | (000) | | (000) | |
Balanced | | $ | — | | $ | 693 | |
Core Plus Fixed Income | | 18,017 | | — | |
High Yield | | 3,848 | | — | |
Intermediate Duration | | 5,599 | | — | |
International Fixed Income | | 180 | | — | |
Limited Duration | | 8,124 | | — | |
Municipal | | 747 | | — | |
| | | | | | | |
J. Contractual Obligations. The Fund enters into contracts that contain a variety of indemnifications. The Fund’s maximum exposure under these arrangements is unknown. However, the Fund has not had prior claims or losses pursuant to these contracts and expects the risk of loss to be remote.
K. Other. The High Yield Portfolio’s net assets are substantially comprised of high yield fixed income securities. The financial condition of an issuer of these securities and general economic and industry specific conditions may affect an issuer’s ability to make payments of income and principal on these securities and ultimately impact their valuation.
A portion of the securities of the Municipal Portfolio are insured by certain companies specializing in the insurance of municipal debt obligations. At March 31, 2007, approximately 83.0% of the net assets of the Municipal Portfolio are covered by such insurance. Listed below are the insurers that insure obligations constituting more than 10% of the Portfolio’s net assets:
| | % of | |
| | Portfolio's | |
Insurers | | Net Assets | |
AMBAC | | 29.5 | % |
MBIA | | 23.5 | |
FGIC | | 13.1 | |
140
2007 Semi-Annual Report |
| |
March 31, 2007 (unaudited) |
Notes to Financial Statements (cont’d)
At March 31, 2007, certain Portfolios had otherwise unaffiliated record owners of 10% or greater. Investment activities of these shareholders could have a material impact on these Portfolios. These Portfolios and the aggregate percentage of such owners was as follows:
| | Percentage of Ownership | |
| | Institutional | | Investment | | Adviser | |
Portfolio | | Class | | Class | | Class | |
| | | | | | | |
Balanced | | 79.9 | % | 98.5 | % | 96.6 | % |
Mid Cap Growth | | 28.3 | | — | | 81.9 | |
U.S. Mid Cap Value | | 62.0 | | 85.2 | | 75.8 | |
U.S. Small Cap Value | | 14.4 | | — | | 81.5 | |
Value | | 55.5 | | 100.0 | | 94.8 | |
Core Fixed Income | | — | | — | | 100.0 | |
Core Plus Fixed Income | | 23.2 | | 96.2 | | 91.1 | |
Equities Plus | | — | | — | | — | |
High Yield | | 19.6 | | — | | 74.9 | |
Intermediate Duration | | 52.7 | | 100.0 | | — | |
International Fixed Income | | 10.7 | | — | | — | |
Investment Grade Fixed Income | | 22.7 | | — | | 12.1 | |
Limited Duration | | 92.4 | | — | | — | |
Long Duration Fixed Income | | — | | — | | — | |
Municipal | | 11.9 | | — | | — | |
L. Reverse Stock Split. After the close of business on November 10, 2006, High Yield Portfolio effected a 2 for 1 reverse stock split for the shares of the Portfolio. All transactions in capital stock and per share data prior to November 13, 2006 have been restated to give effect to the reverse stock split. The reverse stock split had no impact on the overall value of a shareholder’s investment in the Portfolio.
M. Supplemental Proxy Information. On August 1, 2006, a Special Meeting of Shareholders of the Fund was scheduled in order to vote on the proposals set forth below. In the case of certain proposals listed below the quorum necessary in order to hold the meeting was not obtained, and, therefore, the meeting was adjourned several times, most recently until November 30, 2006, to permit further solicitation of proxies.
(1) Modify fundamental policy regarding diversification:
Portfolio | | For | | Withhold | | Abstain | | BNV* | |
| | | | | | | | | |
Limited Duration(1) | | 60,095,819 | | 1,486,547 | | 3,470,494 | | 48,067641 | |
Mid Cap Growth(1) | | 28,954,878 | | 984,745 | | 1,163,922 | | 10,859,919 | |
U.S. Mid Cap Value(2) | | 1,701,614 | | 14,882 | | 22,207 | | 587,051 | |
U.S. Small Cap Value(2) | | 14,113,139 | | 319,848 | | 596,434 | | 121,021 | |
(2) Modify fundamental policy regarding borrowing money:
Portfolio | | For | | Withhold | | Abstain | | BNV* | |
| | | | | | | | | |
International Fixed | | | | | | | | | |
Income(2) | | 6,604,816 | | 528,990 | | 226,384 | | 34,279 | |
Limited Duration(1) | | 59,449,167 | | 2,023,110 | | 3,580,583 | | 48,067,641 | |
Mid Cap Growth(1) | | 28,368,304 | | 1,481,322 | | 1,253,920 | | 10,859,919 | |
U.S. Mid Cap Value(2) | | 1,674,815 | | 41,814 | | 22,074 | | 587,051 | |
U.S. Small Cap Value(2) | | 13,957,980 | | 447,741 | | 623,700 | | 121,021 | |
(3) Modify fundamental policy regarding loans:
Portfolio | | For | | Withhold | | Abstain | | BNV* | |
| | | | | | | | | |
International Fixed | | | | | | | | | |
Income(2) | | 6,588,940 | | 527,773 | | 243,477 | | 34,279 | |
Limited Duration(1) | | 59,496,840 | | 1,934,807 | | 3,621,213 | | 48,067,641 | |
Mid Cap Growth(1) | | 28,400,745 | | 1,443,985 | | 1,258,816 | | 10,859,919 | |
U.S. Mid Cap Value(2) | | 1,668,167 | | 48,722 | | 21,814 | | 587,051 | |
U.S. Small Cap Value(2) | | 13,957,323 | | 450,022 | | 622,076 | | 121,021 | |
(4) Modify fundamental policy regarding investment in commodities, commodity contracts and futures contracts:
Portfolio | | For | | Withhold | | Abstain | | BNV* | |
| | | | | | | | | |
International Fixed Income(2) | | 6,613,522 | | 516,155 | | 230,513 | | 34,279 | |
Limited Duration(1) | | 59,714,755 | | 1,913,234 | | 3,424,871 | | 48,067,641 | |
Mid Cap Growth(1) | | 28,664,379 | | 1,181,101 | | 1,258,065 | | 10,859,919 | |
U.S. Mid Cap Value(2) | | 1,676,052 | | 42,845 | | 19,806 | | 587,051 | |
U.S. Small Cap Value(2) | | 14,000,464 | | 416,168 | | 312,789 | | 121,021 | |
(5) Modify fundamental policy regarding issuance of senior securities:
Portfolio | | For | | Withhold | | Abstain | | BNV* | |
| | | | | | | | | |
International Fixed | | | | | | | | | |
Income(2) | | 6,606,810 | | 516,132 | | 237,248 | | 34,279 | |
Limited Duration(1) | | 60,084,240 | | 1,593,397 | | 3,375,224 | | 48,067,641 | |
Mid Cap Growth(1) | | 28,629,297 | | 1,220,141 | | 1,254,107 | | 10,859,919 | |
U.S. Mid Cap Value(2) | | 1,670,073 | | 44,091 | | 24,539 | | 587,051 | |
U.S. Small Cap Value(2) | | 14,034,107 | | 395,689 | | 599,625 | | 121,021 | |
(1) Meeting was held on October 30, 2006.
(2) Meeting was held on November 30, 2006.
* Broker “non-votes” are shares held in street name for which the broker indicates that instructions have not been received from the beneficial owners or other persons entitled to vote and for which the broker does not have discretionary voting authority.
141
2007 Semi-Annual Report | |
| |
March 31, 2007 (unaudited) | |
Notes to Financial Statements (cont’d)
N. Subsequent Events. On February 20, 2007, the Trustees authorized the addition of the Adviser Share Class for the Municipal Portfolio. The new share class will become effective on April 30, 2007.
142
2007 Semi-Annual Report |
| |
March 31, 2007 (unaudited) |
Trustee and Officer Information
Trustees |
|
Frank L. Bowman |
|
Michael Bozic |
|
Kathleen A. Dennis |
|
James F. Higgins |
|
Dr. Manuel H. Johnson |
|
Joseph J. Kearns |
|
Michael F. Klein |
|
W. Allen Reed |
|
Fergus Reid |
|
Investment Adviser and Administrator |
|
Morgan Stanley Investment Management Inc. |
1221 Avenue of the Americas |
New York, NY 10020 |
|
Distributor |
|
Morgan Stanley Distribution, Inc. |
One Tower Bridge |
100 Front Street, Suite 1100 |
West Conshohocken, PA 19428-2899 |
|
Custodian |
|
JPMorgan Chase Bank, N.A. |
270 Park Avenue |
New York, NY 10017 |
|
Legal Counsel |
|
Clifford Chance US LLP |
31 West 52nd Street |
New York, NY 10019-6131 |
|
Independent Registered Public Accounting Firm |
|
Ernst & Young LLP |
200 Clarendon Street |
Boston, MA 02116-5072 |
|
Officers |
|
Michael E. Nugent |
Chairman of the Board and Trustee |
|
Ronald E. Robison |
President and Principal Executive Officer |
|
J. David Germany |
Vice President |
|
Dennis F. Shea |
Vice President |
|
Amy R. Doberman |
Vice President |
|
Carsten Otto |
Chief Compliance Officer |
|
Stefanie V. Chang Yu |
Vice President |
|
Mary E. Mullin |
Secretary |
|
James W. Garrett |
Treasurer and Chief Financial Officer |
|
Michael J. Leary |
Assistant Treasurer |
Reporting to Shareholders
Each Morgan Stanley fund provides a complete schedule of portfolio holdings in its semi-annual and annual reports within 60 days of the end of the Fund’s second and fourth fiscal quarters. The semi-annual reports and the annual reports are filed electronically with the Securities and Exchange Commission (SEC) on Form N-CSRS and Form N-CSR, respectively. Morgan Stanley also delivers the semi-annual and annual reports to Fund shareholders and makes these reports available on its public website, www.morganstanley.com. Each Morgan Stanley fund also files a complete schedule of portfolio holdings with the SEC for the Fund’s first and third fiscal quarters on Form N-Q. Morgan Stanley does not deliver the reports for the first and third fiscal quarters to shareholders, nor are the reports posted to the Morgan Stanley public website. You may, however, obtain the Form N-Q filings (as well as the Form N-CSR and NCSRS filings) by accessing the SEC’s website, http:/www.sec.gov. You may also review and copy them at the SEC’s public reference room in Washington, DC. Information on the operation of the SEC’s Public Reference Room may be obtained by calling the SEC at 1(800) SEC-0330. You can also request copies of these materials, upon payment of a duplicating fee, by electronic request at the SEC’s email address (publicinfo@sec.gov) or by writing the Public Reference section of the SEC, Washington, DC 20549-0102.
Proxy Voting Policies and Procedures and Proxy Voting Record
You may obtain a copy of the Fund’s Proxy Voting Policy and Procedures and information regarding how the Fund voted proxies relating to portfolio securities during the most recent twelve-month period ended June 30, without charge, upon request, by calling toll-free 1(800) 354-8185 or by visiting our website at www.morganstanley.com/im. This information is also available on the SEC’s website at http://www.sec.gov.
This report is authorized for distribution only when preceded or accompanied by the prospectus of the Morgan Stanley Institutional Fund Trust which describes in detail each Investment Portfolio’s investment policies, risks, fees and expenses. Please read the prospectus carefully before you invest or send money. For additional information, including information regarding the investments comprising the Portfolio, please visit our website at www.morganstanley.com/im or call 1(800) 354-8185.
143
Printed in U.S.A.
This Report has been prepared for shareholders and may be distributed to others only if preceded or accompanied by a current prospectus.
Morgan Stanley Investment Management Inc.
1221 Avenue of the Americas
New York, NY 10020
Investment Adviser: (610) 940-5000 • MSIF Trust (800) 354-8185
© 2007 Morgan Stanley

| | IFEQIFISAN 3/07
IU07-01036P-T03/07 |
Morgan Stanley Investment Management

Morgan Stanley
Institutional Fund Trust
Advisory Portfolios
Advisory
Advisory Global Fixed Income
Advisory Global Fixed Income II
March 31, 2007
Semi-Annual
Report
2007 Semi-Annual Report |
| |
March 31, 2007 (unaudited) |
Table of Contents
Shareholders’Letter | 2 |
Expense Examples | 3 |
Portfolios of Investments | |
Advisory Portfolios: | |
Advisory | 4 |
Advisory Global Fixed Income | 9 |
Advisory Global Fixed Income II | 11 |
| |
Statements of Assets and Liabilities | 12 |
Statements of Operations | 13 |
Statements of Changes in Net Assets | 14 |
Statement of Cash Flows | 15 |
Financial Highlights | 16 |
Notes to Financial Statements | 19 |
Trustee and Officer Information | 28 |
This report is authorized for distribution only when preceded or accompanied by prospectuses of the Morgan Stanley Institutional Fund Trust. To receive a prospectus and/or SAI, which contains more complete information such as investment objectives, charges, expenses, policies for voting proxies, risk considerations, and describes in detail each of the Portfolio’sospective investor, please call 1 (800) 354-8185. Please read the prospectus carefully before you invest or send money.
1
2007 Semi-Annual Report | |
| |
March 31, 2007 (unaudited) | |
Shareholders’ Letter
Dear Shareholders:
We are pleased to present to you the Morgan Stanley Institutional Fund Trust’s (the “Fund”) Semi-Annual Report for the six months ended March 31, 2007. Our Fund currently consists of 18 portfolios. The Fund’s portfolios, together with the portfolios of the Morgan Stanley Institutional Fund, Inc., provide investors with a means to help them meet specific investment needs and to allocate their investments among equities (e.g., value and growth; small, medium, and large capitalization), and fixed income (e.g., short, medium, and long duration; investment grade and high yield).
Sincerely,

Ronald E. Robison
President and Principal Executive Officer
April 2007
2
2007 Semi-Annual Report |
| |
March 31, 2007 (unaudited) |
Expense Examples
As a shareholder of a Portfolio, you incur ongoing costs, including management fees and other Portfolio expenses. These examples are intended to help you understand your ongoing costs (in dollars) of investing in each Portfolio and to compare these costs with the ongoing costs of investing in other mutual funds.
The examples are based on an investment of $1,000 invested at the beginning of the six-month period ended March 31, 2007 and held for the entire six-month period.
Actual Expenses
The first line of the tables below provides information about actual account values and actual expenses. You may use the information in this line, together with the amount you invested, to estimate the expenses that you paid over the period. Simply divide your account value by $1,000 (for example, an $8,600 account value divided by $1,000 = 8.6), then multiply the result by the number in the first line under the heading entitled “Expenses Paid During Period” to estimate the expenses you paid on your account during this period.
Please note that “Expenses Paid During Period” are grossed up to reflect Portfolio expenses prior to the effect of Expense Offset (See Note E in the Notes to Financial Statements). Therefore, the annualized net expense ratios may differ from the ratio of expenses to average net assets shown in the Financial Highlights.
Hypothetical Example for Comparison Purposes
The second line of the tables below provides information about hypothetical account values and hypothetical expenses based on a Portfolio’s actual expense ratio and an assumed rate of return of 5% per year before expenses, which is not the Portfolio’s actual return. The hypothetical account values and expenses may not be used to estimate the actual ending account balance or expenses you paid for the period. You may use this information to compare the ongoing costs of investing in a Portfolio and other funds. To do so, compare this 5% hypothetical example with the 5% hypothetical examples that appear in the shareholder reports of the other funds.
| | Beginning Account Value | | Ending Account Value | | Expenses Paid During Period* | |
| | October 1, 2006 | | March 31, 2007 | | October 1, 2006— March 31, 2007 | |
Advisory Portfolio | | | | | | | |
Institutional Class | | | | | | | |
Actual | | $ | 1,000.00 | | $ | 1,029.80 | | $ | 0.40 | |
Hypothetical (5% average annual return before expenses) | | 1,000.00 | | 1,024.53 | | 0.40 | |
| | | | | | | | | | |
* Expenses are equal to Institutional Class’ annualized net expense ratio of 0.08%, multiplied by the average account value over the period, multiplied by 182/365 (to reflect the one-half year period).
Advisory Global Fixed Income Portfolio | | | | | | | |
Institutional Class | | | | | | | |
Actual | | $ | 1,000.00 | | $ | 1,041.60 | | $ | 0.61 | |
Hypothetical (5% average annual return before expenses) | | 1,000.00 | | 1,024.33 | | 0.61 | |
| | | | | | | | | | |
* Expenses are equal to Institutional Class’ annualized net expense ratio of 0.12%, multiplied by the average account value over the period, multiplied by 182/365 (to reflect the one-half year period).
Advisory Global Fixed Income Portfolio II | | | | | | |
Institutional Class | | | | | | | |
Actual | | $ | 1,000.00 | | $ | 1,020.40 | | $ | 0.76 | |
Hypothetical (5% average annual return before expenses) | | 1,000.00 | | 1,024.18 | | 0.76 | |
| | | | | | | | | | |
* Expenses are equal to Institutional Class’ annualized net expense ratio of 0.15%, multiplied by the average account value over the period, multiplied by 182/365 (to reflect the one-half year period).
3
2007 Semi-Annual Report | |
| |
March 31, 2007 (unaudited) | |
Portfolio of Investments
Advisory Portfolio
| | | | Face | | | |
| | | | Amount | | Value | |
| | | | (000) | | (000) | |
Fixed Income Securities (103.1%) | | | | | | | |
Agency Adjustable Rate Mortgages (5.6%) | | | | | | | |
Federal Home Loan Mortgage Corp., | | | | | | | |
Adjustable Rate Mortgages: | | | | | | | |
3.53%, 5/1/34 | | | | $ | 2,189 | | $ | 2,137 | |
5.58%, 11/1/36 | | | | 11,664 | | 11,763 | |
5.70%, 4/1/37 | | | | 32,483 | | 32,627 | |
5.81%, 1/1/37 | | | | 20,411 | | 20,563 | |
Federal National Mortgage Association, | | | | | | | |
Adjustable Rate Mortgage: | | | | | | | |
3.75%, 6/1/34 | | | | 47 | | 48 | |
4.88%, 5/1/35 | | | | 4,226 | | 4,230 | |
5.03%, 3/1/37 | | | | 5,240 | | 5,231 | |
5.74%, 12/25/08 | | | | 102 | | 102 | |
6.12%, 4/1/37 | | | | 30,736 | | 31,117 | |
7.42%, 4/1/36 | | | | 29,731 | | 31,012 | |
Government National Mortgage Association, | | | | | | | |
Adjustable Rate Mortgages: | | | | | | | |
5.38%, 5/20/24 - 1/20/28 | | | | 24,699 | | 25,007 | |
5.75%, 7/20/25 - 9/20/27 | | | | 4,079 | | 4,129 | |
6.13%, 10/20/25 - 12/20/27 | | | | 5,558 | | 5,636 | |
| | | | | | 173,602 | |
Agency Fixed Rate Mortgages (25.8%) | | | | | | | |
Federal Home Loan Mortgage Corp., | | | | | | | |
Conventional Pools: | | | | | | | |
8.00%, 4/1/08 - 7/1/08 | | | | 7 | | 7 | |
8.25%, 11/1/07 - 7/1/08 | | | | @— | | @— | |
8.75%, 4/1/08 | | | | 2 | | 2 | |
9.00%, 10/1/16 | | | | 20 | | 21 | |
9.50%, 10/1/16 - 3/1/20 | | | | 925 | | 1,006 | |
10.00%, 1/1/09 - 12/1/20 | | | | 2,371 | | 2,593 | |
10.25%, 1/1/09 - 12/1/11 | | | | 14 | | 14 | |
10.50%, 11/1/08 - 12/1/20 | | | | 1,129 | | 1,233 | |
11.00%, 2/1/11 - 9/1/20 | | | | 659 | | 726 | |
11.25%, 6/1/10 - 12/1/15 | | | | 10 | | 10 | |
11.50%, 12/1/09 - 9/1/19 | | | | 439 | | 478 | |
11.75%, 8/1/14 - 4/1/15 | | | | 35 | | 39 | |
12.00%, 10/1/09 - 7/1/20 | | | | 496 | | 549 | |
12.50%, 10/1/09 - 6/1/15 | | | | 47 | | 51 | |
13.00%, 9/1/10 - 11/1/13 | | | | 2 | | 2 | |
13.50%, 2/1/10 | | | | 1 | | 2 | |
Gold Pools: | | | | | | | |
6.00%, 10/1/28 - 12/1/28 | | | | 518 | | 527 | |
6.50%, 5/1/21 - 11/1/33 | | | | 5,736 | | 5,900 | |
7.00%, 12/1/26 - 11/1/32 | | | | 17,068 | | 17,728 | |
7.50%, 2/1/23 - 1/1/34 | | | | 34,797 | | 36,409 | |
8.00%, 5/1/20 - 12/1/31 | | | | 16,414 | | 17,283 | |
8.50%, 10/1/10 - 7/1/31 | | | | 38,685 | | 41,567 | |
9.00%, 10/1/17 - 1/1/31 | | | | 3,357 | | 3,638 | |
9.50%, 11/1/16 - 12/1/22 | | | | 1,324 | | 1,440 | |
10.00%, 6/1/17 - 4/1/25 | | | | 912 | | 997 | |
10.50%, 7/1/19 - 3/1/21 | | | | 348 | | 387 | |
11.00%, 7/1/17 - 9/1/20 | | | | 223 | | 242 | |
11.50%, 1/1/16 - 6/1/20 | | | | 124 | | 135 | |
12.00%, 6/1/20 | | | | 324 | | 348 | |
12.50%, 7/1/19 | | | | $ | 9 | | $ | 9 | |
Federal National Mortgage Association, | | | | | | | |
Conventional Pools: | | | | | | | |
4.50%, 8/1/18 | | | | 369 | | 358 | |
5.50%, 3/1/17 | | | | 372 | | 374 | |
6.00%, 4/1/13 - 1/1/29 | | | | 510 | | 519 | |
6.50%, 1/1/24 - 4/1/34 | | | | 61,993 | | 63,798 | |
7.00%, 6/1/09 - 5/1/36 | | | | 129,935 | | 135,155 | |
7.50%, 10/1/12 - 4/1/33 | | | | 65,238 | | 68,270 | |
8.00%, 10/1/07 - 4/1/33 | | | | 56,730 | | 59,992 | |
8.50%, 5/1/08 - 5/1/32 | | | | 52,180 | | 56,207 | |
9.00%, 6/1/18 - 4/1/26 | | | | 1,291 | | 1,391 | |
9.50%, 7/1/16 - 4/1/30 | | | | 6,850 | | 7,481 | |
10.00%, 9/1/10 - 11/1/25 | | | | 6,338 | | 7,005 | |
10.50%, 10/1/11 - 6/1/27 | | | | 1,804 | | 1,995 | |
10.75%, 10/1/11 | | | | 6 | | 6 | |
11.00%, 10/1/13 - 7/1/25 | | | | 445 | | 490 | |
11.50%, 9/1/11 - 8/1/25 | | | | 894 | | 978 | |
12.00%, 1/1/13 - 5/1/20 | | | | 336 | | 367 | |
12.50%, 2/1/11 - 9/1/15 | | | | 450 | | 502 | |
April TBA | | | | | | | |
7.00%, 4/25/37 | | | | (i)28,975 | | 29,890 | |
7.50%, 4/25/36 | | | | (i)20,500 | | 21,250 | |
May TBA | | | | | | | |
7.00%, 5/25/37 | | | | (i)106,935 | | 110,210 | |
Government National Mortgage Association, | | | | | | | |
Various Pools: | | | | | | | |
5.50%, 12/15/32 | | | | 38 | | 38 | |
6.50%, 10/15/10 | | | | 24 | | 24 | |
7.00%, 7/15/31 | | | | 161 | | 169 | |
8.50%, 7/15/08 - 3/15/20 | | | | 1,758 | | 1,879 | |
9.00%, 11/15/16 - 11/15/24 | | | | 10,256 | | 11,016 | |
9.50%, 7/15/09 - 10/15/24 | | | | 24,278 | | 26,410 | |
10.00%, 11/15/09 - 2/15/26 | | | | 36,561 | | 40,759 | |
10.50%, 4/15/13 - 4/15/25 | | | | 8,023 | | 8,984 | |
11.00%, 12/15/09 - 4/15/21 | | | | 10,141 | | 11,185 | |
11.50%, 3/15/10 - 11/15/19 | | | | 672 | | 747 | |
12.00%, 11/15/12 - 5/15/16 | | | | 1,357 | | 1,526 | |
12.50%, 5/15/10 - 4/15/19 | | | | 101 | | 113 | |
13.00%, 1/15/11 - 10/15/13 | | | | 42 | | 47 | |
13.50%, 5/15/10 - 5/15/13 | | | | 54 | | 61 | |
| | | | | | 802,539 | |
Asset Backed Corporates (1.2%) | | | | | | | |
Bear Stearns Asset Backed Securities, Inc. | | | | | | | |
5.52%, 9/25/34 | | | | (h)152 | | 152 | |
Capital Auto Receivables Asset Trust | | | | | | | |
5.40%, 1/15/08 | | | | (h)80 | | 80 | |
GE Capital Credit Card Master Note Trust | | | | | | | |
5.36%, 9/15/10 | | | | (h)900 | | 901 | |
Harley-Davidson Motorcycle Trust | | | | | | | |
3.09%, 6/15/10 | | | | 63 | | 63 | |
Lehman Brothers Commercial Mortgage Trust | | | | | | | |
5.44%, 9/15/21 | | | | (e)(h)35,404 | | 35,433 | |
The accompanying notes are an integral part of the financial statements.
4
2007 Semi-Annual Report | |
| |
March 31, 2007 (unaudited) | |
Portfolio of Investments (cont’d)
Advisory Portfolio
| | | | Face | | | |
| | | | Amount | | Value | |
| | | | (000) | | (000) | |
Asset Backed Corporates (cont’d) | | | | | | | |
SLM Student Loan Trust | | | | | | | |
5.38%, 4/25/13 | | | | $ | (h)161 | | $ | 161 | |
| | | | | | 36,790 | |
Collateralized Mortgage Obligations — Agency Collateral Series (1.4%) | | | | | | | |
Bank of America Funding Corp. | | | | | | | |
2.11%, 9/20/35 | | | | (h)104,658 | | 2,486 | |
Federal Home Loan Mortgage Corp. | | | | | | | |
Inv FI IO | | | | | | | |
0.63%, 3/15/24 | | | | 41,043 | | 1,055 | |
2.63%, 3/15/32 | | | | 189 | | 15 | |
2.68%, 6/15/28 - 3/15/32 | | | | 4,782 | | 142 | |
3.16%, 12/15/23 | | | | 3,121 | | 380 | |
3.18%, 9/15/30 | | | | 2,404 | | 212 | |
20.38%, 11/15/07 | | | | 11 | | 1 | |
Inv Fl IO PAC | | | | | | | |
4.22%, 3/15/08 | | | | 81 | | 1 | |
4.86%, 2/15/08 | | | | 152 | | 2 | |
Inv Fl IO REMIC | | | | | | | |
2.18%, 8/15/30 | | | | 98 | | 4 | |
IO | | | | | | | |
5.00%, 6/15/17 | | | | 360 | | 35 | |
5.50%, 1/15/29 - 8/15/30 | | | | 12,479 | | 865 | |
6.00%, 5/1/31 | | | | 1,405 | | 272 | |
6.50%, 4/1/28 - 5/15/33 | | | | 2,324 | | 495 | |
7.00%, 8/15/30 - 3/1/32 | | | | 5,272 | | 1,164 | |
7.50%, 4/1/28 - 9/1/30 | | | | 2,771 | | 672 | |
8.00%, 10/15/12 - 6/1/31 | | | | 8,886 | | 1,916 | |
IO PAC | | | | | | | |
1.00%, 2/15/27 | | | | 5,035 | | 132 | |
6.00%, 4/15/32 | | | | 385 | | 46 | |
7.00%, 9/15/27 | | | | 63 | | 15 | |
IO REMIC | | | | | | | |
5.87%, 9/15/07 | | | | 29 | | 29 | |
10.00%, 5/1/20 - 6/1/20 | | | | 80 | | 25 | |
PAC | | | | | | | |
8.55%, 1/15/21 | | | | 38 | | 38 | |
9.50%, 4/15/20 | | | | 139 | | 144 | |
9.60%, 4/15/20 | | | | 135 | | 144 | |
9.90%, 10/15/19 | | | | 653 | | 690 | |
10.00%, 5/15/20 - 6/15/20 | | | | 631 | | 661 | |
Federal National Mortgage Association | | | | | | | |
Inv Fl IO | | | | | | | |
1.08%, 7/25/34 | | | | 30,340 | | 856 | |
2.23%, 2/17/31 | | | | 573 | | 30 | |
2.66%, 7/18/27 | | | | 965 | | 46 | |
2.78%, 12/25/29 | | | | 54 | | @— | |
2.88%, 10/25/28 | | | | 3,344 | | 120 | |
3.18%, 7/25/30 - 11/18/30 | | | | 3,986 | | 236 | |
3.23%, 10/18/30 | | | | 385 | | 20 | |
3.28%, 10/25/29 | | | | 617 | | 18 | |
3.86%, 10/25/07 | | | | 178 | | 1 | |
Inv Fl IO REMIC | | | | | | | |
30.76%, 9/25/20 | | | | $ | 173 | | $ | 291 | |
35.16%, 9/25/22 | | | | 256 | | 237 | |
IO | | | | | | | |
5.00%, 2/25/15 | | | | 459 | | 11 | |
5.50%, 3/25/17 - 6/25/26 | | | | 639 | | 32 | |
6.00%, 8/25/32 - 7/25/33 | | | | 20,798 | | 4,350 | |
6.50%, 6/1/3 - 6/25/33 | | | | 23,819 | | 5,177 | |
7.00%, 4/1/32 - 5/25/33 | | | | 19,131 | | 4,444 | |
7.50%, 4/1/27 - 1/1/32 | | | | 6,554 | | 1,743 | |
8.00%, 2/1/23 - 12/1/31 | | | | 27,114 | | 6,422 | |
8.50%, 10/1/24 - 10/1/25 | | | | 5,052 | | 1,378 | |
9.00%, 11/1/26 | | | | 2,655 | | 639 | |
9.50%, 9/1/18 | | | | 1 | | @— | |
461.28%, 12/25/21 | | | | @— | | 2 | |
807.24%, 6/25/21 | | | | @— | | 1 | |
IO PAC | | | | | | | |
8.00%, 8/18/27 - 9/18/27 | | | | 8,178 | | 1,721 | |
1,008.12%, 9/25/20 | | | | @— | | 8 | |
1,156.92%, 7/25/21 | | | | @— | | 5 | |
IO REMIC PAC | | | | | | | |
8.00%, 8/18/27 | | | | 1,263 | | 276 | |
PAC | | | | | | | |
8.75%, 11/25/19 | | | | 8 | | 9 | |
Government National Mortgage Association | | | | | | | |
Inv Fl IO | | | | | | | |
2.63%, 9/16/27 | | | | 84 | | 6 | |
2.68%, 4/16/29 | | | | 12,902 | | 702 | |
2.83%, 5/20/31 | | | | 3,073 | | 236 | |
3.23%, 12/16/29 | | | | 874 | | 66 | |
3.28%, 8/16/29 | | | | 15,522 | | 1,057 | |
Kidder Peabody Mortgage Assets Trust, IO | | | | | | | |
9.50%, 4/22/18 | | | | 16 | | 4 | |
Lehman Structured Securities Corp., IO | | | | | | | |
7.00%, 10/26/29 | | | | (e)(h)29,059 | | 2,735 | |
| | | | | | 44,520 | |
Collateralized Mortgage Obligations — Non Agency Collateral Series (5.7%) | | | | | | | |
Countrywide Alternative Loan Trust | | | | | | | |
Zero Coupon, 3/20/46 | | | | 33,727 | | 1,267 | |
1.78%, 3/20/46 | | | | (h)142,349 | | 6,557 | |
IO | | | | | | | |
1.54%, 2/25/37 | | | | (h)171,557 | | 9,060 | |
1.70%, 9/25/46 | | | | (h)311,040 | | 15,459 | |
2.25%, 10/25/46 | | | | (h)153,934 | | 7,704 | |
2.71%, 12/20/35 | | | | (e)(h)193,871 | | 9,315 | |
Countrywide Home Loan Mortgage Pass Through Trust | | | | | | | |
IO | | | | | | | |
Zero Coupon, 2/25/35 | | | | 96,641 | | 2,098 | |
Greenpoint Mortgage Funding Trust, | | | | | | | |
1.36%, 6/25/45 | | | | (h)82,865 | | 2,253 | |
5.50%, 1/25/37 - 5/25/47 | | | | (h)63,904 | | 63,852 | |
5.51%, 3/25/47 | | | | (h)38,729 | | 38,738 | |
GS Mortgage Securities Corp. | | | | | | | |
2.57%, 3/25/36 | | | | (e)(h)78,570 | | 3,093 | |
The accompanying notes are an integral part of the financial statements.
5
2007 Semi-Annual Report | |
| |
March 31, 2007 (unaudited) | |
Portfolio of Investments (cont’d)
Advisory Portfolio
| | | | Face | | | |
| | | | Amount | | Value | |
| | | | (000) | | (000) | |
Collateralized Mortgage Obligations — Non Agency Collateral Series (cont’d) | | | | | | | |
Harborview Mortgage Loan Trust | | | | | | | |
IO | | | | | | | |
1.26%, 5/19/35 | | | | $ | (h)174,664 | | $ | 4,174 | |
1.58%, 1/19/36 | | | | (h)73,657 | | 1,841 | |
1.63%, 3/19/37 | | | | (h)85,202 | | 3,754 | |
2.22%, 10/20/45 | | | | (h)100,934 | | 4,542 | |
PO | | | | | | | |
1/19/36 - 10/20/45 | | | | 2,184 | | 454 | |
Indymac Index Mortgage Loan Trust | | | | | | | |
IO | | | | | | | |
0.90%, 7/25/35 | | | | (h)116,094 | | 3,681 | |
PO | | | | | | | |
7/25/35 | | | | @— | | @— | |
| | | | | | 177,842 | |
Mortgages — Other (50.5%) | | | | | | | |
American Express Co. | | | | | | | |
9.63%, 12/1/12 | | | | (d)(k)81 | | 82 | |
American Home Mortgage Assets | | | | | | | |
5.45%, 3/25/47 | | | | (h)34,500 | | 34,443 | |
5.51%, 10/25/46 | | | | (h)23,775 | | 23,818 | |
5.55%, 5/25/46 - 9/25/46 | | | | (h)63,123 | | 63,203 | |
American Housing Trust | | | | | | | |
9.55%, 9/25/20 | | | | 802 | | 800 | |
Bear Stearns Mortgage Securities, Inc. | | | | | | | |
5.48%, 12/25/36 | | | | (h)31,875 | | 31,902 | |
5.52%, 9/25/36 | | | | (h)28,044 | | 27,956 | |
5.57%, 7/25/36 | | | | (h)30,773 | | 30,735 | |
California Federal Savings & Loan Association | | | | | | | |
8.80%, 1/25/14 | | | | (d)(k)2 | | 2 | |
Countrywide Alternative Loan Trust | | | | | | | |
0.86%, 12/20/35 | | | | (e)(h)335,730 | | 8,813 | |
5.46%, 4/25/47 | | | | (h)36,803 | | 36,780 | |
5.49%, 5/25/47 | | | | (h)23,400 | | 23,400 | |
5.53%, 3/20/46 | | | | (h)19,126 | | 19,155 | |
5.58%, 11/20/35 | | | | (h)14,350 | | 14,365 | |
5.61%, 10/25/35 - 11/20/35 | | | | (h)25,693 | | 25,733 | |
5.71%, 12/20/35 | | | | (h)14,537 | | 14,598 | |
6.68%, 2/25/36 | | | | (h)29,263 | | 29,578 | |
6.97%, 11/25/35 | | | | (h)22,498 | | 22,955 | |
Countrywide Home Loan Mortgage Pass Through Trust | | | | | | | |
5.62%, 4/25/46 | | | | (h)28,624 | | 28,680 | |
Deutsche ALT-A Securities, Inc., Alternate Loan Trust | | | | | | | |
5.47%, 2/25/47 | | | | (h)44,362 | | 44,362 | |
Deutsche ALT-A Securities, Inc., NIM Trust | | | | | | | |
6.75%, 2/25/47 | | | | (e)(h)7,934 | | 7,906 | |
Downey Savings & Loan Association Mortgage Loan Trust | | | | | | | |
5.52%, 10/19/36 | | | | (h)34,701 | | 34,789 | |
5.92%, 4/19/46 | | | | (h)30,997 | | 31,026 | |
Gemsco Mortgage Pass Through Certificate | | | | | | | |
8.70%, 11/25/10 | | | | (d)(k)14 | | 14 | |
GSR Mortgage Loan Trust | | | | | | | |
5.51%, 8/25/46 | | | | (h)37,148 | | 37,201 | |
Harborview Mortgage Loan Trust | | | | | | | |
5.45%, 3/19/37 | | | | $ | (h)38,879 | | $ | 38,926 | |
5.47%, 3/19/38 | | | | (h)31,627 | | 31,654 | |
5.50%, 11/19/36 | | | | (h)42,499 | | 42,349 | |
5.51%, 12/19/37 | | | | (h)37,393 | | 37,447 | |
5.52%, 7/21/36 | | | | (h)32,844 | | 32,758 | |
5.53%, 11/19/36 | | | | (h)37,348 | | 37,460 | |
5.55%, 7/19/46 | | | | (h)24,752 | | 24,784 | |
5.56%, 3/19/37 | | | | (h)24,029 | | 24,087 | |
5.61%, 7/19/45 | | | | (h)5,159 | | 5,174 | |
5.70%, 11/19/35 | | | | (h)16,658 | | 16,728 | |
Harborview NIM Corp. | | | | | | | |
6.41%, 3/19/37 - 3/19/38 | | | | (e)(h)15,587 | | 15,540 | |
Household Bank | | | | | | | |
8.24%, 7/1/08 | | | | (d)(k)@— | | @— | |
Indymac Index Mortgage Loan Trust | | | | | | | |
5.55%, 9/25/46 | | | | (h)21,933 | | 22,012 | |
5.60%, 7/25/35 | | | | (h)5,160 | | 5,190 | |
Lehman XS Trust | | | | | | | |
5.59%, 11/25/35 | | | | (h)29,858 | | 29,985 | |
Luminent Mortgage Capital, Inc. | | | | | | | |
5.55%, 5/25/46 | | | | (h)19,702 | | 19,773 | |
Mastr Adjustable Rate Mortgages Trust | | | | | | | |
5.57%, 4/25/46 | | | | (h)18,961 | | 19,040 | |
Mortgage Equity Conversion Asset Trust | | | | | | | |
5.46%, 2/25/42 | | | | (h)26,000 | | 26,000 | |
Residential Accredit Loans, Inc. | | | | | | | |
5.46%, 2/25/37 | | | | (h)29,750 | | 29,741 | |
5.48%, 2/25/37 - 3/25/47 | | | | (h)49,048 | | 49,005 | |
5.52%, 3/25/47 | | | | (h)36,401 | | 36,401 | |
5.58%, 2/25/46 | | | | (h)9,380 | | 9,392 | |
5.59%, 2/25/46 | | | | (h)10,029 | | 10,032 | |
Residential Asset Securities Corp. | | | | | | | |
5.55%, 6/25/46 | | | | (h)34,973 | | 34,945 | |
Ryland Acceptance Corp. IV | | | | | | | |
6.65%, 7/1/11 | | | | (h)399 | | 398 | |
Structured Asset Investment Loan Trust | | | | | | | |
5.55%, 7/25/36 - 8/25/36 | | | | (h)72,119 | | 72,359 | |
Structured Asset Mortgage Investments, Inc. | | | | | | | |
5.51%, 2/25/36 | | | | (h)20,522 | | 20,567 | |
5.52%, 10/25/36 | | | | (h)20,080 | | 20,131 | |
5.59%, 4/25/45 | | | | (h)42,412 | | 42,610 | |
5.62%, 5/25/36 | | | | (h)13,701 | | 13,754 | |
5.63%, 2/25/36 | | | | (h)43,198 | | 43,381 | |
Wamu Alternative Mortgage Pass-Through Certificates | | | | | | | |
4.98%, 8/25/46 | | | | (h)32,546 | | 32,603 | |
5.92%, 4/25/46 - 5/25/46 | | | | (h)49,633 | | 49,681 | |
Washington Mutual, Inc. | | | | | | | |
5.57%, 12/25/45 | | | | (h)10,883 | | 10,903 | |
5.58%, 10/25/44 - 10/25/45 | | | | (h)12,568 | | 12,596 | |
5.59%, 4/25/45 | | | | (h)16,698 | | 16,731 | |
5.61%, 8/25/45 | | | | (h)6,033 | | 6,042 | |
5.68%, 7/25/45 | | | | (h)13,588 | | 13,642 | |
The accompanying notes are an integral part of the financial statements.
6
2007 Semi-Annual Report | |
| |
March 31, 2007 (unaudited) | |
Portfolio of Investments (cont’d)
Advisory Portfolio
| | | | Face | | | |
| | | | Amount | | Value | |
| | | | (000) | | (000) | |
Mortgages — Other (cont’d) | | | | | | | |
Zuni Mortgage Loan Trust | | | | | | | |
5.45%, 8/25/36 | | | | $ | (h)27,080 | | $ | 27,070 | |
| | | | | | 1,573,187 | |
U.S. Treasury Securities (12.9%) | | | | | | | |
U.S. Treasury Strips | | | | | | | |
IO | | | | | | | |
4.97%, 5/15/21 | | | | (c)530,185 | | 263,270 | |
PO | | | | | | | |
5/15/21 | | | | (c)275,650 | | 137,444 | |
| | | | | | 400,714 | |
Total Fixed Income Securities (Cost $3,284,054) | | | | | | 3,209,194 | |
| | | | | | | | | |
| | | | Shares | | | |
Preferred Stock (0.7%) | | | | | | | |
Mortgages — Other | | | | | | | |
Home Ownership Funding Corp. | | | | | | | |
13.33% (Cost $21,855) | | | | (e)153,475 | | 22,712 | |
| | | | No.of | | | |
| | | | Contracts | | | |
Put Options Purchased (0.1%) | | | | | | | |
90 Day EuroDollar | | | | | | | |
6/07 @ $94.25 | | | | 16,196 | | 81 | |
6/07 @ $94.50 | | | | 2,035 | | 10 | |
9/07 @ $94.75 | | | | 1,104 | | 171 | |
12/07 @ $94.75 | | | | 15,415 | | 2,505 | |
12/07 @ $94.50 | | | | 848 | | 36 | |
Total Put Options Purchased
(Cost $8,828) | | | | | | 2,803 | |
| | | | Face | | | |
| | | | Amount | | | |
| | | | (000) | | | |
Short-Term Investments (15.2%) | | | | | | | |
Short-Term Debt Securities held as Collateral on Loaned Securities (13.2%) | | | | | | | |
AIG Match Funding Corp., 5.30%, 4/17/07 | | | | $ | (h)9,141 | | 9,141 | |
Alliance & Leicester plc, 5.33%, 4/10/07 | | | | (h)6,529 | | 6,529 | |
Anglo Irish Bank Corp. plc, 5.35%, 7/9/07 | | | | 3,179 | | 3,179 | |
Bancaja, 5.36%, 4/19/07 | | | | (h)3,264 | | 3,264 | |
Bank of America Corp., 5.32%, 4/2/07 | | | | (h)10,446 | | 10,446 | |
Bank of New York Co., Inc., 5.32%, 4/10/07 | | | | (h)3,264 | | 3,264 | |
Bear Stearns & Co., Inc., 5.36%, 4/16/07 | | | | (h)6,529 | | 6,529 | |
BNP Paribas plc, 5.33%, 5/21/07 | | | | (h)6,529 | | 6,529 | |
CAM US Finance S.A. Unipersonal, | | | | | | | |
5.36%, 7/3/07 | | | | (h)13,058 | | 13,058 | |
CIC, New York, | | | | | | | |
5.30%, 4/3/07 | | | | (h)4,570 | | 4,570 | |
5.34%, 4/2/07 | | | | (h)6,529 | | 6,529 | |
CIT Group Holdings, 5.37%, 7/18/07 | | | | (h)11,752 | | 11,752 | |
Credit Suisse First Boston, New York, | | | | | | | |
5.29%, 5/15/07 | | | | 3,917 | | 3,917 | |
5.32%, 4/2/07 | | | | (h)6,529 | | 6,529 | |
Deutsche Bank Securities, Inc., | | | | | | | |
5.40%, 4/2/07 | | | | 26,116 | | 26,116 | |
5.46%, 4/2/07 | | | | 62,678 | | 62,678 | |
| | | | | | | | |
| | | | Face | | | |
| | | | Amount | | Value | |
| | | | (000) | | (000) | |
Dexia Bank, New York, 5.32%, 4/2/07 | | | | $ | (h)6,528 | | $ | 6,528 | |
First Tennessee Bank, 5.33%, 4/17/07 | | | | (h)3,265 | | 3,265 | |
Gemini Securitization Corp., 5.41%, 4/2/07 | | | | 9,390 | | 9,390 | |
Goldman Sachs Group, Inc., | | | | | | | |
5.37%, 4/16/07 | | | | (h)3,264 | | 3,264 | |
5.55%, 4/2/07 | | | | (h)6,137 | | 6,137 | |
HSBC Finance Corp., 5.33%, 4/10/07 | | | | (h)3,265 | | 3,265 | |
Mane Funding Corp., 5.29%, 4/10/07 | | | | 4,677 | | 4,677 | |
Manufacturers & Traders, 5.30%, 4/16/07 | | | | (h)3,917 | | 3,917 | |
Marshall & Ilsley Bank, 5.37%, 12/17/07 | | | | 6,547 | | 6,547 | |
Merrill Lynch & Co., 5.33%, 4/26/07 | | | | (h)3,431 | | 3,431 | |
Metropolitan Life Global Funding, | | | | | | | |
5.31%, 4/23/07 | | | | (h)9,793 | | 9,793 | |
Natexis Banques Populaires, New York, | | | | | | | |
5.33%, 4/2/07 | | | | (h)6,529 | | 6,529 | |
5.34%, 4/2/07 | | | | (h)6,529 | | 6,529 | |
National Australia Bank Ltd., 5.31%, 4/10/07 | | | | (h)4,962 | | 4,962 | |
National City Bank Cleveland, 5.32%, 4/2/07 | | | | (h)3,265 | | 3,265 | |
National Rural Utilities Cooperative | | | | | | | |
Finance Corp., 5.31%, 4/2/07 | | | | (h)13,058 | | 13,058 | |
Nationwide Building Society, 5.43%, 6/28/07 | | | | (h)7,574 | | 7,574 | |
Nordea Bank, New York, 5.31%, 4/2/07 | | | | (h)9,793 | | 9,793 | |
Raiffeisen Zentralbank Oesterreich, | | | | | | | |
5.31%, 6/19/07 | | | | 3,865 | | 3,865 | |
Rheingold Securitization, 5.32%, 5/15/07 | | | | 5,800 | | 5,800 | |
Sedna Finance, Inc., 5.32%, 5/15/07 | | | | 1,675 | | 1,675 | |
Skandi, New York, 5.32%, 4/10/07 | | | | (h)6,529 | | 6,529 | |
Toronto Dominion, New York, 5.32%, 5/29/07 | | | | (h)6,529 | | 6,529 | |
Tulip Funding Corp., 5.36%, 4/30/07 | | | | 12,998 | | 12,998 | |
UBS Securities LLC, 5.40%, 4/2/07 | | | | 64,165 | | 64,165 | |
Unicredito Delaware, Inc., 5.32%, 4/16/07 | | | | (h)7,182 | | 7,182 | |
Unicredito Italiano Bank (Ireland) plc, | | | | | | | |
5.34%, 4/10/07 | | | | (h)4,570 | | 4,570 | |
| | | | | | 409,267 | |
Repurchase Agreement (1.4%) | | | | | | | |
J.P. Morgan Securities, Inc., | | | | | | | |
5.28%, dated 3/30/07, due 4/2/07, | | | | | | | |
repurchase price $43,289 | | | | (f)43,270 | | 43,270 | |
Commercial Paper (0.5) | | | | | | | |
HBOS Treasury Services | | | | | | | |
5.27%, 5/4/07 | | | | 16,000 | | 15,922 | |
U.S. Treasury Security (0.1) | | | | | | | |
U.S. Treasury Bill | | | | | | | |
4.98%, 7/12/07 | | | | (j)(l)3,925 | | 3,872 | |
Total Short-Term Investments (Cost $472,330) | | | | | | 472,331 | |
Total Investments (119.1%) (Cost $3,787,067) — Including $400,163 of Securities Loaned | | | | | | 3,707,040 | |
Liabilities in Excess of Other Assets (-19.1%) | | | | | | (594,802) | |
Net Assets (100%) | | | | | | $ | 3,112,238 | |
| | | | | | | | | |
(c) | All or a portion of security on loan at March 31, 2007. |
(d) | Security was valued at fair value — At March 31, 2007, the Portfolio held $98,000 of fair valued securities, representing less than 0.05% of net assets. |
The accompanying notes are an integral part of the financial statements.
7
2007 Semi-Annual Report | |
| |
March 31, 2007 (unaudited) | |
Portfolio of Investments (cont’d)
Advisory Portfolio
(e) | 144A security — Certain conditions for public sale may exist. Unless otherwise noted, these securities are deemed to be liquid. |
(f) | Represents the Portfolio’s undivided interest in a joint repurchase agreement which has a total value of $1,580,364,000. The repurchase agreement was fully collateralized by U.S. government agency securities at the date of this Portfolio of Investments as follows: Federal Farm Credit Bank, 0.00% to 7.43%, due 5/7/07 to 3/2/21; Federal Home Loan Bank, 0.00% to 6.42%, due 4/2/07 to 3/9/26; Federal Home Loan Mortgage Corp., 0.00% to 7.00%, due 4/2/07 to 3/15/31; Federal National Mortgage Association, 0.00% to 7.13%, due 4/5/07 to 3/17/31; Tennessee Valley Authority, 4.88%, due 12/15/16, which had a total value of $1,611,974,119. The investment in the repurchase agreement is through participation in a joint account with affiliated parties pursuant to exemptive relief received by the Portfolio from the SEC. |
(h) | Variable/Floating Rate Security — Interest rate changes on these instruments are based on changes in a designated base rate. The rates shown are those in effect on March 31, 2007. |
(i) | Security is subject to delayed delivery. |
(j) | All or a portion of the security was pledged to cover margin requirements for futures contracts. |
(k) | Security has been deemed illiquid at March 31, 2007. |
(l) | Purchased on a discount basis. The interest rate shown has been adjusted to reflect a money market equivalent yield. |
@ | Face Amount/Value is less than $500. |
In Fl | Inverse Floating Rate — Interest rate fluctuates with an inverse relationship to an associated interest rate. Indicated rate is the effective rate at March 31, 2007. |
IO | Interest Only |
PO | Principal Only |
PAC | Planned Amortization Class |
REMIC | Real Estate Mortgage Investment Conduit |
TBA | To Be Announced |
Futures Contracts:
The Portfolio had the following futures contract(s) open at period end:
| | | | | | | | Net | |
| | | | | | | | Unrealized | |
| | Number | | | | | | Appreciation | |
| | of | | Value | | Expiration | | (Depreciation) | |
| | Contracts | | (000) | | Date | | (000) | |
Long: | | | | | | | | | |
U.S. Treasury 2 yr. Note | | 7,885 | | $ | 1,615,563 | | Jun-07 | | $ | (1,558 | ) |
U.S. Treasury 10 yr. Note | | 6,618 | | 715,571 | | Jun-07 | | 2,533 | |
Short: | | | | | | | | | |
U.S. Treasury 5 yr. Note | | 2,997 | | 317,073 | | Jun-07 | | 1,562 | |
U.S. Treasury Short Bond | | 1,398 | | 155,528 | | Jun-07 | | 202 | |
| | | | | | | | $ | 2,739 | |
| | | | | | | | | | | |
Graphic Presentation of Portfolio Holdings
The following graph depicts the Portfolio’s holdings by investment type, as a percentage of total investments.

* Investment types which do not appear in the above graph, as well as those which represent less than 5% of total investments, if applicable, are included in the category labeled “Other”.
The accompanying notes are an integral part of the financial statements.
8
2007 Semi-Annual Report |
| |
March 31, 2007 (unaudited) |
Portfolio of Investments
Advisory Global Fixed Income Portfolio
| | | | Face | | | |
| | | | Amount | | Value | |
| | | | (000) | | (000) | |
Fixed Income Securities (34.8%) | | | | | | | |
Argentina (7.2%) | | | | | | | |
Government of Argentina | | | | | | | |
5.83%, 12/31/33 | | | | $ | 25,000 | | $ | 12,000 | |
Austria (1.6%) | | | | | | | |
Republic of Austria | | | | | | | |
5.00%, 1/15/08 | | | | EUR | 2,000 | | 2,691 | |
Belgium (4.2%) | | | | | | | |
Kingdom of Belgium | | | | | | | |
5.75%, 3/28/08 | | | | 5,100 | | 6,920 | |
France (4.4%) | | | | | | | |
Government of France B.T.A.N. | | | | | | | |
3.00%, 7/12/08 | | | | 5,500 | | 7,254 | |
Mexico (9.0%) | | | | | | | |
Mexican Bonos | | | | | | | |
9.50%, 12/18/14 | | | | MXN | 148,305 | | 14,965 | |
Netherlands (4.8%) | | | | | | | |
Netherlands Government | | | | | | | |
2.50%, 1/15/08 | | | | EUR | 6,000 | | 7,921 | |
Turkey (3.6%) | | | | | | | |
Citigroup, Inc. | | | | | | | |
Zero Coupon, 7/17/08 | | | | $ | 5,035 | | 5,964 | |
Total Fixed Income Securities (Cost $53,809) | | | | | | 57,715 | |
| | | | | | | | | | | |
| | | | No. of | | | |
| | | | Contracts | | | |
Put Options Purchased (3.3%) | | | | | | | |
Turkey (0.1%) | | | | | | | |
Turkish Lira Put @ $1.510 | | | | | | | |
expiring 7/24/07 | | | | (a)5,700 | | 80 | |
Switzerland (3.2%) | | | | | | | |
Swiss Franc Put @ $1.186 | | | | | | | |
expiring 3/6/08 | | | | (a)206,500 | | 5,369 | |
Total Put Options Purchased (Cost $5,764) | | | | | | 5,449 | |
| | | | Face | | | |
| | | | Amount | | | |
| | | | (000) | | | |
Short-Term Investment (60.9%) | | | | | | | |
Repurchase Agreement (60.9%) | | | | | | | |
J.P. Morgan Securities, Inc., 5.28%, dated | | | | | | | |
3/30/07, due 4/2/07, repurchase price | | | | | | | |
$101,262 (Cost $101,217) | | | | $ | (f)101,217 | | 101,217 | |
Total Investments (99.0%) (Cost $160,790) | | | | | | 164,381 | |
Other Assets in Excess of Liabilities (1.0%) | | | | | | 1,684 | |
Net Assets (100%) | | | | | | $ | 166,065 | |
| | | | | | | | | |
(a) | | Non-income producing security. |
(f) | | Represents the Portfolio’s undivided interest in a joint repurchase agreement which has a total value of $1,580,364,000. The repurchase agreement was fully collateralized by U.S. government agency securities at the date of this Portfolio of Investments as follows: Federal Farm Credit Bank, 0.00% to 7.43%, due 5/7/07 to 3/2/21; Federal Home Loan Bank, 0.00% to 6.42%, due 4/2/07 to 3/9/26; Federal Home Loan Mortgage Corp., 0.00% to 7.00%, due 4/2/07 to 3/15/31; Federal National Mortgage Association, 0.00% to 7.13%, due 4/5/07 to 3/17/31; Tennessee Valley Authority, 4.88%, due 12/15/16, which had a total value of $1,611,974,119. The investment in the repurchase agreement is through participation in a joint account with affiliated parties pursuant to exemptive relief received by the Portfolio from the SEC. |
EUR | | Euro |
MXN | | Mexican Peso |
Foreign Currency Exchange Contract Information:
The Portfolio had the following foreign currency exchange contract(s) open at period end:
| | | | | | | | | | Net | |
Currency | | | | | | In | | | | Unrealized | |
to | | | | | | Exchange | | | | Appreciation | |
Deliver
(000) | | Value
(000) | | Settlement
Date | | For
(000) | | Value
(000) | | (Depreciation)
(000) | |
EUR | 18,350 | | | $ | 24,539 | | 4/30/07 | | USD | 23,913 | | $ | 23,913 | | $ | (626 | ) |
EUR | 589 | | | 788 | | 4/30/07 | | USD | 768 | | 768 | | (20 | ) |
EUR | 42,024 | | | 56,230 | | 5/14/07 | | USD | 54,796 | | 54,796 | | (1,434 | ) |
USD | 53,904 | | | 53,904 | | 5/14/07 | | JPY | 6,450,000 | | 55,049 | | 1,145 | |
| | $ | 135,461 | | | | | | $ | 134,526 | | $ | (935 | ) |
JPY | Japanese Yen |
USD | United States Dollar |
Futures Contracts:
The Portfolio had the following futures contract(s) open at period end:
| | | | | | | | Net | |
| | | | | | | | Unrealized | |
| | | | | | | | Appreciation | |
| | Number of | | | | Expiration | | (Depreciation) | |
| | Contracts | | Value(000) | | Date | | (000) | |
Long: | | | | | | | | | |
Euro—Schatz (2) yr. (Germany) | | 617 | | $ | 85,146 | | Jun-07 | | $ | (272 | ) |
| | | | | | | | | | | |
Options Written:
The Portfolio had the following option(s) written open at period end:
| | No. of | | Value | |
| | Contracts | | (000) | |
Put Options Written | | | | | |
Turkish Lira Put @ $1.661 | | | | | |
expiring 7/24/07 (Premiums Received $207) | | 14,670 | | $ | (15 | ) |
| | | | | | |
The accompanying notes are an integral part of the financial statements.
9
2007 Semi-Annual Report |
| |
March 31, 2007 (unaudited) |
Portfolio of Investments (cont’d)
Advisory Global Fixed Income Portfolio
Graphic Presentation of Portfolio Holdings
The following graph depicts the Portfolio’s holdings by country and/or investment type, as a percentage of total investments.

* Countries and/or investment types which do not appear in the above graph, as well as those which represent less than 5% of total investments, if applicable, are included in the category labeled “Other”.
The accompanying notes are an integral part of the financial statements.
10
2007 Semi-Annual Report |
| |
March 31, 2007 (unaudited) |
Portfolio of Investments
Advisory Global Fixed Income Portfolio II
| | | | Face | | | |
| | | | Amount | | Value | |
| | | | (000) | | (000) | |
Fixed Income Securities (37.9%) | | | | | | | |
Austria (4.9%) | | | | | | | |
Republic of Austria | | | | | | | |
4.00%, 7/15/09 | | | | EUR | 40 | | $ | 53 | |
Belgium (23.7%) | | | | | | | |
Kingdom of Belgium | | | | | | | |
5.75%, 3/28/08 | | | | 190 | | 258 | |
France (4.9%) | | | | | | | |
Government of France B.T.A.N | | | | | | | |
3.50%, 1/12/09 | | | | 40 | | 53 | |
Netherlands (4.4%) | | | | | | | |
Netherlands Government | | | | | | | |
5.25%, 7/15/08 | | | | 35 | | 48 | |
Total Fixed Income Securities (Cost $393) | | | | | | 412 | |
Short-Term Investment (54.8%) | | | | | | | |
Repurchase Agreement (54.8%) | | | | | | | |
J.P. Morgan Securities, Inc., 5.28%, dated | | | | | | | |
3/30/07, due 4/2/07, repurchase price | | | | | | | |
$596 (Cost $596) | | | | $ | (f)596 | | 596 | |
Total Investments (92.7%) (Cost $989) | | | | | | 1,008 | |
Other Assets in Excess of Liabilities (7.3%) | | | | | | 79 | |
Net Assets (100%) | | | | | | $ | 1,087 | |
| | | | | | | | | | |
(f) | | Represents the Portfolio’s undivided interest in a joint repurchase agreement which has a total value of $1,580,364,000. The repurchase agreement was fully collateralized by U.S. government agency securities at the date of this Portfolio of Investments as follows: Federal Farm Credit Bank, 0.00% to 7.43%, due 5/7/07 to 3/2/21; Federal Home Loan Bank, 0.00% to 6.42%, due 4/2/07 to 3/9/26; Federal Home Loan Mortgage Corp., 0.00% to 7.00%, due 4/2/07 to 3/15/31; Federal National Mortgage Association, 0.00% to 7.13%, due 4/5/07 to 3/17/31; Tennessee Valley Authority, 4.88%, due 12/15/16, which had a total value of $1,611,974,119. The investment in the repurchase agreement is through participation in a joint account with affiliated parties pursuant to exemptive relief received by the Portfolio from the SEC. |
| | |
EUR | | Euro |
Foreign Currency Exchange Contract Information:
The Portfolio had the following foreign currency exchange contract(s) open atperiod end:
| | | | | | | | | | Net | |
Currency | | | | | | In | | | | Unrealized | |
to | | | | | | Exchange | | | | Appreciation | |
Deliver
(000) | | Value
(000) | | Settlement
Date | | For
(000) | | Value
(000) | | (Depreciation)
(000) | |
EUR | | 319 | | $ | 426 | | 4/30/07 | | USD | 415 | | $ | 415 | | $ | (11 | ) |
| | | | | | | | | | | | | | | | | |
USD United States Dollar
Futures Contracts:
The Portfolio had the following futures contract(s) open at period end:
| | | | | | | | Net | |
| | | | | | | | Unrealized | |
| | Number | | | | | | Appreciation | |
| | of | | Value | | Expiration | | (Deprteciation) | |
| | Contracts | | (000) | | Date | | (000) | |
Long: | | | | | | | | | |
Euro—Schatz 2 yr. (Germany) | | 4 | | $ | 552 | | Jun-07 | | $ | (2 | ) |
| | | | | | | | | | | |
Graphic Presentation of Portfolio Holdings
The following graph depicts the Portfolio’s holdings by country and/or investment type, as a percentage of total investments.
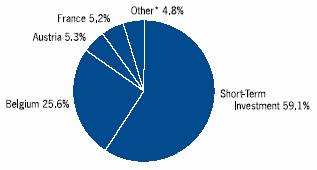
* Countries and/or investment types which do not appear in the above graph, as well as those which represent less than 5% of total investments, if applicable, are included in the category labeled “Other”.
The accompanying notes are an integral part of the financial statements.
11
2007 Semi-Annual Report |
| |
March 31, 2007 (unaudited) |
Statements of Assets and Liabilities
| | | | Advisory | | Advisory | |
| | | | Global | | Global | |
| | Advisory | | Fixed Income | | Fixed Income | |
| | Portfolio | | Portfolio | | Portfolio II | |
| | (000) | | (000) | | (000) | |
Assets: | | | | | | | |
Investments in Securities of Unaffiliated Issuers, at Cost: | | $ | 3,787,067 | | $ | 160,790 | | $ | 989 | |
Foreign Currency, at Cost: | | — | | 253 | | 1 | |
Investments in Securities of Unaffiliated Issuers, at Value:(1) | | 3,707,040 | | 164,381 | | 1,008 | |
Cash | | — | | 1 | | @— | |
Foreign Currency, at Value: | | — | | 254 | | 1 | |
Receivable for Investments Sold | | 31,391 | | — | | — | |
Receivable for Portfolio Shares Sold | | 166 | | — | | — | |
Unrealized Appreciation on Foreign Currency Exchange Contracts | | — | | 1,145 | | — | |
Unrealized Appreciation on Swap Agreements | | 4,238 | | — | | — | |
Interest Receivable | | 12,113 | | 588 | | 4 | |
Receivable for Forward Commitments | | 246,385 | | — | | — | |
Due from Broker | | 14,746 | | 1,821 | | 95 | |
Foreign Withholding Tax Reclaim Receivable | | — | | — | | 1 | |
Due from Adviser | | 167 | | — | | 13 | |
OtherAssets | | 49 | | 3 | | @— | |
Total Assets | | 4,016,295 | | 168,193 | | 1,122 | |
Liabilities: | | | | | | | |
Collateral on Securities Loaned, at Value | | 409,267 | | — | | — | |
Payable for Delayed Delivery Commitments | | 446,793 | | — | | — | |
Payable for Bank Overdraft | | 7,091 | | — | | — | |
Unrealized Depreciation on Foreign Currency Exchange Contracts | | — | | 2,080 | | 11 | |
Unrealized Depreciation on Swap Agreements | | 5,679 | | — | | — | |
Payable for Investments Purchased | | 33,913 | | — | | — | |
Payable for Portfolio Shares Redeemed | | 684 | | — | | — | |
Payable for Administration Fees | | 212 | | 11 | | @— | |
Payable for Custodian Fees | | 110 | | @— | | 3 | |
Payable for Trustees’ Fees and Expenses | | 143 | | 3 | | @— | |
Options Written, at Value (Premiums received $207) | | — | | 15 | | — | |
Other Liabilities | | 165 | | 19 | | 21 | |
Total Liabilities | | 904,057 | | 2,128 | | 35 | |
Net Assets | | $ | 3,112,238 | | $ | 166,065 | | $ | 1,087 | |
Net Assets Consist Of: | | | | | | | |
Paid-in Capital | | $ | 3,582,917 | | $ | 162,583 | | $ | 1,094 | |
Undistributed (Distributions in Excess of) Net Investment Income | | (94,687 | ) | 963 | | (13 | ) |
Accumulated Net Realized Gain (Loss) | | (297,263 | ) | (58 | ) | @— | |
Unrealized Appreciation (Depreciation) on: | | | | | | | |
Investments | | (80,027 | ) | 3,591 | | 19 | |
Foreign Currency Exchange Contracts and Translations | | — | | (934 | ) | (11 | ) |
Futures Contracts | | 2,739 | | (272 | ) | (2 | ) |
Options Written | | — | | 192 | | — | |
Swap Agreements | | (1,441 | ) | — | | — | |
Net Assets | | $ | 3,112,238 | | $ | 166,065 | | $ | 1,087 | |
INSTITUTIONAL CLASS: | | | | | | | |
Shares Outstanding (unlimited number of shares authorized, no par value) (not in 000’s) | | 333,768,092 | | 46,790,605 | | 89,037 | |
Net Asset Value, Offering and Redemption Price Per Share | | $ | 9.32 | | $ | 3.55 | | $ | 12.21 | |
(1) Including: | | | | | | | |
Repurchase Agreements, at Value: | | $ | 43,270 | | $ | 101,217 | | $ | 596 | |
Securities on Loan, at Value: | | $ | 400,163 | | $ | — | | $ | — | |
@ Amount is less than $500.
The accompanying notes are an integral part of the financial statements.
12
2007 Semi-Annual Report |
| |
March 31, 2007 (unaudited) |
Statements of Operations
For the Six Months Ended March 31, 2007
| | | | Advisory | | Advisory | |
| | | | Global | | Global | |
| | Advisory | | Fixed Income | | Fixed Income | |
| | Portfolio | | Portfolio | | Portfolio II | |
| | (000) | | (000) | | (000) | |
Investment Income: | | | | | | | |
Dividends | | $ | 850 | | $ | — | | $ | — | |
Interest | | 76,987 | | 4,125 | | 24 | |
Total Investment Income | | 77,837 | | 4,125 | | 24 | |
Expenses: | | | | | | | |
Investment Advisory Fees (Note B) | | 5,798 | | 311 | | 2 | |
Administration Fees (Note C) | | 1,237 | | 66 | | @— | |
Custodian Fees (Note E) | | 114 | | 2 | | 2 | |
Professional Fees | | 125 | | 12 | | 11 | |
Trustees’ Fees and Expenses | | 43 | | 1 | | @— | |
Transfer Agency Fees (Note F) | | 2 | | 2 | | 2 | |
Shareholder Reporting Fees | | 27 | | 4 | | 3 | |
Proxy Fees | | 17 | | @— | | @— | |
Other Expenses | | 74 | | 11 | | 11 | |
Total Expenses | | 7,437 | | 409 | | 31 | |
Waiver of Investment Advisory Fees (Note B) | | (5,798 | ) | (311 | ) | (2 | ) |
Expenses Reimbursed by Adviser (Note B) | | (400 | ) | — | | (29 | ) |
Expense Offset (Note E) | | (2 | ) | (2 | ) | @— | |
Net Expenses | | 1,237 | | 96 | | @— | |
Net Investment Income | | 76,600 | | 4,029 | | 24 | |
Realized Gain (Loss): | | | | | | | |
Investments Sold | | 33,411 | | 2,384 | | — | |
Foreign Currency Transactions | | — | | (1,761 | ) | 2 | |
Futures Contracts | | 7,313 | | (234 | ) | (3 | ) |
Swap Agreements | | 31,284 | | — | | — | |
Net Realized Gain (Loss) | | 72,008 | | 389 | | (1 | ) |
Change in Unrealized Appreciation (Depreciation): | | | | | | | |
Investments | | (52,028 | ) | 3,394 | | 13 | |
Foreign Currency Exchange Contracts and Translations | | — | | (1,052 | ) | (13 | ) |
Futures Contracts | | (3,569 | ) | (351 | ) | (2 | ) |
Options Written | | — | | 192 | | — | |
Swap Agreements | | (1,526 | ) | — | | — | |
Net Change in Unrealized Appreciation (Depreciation) | | (57,123 | ) | 2,183 | | (2 | ) |
Total Net Realized Gain (Loss) and Change in Unrealized Appreciation (Depreciation) | | 14,885 | | 2,572 | | (3 | ) |
Net Increase (Decrease) in Net Assets Resulting from Operations | | $ | 91,485 | | $ | 6,601 | | $ | 21 | |
@ Amount is less than $500.
The accompanying notes are an integral part of the financial statements.
13
2007 Semi-Annual Report |
| |
March 31, 2007 |
Statements of Changes in Net Assets
| | | | | | Advisory Global | | Advisory Global | |
| | Advisory | | Fixed Income | | Fixed Income | |
| | Portfolio^ | | Portfolio | | Portfolio II | |
| | Six Months | | | | Six Months | | | | Six Months | | | |
| | Ended | | | | Ended | | | | Ended | | | |
| | March 31, | | Year Ended | | March 31, | | Year Ended | | March 31, | | Year Ended | |
| | 2007 | | September | | 2007 | | September | | 2007 | | September | |
| | (unaudited) | | 30, 2006 | | (unaudited) | | 30, 2006 | | (unaudited) | | 30, 2006 | |
| | (000) | | (000) | | (000) | | (000) | | (000) | | (000) | |
Increase (Decrease) in Net Assets Operations: | | | | | | | | | | | | | |
Net Investment Income (Loss) | | $ | 76,600 | | $ | 108,684 | | $ | 4,029 | | $ | 1,785 | | $ | 24 | | $ | 48 | |
Net Realized Gain (Loss) | | 72,008 | | 90,759 | | 389 | | (216 | ) | (1 | ) | (29 | ) |
Net Change in Unrealized Appreciation (Depreciation) | | (57,123 | ) | (52,856 | ) | 2,183 | | 469 | | (2 | ) | 32 | |
Net Increase (Decrease) in Net Assets Resulting from Operations | | 91,485 | | 146,587 | | 6,601 | | 2,038 | | 21 | | 51 | |
Distributions from and/or in Excess of: | | | | | | | | | | | | | |
Institutional Class: | | | | | | | | | | | | | |
Net Investment Income | | (146,766 | ) | (205,755 | ) | (3,965 | ) | (652 | ) | (29 | ) | (21 | ) |
Net Realized Gain | | — | | — | | (415 | ) | — | | — | | — | |
Return of Capital | | — | | (54,511 | ) | — | | — | | — | | — | |
Total Distributions | | (146,766 | ) | (260,266 | ) | (4,380 | ) | (652 | ) | (29 | ) | (21 | ) |
Capital Share Transactions:(1) | | | | | | | | | | | | | |
Institutional Class: | | | | | | | | | | | | | |
Subscribed | | 103,581 | | 364,390 | | 6,477 | | 159,280 | | — | | — | |
Distributions Reinvested | | 127,617 | | 223,721 | | 3,953 | | 574 | | 27 | | 19 | |
Redeemed | | (240,719 | ) | (596,069 | ) | (11,096 | ) | (1,918 | ) | — | | (266 | ) |
Net Increase (Decrease) in Net Assets Resulting from Capital Share Transactions | | (9,521 | ) | (7,958 | ) | (666 | ) | 157,936 | | 27 | | (247 | ) |
Total Increase (Decrease) in Net Assets | | (64,802 | ) | (121,637 | ) | 1,555 | | 159,322 | | 19 | | (217 | ) |
Net Assets: | | | | | | | | | | | | | |
Beginning of Period | | 3,177,040 | | 3,298,677 | | 164,510 | | 5,188 | | 1,068 | | 1,285 | |
End of Period | | $ | 3,112,238 | | $ | 3,177,040 | | $ | 166,065 | | $ | 164,510 | | $ | 1,087 | | $ | 1,068 | |
Undistributed (Distributions in Excess of) Net Investment Income Included in End of Period Net Assets | | $ | (94,687 | ) | $ | (24,521 | ) | $ | 963 | | $ | 899 | | $ | (13 | ) | $ | (8 | ) |
| | | | | | | | | | | | | | | | | | | |
(1) Capital Share Transactions: | | | | | | | | | | | | | | | | | | | |
Institutional Class: | | | | | | | | | | | | | | | | | | | |
Shares Subscribed | | | 11,098 | | | 37,939 | | | 1,826 | | | 45,849 | | | — | | | — | |
Shares Issued on Distributions Reinvested | | | 13,663 | | | 23,333 | | | 1,128 | | | 169 | | | 2 | | | 2 | |
Shares Redeemed | | | (25,674 | ) | | (61,822 | ) | | (3,142) | | | (560 | ) | | — | | | (22 | ) |
Net Increase (Decrease) in Institutional Class Shares Outstanding | | | (913) | | | (550) | | | (188) | | | 45,458 | | | 2 | | | (20 | ) |
| | | | | | | | | | | | | | | | | | | | | | | | | | | |
^ As Restated — See Note L.
The accompanying notes are an integral part of the financial statements.
14
2007 Semi-Annual Report |
| |
March 31, 2007 (unaudited) |
Statement of Cash Flows
For the Six Months Ended March 31, 2007
| | Advisory | |
| | Portfolio | |
| | (000) | |
Cash Flows From Operating Activities: | | | |
Proceeds from Sales and Maturities of Investments | | $ | 3,112,535 | |
Purchases of Investments | | (2,740,712 | ) |
Proceeds from Sales of Forward Commitments | | 716,408 | |
Purchases of Forward Commitments | | (1,066,232 | ) |
Net (Increase) Decrease in Short-Term Investments | | 4,292 | |
Net Realized Gain (Loss) on Futures Contracts | | 7,313 | |
Net Realized Gain (Loss) on Swap Agreements | | 31,284 | |
Net Investment Income | | 76,600 | |
Adjustments to Reconcile Net Investment Income to Net Cash Provided by Operating Activities: | | | |
Net (Increase) Decrease in Receivables Related to Operations | | 331 | |
Net Increase (Decrease) in Payables Related to Operations | | 90 | |
Accretion/Amortization of Discounts and Premiums | | 4,177 | |
Net Cash Provided by Operating Activities | | 146,086 | |
Cash Flows from Financing Activities: | | | |
Proceeds from Portfolio Shares Sold | | 103,415 | |
Payment on Portfolio Shares Redeemed | | (241,926 | ) |
Cash Dividends and Distributions Paid | | (19,149 | ) |
Net Cash Used in Financing Activities | | (157,660 | ) |
Net Increase (Decrease) in Cash | | (11,574 | ) |
Cash at Beginning of Period | | 4,483 | |
Cash at End of Period | | $ | (7,091 | ) |
The accompanying notes are an integral part of the financial statements.
15
2007 Semi-Annual Report |
| |
March 31, 2007 |
Financial Highlights
Advisory Portfolio
| | Institutional Class | |
| | Six Months Ended | | | |
| | March 31, 2007 | | Year Ended September 30, | |
Selected Per Share Data and Ratios | | (unaudited) | | 2006^ | | 2005^ | | 2004^ | | 2003^ | | 2002 | |
Net Asset Value, Beginning of Period | | $ | 9.49 | | $ | 9.84 | | $ | 10.03 | | $ | 10.11 | | $ | 10.74 | | $ | 10.63 | |
Income from Investment Operations: | | | | | | | | | | | | | |
Net Investment Income | | 0.23 | † | 0.33 | † | 0.36 | † | 0.21 | † | 0.23 | † | 0.45 | |
Net Realized and Unrealized Gain (Loss) on | | | | | | | | | | | | | |
Investments | | 0.04 | | 0.11 | | 0.07 | | 0.21 | | 0.22 | | 0.41 | |
Total from Investment Operations | | 0.27 | | 0.44 | | 0.43 | | 0.42 | | 0.45 | | 0.87 | |
Distributions from and/or in Excess of: | | | | | | | | | | | | | |
Net Investment Income | | (0.44 | ) | (0.63 | ) | (0.62 | ) | (0.50 | ) | (0.51 | ) | (0.76 | ) |
Net Realized Gain | | — | | — | | — | | — | | (0.57 | ) | — | |
Return of Capital | | — | | (0.16 | ) | — | | — | | — | | — | |
Total Distributions | | (0.44 | ) | (0.79 | ) | (0.62 | ) | (0.50 | ) | (1.08 | ) | (0.76 | ) |
Net Asset Value, End of Period | | $ | 9.32 | | $ | 9.49 | | $ | 9.84 | | $ | 10.03 | | $ | 10.11 | | $ | 10.74 | |
Total Return | | 2.98 | ‡% | 4.76 | % | 4.44 | % | 4.30 | % | 4.42 | % | 8.49 | % |
Ratios and Supplemental Data: | | | | | | | | | | | | | |
Net Assets, End of Period (Thousands) | | $ | 3,112,238 | | $ | 3,177,040 | | $ | 3,298,677 | | $ | 3,760,527 | | $ | 5,716,522 | | $ | 7,034,400 | |
Ratio of Expenses to Average Net Assets (1) | | 0.08 | %* | 0.08 | % | 0.08 | % | 0.08 | % | 0.08 | % | 0.09 | % |
Ratio of Net Investment Income to Average | | | | | | | | | | | | | |
Net Assets (1) | | 4.96 | %* | 3.41 | % | 3.66 | % | 2.09 | % | 2.24 | % | 4.24 | % |
Portfolio Turnover Rate^^ | | 110 | %‡ | 230 | % | 240 | % | 512 | % | 120 | % | 112 | % |
(1) Supplemental Information on the Ratios to Average Net Assets: | |
Ratios Before Expenses Waived/ | | | | | | | | | | | | | |
Reimbursed by Adviser: | | | | | | | | | | | | | |
Expenses to Average Net Assets | | 0.48 | %* | 0.48 | % | 0.47 | % | 0.49 | % | 0.49 | % | 0.48 | % |
Net Investment Income to Average | | | | | | | | | | | | | |
Net Assets | | 4.55 | %* | 3.01 | % | 3.27 | % | 1.68 | % | 1.83 | % | 3.84 | % |
† | Per share amount is based on average shares outstanding. |
‡ | Not Annualized |
* | Annualized |
^ | As Restated — See Note L. |
^^ | The Portfolio’s turnover rate is calculated by dividing the lesser of purchases and sales of securities for a fiscal year by the average monthly value of the portfolio securities during such fiscal year. The turnover rate may vary greatly from year to year as well as within a year. The Portfolio’s turnover rate reflects mortgage pool forward commitments as purchases and sales, which was not the case prior to the year ended September 30, 2004. The inclusion of such securities caused the reported turnover rate to be higher during the period than in previous fiscal years. |
The accompanying notes are an integral part of the financial statements
16
2007 Semi-Annual Report |
| |
March 31, 2007 |
Financial Highlights
Advisory Global Fixed Income Portfolio
| | Institutional Class | |
| | Six Months Ended | | | |
| | March 31, 2007 | | Year Ended September 30, | |
Selected Per Share Data and Ratios | | (unaudited) | | 2006 | | 2005 | | 2004 | | 2003 | | 2002 | |
Net Asset Value, Beginning of Period | | $ | 3.50 | | $ | 3.41 | | $ | 3.34 | | $ | 3.29 | | $ | 4.17 | | $ | 3.97 | |
Income (Loss) from Investment Operations: | | | | | | | | | | | | | |
Net Investment Income† | | 0.09 | | 0.18 | | 0.08 | | 0.06 | | 0.06 | | 0.18 | |
Net Realized and Unrealized Gain (Loss) on Investments | | 0.05 | | (0.01 | )†† | 0.06 | | 0.01 | | 0.07 | | 0.37 | |
Total from Investment Operations | | 0.14 | | 0.17 | | 0.14 | | 0.07 | | 0.07 | | 0.37 | |
Distributions from and/or in Excess of: | | | | | | | | | | | | | |
Net Investment Income | | (0.08 | ) | (0.08 | ) | (0.07 | ) | (0.02 | ) | (0.34 | ) | (0.17 | ) |
Net Realized Gain | | (0.01 | ) | — | | (0.00 | )# | (0.00 | )# | (0.61 | ) | — | |
Total Distributions | | (0.09 | ) | (0.08 | ) | (0.07 | ) | (0.02 | ) | (0.95 | ) | (0.17 | ) |
Net Asset Value, End of Period | | $ | 3.55 | | $ | 3.50 | | $ | 3.41 | | $ | 3.34 | | $ | 3.29 | | $ | 4.17 | |
Total Return | | 4.16 | %‡ | 4.93 | % | 4.30 | % | 2.15 | % | 1.88 | % | 9.73 | % |
Ratios and Supplemental Data: | | | | | | | | | | | | | |
Net Assets, End of Period (Thousands) | | $ | 166,065 | | $ | 164,510 | | $ | 5,188 | | $ | 101,210 | | $ | 157,665 | | $ | 8,713 | |
Ratio of Expenses to Average Net Assets (1) | | 0.12 | %* | 0.15 | % | 0.15 | % | 0.15 | % | 0.22 | % | 0.15 | % |
Ratio of Net Investment Income to Average Net Assets (1) | | 4.86 | %* | 5.18 | % | 2.45 | % | 1.91 | % | 1.86 | % | 4.51 | % |
Portfolio Turnover Rate | | 42 | %‡ | 11 | % | 7 | % | 10 | % | 13 | % | 51 | % |
(1) Supplemental Information on the Ratios to Average Net Assets: | |
Ratios Before Expenses Waived/Reimbursed by Adviser: | | | | | | | | | | | | | |
Expenses to Average Net Assets | | 0.49 | %* | 0.63 | % | 0.57 | % | 0.53 | % | 0.54 | % | 0.49 | % |
Net Investment Income to Average Net Assets | | 4.49 | %* | 4.70 | % | 2.03 | % | 1.53 | % | 1.47 | % | 4.14 | % |
† | Per share amount is based on average shares outstanding. |
‡ | Not Annualized |
* | Annualized |
†† | The amount shown for a share outstanding does not correspond with the aggregate net gain (loss) on investments for the period due to timing of sales and repurchases of shares in relation to fluctuating market values of the investments of the Portfolio. |
# | Amount is less than $0.005 per share. |
The accompanying notes are an integral part of the financial statements.
17
2007 Semi-Annual Report |
| |
March 31, 2007 |
Financial Highlights
Advisory Global Fixed Income Portfolio II
| | Institutional Class | |
| | Six Months Ended | | | |
| | March 31, 2007 | | Year Ended September 30, | |
Selected Per Share Data and Ratios | | (unaudited) | | 2006 | | 2005 | | 2004 | | 2003 | | 2002 | |
Net Asset Value, Beginning of Period | | $ | 12.30 | | $ | 12.00 | | $ | 11.84 | | $ | 11.63 | | $ | 11.60 | | $ | 10.92 | |
Income (Loss) from Investment Operations: | | | | | | | | | | | | | |
Net Investment Income† | | 0.26 | | 0.49 | | 0.29 | | 0.22 | | 0.24 | | 0.48 | |
Net Realized and Unrealized Gain (Loss) on Investments | | (0.01 | ) | 0.02 | | 0.07 | | 0.05 | | (0.01 | ) | 0.79 | |
Total from Investment Operations | | 0.25 | | 0.51 | | 0.36 | | 0.27 | | 0.23 | | 1.27 | |
Distributions from and/or in Excess of: | | | | | | | | | | | | | |
Net Investment Income | | (0.34 | ) | (0.21 | ) | (0.20 | ) | (0.06 | ) | (0.20 | ) | (0.59 | ) |
Net Realized Gain | | — | | — | | — | | (0.00 | )# | — | | — | |
Total Distributions | | (0.34 | ) | (0.21 | ) | (0.20 | ) | (0.06 | ) | (0.20 | ) | (0.59 | ) |
Net Asset Value, End of Period | | $ | 12.21 | | $ | 12.30 | | $ | 12.00 | | $ | 11.84 | | $ | 11.63 | | $ | 11.60 | |
Total Return | | 2.04 | %‡ | 4.30 | % | 3.11 | % | 2.35 | % | 1.96 | % | 12.07 | % |
Ratios and Supplemental Data: | | | | | | | | | | | | | |
Net Assets, End of Period (Thousands) | | $ | 1,087 | | $ | 1,068 | | $ | 1,285 | | $ | 25,671 | | $ | 26,874 | | $ | 2,181 | |
Ratio of Expenses to Average Net Assets (1) | | 0.15 | %* | 0.15 | % | 0.15 | % | 0.15 | % | 0.22 | % | 0.16 | % |
Ratio of Net Investment Income to Average Net Assets (1) | | 4.33 | %* | 4.04 | % | 2.41 | % | 1.92 | % | 2.08 | % | 4.51 | % |
Portfolio Turnover Rate | | 12 | %‡ | 91 | % | 15% | | 11 | % | 50 | % | 59 | % |
| | | | | | | | | | | | | | | | | | | | |
(1) Supplemental Information on the Ratios to Average Net Assets: | |
Ratios Before Expenses Waived/Reimbursed by Adviser: | | | | | | | | | | | | | |
Expenses to Average Net Assets | | 5.95 | %* | 5.36 | % | 0.81 | % | 0.62 | % | 1.23 | % | 0.57 | % |
Net Investment Income (Loss) to Average Net Assets | | (1.47 | )%* | (1.17 | )% | 1.75 | % | 1.45 | % | 1.00 | % | 4.09 | % |
† | Per share amount is based on average shares outstanding. |
‡ | Not Annualized |
* | Annualized |
# | Amount is less than $0.005 per share. |
The accompanying notes are an integral part of the financial statements.
18
2007 Semi-Annual Report |
| |
March 31, 2007 (unaudited) |
Notes to Financial Statements
Morgan Stanley Institutional Fund Trust (“MSIFT” or the “Fund”) is registered under the Investment Company Act of 1940, as amended (the “1940 Act”) as an open-end investment company. The Fund is comprised of eighteen active portfolios. The accompanying financial statements and financial highlights are those of the Advisory Portfolio (formerly, Advisory Mortgage Portfolio), Advisory Global Fixed Income (formerly, Advisory Foreign Fixed Income Portfolio) and Advisory Global Fixed Income Portfolio II (formerly, Advisory Foreign Fixed Income II Portfolio) (each referred to as a “Portfolio”) only. For the purposes of the 1940 Act, the Advisory Global Fixed Income Portfolio and Advisory Global Fixed Income Portfolio II are considered non-diversified funds; the Advisory Portfolio is considered a diversified fund. Effective December 8, 2006, the Advisory Foreign Fixed Income Portfolio and Advisory Foreign Fixed Income II Portfolio changed its name to Advisory Global Fixed Income Portfolio and Advisory Global Fixed Income Portfolio II, resepctively. Effective April 17, 2006, the Advisory Mortgage Portfolio changed its name to the Advisory Portfolio. The financial statements of the remaining portfolios are presented separately.
A. Significant Accounting Policies. The following significant accounting policies are in conformity with U.S. generally accepted accounting principles. Such policies are consistently followed by the Fund in the preparation of its financial statements. U.S. generally accepted accounting principles may require management to make estimates and assumptions that affect the reported amounts and disclosures in the financial statements. Actual results may differ from those estimates.
1. Security Valuation: Bonds and other fixed income securities may be valued according to the broadest and most representative market. In addition, bonds and other fixed income securities may be valued on the basis of prices provided by a pricing service. The prices provided by a pricing service take into account broker dealer market price quotations for institutional size trading in similar groups of securities, security quality, maturity, coupon and other security characteristics as well as any developments related to the specific security. Debt securities purchased with remaining maturities of 60 days or less are valued at amortized cost, if it approximates market value. Equity securities listed on a U.S. exchange are valued at the latest quoted sales price on the valuation date. Equity securities listed or traded on NASDAQ, for which market quotations are available, are valued at the NASDAQ Official Closing Price. Securities listed on a foreign exchange are valued at their closing price, except as noted below. Unlisted and listed equity securities not traded on the valuation date, for which market quotations are readily available, are valued at the mean between the current bid and asked prices obtained from reputable brokers.
All other securities and investments for which market values are not readily available, including restricted securities, and those securities for which it is inappropriate to determine prices in accordance with the aforementioned procedures, are valued at fair value as determined in good faith under procedures adopted by the Board of Trustees (the “Trustees”), although the actual calculations may be done by others. Factors considered in making this determination may include, but are not limited to, information obtained by contacting the issuer, analysts, or the appropriate stock exchange (for exchange-traded securities), analysis of the issuer’s financial statements or other available documents and, if necessary, available information concerning other securities in similar circumstances.
Most foreign markets close before the New York Stock Exchange (NYSE). Occasionally, developments that could affect the closing prices of securities and other assets may occur between the times at which valuations of such securities are determined (that is, close of the foreign market on which the securities trade) and the close of business on the NYSE. If these developments are expected to materially affect the value of the securities, the valuations may be adjusted to reflect the estimated fair value as of the close of the NYSE, as determined in good faith under procedures established by the Trustees.
2. Repurchase Agreements: Each Portfolio may enter into repurchase agreements under which a Portfolio lends excess cash and takes possession of securities with an agreement that the counterparty will repurchase such securities. In connection with transactions in repurchase agreements, a bank as custodian for the Fund takes possession of the underlying securities which are held as collateral, with a market value at least equal to the amount of the repurchase transaction, including principal and accrued interest. To the extent that any repurchase transaction exceeds one business day, the value of the collateral is marked-to-market on a daily basis to determine the adequacy of the collateral. In the event of default on the obligation to repurchase, the Fund has the right to liquidate the collateral and apply the proceeds in satisfaction of the obligation. In the event of default or bankruptcy by the counterparty to the agreement, realization and/or retention of the collateral or proceeds may be subject to legal proceedings.
Pursuant to an exemptive order issued by the Securities and Exchange Commission, the Portfolios may transfer their uninvested cash balances into a joint trading account with other Portfolios of the Fund which invests in one or more
19
2007 Semi-Annual Report
March 31, 2007 (unaudited)
Notes to Financial Statements (cont’d)
repurchase agreements. Any such joint repurchase agreement is covered by the same collateral requirements discussed above.
3. Futures: Financial futures contracts (secured by cash and securities deposited with brokers as “initial margin”) are valued based upon their quoted daily settlement prices; changes in initial settlement value (represented by cash paid to or received from brokers as “variation margin”) are accounted for as unrealized appreciation (depreciation). When futures contracts are closed, the difference between the opening value at the date of purchase and the value at closing is recorded as realized gain or loss in the Statements of Operations. “Due from (to) Broker” includes initial margin and variation margin, as stated in the Statements of Assets & Liabilities.
Futures contracts may be used by each Portfolio in order to hedge against unfavorable changes in the value of securities or to attempt to realize profits from the value of the related securities.
Futures contracts involve market risk that may exceed the amounts recognized in the Statements of Assets & Liabilities. Risks arise from the possible movements in the prices of securities relating to these instruments. The change in value of futures contracts primarily corresponds with the value of their related securities, but may not precisely correlate with the change in value of such securities. In addition, there is the risk that a Portfolio may not be able to enter into a closing transaction because of an illiquid secondary market.
4. Securities Sold Short: Each Portfolio may sell securities short. A short sale is a transaction in which the Portfolio sells securities it may or may not own, but has borrowed, in anticipation of a decline in the market price of the securities. The Portfolio is obligated to replace the borrowed securities at their market price at the time of replacement. The Portfolio may have to pay a premium to borrow the securities as well as pay any dividends or interest payable on the securities until they are replaced. The Portfolio’s obligation to replace the securities borrowed in connection with a short sale will generally be secured by collateral deposited with the broker that consists of cash, U.S. government securities or other liquid high grade debt obligations. In addition, the Portfolio will either place in a segregated account with its custodian or denote on its custody records an amount of cash, U.S. government securities or other liquid high grade debt obligations equal to the difference, if any, between (1) the market value of the securities sold at the time they were sold short and (2) any cash, U.S. government securities or other liquid high grade debt obligations deposited as collateral with the broker in connection with the short sale (not including the proceeds of the short sale). Short sales by the Portfolios involve certain risks and special considerations. Possible losses from short sales differ from losses that could be incurred from a purchase of a security because losses from short sales may be unlimited, whereas losses from purchases cannot exceed the total amount invested.
5. Swap Agreements: Each Portfolio may enter into swap agreements to exchange the interest rate on, or return generated by, one nominal instrument for the return generated by another nominal instrument. Cash collateral for swap agreements, if applicable, is deposited with the broker serving as counterparty to the agreement, and is included in “Due from (to) Broker” on the Statements of Assets & Liabilities. The following summarizes swaps entered into by the Portfolios:
Credit Default Swaps: Credit default swaps involve commitments to pay a fixed rate in exchange for payment if a credit event affecting a third party (the referenced company) occurs. Credit events may include a failure to pay interest, bankruptcy, or restructuring. The Portfolio accrues for interim payments on swap contracts on a daily basis, with the net amount recorded within unrealized appreciation (depreciation) of swap contracts on the Statements of Assets and Liabilities. Once interim payments are settled in cash, the net amount is recorded within realized gain (loss) on swaps on the Statements of Operations. Credit default swaps are marked-to-market daily based upon quotations from market makers and the change, if any, is recorded as unrealized appreciation or depreciation in the Statements of Operations.
Interest Rate Swaps: Interest rate swaps involve the exchange of commitments to pay and receive interest based on a notional principal amount. The Portfolio accrues for interim payments on swap contracts on a daily basis, with the net amount recorded within unrealized appreciation (depreciation) of swap contracts on the Statements of Assets and Liabilities. Once interim payments are settled in cash, the net amount is recorded within realized gain (loss) on swaps on the Statements of Operations. In a zero-coupon interest rate swap, payments only occur at maturity, at which time one counterparty pays the total compounded fixed rate over the life of the swap and the other pays the total compounded floating rate that would have been earned had a series of LIBOR investments been rolled over through the life of the swap. The Portfolio amortizes its interest payment obligation over the life of the swap. The amortized portion of this payment is recorded in the Statements of Operations as an adjustment to interest income. The unamortized portion of this payment is included in “Due from (to) Broker” on the Statements of Assets and Liabilities. Interest rate swaps are marked-to-market daily
20
2007 Semi-Annual Report |
| |
March 31, 2007 (unaudited) |
Notes to Financial Statements (cont’d)
based upon quotations from market makers and the change, if any, is recorded as unrealized appreciation or depreciation in the Statements of Operations.
Total Return Swaps: Total return swaps involve commitments to pay interest in exchange for a market-linked return based on a notional amount. To the extent the total return of the security or index underlying the transaction exceeds or falls short of the offsetting interest rate obligation, the Portfolio will receive a payment from or make a payment to the coun-terparty, respectively. Total return swaps are marked-to-market daily based upon quotations from market makers and the change, if any, is recorded as unrealized appreciation or depreciation in the Statements of Operations. Periodic payments received or made at the end of each measurement period, but prior to termination, are recorded as realized gains or losses in the Statements of Operations.
Realized gains or losses on maturity or termination of swaps are presented in the Statements of Operations. Because there is no organized market for these swap agreements, the unrealized gain/loss reported in the Statements of Assets & Liabilities may differ from that which would be realized in the event the Portfolio terminated its position in the agreement. Risks may arise upon entering into these agreements from the potential inability of the counterparties to meet the terms of the agreements and are generally limited to the amount of net interest payments to be received, if any, at the date of default. Risks also arise from potential losses from adverse market movements and such losses could exceed the related amounts shown in the Statements of Assets & Liabilities.
6. Structured Investments: Each Portfolio may invest in structured investments whose values are linked either directly or inversely to changes in foreign currencies, interest rates, commodities, indices, or other underlying instruments. A Portfolio uses these securities to increase or decrease its exposure to different underlying instruments and to gain exposure to markets that might be difficult to invest in through conventional securities. Structured investments may be more volatile than their underlying instruments, but any loss is limited to the amount of the original investment.
7. Delayed Delivery Commitments: Each Portfolio may purchase or sell securities on a when-issued or forward commitment basis. Payment and delivery may take place a month or more after the date of the transaction. The price of the underlying securities and the date when the securities will be delivered and paid for are fixed at the time the transaction is negotiated. Liquid securities or cash is designated in an amount at least equal to these commitments. Securities held for this purpose cannot be sold while this strategy is outstanding, unless replaced with other assets. As a result, there is a possibility that as designated assets reach certain levels, a Portfolio may lose some flexibility in managing its investments, responding to shareholder redemption requests, or meeting other current obligations. Such transactions may give rise to a form of leverage. This can cause a Portfolio to be more volatile than if it had not been leveraged, as leverage tends to exaggerate the effect of any increase or decrease in the value of the
8. Foreign Currency Translation and Foreign Currency Exchange Contracts: The books and records of the Fund are maintained in U.S. dollars. Foreign currency amounts are translated into U.S. dollars at the bid prices of such currencies against U.S. dollars quoted by a bank. Net realized gains (losses) on foreign currency transactions represent net foreign exchange gains (losses) from foreign currency exchange contracts, disposition of foreign currencies, currency gains or losses realized between the trade and settlement dates on securities transactions, and the difference between the amount of investment income and foreign withholding taxes recorded on a Portfolio’s books and the U.S. dollar equivalent of amounts actually received or paid.
A foreign currency exchange contract is an agreement between two parties to buy or sell currency at a set price on a future date. Each Portfolio may enter into foreign currency exchange contracts to protect securities and related receivables and payables against future changes in foreign exchange rates and, in certain situations, to gain exposure to foreign currencies. Certain Portfolios may also enter into cross currency hedges which involve the sale of one currency against the positive exposure to a different currency. Cross currency hedges may be used for hedging purposes or to establish an active exposure to the exchange rate between any two currencies. Fluctuations in the value of such contracts are recorded as unrealized appreciation or depreciation; realized gains or losses, which are disclosed in the Statements of Operations, include net gains or losses on contracts which have been terminated by settlements. Risks may arise upon entering into these contracts from the potential inability of counterparties to meet the terms of their contracts and are generally limited to the amount of unrealized gain on the contract, if any, at the date of default. Risks may also arise from unanticipated movements in the value of the foreign currency relative to the U.S. dollar.
The Advisory Global Fixed Income Portfolio and Advisory Global Fixed Income Portfolio II’s net assets include foreign denominated securities and currency. The net assets of these Portfolios are presented at the foreign exchange rates and market values at the close of the period. The Portfolios do not isolate that portion of the results of operations arising as a result of changes in the foreign exchange rates from the
21
2007 Semi-Annual Report
March 31, 2007 (unaudited)
Notes to Financial Statements (cont’d)
fluctuations arising from changes in the market prices of the securities held at period end. Similarly, the Portfolios do not isolate the effect of changes in foreign exchange rates from the fluctuations arising from changes in the market prices of securities sold during the period. Accordingly, the component of realized and unrealized foreign currency gains (losses) representing foreign exchange changes on investments is included in the reported net realized and unrealized gains (losses) on investment transactions and balances. Changes in currency exchange rates will affect the value of and investment income from such securities and currency.
Foreign security and currency transactions may involve certain considerations and risks not typically associated with those of U.S. dollar denominated transactions as a result of, among other factors, the possibly lower level of governmental supervision, relative currency valuation fluctuation and regulation of foreign securities markets and the possibility of political or economic instability.
9. Purchased and Written Options: Certain Portfolios may write covered call and put options on portfolio securities and other financial instruments. Premiums are received and are recorded as liabilities. The liabilities are subsequently adjusted to reflect the current value of the options written. Premiums received from writing options which expire are treated as realized gains. Premiums received from writing options which are exercised or are closed are added to or offset against the proceeds or amount paid on the transaction to determine the net realized gain or loss. By writing a covered call option, a Portfolio, in exchange for the premium, foregoes the opportunity for capital appreciation above the exercise price should the market price of the underlying security increase. By writing a put option, a Portfolio, in exchange for the premium, accepts the risk of having to purchase a security at an exercise price that is above the current market price.
Certain Portfolios may purchase call and put options on their portfolio securities or other financial instruments. Each Portfolio may purchase call options to protect against an increase in the price of the security or financial instrument it anticipates purchasing. Each Portfolio may purchase put options on securities which it holds or other financial instruments to protect against a decline in the value of the security or financial instrument or to close out covered written put positions. Risks may arise from an imperfect correlation between the change in market value of the securities held by the Portfolio and the prices of options relating to the securities purchased or sold by the Portfolio and from the possible lack of a liquid secondary market for an option. The maximum exposure to loss for any purchased option is limited to the premium initially paid for the option.
Options written for the six months ended March 31, 2007 were as follows:
| | Total | | Total | |
| | Number of | | Premiums | |
Advisory Global Fixed Income Portfolio | | Contracts | | Received | |
Options Outstanding — October 1, 2006 | | — | | $ | — | |
Options Written | | 14,670 | | 207 | |
Options Terminated in Closing Purchase Transactions | | — | | — | |
Options Expired | | — | | — | |
Options Exercised | | — | | — | |
Options Outstanding — March 31, 2007 | | 14,670 | | $ | 207 | |
10. New Accounting Pronouncements: In July 2006, the Financial Accounting Standards Board (FASB) issued Interpretation 48, “Accounting for Uncertainty in Income Taxes — an Interpretation of FASB Statement No. 109” (FIN 48). FIN 48 clarifies the accounting for income taxes by prescribing the minimum recognition threshold a tax position must meet before being recognized in the financial statements. FIN 48 is effective for fiscal years beginning after December 15, 2006 and is to be applied to all open tax years as of the effective date. Recent SEC guidance allows implementing FIN 48 in the Portfolio NAV calculations as late as the Portfolios’ last NAV calculation in the first required financial statement period. As a result, the Fund will incorporate FIN 48 in its next semi annual report. The impact to the Portfolios’ financial statements, if any, is currently being assessed.
In addition, in September 2006, Statement of Financial Accounting Standards No. 157, Fair Value Measurements (SFAS 157), was issued and is effective for fiscal years beginning after November 15, 2007. SFAS 157 defines fair value, establishes a framework for measuring fair value and expands disclosures about fair value measurements. Management is currently evaluating the impact the adoption of SFAS 157 will have on the Portfolios’ financial statement disclosures.
11. Other: Security transactions are accounted for on the date the securities are purchased or sold. Costs used in determining realized gains and losses on the sale of investment securities are those of specific securities sold.
Discounts and premiums on securities purchased are accreted/amortized over their respective lives. Most expenses of the Fund can be directly attributed to a particular Portfolio. Expenses which cannot be directly attributed are apportioned among the Portfolios on the basis of their relative net assets.
22
2007 Semi-Annual Report |
| |
March 31, 2007 (unaudited) |
Notes to Financial Statements (cont’d)
B. Investment Advisory Fees. Morgan Stanley Investment Management Inc. (the “Adviser” or “MS Investment Management”), a wholly-owned subsidiary of Morgan Stanley, performs investment advisory services at a fee calculated by applying a quarterly rate based on an annual percentage rate of 0.375% of each Portfolio’s average daily net assets for the quarter.
The Adviser has voluntarily agreed to reduce the fees payable to it and, if necessary, reimburse the Portfolios for certain expenses, after giving effect to custody fee offsets, if annual operating expenses exceed 0.08%, 0.15% and 0.15% of average daily net assets of the Advisory Portfolio, Advisory Global Fixed Income Portfolio, and Advisory Global Fixed Income Portfolio II, respectively.
Morgan Stanley Investment Management Limited (“MSIM Limited”) serves as Sub-Adviser to the Advisory Global Fixed Income Portfolio and the Advisory Global Fixed Income Portfolio II. MSIM Limited is a wholly-owned subsidiary of Morgan Stanley. Under an Investment Sub-Advisory Agreement with the Adviser, MSIM Limited, subject to the control and supervision of the Fund, its officers, Trustees and the Adviser, and in accordance with the investment objectives, policies and restrictions of these Portfolios, makes certain day-to-day investment decisions for these Portfolios and places certain of the Portfolios’ purchase and sales orders. The Adviser pays MSIM Limited on a monthly basis a portion of the net advisory fees the Adviser receives from these Portfolios.
C. Administration Fees. MS Investment Management (the “Administrator”) also provides the Fund with administration services pursuant to an administration agreement for an annual fee, accrued daily and paid monthly, of 0.08% of each Portfolio’s average daily net assets.
Under an agreement between the Administrator and JPMorgan Investor Services Co. (“JPMIS”), a corporate affiliate of JPMorgan Chase Bank, N.A., JPMIS provides certain administrative services to the Fund. For such services, the Administrator pays JPMIS a portion of the fee the Administrator receives from the Fund. An employee of JPMIS is an officer of the Fund.
D. Distributor. Morgan Stanley Distribution, Inc. (“MSDI” or the “Distributor”), a wholly-owned subsidiary of the Adviser, serves as the distributor for the Fund. MSDI is a limited-purpose broker/dealer whose only function is to distribute open-end mutual fund shares.
E. Custodian Fees. JPMorgan Chase Bank, N.A. (the “Custodian”) serves as Custodian for the Fund in accordance with a custodian agreement. The Custodian holds cash, securities, and other assets of the Fund as required by the 1940 Act.
The Fund has entered into an arrangement with its Custodian whereby credits realized on uninvested cash balances were used to offset a portion of each applicable Portfolio’s expenses. These custodian credits are shown as “Expense Offset” on the Statements of Operations.
F. Transfer Agency Fees. JPMIS serves as transfer agent to the Fund pursuant to a transfer agency agreement.
G. Portfolio Investment Activity.
1. Purchases and Sales of Securities: For the six months ended March 31, 2007, purchases and sales of investment securities other than temporary cash investments and long-term U.S. government securities were:
| | Purchases | | Sales | |
Portfolio | | (000) | | (000) | |
Advisory | | $ | 2,325,973 | | $ | 2,008,223 | |
Advisory Global Fixed Income | | 25,115 | | 33,660 | |
Advisory Global Fixed Income II | | 51 | | 107 | |
| | | | | | | |
For the six months ended March 31, 2007, purchases and sales of long-term U.S. government securities were:
| | Purchases | | Sales | |
Portfolio | | (000) | | (000) | |
Advisory | | $ | 1,350,527 | | $ | 2,040,261 | |
| | | | | | | |
2. Swap Agreements: At March 31, 2007, the Advisory Portfolio had the following open Swap Agreements:
| | | | | | | | | | | | Net Unrealized | |
| | | | Notional | | | | | | | | Appreciation | |
| | Termination | | Amount | | | | | | | | (Depreciation) | |
Counterparty | | Date | | (000) | | Type | | Pay | | Receive | | (000) | |
| | | | | | | | | | | | | |
Citigroup | | 5/15/21 | | $ | 39,800 | | ZCS | | at maturity | | compounded 3 month LIBOR less 7.50 bps | | $ | (659 | ) |
| | 5/15/21 | | 39,800 | | ZCS | | at maturity | | compounded 3 month LIBOR less 7.50 bps | | (609 | ) |
| | 5/15/21 | | 15,500 | | ZCS | | at maturity | | compounded 3 month LIBOR less 7.50 bps | | (298 | ) |
| | 5/15/21 | | 47,200 | | ZCS | | at maturity | | compounded 3 month LIBOR less 7.75 bps | | (900 | ) |
| | 5/15/21 | | 33,000 | | ZCS | | at maturity | | compounded 3 month LIBOR less 7.50 bps | | (658 | ) |
| | 5/15/21 | | 30,410 | | ZCS | | at maturity | | compounded 3 month LIBOR less 7.75 bps | | (529 | ) |
| | 5/15/21 | | 36,300 | | ZCS | | at maturity | | compounded 3 month LIBOR less 7.25 bps | | (750 | ) |
| | 5/15/21 | | 119,875 | | ZCS | | at maturity | | compounded 3 month LIBOR less 3.75 bps | | 221 | |
| | 5/15/21 | | 63,800 | | ZCS | | at maturity | | compounded 3 month LIBOR less 4.50 bps | | 414 | |
| | | | | | | | | | | | | | | |
23
2007 Semi-Annual Report
March 31, 2007 (unaudited)
Notes to Financial Statements (cont’d)
| | | | | | | | | | | | Net Unrealized | |
| | | | Notional | | | | | | | | Appreciation | |
| | Termination | | Amount | | | | | | | | (Depreciation) | |
Counterparty | | Date | | (000) | | Type | | Pay | | Receive | | (000) | |
| | 5/15/21 | | $ | 63,900 | | ZCS | | at maturity | | compounded 3 month LIBOR less 3.00 bps | | $ | 2,344 | |
| | 5/15/21 | | 27,250 | | ZCS | | at maturity | | compounded 3 month LIBOR less 4.50 bps | | 1,259 | |
Credit Suisse First Boston | | 5/15/21 | | 289,000 | | ZCS | | at maturity | | compounded 3 month LIBOR | | (1,276 | ) |
| | | | | | | | | | | | $ | (1,441 | ) |
| | | | | | | | | | | | | | | |
bps | — basis points |
LIBOR | — London Inter Bank Offer Rate |
ZCS | — Zero Coupon Interest Rate Swap |
H. Securities Lending. Certain Portfolios may lend securities to qualified financial institutions, such as broker-dealers, to earn additional income. Any increase or decrease in the fair value of the securities loaned that might occur and any interest earned or dividends declared on those securities during the term of the loan would remain in the Portfolio. Portfolios that lend securities receive cash or securities as collateral in an amount equal to or exceeding 100% of the current fair value of the loaned securities. The collateral is marked to market daily, by the securities lending agent, to ensure that a minimum of 100% collateral coverage is maintained.
Based on pre-established guidelines, the securities lending agent invests any cash collateral that is received in high-quality short-term investments. Securities lending income is generated from the earnings on the invested collateral and borrowing fees, less any rebates owed to the borrowers and compensation to the lending agent, and is included in the Portfolios’ Statements of Operations in interest income. Risks in securities lending transactions are that a borrower may not provide additional collateral when required or return the securities when due, and that the value of the short-term investments will be less than the amount of cash collateral plus any rebate that is required to be returned to the borrower. The value of loaned securities and related collateral outstanding at March 31, 2007 are as follows:
| | Value of | | | |
| | Loaned | | Value of | |
| | Securities | | Collateral | |
Portfolio | | (000) | | (000) | |
| | | | | | | |
Advisory | | $ | 400,163 | | $ | 409,267 | |
The following Portfolios had income from securities lending (after rebates to borrowers and allocation to the securities lending agent):
| | Net Interest | |
| | Earned by | |
| | Portfolio | |
Portfolio | | (000) | |
| | | | |
Advisory | | $ | 79 | |
I. Federal Income Taxes. It is each Portfolio’s intention to continue to qualify as a regulated investment company and distribute all of its taxable income. Accordingly, no provision for Federal income taxes is required in the financial statements. Dividend income and distributions to shareholders are recorded on the ex-dividend date. Interest income is recognized on the accrual basis. Dividends from net investment income, if any, are declared and paid quarterly for the Advisory Global Fixed Income Portfolio and Advisory Global Fixed Income Portfolio II and monthly for the Advisory Portfolio. Net realized capital gains, if any, are distributed at least annually.
The tax character of distributions paid may differ from the character of distributions shown on the Statements of Changes in Net Assets due to short-term capital gains being treated as ordinary income for tax purposes. The tax character of distributions paid during fiscal 2006 and 2005 were as follows:
| | 2006 Distributions | | 2005 Distributions | |
| | Paid From: | | Paid From: | |
| | | | | | Long-Term | | | | Long-Term | |
| | Ordinary | | Return of | | Capital | | Ordinary | | Capital | |
| | Income | | Capital | | Gain | | Income | | Gain | |
Portfolio | | (000) | | (000) | | (000) | | (000) | | (000) | |
| | | | | | | | | | | |
Advisory^ | | $ | 205,755 | | $ | 54,511 | | $ | — | | $ | 215,705 | | $ | — | |
Advisory | | | | | | | | | | | |
Global Fixed | | | | | | | | | | | |
Income | | 652 | | — | | — | | 4,713 | | — | |
Advisory | | | | | | | | | | | |
Global Fixed | | | | | | | | | | | |
Income II | | 21 | | — | | — | | 1,111 | | — | |
| | | | | | | | | | | | | | | | |
^ As Restated — See Note L.
The amount and character of income and gains to be distributed are determined in accordance with income tax regulations which may differ from U.S. generally accepted accounting principles. The book/tax differences are either considered temporary or permanent in nature.
Temporary differences are generally due to differing book and tax treatments in the timing of the recognition of gains or losses on securities, forwards and futures, including Post-October Losses.
24
2007 Semi-Annual Report |
| |
March 31, 2007 (unaudited) |
Notes to Financial Statements (cont’d)
Permanent differences are generally due to swap transactions, paydown adjustments, foreign futures transactions and foreign currency transactions. These resulted in the following reclassifications among the Portfolios’ components of net assets at September 30, 2006:
| | Accumulated | | | | | |
| | Undistributed | | | | | |
| | (Distributions in | | | | | |
| | Excess of) Net | | Accumulated Net | | | |
| | Investment | | Realized Gain | | Paid-in | |
| | Income (Loss) | | (Loss) | | Capital | |
Portfolio | | (000) | | (000) | | (000)^^ | |
Advisory^ | | $ | 125,975 | | $ | (117,171 | ) | $ | (8,804 | ) |
Advisory Global | | | | | | | |
Fixed Income | | (216 | ) | 216 | | — | |
Advisory Global | | | | | | | |
Fixed Income II | | (30 | ) | 30 | | — | |
| | | | | | | | | | |
^ As Restated — See Note L.
^^ The restatement of accretion income for Interest Only securities resulted in a Return of Capital for the Advisory Portfolio.
At September 30, 2006, the components of distributable earnings on a tax basis were as follows:
| | Undistributed | |
| | Ordinary Income | |
Portfolio | | (000) | |
Advisory^ | | $ | — | |
Advisory Global Fixed Income | | 1,282 | |
Advisory Global Fixed Income II | | 29 | |
| | | | |
^ As Restated — See Note L.
At March 31, 2007, cost, unrealized appreciation, unrealized depreciation and net unrealized appreciation (depreciation) of securities for Federal income tax purposes were:
| | | | | | | | Net | |
| | | | | | | | Appreciation | |
| | Cost | | Appreciation | | Depreciation | | (Depreciation) | |
Portfolio | | (000) | | (000) | | (000) | | (000) | |
| | | | | | | | | |
Advisory | | $ | 3,787,067 | | $ | 28,038 | | $ | (108,065 | ) | $ | (80,027 | ) |
Advisory Global | | | | | | | | | |
Fixed Income | | 160,790 | | 4,039 | | (448 | ) | 3,591 | |
Advisory Global Fixed | | | | | | | | | |
Income II | | 989 | | 19 | | — | | 19 | |
| | | | | | | | | | | | | |
At September 30, 2006, the following Portfolios had available for Federal income tax purposes unused capital losses, which will expire on the indicated dates:
| | Expiration Date September 30, | |
| | (000) | |
Portfolio | | 2011 | | 2012 | | 2013 | | 2014 | | Total | |
Advisory^ | | $ | — | | $ | 152,715 | | $ | 62,736 | | $ | 19,857 | | $ | 235,308 | |
Advisory Global Fixed Income | | — | | — | | — | | 32 | | 32 | |
| | | | | | | | | | | | | | | | |
^ As Restated — See Note L.
To the extent that a capital loss carryover is used to offset any future capital gains realized during the carryover period as provided by U.S. Federal income tax regulations, no capital gains tax liability will be incurred by a portfolio for gains realized components of net assets at and not distributed. To the extent that capital gains are offset, such gains will not be distributed to the shareholders.
Under current tax law, certain capital and net foreign exchange losses realized after October 31 may be deferred and treated as occurring on the first day of the following fiscal year. For the year ended September 30, 2006, the Advisory Portfolio and Advisory Global Fixed Income Portfolio II elected to defer capital and currency losses occurring between November 1, 2005 and September 30, 2006 up to approximately $65,443,000 and $29,000, respectively.
J. Contractual Obligations. The Fund enters into contracts that contain a variety of indemnifications. The Fund’s maximum exposure under these arrangements is unknown. However, the Fund has not had prior claims or losses pursuant to these contracts and expects the risk of loss to be remote.
K. Other. At March 31, 2007, the Advisory Portfolio, Advisory Global Fixed Income Portfolio and Advisory Global Fixed Income Portfolio II each had otherwise unaffiliated record owners of 10% or greater. Investment activities of these shareholders could have a material impact on the Portfolios. The aggregate percentage of such owners was 13.4%, 29.6% and 88.8%, respectively.
L. Restatement Information. Subsequent to the issuance of its September 30, 2006 financial statements, the Advisory Portfolio restated its accretion income due to adjustments to Interest Only securities. The Portfolio determined that certain amounts which were treated as income should have been treated as unrealized gains. Accordingly, the Advisory Portfolio has restated the Portfolio of Investments and Statement of Assets and Liabilities as of September 30, 2006 and Statement of Operations and Statement of Cash Flows for the year ended September 30, 2006 and Statements of Changes in Net Assets for the two years ended September 30, 2006 and 2005 and the Financial Highlights for the four years ended September 30, 2006, 2005, 2004 and 2003. These adjustments had no impact on the Net Assets of the Portfolio. All amounts (except for per share amounts and ratios) are in thousands.
| | Advisory Portfolio | |
| | Previously | | | |
| | Reported | | Restated | |
Portfolio of Investments | | | | | |
Year Ended September 30, 2006 | | | | | |
Cost of Total Fixed Income Securities | | $ | 3,807,595 | | $ | 3,688,939 | |
Cost of Total Investments | | 4,039,427 | | 3,920,771 | |
| | | | | | | |
25
2007 Semi-Annual Report
March 31, 2007 (unaudited)
Notes to Financial Statements (cont’d)
| | Advisory Portfolio | |
| | Previously | | | |
| | Reported | | Restated | |
Statement of Assets and Liabilities | | | | | |
Year Ended September 30, 2006 | | | | | |
Assets: | | | | | |
Investments in Securities of Unaffiliated Issuers, at Cost | | $ | 4,039,427 | | $ | 3,920,771 | |
| | | | | |
Net Assets Consist Of: | | | | | |
Paid-in Capital | | 3,649,062 | | 3,592,438 | |
Undistributed (Distributions in Excess of) Net Investment Income | | 7,556 | | (24,521 | ) |
Accumulated Net Realized Gain (Loss) | | (339,316 | ) | (369,271 | ) |
Unrealized Appreciation (Depreciation) on Investments | | (146,655 | ) | (27,999 | ) |
| | | | | |
Statement of Operations | | | | | |
Year Ended September 30, 2006 | | | | | |
Investment Income: | | | | | |
Interest | | 166,991 | | 108,550 | |
Total Investment Income | | 169,678 | | 111,237 | |
Net Investment Income | | 167,125 | | 108,684 | |
Change in Unrealized Appreciation (Depreciation): | | | | | |
Investments | | (204,689 | ) | (146,248 | ) |
Net Change in Unrealized Appreciation (Depreciation) | | (111,297 | ) | (52,856 | ) |
Total Net Realized Gain (Loss) and Change in Unrealized Appreciation (Depreciation) | | (20,538 | ) | 37,903 | |
| | | | | |
Statement of Changes in Net Assets | | | | | |
Year Ended September 30, 2006 | | | | | |
Net Investment Income (Loss) | | 167,125 | | 108,684 | |
Net Change in Unrealized Appreciation (Depreciation) | | (111,297 | ) | (52,856 | ) |
Distributions from and/or in Excess of: | | | | | |
Net Investment Income | | (260,266 | ) | (205,755 | ) |
Return of Capital | | — | | (54,511 | ) |
Undistributed (Distributions in Excess of) Net Investment Income Included in End of Period Net Assets | | 7,556 | | (24,521 | ) |
| | | | | |
Statement of Changes in Net Assets | | | | | |
Year Ended September 30, 2005 | | | | | |
Net Investment Income (Loss) | | $ | 155,296 | | $ | 127,129 | |
Net Change in Unrealized Appreciation (Depreciation) | | (48,191 | ) | (20,024 | ) |
Undistributed (Distributions in Excess of) Net Investment Income Included in End of Period Net Assets | | 6,789 | | (53,426 | ) |
| | | | | |
Statement of Cash Flows | | | | | |
Year Ended September 30, 2006 | | | | | |
Net Investment Income | | 167,125 | | 108,684 | |
Accretion/Amortization of Discounts and Premiums | | 3,107 | | 61,548 | |
| | | | | |
Financial Highlights | | | | | |
Year Ended September 30, 2006 | | | | | |
Income from Investment Operations (Per Share): | | | | | |
Net Investment Income | | 0.50 | | 0.33 | |
Net Realized and Unrealized Gain (Loss) on Investments | | (0.06 | ) | 0.11 | |
Distributions from and/or in Excess of: | | | | | |
Net Investment Income | | (0.79 | ) | (0.63 | ) |
Return of Capital | | — | | (0.16 | ) |
Ratio of Net Investment Income to Average Net Assets | | 5.24 | % | 3.41 | % |
Ratio of Net Investment Income to Average Net Assets Before Expenses Waived/Reimbursed by Adviser | | 4.84 | % | 3.01 | % |
| | | | | |
Financial Highlights | | | | | |
Year Ended September 30, 2005 | | | | | |
Income from Investment Operations (Per Share): | | | | | |
Net Investment Income | | $ | 0.44 | | $ | 0.36 | |
Net Realized and Unrealized Gain (Loss) on Investments | | (0.01 | ) | 0.07 | |
Ratio of Net Investment Income to Average Net Assets | | 4.48 | % | 3.66 | % |
Ratio of Net Investment Income to Average Net Assets Before Expenses Waived/Reimbursed by Adviser | | 4.09 | % | 3.27 | % |
26
2007 Semi-Annual Report |
| |
March 31, 2007 (unaudited) |
Notes to Financial Statements (cont’d)
| | Advisory Portfolio | |
| | Previously | | | |
| | Reported | | Restated | |
Financial Highlights | | | | | | | |
Year Ended September 30, 2004 | | | | | | | |
Income from Investment Operations (Per Share): | | | | | | | |
Net Investment Income | | $ | 0.25 | | | $ | 0.21 | | |
Net Realized and Unrealized Gain (Loss) on Investments | | 0.17 | | | 0.21 | | |
Ratio of Net Investment Income to Average Net Assets | | 2.51 | % | | 2.09 | % | |
Ratio of Net Investment Income to Average Net Assets Before Expenses Waived/Reimbursed by Adviser | | 2.10 | % | | 1.68 | % | |
| | | | | | | |
Financial Highlights | | | | | | | |
Year Ended September 30, 2003 | | | | | | | |
Income from Investment Operations (Per Share): | | | | | | | |
Net Investment Income | | $ | 0.25 | | | $ | 0.23 | | |
Net Realized and Unrealized Gain (Loss) on Investments | | 0.20 | | | 0.22 | | |
Ratio of Net Investment Income to Average Net Assets | | 2.43 | % | | 2.24 | % | |
Ratio of Net Investment Income to Average Net Assets Before Expenses Waived/Reimbursed by Adviser | | 2.02 | % | | 1.83 | % | |
| | | | | | | |
Notes to Financial Statements | | | | | | | |
Federal Income Taxes | | | | | | | |
Tax Character of Distributions Paid: | | | | | | | |
2006 Distributions Paid From : | | | | | | | |
Ordinary Income | | $ | 260,266 | | | $ | 205,755 | | |
Return of Capital | | — | | | 54,511 | | |
| | | | | | | |
Tax Basis Components of Net | | | | | | | |
Assets: | | | | | | | |
Accumulated Undistributed (Distributions in Excess of) Net Investment Income (Loss) | | 93,908 | | | 125,975 | | |
Accumulated Net Realized Gain (Loss) | | (87,216 | ) | | (117,171 | ) | |
Paid-in Capital | | (6,692 | ) | | (8,804 | ) | |
| | | | | | | |
Distributable Earnings on a Tax | | | | | | | |
Basis: | | | | | | | |
Undistributed Ordinary Income | | 32,077 | | | — | | |
| | | | | | | |
Federal Income Tax Basis: | | | | | | | |
Cost | | $ | 4,094,576 | | | $ | 3,975,920 | | |
Appreciation | | 25,898 | | | 144,554 | | |
Net Appreciation (Depreciation) | | (201,804) | | | (83,148 | | |
| | | | | | | |
Unused Capital Losses: | | | | | | | |
Expiration Date September 30, 2011 | | 18,149 | | | — | | |
Expiration Date September 30, 2012 | | 104,611 | | | 152,715 | | |
Expiration Date Total | | 205,353 | | | 235,308 | | |
27
2007 Semi-Annual Report
March 31, 2007 (unaudited)
Trustee and Officer Information
Trustees
Frank L. Bowman
Michael Bozic
Kathleen A. Dennis
James F. Higgins
Dr. Manuel H. Johnson
Joseph J. Kearns
Michael F. Klein
W. Allen Reed
Fergus Reid
Investment Adviser and Administrator
Morgan Stanley Investment Management Inc.
1221 Avenue of the Americas
New York, NY 10020
Distributor
Morgan Stanley Distribution, Inc.
One Tower Bridge
100 Front Street, Suite 1100
West Conshohocken, PA 19428-2899
Custodian
JPMorgan Chase Bank, N.A.
270 Park Avenue
New York, NY 10017
Legal Counsel
Clifford Chance US LLP
31 West 52nd Street
New York, NY 10019-6131
Independent Registered Public Accounting Firm
Ernst & Young LLP
200 Clarendon Street
Boston, MA 02116-5072
Officers
Michael E. Nugent
Chairman of the Board and Trustee
Ronald E. Robison
President and Principal Executive Officer
J. David Germany
Vice President
Dennis F. Shea
Vice President
Amy R. Doberman
Vice President
Carsten Otto
Chief Compliance Officer
Stefanie V. Chang Yu
Vice President
Mary E. Mullin
Secretary
James W. Garrett
Treasurer and Chief Financial Officer
Michael J. Leary
Assistant Treasurer
Reporting to Shareholders
Each Morgan Stanley fund provides a complete schedule of portfolio holdings in its semi-annual and annual reports within 60 days of the end of the Fund’s second and fourth fiscal quarters. The semi-annual reports and the annual reports are filed electronically with the Securities and Exchange Commission (SEC) on Form N-CSRS and Form N-CSR, respectively. Morgan Stanley also delivers the semi-annual and annual reports to Fund shareholders and makes these reports available on its public website, www.morganstanley.com. Each Morgan Stanley fund also files a complete schedule of portfolio holdings with the SEC for the Fund’s first and third fiscal quarters on Form N-Q. Morgan Stanley does not deliver the reports for the first and third fiscal quarters to shareholders, nor are the reports posted to the Morgan Stanley public website. You may, however, obtain the Form N-Q filings (as well as the Form N-CSR and N-CSRS filings) by accessing the SEC’s website, http:/www.sec.gov. You may also review and copy them at the SEC’s public reference room in Washington, DC. Information on the operation of the SEC’s Public Reference Room may be obtained by calling the SEC at 1(800) SEC-0330. You can also request copies of these materials, upon payment of a duplicating fee, by electronic request at the SEC’s email address (publicinfo@sec.gov) or by writing the Public Reference section of the SEC, Washington, DC 20549-0102.
Proxy Voting Policies and Procedures and Proxy Voting Record
You may obtain a copy of the Fund’s Proxy Voting Policy and Procedures and information regarding how the Fund voted proxies relating to portfolio securities during the most recent twelve-month period ended June 30, without charge, upon request, by calling toll-free 1(800) 354-8185 or by visiting our website at www.morganstanley.com/im. This information is also available on the SEC’s website at http://www.sec.gov.
This report is authorized for distribution only when preceded or accompanied by the prospectus of the Morgan Stanley Institutional Fund Trust which describes in detail each Investment Portfolio’s investment policies, risks, fees and expenses. Please read the prospectus carefully before you invest or send money. For additional information, including information regarding the investments comprising the Portfolio, please visit our website at www.morganstanley.com/im or call 1(800) 354-8185.
28
Printed in U.S.A.
This Report has been prepared for shareholders and may be distributed to others only if preceded or accompanied by a current prospectus.
Morgan Stanley Investment Management Inc.
1221 Avenue of the Americas
New York, NY 10020
Investment Adviser: (610) 940-5000 • MSIF Trust (800) 354-8185
© 2007 Morgan Stanley

| | IFTAPSAN 3/07 IU07-01038P-T03/07 |
Item 2. Code of Ethics.
Not applicable for semi-annual reports.
Item 3. Audit Committee Financial Expert.
Not applicable for semi-annual reports.
Item 4. Principal Accountant Fees and Services
Not applicable for semi-annual reports.
Item 5. Audit Committee of Listed Registrants.
Not applicable for semi-annual reports.
Item 6. Schedule of Investments
Please refer to Item 1.
Item 7. Disclosure of Proxy Voting Policies and Procedures for Closed-End Management Investment Companies.
Not applicable for semi-annual reports.
Item 8. Portfolio Managers of Closed-End Management Investment Companies
Not Applicable.
Item 9. Closed-End Fund Repurchases
Not Applicable.
Item 10. Submission of Matters to a Vote of Security Holders
Not applicable.
Item 11. Controls and Procedures
(a) The Fund’s principal executive officer and principal financial officer have concluded that the Fund’s disclosure controls and procedures are sufficient to ensure that information required to be disclosed by the Fund in this Form N-CSR was recorded, processed, summarized and reported within the time periods specified in the Securities and Exchange Commission’s rules and forms, based upon such officers’ evaluation of these controls and procedures as of a date within 90 days of the filing date of the report.
(b) There were no changes in the registrant’s internal control over financial reporting that occurred during the registrant’s most recent fiscal half-year (the registrant’s second fiscal half-year in the case of an annual report) that has materially affected, or is reasonably likely to materially affect, the registrant’s internal control over financial reporting.
Item 12. Exhibits
(a) Code of Ethics - Not applicable for semi-annual reports.
(b) A separate certification for each principal executive officer and principal financial officer of the registrant are attached hereto as part of EX-99.CERT.
SIGNATURES
Pursuant to the requirements of the Securities Exchange Act of 1934 and the Investment company Act of 1940, the registrants has duly caused this report to be signed on its behalf by the undersigned, thereunto duly authorized.
(Registrant) Morgan Stanley Institutional Fund Trust
By: | /s/ Ronald E. Robison | | |
Name: | Ronald E. Robison | |
Title: | Principal Executive Officer | |
Date: | May 22, 2007 | |
Pursuant to the requirements of the Securities Exchange Act of 1934 and the Investment Company Act of 1940, this report has been signed by the following persons on behalf of the registrant and in the capacities and on the dates indicated.
By: | /s/ Ronald E. Robison | | |
Name: | Ronald E. Robison | |
Title: | Principal Executive Officer | |
Date: | May 22, 2007 | |
By: | /s/ James Garrett | | |
Name: | James Garrett | |
Title: | Principal Financial Officer | |
Date: | May 22, 2007 | |