As filed with the U.S. Securities and Exchange Commission on July 23, 2012
Securities Act File No. 333-181676
UNITED STATES
SECURITIES AND EXCHANGE COMMISSION
Washington, D.C. 20549
FORM N-14
REGISTRATION STATEMENT
UNDER THE SECURITIES ACT OF 1933 x
Pre-Effective Amendment No. 1 x
Post-Effective Amendment No. o
(Check appropriate box or boxes)
Morgan Stanley Institutional Fund Trust
(Exact Name of Registrant as Specified in Charter)
522 Fifth Avenue
New York, New York 10036
(Address of Principal Executive Offices: (Number, Street, City, State, Zip Code))
(212) 296-6970
(Area Code and Telephone Number)
Stefanie V. Chang Yu, Esq.
Morgan Stanley Investment Management Inc.
522 Fifth Avenue
New York, New York 10036
(Name and Address of Agent for Service)
Copy to:
| Carl Frischling, Esq. Kramer Levin Naftalis & Frankel LLP 1177 Avenue of the Americas New York, New York 10036 | Stuart M. Strauss, Esq. Dechert LLP 1095 Avenue of the Americas New York, New York 10036 | ||||||
Approximate Date of Proposed Public Offering: As soon as practicable after the effective date of this Registration Statement.
No filing fee is required because an indefinite number of common shares of beneficial interest of Morgan Stanley Institutional Fund, Inc. have previously been registered pursuant to Rule 24f-2 under the Investment Company Act of 1940.
The Registrant hereby amends this Registration Statement on such date or dates as may be necessary to delay its effective date until the Registrant shall file a further amendment which specifically states that this Registration Statement shall thereafter become effective in accordance with Section 8(a) of the Securities Act of 1933 or until this Registration Statement shall become effective on such date as the Commission, acting pursuant to said Section 8(a), may determine.
MORGAN STANLEY MID CAP GROWTH FUND
MORGAN STANLEY GLOBAL STRATEGIST FUND
522 Fifth Avenue
New York, NY 10036
(800) 869-6397
NOTICE OF JOINT SPECIAL MEETING OF SHAREHOLDERS
TO BE HELD SEPTEMBER 27, 2012
To the Shareholders of Morgan Stanley Mid Cap Growth Fund and Morgan Stanley Global Strategist Fund:
Notice is hereby given of a Joint Special Meeting of Shareholders (the "Meeting") of each of Morgan Stanley Mid Cap Growth Fund ("Mid Cap Growth") and Morgan Stanley Global Strategist Fund ("Global Strategist"), to be held in Conference Room 3N, 3rd Floor, 522 Fifth Avenue, New York, NY 10036, at 9:00 a.m., New York time, on September 27, 2012, and any adjournments or postponements thereof, for the following purposes:
1. With respect to shareholders of Mid Cap Growth, to consider and vote upon a proposal to approve the actions and transactions described in that certain Agreement and Plan of Reorganization, dated June 28, 2012 (the "Mid Cap Growth Reorganization Agreement"), between Mid Cap Growth and Morgan Stanley Institutional Fund Trust (the "Company"), on behalf of the Mid Cap Growth Portfolio ("MSIFT Mid Cap Growth"), pursuant to which substantially all of the assets and liabilities of Mid Cap Growth will be transferred to MSIFT Mid Cap Growth in exchange for shares of MSIFT Mid Cap Growth of the Class described in the accompanying Joint Proxy Statement and Prospectus and pursuant to which Mid Cap Growth will be liquidated and terminated (the "Mid Cap Growth Reorganization"). As a result of this transaction, shareholders of Mid Cap Growth will become shareholders of MSIFT Mid Cap Growth receiving shares of MSIFT Mid Cap Growth with a value equal to the aggregate net asset value of their shares of Mid Cap Growth held immediately prior to the Mid Cap Growth Reorganization;
2. With respect to shareholders of Global Strategist, to consider and vote upon a proposal to approve the actions and transactions described in that certain Agreement and Plan of Reorganization, dated June 28, 2012 (the "Global Strategist Reorganization Agreement"), between Global Strategist and the Company, on behalf of the Global Strategist Portfolio (formerly, the Balanced Portfolio) ("MSIFT Global Strategist"), pursuant to which substantially all of the assets and liabilities of Global Strategist will be transferred to MSIFT Global Strategist in exchange for shares of MSIFT Global Strategist of the Class described in the accompanying Joint Proxy Statement and Prospectus and pursuant to which Global Strategist will be liquidated and terminated (the "Global Strategist Reorganization"). As a result of this transaction, shareholders of Global Strategist will become shareholders of MSIFT Global Strategist receiving shares of MSIFT Global Strategist with a value equal to the aggregate net asset value of their shares of Global Strategist held immediately prior to the Global Strategist Reorganization; and
3. To act upon such other matters as may properly come before the Meeting.
MSIFT Mid Cap Growth and MSIFT Global Strategist are each referred to herein as an "Acquiring Fund," and together as the "Acquiring Funds." Mid Cap Growth and Global Strategist are each referred to herein as an "Acquired Fund," and together as the "Acquired Funds." The Mid Cap Growth Reorganization Agreement and Global Strategist Reorganization Agreement are each referred to herein as a "Reorganization Agreement," and together as the "Reorganization Agreements." The Mid Cap Growth Reorganization and Global Strategist Reorganization are each referred to herein as a "Reorganization," and together as the "Reorganizations."
Each Reorganization is more fully described in the accompanying Joint Proxy Statement and Prospectus and a form of each Reorganization Agreement is attached as Exhibit A thereto. Shareholders of record of each of the Acquired Funds at the close of business on July 2, 2012 are entitled to notice of, and to vote at, the Meeting. Please read the Joint Proxy Statement and Prospectus carefully before telling us, through your Proxy or in person, how you wish your shares to be voted. Alternatively, if you are eligible to vote telephonically by touchtone telephone or electronically on the Internet (as discussed in the enclosed Joint Proxy Statement and Prospectus), you may do so
in lieu of attending the Meeting in person. The Board of Trustees of each of Mid Cap Growth and Global Strategist recommends that you vote in favor of the applicable Reorganization. WE URGE YOU TO PROMPTLY SIGN, DATE AND MAIL THE ENCLOSED PROXY OR RECORD YOUR VOTE ELECTRONICALLY VIA TELEPHONE OR THE INTERNET.
By Order of the Boards of Trustees,
Mary E. Mullin
Secretary
July 24, 2012
You can help avoid the necessity and expense of sending follow-up letters to ensure a quorum by promptly returning the enclosed Proxy. If you are unable to be present in person, please fill in, sign and return the enclosed Proxy in order that the necessary quorum be represented at the Meeting. The enclosed envelope requires no postage if mailed in the United States. Shareholders will be able to vote telephonically by touchtone telephone or electronically on the Internet by following instructions on their proxy cards or on the enclosed Voting Information Card.
MORGAN STANLEY INSTITUTIONAL FUND TRUST
MID CAP GROWTH PORTFOLIO
GLOBAL STRATEGIST PORTFOLIO
522 Fifth Avenue
New York, NY 10036
(800) 548-7786
This Joint Proxy Statement and Prospectus is being furnished to shareholders ("Shareholders") of each of Morgan Stanley Mid Cap Growth Fund ("Mid Cap Growth") and Morgan Stanley Global Strategist Fund ("Global Strategist") in connection with a Joint Special Meeting of Shareholders (the "Meeting") to be held in Conference Room 3N, 3rd Floor, 522 Fifth Avenue, New York, NY 10036, at 9:00 a.m., New York time, on September 27, 2012, and any adjournments or postponements thereof, for the following purposes:
1. With respect to shareholders of Mid Cap Growth, to consider and vote upon a proposal to approve the actions and transactions described in that certain Agreement and Plan of Reorganization, dated June 28, 2012 (the "Mid Cap Growth Reorganization Agreement"), between Mid Cap Growth and Morgan Stanley Institutional Fund Trust (the "Company"), on behalf of the Mid Cap Growth Portfolio ("MSIFT Mid Cap Growth"), pursuant to which substantially all of the assets and liabilities of Mid Cap Growth will be transferred to MSIFT Mid Cap Growth, in exchange for shares of MSIFT Mid Cap Growth of the Class described in this Joint Proxy Statement and Prospectus and pursuant to which Mid Cap Growth will be liquidated and terminated (the "Mid Cap Growth Reorganization"). As a result of this transaction, shareholders of Mid Cap Growth will become shareholders of MSIFT Mid Cap Growth receiving shares of MSIFT Mid Cap Growth with a value equal to the aggregate net asset value of their shares of Mid Cap Growth held immediately prior to the Mid Cap Growth Reorganization;
2. With respect to shareholders of Global Strategist, to consider and vote upon a proposal to approve the actions and transactions described in that certain Agreement and Plan of Reorganization, dated June 28, 2012 (the "Global Strategist Reorganization Agreement"), between Global Strategist and the Company, on behalf of the Global Strategist Portfolio ("MSIFT Global Strategist"), pursuant to which substantially all of the assets and liabilities of Global Strategist will be transferred to MSIFT Global Strategist, in exchange for shares of MSIFT Global Strategist of the Class described in this Joint Proxy Statement and Prospectus and pursuant to which Global Strategist will be liquidated and terminated (the "Global Strategist Reorganization"). As a result of this transaction, shareholders of Global Strategist will become shareholders of MSIFT Global Strategist receiving shares of MSIFT Global Strategist with a value equal to the aggregate net asset value of their shares of Global Strategist held immediately prior to the Global Strategist Reorganization; and
3. To act upon such other matters as may properly come before the Meeting.
MSIFT Mid Cap Growth and MSIFT Global Strategist are each referred to herein as an "Acquiring Fund," and together as the "Acquiring Funds." Mid Cap Growth and Global Strategist are each referred to herein as an "Acquired Fund," and together as the "Acquired Funds" and, along with the Acquiring Funds, the "Funds." The Mid Cap Growth Reorganization Agreement and Global Strategist Reorganization Agreement are each referred to herein as a "Reorganization Agreement," and together as the "Reorganization Agreements." The Mid Cap Growth Reorganization and Global Strategist Reorganization are each referred to herein as a "Reorganization," and together as the "Reorganizations."
The terms and conditions of each transaction are more fully described in this Joint Proxy Statement and Prospectus and in the form of each Reorganization Agreement attached hereto as Exhibit A. The address and telephone number of the Acquired Funds is the same as that of the Acquiring Funds set forth above. This Joint Proxy Statement also constitutes a Prospectus of each Acquiring Fund, filed by the Company with the Securities and Exchange Commission (the "Commission") as part of the Company's Registration Statement on Form N-14 (the "Registration Statement").
The Company is an open-end management investment company. The investment objective of MSIFT Mid Cap Growth is to seek long-term capital growth. The investment objective of MSIFT Global Strategist is to seek above-average total return over a market cycle of three to five years.
This Joint Proxy Statement and Prospectus sets forth concisely information about the Acquiring Funds that Shareholders of the Acquired Funds should know before voting on the applicable Reorganization Agreement. A copy of the Prospectuses for the Acquiring Funds, dated January 31, 2012, with respect to MSIFT Mid Cap Growth Class I shares, April 30, 2012 with respect to MSIFT Mid Cap Growth Class H and L shares and July 16, 2012, with respect to MSIFT Global Strategist, each as it may be amended and supplemented from time to time, are attached as Exhibit B and incorporated herein by reference. Also incorporated herein by reference are the Prospectuses of Mid Cap Growth, dated January 31, 2012, and Global Strategist, dated November 30, 2011, each as it may be amended and supplemented from time to time.
In addition, also enclosed and incorporated herein by reference is the Annual Report of the Company relating to the Acquiring Funds for the fiscal year ended September 30, 2011 and the Semi-Annual Report of the Company relating to the Acquiring Funds for the six-month period ended March 31, 2012. Also incorporated herein by reference are the Annual Reports of Mid Cap Growth for the fiscal year ended September 30, 2011 and Global Strategist for the fiscal year ended July 31, 2011 and the Semi-Annual Report of Mid Cap Growth for the six-month period ended March 31, 2012 and the Semi-Annual Report of Global Strategist for the six-month period ended January 31, 2012. A Joint Statement of Additional Information relating to the Reorganizations, described in this Joint Proxy Statement and Prospectus, dated July 24, 2012, has been filed with the Commission and is also incorporated herein by reference. Such documents are available upon request and without charge by calling (800) 869-6397 with respect to the Acquired Fund and (800) 548-7786 with respect to the Acquiring Fund or by visiting the Commission's website at www.sec.gov.
Shareholders are advised to read and retain this Joint Proxy Statement and Prospectus for future reference.
The Securities and Exchange Commission has not approved or disapproved these securities or passed upon the adequacy of this Prospectus. Any representation to the contrary is a criminal offense.
This Joint Proxy Statement and Prospectus is dated July 24, 2012.
TABLE OF CONTENTS
JOINT PROXY STATEMENT AND PROSPECTUS
| Page | |||||||
| Synopsis | 1 | ||||||
| General | 1 | ||||||
| The Reorganizations | 1 | ||||||
| Fee Tables | 2 | ||||||
| Mid Cap Growth Reorganization | 2 | ||||||
| Global Strategist Reorganization | 4 | ||||||
| Annual Fund Operating Expenses | 6 | ||||||
| Portfolio Turnover | 6 | ||||||
| Tax Consequences of the Reorganizations | 6 | ||||||
| Comparison of each Acquired Fund and Acquiring Fund | 7 | ||||||
| Record Date; Quorum | 15 | ||||||
| Proxies | 15 | ||||||
| Expenses of Solicitation | 16 | ||||||
| Vote Required | 16 | ||||||
| Principal Risk Factors | 17 | ||||||
| Performance Information | 20 | ||||||
| The Reorganizations | 21 | ||||||
| The Boards' Considerations | 21 | ||||||
| The Reorganization Agreements | 22 | ||||||
| Tax Aspects of the Reorganizations | 23 | ||||||
| Description of Shares | 24 | ||||||
| Capitalization Tables (unaudited) | 25 | ||||||
| Appraisal Rights | 25 | ||||||
| Comparison of Investment Objectives, Principal Policies and Restrictions | 26 | ||||||
| Investment Objectives and Policies | 26 | ||||||
| Mid Cap Growth | 26 | ||||||
| MSIFT Mid Cap Growth | 27 | ||||||
| Global Strategist | 27 | ||||||
| MSIFT Global Strategist | 28 | ||||||
| Investment Restrictions | 28 | ||||||
| Additional Information About the Acquiring Funds and the Acquired Funds | 30 | ||||||
| General | 30 | ||||||
| Rights of Acquired Fund Shareholders and Acquiring Fund Shareholders | 30 | ||||||
| Financial Information | 31 | ||||||
| Shareholder Proposals | 32 | ||||||
| Management | 32 | ||||||
| Description of Shares and Shareholder Inquiries | 32 | ||||||
| Dividends, Distributions and Taxes | 32 | ||||||
| Purchases, Exchanges and Redemptions | 32 | ||||||
| Share Information | 33 | ||||||
| Financial Statements and Experts | 36 | ||||||
| Legal Matters | 37 | ||||||
| Available Information | 37 | ||||||
| Other Business | 37 | ||||||
| Exhibit A – Form of Agreement and Plan of Reorganization | |||||||
| Exhibit B – Prospectuses of MSIFT Mid Cap Growth dated January 31, 2012 with respect to Class I shares and April, 30 2012 with respect to Class H and L shares and of MSIFT Global Strategist dated July 16, 2012, each as it may be amended and supplemented from time to time | |||||||
| Exhibit C – Annual Report for the Company relating to the Acquiring Funds for the fiscal year ended September 30, 2011 | |||||||
| Exhibit D – Semi-Annual Report for the Company relating to the Acquiring Funds for the six-month period ended March 31, 2012 | |||||||
SYNOPSIS
The following is a synopsis of certain information contained in or incorporated by reference in this Joint Proxy Statement and Prospectus. This synopsis is only a summary and is qualified in its entirety by the more detailed information contained or incorporated by reference in this Joint Proxy Statement and Prospectus and the Reorganization Agreements. Shareholders should carefully review this Joint Proxy Statement and Prospectus and the Reorganization Agreements in their entirety and, in particular, the Acquiring Funds' Prospectuses, which are attached to this Joint Proxy Statement and Prospectus as Exhibit B and incorporated herein by reference.
General
This Joint Proxy Statement and Prospectus is being furnished to Shareholders of each of Mid Cap Growth and Global Strategist, each an open-end management investment company, in connection with the solicitation by the Board of Trustees of each of Mid Cap Growth and Global Strategist (each a "Board," and together, the "Boards") of proxies ("Proxies") to be used at the Meeting to consider the Reorganizations. It is expected that the first mailing of this Joint Proxy Statement and Prospectus will be made on or about July 27, 2012.
Shareholders of each Acquired Fund will vote separately on the Reorganization for that Acquired Fund. Each Reorganization is not dependent on the approval of the other. Pursuant to each Reorganization, Class A and Class B Shareholders of each Acquired Fund will receive Class H shares of each respective Acquiring Fund, while Class I Shareholders of each Acquired Fund will receive Class I shares of each respective Acquiring Fund and Class C Shareholders of each Acquired Fund will receive Class L shares of each respective Acquiring Fund. The shares to be issued by each Acquiring Fund pursuant to each Reorganization (the "Acquiring Fund Shares") will be issued at net asset value without any sales charges. Any subsequent purchases of Class H shares, including through the dividend reinvestment plan, of the applicable Acquiring Fund after the applicable Reorganization by the former Class A and Class B Shareholders of an Acquired Fund will be subject to the initial sales charge schedule. See "Comparison of each Acquired Fund and Acquiring Fund—Purchases, Exchanges and Redemptions" below. Further information relating to the Acquiring Funds is set forth herein and in the Acquiring Funds' current Prospectuses, dated January 31, 2012 with respect to MSIFT Mid Cap Growth Class I shares, April 30, 2012 with respect to MSIFT Mid Cap Growth Class H and L shares and July 16, 2012 with respect to MSIFT Global Strategist (together, the "Acquiring Funds' Prospectuses"), attached to this Joint Proxy Statement and Prospectus as Exhibit B and incorporated herein by reference.
As of May 16, 2012, each Acquired Fund suspended the offering of Class B shares to new investors in anticipation of the applicable Reorganization. The Company's Board of Trustees has authorized the issuance of the Acquiring Fund Shares to Shareholders of the Acquired Funds, as applicable, in connection with each Reorganization.
The information concerning the Acquired Funds contained herein has been supplied by each respective Acquired Fund. The information concerning the Acquiring Funds contained herein has been supplied by the Company.
The Reorganizations
Each Reorganization is being proposed because the Board of Trustees of each Acquired Fund has determined that such Reorganization is in the best interests of the applicable Acquired Fund and its Shareholders. Each Reorganization will allow Shareholders of the applicable Acquired Fund to be invested in a fund that is managed according to similar investment objectives, strategies and restrictions and, although stated management fees are higher for the Acquiring Funds, the Acquiring Funds will have lower total operating expenses due to proposed advisory fee waivers and/or expense reimbursements. See "The Reorganizations—The Boards' Considerations."
Each Reorganization Agreement provides for the transfer of substantially all the assets of the applicable Acquired Fund, and the assumption of liabilities, to the applicable Acquiring Fund in exchange for the applicable Acquiring Fund Shares. The aggregate net asset value of the applicable Acquiring Fund Shares issued in the exchange will equal the aggregate value of the net assets of the applicable Acquired Fund received by the applicable Acquiring Fund. On or after the closing date scheduled for each Reorganization (the "Closing Date"), the applicable Acquired
1
Fund will distribute the applicable Acquiring Fund Shares received by such Acquired Fund to its Shareholders as of the Valuation Date (as defined below) in complete liquidation of such Acquired Fund and, without further notice, the outstanding shares of such Acquired Fund held by such Shareholders will then be redeemed and canceled as permitted by the organizational documents of the Acquired Fund and applicable law. Each Acquired Fund thereafter will be deregistered as an investment company under the Investment Company Act of 1940, as amended (the "1940 Act"). As a result of each Reorganization, each Shareholder will receive that number of full and fractional Acquiring Fund Shares, as applicable, equal in value to such Shareholder's pro rata interest in the net assets of the applicable Acquired Fund transferred to the applicable Acquiring Fund. Pursuant to each Reorganization, Class A and Class B Shareholders of each Acquired Fund will receive Class H shares of each Acquiring Fund, while Class C Shareholders of each Acquired Fund will receive Class L of each Acquiring Fund and Class I Shareholders of each Acquired Fund will receive Class I shares of each Acquiring Fund. The Boards have determined that the interests of the Shareholders will not be diluted as a result of the applicable Reorganization. The "Valuation Date" is the date following the receipt of the requisite approval of the applicable Reorganization Agreement by Shareholders on which the number of applicable Acquiring Fund Shares to be delivered to each Acquired Fund will be determined.
For the reasons set forth below under "The Reorganization—The Board's Considerations," each Board, including the Trustees who are not "interested persons" of an Acquired Fund ("Independent Board Members"), as that term is defined in the 1940 Act, has concluded that each respective Reorganization is advisable and in the best interests of the applicable Acquired Fund and its Shareholders and recommends approval of each respective Reorganization.
Fee Tables
The following tables briefly describe the shareholder fees and annual Fund operating expenses that Shareholders of the Funds bear directly and indirectly from an investment in the Funds. Shareholder fees will not be charged on those Acquiring Fund Shares received in connection with the Reorganizations. Each Fund pays expenses for management of its assets, distribution of its shares and other services, and those expenses are reflected in the net asset value per share of each Fund. These expenses are deducted from each respective Fund's assets and are based on actual expenses incurred by each of Mid Cap Growth and Global Strategist for its fiscal year ended September 30, 2011 and semi-annual period ended January 31, 2012, respectively (except that for each Acquired Fund, the actual 12b-1 fees incurred by Class B Shares and Class C Shares of such Acquired Fund for such period may have been less than the maximum 1.00% permitted under the plans). The tables also set forth pro forma fees for the applicable surviving combined fund (MSIFT Mid Cap Growth and MSIFT Global Strategist) (each a "Combined Fund") reflecting what the fee schedule would have been on September 30, 2011, if each Reorganization had been consummated twelve (12) months prior to that date.
Mid Cap Growth Reorganization
Shareholder Fees
(fees paid directly from your investment)
| Mid Cap Growth (Acquired Fund) | Class A | Class B | Class C | Class I | |||||||||||||||
| Maximum sales charge (load) imposed on purchases (as a percentage of offering price) | 5.25 | %(1) | None | None | None | ||||||||||||||
| Maximum deferred sales charge (load) (as a percentage based on the lesser of the offering price or net asset value at redemption) | None(2) | 5.00 | %(3) | 1.00 | %(3) | None | |||||||||||||
2
| MSIFT Mid Cap Growth (Acquiring Fund) | Class H | Class L | Class I | ||||||||||||
| Maximum sales charge (load) imposed on purchases (as a percentage of offering price) | 4.75 | %(4) | None | None | |||||||||||
| Maximum deferred sales charge (load) (as a percentage based on the lesser of the offering price or net asset value at redemption) | None | None | None | ||||||||||||
| Pro Forma Combined Fund (MSIFT Mid Cap Growth) | Class H | Class L | Class I | ||||||||||||
| Maximum sales charge (load) imposed on purchases (as a percentage of offering price) | 4.75 | %(4) | None | None | |||||||||||
| Maximum deferred sales charge (load) (as a percentage based on the lesser of the offering price or net asset value at redemption) | None | None | None | ||||||||||||
(1) Reduced for purchases of $25,000 and over.
(2) Investments that are not subject to any sales charges at the time of purchase are subject to a contingent deferred sales charge ("CDSC") of 1.00% that will be imposed if you sell your shares within 18 months after purchase, except for certain specific circumstances.
(3) The Class B CDSC is scaled down to 1.00% during the sixth year, reaching zero thereafter and the Class C CDSC is only applicable if you sell your shares within one year after purchase.
(4) Reduced for purchases of $50,000 and over.
Annual Fund Operating Expenses
(expenses that are deducted from Fund assets)
| Mid Cap Growth (Acquired Fund) | Class A | Class B | Class C | Class I | |||||||||||||||
| Advisory Fees | 0.42 | % | 0.42 | % | 0.42 | % | 0.42 | % | |||||||||||
| Distribution and/or Service (12b-1) Fees | 0.25 | % | 1.00 | % | 1.00 | % | None | ||||||||||||
| Other Expenses | 0.30 | % | 0.30 | % | 0.30 | % | 0.30 | % | |||||||||||
| Total Annual Fund Operating Expenses | 0.97 | % | 1.72 | % | 1.72 | % | 0.72 | % | |||||||||||
| MSIFT Mid Cap Growth (Acquiring Fund) | Class H | Class L | Class I | ||||||||||||
| Advisory Fees | 0.50 | % | 0.50 | % | 0.50 | % | |||||||||
| Distribution and/or Service (12b-1) Fees | 0.25 | % | 0.75 | % | None | ||||||||||
| Other Expenses | 0.20 | %‡ | 0.20 | %‡ | 0.20 | % | |||||||||
| Total Annual Fund Operating Expenses | 0.95 | % | 1.45 | % | 0.70 | % | |||||||||
| Pro Forma Combined Fund (MSIFT Mid Cap Growth) | Class H | Class L | Class I | ||||||||||||
| Advisory Fees | 0.50 | % | 0.50 | % | 0.50 | % | |||||||||
| Distribution and/or Service (12b-1) Fees | 0.25 | % | 0.75 | % | None | ||||||||||
| Other Expenses | 0.19 | % | 0.19 | % | 0.19 | % | |||||||||
| Total Annual Fund Operating Expenses | 0.94 | % | 1.44 | % | 0.69 | % | |||||||||
‡ Other expenses have been estimated for the current fiscal year.
3
Example
To attempt to show the effect of these expenses on an investment over time, the hypothetical shown below has been created. The example assumes that an investor invests $10,000 in either Mid Cap Growth or MSIFT Mid Cap Growth for the time periods indicated and that an investor then redeems all of his or her shares at the end of those periods. The example also assumes that the investment has a 5% return each year and that the operating expenses for each Fund remains the same (as set forth in the chart above) (except for the ten-year amounts for Class B shares of Mid Cap Growth which reflect the conversion to Class A shares of Mid Cap Growth eight years after the end of the calendar month in which shares were purchased). Although a Shareholder's actual costs may be higher or lower, the table below shows a Shareholder's costs at the end of each period based on these assumptions.
| Mid Cap Growth (Acquired Fund) | 1 Year | 3 Years | 5 Years | 10 Years | |||||||||||||||
| Class A | $ | 619 | $ | 818 | $ | 1,033 | $ | 1,652 | |||||||||||
| Class B | $ | 675 | $ | 842 | $ | 1,133 | $ | 1,831 | |||||||||||
| Class C | $ | 275 | $ | 542 | $ | 933 | $ | 2,030 | |||||||||||
| Class I | $ | 74 | $ | 230 | $ | 401 | $ | 894 | |||||||||||
| MSIFT Mid Cap Growth (Acquiring Fund) | |||||||||||||||||||
| Class H* | $ | 567 | $ | 763 | $ | 976 | $ | 1,586 | |||||||||||
| Class L* | $ | 148 | $ | 459 | $ | 792 | $ | 1,735 | |||||||||||
| Class I | $ | 72 | $ | 224 | $ | 390 | $ | 871 | |||||||||||
| Pro Forma Combined Fund (MSIFT Mid Cap Growth) | |||||||||||||||||||
| Class H | $ | 566 | $ | 760 | $ | 970 | $ | 1,575 | |||||||||||
| Class L | $ | 147 | $ | 456 | $ | 787 | $ | 1,724 | |||||||||||
| Class I | $ | 70 | $ | 221 | $ | 384 | $ | 859 | |||||||||||
* The figures shown reflect the estimated expenses of Class H and Class L and the maximum sales charge of 4.75% applicable to purchases of Class H shares.
Global Strategist Reorganization
Shareholder Fees
(fees paid directly from your investment)
| Global Strategist (Acquired Fund) | Class A | Class B | Class C | Class I | |||||||||||||||
| Maximum sales charge (load) imposed on purchases (as a percentage of offering price) | 5.25 | %(1) | None | None | None | ||||||||||||||
| Maximum deferred sales charge (load) (as a percentage based on the lesser of the offering price or net asset value at redemption) | None(2) | 5.00 | %(3) | 1.00 | %(3) | None | |||||||||||||
| MSIFT Global Strategist (Acquiring Fund) | Class H | Class L | Class I | ||||||||||||
| Maximum sales charge (load) imposed on purchases (as a percentage of offering price) | 4.75 | %(4) | None | None | |||||||||||
| Maximum deferred sales charge (load) (as a percentage based on the lesser of the offering price or net asset value at redemption) | None | None | None | ||||||||||||
4
| Pro Forma Combined Fund (MSIFT Global Strategist) | Class H | Class L | Class I | ||||||||||||
| Maximum sales charge (load) imposed on purchases (as a percentage of offering price) | 4.75 | %(4) | None | None | |||||||||||
| Maximum deferred sales charge (load) (as a percentage based on the lesser of the offering price or net asset value at redemption) | None | None | None | ||||||||||||
(1) Reduced for purchases of $25,000 and over.
(2) Investments that are not subject to any sales charges at the time of purchase are subject to a CDSC of 1.00% that will be imposed if you sell your shares within 18 months after purchase, except for certain specific circumstances.
(3) The Class B CDSC is scaled down to 1.00% during the sixth year, reaching zero thereafter and the Class C CDSC is only applicable if you sell your shares within one year after purchase.
(4) Reduced for purchases of $50,000 and over.
Annual Fund Operating Expenses
(expenses that are deducted from Fund assets)
| Global Strategist (Acquired Fund) | Class A | Class B | Class C | Class I | |||||||||||||||
| Advisory Fees | 0.42 | % | 0.42 | % | 0.42 | % | 0.42 | % | |||||||||||
| Distribution and/or Service (12b-1) Fees | 0.25 | % | 1.00 | % | 1.00 | % | None | ||||||||||||
| Other Expenses | 0.33 | % | 0.33 | % | 0.33 | % | 0.33 | % | |||||||||||
| Total Annual Fund Operating Expenses | 1.00 | % | 1.75 | % | 1.75 | % | 0.75 | % | |||||||||||
| MSIFT Global Strategist (Acquiring Fund) | Class H | Class L | Class I | ||||||||||||
| Advisory Fees | 0.45 | % | 0.45 | % | 0.45 | % | |||||||||
| Distribution and/or Service (12b-1) Fees | 0.25 | % | 0.75 | % | None | ||||||||||
| Other Expenses | 0.86 | %‡ | 0.86 | %‡ | 0.86 | % | |||||||||
| Total Annual Fund Operating Expenses | 1.56 | % | 2.06 | % | 1.31 | % | |||||||||
| Pro Forma Combined Fund (MSIFT Global Strategist) | Class H | Class L | Class I | ||||||||||||
| Advisory Fees | 0.45 | % | 0.45 | % | 0.45 | % | |||||||||
| Distribution and/or Service (12b-1) Fees | 0.25 | % | 0.75 | % | None | ||||||||||
| Other Expenses | 0.33 | % | 0.33 | % | 0.33 | % | |||||||||
| Total Annual Fund Operating Expenses* | 1.03 | % | 1.53 | % | 0.78 | % | |||||||||
| Fee Waiver and/or Expense Reimbursement* | 0.04 | % | 0.04 | % | 0.04 | % | |||||||||
| Total Annual Fund Operating Expenses after Fee Waiver and/or Expense Reimbursement* | 0.99 | % | 1.49 | % | 0.74 | % | |||||||||
* Morgan Stanley Investment Management Inc. ("MSIM"), the Acquiring Fund's investment adviser, has agreed to reduce its advisory fee and/or reimburse the Acquiring Fund so that Total Annual Portfolio Operating Expenses, excluding certain investment related expenses, will not exceed 0.74% for Class I, 0.99% for Class H and 1.49% for Class L. The fee waivers and/or expense reimbursements will continue for at least two years from the date of the Reorganization or until such time as the Board acts to discontinue all or a portion of such waivers and/or reimbursements when it deems such action is appropriate.
‡ Other expenses have been estimated for the current fiscal year.
5
Example
To attempt to show the effect of these expenses on an investment over time, the hypothetical shown below has been created. The example assumes that an investor invests $10,000 in either Global Strategist or MSIFT Global Strategist for the time periods indicated and that an investor then redeems all of his or her shares at the end of those periods. The example also assumes that the investment has a 5% return each year and that the operating expenses for each Fund remain the same (as set forth in the chart above) (except for the ten-year amounts for Class B shares of Global Strategist which reflect the conversion to Class A shares of Global Strategist eight years after the end of the calendar month in which shares were purchased). Although a Shareholder's actual costs may be higher or lower, the table below shows a Shareholder's costs at the end of each period based on these assumptions.
| Global Strategist (Acquired Fund) | 1 Year | 3 Years | 5 Years | 10 Years | |||||||||||||||
| Class A | $ | 622 | $ | 827 | $ | 1,048 | $ | 1,685 | |||||||||||
| Class B | $ | 678 | $ | 851 | $ | 1,149 | $ | 1,864 | |||||||||||
| Class C | $ | 278 | $ | 551 | $ | 949 | $ | 2,062 | |||||||||||
| Class I | $ | 77 | $ | 240 | $ | 417 | $ | 930 | |||||||||||
| MSIFT Global Strategist (Acquiring Fund) | |||||||||||||||||||
| Class H** | $ | 626 | $ | 944 | $ | 1,285 | $ | 2,243 | |||||||||||
| Class L** | $ | 209 | $ | 646 | $ | 1,108 | $ | 2,390 | |||||||||||
| Class I | $ | 133 | $ | 415 | $ | 718 | $ | 1,579 | |||||||||||
| Pro Forma Combined Fund (MSIFT Global Strategist) | |||||||||||||||||||
| Class H | $ | 571 | $ | 775 | $ | 996 | $ | 1,630 | |||||||||||
| Class L | $ | 152 | $ | 471 | $ | 813 | $ | 1,779 | |||||||||||
| Class I | $ | 76 | $ | 237 | $ | 411 | $ | 918 | |||||||||||
** The figures shown reflect the estimated expenses of Class H and Class L and the maximum sales charge of 4.75% applicable to purchases of Class H shares.
Annual Fund Operating Expenses
The purpose of the foregoing fee tables is to assist Shareholders in understanding the various costs and expenses that a Shareholder in each Fund will bear directly or indirectly. For a more complete description of these costs and expenses, see "Comparison of each Acquired Fund and Acquiring Fund—Investment Advisory Fees," "—Distribution Plan and Shareholder Services Plan Fees," "—Other Significant Fees" and "—Purchases, Exchanges and Redemptions" below.
Portfolio Turnover
Each Fund pays transaction costs, such as commissions, when it buys and sells securities (or "turns over" its portfolio). A higher portfolio turnover rate may indicate higher transaction costs and may result in higher taxes when Fund shares are held in a taxable account. These costs, which are not reflected in Total Annual Fund Operating Expenses or in the Example, affect Fund performance. During the most recent fiscal year, MSIFT Mid Cap Growth's and MSIFT Global Strategist's portfolio turnover rates were 35% and 164%, respectively, of the average value of their portfolios.
Tax Consequences of the Reorganizations
As a condition to each Reorganization, each Acquired Fund has requested an opinion of Dechert LLP to the effect that, based upon certain facts, assumptions and representations, the applicable Reorganization will constitute a tax-free reorganization for federal income tax purposes, and no gain or loss will be recognized by the Acquired Fund, the corresponding Acquiring Fund or the Acquired Fund's Shareholders for federal income tax purposes as a
6
result of the transactions included in the applicable Reorganization. Receipt of such opinion is a condition to each Reorganization. For further information about the tax consequences of the Reorganizations, see "The Reorganizations—Tax Aspects of the Reorganizations" below.
Comparison of each Acquired Fund and Acquiring Fund
Investment Objectives and Principal Investment Policies. The investment objective and principal investment policies of the Acquired Funds are similar to those of the Acquiring Funds and are set forth below. Each Fund is a diversified fund. The principal differences between the principal investment policies of each Acquired Fund and its corresponding Acquiring Fund are more fully described under "Comparison of Investment Objectives, Principal Policies and Restrictions" below. Each Acquired Fund's investment objective is a fundamental policy and may not be changed without shareholder approval of a majority of the Acquired Fund's outstanding voting securities, as defined in the 1940 Act.
| Mid Cap Growth | MSIFT Mid Cap Growth | ||||||
| Investment Objective | Investment Objective | ||||||
| • seeks long-term capital growth | • seeks long-term capital growth | ||||||
| Investment Policies | Investment Policies | ||||||
| • will normally invest at least 80% of its assets in common stocks (including depositary receipts) and other equity securities of medium capitalization companies. Mid Cap Growth's other equity securities may include convertible securities and preferred stocks. MSIM seeks to invest primarily in established and emerging companies with capitalizations within the range of companies included in the Russell MidCap® Growth Index, which as of December 31, 2011 was between $117 million and $20.4 billion | • under normal circumstances, at least 80% of MSIFT Mid Cap Growth's assets will be invested in common stocks of mid cap companies. MSIM seeks long-term capital growth by investing primarily in established and emerging companies with capitalizations within the range of companies included in the Russell Midcap® Growth Index, which as of December 31, 2011 was between $117 million and $20.4 billion | ||||||
| • may invest up to 25% of its net assets in foreign securities, including emerging market securities, and securities classified as American Depositary Receipts, Global Depositary Receipts, American Depositary Shares, Global Depositary Shares or local shares of non-U.S. issuers. The Fund may also invest in U.S. dollar-denominated foreign securities that are traded on a U.S. national securities exchange | • may invest up to 25% of its net assets in securities of foreign issuers, including issuers located in emerging market or developing countries | ||||||
| • may invest in initial public offerings ("IPOs") and privately placed and restricted securities | • may invest in privately placed securities | ||||||
| • derivative instruments will be counted toward the 80% policy discussed above to the extent they have economic characteristics similar to the securities included within that policy | • derivative instruments will be counted toward the 80% policy discussed above to the extent they have economic characteristics similar to the securities included within that policy | ||||||
| • may utilize forward foreign currency exchange contracts, which are derivatives, in connection with its investments in foreign securities | • may utilize foreign currency forward exchange contracts, which are derivatives, in connection with its investments in foreign securities | ||||||
| • a diversified fund | • a diversified fund | ||||||
7
| Global Strategist | MSIFT Global Strategist | ||||||
| Investment Objective | Investment Objective | ||||||
| • seeks to maximize total return on its investments | • seeks above-average total return over a market cycle of three to five years | ||||||
| Global Strategist | MSIFT Global Strategist | ||||||
| Investment Policies | Investment Policies | ||||||
| • invests primarily in a blend of equity and fixed income securities of U.S. and non-U.S. issuers. Equity securities may include common and preferred stocks, depositary receipts, convertible securities, equity-linked securities, real estate investment trusts ("REITs"), and rights and warrants to purchase equity securities. Fixed income securities may include mortgage-related or mortgage-backed securities, floating rate securities, inflation-linked fixed income securities, securities issued or guaranteed by the U.S. Government, its agencies or instrumentalities, securities issued or guaranteed by non-U.S. governments, their agencies, or instrumentalities, corporate bonds and notes issued by U.S. and non-U.S. entities | • invests primarily in a blend of equity and fixed income securities of U.S. and non-U.S. issuers. Equity securities may include common and preferred stocks, depositary receipts, convertible securities, equity-linked securities, REITs, rights and warrants to purchase equity securities and limited partnership interests. Fixed income securities may include mortgage-related or mortgage-backed securities, floating rate securities, inflation-linked fixed income securities, securities issued or guaranteed by the U.S. Government, its agencies or instrumentalities, securities issued or guaranteed by non-U.S. governments, their agencies or instrumentalities, corporate bonds and notes issued by U.S. and non-U.S. entities | ||||||
| • may invest in any country, including developing or emerging market countries. Investments may be U.S. and non-U.S. dollar denominated | • may invest in any country, including developing or emerging market countries. Investments may be denominated in U.S. dollars or in currencies other than U.S. dollars | ||||||
| • may invest a portion of its assets in below investment grade fixed income securities and repurchase agreements | • may invest a portion of its assets in below investment grade fixed income securities and repurchase agreements | ||||||
| • may invest in restricted and illiquid securities | • may invest in restricted and illiquid securities | ||||||
| • may invest up to 10% of its total assets in other investment companies, including exchange-traded funds ("ETFs") | • may invest up to 10% of its total assets in other investment companies, including ETFs | ||||||
8
| Global Strategist | MSIFT Global Strategist | ||||||
| Investment Policies | Investment Policies | ||||||
| • may, but is not required to, use derivative instruments for a variety of purposes, including hedging, risk management, portfolio management or to earn income. Global Strategist's use of derivatives may involve the purchase and sale of derivative instruments such as options, futures, swaps, structured investments (including commodity-linked notes) and other related instruments and techniques. Global Strategist may also invest in forward foreign currency exchange contracts, which are also derivatives, in connection with its investments in foreign securities | • may, but it is not required to, use derivative instruments for a variety of purposes, including hedging, risk management, portfolio management or to earn income. MSIFT Global Strategist's use of derivatives may involve the purchase and sale of derivative instruments such as options, futures, swaps and structured investments (including commodity-linked notes), and other related instruments and techniques. MSIFT Global Strategist may utilize foreign currency forward exchange contracts, which are also derivatives, in connection with its investments in foreign securities. Derivative instruments used by MSIFT Global Strategist will be counted toward MSIFT Global Strategist's exposure to the types of securities listed above to the extent they have economic characteristics similar to such securities | ||||||
| • a diversified fund | • a diversified fund | ||||||
Fund Management.
The current portfolio management team for each Acquired Fund is expected to continue to be primarily responsible for the day-to-day management of the applicable Acquiring Fund.
Mid Cap Growth Reorganization
Mid Cap Growth and MSIFT Mid Cap Growth are both managed within MSIM's Growth team and, if the Mid Cap Growth Reorganization is approved, MSIFT Mid Cap Growth is expected to continue to be managed within MSIM's Growth team. The team consists of a portfolio manager and analysts. Current members of the team jointly and primarily responsible for the day-to-day management of Mid Cap Growth and MSIFT Mid Cap Growth, and those members that are expected to continue to be responsible for the day-to-day management of MSIFT Mid Cap Growth if the Mid Cap Growth Reorganization is approved, are Dennis P. Lynch, David S. Cohen, Sam G. Chainani, Alexander T. Norton, Jason C. Yeung and Armistead B. Nash.
Mr. Lynch, a Managing Director of MSIM, has been associated with MSIM in an investment management capacity since 1998, and has managed Mid Cap Growth and MSIFT Mid Cap Growth since 2002. Mr. Cohen, a Managing Director of MSIM, has been associated with MSIM in an investment management capacity since 1993, and has managed Mid Cap Growth since 2003 and MSIFT Mid Cap Growth since 2002. Mr. Chainani, a Managing Director of MSIM, has been associated with MSIM in an investment management capacity since 1996, and has managed Mid Cap Growth and MSIFT Mid Cap Growth since 2004. Mr. Norton, an Executive Director of MSIM, has been associated with MSIM in an investment management capacity since 2000, and has managed Mid Cap Growth and MSIFT Mid Cap Growth since 2005. Mr. Yeung, a Managing Director of MSIM, has been associated with MSIM in an investment management capacity since 2002, and has managed Mid Cap Growth and MSIFT Mid Cap Growth since 2007. Mr. Nash, an Executive Director of MSIM, has been associated with MSIM in an investment management capacity since 2002, and has managed Mid Cap Growth and MSIFT Mid Cap Growth since 2008. Mr. Lynch is the lead portfolio manager of Mid Cap Growth and MSIFT Mid Cap Growth. Messrs. Cohen, Chainani, Norton, Yeung and Nash are co-portfolio managers. Members of the team collaborate to manage the assets of Mid Cap Growth and MSIFT Mid Cap Growth.
9
Global Strategist Reorganization
Global Strategist and MSIFT Global Strategist are both managed within MSIM's Global Asset Allocation team and, if the Global Strategist Reorganization is approved, MSIFT Global Strategist is expected to continue to be managed within MSIM's Global Asset Allocation team. The team consists of portfolio managers and analysts. Current members of the team jointly and primarily responsible for the day-to-day management of Global Strategist and MSIFT Global Strategist, and those members that are expected to continue to be responsible for the day-to-day management of MSIFT Global Strategist if the Global Strategist Growth Reorganization is approved, are Mark A. Bavoso and Cyril Moullé-Berteaux.
Mr. Bavoso, a Managing Director of MSIM, has been associated with MSIM in an investment management capacity since 1986, and has managed Global Strategist and MSIFT Global Strategist since 2011. Mr. Moullé-Berteaux, a Managing Director of MSIM, has been associated with MSIM in an investment management capacity since August 2011, and has managed Global Strategist and MSIFT Global Strategist since 2011. Members of the team collaborate to manage the assets of Global Strategist and MSIFT Global Strategist.
Additional information about the portfolio managers' compensation structure, other accounts managed by the portfolio managers and the portfolio managers' ownership of securities in the Funds is provided in each Fund's Statement of Additional Information.
Investment Advisory Fees. Each Acquiring Fund and Acquired Fund currently obtains advisory services from MSIM. MSIM is a wholly-owned subsidiary of Morgan Stanley with its principal office located at 522 Fifth Avenue, New York, NY 10036. Morgan Stanley is a preeminent global financial services firm engaged in securities trading and brokerage activities, as well as providing investment banking, research and analysis, financing and financial advisory services.
The annual advisory fee (as a percentage of daily net assets) payable by each Acquiring Fund and Acquired Fund is set forth below. Each Acquiring Fund pays its advisory fee on a quarterly basis while each Acquired Fund pays its advisory fee on a monthly basis.
| Mid Cap Growth: | 0.42% of the portion of daily net assets not exceeding $500 million; and 0.395% of the portion of daily net assets exceeding $500 million. | ||||||
| MSIFT Mid Cap Growth: | 0.50% of average daily net assets. | ||||||
| Global Strategist: | 0.42% of the portion of the daily net assets not exceeding $1.5 billion; and 0.395% of the portion of the daily net assets exceeding $1.5 billion. | ||||||
| MSIFT Global Strategist: | 0.45% of average daily net assets. | ||||||
10
Comparison of Other Service Providers. The following table identifies the principal service providers that service the Acquiring Funds and the Acquired Funds:
| Acquired Funds | Acquiring Funds | ||||||||||
| Administrator: | Morgan Stanley Services Company Inc. | Morgan Stanley Investment Management Inc. | |||||||||
| Transfer Agent: | Morgan Stanley Services Company Inc. | Morgan Stanley Services Company Inc. | |||||||||
| Custodian: | State Street Bank and Trust Company | State Street Bank and Trust Company | |||||||||
| Distributor: | Morgan Stanley Distribution, Inc. | Morgan Stanley Distribution, Inc. | |||||||||
| Independent Registered Public Accounting Firm: | Ernst & Young LLP | Ernst & Young LLP | |||||||||
Distribution Plan and Shareholder Services Plan Fees.
Descriptions of the Plans. Each Acquired Fund has adopted a plan of distribution plan (the "MS Plan") with respect to each of its Class A shares, Class B shares and Class C shares, pursuant to Rule 12b-1 under the 1940 Act. Under the MS Plan, each Acquired Fund pays distribution and/or shareholder services fees in connection with the sale and distribution of its shares and service fees in connection with the provision of ongoing services to Shareholders of each such class and the maintenance of shareholder accounts. For a complete description of these arrangements with respect to each Acquired Fund, see the section of each Acquired Fund's prospectus entitled "Share Class Arrangements" and the section of each Acquired Fund's Statement of Additional Information entitled "Rule 12b-1 Plan."
The Company has adopted a shareholder services plan (the "MSIFT Service Plan") with respect to Class H shares of each Acquiring Fund and a distribution and shareholder services plan (the "MSIFT Distribution Plan" and, together with the MSIFT Service Plan, the "MSIFT Plans") with respect to Class L shares of each Acquiring Fund pursuant to Rule 12b-1 under the 1940 Act.
Class A and Class B Shares of Acquired Fund/Class H Shares of Acquiring Fund. Under the MS Plan, each Acquired Fund may pay up to 0.25% and 1.00% of their respective average daily net assets attributable to each of Class A shares and Class B shares, respectively, for distribution-related expenses and for the provision of ongoing services to Shareholders.
Under the MSIFT Service Plan, each Acquiring Fund may pay a shareholder services fee of up to 0.25% of Class H shares' average daily net assets on an annualized basis. The Distributor may compensate other parties for providing shareholder support services to investors who purchase Class H shares. For further information relating to shareholder services applicable to Class H shares of each Acquiring Fund, see the section entitled "Fund Management—Shareholder Services Plan (Class H)" in the Acquiring Funds' Prospectuses attached hereto as Exhibit B.
Class C Shares of Acquired Fund/Class L Shares of Acquiring Fund. Under the MS Plan, each Acquired Fund may pay up to 1.00% of their respective average daily net assets attributable to Class C shares for distribution-related expenses and for the provision of ongoing services to Shareholders.
Under the MSIFT Distribution Plan, each Acquiring Fund may pay a shareholder services fee of up to 0.25% of the Class L shares' average daily net assets on an annualized basis and a distribution fee of 0.50% of the Class L shares' average daily net assets on an annualized basis. The Distributor may compensate other parties for providing shareholder support services to investors who purchase Class L shares. For further information relating to the shareholder services and distribution fees applicable to Class L shares of each Acquiring Fund, see the section entitled "Fund Management—Distribution and Shareholder Services Plan (Class L)" in the Acquiring Funds' Prospectuses attached hereto as Exhibit B.
11
Class I Shares of Acquired Fund/Class I Shares of Acquiring Fund. Class I shares of each Acquired Fund are not subject to the MS Plans and Class I shares of each Acquiring Fund are not subject to the MSIFT Plans.
Other Significant Fees. Each of the Acquiring Funds and Acquired Funds pay additional fees in connection with their operations, including legal, auditing, transfer agent and custodial fees. See "Synopsis—Fee Tables" above for the percentage of average net assets represented by such "Other Expenses."
Purchases, Exchanges and Redemptions. The Company's Board of Trustees has authorized the issuance of the Acquiring Fund Shares in connection with the applicable Reorganization.
Class A and Class B Shares of Acquired Funds/Class H Shares of Acquiring Fund
Minimum Investments. The minimum initial investment amount for Class A and Class B shares of each Acquired Fund is $1,000 for regular accounts and individual retirement accounts; $500 for Coverdell Education Savings Accounts; and $100 for purchase plans that allow you to transfer money automatically from your checking or savings account or from a Morgan Stanley Money Market Fund on a semi-monthly, monthly or quarterly basis ("EasyInvest®"). The minimum subsequent investment amount for Class A and Class B shares of each Acquired Fund is $100 for all account types, except for an account opened through EasyInvest®, which requires a Shareholder's schedule of investments to total $1,000 in 12 months.
The minimum initial investment for Class H shares of each Acquiring Fund generally is $25,000. If the value of an investor's account falls below the minimum initial investment amount for Class H shares as a result of share redemptions or if such investor no longer meets one of the waiver criteria, the investor's account may be subject to involuntary conversion (to another class of shares offered by the Acquired Fund (if an account meets the minimum investment amount for such class)) or involuntary redemption. Shareholders will be notified prior to any such conversion or redemption. For further information relating to the minimum investment amounts for Class H shares of each Acquiring Fund, please see the section entitled "Purchasing Class H Shares" in the Acquiring Funds' Prospectuses attached hereto as Exhibit B.
The higher minimum initial investment for Class H shares of each Acquiring Fund will be waived for Class H shares of each Acquiring Fund acquired in connection with the Reorganizations. In addition, the Acquiring Funds' ability to impose an involuntary conversion or redemption will be waived for the life of the applicable Combined Fund for Class A and Class B Shareholders of the Acquired Funds that receive Class H shares of the applicable Acquiring Fund in connection with the Reorganizations.
Sales Charges. Class A shares of each Acquired Fund are subject to an initial sales charge of up to 5.25%. The initial sales charge is reduced for purchases of Class A shares in amounts of $25,000 or more. Investments of $1,000,000 or more are not subject to an initial sales charge, but are generally subject to a CDSC of 1.00% on sales made within 18 months after the last day of the month of purchase.
Class B shares of each Acquired Fund are offered at net asset value with no initial sales charge but are subject to a CDSC. The CSDC is reduced to zero after a seven year period as follows: Year 1—5.00%; Year 2—4.00%; Year 3—3.00%; Year 4—2.00%; Year 5—2.00%; Year 6—1.00%; Year 7 and thereafter—None. The CDSC is assessed on an amount equal to the lesser of the then market value of the Class B shares or the historical cost of the Class B shares (which is the amount actually paid for the Class B shares at the time of original purchase) being redeemed.
Class H shares of each Acquiring Fund are offered at net asset value and are subject to an initial sales charge equal to a maximum of 4.75% calculated as a percentage of the offering price on a single transaction. The sales charge is reduced for purchases of $50,000 and over. Class H shares are not subject to a CDSC. For further information relating to the initial sales charge for Class H shares of each Acquiring Fund, please see the section entitled "How To Purchase Class H Shares" in the Acquiring Funds' Prospectuses attached hereto as Exhibit B.
The initial sales charge applicable to Class H shares of the Acquiring Funds will be waived for Class H shares acquired in each Reorganization. Any subsequent purchases of Class H shares, including through the dividend reinvestment plan, of the Acquiring Fund after the applicable Reorganization by the former Class A and Class B Shareholders of an Acquired Fund will be subject to the initial sales charge schedule. No CDSCs
12
will be imposed on Class B shares of each Acquired Fund that are exchanged for Class H shares of the corresponding Acquiring Fund in connection with the applicable Reorganization.
Exchange Privileges. Class A shares and Class B shares of each Acquired Fund may be exchanged for shares of the same class of any other continuously offered Morgan Stanley Multi-Class Fund, or for shares of a Morgan Stanley Money Market Fund or the Morgan Stanley Limited Duration U.S. Government Trust (together the "Morgan Stanley Funds"), based on the next determined net asset value per share of each fund after requesting the exchange without any sales charge, subject to certain limitations. Class A and Class B shares of each Acquired Fund may be exchanged for shares of any Morgan Stanley Fund only if shares of that Morgan Stanley Fund are available for sale.
Class H shares of each Acquiring Fund may be exchanged for shares of the same class of any other available portfolio of the Company and available portfolios of Morgan Stanley Institutional Fund, Inc. (each, an "Exchange Fund"). Exchanges are effected based on the respective net asset values of the applicable portfolios. Upon consummation of the applicable Reorganization, the foregoing exchange privileges will apply to Shareholders of each Combined Fund; however, Shareholders must satisfy the applicable Class H minimum initial investment amount of the Exchange Fund at the time of the exchange.
Each Fund provides telephone exchange privileges to its Shareholders. For greater details relating to exchange privileges applicable to the Acquiring Funds, see the section entitled "General Shareholder Information—Exchange Privilege" in the Acquiring Funds' Prospectuses attached hereto as Exhibit B. For greater details relating to exchange privileges applicable to the Acquired Funds, see the section entitled "Shareholder Information—How to Exchange Shares" in the Acquired Funds' Prospectuses, incorporated herein by reference.
Class C Shares of Acquired Fund/Class L Shares of Acquiring Fund
Minimum Investments. The minimum initial investment amount for Class C shares of each Acquired Fund is $1,000 for regular accounts and individual retirement accounts; $500 for Coverdell Education Savings Accounts; and $100 for EasyInvest®. The minimum subsequent investment amount for Class C shares of each Acquired Fund is $100 for all account types, except for an account opened through EasyInvest®, which requires a Shareholder's schedule of investments to total $1,000 in 12 months.
The minimum initial investment for Class L shares of each Acquiring Fund generally is $25,000. If the value of an investor's account falls below the minimum initial investment amount for Class L shares as a result of share redemptions or if such investor no longer meets one of the waiver criteria, the investor's account may be subject to involuntary conversion (to another class of shares offered by the Acquired Fund (if an account meets the minimum investment amount for such class)) or involuntary redemption. Shareholders will be notified prior to any such conversion or redemption. For further information relating to the minimum investment amounts for Class L shares of each Acquiring Fund, please see the section entitled "Purchasing Class L Shares" in the Acquiring Funds' Prospectuses attached hereto as Exhibit B.
The higher minimum initial investment for Class L shares of each Acquiring Fund will be waived for Class L shares of each Acquiring Fund acquired in connection with the Reorganizations. In addition, the Acquiring Funds' ability to impose an involuntary conversion or redemption will be waived for the life of the applicable Combined Fund for Class C Shareholders of the Acquired Funds that receive Class L shares of the applicable Acquiring Fund in connection with the Reorganizations.
Sales Charges. Class C shares of each Acquired Fund do not incur an initial sales charge when purchased, but generally are subject to a CDSC of 1.00% of the lesser of the then current net asset value or the original purchase price on Class C shares redeemed within one year after purchase, which sales charge is reduced to zero thereafter. Class L shares of each Acquiring Fund are offered at net asset value with no initial sales charge or CDSC.
No CDSCs will be imposed on Class C shares of each Acquired Fund that are exchanged for Class L shares of the corresponding Acquiring Fund in connection with the Reorganizations.
Exchange Privileges. Class C shares of each Acquired Fund may be exchanged for shares of the same class of any Morgan Stanley Fund, based on the next determined net asset value per share of each fund after requesting the exchange without any sales charge, subject to certain limitations. Class C shares of each Acquired Fund may be exchanged for shares of any Morgan Stanley Fund only if shares of that Morgan Stanley Fund are available for sale.
13
Class L shares of each Acquiring Fund may be exchanged for shares of the same class of any Exchange Fund. Exchanges are effected based on the respective net asset values of the applicable portfolios. Upon consummation of the applicable Reorganization, the foregoing exchange privileges will apply to Shareholders of each Combined Fund; however, Shareholders must satisfy the applicable Class L minimum initial investment amount of the Exchange Fund at the time of the exchange.
Each Fund provides telephone exchange privileges to its Shareholders. For greater details relating to exchange privileges applicable to the Acquiring Funds, see the section entitled "General Shareholder Information—Exchange Privilege" in the Acquiring Funds' Prospectuses attached hereto as Exhibit B. For greater details relating to exchange privileges applicable to the Acquired Funds, see the section entitled "Shareholder Information—How to Exchange Shares" in the Acquired Funds' Prospectuses, incorporated herein by reference.
Class I Shares of Acquired Fund/Class I Shares of Acquiring Fund
Minimum Investments. Class I shares of each Acquired Fund are offered only to investors meeting an initial investment minimum of $5,000,000 ($25,000,000 for employer-sponsored employee benefit plans, whether or not qualified under the Internal Revenue Code, for which an entity independent from Morgan Stanley serves as record-keeper under an alliance or similar agreement with Morgan Stanley's Retirement Plan Solutions) and are available only to limited categories of investors.
The minimum initial investment for Class I shares of each Acquiring Fund generally is $5,000,000. If the value of an investor's account falls below the minimum initial investment amount for Class I shares as a result of share redemptions or if such investor no longer meets one of the waiver criteria, the investor's account may be subject to involuntary conversion (to another class of shares offered by the Acquired Fund (if an account meets the minimum investment amount for such class)) or involuntary redemption. Shareholders will be notified prior to any such conversion or redemption. For further information relating to minimum investment requirements for Class I shares of each Acquiring Fund, please see the sections entitled "Purchasing Shares—Share Class Arrangements" and "—Other Purchase Information" in the Acquiring Funds' Prospectuses attached hereto as Exhibit B.
The minimum initial investment for Class I shares of each Acquiring Fund will be waived for Class I shares of each Acquiring Fund acquired in connection with the Reorganizations. In addition, the Acquiring Funds' ability to impose an involuntary conversion or redemption will be waived for the life of the applicable Combined Fund for Class I Shareholders of the Acquired Funds that receive Class I shares of the applicable Acquiring Fund in connection with the Reorganizations.
Sales Charges. Class I shares of each Acquired Fund and each Acquiring Fund are not subject to either an initial sales charge or a CDSC.
Exchange Privileges. Class I shares of each Acquired Fund may be exchanged for shares of the same class of any Morgan Stanley Fund based on the next determined net asset value per share of each fund after requesting the exchange without any sales charge, subject to minimum purchase requirements and certain limitations. Class I shares of each Acquired Fund may be exchanged for shares of any Morgan Stanley Fund only if shares of that Morgan Stanley Fund are available for sale.
Class I shares of each Acquiring Fund may be exchanged for shares of the same class of any Exchange Fund. Exchanges are effected based on the respective net asset values of the applicable portfolios. Upon consummation of the applicable Reorganization, the foregoing exchange privileges will apply to Shareholders of each Combined Fund; however, Shareholders must satisfy the applicable Class I minimum initial investment amount of the Exchange Fund at the time of the exchange.
Each Fund provides telephone exchange privileges to its Shareholders. For greater details relating to exchange privileges applicable to the Acquiring Funds, see the section entitled "General Shareholder Information—Exchange Privilege" in the Acquiring Funds' Prospectuses attached hereto as Exhibit B. For greater details relating to exchange privileges applicable to the Acquired Funds, see the section entitled "Shareholder Information—How to Exchange Shares" in the Acquired Funds' Prospectuses, incorporated herein by reference.
Dividends. Each Fund declares dividends separately for each of its classes. Mid Cap Growth, MSIFT Mid Cap Growth pays dividends from net investment income, if any, annually and distributes net realized capital gains,
14
if any, annually. MSIFT Mid Cap Growth pays dividends from net investment income, if any, annually and distributes net realized capital gains, if any, at least annually. Global Strategist pays dividends from net investment income, if any, annually and distributes net realized capital gains, if any, annually. MSIFT Global Strategist pays dividends from net investment income, if any, quarterly and distributes net realized capital gains, if any, at least annually. Dividends and capital gains distributions are automatically reinvested in additional shares of the same class of shares of such Fund at net asset value unless the shareholder instructs otherwise.
Record Date; Quorum
Each Board has fixed the close of business on July 2, 2012 as the record date (the "Record Date") for the determination of Shareholders of each Acquired Fund entitled to notice of, and to vote at, the Meeting. As of the Record Date, there were 9,858,411 shares of Mid Cap Growth and 29,675,936 shares of Global Strategist issued and outstanding. Shareholders on the Record Date are entitled to one vote per share and a fractional vote for a fractional share on each matter submitted to a vote at the Meeting. Shareholders of each class of each Acquired Fund will vote together as a single class in connection with the applicable Reorganization Agreement. The holders of a majority of the shares issued and outstanding and entitled to vote of each of Mid Cap Growth and Global Strategist, represented in person or by proxy, will constitute a quorum at the applicable Meeting.
Proxies
The enclosed form of Proxy for each Acquired Fund, if properly executed and returned, will be voted in accordance with the choice specified thereon. The Proxy will be voted in favor of the applicable Reorganization unless a choice is indicated to vote against or to abstain from voting on the Reorganization. If a Shareholder executes and returns a Proxy but fails to indicate how the votes should be cast, the Proxy will be voted in favor of the applicable Reorganization. The Board knows of no business, other than that set forth in the Notice of Joint Special Meeting of Shareholders, to be presented for consideration at the Meeting. However, the Proxy confers discretionary authority upon the persons named therein to vote as they determine on other business, not currently contemplated, which may come before the Meeting.
The Proxy may be revoked at any time prior to the voting thereof by: (i) delivering written notice of revocation to the Secretary of Mid Cap Growth or Global Strategist, as applicable, 522 Fifth Avenue, New York, NY 10036; (ii) attending the Meeting and voting in person; or (iii) completing and returning a new Proxy (whether by mail or, as discussed below, by touchtone telephone or the Internet) (if returned and received in time to be voted). Attendance at the Meeting will not in and of itself revoke a Proxy.
In the event that the necessary quorum to transact business or the vote required to approve or reject the Reorganization with respect to an Acquired Fund is not obtained at the applicable Meeting, the persons named as Proxies may propose one or more adjournments of the Meeting to permit further solicitation of Proxies. Any such adjournment will require the affirmative vote of the holders of a majority of shares of Mid Cap Growth or Global Strategist, as applicable, present in person or by Proxy at the Meeting. Where an adjournment is proposed because the necessary quorum to transact business is not obtained at the applicable Meeting, the persons named as Proxies will vote in favor of such adjournment provided that such persons named as Proxies determine that such adjournment and additional solicitation is reasonable and in the interests of Shareholders based on all relevant factors, including the nature of the proposal, the percentage of Shareholders present, the nature of the proposed solicitation activities and the nature of the reasons for the further solicitation. Where an adjournment is proposed because the vote required to approve or reject the Reorganization with respect to an Acquired Fund is not obtained at the applicable Meeting, the persons named as Proxies will vote in favor of such adjournment those Proxies which they are entitled to vote in favor of the Reorganization and will vote against any such adjournment those Proxies required to be voted against the Reorganization. Abstentions will not be voted either for or against any such adjournment.
Shareholders will be able to vote their shares by touchtone telephone or by Internet by following the instructions on the Proxy Card or on the Voting Information Card accompanying this Joint Proxy Statement and Prospectus. To vote by Internet or by telephone, Shareholders can access the website or call the toll-free number listed on the Proxy Card or noted in the enclosed voting instructions. To vote by touchtone telephone, Shareholders will need the number that appears on the Proxy Card. In certain instances, a proxy solicitor may call Shareholders to ask if they would be willing to have their votes recorded by telephone. The telephone voting procedure is designed to
15
authenticate Shareholders' identities, to allow Shareholders to authorize the voting of their shares in accordance with their instructions and to confirm that their instructions have been recorded properly. No recommendation will be made as to how a Shareholder should vote on any proposal other than to refer to the recommendations of the Board. Shareholders voting by telephone in this manner will be asked for identifying information and will be given an opportunity to authorize Proxies to vote their shares in accordance with their instructions. To ensure that Shareholders' instructions have been recorded correctly they will receive a confirmation of their instructions in the mail. A special toll-free number set forth in the confirmation will be available in case the information contained in the confirmation is incorrect. Although a Shareholder's vote may be taken by telephone, each Shareholder will receive a copy of this Joint Proxy Statement and may vote by mail using the enclosed Proxy Card or by touchtone telephone or the Internet as set forth above. The last proxy vote received in time to be voted, whether by Proxy Card, touchtone telephone or Internet, will be the vote that is counted and will revoke all previous votes by Shareholders.
Expenses of Solicitation
Solicitation of Proxies is being made primarily by the mailing of this Joint Proxy Statement and Prospectus with its enclosures. In addition to the solicitation of Proxies by mail, employees of MSIM and its affiliates, without additional compensation, may solicit proxies in person or by telephone, telegraph, facsimile or oral communication. Each Acquired Fund may retain Computershare Fund Services, a professional proxy solicitation firm, to assist with any necessary solicitation of Proxies. The estimated cost of additional telephone solicitation by Computershare Fund Services is approximately $104,488, with respect to Mid Cap Growth, and $117,314, with respect to Global Strategist. The expenses of the Reorganizations, including the cost of printing, filing and proxy solicitation (including the aforementioned cost of additional telephone solicitation by Computershare Fund Services), and legal and accounting expenses, with respect to Mid Cap Growth are expected to be approximately $602,691, $596,400 of which will be borne by Mid Cap Growth, and with respect to Global Strategist are expected to be approximately $685,828, all of which will be borne by Global Strategist.
Vote Required
Approval of the Mid Cap Growth Reorganization and Global Strategist Reorganization by Shareholders requires the affirmative vote of the lesser of: (1) more than 50% of the outstanding shares of the applicable Acquired Fund, or (2) 67% or more of the shares of the applicable Acquired Fund represented at the Meeting if the holders of more than 50% of the outstanding shares of the applicable Acquired Fund are present or represented by Proxy. Abstentions are not considered votes "FOR" a Reorganization at the Meeting. As a result, abstentions have the same effect as a vote against a Reorganization because approval of a Reorganization requires the affirmative vote of a percentage of the voting securities present or represented by proxy or a percentage of the outstanding voting securities.
If a Reorganization is not approved by Shareholders of an Acquired Fund, that Acquired Fund will continue in existence and the Board will consider alternative actions for such Fund.
16
PRINCIPAL RISK FACTORS
The principal risks of investing in an Acquiring Fund are substantially similar to those of investing in its corresponding Acquired Fund. The value of an investment in all of the Funds is based on the market prices of the securities such Fund holds. These prices change daily due to economic and other events that affect markets generally, as well as those that affect particular regions, countries, industries, companies or governments.
Common Stock and Other Equity Securities. Each Fund may invest in common stock and other equity securities. In general, stock values fluctuate, and sometimes widely fluctuate, in response to activities specific to the company as well as general market, economic and political conditions. To the extent that a Fund invests in convertible securities, and the convertible security's investment value is greater than its conversion value, its price will be likely to increase when interest rates fall and decrease when interest rates rise. If the conversion value exceeds the investment value, the price of the convertible security will tend to fluctuate directly with the price of the underlying security.
Fixed Income Securities. Global Strategist and MSIFT Global Strategist may invest in fixed income securities. All fixed-income securities are subject to two types of risk: credit risk and interest rate risk. Credit risk refers to the possibility that the issuer of a security will be unable to make interest payments and/or repay the principal on its debt. Interest rate risk refers to fluctuations in the value of a fixed-income security resulting from changes in the general level of interest rates. When the general level of interest rates goes up, the prices of most fixed-income securities go down. When the general level of interest rates goes down, the prices of most fixed-income securities go up. (Zero coupon securities are typically subject to greater price fluctuations than comparable securities that pay interest.) Global Strategist and MSIFT Global Strategist are not limited as to the maturities of the fixed-income securities in which they may invest. Thus, a rise in the general level of interest rates may cause the price of such Fund's portfolio securities to fall substantially. A portion of the Funds' securities may be rated below investment grade. Securities rated below investment grade are commonly known as "junk bonds" and may have speculative credit risk characteristics.
Mid Capitalization Companies. Mid Cap Growth and MSIFT Mid Cap Growth may invest in mid capitalization companies. Investments in mid capitalization companies may involve greater risk than investments in larger, more established companies. The securities issued by mid capitalization companies may be less liquid, and such companies may have more limited markets, financial resources and product lines, and may lack the depth of management of larger companies.
Shares of IPOs. Mid Cap Growth may purchase shares issued as part of, or a short period after, companies' initial public offerings ("IPOs"), and may at times dispose of those shares shortly after their acquisition. The Fund's purchase of shares issued in IPOs exposes it to the risks associated with companies that have little operating history as public companies, as well as to the risks inherent in those sectors of the market where these new issuers operate. The market for IPO issuers has been volatile, and share prices of newly-public companies have fluctuated in significant amounts over short periods of time. The purchase of shares issued in IPOs may have a greater impact upon the Fund's total returns during any period that the Fund has a small asset base. As the Fund's assets grow, any impact of IPO investments on the Fund's total return may decline.
Foreign and Emerging Market Securities. Each Fund may invest in foreign and emerging market securities. Each Fund's investments in foreign securities involve risks that are in addition to the risks associated with domestic securities. One additional risk is currency risk. While the price of Fund shares is quoted in U.S. dollars, each Fund may convert U.S. dollars to a foreign market's local currency to purchase a security in that market. If the value of that local currency falls relative to the U.S. dollar, the U.S. dollar value of the foreign security will decrease. This is true even if the foreign security's local price remains unchanged.
Foreign securities also have risks related to economic and political developments abroad, including expropriations, confiscatory taxation, exchange control regulation, limitations on the use or transfer of Fund assets and any effects of foreign social, economic or political instability. Foreign companies, in general, are not subject to the regulatory requirements of U.S. companies and, as such, there may be less publicly available information about these companies. Moreover, foreign accounting, auditing and financial reporting standards generally are different from those applicable to U.S. companies. Finally, in the event of a default of any foreign debt obligations, it may be more difficult for the Fund to obtain or enforce a judgment against the issuers of the securities.
17
Securities of foreign issuers may be less liquid than comparable securities of U.S. issuers and, as such, their price changes may be more volatile. Furthermore, foreign exchanges and broker-dealers are generally subject to less government and exchange scrutiny and regulation than their U.S. counterparts. In addition, differences in clearance and settlement procedures in foreign markets may cause delays in settlement of a Fund's trades effected in those markets and could result in losses to the Fund due to subsequent declines in the value of the securities subject to the trades.
The foreign securities in which the Fund may invest may be issued by governments of, or issuers located in, emerging market or developing countries. Compared to the United States and other developed countries, emerging market or developing countries may have relatively unstable governments, economies based on only a few industries and securities markets that trade a small number of securities. Prices of these securities tend to be especially volatile and, in the past, securities in these countries have offered greater potential loss (as well as gain) than securities of companies located in developed countries.
Depositary receipts involve many of the same risks as those associated with direct investment in foreign securities. In addition, the underlying issuers of certain depositary receipts, particularly unsponsored or unregistered depositary receipts, are under no obligation to distribute shareholder communications to the holders of such receipts, or to pass through to them any voting rights with respect to the deposited securities.
In connection with its investments in foreign securities, each Fund also may enter into forward contracts. A forward foreign currency exchange contract is a negotiated agreement between the contracting parties to exchange a specified amount of currency at a specified future time at a specified rate. The rate can be higher or lower than the spot rate between the currencies that are the subject of the contract. Forward foreign currency exchange contracts may be used to protect against uncertainty in the level of future foreign currency exchange rates or to gain or modify exposure to a particular currency. In addition, each Fund may use cross currency hedging or proxy hedging with respect to currencies in which the Fund has or expects to have portfolio or currency exposure. Cross currency hedges involve the sale of one currency against the positive exposure to a different currency and may be used for hedging purposes or to establish an active exposure to the exchange rate between any two currencies. Hedging each Fund's currency risks involves the risk of mismatching the Fund's objectives under a forward or futures contract with the value of securities denominated in a particular currency. Furthermore, such transactions reduce or preclude the opportunity for gain if the value of the currency should move in the direction opposite to the position taken. There is an additional risk to the effect that currency contracts create exposure to currencies in which the Fund's securities are not denominated. Unanticipated changes in currency prices may result in poorer overall performance for the Fund than if it had not entered into such contracts. The use of forward foreign currency exchange contracts involves the risk of loss from the insolvency or bankruptcy of the counterparty to the contract or the failure of the counterparty to make payments or otherwise comply with the terms of the contract.
Privately Placed and Restricted Securities. Mid Cap Growth's and MSIFT Mid Cap Growth's investments may include privately placed securities, which are subject to resale restrictions. These securities will have the effect of increasing the level of Fund illiquidity to the extent a Fund may be unable to sell or transfer these securities due to restrictions on transfers or on the ability to find buyers interested in purchasing the securities. The illiquidity of the market, as well as the lack of publicly available information regarding these securities, may also adversely affect the ability to arrive at a fair value for certain securities at certain times and could make it difficult for a Fund to sell certain securities.
Lower Rated Fixed-Income Securities ("Junk Bonds"). Global Strategist and MSIFT Global Strategist may invest in junk bonds. The prices of these securities are likely to be more sensitive to adverse economic changes, resulting in increased volatility of market prices of these securities during periods of economic uncertainty, or adverse individual corporate developments, than higher rated securities. In addition, during an economic downturn or substantial period of rising interest rates, junk bond issuers and, in particular, highly leveraged issuers may experience financial stress.
Mortgage Securities. Global Strategist and MSIFT Global Strategist may invest in mortgage securities. Investments in mortgage securities are subject to the risk that if interest rates decline, borrowers may pay off their mortgages sooner than expected which may adversely affect a Fund's return. Certain mortgage-backed securities may be more volatile and less liquid than other traditional types of debt securities. In addition, an unexpectedly high rate of defaults on the mortgages held by a mortgage pool may adversely affect the value of a mortgage-backed
18
security and could result in losses to a Fund. The risk of such defaults is generally higher in the case of mortgage pools that include subprime mortgages.
REITs. Mid Cap Growth, Global Strategist and MSIFT Global Strategist may invest in REITs. REITs pool investors' funds for investments primarily in real estate properties. Like mutual funds, REITs have expenses, including advisory and administration fees, that are paid by their shareholders. As a result, shareholders will absorb duplicate levels of fees when the Portfolio invests in REITs. The performance of any Portfolio REIT holdings ultimately depends on the types of real property in which the REITs invest and how well the property is managed. A general downturn in real estate values also can hurt REIT performance. In addition, REITs are subject to certain provisions under federal tax law. The failure of a company to qualify as a REIT could have adverse consequences for the Portfolio, including significantly reducing return to the Portfolio on its investment in such company.
U.S. Government Securities. Global Strategist and MSIFT Global Strategist may invest in U.S. government securities. With respect to U.S. government securities that are not backed by the full faith and credit of the U.S. Government, there is the risk that the U.S. Government will not provide financial support to such U.S. government agencies, instrumentalities or sponsored enterprises if it is not obligated to do so by law.
Liquidity Risk. Global Strategist and MSIFT Global Strategist investments in restricted and illiquid securities may entail greater risk than investments in publicly traded securities. These securities may be more difficult to sell, particularly in times of market turmoil. Illiquid securities may be more difficult to value. If a Fund is forced to sell an illiquid security to fund redemptions or for other cash needs, it may be forced to sell the security at a loss.
Derivatives Risk. Global Strategist and MSIFT Global Strategist may, but are not required to, use derivative instruments for a variety of purposes, including hedging, risk management, portfolio management or to earn income. Derivatives are financial instruments whose value is based on the value of an underlying asset, interest rate, index or financial instrument. A derivative instrument often has risks similar to its underlying asset and may have additional risks, including imperfect correlation between the value of the derivative and the underlying asset, risks of default by the counterparty to certain transactions, magnification of losses incurred due to changes in the market value of the securities, instruments, indices or interest rates to which they relate, and risks that the transactions may not be liquid. The use of derivatives involves risks that are different from, and possibly greater than, the risks associated with other portfolio investments. Derivatives may involve the use of highly specialized instruments that require investment techniques and risk analyses different from those associated with other portfolio investments.
Certain derivative transactions may give rise to a form of leverage. Leverage magnifies the potential for gain and the risk of loss. Leverage associated with derivative transactions may cause the Funds to liquidate portfolio positions when it may not be advantageous to do so to satisfy its obligations or to meet earmarking or segregation requirements, pursuant to applicable SEC rules and regulations, or may cause the Funds to be more volatile than if the Funds had not been leveraged. Although MSIM seeks to use derivatives to further the Funds' investment objectives, there is no assurance that the use of derivatives will achieve this result.
The derivative instruments and techniques that certain Funds may principally use include:
• Futures. A futures contract is a standardized, exchange-traded agreement to buy or sell a specific quantity of an underlying asset, reference rate or index at a specific price at a specific future time. The value of a futures contract tends to increase and decrease in tandem with the value of the underlying instrument. Depending on the terms of the particular contract, futures contracts are settled through either physical delivery of the underlying instrument on the settlement date or by payment of a cash settlement amount on the settlement date. A decision as to whether, when and how to use futures involves the exercise of skill and judgment and even a well-conceived futures transaction may be unsuccessful because of market behavior or unexpected events. In addition to the derivatives risks discussed above, the prices of futures contracts can be highly volatile, using futures can lower total return, and the potential loss from futures can exceed the Funds' initial investments in such contracts.
• Options. If a Fund buys an option, it buys a legal contract giving it the right to buy or sell a specific amount of the underlying instrument or futures contract on the underlying instrument at an agreed-upon
19
price typically in exchange for a premium paid by the Fund. If a Fund sells an option, it sells to another person the right to buy from or sell to the Fund a specific amount of the underlying instrument or futures contract on the underlying instrument at an agreed-upon price typically in exchange for a premium received by the Fund. A decision as to whether, when and how to use options involves the exercise of skill and judgment and even a well-conceived option transaction may be unsuccessful because of market behavior or unexpected events. The prices of options can be highly volatile and the use of options can lower total returns.
• Swaps. An over-the-counter ("OTC") swap contract is an agreement between two parties pursuant to which the parties exchange payments at specified dates on the basis of a specified notional amount, with the payments calculated by reference to specified securities, indices, reference rates, currencies or other instruments. A small percentage of swap contracts are cleared through a central clearinghouse. Most swap agreements provide that when the period payment dates for both parties are the same, the payments are made on a net basis (i.e., the two payment streams are netted out, with only the net amount paid by one party to the other). The Funds' obligations or rights under swap contracts entered into on a net basis will generally be equal only to the net amount to be paid or received under the agreements, based on the relative values of the positions held by each counterparty. Most swap agreements are not entered into or traded on exchanges and often there is no central clearing or guaranty function for swaps. These OTC swaps are often subject to credit risk or the risk of default or non-performance by the counterparty. Swaps could result in losses if interest rates or foreign currency exchange rates or credit quality changes are not correctly anticipated by Funds or if the reference index, security or investments do not perform as expected. The Funds' use of swaps may include those based on the credit of an underlying security, commonly referred to as "credit default swaps." Where a Fund is the buyer of a credit default swap contract, it would be entitled to receive the par (or other agreed-upon) value of a referenced debt obligation from the counterparty to the contract only in the event of a default or similar event by the issuer of the debt obligation. If no default occurs, the Fund would have paid to the counterparty a periodic stream of payments over the term of the contract and received no benefit from the contract. When a Fund is the seller of a credit default swap contract, it receives the stream of payments but is obligated to pay an amount equal to the par (or other agreed-upon) value of a referenced debt obligation upon the default or similar event of the issuer of the obligation.
• Structured Investments. A structured investment is a derivative security designed to offer a return linked to a particular underlying security, currency, commodity or market. Structured investments may come in various forms including notes, warrants and options to purchase securities. A Fund will typically use structured investments to gain exposure to a permitted underlying security, currency, commodity or market when direct access to a market is limited or inefficient from a tax or cost standpoint. Investments in structured investments involve risks including issuer risk, counterparty risk and market risk. Holders of structured investments bear risks of the underlying investment and are subject to issuer or counterparty risk because a Fund is relying on the creditworthiness of such issuer or counterparty and has no rights with respect to the underlying investment. Certain structured investments may be thinly traded or have a limited trading market and may have the effect of increasing a Fund's illiquidity to the extent that the Fund, at a particular point in time, may be unable to find qualified buyers for these securities.
The foregoing discussion is a summary of the principal risk factors. For a more complete discussion of the risks of each Acquiring Fund, see "Details of the Portfolio—Principal Risks" and "Additional Information About the Portfolio's Investment Strategies and Related Risks" in the Acquiring Funds' Prospectuses attached hereto as Exhibit B. For a more complete discussion of the risks of each Acquired Fund, see "Additional Information about the Fund's Investment Objective, Principal Investment Strategies and Risks" in each Acquired Fund's Prospectus, each incorporated herein by reference.
PERFORMANCE INFORMATION
For a discussion of each Acquiring Fund's performance information, see "Portfolio Summary—Performance Information" in the Acquiring Funds' Prospectuses attached hereto as Exhibit B.
20
THE REORGANIZATIONS
The Boards' Considerations
The Boards, including the Independent Board Members, unanimously approved a Reorganization on behalf of each Acquired Fund and determined to recommend that Shareholders of each Acquired Fund approve the applicable Reorganization. In reaching this decision, the Boards made an extensive inquiry into a number of factors including, but not limited to: the similarity of the investment objectives of the Acquiring Funds; the continuity of the portfolio management teams; the current and future sales and asset growth potential of the Funds; the asset base of the Funds, including that, with respect to the Mid Cap Growth Reorganization, the Acquiring Fund has a substantially larger asset base than the Acquired Fund; the effects of the Reorganizations on the total expenses of the Shareholders of the Acquired Funds; the annual expense savings for Shareholders of the Acquired Funds; the terms and conditions of the Reorganizations, which would affect the price of shares to be issued in the Reorganizations; that there is not expected to be a significant amount of portfolio turnover as a result of the Mid Cap Growth Reorganization; that capital loss carryforwards would not be lost as a result of the Reorganizations; the tax-free nature of the Reorganizations; and the expenses of this solicitation, including the cost of preparing and mailing this Joint Proxy Statement and Prospectus, which will be borne by the respective Acquired Fund (up to a maximum of $596,400 for Mid Cap Growth) in connection with the Reorganizations.
The Boards also considered that the investments of Mid Cap Growth may be held by MSIFT Mid Cap Growth in accordance with the investment guidelines of the MSIFT Mid Cap Growth Fund.
The Boards considered information provided by MSIM. The parties discussed the overlap among Morgan Stanley fund offerings, and the goal of finding a cost effective solution to streamline the Morgan Stanley fund offerings, reducing costs to shareholders and removing potential point of sale conflicts in the marketplace. The parties also discussed the exchangeability among funds within the Morgan Stanley fund family and the waivers of sales charges and minimum investment amounts applicable to the Acquiring Funds for Shareholders of the Acquired Funds in connection with the Reorganizations.
The Boards discussed with MSIM the foreseeable short- and long-term effects on the Acquired Funds and their Shareholders. The members of the Boards who are not "interested persons" of the Acquired Funds, as that term is defined in the 1940 Act, conferred separately with their counsel about the Reorganizations on several occasions.
In connection with the Board review of the Reorganizations, MSIM advised the Boards about a variety of matters, including, but not limited to:
1. the continuity of the portfolio management team before and after the Reorganizations;
2. the similar investment process and objectives of the Acquired Funds and Acquiring Funds;
3. although stated management fees are higher for the Acquiring Funds, the Acquiring Funds will have lower total operating expenses due to the advisory fee waivers and/or expense reimbursements instituted by MSIM for at least two years from the date of the Reorganizations;
4. the current and future sales and asset growth potential of the Funds;
5. the estimated expenses of the Reorganizations; and
7. while the Reorganization may delay when capital losses can be utilized, there is no expectation that any amount of losses would be written off.
In their deliberations, the Boards considered all information they received, as described above, as well as advice and analysis from its counsel. The Boards considered each Reorganization and the impact of each Reorganization on each Acquired Fund and its respective Shareholders. The Boards concluded, based on all of the information presented, that each Reorganization is advisable and in the best interest of each respective Acquired Funds' Shareholders and that Shareholders will not be diluted as a result thereof, and decided to recommend that each Acquired Fund's Shareholders approve the applicable Reorganization.
21
If Shareholders of an Acquired Fund do not approve the respective Reorganization, the Board of that Acquired Fund will consider other courses of action for such Acquired Fund.
The Reorganization Agreements
The terms and conditions under which each Reorganization would be consummated, as summarized below, are set forth in the Reorganization Agreement. This summary is qualified in its entirety by reference to the Agreement and Plan of Reorganization, a copy of which is attached as Exhibit A to this Joint Proxy Statement and Prospectus.
Each Reorganization Agreement provides that (i) an Acquired Fund will transfer substantially all of its assets, including portfolio securities, cash, cash equivalents and receivables, to the applicable Acquiring Fund on the Closing Date in exchange for the assumption by the Acquiring Fund of stated liabilities of the Acquired Fund, including all expenses, costs, charges and reserves, as reflected on an unaudited statement of assets and liabilities of Acquired Fund prepared by the Treasurer of the Acquired Fund as of the Valuation Date (as defined below) in accordance with generally accepted accounting principles consistently applied from the prior audited period, and the delivery of the Acquiring Fund Shares; (ii) such Acquiring Fund Shares would be distributed to Shareholders on the Closing Date or as soon as practicable thereafter; (iii) the Acquired Fund would be liquidated and terminated; and (iv) the outstanding shares of Acquired Fund would be canceled.
The number of Acquiring Fund Shares to be delivered to the applicable Acquired Fund will be determined by dividing the aggregate net asset value of each class of shares of the Acquired Fund acquired by the Acquiring Fund by the net asset value per share of the corresponding class of shares of the Acquiring Fund; these values will be calculated as of the close of business of the New York Stock Exchange on the third business day following the receipt of the requisite approval by Shareholders of the applicable Reorganization Agreement or at such other time as the Acquiring Fund and Acquired Fund may agree (the "Valuation Date"). As an illustration, assume that on the Valuation Date, Class I shares of an Acquired Fund had an aggregate net asset value of $100,000. If the net asset value per Class I share of the applicable Acquiring Fund were $10 per share at the close of business on the Valuation Date, the number of Class I shares of the Acquiring Fund to be issued would be 10,000 ($100,000 ÷ $10). These 10,000 Class I shares of the Acquiring Fund would be distributed to the former Class I shareholders of the Acquired Fund. This example is given for illustration purposes only and does not bear any relationship to the dollar amounts or shares expected to be involved in the Reorganization.
On the Closing Date or as soon as practicable thereafter, each Acquired Fund will distribute pro rata to its Shareholders of record as of the close of business on the Valuation Date, the Acquiring Fund Shares it receives. Each Shareholder will receive the class of shares of the Acquiring Fund that corresponds to the class of shares of the Acquired Fund currently held by that Shareholder. Accordingly, the Acquiring Fund Shares will be distributed as follows: each of the Class I shares of an Acquiring Fund will be distributed to holders of the Class I shares of the applicable Acquired Fund, each of the Class H shares of an Acquiring Fund will be distributed to holders of Class A and Class B shares of applicable Acquired Fund and each of the Class L shares of an Acquiring Fund will be distributed to holders of Class C shares of applicable Acquired Fund. Each Acquiring Fund will cause its transfer agent to credit and confirm an appropriate number of the Acquiring Fund's Shares to each Shareholder.
The Closing Date will be the Valuation Date or the next business day following the Valuation Date. The consummation of the Reorganization is contingent upon the approval of the applicable Reorganization by the Shareholders and the receipt of the other opinions and certificates set forth in Sections 6, 7 and 8 of each Reorganization Agreement and the occurrence of the events described in those Sections, certain of which may be waived by a Fund. Each Reorganization Agreement may be amended in any mutually agreeable manner.
Each Reorganization Agreement may be terminated and the applicable Reorganization abandoned at any time, before or after approval by Shareholders, by mutual consent of the Company, on behalf of the Acquiring Funds, and the Acquired Funds. In addition, either party may terminate the applicable Reorganization Agreement upon the occurrence of a material breach of the Reorganization Agreement by the other party or if, by June 28, 2013, any condition set forth in the Reorganization Agreement has not been fulfilled or waived by the party entitled to its benefits.
22
Under each Reorganization Agreement, within one year after the Closing Date, the applicable Acquired Fund shall either pay or make provision for all of its liabilities to former Shareholders of the Acquired Fund that received Acquiring Fund Shares. Each Acquired Fund shall be terminated following the distribution of applicable Acquiring Fund Shares to Shareholders of record of the Acquired Funds.
The effect of the Reorganizations is that Shareholders who vote their shares in favor of a Reorganization Agreement are electing to sell their shares of an Acquired Fund and reinvest the proceeds in the applicable Acquiring Fund Shares at net asset value and without recognition of taxable gain or loss for federal income tax purposes. See "Tax Aspects of the Reorganization" below. As noted in "Tax Aspects of the Reorganization" below, if an Acquired Fund recognizes net gain from the sale of securities prior to the Closing Date, such gain, to the extent not offset by capital loss carry-forwards, will be distributed to Shareholders prior to the Closing Date and will be taxable to Shareholders as capital gain.
Shareholders will continue to be able to redeem their shares of Acquired Funds at net asset value next determined after receipt of the redemption request until the close of business on the business day next preceding the Closing Date. Redemption requests received by Acquired Funds thereafter will be treated as requests for redemption of shares of the applicable Acquiring Fund.
To the extent that a Shareholder holds shares of an Acquired Fund through a retirement plan separate account for which the relevant Acquiring Fund is not an investment option, the disposition of such Shareholder's shares will be governed by such Shareholder's contract with the retirement plan.
Tax Aspects of the Reorganizations
The following is a general summary of the material federal income tax consequences of the Reorganizations and is based upon the current provisions of the Internal Revenue Code of 1986, as amended (the "Code"), the existing U.S. Treasury Regulations thereunder, current administrative rulings of the Internal Revenue Service ("IRS") and published judicial decisions, all of which are subject to change. This discussion is limited to U.S. persons who hold shares of an Acquired Fund as capital assets for federal income tax purposes. This summary does not address all of the U.S. federal income tax consequences that may be relevant to a particular shareholder or to Shareholders who may be subject to special treatment under federal income tax laws.
Tax Consequences of each Reorganization to Shareholders. Each Reorganization is intended to qualify for federal income tax purposes as a tax-free reorganization under Section 368(a)(1) of the Code.
As a condition to each Reorganization, each Acquired Fund and the Acquiring Fund, has requested an opinion of Dechert LLP substantially to the effect that, based on certain assumptions, facts, the terms of the Reorganization Agreement and representations set forth in the Reorganization Agreement or otherwise provided by the applicable Acquired Fund and the applicable Acquiring Fund:
1. The transfer of substantially all of the assets of the Acquired Fund in exchange solely for the applicable Acquiring Fund Shares and the assumption by such Acquiring Fund of certain stated liabilities of the Acquired Fund followed by the distribution by the Acquired Fund of the applicable Acquiring Fund Shares to Shareholders in exchange for their Acquired Fund shares pursuant to and in accordance with the terms of the Reorganization Agreement will constitute a "reorganization" within the meaning of Section 368(a)(1) of the Code;
2. No gain or loss will be recognized by the applicable Acquiring Fund upon the receipt of the assets of the Acquired Fund solely in exchange for the applicable Acquiring Fund Shares and the assumption by such Acquiring Fund of the stated liabilities of the Acquired Fund;
3. No gain or loss will be recognized by the Acquired Fund upon the transfer of substantially all of the assets of the Acquired Fund to the applicable Acquiring Fund solely in exchange for the applicable Acquiring Fund Shares and the assumption by the Acquiring Fund of the stated liabilities or upon the distribution of the Acquiring Fund Shares to Shareholders in exchange for their Acquired Fund Shares, except that the Acquired Fund may be required to recognize gain or loss with respect to contracts described in Section 1256(b) of the Code or stock in a passive foreign investment company, as defined in Section 1297(a) of the Code;
23
4. No gain or loss will be recognized by Shareholders upon the exchange of the shares of the Acquired Fund solely for the Acquiring Fund Shares;
5. The aggregate tax basis for the Acquiring Fund Shares received by each Shareholder pursuant to the Reorganization will be the same as the aggregate tax basis of the shares in the Acquired Fund surrendered by each such Shareholder in exchange therefor;
6. The holding period of the Acquiring Fund Shares to be received by each Shareholder will include the period during which the shares in the Acquired Fund surrendered in exchange therefor were held (provided such shares in the Acquired Fund were held as capital assets on the date of the Reorganization);
7. The tax basis of the assets of the Acquired Fund acquired by the applicable Acquiring Fund will be the same as the tax basis of such assets of the Acquired Fund immediately prior to the Reorganization; and
8. The holding period of the assets of the Acquired Fund in the hands of the applicable Acquiring Fund will include the period during which those assets were held by the Acquired Fund (except where the investment activities of the applicable Acquiring Fund have the effect of reducing or eliminating such period with respect to an asset).
Prior to the closing of a Reorganization, each Acquired Fund will distribute to its shareholders any undistributed income and gains to the extent required to avoid entity level tax or as otherwise deemed desirable. The advice of counsel is not binding on the IRS or the courts and neither the Acquired Funds nor the Acquiring Funds has sought a ruling with respect to the tax treatment of the applicable Reorganization. The opinion of counsel, if delivered, will be based on the Code, regulations issued by the Treasury Department under the Code, court decisions, and administrative pronouncements issued by the IRS with respect to all of the foregoing, all as in effect on the date of the opinion, and all of which may be repealed, revoked or modified thereafter, possibly on a retroactive basis.
After the Reorganization, you will continue to be responsible for tracking the adjusted tax basis and holding period of your shares for federal income tax purposes.
Shareholders should consult their tax advisors regarding the effect, if any, of the proposed Reorganizations in light of their individual circumstances. Because the foregoing discussion only relates to the federal income tax consequences of the proposed Reorganizations, Shareholders should also consult their tax advisors as to state and local tax consequences, if any, of the proposed Reorganizations.
Description of Shares
The Acquiring Fund Shares to be issued pursuant to the applicable Reorganization Agreement will, when issued in exchange for the consideration therefor, be fully paid and non-assessable by the applicable Acquiring Fund and transferable without restrictions and will have no preemptive rights. For greater details regarding each Acquiring Fund's shares, see "General Shareholder Information" in the Acquiring Funds' Prospectuses attached hereto as Exhibit B.
24
Capitalization Tables (unaudited)
The following tables set forth the capitalization of each Acquired Fund as of June 29, 2012 and each Acquiring Fund on a pro forma combined basis as if each Reorganization had occurred on that date:
| Mid Cap Growth (Acquired Fund) | Class A | Class B | Class C | Class I | Total | ||||||||||||||||||
| Net Assets | $ | 280,241,633 | $ | 7,012,794 | $ | 19,435,276 | $ | 3,521,319 | $ | 310,211,022 | |||||||||||||
| Pro Forma Adjustments† | $ | (538,781 | ) | $ | (13,483 | ) | $ | (37,366 | ) | $ | (6,770 | ) | $ | (596,400 | ) | ||||||||
| Net Assets minus Pro Forma Adjustments | $ | 279,702,852 | $ | 6,999,311 | $ | 19,397,910 | $ | 3,514,549 | $ | 309,614,622 | |||||||||||||
| Shares Outstanding | 8,820,873 | 257,769 | 710,794 | 105,950 | 9,895,386 | ||||||||||||||||||
| Net Asset Value Per Share | $ | 31.71 | $ | 27.15 | $ | 27.29 | $ | 33.17 | — | ||||||||||||||
| MSIFT Mid Cap Growth (Acquiring Fund) | Class H | Class L | Class I | Total | |||||||||||||||
| Net Assets | $ | 10,294 | $ | 10,292 | $ | 4,466,683,577 | $ | 4,466,704,163 | |||||||||||
| Shares Outstanding | 304 | 304 | 127,187,643 | 127,188,251 | |||||||||||||||
| Net Asset Value Per Share | $ | 33.84 | $ | 33.83 | $ | 35.12 | — | ||||||||||||
| Pro Forma Combined Fund MSIFT Mid Cap Growth | Class H | Class L | Class I | Total | |||||||||||||||
| Net Assets | $ | 286,712,457 | $ | 19,408,202 | $ | 4,470,198,126 | $ | 4,776,318,785 | |||||||||||
| Shares Outstanding | 8,472,590 | 573,698 | 127,287,716 | 136,334,004 | |||||||||||||||
| Net Asset Value Per Share | $ | 33.84 | $ | 33.83 | $ | 35.12 | — | ||||||||||||
| Global Strategist (Acquired Fund) | Class A | Class B | Class C | Class I | Total | ||||||||||||||||||
| Net Assets | $ | 372,597,784 | $ | 16,797,324 | $ | 36,877,613 | $ | 23,670,115 | $ | 449,942,836 | |||||||||||||
| Pro Forma Adjustments†† | $ | (567,935 | ) | $ | (25,603 | ) | $ | (56,211 | ) | $ | (36,079 | ) | $ | (685,828 | ) | ||||||||
| Net Assets minus Pro Forma Adjustments | $ | 372,029,849 | $ | 16,771,721 | $ | 36,821,402 | $ | 23,634,036 | $ | 449,257,008 | |||||||||||||
| Shares Outstanding | 24,601,216 | 1,103,457 | 2,462,412 | 1,557,169 | 29,724,254 | ||||||||||||||||||
| Net Asset Value Per Share | $ | 15.12 | $ | 15.20 | $ | 14.95 | $ | 15.18 | — | ||||||||||||||
| MSIFT Global Strategist (Acquiring Fund) | Class H | Class L | Class I | Total | |||||||||||||||
| Net Assets | $ | 9,955 | $ | 9,947 | $ | 21,437,135 | $ | 21,457,037 | |||||||||||
| Shares Outstanding | 693 | 693 | 1,488,580 | 1,489,966 | |||||||||||||||
| Net Asset Value Per Share | $ | 14.36 | $ | 14.34 | $ | 14.40 | — | ||||||||||||
| Pro Forma Combined Fund MSIFT Global Strategist | Class H | Class L | Class I | Total | |||||||||||||||
| Net Assets | $ | 388,811,525 | $ | 36,831,349 | $ | 45,071,171 | $ | 470,714,045 | |||||||||||
| Shares Outstanding | 27,076,011 | 2,568,434 | 3,129,833 | 32,774,278 | |||||||||||||||
| Net Asset Value Per Share | $ | 14.36 | $ | 14.34 | $ | 14.40 | — | ||||||||||||
† Reflects the charge for estimated reorganization expenses of $538,781, $13,483, $37,366 and $6,770 by Class A shares, Class B shares, Class C shares and Class I shares, respectively, of Mid Cap Growth.
†† Reflects the charge for estimated reorganization expenses of $567,935, $25,603, $56,211 and $36,079 by Class A shares, Class B shares, Class C shares and Class I shares, respectively, of Global Strategist.
25
Appraisal Rights
Shareholders will have no appraisal rights in connection with the Reorganization.
COMPARISON OF INVESTMENT OBJECTIVES, PRINCIPAL POLICIES AND RESTRICTIONS
Investment Objectives and Policies
The investment objective of each Acquiring Fund and each Acquired Fund is set forth in the table below:
| Mid Cap Growth | MSIFT Mid Cap Growth | ||||||||||
| Investment Objective | • seeks long-term capital growth | • seeks long-term capital growth | |||||||||
| • The Fund's investment objective is a fundamental policy and may not be changed without shareholder approval of a majority of the Fund's outstanding voting securities, as defined in the 1940 Act | • The Fund's investment objective is a fundamental policy and may not be changed without shareholder approval of a majority of the Fund's outstanding voting securities, as defined in the 1940 Act | ||||||||||
| Global Strategist | MSIFT Global Strategist | ||||||||||
| Investment Objective | • seeks to maximize the total return on its investments | • seeks above-average total return over a market cycle of three to five years | |||||||||
| • The Fund's investment objective is a fundamental policy and may not be changed without shareholder approval of a majority of the Fund's outstanding voting securities, as defined in the 1940 Act | • The Fund's investment objective is a fundamental policy and may not be changed without shareholder approval of a majority of the Fund's outstanding voting securities, as defined in the 1940 Act | ||||||||||
Mid Cap Growth
Mid Cap Growth will normally invest at least 80% of its assets in common stocks (including depositary receipts) and other equity securities of medium capitalization companies. Mid Cap Growth's other equity securities may include convertible securities and preferred stocks. MSIM seeks to invest primarily in established and emerging companies with capitalizations within the range of companies included in the Russell MidCap® Growth Index, which as of December 31, 2011 was between $117 million and $20.4 billion. MSIM emphasizes a bottom-up stock selection process, seeking attractive investments on an individual company basis. MSIM seeks to invest in high quality companies it believes have sustainable competitive advantages and the ability to redeploy capital at high rates of return. MSIM typically favors companies with rising returns on invested capital, above average business visibility, strong free cash flow generation and an attractive risk/reward. Mid Cap Growth may also use derivative instruments as discussed herein. These derivative instruments will be counted toward the 80% policy discussed above to the extent they have economic characteristics similar to the securities included within that policy.
Mid Cap Growth may also invest in initial public offerings and privately placed and restricted securities.
Mid Cap Growth may invest up to 25% of its net assets in foreign securities, including emerging market securities, and securities classified as American Depositary Receipts, Global Depositary Receipts, American Depositary Shares, Global Depositary Shares or local shares of non-U.S. issuers. Mid Cap Growth may also invest in U.S. dollar-denominated foreign securities that are traded on a U.S. national securities exchange. The 25% limitation, however, does not apply to securities of foreign companies that are listed in the United States on a national securities exchange.
Mid Cap Growth may utilize forward foreign currency exchange contracts, which are derivatives, in connection with its investments in foreign securities.
26
MSIFT Mid Cap Growth
Under normal circumstances, at least 80% of MSIFT Mid Cap Growth's assets will be invested in common stocks of mid cap companies. MSIM seeks long-term capital growth by investing primarily in established and emerging companies with capitalizations within the range of companies included in the Russell Midcap® Growth Index, which as of December 31, 2011 was between $117 million and $20.4 billion. MSIM emphasizes a bottom-up stock selection process, seeking attractive investments on an individual company basis. MSIM seeks to invest in high quality companies it believes have sustainable competitive advantages and the ability to redeploy capital at high rates of return. MSIM typically favors companies with rising returns on invested capital, above average business visibility, strong free cash flow generation and an attractive risk/reward. MSIFT Mid Cap Growth may also use derivative instruments as discussed herein. These derivative instruments will be counted towards the 80% policy discussed above to the extent they have economic characteristics similar to the securities included within that policy.
MSIFT Mid Cap Growth may invest up to 25% of its net assets in securities of foreign issuers, including issuers located in emerging market or developing countries. The securities in which MSIFT Mid Cap Growth may invest may be denominated in U.S. dollars or in currencies other than U.S. dollars. MSIFT Mid Cap Growth may invest in privately placed and restricted securities. In addition, MSIFT Mid Cap Growth may invest in convertible securities.
MSIFT Mid Cap Growth may utilize foreign currency forward exchange contracts, which are derivatives, in connection with its investments in foreign securities.
Global Strategist
Global Strategist's Adviser, MSIM, seeks to achieve Global Strategist's investment objective by investing primarily in a blend of equity and fixed-income securities of U.S. and non-U.S. issuers. Equity securities may include common and preferred stocks, depositary receipts, convertible securities, equity-linked securities, REITs, and rights and warrants to purchase equity securities. Fixed income securities may include mortgage-related or mortgage-backed securities, floating rate securities, inflation-linked fixed income securities, securities issued or guaranteed by the U.S. Government, its agencies or instrumentalities, securities issued or guaranteed by non-U.S. governments, their agencies, or instrumentalities, corporate bonds and notes issued by U.S. and non-U.S. entities.
MSIM will utilize a top-down investment approach that focuses on asset class, sector, region, country, and currency selection. The portfolio's allocations will be based upon MSIM's evaluations and analyses, taking into account results of its fundamental market research and recommendations generated by MSIM's quantitative models. Investment decisions will be made without regard to any particular allocation as to geographical location, sector, credit rating, maturity, currency denomination or market capitalization. Global Strategist may invest in any country, including developing or emerging market countries. Global Strategist's investments may be U.S. and non-U.S. dollar denominated.
Global Strategist may invest a portion of its assets in below investment grade fixed income securities and repurchase agreements. Global Strategist may also invest in restricted and illiquid securities. Global Strategist may also invest up to 10% of its total assets in other investment companies, including ETFs. Global Strategist may, but is not required to, use derivative instruments for a variety of purposes, including hedging, risk management, portfolio management or to earn income. Global Strategist's use of derivatives may involve the purchase and sale of derivative instruments such as options, futures, swaps, structured investments (including commodity-linked notes) and other related instruments and techniques. Global Strategist may also invest in forward foreign currency exchange contracts, which are also derivatives, in connection with its investments in foreign securities.
The mortgage-backed securities in which Global Strategist may invest include mortgage pass-through securities which represent a participation interest in a pool of mortgage loans originated by U.S. governmental or private lenders such as banks.
27
MSIFT Global Strategist
MSIM seeks to achieve MSIFT Global Strategist's investment objective by investing primarily in a blend of equity and fixed income securities of U.S. and non-U.S. issuers. Equity securities may include common and preferred stocks, depositary receipts, convertible securities, equity-linked securities, REITs, rights and warrants to purchase equity securities and limited partnership interests. Fixed income securities may include mortgage-related or mortgage-backed securities, floating rate securities, inflation-linked fixed income securities, securities issued or guaranteed by the U.S. Government, its agencies or instrumentalities, securities issued or guaranteed by non-U.S. governments, their agencies or instrumentalities, corporate bonds and notes issued by U.S. and non-U.S. entities.
MSIM will utilize a top-down investment approach that focuses on asset class, sector, region, country, and currency selection. The Portfolio's allocations will be based upon MSIM's evaluations and analyses, taking into account results of its fundamental market research and recommendations generated by MSIM's quantitative models. Investment decisions will be made without regard to any particular allocation as to geographical location, sector, credit rating, maturity, currency denomination or market capitalization. MSIFT Global Strategist may invest in any country, including developing or emerging market countries. MSIFT Global Strategist's investments may be denominated in U.S. dollars or in currencies other than U.S. dollars.
MSIFT Global Strategist may invest a portion of its assets in below investment grade fixed income securities (commonly referred to as "junk bonds") and repurchase agreements. The Portfolio may also invest in restricted and illiquid securities. MSIFT Global Strategist may also invest up to 10% of its total assets in other investment companies, including ETFs. The mortgage-backed securities in which MSIFT Global Strategist may invest include mortgage pass-through securities which represent a participation interest in a pool of mortgage loans originated by U.S. governmental or private lenders such as banks.
MSIFT Global Strategist may, but it is not required to, use derivative instruments for a variety of purposes, including hedging, risk management, portfolio management or to earn income. MSIFT Global Strategist's use of derivatives may involve the purchase and sale of derivative instruments such as options, futures, swaps and structured investments (including commodity-linked notes), and other related instruments and techniques. MSIFT Global Strategist may utilize foreign currency forward exchange contracts, which are also derivatives, in connection with its investments in foreign securities.
Derivative instruments used by MSIFT Global Strategist will be counted toward MSIFT Global Strategist's exposure to the types of securities listed above to the extent they have economic characteristics similar to such securities.
Investment Restrictions
The investment restrictions adopted by each Acquired Fund and each Acquiring Fund as fundamental policies are substantially similar. Each Acquiring Fund's investment restrictions are summarized under the caption "Investment Limitations" in the Statement of Additional Information dated January 31, 2012 with respect to MSIFT Mid Cap Growth Class I shares, April 30, 2012 with respect to Mid Cap Growth Class H and Class L shares and July 16, 2012, with respect to Global Strategist, each as it may be amended and supplemented from time to time. Each Acquired Fund's investment restrictions are summarized under the caption "Fund Policies/Investment Restrictions" in each Acquired Fund's Statement of Additional Information, dated January 31, 2012 (with respect to Mid Cap Growth) and November 30, 2011 (with respect to Global Strategist), each as may be amended and supplemented from time to time. A fundamental investment restriction cannot be changed without the vote of the majority of the outstanding voting securities of a Fund, which is defined by the 1940 Act as the lesser of (i) at least 67% of the voting securities of a fund or portfolio present at a meeting if the holders of more than 50% of the outstanding voting securities of a fund or portfolio are present or represented by proxy; or (ii) more than 50% of the outstanding voting securities of a fund or portfolio. The differences in the investment restrictions adopted by the Funds as fundamental policies are discussed below:
1. With respect to MSIFT Mid Cap Growth's and MSIFT Global Strategist's investment restriction to not invest 25% or more of the value of its total assets in securities of issuers in any one industry, the Funds' investment restrictions state that (i) utility companies will be divided according to their services, for example, gas, gas transmission,
28
electric and telephone will each be considered a separate industry; (ii) financial service companies will be classified according to the end users of their services, for example, automobile finance, bank finance and diversified finance will each be considered a separate industry; and (iii) asset-backed securities will be classified according to the underlying assets securing such securities. Mid Cap Growth and Global Strategist do not have such industry definitions.
The non-fundamental investment restrictions of the Acquiring Funds and the Acquired Funds are set forth below:
The Acquired Funds
Mid Cap Growth
The Fund will not:
1. Make short sales of securities, except short sales against the box.
2. Invest its assets in the securities of any investment company except as may be permitted by (i) the 1940 Act, as amended from time to time; (ii) the rules and regulations promulgated by the Commission under the 1940 Act, as amended from time to time; or (iii) an exemption or other relief applicable to the Fund from the provisions of the 1940 Act, as amended from time to time.
3. Write, purchase or sell puts, calls or combinations thereof.
4. Invest in other investment companies in reliance on Sections 12(d)(1)(F), 12(d)(1)(G) or 12(d)(1)(J) of the 1940 Act.
Notwithstanding any other investment policy or restriction, the Fund may seek to achieve its investment objective by investing all or substantially all of its assets in another investment company having substantially the same investment objective and policies as the Fund.
Global Strategist
The Fund will not:
1. Make short sales of securities, except short sales against the box.
2. Invest its assets in the securities of any investment company except as may permitted by (i) the 1940 Act, as amended from time to time; (ii) the rules and regulations promulgated by the Commission under the 1940 Act, as amended from time to time; or (iii) an exemption or other relief applicable to the Fund from the provisions of the 1940 Act, as amended from time to time.
3. Invest more than 15% of its net assets or such other amount as may be permitted by SEC guidelines in illiquid securities, including restricted securities.
4. Invest in other investment companies in reliance on Sections 12(d)(1)(F), 12(d)(1)(G) or 12(d)(1)(J) of the 1940 Act.
The Fund has an operating policy, which may be changed by the Fund's Board of Trustees, not to borrow except from a bank for temporary or emergency purposes in amounts not exceeding 5% (taken at the lower of cost or current value) of its total assets (not including the amount borrowed).
Notwithstanding any other investment policy or restriction, the Fund may seek to achieve its investment objective by investing all or substantially all of its assets in another investment company having substantially the same investment objective and policies as the Fund.
The Acquiring Funds
Each Acquiring Fund will not:
1. purchase on margin, except for use of short-term credit as may be necessary for the clearance of purchases and sales of securities, provided that a Fund may make margin deposits in connection with transactions in options, futures, and options on futures;
29
2. sell short unless the Fund (i) by virtue of its ownership of other securities, has the right to obtain securities equivalent in kind and amount to the securities sold and, if the right is conditional, the sale is made upon the same conditions, or (ii) maintains in a segregated account on the books of the Fund's custodian an amount that, when combined with the amount of collateral deposited with the broker in connection with the short sale, equals the current market value of the security sold short or such other amount as the Commission or its staff may permit by rule, regulation, order or interpretation (transactions in futures contracts and options, however, are not deemed to constitute selling securities short);
3. pledge, mortgage or hypothecate assets in an amount greater than 50% of its total assets, provided that each Fund may earmark or segregate assets without limit in order to comply with the requirements of Section 18(f) of the 1940 Act and applicable rules, regulations or interpretations of the Commission and its staff;
4. invest more than an aggregate of 15% of the net assets of the Fund, determined at the time of investment, in illiquid securities, provided that this limitation shall not apply to any investment in securities that are not registered under the 1933 Act but that can be sold to qualified institutional investors in accordance with Rule 144A under the 1933 Act and are determined to be liquid securities under guidelines or procedures adopted by the Board;
5. invest for the purpose of exercising control over management of any company; and
6. invest its assets in securities of any investment company, except as permitted by the 1940 Act or the rules, regulations, interpretations or orders of the Commission and its staff thereunder; provided that the Fund will not invest in other investment companies in reliance on Sections 12(d)(1)(F), 12(d)(1)(G) or 12(d)(1)(J) of the 1940 Act.
Unless otherwise indicated, if a percentage limitation on investment or utilization of assets as set forth above is adhered to at the time an investment is made, a later change in percentage resulting from changes in the value or total cost of an Acquiring Fund's assets will not be considered a violation of the restriction, and the sale of securities will not be required. The foregoing does not apply to borrowings or investments in illiquid securities.
Pursuant to an order from the Commission, each Acquiring Fund may enter into interfund lending arrangements. Interfund loans and borrowings permit the Acquiring Funds to lend money directly to and borrow from other portfolios of the Company for temporary purposes. Such loans and borrowings normally extend overnight but may have a maximum duration of seven days. The Acquiring Funds will borrow through the interfund lending facility only when the costs are lower than the costs of bank loans, and will lend through the facility only when the returns are higher than those available from an investment in repurchase agreements. In addition, the Acquiring Funds will borrow and lend money through interfund lending arrangements only if, and to the extent that, such practice is consistent with the their investment objectives and other investments. Any delay in repayment to an Acquiring Fund could result in a lost investment opportunity or additional borrowing costs.
ADDITIONAL INFORMATION ABOUT THE ACQUIRING FUNDS AND THE ACQUIRED FUNDS
General
For a discussion of the organization and operation of each Acquiring Fund, see "Portfolio Summary" and "Fund Management" in the Acquiring Funds' Prospectuses attached hereto as Exhibit B. For a discussion of the organization and operation of the Company, see "General Information—Fund History" in the Statements of Additional Information relating to each Acquiring Fund.
For a discussion of the organization and operation of each Acquired Fund, see "Fund Summary" and "Fund Details—Fund Management" in their respective prospectuses. For a discussion of the organization and operation of each of Mid Cap Growth and Global Strategist, see "Fund History" in each Acquired Fund's Statement of Additional Information.
Rights of Acquired Fund Shareholders and Acquiring Fund Shareholders
Each Acquiring Fund is organized as a separate series of shares of common stock of the Company, a Pennsylvania business trust that is governed by its Amended and Restated Declaration of Trust, its Amended and
30
Restated By-laws and Pennsylvania law. Each Acquired Fund is organized as a Massachusetts business trust that is governed by its Declaration of Trust, as amended, its Amended and Restated By-laws and Massachusetts law.
While Pennsylvania corporate law contains many provisions specifically applicable to management investment companies and Massachusetts statutory trust law is specifically drafted to accommodate some of the unique corporate governance needs of management investment companies, certain statutory differences do exist and the Funds' organizational documents contain certain differences summarized below. Each Fund is subject to federal securities laws, including the 1940 Act and the rules and regulations promulgated by the Commission thereunder, and applicable state securities laws.
Consistent with Pennsylvania law, the Company has authorized the issuance of an unlimited number of shares. Consistent with Massachusetts law, the Acquired Funds are authorized to issue an unlimited number of shares. The Acquired Funds' and the Company's organizational documents allow the respective Board of Trustees to create one or more separate investment portfolios and to establish a separate series of shares for each portfolio and to further subdivide the shares of a series into one or more classes.
Under Massachusetts law, shareholders of a business trust may, under certain limited circumstances, be held personally liable as partners for the obligations of an Acquired Fund. However, the Declaration of Trust of each Acquired Fund contains an express disclaimer of shareholder liability for acts or obligations of the Acquired Fund, requires that notice of such Acquired Fund obligations include such disclaimer, and provides for indemnification out of the Acquired Fund's property for any shareholder held personally liable for the obligations of the Acquired Fund.
No Fund is required, and no Fund anticipates, holding annual meetings of its Shareholders. Each Fund has certain mechanics whereby Shareholders can call a special meeting of their Fund. Shareholders generally have the right to approve investment advisory agreements, elect trustees, change fundamental investment policies, ratify the selection of independent auditors and vote on other matters required by law or the applicable Fund's organizational documents or deemed desirable by their Boards.
The business of each of the Acquiring Funds and the Acquired Funds is supervised by the respective Boards of the Acquired Funds and the Company. Each respective Board of the Acquired Funds consists of the same members; and similarly, the Board of the Company consists of the same members. The responsibilities, powers and fiduciary duties of trustees under Pennsylvania law are generally similar in certain respects to those for trustees under Massachusetts law, although significant differences do exist and shareholders should refer to the provisions of each Fund's applicable organizational documents and applicable law for a more thorough comparison. For the Acquiring Funds and the Acquired Funds, trustee vacancies may be filled by approval of a majority of the trustees then in office subject to provisions of the 1940 Act. A trustee's term lasts until the election of such person's successor or until such person's earlier resignation or removal. In addition, the Acquired Funds' Declarations of Trust specify that a Trustee's term will terminate in the event of the death, bankruptcy, adjudicated incompetence or other incapacity to perform the duties of the office of a Trustee. Trustees of the Acquired Funds may be removed with or without cause by the action of two-thirds of the remaining Trustees or, with respect to Global Strategist, by the action of the shareholders of record of not less than two-thirds of the shares outstanding.
The foregoing is only a summary of certain differences between the Acquiring Funds and the Acquired Funds under applicable law. It is not intended to be a complete list of differences and Shareholders should refer to the provisions of each Fund's applicable organizational documents for a more thorough comparison. Such documents are filed as part of each Fund's registration statements with the Commission, and Shareholders may obtain copies of such documents as described herein.
Financial Information
For certain financial information about each Fund, see "Financial Highlights" with respect to such Fund in its Prospectus.
31
Shareholder Proposals
The Funds are not required and do not intend to hold regular shareholder meetings unless shareholder action is required in accordance with the 1940 Act. Shareholders who would like to submit proposals for consideration at future shareholder meetings of either an Acquired Fund (in the event the applicable Reorganization is not completed) or an Acquiring Fund should send written proposals to Mary E. Mullin, Secretary, 522 Fifth Avenue, New York, NY 10036. To be considered for presentation at a shareholders' meeting, rules promulgated by the Commission require that, among other things, a shareholder's proposal must be received at the offices of the applicable Fund within a reasonable time before a solicitation is made. Timely submission of a proposal does not necessarily mean that such proposal will be included.
Management
For information about the Board of Trustees, MSIM and the distributor of each Acquiring Fund, see "Fund Management—Adviser" in the Acquiring Funds' Prospectuses attached hereto as Exhibit B and "Management of the Fund" in the Company's Statements of Additional Information.
For information about the Board, MSIM and the distributor of each Acquired Fund, see "Fund Details—Fund Management" in their Prospectus and "Management of the Fund" in each Acquired Fund's Statement of Additional Information.
Description of Shares and Shareholder Inquiries
For a description of the nature and most significant attributes of shares of each Acquiring Fund, and information regarding Shareholder inquiries, see "General Information" in the Company's Statement of Additional Information as well as "General Shareholder Information" and "Where to Find Additional Information" in the Acquiring Funds' Prospectuses attached hereto as Exhibit B.
For a description of the nature and most significant attributes of shares of each Acquired Fund, and information regarding Shareholder inquiries, see "Capital Stock and Other Securities" in each Acquired Fund's Statement of Additional Information as well as "Shareholder Information—Additional Information" in each Acquired Fund's prospectus.
Dividends, Distributions and Taxes
For a discussion of each Acquiring Fund's policies with respect to dividends, distributions and taxes, see "General Shareholder Information—Tax Considerations" and "General Shareholder Information—Dividends and Distributions" in their Prospectus, "Tax Considerations" in the Company's Statements of Additional Information, and the discussions herein under "Synopsis—Comparison of each Acquired Fund and Acquiring Fund—Dividends," "Synopsis—Tax Consequences of the Reorganizations" and "The Reorganizations—Tax Aspects of the Reorganizations."
For a discussion of each Acquired Fund's policies with respect to dividends, distributions and taxes, see "Shareholder Information—Distributions" and "Shareholder Information Tax Consequences" in their Prospectus, "Taxation of the Fund and Shareholders" in each Acquired Fund's Statement of Additional Information, and the discussions herein under "Synopsis—Comparison of each Acquired Fund and Acquiring Fund—Dividends," "Synopsis—Tax Consequences of the Reorganizations" and "The Reorganization—Tax Aspects of the Reorganizations."
Purchases, Exchanges and Redemptions
For a discussion of how each Acquiring Fund's shares may be purchased, exchanged and redeemed, see "Purchasing Class I, Class P and Class L Shares," "Purchasing Class H Shares," "Redeeming Shares" and "General Shareholder Information—Exchange Privileges" in the Acquiring Funds' Prospectuses, "Purchase of Shares" and "Redemption of Shares" in the Company's Statements of Additional Information, and the discussion herein under "Synopsis—Comparison of each Acquired Fund and Acquiring Fund—Purchases, Exchanges and Redemptions."
For a discussion of how each Acquired Fund's shares may be purchased, exchanged and redeemed, see "Shareholder Information—How to Buy Shares; How to Exchange Shares; and How to Sell Shares" in their
32
Prospectus and "Purchase, Redemption and Pricing of Shares" in each Acquired Fund's Statement of Additional Information, and the discussion herein under "Synopsis—Comparison of each Acquired Fund and Acquiring Fund—Purchases, Exchanges and Redemptions."
For a discussion of each Acquiring Fund's policies with respect to frequent purchases and redemptions, see "Shareholder Information—Frequent Purchases and Redemptions of Shares" in their Prospectus attached hereto in Exhibit B.
For a discussion of each Acquired Fund's policies with respect to frequent purchases and redemptions, see "Shareholder Information—Frequent Purchases and Redemptions of Fund Shares" in their Prospectus.
SHARE INFORMATION
The following persons were known to own of record or beneficially 5% or more of the outstanding shares of a class of Mid Cap Growth as of the Record Date:
| Shareholder | Percentage of Outstanding Shares | ||||||
| Class A | |||||||
| MORGAN STANLEY & CO HARBORSIDE FINANCIAL CENTER PLAZA II 3RD FLOOR JERSEY CITY NJ 07311 | 49.3236 | % | |||||
| CHARLES SCHWAB & CO INC SPECIAL CUSTODY ACCT FOR EXCLUSIVE BENEFIT OF CUSTOMERS 101 MONTGOMERY ST SAN FRANCISCO CA 94104-4151 | 10.8758 | % | |||||
| STATE STREET BANK AND TRUST CO FBO ADP/MORGAN STANLEY ALLIANCE 105 ROSEMONT AVENUE WESTWOOD MA 02090-2318 | 9.5186 | % | |||||
| Class B | |||||||
| MORGAN STANLEY & CO HARBORSIDE FINANCIAL CENTER PLAZA II 3RD FLOOR JERSEY CITY NJ 07311 | 51.5991 | % | |||||
| MERRILL LYNCH PIERCE FENNER & SMITH INC FOR THE SOLE BENEFIT IF ITS CUSTOMERS 4800 DEER LAKE DRIVE EAST JACKSONVILLE FL 32246-6484 | 8.2374 | % | |||||
| FIRST CLEARING, LLC SPECIAL CUSTODY ACCT FOR THE EXCLUSIVE BENEFIT OF CUSTOMER 2801 MARKET ST SAINT LOUIS MO 63103-2523 | 7.4640 | % | |||||
| Class C | |||||||
| MORGAN STANLEY & CO HARBORSIDE FINANCIAL CENTER PLAZA II 3RD FLOOR JERSEY CITY NJ 07311 | 66.5919 | % | |||||
33
| Shareholder | Percentage of Outstanding Shares | ||||||
| FIRST CLEARING, LLC SPECIAL CUSTODY ACCT FOR THE EXCLUSIVE BENEFIT OF CUSTOMER 2801 MARKET ST SAINT LOUIS MO 63103-2523 | 9.8994 | % | |||||
| Class I | |||||||
| MORGAN STANLEY & CO HARBORSIDE FINANCIAL CENTER PLAZA II 3RD FLOOR JERSEY CITY NJ 07311 | 62.1447 | % | |||||
| FIRST CLEARING, LLC SPECIAL CUSTODY ACCT FOR THE EXCLUSIVE BENEFIT OF CUSTOMER 2801 MARKET ST SAINT LOUIS MO 63103-2523 | 16.4259 | % | |||||
| STATE STREET BANK AND TRUST CO FBO ADP/MORGAN STANLEY ALLIANCE 105 ROSEMONT AVENUE WESTWOOD MA 02090-2318 | 6.5335 | % | |||||
As of the Record Date, the trustees and officers of Mid Cap Growth, as a group, owned less than 1% of the outstanding shares of Mid Cap Growth.
The following persons were known to own of record or beneficially 5% or more of the outstanding shares of a class of Global Strategist as of the Record Date:
| Shareholder | Percentage of Outstanding Shares | ||||||
| Class A | |||||||
| MORGAN STANLEY & CO HARBORSIDE FINANCIAL CENTER PLAZA II 3RD FLOOR JERSEY CITY NJ 07311 | 77.6335 | % | |||||
| Class B | |||||||
| MORGAN STANLEY & CO HARBORSIDE FINANCIAL CENTER PLAZA II 3RD FLOOR JERSEY CITY NJ 07311 | 71.2673 | % | |||||
| Class C | |||||||
| MORGAN STANLEY & CO HARBORSIDE FINANCIAL CENTER PLAZA II 3RD FLOOR JERSEY CITY NJ 07311 | 81.3937 | % | |||||
| Class I | |||||||
| MORGAN STANLEY & CO HARBORSIDE FINANCIAL CENTER PLAZA II 3RD FLOOR JERSEY CITY NJ 07311 | 49.3552 | % | |||||
34
| Shareholder | Percentage of Outstanding Shares | ||||||
| MORGAN STANLEY & CO FBO THE ASCAP FOUNDATION COMPOSERS AUTHORS & PUBLISHERS FOUNDATION ASCAP BUILDING ONE LINCOLN PL NEW YORK NY 10023 | 31.7986 | % | |||||
| STATE STREET BANK AND TRUST CO FBO ADP/MORGAN STANLEY ALLIANCE 105 ROSEMONT AVENUE WESTWOOD MA 02090-2318 | 8.3304 | % | |||||
As of the Record Date, the trustees and officers of Global Strategist, as a group, owned less than 1% of the outstanding shares of Global Strategist.
The following persons were known to own of record or beneficially 5% or more of the outstanding shares of a class of MSIFT Mid Cap Growth as of the Record Date:
| Shareholder | Percentage of Outstanding Shares | ||||||
| Class I | |||||||
| FIDELITY INVESTMENTS INSTITUTIONAL OPERATIONS FIIOC AS AGENT FOR CERTAIN EE BENEFIT PLANS 100 MAGELLAN WAY KW1C COVINGTON KY 41015-1999 | 44.109 | % | |||||
| CHARLES SCHWAB & CO INC SPECIAL CUSTODY ACCOUNT FOR THE EXCLUSIVE BENEFIT OF CUSTOMERS ATTN MUTUAL FUNDS 101 MONTGOMERY ST SAN FRANCISCO CA 94104-4151 | 7.755 | % | |||||
| Class P | |||||||
| FIDELITY INVESTMENTS INSTITUTIONAL OPERATIONS FIIOC AS AGENT FOR CERTAIN EE BENEFIT PLANS 100 MAGELLAN WAY KW1C COVINGTON KY 41015-1999 | 43.713 | % | |||||
| NATIONAL FINCL SERVICES CORPORATION FOR EXCLUSIVE BNFT OF OUR CUST ATTN MUTUAL FUNDS DEPT 5TH FLOOR ONE WORLD FINANCIAL CENTER NEW YORK NY 10281-1003 | 15.532 | % | |||||
| CHARLES SCHWAB & CO INC ATTN MUTUAL FUNDS SPECIAL CUSTODY FBO CUSTOMERS 101 MONTGOMERY ST SAN FRANCISCO CA 94104-4151 | 7.977 | % | |||||
35
| Shareholder | Percentage of Outstanding Shares | ||||||
| WELLS FARGO BANK NA OMNIBUS ACCT FOR VARIOUS RET PLANS- 9777777726 NC 1151 1525 WEST WT HARRIS BLVD CHARLOTTE NC 28288-1076 | 5.436 | % | |||||
As of the Record Date, the Trustees and officers of MSIFT Mid Cap Growth, as a group, owned less than 1% of the outstanding shares of MSIFT Mid Cap Growth.
The following persons were known to own of record or beneficially 5% or more of the outstanding shares of a class of MSIFT Global Strategist as of the Record Date:
| Shareholder | Percentage of Outstanding Shares | ||||||
| Class I | |||||||
| KANO PROFIT SHARING PLAN ATTN RHOADS ZIMMERMAN PO BOX 110098 NASHVILLE TN 37222-0098 | 29.85 | % | |||||
| WELLS FARGO BANK NA FBO OMNIBUS ACCOUNT REINV/REINV XXXX1 PO BOX 1533 MINNEAPOLIS MN 55480-1533 | 29.752 | % | |||||
| PEOPLE'S LIGHT & THEATRE COMPANY ATTN GRACE GRILLET 39 CONESTOGA RD MALVERN PA 19355-1737 | 7.570 | % | |||||
| STATE STREET BK & TR CO CUST IRA A/C DONALD G BAKER 616 MORNING GLORY DR HANOVER PA 17331-7828 | 5.5590 | % | |||||
| Class P | |||||||
| FIDELITY INVESTMENTS INSTITUTIONAL OPERATIONS FIIOC AS AGENT FOR CERTAIN EE BENEFIT PLANS 100 MAGELLAN WAY KW1C COVINGTON KY 41015-1999 | 96.703 | % | |||||
As of the Record Date, the Trustees and officers of MSIFT Global Strategist, as a group, owned less than 1% of the outstanding shares of MSIFT Global Strategist.
FINANCIAL STATEMENTS AND EXPERTS
The financial statements of the Acquiring Funds, for the fiscal year ended September 30, 2011, and Mid Cap Growth and Global Strategist, for the fiscal years ended September 30, 2011 and July 31, 2011, respectively, that are incorporated by reference in the Statement of Additional Information relating to the Registration Statement on Form N-14 of which this Joint Proxy Statement and Prospectus forms a part, have been audited by Ernst & Young LLP, the Funds' independent registered public accounting firm (except that the financial information for the Acquired Funds for the fiscal years ended prior to 2011 was audited by the Acquired Funds' prior independent registered public accounting firm). The financial statements for Mid Cap Growth for the six-month period ended March 31, 2012, Global Strategist for the six-month period ended January 31, 2012 and the Acquiring Funds for the six-month
36
period ended March 31, 2012 have not been audited and are also incorporated by reference in the Statement of Additional Information relating to the Registration Statement on Form N-14 of which this Joint Proxy Statement and Prospectus forms a part. Each set of audited financial statements is incorporated herein by reference in reliance upon such reports given upon the authority of said independent registered public accounting firms as experts in accounting and auditing.
LEGAL MATTERS
Certain legal matters concerning the issuance of the Acquiring Fund Shares will be passed upon by Dechert LLP, New York, NY.
AVAILABLE INFORMATION
Additional information about each Fund is available, as applicable, in the following documents which are incorporated herein by reference: (i) MSIFT Mid Cap Growth's Prospectus dated January 31, 2012 (with respect to Class I shares), attached to this Joint Proxy Statement and Prospectus as Exhibit B, which Prospectus forms a part of Post-Effective Amendment No. 99 to the Company's Registration Statement on Form N-1A (File Nos. 2-89729; 811-03980); (ii) MSIFT Mid Cap Growth's Prospectuses dated April 30, 2012 (with respect to Class H and Class L shares), attached to this Joint Proxy Statement and Prospectus as Exhibit B, which Prospectus forms a part of Post-Effective Amendment No. 104 to the Company's Registration Statement on Form N-1A (File Nos. 2-89729; 811-03980); (iii) MSIFT Global Strategist's Prospectus dated July 16, 2012, attached to this Joint Proxy Statement and Prospectus as Exhibit B, which Prospectus forms a part of Post-Effective Amendment No. 107 to the Company's Registration Statement on Form N-1A (File Nos. 2-89729; 811-03980); (iv) Mid Cap Growth's Prospectus dated January 31, 2012, which Prospectus forms a part of Post-Effective Amendment No. 36 to Mid Cap Growth's Registration Statement on Form N-1A (File Nos. 2- 81151; 811-3639); (v) Global Strategist's Prospectus dated November 30, 2011, which Prospectus forms a part of Post-Effective Amendment No. 30 to Global Strategist's Registration Statement on Form N-1A (File Nos. 33-23669; 811-5634); (vi) the Company's Annual Report for its fiscal year ended September 30, 2011 with respect to the Acquiring Funds; (vii) the Company's Semi-Annual Report for the six-month period ended March 31, 2012 with respect to the Acquiring Funds; (viii) Mid Cap Growth's Annual Report for its fiscal year ended September 30, 2011; (ix) Mid Cap Growth's Semi-Annual Report for the six-month period ended March 31, 2012; (x) Global Strategist's Annual Report for its fiscal year ended July 31, 2011; and (xi) Global Strategist's Semi-Annual Report for the six-month period ended January 31, 2012.
Each Fund is subject to the informational requirements of the Securities Exchange Act of 1934, as amended, and in accordance therewith, files reports and other information with the Commission. Proxy materials, reports and other information about the Funds which are of public record can be viewed and copied at the Commission's Public Reference Room in Washington, D.C. Information about the Reference Room's operations may be obtained by calling the Commission at (202) 551-8090. Reports and other information about the Funds and the Company are available on the EDGAR Database on the Commission's Internet site (www.sec.gov) and copies of this information may be obtained, after paying a duplicating fee, by electronic request at the following E-mail address: publicinfo@sec.gov, or by writing the Public Reference Branch, Office of Consumer Affairs and Information Services, Securities and Exchange Commission, Washington, D.C. 20549-1520.
OTHER BUSINESS
Management of each Acquired Fund knows of no business other than the matters specified above which will be presented at the Meeting. Since matters not known at the time of the solicitation may come before the Meeting, the Proxy as solicited confers discretionary authority with respect to such matters as properly come before the Meeting, including any adjournment or adjournments thereof, and it is the intention of the persons named as attorneys-in-fact in the Proxy to vote this Proxy in accordance with their judgment on such matters.
By Order of the Board of Trustees,
Mary E. Mullin
Secretary
July 24, 2012
37
Exhibit A
FORM OF AGREEMENT AND PLAN OF REORGANIZATION
THIS AGREEMENT AND PLAN OF REORGANIZATION ("Agreement") is made as of June 28, 2012, by and between MORGAN STANLEY INSTITUTIONAL FUND TRUST (the "Company"), a Pennsylvania business trust, on behalf of ________________________ Portfolio ("Acquiring Fund"), and ________________________, a Massachusetts business trust ("Acquired Fund").
This Agreement is intended to be and is adopted as a "plan of reorganization" within the meaning of Treas. Reg. 1.368-2(g), for a reorganization under Section 368(a)(1) of the Internal Revenue Code of 1986, as amended (the "Code"). The reorganization ("Reorganization") will consist of the transfer to Acquiring Fund of substantially all of the assets of Acquired Fund in exchange for the assumption by Acquiring Fund of all stated liabilities of Acquired Fund and the issuance by Acquiring Fund of shares of beneficial interest, without par value (the "Acquiring Fund Shares"), to be distributed, after the Closing Date hereinafter referred to, to the shareholders of Acquired Fund in liquidation of Acquired Fund as provided herein, all upon the terms and conditions hereinafter set forth in this Agreement.
In consideration of the premises and of the covenants and agreements hereinafter set forth, the parties hereto covenant and agree as follows:
1. The Reorganization and Liquidation of Acquired Fund
1.1 Subject to the terms and conditions herein set forth and on the basis of the representations and warranties contained herein, Acquired Fund agrees to assign, deliver and otherwise transfer the Acquired Fund Assets (as defined in paragraph 1.2) to Acquiring Fund, and the Company, on behalf of Acquiring Fund, agrees in exchange therefor to assume all of Acquired Fund's stated liabilities on the Closing Date as set forth in paragraph 1.3 and to deliver to Acquired Fund the number of Acquiring Fund Shares, including fractional Acquiring Fund Shares, determined in the manner set forth in paragraph 2.3. Such transactions shall take place at the closing provided for in paragraph 3.1 ("Closing").
1.2 (a) The "Acquired Fund Assets" shall consist of all property, including without limitation, all cash, cash equivalents, securities and dividend and interest receivables owned by Acquired Fund, and any deferred or prepaid expenses shown as an asset on Acquired Fund's books on the Valuation Date.
(b) On or prior to the Valuation Date, Acquired Fund will provide Acquiring Fund with a list of all of Acquired Fund's assets to be assigned, delivered and otherwise transferred to Acquiring Fund and a list of the stated liabilities to be assumed by Acquiring Fund pursuant to this Agreement. Acquired Fund reserves the right to sell any of the securities on such list but will not, without the prior approval of the Company, on behalf of Acquiring Fund, acquire any additional securities other than securities of the type in which Acquiring Fund is permitted to invest and in amounts agreed to in writing by the Company, on behalf of Acquiring Fund. The Company, on behalf of Acquiring Fund, will, within a reasonable time prior to the Valuation Date, furnish Acquired Fund with a statement of Acquiring Fund's investment objective, policies and restrictions and a list of the securities, if any, on the list referred to in the first sentence of this paragraph that do not conform to Acquiring Fund's investment objective, policies and restrictions. In the event that Acquired Fund holds any investments that Acquiring Fund is not permitted to hold, Acquired Fund will dispose of such securities on or prior to the Valuation Date. In addition, if it is determined that the portfolios of Acquired Fund and Acquiring Fund, when aggregated, would contain investments exceeding certain percentage limitations imposed upon Acquiring Fund with respect to such investments, Acquired Fund if requested by the Company, on behalf of Acquiring Fund, will, on or prior to the Valuation Date, dispose of and/or reinvest a sufficient amount of such investments as may be necessary to avoid violating such limitations as of the Closing Date (as defined in paragraph 3.1).
1.3 Acquired Fund will endeavor to discharge all of Acquired Fund's liabilities and obligations on or prior to the Valuation Date. The Company, on behalf of Acquiring Fund, will assume all stated liabilities, which includes, without limitation, all expenses, costs, charges and reserves reflected on an unaudited Statement of Assets and
A-1
Liabilities of Acquired Fund prepared by the Treasurer of Acquired Fund as of the Valuation Date in accordance with generally accepted accounting principles consistently applied from the prior audited period.
1.4 In order for the Acquired Fund to comply with Section 852(a)(1) of the Code and to avoid having any investment company taxable income or net capital gain (as defined in Sections 852(b)(2) and 1222(11) of the Code, respectively) in the short taxable year ending with its dissolution, Acquired Fund will on or before the Valuation Date (a) declare a dividend in an amount large enough so that Acquired Fund will have declared dividends of substantially all of its investment company taxable income and net capital gain, if any, for such taxable year (determined without regard to any deduction for dividends paid) and (b) distribute such dividend.
1.5 On the Closing Date or as soon as practicable thereafter, Acquired Fund will distribute Acquiring Fund Shares received by Acquired Fund pursuant to paragraph 1.1 pro rata to Acquired Fund's shareholders of record determined as of the close of business on the Valuation Date ("Acquired Fund Shareholders"). Each Acquired Fund Shareholder will receive the class of shares of Acquiring Fund that corresponds to the class of shares of Acquired Fund currently held by that Acquired Fund shareholder. Accordingly, the Acquiring Fund Shares will be distributed as follows: each of the Class I shares of Acquiring Fund will be distributed to holders of Class I shares of Acquired Fund, each of the Class H shares of Acquiring Fund will be distributed to holders of Class A and Class B shares of Acquired Fund and each of the Class L shares of Acquiring Fund will be distributed to holders of Class C shares of Acquired Fund. Such distribution will be accomplished by an instruction, signed by Acquired Fund's Secretary, to transfer Acquiring Fund Shares then credited to Acquired Fund's account on the books of Acquiring Fund to open accounts on the books of Acquiring Fund in the names of the Acquired Fund shareholders and representing the respective pro rata number of Acquiring Fund Shares due such Acquired Fund shareholders. All issued and outstanding shares of Acquired Fund simultaneously will be canceled on Acquired Fund's books.
1.6 Ownership of Acquiring Fund Shares will be shown on the books of Acquiring Fund's transfer agent. Acquiring Fund Shares will be issued in the manner described in Acquiring Fund's current Prospectus, as supplemented, and the Company's Statement of Additional Information.
1.7 Any transfer taxes payable upon issuance of Acquiring Fund Shares in a name other than the registered holder of Acquiring Fund Shares on Acquired Fund's books as of the close of business on the Valuation Date shall, as a condition of such issuance and transfer, be paid by the person to whom Acquiring Fund Shares are to be issued and transferred.
1.8 Any reporting responsibility of Acquired Fund is and shall remain the responsibility of Acquired Fund up to and including the date on which Acquired Fund is dissolved and terminated pursuant to paragraph 1.9.
1.9 Within one year after the Closing Date, Acquired Fund shall pay or make provision for the payment of all Acquired Fund's liabilities and taxes. If and to the extent that any trust, escrow account, or other similar entity continues after the close of such one-year period in connection either with making provision for payment of liabilities or taxes or with distributions to shareholders of Acquired Fund, such entity shall either (i) qualify as a liquidating trust under Section 7701 of the Code (and applicable Treasury Regulations thereunder) or other entity which does not constitute a continuation of Acquired Fund for federal income tax purposes, or (ii) be subject to a waiver under Section 368(a)(2)(G)(ii) of the complete distribution requirement of Section 368(a)(2)(G)(i) of the Code. Acquired Fund shall be terminated following the making of all distributions pursuant to paragraph 1.5.
1.10 Copies of all books and records maintained on behalf of Acquired Fund in connection with its obligations under the Investment Company Act of 1940, as amended (the "1940 Act"), the Code, state blue sky laws or otherwise in connection with this Agreement will promptly be delivered after the Closing to officers of Acquiring Fund or their designee, and Acquiring Fund or its designee shall comply with applicable record retention requirements to which Acquired Fund is subject under the 1940 Act.
A-2
2. Valuation
2.1 The value of the Acquired Fund Assets shall be the value of such assets computed as of 4:00 p.m. on the New York Stock Exchange on the third business day following the receipt of the requisite approval of this Agreement by shareholders of Acquired Fund or at such time on such earlier or later date after such approval as may be mutually agreed upon in writing (such time and date being hereinafter called the "Valuation Date"), using the valuation procedures set forth in Acquiring Fund's then current Prospectus, as supplemented, and the Company's Statement of Additional Information.
2.2 The net asset value of an Acquiring Fund Share shall be the net asset value per share computed on the Valuation Date, using the valuation procedures set forth in Acquiring Fund's then current Prospectus, as supplemented, and the Company's Statement of Additional Information.
2.3 The number of Acquiring Fund Shares (including fractional shares, if any) to be issued hereunder shall be determined, with respect to each class, by dividing the aggregate net asset value of each class of Acquired Fund shares (determined in accordance with paragraph 2.1) by the net asset value per share of the corresponding class of shares of Acquiring Fund (determined in accordance with paragraph 2.2).
2.4 All computations of value shall be made by Morgan Stanley Services Company Inc. ("Morgan Stanley Services") in accordance with its regular practice in pricing Acquiring Fund. The Company, on behalf of Acquiring Fund, shall cause Morgan Stanley Services to deliver a copy of Acquiring Fund's valuation report at the Closing.
3. Closing and Closing Date
3.1 The Closing shall take place on the Valuation Date or on the next business day following the Valuation Date (the "Closing Date"). The Closing shall be held as of 9:00 a.m. Eastern time, or at such other time as the parties may agree. The Closing shall be held in a location mutually agreeable to the parties hereto. All acts taking place at the Closing shall be deemed to take place simultaneously as of 9:00 a.m. Eastern time on the Closing Date unless otherwise provided.
3.2 Portfolio securities held by Acquired Fund and represented by a certificate or other written instrument shall be presented by it or on its behalf to State Street Bank and Trust Company (the "Custodian"), as custodian for Acquiring Fund, for examination no later than five business days preceding the Valuation Date. Such portfolio securities (together with any cash or other assets) shall be delivered by Acquired Fund to the Custodian for the account of Acquiring Fund on or before the Closing Date in conformity with applicable custody provisions under the 1940 Act and duly endorsed in proper form for transfer in such condition as to constitute good delivery thereof in accordance with the custom of brokers. The portfolio securities shall be accompanied by all necessary federal and state stock transfer stamps or a check for the appropriate purchase price of such stamps. Portfolio securities and instruments deposited with a securities depository (as defined in Rule 17f-4 under the 1940 Act) shall be delivered on or before the Closing Date by book-entry in accordance with customary practices of such depository and the Custodian. The cash delivered shall be in the form of a Federal Funds wire, payable to the order of "State Street Bank and Trust Company, Custodian for Morgan Stanley Institutional Fund, Inc."
3.3 In the event that on the Valuation Date, (a) the New York Stock Exchange shall be closed to trading or trading thereon shall be restricted or (b) trading or the reporting of trading on such Exchange or elsewhere shall be disrupted so that, in the judgment of both the Company, on behalf of Acquiring Fund, and Acquired Fund accurate appraisal of the value of the net assets of Acquiring Fund or the Acquired Fund Assets is impracticable, the Valuation Date shall be postponed until the first business day after the day when trading shall have been fully resumed without restriction or disruption and reporting shall have been restored.
3.4 If requested, Acquired Fund shall deliver to the Company, on behalf of Acquiring Fund, or its designee (a) at the Closing, a list, certified by Acquired Fund's Secretary, of the names, addresses and taxpayer identification numbers of the Acquired Fund shareholders and the number and percentage ownership of outstanding Acquired Fund shares owned by each such Acquired Fund shareholder, all as of the Valuation Date, and (b) as soon as practicable after the Closing, all original documentation (including Internal Revenue Service forms, certificates, certifications and correspondence) relating to the Acquired Fund shareholders' taxpayer identification numbers and
A-3
their liability for or exemption from back-up withholding. The Company, on behalf of Acquiring Fund, shall issue and deliver to such Secretary a confirmation evidencing delivery of Acquiring Fund Shares to be credited on the Closing Date to Acquired Fund or provide evidence satisfactory to Acquired Fund that such Acquiring Fund Shares have been credited to Acquired Fund's account on the books of Acquiring Fund. At the Closing, each party shall deliver to the other such bills of sale, checks, assignments, share certificates, if any, receipts or other documents as such other party or its counsel may reasonably request.
4. Covenants of Acquiring Fund and Acquired Fund
4.1 Except as otherwise expressly provided herein, the Acquired Fund and the Company, on behalf of Acquiring Fund, will operate in the ordinary course between the date hereof and the Closing Date, it being understood that such ordinary course of business will include customary dividends and other distributions.
4.2 The Company will prepare and file with the Securities and Exchange Commission ("Commission") a registration statement on Form N-14 under the Securities Act of 1933, as amended ("1933 Act"), relating to Acquiring Fund Shares ("Registration Statement"). Acquired Fund, will provide the Proxy Materials as described in paragraph 4.3 below for inclusion in the Registration Statement. The Company, on behalf of the Acquiring Fund, and the Acquired Fund agree that each of Acquired Fund and Acquiring Fund will further provide such other information and documents as are reasonably necessary for the preparation of the Registration Statement.
4.3 Acquired Fund will call a meeting of Acquired Fund's shareholders to consider and act upon this Agreement and to take all other action necessary to obtain approval of the transactions contemplated herein. Acquired Fund will prepare the notice of meeting, form of proxy and proxy statement (collectively, "Proxy Materials") to be used in connection with such meeting; provided that the Company, on behalf of Acquiring Fund, will furnish Acquired Fund with its currently effective prospectus for inclusion in the Proxy Materials and with such other information relating to Acquiring Fund as is reasonably necessary for the preparation of the Proxy Materials.
4.4 Acquired Fund will assist Acquiring Fund in obtaining such information as Acquiring Fund reasonably requests concerning the beneficial ownership of Acquired Fund shares.
4.5 Subject to the provisions of this Agreement, the Company, on behalf of the Acquiring Fund, and the Acquired Fund agree that each respective Fund will take, or cause to be taken, all action, and do or cause to be done, all things reasonably necessary, proper or advisable to consummate and make effective the transactions contemplated by this Agreement.
4.6 Acquired Fund, shall furnish or cause to be furnished to Acquiring Fund within 30 days after the Closing Date a statement of Acquired Fund's assets and liabilities as of the Closing Date, which statement shall be certified by the Acquired Fund's Treasurer and shall be in accordance with generally accepted accounting principles consistently applied. As promptly as practicable, but in any case within 60 days after the Closing Date, Acquired Fund shall furnish Acquiring Fund, in such form as is reasonably satisfactory to Acquiring Fund, a statement certified by the Acquired Fund's Treasurer of Acquired Fund's earnings and profits for federal income tax purposes that will be carried over to Acquiring Fund pursuant to Section 381 of the Code.
4.7 As soon after the Closing Date as is reasonably practicable, the Company (a) shall prepare and file all federal and other tax returns and reports of Acquired Fund required by law to be filed with respect to all periods ending on or before the Closing Date but not theretofore filed and (b) shall pay all federal and other taxes shown as due thereon and/or all federal and other taxes that were unpaid as of the Closing Date, including without limitation, all taxes for which the provision for payment was made as of the Closing Date (as represented in paragraph 5.2(k)).
4.8 The Company agrees to use all reasonable efforts to obtain the approvals and authorizations required by the 1933 Act and the 1940 Act and to make such filings required by the state Blue Sky and securities laws as it may deem appropriate in order to continue the Acquiring Fund's operations after the Closing Date.
A-4
5. Representations and Warranties
5.1 The Company, on behalf of Acquiring Fund, represents and warrants to Acquired Fund, as follows:
(a) Acquiring Fund is a series of the Company, a validly existing Pennsylvania business trust with full power to carry on its business as presently conducted;
(b) The Company is a duly registered, open-end management investment company, and its registration with the Commission as an investment company under the 1940 Act and the registration of its shares under the 1933 Act are in full force and effect;
(c) All of the issued and outstanding shares of Acquiring Fund have been offered and sold in compliance in all material respects with applicable registration requirements of the 1933 Act and state securities laws. Shares of Acquiring Fund are registered in all jurisdictions in which they are required to be registered under state securities laws and other laws, and said registrations, including any periodic reports or supplemental filings, are complete and current, all fees required to be paid have been paid, and Acquiring Fund is not subject to any stop order and is fully qualified to sell its shares in each state in which its shares have been registered;
(d) The current Prospectus of the Acquiring Fund and Statement of Additional Information of the Company conform in all material respects to the applicable requirements of the 1933 Act and the 1940 Act and the regulations thereunder and do not include any untrue statement of a material fact or omit to state any material fact required to be stated therein or necessary to make the statements therein, in light of the circumstances under which they were made, not misleading;
(e) The Company is not in, and the execution, delivery and performance of this Agreement will not result in a, material violation of any provision of its Amended and Restated Agreement and Declaration of Trust or By-Laws, each as amended, or of any agreement, indenture, instrument, contract, lease or other undertaking to which Acquiring Fund is a party or by which it is bound;
(f) No litigation or administrative proceeding or investigation of or before any court or governmental body is presently pending or, to its knowledge, threatened against the Company, Acquiring Fund or any of their properties or assets which, if adversely determined, would materially and adversely affect Acquiring Fund's financial condition or the conduct of its business; and the Company knows of no facts that might form the basis for the institution of such proceedings and is not a party to or subject to the provisions of any order, decree or judgment of any court or governmental body which materially and adversely affects, or is reasonably likely to materially and adversely affect, its business or its ability to consummate the transactions herein contemplated;
(g) The Statement of Assets and Liabilities, Statement of Operations, Statements of Changes in Net Assets and Financial Highlights for its last completed fiscal year, audited by Ernst & Young LLP (copies of which will be furnished to Acquired Fund), fairly present, in all material respects, Acquiring Fund's financial condition as of such date in accordance with generally accepted accounting principles, and its results of such operations, changes in its net assets and financial highlights for such period, and as of such date there will be no known liabilities of Acquiring Fund (contingent or otherwise) not disclosed therein that would be required in accordance with generally accepted accounting principles to be disclosed therein;
(h) All issued and outstanding Acquiring Fund Shares are, and at the Closing Date will be, duly and validly issued and outstanding, fully paid and non-assessable with no personal liability attaching to the ownership thereof. Acquiring Fund does not have outstanding any options, warrants or other rights to subscribe for or purchase any of its shares;
(i) The execution, delivery and performance of this Agreement have been duly authorized by all necessary action on the part of the Company, and this Agreement constitutes a valid and binding obligation of Acquiring Fund enforceable in accordance with its terms, subject as to enforcement, to bankruptcy, insolvency, reorganization, moratorium and other laws relating to or affecting creditors' rights and to general equity principles. No other consents, authorizations or approvals are necessary in connection with Acquiring Fund's performance of this Agreement;
A-5
(j) Acquiring Fund Shares to be issued and delivered to Acquired Fund, for the account of the Acquired Fund shareholders, pursuant to the terms of this Agreement will at the Closing Date have been duly authorized and, when so issued and delivered, will be duly and validly issued Acquiring Fund Shares, and will be fully paid and non-assessable with no personal liability attaching to the ownership thereof;
(k) All material federal and other tax returns and reports of Acquiring Fund required by law to be filed on or before the Closing Date have been filed and are correct, and all federal and other taxes shown as due or required to be shown as due on said returns and reports have been paid or provision has been made for the payment thereof, and to the best of the Company's knowledge, no such return is currently under audit and no assessment has been asserted with respect to any such return;
(l) For each taxable year since its inception, Acquiring Fund has met the requirements of Subchapter M of the Code for qualification and treatment as a "regulated investment company" and neither the execution or delivery of nor the performance of the Company's obligations with respect to Acquiring Fund under this Agreement will adversely affect, and no other events are reasonably likely to occur which will adversely affect, the ability of Acquiring Fund to continue to meet the requirements of Subchapter M of the Code;
(m) Since October 31, 2011, there has been no change by Acquiring Fund in accounting methods, principles, or practices, including those required by generally accepted accounting principles;
(n) The information furnished or to be furnished by the Company on behalf of Acquiring Fund for use in registration statements, proxy materials and other documents which may be necessary in connection with the transactions contemplated hereby shall be accurate and complete in all material respects and shall comply in all material respects with federal securities and other laws and regulations applicable thereto; and
(o) The Proxy Materials to be included in the Registration Statement (only insofar as they relate to Acquiring Fund) will, on the effective date of the Registration Statement and on the Closing Date, not contain any untrue statement of a material fact or omit to state a material fact required to be stated therein or necessary to make the statements therein, in light of the circumstances under which such statements were made, not materially misleading.
5.2 Acquired Fund represents and warrants to the Company, on behalf of Acquiring Fund as follows:
(a) Acquired Fund is a validly existing Massachusetts business trust with full power to carry on its business as presently conducted;
(b) Acquired Fund is a duly registered, open-end management investment company, and its registration with the Commission as an investment company under the 1940 Act and the registration of its shares under the 1933 Act are in full force and effect;
(c) All of the issued and outstanding shares of Acquired Fund have been offered and sold in compliance in all material respects with applicable requirements of the 1933 Act and state securities laws. Shares of Acquired Fund are registered in all jurisdictions in which they are required to be registered and said registrations, including any periodic reports or supplemental filings, are complete and current, all fees required to be paid have been paid, and Acquired Fund is not subject to any stop order and is fully qualified to sell its shares in each state in which its shares have been registered;
(d) The current Prospectus, as supplemented, of Acquired Fund and Statement of Additional Information of Acquired Fund conform in all material respects to the applicable requirements of the 1933 Act and the 1940 Act and the regulations thereunder and do not include any untrue statement of a material fact or omit to state any material fact required to be stated therein or necessary to make the statements therein, in light of the circumstances under which they were made, not misleading;
(e) Acquired Fund is not in, and the execution, delivery and performance of this Agreement will not result in a, material violation of any provision of its Declaration of Trust or By-Laws, each as amended, or of any agreement, indenture, instrument, contract, lease or other undertaking to which Acquired Fund is a party or by which it is bound;
A-6
(f) No litigation or administrative proceeding or investigation of or before any court or governmental body is presently pending or, to its knowledge, threatened against Acquired Fund or any of its properties or assets which, if adversely determined, would materially and adversely affect Acquired Fund's financial condition or the conduct of its business; and Acquired Fund knows of no facts that might form the basis for the institution of such proceedings and is not a party to or subject to the provisions of any order, decree or judgment of any court or governmental body which materially and adversely affects, or is reasonably likely to materially and adversely affect, its business or its ability to consummate the transactions herein contemplated;
(g) The Statement of Assets and Liabilities, Statement of Operations, Statement of Changes in Net Assets and Financial Highlights of Acquired Fund for its last completed fiscal year, audited by Ernst & Young LLP (except that the financial information for the Acquired Funds for the fiscal years ended prior to 2011 was audited by the Acquired Funds' prior independent registered public accounting firm) (copies of which have been or will be furnished to Acquiring Fund) fairly present, in all material respects, Acquired Fund's financial condition as of such date, and its results of operations, changes in its net assets and financial highlights for such period in accordance with generally accepted accounting principles, and as of such date there were no known liabilities of Acquired Fund (contingent or otherwise) not disclosed therein that would be required in accordance with generally accepted accounting principles to be disclosed therein;
(h) Acquired Fund has no material contracts or other commitments (other than this Agreement) that will be terminated with liability to it prior to the Closing Date;
(i) All issued and outstanding shares of Acquired Fund are, and at the Closing Date will be, duly and validly issued and outstanding, fully paid and non-assessable with no personal liability attaching to the ownership thereof. Acquired Fund does not have outstanding any options, warrants or other rights to subscribe for or purchase any of its shares, nor is there outstanding any security convertible to any of its shares. All such shares will, at the time of Closing, be held by the persons and in the amounts set forth in the list of shareholders submitted to Acquiring Fund pursuant to paragraph 3.4;
(j) The execution, delivery and performance of this Agreement will have been duly authorized prior to the Closing Date by all necessary action on the part of Acquired Fund, and subject to the approval of Acquired Fund's shareholders, this Agreement constitutes a valid and binding obligation of Acquired Fund, enforceable in accordance with its terms, subject as to enforcement to bankruptcy, insolvency, reorganization, moratorium and other laws relating to or affecting creditors' rights and to general equity principles. No other consents, authorizations or approvals are necessary in connection with Acquired Fund's performance of this Agreement;
(k) All material federal and other tax returns and reports of Acquired Fund required by law to be filed on or before the Closing Date shall have been filed and are correct and all federal and other taxes shown as due or required to be shown as due on said returns and reports have been paid or provision has been made for the payment thereof, and to the best of Acquired Fund's knowledge, no such return is currently under audit and no assessment has been asserted with respect to any such return;
(l) For each taxable year since its inception, Acquired Fund has met all the requirements of Subchapter M of the Code for qualification and treatment as a "regulated investment company" and neither the execution or delivery of nor the performance of Acquired Fund's obligations under this Agreement will adversely affect, and no other events are reasonably likely to occur which will adversely affect, the ability of Acquired Fund to continue to meet the requirements of Subchapter M of the Code for its final taxable year ending on the Closing Date;
(m) At the Closing Date, Acquired Fund will have good and valid title to the Acquired Fund Assets, subject to no liens (other than the obligation, if any, to pay the purchase price of portfolio securities purchased by Acquired Fund which have not settled prior to the Closing Date), security interests or other encumbrances, and full right, power and authority to assign, deliver and otherwise transfer such assets hereunder, and upon delivery and payment for such assets, the Company, on behalf of Acquiring Fund, will acquire good and marketable title thereto, subject to no restrictions on the full transfer thereof, including any restrictions as might arise under the 1933 Act;
A-7
(n) On the effective date of the Registration Statement, at the time of the meeting of Acquired Fund's shareholders and on the Closing Date, the Proxy Materials (exclusive of the currently effective Acquiring Fund Prospectus contained therein) will (i) comply in all material respects with the provisions of the 1933 Act, the Securities Exchange Act of 1934, as amended ("1934 Act"), and the 1940 Act and the regulations thereunder and (ii) not contain any untrue statement of a material fact or omit to state a material fact required to be stated therein or necessary to make the statements therein not misleading. Any other information furnished by Acquired Fund for use in the Registration Statement or in any other manner that may be necessary in connection with the transactions contemplated hereby shall be accurate and complete and shall comply in all material respects with applicable federal securities and other laws and regulations thereunder;
(o) Acquired Fund will, on or prior to the Valuation Date, declare one or more dividends or other distributions to shareholders that, together with all previous dividends and other distributions to shareholders, shall have the effect of distributing to the shareholders all of its investment company taxable income and net capital gain, if any, through the Valuation Date (computed without regard to any deduction for dividends paid);
(p) Acquired Fund has maintained or has caused to be maintained on its behalf all books and accounts as required of a registered investment company in compliance with the requirements of Section 31 of the 1940 Act and the rules thereunder; and
(q) Acquired Fund is not acquiring Acquiring Fund Shares to be issued hereunder for the purpose of making any distribution thereof other than in accordance with the terms of this Agreement.
6. Conditions Precedent to Obligations of Acquired Fund
The obligations of Acquired Fund to consummate the transactions provided for herein shall be subject, at its election, to the performance by the Company, on behalf of Acquiring Fund, of all the obligations to be performed by it hereunder on or before the Closing Date and, in addition thereto, the following conditions:
6.1 All representations and warranties of the Company made on behalf of Acquiring Fund contained in this Agreement shall be true and correct in all material respects as of the date hereof and, except as they may be affected by the transactions contemplated by this Agreement, as of the Closing Date with the same force and effect as if made on and as of the Closing Date;
6.2 The Company, on behalf of Acquiring Fund, shall have delivered to Acquired Fund a certificate of the Company's President and Treasurer, in a form reasonably satisfactory to Acquired Fund and dated as of the Closing Date, to the effect that the representations and warranties of the Company, on behalf of Acquiring Fund, made in this Agreement are true and correct at and as of the Closing Date, except as they may be affected by the transactions contemplated by this Agreement, and as to such other matters as Acquired Fund, shall reasonably request;
6.3 Acquired Fund, shall have received a favorable opinion from Dechert LLP, counsel to Acquiring Fund, dated as of the Closing Date, to the effect that:
(a) Acquiring Fund is a series of the Company, a validly existing Pennsylvania business trust, and has the power to own all of its properties and assets and to carry on its business as presently conducted; (b) the Company is a duly registered, open-end, management investment company, and its registration with the Commission as an investment company under the 1940 Act is in full force and effect; (c) this Agreement has been duly authorized, executed and delivered by the Company and, assuming that the Registration Statement complies with the 1933 Act, the 1934 Act and the 1940 Act and regulations thereunder and assuming due authorization, execution and delivery of this Agreement by Acquired Fund, is a valid and binding obligation of Acquiring Fund enforceable against Acquiring Fund in accordance with its terms, subject as to enforcement, to bankruptcy, insolvency, reorganization, moratorium and other laws relating to or affecting creditors' rights and to general equity principles; (d) Acquiring Fund Shares to be issued to Acquired Fund shareholders as provided by this Agreement are duly authorized and upon such delivery will be validly issued, fully paid and non-assessable, and no shareholder of Acquiring Fund has any preemptive rights to subscription or purchase in respect thereof; (e) the execution and delivery of this Agreement did not, and the consummation of the transactions contemplated hereby will not, violate the Company's Amended and Restated Agreement and Declaration of Trust or By-Laws, each as amended; and (f) to the knowledge of such counsel, no consent, approval, authorization or order of any court or governmental authority of the United States or
A-8
any state is required for the consummation by Acquiring Fund of the transactions contemplated herein, except such as have been obtained under the 1933 Act, the 1934 Act and the 1940 Act and such as may be required under state securities laws; and
6.4 As of the Closing Date, there shall have been no material change in the investment objective, policies and restrictions of Acquiring Fund or any increase in the investment management fees or annual fees pursuant to Acquiring Fund's shareholder services plan from those described in Acquiring Fund's Prospectuses dated January 31, 2011 with respect to Class I and Class P shares and April 30, 2012 with respect to Class H and Class L shares, each as may be supplemented, and the Company's Statements of Additional Information dated January 31, 2011 with respect to Class I and Class P shares and April 30, 2012 with respect to Class H and Class L shares, each as may be supplemented.
7. Conditions Precedent to Obligations of Acquiring Fund
The obligations of the Company, on behalf of Acquiring Fund, to complete the transactions provided for herein shall be subject, at its election, to the performance by Acquired Fund, of all the obligations to be performed by it hereunder on or before the Closing Date and, in addition thereto, the following conditions:
7.1 All representations and warranties of Acquired Fund contained in this Agreement shall be true and correct in all material respects as of the date hereof and, except as they may be affected by the transactions contemplated by this Agreement, as of the Closing Date with the same force and effect as if made on and as of the Closing Date;
7.2 Acquired Fund shall have delivered to Acquiring Fund at the Closing a certificate of Acquired Fund's President and its Treasurer, in form and substance satisfactory to Acquiring Fund and dated as of the Closing Date, to the effect that the representations and warranties of Acquired Fund, made in this Agreement are true and correct at and as of the Closing Date, except as they may be affected by the transactions contemplated by this Agreement, and as to such other matters as the Company, on behalf of Acquiring Fund, shall reasonably request;
7.3 Acquired Fund shall have delivered to Acquiring Fund a statement of the Acquired Fund Assets and its liabilities, together with a list of Acquired Fund's portfolio securities and other assets showing the respective adjusted bases and holding periods thereof for income tax purposes, as of the Closing Date, certified by the Treasurer of the Acquired Fund;
7.4 The Company, on behalf of Acquiring Fund, shall have received at the Closing a favorable opinion from Dechert LLP, counsel to Acquired Fund, dated as of the Closing Date to the effect that:
(a) Acquired Fund is a validly existing Massachusetts business trust, and has the power to own all of its properties and assets and to carry on its business as presently conducted; (b) Acquired Fund is a duly registered, open-end, management investment company under the 1940 Act, and its registration with the Commission as an investment company under the 1940 Act is in full force and effect; (c) this Agreement has been duly authorized, executed and delivered by Acquired Fund, and, assuming that the Registration Statement complies with the 1933 Act, the 1934 Act and the 1940 Act and the regulations thereunder and assuming due authorization, execution and delivery of this Agreement by the Company, on behalf of Acquiring Fund, is a valid and binding obligation of Acquired Fund enforceable against Acquired Fund in accordance with its terms, subject as to enforcement, to bankruptcy, insolvency, reorganization, moratorium and other laws relating to or affecting creditors' rights and to general equity principles; (d) the execution and delivery of this Agreement did not, and the consummation of the transactions contemplated hereby will not, violate Acquired Fund's Declaration of Trust or By-Laws, each as amended; and (e) to the knowledge of such counsel, no consent, approval, authorization or order of any court or governmental authority of the United States or any state is required for the consummation by Acquired Fund of the transactions contemplated herein, except such as have been obtained under the 1933 Act, the 1934 Act and the 1940 Act and such as may be required under state securities laws; and
A-9
7.5 On the Closing Date, the Acquired Fund Assets shall include no assets that the Acquiring Fund, by reason of limitations of the Acquired Fund's Declaration of Trust, as amended, or otherwise, may not properly acquire.
8. Further Conditions Precedent to Obligations of Acquiring Fund and Acquired Fund
The obligations of Acquired Fund and the Company, on behalf of Acquiring Fund, hereunder are each subject to the further conditions that on or before the Closing Date:
8.1 This Agreement and the transactions contemplated herein shall have been approved by the requisite vote of the holders of the outstanding shares of Acquired Fund in accordance with the provisions of Acquired Fund's Declaration of Trust, as amended, and certified copies of the resolutions evidencing such approval shall have been delivered to Acquiring Fund;
8.2 On the Closing Date, no action, suit or other proceeding shall be pending before any court or governmental agency in which it is sought to restrain or prohibit, or obtain damages or other relief in connection with, this Agreement or the transactions contemplated herein;
8.3 All consents of other parties and all other consents, orders and permits of federal, state and local regulatory authorities (including those of the Commission and of state Blue Sky and securities authorities, including "no-action" positions of and exemptive orders from such federal and state authorities) deemed necessary by the Company, on behalf of Acquiring Fund, or Acquired Fund to permit consummation, in all material respects, of the transactions contemplated herein shall have been obtained, except where failure to obtain any such consent, order or permit would not involve risk of a material adverse effect on the assets or properties of Acquiring Fund or Acquired Fund;
8.4 The Registration Statement shall have become effective under the 1933 Act, no stop orders suspending the effectiveness thereof shall have been issued and, to the best knowledge of the parties hereto, no investigation or proceeding for that purpose shall have been instituted or be pending, threatened or contemplated under the 1933 Act;
8.5 Acquired Fund, shall have declared and paid a dividend or dividends and/or other distribution or distributions that, together with all previous such dividends or distributions, shall have the effect of distributing to the Acquired Fund shareholders all of Acquired Fund's investment company taxable income (computed without regard to any deduction for dividends paid) and all of its net capital gain (after reduction for any capital loss carry-forward and computed without regard to any deduction for dividends paid) for all taxable years ending on or before the Closing Date; and
8.6 The parties shall have received the opinion of the law firm of Dechert LLP (based on certain facts, assumptions and representations), addressed to Acquiring Fund and Acquired Fund, which opinion may be relied upon by the shareholders of Acquired Fund, substantially to the effect that, for federal income tax purposes:
(a) The transfer of substantially all of Acquired Fund's assets in exchange solely for Acquiring Fund Shares and the assumption by Acquiring Fund of certain stated liabilities of Acquired Fund followed by the distribution by Acquired Fund of Acquiring Fund Shares to the Acquired Fund shareholders in exchange for their Acquired Fund shares pursuant to and in accordance with the terms of the Reorganization Agreement will constitute a "reorganization" within the meaning of Section 368(a)(1)(C) of the Code;
(b) No gain or loss will be recognized by Acquiring Fund upon the receipt of the assets of Acquired Fund solely in exchange for Acquiring Fund Shares and the assumption by Acquiring Fund of the stated liabilities of Acquired Fund;
(c) No gain or loss will be recognized by Acquired Fund upon the transfer of substantially all of the assets of Acquired Fund to Acquiring Fund in exchange solely for Acquiring Fund Shares and the assumption by Acquiring Fund of the stated liabilities or upon the distribution of Acquiring Fund Shares to the Acquired Fund shareholders in exchange for their Acquired Fund shares, except that Acquired Fund may be required to recognize
A-10
gain or loss with respect to contracts described in Section 1256(b) of the Code or stock in a passive foreign investment company, as defined in Section 1297(a) of the Code;
(d) No gain or loss will be recognized by the Acquired Fund shareholders upon the exchange of the Acquired Fund shares for Acquiring Fund Shares;
(e) The aggregate tax basis for Acquiring Fund Shares received by each Acquired Fund shareholder pursuant to the reorganization will be the same as the aggregate tax basis of the Acquired Fund shares surrendered by each such Acquired Fund shareholder in exchange therefor;
(f) The holding period of Acquiring Fund Shares to be received by each Acquired Fund shareholder will include the period during which the Acquired Fund shares surrendered in exchange therefor were held (provided such Acquired Fund shares were held as capital assets on the date of the Reorganization);
(g) The tax basis of the assets of Acquired Fund acquired by Acquiring Fund will be the same as the tax basis of such assets to Acquired Fund immediately prior to the Reorganization; and
(h) The holding period of the assets of Acquired Fund in the hands of Acquiring Fund will include the period during which those assets were held by Acquired Fund (except where the investment activities of Acquiring Fund have the effect of reducing or eliminating such periods with respect to an asset).
Notwithstanding anything herein to the contrary, neither the Company, on behalf of Acquiring Fund, nor Acquired Fund, may waive the conditions set forth in this paragraph 8.6.
9. Fees and Expenses
9.1 (a) Acquired Fund shall bear expenses incurred in connection with the entering into, and carrying out of, the provisions of this Agreement, including printing, filing and proxy solicitation expenses, legal, accounting, Commission registration fees and Blue Sky expenses.
(b) In the event the transactions contemplated herein are not consummated by reason of Acquired Fund being either unwilling or unable to go forward (other than by reason of the non-fulfillment or failure of any condition to Acquired Fund's obligations specified in this Agreement), Acquired Fund's only obligation hereunder shall be to reimburse Acquiring Fund for all reasonable out-of-pocket fees and expenses incurred by Acquiring Fund in connection with those transactions.
(c) In the event the transactions contemplated herein are not consummated by reason of Acquiring Fund being either unwilling or unable to go forward (other than by reason of the non-fulfillment or failure of any condition to Acquiring Fund's obligations specified in this Agreement), Acquiring Fund's only obligation hereunder shall be to reimburse Acquired Fund for all reasonable out-of-pocket fees and expenses incurred by Acquired Fund in connection with those transactions.
10. Entire Agreement; Survival of Warranties
10.1 This Agreement constitutes the entire agreement between the parties.
10.2 The representations, warranties and covenants contained in this Agreement or in any document delivered pursuant hereto or in connection herewith shall survive the consummation of the transactions contemplated herein, except that the representations, warranties and covenants of Acquired Fund hereunder shall not survive the dissolution and complete liquidation of Acquired Fund in accordance with paragraph 1.9.
11. Termination
11.1 This Agreement may be terminated and the transactions contemplated hereby may be abandoned at any time prior to the Closing:
(a) by the mutual written consent of Acquired Fund and the Company, on behalf of Acquiring Fund;
A-11
(b) by either the Company, on behalf of Acquiring Fund, or Acquired Fund, by notice to the other, without liability to the terminating party on account of such termination (providing the terminating party is not otherwise in material default or breach of this Agreement), if the Closing shall not have occurred on or before June 28, 2013; or
(c) by either the Company, on behalf of Acquiring Fund, or Acquired Fund, in writing without liability to the terminating party on account of such termination (provided the terminating party is not otherwise in material default or breach of this Agreement), if (i) the other party shall fail to perform in any material respect its agreements contained herein required to be performed on or prior to the Closing Date, (ii) the other party materially breaches any of its representations, warranties or covenants contained herein, (iii) the Acquired Fund shareholders fail to approve this Agreement at any meeting called for such purpose at which a quorum was present or (iv) any other condition herein expressed to be precedent to the obligations of the terminating party has not been met and it reasonably appears that it will not or cannot be met.
11.2 (a) Termination of this Agreement pursuant to paragraphs 11.1(a) or (b) shall terminate all obligations of the parties hereunder and there shall be no liability for damages on the part of the Company, Acquiring Fund or Acquired Fund, or the trustees or officers of the Company, on behalf of Acquiring Fund, or the trustees or officers of the Acquired Fund, to any other party or its directors, trustees or officers.
(b) Termination of this Agreement pursuant to paragraph 11.1(c) shall terminate all obligations of the parties hereunder and there shall be no liability for damages on the part of the Company, Acquiring Fund or Acquired Fund, or the trustees or officers of the Company, on behalf of Acquiring Fund, or the trustees or officers of Acquired Fund, except that any party in breach of this Agreement shall, upon demand, reimburse the non-breaching party for all reasonable out-of-pocket fees and expenses incurred in connection with the transactions contemplated by this Agreement, including legal, accounting and filing fees.
12. Amendments
This Agreement may be amended, modified or supplemented in such manner as may be mutually agreed upon in writing by the parties.
13. Miscellaneous
13.1 The article and paragraph headings contained in this Agreement are for reference purposes only and shall not affect in any way the meaning or interpretation of this Agreement.
13.2 This Agreement may be executed in any number of counterparts, each of which shall be deemed an original.
13.3 This Agreement shall be governed by and construed in accordance with the laws of the State of New York.
13.4 This Agreement shall bind and inure to the benefit of the parties hereto and their respective successors and assigns, but no assignment or transfer hereof or of any rights or obligations hereunder shall be made by any party without the written consent of the other party. Nothing herein expressed or implied is intended or shall be construed to confer upon or give any person, firm or corporation, other than the parties hereto and their respective successors and assigns, any rights or remedies hereunder or by reason of this Agreement.
13.5 The obligations and liabilities of Acquiring Fund hereunder are solely those of Acquiring Fund. It is expressly agreed that no shareholder, nominee, trustee, officer, agent, or employee of Acquiring Fund, or the trustees or officers of the Company, acting on behalf of Acquiring Fund, shall be personally liable hereunder. The execution and delivery of this Agreement have been authorized by the trustees of Acquiring Fund and signed by authorized officers of the Company, acting on behalf of Acquiring Fund, and neither such authorization by such trustees nor such execution and delivery by such officers shall be deemed to have been made by any of them individually or to impose any liability on any of them personally.
13.6 The obligations and liabilities of Acquired Fund hereunder are solely those of Acquired Fund. It is expressly agreed that no shareholder, nominee, trustee, officer, agent, or employee of Acquired Fund, or the trustees or officers of Acquired Fund shall be personally liable hereunder. The execution and delivery of this Agreement
A-12
have been authorized by the trustees of the Acquired Fund and signed by authorized officers of the Acquired Fund, and neither such authorization by such trustees nor such execution and delivery by such officers shall be deemed to have been made by any of them individually or to impose any liability on any of them personally.
IN WITNESS WHEREOF, each of the parties hereto has caused this Agreement to be executed by a duly authorized officer.
| MORGAN STANLEY INSTITUTIONAL FUND TRUST, | on behalf of the Acquiring Fund | ||||||
| By: Name: Title: | |||||||
| ACQUIRED FUND | |||||||
| By: Name: Title: | |||||||
A-13
INVESTMENT MANAGEMENT

Morgan Stanley
Institutional Fund Trust

Mid Cap Growth Portfolio
Prospectus
January 31, 2012
| Share Class | Ticker Symbol | ||||||
| Class I | MPEGX | ||||||
| Class P | MACGX | ||||||
The Securities and Exchange Commission has not approved or disapproved these securities or passed upon the adequacy of this Prospectus. Any representation to the contrary is a criminal offense.
Mid Cap Growth Portfolio Prospectus
January 31, 2012
Table of Contents
| Page | |||||||
| Portfolio Summary | |||||||
| Objective | 1 | ||||||
| Fees and Expenses | 1 | ||||||
| Portfolio Turnover | 1 | ||||||
| Principal Investment Strategies | 1 | ||||||
| Principal Risks | 1 | ||||||
| Performance Information | 2 | ||||||
| Investment Adviser | 2 | ||||||
| Purchase and Sale of Fund Shares | 3 | ||||||
| Tax Information | 3 | ||||||
| Payments to Broker-Dealers and Other Financial Intermediaries | 3 | ||||||
| Details of the Portfolio | 4 | ||||||
| Additional Information about the Portfolio's Investment Strategies and Related Risks | 6 | ||||||
| Portfolio Holdings | 9 | ||||||
| Purchasing Shares | 10 | ||||||
| Redeeming Shares | 11 | ||||||
| Frequent Purchases and Redemptions of Shares | 13 | ||||||
| General Shareholder Information | 14 | ||||||
| Fund Management | 16 | ||||||
| Financial Highlights | 18 | ||||||
Portfolio Summary
Objective
The Mid Cap Growth Portfolio seeks long-term capital growth.
Fees and Expenses
The table below describes the fees and expenses that you may pay if you buy and hold shares of the Portfolio. The Portfolio does not charge any sales loads or other fees when you purchase or redeem shares.
Annual Portfolio Operating Expenses
(expenses that you pay each year as a percentage of the value of your investment)
| Class I | Class P | ||||||||||
| Advisory Fee | 0.50 | % | 0.50 | % | |||||||
| Distribution and/or Service (12b-1) Fee | None | 0.25 | % | ||||||||
| Other Expenses | 0.20 | % | 0.20 | % | |||||||
| Total Annual Portfolio Operating Expenses | 0.70 | % | 0.95 | % | |||||||
Example
The example below is intended to help you compare the cost of investing in the Portfolio with the cost of investing in other mutual funds.
The example assumes that you invest $10,000 in the Portfolio, your investment has a 5% return each year and that the Portfolio's operating expenses remain the same. Although your actual costs may be higher or lower, based on these assumptions your costs would be:
| 1 Year | 3 Years | 5 Years | 10 Years | ||||||||||||||||
| Class I | $ | 72 | $ | 224 | $ | 390 | $ | 871 | |||||||||||
| Class P | $ | 97 | $ | 303 | $ | 525 | $ | 1,166 | |||||||||||
Portfolio Turnover
The Portfolio pays transaction costs, such as commissions, when it buys and sells securities (or "turns over" its portfolio). A higher portfolio turnover rate may indicate higher transaction costs and may result in higher taxes when Portfolio shares are held in a taxable account. These costs, which are not reflected in Total Annual Portfolio Operating Expenses or in the Example, affect the Portfolio's performance. During the most recent fiscal year, the Portfolio's portfolio turnover rate was 35% of the average value of its portfolio.
Principal Investment Strategies
Under normal circumstances, at least 80% of the Portfolio's assets will be invested in common stocks of mid cap companies. The Portfolio's "Adviser," Morgan Stanley Investment Management Inc., seeks long-term capital growth by investing primarily in established and emerging companies with capitalizations within the range of companies included in the Russell Midcap® Growth Index, which as of December 31, 2011 was between $117 million and $20.4 billion. The Adviser emphasizes a bottom-up stock selection process, seeking attractive investments on an individual company basis. The Adviser seeks to invest in high quality companies it believes have sustainable competitive advantages and the ability to redeploy capital at high rates of return. The Adviser typically favors companies with rising returns on invested capital, above average business visibility, strong free cash flow generation and an attractive risk/reward. The Portfolio may also use derivative instruments as discussed herein. These derivative instruments will be counted towards the 80% policy discussed above to the extent they have economic characteristics similar to the securities included within that policy.
The Portfolio may invest up to 25% of its net assets in securities of foreign issuers, including issuers located in emerging market or developing countries. The securities in which the Portfolio may invest may be denominated in U.S. dollars or in currencies other than U.S. dollars. The Portfolio may invest in privately placed securities. In addition, the Portfolio may invest in convertible securities.
The Portfolio may utilize forward foreign currency exchange contracts, which are derivatives, in connection with its investments in foreign securities.
Principal Risks
An investment in the Portfolio is subject to risks, and you could lose money on your investment in the Portfolio. There can be no assurance that the Portfolio will achieve its investment objective. An investment in the Portfolio is not a deposit of any bank or other insured depository institution and is not insured or guaranteed by the Federal Deposit Insurance Corporation or any other government agency.
The Portfolio's principal investment strategies are subject to the following principal risks:
• Common Stock and Other Equity Securities. In general, stock values fluctuate, and sometimes widely fluctuate, in response to activities specific to the company as well as general market, economic and political conditions. To the extent that the Portfolio invests in convertible securities, and the convertible security's investment value is greater than its conversion value, its price will be likely to increase when interest rates fall and decrease when interest rates rise. If the conversion value exceeds the investment value, the price of the convertible security will tend to fluctuate directly with the price of the underlying security.
• Mid Capitalization Companies. Investments in mid cap companies may involve greater risk than investments in larger, more established companies. The securities issued by mid cap companies may be less liquid, and such companies may have more limited markets, financial resources and product lines, and may lack the depth of management of larger companies.
• Foreign and Emerging Market Securities. Investments in foreign markets entail special risks such as currency, political, economic and market risks. There also may be greater market volatility, less reliable financial information, higher transaction and custody costs, decreased market liquidity and less government and exchange regulation associated with investments in foreign markets. The risks of investing
morganstanley.com/im
1
in emerging market countries are greater than risks associated with investments in foreign developed countries. In addition, the Portfolio's investments may be denominated in foreign currencies and therefore, changes in the value of a country's currency compared to the U.S. dollar may affect the value of the Portfolio's investments. Hedging the Portfolio's currency risks through forward foreign currency exchange contracts involves the risk of mismatching the Portfolio's objectives under a forward foreign currency exchange contract with the value of securities denominated in a particular currency. There is additional risk that such transactions reduce or preclude the opportunity for gain and that currency contracts create exposure to currencies in which the Portfolio's securities are not denominated.
• Privately Placed Securities. The Portfolio's investments may also include privately placed securities, which are subject to resale restrictions. These securities will have the effect of increasing the level of Portfolio illiquidity to the extent the Portfolio may be unable to sell or transfer these securities due to restrictions on transfers or on the ability to find buyers interested in purchasing the securities. The illiquidity of the market, as well as the lack of publicly available information regarding these securities, may also adversely affect the ability of the Portfolio's Trustees to arrive at a fair value for certain securities at certain times and could make it difficult for the Portfolio to sell certain securities.
Performance Information
The bar chart and table below provide some indication of the risks of investing in the Portfolio by showing changes in the Portfolio's Class I shares' performance from year-to-year and by showing how the Portfolio's average annual returns for the past one, five and 10 year periods compare with those of a broad measure of market performance, as well as an index that represents a group of similar mutual funds, over time. The performance of the other Class will differ because the Classes have different ongoing fees. The Portfolio's past performance, before and after taxes, is not necessarily an indication of how the Portfolio will perform in the future. Updated performance information is available online at www.morganstanley.com/im.
Annual Total Returns—Calendar Years

| High Quarter | 6/30/09 | 26.71 | % | ||||||||
| Low Quarter | 12/31/08 | –26.68 | % | ||||||||
Average Annual Total Returns For Periods Ended December 31, 2011
| Past One Year | Past Five Years | Past Ten Years | |||||||||||||
| Class I (commenced operations on 3/30/90) Return before Taxes | –6.89 | % | 5.15 | % | 7.27 | % | |||||||||
| Return after Taxes on Distributions | –7.68 | % | 4.95 | % | 7.16 | % | |||||||||
| Return after Taxes on Distributions and Sale of Fund Shares | –3.55 | % | 4.43 | % | 6.42 | % | |||||||||
| Class P (commenced operations on 1/31/97) Return before Taxes | –7.11 | % | 4.90 | % | 7.00 | % | |||||||||
| Russell Midcap® Growth Index (reflects no deduction for fees, expenses or taxes)1 | –1.65 | % | 2.44 | % | 5.29 | % | |||||||||
| Lipper Multi-Cap Growth Funds Index (reflects no deductions for taxes)2 | –4.02 | % | 0.87 | % | 2.78 | % | |||||||||
1 The Russell Midcap® Growth Index measures the performance of the mid-cap growth segment of the U.S. equity universe. It includes those Russell Midcap® Index companies with higher price-to-book ratios and higher forecasted growth values. The Russell Midcap® Index is a subset of the Russell 1000® Index and includes approximately 800 of the smallest securities in the Russell 1000® Index, which in turn consists of approximately 1,000 of the largest U.S. securities based on a combination of market capitalization and current index membership. It is not possible to invest directly in an index.
2 The Lipper Multi-Cap Growth Funds Index is an equally weighted performance index of the largest qualifying funds (based on net assets) in the Lipper Multi-Cap Growth Funds classification. There are currently 30 funds represented in this Index.
The after-tax returns shown in the table above are calculated using the historical highest individual federal marginal income tax rates during the period shown and do not reflect the impact of state and local taxes. After-tax returns for the Portfolio's other Class will vary from Class I shares' returns. Actual after-tax returns depend on the investor's tax situation and may differ from those shown, and after-tax returns are not relevant to investors who hold their Portfolio shares through tax deferred arrangements such as 401(k) plans or individual retirement accounts. After-tax returns may be higher than before-tax returns due to foreign tax credits and/or an assumed benefit from capital losses that would have been realized had Portfolio shares been sold at the end of the relevant periods, as applicable.
Investment Adviser
Adviser. Morgan Stanley Investment Management Inc.
Portfolio Managers. The Portfolio is managed by members of the Growth team. Information about the members jointly and primarily responsible for the day-to-day management of the Portfolio is shown below:
| Name | Title with Adviser | Date Began Managing Portfolio | |||||||||
| Dennis P. Lynch | Managing Director | January 2002 | |||||||||
| David S. Cohen | Managing Director | January 2002 | |||||||||
| Sam G. Chainani | Managing Director | June 2004 | |||||||||
| Alexander T. Norton | Executive Director | July 2005 | |||||||||
| Jason C. Yeung | Managing Director | September 2007 | |||||||||
| Armistead B. Nash | Executive Director | September 2008 | |||||||||
2
Purchase and Sale of Fund Shares
On March 31, 2011, the Fund suspended offering shares of the Portfolio to new investors. The Fund will continue to offer shares of the Portfolio in certain circumstances. For more information, please refer to the "Purchasing Shares" section beginning on page 10.
The minimum initial investment generally is $5,000,000 for Class I shares and $1,000,000 for Class P shares of the Portfolio. You may not be subject to the minimum investment requirements under certain circumstances. For more information, please refer to the "Purchasing Shares—Share Class Arrangements" and "—Other Purchase Information" sections beginning on pages 10 and 11, respectively, of this Prospectus.
Portfolio shares may be purchased or sold on any day the New York Stock Exchange ("NYSE") is open for business directly through Morgan Stanley Institutional Fund Trust (the "Fund") by mail (c/o Morgan Stanley Services Company Inc., P.O. Box 219804, Kansas City, MO 64121-9804) or by telephone (1-800-548-7786) or by contacting your financial intermediary.
For more information, please refer to the "Purchasing Shares" and "Redeeming Shares" sections beginning on pages 10 and 11, respectively, of this Prospectus.
Tax Information
The Portfolio intends to make distributions that may be taxed as ordinary income or capital gains, unless you are investing through a tax-deferred arrangement, such as a 401(k) plan or an individual retirement account.
Payments to Broker-Dealers and Other Financial Intermediaries
If you purchase the Portfolio through a broker-dealer or other financial intermediary (such as a bank), the Adviser and/or the Portfolio's distributor may pay the intermediary for the sale of Portfolio shares and related services. These payments, which may be significant in amount, may create a conflict of interest by influencing the broker-dealer or other intermediary and your salesperson to recommend the Portfolio over another investment. Ask your salesperson or visit your financial intermediary's web site for more information.
morganstanley.com/im
3
Details of the Portfolio
Objective
The Mid Cap Growth Portfolio seeks long-term capital growth.
Approach
The Adviser seeks long-term capital growth by investing primarily in established and emerging companies with capitalizations within the range of companies included in the Russell MidCap® Growth Index.
The Portfolio may invest up to 25% of its net assets in securities of foreign issuers, including issuers located in emerging market or developing countries. The securities in which the Portfolio may invest may be denominated in U.S. dollars or in currencies other than U.S. dollars.
Process
The Adviser emphasizes a bottom-up stock selection process, seeking attractive investments on an individual company basis. The Adviser seeks to invest in high quality companies it believes have sustainable competitive advantages and the ability to redeploy capital at high rates of return. The Adviser typically favors companies with rising returns on invested capital, above average business visibility, strong free cash flow generation and an attractive risk/reward. The Adviser generally considers selling a portfolio holding when it determines that the holding no longer satisfies its investment criteria.
Under normal circumstances, at least 80% of the Portfolio's assets will be invested in common stocks of mid cap companies. This policy may be changed without shareholder approval; however, you would be notified in writing of any changes. The Portfolio may also use derivative instruments as discussed herein. These derivative instruments will be counted toward the 80% policy discussed above to the extent they have economic characteristics similar to the securities included within that policy.
In accordance with the Portfolio's investment strategy of investing in mid cap companies, the capitalization range of securities in which the Portfolio may invest is consistent with the capitalization range of the Russell Midcap® Growth Index, which as of December 31, 2011 was between $117 million and $20.4 billion. The market capitalization limit is subject to adjustment annually based upon the Adviser's assessment as to the capitalization range of companies which possess the fundamental characteristics of mid cap companies. The Portfolio may invest in convertible securities. The Portfolio may invest up to 10% of its assets in real estate investment trusts ("REITs"). The Portfolio may also invest in privately placed securities.
The Portfolio may utilize forward foreign currency exchange contracts, which are derivatives, in connection with its investments in foreign securities.
Principal Risks
The Portfolio's principal investment strategies are subject to the following principal risks:
The Portfolio is subject to various risks that could adversely affect its net asset value ("NAV") and total return. It is possible for an investor to lose money by investing in the Portfolio.
The prices of common stocks rise and fall in response to events that affect entire financial markets or industries, and to events that affect a particular issuer. Investments in mid cap companies may involve greater risk than investments in larger, more established companies. The securities issued by mid cap companies may be less liquid and their prices subject to more abrupt or erratic price movements. In addition, mid cap companies may have more limited markets, financial resources and product lines, and may lack the depth of management of larger companies.
To the extent that the Portfolio invests in convertible securities, and the convertible security's investment value is greater than its conversion value, its price will be likely to increase when interest rates fall and decrease when interest rates rise. If the conversion value exceeds the investment value, the price of the convertible security will tend to fluctuate directly with the price of the underlying security.
Investing in the securities of foreign issuers, particularly those located in emerging market or developing countries, entails the risk that news and events unique to a country or region will affect those markets and their issuers. These same events will not
4
Mid Cap Growth Portfolio Prospectus
January 31, 2012
Details of the Portfolio (Cont'd)
necessarily have an effect on the U.S. economy or similar issuers located in the United States.
The Portfolio's investments may be denominated in foreign currencies. As a result, changes in the value of a country's currency compared to the U.S. dollar may affect the value of the Portfolio's investments. These changes may occur separately from and in response to events that do not otherwise affect the value of the security in the issuer's home country. Hedging the Portfolio's currency risks through forward foreign currency exchange contracts involves the risk of mismatching the Portfolio's objectives under a forward foreign currency exchange contract with the value of securities denominated in a particular currency. There is additional risk that such transactions reduce or preclude the opportunity for gain and that currency contracts create exposure to currencies in which the Portfolio's securities are not denominated.
REITs pool investors' funds for investments primarily in real estate properties. Like mutual funds, REITs have expenses, including advisory and administration fees, that are paid by their shareholders. As a result, shareholders will absorb duplicate levels of fees when the Portfolio invests in REITs. The performance of any Portfolio REIT holdings ultimately depends on the types of real property in which the REITs invest and how well the property is managed. A general downturn in real estate values also can hurt REIT performance. In addition, REITs are subject to certain provisions under federal tax law. The failure of a company to qualify as a REIT could have adverse consequences for the Portfolio, including significantly reducing return to the Portfolio on its investment in such company.
The Portfolio's investments may also include privately placed securities, which are subject to resale restrictions. These securities will have the effect of increasing the level of Portfolio illiquidity to the extent the Portfolio may be unable to sell or transfer these securities due to restrictions on transfers or on the ability to find buyers interested in purchasing the securities. The illiquidity of the market, as well as the lack of publicly available information regarding these securities, may also adversely affect the ability of the Portfolio's Trustees to arrive at a fair value for certain securities at certain times and could make it difficult for the Portfolio to sell certain securities.
Please see "Additional Information about the Portfolio's Investment Strategies and Related Risks" for further information about these and other risks of investing in the Portfolio.
5
Additional Information about the Portfolio's Investment Strategies and Related Risks
This section discusses additional information relating to the Portfolio's investment strategies, other types of investments that the Portfolio may make and related risk factors. The Portfolio's investment practices and limitations are also described in more detail in the Statement of Additional Information ("SAI"), which is incorporated by reference and legally is a part of this Prospectus. For details on how to obtain a copy of the SAI and other reports and information, see the back cover of this Prospectus.
Equity Securities
Equity securities include common stock, preferred stock, convertible securities, American Depositary Receipts ("ADRs"), rights, warrants and shares of investment companies. The Portfolio may invest in equity securities that are publicly traded on securities exchanges or over-the-counter or in equity securities that are not publicly traded. Securities that are not publicly traded may be more difficult to sell and their value may fluctuate more dramatically than other securities. For purposes of the Portfolio, companies traded on a U.S. exchange include companies listed on Nasdaq.
ADRs are U.S. dollar-denominated securities that represent claims to shares of foreign stocks. The Portfolio treats ADRs as U.S. securities for purposes of foreign investment limitations.
Growth stocks generally have higher growth rates, betas and price/earnings ratios, and lower yields than the stock market in general as measured by an appropriate stock market index. Value stocks are stocks that are deemed by the Adviser to be undervalued relative to the stock market in general. The Adviser makes value decisions guided by the appropriate market index, based on value characteristics such as price/earnings and price/book ratios. Value stocks generally are dividend paying common stocks. However, non-dividend paying stocks also may be selected for their value characteristics.
IPOs
The Portfolio may purchase shares issued as part of, or a short period after, companies' initial public offerings ("IPOs"), and may at times dispose of those shares shortly after their acquisition. The Portfolio's purchase of shares issued in IPOs exposes it to the risks associated with companies that have little operating history as public companies, as well as to the risks inherent in those sectors of the market where these new issuers operate. The market for IPO issuers has been volatile, and share prices of newly-public companies have fluctuated in significant amounts over short periods of time. The purchase of shares issued in IPOs may have a greater impact upon the Portfolio's total returns during any period that the Portfolio has a small asset base. As the Portfolio's assets grow, any impact of IPO investments on the Portfolio's total return may decline.
Fixed Income Securities
Fixed income securities are securities that pay a fixed or a variable rate of interest until a stated maturity date. Fixed income securities include U.S. government securities, securities issued by federal or federally sponsored agencies and instrumentalities ("agencies"), corporate bonds and notes, asset-backed securities, mortgage securities, high yield securities, municipal bonds, loan participations and assignments, zero coupon bonds, convertible securities, Eurobonds, Brady Bonds, Yankee Bonds, repurchase agreements, commercial paper and cash equivalents.
These securities are subject to risks related to changes in interest rates and in the financial health or credit rating of the issuers. The maturity and duration of a fixed income instrument also affects the extent to which the price of the security will change in response to these and other factors. Longer term securities tend to experience larger price changes than shorter term securities because they are more sensitive to changes in interest rates or in the credit ratings of the issuers.
Fixed income securities may be called (i.e., redeemed by the issuer) prior to final maturity. If a callable security is called, the Portfolio may have to reinvest the proceeds at a lower rate of interest.
Foreign Securities
Foreign issuers generally are subject to different accounting, auditing and financial reporting standards than U.S. issuers. There may be less information available to the public about foreign issuers. Securities of foreign issuers can be less liquid
6
Mid Cap Growth Portfolio Prospectus
January 31, 2012
and experience greater price movements. In some foreign countries, there is also the risk of government expropriation, excessive taxation, political or social instability, the imposition of currency controls, or diplomatic developments that could affect an investing portfolio's investment. There also can be difficulty obtaining and enforcing judgments against issuers in foreign countries. Foreign stock exchanges, broker-dealers and listed issuers may be subject to less government regulation and oversight. The cost of investing in foreign securities, including brokerage commissions and custodial expenses, can be higher than in the United States.
In connection with its investments in foreign securities, the Portfolio also may enter into contracts with banks, brokers or dealers to purchase or sell securities or foreign currencies at a future date. A forward foreign currency contract is a negotiated agreement between the contracting parties to exchange a specified amount of currency at a specified future time at a specified rate. The rate can be higher or lower than the spot rate between the currencies that are the subject of the contract. Forward foreign currency exchange contracts may be used to protect against uncertainty in the level of future foreign currency exchange rates or to gain or modify exposure to a particular currency. In addition, the Portfolio may use cross currency hedging or proxy hedging with respect to currencies in which the Portfolio has or expects to have portfolio or currency exposure. Cross currency hedges involve the sale of one currency against the positive exposure to a different currency and may be used for hedging purposes or to establish an active exposure to the exchange rate between any two currencies. Hedging the Portfolio's currency risks involves the risk of mismatching the Portfolio's objectives under a forward or futures contract with the value of securities denominated in a particular currency. Furthermore, such transactions reduce or preclude the opportunity for gain if the value of the currency should move in the direction opposite to the position taken. There is an additional risk to the effect that currency contracts create exposure to currencies in which the Portfolio's securities are not denominated. Unanticipated changes in currency prices may result in poorer overall performance for the Portfolio than if it had not entered into such contracts. The use of forward foreign currency exchange contracts involves the risk of loss from the insolvency or bankruptcy of the counterparty to the contract or the failure of the counterparty to make payments or otherwise comply with the terms of the contract.
Foreign Currency
The Portfolio's investments may be denominated in foreign currencies. The value of foreign currencies fluctuates relative to the value of the U.S. dollar. Since the Portfolio may invest in such non-U.S. dollar-denominated securities, and therefore may convert the value of such securities into U.S. dollars, changes in currency exchange rates can increase or decrease the U.S. dollar value of the Portfolio's assets. The Adviser may use derivatives to reduce this risk. The Adviser may in its discretion choose not to hedge against currency risk. In addition, certain market conditions may make it impossible or uneconomical to hedge against currency risk.
Emerging Market Securities
Investing in emerging market securities enhances the risks of foreign investing. In addition, emerging market securities generally are less liquid and subject to wider price and currency fluctuations than securities issued in more developed countries. In certain countries, the market may be dominated by a few issuers or sectors. Investment funds and structured investments are mechanisms for U.S. and other investors to invest in certain emerging markets that have laws precluding or limiting direct investments by foreign investors.
Convertible Securities
A convertible security is a bond, debenture, note, preferred stock, right, warrant or other security that may be converted into or exchanged for a prescribed amount of common stock or other security of the same or a different issuer or into cash within a particular period of time at a specified price or formula. A convertible security generally entitles the holder to receive interest paid or accrued on debt securities or the dividend paid on preferred stock until the convertible security matures or is redeemed, converted or exchanged. Before conversion, convertible securities generally have characteristics similar to both debt and equity securities. The value of convertible securities tends to decline as interest rates rise and, because of the conversion feature,
7
tends to vary with fluctuations in the market value of the underlying securities. Convertible securities ordinarily provide a stream of income with generally higher yields than those of common stock of the same or similar issuers. Convertible securities generally rank senior to common stock in a corporation's capital structure but are usually subordinated to comparable nonconvertible securities. Convertible securities generally do not participate directly in any dividend increases or decreases of the underlying securities although the market prices of convertible securities may be affected by any dividend changes or other changes in the underlying securities.
Derivatives
The Portfolio may, but is not required to, use derivative instruments for a variety of purposes, including hedging, risk management, portfolio management or to earn income. Derivatives are financial instruments whose value is based on the value of an underlying asset, interest rate, index or financial instrument. A derivative instrument often has risks similar to its underlying instrument and may have additional risks, including imperfect correlation between the value of the derivative and the underlying instrument, risks of default by the counterparty to certain transactions, magnification of losses incurred due to changes in the market value of the securities, instruments, indices or interest rates to which they relate, and risks that the transactions may not be liquid. The use of derivatives involves risks that are different from, and possibly greater than, the risks associated with other portfolio investments. Derivatives may involve the use of highly specialized instruments that require investment techniques and risk analyses different from those associated with other portfolio investments.
Certain derivative transactions may give rise to a form of leverage. Leverage magnifies the potential for gain and the risk of loss. Leverage associated with derivative transactions may cause the Portfolio to liquidate portfolio positions when it may not be advantageous to do so to satisfy its obligations or to meet earmarking or segregation requirements, pursuant to applicable U.S. Securities and Exchange Commission (the "Commission") rules and regulations, or may cause a Portfolio to be more volatile than if the Portfolio had not been leveraged. Although the Adviser seeks to use derivatives to further the Portfolio's investment objectives, there is no assurance that the use of derivatives will achieve this result.
The derivative instruments and techniques that the Portfolio may use include:
Futures. A futures contract is a standardized agreement to buy or sell a specific quantity of an underlying instrument at a specific price at a specific future time. The value of a futures contract tends to increase and decrease in tandem with the value of the underlying instrument. Depending on the terms of the particular contract, futures contracts are settled through either physical delivery of the underlying instrument on the settlement date or by payment of a cash settlement amount on the settlement date. A decision as to whether, when and how to use futures involves the exercise of skill and judgment and even a well-conceived futures transaction may be unsuccessful because of market behavior or unexpected events. In addition to the derivatives risks discussed above, the prices of futures can be highly volatile, using futures can lower total return, and the potential loss from futures can exceed the Portfolio's initial investment in such contracts.
Options. If the Portfolio buys an option, it buys a legal contract giving it the right to buy or sell a specific amount of the underlying instrument or futures contract on the underlying instrument at an agreed-upon price typically in exchange for a premium paid by the Portfolio. If the Portfolio sells an option, it sells to another person the right to buy from or sell to the Portfolio a specific amount of the underlying instrument or futures contract on the underlying instrument at an agreed upon price typically in exchange for a premium received by the Portfolio. A decision as to whether, when and how to use options involves the exercise of skill and judgment and even a well-conceived option transaction may be unsuccessful because of market behavior or unexpected events. The prices of options can be highly volatile and the use of options can lower total returns.
Swaps. A swap contract is an agreement between two parties pursuant to which the parties exchange payments at specified dates on the basis of a specified
8
Mid Cap Growth Portfolio Prospectus
January 31, 2012
notional amount, with the payments calculated by reference to specified securities, indexes, reference rates, currencies or other instruments. Most swap agreements provide that when the period payment dates for both parties are the same, the payments are made on a net basis (i.e., the two payment streams are netted out, with only the net amount paid by one party to the other). The Portfolio's obligations or rights under a swap contract entered into on a net basis will generally be equal only to the net amount to be paid or received under the agreement, based on the relative values of the positions held by each counterparty. Swap agreements currently are not entered into or traded on exchanges and there is no central clearing or guaranty function for swaps. Therefore, swaps are subject to credit risk or the risk of default or non-performance by the counterparty. Swaps could result in losses if interest rate or foreign currency exchange rates or credit quality changes are not correctly anticipated by the Portfolio or if the reference index, security or investments do not perform as expected.
Structured Investments. The Portfolio also may invest a portion of its assets in structured investments. A structured investment is a derivative security designed to offer a return linked to a particular underlying security, currency, commodity or market. Structured investments may come in various forms including notes, warrants and options to purchase securities. The Portfolio will typically use structured investments to gain exposure to a permitted underlying security, currency or market when direct access to a market is limited or inefficient from a tax or cost standpoint. Investments in structured investments involve risks including counterparty risk and market risk. Holders of structured investments bear risks of the underlying investment and are subject to counterparty risk because the Portfolio is relying on the creditworthiness of such counterparty and has no rights with respect to the issuer of the underlying investment. Certain structured investments may be thinly traded or have a limited trading market and may have the effect of increasing the Portfolio's illiquidity to the extent that the Portfolio, at a particular point in time, may be unable to find qualified buyers for these securities.
Temporary Defensive Investments
When the Adviser believes that changes in economic, financial or political conditions warrant, the Portfolio may invest without limit in fixed income securities for temporary defensive purposes that may be inconsistent with the Portfolio's principal investment strategies, as described in the SAI. If the Adviser incorrectly predicts the effects of these changes, the defensive investments may adversely affect the Portfolio's performance. Using defensive investments could cause the Portfolio to fail to meet its investment objective.
Portfolio Holdings
A description of the policies and procedures of the Fund with respect to the disclosure of the Portfolio's securities is available in the Fund's SAI.
9
Purchasing Shares
On March 31, 2011, the Fund suspended offering shares of the Portfolio to new investors, except as follows. The Fund will continue to offer shares of the Portfolio (1) through certain retirement plan accounts, (2) to clients of certain registered investment advisers who currently offer shares of the Portfolio in their asset allocation programs, (3) to directors and trustees of the Morgan Stanley Funds, (4) to Morgan Stanley affiliates and their employees and (5) to benefit plans sponsored by Morgan Stanley and its affiliates. The Fund will continue to offer shares of the Portfolio to existing shareholders and, as market conditions permit, may recommence offering shares of the Portfolio to other new investors in the future. Any such offerings of the Portfolio's shares may be limited in amount and may commence and terminate without any prior notice.
Share Class Arrangements
The minimum initial investment generally is $5,000,000 for Class I shares and $1,000,000 for Class P shares of the Portfolio.
Class I shares are not subject to either a distribution fee or a shareholder servicing fee. Class P shares are subject to a monthly service fee at an annual rate of up to 0.25% of the Portfolio's average daily net assets attributable to Class P shares.
General
Shares of the Portfolio may be purchased directly from the Fund or through a financial intermediary. Investors purchasing shares through a financial intermediary may be charged a transaction-based or other fee by the financial intermediary for its services. If you are purchasing shares through a financial intermediary, please consult your intermediary for purchase instructions.
Shares of the Portfolio may, in the Fund's discretion, be purchased with investment securities (in lieu of, or in conjunction with, cash) acceptable to the Fund. The securities would be accepted by the Fund at their market value in return for shares of the Portfolio.
Shares of the Portfolio may be purchased at the NAV next determined after we receive your purchase order. The NAV of the Portfolio is determined as of the close of the NYSE (normally 4:00 p.m. Eastern Time) on each day the NYSE is open for business.
To help the U.S. Government fight the funding of terrorism and money laundering activities, federal law requires all financial institutions to obtain, verify and record information that identifies each person who opens an account. What this means to you is that when you open an account, we will ask your name, address, date of birth and other information that will allow us to identify you. If we are unable to verify your identity, we reserve the right to restrict additional transactions and/or liquidate your account at the next calculated NAV after your account is closed (less any applicable sales/account charges and/or tax penalties) or take any other action required by law. In accordance with federal law requirements, the Fund has implemented an anti-money laundering compliance program, which includes designation of an anti-money laundering compliance officer.
Initial Purchase by Mail
You may open an account, subject to acceptance by the Fund, by completing and signing an Account Registration Form provided by Morgan Stanley Services Company, Inc. ("Morgan Stanley Services"), the Fund's transfer agent, which you can obtain by calling Morgan Stanley Services at 1-800-548-7786 and mailing it to Morgan Stanley Institutional Fund Trust. c/o Morgan Stanley Services Company Inc., P.O. Box 219804, Kansas City, MO 64121-9804 together with a check payable to Morgan Stanley Institutional Fund Trust.
Please note that payments to investors who redeem shares purchased by check will not be made until payment of the purchase has been collected, which may take up to 15 business days after purchase. You can avoid this delay by purchasing shares by wire.
Initial Purchase by Wire
You may purchase shares of the Portfolio by wiring Federal Funds (monies credited by a Federal Reserve Bank) to State Street Bank and Trust Company (the "Custodian"). You should forward a completed Account Registration Form to Morgan Stanley Services in advance of the wire. See the section below entitled "Valuation of Shares." Instruct your bank to send a
10
Mid Cap Growth Portfolio Prospectus
January 31, 2012
Federal Funds wire in a specified amount to the Custodian using the following wire instructions:
State Street Bank and Trust Company
One Lincoln Street
Boston, MA 02111-2101
ABA #011000028
DDA #00575373
Attn: Morgan Stanley Institutional Fund Trust
Subscription Account
Ref: (Portfolio Name, Account Number, Account Name)
Additional Investments
You may make additional investments of shares at the NAV next determined after the request is received in good order, by mailing a check (payable to Morgan Stanley Institutional Fund Trust) to Morgan Stanley Services at the address noted under Initial Purchase by Mail or by wiring Federal Funds to the Custodian as outlined above.
Other Purchase Information
The Fund may suspend the offering of shares, or any class of shares, of the Portfolio or reject any purchase orders when we think it is in the best interest of the Fund. The minimum initial investment in Class I shares or Class P shares may be waived for certain investments, including sales through banks, broker-dealers and other financial institutions (including registered investment advisers and financial planners) purchasing shares on behalf of their clients in (i) discretionary and non-discretionary advisory programs, (ii) fund supermarkets, (iii) asset allocation programs or (iv) other programs in which the client pays an asset-based fee for advice or for executing transactions in Portfolio shares or for otherwise participating in the program. In addition, the minimum initial investment will be waived for: (i) certain retirement plans investing directly with the Fund; (ii) retirement plans investing through certain retirement plan platforms; (iii) certain endowments, foundations and other not for profit entities investing directly with the Fund; (iv) other registered investment companies advised by Morgan Stanley Investment Management or any of its affiliates; (v) Morgan Stanley Investment Management and its affiliates with respect to shares held in connection with certain retirement and deferred compensation programs established for their employees; (vi) the independent Trustees of the Fund; (vii) clients who owned Portfolio shares as of December 31, 2007; and (viii) investments made in connection with certain reorganizations as approved by the Adviser. If the value of your account falls below the minimum initial investment amount for Class I shares or Class P shares as a result of share redemptions or you no longer meet one of the waiver criteria set forth above, your account may be subject to involuntary conversion or involuntary redemption. You will be notified prior to any such conversions or redemptions.
Certain patterns of past exchanges and/or purchase or sale transactions involving the Portfolio may result in the Fund rejecting, limiting or prohibiting, at its sole discretion and without prior notice, additional purchases and/or exchanges and may result in a shareholder's account being closed. Determinations in this regard may be made based on the frequency or dollar amount of the previous exchanges or purchase or sale transactions.
Purchases of the Portfolio's shares will be made in full and fractional shares of the Portfolio calculated to three decimal places.
Redeeming Shares
You may redeem shares of the Portfolio by mail, or, if authorized, by telephone at no charge. The value of shares redeemed may be more or less than the purchase price, depending on the NAV at the time of redemption. Shares of the Portfolio will be redeemed at the NAV next determined after the request is received in good order. If you are redeeming shares through a financial intermediary, please consult your intermediary for redemption instructions.
By Mail
Requests should be addressed to Morgan Stanley Institutional Fund Trust, c/o Morgan Stanley Services Company Inc., P.O. Box 219804, Kansas City, MO 64121-9804.
11
To be in good order, redemption requests must include the following documentation:
(a) A letter of instruction, if required, or a stock assignment specifying the number of shares or dollar amount to be redeemed, signed by all registered owners of the shares in the exact names in which the shares are registered;
(b) The share certificates, if issued;
(c) Any required signature guarantees; and
(d) Other supporting legal documents, if required, in the case of estates, trusts, guardianships, custodianship, corporations, pension and profit sharing plans and other organizations.
By Telephone
You automatically have telephone redemption and exchange privileges unless you indicate otherwise by checking the applicable box on the new account application form or calling Morgan Stanley Services to opt out of such privileges. You may request a redemption of shares by calling the Fund at 1-800-548-7786 and requesting that the redemption proceeds be wired to you. You cannot redeem shares by telephone if you hold share certificates for those shares. For your protection when calling the Fund, we will employ reasonable procedures to confirm that redemption instructions communicated over the telephone are genuine. These procedures may include requiring various forms of personal identification such as name, mailing address, social security number or other tax identification number. Telephone instructions may also be recorded. If reasonable procedures are employed, none of Morgan Stanley, Morgan Stanley Services or the Fund will be liable for following telephone instructions which it reasonably believes to be genuine. Telephone redemptions and exchanges may not be available if you cannot reach Morgan Stanley Services by telephone, whether because all telephone lines are busy or for any other reason; in such case, a shareholder would have to use the Fund's other redemption and exchange procedures described in this Prospectus. During periods of drastic economic or market changes, it is possible that the telephone privileges may be difficult to implement, although this has not been the case with the Fund in the past. To opt out of telephone privileges, please contact Morgan Stanley Services at 1-800-548-7786.
The Fund will ordinarily pay redemption proceeds in cash within seven business days after receipt of your request. The Fund may suspend the right of redemption or postpone the payment of redemption proceeds at times when the NYSE is closed or under other circumstances in accordance with interpretations or orders of the Commission.
If we determine that it is in the best interest of the Fund or Portfolio not to pay redemption proceeds in cash, we may distribute to you securities held by the Portfolio from which you are redeeming. Such in-kind securities may be illiquid and difficult or impossible for a shareholder to sell at a time and at a price that a shareholder would like. If requested, we will pay a portion of your redemption(s) in cash (during any 90 day period) up to the lesser of $250,000 or 1% of the net assets of the Portfolio at the beginning of such period. Redemptions paid in investment securities will give rise to income, gain or loss for income tax purposes in the same manner as redemptions paid in cash. In addition, you may incur brokerage costs and a further gain or loss for income tax purposes when you ultimately sell the securities.
12
Mid Cap Growth Portfolio Prospectus
January 31, 2012
Frequent Purchases and Redemptions of Shares
Frequent purchases and redemptions of shares by Portfolio shareholders are referred to as "market-timing" or "short-term trading" and may present risks for other shareholders of the Portfolio, which may include, among other things, dilution in the value of the Portfolio's shares held by long-term shareholders, interference with the efficient management of the Portfolio, increased brokerage and administrative costs, incurring unwanted taxable gains and forcing the Portfolio to hold excess levels of cash.
In addition, the Portfolio is subject to the risk that market-timers and/or short-term traders may take advantage of time zone differences between the foreign markets on which the Portfolio's securities trade and the time as of which the Portfolio's NAV is calculated ("time-zone arbitrage"). For example, a market-timer may purchase shares of the Portfolio based on events occurring after foreign market closing prices are established, but before the Portfolio's NAV calculation, that are likely to result in higher prices in foreign markets the following day. The market-timer would redeem the Portfolio's shares the next day when the Portfolio's share price would reflect the increased prices in foreign markets for a quick profit at the expense of long-term Portfolio shareholders.
Investments in other types of securities also may be susceptible to short-term trading strategies. These investments include securities that are, among other things, thinly traded, traded infrequently or relatively illiquid, which have the risk that the current market price for the securities may not accurately reflect current market values. A shareholder may seek to engage in short-term trading to take advantage of these pricing differences (referred to as "price-arbitrage"). Investment in certain fixed income securities may be adversely affected by price arbitrage trading securities.
The Fund discourages and does not accommodate frequent purchases and redemptions of Portfolio shares by Portfolio shareholders and the Fund's Board of Trustees has adopted policies and procedures with respect to such frequent purchases and redemptions. The Fund's policies with respect to purchases, exchanges and redemptions of shares are described in the "Purchasing Shares," "General Shareholder Information" and "Redeeming Shares" sections of this Prospectus. Except as described in each of these sections, and with respect to trades that occur through omnibus accounts at financial intermediaries as described below, the Fund's policies regarding frequent trading of shares are applied uniformly to all shareholders. With respect to trades that occur through omnibus accounts at intermediaries, such as investment advisers, broker-dealers, transfer agents and third party administrators, the Fund (i) requests assurance that such intermediaries currently selling shares have in place internal policies and procedures reasonably designed to address market-timing concerns and has instructed such intermediaries to notify the Fund immediately if they are unable to comply with such policies and procedures and (ii) requires all prospective intermediaries to agree to cooperate in enforcing the Fund's policies (or, upon prior written approval only, an intermediary's own policies) with respect to frequent purchases, exchanges and redemptions of shares.
Omnibus accounts generally do not identify customers' trading activity to the Fund on an individual ongoing basis. Therefore, with respect to trades that occur through omnibus accounts at financial intermediaries, to some extent, the Fund relies on the financial intermediary to monitor frequent short-term trading within the Fund by the financial intermediary's customers. However, the Fund or the Distributor has entered into agreements with financial intermediaries whereby intermediaries are required to provide certain customer identification and transaction information upon the Fund's request. The Fund may use this information to help identify and prevent market-timing activity in the Fund. There can be no assurance that the Fund will be able to identify or prevent all market-timing activities.
13
General Shareholder Information
Valuation of Shares
The price of the Portfolio's shares (NAV) is based on the value of the Portfolio's securities. The NAV of the Portfolio is determined as of the close of the NYSE (normally 4:00 p.m. Eastern Time) on each day the NYSE is open for business.
The Portfolio values its securities at market value. When no market quotations are readily available for securities, including circumstances under which the Adviser determines that a security's market price is not accurate, we will determine the value for those securities in good faith at fair value using methods approved by the Fund's Board of Trustees. In addition, with respect to securities that primarily are listed on foreign exchanges, when an event occurs after the close of such exchanges that is likely to have changed the value of the securities (for example, a percentage change in value of one or more U.S. securities indices in excess of specified thresholds), such securities will be valued at their fair value, as determined under procedures established by the Fund's Board of Trustees. Securities also may be fair valued in the event of a significant development affecting a country or region or an issuer-specific development which is likely to have changed the value of the security. In these cases, a Portfolio's NAV will reflect certain portfolio securities' fair value rather than their market price.
Fair value pricing involves subjective judgment and it is possible that the fair value determined for a security is materially different than the value that could be realized upon the sale of that security.
The NAV of each Class of shares may differ from that of other classes because of class-specific expenses that each class may pay and the shareholder servicing fees charged to Class P shares.
Exchange Privilege
You may exchange Class I and Class P shares for the same Class of shares of other available portfolios of the Fund and available portfolios of Morgan Stanley Institutional Fund, Inc. Exchanges are based on the shares' respective NAVs.
To obtain a prospectus for another portfolio, call the Fund at 1-800-548-7786 or contact your financial intermediary. If you purchased Portfolio shares through a financial intermediary, certain portfolios may be unavailable for exchange. Contact your financial intermediary to determine which portfolios are available for exchange. See also "Other Purchase Information" for certain limitations relating to exchanges.
You can process your exchange by contacting your financial intermediary. Otherwise, you should send exchange requests by mail to Morgan Stanley Institutional Fund Trust. c/o Morgan Stanley Services Company Inc., P.O. Box 219804, Kansas City, MO 64121-9804. Exchange requests can also be made by calling 1-800-548-7786.
When you exchange for shares of another portfolio, your transaction will be treated the same as an initial purchase. You will be subject to the same minimum initial investment and account size as an initial purchase. The Fund, in its sole discretion, may waive the minimum initial investment amounts in certain cases. The Fund may terminate or revise the exchange privilege upon required notice or in certain cases without notice.
Tax Considerations
As with any investment, you should consider how your Portfolio investment will be taxed. The tax information in this Prospectus is provided as general information. You should consult your own tax professional about the tax consequences of an investment in a Portfolio. Unless your investment in a Portfolio is through a tax-deferred retirement account, such as a 401(k) plan or IRA, you need to be aware of the possible tax consequences when the Portfolio makes distributions and when you sell shares, including an exchange to another Morgan Stanley Fund.
Taxation of Distributions. Your distributions normally are subject to federal and state income tax when they are paid, whether you take them in cash or reinvest them in Portfolio shares. A distribution also may be
14
Mid Cap Growth Portfolio Prospectus
January 31, 2012
subject to local income tax. Any income dividend distributions and any short-term capital gain distributions are taxable to you as ordinary income. Any long-term capital gain distributions are taxable as long-term capital gains, no matter how long you have owned shares in the Portfolio.
Under current law (through 2012), if certain holding period requirements are met with respect to your shares, a portion of the income dividends you receive may be taxed at the same rates as long-term capital gains. However, even if income received in the form of income dividends is taxed at the same rates as long-term capital gains, such income will not be considered long-term capital gains for other federal income tax purposes. For example, you will not be permitted to offset income dividends with capital losses. Short-term capital gain distributions will continue to be taxed at ordinary income rates.
Corporate shareholders may be entitled to a dividends-received deduction for the portion of dividends they receive which are attributable to dividends received by such portfolios from U.S. corporations.
Investment income received by the Portfolio from sources within foreign countries may be subject to foreign income taxes.
You will be sent a statement (Internal Revenue Service ("IRS") Form 1099-DIV) by February of each year showing the taxable distributions paid to you in the previous year. The statement provides information on your dividends and any capital gains for tax purposes.
Taxation of Sales. Your sale of Portfolio shares normally is subject to federal and state income tax and may result in a taxable gain or loss to you. A sale also may be subject to local income tax. Your exchange of Portfolio shares for shares of another Morgan Stanley Fund is treated for tax purposes like a sale of your original shares and a purchase of your new shares. Thus, the exchange may, like a sale, result in a taxable gain or loss to you and will give you a new tax basis for your shares.
Due to recent legislation, the Portfolio (or its administrative agent) is required to report to the IRS and furnish to Portfolio shareholders the cost basis information for sale transactions of shares purchased on or after January 1, 2012. Shareholders may elect to have one of several cost basis methods applied to their account when calculating the cost basis of shares sold, including average cost, FIFO ("first-in, first-out"), or some other specific identification method. Unless you instruct otherwise, the Fund will use average cost as its default cost basis method, and will treat sales as first coming from shares purchased prior to January 1, 2012. If average cost is used for the first sale of Portfolio shares covered by these new rules, the shareholder may only use an alternative cost basis method for shares purchased prospectively. Portfolio shareholders should consult with their tax advisors to determine the best cost basis method for their tax situation.
When you open your account, you should provide your social security or tax identification number on your investment application. By providing this information, you will avoid being subject to federal backup withholding (as of the date of this Prospectus this rate is 28% and is scheduled to increase to 31% after 2012) on taxable distributions and redemption proceeds. Any withheld amount would be sent to the IRS as an advance payment of your taxes due on your income for such year.
Dividends and Distributions
The Portfolio normally declares dividends and distributes substantially all of its net investment income to shareholders annually.
If any net gains are realized from the sale of underlying securities, the Portfolio normally distributes the gains with the last distributions for the calendar year. All dividends and distributions are automatically paid in additional shares of the Portfolio unless you elect otherwise. If you want to change how your dividends are paid, you must notify the Fund in writing.
15
Fund Management
Adviser
Morgan Stanley Investment Management Inc., with principal offices at 522 Fifth Avenue, New York, New York 10036, conducts a worldwide portfolio management business and provides a broad range of portfolio management services to customers in the United States and abroad. Morgan Stanley is the direct parent of the Adviser. Morgan Stanley is a preeminent global financial services firm engaged in securities trading and brokerage activities, as well as providing investment banking, research and analysis, financing and financial advisory services. As of December 31, 2011, the Adviser, together with its affiliated asset management companies, had approximately $287.4 billion in assets under management or supervision.
The Adviser makes investment decisions for the Portfolio and places the Portfolio's purchase and sales orders. The Portfolio, in turn, pays the Adviser an annual advisory fee calculated by applying a quarterly rate. The table below shows the Adviser's actual rates of compensation as a percentage of the Portfolio's average daily net assets for the Fund's 2011 fiscal year.
A discussion regarding the basis for the Board of Trustees' approval of the investment advisory agreement is available in the Fund's annual report to shareholders for the fiscal year ended September 30, 2011.
Adviser's Rate of Compensation
| Portfolio | FY 2011 Actual Compensation Rate | ||||||
| Mid Cap Growth | 0.49 | % | |||||
Portfolio Management
Mid Cap Growth Portfolio
The Portfolio is managed by members of the Growth team. The team consists of portfolio managers and analysts. Current members of the team who are jointly and primarily responsible for the day-to-day management of the Portfolio are Dennis P. Lynch, David S. Cohen, Jason C. Yeung and Sam G. Chainani, each a Managing Director of the Adviser, and Alexander T. Norton and Armistead B. Nash, each an Executive Director of the Adviser.
Mr. Lynch has been associated with the Adviser in an investment management capacity since 1998. Mr. Cohen has been associated with the Adviser in an investment management capacity since 1993. Mr. Chainani has been associated with the Adviser in an investment management capacity since 1996. Mr. Norton has been associated with the Adviser in an investment management capacity since 2000. Mr. Yeung has been associated with the Adviser in an investment management capacity since 2002. Mr. Nash has been associated with the Adviser in an investment management capacity since 2002.
Mr. Lynch is the lead portfolio manager of the Portfolio. Messrs. Cohen, Chainani, Norton, Yeung and Nash are co-portfolio managers. Members of the team collaborate to manage the assets of the Portfolio.
The Fund's SAI provides additional information about the portfolio managers' compensation structure, other accounts managed by the portfolio managers and the portfolio managers' ownership of securities in the Portfolio.
The composition of the team may change from time to time.
Distributor
Shares of the Fund are distributed exclusively through Morgan Stanley Distribution, Inc., a wholly-owned subsidiary of the Adviser. The Distributor has entered into arrangements with certain financial intermediaries who may accept purchase and redemption orders for shares of the Portfolio on its behalf.
Shareholder Services Plan (Class P)
The Fund has adopted a Shareholder Services Plan for the Portfolio's Class P shares pursuant to Rule 12b-1 under the Investment Company Act of 1940, as amended (the "Class P Service Plan"). Under the Class P Service Plan, the Portfolio may
16
Mid Cap Growth Portfolio Prospectus
January 31, 2012
pay to the Distributor and other affiliated and unaffiliated broker-dealers, financial institutions and/or intermediaries a monthly service fee at an annual rate of up to 0.25% of the Portfolio's average daily net assets attributable to Class P shares. The Distributor may direct that all or any part of this fee be paid directly to its affiliates or other broker-dealers, financial institutions and/or intermediaries that provide shareholder services. Over time the shareholder servicing fees will increase the cost of your investment and may cost you more than paying other types of sales charges.
Additional Information
The Adviser and/or Distributor may pay compensation to certain affiliated or unaffiliated brokers or other service providers in connection with the sale or retention of shares of the Portfolio and/or shareholder servicing. Such compensation may be significant in amount and the prospect of receiving any such additional compensation may provide affiliated or unaffiliated entities with an incentive to favor sales of shares of the Portfolio over other investment options. Any such payments will not change the NAV or the price of Portfolio shares. For more information, please see the Fund's SAI.
17
Financial Highlights
The financial highlights tables that follow are intended to help you understand the financial performance of the Class I and Class P shares of the Portfolio for the past five years. Certain information reflects financial results for a single Portfolio share. The total returns in the tables represent the rate that an investor would have earned (or lost) on an investment in the Portfolio (assuming reinvestment of all dividends and distributions).
The ratio of expenses to average net assets listed in the tables below for each class of shares of the Portfolio are based on the average net assets of the Portfolio for each of the periods listed in the tables. To the extent that the Portfolio's average net assets decrease over the Portfolio's next fiscal year, such expense ratios can be expected to increase, potentially significantly, because certain fixed costs will be spread over a smaller amount of assets.
The information has been audited by Ernst & Young LLP, the Fund's independent registered public accounting firm. Ernst & Young LLP's report, along with the Portfolio's financial statements, are incorporated by reference in the SAI and are included in the Fund's Annual Report to Shareholders. The Annual Report to Shareholders and the Portfolio's financial statements, as well as the SAI, are available at no cost from the Fund at the toll-free number noted on the back cover to this Prospectus.
18
Mid Cap Growth Portfolio Prospectus
January 31, 2012
Financial Highlights
Mid Cap Growth Portfolio
| Class I | |||||||||||||||||||||||
| Year Ended September 30, | |||||||||||||||||||||||
| Selected Per Share Data and Ratios | 2011 | 2010 | 2009 | 2008 | 2007 | ||||||||||||||||||
| Net Asset Value, Beginning of Period | $ | 33.58 | $ | 26.96 | $ | 23.99 | $ | 33.68 | $ | 25.21 | |||||||||||||
| Income (Loss) from Investment Operations: | |||||||||||||||||||||||
| Net Investment Income† | 0.03 | 0.11 | 0.03 | 0.05¥ | 0.17 | ||||||||||||||||||
| Net Realized and Unrealized Gain (Loss) | 0.14 | 6.52 | 2.94 | (9.58 | ) | 8.42 | |||||||||||||||||
| Total from Investment Operations | 0.17 | 6.63 | 2.97 | (9.53 | ) | 8.59 | |||||||||||||||||
| Distributions from and/or in Excess of: | |||||||||||||||||||||||
| Net Investment Income | (0.10 | ) | (0.01 | ) | — | (0.16 | ) | (0.12 | ) | ||||||||||||||
| Redemption Fees | — | — | 0.00 | ‡ | 0.00 | ‡ | 0.00 | ‡ | |||||||||||||||
| Net Asset Value, End of Period | $ | 33.65 | $ | 33.58 | $ | 26.96 | $ | 23.99 | $ | 33.68 | |||||||||||||
| Total Return++ | 0.47 | % | 24.58 | % | 12.38 | %** | (28.42 | )%¥ | 34.24 | % | |||||||||||||
| Ratios and Supplemental Data: | |||||||||||||||||||||||
| Net Assets, End of Period (Thousands) | $ | 3,797,139 | $ | 3,012,006 | $ | 2,005,809 | $ | 1,609,506 | $ | 1,647,326 | |||||||||||||
| Ratio of Expenses to Average Net Assets | 0.69 | %+†† | 0.68 | %+†† | 0.69 | %+ | 0.63 | %+ | 0.63 | %+ | |||||||||||||
| Ratio of Net Investment Income to Average Net Assets | 0.07 | %+†† | 0.38 | %+†† | 0.16 | %+ | 0.17 | %+ | 0.57 | %+ | |||||||||||||
| Ratio of Rebate from Morgan Stanley Affiliates to Average Net Assets | 0.01 | % | 0.01 | % | 0.01 | % | 0.00 | %§ | 0.00 | %§ | |||||||||||||
| Portfolio Turnover Rate | 35 | % | 23 | % | 27 | % | 37 | % | 64 | % | |||||||||||||
† Per share amount is based on average shares outstanding.
¥ During the year, the Portfolio received a regulatory settlement from an unaffiliated third party, which had an impact of less than $0.005 on net investment income per share and less than 0.005% on total returns for Class I.
‡ Amount is less than $0.005 per share.
++ Calculated based on the net asset value as of the last business day of the period.
** Performance was positively impacted by approximately 0.04% due to the receipt of proceeds from the settlements of class action suits involving primarily two of the Portfolio's past holdings. This was a one-time settlement, and as a result, the impact on the NAV and consequently the performance will not likely be repeated in the future. Had these settlements not occurred, the total return for Class I shares would have been approximately 12.34%.
+ The Ratios of Expenses and Net Investment Income reflect the rebate of certain Portfolio expenses in connection with the investments in Morgan Stanley affiliates during the period. The effect of the rebate on the ratios is disclosed in the above table as "Ratio of Rebate from Morgan Stanley Affiliates to Average Net Assets."
†† Reflects overall Portfolio ratios for investment income and non-class specific expenses.
§ Amount is less than 0.005%.
19
Financial Highlights
Mid Cap Growth Portfolio
| Class P | |||||||||||||||||||||||
| Year Ended September 30, | |||||||||||||||||||||||
| Selected Per Share Data and Ratios | 2011 | 2010 | 2009 | 2008 | 2007 | ||||||||||||||||||
| Net Asset Value, Beginning of Period | $ | 32.51 | $ | 26.15 | $ | 23.33 | $ | 32.78 | $ | 24.54 | |||||||||||||
| Income (Loss) from Investment Operations: | |||||||||||||||||||||||
| Net Investment Income (Loss)† | (0.07 | ) | 0.04 | (0.02 | ) | (0.02 | )¥ | 0.09 | |||||||||||||||
| Net Realized and Unrealized Gain (Loss) | 0.15 | 6.32 | 2.84 | (9.34 | ) | 8.20 | |||||||||||||||||
| Total from Investment Operations | 0.08 | 6.36 | 2.82 | (9.36 | ) | 8.29 | |||||||||||||||||
| Distributions from and/or in Excess of: | |||||||||||||||||||||||
| Net Investment Income | (0.04 | ) | — | — | (0.09 | ) | (0.05 | ) | |||||||||||||||
| Redemption Fees | — | — | 0.00 | ‡ | 0.00 | ‡ | 0.00 | ‡ | |||||||||||||||
| Net Asset Value, End of Period | $ | 32.55 | $ | 32.51 | $ | 26.15 | $ | 23.33 | $ | 32.78 | |||||||||||||
| Total Return++ | 0.22 | % | 24.32 | % | 12.04 | %** | (28.59 | )%¥ | 33.89 | % | |||||||||||||
| Ratios and Supplemental Data: | |||||||||||||||||||||||
| Net Assets, End of Period (Thousands) | $ | 2,595,397 | $ | 2,465,552 | $ | 1,567,302 | $ | 1,236,945 | $ | 1,520,096 | |||||||||||||
| Ratio of Expenses to Average Net Assets (1) | 0.94 | %+†† | 0.93 | %+†† | 0.96 | %+ | 0.88 | %+ | 0.88 | %+ | |||||||||||||
| Ratio of Net Investment Income (Loss) to Average Net Assets (1) | (0.18 | )%+†† | 0.13 | %+†† | (0.11 | )%+ | (0.07 | )%+ | 0.31 | %+ | |||||||||||||
| Ratio of Rebate from Morgan Stanley Affiliates to Average Net Assets | 0.01 | % | 0.01 | % | 0.01 | % | 0.00 | %§ | 0.00 | %§ | |||||||||||||
| Portfolio Turnover Rate | 35 | % | 23 | % | 27 | % | 37 | % | 64 | % | |||||||||||||
| (1) Supplemental Information on the Ratios to Average Net Assets: | |||||||||||||||||||||||
| Ratios Before Expense Limitation: | |||||||||||||||||||||||
| Expenses to Average Net Assets | N/A | N/A | N/A | 0.89 | %+ | N/A | |||||||||||||||||
| Net Investment Loss to Average Net Assets | N/A | N/A | N/A | (0.08 | )%+ | N/A | |||||||||||||||||
† Per share amount is based on average shares outstanding.
¥ During the year, the Portfolio received a regulatory settlement from an unaffiliated third party, which had an impact of less than $0.005 on net investment income per share and less than 0.005% on total returns for Class P.
‡ Amount is less than $0.005 per share.
++ Calculated based on the net asset value as of the last business day of the period.
** Performance was positively impacted by approximately 0.04% due to the receipt of proceeds from the settlements of class action suits involving primarily two of the Portfolio's past holdings. This was a one-time settlement, and as a result, the impact on the NAV and consequently the performance will not likely be repeated in the future. Had these settlements not occurred, the total return for Class P shares would have been approximately 12.00%.
+ The Ratios of Expenses and Net Investment Income (Loss) reflect the rebate of certain Portfolio expenses in connection with the investments in Morgan Stanley affiliates during the period. The effect of the rebate on the ratios is disclosed in the above table as "Ratio of Rebate from Morgan Stanley Affiliates to Average Net Assets."
†† Reflects overall Portfolio ratios for investment income and non-class specific expenses.
§ Amount is less than 0.005%.
20
(This page intentionally left blank)
21
Where to Find Additional Information
In addition to this Prospectus, the Fund has a Statement of Additional Information, dated January 31, 2012, which contains additional, more detailed information about the Fund and the Portfolio. The Statement of Additional Information is incorporated by reference into this Prospectus and, therefore, legally forms a part of this Prospectus.
The Fund publishes Annual and Semi-Annual Reports to Shareholders ("Shareholder Reports") that contain additional information about the Portfolio's investments. In the Fund's Annual Report to Shareholders, you will find a discussion of the market conditions and the investment strategies that significantly affected the Portfolio's performance during the last fiscal year. For additional Fund information, including information regarding the investments comprising the Portfolio, please call the toll-free number below.
You may obtain the Statement of Additional Information and Shareholder Reports without charge by contacting the Fund at the toll-free number below or on our internet site at: www.morganstanley.com/im. If you purchased shares through a financial intermediary, you may also obtain these documents, without charge, by contacting your financial intermediary.
Information about the Fund, including the Statement of Additional Information and Shareholder Reports, may be obtained from the Commission in any of the following ways. (1) In person: you may review and copy documents in the Commission's Public Reference Room in Washington D.C. (for information on the operation of the Public Reference Room call 1-202-551-8090); (2) On-line: you may retrieve information from the Commission's web site at http://www.sec.gov; (3) By mail: you may request documents, upon payment of a duplicating fee, by writing to the Securities and Exchange Commission, Public Reference Section, Washington, D.C. 20549-1520; or (4) By e-mail: you may request documents, upon payment of a duplicating fee, by e-mailing the Commission at the following address: publicinfo@sec.gov.
Morgan Stanley Institutional Fund Trust
c/o Morgan Stanley Services Company Inc.
P.O. Box 219804
Kansas City, MO 64121-9804
For Shareholder Inquiries,
1-800-354-7786.
Prices and Investment Results are available at www.morganstanley.com/im.
The Fund's Investment Company Act registration number is 811-03980.

IFTMCGPRO 01/12
Prospectus Supplement
June 12, 2012
Morgan Stanley Institutional Fund Trust
Supplement dated June 12, 2012 to the Morgan Stanley Institutional Fund Trust (the "Fund") Prospectus dated April 30, 2012 of:
Mid Cap Growth Portfolio
Effective June 15, 2012, the first paragraph under the section entitled "Portfolio Summary—Purchase and Sale of Fund Shares" is hereby deleted and replaced with the following:
On June 15, 2012, the Fund suspended offering Class L and Class H shares of the Portfolio to new investors. The Fund will continue to offer Class L and Class H shares of the Portfolio in certain circumstances. For more information, please refer to the "Purchasing Class L Shares" and "Purchasing Class H Shares" sections beginning on pages 10 and 11, respectively, of this Prospectus.
Effective June 15, 2012, the first paragraph under the section entitled "Purchasing Class L Shares" is hereby deleted and replaced with the following:
On June 15, 2012, the Fund suspended offering Class L shares of the Portfolio to new investors, except as follows. The Fund will continue to offer Class L shares of the Portfolio (1) through certain retirement plan accounts, (2) to clients of certain registered investment advisers who currently offer Class L shares of the Portfolio in their asset allocation programs, (3) to directors and trustees of the Morgan Stanley Funds, (4) to Morgan Stanley affiliates and their employees and (5) to benefit plans sponsored by Morgan Stanley and its affiliates. The Fund will continue to offer Class L shares of the Portfolio to existing shareholders and, as market conditions permit, may recommence offering Class L shares of the Portfolio to other new investors in the future. Any such offerings of the Portfolio's Class L shares may be limited in amount and may commence and terminate without any prior notice.
Effective June 15, 2012, the first paragraph under the section entitled "Purchasing Class H Shares" is hereby deleted and replaced with the following:
On June 15, 2012, the Fund suspended offering Class H shares of the Portfolio to new investors, except as follows. The Fund will continue to offer Class H shares of the Portfolio (1) through certain retirement plan accounts, (2) to clients of certain registered investment advisers who currently offer Class H shares of the Portfolio in their asset allocation programs, (3) to directors and trustees of the Morgan Stanley Funds, (4) to Morgan Stanley affiliates and their employees and (5) to benefit plans sponsored by Morgan Stanley and its affiliates. The Fund will continue to offer Class H shares of the Portfolio to existing shareholders and, as market conditions permit, may recommence offering Class H shares of the Portfolio to other new investors in the future. Any such offerings of the Portfolio's Class H shares may be limited in amount and may commence and terminate without any prior notice.
Please retain this supplement for future reference.
IFTMCGHLSPT 6/12
INVESTMENT MANAGEMENT

Morgan Stanley
Institutional Fund Trust

Mid Cap Growth Portfolio
| Share Class and Ticker Symbol | |||||||||||
| Portfolio | Class H | Class L | |||||||||
| Mid Cap Growth Portfolio | MSKHX | MSKLX | |||||||||
Prospectus
April 30, 2012

The Securities and Exchange Commission ("SEC") has not approved or disapproved these securities or passed upon the adequacy of this Prospectus. Any representation to the contrary is a criminal offense.
Mid Cap Growth Portfolio Prospectus
April 30, 2012
Table of Contents
| Page | |||||||
| Portfolio Summary | 1 | ||||||
| Details of the Portfolio | 4 | ||||||
| Additional Information about the Portfolio's Investment Strategies and Related Risks | 6 | ||||||
| Portfolio Holdings | 9 | ||||||
| Purchasing Class L Shares | 10 | ||||||
| Purchasing Class H Shares | 11 | ||||||
| Redeeming Shares | 14 | ||||||
| Frequent Purchases and Redemptions of Shares | 15 | ||||||
| General Shareholder Information | 16 | ||||||
| Fund Management | 18 | ||||||
| Financial Highlights | 20 | ||||||
Portfolio Summary
Objective
The Mid Cap Growth Portfolio seeks long-term capital growth.
Fees and Expenses
The table below describes the fees and expenses that you may pay if you buy and hold shares of the Portfolio. For shareholders of Class H shares, you may qualify for sales charge discounts if the cumulative net asset value ("NAV") of Class H shares of the Portfolio purchased in a single transaction, together with the NAV of all Class H shares of a portfolio of Morgan Stanley Institutional Fund Trust (the "Fund") or of a portfolio of Morgan Stanley Institutional Fund, Inc. held in related accounts, amounts to $50,000 or more. More information about these and other discounts is available from your financial adviser and in the "Purchasing Class H Shares" section on page 11 of this Prospectus.
Shareholder Fees (fees paid directly from your investment)
| Class H | Class L | ||||||||||
| Maximum sales charge (load) imposed on purchases (as a percentage of offering price) | 4.75 | %† | None | ||||||||
Annual Portfolio Operating Expenses
(expenses that you pay each year as a percentage of the value of your investment)
| Class H | Class L | ||||||||||
| Advisory Fee | 0.50 | % | 0.50 | % | |||||||
| Distribution and/or Service (12b-1) Fee | 0.25 | % | 0.75 | % | |||||||
| Other Expenses‡ | 0.20 | % | 0.20 | % | |||||||
| Total Annual Portfolio Operating Expenses | 0.95 | % | 1.45 | % | |||||||
Example
The example below is intended to help you compare the cost of investing in the Portfolio with the cost of investing in other mutual funds.
The example assumes that you invest $10,000 in the Portfolio, your investment has a 5% return each year and that the Portfolio's operating expenses remain the same. Although your actual costs may be higher or lower, based on these assumptions your costs would be:
| 1 Year | 3 Years | ||||||||||
| Class H | $ | 567 | $ | 763 | |||||||
| Class L | $ | 148 | $ | 459 | |||||||
† The sales charge is calculated as a percentage of the offering price. The sales charge is reduced for purchases of $50,000 and over. See "Purchasing Class H Shares."
‡ Other expenses have been estimated for the current fiscal year.
Portfolio Turnover
The Portfolio pays transaction costs, such as commissions, when it buys and sells securities (or "turns over" its portfolio). A higher portfolio turnover rate may indicate higher transaction costs and may result in higher taxes when Portfolio shares are held in a taxable account. These costs, which are not reflected in Total Annual Portfolio Operating Expenses or in the Example, affect the Portfolio's performance. During the most recent fiscal year, the Portfolio's portfolio turnover rate was 35% of the average value of its portfolio.
Principal Investment Strategies
Under normal circumstances, at least 80% of the Portfolio's assets will be invested in common stocks of mid cap companies. The Portfolio's "Adviser," Morgan Stanley Investment Management Inc., seeks long-term capital growth by investing primarily in established and emerging companies with capitalizations within the range of companies included in the Russell Midcap® Growth Index, which as of December 31, 2011 was between $117 million and $20.4 billion. The Adviser emphasizes a bottom-up stock selection process, seeking attractive investments on an individual company basis. The Adviser seeks to invest in high quality companies it believes have sustainable competitive advantages and the ability to redeploy capital at high rates of return. The Adviser typically favors companies with rising returns on invested capital, above average business visibility, strong free cash flow generation and an attractive risk/reward. The Portfolio may also use derivative instruments as discussed herein. These derivative instruments will be counted towards the 80% policy discussed above to the extent they have economic characteristics similar to the securities included within that policy.
The Portfolio may invest up to 25% of its net assets in securities of foreign issuers, including issuers located in emerging market or developing countries. The securities in which the Portfolio may invest may be denominated in U.S. dollars or in currencies other than U.S. dollars. The Portfolio may invest in privately placed and restricted securities. In addition, the Portfolio may invest in convertible securities.
The Portfolio may utilize foreign currency forward exchange contracts, which are derivatives, in connection with its investments in foreign securities.
Principal Risks
An investment in the Portfolio is subject to risks, and you could lose money on your investment in the Portfolio. There can be no assurance that the Portfolio will achieve its investment objective. An investment in the Portfolio is not a deposit of any bank or other insured depository institution and is not insured or guaranteed by the Federal Deposit Insurance Corporation or any other government agency.
The Portfolio's principal investment strategies are subject to the following principal risks:
• Common Stock and Other Equity Securities. In general, stock values fluctuate, and sometimes widely fluctuate, in response to activities specific to the company as well as general market, economic and political conditions. To the extent that the Portfolio invests in convertible securities, and the convertible security's investment value is greater than its conversion value, its price will be likely to increase when interest rates fall and decrease when interest rates rise. If the conversion value exceeds the investment value, the price of the
morganstanley.com/im
1
convertible security will tend to fluctuate directly with the price of the underlying security.
• Mid Capitalization Companies. Investments in mid cap companies may involve greater risk than investments in larger, more established companies. The securities issued by mid cap companies may be less liquid, and such companies may have more limited markets, financial resources and product lines, and may lack the depth of management of larger companies.
• Foreign and Emerging Market Securities. Investments in foreign markets entail special risks such as currency, political, economic and market risks. There also may be greater market volatility, less reliable financial information, higher transaction and custody costs, decreased market liquidity and less government and exchange regulation associated with investments in foreign markets. In addition, investments in certain foreign markets, which have historically been considered stable, may become more volatile and subject to increased risk due to ongoing developments and changing conditions in such markets. Moreover, the growing interconnectivity of global economies and financial markets has increased the probability that adverse developments and conditions in one country or region will affect the stability of economies and financial markets in other countries or regions. The risks of investing in emerging market countries are greater than risks associated with investments in foreign developed countries. In addition, the Portfolio's investments may be denominated in foreign currencies and therefore, changes in the value of a country's currency compared to the U.S. dollar may affect the value of the Portfolio's investments. Hedging the Portfolio's currency risks through foreign currency forward exchange contracts involves the risk of mismatching the Portfolio's objectives under a foreign currency forward exchange contract with the value of securities denominated in a particular currency. There is additional risk to the effect that currency contracts create exposure to currencies in which the Portfolio's securities are not denominated. The use of foreign currency forward exchange contracts involves the risk of loss from the insolvency or bankruptcy of the counterparty to the contract or the failure of the counterparty to make payments or otherwise comply with the terms of the contract.
• Privately Placed and Restricted Securities. The Portfolio's investments may also include privately placed securities, which are subject to resale restrictions. These securities will have the effect of increasing the level of Portfolio illiquidity to the extent the Portfolio may be unable to sell or transfer these securities due to restrictions on transfers or on the ability to find buyers interested in purchasing the securities. The illiquidity of the market, as well as the lack of publicly available information regarding these securities, may also adversely affect the ability to arrive at a fair value for certain securities at certain times and could make it difficult for the Portfolio to sell certain securities.
Performance Information
The bar chart and table below provide some indication of the risks of investing in the Portfolio by showing changes in the Portfolio's Class I shares' performance from year-to-year and by showing how the Portfolio's average annual returns for the past one, five and 10 year periods compare with those of a broad measure of market performance, as well as an index that represents a group of similar mutual funds, over time. The performance of the other Classes will differ because the Classes have different ongoing fees. The Portfolio's past performance, before and after taxes, is not necessarily an indication of how the Portfolio will perform in the future. Updated performance information is available online at www.morganstanley.com/im.
Annual Total Returns—Calendar Years (Class I)*
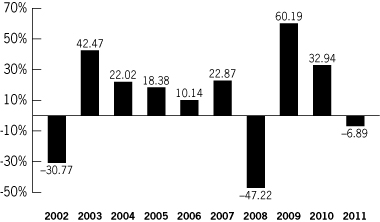
| High Quarter | 6/30/09 | 26.71 | % | ||||||||
| Low Quarter | 12/31/08 | –26.68 | % | ||||||||
Average Annual Total Returns For Periods Ended December 31, 2011
| Past One Year | Past Five Years | Past Ten Years | |||||||||||||
| Class I* | |||||||||||||||
| Return before Taxes | –6.89 | % | 5.15 | % | 7.27 | % | |||||||||
| Return after Taxes on Distributions | –7.68 | % | 4.95 | % | 7.16 | % | |||||||||
| Return after Taxes on Distributions and Sale of Fund Shares | –3.55 | % | 4.43 | % | 6.42 | % | |||||||||
| Class H* | |||||||||||||||
| Return before Taxes | N/A | N/A | N/A | ||||||||||||
| Class L* | |||||||||||||||
| Return before Taxes | N/A | N/A | N/A | ||||||||||||
| Russell Midcap® Growth Index (reflects no deduction for fees, expenses or taxes)1 | –1.65 | % | 2.44 | % | 5.29 | % | |||||||||
| Lipper Multi-Cap Growth Funds Index (reflects no deductions for taxes)2 | –4.02 | % | 0.87 | % | 2.78 | % | |||||||||
* Class I shares are not offered in this Prospectus. As of December 31, 2011, the Fund had not commenced offering Class H and Class L shares of the Portfolio. The returns for Class H and Class L shares would be lower than the returns for Class I shares of the Portfolio as expenses of Class H and Class L are higher. Return information for the Portfolio's Class H and Class L shares will be shown in future prospectuses offering the Portfolio's Class H and Class L shares after the Portfolio's Class H and Class L shares have a full calendar year of return information to report.
1 The Russell Midcap® Growth Index measures the performance of the mid-cap growth segment of the U.S. equity universe. It includes those Russell Midcap® Index companies with higher price-to-book ratios and higher forecasted growth values. The Russell Midcap® Index is a subset of the Russell 1000® Index and includes approximately 800 of the smallest securities in the Russell 1000® Index, which in turn consists of approximately 1,000 of the largest U.S. securities based on a combination of market capitalization and current index membership. It is not possible to invest directly in an index.
2 The Lipper Multi-Cap Growth Funds Index is an equally weighted performance index of the largest qualifying funds (based on net assets) in the Lipper Multi-Cap Growth Funds classification. There are currently 30 funds represented in this Index.
The after-tax returns shown in the table above are calculated using the historical highest individual federal marginal income tax rates during the period shown and do not reflect the impact of state and local taxes. After-tax returns for the Portfolio's other Classes will vary from Class I shares' returns. Actual after-tax returns depend on the investor's tax situation and may differ from those shown, and after-tax returns are not relevant to investors who hold their Portfolio shares
2
through tax deferred arrangements such as 401(k) plans or individual retirement accounts. After-tax returns may be higher than before-tax returns due to foreign tax credits and/or an assumed benefit from capital losses that would have been realized had Portfolio shares been sold at the end of the relevant periods, as applicable.
Adviser. Morgan Stanley Investment Management Inc.
Portfolio Managers. The Portfolio is managed by members of the Growth team. Information about the members jointly and primarily responsible for the day-to-day management of the Portfolio is shown below:
| Name | Title with Adviser | Date Began Managing Portfolio | |||||||||
| Dennis P. Lynch | Managing Director | January 2002 | |||||||||
| David S. Cohen | Managing Director | January 2002 | |||||||||
| Sam G. Chainani | Managing Director | June 2004 | |||||||||
| Alexander T. Norton | Executive Director | July 2005 | |||||||||
| Jason C. Yeung | Managing Director | September 2007 | |||||||||
| Armistead B. Nash | Executive Director | September 2008 | |||||||||
Purchase and Sale of Fund Shares
The Fund is not currently offering Class H and Class L shares of the Portfolio. The Fund may commence offering Class H and Class L shares of the Portfolio in the future. Any such offerings of the Portfolio's Class H and Class L shares may commence and terminate without any prior notice.
The minimum initial investment generally is $25,000 for each of Class H and Class L shares of the Portfolio. You may not be subject to the minimum investment requirements under certain circumstances. For more information, please refer to the "Purchasing Class L Shares—Share Class Arrangements," "—Other Purchase Information" and "Purchasing Class H Shares" sections beginning on pages 10, 11 and 11, respectively, of this Prospectus.
Class L shares may be purchased or sold on any day the New York Stock Exchange ("NYSE") is open for business directly through Morgan Stanley Institutional Fund Trust (the "Fund") by mail (c/o Morgan Stanley Services Company Inc., P.O. Box 219804, Kansas City, MO 64121-9804) or by telephone (1-800-548-7786) or by contacting your financial intermediary.
For more information, please refer to the "Purchasing Class L Shares" and "Redeeming Shares" sections beginning on pages 10 and 14, respectively, of this Prospectus.
Class H shares of the Portfolio may be purchased or redeemed by contacting your authorized financial representative.
Tax Information
The Portfolio intends to make distributions that may be taxed as ordinary income or capital gains, unless you are investing through a tax-deferred arrangement, such as a 401(k) plan or an individual retirement account.
Payments to Broker-Dealers and Other Financial Intermediaries
If you purchase the Portfolio through a broker-dealer or other financial intermediary (such as a bank), the Adviser and/or the Portfolio's "Distributor," Morgan Stanley Distribution, Inc. may pay the intermediary for the sale of Portfolio shares and related services. These payments, which may be significant in amount, may create a conflict of interest by influencing the broker-dealer or other intermediary and your salesperson to recommend the Portfolio over another investment. Ask your salesperson or visit your financial intermediary's web site for more information.
morganstanley.com/im
3
Details of the Portfolio
Objective
The Mid Cap Growth Portfolio seeks long-term capital growth.
Approach
The Adviser seeks long-term capital growth by investing primarily in established and emerging companies with capitalizations within the range of companies included in the Russell MidCap® Growth Index.
The Portfolio may invest up to 25% of its net assets in securities of foreign issuers, including issuers located in emerging market or developing countries. The securities in which the Portfolio may invest may be denominated in U.S. dollars or in currencies other than U.S. dollars.
Process
The Adviser emphasizes a bottom-up stock selection process, seeking attractive investments on an individual company basis. The Adviser seeks to invest in high quality companies it believes have sustainable competitive advantages and the ability to redeploy capital at high rates of return. The Adviser typically favors companies with rising returns on invested capital, above average business visibility, strong free cash flow generation and an attractive risk/reward. The Adviser generally considers selling a portfolio holding when it determines that the holding no longer satisfies its investment criteria.
Under normal circumstances, at least 80% of the Portfolio's assets will be invested in common stocks of mid cap companies. This policy may be changed without shareholder approval; however, you would be notified in writing of any changes. The Portfolio may also use derivative instruments as discussed herein. These derivative instruments will be counted toward the 80% policy discussed above to the extent they have economic characteristics similar to the securities included within that policy.
In accordance with the Portfolio's investment strategy of investing in mid cap companies, the capitalization range of securities in which the Portfolio may invest is consistent with the capitalization range of the Russell Midcap® Growth Index, which as of December 31, 2011 was between $117 million and $20.4 billion. The market capitalization limit is subject to adjustment annually based upon the Adviser's assessment as to the capitalization range of companies which possess the fundamental characteristics of mid cap companies. The Portfolio may invest in convertible securities. The Portfolio may invest up to 10% of its assets in real estate investment trusts ("REITs"). The Portfolio may also invest in privately placed and restricted securities.
The Portfolio may utilize foreign currency forward exchange contracts, which are derivatives, in connection with its investments in foreign securities.
Principal Risks
The Portfolio's principal investment strategies are subject to the following principal risks:
The Portfolio is subject to various risks that could adversely affect its NAV and total return. It is possible for an investor to lose money by investing in the Portfolio.
The prices of common stocks rise and fall in response to events that affect entire financial markets or industries, and to events that affect a particular issuer. Investments in mid cap companies may involve greater risk than investments in larger, more established companies. The securities issued by mid cap companies may be less liquid and their prices subject to more abrupt or erratic price movements. In addition, mid cap companies may have more limited markets, financial resources and product lines, and may lack the depth of management of larger companies.
To the extent that the Portfolio invests in convertible securities, and the convertible security's investment value is greater than its conversion value, its price will be likely to increase when interest rates fall and decrease when interest rates rise. If the conversion value exceeds the investment value, the price of the convertible security will tend to fluctuate directly with the price of the underlying security.
Investing in the securities of foreign issuers, particularly those located in emerging market or developing countries, entails the risk that news and events unique to a country or region will affect those markets and their issuers. The value of the Portfolio's
4
Mid Cap Growth Portfolio Prospectus
April 30, 2012
Details of the Portfolio (Cont'd)
shares may vary widely in response to political and economic factors affecting companies in foreign countries. These same events will not necessarily have an effect on the U.S. economy or similar issuers located in the United States. In addition, investments in certain foreign markets, which have historically been considered stable, may become more volatile and subject to increased risk due to ongoing developments and changing conditions in such markets. Moreover, the growing interconnectivity of global economies and financial markets has increased the probability that adverse developments and conditions in one country or region will affect the stability of economies and financial markets in other countries or regions.
The Portfolio's investments may be denominated in foreign currencies. As a result, changes in the value of a country's currency compared to the U.S. dollar may affect the value of the Portfolio's investments. These changes may occur separately from and in response to events that do not otherwise affect the value of the security in the issuer's home country. Hedging the Portfolio's currency risks through foreign currency forward exchange contracts involves the risk of mismatching the Portfolio's objectives under a foreign currency forward exchange contract with the value of securities denominated in a particular currency. Furthermore, such transactions reduce or preclude the opportunity for gain if the value of the currency should move in the direction opposite to the position taken. There is additional risk to the effect that currency contracts create exposure to currencies in which the Portfolio's securities are not denominated. Unanticipated changes in currency prices may result in poorer overall performance for the Portfolio than if it had not entered into such contracts. The use of foreign currency forward exchange contracts involves the risk of loss from the insolvency or bankruptcy of the counterparty to the contract or the failure of the counterparty to make payments or otherwise comply with the terms of the contract.
REITs pool investors' funds for investments primarily in real estate properties. Like mutual funds, REITs have expenses, including advisory and administration fees, that are paid by their shareholders. As a result, shareholders will absorb duplicate levels of fees when the Portfolio invests in REITs. The performance of any Portfolio REIT holdings ultimately depends on the types of real property in which the REITs invest and how well the property is managed. A general downturn in real estate values also can hurt REIT performance. In addition, REITs are subject to certain provisions under federal tax law. The failure of a company to qualify as a REIT could have adverse consequences for the Portfolio, including significantly reducing return to the Portfolio on its investment in such company.
The Portfolio's investments may also include privately placed securities, which are subject to resale restrictions. These securities will have the effect of increasing the level of Portfolio illiquidity to the extent the Portfolio may be unable to sell or transfer these securities due to restrictions on transfers or on the ability to find buyers interested in purchasing the securities. The illiquidity of the market, as well as the lack of publicly available information regarding these securities, may also adversely affect the ability to arrive at a fair value for certain securities at certain times and could make it difficult for the Portfolio to sell certain securities.
Please see "Additional Information about the Portfolio's Investment Strategies and Related Risks" for further information about these and other risks of investing in the Portfolio.
5
Additional Information about the Portfolio's Investment Strategies and Related Risks
This section discusses additional information relating to the Portfolio's investment strategies, other types of investments that the Portfolio may make and related risk factors. The Portfolio's investment practices and limitations are also described in more detail in the Statement of Additional Information ("SAI"), which is incorporated by reference and legally is a part of this Prospectus. For details on how to obtain a copy of the SAI and other reports and information, see the back cover of this Prospectus.
Equity Securities
Equity securities may include common and preferred stocks, convertible securities and equity-linked securities, rights and warrants to purchase common stocks, American Depositary Receipts ("ADRs"), limited partnership interests, other specialty securities having equity features and shares of investment companies. The Portfolio may invest in equity securities that are publicly traded on securities exchanges or over-the-counter or in equity securities that are not publicly traded. Securities that are not publicly traded may be more difficult to sell and their value may fluctuate more dramatically than other securities. For purposes of the Portfolio, companies traded on a U.S. exchange include companies listed on Nasdaq.
ADRs are U.S. dollar-denominated securities that represent claims to shares of foreign stocks. The Portfolio treats ADRs as U.S. securities for purposes of foreign investment limitations.
Growth stocks generally have higher growth rates, betas and price/earnings ratios, and lower yields than the stock market in general as measured by an appropriate stock market index. Value stocks are stocks that are deemed by the Adviser to be undervalued relative to the stock market in general. The Adviser makes value decisions guided by the appropriate market index, based on value characteristics such as price/earnings and price/book ratios. Value stocks generally are dividend paying common stocks. However, non-dividend paying stocks also may be selected for their value characteristics.
IPOs
The Portfolio may purchase shares issued as part of, or a short period after, companies' initial public offerings ("IPOs"), and may at times dispose of those shares shortly after their acquisition. The Portfolio's purchase of shares issued in IPOs exposes it to the risks associated with companies that have little operating history as public companies, as well as to the risks inherent in those sectors of the market where these new issuers operate. The market for IPO issuers has been volatile, and share prices of newly-public companies have fluctuated in significant amounts over short periods of time. The purchase of shares issued in IPOs may have a greater impact upon the Portfolio's total returns during any period that the Portfolio has a small asset base. As the Portfolio's assets grow, any impact of IPO investments on the Portfolio's total return may decline.
Fixed Income Securities
Fixed income securities are securities that pay a fixed or a variable rate of interest until a stated maturity date. Fixed income securities include U.S. government securities, securities issued by federal or federally sponsored agencies and instrumentalities ("agencies"), corporate bonds and notes, asset-backed securities, mortgage securities, high yield securities (commonly referred to as "junk bonds" or high risk securities), municipal bonds, loan participations and assignments, zero coupon bonds, convertible securities, Eurobonds, Brady Bonds, Yankee Bonds, repurchase agreements, commercial paper and cash equivalents.
These securities are subject to risks related to changes in interest rates and in the financial health or credit rating of the issuers. The maturity and duration of a fixed income instrument also affects the extent to which the price of the security will change in response to these and other factors. Longer term securities tend to experience larger price changes than shorter term securities because they are more sensitive to changes in interest rates or in the credit ratings of the issuers.
Fixed income securities may be called (i.e., redeemed by the issuer) prior to final maturity. If a callable security is called, the Portfolio may have to reinvest the proceeds at a lower rate of interest.
Foreign Securities
Foreign issuers generally are subject to different accounting, auditing and financial reporting
6
Mid Cap Growth Portfolio Prospectus
April 30, 2012
standards than U.S. issuers. There may be less information available to the public about foreign issuers. Securities of foreign issuers can be less liquid and experience greater price movements. In addition, the prices of such securities may be susceptible to influence by large traders, due to the limited size of many foreign securities markets. Moreover, investments in certain foreign markets, which have historically been considered stable, may become more volatile and subject to increased risk due to ongoing developments and changing conditions in such markets. Also, the growing interconnectivity of global economies and financial markets has increased the probability that adverse developments and conditions in one country or region will affect the stability of economies and financial markets in other countries or regions. In some foreign countries, there is also the risk of government expropriation, excessive taxation, political or social instability, the imposition of currency controls, or diplomatic developments that could affect an investing portfolio's investment. There also can be difficulty obtaining and enforcing judgments against issuers in foreign countries. Foreign stock exchanges, broker-dealers and listed issuers may be subject to less government regulation and oversight. The cost of investing in foreign securities, including brokerage commissions and custodial expenses, can be higher than in the United States.
In connection with its investments in foreign securities, the Portfolio also may enter into contracts with banks, brokers or dealers to purchase or sell securities or foreign currencies at a future date. A foreign currency forward contract is a negotiated agreement between the contracting parties to exchange a specified amount of currency at a specified future time at a specified rate. The rate can be higher or lower than the spot rate between the currencies that are the subject of the contract. Foreign currency forward exchange contracts may be used to protect against uncertainty in the level of future foreign currency exchange rates or to gain or modify exposure to a particular currency. In addition, the Portfolio may use cross currency hedging or proxy hedging with respect to currencies in which the Portfolio has or expects to have portfolio or currency exposure. Cross currency hedges involve the sale of one currency against the positive exposure to a different currency and may be used for hedging purposes or to establish an active exposure to the exchange rate between any two currencies.
Foreign Currency
The Portfolio's investments may be denominated in foreign currencies. The value of foreign currencies fluctuates relative to the value of the U.S. dollar. Since the Portfolio may invest in such non-U.S. dollar-denominated securities, and therefore may convert the value of such securities into U.S. dollars, changes in currency exchange rates can increase or decrease the U.S. dollar value of the Portfolio's assets. The Adviser may use derivatives to reduce this risk. The Adviser may in its discretion choose not to hedge against currency risk. In addition, certain market conditions may make it impossible or uneconomical to hedge against currency risk.
Emerging Market Securities
Investing in emerging market securities enhances the risks of foreign investing. In addition, emerging market securities generally are less liquid and subject to wider price and currency fluctuations than securities issued in more developed countries. In certain countries, the market may be dominated by a few issuers or sectors. Investment funds and structured investments are mechanisms for U.S. and other investors to invest in certain emerging markets that have laws precluding or limiting direct investments by foreign investors.
Convertible Securities
A convertible security is a bond, debenture, note, preferred stock, right, warrant or other security that may be converted into or exchanged for a prescribed amount of common stock or other security of the same or a different issuer or into cash within a particular period of time at a specified price or formula. A convertible security generally entitles the holder to receive interest paid or accrued on debt securities or the dividend paid on preferred stock until the convertible security matures or is redeemed, converted or exchanged. Before conversion, convertible securities generally have characteristics similar to both debt and equity securities. The value of convertible securities tends to decline as interest rates rise and, because of the conversion feature, tends to vary with fluctuations in the market value of the underlying securities. Convertible securities ordinarily
7
provide a stream of income with generally higher yields than those of common stock of the same or similar issuers. Convertible securities generally rank senior to common stock in a corporation's capital structure but are usually subordinated to comparable nonconvertible securities. Convertible securities generally do not participate directly in any dividend increases or decreases of the underlying securities although the market prices of convertible securities may be affected by any dividend changes or other changes in the underlying securities.
Derivatives
The Portfolio may, but is not required to, use derivative instruments for a variety of purposes, including hedging, risk management, portfolio management or to earn income. Derivatives are financial instruments whose value is based on the value of an underlying asset, interest rate, index or financial instrument. A derivative instrument often has risks similar to its underlying asset and may have additional risks, including imperfect correlation between the value of the derivative and the underlying asset, risks of default by the counterparty to certain transactions, magnification of losses incurred due to changes in the market value of the securities, instruments, indices or interest rates to which they relate, and risks that the transactions may not be liquid. The use of derivatives involves risks that are different from, and possibly greater than, the risks associated with other portfolio investments. Derivatives may involve the use of highly specialized instruments that require investment techniques and risk analyses different from those associated with other portfolio investments.
Certain derivative transactions may give rise to a form of leverage. Leverage magnifies the potential for gain and the risk of loss. Leverage associated with derivative transactions may cause the Portfolio to liquidate portfolio positions when it may not be advantageous to do so to satisfy its obligations or to meet earmarking or segregation requirements, pursuant to applicable SEC rules and regulations, or may cause a Portfolio to be more volatile than if the Portfolio had not been leveraged. Although the Adviser seeks to use derivatives to further the Portfolio's investment objectives, there is no assurance that the use of derivatives will achieve this result.
The derivative instruments and techniques that the Portfolio may use include:
Futures. A futures contract is a standardized, exchange-traded agreement to buy or sell a specific quantity of an underlying instrument at a specific price at a specific future time. The value of a futures contract tends to increase and decrease in tandem with the value of the underlying instrument. Depending on the terms of the particular contract, futures contracts are settled through either physical delivery of the underlying instrument on the settlement date or by payment of a cash settlement amount on the settlement date. A decision as to whether, when and how to use futures involves the exercise of skill and judgment and even a well-conceived futures transaction may be unsuccessful because of market behavior or unexpected events. In addition to the derivatives risks discussed above, the prices of futures can be highly volatile, using futures can lower total return, and the potential loss from futures can exceed the Portfolio's initial investment in such contracts.
Options. If the Portfolio buys an option, it buys a legal contract giving it the right to buy or sell a specific amount of the underlying instrument or futures contract on the underlying instrument at an agreed-upon price typically in exchange for a premium paid by the Portfolio. If the Portfolio sells an option, it sells to another person the right to buy from or sell to the Portfolio a specific amount of the underlying instrument or futures contract on the underlying instrument at an agreed-upon price typically in exchange for a premium received by the Portfolio. A decision as to whether, when and how to use options involves the exercise of skill and judgment and even a well-conceived option transaction may be unsuccessful because of market behavior or unexpected events. The prices of options can be highly volatile and the use of options can lower total returns.
Swaps. An over-the-counter ("OTC") swap contract is an agreement between two parties pursuant to which the parties exchange payments at specified dates on the basis of a specified notional amount, with the payments calculated by reference to specified securities, indices, reference rates, currencies or other instruments. A small percentage of swap contracts are
8
Mid Cap Growth Portfolio Prospectus
April 30, 2012
cleared through a central clearinghouse. Most swap agreements provide that when the period payment dates for both parties are the same, the payments are made on a net basis (i.e., the two payment streams are netted out, with only the net amount paid by one party to the other). The Portfolio's obligations or rights under a swap contract entered into on a net basis will generally be equal only to the net amount to be paid or received under the agreement, based on the relative values of the positions held by each counterparty. Most swap agreements are not entered into or traded on exchanges and often there is no central clearing or guaranty function for swaps. These OTC swaps are often subject to credit risk or the risk of default or non-performance by the counterparty. Swaps could result in losses if interest rate or foreign currency exchange rates or credit quality changes are not correctly anticipated by the Portfolio or if the reference index, security or investments do not perform as expected.
Structured Investments. The Portfolio also may invest a portion of its assets in structured investments. A structured investment is a derivative security designed to offer a return linked to a particular underlying security, currency, commodity or market. Structured investments may come in various forms including notes, warrants and options to purchase securities. The Portfolio will typically use structured investments to gain exposure to a permitted underlying security, currency or market when direct access to a market is limited or inefficient from a tax or cost standpoint. Investments in structured investments involve risks including issuer risk, counterparty risk and market risk. Holders of structured investments bear risks of the underlying investment and are subject to issuer or counterparty risk because the Portfolio is relying on the creditworthiness of such issuer or counterparty and has no rights with respect to the underlying investment. Certain structured investments may be thinly traded or have a limited trading market and may have the effect of increasing the Portfolio's illiquidity to the extent that the Portfolio, at a particular point in time, may be unable to find qualified buyers for these securities.
Temporary Defensive Investments
When the Adviser believes that changes in economic, financial or political conditions warrant, the Portfolio may invest without limit in fixed income securities for temporary defensive purposes that may be inconsistent with the Portfolio's principal investment strategies. If the Adviser incorrectly predicts the effects of these changes, the defensive investments may adversely affect the Portfolio's performance. Using defensive investments could cause the Portfolio to fail to meet its investment objective.
Portfolio Holdings
A description of the policies and procedures of the Fund with respect to the disclosure of the Portfolio's securities is available in the Fund's SAI.
9
Purchasing Class L Shares
The Fund is not currently offering Class L shares of the Portfolio. The Fund may commence offering Class L shares of the Portfolio in the future. Any such offerings of the Portfolio's Class L shares may commence and terminate without any prior notice.
Share Class Arrangements
The minimum initial investment generally is $25,000 for Class L shares of the Portfolio.
Class L shares are subject to a monthly distribution fee at an annual rate of up to 0.50% of the Portfolio's average daily net assets attributable to Class L shares and a monthly shareholder servicing fee at an annual rate of up to 0.25% of the Portfolio's average daily net assets attributable to Class L shares.
General
Shares of the Portfolio may be purchased directly from the Fund or through a financial intermediary. Investors purchasing shares through a financial intermediary may be charged a transaction-based or other fee by the financial intermediary for its services. If you are purchasing shares through a financial intermediary, please consult your intermediary for purchase instructions.
Shares of the Portfolio may, in the Fund's discretion, be purchased with investment securities (in lieu of, or in conjunction with, cash) acceptable to the Fund. The securities would be accepted by the Fund at their market value in return for shares of the Portfolio.
Shares of the Portfolio may be purchased at the NAV next determined after we receive your purchase order. The NAV of the Portfolio is determined as of the close of the NYSE (normally 4:00 p.m. Eastern Time) on each day the NYSE is open for business.
To help the U.S. Government fight the funding of terrorism and money laundering activities, federal law requires all financial institutions to obtain, verify and record information that identifies each person who opens an account. What this means to you is that when you open an account, we will ask your name, address, date of birth and other information that will allow us to identify you. If we are unable to verify your identity, we reserve the right to restrict additional transactions and/or liquidate your account at the next calculated NAV after your account is closed (less any applicable sales/account charges and/or tax penalties) or take any other action required by law. In accordance with federal law requirements, the Fund has implemented an anti-money laundering compliance program, which includes designation of an anti-money laundering compliance officer.
Initial Purchase by Mail
You may open an account, subject to acceptance by the Fund, by completing and signing an Account Registration Form provided by Morgan Stanley Services Company, Inc. ("Morgan Stanley Services"), the Fund's transfer agent, which you can obtain by calling Morgan Stanley Services at 1-800-548-7786 and mailing it to Morgan Stanley Institutional Fund Trust. c/o Morgan Stanley Services Company Inc., P.O. Box 219804, Kansas City, MO 64121-9804 together with a check payable to Morgan Stanley Institutional Fund Trust.
Please note that payments to investors who redeem shares purchased by check will not be made until payment of the purchase has been collected, which may take up to 15 business days after purchase. You can avoid this delay by purchasing shares by wire.
Initial Purchase by Wire
You may purchase shares of the Portfolio by wiring Federal Funds (monies credited by a Federal Reserve Bank) to State Street Bank and Trust Company (the "Custodian"). You should forward a completed Account Registration Form to Morgan Stanley Services in advance of the wire. See the section below entitled "Valuation of Shares." Instruct your bank to send a Federal Funds wire in a specified amount to the Custodian using the following wire instructions:
State Street Bank and Trust Company
One Lincoln Street
Boston, MA 02111-2101
ABA #011000028
DDA #00575373
Attn: Morgan Stanley Institutional Fund Trust
Subscription Account
Ref: (Portfolio Name, Account Number, Account Name)
10
Mid Cap Growth Portfolio Prospectus
April 30, 2012
Additional Investments
You may make additional investments of shares at the NAV next determined after the request is received in good order, by mailing a check (payable to Morgan Stanley Institutional Fund Trust) to Morgan Stanley Services at the address noted under Initial Purchase by Mail or by wiring Federal Funds to the Custodian as outlined above.
Other Purchase Information
The Fund may suspend the offering of shares, or any class of shares, of the Portfolio or reject any purchase orders when we think it is in the best interest of the Fund. The minimum initial investment in Class L shares may be waived for certain investments, including sales through banks, broker-dealers and other financial institutions (including registered investment advisers and financial planners) purchasing shares on behalf of their clients in (i) discretionary and non-discretionary advisory programs, (ii) fund supermarkets, (iii) asset allocation programs or (iv) other programs in which the client pays an asset-based fee for advice or for executing transactions in Portfolio shares or for otherwise participating in the program. In addition, the minimum initial investment will be waived for: (i) certain retirement plans investing directly with the Fund; (ii) retirement plans investing through certain retirement plan platforms; (iii) certain endowments, foundations and other not for profit entities investing directly with the Fund; (iv) other registered investment companies advised by Morgan Stanley Investment Management or any of its affiliates; (v) Morgan Stanley Investment Management and its affiliates with respect to shares held in connection with certain retirement and deferred compensation programs established for their employees; (vi) the independent Trustees of the Fund; and (vii) investments made in connection with certain reorganizations as approved by the Adviser. If the value of your account falls below the minimum initial investment amount for Class L shares as a result of share redemptions or you no longer meet one of the waiver criteria set forth above, your account may be subject to involuntary conversion or involuntary redemption. You will be notified prior to any such conversions or redemptions.
Certain patterns of past exchanges and/or purchase or sale transactions involving the Portfolio may result in the Fund rejecting, limiting or prohibiting, at its sole discretion and without prior notice, additional purchases and/or exchanges and may result in a shareholder's account being closed. Determinations in this regard may be made based on the frequency or dollar amount of the previous exchanges or purchase or sale transactions.
Purchases of the Portfolio's shares will be made in full and fractional shares of the Portfolio calculated to three decimal places.
Purchasing Class H Shares
The Fund is not currently offering Class H shares of the Portfolio. The Fund may commence offering Class H shares of the Portfolio in the future. Any such offerings of the Portfolio's Class H shares may commence and terminate without any prior notice.
Class H shares are available to investors with a minimum investment of $25,000. If the value of your account falls below the minimum initial investment amount for Class H shares as a result of share redemptions, your account may be subject to involuntary redemption. You will be notified prior to any such redemptions. Class H shares are subject to a sales charge equal to a maximum of 4.75% calculated as a percentage of the offering price on a single transaction as shown in the table below. As shown below, the sales charge is reduced for purchases of $50,000 and over. Class H shares are subject to a
11
monthly shareholder services fee at an annual rate of up to 0.25% of the Portfolio's average daily net assets attributable to Class H shares.
| Front-End Sales Charge | |||||||||||
| Amount of Single Transaction | Percentage of Public Offering Price | Approximate Percentage of Net Amount Invested | |||||||||
| $25,000 but less than $50,000 | 4.75 | % | 4.99 | % | |||||||
| $50,000 but less than $100,000 | 4.00 | % | 4.17 | % | |||||||
| $100,000 but less than $250,000 | 3.00 | % | 3.09 | % | |||||||
| $250,000 but less than $500,000 | 2.50 | % | 2.56 | % | |||||||
| $500,000 but less than $1 million | 2.00 | % | 2.04 | % | |||||||
| $1 million and over | 0.00 | % | 0.00 | % | |||||||
You may benefit from a reduced sales charge schedule (i.e., breakpoint discount) for purchases of Class H shares of the Portfolio, by combining, in a single transaction, your purchase with purchases of Class H shares of the Portfolio by the following related accounts:
• A single account (including an individual, trust or fiduciary account).
• A family member account (limited to spouse, and children under the age of 21).
• Pension, profit sharing or other employee benefit plans of companies and their affiliates.
• Employer sponsored and individual retirement accounts (including IRAs, Keogh, 401(k), 403(b), 408(k) and 457(b) Plans).
• Tax-exempt organizations.
• Groups organized for a purpose other than to buy mutual fund shares.
In addition to investments of $1 million or more, purchases of Class H shares are not subject to a front-end sales charge for accounts of employees of Morgan Stanley and its subsidiaries, such persons' family members (limited to spouse, and children under the age of 21) and trust accounts for which any such person is a beneficiary.
Combined Purchase Privilege
You will have the benefit of reduced sales charges by combining purchases of Class H shares of the Portfolio for any related account in a single transaction with purchases of Class H shares of another portfolio of the Fund or of a portfolio of Morgan Stanley Institutional Fund, Inc. for the related account or any other related account. For the purpose of this combined purchase privilege, a "related account" is:
• A single account (including an individual account, a joint account and a trust account established solely for the benefit of the individual).
• A family member account (limited to spouse, and children under the age of 21, but including trust accounts established solely for the benefit of a spouse, or children under the age of 21).
• An IRA and single participant retirement account (such as a Keogh).
• An UGMA/UTMA account.
Right of Accumulation
You may benefit from a reduced sales charge if the cumulative NAV of Class H shares of the Portfolio purchased in a single transaction, together with the NAV of all Class H shares of a portfolio of the Fund or a portfolio of Morgan Stanley Institutional Fund, Inc. held in related accounts, amounts to $50,000 or more. For the purposes of the rights of accumulation privilege, a related account is any one of the accounts listed under "Combined Purchase Privilege" above.
Notification
You must notify your authorized financial representative at the time a purchase order is placed, that the purchase qualifies for a reduced sales charge under any of the privileges discussed above. Similar notification must be made in writing when an order is placed by mail. The reduced sales charge will not be granted if: (i) notification is not furnished at the time of the order; or (ii) a review of the records of your authorized financial representative or the Fund's transfer agent, Morgan Stanley Services, does not confirm your represented holdings.
In order to obtain a reduced sales charge under any of the privileges discussed above, it may be necessary at the time of purchase for you to inform your authorized financial representative of the existence of other accounts in which there are holdings eligible to be aggregated to meet the sales load breakpoint and/or right of accumulation threshold. In order to verify your eligibility, you may be required to provide
12
April 30, 2012
Mid Cap Growth Portfolio Prospectus
account statements and/or confirmations regarding Class H shares of the Portfolio or a portfolio of Morgan Stanley Institutional Fund, Inc. held in all related accounts described above at your authorized financial representative, as well as shares held by related parties, in order to determine whether you have met the sales load breakpoint and/or right of accumulation threshold.
Letter of Intent
The above schedule of reduced sales charges for larger purchases also will be available to you if you enter into a written "Letter of Intent." A Letter of Intent provides for the purchase of Class H shares of the Portfolio or a portfolio of Morgan Stanley Institutional Fund, Inc. within a 13-month period. The initial purchase under a Letter of Intent must be at least 5% of the stated investment goal. The Letter of Intent does not preclude the Portfolio from discontinuing sales of its shares. To determine the applicable sales charge reduction, you may also include (1) the cost of shares of other Class H shares which were previously purchased at a price including a front-end sales charge during the 90-day period prior to the Distributor receiving the Letter of Intent, and (2) the historical cost of shares of other portfolios of the Fund or portfolios of Morgan Stanley Institutional Fund, Inc. you currently own acquired in exchange for shares of other portfolios of the Fund or portfolios of Morgan Stanley Institutional Fund, Inc. purchased during that period at a price including a front-end sales charge. You may combine purchases and exchanges by family members (limited to spouse, and children under the age of 21) during the periods referenced in (1) and (2) above. You should retain any records necessary to substantiate historical costs because the Fund, the Transfer Agent, your authorized financial representative and any financial intermediaries may not maintain this information. You can obtain a Letter of Intent by contacting your authorized financial representative. If you do not achieve the stated investment goal within the 13-month period, you are required to pay the difference between the sales charges otherwise applicable and sales charges actually paid, which may be deducted from your investment. Shares acquired through ,reinvestment of distributions are not aggregated to achieve the stated investment goal.
General
Class H shares of the Portfolio may be purchased by contacting your authorized financial representative who will assist you, step-by-step, with the procedures to invest in Class H shares of the Portfolio.
Class H shares of the Portfolio may, in the Fund's discretion, be purchased with investment securities (in lieu of or, in conjunction with, cash) acceptable to the Fund. The securities would be accepted by the Fund at their market value in return for shares of the Portfolio, taking into account any applicable sales charge.
Class H shares of the Portfolio may be purchased at the NAV (plus any applicable front-end sales charge) next determined after we receive your purchase order. The NAV of the Portfolio is determined as of the close of the NYSE (normally 4:00 p.m. Eastern Time) on each day the NYSE is open for business.
Additional Investments
You may make additional investments of shares at the NAV next determined after the request is received, plus any applicable sales charge, by the method described above.
Order Processing Fee
Your financial intermediary may charge processing or other fees in connection with the purchase or sale of shares of the Portfolio. Please consult your authorized financial representative for more information regarding any such fees.
Other Purchase Information
The Fund may suspend the offering of shares, or any class of shares, of the Portfolio or reject any purchase orders when we think it is in the best interest of the Fund. The Fund, in its sole discretion, may waive the minimum initial and additional investment amounts in certain cases.
Certain patterns of past exchanges and/or purchase or sale transactions involving the Portfolio may result in the Fund rejecting, limiting or prohibiting, at its sole discretion and without prior notice additional purchases and/or exchanges and may result in a shareholder's account being closed. Determinations in this regard may be made based on the frequency or dollar amount of the previous exchanges or purchase or sale transactions.
Purchases of the Portfolio's shares will be made in full and fractional shares of the Portfolio calculated to three decimal places.
13
Redeeming Shares
Class L
You may redeem Class L shares of the Portfolio by mail, or, if authorized, by telephone at no charge. The value of shares redeemed may be more or less than the purchase price, depending on the NAV at the time of redemption. Shares of the Portfolio will be redeemed at the NAV next determined after the request is received in good order. If you are redeeming shares through a financial intermediary, please consult your intermediary for redemption instructions.
By Mail
Requests should be addressed to Morgan Stanley Institutional Fund Trust, c/o Morgan Stanley Services Company Inc., P.O. Box 219804, Kansas City, MO 64121-9804.
To be in good order, redemption requests must include the following documentation:
(a) A letter of instruction, if required, or a stock assignment specifying the number of shares or dollar amount to be redeemed, signed by all registered owners of the shares in the exact names in which the shares are registered;
(b) The share certificates, if issued;
(c) Any required signature guarantees; and
(d) Other supporting legal documents, if required, in the case of estates, trusts, guardianships, custodianship, corporations, pension and profit sharing plans and other organizations.
By Telephone
You automatically have telephone redemption and exchange privileges unless you indicate otherwise by checking the applicable box on the new account application form or calling Morgan Stanley Services to opt out of such privileges. You may request a redemption of shares by calling the Fund at 1-800-548-7786 and requesting that the redemption proceeds be wired to you. You cannot redeem shares by telephone if you hold share certificates for those shares. For your protection when calling the Fund, we will employ reasonable procedures to confirm that redemption instructions communicated over the telephone are genuine. These procedures may include requiring various forms of personal identification such as name, mailing address, social security number or other tax identification number. Telephone instructions may also be recorded. If reasonable procedures are employed, none of Morgan Stanley, Morgan Stanley Services or the Fund will be liable for following telephone instructions which it reasonably believes to be genuine. Telephone redemptions and exchanges may not be available if you cannot reach Morgan Stanley Services by telephone, whether because all telephone lines are busy or for any other reason; in such case, a shareholder would have to use the Fund's other redemption and exchange procedures described in this Prospectus. During periods of drastic economic or market changes, it is possible that the telephone privileges may be difficult to implement, although this has not been the case with the Fund in the past. To opt out of telephone privileges, please contact Morgan Stanley Services at 1-800-548-7786.
Class H
You may redeem Class H shares of the Portfolio by contacting your authorized financial representative. The value of shares redeemed may be more or less than the purchase price, depending on the NAV at the time of redemption. Class H shares of the Portfolio will be redeemed at the NAV next determined after the request is received in good order.
General
The Fund will ordinarily pay redemption proceeds in cash within seven business days after receipt of your request. The Fund may suspend the right of redemption or postpone the payment of redemption proceeds at times when the NYSE is closed or under other circumstances in accordance with interpretations or orders of the SEC.
If we determine that it is in the best interest of the Fund or Portfolio not to pay redemption proceeds in cash, we may distribute to you securities held by the Portfolio from which you are redeeming. Such in-kind securities may be illiquid and difficult or impossible for a shareholder to sell at a time and at a price that a shareholder would like. If requested, we will pay a portion of your redemption(s) in cash (during any 90 day period) up to the lesser of $250,000 or 1% of the net assets of the Portfolio at the beginning of such period. Redemptions paid in investment securities will give rise to income, gain or loss for income tax purposes in the same manner as redemptions paid in cash. In addition, you may incur brokerage costs and a further gain or loss for income tax purposes when you ultimately sell the securities.
14
Mid Cap Growth Portfolio Prospectus
April 30, 2012
Frequent Purchases and Redemptions of Shares
Frequent purchases and redemptions of shares by Portfolio shareholders are referred to as "market-timing" or "short-term trading" and may present risks for other shareholders of the Portfolio, which may include, among other things, dilution in the value of the Portfolio's shares held by long-term shareholders, interference with the efficient management of the Portfolio, increased brokerage and administrative costs, incurring unwanted taxable gains and forcing the Portfolio to hold excess levels of cash.
In addition, the Portfolio is subject to the risk that market-timers and/or short-term traders may take advantage of time zone differences between the foreign markets on which the Portfolio's securities trade and the time as of which the Portfolio's NAV is calculated ("time-zone arbitrage"). For example, a market-timer may purchase shares of the Portfolio based on events occurring after foreign market closing prices are established, but before the Portfolio's NAV calculation, that are likely to result in higher prices in foreign markets the following day. The market-timer would redeem the Portfolio's shares the next day when the Portfolio's share price would reflect the increased prices in foreign markets for a quick profit at the expense of long-term Portfolio shareholders.
Investments in other types of securities also may be susceptible to short-term trading strategies. These investments include securities that are, among other things, thinly traded, traded infrequently or relatively illiquid, which have the risk that the current market price for the securities may not accurately reflect current market values. A shareholder may seek to engage in short-term trading to take advantage of these pricing differences (referred to as "price-arbitrage"). Investment in certain fixed income securities may be adversely affected by price arbitrage trading securities.
The Fund discourages and does not accommodate frequent purchases and redemptions of Portfolio shares by Portfolio shareholders and the Fund's Board of Trustees has adopted policies and procedures with respect to such frequent purchases and redemptions. The Fund's policies with respect to purchases, exchanges and redemptions of shares are described in the "Purchasing Shares," "General Shareholder Information" and "Redeeming Shares" sections of this Prospectus. Except as described in each of these sections, and with respect to trades that occur through omnibus accounts at financial intermediaries as described below, the Fund's policies regarding frequent trading of shares are applied uniformly to all shareholders. With respect to trades that occur through omnibus accounts at intermediaries, such as investment advisers, broker-dealers, transfer agents and third party administrators, the Fund (i) requests assurance that such intermediaries currently selling shares have in place internal policies and procedures reasonably designed to address market-timing concerns and has instructed such intermediaries to notify the Fund immediately if they are unable to comply with such policies and procedures and (ii) requires all prospective intermediaries to agree to cooperate in enforcing the Fund's policies (or, upon prior written approval only, an intermediary's own policies) with respect to frequent purchases, exchanges and redemptions of shares.
Omnibus accounts generally do not identify customers' trading activity to the Fund on an individual ongoing basis. Therefore, with respect to trades that occur through omnibus accounts at financial intermediaries, to some extent, the Fund relies on the financial intermediary to monitor frequent short-term trading within the Fund by the financial intermediary's customers. However, the Fund or the Distributor has entered into agreements with financial intermediaries whereby intermediaries are required to provide certain customer identification and transaction information upon the Fund's request. The Fund may use this information to help identify and prevent market-timing activity in the Fund. There can be no assurance that the Fund will be able to identify or prevent all market-timing activities.
15
General Shareholder Information
Share Classes
This Prospectus offers Class H and Class L shares of the Portfolio, each having different distribution arrangements designed to provide you with different purchase options according to your investment needs. Class I and Class P shares are generally restricted to investments in minimum amounts that are substantially higher than Class H and Class L shares.
Valuation of Shares
The price of the Portfolio's shares (NAV) is based on the value of the Portfolio's securities. The NAV of the Portfolio is determined as of the close of the NYSE (normally 4:00 p.m. Eastern Time) on each day the NYSE is open for business.
The Portfolio values its securities at market value. When no market quotations are readily available for securities, including circumstances under which the Adviser determines that a security's market price is not accurate, we will determine the value for those securities in good faith at fair value using methods approved by the Fund's Board of Trustees. In addition, with respect to securities that primarily are listed on foreign exchanges, when an event occurs after the close of such exchanges that is likely to have changed the value of the securities (for example, a percentage change in value of one or more U.S. securities indices in excess of specified thresholds), such securities will be valued at their fair value, as determined under procedures established by the Fund's Board of Trustees. Securities also may be fair valued in the event of a significant development affecting a country or region or an issuer-specific development which is likely to have changed the value of the security. In these cases, a Portfolio's NAV will reflect certain portfolio securities' fair value rather than their market price.
Fair value pricing involves subjective judgment and it is possible that the fair value determined for a security is materially different than the value that could be realized upon the sale of that security.
The NAV of each Class of shares may differ from that of other classes because of class-specific expenses that each class may pay and the shareholder servicing fees charged to Class H and Class L shares.
Exchange Privilege
You may exchange Class H and Class L shares for the same Class of shares of other available portfolios of the Fund and available portfolios of Morgan Stanley Institutional Fund, Inc. Exchanges are based on the shares' respective NAVs.
To obtain a prospectus for another portfolio, call the Fund at 1-800-548-7786 or contact your financial intermediary. If you purchased Portfolio shares through a financial intermediary, certain portfolios may be unavailable for exchange. Contact your financial intermediary to determine which portfolios are available for exchange. See also "Other Purchase Information" for certain limitations relating to exchanges.
With respect to exchanges of Class L shares, you can process your exchange by contacting your financial intermediary. Otherwise, you should send exchange requests by mail to Morgan Stanley Institutional Fund Trust, c/o Morgan Stanley Services Company Inc., P.O. Box 219804, Kansas City, MO 64121-9804. Exchange requests can also be made by calling 1-800-548-7786. With respect to Class H shares, you can process your exchange by contacting your authorized financial representative.
When you exchange for shares of another portfolio, your transaction will be treated the same as an initial purchase. You will be subject to the same minimum initial investment and account size as an initial purchase. The Fund, in its sole discretion, may waive the minimum initial investment amounts in certain cases. The Fund may terminate or revise the exchange privilege upon required notice or in certain cases without notice.
Tax Considerations
As with any investment, you should consider how your Portfolio investment will be taxed. The tax information in this Prospectus is provided as general information. You should consult your own tax professional about the tax consequences of an investment in a Portfolio. Unless your investment in a Portfolio is through a tax-deferred retirement account, such as a 401(k) plan or IRA, you need to be aware of the possible tax consequences when the Portfolio makes distributions and when you sell shares, including an exchange to another Morgan Stanley Fund.
16
Mid Cap Growth Portfolio Prospectus
April 30, 2012
Taxation of Distributions. Your distributions normally are subject to federal and state income tax when they are paid, whether you take them in cash or reinvest them in Portfolio shares. A distribution also may be subject to local income tax. Any income dividend distributions and any short-term capital gain distributions are taxable to you as ordinary income. Any long-term capital gain distributions are taxable as long-term capital gains, no matter how long you have owned shares in the Portfolio.
Under current law (through 2012), if certain holding period requirements are met with respect to your shares, a portion of the income dividends you receive may be taxed at the same rates as long-term capital gains. However, even if income received in the form of income dividends is taxed at the same rates as long-term capital gains, such income will not be considered long-term capital gains for other federal income tax purposes. For example, you will not be permitted to offset income dividends with capital losses. Short-term capital gain distributions will continue to be taxed at ordinary income rates.
Corporate shareholders may be entitled to a dividends-received deduction for the portion of dividends they receive which are attributable to dividends received by such portfolios from U.S. corporations.
Investment income received by the Portfolio from sources within foreign countries may be subject to foreign income taxes.
You will be sent a statement (Internal Revenue Service ("IRS") Form 1099-DIV) by February of each year showing the taxable distributions paid to you in the previous year. The statement provides information on your dividends and any capital gains for tax purposes.
Taxation of Sales. Your sale of Portfolio shares normally is subject to federal and state income tax and may result in a taxable gain or loss to you. A sale also may be subject to local income tax. Your exchange of Portfolio shares for shares of another Morgan Stanley Fund is treated for tax purposes like a sale of your original shares and a purchase of your new shares. Thus, the exchange may, like a sale, result in a taxable gain or loss to you and will give you a new tax basis for your shares.
Due to recent legislation, the Portfolio (or its administrative agent) is required to report to the IRS and furnish to Portfolio shareholders the cost basis information for sale transactions of shares purchased on or after January 1, 2012. Shareholders may elect to have one of several cost basis methods applied to their account when calculating the cost basis of shares sold, including average cost, FIFO ("first-in, first-out") or some other specific identification method. Unless you instruct otherwise, the Fund will use average cost as its default cost basis method, and will treat sales as first coming from shares purchased prior to January 1, 2012. If average cost is used for the first sale of Portfolio shares covered by these new rules, the shareholder may only use an alternative cost basis method for shares purchased prospectively. Portfolio shareholders should consult with their tax advisors to determine the best cost basis method for their tax situation.
When you open your account, you should provide your social security or tax identification number on your investment application. By providing this information, you will avoid being subject to federal backup withholding (as of the date of this Prospectus this rate is 28% and is scheduled to increase to 31% after 2012) on taxable distributions and redemption proceeds. Any withheld amount would be sent to the IRS as an advance payment of your taxes due on your income for such year.
Dividends and Distributions
The Portfolio normally declares dividends and distributes substantially all of its net investment income to shareholders annually.
If any net gains are realized from the sale of underlying securities, the Portfolio normally distributes the gains with the last distributions for the calendar year. All dividends and distributions are automatically paid in additional shares of the Portfolio unless you elect otherwise. If you want to change how your dividends are paid, you must notify the Fund in writing.
17
Fund Management
Adviser
Morgan Stanley Investment Management Inc., with principal offices at 522 Fifth Avenue, New York, NY 10036, conducts a worldwide portfolio management business and provides a broad range of portfolio management services to customers in the United States and abroad. Morgan Stanley is the direct parent of the Adviser. Morgan Stanley is a preeminent global financial services firm engaged in securities trading and brokerage activities, as well as providing investment banking, research and analysis, financing and financial advisory services. As of March 31, 2012, the Adviser, together with its affiliated asset management companies, had approximately $303.8 billion in assets under management or supervision.
A discussion regarding the basis for the Board of Trustees' approval of the investment advisory agreement is available in the Fund's annual report to shareholders for the fiscal year ended September 30, 2011.
Advisory Fees
For the fiscal year ended September 30, 2011, the Adviser received a fee for advisory services (net of affiliated rebates, if applicable) equal to 0.49% of the Portfolio's average daily net assets.
Portfolio Management
Mid Cap Growth Portfolio
The Portfolio is managed by members of the Growth team. The team consists of portfolio managers and analysts. Current members of the team who are jointly and primarily responsible for the day-to-day management of the Portfolio are Dennis P. Lynch, David S. Cohen, Sam G. Chainani and Jason C. Yeung, each a Managing Director of the Adviser, and Alexander T. Norton and Armistead B. Nash, each an Executive Director of the Adviser.
Mr. Lynch has been associated with the Adviser in an investment management capacity since 1998. Mr. Cohen has been associated with the Adviser in an investment management capacity since 1993. Mr. Chainani has been associated with the Adviser in an investment management capacity since 1996. Mr. Norton has been associated with the Adviser in an investment management capacity since 2000. Mr. Yeung has been associated with the Adviser in an investment management capacity since 2002. Mr. Nash has been associated with the Adviser in an investment management capacity since 2002.
Mr. Lynch is the lead portfolio manager of the Portfolio. Messrs. Cohen, Chainani, Norton, Yeung and Nash are co-portfolio managers. Members of the team collaborate to manage the assets of the Portfolio.
The Fund's SAI provides additional information about the portfolio managers' compensation structure, other accounts managed by the portfolio managers and the portfolio managers' ownership of securities in the Portfolio.
The composition of the team may change from time to time.
Distributor
Shares of the Fund are distributed exclusively through Morgan Stanley Distribution, Inc., a wholly-owned subsidiary of the Adviser. The Distributor has entered into arrangements with certain financial intermediaries who may accept purchase and redemption orders for shares of the Portfolio on its behalf.
Shareholder Services Plan (Class H)
The Fund has adopted a Shareholder Services Plan for the Portfolio's Class H shares pursuant to Rule 12b-1 under the Investment Company Act of 1940, as amended (the "1940 Act") (the "Class H Service Plan"). Under the Class H Service Plan, the Portfolio may pay to the Distributor and other affiliated and unaffiliated broker-dealers, financial institutions and/or intermediaries a monthly service fee at an annual rate of up to 0.25% of the Portfolio's average daily net assets attributable to Class H shares. The Distributor may direct that all or any part of this fee be paid directly to its affiliates or other broker-dealers, financial institutions and/or intermediaries that provide shareholder services to investors who purchase Class H shares. Over time the shareholder servicing fees will increase the cost of
18
Mid Cap Growth Portfolio Prospectus
April 30, 2012
your investment and may cost you more than paying other types of sales charges.
Distribution and Shareholder Services Plan (Class L)
The Fund has adopted a Distribution and Shareholder Services Plan for the Portfolio's Class L shares pursuant to Rule 12b-1 under the 1940 Act (the "Class L Plan"). Under the Class L Plan, the Portfolio pays the Distributor a monthly distribution fee at an annual rate of up to 0.50% of the Portfolio's average daily net assets attributable to Class L shares and a monthly shareholder service fee at an annual rate of up to 0.25% of the Portfolio's average daily net assets attributable to Class L shares. The Distributor may direct that all or any part of these fees be paid directly to its affiliates or other broker-dealers, financial institutions and/or intermediaries that provide distribution and/or shareholder support services to investors who purchase Class L shares. Over time the distribution fees and shareholder servicing fees will increase the cost of your investment and may cost you more than paying other types of sales charges.
Additional Information
The Adviser and/or Distributor may pay compensation to certain affiliated or unaffiliated brokers or other service providers in connection with the sale or retention of shares of the Portfolio and/or shareholder servicing. Such compensation may be significant in amount and the prospect of receiving any such additional compensation may provide affiliated or unaffiliated entities with an incentive to favor sales of shares of the Portfolio over other investment options. Any such payments will not change the NAV or the price of Portfolio shares. For more information, please see the Fund's SAI.
19
Financial Highlights
No financial information is provided for the Portfolio's Class H and Class L shares because they had not commenced operations as of the date of this Prospectus.
20
(This page intentionally left blank)
21
Where to Find Additional Information
In addition to this Prospectus, the Fund has a Statement of Additional Information, dated April 30, 2012, which contains additional, more detailed information about the Fund and the Portfolio. The Statement of Additional Information is incorporated by reference into this Prospectus and, therefore, legally forms a part of this Prospectus.
The Fund publishes Annual and Semi-Annual Reports to Shareholders ("Shareholder Reports") that contain additional information about the Portfolio's investments. In the Fund's Annual Report to Shareholders, you will find a discussion of the market conditions and the investment strategies that significantly affected the Portfolio's performance during the last fiscal year. For additional Fund information, including information regarding the investments comprising the Portfolio, please call the toll-free number below.
You may obtain the Statement of Additional Information and Shareholder Reports without charge by contacting the Fund at the toll-free number below or on our internet site at: www.morganstanley.com/im. If you purchased shares through a financial intermediary, you may also obtain these documents, without charge, by contacting your financial intermediary.
Information about the Fund, including the Statement of Additional Information and Shareholder Reports, may be obtained from the SEC in any of the following ways. (1) in person: you may review and copy documents in the SEC's Public Reference Room in Washington D.C. (for information on the operation of the Public Reference Room call 1-202-551-8090); (2) on-line: you may retrieve information from the SEC's web site at http://www.sec.gov; (3) by mail: you may request documents, upon payment of a duplicating fee, by writing to the Securities and Exchange Commission, Public Reference Section, Washington, D.C. 20549-1520; or (4) by e-mail: you may request documents, upon payment of a duplicating fee, by e-mailing the SEC at the following address: publicinfo@sec.gov.
Morgan Stanley Institutional Fund Trust
c/o Morgan Stanley Services Company Inc.
P.O. Box 219804
Kansas City, MO 64121-9804
For Shareholder Inquiries,
1-800-354-7786.
Prices and Investment Results are available at www.morganstanley.com/im.
The Fund's Investment Company Act registration number is 811-03980.

IFTMCGHLPRO 4/12
INVESTMENT MANAGEMENT

Morgan Stanley
Institutional Fund Trust

Global Strategist Portfolio (formerly Balanced Portfolio)
| Share Class and Ticker Symbol | |||||||||||||||||||
| Portfolio | Class I | Class P | Class H | Class L | |||||||||||||||
| Global Strategist | MPBAX | MBAAX | MSBHX | MSDLX | |||||||||||||||
Prospectus
July 16, 2012

The Securities and Exchange Commission ("SEC") has not approved or disapproved these securities or passed upon the adequacy of this Prospectus. Any representation to the contrary is a criminal offense.
Global Strategist Portfolio Prospectus
July 16, 2012
Table of Contents
| Page | |||||||
| Portfolio Summary | 1 | ||||||
| Details of the Portfolio | 5 | ||||||
| Additional Information about the Portfolio's Investment Strategies and Related Risks | 8 | ||||||
| Portfolio Holdings | 13 | ||||||
| Purchasing Class I, Class P and Class L Shares | 13 | ||||||
| Purchasing Class H Shares | 14 | ||||||
| Redeeming Shares | 16 | ||||||
| Frequent Purchases and Redemptions of Shares | 17 | ||||||
| General Shareholder Information | 18 | ||||||
| Fund Management | 21 | ||||||
| Financial Highlights | 23 | ||||||
Portfolio Summary
Objective
The Global Strategist Portfolio seeks above-average total return over a market cycle of three to five years.
Fees and Expenses
The table below describes the fees and expenses that you may pay if you buy and hold shares of the Portfolio. For shareholders of Class H shares, you may qualify for sales charge discounts if the cumulative net asset value ("NAV") of Class H shares of the Portfolio purchased in a single transaction, together with the NAV of all Class H shares of a portfolio of Morgan Stanley Institutional Fund Trust (the "Fund") or of a portfolio of Morgan Stanley Institutional Fund, Inc. held in related accounts, amounts to $50,000 or more. More information about these and other discounts is available from your financial adviser and in the "Purchasing Class H Shares" section on page 14 of this Prospectus.
Shareholder Fees (fees paid directly from your investment)
| Class I | Class P | Class H | Class L | ||||||||||||||||
| Maximum sales charge (load) imposed on purchases (as a percentage of offering price) | None | None | 4.75 | % | None | ||||||||||||||
Annual Portfolio Operating Expenses
(expenses that you pay each year as a percentage of the value of your investment)
| Class I | Class P | Class H | Class L | ||||||||||||||||
| Advisory Fee | 0.45 | % | 0.45 | % | 0.45 | % | 0.45 | % | |||||||||||
| Distribution and/or Service (12b-1) Fee | None | 0.25 | % | 0.25 | % | 0.75 | % | ||||||||||||
| Other Expenses | 0.86 | % | 0.86 | % | 0.86 | %‡ | 0.86 | %‡ | |||||||||||
| Total Annual Portfolio Operating Expenses | 1.31 | % | 1.56 | % | 1.56 | % | 2.06 | % | |||||||||||
Example
The example below is intended to help you compare the cost of investing in the Portfolio with the cost of investing in other mutual funds.
The example assumes that you invest $10,000 in the Portfolio, your investment has a 5% return each year and that the Portfolio's operating expenses remain the same. Although your actual costs may be higher or lower, based on these assumptions your costs would be:
| 1 Year | 3 Years | 5 Years | 10 Years | ||||||||||||||||
| Class I | $ | 133 | $ | 415 | $ | 718 | $ | 1,579 | |||||||||||
| Class P | $ | 159 | $ | 493 | $ | 850 | $ | 1,856 | |||||||||||
| Class H | $ | 626 | $ | 944 | $ | 1,285 | $ | 2,243 | |||||||||||
| Class L | $ | 209 | $ | 646 | $ | 1,108 | $ | 2,390 | |||||||||||
‡ Other expenses have been estimated for the Portfolio's Class H and Class L shares for the current fiscal year.
Portfolio Turnover
The Portfolio pays transaction costs, such as commissions, when it buys and sells securities (or "turns over" its portfolio). A higher portfolio turnover rate may indicate higher transaction costs and may result in higher taxes when Portfolio shares are held in a taxable account. These costs, which are not reflected in Total Annual Portfolio Operating Expenses or in the Example, affect the Portfolio's performance. During the most recent fiscal year, the Portfolio's portfolio turnover rate was 164% of the average value of its portfolio.
Principal Investment Strategies
The Portfolio's "Adviser," Morgan Stanley Investment Management Inc., seeks to achieve the Portfolio's investment objective by investing primarily in a blend of equity and fixed income securities of U.S. and non-U.S. issuers. Equity securities may include common and preferred stocks, depositary receipts, convertible securities, equity-linked securities, real estate investment trusts ("REITs"), rights and warrants to purchase equity securities and limited partnership interests. Fixed income securities may include mortgage-related or mortgage-backed securities, floating rate securities, inflation-linked fixed income securities, securities issued or guaranteed by the U.S. Government, its agencies or instrumentalities, securities issued or guaranteed by non-U.S. governments, their agencies or instrumentalities, corporate bonds and notes issued by U.S. and non-U.S. entities.
The Adviser will utilize a top-down investment approach that focuses on asset class, sector, region, country and currency selection. The Portfolio's allocations will be based upon the Adviser's evaluations and analyses, taking into account results of its fundamental market research and recommendations generated by the Adviser's quantitative models. Investment decisions will be made without regard to any particular allocation as to geographical location, sector, credit rating, maturity, currency denomination or market capitalization. The Portfolio may invest in any country, including developing or emerging market countries. The Portfolio's investments may be denominated in U.S. dollars or in currencies other than U.S. dollars.
The Portfolio may invest a portion of its assets in below investment grade fixed income securities and repurchase agreements. The Portfolio may also invest in restricted and illiquid securities. The mortgage-backed securities in which the Portfolio may invest include mortgage pass-through securities which represent a participation interest in a pool of mortgage loans originated by U.S. governmental or private lenders such as banks.
The Portfolio may, but it is not required to, use derivative instruments for a variety of purposes, including hedging, risk management, portfolio management or to earn income. The Portfolio's use of derivatives may involve the purchase and sale of derivative instruments such as options, futures, swaps and structured investments (including commodity-linked notes), and other related instruments and techniques. The Portfolio may utilize foreign currency forward exchange contracts, which are also derivatives, in connection with its investments in foreign securities.
morganstanley.com/im
1
Derivative instruments used by the Portfolio will be counted toward the Portfolio's exposure to the types of securities listed above to the extent they have economic characteristics similar to such securities.
Principal Risks
An investment in the Portfolio is subject to risks, and you could lose money on your investment in the Portfolio. There can be no assurance that the Portfolio will achieve its investment objective. An investment in the Portfolio is not a deposit of any bank or other insured depository institution and is not insured or guaranteed by the Federal Deposit Insurance Corporation or any other government agency.
The Portfolio's principal investment strategies are subject to the following principal risks:
• Common Stock and Other Equity Securities. In general, stock and other equity security values fluctuate, and sometimes widely fluctuate, in response to activities specific to the company as well as general market, economic and political conditions. To the extent that the Portfolio invests in convertible securities, and the convertible security's investment value is greater than its conversion value, its price will be likely to increase when interest rates fall and decrease when interest rates rise. If the conversion value exceeds the investment value, the price of the convertible security will tend to fluctuate directly with the price of the underlying security.
• Fixed Income Securities. The prices of fixed income securities respond to economic developments, particularly interest rate changes, changes in the general level of spreads between U.S. Treasury and non-Treasury securities, and changes in the actual or perceived creditworthiness of the issuer of the fixed income security. Securities with longer durations are likely to be more sensitive to changes in interest rates, generally making them more volatile than securities with shorter durations. A portion of the Portfolio's fixed income securities may be rated below investment grade.
• Lower Rated Fixed-Income Securities ("Junk Bonds"). The prices of these securities are likely to be more sensitive to adverse economic changes, resulting in increased volatility of market prices of these securities during periods of economic uncertainty, or adverse individual corporate developments, than higher rated securities. In addition, during an economic downturn or substantial period of rising interest rates, junk bond issuers and, in particular, highly leveraged issuers may experience financial stress.
• Mortgage Securities. Investments in mortgage securities are subject to the risk that if interest rates decline, borrowers may pay off their mortgages sooner than expected which may adversely affect the Portfolio's return. Certain mortgage-backed securities may be more volatile and less liquid than other traditional types of debt securities. In addition, an unexpectedly high rate of defaults on the mortgages held by a mortgage pool may adversely affect the value of a mortgage-backed security and could result in losses to the Portfolio. The risk of such defaults is generally higher in the case of mortgage pools that include subprime mortgages.
• REITs. Investing in REITs exposes investors to the risks of owning real estate directly, as well as to risks that relate specifically to the way in which REITs are organized and operated. Operating REITs requires specialized management skills and the Portfolio indirectly bears management expenses along with the direct expenses of the Portfolio. REITs are also subject to certain provisions under federal tax law and the failure of a company to qualify as a REIT could have adverse consequences for the Portfolio.
• Foreign and Emerging Market Securities. Investments in foreign markets entail special risks such as currency, political, economic and market risks. There also may be greater market volatility, less reliable financial information, higher transaction and custody costs, decreased market liquidity and less government and exchange regulation associated with investments in foreign markets. In addition, investments in certain foreign markets, which have historically been considered stable, may become more volatile and subject to increased risk due to ongoing developments and changing conditions in such markets. Moreover, the growing interconnectivity of global economies and financial markets has increased the probability that adverse developments and conditions in one country or region will affect the stability of economies and financial markets in other countries or regions. The risks of investing in emerging market countries are greater than risks associated with investments in foreign developed countries. In addition, the Portfolio's investments may be denominated in foreign currencies and therefore, changes in the value of a country's currency compared to the U.S. dollar may affect the value of the Portfolio's investments. Hedging the Portfolio's currency risks through foreign currency forward exchange contracts involves the risk of mismatching the Portfolio's objectives under a foreign currency forward exchange contract with the value of securities denominated in a particular currency. There is additional risk to the effect that currency contracts create exposure to currencies in which the Portfolio's securities are not denominated. The use of foreign currency forward exchange contracts involves the risk of loss from the insolvency or bankruptcy of the counterparty to the contract or the failure of the counterparty to make payments or otherwise comply with the terms of the contract.
• U.S. Government Securities. With respect to U.S. government securities that are not backed by the full faith and credit of the U.S. Government, there is the risk that the U.S. Government will not provide financial support to such U.S. government agencies, instrumentalities or sponsored enterprises if it is not obligated to do so by law.
• Liquidity Risk. The Portfolio's investments in restricted and illiquid securities may entail greater risk than investments in publicly traded securities. These securities may be more difficult to sell, particularly in times of market turmoil. Illiquid securities may be more difficult to value. If the Portfolio is forced to sell an illiquid security to fund redemptions or for other cash needs, it may be forced to sell the security at a loss.
• Derivatives. A derivative instrument often has risks similar to its underlying asset and may have additional risks, including imperfect correlation between the value of the derivative and the underlying asset, risks of default by the counterparty to certain transactions, magnification of losses incurred due to changes in the market value of the securities, instruments, indices or interest rates to which they relate, and risks that the transactions may not be liquid. Certain derivative transactions may give rise to a form of leverage. Leverage magnifies the potential for gain and the risk of loss.
Performance Information
The bar chart and table below provide some indication of the risks of investing in the Portfolio by showing changes in the Portfolio's Class I shares' performance from year-to-year and by showing how the Portfolio's average annual returns for the past one, five and 10 year periods compare with those of broad measures of market performance, as well as an index that represents a group of similar mutual funds, over time. The performance of the other Classes will differ because the Classes have different ongoing fees. The Portfolio's past performance,
2
before and after taxes, is not necessarily an indication of how the Portfolio will perform in the future. Updated performance information is available online at www.morganstanley.com/im.
Annual Total Returns—Calendar Years

| High Quarter | 9/30/09 | 12.23 | % | ||||||||
| Low Quarter | 12/31/08 | –12.60 | % | ||||||||
Average Annual Total Returns For Periods Ended December 31, 2011
| Past One Year | Past Five Years | Past Ten Years | |||||||||||||
| Class I (commenced operations on 12/31/92) | |||||||||||||||
| Return before Taxes | 3.84 | % | 2.93 | % | 4.64 | % | |||||||||
| Return after Taxes on Distributions | 3.27 | % | 2.15 | % | 3.84 | % | |||||||||
| Return after Taxes on Distributions and Sale of Fund Shares | 2.49 | % | 2.08 | % | 3.56 | % | |||||||||
| Class P (commenced operations on 11/1/96) | |||||||||||||||
| Return before Taxes | 3.52 | % | 2.65 | % | 4.37 | % | |||||||||
| Class H* | |||||||||||||||
| Return before Taxes | N/A | N/A | N/A | ||||||||||||
| Class L* | |||||||||||||||
| Return before Taxes | N/A | N/A | N/A | ||||||||||||
| MSCI All Country World Index (reflects no deduction for fees, expenses or taxes)1 | –7.35 | % | –1.93 | % | 4.24 | % | |||||||||
| S&P 500® Index (reflects no deduction for fees, expenses or taxes)2 | 2.11 | % | –0.25 | % | 2.92 | % | |||||||||
| Barclays Capital U.S. Aggregate Index (reflects no deduction for fees, expenses or taxes)3 | 7.84 | % | 6.50 | % | 5.78 | % | |||||||||
| 60/40 Blended Index (reflects no deduction for fees, expenses or taxes)4 | 4.98 | % | 3.03 | % | 4.55 | % | |||||||||
| Lipper Mixed-Asset Target Allocation Growth Funds Index (reflects no deduction for taxes)5 | –0.54 | % | 1.32 | % | 4.44 | % | |||||||||
*As of December 31, 2011, the Fund had not commenced offering Class H and Class L shares of the Portfolio. The returns for Class H and Class L shares would be lower than the returns for Class I shares of the Portfolio as expenses of Class H and Class L are higher. Return information for the Portfolio's Class H and Class L shares will be shown in future prospectuses offering the Portfolio's Class H and Class L shares after the Portfolio's Class H and Class L shares have a full calendar year of return information to report.
1 The Morgan Stanley Capital International (MSCI) All Country World Index (ACWI) is a free float-adjusted market capitalization weighted index designed to measure the equity market performance of developed and emerging markets. The term "free float" represents the portion of shares outstanding that are deemed to be available for purchase in the public equity markets by investors. The performance of the Index is listed in U.S. dollars and assumes reinvestment of net dividends. "Net dividends" reflects a reduction in dividends after taking into account withholding of taxes by any foreign countries represented in the Index. It is not possible to invest directly in an index. The Portfolio's primary benchmark was changed in July 2012 to the MSCI All Country World Index to more accurately reflect the Portfolio's investible universe.
2 The Standard & Poor's 500® Index (S&P 500®) measures the performance of the large-cap segment of the U.S. equities market, covering approximately 75% of the U.S. equities market. The Index includes 500 leading companies in leading industries of the U.S. economy. It is not possible to invest directly in an index.
3 The Barclays Capital U.S. Aggregate Index tracks the performance of all U.S. government agency and Treasury securities, investment-grade corporate debt securities, agency mortgage-backed securities, asset-backed securities and commercial mortgage-backed securities. It is not possible to invest directly in an index.
4 The 60/40 Blended Index is comprised of 60% S&P 500® Index and 40% Barclays Capital U.S. Aggregate Index. It is not possible to invest directly in an index.
5 The Lipper Mixed-Asset Target Allocation Growth Funds Index is an equally-weighted performance index of the largest qualifying funds (based on net assets) in the Lipper Mixed-Asset Target Allocation Growth Funds classification. There are currently 30 funds represented in this Index.
The after-tax returns shown in the table above are calculated using the historical highest individual federal marginal income tax rates during the period shown and do not reflect the impact of state and local taxes. After-tax returns for the Portfolio's other Classes will vary from Class I shares' returns. Actual after-tax returns depend on the investor's tax situation and may differ from those shown, and after-tax returns are not relevant to investors who hold their Portfolio shares through tax deferred arrangements such as 401(k) plans or individual retirement accounts. After-tax returns may be higher than before-tax returns due to foreign tax credits and/or an assumed benefit from capital losses that would have been realized had Portfolio shares been sold at the end of the relevant periods, as applicable.
Adviser. Morgan Stanley Investment Management Inc.
Portfolio Managers. The Portfolio is managed by members of the Global Asset Allocation team. Information about the members jointly and primarily responsible for the day-to-day management of the Portfolio is shown below:
| Name | Title with Adviser | Date Began Managing Portfolio | |||||||||
| Cyril Moullé-Berteaux | Managing Director | August 2011 | |||||||||
| Mark A. Bavoso | Managing Director | January 2011 | |||||||||
Purchase and Sale of Fund Shares
The minimum initial investment generally is $5,000,000 for Class I shares, $1,000,000 for Class P shares and $25,000 for each of Class H and Class L shares of the Portfolio. You may not be subject to the minimum investment requirements under certain circumstances. For more information, please refer to the "Purchasing Class I, Class P and Class L Shares—Share Class Arrangements," "—Other Purchase Information" and "Purchasing Class H Shares" sections beginning on pages 13, 14 and 14, respectively, of this Prospectus.
Class I, Class P and Class L shares may be purchased or sold on any day the New York Stock Exchange ("NYSE") is open for business directly through Morgan Stanley Institutional Fund Trust
morganstanley.com/im
3
(the "Fund") by mail (c/o Morgan Stanley Services Company Inc., P.O. Box 219804, Kansas City, MO 64121-9804) or by telephone (1-800-548-7786) or by contacting your financial intermediary.
For more information, please refer to the "Purchasing Class I, Class P and Class L Shares" and "Redeeming Shares" sections beginning on pages 13 and 16, respectively, of this Prospectus.
Class H shares of the Portfolio may be purchased or redeemed by contacting your authorized financial representative.
Tax Information
The Portfolio intends to make distributions that may be taxed as ordinary income or capital gains, unless you are investing through a tax-deferred arrangement, such as a 401(k) plan or an individual retirement account.
Payments to Broker-Dealers and Other Financial Intermediaries
If you purchase the Portfolio through a broker-dealer or other financial intermediary (such as a bank), the Adviser and/or the Portfolio's "Distributor," Morgan Stanley Distribution, Inc., may pay the intermediary for the sale of Portfolio shares and related services. These payments, which may be significant in amount, may create a conflict of interest by influencing the broker-dealer or other intermediary and your salesperson to recommend the Portfolio over another investment. Ask your salesperson or visit your financial intermediary's web site for more information.
4
Global Strategist Portfolio Prospectus
July 16, 2012
Details of the Portfolio
Objective
The Global Strategist Portfolio seeks above-average total return over a market cycle of three to five years.
Approach
The Adviser seeks to achieve the Portfolio's investment objective by investing primarily in a blend of equity and fixed income securities of U.S. and non-U.S. issuers. Equity securities may include common and preferred stocks, depositary receipts, convertible securities, equity-linked securities, REITs, rights and warrants to purchase equity securities and limited partnerships. Fixed income securities may include mortgage-related or mortgage-backed securities, floating rate securities, inflation-linked fixed income securities, securities issued or guaranteed by the U.S. Government, its agencies or instrumentalities, securities issued or guaranteed by non-U.S. governments, their agencies or instrumentalities, corporate bonds and notes issued by U.S. and non-U.S. entities.
The Portfolio may invest a portion of its assets in below investment grade fixed income securities and repurchase agreements. The mortgage-backed securities in which the Portfolio may invest include mortgage pass-through securities which represent a participation interest in a pool of mortgage loans originated by U.S. governmental or private lenders such as banks. The Portfolio may also invest up to 10% of its total assets in other investment companies, including exchange-traded funds ("ETFs"). The securities in which the Portfolio may invest may be denominated in U.S. dollars or in currencies other than U.S. dollars.
The Portfolio may purchase certain non-publicly traded "restricted" securities. These securities may include "Rule 144A" securities which are exempt from registration and that may only be resold to qualified institutional buyers. The Portfolio may invest up to 15% of its assets in illiquid securities, including restricted securities that are illiquid. The Portfolio may invest an unlimited amount in restricted securities that are considered by the Adviser to be liquid and otherwise meet the Portfolio's investment policies.
The Portfolio may, but it is not required to, use derivative instruments for a variety of purposes, including hedging, risk management, portfolio management or to earn income. Derivatives are financial instruments whose value is based on the value of an underlying asset, interest rate, index or financial instrument. The Portfolio's use of derivatives may involve the purchase and sale of derivative instruments such as options, futures, swaps and structured investments (including commodity-linked notes), and other related instruments and techniques. The Portfolio may also utilize foreign currency forward exchange contracts, which are also derivatives, in connection with its investments in foreign securities.
Process
The Adviser will utilize a top-down investment approach that focuses on asset class, sector, region, country and currency selection. The Portfolio's allocations will be based upon the Adviser's evaluations and analyses, taking into account results of its fundamental market research and recommendations generated by the Adviser's quantitative models. Investment decisions will be made without regard to any particular allocation as to geographical location, sector, credit rating, maturity, currency denomination or market capitalization. The Portfolio may invest in any country, including developing or emerging market countries. In determining whether securities should be sold, the Adviser considers factors such as changes in capital appreciation potential, or the overall assessment of asset class, sector, region, country and currency selection shifts.
Derivative instruments used by the Portfolio will be counted toward the Portfolio's exposure to the types of securities listed above to the extent they have economic characteristics similar to such securities.
Principal Risks
The Portfolio's principal investment strategies are subject to the following principal risks:
The Portfolio is subject to various risks that could adversely affect its NAV, yield and total return. It is possible for an investor to lose money by investing in the Portfolio.
5
Details of the Portfolio (Cont'd)
The prices of common stocks rise and fall in response to events that affect entire financial markets or industries, and to events that affect a particular issuer.
To the extent that the Portfolio invests in convertible securities, and the convertible security's investment value is greater than its conversion value, its price will be likely to increase when interest rates fall and decrease when interest rates rise. If the conversion value exceeds the investment value, the price of the convertible security will tend to fluctuate directly with the price of the underlying security.
The Portfolio is subject to the risks of investing in fixed income securities. The prices of fixed income securities respond to economic developments, particularly interest rate changes, changes in the general level of spreads between U.S. Treasury and non-Treasury securities, and changes in the actual or perceived creditworthiness of the issuer of the fixed income security. Securities with longer durations are likely to be more sensitive to changes in interest rates, generally making them more volatile than securities with shorter durations. Lower rated fixed income securities have greater volatility because there is less certainty that principal and interest payments will be made as scheduled. Securities with greater spread durations are likely to be more sensitive to changes in spreads between U.S. Treasury and non-Treasury securities, generally making them more volatile than securities with lesser spread durations. Spread duration measures the change in the value of a security (or portfolio) for a given change in the interest rate spread (difference) between Treasury and non-Treasury securities. Prices of fixed income securities generally will move in correlation to changes in an issuer's credit rating and inversely to movements in interest rates.
The Portfolio's investments in high yield securities expose it to a substantial degree of credit risk. These investments are considered speculative under traditional investment standards. High yield securities range from those for which the prospect for repayment of principal and interest is predominantly speculative to those which are currently in default on principal or interest payments. High yield securities may be issued by companies that are restructuring, are smaller and less creditworthy or are more highly indebted than other companies. This means that they may have more difficulty making scheduled payments of principal and interest. Prices of high yield securities will rise and fall primarily in response to actual or perceived changes in the issuer's financial health, although changes in market interest rates also will affect prices. High yield securities may experience reduced liquidity and sudden and substantial decreases in price.
Mortgage securities are subject to the risk that if interest rates decline, borrowers may pay off their mortgages sooner than expected. Rates of prepayment faster or slower than anticipated by the Adviser could result in reduced yields, increased volatility and/or reductions in NAV. The Portfolio's return may be reduced if prepayments occur and the Portfolio has to reinvest at lower interest rates. Prepayment rates can also shorten or extend the average life of the Portfolio's mortgage securities.
Investing in the securities of foreign issuers, particularly those located in emerging market or developing countries, entails the risk that news and events unique to a country or region will affect those markets and their issuers. The value of the Portfolio's shares may vary widely in response to political and economic factors affecting companies in foreign countries. These same events will not necessarily have an effect on the U.S. economy or similar issuers located in the United States. In addition, investments in certain foreign markets, which have historically been considered stable, may become more volatile and subject to increased risk due to ongoing developments and changing conditions in such markets. Moreover, the growing interconnectivity of global economies and financial markets has increased the probability that adverse developments and conditions in one country or region will affect the stability of economies and financial markets in other countries or regions.
The Portfolio's investments may be denominated in foreign currencies. As a result, changes in the value of a country's currency compared to the U.S. dollar may affect the value of the Portfolio's investments. These changes may occur separately from and in response to events that do not otherwise affect the value of the security in the issuer's home country. Hedging the Portfolio's currency risks through foreign currency forward exchange contracts involves the risk of mismatching the Portfolio's objectives under a foreign
6
Global Strategist Portfolio Prospectus
July 16, 2012
currency forward exchange contract with the value of securities denominated in a particular currency. There is additional risk to the effect that currency contracts create exposure to currencies in which the Portfolio's securities are not denominated. Unanticipated changes in currency prices may result in poorer overall performance for the Portfolio than if it had not entered into such contracts. The use of foreign currency forward exchange contracts involves the risk of loss from the insolvency or bankruptcy of the counterparty to the contract or the failure of the counterparty to make payments or otherwise comply with the terms of the contract.
At various times, some asset classes will perform better or worse than others. There is a risk that the Portfolio could invest too much or too little in particular asset classes, which could adversely affect the Portfolio's overall performance.
REITs pool investors' funds for investments primarily in real estate properties. Like mutual funds, REITs have expenses, including advisory and administration fees, that are paid by their shareholders. As a result, shareholders will absorb duplicate levels of fees when the Portfolio invests in REITs. The performance of any Portfolio REIT holdings ultimately depends on the types of real property in which the REITs invest and how well the property is managed. A general downturn in real estate values also can hurt REIT performance. In addition, REITs are subject to certain provisions under federal tax law. The failure of a company to qualify as a REIT could have adverse consequences for the Portfolio, including significantly reducing return to the Portfolio on its investment in such company.
The Portfolio may purchase U.S. government securities that are not backed by the full faith and credit of the United States. With respect to these U.S. government securities, there is the risk that the U.S. Government will not provide financial support to such U.S. government agencies, instrumentalities or sponsored enterprises if it is not obligated to do so by law. The maximum potential liability of the issuers of some U.S. government securities held by the Portfolio may greatly exceed their current resources, including their legal right to support from the U.S. Treasury. It is possible that these issuers will not have the funds to meet their payment obligations in the future.
Any Portfolio investment in an investment company, including ETFs, is subject to the underlying risk of that investment company's portfolio securities. ETFs seek to track the performance of various portions or segments of the equity markets. Shares of ETFs have many of the same risks as direct investments in common stocks or bonds and their market value is expected to rise and fall as the value of the underlying index rises and falls. The market value of their shares may differ from the NAV of the particular underlying securities. As a shareholder in an investment company, the Portfolio would bear its ratable share of that entity's expenses. At the same time, the Portfolio would continue to pay its own investment management fees and other expenses. As a result, the Portfolio and its shareholders, in effect, will be absorbing duplicate levels of fees with respect to investments in other investment companies.
The Portfolio's investments in restricted and illiquid securities may entail greater risk than investments in publicly traded securities. These securities may be more difficult to sell, particularly in times of market turmoil. Illiquid securities may be more difficult to value. If the Portfolio is forced to sell an illiquid security to fund redemptions or for other cash needs, it may be forced to sell the security at a loss.
A derivative instrument often has risks similar to its underlying asset and may have additional risks, including imperfect correlation between the value of the derivative and the underlying asset, risks of default by the counterparty to certain transactions, magnification of losses incurred due to changes in the market value of the securities, instruments, indices or interest rates to which they relate, and risks that the transactions may not be liquid. Certain derivative transactions may give rise to a form of leverage. Leverage magnifies the potential for gain and the risk of loss.
Please see "Additional Information about the Portfolio's Investment Strategies and Related Risks" for further information about these and other risks of investing in the Portfolio.
7
Additional Information about the Portfolio's Investment Strategies and Related Risks
This section discusses additional information relating to the Portfolio's investment strategies, other types of investments that the Portfolio may make and related risk factors. The Portfolio's investment practices and limitations are also described in more detail in the Statement of Additional Information ("SAI"), which is incorporated by reference and legally is a part of this Prospectus. For details on how to obtain a copy of the SAI and other reports and information, see the back cover of this Prospectus.
Equity Securities
Equity securities may include common and preferred stocks, depositary receipts, convertible securities, equity-linked securities, REITs, rights and warrants to purchase equity securities, limited partnership interests, other specialty securities having equity features and shares of investment companies. The Portfolio may invest in equity securities that are publicly traded on securities exchanges or over-the-counter or in equity securities that are not publicly traded. Securities that are not publicly traded may be more difficult to sell and their value may fluctuate more dramatically than other securities. For purposes of the Portfolio, companies traded on a U.S. exchange include companies listed on Nasdaq.
Depositary receipts involve many of the same risks as those associated with direct investment in foreign securities. In addition, the underlying issuers of certain depositary receipts, particularly unsponsored or unregistered depositary receipts, are under no obligation to distribute shareholder communications to the holders of such receipts, or to pass through to them any voting rights with respect to the deposited securities.
Fixed Income Securities
Fixed income securities are securities that pay a fixed or a variable rate of interest until a stated maturity date. Fixed income securities include U.S. government securities, securities issued by federal or federally sponsored agencies and instrumentalities ("agencies"), corporate bonds and notes, asset-backed securities, mortgage securities, high yield securities (commonly referred to as "junk bonds" or high risk securities), municipal bonds, loan participations and assignments, zero coupon bonds, convertible securities, Eurobonds, Brady Bonds, Yankee Bonds, repurchase agreements, commercial paper and cash equivalents.
These securities are subject to risks related to changes in interest rates and in the financial health or credit rating of the issuers. The maturity and duration of a fixed income instrument also affects the extent to which the price of the security will change in response to these and other factors. Longer term securities tend to experience larger price changes than shorter term securities because they are more sensitive to changes in interest rates or in the credit ratings of the issuers.
Fixed income securities may be called (i.e., redeemed by the issuer) prior to final maturity. If a callable security is called, the Portfolio may have to reinvest the proceeds at a lower rate of interest.
Duration
The average duration of a portfolio of fixed income securities represents its exposure to changing interest rates. A portfolio with a lower average duration generally will experience less price volatility in response to changes in interest rates than a portfolio with a higher average duration.
High Yield Securities
Fixed income securities that are not investment grade are commonly referred to as "junk bonds" or high yield, high risk securities. These securities offer a higher yield than other higher rated securities, but they carry a greater degree of risk and are considered speculative by the major credit rating agencies. High yield securities may be issued by companies that are restructuring, are smaller and less creditworthy or are more highly indebted than other companies. This means that they may have more difficulty making scheduled payments of principal and interest. Changes in the value of high yield securities are influenced more by changes in the financial and business position of the issuing company than by changes in interest rates when compared to investment grade securities.
Mortgage Securities
Mortgage securities are fixed income securities representing an interest in a pool of underlying mortgage loans. They are sensitive to changes in interest rates, but may respond to these changes
8
Global Strategist Portfolio Prospectus
July 16, 2012
differently from other fixed income securities due to the possibility of prepayment of the underlying mortgage loans. As a result, it may not be possible to determine in advance the actual maturity date or average life of a mortgage security. Rising interest rates tend to discourage refinancings, with the result that the average life and volatility of the security will increase and its market price will decrease. When interest rates fall, however, mortgage securities may not gain as much in market value because additional mortgage prepayments must be reinvested at lower interest rates. Prepayment risk may make it difficult to calculate the average maturity of a portfolio of mortgage securities and, therefore, to assess the volatility risk of that portfolio.
The Portfolio may invest in mortgage securities that are issued or guaranteed by the U.S. government, its agencies or instrumentalities. These securities are either direct obligations of the U.S. government or the issuing agency or instrumentality has the right to borrow from the U.S. Treasury to meet its obligations although it is not legally required to extend credit to the agency or instrumentality. Certain of these mortgage securities purchased by the Portfolio, such as those issued by the Government National Mortgage Association and the Federal Housing Administration are backed by the full faith and credit of the United States. Other of these mortgage securities purchased by the Portfolio, such as those issued by the Federal National Mortgage Association ("Fannie Mae") and Federal Home Loan Mortgage Corporation ("Freddie Mac"), are not backed by the full faith and credit of the United States and there is a risk that the U.S. Government will not provide financial support to these agencies if it is not obligated to do so by law. In September 2008, the U.S. Treasury Department announced that the government would be taking over Fannie Mae and Freddie Mac and placing the companies into a conservatorship. In addition, the U.S. Treasury announced additional steps that it intended to take with respect to the debt and mortgage-backed securities issued by Fannie Mae and Freddie Mac in order to support the conservatorship. No assurance can be given that these initiatives will be successful.
The maximum potential liability of the issuers of some of the mortgage securities held by the Portfolio may greatly exceed their current resources, including their legal right to support from the U.S. Treasury. It is possible that these issuers will not have the funds to meet their payment obligations in the future.
To the extent the Portfolio invests in mortgage securities offered by non-governmental issuers, such as commercial banks, savings and loan institutions, private mortgage insurance companies, mortgage bankers and other secondary market issuers, the Portfolio may be subject to additional risks. Timely payment of interest and principal of non-governmental issuers are supported by various forms of private insurance or guarantees, including individual loan, title, pool and hazard insurance purchased by the issuer. There can be no assurance that the private insurers can meet their obligations under the policies.
An unexpectedly high rate of defaults on the mortgages held by a mortgage pool may adversely affect the value of a mortgage backed security and could result in losses to a Portfolio. The risk of such defaults is generally higher in the case of mortgage pools that include subprime mortgages. Subprime mortgages refer to loans made to borrowers with weakened credit histories or with a lower capacity to make timely payments on their mortgages.
Foreign Securities
Foreign issuers generally are subject to different accounting, auditing and financial reporting standards than U.S. issuers. There may be less information available to the public about foreign issuers. Securities of foreign issuers can be less liquid and experience greater price movements. In addition, the prices of such securities may be susceptible to influence by large traders, due to the limited size of many foreign securities markets. Moreover, investments in certain foreign markets, which have historically been considered stable, may become more volatile and subject to increased risk due to ongoing developments and changing conditions in such markets. Also, the growing interconnectivity of global economies and financial markets has increased the probability that adverse developments and conditions in one country or region will affect the stability of economies and
9
financial markets in other countries or regions. In some foreign countries, there is also the risk of government expropriation, excessive taxation, political or social instability, the imposition of currency controls, or diplomatic developments that could affect an investing portfolio's investment. There also can be difficulty obtaining and enforcing judgments against issuers in foreign countries. Foreign stock exchanges, broker-dealers, and listed issuers may be subject to less government regulation and oversight. The cost of investing in foreign securities, including brokerage commissions and custodial expenses, can be higher than in the United States.
The Portfolio may invest in debt obligations known as "sovereign debt," which are obligations of governmental issuers in emerging market or developing countries and industrialized countries. Certain emerging market or developing countries are among the largest debtors to commercial banks and foreign governments. The issuer or governmental authority that controls the repayment of sovereign debt may not be willing or able to repay the principle and/or pay interest when due in accordance with the terms of such obligations.
In connection with its investments in foreign securities, the Portfolio also may enter into contracts with banks, brokers or dealers to purchase or sell securities or foreign currencies at a future date. A foreign currency forward exchange contract is a negotiated agreement between the contracting parties to exchange a specified amount of currency at a specified future time at a specified rate. The rate can be higher or lower than the spot rate between the currencies that are the subject of the contract. Foreign currency forward exchange contracts may be used to protect against uncertainty in the level of future foreign currency exchange rates or to gain or modify exposure to a particular currency. In addition, the Portfolio may use cross currency hedging or proxy hedging with respect to currencies in which the Portfolio has or expects to have portfolio or currency exposure. Cross currency hedges involve the sale of one currency against the positive exposure to a different currency and may be used for hedging purposes or to establish an active exposure to the exchange rate between any two currencies.
Foreign Currency
The Portfolio's investments may be denominated in foreign currencies. The value of foreign currencies fluctuates relative to the value of the U.S. dollar. Since the Portfolio may invest in such non-U.S. dollar-denominated securities, and therefore may convert the value of such securities into U.S. dollars, changes in currency exchange rates can increase or decrease the U.S. dollar value of the Portfolio's assets. The Adviser may use derivatives to reduce this risk. The Adviser may in its discretion choose not to hedge against currency risk. In addition, certain market conditions may make it impossible or uneconomical to hedge against currency risk.
Emerging Market Securities
Investing in emerging market securities enhances the risks of foreign investing. In addition, emerging market securities generally are less liquid and subject to wider price and currency fluctuations than securities issued in more developed countries. In certain countries, the market may be dominated by a few issuers or sectors. Investment funds and structured investments are mechanisms for U.S. and other investors to invest in certain emerging markets that have laws precluding or limiting direct investments by foreign investors.
Convertible Securities
A convertible security is a bond, debenture, note, preferred stock, right, warrant or other security that may be converted into or exchanged for a prescribed amount of common stock or other security of the same or a different issuer or into cash within a particular period of time at a specified price or formula. A convertible security generally entitles the holder to receive interest paid or accrued on debt securities or the dividend paid on preferred stock until the convertible security matures or is redeemed, converted or exchanged. Before conversion, convertible securities generally have characteristics similar to both debt and equity securities. The value of convertible securities tends to decline as interest rates rise and, because of the conversion feature, tends to vary with fluctuations in the market value of the underlying securities. Convertible securities ordinarily provide a stream of income with generally higher yields than those of common stock of the same or similar issuers. Convertible securities generally rank
10
Global Strategist Portfolio Prospectus
July 16, 2012
senior to common stock in a corporation's capital structure but are usually subordinated to comparable nonconvertible securities. Convertible securities generally do not participate directly in any dividend increases or decreases of the underlying securities although the market prices of convertible securities may be affected by any dividend changes or other changes in the underlying securities.
Derivatives
The Portfolio may, but it is not required to, use derivative instruments for a variety of purposes, including hedging, risk management, portfolio management or to earn income. Derivatives are financial instruments whose value is based on the value of an underlying asset, interest rate, index or financial instrument. A derivative instrument often has risks similar to its underlying asset and may have additional risks, including imperfect correlation between the value of the derivative and the underlying asset, risks of default by the counterparty to certain transactions, magnification of losses incurred due to changes in the market value of the securities, instruments, indices or interest rates to which they relate, and risks that the transactions may not be liquid. The use of derivatives involves risks that are different from, and possibly greater than, the risks associated with other portfolio investments. Derivatives may involve the use of highly specialized instruments that require investment techniques and risk analyses different from those associated with other portfolio investments.
Certain derivative transactions may give rise to a form of leverage. Leverage magnifies the potential for gain and the risk of loss. Leverage associated with derivative transactions may cause the Portfolio to liquidate portfolio positions when it may not be advantageous to do so to satisfy its obligations or to meet earmarking or segregation requirements, pursuant to applicable SEC rules and regulations, or may cause the Portfolio to be more volatile than if the Portfolio had not been leveraged. Although the Adviser seeks to use derivatives to further the Portfolio's investment objective, there is no assurance that the use of derivatives will achieve this result.
The derivative instruments and techniques that the Portfolio may use include:
Options. If the Portfolio buys an option, it buys a legal contract giving it the right to buy or sell a specific amount of the underlying instrument or futures contract on the underlying instrument at an agreed-upon price typically in exchange for a premium paid by the Portfolio. If the Portfolio sells an option, it sells to another person the right to buy from or sell to the Portfolio a specific amount of the underlying instrument or futures contract on the underlying instrument at an agreed-upon price typically in exchange for a premium received by the Portfolio. A decision as to whether, when and how to use options involves the exercise of skill and judgment and even a well-conceived option transaction may be unsuccessful because of market behavior or unexpected events. The prices of options can be highly volatile and the use of options can lower total returns.
Futures. A futures contract is a standardized, exchange-traded agreement to buy or sell a specific quantity of an underlying asset, reference rate or index at a specific price at a specific future time. The value of a futures contract tends to increase and decrease in tandem with the value of the underlying instrument. Depending on the terms of the particular contract, futures contracts are settled through either physical delivery of the underlying instrument on the settlement date or by payment of a cash settlement amount on the settlement date. A decision as to whether, when and how to use futures involves the exercise of skill and judgment and even a well-conceived futures transaction may be unsuccessful because of market behavior or unexpected events. In addition to the derivatives risks discussed above, the prices of futures contracts can be highly volatile, using futures can lower total return, and the potential loss from futures can exceed the Portfolio's initial investment in such contracts.
Swaps. An over-the-counter ("OTC") swap contract is an agreement between two parties pursuant to which the parties exchange payments at specified dates on the basis of a specified notional amount, with the payments calculated by reference to specified securities, indices, reference rates, currencies or other
11
instruments. A small percentage of swap contracts are cleared through a central clearinghouse. Most swap agreements provide that when the period payment dates for both parties are the same, the payments are made on a net basis (i.e., the two payment streams are netted out, with only the net amount paid by one party to the other). The Portfolio's obligations or rights under a swap contract entered into on a net basis will generally be equal only to the net amount to be paid or received under the agreement, based on the relative values of the positions held by each party. Most swap agreements are not entered into or traded on exchanges and often there is no central clearing or guaranty function for swaps. These OTC swaps are often subject to credit risk or the risk of default or non-performance by the counterparty. Swaps could result in losses if interest rate or foreign currency exchange rates or credit quality changes are not correctly anticipated by the Portfolio or if the reference index, security or investments do not perform as expected. The Portfolio's use of swaps may include those based on the credit of an underlying security, commonly referred to as "credit default swaps." Where the Portfolio is the buyer of a credit default swap contract, it would be entitled to receive the par (or other agreed-upon) value of a referenced debt obligation from the counterparty to the contract only in the event of a default or similar event by the issuer of the debt obligation. If no default occurs, the Portfolio would have paid to the counterparty a periodic stream of payments over the term of the contract and received no benefit from the contract. When the Portfolio is the seller of a credit default swap contract, it receives the stream of payments but is obligated to pay an amount equal to the par (or other agreed-upon) value of a referenced debt obligation upon the default or similar event of the issuer of the referenced debt obligation.
Structured Investments. The Portfolio also may invest a portion of its assets in structured investments. A structured investment is a derivative security designed to offer a return linked to a particular underlying security, currency, commodity or market. Structured investments may come in various forms including notes, warrants and options to purchase securities. The Portfolio will typically use structured investments to gain exposure to a permitted underlying security, currency, commodity or market when direct access to a market is limited or inefficient from a tax or cost standpoint. Investments in structured investments involve risks including issuer risk, counterparty risk and market risk. Holders of structured investments bear risks of the underlying investment and are subject to issuer or counterparty risk because the Portfolio is relying on the creditworthiness of such issuer or counterparty and has no rights with respect to the underlying investment. Certain structured investments may be thinly traded or have a limited trading market and may have the effect of increasing the Portfolio's illiquidity to the extent that the Portfolio, at a particular point in time, may be unable to find qualified buyers for these securities.
Temporary Defensive Investments
When the Adviser believes that changes in economic, financial or political conditions warrant, the Portfolio may invest without limit in fixed income securities for temporary defensive purposes that may be inconsistent with the Portfolio's principal investment strategies. If the Adviser incorrectly predicts the effects of these changes, the defensive investments may adversely affect the Portfolio's performance. Using defensive investments could cause the Portfolio to fail to meet its investment objective.
12
Global Strategist Portfolio Prospectus
July 16, 2012
Portfolio Holdings
A description of the policies and procedures of the Fund with respect to the disclosure of the Portfolio's securities is available in the Fund's SAI.
Purchasing Class I, Class P and Class L Shares
Share Class Arrangements
The minimum initial investment generally is $5,000,000 for Class I shares, $1,000,000 for Class P shares and $25,000 for Class L shares of the Portfolio.
Class I shares are not subject to either a distribution fee or a shareholder servicing fee. Class P shares are subject to a monthly service fee at an annual rate of up to 0.25% of the Portfolio's average daily net assets attributable to Class P shares. Class L shares are subject to a monthly distribution fee at an annual rate of up to 0.50% of the Portfolio's average daily net assets attributable to Class L shares and a monthly shareholder servicing fee at an annual rate of up to 0.25% of the Portfolio's average daily net assets attributable to Class L shares.
General
Shares of the Portfolio may be purchased directly from Morgan Stanley Institutional Fund Trust or through a financial intermediary. Investors purchasing shares through a financial intermediary may be charged a transaction-based or other fee by the financial intermediary for its services. If you are purchasing shares through a financial intermediary, please consult your intermediary for purchase instructions.
Shares of the Portfolio may, in the Fund's discretion, be purchased with investment securities (in lieu of, or in conjunction with, cash) acceptable to the Fund. The securities would be accepted by the Fund at their market value in return for shares of the Portfolio.
Shares of the Portfolio may be purchased at the NAV next determined after we receive your purchase order. The NAV of the Portfolio is determined as of the close of the NYSE (normally 4:00 p.m. Eastern Time) on each day the NYSE is open for business.
To help the U.S. Government fight the funding of terrorism and money laundering activities, federal law requires all financial institutions to obtain, verify and record information that identifies each person who opens an account. What this means to you is that when you open an account, we will ask your name, address, date of birth and other information that will allow us to identify you. If we are unable to verify your identity, we reserve the right to restrict additional transactions and/or liquidate your account at the next calculated NAV after your account is closed (less any applicable sales/account charges and/or tax penalties) or take any other action required by law. In accordance with federal law requirements, the Fund has implemented an anti-money laundering compliance program, which includes designation of an anti-money laundering compliance officer.
Initial Purchase by Mail
You may open an account, subject to acceptance by the Fund, by completing and signing an Account Registration Form provided by Morgan Stanley Services Company, Inc. ("Morgan Stanley Services"), the Fund's transfer agent, which you can obtain by calling Morgan Stanley Services at 1-800-548-7786 and mailing it to Morgan Stanley Institutional Fund Trust, c/o Morgan Stanley Services Company Inc., P.O. Box 219804, Kansas City, MO 64121-9804 together with a check payable to Morgan Stanley Institutional Fund Trust.
Please note that payments to investors who redeem shares purchased by check will not be made until payment of the purchase has been collected, which may take up to 15 business days after purchase. You can avoid this delay by purchasing shares by wire.
Initial Purchase by Wire
You may purchase shares of the Portfolio by wiring Federal Funds (monies credited by a Federal Reserve Bank) to State Street Bank and Trust Company (the "Custodian"). You should forward a completed Account Registration Form to Morgan Stanley Services in advance of the wire. See the section below entitled "Valuation of Shares." Instruct your bank to send a Federal Funds wire in a specified amount to the Custodian using the following wire instructions:
State Street Bank and Trust Company
One Lincoln Street
Boston, MA 02111-2101
ABA #011000028
DDA #00575373
Attn: Morgan Stanley Institutional Fund
Trust Subscription Account
Ref: (Portfolio Name, Account Number, Account Name)
13
Additional Investments
You may make additional investments of shares at the NAV next determined after the request is received in good order, by mailing a check (payable to Morgan Stanley Institutional Fund Trust) to Morgan Stanley Services at the address noted under Initial Purchase by Mail or by wiring Federal Funds to the Custodian as outlined above.
Other Purchase Information
The Fund may suspend the offering of shares, or any class of shares, of the Portfolio or reject any purchase orders when we think it is in the best interest of the Fund. The minimum initial investment in Class I shares, Class P shares or Class L shares may be waived for certain investments, including sales through banks, broker-dealers and other financial institutions (including registered investment advisers and financial planners) purchasing shares on behalf of their clients in (i) discretionary and non-discretionary advisory programs, (ii) fund supermarkets, (iii) asset allocation programs or (iv) other programs in which the client pays an asset-based fee for advice or for executing transactions in Portfolio shares or for otherwise participating in the program. In addition, the minimum initial investment will be waived for: (i) certain retirement plans investing directly with the Fund; (ii) retirement plans investing through certain retirement plan platforms; (iii) certain endowments, foundations and other not for profit entities investing directly with the Fund; (iv) other registered investment companies advised by Morgan Stanley Investment Management or any of its affiliates; (v) Morgan Stanley Investment Management and its affiliates with respect to shares held in connection with certain retirement and deferred compensation programs established for their employees; (vi) the Independent Trustees of the Fund; (vii) with respect to holders of Class I shares and Class P shares, clients who owned Portfolio shares as of December 31, 2007; and (viii) investments made in connection with certain reorganizations as approved by the Adviser. If the value of your account falls below the minimum initial investment amount for Class I shares, Class P shares or Class L shares as a result of share redemptions or you no longer meet one of the waiver criteria set forth above, your account may be subject to involuntary conversion or involuntary redemption. You will be notified prior to any such conversions or redemptions.
Certain patterns of past exchanges and/or purchase or sale transactions involving the Portfolio may result in the Fund rejecting, limiting or prohibiting, at its sole discretion, and without prior notice, additional purchases and/or exchanges and may result in a shareholder's account being closed. Determinations in this regard may be made based on the frequency or dollar amount of the previous exchanges or purchase or sale transactions.
Purchases of the Portfolio's shares will be made in full and fractional shares of the Portfolio calculated to three decimal places.
Purchasing Class H Shares
Class H shares are available to investors with a minimum investment of $25,000. If the value of your account falls below the minimum initial investment amount for Class H shares as a result of share redemptions, your account may be subject to involuntary redemption. You will be notified prior to any such redemptions. Class H shares are subject to a sales charge equal to a maximum of 4.75% calculated as a percentage of the offering price on a single transaction as shown in the table below. As shown below, the sales charge is reduced for purchases of $50,000 and over. Class H shares are subject to a monthly shareholder services fee at an annual rate of up to 0.25% of the Portfolio's average daily net assets attributable to Class H shares.
| Front-End Sales Charge | |||||||||||
| Amount of Single Transaction | Percentage of Public Offering Price | Approximate Percentage of Net Amount Invested | |||||||||
| $25,000 but less than $50,000 | 4.75 | % | 4.99 | % | |||||||
| $50,000 but less than $100,000 | 4.00 | % | 4.17 | % | |||||||
| $100,000 but less than $250,000 | 3.00 | % | 3.09 | % | |||||||
| $250,000 but less than $500,000 | 2.50 | % | 2.56 | % | |||||||
| $500,000 but less than $1 million | 2.00 | % | 2.04 | % | |||||||
| $1 million and over | 0.00 | % | 0.00 | % | |||||||
14
Global Strategist Portfolio Prospectus
July 16, 2012
You may benefit from a reduced sales charge schedule (i.e., breakpoint discount) for purchases of Class H shares of the Portfolio, by combining, in a single transaction, your purchase with purchases of Class H shares of the Portfolio by the following related accounts:
• A single account (including an individual, trust or fiduciary account).
• A family member account (limited to spouse, and children under the age of 21).
• Pension, profit sharing or other employee benefit plans of companies and their affiliates.
• Employer sponsored and individual retirement accounts (including IRAs, Keogh, 401(k), 403(b), 408(k) and 457(b) Plans).
• Tax-exempt organizations.
• Groups organized for a purpose other than to buy mutual fund shares.
In addition to investments of $1 million or more, purchases of Class H shares are not subject to a front-end sales charge for accounts of employees of Morgan Stanley and its subsidiaries, such persons' family members (limited to spouse, and children under the age of 21) and trust accounts for which any such person is a beneficiary.
Combined Purchase Privilege
You will have the benefit of reduced sales charges by combining purchases of Class H shares of the Portfolio for any related account in a single transaction with purchases of Class H shares of another portfolio of the Fund or of a portfolio of Morgan Stanley Institutional Fund, Inc. for the related account or any other related account. For the purpose of this combined purchase privilege, a "related account" is:
• A single account (including an individual account, a joint account and a trust account established solely for the benefit of the individual).
• A family member account (limited to spouse, and children under the age of 21, but including trust accounts established solely for the benefit of a spouse, or children under the age of 21).
• An IRA and single participant retirement account (such as a Keogh).
• An UGMA/UTMA account.
Right of Accumulation
You may benefit from a reduced sales charge if the cumulative NAV of Class H shares of the Portfolio purchased in a single transaction, together with the NAV of all Class H shares of a portfolio of the Fund or a portfolio of Morgan Stanley Institutional Fund, Inc. held in related accounts, amounts to $50,000 or more. For the purposes of the rights of accumulation privilege, a related account is any one of the accounts listed under "Combined Purchase Privilege" above.
Notification
You must notify your authorized financial representative at the time a purchase order is placed, that the purchase qualifies for a reduced sales charge under any of the privileges discussed above. Similar notification must be made in writing when an order is placed by mail. The reduced sales charge will not be granted if: (i) notification is not furnished at the time of the order; or (ii) a review of the records of your authorized financial representative or the Fund's transfer agent, Morgan Stanley Services, does not confirm your represented holdings.
In order to obtain a reduced sales charge under any of the privileges discussed above, it may be necessary at the time of purchase for you to inform your authorized financial representative of the existence of other accounts in which there are holdings eligible to be aggregated to meet the sales load breakpoint and/or right of accumulation threshold. In order to verify your eligibility, you may be required to provide account statements and/or confirmations regarding Class H shares of the Portfolio or a portfolio of Morgan Stanley Institutional Fund, Inc. held in all related accounts described above at your authorized financial representative, as well as shares held by related parties, in order to determine whether you have met the sales load breakpoint and/or right of accumulation threshold.
Letter of Intent
The above schedule of reduced sales charges for larger purchases also will be available to you if you enter into a written "Letter of Intent." A Letter of Intent provides for the purchase of Class H shares of the Portfolio or a portfolio of Morgan Stanley Institutional Fund, Inc. within a 13-month period. The initial purchase under a Letter of Intent must be at least 5% of the stated investment goal. The Letter of Intent does not preclude the Portfolio from discontinuing sales of its shares. To determine the applicable sales charge reduction, you may also include (1) the cost of shares of other Class H shares which were previously purchased at a price including a front-end sales charge during the 90-day period prior to the Distributor receiving the Letter of Intent, and (2) the historical cost of shares of other
15
portfolios of the Fund or portfolios of Morgan Stanley Institutional Fund, Inc. you currently own acquired in exchange for shares of other portfolios of the Fund or portfolios of Morgan Stanley Institutional Fund, Inc. purchased during that period at a price including a front-end sales charge. You may combine purchases and exchanges by family members (limited to spouse, and children under the age of 21) during the periods referenced in (1) and (2) above. You should retain any records necessary to substantiate historical costs because the Fund, the Transfer Agent, your authorized financial representative and any financial intermediaries may not maintain this information. You can obtain a Letter of Intent by contacting your authorized financial representative. If you do not achieve the stated investment goal within the 13-month period, you are required to pay the difference between the sales charges otherwise applicable and sales charges actually paid, which may be deducted from your investment. Shares acquired through reinvestment of distributions are not aggregated to achieve the stated investment goal.
General
Class H shares of the Portfolio may be purchased by contacting your authorized financial representative who will assist you, step-by-step, with the procedures to invest in Class H shares of the Portfolio. Class H shares of the Portfolio may, in the Fund's discretion, be purchased with investment securities (in lieu of or, in conjunction with, cash) acceptable to the Fund. The securities would be accepted by the Fund at their market value in return for shares of the Portfolio, taking into account any applicable sales charge.
Class H shares of the Portfolio may be purchased at the NAV (plus any applicable front-end sales charge) next determined after we receive your purchase order. The NAV of the Portfolio is determined as of the close of the NYSE (normally 4:00 p.m. Eastern Time) on each day the NYSE is open for business.
Additional Investments
You may make additional investments of shares at the NAV next determined after the request is received, plus any applicable sales charge, by the method described above.
Order Processing Fee
Your financial intermediary may charge processing or other fees in connection with the purchase or sale of shares of the Portfolio. Please consult your authorized financial representative for more information regarding any such fees.
Other Purchase Information
The Fund may suspend the offering of shares, or any class of shares, of the Portfolio or reject any purchase orders when we think it is in the best interest of the Fund. The Fund, in its sole discretion, may waive the minimum initial and additional investment amounts in certain cases.
Certain patterns of past exchanges and/or purchase or sale transactions involving the Portfolio may result in the Fund rejecting, limiting or prohibiting, at its sole discretion and without prior notice additional purchases and/or exchanges and may result in a shareholder's account being closed. Determinations in this regard may be made based on the frequency or dollar amount of the previous exchanges or purchase or sale transactions.
Purchases of the Portfolio's shares will be made in full and fractional shares of the Portfolio calculated to three decimal places.
Redeeming Shares
Class I, Class P and Class L
You may redeem Class I, Class P and Class L shares of the Portfolio by mail, or, if authorized, by telephone at no charge. The value of shares redeemed may be more or less than the purchase price, depending on the NAV at the time of redemption. Shares of the Portfolio will be redeemed at the NAV next determined after we receive your redemption request in good order. If you are redeeming shares through a financial intermediary, please consult your intermediary for redemption instructions.
By Mail
Requests should be addressed to Morgan Stanley Institutional Fund Trust, c/o Morgan Stanley Services Company Inc., P.O. Box 219804, Kansas City, MO 64121-9804.
16
Global Strategist Portfolio Prospectus
July 16, 2012
To be in good order, redemption requests must include the following documentation:
(a) A letter of instruction, if required, or a stock assignment specifying the number of shares or dollar amount to be redeemed, signed by all registered owners of the shares in the exact names in which the shares are registered;
(b) The share certificates, if issued;
(c) Any required signature guarantees; and
(d) Other supporting legal documents, if required, in the case of estates, trusts, guardianships, custodianship, corporations, pension and profit sharing plans and other organizations.
By Telephone
You automatically have telephone redemption and exchange privileges unless you indicate otherwise by checking the applicable box on the new account application form or calling Morgan Stanley Services to opt out of such privileges. You may request a redemption of shares by calling the Fund at 1-800-548-7786 and requesting that the redemption proceeds be wired to you. You cannot redeem shares by telephone if you hold share certificates for those shares. For your protection when calling the Fund, we will employ reasonable procedures to confirm that redemption instructions communicated over the telephone are genuine. These procedures may include requiring various forms of personal identification such as name, mailing address, social security number or other tax identification number. Telephone instructions may also be recorded. If reasonable procedures are employed, none of Morgan Stanley, Morgan Stanley Services or the Fund will be liable for following telephone instructions which it reasonably believes to be genuine. Telephone redemptions and exchanges may not be available if you cannot reach Morgan Stanley Services by telephone, whether because all telephone lines are busy or for any other reason; in such case, a shareholder would have to use the Fund's other redemption and exchange procedures described in this Prospectus. During periods of drastic economic or market changes, it is possible that the telephone privileges may be difficult to implement, although this has not been the case with the Fund in the past. To opt out of telephone privileges, please contact Morgan Stanley Services at 1-800-548-7786.
Class H
You may redeem Class H shares of the Portfolio by contacting your authorized financial representative. The value of shares redeemed may be more or less than the purchase price, depending on the NAV at the time of redemption. Class H shares of the Portfolio will be redeemed at the NAV next determined after the request is received in good order.
General
The Fund will ordinarily pay redemption proceeds in cash within seven business days after receipt of your request. The Fund may suspend the right of redemption or postpone the payment of redemption proceeds at times when the NYSE is closed or under other circumstances in accordance with interpretations or orders of the SEC.
If we determine that it is in the best interest of the Fund or Portfolio not to pay redemption proceeds in cash, we may distribute to you securities held by the Portfolio from which you are redeeming. Such in-kind securities may be illiquid and difficult or impossible for a shareholder to sell at a time and at a price that a shareholder would like. If requested, we will pay a portion of your redemption(s) in cash (during any 90 day period) up to the lesser of $250,000 or 1% of the net assets of the Portfolio at the beginning of such period. Redemptions paid in investment securities will give rise to income, gain or loss for income tax purposes in the same manner as redemptions paid in cash. In addition, you may incur brokerage costs and a further gain or loss for income tax purposes when you ultimately sell the securities.
Frequent Purchases and Redemptions of Shares
Frequent purchases and redemptions of shares by Portfolio shareholders are referred to as "market-timing" or "short-term trading" and may present risks for other shareholders of the Portfolio, which may include, among other things, dilution in the value of the Portfolio's shares held by long-term shareholders, interference with the efficient management of the Portfolio, increased brokerage and administrative costs, incurring unwanted taxable gains and forcing the Portfolio to hold excess levels of cash.
17
In addition, the Portfolio is subject to the risk that market-timers and/or short-term traders may take advantage of time zone differences between the foreign markets on which the Portfolio's securities trade and the time as of which the Portfolio's NAV is calculated ("time-zone arbitrage"). For example, a market-timer may purchase shares of the Portfolio based on events occurring after foreign market closing prices are established, but before the Portfolio's NAV calculation, that are likely to result in higher prices in foreign markets the following day. The market-timer would redeem the Portfolio's shares the next day when the Portfolio's share price would reflect the increased prices in foreign markets for a quick profit at the expense of long-term Portfolio shareholders.
Investments in other types of securities also may be susceptible to short-term trading strategies. These investments include securities that are, among other things, thinly traded, traded infrequently, or relatively illiquid, which have the risk that the current market price for the securities may not accurately reflect current market values. A shareholder may seek to engage in short-term trading to take advantage of these pricing differences (referred to as "price-arbitrage"). Investments in certain fixed income securities, such as high yield bonds, may be adversely affected by price arbitrage trading strategies.
The Fund discourages and does not accommodate frequent purchases and redemptions of Portfolio shares by Portfolio shareholders and the Fund's Board of Trustees has adopted policies and procedures with respect to such frequent purchases and redemptions. The Fund's policies with respect to purchases, exchanges and redemptions of shares are described in the "Purchasing Shares," "General Shareholder Information" and "Redeeming Shares" sections of this Prospectus. Except as described in each of these sections, and with respect to trades that occur through omnibus accounts at intermediaries as described below, the Fund's policies regarding frequent trading of shares are applied uniformly to all shareholders. With respect to trades that occur through omnibus accounts at financial intermediaries, such as investment advisers, broker-dealers, transfer agents and third party administrators, the Fund (i) requests assurance that such intermediaries currently selling shares have in place internal policies and procedures reasonably designed to address market-timing concerns and has instructed such intermediaries to notify the Fund immediately if they are unable to comply with such policies and procedures and (ii) requires all prospective intermediaries to agree to cooperate in enforcing the Fund's policies (or, upon prior written approval only, an intermediary's own policies) with respect to frequent purchases, exchanges and redemptions of shares.
Omnibus accounts generally do not identify customers' trading activity to the Fund on an individual ongoing basis. Therefore, with respect to trades that occur through omnibus accounts at financial intermediaries, to some extent, the Fund relies on the financial intermediary to monitor frequent short-term trading within the Fund by the financial intermediary's customers. However, the Fund or the Distributor has entered into agreements with financial intermediaries whereby intermediaries are required to provide certain customer identification and transaction information upon the Fund's request. The Fund may use this information to help identify and prevent market-timing activity in the Fund. There can be no assurance that the Fund will be able to identify or prevent all market-timing activities.
General Shareholder Information
Share Classes
This Prospectus offers Class I, Class P, Class H and Class L shares of the Portfolio, each having different distribution arrangements designed to provide you with different purchase options according to your investment needs. Class I and Class P shares are generally restricted to investments in minimum amounts that are substantially higher than Class H and Class L shares.
Valuation of Shares
The price of the Portfolio's shares (NAV) is based on the value of the Portfolio's securities. The NAV of the Portfolio is determined as of the close of the NYSE (normally 4:00 p.m. Eastern Time) on each day the NYSE is open for business. The Fund may, however, elect to remain open and price shares of the Portfolio on days where the NYSE is closed but the primary securities markets on which the Portfolio's securities
18
Global Strategist Portfolio Prospectus
July 16, 2012
trade remain open, in which case the NAV of the Portfolio will be determined as of the close of such primary securities markets.
The Portfolio values its securities at market value. When no market quotations are readily available for securities, including circumstances under which the Adviser determines that a security's market price is not accurate, we will determine the value for those securities in good faith at fair value using methods approved by the Fund's Board of Trustees. In addition, with respect to securities that primarily are listed on foreign exchanges, when an event occurs after the close of such exchanges that is likely to have changed the value of the securities (for example, a percentage change in value of one or more U.S. securities indices in excess of specified thresholds), such securities will be valued at their fair value, as determined under procedures established by the Fund's Board of Trustees. Securities also may be fair valued in the event of a significant development affecting a country or region or an issuer-specific development which is likely to have changed the value of the security. In these cases, the Portfolio's NAV will reflect certain portfolio securities' fair value rather than their market price.
Fair value pricing involves subjective judgment and it is possible that the fair value determined for a security is materially different than the value that could be realized upon the sale of that security. With respect to securities that are primarily listed on foreign exchanges, the values of the Portfolio's portfolio securities may change on days when you will not be able to purchase or sell your shares.
The NAV of each Class of shares may differ from that of other classes because of class-specific expenses that each class may pay and the shareholder servicing fees charged to Class P, Class H and Class L shares.
Exchange Privilege
You may exchange Class I, Class P, Class H and Class L shares for the same Class of shares of other available portfolios of the Fund and available portfolios of Morgan Stanley Institutional Fund, Inc. Exchanges are based on the shares' respective NAVs.
To obtain a prospectus for another portfolio, call the Fund at 1-800-548-7786 or contact your financial intermediary. If you purchased Portfolio shares through a financial intermediary, certain portfolios may be unavailable for exchange. Contact your financial intermediary to determine which portfolios are available for exchange. See also "Other Purchase Information" for certain limitations relating to exchanges.
With respect to exchanges of Class I, Class P and Class L shares, you can process your exchange by contacting your financial intermediary. Otherwise, you should send exchange requests by mail to Morgan Stanley Institutional Fund Trust, c/o Morgan Stanley Services Company Inc., P.O. Box 219804, Kansas City, MO 64121-9804. Exchange requests can also be made by calling 1-800-548-7786. With respect to Class H shares, you can process your exchange by contacting your authorized financial representative.
When you exchange for shares of another portfolio, your transaction will be treated the same as an initial purchase. You will be subject to the same minimum initial investment and account size as an initial purchase. The Fund, in its sole discretion, may waive the minimum initial investment amounts in certain cases. The Fund may terminate or revise the exchange privilege upon required notice or in certain cases without notice.
Tax Considerations
As with any investment, you should consider how your Portfolio investment will be taxed. The tax information in this Prospectus is provided as general information. You should consult your own tax professional about the tax consequences of an investment in the Portfolio. Unless your investment in the Portfolio is through a tax-deferred retirement account, such as a 401(k) plan or IRA, you need to be aware of the possible tax consequences when the Portfolio makes distributions and when you sell shares, including an exchange to another Morgan Stanley Fund.
Taxation of Distributions. Your distributions normally are subject to federal and state income tax when they
19
are paid, whether you take them in cash or reinvest them in Portfolio shares. A distribution also may be subject to local income tax. Any income dividend distributions and any short-term capital gain distributions are taxable to you as ordinary income. Any long-term capital gain distributions are taxable as long-term capital gains, no matter how long you have owned shares in the Portfolio.
Under current law (through 2012), if certain holding period requirements are met with respect to your shares, a portion of the income dividends you receive may be taxed at the same rates as long-term capital gains. However, even if income received in the form of income dividends is taxed at the same rates as long-term capital gains, such income will not be considered long-term capital gains for other federal income tax purposes. For example, you will not be permitted to offset income dividends with capital losses. Short term capital gain distributions will continue to be taxed at ordinary income taxes.
If certain witholding period requirements are met, Corporate shareholders may be entitled to a dividends-received deduction for the portion of dividends they receive which are attributable to dividends received by such portfolios from U.S. corporations.
Investment income received by the Portfolio from sources within foreign countries may be subject to foreign income taxes.
You will be sent a statement (Internal Revenue Service ("IRS") Form 1099-DIV) by February of each year showing the taxable distributions paid to you in the previous year. The statement provides information on your dividends and any capital gains for tax purposes.
Taxation of Sales. Your sale of Portfolio shares normally is subject to federal and state income tax and may result in a taxable gain or loss to you. A sale also may be subject to local income tax. Your exchange of Portfolio shares for shares of another Morgan Stanley Fund is treated for tax purposes like a sale of your original shares and a purchase of your new shares. Thus, the exchange may, like a sale, result in a taxable gain or loss to you and will give you a new tax basis for your shares.
Due to recent legislation, the Portfolio (or its administrative agent) is required to report to the IRS and furnish to Portfolio shareholders the cost basis information for sale transactions of shares purchased on or after January 1, 2012. Shareholders may elect to have one of several cost basis methods applied to their account when calculating the cost basis of shares sold, including average cost, FIFO ("first-in, first-out") or some other specific identification method. Unless you instruct otherwise, the Fund will use average cost as its default cost basis method, and will treat sales as first coming from shares purchased prior to January 1, 2012. If average cost is used for the first sale of Portfolio shares covered by these new rules, the shareholder may only use an alternative cost basis method for shares purchased prospectively. Portfolio shareholders should consult with their tax advisors to determine the best cost basis method for their tax situation.
When you open your account, you should provide your social security or tax identification number on your investment application. By providing this information, you will avoid being subject to federal backup withholding (as of the date of this Prospectus this rate is 28% and is scheduled to increase to 31% after 2012) on taxable distributions and redemption proceeds. Any withheld amount would be sent to the IRS as an advance payment of your taxes due on your income for such year.
Dividends and Distributions
The Portfolio normally declares dividends and distributes substantially all of its net investment income to shareholders quarterly.
If any net gains are realized from the sale of underlying securities, the Portfolio normally distributes the gains with the last distributions for the calendar year. All dividends and distributions are automatically paid in additional shares of the Portfolio unless you elect otherwise. If you want to change how your dividends are paid, you must notify the Fund in writing.
20
Global Strategist Portfolio Prospectus
July 16, 2012
Fund Management
Adviser
Morgan Stanley Investment Management Inc., with principal offices at 522 Fifth Avenue, New York, NY 10036, conducts a worldwide portfolio management business and provides a broad range of portfolio management services to customers in the United States and abroad. Morgan Stanley is the direct parent of the Adviser. Morgan Stanley is a preeminent global financial services firm engaged in securities trading and brokerage activities, as well as providing investment banking, research and analysis, financing and financial advisory services. As of March 31, 2012, the Adviser, together with its affiliated asset management companies, had approximately $303.8 billion in assets under management or supervision.
A discussion regarding the basis for the Board of Trustees' approval of the investment advisory agreement is available in the Fund's annual report to shareholders for the fiscal year ended September 30, 2011.
Advisory Fees
For the fiscal year ended September 30, 2011, the Adviser received a fee for advisory services (net of affiliated rebates, if applicable) equal to 0.44% of the Portfolio's average daily net assets.
Portfolio Management
The Portfolio is managed by members of the Global Asset Allocation team. The team consists of portfolio managers and analysts.
Current members of the team jointly and primarily responsible for the day-to-day management of the Portfolio are Mark A. Bavoso and Cyril Moullé-Berteaux. Mr. Bavoso has been associated with the Adviser in an investment management capacity since 1986. Mr. Moullé-Berteaux has been associated with the Adviser in an investment management capacity since August 2011. Mr. Moullé-Berteaux was a founding partner and portfolio manager of Traxis Partners LP from March 2003 to July 2011.
Team members collaborate to manage the assets of the Portfolio.
The Fund's SAI provides additional information about the portfolio managers' compensation structure, other accounts managed by the portfolio managers and the portfolio managers' ownership of securities in the Portfolio.
The composition of the team may change from time to time.
Distributor
Shares of the Fund are distributed exclusively through Morgan Stanley Distribution, Inc. a wholly-owned subsidiary of the Adviser. The Distributor has entered into arrangements with certain financial intermediaries who may accept purchase and redemption orders for shares of the Portfolio on its behalf.
Shareholder Services Plans (Class P and Class H)
The Fund has adopted a Shareholder Services Plan for each of the Portfolio's Class P and Class H shares pursuant to Rule 12b-1 under the Investment Company Act of 1940, as amended (the "1940 Act") (together, the "Class P and Class H Service Plans"). Under the Class P and Class H Service Plans, the Portfolio may pay to the Distributor and other affiliated and unaffiliated broker-dealers, financial institutions and/or intermediaries a monthly service fee at an annual rate of up to 0.25% of the Portfolio's average daily net assets attributable to Class P shares and Class H shares, respectively. The Distributor may direct that all or any part of this fee be paid directly to its affiliates or other broker-dealers, financial institutions and/or intermediaries that provide shareholder services to investors who purchase Class P and Class H shares. Over time the shareholder servicing fees will increase the cost of your investment and may cost you more than paying other types of sales charges.
Distribution and Shareholder Services Plan (Class L)
The Fund has adopted a Distribution and Shareholder Services Plan for the Portfolio's Class L shares pursuant to Rule 12b-1 under the 1940 Act (the "Class L Plan"). Under the Class L Plan, the Portfolio pays the Distributor a monthly distribution fee at an annual rate of up to 0.50% of the Portfolio's average daily net assets attributable to Class L shares and a
21
monthly shareholder service fee at an annual rate of up to 0.25% of the Portfolio's average daily net assets attributable to Class L shares. The Distributor may direct that all or any part of these fees be paid directly to its affiliates or other broker-dealers, financial institutions and/or intermediaries that provide distribution and/or shareholder support services to investors who purchase Class L shares. Over time the distribution fees and shareholder servicing fees will increase the cost of your investment and may cost you more than paying other types of sales charges.
Additional Information
The Adviser and/or Distributor may pay compensation to certain affiliated or unaffiliated brokers or other service providers in connection with the sale or retention of shares of the Portfolio and/or shareholder servicing. Such compensation may be significant in amount and the prospect of receiving any such additional compensation may provide affiliated or unaffiliated entities with an incentive to favor sales of shares of the Portfolio over other investment options. Any such payments will not change the NAV or the price of Portfolio shares. For more information, please see the Fund's SAI.
22
Global Strategist Portfolio Prospectus
July 16, 2012
Financial Highlights
The financial highlights tables that follow are intended to help you understand the financial performance of the Class I and Class P shares of the Portfolio for the past five years. Class H and Class L shares of the Portfolio had not commenced operations as of September 30, 2011. Certain information reflects financial results for a single Portfolio share. The total returns in the tables represent the rate that an investor would have earned (or lost) on an investment in the Portfolio (assuming reinvestment of all dividends and distributions).
The ratio of expenses to average net assets listed in the tables below for each class of shares of the Portfolio are based on the average net assets of the Portfolio for each of the periods listed in the tables. To the extent that the Portfolio's average net assets decrease over the Portfolio's next fiscal year, such expense ratios can be expected to increase, potentially significantly, because certain fixed costs will be spread over a smaller amount of assets.
The information below has been audited by Ernst & Young LLP, the Fund's independent registered public accounting firm (except for the information for the six months ended March 31, 2012). Ernst & Young LLP's report, along with the Portfolio's financial statements, are incorporated by reference in the SAI. The Annual Report to Shareholders and the Portfolio's financial statements, as well as the SAI, are available at no cost from the Fund at the toll-free number noted on the back cover to this Prospectus.
23
Financial Highlights
Global Strategist Portfolio
| Class I | |||||||||||||||||||||||||||
| For the Six Months Ended March 31, | Year Ended September 30, | ||||||||||||||||||||||||||
| Selected Per Share Data and Ratios | 2012 (unaudited) | 2011 | 2010 | 2009 | 2008 | 2007 | |||||||||||||||||||||
| Net Asset Value, Beginning of Period | $ | 12.50 | $ | 12.55 | $ | 11.66 | $ | 11.87 | $ | 14.69 | $ | 12.63 | |||||||||||||||
| Income (Loss) from Investment Operations: | |||||||||||||||||||||||||||
| Net Investment Income† | 0.10 | 0.18 | 0.21 | 0.16 | 0.38 | 0.32 | |||||||||||||||||||||
| Net Realized and Unrealized Gain (Loss) | 2.05 | (0.02 | ) | 0.91 | 0.17 | (2.84 | ) | 2.00 | |||||||||||||||||||
| Total from Investment Operations | 2.15 | 0.16 | 1.12 | 0.33 | (2.46 | ) | 2.32 | ||||||||||||||||||||
| Distributions from and/or in Excess of: | |||||||||||||||||||||||||||
| Net Investment Income | (0.11 | ) | (0.21 | ) | (0.23 | ) | (0.54 | ) | (0.36 | ) | (0.26 | ) | |||||||||||||||
| Redemption Fees | — | — | — | 0.00 | ‡ | 0.00 | ‡ | 0.00 | ‡ | ||||||||||||||||||
| Net Asset Value, End of Period | $ | 14.54 | $ | 12.50 | $ | 12.55 | $ | 11.66 | $ | 11.87 | $ | 14.69 | |||||||||||||||
| Total Return++ | 17.32 | %# | 1.07 | % | 9.77 | % | 3.45 | %** | (17.02 | )% | 18.57 | % | |||||||||||||||
| Ratios and Supplemental Data: | |||||||||||||||||||||||||||
| Net Assets, End of Period (Thousands) | $ | 21,196 | $ | 25,192 | $ | 22,706 | $ | 45,567 | $ | 40,799 | $ | 310,886 | |||||||||||||||
| Ratio of Expenses to Average Net Assets (1) | 1.16 | %*+†† | 1.30 | %+†† | 0.89 | %+†† | 0.67 | %+ | 0.57 | %+ | 0.61 | %+ | |||||||||||||||
| Ratio of Net Investment Income to Average Net Assets (1) | 1.44 | %*+†† | 1.35 | %+†† | 1.73 | %+†† | 1.56 | %+ | 2.66 | %+ | 2.35 | %+ | |||||||||||||||
| Ratio of Rebate from Morgan Stanley Affiliates to Average Net Assets | 0.02 | %* | 0.01 | % | 0.01 | % | 0.04 | % | 0.05 | % | 0.00 | %§ | |||||||||||||||
| Portfolio Turnover Rate | 58 | %# | 164 | % | 176 | % | 171 | % | 148 | % | 60 | % | |||||||||||||||
| (1) Supplemental Information on the Ratios to Average Net Assets: | |||||||||||||||||||||||||||
| Ratios Before Expense Limitation: | |||||||||||||||||||||||||||
| Expenses to Average Net Assets | N/A | N/A | N/A | N/A | 0.58 | %+ | N/A | ||||||||||||||||||||
| Net Investment Income to Average Net Assets | N/A | N/A | N/A | N/A | 2.65 | %+ | N/A | ||||||||||||||||||||
† Per share amount is based on average shares outstanding.
‡ Amount is less than $0.005 per share.
++ Calculated based on the net asset value as of the last business day of the period.
# Not Annualized.
** Performance was positively impacted by approximately 0.79% due to the receipt of proceeds from the settlements of class action suits involving primarily two of the Portfolio's past holdings. This was a one-time settlement, and as a result, the impact on the NAV and consequently the performance will not likely be repeated in the future. Had these settlements not occurred, the total return for Class I shares would have been approximately 2.66%.
+ The Ratios of Expenses and Net Investment Income reflect the rebate of certain Portfolio expenses in connection with the investments in Morgan Stanley affiliates during the period. The effect of the rebate on the ratios is disclosed in the above table as "Ratio of Rebate from Morgan Stanley Affiliates to Average Net Assets."
†† Reflects overall Portfolio ratios for investment income and non-class specific expenses.
§ Amount is less than 0.005%.
24
Global Strategist Portfolio Prospectus
July 16, 2012
Financial Highlights
Global Strategist Portfolio
| Class P | |||||||||||||||||||||||||||
| For the Six Months Ended March 31 | Year Ended September 30, | ||||||||||||||||||||||||||
| Selected Per Share Data and Ratios | 2012 (unaudited) | 2011 | 2010 | 2009 | 2008 | 2007 | |||||||||||||||||||||
| Net Asset Value, Beginning of Period | $ | 12.47 | $ | 12.52 | $ | 11.63 | $ | 11.84 | $ | 14.66 | $ | 12.61 | |||||||||||||||
| Income (Loss) from Investment Operations: | |||||||||||||||||||||||||||
| Net Investment Income† | 0.08 | 0.15 | 0.18 | 0.13 | 0.32 | 0.29 | |||||||||||||||||||||
| Net Realized and Unrealized Gain (Loss) | 2.04 | (0.03 | ) | 0.91 | 0.17 | (2.81 | ) | 1.98 | |||||||||||||||||||
| Total from Investment Operations | 2.12 | 0.12 | 1.09 | 0.30 | (2.49 | ) | 2.27 | ||||||||||||||||||||
| Distributions from and/or in Excess of: | |||||||||||||||||||||||||||
| Net Investment Income | (0.09 | ) | (0.17 | ) | (0.20 | ) | (0.51 | ) | (0.33 | ) | (0.22 | ) | |||||||||||||||
| Redemption Fees | — | — | — | 0.00 | ‡ | 0.00 | ‡ | 0.00 | ‡ | ||||||||||||||||||
| Net Asset Value, End of Period | $ | 14.50 | $ | 12.47 | $ | 12.52 | $ | 11.63 | $ | 11.84 | $ | 14.66 | |||||||||||||||
| Total Return++ | 17.13 | %# | 0.83 | % | 9.52 | % | 3.15 | %** | (17.26 | )% | 18.23 | % | |||||||||||||||
| Ratios and Supplemental Data: | |||||||||||||||||||||||||||
| Net Assets, End of Period (Thousands) | $ | 19,774 | $ | 16,857 | $ | 17,169 | $ | 18,290 | $ | 32,398 | $ | 31,183 | |||||||||||||||
| Ratio of Expenses to Average Net Assets (1) | 1.41 | %*+†† | 1.55 | %+†† | 1.14 | %+†† | 1.03 | %+ | 0.90 | %+ | 0.87 | %+ | |||||||||||||||
| Ratio of Net Investment Income to Average Net Assets (1) | 1.19 | %*+†† | 1.10 | %+†† | 1.48 | %+†† | 1.27 | %+ | 2.35 | %+ | 2.11 | %+ | |||||||||||||||
| Ratio of Rebate from Morgan Stanley Affiliates to Average Net Assets | 0.02 | %* | 0.01 | % | 0.01 | % | 0.04 | % | 0.06 | % | 0.00 | %§ | |||||||||||||||
| Portfolio Turnover Rate | 58 | %# | 164 | % | 176 | % | 171 | % | 148 | % | 60 | % | |||||||||||||||
| (1) Supplemental Information on the Ratios to Average Net Assets: | |||||||||||||||||||||||||||
| Ratios Before Expense Limitation: | |||||||||||||||||||||||||||
| Expenses to Average Net Assets | N/A | N/A | N/A | 1.08 | %+ | 0.91 | %+ | N/A | |||||||||||||||||||
| Net Investment Income to Average Net Assets | N/A | N/A | N/A | 1.22 | %+ | 2.34 | %+ | N/A | |||||||||||||||||||
† Per share amount is based on average shares outstanding.
‡ Amount is less than $0.005 per share.
++ Calculated based on the net asset value as of the last business day of the period.
# Not Annualized.
** Performance was positively impacted by approximately 0.80% due to the receipt of proceeds from the settlements of class action suits involving primarily two of the Portfolio's past holdings. This was a one-time settlement, and as a result, the impact on the NAV and consequently the performance will not likely be repeated in the future. Had these settlements not occurred, the total return for Class P shares would have been approximately 2.35%.
+ The Ratios of Expenses and Net Investment Income reflect the rebate of certain Portfolio expenses in connection with the investments in Morgan Stanley affiliates during the period. The effect of the rebate on the ratios is disclosed in the above table as "Ratio of Rebate from Morgan Stanley Affiliates to Average Net Assets."
†† Reflects overall Portfolio ratios for investment income and non-class specific expenses.
§ Amount is less than 0.005%.
25
Where to Find Additional Information
In addition to this Prospectus, the Fund has a Statement of Additional Information, dated July 16, 2012, which contains additional, more detailed information about the Fund and the Portfolio. The Statement of Additional Information is incorporated by reference into this Prospectus and, therefore, legally forms a part of this Prospectus.
The Fund publishes Annual and Semi-Annual Reports to Shareholders ("Shareholder Reports") that contain additional information about the Portfolio's investments. In the Fund's Annual Report to Shareholders, you will find a discussion of the market conditions and the investment strategies that significantly affected the Portfolio's performance during the last fiscal year. For additional Fund information, including information regarding the investments comprising of Portfolio, please call the toll-free number below.
You may obtain the Statement of Additional Information and Shareholder Reports without charge by contacting the Fund at the toll-free number below or on our internet site at: www.morganstanley.com/im. If you purchased shares through a financial intermediary, you may also obtain these documents, without charge, by contacting your financial intermediary.
Information about the Fund, including the Statement of Additional Information and Shareholder Reports, may be obtained from the SEC in any of the following ways. (1) in person: you may review and copy documents in the SEC's Public Reference Room in Washington D.C. (for information on the operation of the Public Reference Room call 1-202-551-8090); (2) on-line: you may retrieve information from the SEC's web site at http://www.sec.gov; (3) by mail: you may request documents, upon payment of a duplicating fee, by writing to the Securities and Exchange Commission, Public Reference Section, Washington, D.C. 20549-1520; or (4) by e-mail: you may request documents, upon payment of a duplicating fee, by e-mailing the SEC at the following address: publicinfo@sec.gov.
Morgan Stanley Institutional Fund Trust
c/o Morgan Stanley Services Company Inc.
P.O. Box 219804
Kansas City, MO 64121-9804
For Shareholder Inquiries,
call 1-800-548-7786.
Prices and Investment Results are available at www.morganstanley.com/im.
The Fund's Investment Company Act registration number is 811-03980.

IFTGLBSTRATPRO 07/12
INVESTMENT MANAGEMENT

Morgan Stanley
Institutional Fund Trust
Balanced Portfolio
Balanced Portfolio
Equity Portfolio
Mid Cap Growth Portfolio
Fixed Income Portfolios
Core Fixed Income Portfolio
Core Plus Fixed Income Portfolio
Investment Grade Fixed Income Portfolio
Limited Duration Portfolio
Long Duration Fixed Income Portfolio
Annual
Report
September 30, 2011

2011 Annual Report
September 30, 2011
Table of Contents
| Shareholders' Letter | 2 | ||||||
| Investment Advisory Agreement Approval | 3 | ||||||
| Expense Examples | 6 | ||||||
| Investment Overviews & Portfolios of Investments | |||||||
| Balanced Portfolio: | |||||||
| Balanced | 7 | ||||||
| Equity Portfolio: | |||||||
| Mid Cap Growth | 24 | ||||||
| Fixed Income Portfolios: | |||||||
| Core Fixed Income | 29 | ||||||
| Core Plus Fixed Income | 39 | ||||||
| Investment Grade Fixed Income | 51 | ||||||
| Limited Duration | 60 | ||||||
| Long Duration Fixed Income | 67 | ||||||
| Statements of Assets and Liabilities | 75 | ||||||
| Statements of Operations | 79 | ||||||
| Statements of Changes in Net Assets | 81 | ||||||
| Financial Highlights | 86 | ||||||
| Notes to Financial Statements | 102 | ||||||
| Report of Independent Registered Public Accounting Firm | 112 | ||||||
| Federal Income Tax Information | 113 | ||||||
| U.S. Privacy Policy | 116 | ||||||
| Trustee and Officer Information | 117 | ||||||
This report is authorized for distribution only when preceded or accompanied by prospectuses of the Morgan Stanley Institutional Fund Trust. To receive a prospectus and/or SAI, which contains more complete information such as investment objectives, charges, expenses, policies for voting proxies, risk considerations, and describes in detail each of the Portfolio's investment policies to the prospective investor, please call toll free 1-(800) 548-7786. Please read the prospectuses carefully before you invest or send money.
Additionally, you can access portfolio information including performance, characteristics, and investment team commentary through Morgan Stanley Investment Management's website: www.morganstanley.com/im.
Market forecasts provided in this report may not necessarily come to pass. There is no guarantee that any sectors mentioned will continue to perform as discussed herein or that securities in such sectors will be held by the Portfolio in the future. There is no assurance that a Portfolio will achieve its investment objective. Portfolios are subject to market risk, which is the possibility that market values of securities owned by the Portfolio will decline and, therefore, the value of the Portfolio's shares may be less than what you paid for them. Accordingly, you can lose money investing in Portfolios. Please see the prospectus for more complete information on investment risks.
1
2011 Annual Report
September 30, 2011
Shareholders' Letter
Dear Shareholders:
We are pleased to present to you the Morgan Stanley Institutional Fund Trust's (the "Fund") Annual Report for the year ended September 30, 2011. Our Fund currently offers 7 portfolios providing investors with asset allocation, domestic equity and fixed-income products. The Fund's portfolios, together with the portfolios of the Morgan Stanley Institutional Fund, Inc., provide investors with a means to help them meet specific investment needs and to allocate their investments among equities and fixed income.
Sincerely,

Arthur Lev
President and Principal Executive Officer
October 2011
2
2011 Annual Report
September 30, 2011
Investment Advisory Agreement Approval (unaudited)
Nature, Extent and Quality of Services
The Board reviewed and considered the nature and extent of the investment advisory services provided by the Adviser (as defined herein) under the advisory agreement, including portfolio management, investment research and equity and fixed income securities trading. The Board also reviewed and considered the nature and extent of the non-advisory, administrative services provided by the Adviser under the administration agreement, including accounting, clerical, bookkeeping, compliance, business management and planning, and the provision of supplies, office space and utilities at the Adviser's expense. (The advisory and administration agreements together are referred to as the "Management Agreement.") The Board also compared the nature of the services provided by the Adviser with similar services provided by non-affiliated advisers as reported to the Board by Lipper, Inc. ("Lipper").
The Board reviewed and considered the qualifications of the portfolio managers, the senior administrative managers and other key personnel of the Adviser who provide the advisory and administrative services to the Portfolios. The Board determined that the Adviser's portfolio managers and key personnel are well qualified by education and/or training and experience to perform the services in an efficient and professional manner. The Board concluded that the nature and extent of the advisory and administrative services provided were necessary and appropriate for the conduct of the business and investment activities of the Portfolios and supported its decision to approve the Management Agreement.
Performance, Fees and Expenses of the Portfolios
The Board reviewed the performance, fees and expenses of the Portfolios compared to their peers, as determined by Lipper, and to appropriate benchmarks where applicable. The Board discussed with the Adviser the performance goals and the actual results achieved in managing the Portfolios. When considering a fund's performance, the Board and the Adviser place emphasis on trends and longer-term returns (focusing on one-year, three-year and five-year performance as of December 31, 2010, or since inception, as applicable). When a fund underperforms its benchmark and/or its peer group average, the Board and the Adviser discuss the causes of such underperformance and, where necessary, they discuss specific changes to investment strategy or investment personnel.
Performance
The Board noted that the performance of the Core Fixed Income, Investment Grade Fixed Income and Limited Duration Portfolios were below the peer group averages for the one-, three- and five-year periods.
The Board noted that the performance of the Mid Cap Growth Portfolio was better than its peer group averages for the one-, three- and five-year periods.
The Board noted that the performance of the Long Duration Fixed Income Portfolio was below the peer group average for the one-year period but better than its peer group average for the three-year period and since the end of July 2006, the month of inception of the Portfolio.
The Board noted that the performance of the Balanced Portfolio was better than its peer group average for the five-year period but below its peer group average for the one- and three-year periods.
The Board noted that the performance of the Core Plus Fixed Income was better than its peer group average for the one-year period but below its peer group average for the three- and five-year periods.
Performance Conclusions
With respect to the Core Plus Fixed Income, Core Fixed Income, Investment Grade Fixed Income and Limited Duration Portfolios, after discussion, the Board concluded that performance was acceptable.
With respect to the Balanced, Mid Cap Growth and Long Duration Fixed Income Portfolios, after discussion, the Board concluded that performance was competitive with the peer group averages.
Fees and Expense
The Board members discussed with the Adviser the level of the advisory and administration fees (together, the "management fee") for the Portfolios relative to comparable funds and/or other accounts advised by the Adviser and/or compared to their peers as determined by Lipper. In addition to the management fee, the Board also reviewed the Portfolios' total expense ratios.
3
2011 Annual Report
September 30, 2011
Investment Advisory Agreement Approval (unaudited) (cont'd)
The Board noted that the management fees and total expense ratios for the Core Fixed Income, Mid Cap Growth and Long Duration Fixed Income Portfolios were lower than the peer group averages.
The Board noted for the Balanced Portfolio that the management fee was lower than the peer group average and the total expense ratio was higher but close to the peer group average.
The Board noted for the Core Plus Fixed Income Portfolio that the management fee was higher but close to the peer group average and the total expense ratio was lower than the peer group average.
The Board noted for the Limited Duration Portfolio that the management fee was higher but close to the peer group average and the total expense ratio was higher than the peer group average.
The Board noted for the Investment Grade Fixed Income Portfolio that the management fee and total expense ratio were higher than the peer group average.
Fee and Expense Conclusions
With respect to the Balanced, Mid Cap Growth, Core Plus Fixed Income, Core Fixed Income and Long Duration Fixed Income Portfolios, after discussion, the Board concluded that the management fees and total expense ratios were competitive with the peer group averages.
With respect to the Limited Duration Portfolio, after discussion, the Board concluded that the management fee was competitive with the peer group average and the total expense ratio was acceptable given the quality and nature of services provided.
With respect to the Investment Grade Fixed Income Portfolio, after discussion, the Board concluded that the management fee and total expense ratio, although higher than the peer group average, were acceptable given the quality and nature of services provided.
Economies of Scale
The Board considered the size and growth prospects of the Portfolios and how that relates to the Portfolios' total expense ratios and particularly the Portfolios' management fee rates (which, for all the Portfolios except Core Plus Fixed Income Portfolio do not include breakpoints). In conjunction with its review of the Adviser's profitability, the Board discussed with the Adviser how a change in assets can affect the efficiency or effectiveness of managing the Portfolios and whether the management fee level is appropriate relative to current and projected asset levels and/or whether the management fee structure reflects economies of scale as asset levels change. The Board has determined that its review of the actual and potential economies of scale of each Portfolio supports its decision to approve the Management Agreement.
Profitability of the Adviser and Affiliates
The Board considered information concerning the costs incurred and profits realized by the Adviser and its affiliates during the last year from their relationship with the Portfolios and during the last two years from their relationship with the Morgan Stanley Fund Complex and reviewed with the Adviser the cost allocation methodology used to determine the profitability of the Adviser and affiliates. The Board has determined that its review of the analysis of the Adviser's expenses and profitability supports its decision to approve the Management Agreement.
Other Benefits of the Relationship
The Board considered other benefits to the Adviser and its affiliates derived from their relationship with the Portfolios and other funds advised by the Adviser. These benefits may include, among other things, "float" benefits derived from handling of checks for purchases and sales, research received by the Adviser generated from commission dollars spent on funds' portfolio trading and fees for distribution and/or shareholder servicing. The Board reviewed with the Adviser each of these arrangements and the reasonableness of the Adviser's costs relative to the services performed. The Board has determined that its review of the other benefits received by the Adviser or its affiliates supports its decision to approve the Management Agreement.
Resources of the Adviser and Historical Relationship Between the Portfolios and the Adviser
The Board considered whether the Adviser is financially sound and has the resources necessary to perform its obligations under the Management Agreement. The Board also reviewed and considered the historical relationship between the Portfolios and the
4
2011 Annual Report
September 30, 2011
Investment Advisory Agreement Approval (unaudited) (cont'd)
Adviser, including the organizational structure of the Adviser, the policies and procedures formulated and adopted by the Adviser for managing the Portfolios' operations and the Board's confidence in the competence and integrity of the senior managers and key personnel of the Adviser. The Board concluded that the Adviser has the financial resources necessary to fulfill its obligations under the Management Agreement and that it is beneficial for the Portfolios to continue their relationship with the Adviser.
Other Factors and Current Trends
The Board considered the controls and procedures adopted and implemented by the Adviser and monitored by the Fund's Chief Compliance Officer and concluded that the conduct of business by the Adviser indicates a good faith effort on its part to adhere to high ethical standards in the conduct of the Fund's business.
General Conclusion
After considering and weighing all of the above factors, the Board concluded that it would be in the best interest of each Portfolio and its shareholders to approve renewal of the Management Agreement for another year. In reaching this conclusion the Board did not give particular weight to any single factor referenced above. The Board considered these factors over the course of numerous meetings, some of which were in executive session with only the independent Board members and their counsel present. It is possible that individual Board members may have weighed these factors differently in reaching their individual decisions to approve the Management Agreement.
5
2011 Annual Report
September 30, 2011
Expense Examples (unaudited)
Expense Examples
As a shareholder of the Portfolio, you may incur two types of costs: (1) transactional costs, including sales charge (loads) on purchase payments, if applicable; and (2) ongoing costs, including management fees, distribution and shareholder servicing fees (in the case of Class P, Class H and Class L); and other Portfolio expenses. These examples are intended to help you understand your ongoing costs (in dollars) of investing in the Portfolio and to compare these costs with the ongoing costs of investing in other mutual funds.
The examples are based on an investment of $1,000 invested at the beginning of the six-month period ended September 30, 2011 and held for the entire six-month period.
Actual Expenses
The table below provides information about actual account values and actual expenses. You may use the information in this table, together with the amount you invested, to estimate the expenses that you paid over the period. Simply divide your account value by $1,000 (for example, an $8,600 account value divided by $1,000 = 8.6), then multiply the result by the number in the table under the heading entitled "Actual Expenses Paid During Period" to estimate the expenses you paid on your account during this period.
Please note that "Actual Expenses Paid During Period" are grossed up to reflect Portfolio expenses prior to the effect of Expense Offset (See Note F in the Notes to Financial Statements). Therefore, the annualized net expense ratios may differ from the ratio of expenses to average net assets shown in the Financial Highlights.
Hypothetical Example for Comparison Purposes
The table below provides information about hypothetical account values and hypothetical expenses based on the Portfolio's actual expense ratio and an assumed rate of return of 5% per year before expenses, which is not the Portfolio's actual return. The hypothetical account values and expenses may not be used to estimate the actual ending account balance or expenses you paid for the period. You may use this information to compare the ongoing costs of investing in the Portfolio and other funds. To do so, compare this 5% hypothetical example with the 5% hypothetical examples that appear in the shareholder reports of the other funds.
Please note that the expenses shown in the table are meant to highlight your ongoing costs only and do not reflect any transactional costs, such as sales charges (loads, if applicable). Therefore, the hypothetical account values and hypothetical expenses are useful in comparing ongoing costs only, and will not help you determine the relative total costs of owning different funds. In addition, if these transactional costs were included, your costs would have been higher.
| Portfolio | Beginning Account Value 4/1/11 | Actual Ending Account Value 9/30/11 | Hypothetical Ending Account Value | Actual Expenses Paid During Period* | Hypothetical Expenses Paid During Period* | Net Expense Ratio During Period** | |||||||||||||||||||||
| Balanced Portfolio Class I | $ | 1,000.00 | $ | 926.50 | $ | 1,017.75 | $ | 7.05 | $ | 7.38 | 1.46 | % | |||||||||||||||
| Balanced Portfolio Class P | 1,000.00 | 925.20 | 1,016.50 | 8.25 | 8.64 | 1.71 | |||||||||||||||||||||
| Mid Cap Growth Portfolio Class I | 1,000.00 | 832.50 | 1,021.56 | 3.22 | 3.55 | 0.70 | |||||||||||||||||||||
| Mid Cap Growth Portfolio Class P | 1,000.00 | 831.40 | 1,020.31 | 4.36 | 4.81 | 0.95 | |||||||||||||||||||||
| Core Fixed Income Portfolio Class I | 1,000.00 | 1,047.60 | 1,022.56 | 2.57 | 2.54 | 0.50 | |||||||||||||||||||||
| Core Fixed Income Portfolio Class P | 1,000.00 | 1,047.60 | 1,021.31 | 3.85 | 3.80 | 0.75 | |||||||||||||||||||||
| Core Plus Fixed Income Portfolio Class I | 1,000.00 | 1,033.00 | 1,021.86 | 3.26 | 3.24 | 0.64 | |||||||||||||||||||||
| Core Plus Fixed Income Portfolio Class P | 1,000.00 | 1,032.70 | 1,020.61 | 4.54 | 4.51 | 0.89 | |||||||||||||||||||||
| Investment Grade Fixed Income Portfolio Class I | 1,000.00 | 1,045.60 | 1,020.81 | 4.36 | 4.31 | 0.85 | |||||||||||||||||||||
| Investment Grade Fixed Income Portfolio Class P | 1,000.00 | 1,044.80 | 1,020.05 | 5.13 | 5.06 | 1.00 | |||||||||||||||||||||
| Investment Grade Fixed Income Portfolio Class H | 1,000.00 | 1,044.30 | 1,019.55 | 5.64 | 5.57 | 1.10 | |||||||||||||||||||||
| Investment Grade Fixed Income Portfolio Class L | 1,000.00 | 1,042.90 | 1,018.30 | 6.91 | 6.83 | 1.35 | |||||||||||||||||||||
| Limited Duration Portfolio Class I | 1,000.00 | 1,005.80 | 1,022.21 | 2.87 | 2.89 | 0.57 | |||||||||||||||||||||
| Limited Duration Portfolio Class P | 1,000.00 | 1,004.40 | 1,020.96 | 4.12 | 4.15 | 0.82 | |||||||||||||||||||||
| Long Duration Fixed Income Portfolio Class I | 1,000.00 | 1,179.00 | 1,022.56 | 2.73 | 2.54 | 0.50 | |||||||||||||||||||||
| Long Duration Fixed Income Portfolio Class P | 1,000.00 | 1,177.70 | 1,021.31 | 4.09 | 3.80 | 0.75 | |||||||||||||||||||||
* Expenses are calculated using each Portfolio Class' annualized net expense ratio (as disclosed), multiplied by the average account value over the period, and multiplied by 183/365 (to reflect the most recent one-half year period).
** Annualized.
6
2011 Annual Report
September 30, 2011
Investment Overview (unaudited)
Balanced Portfolio
Performance
For the fiscal year ended September 30, 2011, the Portfolio's Class I had a total return based on net asset value and reinvestment of distributions per share of 1.07%, net of fees. The Portfolio's Class I underperformed against the S&P 500® Index, which returned 1.15%, the Barclays Capital U.S. Aggregate Index, which returned 5.26%, and the 60/40 Blended Index (the "Blended Index"), a blend of 60% S&P 500® Index and 40% Barclays Capital U.S. Aggregate Index, which returned 3.41%.
Factors Affecting Performance
• During the fourth quarter of 2010, global risk appetite began to rise on the back of improving economic data, a bullish outlook for 2011, and the announcement of a second round of quantitative easing (QE2) from the Federal Reserve. While conditions in Europe showed further deterioration, investors were generally unfazed. In 2011, the equity rally was quickly brought to a halt in March, after Japan was devastated by an earthquake and tsunami that resulted in a partial nuclear meltdown. Just as conditions began to settle, headwinds began to present themselves across most regions. In the U.S., bond rating agency Standard & Poor's downgraded U.S. government debt from AAA to AA+, shocking global equity markets. In Europe, contagion fears gained momentum as Greek credit default swap (CDS) spreads (which gauge the risk of insuring Greek bonds against default) spiked, causing Italian and Spanish yields to follow. Lastly, investors began to question global growth prospects (especially in China), contributing to a fall in equities.
• Regarding the Portfolio's overall performance relative to the Blended Index, an overweight position in global equities and underweight position in fixed income negatively impacted returns as global equities tumbled in the third quarter of 2011, while U.S. Treasury yields fell to their lowest reading in over 60 years.
• Within U.S. equities, an allocation to equities that we believed could benefit from increased merger and acquisition (M&A) activity detracted from performance as the uncertain macro outlook caused corporations to focus on protecting cash assets as opposed to using them to acquire peers. In addition, opportunistic long positions in emerging markets equities dampened returns as the region suffered from sticky inflation and slower growth.
• Security selection within U.S. core fixed income negatively affected relative returns. Overweight positions to the credit and mortgage sectors detracted from performance as 10-year Treasury yields fell to 1.7%, while spreads over Treasuries rose to near recessionary levels.
• However, other positions performed more favorably. Within U.S. equities, an allocation to high dividend paying equities added to relative performance as investors found their yields attractive in an otherwise low yielding environment.
• Within currencies, tactical allocations to emerging market currencies (long positions in the beginning of 2011 and short positions in the third quarter of 2011) added to performance as emerging markets allowed their currencies to rise as they battled inflation and later fell with other risky assets. In addition, a long position in the Japanese yen and short position in the euro added to returns as Europe's sovereign debt crisis caused investors to view Japan as a relative safe haven.
Management Strategies
• Heading into the fourth quarter of 2011, we believe that the global economy is already at stall speed and in danger of falling into an outright recession. In a normal economic expansion, the global economy should be growing 3.5% to 4%. In a deleveraging environment, the baseline growth rate drops by about 1% to 3%. However, recent economic indicators point to a global economy growing at a subpar 2% and we expect growth to slow further over the next two quarters. Even in such an environment, we think it is possible and even likely that countertrend rallies will occur. Going into the end of the quarter, almost all equity markets had already fallen into bear market territory. As a result, global equities have become severely oversold and undervalued. Although past performance is no guarantee of future result, these conditions usually precede upward moves in stocks that can be significant and last weeks to months. Against this backdrop, we intend to initiate a tactical overweight position in global equities and maintain an underweight position to U.S. fixed income.
• Within equities, the Portfolio maintains an underweight position in the U.S. We believe that the U.S. will likely not grow at all in the first half of next year as fiscal policy, which has been supporting
7
2011 Annual Report
September 30, 2011
Investment Overview (unaudited) (cont'd)
Balanced Portfolio
consumption for the past two years, is about to become a headwind. In addition, we believe 2012 earnings estimates may be as much as 20% too high. Within non-U.S. equities, we intend to initiate a tactical overweight position to Europe and emerging markets. While the fundamental outlook looks poor for these nations, we believe equity markets have become oversold and undervalued. For example, German equities were priced at just 7 times forward earnings at their lows, which would still look reasonable, in our view, if 2012 earnings expectations are 30% too high.
• Within U.S. equities, we intend to initiate a tactical overweight position to financials. We believe U.S. financials have overly discounted European contagion fears and are now cheap. Currently, U.S. financials are priced similarly to the depths of the 2008-2009 financial crisis, which we do not believe is representative of current conditions.
• Within fixed income, we continue to view spread products favorably, as we believe Treasury yields have fallen too much in the near term and credit spreads are set to narrow. Historically, U.S. Treasuries have provided investors with a yield 2% to 2.5% above inflation. With core inflation at approximately 2%, Treasury yields are either forecasting 0% growth over the next 10 years or a deflationary environment. We believe neither of these events is likely to occur.

* Minimum Investment
In accordance with SEC regulations, the Portfolio's performance shown assumes that all recurring fees (including management fees) were deducted and all dividends and distributions were reinvested. The performance of Class P shares will vary from the Class I shares based upon their different inception dates and will be negatively impacted by additional fees assessed to that class.
Performance Compared to the S&P 500® Index(1), the Barclays Capital U.S. Aggregate Index(2), 60/40 Blended Index(3), the Lipper Mixed-Asset Target Allocation Growth Funds Index(4)
| Period Ended September 30, 2011 Total Returns(5) | |||||||||||||||||||
| Average Annual | |||||||||||||||||||
| One Year | Five Years | Ten Years | Since Inception(8) | ||||||||||||||||
| Portfolio — Class I Shares w/o sales charges(6) | 1.07 | % | 2.46 | % | 4.37 | % | 6.89 | % | |||||||||||
| S&P 500® Index | 1.15 | –1.18 | 2.82 | 7.29 | |||||||||||||||
| Barclays Capital U.S. Aggregate Index | 5.26 | 6.53 | 5.66 | �� | 6.48 | ||||||||||||||
| 60/40 Blended Index | 3.41 | 2.44 | 4.44 | 7.40 | |||||||||||||||
| Lipper Mixed-Asset Target Allocation Growth Funds Index | –0.62 | 0.97 | 4.53 | 6.91 | |||||||||||||||
| Portfolio — Class P Shares w/o sales charges(7) | 0.83 | 2.19 | 4.11 | 5.39 | |||||||||||||||
| S&P 500® Index | 1.15 | –1.18 | 2.82 | 5.08 | |||||||||||||||
| Barclays Capital U.S. Aggregate Index | 5.26 | 6.53 | 5.66 | 6.34 | |||||||||||||||
| 60/40 Blended Index | 3.41 | 2.44 | 4.44 | 6.10 | |||||||||||||||
| Lipper Mixed-Asset Target Allocation Growth Funds Index | –0.62 | 0.97 | 4.53 | 5.55 | |||||||||||||||
Performance data quoted represents past performance, which is no guarantee of future results, and current performance may be lower or higher than the figures shown. Performance assumes that all dividends and distributions, if any, were reinvested. For the most recent month-end performance figures, please visit www.morganstanley.com/im. Investment returns and principal value will fluctuate so that Portfolio shares, when redeemed, may be worth more or less than their original cost. Total returns do not reflect the deduction of taxes that a shareholder would pay on Portfolio distributions or the redemption of Portfolio shares. Performance of share classes will vary due to differences in expenses.
(1) The Standard & Poor's 500® Index (S&P 500®) measures the performance of the large cap segment of the U.S. equities market, covering approximately 75% of the U.S. equities market. The Index includes 500 leading companies in leading industries of the U.S. economy. The Index is unmanaged and its returns do not include any sales charges or fees. Such costs would lower performance. It is not possible to invest directly in an index.
(2) The Barclays Capital U.S. Aggregate Index tracks the performance of all U.S. government agency and Treasury securities, investment-grade corporate debt securities, agency mortgage-backed securities, asset-backed securities and commercial mortgage-backed securities. The Index is unmanaged and its returns do not include any sales charges or fees. Such costs would lower performance. It is not possible to invest directly in an index.
(3) The 60/40 Blended Index is comprised of 60% S&P 500® Index and 40% Barclays Capital U.S. Aggregate Index.
(4) The Lipper Mixed-Asset Target Allocation Growth Funds Index is an equally-weighted performance index of the largest qualifying funds (based on net assets) in the Lipper Mixed-Asset Target Allocation Growth Funds classification. The Index, which is adjusted for capital gains distributions and income dividends, is unmanaged and should not be considered an investment. There are currently 30 fund represented in this Index. As of the date of this report, the Portfolio was in the Lipper Mixed-Asset Target Allocation Growth Funds classification.
(5) Total returns for the Portfolio reflect expenses waived and/or reimbursed, if applicable, by the Adviser. Without such waivers and/or reimbursements, total returns would have been lower. Fee waivers and/or reimbursements are expected to continue until such time that the Fund's Board of Trustees acts to discontinue such waivers and/or reimbursements.
(6) Commenced operations on December 31, 1992.
8
2011 Annual Report
September 30, 2011
Investment Overview (unaudited) (cont'd)
Balanced Portfolio
(7) Commenced operations on November 1, 1996.
(8) For comparative purposes, average annual since inception returns listed for the Indexes refer to the inception date or initial offering of the respective share class of the Portfolio, not the inception of the Indexes.
Portfolio Composition*
| Classification | Percentage of Total Investments | ||||||
| Common Stocks | 48.4 | % | |||||
| Fixed Income Securities | 42.5 | ||||||
| Short-Term Investments | 8.1 | ||||||
| Other** | 1.0 | ||||||
| Total Investments | 100.0 | %*** | |||||
* Percentages indicated are based upon total investments (excluding Securities held as Collateral on Loaned Securities) as of September 30, 2011.
** Industries and/or investment types representing less than 5% of total investments.
*** Does not include open long/short futures contracts with a value of approximately $13,445,000 and net unrealized depreciation of approximately $72,000. Also, does not include open foreign currency exchange contracts with net unrealized appreciation of approximately $128,000 and open swap agreements with net unrealized depreciation of approximately $25,000.
9
2011 Annual Report
September 30, 2011
Portfolio of Investments
Balanced Portfolio
| Face Amount (000) | Value (000) | ||||||||||
| Fixed Income Securities (42.8%) | |||||||||||
| Agency Adjustable Rate Mortgage (0.2%) | |||||||||||
| Federal National Mortgage Association, | |||||||||||
| Conventional Pools: | |||||||||||
| 2.43%, 5/1/35 | $ | 64 | $ | 67 | |||||||
| Agency Bond — Banking (FDIC Guaranteed) (1.1%) | |||||||||||
| Ally Financial, Inc. | |||||||||||
| 2.20%, 12/19/12 | 450 | 460 | |||||||||
| Agency Fixed Rate Mortgages (10.8%) | |||||||||||
| Federal Home Loan Mortgage Corporation, | |||||||||||
| Gold Pools: | |||||||||||
| 5.00%, 10/1/35 | 349 | 376 | |||||||||
| 6.00%, 12/1/37 - 2/1/38 | 404 | 443 | |||||||||
| 7.50%, 5/1/35 | 17 | 20 | |||||||||
| 8.00%, 8/1/32 | 17 | 21 | |||||||||
| 8.50%, 8/1/31 | 18 | 22 | |||||||||
| Federal National Mortgage Association, | |||||||||||
| Conventional Pools: | |||||||||||
| 4.50%, 11/1/40 - 10/1/41 | 1,151 | 1,223 | |||||||||
| 5.00%, 9/1/39 | 145 | 156 | |||||||||
| 5.50%, 11/1/35 - 8/1/38 | 584 | 637 | |||||||||
| 6.00%, 1/1/38 | 100 | 110 | |||||||||
| 6.50%, 2/1/39 | 151 | 168 | |||||||||
| 7.50%, 8/1/37 | 33 | 39 | |||||||||
| 8.00%, 4/1/33 | 17 | 20 | |||||||||
| 8.50%, 10/1/32 | 17 | 20 | |||||||||
| Government National Mortgage Association, | |||||||||||
| October TBA: | |||||||||||
| 3.50%, 10/25/41 (a) | 185 | 193 | |||||||||
| 4.00%, 10/25/41 (a) | 525 | 562 | |||||||||
| Various Pools: | |||||||||||
| 4.50%, 4/15/39 - 5/15/40 | 490 | 533 | |||||||||
| 4,543 | |||||||||||
| Asset-Backed Securities (1.0%) | |||||||||||
| FUEL Trust | |||||||||||
| 4.21%, 4/15/16 (b) | 200 | 200 | |||||||||
| Santander Drive Auto Receivables Trust | |||||||||||
| 3.06%, 11/15/17 | 50 | 50 | |||||||||
| U-Haul S Fleet LLC | |||||||||||
| 4.90%, 10/25/23 (b) | 89 | 92 | |||||||||
| Westlake Automobile Receivables Trust | |||||||||||
| 5.00%, 5/15/15 (b) | 75 | 75 | |||||||||
| 417 | |||||||||||
| Collateralized Mortgage Obligations — Agency Collateral Series (2.6%) | |||||||||||
| Federal Home Loan Mortgage Corporation, | |||||||||||
| IO | |||||||||||
| 0.84%, 1/25/21 (c) | 698 | 30 | |||||||||
| IO REMIC | |||||||||||
| 5.00%, 12/15/20 - 12/15/37 | 283 | 37 | |||||||||
| 5.74%, 6/15/40 (c) | 196 | 31 | |||||||||
| 5.91%, 7/15/37 (c) | 157 | 23 | |||||||||
| 6.24%, 6/15/40 (c) | 679 | 130 | |||||||||
| Face Amount (000) | Value (000) | ||||||||||
| REMIC | |||||||||||
| 22.09%, 5/15/41 (c)(d) | $ | 110 | $ | 121 | |||||||
| Federal National Mortgage Association, | |||||||||||
| IO | |||||||||||
| 6.16%, 9/25/20 (c) | 446 | 116 | |||||||||
| IO REMIC | |||||||||||
| 5.00%, 8/25/37 | 109 | 8 | |||||||||
| 6.47%, 2/25/24 (c) | 132 | 15 | |||||||||
| Government National Mortgage Association, | |||||||||||
| IO | |||||||||||
| 6.32%, 12/20/40 (c) | 1,947 | 324 | |||||||||
| IO REMIC | |||||||||||
| 0.85%, 8/20/58 (c) | 780 | 25 | |||||||||
| 4.50%, 6/20/39 | 197 | 32 | |||||||||
| 5.22%, 6/20/41 (c) | 297 | 42 | |||||||||
| 6.02%, 10/20/37 (c) | 249 | 21 | |||||||||
| 6.35%, 6/20/40 (c) | 138 | 24 | |||||||||
| 6.37%, 4/16/41 (c) | 337 | 68 | |||||||||
| 6.44%, 4/16/41 (c) | 280 | 50 | |||||||||
| 1,097 | |||||||||||
| Commercial Mortgage Backed Securities (1.7%) | |||||||||||
| Banc of America Commercial Mortgage, Inc. | |||||||||||
| 5.83%, 4/10/49 (c) | 50 | 43 | |||||||||
| Bear Stearns Commercial Mortgage Securities | |||||||||||
| 5.36%, 2/11/44 | 40 | 34 | |||||||||
| Citigroup Commercial Mortgage Trust (See Note G-2), | |||||||||||
| 5.89%, 12/10/49 (c) | 85 | 79 | |||||||||
| 5.92%, 3/15/49 (c) | 30 | 30 | |||||||||
| 6.27%, 12/10/49 (c) | 50 | 55 | |||||||||
| FREMF Mortgage Trust | |||||||||||
| 4.89%, 7/25/44 (b)(c) | 70 | 64 | |||||||||
| Greenwich Capital Commercial Funding Corp., | |||||||||||
| 5.48%, 3/10/39 | 45 | 38 | |||||||||
| 5.87%, 12/10/49 (c) | 130 | 105 | |||||||||
| JP Morgan Chase Commercial Mortgage Securities Corp., | |||||||||||
| 4.17%, 8/15/46 | 70 | 71 | |||||||||
| 4.39%, 7/15/46 (b) | 100 | 100 | |||||||||
| 6.10%, 2/12/51 (c) | 35 | 32 | |||||||||
| 6.26%, 2/15/51 (c) | 45 | 38 | |||||||||
| LB-UBS Commercial Mortgage Trust | |||||||||||
| 6.37%, 9/15/45 (c) | 50 | 41 | |||||||||
| 730 | |||||||||||
| Corporate Bonds (12.9%) | |||||||||||
| Finance (6.6%) | |||||||||||
| ABB Treasury Center USA, Inc. | |||||||||||
| 2.50%, 6/15/16 (b) | 55 | 56 | |||||||||
| Abbey National Treasury Services PLC | |||||||||||
| 3.88%, 11/10/14 (b) | 100 | 96 | |||||||||
| American International Group, Inc. | |||||||||||
| 6.40%, 12/15/20 | 50 | 51 | |||||||||
The accompanying notes are an integral part of the financial statements.
10
2011 Annual Report
September 30, 2011
Portfolio of Investments (cont'd)
Balanced Portfolio
| Face Amount (000) | Value (000) | ||||||||||
| Finance (cont'd) | |||||||||||
| Bank of America Corp., | |||||||||||
| 5.63%, 7/1/20 | $ | 15 | $ | 14 | |||||||
| 5.65%, 5/1/18 | 115 | 109 | |||||||||
| BBVA US Senior SAU | |||||||||||
| 3.25%, 5/16/14 | 100 | 94 | |||||||||
| BNP Paribas SA | |||||||||||
| 5.00%, 1/15/21 | 40 | 39 | |||||||||
| Brandywine Operating Partnership LP | |||||||||||
| 4.95%, 4/15/18 | 50 | 48 | |||||||||
| Citigroup, Inc. (See Note G-2), | |||||||||||
| 6.13%, 5/15/18 | 100 | 107 | |||||||||
| 8.50%, 5/22/19 | 5 | 6 | |||||||||
| CNA Financial Corp. | |||||||||||
| 5.75%, 8/15/21 | 45 | 46 | |||||||||
| Coventry Health Care, Inc. | |||||||||||
| 5.45%, 6/15/21 | 35 | 38 | |||||||||
| Credit Suisse | |||||||||||
| 5.40%, 1/14/20 | 85 | 82 | |||||||||
| Dexus Diversified Trust/Dexus Office Trust | |||||||||||
| 5.60%, 3/15/21 (b) | 25 | 26 | |||||||||
| Digital Realty Trust LP | |||||||||||
| 5.25%, 3/15/21 | 50 | 50 | |||||||||
| General Electric Capital Corp., | |||||||||||
| 5.88%, 1/14/38 | 100 | 103 | |||||||||
| MTN | |||||||||||
| 6.00%, 8/7/19 | 25 | 28 | |||||||||
| Genworth Financial, Inc. | |||||||||||
| 7.20%, 2/15/21 | 30 | 26 | |||||||||
| Goldman Sachs Group, Inc. (The), | |||||||||||
| 6.15%, 4/1/18 | 115 | 119 | |||||||||
| 7.50%, 2/15/19 | 25 | 28 | |||||||||
| Hartford Financial Services Group, Inc. | |||||||||||
| 5.50%, 3/30/20 | 25 | 24 | |||||||||
| HCP, Inc. | |||||||||||
| 5.63%, 5/1/17 | 50 | 52 | |||||||||
| Health Care REIT, Inc. | |||||||||||
| 6.13%, 4/15/20 | 25 | 26 | |||||||||
| HSBC Holdings PLC | |||||||||||
| 5.10%, 4/5/21 | 175 | 181 | |||||||||
| JPMorgan Chase & Co., | |||||||||||
| 3.15%, 7/5/16 | 60 | 60 | |||||||||
| 4.95%, 3/25/20 | 25 | 26 | |||||||||
| 6.30%, 4/23/19 | 55 | 62 | |||||||||
| Lloyds TSB Bank PLC | |||||||||||
| 5.80%, 1/13/20 (b) | 100 | 95 | |||||||||
| Macquarie Bank Ltd. | |||||||||||
| 6.63%, 4/7/21 (b) | 25 | 24 | |||||||||
| Macquarie Group Ltd. | |||||||||||
| 6.00%, 1/14/20 (b) | 25 | 24 | |||||||||
| Merrill Lynch & Co., Inc., | |||||||||||
| MTN | |||||||||||
| 6.88%, 4/25/18 | 40 | 40 | |||||||||
| Face Amount (000) | Value (000) | ||||||||||
| MetLife, Inc. | |||||||||||
| 7.72%, 2/15/19 | $ | 20 | $ | 25 | |||||||
| NASDAQ OMX Group, Inc. (The) | |||||||||||
| 5.55%, 1/15/20 | 20 | 20 | |||||||||
| National Australia Bank Ltd. | |||||||||||
| 3.00%, 7/27/16 (b) | 105 | 105 | |||||||||
| Nationwide Financial Services | |||||||||||
| 5.38%, 3/25/21 (b) | 25 | 25 | |||||||||
| Pacific LifeCorp | |||||||||||
| 6.00%, 2/10/20 (b) | 25 | 27 | |||||||||
| Regions Financial Corp. | |||||||||||
| 5.75%, 6/15/15 | 20 | 19 | |||||||||
| Reinsurance Group of America, Inc. | |||||||||||
| 6.45%, 11/15/19 | 50 | 57 | |||||||||
| Santander Holdings USA, Inc. | |||||||||||
| 4.63%, 4/19/16 | 10 | 10 | |||||||||
| SLM Corp., | |||||||||||
| MTN | |||||||||||
| 6.25%, 1/25/16 | 35 | 34 | |||||||||
| Standard Chartered PLC | |||||||||||
| 3.85%, 4/27/15 (b) | 100 | 103 | |||||||||
| UnitedHealth Group, Inc. | |||||||||||
| 6.63%, 11/15/37 | 90 | 114 | |||||||||
| US Central Federal Credit Union, | |||||||||||
| (U.S. Government Guaranteed) | |||||||||||
| 1.90%, 10/19/12 | 250 | 254 | |||||||||
| Ventas Realty LP/Ventas Capital Corp. | |||||||||||
| 4.75%, 6/1/21 | 50 | 48 | |||||||||
| Wachovia Corp. | |||||||||||
| 5.63%, 10/15/16 | 25 | 27 | |||||||||
| WEA Finance LLC | |||||||||||
| 4.63%, 5/10/21 (b) | 50 | 48 | |||||||||
| Wells Operating Partnership II LP | |||||||||||
| 5.88%, 4/1/18 | 50 | 51 | |||||||||
| Willis Group Holdings PLC | |||||||||||
| 4.13%, 3/15/16 | 45 | 46 | |||||||||
| 2,793 | |||||||||||
| Industrials (5.2%) | |||||||||||
| Altria Group, Inc. | |||||||||||
| 4.13%, 9/11/15 | 40 | 43 | |||||||||
| ArcelorMittal | |||||||||||
| 9.85%, 6/1/19 | 25 | 28 | |||||||||
| AT&T, Inc. | |||||||||||
| 6.30%, 1/15/38 | 50 | 57 | |||||||||
| Bemis Co., Inc. | |||||||||||
| 4.50%, 10/15/21 (e) | 70 | 71 | |||||||||
| Best Buy Co., Inc. | |||||||||||
| 3.75%, 3/15/16 | 45 | 44 | |||||||||
| CenturyLink, Inc. | |||||||||||
| 6.45%, 6/15/21 | 45 | 42 | |||||||||
| CF Industries, Inc. | |||||||||||
| 6.88%, 5/1/18 | 65 | 73 | |||||||||
The accompanying notes are an integral part of the financial statements.
11
2011 Annual Report
September 30, 2011
Portfolio of Investments (cont'd)
Balanced Portfolio
| Face Amount (000) | Value (000) | ||||||||||
| Industrials (cont'd) | |||||||||||
| Comcast Corp. | |||||||||||
| 5.70%, 5/15/18 | $ | 30 | $ | 35 | |||||||
| CRH America, Inc. | |||||||||||
| 6.00%, 9/30/16 | 40 | 43 | |||||||||
| CVS Caremark Corp. | |||||||||||
| 6.60%, 3/15/19 | 80 | 97 | |||||||||
| Darden Restaurants, Inc. | |||||||||||
| 6.20%, 10/15/17 (f) | 50 | 58 | |||||||||
| Delhaize Group SA | |||||||||||
| 5.70%, 10/1/40 | 92 | 96 | |||||||||
| DirecTV Holdings LLC/DirecTV Financing Co., Inc. | |||||||||||
| 5.88%, 10/1/19 | 35 | 39 | |||||||||
| DISH DBS Corp. | |||||||||||
| 7.13%, 2/1/16 | 35 | 36 | |||||||||
| Frontier Communications Corp. | |||||||||||
| 8.50%, 4/15/20 | 30 | 29 | |||||||||
| Georgia-Pacific LLC | |||||||||||
| 5.40%, 11/1/20 (b) | 80 | 82 | |||||||||
| Gilead Sciences, Inc. | |||||||||||
| 4.50%, 4/1/21 | 45 | 49 | |||||||||
| Harley-Davidson Funding Corp. | |||||||||||
| 6.80%, 6/15/18 (b) | 30 | 35 | |||||||||
| Hess Corp. | |||||||||||
| 6.00%, 1/15/40 | 35 | 40 | |||||||||
| Home Depot, Inc. | |||||||||||
| 5.88%, 12/16/36 | 30 | 35 | |||||||||
| International Paper Co. | |||||||||||
| 7.50%, 8/15/21 | 30 | 35 | |||||||||
| JC Penney Co., Inc. | |||||||||||
| 5.65%, 6/1/20 | 10 | 9 | |||||||||
| JC Penney Corp., Inc. | |||||||||||
| 6.38%, 10/15/36 | 28 | 24 | |||||||||
| Kohl's Corp. | |||||||||||
| 6.88%, 12/15/37 | 30 | 38 | |||||||||
| Kraft Foods, Inc. | |||||||||||
| 7.00%, 8/11/37 | 80 | 103 | |||||||||
| Lafarge SA | |||||||||||
| 6.20%, 7/9/15 (b) | 80 | 80 | |||||||||
| Life Technologies Corp. | |||||||||||
| 6.00%, 3/1/20 | 40 | 44 | |||||||||
| NBC Universal Media LLC | |||||||||||
| 5.15%, 4/30/20 | 55 | 60 | |||||||||
| Omnicom Group, Inc. | |||||||||||
| 4.45%, 8/15/20 | 25 | 25 | |||||||||
| Petrobras International Finance Co. | |||||||||||
| 5.75%, 1/20/20 | 90 | 94 | |||||||||
| QEP Resources, Inc. | |||||||||||
| 6.88%, 3/1/21 | 15 | 16 | |||||||||
| Quest Diagnostics, Inc. | |||||||||||
| 6.95%, 7/1/37 | 10 | 13 | |||||||||
| Rio Tinto Finance USA Ltd. | |||||||||||
| 9.00%, 5/1/19 | 15 | 20 | |||||||||
| Face Amount (000) | Value (000) | ||||||||||
| Teck Resources Ltd. | |||||||||||
| 4.75%, 1/15/22 (f) | $ | 75 | $ | 77 | |||||||
| Telecom Italia Capital SA | |||||||||||
| 7.18%, 6/18/19 | 30 | 30 | |||||||||
| Telstra Corp. Ltd. | |||||||||||
| 4.80%, 10/12/21 (b) | 60 | 63 | |||||||||
| Time Warner, Inc., | |||||||||||
| 4.75%, 3/29/21 | 45 | 47 | |||||||||
| 7.70%, 5/1/32 | 40 | 51 | |||||||||
| Vale Overseas Ltd. | |||||||||||
| 6.88%, 11/10/39 | 50 | 54 | |||||||||
| Verisk Analytics, Inc. | |||||||||||
| 5.80%, 5/1/21 | 55 | 62 | |||||||||
| Verizon Communications, Inc. | |||||||||||
| 8.95%, 3/1/39 | 45 | 70 | |||||||||
| Wesfarmers Ltd. | |||||||||||
| 2.98%, 5/18/16 (b) | 50 | 51 | |||||||||
| Wyndham Worldwide Corp. | |||||||||||
| 5.63%, 3/1/21 | 50 | 50 | |||||||||
| Yum! Brands, Inc. | |||||||||||
| 6.88%, 11/15/37 | 40 | 53 | |||||||||
| 2,201 | |||||||||||
| Utilities (1.1%) | |||||||||||
| EDF SA | |||||||||||
| 4.60%, 1/27/20 (b) | 25 | 26 | |||||||||
| Energy Transfer Partners LP | |||||||||||
| 9.00%, 4/15/19 | 25 | 30 | |||||||||
| Enterprise Products Operating LLC | |||||||||||
| 5.20%, 9/1/20 | 50 | 55 | |||||||||
| EQT Corp. | |||||||||||
| 8.13%, 6/1/19 | 25 | 30 | |||||||||
| Exelon Generation Co. LLC | |||||||||||
| 6.25%, 10/1/39 | 75 | 88 | |||||||||
| FirstEnergy Solutions Corp. | |||||||||||
| 6.05%, 8/15/21 | 40 | 44 | |||||||||
| Kinder Morgan Energy Partners LP | |||||||||||
| 5.95%, 2/15/18 | 75 | 86 | |||||||||
| Plains All American Pipeline LP/PAA Finance Corp. | |||||||||||
| 8.75%, 5/1/19 | 30 | 38 | |||||||||
| PPL WEM Holdings PLC | |||||||||||
| 3.90%, 5/1/16 (b) | 40 | 42 | |||||||||
| 439 | |||||||||||
| 5,433 | |||||||||||
| Mortgages — Other (2.9%) | |||||||||||
| American Home Mortgage Investment Trust | |||||||||||
| 0.41%, 12/25/46 (c) | 133 | 77 | |||||||||
| Banc of America Alternative Loan Trust, | |||||||||||
| 5.86%, 10/25/36 (c) | 69 | 45 | |||||||||
| 5.91%, 10/25/36 (c) | 125 | 79 | |||||||||
| 6.00%, 4/25/36 | 76 | 71 | |||||||||
| Banc of America Funding Corp. | |||||||||||
| 0.60%, 8/25/36 (c) | 39 | 33 | |||||||||
The accompanying notes are an integral part of the financial statements.
12
2011 Annual Report
September 30, 2011
Portfolio of Investments (cont'd)
Balanced Portfolio
| Face Amount (000) | Value (000) | ||||||||||
| Mortgages — Other (cont'd) | |||||||||||
| Chase Mortgage Finance Corp. | |||||||||||
| 6.00%, 11/25/36 | $ | 76 | $ | 64 | |||||||
| Chaseflex Trust | |||||||||||
| 6.00%, 2/25/37 | 70 | 49 | |||||||||
| Countrywide Alternative Loan Trust | |||||||||||
| 0.58%, 9/25/35 (c) | 99 | 60 | |||||||||
| Countrywide Home Loan Mortgage Pass-Through Trust | |||||||||||
| 0.53%, 4/25/46 (c) | 133 | 41 | |||||||||
| First Horizon Alternative Mortgage Securities | |||||||||||
| 6.25%, 8/25/36 | 42 | 30 | |||||||||
| GMAC Mortgage Corp. Loan Trust | |||||||||||
| 4.25%, 7/25/40 (b) | 6 | 6 | |||||||||
| GSR Mortgage Loan Trust | |||||||||||
| 5.75%, 1/25/37 | 75 | 68 | |||||||||
| JP Morgan Mortgage Trust, | |||||||||||
| 6.00%, 6/25/37 | 65 | 59 | |||||||||
| 6.25%, 7/25/36 | 86 | 83 | |||||||||
| Lehman Mortgage Trust, | |||||||||||
| 5.50%, 11/25/35 - 2/25/36 | 120 | 109 | |||||||||
| 6.50%, 9/25/37 | 92 | 73 | |||||||||
| Luminent Mortgage Trust | |||||||||||
| 0.37%, 1/25/37 (c) | 136 | 80 | |||||||||
| Residential Accredit Loans, Inc. | |||||||||||
| 0.73%, 3/25/35 (c) | 58 | 35 | |||||||||
| Structured Asset Mortgage Investments, Inc. | |||||||||||
| 0.46%, 8/25/36 (c) | 115 | 28 | |||||||||
| WaMu Mortgage Pass-Through Certificates, | |||||||||||
| 1.01%, 5/25/47 (c) | 145 | 87 | |||||||||
| 1.22%, 7/25/46 (c) | 97 | 59 | |||||||||
| 1,236 | |||||||||||
| Municipal Bonds (0.5%) | |||||||||||
| Chicago Transit Authority | |||||||||||
| 6.20%, 12/1/40 | 20 | 23 | |||||||||
| City of Chicago, IL | |||||||||||
| 6.40%, 1/1/40 | 10 | 12 | |||||||||
| City of New York, NY, Series G-1 | |||||||||||
| 5.97%, 3/1/36 | 15 | 18 | |||||||||
| Illinois State Toll Highway Authority, Highway Revenue, Build America Bonds | |||||||||||
| 6.18%, 1/1/34 | 50 | 59 | |||||||||
| Municipal Electric Authority of Georgia, | |||||||||||
| 6.64%, 4/1/57 | 20 | 22 | |||||||||
| 6.66%, 4/1/57 | 30 | 32 | |||||||||
| New York City Transitional Finance Authority | |||||||||||
| 5.27%, 5/1/27 | 15 | 17 | |||||||||
| State of California, General Obligation Bonds | |||||||||||
| 5.95%, 4/1/16 | 40 | 46 | |||||||||
| 229 | |||||||||||
| Face Amount (000) | Value (000) | ||||||||||
| U.S. Agency Securities (1.5%) | |||||||||||
| Federal Home Loan Mortgage Corporation | |||||||||||
| 2.50%, 1/7/14 (f) | $ | 400 | $ | 419 | |||||||
| Federal National Mortgage Association | |||||||||||
| 5.38%, 6/12/17 | 170 | 206 | |||||||||
| 625 | |||||||||||
| U.S. Treasury Securities (7.6%) | |||||||||||
| U.S. Treasury Bonds, | |||||||||||
| 3.50%, 2/15/39 | 310 | 345 | |||||||||
| 4.63%, 2/15/40 | 300 | 401 | |||||||||
| U.S. Treasury Notes, | |||||||||||
| 0.50%, 10/15/13 | 565 | 567 | |||||||||
| 0.63%, 2/28/13 | 355 | 357 | |||||||||
| 1.25%, 8/31/15 (f) | 890 | 911 | |||||||||
| 3.00%, 8/31/16 (f) | 80 | 88 | |||||||||
| 3.00%, 9/30/16 | 150 | 165 | |||||||||
| 3.25%, 12/31/16 | 155 | 172 | |||||||||
| 3.63%, 8/15/19 (f) | 165 | 190 | |||||||||
| 3,196 | |||||||||||
| Total Fixed Income Securities (Cost $17,581) | 18,033 | ||||||||||
| Shares | |||||||||||
| Common Stocks (48.9%) | |||||||||||
| Aerospace & Defense (1.5%) | |||||||||||
| Alliant Techsystems, Inc. (f) | 648 | 35 | |||||||||
| Boeing Co. (The) | 795 | 48 | |||||||||
| General Dynamics Corp. | 640 | 37 | |||||||||
| Goodrich Corp. | 178 | 22 | |||||||||
| Honeywell International, Inc. | 2,117 | 93 | |||||||||
| Huntington Ingalls Industries, Inc. (g) | 53 | 1 | |||||||||
| ITT Corp. (f) | 594 | 25 | |||||||||
| L-3 Communications Holdings, Inc. | 200 | 12 | |||||||||
| Lockheed Martin Corp. | 362 | 26 | |||||||||
| Northrop Grumman Corp. | 322 | 17 | |||||||||
| Precision Castparts Corp. | 452 | 70 | |||||||||
| Raytheon Co. | 1,535 | 63 | |||||||||
| Rockwell Collins, Inc. | 475 | 25 | |||||||||
| Textron, Inc. (f) | 500 | 9 | |||||||||
| United Technologies Corp. | 2,165 | 152 | |||||||||
| 635 | |||||||||||
| Air Freight & Logistics (0.4%) | |||||||||||
| C.H. Robinson Worldwide, Inc. (f) | 300 | 21 | |||||||||
| Expeditors International of Washington, Inc. | 300 | 12 | |||||||||
| FedEx Corp. | 500 | 34 | |||||||||
| United Parcel Service, Inc., Class B | 1,600 | 101 | |||||||||
| 168 | |||||||||||
| Airlines (0.0%) | |||||||||||
| Southwest Airlines Co. | 1,300 | 10 | |||||||||
| Auto Components (0.2%) | |||||||||||
| BorgWarner, Inc. (g) | 835 | 50 | |||||||||
| Johnson Controls, Inc. | 1,614 | 43 | |||||||||
| 93 | |||||||||||
The accompanying notes are an integral part of the financial statements.
13
2011 Annual Report
September 30, 2011
Portfolio of Investments (cont'd)
Balanced Portfolio
| Shares | Value (000) | ||||||||||
| Automobiles (0.1%) | |||||||||||
| Ford Motor Co. (f)(g) | 2,605 | $ | 25 | ||||||||
| Beverages (1.0%) | |||||||||||
| Brown-Forman Corp., Class B | 119 | 8 | |||||||||
| Coca-Cola Co. (The) | 2,852 | 193 | |||||||||
| Coca-Cola Enterprises, Inc. | 577 | 14 | |||||||||
| Constellation Brands, Inc. (g) | 500 | 9 | |||||||||
| Molson Coors Brewing Co. | 500 | 20 | |||||||||
| PepsiCo, Inc. | 2,915 | 181 | |||||||||
| 425 | |||||||||||
| Biotechnology (0.5%) | |||||||||||
| Amgen, Inc. | 1,580 | 87 | |||||||||
| Biogen Idec, Inc. (g) | 365 | 34 | |||||||||
| Celgene Corp. (g) | 632 | 39 | |||||||||
| Gilead Sciences, Inc. (g) | 1,214 | 47 | |||||||||
| 207 | |||||||||||
| Capital Markets (0.8%) | |||||||||||
| Ameriprise Financial, Inc. | 100 | 4 | |||||||||
| Bank of New York Mellon Corp. (The) | 2,914 | 54 | |||||||||
| Charles Schwab Corp. (The) | 747 | 8 | |||||||||
| Franklin Resources, Inc. | 291 | 28 | |||||||||
| Goldman Sachs Group, Inc. (The) | 1,522 | 144 | |||||||||
| Invesco Ltd. | 500 | 8 | |||||||||
| Janus Capital Group, Inc. | 200 | 1 | |||||||||
| Legg Mason, Inc. | 342 | 9 | |||||||||
| Northern Trust Corp. | 130 | 5 | |||||||||
| State Street Corp. | 2,253 | 72 | |||||||||
| 333 | |||||||||||
| Chemicals (0.8%) | |||||||||||
| Air Products & Chemicals, Inc. | 291 | 22 | |||||||||
| CF Industries Holdings, Inc. | 395 | 49 | |||||||||
| Dow Chemical Co. (The) | 1,513 | 34 | |||||||||
| Eastman Chemical Co. | 100 | 7 | |||||||||
| Ecolab, Inc. (f) | 258 | 12 | |||||||||
| EI du Pont de Nemours & Co. | 2,249 | 90 | |||||||||
| FMC Corp. | 119 | 8 | |||||||||
| International Flavors & Fragrances, Inc. | 119 | 7 | |||||||||
| Monsanto Co. | 677 | 41 | |||||||||
| PPG Industries, Inc. | 311 | 22 | |||||||||
| Praxair, Inc. | 377 | 35 | |||||||||
| Sherwin-Williams Co. (The) | 119 | 9 | |||||||||
| Sigma-Aldrich Corp. | 239 | 15 | |||||||||
| 351 | |||||||||||
| Commercial Banks (1.3%) | |||||||||||
| BB&T Corp. | 1,577 | 34 | |||||||||
| Comerica, Inc. | 400 | 9 | |||||||||
| Fifth Third Bancorp | 2,011 | 20 | |||||||||
| First Republic Bank (g) | 1,074 | 25 | |||||||||
| Huntington Bancshares, Inc. (f) | 1,600 | 8 | |||||||||
| KeyCorp | 1,356 | 8 | |||||||||
| M&T Bank Corp. | 174 | 12 | |||||||||
| PNC Financial Services Group, Inc. | 1,103 | 53 | |||||||||
| Regions Financial Corp. | 2,532 | 8 | |||||||||
| Shares | Value (000) | ||||||||||
| SunTrust Banks, Inc. | 1,208 | $ | 22 | ||||||||
| US Bancorp | 4,252 | 100 | |||||||||
| Wells Fargo & Co. | 9,546 | 230 | |||||||||
| Zions Bancorporation | 400 | 6 | |||||||||
| 535 | |||||||||||
| Commercial Services & Supplies (0.3%) | |||||||||||
| Avery Dennison Corp. | 234 | 6 | |||||||||
| Cintas Corp. | 287 | 8 | |||||||||
| Iron Mountain, Inc. (f) | 206 | 6 | |||||||||
| Pitney Bowes, Inc. (f) | 429 | 8 | |||||||||
| Republic Services, Inc. | 646 | 18 | |||||||||
| RR Donnelley & Sons Co. | 458 | 6 | |||||||||
| Stericycle, Inc. (f)(g) | 119 | 10 | |||||||||
| Waste Management, Inc. (f) | 1,309 | 43 | |||||||||
| 105 | |||||||||||
| Communications Equipment (0.8%) | |||||||||||
| Cisco Systems, Inc. | 9,478 | 147 | |||||||||
| Juniper Networks, Inc. (g) | 1,028 | 18 | |||||||||
| Motorola Mobility Holdings, Inc. (g) | 410 | 15 | |||||||||
| Motorola Solutions, Inc. | 468 | 20 | |||||||||
| QUALCOMM, Inc. | 2,900 | 141 | |||||||||
| 341 | |||||||||||
| Computers & Peripherals (2.5%) | |||||||||||
| Apple, Inc. (g) | 1,641 | 626 | |||||||||
| Dell, Inc. (g) | 2,624 | 37 | |||||||||
| EMC Corp. (g) | 3,830 | 80 | |||||||||
| Hewlett-Packard Co. | 5,112 | 115 | |||||||||
| Lexmark International, Inc. (g) | 100 | 3 | |||||||||
| NetApp, Inc. (g) | 716 | 24 | |||||||||
| SanDisk Corp. (g) | 3,232 | 130 | |||||||||
| Western Digital Corp. (g) | 1,078 | 28 | |||||||||
| 1,043 | |||||||||||
| Construction & Engineering (0.2%) | |||||||||||
| Foster Wheeler AG (g) | 1,881 | 33 | |||||||||
| Jacobs Engineering Group, Inc. (g) | 300 | 10 | |||||||||
| URS Corp. (g) | 1,683 | 50 | |||||||||
| 93 | |||||||||||
| Consumer Finance (0.3%) | |||||||||||
| American Express Co. | 1,130 | 51 | |||||||||
| Capital One Financial Corp. | 1,083 | 43 | |||||||||
| Discover Financial Services | 1,293 | 30 | |||||||||
| SLM Corp. | 444 | 5 | |||||||||
| 129 | |||||||||||
| Containers & Packaging (0.0%) | |||||||||||
| Ball Corp. | 239 | 7 | |||||||||
| Distributors (0.0%) | |||||||||||
| Genuine Parts Co. | 200 | 10 | |||||||||
| Diversified Consumer Services (0.1%) | |||||||||||
| Apollo Group, Inc., Class A (g) | 358 | 14 | |||||||||
| DeVry, Inc. | 119 | 5 | |||||||||
| H&R Block, Inc. | 1,216 | 16 | |||||||||
| 35 | |||||||||||
The accompanying notes are an integral part of the financial statements.
14
2011 Annual Report
September 30, 2011
Portfolio of Investments (cont'd)
Balanced Portfolio
| Shares | Value (000) | ||||||||||
| Diversified Financial Services (1.7%) | |||||||||||
| Bank of America Corp. | 24,146 | $ | 148 | ||||||||
| Citigroup, Inc. (See Note G-2) | 6,796 | 174 | |||||||||
| CME Group, Inc. | 138 | 34 | |||||||||
| JPMorgan Chase & Co. | 10,815 | 326 | |||||||||
| Leucadia National Corp. (f) | 123 | 3 | |||||||||
| Moody's Corp. | 109 | 3 | |||||||||
| NASDAQ OMX Group, Inc. (The) (g) | 136 | 3 | |||||||||
| NYSE Euronext | 331 | 8 | |||||||||
| 699 | |||||||||||
| Diversified Telecommunication Services (1.5%) | |||||||||||
| AT&T, Inc. | 10,192 | 291 | |||||||||
| CenturyLink, Inc. | 2,357 | 78 | |||||||||
| Frontier Communications Corp. | 2,518 | 15 | |||||||||
| Verizon Communications, Inc. | 6,254 | 230 | |||||||||
| 614 | |||||||||||
| Electric Utilities (1.0%) | |||||||||||
| American Electric Power Co., Inc. | 969 | 37 | |||||||||
| Duke Energy Corp. | 2,115 | 42 | |||||||||
| Edison International | 935 | 36 | |||||||||
| Exelon Corp. | 780 | 33 | |||||||||
| FirstEnergy Corp. | 495 | 22 | |||||||||
| NextEra Energy, Inc. (f) | 935 | 50 | |||||||||
| Pepco Holdings, Inc. (f) | 85 | 2 | |||||||||
| PPL Corp. | 935 | 27 | |||||||||
| Progress Energy, Inc. | 505 | 26 | |||||||||
| Southern Co. | 3,042 | 129 | |||||||||
| 404 | |||||||||||
| Electrical Equipment (0.2%) | |||||||||||
| Emerson Electric Co. | 1,782 | 74 | |||||||||
| Electronic Equipment, Instruments & Components (0.3%) | |||||||||||
| Amphenol Corp., Class A | 385 | 16 | |||||||||
| Arrow Electronics, Inc. (g) | 1,669 | 47 | |||||||||
| Corning, Inc. | 5,121 | 63 | |||||||||
| Jabil Circuit, Inc. | 300 | 5 | |||||||||
| Molex, Inc. (f) | 164 | 3 | |||||||||
| 134 | |||||||||||
| Energy Equipment & Services (1.3%) | |||||||||||
| Baker Hughes, Inc. | 839 | 39 | |||||||||
| Cameron International Corp. (g) | 831 | 35 | |||||||||
| Diamond Offshore Drilling, Inc. (f) | 239 | 13 | |||||||||
| FMC Technologies, Inc. (g) | 954 | 36 | |||||||||
| Halliburton Co. | 2,244 | 68 | |||||||||
| National Oilwell Varco, Inc. | 1,335 | 68 | |||||||||
| Noble Corp. (g) | 596 | 18 | |||||||||
| Schlumberger Ltd. | 4,222 | 252 | |||||||||
| Tidewater, Inc. | 694 | 29 | |||||||||
| 558 | |||||||||||
| Food & Staples Retailing (1.2%) | |||||||||||
| Costco Wholesale Corp. | 795 | 65 | |||||||||
| CVS Caremark Corp. | 2,573 | 86 | |||||||||
| Kroger Co. (The) | 1,072 | 23 | |||||||||
| Shares | Value (000) | ||||||||||
| Safeway, Inc. (f) | 1,072 | $ | 18 | ||||||||
| Sysco Corp. | 1,455 | 38 | |||||||||
| Wal-Mart Stores, Inc. | 3,987 | 207 | |||||||||
| Walgreen Co. | 658 | 22 | |||||||||
| Whole Foods Market, Inc. | 1,005 | 66 | |||||||||
| 525 | |||||||||||
| Food Products (1.2%) | |||||||||||
| Archer-Daniels-Midland Co. | 1,316 | 33 | |||||||||
| Campbell Soup Co. (f) | 400 | 13 | |||||||||
| ConAgra Foods, Inc. | 3,393 | 82 | |||||||||
| General Mills, Inc. | 1,201 | 46 | |||||||||
| H.J. Heinz Co. | 743 | 38 | |||||||||
| Hershey Co. (The) | 300 | 18 | |||||||||
| JM Smucker Co. (The) | 323 | 24 | |||||||||
| Kellogg Co. | 562 | 30 | |||||||||
| Kraft Foods, Inc., Class A | 3,124 | 105 | |||||||||
| Mead Johnson Nutrition Co. | 339 | 23 | |||||||||
| Sara Lee Corp. | 878 | 14 | |||||||||
| Smithfield Foods, Inc. (g) | 3,334 | 65 | |||||||||
| Tyson Foods, Inc., Class A | 1,000 | 17 | |||||||||
| 508 | |||||||||||
| Health Care Equipment & Supplies (0.7%) | |||||||||||
| Baxter International, Inc. | 929 | 52 | |||||||||
| Becton Dickinson and Co. | 561 | 41 | |||||||||
| Boston Scientific Corp. (g) | 2,517 | 15 | |||||||||
| CR Bard, Inc. | 239 | 21 | |||||||||
| Intuitive Surgical, Inc. (g) | 127 | 46 | |||||||||
| Medtronic, Inc. | 1,193 | 40 | |||||||||
| St. Jude Medical, Inc. | 681 | 24 | |||||||||
| Stryker Corp. | 672 | 32 | |||||||||
| Varian Medical Systems, Inc. (g) | 358 | 19 | |||||||||
| Zimmer Holdings, Inc. (f)(g) | 402 | 21 | |||||||||
| 311 | |||||||||||
| Health Care Providers & Services (1.3%) | |||||||||||
| Aetna, Inc. | 719 | 26 | |||||||||
| AmerisourceBergen Corp. | 838 | 31 | |||||||||
| Cardinal Health, Inc. | 539 | 23 | |||||||||
| CIGNA Corp. | 665 | 28 | |||||||||
| Coventry Health Care, Inc. (g) | 2,409 | 69 | |||||||||
| DaVita, Inc. (g) | 239 | 15 | |||||||||
| Express Scripts, Inc. (g) | 859 | 32 | |||||||||
| Laboratory Corp. of America Holdings (g) | 283 | 22 | |||||||||
| McKesson Corp. | 419 | 31 | |||||||||
| Medco Health Solutions, Inc. (g) | 660 | 31 | |||||||||
| Omnicare, Inc. | 2,218 | 56 | |||||||||
| Patterson Cos., Inc. | 358 | 10 | |||||||||
| Quest Diagnostics, Inc. | 239 | 12 | |||||||||
| Tenet Healthcare Corp. (g) | 1,432 | 6 | |||||||||
| UnitedHealth Group, Inc. | 950 | 44 | |||||||||
| Universal Health Services, Inc., Class B | 1,501 | 51 | |||||||||
| WellPoint, Inc. | 619 | 40 | |||||||||
| 527 | |||||||||||
The accompanying notes are an integral part of the financial statements.
15
2011 Annual Report
September 30, 2011
Portfolio of Investments (cont'd)
Balanced Portfolio
| Shares | Value (000) | ||||||||||
| Health Care Technology (0.1%) | |||||||||||
| Cerner Corp. (g) | 392 | $ | 27 | ||||||||
| Hotels, Restaurants & Leisure (0.9%) | |||||||||||
| Carnival Corp. | 853 | 26 | |||||||||
| Darden Restaurants, Inc. | 238 | 10 | |||||||||
| International Game Technology | 1,296 | 19 | |||||||||
| Marriott International, Inc., Class A (f) | 318 | 9 | |||||||||
| McDonald's Corp. | 1,736 | 152 | |||||||||
| Starbucks Corp. | 1,112 | 41 | |||||||||
| Starwood Hotels & Resorts Worldwide, Inc. | 275 | 11 | |||||||||
| Wyndham Worldwide Corp. | 477 | 14 | |||||||||
| Wynn Resorts Ltd. | 119 | 14 | |||||||||
| Yum! Brands, Inc. | 1,727 | 85 | |||||||||
| 381 | |||||||||||
| Household Durables (0.1%) | |||||||||||
| Harman International Industries, Inc. | 239 | 7 | |||||||||
| Toll Brothers, Inc. (g) | 3,034 | 44 | |||||||||
| 51 | |||||||||||
| Household Products (1.3%) | |||||||||||
| Colgate-Palmolive Co. | 1,013 | 90 | |||||||||
| Kimberly-Clark Corp. | 964 | 68 | |||||||||
| Procter & Gamble Co. (The) | 5,999 | 379 | |||||||||
| 537 | |||||||||||
| Independent Power Producers & Energy Traders (0.1%) | |||||||||||
| AES Corp. (The) (g) | 1,904 | 19 | |||||||||
| Constellation Energy Group, Inc. | 58 | 2 | |||||||||
| NRG Energy, Inc. (f)(g) | 1,611 | 34 | |||||||||
| 55 | |||||||||||
| Industrial Conglomerates (1.0%) | |||||||||||
| 3M Co. | 1,085 | 78 | |||||||||
| Danaher Corp. | 1,111 | 47 | |||||||||
| General Electric Co. | 14,433 | 220 | |||||||||
| Tyco International Ltd. | 1,802 | 73 | |||||||||
| 418 | |||||||||||
| Information Technology Services (1.6%) | |||||||||||
| Automatic Data Processing, Inc. | 564 | 27 | |||||||||
| Cognizant Technology Solutions Corp., Class A (g) | 531 | 33 | |||||||||
| Fidelity National Information Services, Inc. | 100 | 3 | |||||||||
| International Business Machines Corp. | 2,493 | 436 | |||||||||
| Mastercard, Inc., Class A | 202 | 64 | |||||||||
| Paychex, Inc. | 450 | 12 | |||||||||
| Visa, Inc., Class A | 643 | 55 | |||||||||
| Western Union Co. (The) | 1,690 | 26 | |||||||||
| 656 | |||||||||||
| Insurance (1.8%) | |||||||||||
| Aflac, Inc. | 1,053 | 37 | |||||||||
| Allstate Corp. (The) | 1,189 | 28 | |||||||||
| AON Corp. | 480 | 20 | |||||||||
| Assurant, Inc. | 1,261 | 45 | |||||||||
| Berkshire Hathaway, Inc., Class B (g) | 1,389 | 99 | |||||||||
| Chubb Corp. | 1,646 | 99 | |||||||||
| Shares | Value (000) | ||||||||||
| Fidelity National Financial, Inc. | 2,892 | $ | 44 | ||||||||
| Hartford Financial Services Group, Inc. | 685 | 11 | |||||||||
| Lincoln National Corp. | 1,593 | 25 | |||||||||
| Loews Corp. | 1,037 | 36 | |||||||||
| Marsh & McLennan Cos., Inc. | 1,037 | 28 | |||||||||
| MetLife, Inc. | 1,693 | 47 | |||||||||
| PartnerRe Ltd. | 652 | 34 | |||||||||
| Principal Financial Group, Inc. | 1,490 | 34 | |||||||||
| Progressive Corp. (The) | 913 | 16 | |||||||||
| Prudential Financial, Inc. | 1,022 | 48 | |||||||||
| Travelers Cos., Inc. (The) | 885 | 43 | |||||||||
| Unum Group | 2,400 | 50 | |||||||||
| 744 | |||||||||||
| Internet & Catalog Retail (0.3%) | |||||||||||
| Amazon.com, Inc. (g) | 467 | 101 | |||||||||
| Expedia, Inc. | 403 | 11 | |||||||||
| NetFlix, Inc. (f)(g) | 100 | 11 | |||||||||
| Priceline.com, Inc. (g) | 27 | 12 | |||||||||
| 135 | |||||||||||
| Internet Software & Services (0.8%) | |||||||||||
| eBay, Inc. (g) | 1,817 | 53 | |||||||||
| Google, Inc., Class A (g) | 394 | 203 | |||||||||
| Yahoo!, Inc. (g) | 6,557 | 86 | |||||||||
| 342 | |||||||||||
| Leisure Equipment & Products (0.1%) | |||||||||||
| Hasbro, Inc. | 358 | 12 | |||||||||
| Mattel, Inc. | 477 | 12 | |||||||||
| 24 | |||||||||||
| Life Sciences Tools & Services (0.2%) | |||||||||||
| Agilent Technologies, Inc. (g) | 10 | — | @ | ||||||||
| Life Technologies Corp. (g) | 365 | 14 | |||||||||
| Thermo Fisher Scientific, Inc. (g) | 1,218 | 62 | |||||||||
| 76 | |||||||||||
| Machinery (1.0%) | |||||||||||
| AGCO Corp. (g) | 1,193 | 41 | |||||||||
| Caterpillar, Inc. | 2,204 | 163 | |||||||||
| Cummins, Inc. | 525 | 43 | |||||||||
| Deere & Co. | 650 | 42 | |||||||||
| Eaton Corp. | 400 | 14 | |||||||||
| Illinois Tool Works, Inc. | 2,061 | 86 | |||||||||
| PACCAR, Inc. | 355 | 12 | |||||||||
| Stanley Black & Decker, Inc. | 239 | 11 | |||||||||
| 412 | |||||||||||
| Media (1.5%) | |||||||||||
| AMC Networks, Inc. (g) | 119 | 4 | |||||||||
| Cablevision Systems Corp. | 477 | 7 | |||||||||
| CBS Corp., Class B | 968 | 20 | |||||||||
| Comcast Corp., Class A | 5,546 | 116 | |||||||||
| DIRECTV, Class A (g) | 1,712 | 72 | |||||||||
| Discovery Communications, Inc. (g) | 477 | 18 | |||||||||
| Gannett Co., Inc. | 600 | 6 | |||||||||
The accompanying notes are an integral part of the financial statements.
16
2011 Annual Report
September 30, 2011
Portfolio of Investments (cont'd)
Balanced Portfolio
| Shares | Value (000) | ||||||||||
| Media (cont'd) | |||||||||||
| Interpublic Group of Cos., Inc. (The) | 835 | $ | 6 | ||||||||
| McGraw-Hill Cos., Inc. (The) | 565 | 23 | |||||||||
| News Corp., Class A | 3,952 | 61 | |||||||||
| Omnicom Group, Inc. | 537 | 20 | |||||||||
| Scripps Networks Interactive, Inc., Class A | 100 | 4 | |||||||||
| Time Warner Cable, Inc. | 687 | 43 | |||||||||
| Time Warner, Inc. | 3,439 | 103 | |||||||||
| Viacom, Inc., Class B | 1,227 | 47 | |||||||||
| Walt Disney Co. (The) | 3,346 | 101 | |||||||||
| 651 | |||||||||||
| Metals & Mining (0.6%) | |||||||||||
| Alcoa, Inc. | 4,568 | 44 | |||||||||
| Allegheny Technologies, Inc. | 200 | 7 | |||||||||
| Cliffs Natural Resources, Inc. | 139 | 7 | |||||||||
| Commercial Metals Co. | 4,386 | 42 | |||||||||
| Freeport-McMoRan Copper & Gold, Inc. | 1,219 | 37 | |||||||||
| Molycorp, Inc. (f)(g) | 867 | 28 | |||||||||
| Newmont Mining Corp. | 535 | 34 | |||||||||
| Nucor Corp. | 287 | 9 | |||||||||
| Steel Dynamics, Inc. | 2,892 | 29 | |||||||||
| United States Steel Corp. (f) | 100 | 2 | |||||||||
| 239 | |||||||||||
| Multi-Utilities (0.9%) | |||||||||||
| CenterPoint Energy, Inc. | 58 | 1 | |||||||||
| Consolidated Edison, Inc. | 505 | 29 | |||||||||
| Dominion Resources, Inc. | 2,879 | 146 | |||||||||
| DTE Energy Co. | 58 | 3 | |||||||||
| Integrys Energy Group, Inc. (f) | 1,062 | 52 | |||||||||
| NiSource, Inc. (f) | 58 | 1 | |||||||||
| PG&E Corp. | 935 | 40 | |||||||||
| Public Service Enterprise Group, Inc. | 969 | 32 | |||||||||
| Sempra Energy | 505 | 26 | |||||||||
| Wisconsin Energy Corp. | 655 | 20 | |||||||||
| Xcel Energy, Inc. | 969 | 24 | |||||||||
| 374 | |||||||||||
| Multiline Retail (0.5%) | |||||||||||
| Dollar General Corp. (g) | 1,659 | 63 | |||||||||
| Family Dollar Stores, Inc. | 200 | 10 | |||||||||
| JC Penney Co., Inc. (f) | 400 | 11 | |||||||||
| Kohl's Corp. | 395 | 19 | |||||||||
| Macy's, Inc. | 2,404 | 63 | |||||||||
| Nordstrom, Inc. | 261 | 12 | |||||||||
| Target Corp. | 1,004 | 49 | |||||||||
| 227 | |||||||||||
| Office Electronics (0.0%) | |||||||||||
| Xerox Corp. | 2,124 | 15 | |||||||||
| Oil, Gas & Consumable Fuels (4.1%) | |||||||||||
| Anadarko Petroleum Corp. | 2,100 | 132 | |||||||||
| Apache Corp. | 916 | 74 | |||||||||
| Chesapeake Energy Corp. | 3,706 | 95 | |||||||||
| Chevron Corp. | 2,593 | 240 | |||||||||
| Shares | Value (000) | ||||||||||
| ConocoPhillips | 2,369 | $ | 150 | ||||||||
| Consol Energy, Inc. | 1,053 | 36 | |||||||||
| Denbury Resources, Inc. (g) | 1,651 | 19 | |||||||||
| Devon Energy Corp. | 1,003 | 56 | |||||||||
| El Paso Corp. | 1,670 | 29 | |||||||||
| EOG Resources, Inc. | 615 | 44 | |||||||||
| Exxon Mobil Corp. | 5,401 | 392 | |||||||||
| Hess Corp. | 1,110 | 58 | |||||||||
| Marathon Oil Corp. | 900 | 19 | |||||||||
| Marathon Petroleum Corp. | 450 | 12 | |||||||||
| Murphy Oil Corp. | 355 | 16 | |||||||||
| Newfield Exploration Co. (g) | 477 | 19 | |||||||||
| Noble Energy, Inc. | 357 | 25 | |||||||||
| Occidental Petroleum Corp. | 1,660 | 119 | |||||||||
| Peabody Energy Corp. | 1,753 | 59 | |||||||||
| Pioneer Natural Resources Co. (f) | 477 | 31 | |||||||||
| Southwestern Energy Co. (g) | 1,349 | 45 | |||||||||
| Spectra Energy Corp. | 1,054 | 26 | |||||||||
| Valero Energy Corp. | 849 | 15 | |||||||||
| Williams Cos., Inc. (The) | 979 | 24 | |||||||||
| 1,735 | |||||||||||
| Paper & Forest Products (0.1%) | |||||||||||
| International Paper Co. | 625 | 14 | |||||||||
| MeadWestvaco Corp. | 1,449 | 36 | |||||||||
| 50 | |||||||||||
| Personal Products (0.0%) | |||||||||||
| Avon Products, Inc. | 1,001 | 20 | |||||||||
| Pharmaceuticals (3.4%) | |||||||||||
| Abbott Laboratories | 3,447 | 176 | |||||||||
| Allergan, Inc. | 1,361 | 112 | |||||||||
| Bristol-Myers Squibb Co. | 5,444 | 171 | |||||||||
| Eli Lilly & Co. (f) | 999 | 37 | |||||||||
| Hospira, Inc. (g) | 1,120 | 41 | |||||||||
| Johnson & Johnson | 5,087 | 324 | |||||||||
| Merck & Co., Inc. | 5,409 | 177 | |||||||||
| Pfizer, Inc. | 17,039 | 301 | |||||||||
| Teva Pharmaceutical Industries Ltd. ADR (Israel) | 792 | 30 | |||||||||
| Watson Pharmaceuticals, Inc. (g) | 909 | 62 | |||||||||
| 1,431 | |||||||||||
| Professional Services (0.0%) | |||||||||||
| Dun & Bradstreet Corp. | 119 | 7 | |||||||||
| Equifax, Inc. | 149 | 5 | |||||||||
| 12 | |||||||||||
| Real Estate Investment Trusts (REITs) (0.9%) | |||||||||||
| AvalonBay Communities, Inc. REIT | 239 | 27 | |||||||||
| Boston Properties, Inc. REIT (f) | 290 | 26 | |||||||||
| Equity Residential REIT | 636 | 33 | |||||||||
| HCP, Inc. REIT | 733 | 26 | |||||||||
| Health Care, Inc. REIT | 317 | 15 | |||||||||
| Host Hotels & Resorts, Inc. REIT (f) | 1,458 | 16 | |||||||||
| Kimco Realty Corp. REIT | 824 | 12 | |||||||||
| Plum Creek Timber Co., Inc. REIT (f) | 374 | 13 | |||||||||
The accompanying notes are an integral part of the financial statements.
17
2011 Annual Report
September 30, 2011
Portfolio of Investments (cont'd)
Balanced Portfolio
| Shares | Value (000) | ||||||||||
| Real Estate Investment Trusts (REITs) (cont'd) | |||||||||||
| ProLogis, Inc. REIT | 944 | $ | 23 | ||||||||
| Public Storage REIT | 275 | 31 | |||||||||
| Simon Property Group, Inc. REIT (f) | 633 | 69 | |||||||||
| Ventas, Inc. REIT | 558 | 27 | |||||||||
| Vornado Realty Trust REIT | 318 | 24 | |||||||||
| Weyerhaeuser Co. REIT | 1,137 | 18 | |||||||||
| 360 | |||||||||||
| Real Estate Management & Development (0.0%) | |||||||||||
| CBRE Group, Inc. (g) | 716 | 10 | |||||||||
| Road & Rail (0.5%) | |||||||||||
| CSX Corp. | 1,800 | 34 | |||||||||
| Norfolk Southern Corp. | 2,007 | 122 | |||||||||
| Union Pacific Corp. | 800 | 65 | |||||||||
| 221 | |||||||||||
| Semiconductors & Semiconductor Equipment (1.2%) | |||||||||||
| Advanced Micro Devices, Inc. (g) | 771 | 4 | |||||||||
| Altera Corp. | 413 | 13 | |||||||||
| Analog Devices, Inc. | 365 | 11 | |||||||||
| Applied Materials, Inc. | 3,463 | 36 | |||||||||
| Broadcom Corp., Class A (g) | 1,801 | 60 | |||||||||
| First Solar, Inc. (f)(g) | 72 | 4 | |||||||||
| Intel Corp. | 11,747 | 251 | |||||||||
| KLA-Tencor Corp. | 242 | 9 | |||||||||
| Linear Technology Corp. | 305 | 8 | |||||||||
| LSI Corp. (g) | 781 | 4 | |||||||||
| Microchip Technology, Inc. (f) | 245 | 8 | |||||||||
| Micron Technology, Inc. (g) | 1,178 | 6 | |||||||||
| NVIDIA Corp. (g) | 2,981 | 37 | |||||||||
| Texas Instruments, Inc. | 1,758 | 47 | |||||||||
| Xilinx, Inc. | 319 | 9 | |||||||||
| 507 | |||||||||||
| Software (1.9%) | |||||||||||
| Adobe Systems, Inc. (g) | 2,960 | 72 | |||||||||
| Citrix Systems, Inc. (g) | 462 | 25 | |||||||||
| Intuit, Inc. (g) | 531 | 25 | |||||||||
| Microsoft Corp. | 14,057 | 350 | |||||||||
| Oracle Corp. | 7,685 | 221 | |||||||||
| Red Hat, Inc. (g) | 1,513 | 64 | |||||||||
| Salesforce.com, Inc. (g) | 378 | 43 | |||||||||
| Symantec Corp. (g) | 1,176 | 19 | |||||||||
| 819 | |||||||||||
| Specialty Retail (1.1%) | |||||||||||
| AutoZone, Inc. (g) | 27 | 9 | |||||||||
| Bed Bath & Beyond, Inc. (g) | 368 | 21 | |||||||||
| Best Buy Co., Inc. (f) | 368 | 9 | |||||||||
| CarMax, Inc. (g) | 442 | 10 | |||||||||
| Gap, Inc. (The) | 5,287 | 86 | |||||||||
| Home Depot, Inc. | 4,005 | 132 | |||||||||
| Lowe's Cos., Inc. | 1,794 | 35 | |||||||||
| Ltd. Brands, Inc. | 412 | 16 | |||||||||
| O'Reilly Automotive, Inc. (g) | 234 | 16 | |||||||||
| Shares | Value (000) | ||||||||||
| Ross Stores, Inc. | 134 | $ | 10 | ||||||||
| Staples, Inc. | 1,221 | 16 | |||||||||
| Talbots, Inc. (f)(g) | 13,017 | 35 | |||||||||
| Tiffany & Co. | 234 | 14 | |||||||||
| TJX Cos., Inc. | 595 | 33 | |||||||||
| 442 | |||||||||||
| Textiles, Apparel & Luxury Goods (0.4%) | |||||||||||
| Coach, Inc. | 711 | 37 | |||||||||
| NIKE, Inc., Class B | 495 | 42 | |||||||||
| Ralph Lauren Corp. | 119 | 16 | |||||||||
| VF Corp. | 546 | 66 | |||||||||
| 161 | |||||||||||
| Thrifts & Mortgage Finance (0.0%) | |||||||||||
| Hudson City Bancorp, Inc. | 400 | 2 | |||||||||
| People's United Financial, Inc. | 1,100 | 13 | |||||||||
| 15 | |||||||||||
| Tobacco (1.1%) | |||||||||||
| Altria Group, Inc. | 3,666 | 98 | |||||||||
| Lorillard, Inc. | 300 | 33 | |||||||||
| Philip Morris International, Inc. | 3,883 | 242 | |||||||||
| Reynolds American, Inc. | 2,231 | 84 | |||||||||
| 457 | |||||||||||
| Wireless Telecommunication Services (0.2%) | |||||||||||
| American Tower Corp., Class A (g) | 993 | 54 | |||||||||
| MetroPCS Communications, Inc. (g) | 600 | 5 | |||||||||
| Sprint Nextel Corp. (g) | 2,982 | 9 | |||||||||
| 68 | |||||||||||
| Total Common Stocks (Cost $23,504) | 20,571 | ||||||||||
| Convertible Preferred Stocks (0.2%) | |||||||||||
| Alternative Energy (0.2%) | |||||||||||
| Better Place, Inc. (g)(h)(i) (Cost $84) | 27,888 | 84 | |||||||||
| Investment Companies (0.8%) | |||||||||||
| iShares MSCI EMU Index Fund (f) | 200 | 5 | |||||||||
| Morgan Stanley Institutional Fund, Inc. — Emerging Markets Portfolio (See Note G-2) | 4,307 | 93 | |||||||||
| Technology Select Sector SPDR Fund (f) | 9,300 | 219 | |||||||||
| Total Investment Companies (Cost $369) | 317 | ||||||||||
| No. of Rights | |||||||||||
| Right (0.0%) | |||||||||||
| Pharmaceuticals (0.0%) | |||||||||||
| Sanofi (France) (g) (Cost $—@) | 54 | — | @ | ||||||||
| Shares | |||||||||||
| Short-Term Investments (12.8%) | |||||||||||
| Securities held as Collateral on Loaned Securities (4.5%) | |||||||||||
| Investment Company (4.2%) | |||||||||||
| Morgan Stanley Institutional Liquidity Funds — Money Market Portfolio — Institutional Class (See Note G-2) | 1,747,597 | 1,748 | |||||||||
The accompanying notes are an integral part of the financial statements.
18
2011 Annual Report
September 30, 2011
Portfolio of Investments (cont'd)
Balanced Portfolio
| Face Amount (000) | Value (000) | ||||||||||
| Repurchase Agreements (0.3%) | |||||||||||
| Merrill Lynch & Co., Inc., (0.10%, dated 9/30/11, due 10/3/11; proceeds $45; fully collateralized by a U.S. Government Agency; Government National Mortgage Association 4.00% due 5/16/38; valued at $46) | $ | 45 | $ | 45 | |||||||
| Nomura Holdings, Inc., (0.14%, dated 9/30/11, due 10/3/11; proceeds $93; fully collateralized by U.S. Government Agencies; Federal Home Loan Mortgage Corporation 4.00% due 7/1/26; Federal National Mortgage Association 3.00% due 1/1/26; valued at $95) | 93 | 93 | |||||||||
| 138 | |||||||||||
| Total Securities held as Collateral on Loaned Securities (Cost $1,886) | 1,886 | ||||||||||
| Shares | |||||||||||
| Investment Company (5.3%) | |||||||||||
| Morgan Stanley Institutional Liquidity Funds — Money Market Portfolio — Institutional Class (See Note G-2) | 2,207,555 | 2,208 | |||||||||
| Face Amount (000) | |||||||||||
| U.S. Treasury Securities (3.0%) | |||||||||||
| U.S. Treasury Bills, | |||||||||||
| 0.01%, 10/13/11 (j) | $ | 900 | 900 | ||||||||
| 0.03%, 11/3/11 (j) | 350 | 350 | |||||||||
| 1,250 | |||||||||||
| Total Short-Term Investments (Cost $5,344) | 5,344 | ||||||||||
| Total Investments (105.5%) (Cost $46,882) Including $2,122 of Securities Loaned (k) | 44,349 | ||||||||||
| Liabilities in Excess of Other Assets (-5.5%) | (2,300 | ) | |||||||||
| Net Assets (100.0%) | $ | 42,049 | |||||||||
(a) Security is subject to delayed delivery.
(b) 144A security — Certain conditions for public sale may exist. Unless otherwise noted, these securities are deemed to be liquid.
(c) Variable/Floating Rate Security — Interest rate changes on these instruments are based on changes in a designated base rate. The rates shown are those in effect on September 30, 2011.
(d) Inverse Floating Rate Security — Interest rate fluctuates with an inverse relationship to an associated interest rate. Indicated rate is the effective rate at September 30, 2011.
(e) When-issued security.
(f) All or a portion of this security was on loan at September 30, 2011.
(g) Non-income producing security.
(h) Security has been deemed illiquid at September 30, 2011.
(i) At September 30, 2011, the Portfolio held a fair valued security valued at approximately $84,000, representing 0.2% of net assets. This security has been fair valued as determined in good faith under procedures established by and under the general supervision of the Fund's Trustees.
(j) Rate shown is the yield to maturity at September 30, 2011.
(k) Securities are available for collateral in connection with securities purchased on a forward commitment basis, open foreign currency exchange contracts, futures contracts and swap agreements.
@ Value is less than $500.
ADR American Depositary Receipt.
FDIC Federal Deposit Insurance Corporation.
IO Interest Only.
MTN Medium Term Note.
REMIC Real Estate Mortgage Investment Conduit.
TBA To Be Announced.
Foreign Currency Exchange Contracts Information:
The Portfolio had the following foreign currency exchange contracts open at period end:
| Counterparty | Currency to Deliver (000) | Value (000) | Settlement Date | In Exchange For (000) | Value (000) | Unrealized Appreciation (Depreciation) (000) | |||||||||||||||||||||
| JPMorgan Chase Bank | CHF | 15 | $ | 16 | 10/14/11 | USD | 18 | $ | 18 | $ | 2 | ||||||||||||||||
| JPMorgan Chase Bank | CLP | 34,100 | 66 | 10/14/11 | USD | 71 | 71 | 5 | |||||||||||||||||||
| JPMorgan Chase Bank | JPY | 3,600 | 47 | 10/14/11 | USD | 47 | 47 | — | @ | ||||||||||||||||||
| JPMorgan Chase Bank | USD | 19 | 19 | 10/14/11 | JPY | 1,450 | 19 | (— | @) | ||||||||||||||||||
| UBS AG | CHF | 113 | 125 | 10/14/11 | USD | 144 | 144 | 19 | |||||||||||||||||||
| UBS AG | EUR | 34 | 46 | 10/14/11 | USD | 49 | 49 | 3 | |||||||||||||||||||
| UBS AG | JPY | 3,700 | 48 | 10/14/11 | USD | 48 | 48 | — | @ | ||||||||||||||||||
| UBS AG | NOK | 134 | 23 | 10/14/11 | USD | 25 | 25 | 2 | |||||||||||||||||||
| UBS AG | SEK | 123 | 18 | 10/14/11 | USD | 19 | 19 | 1 | |||||||||||||||||||
| UBS AG | SEK | 457 | 66 | 10/14/11 | USD | 67 | 67 | 1 | |||||||||||||||||||
| UBS AG | SEK | 190 | 28 | 10/14/11 | USD | 28 | 28 | — | @ | ||||||||||||||||||
| UBS AG | SGD | 90 | 68 | 10/14/11 | USD | 72 | 72 | 4 | |||||||||||||||||||
| UBS AG | USD | 70 | 70 | 10/14/11 | CHF | 60 | 66 | (4 | ) | ||||||||||||||||||
| UBS AG | USD | 37 | 37 | 10/14/11 | CHF | 30 | 33 | (4 | ) | ||||||||||||||||||
The accompanying notes are an integral part of the financial statements.
19
2011 Annual Report
September 30, 2011
Portfolio of Investments (cont'd)
Balanced Portfolio
Foreign Currency Exchange Contracts Information: (cont'd)
| Counterparty | Currency to Deliver (000) | Value (000) | Settlement Date | In Exchange For (000) | Value (000) | Unrealized Appreciation (Depreciation) (000) | |||||||||||||||||||||
| UBS AG | USD | 72 | $ | 72 | 10/14/11 | CLP | 34,100 | $ | 65 | $ | (7 | ) | |||||||||||||||
| UBS AG | USD | 48 | 48 | 10/14/11 | EUR | 34 | 46 | (2 | ) | ||||||||||||||||||
| UBS AG | USD | 48 | 48 | 10/14/11 | JPY | 3,700 | 48 | (— | @) | ||||||||||||||||||
| UBS AG | USD | 33 | 33 | 10/14/11 | NOK | 195 | 33 | (— | @) | ||||||||||||||||||
| UBS AG | USD | 118 | 118 | 10/14/11 | NOK | 644 | 110 | (8 | ) | ||||||||||||||||||
| UBS AG | USD | 91 | 91 | 10/14/11 | SEK | 580 | 84 | (7 | ) | ||||||||||||||||||
| UBS AG | USD | 74 | 74 | 10/14/11 | SGD | 90 | 68 | (6 | ) | ||||||||||||||||||
| Bank of America NA | USD | 470 | 470 | 10/20/11 | CAD | 467 | 445 | (25 | ) | ||||||||||||||||||
| Deutsche Bank AG London | AUD | 848 | 820 | 10/20/11 | USD | 871 | 871 | 51 | |||||||||||||||||||
| Deutsche Bank AG London | AUD | 460 | 444 | 10/20/11 | USD | 445 | 445 | 1 | |||||||||||||||||||
| Deutsche Bank AG London | CNY | 1,243 | 195 | 10/20/11 | USD | 195 | 195 | — | @ | ||||||||||||||||||
| Deutsche Bank AG London | EUR | 121 | 162 | 10/20/11 | USD | 167 | 167 | 5 | |||||||||||||||||||
| Deutsche Bank AG London | EUR | 149 | 200 | 10/20/11 | USD | 202 | 202 | 2 | |||||||||||||||||||
| Deutsche Bank AG London | JPY | 5,340 | 69 | 10/20/11 | USD | 69 | 69 | — | @ | ||||||||||||||||||
| Goldman Sachs International | EUR | 152 | 203 | 10/20/11 | USD | 203 | 203 | — | @ | ||||||||||||||||||
| JPMorgan Chase Bank | NOK | 394 | 67 | 10/20/11 | USD | 70 | 70 | 3 | |||||||||||||||||||
| JPMorgan Chase Bank | SEK | 426 | 62 | 10/20/11 | USD | 64 | 64 | 2 | |||||||||||||||||||
| JPMorgan Chase Bank | SGD | 394 | 301 | 10/20/11 | USD | 313 | 313 | 12 | |||||||||||||||||||
| JPMorgan Chase Bank | USD | 1,266 | 1,266 | 10/20/11 | CNY | 8,071 | 1,264 | (2 | ) | ||||||||||||||||||
| Mellon Bank | SGD | 34 | 26 | 10/20/11 | USD | 27 | 27 | 1 | |||||||||||||||||||
| Royal Bank of Scotland | MXN | 2,151 | 155 | 10/20/11 | USD | 163 | 163 | 8 | |||||||||||||||||||
| Royal Bank of Scotland | USD | 62 | 62 | 10/20/11 | MXN | 865 | 62 | (— | @) | ||||||||||||||||||
| UBS AG | BRL | 80 | 42 | 10/20/11 | USD | 46 | 46 | 4 | |||||||||||||||||||
| UBS AG | CAD | 232 | 221 | 10/20/11 | USD | 234 | 234 | 13 | |||||||||||||||||||
| UBS AG | EUR | 363 | 486 | 10/20/11 | USD | 500 | 500 | 14 | |||||||||||||||||||
| UBS AG | GBP | 303 | 472 | 10/20/11 | USD | 476 | 476 | 4 | |||||||||||||||||||
| UBS AG | KRW | 443,820 | 376 | 10/20/11 | USD | 400 | 400 | 24 | |||||||||||||||||||
| UBS AG | NZD | 310 | 236 | 10/20/11 | USD | 255 | 255 | 19 | |||||||||||||||||||
| UBS AG | SGD | 57 | 43 | 10/20/11 | USD | 45 | 45 | 2 | |||||||||||||||||||
| UBS AG | USD | 90 | 90 | 10/20/11 | CHF | 79 | 88 | (2 | ) | ||||||||||||||||||
| UBS AG | USD | 46 | 46 | 10/20/11 | GBP | 30 | 46 | (— | @) | ||||||||||||||||||
| UBS AG | USD | 332 | 332 | 10/20/11 | JPY | 25,369 | 329 | (3 | ) | ||||||||||||||||||
| UBS AG | USD | 42 | 42 | 10/20/11 | KRW | 50,394 | 43 | 1 | |||||||||||||||||||
| UBS AG | USD | 95 | 95 | 10/20/11 | MXN | 1,251 | 90 | (5 | ) | ||||||||||||||||||
| UBS AG | USD | 27 | 27 | 10/20/11 | NZD | 35 | 27 | (— | @) | ||||||||||||||||||
| UBS AG | USD | 54 | 54 | 10/20/11 | SGD | 71 | 54 | (— | @) | ||||||||||||||||||
| $ | 8,225 | $ | 8,353 | $ | 128 | ||||||||||||||||||||||
Futures Contracts:
The Portfolio had the following futures contracts open at period end:
| Number of Contracts | Value (000) | Expiration Date | Unrealized Appreciation (Depreciation) (000) | ||||||||||||||||
| Long: | |||||||||||||||||||
| S&P 500 E-Mini Index | 65 | $ | 3,660 | Dec-11 | $ | (74 | ) | ||||||||||||
| U.S. Treasury 2 yr. Note | 12 | 2,642 | Dec-11 | (1 | ) | ||||||||||||||
| U.S. Treasury 5 yr. Note | 4 | 490 | Dec-11 | (1 | ) | ||||||||||||||
| U.S. Treasury 30 yr. Bond | 1 | 143 | Dec-11 | 7 | |||||||||||||||
Futures Contracts: (cont'd)
Number of Contracts | Value (000) | Expiration Date | Unrealized Appreciation (Depreciation) (000) | ||||||||||||||||
| Short: | |||||||||||||||||||
| E-Mini MSCI Emerging Market Index | 9 | $ | (378 | ) | Dec-11 | $ | 23 | ||||||||||||
| Euro STOXX 50 Index | 2 | (58 | ) | Dec-11 | (4 | ) | |||||||||||||
| U.S. Treasury 2 yr. Note | 1 | (220 | ) | Dec-11 | — | @ | |||||||||||||
| U.S. Treasury 10 yr. Note | 45 | (5,854 | ) | Dec-11 | (22 | ) | |||||||||||||
| $ | (72 | ) | |||||||||||||||||
The accompanying notes are an integral part of the financial statements.
20
2011 Annual Report
September 30, 2011
Portfolio of Investments (cont'd)
Balanced Portfolio
Interest Rate Swap Agreements
The Portfolio had the following interest rate swap agreements open at period end:
| Swap Counterparty | Floating Rate Index | Pay/Receive Floating Rate | Fixed Rate | Termination Date | Notional Amount (000) | Unrealized Appreciation (Depreciation) (000) | |||||||||||||||||||||
| Bank of America | 6 Month EURIBOR | Pay | 4.26 | % | 8/18/26 | EUR | 910 | $ | 33 | ||||||||||||||||||
| Bank of America | 3 Month LIBOR | Receive | 4.35 | 8/18/26 | $ | 1,220 | (44 | ) | |||||||||||||||||||
| Bank of America | 6 Month EURIBOR | Receive | 3.61 | 8/18/31 | EUR | 1,150 | (29 | ) | |||||||||||||||||||
| Bank of America | 3 Month LIBOR | Pay | 4.15 | 8/18/31 | $ | 1,515 | 47 | ||||||||||||||||||||
| Barclays Capital | 3 Month STIBOR | Pay | 2.76 | 7/29/12 | SEK | 26,940 | 20 | ||||||||||||||||||||
| Barclays Capital | 3 Month STIBOR | Pay | 2.30 | 9/12/12 | 13,470 | 2 | |||||||||||||||||||||
| Barclays Capital | 3 Month STIBOR | Receive | 2.89 | 7/29/13 | 31,576 | (45 | ) | ||||||||||||||||||||
| Credit Suisse | 3 Month CDOR | Pay | 4.07 | 9/8/20 | CAD | 604 | 23 | ||||||||||||||||||||
| Credit Suisse | 3 Month CDOR | Pay | 4.12 | 9/8/20 | 435 | 18 | |||||||||||||||||||||
| Goldman Sachs | 3 Month CDOR | Receive | 2.70 | 7/15/15 | 2,400 | (50 | ) | ||||||||||||||||||||
| $ | (25 | ) | |||||||||||||||||||||||||
@ Value is less than $500.
CDOR Canadian Dealer Offered Rate.
EURIBOR Euro Interbank Offered Rate.
LIBOR London Interbank Offered Rate.
STIBOR Stockholm Interbank Offered Rate.
AUD — Australian Dollar
BRL — Brazilian Real
CAD — Canadian Dollar
CHF — Swiss Franc
CLP — Chilean Peso
CNY — Chinese Yuan Renminbi
EUR — Euro
GBP — British Pound
JPY — Japanese Yen
KRW — South Korean Won
MXN — Mexican New Peso
NOK — Norwegian Krone
NZD — New Zealand Dollar
SEK — Swedish Krona
SGD — Singapore Dollar
USD — United States Dollar
Fair Value Measurement Information:
The following is a summary of the inputs used to value the Portfolio's net assets as of September 30, 2011. (See Note A-6 to the financial statements for further information regarding fair value measurement.)
| Investment Type | Level 1 Unadjusted quoted prices (000) | Level 2 Other significant observable inputs (000) | Level 3 Significant unobservable inputs (000) | Total (000) | |||||||||||||||
| Assets: | |||||||||||||||||||
| Fixed Income Securities | |||||||||||||||||||
| Agency Adjustable Rate Mortgage | $ | — | $ | 67 | $ | — | $ | 67 | |||||||||||
| Agency Bond — Banking (FDIC Guaranteed) | — | 460 | — | 460 | |||||||||||||||
Fair Value Measurement Information: (cont'd)
| Investment Type | Level 1 Unadjusted quoted prices (000) | Level 2 Other significant observable inputs (000) | Level 3 Significant unobservable inputs (000) | Total (000) | |||||||||||||||
| Fixed Income Securities (cont'd) | |||||||||||||||||||
| Agency Fixed Rate Mortgages | $ | — | $ | 4,543 | $ | — | $ | 4,543 | |||||||||||
| Asset-Backed Securities | — | 417 | — | 417 | |||||||||||||||
| Collateralized Mortgage Obligations — Agency Collateral Series | — | 1,097 | — | 1,097 | |||||||||||||||
| Commercial Mortgage Backed Securities | — | 730 | — | 730 | |||||||||||||||
| Corporate Bonds | — | 5,433 | — | 5,433 | |||||||||||||||
The accompanying notes are an integral part of the financial statements.
21
2011 Annual Report
September 30, 2011
Portfolio of Investments (cont'd)
Balanced Portfolio
Fair Value Measurement Information: (cont'd)
| Investment Type | Level 1 Unadjusted quoted prices (000) | Level 2 Other significant observable inputs (000) | Level 3 Significant unobservable inputs (000) | Total (000) | |||||||||||||||
| Fixed Income Securities (cont'd) | |||||||||||||||||||
| Mortgages — Other | $ | — | $ | 1,236 | $ | — | $ | 1,236 | |||||||||||
| Municipal Bonds | — | 229 | — | 229 | |||||||||||||||
| U.S. Agency Securities | — | 625 | — | 625 | |||||||||||||||
| U.S. Treasury Securities | — | 3,196 | — | 3,196 | |||||||||||||||
| Total Fixed Income Securities | — | 18,033 | — | 18,033 | |||||||||||||||
| Common Stocks | |||||||||||||||||||
| Aerospace & Defense | 635 | — | — | 635 | |||||||||||||||
| Air Freight & Logistics | 168 | — | — | 168 | |||||||||||||||
| Airlines | 10 | — | — | 10 | |||||||||||||||
| Auto Components | 93 | — | — | 93 | |||||||||||||||
| Automobiles | 25 | — | — | 25 | |||||||||||||||
| Beverages | 425 | — | — | 425 | |||||||||||||||
| Biotechnology | 207 | — | — | 207 | |||||||||||||||
| Capital Markets | 333 | — | — | 333 | |||||||||||||||
| Chemicals | 351 | — | — | 351 | |||||||||||||||
| Commercial Banks | 535 | — | — | 535 | |||||||||||||||
| Commercial Services & Supplies | 105 | — | — | 105 | |||||||||||||||
| Communications Equipment | 341 | — | — | 341 | |||||||||||||||
| Computers & Peripherals | 1,043 | — | — | 1,043 | |||||||||||||||
| Construction & Engineering | 93 | — | — | 93 | |||||||||||||||
| Consumer Finance | 129 | — | — | 129 | |||||||||||||||
| Containers & Packaging | 7 | — | — | 7 | |||||||||||||||
| Distributors | 10 | — | — | 10 | |||||||||||||||
| Diversified Consumer Services | 35 | — | — | 35 | |||||||||||||||
| Diversified Financial Services | 699 | — | — | 699 | |||||||||||||||
| Diversified Telecommunication Services | 614 | — | — | 614 | |||||||||||||||
| Electric Utilities | 404 | — | — | 404 | |||||||||||||||
| Electrical Equipment | 74 | — | — | 74 | |||||||||||||||
| Electronic Equipment, Instruments & Components | 134 | — | — | 134 | |||||||||||||||
| Energy Equipment & Services | 558 | — | — | 558 | |||||||||||||||
| Food & Staples Retailing | 525 | — | — | 525 | |||||||||||||||
| Food Products | 508 | — | — | 508 | |||||||||||||||
| Health Care Equipment & Supplies | 311 | — | — | 311 | |||||||||||||||
| Health Care Providers & Services | 527 | — | — | 527 | |||||||||||||||
| Health Care Technology | 27 | — | — | 27 | |||||||||||||||
| Hotels, Restaurants & Leisure | 381 | — | — | 381 | |||||||||||||||
| Household Durables | 51 | — | — | 51 | |||||||||||||||
| Household Products | 537 | — | — | 537 | |||||||||||||||
Fair Value Measurement Information: (cont'd)
| Investment Type | Level 1 Unadjusted quoted prices (000) | Level 2 Other significant observable inputs (000) | Level 3 Significant unobservable inputs (000) | Total (000) | |||||||||||||||
| Common Stocks (cont'd) | |||||||||||||||||||
| Independent Power Producers & Energy Traders | $ | 55 | $ | — | $ | — | $ | 55 | |||||||||||
| Industrial Conglomerates | 418 | — | — | 418 | |||||||||||||||
| Information Technology Services | 656 | — | — | 656 | |||||||||||||||
| Insurance | 744 | — | — | 744 | |||||||||||||||
| Internet & Catalog Retail | 135 | — | — | 135 | |||||||||||||||
| Internet Software & Services | 342 | — | — | 342 | |||||||||||||||
| Leisure Equipment & Products | 24 | — | — | 24 | |||||||||||||||
| Life Sciences Tools & Services | 76 | — | — | 76 | |||||||||||||||
| Machinery | 412 | — | — | 412 | |||||||||||||||
| Media | 651 | — | — | 651 | |||||||||||||||
| Metals & Mining | 239 | — | — | 239 | |||||||||||||||
| Multi-Utilities | 374 | — | — | 374 | |||||||||||||||
| Multiline Retail | 227 | — | — | 227 | |||||||||||||||
| Office Electronics | 15 | — | — | 15 | |||||||||||||||
| Oil, Gas & Consumable Fuels | 1,735 | — | — | 1,735 | |||||||||||||||
| Paper & Forest Products | 50 | — | — | 50 | |||||||||||||||
| Personal Products | 20 | — | — | 20 | |||||||||||||||
| Pharmaceuticals | 1,431 | — | — | 1,431 | |||||||||||||||
| Professional Services | 12 | — | — | 12 | |||||||||||||||
| Real Estate Investment Trusts (REITs) | 360 | — | — | 360 | |||||||||||||||
| Real Estate Management & Development | 10 | — | — | 10 | |||||||||||||||
| Road & Rail | 221 | — | — | 221 | |||||||||||||||
| Semiconductors & Semiconductor Equipment | 507 | — | — | 507 | |||||||||||||||
| Software | 819 | — | — | 819 | |||||||||||||||
| Specialty Retail | 442 | — | — | 442 | |||||||||||||||
| Textiles, Apparel & Luxury Goods | 161 | — | — | 161 | |||||||||||||||
| Thrifts & Mortgage Finance | 15 | — | — | 15 | |||||||||||||||
| Tobacco | 457 | — | — | 457 | |||||||||||||||
| Wireless Telecommunication Services | 68 | — | — | 68 | |||||||||||||||
| Total Common Stocks | 20,571 | — | — | 20,571 | |||||||||||||||
| Convertible Preferred Stocks | — | — | 84 | 84 | |||||||||||||||
| Investment Companies | 317 | — | — | 317 | |||||||||||||||
| Right | — | @ | — | — | — | @ | |||||||||||||
| Short-Term Investments | |||||||||||||||||||
| Investment Company | 3,956 | — | — | 3,956 | |||||||||||||||
| Repurchase Agreements | — | 138 | — | 138 | |||||||||||||||
The accompanying notes are an integral part of the financial statements.
22
2011 Annual Report
September 30, 2011
Portfolio of Investments (cont'd)
Balanced Portfolio
Fair Value Measurement Information: (cont'd)
| Investment Type | Level 1 Unadjusted quoted prices (000) | Level 2 Other significant observable inputs (000) | Level 3 Significant unobservable inputs (000) | Total (000) | |||||||||||||||
| Short-Term Investments (cont'd) | |||||||||||||||||||
| U.S. Treasury Securities | $ | — | $ | 1,250 | $ | — | $ | 1,250 | |||||||||||
| Total Short-Term Investments | 3,956 | 1,388 | — | 5,344 | |||||||||||||||
| Foreign Currency Exchange Contracts | — | 203 | — | 203 | |||||||||||||||
| Futures Contracts | 30 | — | — | 30 | |||||||||||||||
| Interest Rate Swap Agreements | — | 143 | — | 143 | |||||||||||||||
| Total Assets | 24,874 | 19,767 | 84 | 44,725 | |||||||||||||||
| Liabilities: | |||||||||||||||||||
| Foreign Currency Exchange Contracts | — | (75 | ) | — | (75 | ) | |||||||||||||
| Futures Contracts | (102 | ) | — | — | (102 | ) | |||||||||||||
| Interest Rate Swap Agreements | — | (168 | ) | — | (168 | ) | |||||||||||||
| Total Liabilities | (102 | ) | (243 | ) | — | (345 | ) | ||||||||||||
| Total | $ | 24,772 | $ | 19,524 | $ | 84 | $ | 44,380 | |||||||||||
Transfers between investment levels may occur as the markets fluctuate and/or the availability of data used in an investment's valuation changes. The Portfolio recognizes transfers between the levels as of the end of the period. As of September 30, 2011, the Portfolio did not have any significant investments transfer between investment levels.
Fair Value Measurement Information: (cont'd)
Following is a reconciliation of investments in which significant unobservable inputs (Level 3) were used in determining fair value.
| Convertible Preferred Stocks (000) | |||||||
| Beginning Balance | $ | 84 | |||||
| Purchases | — | ||||||
| Sales | — | ||||||
| Amortization of discount | — | ||||||
| Transfers in | — | ||||||
| Transfers out | — | ||||||
| Change in unrealized appreciation/depreciation | — | ||||||
| Realized gains (losses) | — | ||||||
| Ending Balance | $ | 84 | |||||
| Net change in unrealized appreciation/depreciation from investments still held as of September 30, 2011 | $ | — | |||||
@ Value is less than $500.
The accompanying notes are an integral part of the financial statements.
23
2011 Annual Report
September 30, 2011
Investment Overview (unaudited)
Mid Cap Growth Portfolio
Performance
For the fiscal year ended September 30, 2011, the Portfolio's Class I had a total return based on net asset value and reinvestment of distributions per share of 0.47%, net of fees. The Portfolio's Class I underperformed against its benchmark the Russell Midcap® Growth Index (the "Index") which returned 0.80%.
Factors Affecting Performance
• The stock market had been moving slowly upward in the first half of the 12-month period, with a slight pullback in March following news of political turmoil in the Middle East (which caused oil prices to rise) and a major natural disaster in Japan (which prompted fears of supply chain disruptions for the auto and electronics industries). However, the remainder of the period saw considerable volatility which negated the market's gains over the first six months. Delays in approving an increase for the U.S. debt ceiling followed by the downgrade of U.S. bonds by credit rating agency Standard & Poor's led to a major sell-off in the stock market in July and August. The European sovereign debt crisis also appeared to worsen during the period and its policy solutions continued to face significant political hurdles. Concerns about the fragile state of economic growth in the U.S. and globally weighed on the market for the remainder of the period.
• Within the Portfolio, the consumer discretionary sector detracted from performance relative to the Index. Holdings in an internet video streaming company, an online travel booking provider (not represented in the Index) and a cosmetics company (also not represented in the Index) had disappointing results. An underweight relative to the Index in this sector also had a negative effect on relative results.
• An underweight in the consumer staples sector also caused the Portfolio to lag versus the Index. Our holdings performed well for the most part but the Portfolio lacked exposure to other consumer staples stocks in the Index that also had strong gains during the period.
• Stock selection in the technology sector hampered performance, primarily due to several holdings in the computer services software and systems industry (two of which are not represented in the Index).
• However, stock selection in the producer durables sector was more favorable for performance. A number of holdings performed well within this sector including some in back office support, human resources and consulting; engineering and contracting services; and international trade and diversified logistics.
• Also bolstering relative gains were stock selection and an underweight in health care. The Portfolio benefited from holdings in the medical and dental instruments and supplies industry and a holding in a medical equipment stock.
Management Strategies
• The Growth Team seeks high quality companies, which we define primarily as those with sustainable competitive advantages. We manage focused portfolios that are highly differentiated from the benchmark, with securities weighted on our assessment of the quality of the company and our conviction. Our longer-term focus has typically resulted in lower turnover than many of our peers. The value added or detracted in any period of time will typically result from stock selection, given our philosophy and process.

* Minimum Investment
In accordance with SEC regulations, the Portfolio's performance shown assumes that all recurring fees (including management fees) were deducted and all dividends and distributions were reinvested. The performance of Class P shares will vary from the Class I shares based upon their different inception dates and will be negatively impacted by additional fees assessed to that class.
24
2011 Annual Report
September 30, 2011
Investment Overview (unaudited) (cont'd)
Mid Cap Growth Portfolio
Performance Compared to the Russell Midcap® Growth Index(1) and the Lipper Multi-Cap Growth Funds Index(2)
| Period Ended September 30, 2011 Total Returns(3) | |||||||||||||||||||
| Average Annual | |||||||||||||||||||
| One Year | Five Years | Ten Years | Since Inception(6) | ||||||||||||||||
| Portfolio — Class I Shares w/o sales charges(4) | 0.47 | % | 6.21 | % | 8.69 | % | 12.57 | % | |||||||||||
| Russell Midcap® Growth Index | 0.80 | 1.64 | 6.70 | 8.88 | |||||||||||||||
| Lipper Multi-Cap Growth Funds Index | 0.70 | 0.80 | 3.84 | 7.56 | |||||||||||||||
| Portfolio — Class P Shares w/o sales charges(5) | 0.22 | 5.94 | 8.42 | 9.28 | |||||||||||||||
| Russell Midcap® Growth Index | 0.80 | 1.64 | 6.70 | 5.59 | |||||||||||||||
| Lipper Multi-Cap Growth Funds Index | 0.70 | 0.80 | 3.84 | 3.78 | |||||||||||||||
Performance data quoted represents past performance, which is no guarantee of future results, and current performance may be lower or higher than the figures shown. Performance assumes that all dividends and distributions, if any, were reinvested. For the most recent month-end performance figures, please visit www.morganstanley.com/im. Investment returns and principal value will fluctuate so that Portfolio shares, when redeemed, may be worth more or less than their original cost. Total returns do not reflect the deduction of taxes that a shareholder would pay on Portfolio distributions or the redemption of Portfolio shares. Performance of share classes will vary due to differences in expenses.
(1) The Russell Midcap® Growth Index measures the performance of the mid-cap growth segment of the U.S. equity universe. It includes those Russell Midcap® Index companies with higher price-to-book ratios and higher forecasted growth values. The Russell Midcap® Index is a subset of the Russell 1000® Index and includes approximately 800 of the smallest securities in the Russell 1000® Index, which in turn consists of approximately 1,000 of the largest U.S. securities based on a combination of market capitalization and current index membership. The Index is unmanaged and its returns do not include any sales charges or fees. Such costs would lower performance. It is not possible to invest directly in an index.
(2) The Lipper Multi-Cap Growth Funds Index is an equally weighted performance index of the largest qualifying funds (based on net assets) in the Lipper Multi-Cap Growth Funds classification. The index, which is adjusted for capital gains distributions and income dividends, is unmanaged and should not be considered an investment. There are currently 30 funds represented in this Index. As of the date of this report, the Portfolio was in the Lipper Multi-Cap Growth Funds classification.
(3) Total returns for the Portfolio reflect expenses waived and/or reimbursed, if applicable, by the Adviser. Without such waivers and/or reimbursements, total returns would have been lower. Fee waivers and/or reimbursements are expected to continue until such time that the Fund's Board of Trustees acts to discontinue such waivers and/or reimbursements.
(4) Commenced operations on March 30, 1990.
(5) Commenced operations on January 31, 1997.
(6) For comparative purposes, average annual since inception returns listed for the Indexes refer to the inception date or initial offering of the respective share class of the Portfolio, not the inception of the Indexes.
Portfolio Composition
| Classification | Percentage of Total Investments | ||||||
| Other* | 56.3 | % | |||||
| Computer Services, Software & Systems | 12.4 | ||||||
| Diversified Retail | 9.0 | ||||||
| Pharmaceuticals | 6.5 | ||||||
| Commercial Services | 5.6 | ||||||
| Communications Technology | 5.2 | ||||||
| Financial Data & Systems | 5.0 | ||||||
| Total Investments | 100.0 | % | |||||
* Industries representing less than 5% of total investments.
25
2011 Annual Report
September 30, 2011
Portfolio of Investments
Mid Cap Growth Portfolio
| Shares | Value (000) | ||||||||||
| Common Stocks (93.3%) | |||||||||||
| Air Transport (2.1%) | |||||||||||
| Expeditors International of Washington, Inc. | 3,260,949 | $ | 132,232 | ||||||||
| Alternative Energy (3.4%) | |||||||||||
| Range Resources Corp. | 2,221,773 | 129,885 | |||||||||
| Ultra Petroleum Corp. (a) | 3,231,940 | 89,589 | |||||||||
| 219,474 | |||||||||||
| Asset Management & Custodian (0.5%) | |||||||||||
| Greenhill & Co., Inc. | 1,164,594 | 33,296 | |||||||||
| Biotechnology (3.5%) | |||||||||||
| IDEXX Laboratories, Inc. (a) | 1,389,959 | 95,865 | |||||||||
| Illumina, Inc. (a) | 3,189,436 | 130,512 | |||||||||
| 226,377 | |||||||||||
| Cement (1.0%) | |||||||||||
| Martin Marietta Materials, Inc. | 963,957 | 60,941 | |||||||||
| Chemicals: Diversified (2.5%) | |||||||||||
| Intrepid Potash, Inc. (a) | 3,382,607 | 84,126 | |||||||||
| Rockwood Holdings, Inc. (a) | 2,231,710 | 75,186 | |||||||||
| 159,312 | |||||||||||
| Commercial Services (5.6%) | |||||||||||
| Gartner, Inc. (a) | 2,790,883 | 97,318 | |||||||||
| Intertek Group PLC (United Kingdom) | 3,788,642 | 108,626 | |||||||||
| Leucadia National Corp. | 3,668,727 | 83,207 | |||||||||
| Weight Watchers International, Inc. | 1,147,409 | 66,836 | |||||||||
| 355,987 | |||||||||||
| Communications Technology (5.3%) | |||||||||||
| Millicom International Cellular SA SDR (Sweden) | 778,840 | 77,999 | |||||||||
| Motorola Solutions, Inc. | 6,161,217 | 258,155 | |||||||||
| 336,154 | |||||||||||
| Computer Services, Software & Systems (12.4%) | |||||||||||
| Akamai Technologies, Inc. (a) | 3,608,607 | 71,739 | |||||||||
| Alibaba.com Ltd. (China) (b) | 34,156,500 | 31,521 | |||||||||
| Citrix Systems, Inc. (a) | 850,068 | 46,354 | |||||||||
| IHS, Inc., Class A (a) | 1,264,222 | 94,576 | |||||||||
| LinkedIn Corp., Class A (a) | 1,089,121 | 85,039 | |||||||||
| Red Hat, Inc. (a) | 3,776,776 | 159,607 | |||||||||
| Renren, Inc. ADR (China) (a) | 5,146,084 | 26,245 | |||||||||
| Salesforce.com, Inc. (a) | 1,134,441 | 129,644 | |||||||||
| Solera Holdings, Inc. | 2,938,297 | 148,384 | |||||||||
| 793,109 | |||||||||||
| Computer Technology (3.0%) | |||||||||||
| NVIDIA Corp. (a) | 1,497,660 | 18,721 | |||||||||
| Yandex N.V., Class A (Russia) (a) | 5,733,257 | 117,016 | |||||||||
| Youku.com, Inc. ADR (China) (a) | 3,371,132 | 55,151 | |||||||||
| 190,888 | |||||||||||
| Consumer Lending (1.5%) | |||||||||||
| IntercontinentalExchange, Inc. (a) | 787,116 | 93,084 | |||||||||
| Shares | Value (000) | ||||||||||
| Consumer Services: Miscellaneous (2.3%) | |||||||||||
| Qualicorp SA (Brazil) (a) | 11,730,661 | $ | 87,344 | ||||||||
| Sun Art Retail Group Ltd. (Hong Kong) (a) | 60,764,000 | 62,559 | |||||||||
| 149,903 | |||||||||||
| Cosmetics (0.8%) | |||||||||||
| Natura Cosmeticos SA (Brazil) | 3,166,631 | 53,893 | |||||||||
| Diversified Materials & Processing (1.7%) | |||||||||||
| Schindler Holding AG (Switzerland) | 991,550 | 106,167 | |||||||||
| Diversified Media (3.2%) | |||||||||||
| Factset Research Systems, Inc. | 1,115,630 | 99,258 | |||||||||
| McGraw-Hill Cos., Inc. (The) | 2,508,465 | 102,847 | |||||||||
| 202,105 | |||||||||||
| Diversified Retail (9.0%) | |||||||||||
| Chipotle Mexican Grill, Inc. (a) | 314,442 | 95,260 | |||||||||
| Ctrip.com International Ltd. ADR (China) (a) | 2,766,909 | 88,984 | |||||||||
| Dollar Tree, Inc. (a) | 1,450,040 | 108,912 | |||||||||
| Fastenal Co. | 5,392,770 | 179,471 | |||||||||
| NetFlix, Inc. (a) | 930,890 | 105,340 | |||||||||
| 577,967 | |||||||||||
| Education Services (1.0%) | |||||||||||
| New Oriental Education & Technology Group, Inc. ADR (China) (a) | 2,869,268 | 65,907 | |||||||||
| Financial Data & Systems (5.0%) | |||||||||||
| MSCI, Inc., Class A (a) | 5,499,670 | 166,805 | |||||||||
| Verisk Analytics, Inc., Class A (a) | 4,437,477 | 154,291 | |||||||||
| 321,096 | |||||||||||
| Health Care Services (2.7%) | |||||||||||
| athenahealth, Inc. (a) | 1,174,976 | 69,970 | |||||||||
| Stericycle, Inc. (a) | 1,249,930 | 100,894 | |||||||||
| 170,864 | |||||||||||
| Medical & Dental Instruments & Supplies (1.4%) | |||||||||||
| Techne Corp. | 1,282,524 | 87,225 | |||||||||
| Medical Equipment (3.1%) | |||||||||||
| Intuitive Surgical, Inc. (a) | 549,589 | 200,204 | |||||||||
| Metals & Minerals: Diversified (1.8%) | |||||||||||
| Lynas Corp. Ltd. (Australia) (a) | 25,224,987 | 25,493 | |||||||||
| Molycorp, Inc. (a) | 2,824,804 | 92,851 | |||||||||
| 118,344 | |||||||||||
| Pharmaceuticals (6.5%) | |||||||||||
| Gen-Probe, Inc. (a) | 1,878,548 | 107,547 | |||||||||
| Ironwood Pharmaceuticals, Inc. (a) | 3,714,185 | 40,113 | |||||||||
| Mead Johnson Nutrition Co. | 2,477,130 | 170,501 | |||||||||
| Valeant Pharmaceuticals International, Inc. (Canada) | 2,574,584 | 95,569 | |||||||||
| 413,730 | |||||||||||
| Publishing (1.5%) | |||||||||||
| Morningstar, Inc. | 1,673,181 | 94,434 | |||||||||
The accompanying notes are an integral part of the financial statements.
26
2011 Annual Report
September 30, 2011
Portfolio of Investments (cont'd)
Mid Cap Growth Portfolio
| Shares | Value (000) | ||||||||||
| Recreational Vehicles & Boats (3.4%) | |||||||||||
| Edenred (France) | 9,181,694 | $ | 218,296 | ||||||||
| Restaurants (1.3%) | |||||||||||
| Dunkin' Brands Group, Inc. (a) | 2,992,097 | 82,881 | |||||||||
| Scientific Instruments: Pollution Control (1.2%) | |||||||||||
| Covanta Holding Corp. | 4,949,620 | 75,185 | |||||||||
| Semiconductors & Components (2.9%) | |||||||||||
| ARM Holdings PLC ADR (United Kingdom) | 4,213,428 | 107,442 | |||||||||
| First Solar, Inc. (a) | 1,236,384 | 78,152 | |||||||||
| 185,594 | |||||||||||
| Shipping (1.4%) | |||||||||||
| C.H. Robinson Worldwide, Inc. | 1,276,462 | 87,399 | |||||||||
| Textiles Apparel & Shoes (1.3%) | |||||||||||
| Lululemon Athletica, Inc. (Canada) (a) | 1,777,166 | 86,459 | |||||||||
| Utilities: Electrical (1.0%) | |||||||||||
| Brookfield Infrastructure Partners LP (Canada) | 2,664,327 | 64,850 | |||||||||
| Total Common Stocks (Cost $5,973,983) | 5,963,357 | ||||||||||
| Convertible Preferred Stocks (1.9%) | |||||||||||
| Alternative Energy (0.4%) | |||||||||||
| Better Place, Inc. (a)(c)(d) | 7,507,951 | 22,524 | |||||||||
| Computer Technology (1.5%) | |||||||||||
| Groupon, Inc. Series G (a)(c)(d) | 1,498,247 | 95,888 | |||||||||
| Total Convertible Preferred Stocks (Cost $69,853) | 118,412 | ||||||||||
| Preferred Stocks (0.7%) | |||||||||||
| Leisure Time (0.7%) | |||||||||||
| Zynga, Inc. Series C (a)(c)(d) (Cost $47,566) | 3,390,490 | 47,566 | |||||||||
| Short-Term Investment (4.4%) | |||||||||||
| Investment Company (4.4%) | |||||||||||
| Morgan Stanley Institutional Liquidity Funds — Money Market Portfolio — Institutional Class (See Note G-2) (Cost $280,754) | 280,754,267 | 280,754 | |||||||||
| Total Investments (100.3%) (Cost $6,372,156) (e) | 6,410,089 | ||||||||||
| Liabilities in Excess of Other Assets (-0.3%) | (17,553 | ) | |||||||||
| Net Assets (100.0%) | $ | 6,392,536 | |||||||||
(a) Non-income producing security.
(b) Security trades on the Hong Kong exchange.
(c) Security has been deemed illiquid at September 30, 2011.
(d) At September 30, 2011, the Portfolio held fair valued securities valued at approximately $165,978,000, representing 2.6% of net assets. These securities have been fair valued as determined in good faith under procedures established by and under the general supervision of the Fund's Trustees.
(e) The approximate market value and percentage of net assets, $524,494,000 and 8.2%, respectively, represent the securities that have been fair valued under the fair valuation policy for international investments as described in Note A-1 within the Notes to the Financial Statements.
ADR American Depositary Receipt.
SDR Swedish Depositary Receipt.
Fair Value Measurement Information:
The following is a summary of the inputs used to value the Portfolio's net assets as of September 30, 2011. (See Note A-6 to the financial statements for further information regarding fair value measurement.)
| Investment Type | Level 1 Unadjusted quoted prices (000) | Level 2 Other significant observable inputs (000) | Level 3 Significant unobservable inputs (000) | Total (000) | |||||||||||||||
| Assets: | |||||||||||||||||||
| Common Stocks | |||||||||||||||||||
| Air Transport | $ | 132,232 | $ | — | $ | — | $ | 132,232 | |||||||||||
| Alternative Energy | 219,474 | — | — | 219,474 | |||||||||||||||
| Asset Management & Custodian | 33,296 | — | — | 33,296 | |||||||||||||||
| Biotechnology | 226,377 | — | — | 226,377 | |||||||||||||||
| Cement | 60,941 | — | — | 60,941 | |||||||||||||||
| Chemicals: Diversified | 159,312 | — | — | 159,312 | |||||||||||||||
| Commercial Services | 247,361 | 108,626 | — | 355,987 | |||||||||||||||
| Communications Technology | 258,155 | 77,999 | — | 336,154 | |||||||||||||||
| Computer Services, Software & Systems | 761,588 | 31,521 | — | 793,109 | |||||||||||||||
| Computer Technology | 190,888 | — | — | 190,888 | |||||||||||||||
| Consumer Lending | 93,084 | — | — | 93,084 | |||||||||||||||
| Consumer Services: Miscellaneous | 87,344 | 62,559 | — | 149,903 | |||||||||||||||
| Cosmetics | 53,893 | — | — | 53,893 | |||||||||||||||
| Diversified Materials & Processing | 106,167 | — | — | 106,167 | |||||||||||||||
| Diversified Media | 202,105 | — | — | 202,105 | |||||||||||||||
| Diversified Retail | 577,967 | — | — | 577,967 | |||||||||||||||
| Education Services | 65,907 | — | — | 65,907 | |||||||||||||||
| Financial Data & Systems | 321,096 | — | — | 321,096 | |||||||||||||||
| Health Care Services | 170,864 | — | — | 170,864 | |||||||||||||||
| Medical & Dental Instruments & Supplies | 87,225 | — | — | 87,225 | |||||||||||||||
| Medical Equipment | 200,204 | — | — | 200,204 | |||||||||||||||
| Metals & Minerals: Diversified | 92,851 | 25,493 | — | 118,344 | |||||||||||||||
| Pharmaceuticals | 413,730 | — | — | 413,730 | |||||||||||||||
| Publishing | 94,434 | — | — | 94,434 | |||||||||||||||
| Recreational Vehicles & Boats | — | 218,296 | — | 218,296 | |||||||||||||||
| Restaurants | 82,881 | — | — | 82,881 | |||||||||||||||
| Scientific Instruments: Pollution Control | 75,185 | — | — | 75,185 | |||||||||||||||
| Semiconductors & Components | 185,594 | — | — | 185,594 | |||||||||||||||
| Shipping | 87,399 | — | — | 87,399 | |||||||||||||||
| Textiles Apparel & Shoes | 86,459 | — | — | 86,459 | |||||||||||||||
| Utilities: Electrical | 64,850 | — | — | 64,850 | |||||||||||||||
| Total Common Stocks | 5,438,863 | 524,494 | — | 5,963,357 | |||||||||||||||
The accompanying notes are an integral part of the financial statements.
27
2011 Annual Report
September 30, 2011
Portfolio of Investments (cont'd)
Mid Cap Growth Portfolio
Fair Value Measurement Information: (cont'd)
| Investment Type | Level 1 Unadjusted quoted prices (000) | Level 2 Other significant observable inputs (000) | Level 3 Significant unobservable inputs (000) | Total (000) | |||||||||||||||
| Convertible Preferred Stocks | $ | — | $ | — | $ | 118,412 | $ | 118,412 | |||||||||||
| Preferred Stocks | — | — | 47,566 | 47,566 | |||||||||||||||
| Short-Term Investment — | |||||||||||||||||||
| Investment Company | 280,754 | — | — | 280,754 | |||||||||||||||
| Total Assets | $ | 5,719,617 | $ | 524,494 | $ | 165,978 | $ | 6,410,089 | |||||||||||
Transfers between investment levels may occur as the markets fluctuate and/or the availability of data used in an investment's valuation changes. The Portfolio recognizes transfers between the levels as of the end of the period. As of September 30, 2011, securities with a total value of approximately $383,935,000 transferred from Level 1 to Level 2. At September 30, 2011 the fair market value of certain securities were adjusted due to developments which occurred between the time of the close of the foreign markets on which they trade and the close of business on the NYSE which resulted in their Level 2 classification.
Fair Value Measurement Information: (cont'd)
Following is a reconciliation of investments in which significant unobservable inputs (Level 3) were used in determining fair value.
| Convertible Preferred Stocks (000) | Preferred Stocks (000) | ||||||||||
| Beginning Balance | $ | 22,524 | $ | — | |||||||
| Net purchases (sales) | 47,329 | 47,566 | |||||||||
| Amortization of discount | — | — | |||||||||
| Transfers in | — | — | |||||||||
| Transfers out | — | — | |||||||||
| Change in unrealized appreciation/ depreciation | 48,559 | — | |||||||||
| Realized gains (losses) | — | — | |||||||||
| Ending Balance | $ | 118,412 | $ | 47,566 | |||||||
| Net change in unrealized appreciation/ depreciation from investments still held as of September 30, 2011 | $ | 48,559 | $ | — | |||||||
The accompanying notes are an integral part of the financial statements.
28
2011 Annual Report
September 30, 2011
Investment Overview (unaudited)
Core Fixed Income Portfolio
Performance
For the fiscal year ended September 30, 2011, the Portfolio's Class I had a total return based on net asset value and reinvestment of distributions per share of 4.34%, net of fees. The Portfolio's Class I underperformed against its benchmark the Barclays Capital U.S. Aggregate Index (the "Index"), which returned 5.26%.
Factors Affecting Performance
• Financial markets were volatile during much of the 12-month period, with political upheaval across the Middle East at the beginning of 2011. Markets were further disrupted by the earthquake in Japan in March, as investors feared supply chain disruptions for electronics and auto components. In the summer, investors focused on the U.S.'s debt ceiling issue. Then, in August, one of the three major bond rating agencies, Standard & Poor's, downgraded the U.S.'s credit rating from AAA to AA+. August and September were the most volatile months as concerns about the European sovereign debt crisis and a slowdown in global growth led to a dramatic sell-off in risky assets.
• The Federal Reserve's second round of quantitative easing (QE2), an asset purchase program intended to stimulate the economy by encouraging banks to lend, ended in June. Amidst renewed weakness in economic indicators in the second half of the period, the Fed announced that it would extend the maturity of its Treasury holdings to put downward pressure on longer-term interest rates. In addition, to provide support to the mortgage market, the Fed will re-invest principal payments from its mortgage and agency holdings into mortgages instead of Treasuries.
• Investment-grade corporate debt spreads versus Treasuries narrowed in the first half of the period. Corporate balance sheets have been strong, with near all-time highs in profit margins, cash flow generation and cash on balance sheet. However, in the third quarter of 2011, the credit market, especially the financial sector, was negatively affected by the increased risk aversion due to the European debt crisis and signs of slowing economic growth. Overall investment-grade corporate spreads ended the period almost 60 basis points wider after tightening about 40 basis points in first few months of the year.
• The agency mortgage sector generated positive returns versus duration neutral Treasuries. The Treasury's announcement in the first quarter that it would reduce its mortgage-backed securities portfolio initially prompted a negative reaction in the market. However, the market recovered, as the Treasury planned to sell its portfolio over a 12-month period, promising not to disrupt the market. During the second quarter, the Treasury started selling leveraged agency mortgage bonds. This supply was absorbed by the market without much impact on spreads. Toward the end of the period, the sector, especially higher coupon mortgages, came under some pressure due to concerns about a government-sponsored universal refinancing program. However, we believe the sector should remain well supported given the relatively attractive yield and the Fed's plan to re-invest principal payments from their mortgage and agency holdings into mortgages.
• The U.S. Treasury yield curve flattened during the period, with yields on 2-, 5-, 10-, and 30-year Treasuries declining by 18, 32, 59, and 77 basis points, respectively.
• The Portfolio's overweight position in the investment-grade credit sector, particularly banking, detracted from relative performance.
• The Portfolio's positioning in the commercial mortgage backed security (CMBS) sector hurt performance as the sector experienced substantial spread widening in the third quarter of 2011.
• The Portfolio's mortgage strategy helped performance. This was primarily due to an allocation to agency mortgage derivatives through interest only (IO) and inverse interest only (IIO) securities.
Management Strategies
• Throughout the period, the Portfolio was positioned with an overweight to investment-grade credit as corporate valuations relative to fundamentals have been attractive. We reduced some credit exposure a few months ago but continue to maintain an overweight to the sector.
• Additionally, interest rate positioning contributed to performance. The Portfolio was positioned to
29
2011 Annual Report
September 30, 2011
Investment Overview (unaudited) (cont'd)
Core Fixed Income Portfolio
benefit from an anticipated flattening (or, reduction in the difference of yield spreads) between the short and intermediate parts of the yield curve. We unwound the position profitably toward the end of the reporting period.
• In terms of mortgage strategy, the Portfolio had a position in IO and IIO securities. Prepayment speeds have been slow, which was beneficial for this position. A number of factors, such as increased credit requirements and fees, have mitigated prepayments and presented hurdles for borrowers looking to refinance.
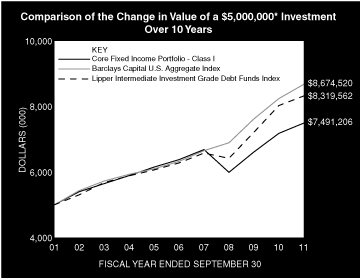
* Minimum Investment
In accordance with SEC regulations, the Portfolio's performance shown assumes that all recurring fees (including management fees) were deducted and all dividends and distributions were reinvested. The performance of Class P shares will vary from the Class I shares based upon their different inception dates and will be negatively impacted by additional fees assessed to that class.
Performance Compared to the Barclays Capital U.S. Aggregate Index(1) and the Lipper Intermediate Investment Grade Debt Funds Index(2)
| Period Ended September 30, 2011 Total Returns(3) | |||||||||||||||||||
| Average Annual | |||||||||||||||||||
| One Year | Five Years | Ten Years | Since Inception(6) | ||||||||||||||||
| Portfolio — Class I Shares w/o sales charges(4) | 4.34 | % | 3.26 | % | 4.13 | % | 7.01 | % | |||||||||||
| Barclays Capital U.S. Aggregate Index | 5.26 | 6.53 | 5.66 | 7.57 | |||||||||||||||
| Lipper Intermediate Investment Grade Debt Funds Index | 3.66 | 5.78 | 5.22 | N/A | |||||||||||||||
| Portfolio — Class P Shares w/o sales charges(5) | 4.11 | 3.03 | 3.89 | 4.53 | |||||||||||||||
| Barclays Capital U.S. Aggregate Index | 5.26 | 6.53 | 5.66 | 6.13 | |||||||||||||||
| Lipper Intermediate Investment Grade Debt Funds Index | 3.66 | 5.78 | 5.22 | 5.61 | |||||||||||||||
Performance data quoted represents past performance, which is no guarantee of future results, and current performance may be lower or higher than the figures shown. Performance assumes that all dividends and distributions, if any, were reinvested. For the most recent month-end performance figures, please visit www.morganstanley.com/im. Investment returns and principal value will fluctuate so that Portfolio shares, when redeemed, may be worth more or less than their original cost. Total returns do not reflect the deduction of taxes that a shareholder would pay on Portfolio distributions or the redemption of Portfolio shares. Performance of share classes will vary due to differences in expenses.
(1) The Barclays Capital U.S. Aggregate Index tracks the performance of all U.S. government agency and Treasury securities, investment-grade corporate debt securities, agency mortgage-backed securities, asset-backed securities and commercial mortgage-backed securities. The Index is unmanaged and its returns do not include any sales charges or fees. Such costs would lower performance. It is not possible to invest directly in an index.
(2) The Lipper Intermediate Investment Grade Debt Funds Index is an equally weighted performance index of the largest qualifying funds (based on net assets) in the Lipper Intermediate Investment Grade Debt Funds classification. The Index, which is adjusted for capital gains distributions and income dividends, is unmanaged and should not be considered an investment. There are currently 30 funds represented in this Index. As of the date of this report, the Portfolio was in the Lipper Intermediate Investment Grade Debt Funds classification.
(3) Total returns for the Portfolio reflect expenses waived and/or reimbursed, if applicable, by the Adviser. Without such waivers and/or reimbursements, total returns would have been lower. Fee waivers and/or reimbursements are expected to continue until such time that the Fund's Board of Trustees acts to discontinue such waivers and/or reimbursements.
(4) Commenced operations on September 29, 1987.
(5) Commenced operations on March 1, 1999.
(6) For comparative purposes, average annual since inception returns listed for the Indexes refer to the inception date or initial offering of the respective share class of the Portfolio, not the inception of the Indexes.
30
2011 Annual Report
September 30, 2011
Investment Overview (unaudited) (cont'd)
Core Fixed Income Portfolio
Portfolio Composition*
| Classification | Percentage of Total Investments | ||||||
| Agency Fixed Rate Mortgages | 26.2 | % | |||||
| Other** | 14.5 | ||||||
| Finance | 14.2 | ||||||
| Industrials | 13.3 | ||||||
| U.S. Treasury Securities | 11.2 | ||||||
| Collateralized Mortgage Obligations — Agency Collateral Series | 8.9 | ||||||
| Asset-Backed Securities | 6.7 | ||||||
| Short-Term Investments | 5.0 | ||||||
| Total Investments | 100.0 | %*** | |||||
* Percentages indicated are based upon total investments (excluding Securities held as Collateral on Loaned Securities) as of September 30, 2011.
** Industries and/or investment types representing less than 5% of total investments.
*** Does not include open long/short futures contracts with a value of approximately $21,657,000 and net unrealized depreciation of approximately $71,000 and open swap agreements with net unrealized depreciation of approximately $206,000.
31
2011 Annual Report
September 30, 2011
Portfolio of Investments
Core Fixed Income Portfolio
| Face Amount (000) | Value (000) | ||||||||||
| Fixed Income Securities (97.3%) | |||||||||||
| Agency Bond — Banking (FDIC Guaranteed) (2.3%) | |||||||||||
| Ally Financial, Inc. | |||||||||||
| 2.20%, 12/19/12 | $ | 1,465 | $ | 1,498 | |||||||
| Agency Fixed Rate Mortgages (26.9%) | |||||||||||
| Federal Home Loan Mortgage Corporation, | |||||||||||
| Gold Pools: | |||||||||||
| 5.00%, 10/1/35 | 1,119 | 1,205 | |||||||||
| 6.00%, 5/1/37 - 10/1/38 | 520 | 572 | |||||||||
| 7.50%, 5/1/35 | 69 | 80 | |||||||||
| 8.00%, 8/1/32 | 35 | 41 | |||||||||
| 8.50%, 8/1/31 | 55 | 66 | |||||||||
| October TBA: | |||||||||||
| 4.00%, 10/25/41 (a) | 1,215 | 1,272 | |||||||||
| Federal National Mortgage Association, | |||||||||||
| Conventional Pools: | |||||||||||
| 4.50%, 8/1/40 - 8/1/41 | 3,705 | 3,935 | |||||||||
| 5.00%, 3/1/39 | 1,152 | 1,253 | |||||||||
| 5.50%, 4/1/34 - 2/1/38 | 3,015 | 3,292 | |||||||||
| 6.00%, 1/1/38 - 10/1/38 | 431 | 474 | |||||||||
| 6.50%, 7/1/29 - 2/1/33 | 456 | 517 | |||||||||
| 7.00%, 10/1/31 - 12/1/31 | 3 | 3 | |||||||||
| 7.50%, 8/1/37 | 116 | 136 | |||||||||
| 8.00%, 4/1/33 | 85 | 99 | |||||||||
| 8.50%, 10/1/32 | 85 | 100 | |||||||||
| Government National Mortgage Association, | |||||||||||
| October TBA: | |||||||||||
| 3.50%, 10/25/41 (a) | 700 | 732 | |||||||||
| 4.00%, 10/25/41 (a) | 755 | 808 | |||||||||
| Various Pools: | |||||||||||
| 4.50%, 4/15/39 - 5/15/40 | 2,379 | 2,592 | |||||||||
| 17,177 | |||||||||||
| Asset-Backed Securities (6.8%) | |||||||||||
| Ally Master Owner Trust | |||||||||||
| 2.88%, 4/15/15 (b) | 225 | 231 | |||||||||
| ARI Fleet Lease Trust | |||||||||||
| 1.68%, 8/15/18 (b)(c) | 55 | 55 | |||||||||
| Brazos Higher Education Authority | |||||||||||
| 1.10%, 7/25/29 (c) | 325 | 322 | |||||||||
| CarMax Auto Owner Trust | |||||||||||
| 1.29%, 9/15/15 | 225 | 227 | |||||||||
| CLI Funding LLC | |||||||||||
| 4.50%, 3/18/26 (b) | 239 | 242 | |||||||||
| CVS Pass-Through Trust | |||||||||||
| 6.04%, 12/10/28 | 339 | 357 | |||||||||
| Discover Card Master Trust | |||||||||||
| 0.58%, 8/15/16 (c) | 300 | 301 | |||||||||
| Enterprise Fleet Financing LLC | |||||||||||
| 1.43%, 10/20/16 (b) | 189 | 189 | |||||||||
| Ford Credit Floorplan Master Owner Trust | |||||||||||
| 2.12%, 2/15/16 | 175 | 178 | |||||||||
| Face Amount (000) | Value (000) | ||||||||||
| FUEL Trust | |||||||||||
| 4.21%, 4/15/16 (b) | $ | 200 | $ | 199 | |||||||
| Great America Leasing Receivables | |||||||||||
| 1.69%, 2/15/14 (b) | 300 | 302 | |||||||||
| Louisiana Public Facilities Authority | |||||||||||
| 1.15%, 1/25/20 (c) | 325 | 320 | |||||||||
| Macquarie Equipment Funding Trust | |||||||||||
| 1.21%, 9/20/13 (b) | 275 | 275 | |||||||||
| Mercedes-Benz Auto Lease Trust | |||||||||||
| 1.18%, 11/15/13 (b) | 350 | 352 | |||||||||
| MMCA Automobile Trust | |||||||||||
| 1.22%, 1/15/15 (b) | 225 | 226 | |||||||||
| North Carolina State Education Assistance Authority | |||||||||||
| 1.15%, 1/26/26 (c) | 225 | 221 | |||||||||
| Panhandle-Plains Higher Education Authority, Inc. | |||||||||||
| 1.21%, 7/1/24 (c) | 125 | 124 | |||||||||
| Textainer Marine Containers Ltd. | |||||||||||
| 4.70%, 6/15/26 (b) | 244 | 246 | |||||||||
| 4,367 | |||||||||||
| Collateralized Mortgage Obligations — Agency Collateral Series (9.2%) | |||||||||||
| Federal Home Loan Mortgage Corporation, | |||||||||||
| 2.70%, 5/25/18 | 335 | 337 | |||||||||
| 3.15%, 2/25/18 | 225 | 236 | |||||||||
| 3.87%, 4/25/21 | 325 | 352 | |||||||||
| IO | |||||||||||
| 0.84%, 1/25/21 (c) | 2,294 | 100 | |||||||||
| IO REMIC | |||||||||||
| 5.00%, 12/15/20 - 12/15/37 | 1,340 | 187 | |||||||||
| 5.72%, 6/15/41 (c) | 6,497 | 773 | |||||||||
| 5.74%, 6/15/40 (c) | 784 | 123 | |||||||||
| 5.91%, 7/15/37 (c) | 628 | 90 | |||||||||
| 6.24%, 6/15/40 (c) | 2,619 | 500 | |||||||||
| IO STRIPS | |||||||||||
| 8.00%, 1/1/28 | 23 | 5 | |||||||||
| REMIC | |||||||||||
| 22.09%, 5/15/41 (c)(d) | 350 | 387 | |||||||||
| Federal National Mortgage Association, | |||||||||||
| 3.76%, 6/25/21 | 110 | 119 | |||||||||
| IO | |||||||||||
| 6.16%, 9/25/20 (c) | 1,783 | 465 | |||||||||
| IO REMIC | |||||||||||
| 6.47%, 2/25/24 (c) | 572 | 63 | |||||||||
| REMIC | |||||||||||
| 6.04%, 10/25/40 (c) | 145 | 164 | |||||||||
| 9.16%, 10/25/41 | 229 | 226 | |||||||||
| Government National Mortgage Association, | |||||||||||
| IO | |||||||||||
| 6.32%, 12/20/40 (c) | 2,318 | 386 | |||||||||
| IO REMIC | |||||||||||
| 0.85%, 8/20/58 (c) | 3,021 | 98 | |||||||||
| 4.50%, 6/20/39 | 689 | 112 | |||||||||
The accompanying notes are an integral part of the financial statements.
32
2011 Annual Report
September 30, 2011
Portfolio of Investments (cont'd)
Core Fixed Income Portfolio
| Face Amount (000) | Value (000) | ||||||||||
| Collateralized Mortgage Obligations — Agency Collateral Series (cont'd) | |||||||||||
| 5.00%, 2/16/41 | $ | 192 | $ | 40 | |||||||
| 5.22%, 6/20/41 (c) | 991 | 140 | |||||||||
| 5.82%, 11/16/40 (c) | 1,243 | 251 | |||||||||
| 6.02%, 10/20/37 (c) | 929 | 79 | |||||||||
| 6.35%, 6/20/40 (c) | 927 | 164 | |||||||||
| 6.37%, 4/16/41 (c) | 1,349 | 270 | |||||||||
| 6.44%, 4/16/41 (c) | 934 | 168 | |||||||||
| 5,835 | |||||||||||
| Commercial Mortgage Backed Securities (4.7%) | |||||||||||
| Bear Stearns Commercial Mortgage Securities | |||||||||||
| 5.47%, 1/12/45 (c) | 325 | 358 | |||||||||
| DBUBS Mortgage Trust, | |||||||||||
| 4.54%, 7/10/44 (b) | 350 | 358 | |||||||||
| 5.00%, 11/10/46 (b) | 300 | 323 | |||||||||
| 5.47%, 11/10/46 (b)(c) | 190 | 178 | |||||||||
| GS Mortgage Securities Corp. II, | |||||||||||
| 3.71%, 8/10/44 (c)(e) | 240 | 243 | |||||||||
| 5.36%, 3/10/44 (b)(c) | 175 | 163 | |||||||||
| 5.55%, 4/10/38 (c) | 100 | 106 | |||||||||
| JP Morgan Chase Commercial Mortgage Securities Corp., | |||||||||||
| 4.17%, 8/15/46 | 240 | 245 | |||||||||
| 4.39%, 7/15/46 (b) | 350 | 350 | |||||||||
| 4.72%, 2/16/46 (b) | 335 | 346 | |||||||||
| WF-RBS Commercial Mortgage Trust | |||||||||||
| 4.87%, 2/15/44 (b)(c) | 315 | 333 | |||||||||
| 3,003 | |||||||||||
| Corporate Bonds (31.4%) | |||||||||||
| Finance (14.5%) | |||||||||||
| ABB Treasury Center USA, Inc. | |||||||||||
| 2.50%, 6/15/16 (b) | 175 | 179 | |||||||||
| Abbey National Treasury Services PLC | |||||||||||
| 3.88%, 11/10/14 (b) | 140 | 135 | |||||||||
| Aegon N.V. | |||||||||||
| 4.63%, 12/1/15 | 175 | 179 | |||||||||
| American International Group, Inc. | |||||||||||
| 6.40%, 12/15/20 | 200 | 204 | |||||||||
| Australia & New Zealand Banking Group Ltd. | |||||||||||
| 4.88%, 1/12/21 (b) | 140 | 146 | |||||||||
| Bank of America Corp. | |||||||||||
| 5.75%, 12/1/17 | 520 | 488 | |||||||||
| Barclays Bank PLC, | |||||||||||
| 6.05%, 12/4/17 (b) | 100 | 92 | |||||||||
| 6.75%, 5/22/19 | 120 | 130 | |||||||||
| BBVA US Senior SAU | |||||||||||
| 3.25%, 5/16/14 | 200 | 188 | |||||||||
| Bear Stearns Cos. LLC (The), | |||||||||||
| 6.40%, 10/2/17 | 25 | 28 | |||||||||
| 7.25%, 2/1/18 | 170 | 201 | |||||||||
| Berkshire Hathaway, Inc. | |||||||||||
| 3.75%, 8/15/21 | 235 | 239 | |||||||||
| Face Amount (000) | Value (000) | ||||||||||
| BNP Paribas SA | |||||||||||
| 5.00%, 1/15/21 | $ | 135 | $ | 132 | |||||||
| Boston Properties LP | |||||||||||
| 5.88%, 10/15/19 | 30 | 33 | |||||||||
| Brookfield Asset Management, Inc., | |||||||||||
| 5.80%, 4/25/17 | 65 | 69 | |||||||||
| 7.13%, 6/15/12 | 60 | 62 | |||||||||
| Citigroup, Inc. (See Note G-2), | |||||||||||
| 5.88%, 5/29/37 | 150 | 144 | |||||||||
| 6.13%, 11/21/17 - 5/15/18 | 195 | 209 | |||||||||
| 8.50%, 5/22/19 | 85 | 103 | |||||||||
| Coventry Health Care, Inc. | |||||||||||
| 5.45%, 6/15/21 | 120 | 130 | |||||||||
| Credit Suisse, | |||||||||||
| 5.40%, 1/14/20 | 135 | 130 | |||||||||
| 6.00%, 2/15/18 | 60 | 61 | |||||||||
| Dexus Diversified Trust/Dexus Office Trust | |||||||||||
| 5.60%, 3/15/21 (b)(f) | 100 | 104 | |||||||||
| Digital Realty Trust LP | |||||||||||
| 5.25%, 3/15/21 | 175 | 174 | |||||||||
| Fifth Third Bancorp | |||||||||||
| 3.63%, 1/25/16 | 70 | 71 | |||||||||
| General Electric Capital Corp., | |||||||||||
| 5.30%, 2/11/21 | 110 | 114 | |||||||||
| 6.00%, 8/7/19 | 565 | 637 | |||||||||
| Goldman Sachs Group, Inc. (The), | |||||||||||
| 6.15%, 4/1/18 | 315 | 327 | |||||||||
| 7.50%, 2/15/19 | 110 | 123 | �� | ||||||||
| Hartford Financial Services Group, Inc. | |||||||||||
| 5.50%, 3/30/20 | 110 | 107 | |||||||||
| HBOS PLC | |||||||||||
| 6.75%, 5/21/18 (b) | 340 | 290 | |||||||||
| HCP, Inc., | |||||||||||
| 5.38%, 2/1/21 | 50 | 50 | |||||||||
| 5.63%, 5/1/17 | 100 | 104 | |||||||||
| HSBC Holdings PLC | |||||||||||
| 5.10%, 4/5/21 | 295 | 304 | |||||||||
| ING Bank N.V. | |||||||||||
| 4.00%, 3/15/16 (b) | 200 | 201 | |||||||||
| Intesa Sanpaolo SpA | |||||||||||
| 6.50%, 2/24/21 (b) | 100 | 89 | |||||||||
| JPMorgan Chase & Co., | |||||||||||
| 4.95%, 3/25/20 | 80 | 85 | |||||||||
| 6.30%, 4/23/19 | 25 | 28 | |||||||||
| MetLife, Inc. | |||||||||||
| 7.72%, 2/15/19 | 60 | 74 | |||||||||
| NASDAQ OMX Group, Inc. (The) | |||||||||||
| 5.55%, 1/15/20 | 50 | 50 | |||||||||
| National Australia Bank Ltd. | |||||||||||
| 3.00%, 7/27/16 (b) | 170 | 171 | |||||||||
| Nationwide Building Society | |||||||||||
| 6.25%, 2/25/20 (b) | 345 | 348 | |||||||||
| Nationwide Financial Services | |||||||||||
| 5.38%, 3/25/21 (b) | 75 | 73 | |||||||||
The accompanying notes are an integral part of the financial statements.
33
2011 Annual Report
September 30, 2011
Portfolio of Investments (cont'd)
Core Fixed Income Portfolio
| Face Amount (000) | Value (000) | ||||||||||
| Finance (cont'd) | |||||||||||
| Nordea Bank AB | |||||||||||
| 4.88%, 5/13/21 (b) | $ | 200 | $ | 171 | |||||||
| Pacific LifeCorp | |||||||||||
| 6.00%, 2/10/20 (b) | 125 | 134 | |||||||||
| Platinum Underwriters Finance, Inc., | |||||||||||
| Series B | |||||||||||
| 7.50%, 6/1/17 | 120 | 131 | |||||||||
| PNC Funding Corp. | |||||||||||
| 6.70%, 6/10/19 (f) | 90 | 108 | |||||||||
| Principal Financial Group, Inc. | |||||||||||
| 8.88%, 5/15/19 | 100 | 128 | |||||||||
| Prudential Financial, Inc. | |||||||||||
| 7.38%, 6/15/19 | 170 | 199 | |||||||||
| Reinsurance Group of America, Inc. | |||||||||||
| 6.45%, 11/15/19 | 135 | 153 | |||||||||
| Royal Bank of Scotland PLC (The) | |||||||||||
| 4.88%, 3/16/15 | 95 | 93 | |||||||||
| Santander Holdings USA, Inc. | |||||||||||
| 4.63%, 4/19/16 | 40 | 39 | |||||||||
| Santander US Debt SA Unipersonal | |||||||||||
| 3.72%, 1/20/15 (b) | 200 | 186 | |||||||||
| Societe Generale SA | |||||||||||
| 5.20%, 4/15/21 (b) | 200 | 174 | |||||||||
| Standard Chartered Bank | |||||||||||
| 6.40%, 9/26/17 (b) | 100 | 106 | |||||||||
| Sumitomo Mitsui Banking Corp. | |||||||||||
| 2.90%, 7/22/16 (b) | 200 | 202 | |||||||||
| UnitedHealth Group, Inc. | |||||||||||
| 6.63%, 11/15/37 | 195 | 247 | |||||||||
| Ventas Realty LP/Ventas Capital Corp. | |||||||||||
| 4.75%, 6/1/21 | 125 | 120 | |||||||||
| Wachovia Corp. | |||||||||||
| 5.63%, 10/15/16 | 60 | 65 | |||||||||
| WEA Finance LLC | |||||||||||
| 4.63%, 5/10/21 (b) | 150 | 144 | |||||||||
| Wells Fargo & Co. | |||||||||||
| 5.63%, 12/11/17 | 60 | 68 | |||||||||
| 9,274 | |||||||||||
| Industrials (13.6%) | |||||||||||
| Agilent Technologies, Inc. | |||||||||||
| 5.50%, 9/14/15 | 120 | 131 | |||||||||
| Air Products & Chemicals, Inc. | |||||||||||
| 2.00%, 8/2/16 | 165 | 168 | |||||||||
| Albemarle Corp. | |||||||||||
| 4.50%, 12/15/20 | 110 | 119 | |||||||||
| Altria Group, Inc., | |||||||||||
| 4.13%, 9/11/15 | 50 | 54 | |||||||||
| 9.25%, 8/6/19 | 125 | 164 | |||||||||
| Anglo American Capital PLC | |||||||||||
| 9.38%, 4/8/19 (b) | 100 | 133 | |||||||||
| ArcelorMittal | |||||||||||
| 9.85%, 6/1/19 | 100 | 113 | |||||||||
| Face Amount (000) | Value (000) | ||||||||||
| AT&T, Inc., | |||||||||||
| 3.88%, 8/15/21 | $ | 45 | $ | 46 | |||||||
| 6.30%, 1/15/38 | 170 | 195 | |||||||||
| BAA Funding Ltd. | |||||||||||
| 4.88%, 7/15/21 (b) | 170 | 173 | |||||||||
| Barrick North America Finance LLC | |||||||||||
| 4.40%, 5/30/21 | 95 | 98 | |||||||||
| BAT International Finance PLC | |||||||||||
| 9.50%, 11/15/18 (b) | 165 | 224 | |||||||||
| Bemis Co., Inc. | |||||||||||
| 4.50%, 10/15/21 (e) | 110 | 112 | |||||||||
| Best Buy Co., Inc. | |||||||||||
| 3.75%, 3/15/16 | 165 | 160 | |||||||||
| Boeing Capital Corp. | |||||||||||
| 2.13%, 8/15/16 | 175 | 177 | |||||||||
| Bunge Ltd. Finance Corp. | |||||||||||
| 8.50%, 6/15/19 | 85 | 106 | |||||||||
| Burlington Northern Santa Fe LLC | |||||||||||
| 5.65%, 5/1/17 | 115 | 133 | |||||||||
| Comcast Corp., | |||||||||||
| 5.15%, 3/1/20 | 75 | 85 | |||||||||
| 5.70%, 5/15/18 | 50 | 58 | |||||||||
| ConAgra Foods, Inc. | |||||||||||
| 8.25%, 9/15/30 | 140 | 181 | |||||||||
| COX Communications, Inc. | |||||||||||
| 8.38%, 3/1/39 (b) | 25 | 35 | |||||||||
| CRH America, Inc. | |||||||||||
| 6.00%, 9/30/16 | 135 | 145 | |||||||||
| Daimler Finance North America LLC, | |||||||||||
| 7.30%, 1/15/12 | 95 | 97 | |||||||||
| 8.50%, 1/18/31 | 55 | 78 | |||||||||
| Darden Restaurants, Inc. | |||||||||||
| 6.20%, 10/15/17 | 205 | 239 | |||||||||
| Delhaize Group SA | |||||||||||
| 5.70%, 10/1/40 | 106 | 110 | |||||||||
| Deutsche Telekom International Finance BV | |||||||||||
| 8.75%, 6/15/30 | 65 | 87 | |||||||||
| DirecTV Holdings LLC/DirecTV Financing Co., Inc. | |||||||||||
| 5.88%, 10/1/19 | 150 | 169 | |||||||||
| Fiserv, Inc. | |||||||||||
| 3.13%, 6/15/16 | 120 | 122 | |||||||||
| Georgia-Pacific LLC | |||||||||||
| 5.40%, 11/1/20 (b) | 90 | 92 | |||||||||
| Gilead Sciences, Inc. | |||||||||||
| 4.50%, 4/1/21 | 140 | 151 | |||||||||
| Grupo Bimbo SAB de CV | |||||||||||
| 4.88%, 6/30/20 (b) | 100 | 102 | |||||||||
| Harley-Davidson Funding Corp. | |||||||||||
| 6.80%, 6/15/18 (b) | 105 | 122 | |||||||||
| Hess Corp. | |||||||||||
| 6.00%, 1/15/40 | 175 | 200 | |||||||||
| Holcim US Finance Sarl & Cie SCS | |||||||||||
| 6.00%, 12/30/19 (b) | 85 | 90 | |||||||||
The accompanying notes are an integral part of the financial statements.
34
2011 Annual Report
September 30, 2011
Portfolio of Investments (cont'd)
Core Fixed Income Portfolio
| Face Amount (000) | Value (000) | ||||||||||
| Industrials (cont'd) | |||||||||||
| Home Depot, Inc. | |||||||||||
| 5.88%, 12/16/36 | $ | 190 | $ | 222 | |||||||
| International Paper Co. | |||||||||||
| 7.50%, 8/15/21 | 105 | 122 | |||||||||
| Kinross Gold Corp. | |||||||||||
| 5.13%, 9/1/21 (b) | 115 | 114 | |||||||||
| KLA-Tencor Corp. | |||||||||||
| 6.90%, 5/1/18 | 145 | 166 | |||||||||
| Kraft Foods, Inc. | |||||||||||
| 5.38%, 2/10/20 | 195 | 221 | |||||||||
| L-3 Communications Corp. | |||||||||||
| 4.75%, 7/15/20 | 135 | 140 | |||||||||
| Marathon Petroleum Corp. | |||||||||||
| 5.13%, 3/1/21 (b) | 70 | 73 | |||||||||
| Mosaic Co. (The) | |||||||||||
| 7.63%, 12/1/16 (b) | 60 | 63 | |||||||||
| NBC Universal Media LLC | |||||||||||
| 5.15%, 4/30/20 | 140 | 154 | |||||||||
| News America, Inc. | |||||||||||
| 4.50%, 2/15/21 | 75 | 76 | |||||||||
| Omnicom Group, Inc. | |||||||||||
| 4.45%, 8/15/20 | 70 | 71 | |||||||||
| Petrobras International Finance Co. | |||||||||||
| 5.75%, 1/20/20 | 175 | 183 | |||||||||
| Potash Corp. of Saskatchewan, Inc. | |||||||||||
| 5.88%, 12/1/36 | 110 | 132 | |||||||||
| Quest Diagnostics, Inc. | |||||||||||
| 6.95%, 7/1/37 | 95 | 120 | |||||||||
| Rio Tinto Finance USA Ltd. | |||||||||||
| 9.00%, 5/1/19 | 35 | 47 | |||||||||
| Sanofi | |||||||||||
| 4.00%, 3/29/21 | 135 | 147 | |||||||||
| Teck Resources Ltd., | |||||||||||
| 4.75%, 1/15/22 | 85 | 87 | |||||||||
| 6.25%, 7/15/41 | 100 | 105 | |||||||||
| Telecom Italia Capital SA, | |||||||||||
| 7.00%, 6/4/18 | 85 | 85 | |||||||||
| 7.18%, 6/18/19 | 35 | 35 | |||||||||
| Telefonica Europe BV | |||||||||||
| 8.25%, 9/15/30 | 195 | 219 | |||||||||
| Telstra Corp. Ltd. | |||||||||||
| 4.80%, 10/12/21 (b) | 100 | 105 | |||||||||
| Thermo Fisher Scientific, Inc. | |||||||||||
| 3.60%, 8/15/21 | 160 | 166 | |||||||||
| Time Warner Cable, Inc., | |||||||||||
| 6.75%, 6/15/39 | 40 | 46 | |||||||||
| 8.75%, 2/14/19 | 55 | 71 | |||||||||
| Time Warner, Inc., | |||||||||||
| 4.70%, 1/15/21 | 100 | 105 | |||||||||
| 4.75%, 3/29/21 | 90 | 95 | |||||||||
| 5.88%, 11/15/16 | 75 | 85 | |||||||||
| Face Amount (000) | Value (000) | ||||||||||
| Vale Overseas Ltd., | |||||||||||
| 5.63%, 9/15/19 | $ | 110 | $ | 116 | |||||||
| 6.88%, 11/10/39 | 20 | 22 | |||||||||
| Verizon Communications, Inc., | |||||||||||
| 4.60%, 4/1/21 (f) | 30 | 33 | |||||||||
| 8.95%, 3/1/39 | 50 | 77 | |||||||||
| VF Corp. | |||||||||||
| 3.50%, 9/1/21 | 105 | 107 | |||||||||
| Viacom, Inc. | |||||||||||
| 6.88%, 4/30/36 | 130 | 155 | |||||||||
| Vivendi SA | |||||||||||
| 6.63%, 4/4/18 (b) | 120 | 136 | |||||||||
| Wesfarmers Ltd. | |||||||||||
| 2.98%, 5/18/16 (b) | 85 | 86 | |||||||||
| Woolworths Ltd. | |||||||||||
| 4.00%, 9/22/20 (b) | 125 | 130 | |||||||||
| WPP Finance UK | |||||||||||
| 8.00%, 9/15/14 | 100 | 113 | |||||||||
| 8,699 | |||||||||||
| Utilities (3.3%) | |||||||||||
| EDF SA | |||||||||||
| 4.60%, 1/27/20 (b) | 80 | 84 | |||||||||
| Enel Finance International N.V. | |||||||||||
| 5.13%, 10/7/19 (b) | 275 | 258 | |||||||||
| Energy Transfer Partners LP | |||||||||||
| 9.00%, 4/15/19 | 125 | 151 | |||||||||
| Enterprise Products Operating LLC, | |||||||||||
| 5.25%, 1/31/20 | 50 | 55 | |||||||||
| 6.50%, 1/31/19 | 160 | 189 | |||||||||
| Exelon Generation Co. LLC | |||||||||||
| 6.25%, 10/1/39 | 315 | 367 | |||||||||
| FirstEnergy Solutions Corp. | |||||||||||
| 6.05%, 8/15/21 | 225 | 250 | |||||||||
| Iberdrola Finance Ireland Ltd. | |||||||||||
| 5.00%, 9/11/19 (b) | 175 | 169 | |||||||||
| Kinder Morgan Energy Partners LP | |||||||||||
| 5.95%, 2/15/18 | 160 | 182 | |||||||||
| Plains All American Pipeline LP/PAA Finance Corp., | |||||||||||
| 6.70%, 5/15/36 | 160 | 183 | |||||||||
| 8.75%, 5/1/19 | 65 | 83 | |||||||||
| PPL WEM Holdings PLC | |||||||||||
| 3.90%, 5/1/16 (b) | 150 | 158 | |||||||||
| 2,129 | |||||||||||
| 20,102 | |||||||||||
| Municipal Bonds (1.5%) | |||||||||||
| Chicago Transit Authority | |||||||||||
| 6.20%, 12/1/40 | 100 | 116 | |||||||||
| City of Chicago, IL, | |||||||||||
| O'Hare International Airport Revenue | |||||||||||
| 6.40%, 1/1/40 | 40 | 49 | |||||||||
The accompanying notes are an integral part of the financial statements.
35
2011 Annual Report
September 30, 2011
Portfolio of Investments (cont'd)
Core Fixed Income Portfolio
| Face Amount (000) | Value (000) | ||||||||||
| Municipal Bonds (cont'd) | |||||||||||
| City of New York, NY, Series G-1 | |||||||||||
| 5.97%, 3/1/36 | $ | 85 | $ | 104 | |||||||
| Illinois State Toll Highway Authority, | |||||||||||
| Highway Revenue, Build America Bonds | |||||||||||
| 6.18%, 1/1/34 | 130 | 153 | |||||||||
| Municipal Electric Authority of Georgia, | |||||||||||
| 6.64%, 4/1/57 | 90 | 98 | |||||||||
| 6.66%, 4/1/57 | 155 | 165 | |||||||||
| New York City Transitional Finance Authority | |||||||||||
| 5.27%, 5/1/27 | 80 | 90 | |||||||||
| State of California, | |||||||||||
| General Obligation Bonds | |||||||||||
| 5.95%, 4/1/16 | 175 | 199 | |||||||||
| 974 | |||||||||||
| Sovereign (0.9%) | |||||||||||
| Bermuda Government International Bond | |||||||||||
| 5.60%, 7/20/20 (b)(f) | 100 | 108 | |||||||||
| Brazilian Government International Bond | |||||||||||
| 6.00%, 1/17/17 | 190 | 218 | |||||||||
| Export - Import Bank of Korea | |||||||||||
| 4.13%, 9/9/15 | 100 | 101 | |||||||||
| Korea Development Bank | |||||||||||
| 4.38%, 8/10/15 | 130 | 133 | |||||||||
| 560 | |||||||||||
| U.S. Agency Securities (2.1%) | |||||||||||
| Federal National Mortgage Association, | |||||||||||
| 1.25%, 8/20/13 - 9/28/16 | 330 | 331 | |||||||||
| 5.38%, 6/12/17 | 700 | 850 | |||||||||
| 6.63%, 11/15/30 (f) | 100 | 149 | |||||||||
| 1,330 | |||||||||||
| U.S. Treasury Securities (11.5%) | |||||||||||
| U.S. Treasury Bond | |||||||||||
| 4.75%, 2/15/41 | 1,945 | 2,658 | |||||||||
| U.S. Treasury Notes, | |||||||||||
| 1.75%, 7/31/15 | 2,370 | 2,470 | |||||||||
| 2.25%, 3/31/16 | 2,105 | 2,238 | |||||||||
| 7,366 | |||||||||||
| Total Fixed Income Securities (Cost $60,238) | 62,212 | ||||||||||
| Shares | |||||||||||
| Short-Term Investments (6.0%) | |||||||||||
| Securities held as Collateral on Loaned Securities (0.8%) | |||||||||||
| Investment Company (0.7%) | |||||||||||
| Morgan Stanley Institutional Liquidity Funds — Money Market Portfolio — Institutional Class (See Note G-2) | 478,399 | 478 | |||||||||
| Face Amount (000) | Value (000) | ||||||||||
| Repurchase Agreements (0.1%) | |||||||||||
| Merrill Lynch & Co., Inc., (0.10%, dated 9/30/11, due 10/3/11; proceeds $12; fully collateralized by a U.S. Government Agency; Government National Mortgage Association 4.00% due 5/16/38; valued at $13) | $ | 12 | $ | 12 | |||||||
| Nomura Holdings, Inc., (0.14%, dated 9/30/11, due 10/3/11; proceeds $26; fully collateralized by U.S. Government Agencies; Federal Home Loan Mortgage Corporation 4.00% due 7/1/26; Federal National Mortgage Association 3.00% due 1/1/26; valued at $26) | 26 | 26 | |||||||||
| 38 | |||||||||||
| Total Securities held as Collateral on Loaned Securities (Cost $516) | 516 | ||||||||||
| Shares | |||||||||||
| Investment Company (4.1%) | |||||||||||
| Morgan Stanley Institutional Liquidity Funds — Money Market Portfolio — Institutional Class (See Note G-2) | 2,602,425 | 2,602 | |||||||||
| Face Amount (000) | |||||||||||
| U.S. Treasury Security (1.1%) | |||||||||||
| U.S. Treasury Bill, | |||||||||||
| 0.02%, 3/22/12 (g)(h)(i) | $ | 673 | 673 | ||||||||
| Total Short-Term Investments (Cost $3,791) | 3,791 | ||||||||||
| Total Investments (103.3%) (Cost $64,029) Including $509 of Securities Loaned (j) | 66,003 | ||||||||||
| Liabilities in Excess of Other Assets (-3.3%) | (2,093 | ) | |||||||||
| Net Assets (100.0%) | $ | 63,910 | |||||||||
(a) Security is subject to delayed delivery.
(b) 144A security — Certain conditions for public sale may exist. Unless otherwise noted, these securities are deemed to be liquid.
(c) Variable/Floating Rate Security — Interest rate changes on these instruments are based on changes in a designated base rate. The rates shown are those in effect on September 30, 2011.
(d) Inverse Floating Rate Security — Interest rate fluctuates with an inverse relationship to an associated interest rate. Indicated rate is the effective rate at September 30, 2011.
(e) When-issued security.
(f) All or a portion of this security was on loan at September 30, 2011.
(g) Rate shown is the yield to maturity at September 30, 2011.
(h) All or a portion of the security was pledged as collateral for swap agreements.
(i) All or a portion of the security was pledged to cover margin requirements for futures contracts.
(j) Securities are available for collateral in connection with securities purchased on a forward commitment basis, open futures contracts and swap agreements.
FDIC Federal Deposit Insurance Corporation.
IO Interest Only.
REMIC Real Estate Mortgage Investment Conduit.
STRIPS Separate Trading of Registered Interest and Principal of Securities.
TBA To Be Announced.
The accompanying notes are an integral part of the financial statements.
36
2011 Annual Report
September 30, 2011
Portfolio of Investments (cont'd)
Core Fixed Income Portfolio
Futures Contracts:
The Portfolio had the following futures contracts open at period end:
| Number of Contracts | Value (000) | Expiration Date | Unrealized Appreciation (Depreciation) (000) | ||||||||||||||||
| Long: | |||||||||||||||||||
| U.S. Treasury 2 yr. Note | 47 | $ | 10,350 | Dec-11 | $ | (16 | ) | ||||||||||||
| U.S. Treasury 5 yr. Note | 8 | 980 | Dec-11 | (2 | ) | ||||||||||||||
| Short: | |||||||||||||||||||
| U.S. Treasury 10 yr. Note | 75 | (9,757 | ) | Dec-11 | (41 | ) | |||||||||||||
| U.S. Treasury 30 yr. Bond | 4 | (570 | ) | Dec-11 | (12 | ) | |||||||||||||
| $ | (71 | ) | |||||||||||||||||
Zero Coupon Swap Agreements
The Portfolio had the following zero coupon swap agreements open at period end:
| Swap Counterparty | Notional Amount (000) | Floating Rate Index | Pay/Receive Floating Rate | Termination Date | Premium Paid (Received) (000) | Unrealized Appreciation (Depreciation) (000) | |||||||||||||||||||||
| Barclays Capital | $ | 1,457 | 3 Month LIBOR | Receive | 11/15/19 | $ | (105 | ) | $ | (439 | ) | ||||||||||||||||
| Barclays Capital | 1,726 | 3 Month LIBOR | Pay | 11/15/19 | 59 | 233 | |||||||||||||||||||||
| $ | (206 | ) | |||||||||||||||||||||||||
LIBOR London Interbank Offered Rate.
Fair Value Measurement Information:
The following is a summary of the inputs used to value the Portfolio's net assets as of September 30, 2011. (See Note A-6 to the financial statements for further information regarding fair value measurement.)
| Investment Type | Level 1 Unadjusted quoted prices (000) | Level 2 Other significant observable inputs (000) | Level 3 Significant unobservable inputs (000) | Total (000) | |||||||||||||||
| Assets: | |||||||||||||||||||
| Fixed Income Securities | |||||||||||||||||||
| Agency Bond — Banking (FDIC Guaranteed) | $ | — | $ | 1,498 | $ | — | $ | 1,498 | |||||||||||
| Agency Fixed Rate Mortgages | — | 17,177 | — | 17,177 | |||||||||||||||
| Asset-Backed Securities | — | 4,367 | — | 4,367 | |||||||||||||||
| Collateralized Mortgage Obligations — Agency Collateral Series | — | 5,835 | — | 5,835 | |||||||||||||||
| Commercial Mortgage Backed Securities | — | 3,003 | — | 3,003 | |||||||||||||||
| Corporate Bonds | — | 20,102 | — | 20,102 | |||||||||||||||
| Municipal Bonds | — | 974 | — | 974 | |||||||||||||||
| Sovereign | — | 560 | — | 560 | |||||||||||||||
| U.S. Agency Securities | — | 1,330 | — | 1,330 | |||||||||||||||
| U.S. Treasury Securities | — | 7,366 | — | 7,366 | |||||||||||||||
| Total Fixed Income Securities | — | 62,212 | — | 62,212 | |||||||||||||||
Fair Value Measurement Information: (cont'd)
| Investment Type | Level 1 Unadjusted quoted prices (000) | Level 2 Other significant observable inputs (000) | Level 3 Significant unobservable inputs (000) | Total (000) | |||||||||||||||
| Short-Term Investments | |||||||||||||||||||
| Investment Company | $ | 3,080 | $ | — | $ | — | $ | 3,080 | |||||||||||
| Repurchase Agreements | — | 38 | — | 38 | |||||||||||||||
| U.S. Treasury Security | — | 673 | — | 673 | |||||||||||||||
| Total Short-Term Investments | 3,080 | 711 | — | 3,791 | |||||||||||||||
| Zero Coupon Swap Agreements | — | 233 | — | 233 | |||||||||||||||
| Total Assets | 3,080 | 63,156 | — | 66,236 | |||||||||||||||
| Liabilities: | |||||||||||||||||||
| Futures Contracts | (71 | ) | — | — | (71 | ) | |||||||||||||
| Zero Coupon Swap Agreements | — | (439 | ) | — | (439 | ) | |||||||||||||
| Total Liabilities | (71 | ) | (439 | ) | — | (510 | ) | ||||||||||||
| Total | $ | 3,009 | $ | 62,717 | $ | — | $ | 65,726 | |||||||||||
Transfers between investment levels may occur as the markets fluctuate and/or the availability of data used in an investment's valuation changes. The Portfolio recognizes transfers between the levels as of the end of the period. As of September 30, 2011, the Portfolio did not have any significant investments transfer between investment levels.
The accompanying notes are an integral part of the financial statements.
37
2011 Annual Report
September 30, 2011
Portfolio of Investments (cont'd)
Core Fixed Income Portfolio
Fair Value Measurement Information: (cont'd)
Following is a reconciliation of investments in which significant unobservable inputs (Level 3) were used in determining fair value.
| Fixed Income Securities (000) | |||||||
| Beginning Balance | $ | — | @ | ||||
| Net purchases (sales) | (— | @) | |||||
| Amortization of discount | — | ||||||
| Transfers in | — | ||||||
| Transfers out | — | ||||||
| Change in unrealized appreciation/depreciation | — | @ | |||||
| Realized gains (losses) | — | @ | |||||
| Ending Balance | $ | — | |||||
| Net change in unrealized appreciation/depreciation from investments still held as of September 30, 2011 | $ | — | |||||
@ Value is less than $500.
The accompanying notes are an integral part of the financial statements.
38
2011 Annual Report
September 30, 2011
Investment Overview (unaudited)
Core Plus Fixed Income Portfolio
Performance
For the fiscal year ended September 30, 2011, the Portfolio's Class I had a total return based on net asset value and reinvestment of distributions per share of 3.74%, net of fees. The Portfolio's Class I underperformed against its benchmark the Barclays Capital U.S. Aggregate Index (the "Index"), which returned 5.26%.
Factors Affecting Performance
• Financial markets were volatile during much of the 12-month period, with political upheaval across the Middle East at the beginning of 2011. Markets were further disrupted by the earthquake in Japan in March, as investors feared supply chain disruptions for electronics and auto components. In the summer, investors focused on the U.S. debt ceiling issue. Then, in August, one of the three major bond rating agencies, Standard & Poor's, downgraded the U.S.'s credit rating from AAA to AA+. August and September were the most volatile months as concerns about the European sovereign debt crisis and a slowdown in global growth led to a dramatic sell-off in risky assets.
• The Federal Reserve's second round of quantitative easing (QE2), an asset purchase program intended to stimulate the economy by encouraging banks to lend, ended in June. Amidst renewed weakness in economic indicators in the second half of the period, the Fed announced that it would extend the maturity of its Treasury holdings to put downward pressure on longer-term interest rates. In addition, to provide support to the mortgage market, the Fed will re-invest principal payments from its mortgage and agency holdings into mortgages instead of Treasuries.
• Investment-grade corporate debt spreads versus Treasuries narrowed in the first half of the period. Corporate balance sheets have been strong, with near all-time highs in profit margins, cash flow generation and cash on balance sheet. However, in the third quarter of 2011, the credit market, especially the financial sector, was negatively affected by the increased risk aversion due to the European debt crisis and signs of slowing economic growth. Overall investment-grade corporate spreads ended the period almost 60 basis points wider after tightening about 40 basis points in first few months of the year.
• The agency mortgage sector generated positive returns versus duration neutral Treasuries. The Treasury's announcement in the first quarter that it would reduce its mortgage-backed securities portfolio initially prompted a negative reaction in the market. However, the market recovered, as the Treasury planned to sell its portfolio over a 12-month period, promising not to disrupt the market. During the second quarter, the Treasury started selling leveraged agency mortgage bonds. This supply was absorbed by the market without much impact on spreads. Toward the end of the period, the sector, especially higher coupon mortgages, came under some pressure due to concerns about a government sponsored universal refinancing program. However, we believe the sector should remain well supported given the relatively attractive yield and the Fed's plan to re-invest principal payments from their mortgage and agency holdings into mortgages.
• The U.S. Treasury yield curve flattened during the period, with yields on 2-, 5-, 10-, and 30-year Treasuries declining by 18, 32, 59, and 77 basis points, respectively.
• The Portfolio's overweight position in the investment-grade credit sector, particularly banking, detracted from relative performance.
• The Portfolio's positioning in the commercial mortgage backed security (CMBS) sector hurt performance as the sector experienced substantial spread widening in the third quarter of 2011.
• Positions in high yield securities, as well as an allocation to non-agency mortgage securities, also detracted slightly from performance. These sectors are not represented in the Index.
• The Portfolio's mortgage strategy helped performance. This was primarily due to an allocation to agency mortgage derivatives through interest only (IO) and inverse interest only (IIO) securities.
39
2011 Annual Report
September 30, 2011
Investment Overview (unaudited) (cont'd)
Core Plus Fixed Income Portfolio
Management Strategies
• Throughout the period, the Portfolio was positioned with an overweight to investment-grade credit as corporate valuations relative to fundamentals have been attractive. We reduced some credit exposure a few months ago but continue to maintain an overweight to the sector.
• Additionally, interest rate positioning contributed to performance. The Portfolio was positioned to benefit from an anticipated flattening (or, reduction in the difference of yield spreads) between the short and intermediate parts of the yield curve. We unwound the position profitably toward the end of the reporting period.
• In terms of mortgage strategy, the Portfolio had a position in IO and IIO securities. Prepayment speeds have been slow, which has been beneficial for this position. A number of factors, such as increased credit requirements and fees, have mitigated prepayments and presented hurdles for borrowers looking to refinance.
• The Portfolio also has allocations to riskier segments of the market such as high-yield corporates, non-agency mortgages and convertible bonds.
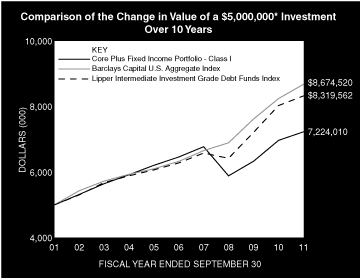
* Minimum Investment
In accordance with SEC regulations, the Portfolio's performance shown assumes that all recurring fees (including management fees) were deducted and all dividends and distributions were reinvested. The performance of Class P shares will vary from the Class I shares based upon their different inception dates and will be negatively impacted by additional fees assessed to that class.
Performance Compared to the Barclays Capital U.S. Aggregate Index(1) and the Lipper Intermediate Investment Grade Debt Funds Index(2)
| Period Ended September 30, 2011 Total Returns(3) | |||||||||||||||||||
| Average Annual | |||||||||||||||||||
| One Year | Five Years | Ten Years | Since Inception(6) | ||||||||||||||||
| Portfolio — Class I Shares w/o sales charges(4) | 3.74 | % | 2.26 | % | 3.75 | % | 7.62 | % | |||||||||||
| Barclays Capital U.S. Aggregate Index | 5.26 | 6.53 | 5.66 | 8.08 | |||||||||||||||
| Lipper Intermediate Investment Grade Debt Funds Index | 3.66 | 5.78 | 5.22 | N/A | |||||||||||||||
| Portfolio — Class P Shares w/o sales charges(5) | 3.57 | 2.01 | 3.49 | 4.64 | |||||||||||||||
| Barclays Capital U.S. Aggregate Index | 5.26 | 6.53 | 5.66 | 6.31 | |||||||||||||||
| Lipper Intermediate Investment Grade Debt Funds Index | 3.66 | 5.78 | 5.22 | 5.80 | |||||||||||||||
Performance data quoted represents past performance, which is no guarantee of future results, and current performance may be lower or higher than the figures shown. Performance assumes that all dividends and distributions, if any, were reinvested. For the most recent month-end performance figures, please visit www.morganstanley.com/im. Investment returns and principal value will fluctuate so that Portfolio shares, when redeemed, may be worth more or less than their original cost. Total returns do not reflect the deduction of taxes that a shareholder would pay on Portfolio distributions or the redemption of Portfolio shares. Performance of share classes will vary due to differences in expenses.
(1) The Barclays Capital U.S. Aggregate Index tracks the performance of all U.S. government agency and Treasury securities, investment-grade corporate debt securities, agency mortgage-backed securities, asset-backed securities and commercial mortgage-backed securities. The Index is unmanaged and its returns do not include any sales charges or fees. Such costs would lower performance. It is not possible to invest directly in an index.
(2) The Lipper Intermediate Investment Grade Debt Funds Index is an equally weighted performance index of the largest qualifying funds (based on net assets) in the Lipper Intermediate Investment Grade Debt Funds classification. The Index, which is adjusted for capital gains distributions and income dividends, is unmanaged and should not be considered an investment. There are currently 30 funds represented in this Index. As of the date of this report, the Portfolio was in the Lipper Intermediate Investment Grade Debt Funds classification.
(3) Total returns for the Portfolio reflect expenses waived and/or reimbursed, if applicable, by the Adviser. Without such waivers and/or reimbursements, total returns would have been lower. Fee waivers and/or reimbursements are expected to continue until such time that the Fund's Board of Trustees acts to discontinue such waivers and/or reimbursements.
(4) Commenced operations on November 14, 1984.
(5) Commenced operations on November 7, 1996.
(6) For comparative purposes, average annual since inception returns listed for the Indexes refer to the inception date or initial offering of the respective share class of the Portfolio, not the inception of the Indexes.
40
2011 Annual Report
September 30, 2011
Investment Overview (unaudited) (cont'd)
Core Plus Fixed Income Portfolio
Portfolio Composition*
| Classification | Percentage of Total Investments | ||||||
| Agency Fixed Rate Mortgages | 26.0 | % | |||||
| Other** | 24.9 | ||||||
| Industrials | 17.3 | ||||||
| Finance | 15.4 | ||||||
| Mortgages — Other | 8.5 | ||||||
| Collateralized Mortgage Obligations — Agency Collateral Series | 7.9 | ||||||
| Total Investments | 100.0 | %*** | |||||
* Percentages indicated are based upon total investments (excluding Securities held as Collateral on Loaned Securities) as of September 30, 2011.
** Industries and/or investment types representing less than 5% of total investments.
*** Does not include open long/short futures contracts with a value of approximately $120,557,000 and net unrealized depreciation of approximately $66,000. Also, does not include open forward foreign currency exchange contracts with net unrealized appreciation of approximately $12,000 and open swap agreements with net unrealized depreciation of approximately $469,000.
41
2011 Annual Report
September 30, 2011
Portfolio of Investments
Core Plus Fixed Income Portfolio
| Face Amount (000) | Value (000) | ||||||||||
| Fixed Income Securities (94.1%) | |||||||||||
| Agency Adjustable Rate Mortgages (0.7%) | |||||||||||
| Federal National Mortgage Association, | |||||||||||
| Conventional Pools: | |||||||||||
| 2.43%, 5/1/35 | $ | 2,024 | $ | 2,132 | |||||||
| Agency Fixed Rate Mortgages (25.7%) | |||||||||||
| Federal Home Loan Mortgage Corporation, | |||||||||||
| Conventional Pools: | |||||||||||
| 12.00%, 2/1/15 | 1 | 1 | |||||||||
| 13.00%, 6/1/19 | 1 | 1 | |||||||||
| Gold Pools: | |||||||||||
| 4.50%, 3/1/41 | 7,533 | 7,978 | |||||||||
| 5.00%, 10/1/35 | 420 | 453 | |||||||||
| 5.50%, 5/1/37 | 188 | 204 | |||||||||
| 6.00%, 2/1/32 - 10/1/38 | 3,116 | 3,430 | |||||||||
| 6.50%, 3/1/16 - 8/1/33 | 514 | 580 | |||||||||
| 7.00%, 6/1/28 - 11/1/31 | 156 | 179 | |||||||||
| 7.50%, 5/1/16 - 5/1/35 | 504 | 585 | |||||||||
| 8.00%, 8/1/32 | 240 | 286 | |||||||||
| 8.50%, 8/1/31 | 307 | 371 | |||||||||
| October TBA: | |||||||||||
| 4.00%, 10/25/41 (a) | 1,000 | 1,047 | |||||||||
| Federal National Mortgage Association, | |||||||||||
| Conventional Pools: | |||||||||||
| 4.50%, 8/1/40 - 8/1/41 | 15,779 | 16,769 | |||||||||
| 5.00%, 1/1/37 - 3/1/41 | 3,742 | 4,044 | |||||||||
| 5.50%, 6/1/35 - 5/1/41 | 13,777 | 15,085 | |||||||||
| 6.00%, 10/1/31 - 10/1/38 | 3,444 | 3,789 | |||||||||
| 6.50%, 11/1/23 - 12/1/36 | 6,349 | 7,165 | |||||||||
| 7.00%, 11/1/13 - 1/1/34 | 904 | 1,036 | |||||||||
| 7.50%, 8/1/37 | 722 | 844 | |||||||||
| 8.00%, 2/1/12 - 4/1/33 | 567 | 663 | |||||||||
| 8.50%, 1/1/15 - 10/1/32 | 531 | 625 | |||||||||
| 9.50%, 4/1/30 | 819 | 983 | |||||||||
| 11.25%, 8/1/13 | 1 | 1 | |||||||||
| 12.00%, 11/1/15 | 29 | 33 | |||||||||
| 12.50%, 9/1/15 | 6 | 7 | |||||||||
| October TBA: | |||||||||||
| 4.00%, 10/25/41 (a) | 3,700 | 3,879 | |||||||||
| Government National Mortgage Association, | |||||||||||
| October TBA: | |||||||||||
| 3.50%, 10/25/41 (a) | 3,125 | 3,266 | |||||||||
| Various Pools: | |||||||||||
| 4.50%, 8/15/39 - 5/15/40 | 3,391 | 3,693 | |||||||||
| 76,997 | |||||||||||
| Asset-Backed Securities (3.7%) | |||||||||||
| Ally Master Owner Trust | |||||||||||
| 3.47%, 4/15/15 (b) | 578 | 589 | |||||||||
| ARI Fleet Lease Trust | |||||||||||
| 1.68%, 8/15/18 (b)(c) | 357 | 359 | |||||||||
| CLI Funding LLC | |||||||||||
| 4.50%, 3/18/26 (b) | 1,290 | 1,306 | |||||||||
| Face Amount (000) | Value (000) | ||||||||||
| Contimortgage Home Equity Trust | |||||||||||
| 8.10%, 8/15/25 | $ | 44 | $ | 44 | |||||||
| CVS Pass-Through Trust | |||||||||||
| 6.04%, 12/10/28 | 1,483 | 1,565 | |||||||||
| FUEL Trust | |||||||||||
| 4.21%, 4/15/16 (b) | 860 | 858 | |||||||||
| Mid-State Trust | |||||||||||
| 8.33%, 4/1/30 | 37 | 37 | |||||||||
| Santander Drive Auto Receivables Trust | |||||||||||
| 3.06%, 11/15/17 | 1,075 | 1,077 | |||||||||
| SLM Student Loan Trust | |||||||||||
| 4.37%, 4/17/28 (b) | 825 | 875 | |||||||||
| Textainer Marine Containers Ltd. | |||||||||||
| 4.70%, 6/15/26 (b) | 731 | 737 | |||||||||
| U-Haul S Fleet LLC | |||||||||||
| 4.90%, 10/25/23 (b) | 1,667 | 1,720 | |||||||||
| Westlake Automobile Receivables Trust | |||||||||||
| 5.00%, 5/15/15 (b) | 1,950 | 1,956 | |||||||||
| 11,123 | |||||||||||
| Collateralized Mortgage Obligations — Agency Collateral Series (7.8%) | |||||||||||
| Federal Home Loan Mortgage Corporation, | |||||||||||
| IO | |||||||||||
| 0.84%, 1/25/21 (c) | 10,172 | 442 | |||||||||
| IO REMIC | |||||||||||
| 5.00%, 12/15/20 - 12/15/37 | 6,119 | 852 | |||||||||
| 5.72%, 6/15/41 (c) | 29,143 | 3,466 | |||||||||
| 5.74%, 6/15/40 (c) | 4,409 | 690 | |||||||||
| 5.91%, 7/15/37 (c) | 3,610 | 516 | |||||||||
| 6.24%, 6/15/40 (c) | 14,935 | 2,857 | |||||||||
| IO STRIPS | |||||||||||
| 7.50%, 12/1/29 | 100 | 23 | |||||||||
| 8.00%, 1/1/28 - 6/15/31 | 812 | 172 | |||||||||
| PAC REMIC | |||||||||||
| 9.50%, 4/15/20 | 2 | 2 | |||||||||
| 10.00%, 6/15/20 | 1 | 2 | |||||||||
| REMIC | |||||||||||
| 22.09%, 5/15/41 (c)(d) | 1,533 | 1,693 | |||||||||
| Federal National Mortgage Association, | |||||||||||
| IO | |||||||||||
| 6.16%, 9/25/20 (c) | 10,201 | 2,659 | |||||||||
| IO PAC REMIC | |||||||||||
| 8.00%, 9/18/27 | 445 | 97 | |||||||||
| IO REMIC | |||||||||||
| 5.00%, 8/25/37 | 3,279 | 241 | |||||||||
| 6.00%, 7/25/33 | 829 | 120 | |||||||||
| 6.47%, 2/25/24 (c) | 3,741 | 412 | |||||||||
| IO STRIPS | |||||||||||
| 6.50%, 9/1/29 - 12/1/29 | 1,961 | 388 | |||||||||
| 8.00%, 4/1/24 - 6/1/30 | 1,437 | 304 | |||||||||
| 8.50%, 10/1/25 | 142 | 31 | |||||||||
| 9.00%, 11/1/26 | 133 | 28 | |||||||||
| REMIC | |||||||||||
| 7.00%, 9/25/32 | 958 | 1,128 | |||||||||
The accompanying notes are an integral part of the financial statements.
42
2011 Annual Report
September 30, 2011
Portfolio of Investments (cont'd)
Core Plus Fixed Income Portfolio
| Face Amount (000) | Value (000) | ||||||||||
| Collateralized Mortgage Obligations — Agency Collateral Series (cont'd) | |||||||||||
| 9.16%, 10/25/41 | $ | 1,017 | $ | 1,002 | |||||||
| 63.02%, 9/25/20 (c)(d) | 12 | 26 | |||||||||
| Government National Mortgage Association, | |||||||||||
| IO REMIC | |||||||||||
| 0.85%, 8/20/58 (c) | 17,349 | 564 | |||||||||
| 4.50%, 6/20/39 | 2,855 | 465 | |||||||||
| 5.00%, 2/16/41 | 1,007 | 212 | |||||||||
| 5.22%, 6/20/41 (c) | 4,460 | 632 | |||||||||
| 5.82%, 11/16/40 (c) | 5,450 | 1,101 | |||||||||
| 6.02%, 10/20/37 (c) | 4,159 | 352 | |||||||||
| 6.35%, 6/20/40 (c) | 4,038 | 716 | |||||||||
| 6.37%, 4/16/41 (c) | 7,419 | 1,487 | |||||||||
| 6.44%, 4/16/41 (c) | 4,111 | 738 | |||||||||
| 23,418 | |||||||||||
| Commercial Mortgage Backed Securities (3.8%) | |||||||||||
| Banc of America Merrill Lynch Commercial Mortgage, Inc. | |||||||||||
| 5.83%, 4/10/49 (c) | 795 | 677 | |||||||||
| Bear Stearns Commercial Mortgage Securities, | |||||||||||
| 5.36%, 2/11/44 | 700 | 596 | |||||||||
| 5.47%, 1/12/45 (c) | 1,526 | 1,682 | |||||||||
| Citigroup Commercial Mortgage Trust (See Note G-2), | |||||||||||
| 5.89%, 12/10/49 (c) | 1,285 | 1,190 | |||||||||
| 5.92%, 3/15/49 (c) | 435 | 432 | |||||||||
| DBUBS Mortgage Trust | |||||||||||
| 5.63%, 7/10/44 (b)(c) | 325 | 275 | |||||||||
| FREMF Mortgage Trust | |||||||||||
| 5.33%, 2/25/47 (b)(c) | 525 | 505 | |||||||||
| Greenwich Capital Commercial Funding Corp., | |||||||||||
| 5.48%, 3/10/39 | 675 | 571 | |||||||||
| 5.87%, 12/10/49 (c) | 2,185 | 1,769 | |||||||||
| JP Morgan Chase Commercial Mortgage Securities Corp., | |||||||||||
| 4.80%, 7/15/46 (b) | 775 | 716 | |||||||||
| 6.10%, 2/12/51 (c) | 540 | 486 | |||||||||
| 6.26%, 2/15/51 (c) | 730 | 624 | |||||||||
| LB-UBS Commercial Mortgage Trust, | |||||||||||
| 5.28%, 2/15/41 (c) | 1,600 | 1,314 | |||||||||
| 6.37%, 9/15/45 (c) | 835 | 691 | |||||||||
| 11,528 | |||||||||||
| Corporate Bonds (34.9%) | |||||||||||
| Finance (15.2%) | |||||||||||
| ABB Treasury Center USA, Inc. | |||||||||||
| 2.50%, 6/15/16 (b) | 800 | 818 | |||||||||
| Abbey National Treasury Services PLC | |||||||||||
| 3.88%, 11/10/14 (b) | 439 | 422 | |||||||||
| Aegon N.V. | |||||||||||
| 4.63%, 12/1/15 | 830 | 849 | |||||||||
| Affiliated Managers Group, Inc. | |||||||||||
| 3.95%, 8/15/38 | 496 | 523 | |||||||||
| American International Group, Inc. | |||||||||||
| 6.40%, 12/15/20 | 850 | 867 | |||||||||
| Face Amount (000) | Value (000) | ||||||||||
| Banco Votorantim SA | |||||||||||
| 5.25%, 2/11/16 (b) | $ | 700 | $ | 698 | |||||||
| Bank of America Corp. | |||||||||||
| 5.63%, 7/1/20 | 360 | 332 | |||||||||
| Barclays Bank PLC | |||||||||||
| 6.05%, 12/4/17 (b) | 600 | 551 | |||||||||
| BBVA Bancomer SA | |||||||||||
| 4.50%, 3/10/16 (b) | 1,000 | 940 | |||||||||
| BBVA US Senior SAU | |||||||||||
| 3.25%, 5/16/14 | 400 | 375 | |||||||||
| Bear Stearns Cos. LLC (The) | |||||||||||
| 7.25%, 2/1/18 | 1,090 | 1,287 | |||||||||
| BNP Paribas SA | |||||||||||
| 5.00%, 1/15/21 | 615 | 603 | |||||||||
| Brandywine Operating Partnership LP | |||||||||||
| 4.95%, 4/15/18 | 750 | 726 | |||||||||
| Brookfield Asset Management, Inc. | |||||||||||
| 5.80%, 4/25/17 | 300 | 317 | |||||||||
| Capital One Bank, USA NA | |||||||||||
| 8.80%, 7/15/19 | 555 | 655 | |||||||||
| Citigroup, Inc. (See Note G-2), | |||||||||||
| 5.88%, 5/29/37 | 1,089 | 1,044 | |||||||||
| 8.50%, 5/22/19 | 704 | 852 | |||||||||
| CNA Financial Corp. | |||||||||||
| 5.75%, 8/15/21 | 315 | 318 | |||||||||
| Coventry Health Care, Inc. | |||||||||||
| 5.45%, 6/15/21 | 540 | 584 | |||||||||
| Credit Suisse | |||||||||||
| 6.00%, 2/15/18 | 369 | 375 | |||||||||
| Dexus Diversified Trust/Dexus Office Trust | |||||||||||
| 5.60%, 3/15/21 (b) | 600 | 627 | |||||||||
| Digital Realty Trust LP | |||||||||||
| 4.50%, 7/15/15 | 400 | 409 | |||||||||
| Discover Bank | |||||||||||
| 7.00%, 4/15/20 | 575 | 610 | |||||||||
| Farmers Insurance Exchange | |||||||||||
| 8.63%, 5/1/24 (b) | 845 | 1,039 | |||||||||
| Fifth Third Bancorp | |||||||||||
| 3.63%, 1/25/16 | 425 | 432 | |||||||||
| General Electric Capital Corp., | |||||||||||
| 5.30%, 2/11/21 | 630 | 655 | |||||||||
| 6.00%, 8/7/19 | 1,694 | 1,910 | |||||||||
| Genworth Financial, Inc. | |||||||||||
| 7.20%, 2/15/21 | 625 | 532 | |||||||||
| Goldman Sachs Group, Inc. (The) | |||||||||||
| 6.15%, 4/1/18 | 1,910 | 1,982 | |||||||||
| Goodman Funding Pty Ltd. | |||||||||||
| 6.38%, 4/15/21 (b) | 850 | 876 | |||||||||
| Hartford Financial Services Group, Inc. | |||||||||||
| 5.50%, 3/30/20 | 645 | 630 | |||||||||
| HBOS PLC | |||||||||||
| 6.75%, 5/21/18 (b) | 1,388 | 1,185 | |||||||||
The accompanying notes are an integral part of the financial statements.
43
2011 Annual Report
September 30, 2011
Portfolio of Investments (cont'd)
Core Plus Fixed Income Portfolio
| Face Amount (000) | Value (000) | ||||||||||
| Finance (cont'd) | |||||||||||
| HCP, Inc., | |||||||||||
| 5.38%, 2/1/21 | $ | 300 | $ | 302 | |||||||
| 5.63%, 5/1/17 | 425 | 441 | |||||||||
| Health Care REIT, Inc., | |||||||||||
| 4.75%, 7/15/27 | 520 | 556 | |||||||||
| 6.13%, 4/15/20 | 415 | 433 | |||||||||
| HSBC Holdings PLC | |||||||||||
| 5.10%, 4/5/21 | 1,625 | 1,676 | |||||||||
| ING Bank N.V. | |||||||||||
| 4.00%, 3/15/16 (b) | 595 | 599 | |||||||||
| Intesa Sanpaolo SpA | |||||||||||
| 6.50%, 2/24/21 (b) | 440 | 392 | |||||||||
| JPMorgan Chase Bank NA | |||||||||||
| 6.00%, 10/1/17 | 715 | 753 | |||||||||
| Lloyds TSB Bank PLC | |||||||||||
| 5.80%, 1/13/20 (b) | 575 | 548 | |||||||||
| Macquarie Bank Ltd. | |||||||||||
| 6.63%, 4/7/21 (b) | 490 | 461 | |||||||||
| Macquarie Group Ltd. | |||||||||||
| 6.00%, 1/14/20 (b) | 588 | 558 | |||||||||
| Merrill Lynch & Co., Inc., | |||||||||||
| MTN | |||||||||||
| 6.88%, 4/25/18 | 908 | 909 | |||||||||
| MetLife, Inc. | |||||||||||
| 7.72%, 2/15/19 | 285 | 350 | |||||||||
| NASDAQ OMX Group, Inc. (The) | |||||||||||
| 5.55%, 1/15/20 | 225 | 226 | |||||||||
| Nationwide Building Society | |||||||||||
| 6.25%, 2/25/20 (b) | 1,195 | 1,206 | |||||||||
| Nationwide Financial Services | |||||||||||
| 5.38%, 3/25/21 (b) | 450 | 441 | |||||||||
| Nordea Bank AB | |||||||||||
| 4.88%, 5/13/21 (b) | 765 | 655 | |||||||||
| Platinum Underwriters Finance, Inc., | |||||||||||
| Series B | |||||||||||
| 7.50%, 6/1/17 | 791 | 861 | |||||||||
| Principal Financial Group, Inc. | |||||||||||
| 8.88%, 5/15/19 | 658 | 839 | |||||||||
| QBE Capital Funding III Ltd. | |||||||||||
| 7.25%, 5/24/41 (b)(c) | 550 | 498 | |||||||||
| Regions Financial Corp. | |||||||||||
| 5.75%, 6/15/15 | 545 | 529 | |||||||||
| Reinsurance Group of America, Inc. | |||||||||||
| 6.45%, 11/15/19 | 824 | 937 | |||||||||
| Royal Bank of Scotland PLC (The) | |||||||||||
| 4.88%, 3/16/15 | 455 | 446 | |||||||||
| Santander Holdings USA, Inc. | |||||||||||
| 4.63%, 4/19/16 | 250 | 241 | |||||||||
| Santander US Debt SA Unipersonal | |||||||||||
| 3.72%, 1/20/15 (b) | 1,200 | 1,114 | |||||||||
| SLM Corp., | |||||||||||
| MTN | |||||||||||
| 6.25%, 1/25/16 | 580 | 570 | |||||||||
| Face Amount (000) | Value (000) | ||||||||||
| Societe Generale SA | |||||||||||
| 5.20%, 4/15/21 (b) | $ | 455 | $ | 396 | |||||||
| Standard Chartered Bank | |||||||||||
| 6.40%, 9/26/17 (b) | 790 | 834 | |||||||||
| Ventas Realty LP/Ventas Capital Corp. | |||||||||||
| 4.75%, 6/1/21 | 925 | 890 | |||||||||
| Vornado Realty LP | |||||||||||
| 3.88%, 4/15/25 | 507 | 525 | |||||||||
| Wachovia Bank NA | |||||||||||
| 6.00%, 11/15/17 | 415 | 460 | |||||||||
| Wachovia Corp. | |||||||||||
| 5.63%, 10/15/16 | 400 | 433 | |||||||||
| WEA Finance LLC | |||||||||||
| 4.63%, 5/10/21 (b) | 650 | 622 | |||||||||
| Wells Operating Partnership II LP | |||||||||||
| 5.88%, 4/1/18 | 800 | 818 | |||||||||
| 45,542 | |||||||||||
| Industrials (17.1%) | |||||||||||
| Alpha Natural Resources, Inc., | |||||||||||
| 6.00%, 6/1/19 | 100 | 94 | |||||||||
| 6.25%, 6/1/21 | 280 | 263 | |||||||||
| Altria Group, Inc., | |||||||||||
| 4.13%, 9/11/15 | 45 | 48 | |||||||||
| 9.25%, 8/6/19 | 687 | 902 | |||||||||
| Amgen, Inc., | |||||||||||
| Series B | |||||||||||
| 0.38%, 2/1/13 | 571 | 564 | |||||||||
| ArcelorMittal | |||||||||||
| 9.85%, 6/1/19 | 666 | 756 | |||||||||
| Archer-Daniels-Midland Co. | |||||||||||
| 0.88%, 2/15/14 | 535 | 535 | |||||||||
| AT&T, Inc. | |||||||||||
| 6.30%, 1/15/38 | 500 | 575 | |||||||||
| BAA Funding Ltd. | |||||||||||
| 4.88%, 7/15/21 (b) | 750 | 765 | |||||||||
| Barrick North America Finance LLC | |||||||||||
| 4.40%, 5/30/21 | 430 | 442 | |||||||||
| BAT International Finance PLC | |||||||||||
| 9.50%, 11/15/18 (b) | 930 | 1,264 | |||||||||
| Bemis Co., Inc. | |||||||||||
| 4.50%, 10/15/21 (e) | 525 | 532 | |||||||||
| Best Buy Co., Inc. | |||||||||||
| 3.75%, 3/15/16 | 920 | 893 | |||||||||
| Bombardier, Inc. | |||||||||||
| 7.75%, 3/15/20 (b) | 575 | 615 | |||||||||
| Bunge Ltd. Finance Corp. | |||||||||||
| 8.50%, 6/15/19 | 566 | 706 | |||||||||
| CBS Corp. | |||||||||||
| 8.88%, 5/15/19 | 500 | 639 | |||||||||
| CenturyLink, Inc. | |||||||||||
| 6.45%, 6/15/21 | 440 | 408 | |||||||||
| CF Industries, Inc. | |||||||||||
| 6.88%, 5/1/18 | 1,075 | 1,203 | |||||||||
The accompanying notes are an integral part of the financial statements.
44
2011 Annual Report
September 30, 2011
Portfolio of Investments (cont'd)
Core Plus Fixed Income Portfolio
| Face Amount (000) | Value (000) | ||||||||||
| Industrials (cont'd) | |||||||||||
| Chrysler Group LLC/CG Co-Issuer, Inc. | |||||||||||
| 8.00%, 6/15/19 (b) | $ | 760 | $ | 597 | |||||||
| Comcast Corp., | |||||||||||
| 5.15%, 3/1/20 (f) | 555 | 627 | |||||||||
| 5.70%, 5/15/18 | 98 | 113 | |||||||||
| ConAgra Foods, Inc., | |||||||||||
| 7.00%, 10/1/28 | 150 | 175 | |||||||||
| 8.25%, 9/15/30 | 540 | 696 | |||||||||
| Concho Resources, Inc. | |||||||||||
| 7.00%, 1/15/21 | 115 | 115 | |||||||||
| Constellation Brands, Inc. | |||||||||||
| 7.25%, 9/1/16 | 370 | 390 | |||||||||
| Continental Resources, Inc. | |||||||||||
| 7.13%, 4/1/21 | 575 | 584 | |||||||||
| Cooper US, Inc. | |||||||||||
| 5.25%, 11/15/12 | 846 | 886 | |||||||||
| Corning, Inc. | |||||||||||
| 7.25%, 8/15/36 | 270 | 334 | |||||||||
| COX Communications, Inc. | |||||||||||
| 8.38%, 3/1/39 (b) | 164 | 227 | |||||||||
| CRH America, Inc. | |||||||||||
| 6.00%, 9/30/16 | 580 | 622 | |||||||||
| Daimler Finance North America LLC, | |||||||||||
| 7.30%, 1/15/12 | 622 | 633 | |||||||||
| 8.50%, 1/18/31 | 224 | 318 | |||||||||
| Darden Restaurants, Inc. | |||||||||||
| 6.20%, 10/15/17 (f) | 520 | 606 | |||||||||
| Delhaize Group SA | |||||||||||
| 5.70%, 10/1/40 | 758 | 788 | |||||||||
| DirecTV Holdings LLC/DirecTV Financing Co., Inc., | |||||||||||
| 5.88%, 10/1/19 | 483 | 544 | |||||||||
| 7.63%, 5/15/16 | 332 | 357 | |||||||||
| DISH DBS Corp. | |||||||||||
| 7.13%, 2/1/16 | 580 | 590 | |||||||||
| Expedia, Inc. | |||||||||||
| 5.95%, 8/15/20 | 235 | 237 | |||||||||
| Fiserv, Inc. | |||||||||||
| 3.13%, 6/15/16 | 535 | 542 | |||||||||
| FMG Resources August 2006 Pty Ltd., | |||||||||||
| 6.38%, 2/1/16 (b) | 380 | 344 | |||||||||
| 6.88%, 2/1/18 (b) | 140 | 124 | |||||||||
| Frontier Communications Corp. | |||||||||||
| 8.50%, 4/15/20 | 750 | 731 | |||||||||
| Gap, Inc. (The) | |||||||||||
| 5.95%, 4/12/21 | 645 | 608 | |||||||||
| Gazprom OAO Via Gaz Capital SA | |||||||||||
| 6.51%, 3/7/22 (b) | 340 | 334 | |||||||||
| Georgia-Pacific LLC, | |||||||||||
| 7.75%, 11/15/29 | 385 | 446 | |||||||||
| 8.88%, 5/15/31 | 480 | 601 | |||||||||
| Grupo Bimbo SAB de CV | |||||||||||
| 4.88%, 6/30/20 (b) | 735 | 746 | |||||||||
| Face Amount (000) | Value (000) | ||||||||||
| Harley-Davidson Funding Corp. | |||||||||||
| 6.80%, 6/15/18 (b) | $ | 630 | $ | 735 | |||||||
| Holcim US Finance Sarl & Cie SCS | |||||||||||
| 6.00%, 12/30/19 (b) | 483 | 513 | |||||||||
| Home Depot, Inc. | |||||||||||
| 5.88%, 12/16/36 | 793 | 926 | |||||||||
| Hyatt Hotels Corp. | |||||||||||
| 6.88%, 8/15/19 (b) | 545 | 614 | |||||||||
| Ingram Micro, Inc. | |||||||||||
| 5.25%, 9/1/17 | 295 | 314 | |||||||||
| Intel Corp. | |||||||||||
| 2.95%, 12/15/35 | 588 | 599 | |||||||||
| International Game Technology | |||||||||||
| 3.25%, 5/1/14 (f) | 492 | 568 | |||||||||
| International Paper Co. | |||||||||||
| 7.50%, 8/15/21 | 465 | 539 | |||||||||
| JC Penney Co., Inc. | |||||||||||
| 5.65%, 6/1/20 (f) | 310 | 292 | |||||||||
| JC Penney Corp., Inc. | |||||||||||
| 6.38%, 10/15/36 | 647 | 547 | |||||||||
| Kinross Gold Corp. | |||||||||||
| 5.13%, 9/1/21 (b) | 520 | 517 | |||||||||
| KLA-Tencor Corp. | |||||||||||
| 6.90%, 5/1/18 | 659 | 754 | |||||||||
| Kraft Foods, Inc. | |||||||||||
| 7.00%, 8/11/37 | 170 | 220 | |||||||||
| Lafarge SA | |||||||||||
| 6.20%, 7/9/15 (b) | 765 | 762 | |||||||||
| Lam Research Corp. | |||||||||||
| 1.25%, 5/15/18 (b) | 651 | 606 | |||||||||
| Life Technologies Corp. | |||||||||||
| 6.00%, 3/1/20 | 605 | 671 | |||||||||
| Medtronic, Inc., | |||||||||||
| Series B | |||||||||||
| 1.63%, 4/15/13 | 563 | 566 | |||||||||
| Microsoft Corp. | |||||||||||
| Zero Coupon, 6/15/13 (b)(f) | 534 | 543 | |||||||||
| Molson Coors Brewing Co. | |||||||||||
| 2.50%, 7/30/13 (f) | 497 | 525 | |||||||||
| Mosaic Co. (The) | |||||||||||
| 7.63%, 12/1/16 (b) | 335 | 351 | |||||||||
| NBC Universal Media LLC | |||||||||||
| 5.15%, 4/30/20 | 915 | 1,005 | |||||||||
| News America, Inc. | |||||||||||
| 4.50%, 2/15/21 | 340 | 342 | |||||||||
| Omnicom Group, Inc. | |||||||||||
| 4.45%, 8/15/20 | 470 | 475 | |||||||||
| Petrobras International Finance Co. | |||||||||||
| 5.75%, 1/20/20 | 625 | 655 | |||||||||
| QEP Resources, Inc. | |||||||||||
| 6.88%, 3/1/21 | 385 | 404 | |||||||||
| Quest Diagnostics, Inc. | |||||||||||
| 6.95%, 7/1/37 | 400 | 504 | |||||||||
The accompanying notes are an integral part of the financial statements.
45
2011 Annual Report
September 30, 2011
Portfolio of Investments (cont'd)
Core Plus Fixed Income Portfolio
| Face Amount (000) | Value (000) | ||||||||||
| Industrials (cont'd) | |||||||||||
| RadioShack Corp. | |||||||||||
| 2.50%, 8/1/13 (b) | $ | 563 | $ | 545 | |||||||
| Sable International Finance Ltd. | |||||||||||
| 7.75%, 2/15/17 (b) | 1,255 | 1,224 | |||||||||
| SBA Telecommunications, Inc. | |||||||||||
| 8.25%, 8/15/19 | 685 | 723 | |||||||||
| Symantec Corp., | |||||||||||
| Series B | |||||||||||
| 1.00%, 6/15/13 (f) | 488 | 558 | |||||||||
| Tech Data Corp. | |||||||||||
| 2.75%, 12/15/26 | 529 | 532 | |||||||||
| Teck Resources Ltd., | |||||||||||
| 4.75%, 1/15/22 (f) | 380 | 388 | |||||||||
| 6.25%, 7/15/41 | 435 | 458 | |||||||||
| Telecom Italia Capital SA, | |||||||||||
| 7.00%, 6/4/18 | 310 | 311 | |||||||||
| 7.18%, 6/18/19 | 230 | 231 | |||||||||
| Telefonica Europe BV | |||||||||||
| 8.25%, 9/15/30 | 811 | 910 | |||||||||
| Time Warner, Inc., | |||||||||||
| 4.70%, 1/15/21 | 200 | 209 | |||||||||
| 4.75%, 3/29/21 | 405 | 426 | |||||||||
| 5.88%, 11/15/16 | 170 | 192 | |||||||||
| 7.70%, 5/1/32 | 66 | 84 | |||||||||
| Vale Overseas Ltd., | |||||||||||
| 5.63%, 9/15/19 | 694 | 734 | |||||||||
| 6.88%, 11/10/39 | 104 | 113 | |||||||||
| Verisk Analytics, Inc. | |||||||||||
| 5.80%, 5/1/21 | 550 | 619 | |||||||||
| Vivendi SA | |||||||||||
| 6.63%, 4/4/18 (b) | 758 | 861 | |||||||||
| Warner Chilcott Co. LLC | |||||||||||
| 7.75%, 9/15/18 | 800 | 768 | |||||||||
| Wesfarmers Ltd. | |||||||||||
| 2.98%, 5/18/16 (b) | 390 | 395 | |||||||||
| WPP Finance UK | |||||||||||
| 8.00%, 9/15/14 | 864 | 978 | |||||||||
| Wynn Las Vegas LLC/Wynn Las Vegas Capital Corp. | |||||||||||
| 7.75%, 8/15/20 | 350 | 369 | |||||||||
| 51,294 | |||||||||||
| Utilities (2.6%) | |||||||||||
| Enel Finance International N.V. | |||||||||||
| 5.13%, 10/7/19 (b) | 655 | 615 | |||||||||
| Energy Transfer Partners LP | |||||||||||
| 9.00%, 4/15/19 | 875 | 1,056 | |||||||||
| Enterprise Products Operating LLC | |||||||||||
| 5.20%, 9/1/20 | 635 | 699 | |||||||||
| EQT Corp. | |||||||||||
| 8.13%, 6/1/19 | 400 | 486 | |||||||||
| Exelon Generation Co. LLC | |||||||||||
| 6.25%, 10/1/39 | 795 | 927 | |||||||||
| Face Amount (000) | Value (000) | ||||||||||
| FirstEnergy Solutions Corp. | |||||||||||
| 6.05%, 8/15/21 | $ | 869 | $ | 964 | |||||||
| Iberdrola Finance Ireland Ltd. | |||||||||||
| 5.00%, 9/11/19 (b) | 1,125 | 1,089 | |||||||||
| NRG Energy, Inc. | |||||||||||
| 8.50%, 6/15/19 | 665 | 645 | |||||||||
| Plains All American Pipeline LP/PAA Finance Corp. | |||||||||||
| 6.70%, 5/15/36 | 614 | 701 | |||||||||
| PPL WEM Holdings PLC | |||||||||||
| 3.90%, 5/1/16 (b) | 625 | 656 | |||||||||
| 7,838 | |||||||||||
| 104,674 | |||||||||||
| Mortgages — Other (8.4%) | |||||||||||
| American Home Mortgage Investment Trust | |||||||||||
| 0.41%, 12/25/46 (c) | 1,669 | 962 | |||||||||
| Banc of America Alternative Loan Trust, | |||||||||||
| 5.86%, 10/25/36 (c) | 1,247 | 812 | |||||||||
| 5.91%, 10/25/36 (c) | 2,050 | 1,292 | |||||||||
| 6.00%, 4/25/36 | 908 | 852 | |||||||||
| Banc of America Funding Corp. | |||||||||||
| 0.60%, 8/25/36 (c) | 841 | 723 | |||||||||
| Chase Mortgage Finance Corp., | |||||||||||
| 5.50%, 11/25/35 | 1,071 | 1,014 | |||||||||
| 6.00%, 11/25/36 | 1,268 | 1,067 | |||||||||
| Chaseflex Trust | |||||||||||
| 6.00%, 2/25/37 | 2,058 | 1,424 | |||||||||
| Countrywide Alternative Loan Trust | |||||||||||
| 0.58%, 9/25/35 (c) | 1,966 | 1,180 | |||||||||
| Countrywide Home Loan Mortgage Pass-Through Trust | |||||||||||
| 0.53%, 4/25/46 (c) | 2,617 | 810 | |||||||||
| First Horizon Alternative Mortgage Securities | |||||||||||
| 6.25%, 8/25/36 | 1,335 | 941 | |||||||||
| FREMF Mortgage Trust | |||||||||||
| 4.89%, 7/25/44 (b)(c) | 1,115 | 1,018 | |||||||||
| GMAC Mortgage Corp. Loan Trust | |||||||||||
| 4.25%, 7/25/40 (b) | 179 | 179 | |||||||||
| GS Mortgage Securities Corp. | |||||||||||
| 7.50%, 9/25/36 (b)(c) | 1,546 | 1,221 | |||||||||
| JP Morgan Chase Commercial Mortgage Securities Corp. | |||||||||||
| 4.17%, 8/15/46 | 1,100 | 1,123 | |||||||||
| JP Morgan Mortgage Trust, | |||||||||||
| 6.00%, 6/25/37 | 1,033 | 935 | |||||||||
| 6.25%, 7/25/36 | 1,679 | 1,616 | |||||||||
| Lehman Mortgage Trust, | |||||||||||
| 5.50%, 11/25/35 - 2/25/36 | 2,943 | 2,676 | |||||||||
| 6.50%, 9/25/37 | 2,249 | 1,778 | |||||||||
| Luminent Mortgage Trust | |||||||||||
| 0.37%, 1/25/37 (c) | 815 | 482 | |||||||||
| Structured Asset Mortgage Investments, Inc. | |||||||||||
| 0.46%, 8/25/36 (c) | 2,691 | 658 | |||||||||
The accompanying notes are an integral part of the financial statements.
46
2011 Annual Report
September 30, 2011
Portfolio of Investments (cont'd)
Core Plus Fixed Income Portfolio
| Face Amount (000) | Value (000) | ||||||||||
| Mortgages — Other (cont'd) | |||||||||||
| WaMu Mortgage Pass-Through Certificates, | |||||||||||
| 1.01%, 5/25/47 (c) | $ | 1,690 | $ | 1,022 | |||||||
| 1.22%, 7/25/46 (c) | 2,164 | 1,308 | |||||||||
| 25,093 | |||||||||||
| Municipal Bonds (2.0%) | |||||||||||
| Chicago Transit Authority | |||||||||||
| 6.20%, 12/1/40 | 665 | 772 | |||||||||
| City of Chicago, IL, O'Hare International Airport Revenue | |||||||||||
| 6.40%, 1/1/40 | 255 | 309 | |||||||||
| City of New York, NY, Series G-1 | |||||||||||
| 5.97%, 3/1/36 | 545 | 665 | |||||||||
| Illinois State Toll Highway Authority, Highway Revenue, Build America Bonds | |||||||||||
| 6.18%, 1/1/34 | 877 | 1,031 | |||||||||
| Municipal Electric Authority of Georgia, | |||||||||||
| 6.64%, 4/1/57 | 563 | 614 | |||||||||
| 6.66%, 4/1/57 | 1,076 | 1,148 | |||||||||
| New York City Transitional Finance Authority | |||||||||||
| 5.27%, 5/1/27 | 540 | 609 | |||||||||
| State of California, General Obligation Bonds | |||||||||||
| 5.95%, 4/1/16 | 830 | 946 | |||||||||
| 6,094 | |||||||||||
| Sovereign (1.4%) | |||||||||||
| Bermuda Government International Bond | |||||||||||
| 5.60%, 7/20/20 (b) | 775 | 838 | |||||||||
| Brazilian Government International Bond | |||||||||||
| 6.00%, 1/17/17 | 1,096 | 1,254 | |||||||||
| Export - Import Bank of Korea | |||||||||||
| 4.13%, 9/9/15 | 600 | 608 | |||||||||
| Korea Development Bank | |||||||||||
| 4.38%, 8/10/15 | 875 | 895 | |||||||||
| Qatar Government International Bond | |||||||||||
| 4.00%, 1/20/15 (b) | 645 | 681 | |||||||||
| 4,276 | |||||||||||
| U.S. Agency Securities (1.6%) | |||||||||||
| Federal Home Loan Mortgage Corporation | |||||||||||
| 3.75%, 3/27/19 (f) | 3,500 | 3,960 | |||||||||
| 6.75%, 3/15/31 | 470 | 714 | |||||||||
| 4,674 | |||||||||||
| U.S. Treasury Security (4.1%) | |||||||||||
| U.S. Treasury Bond | |||||||||||
| 4.75%, 2/15/41 | 9,115 | 12,456 | |||||||||
| Total Fixed Income Securities (Cost $285,047) | 282,465 | ||||||||||
| Shares | Value (000) | ||||||||||
| Short-Term Investments (6.0%) | |||||||||||
| Securities held as Collateral on Loaned Securities (1.3%) | |||||||||||
| Investment Company (1.2%) | |||||||||||
| Morgan Stanley Institutional Liquidity Funds — Money Market Portfolio — Institutional Class (See Note G-2) | 3,513,831 | $ | 3,514 | ||||||||
| Face Amount (000) | |||||||||||
| Repurchase Agreements (0.1%) | |||||||||||
| Merrill Lynch & Co., Inc., (0.10%, dated 9/30/11, due 10/3/11; proceeds $91; fully collateralized by a U.S. Government Agency; Government National Mortgage Association 4.00% due 5/16/38; valued at $93) | $ | 91 | 91 | ||||||||
| Nomura Holdings, Inc., (0.14%, dated 9/30/11, due 10/3/11; proceeds $188; fully collateralized by U.S. Government Agencies; Federal Home Loan Mortgage Corporation 4.00% due 7/1/26; Federal National Mortgage Association 3.00% due 1/1/26; valued at $191) | 188 | 188 | |||||||||
| 279 | |||||||||||
| Total Securities held as Collateral on Loaned Securities (Cost $3,793) | 3,793 | ||||||||||
| Shares | |||||||||||
| Investment Company (4.6%) | |||||||||||
| Morgan Stanley Institutional Liquidity Funds — Money Market Portfolio — Institutional Class (See Note G-2) | 13,731,710 | 13,732 | |||||||||
| Face Amount (000) | |||||||||||
| U.S. Treasury Security (0.1%) | |||||||||||
| U.S. Treasury Bill | |||||||||||
| 0.02%, 3/22/12 (g)(h) | $ | 290 | 290 | ||||||||
| Total Short-Term Investments (Cost $17,815) | 17,815 | ||||||||||
| Total Investments (100.1%) (Cost $302,862) Including $3,721 of Securities Loaned (i) | 300,280 | ||||||||||
| Liabilities in Excess of Other Assets (-0.1%) | (400 | ) | |||||||||
| Net Assets (100.0%) | $ | 299,880 | |||||||||
(a) Security is subject to delayed delivery.
(b) 144A security — Certain conditions for public sale may exist. Unless otherwise noted, these securities are deemed to be liquid.
(c) Variable/Floating Rate Security — Interest rate changes on these instruments are based on changes in a designated base rate. The rates shown are those in effect on September 30, 2011.
(d) Inverse Floating Rate Security — Interest rate fluctuates with an inverse relationship to an associated interest rate. Indicated rate is the effective rate at September 30, 2011.
(e) When-issued security.
(f) All or a portion of this security was on loan at September 30, 2011.
The accompanying notes are an integral part of the financial statements.
47
2011 Annual Report
September 30, 2011
Portfolio of Investments (cont'd)
Core Plus Fixed Income Portfolio
(g) Rate shown is the yield to maturity at September 30, 2011.
(h) All or a portion of the security was pledged as collateral for swap agreements.
(i) Securities are available for collateral in connection with securities purchased on a forward commitment basis, open foreign currency exchange contracts, futures contracts and swap agreements.
IO Interest Only.
MTN Medium Term Note.
PAC Planned Amortization Class.
REMIC Real Estate Mortgage Investment Conduit.
STRIPS Separate Trading of Registered Interest and Principal of Securities.
TBA To Be Announced.
Foreign Currency Exchange Contracts Information:
The Portfolio had the following foreign currency exchange contracts open at period end:
| Counterparty | Currency to Deliver (000) | Value (000) | Settlement Date | In Exchange For (000) | Value (000) | Unrealized Appreciation (Depreciation) (000) | |||||||||||||||||||||
| JPMorgan Chase | CLP | 571,000 | $ | 1,097 | 10/14/11 | USD | 1,186 | $ | 1,186 | $ | 89 | ||||||||||||||||
| JPMorgan Chase | JPY | 80,000 | 1,037 | 10/14/11 | USD | 1,047 | 1,047 | 10 | |||||||||||||||||||
| JPMorgan Chase | USD | 772 | 772 | 10/14/11 | JPY | 59,500 | 771 | (1 | ) | ||||||||||||||||||
| UBS AG | CHF | 1,870 | 2,063 | 10/14/11 | USD | 2,378 | 2,378 | 315 | |||||||||||||||||||
| UBS AG | EUR | 1,286 | 1,722 | 10/14/11 | USD | 1,848 | 1,848 | 126 | |||||||||||||||||||
| UBS AG | JPY | 82,764 | 1,073 | 10/14/11 | USD | 1,083 | 1,083 | 10 | |||||||||||||||||||
| UBS AG | SEK | 4,843 | 705 | 10/14/11 | USD | 753 | 753 | 48 | |||||||||||||||||||
| UBS AG | SEK | 7,957 | 1,159 | 10/14/11 | USD | 1,169 | 1,169 | 10 | |||||||||||||||||||
| UBS AG | SEK | 3,010 | 439 | 10/14/11 | USD | 439 | 439 | — | @ | ||||||||||||||||||
| UBS AG | SGD | 1,500 | 1,147 | 10/14/11 | USD | 1,207 | 1,207 | 60 | |||||||||||||||||||
| UBS AG | USD | 1,499 | 1,499 | 10/14/11 | CHF | 1,278 | 1,410 | (89 | ) | ||||||||||||||||||
| UBS AG | USD | 1,209 | 1,209 | 10/14/11 | CLP | 571,000 | 1,097 | (112 | ) | ||||||||||||||||||
| UBS AG | USD | 1,174 | 1,174 | 10/14/11 | EUR | 840 | 1,125 | (49 | ) | ||||||||||||||||||
| UBS AG | USD | 618 | 618 | 10/14/11 | EUR | 446 | 597 | (21 | ) | ||||||||||||||||||
| UBS AG | USD | 903 | 903 | 10/14/11 | JPY | 68,974 | 895 | (8 | ) | ||||||||||||||||||
| UBS AG | USD | 1,968 | 1,968 | 10/14/11 | NOK | 10,750 | 1,830 | (138 | ) | ||||||||||||||||||
| UBS AG | USD | 2,008 | 2,008 | 10/14/11 | SEK | 12,800 | 1,864 | (144 | ) | ||||||||||||||||||
| UBS AG | USD | 1,241 | 1,241 | 10/14/11 | SGD | 1,500 | 1,147 | (94 | ) | ||||||||||||||||||
| $ | 21,834 | $ | 21,846 | $ | 12 | ||||||||||||||||||||||
Futures Contracts:
The Portfolio had the following futures contracts open at period end:
| Number of Contracts | Value (000) | Expiration Date | Unrealized Appreciation (Depreciation) (000) | ||||||||||||||||
| Long: | |||||||||||||||||||
| U.S. Treasury 2 yr. Note | 258 | $ | 56,813 | Dec-11 | $ | (85 | ) | ||||||||||||
| U.S. Treasury 5 yr. Note | 172 | 21,067 | Dec-11 | (32 | ) | ||||||||||||||
| U.S. Treasury Ultra Long Bond | 16 | 2,538 | Dec-11 | 236 | |||||||||||||||
| Short: | |||||||||||||||||||
| U.S. Treasury 10 yr. Note | 291 | (37,857 | ) | Dec-11 | (156 | ) | |||||||||||||
| U.S. Treasury 30 yr. Bond | 16 | (2,282 | ) | Dec-11 | (29 | ) | |||||||||||||
| $ | (66 | ) | |||||||||||||||||
The accompanying notes are an integral part of the financial statements.
48
2011 Annual Report
September 30, 2011
Portfolio of Investments (cont'd)
Core Plus Fixed Income Portfolio
Interest Rate Swap Agreements
The Portfolio had the following interest rate swap agreements open at period end:
| Swap Counterparty | Floating Rate Index | Pay/Receive Floating Rate | Fixed Rate | Termination Date | Notional Amount (000) | Unrealized Appreciation (Depreciation) (000) | |||||||||||||||||||||
| Bank of America | 6 Month EURIBOR | Pay | 4.26 | % | 8/18/26 | EUR | 14,435 | $ | 529 | ||||||||||||||||||
| Bank of America | 3 Month LIBOR | Receive | 4.35 | 8/18/26 | $ | 19,325 | (692 | ) | |||||||||||||||||||
| Bank of America | 6 Month EURIBOR | Receive | 3.61 | 8/18/31 | EUR | 18,225 | (457 | ) | |||||||||||||||||||
| Bank of America | 3 Month LIBOR | Pay | 4.15 | 8/18/31 | $ | 23,970 | 745 | ||||||||||||||||||||
| Barclays Capital | 3 Month STIBOR | Pay | 2.76 | 7/30/12 | SEK | 430,907 | 325 | ||||||||||||||||||||
| Barclays Capital | 3 Month STIBOR | Pay | 2.30 | 9/12/12 | 202,810 | 25 | |||||||||||||||||||||
| Barclays Capital | 3 Month STIBOR | Receive | 2.89 | 7/29/13 | 504,834 | (720 | ) | ||||||||||||||||||||
| Credit Suisse | 3 Month CDOR | Pay | 4.07 | 9/8/20 | CAD | 18,197 | 689 | ||||||||||||||||||||
| Goldman Sachs | 3 Month CDOR | Receive | 2.70 | 7/15/15 | 44,000 | (913 | ) | ||||||||||||||||||||
| $ | (469 | ) | |||||||||||||||||||||||||
@ Value is less than $500.
CDOR Canadian Dealer Offered Rate.
EURIBOR Euro Interbank Offered Rate.
LIBOR London Interbank Offered Rate.
STIBOR Stockholm Interbank Offered Rate.
CAD — Canadian Dollar
CHF — Swiss Franc
CLP — Chilean Peso
EUR — Euro
JPY — Japanese Yen
NOK — Norwegian Krone
SEK — Swedish Krona
SGD — Singapore Dollar
USD — United States Dollar
Fair Value Measurement Information:
The following is a summary of the inputs used to value the Portfolio's net assets as of September 30, 2011. (See Note A-6 to the financial statements for further information regarding fair value measurement.)
| Investment Type | Level 1 Unadjusted quoted prices (000) | Level 2 Other significant observable inputs (000) | Level 3 Significant unobservable inputs (000) | Total (000) | |||||||||||||||
| Assets: | |||||||||||||||||||
| Fixed Income Securities | |||||||||||||||||||
| Agency Adjustable Rate Mortgages | $ | — | $ | 2,132 | $ | — | $ | 2,132 | |||||||||||
| Agency Fixed Rate Mortgages | — | 76,997 | — | 76,997 | |||||||||||||||
| Asset-Backed Securities | — | 11,123 | — | 11,123 | |||||||||||||||
| Collateralized Mortgage Obligations — Agency Collateral Series | — | 23,418 | — | 23,418 | |||||||||||||||
| Commercial Mortgage Backed Securities | — | 11,528 | — | 11,528 | |||||||||||||||
| Corporate Bonds | — | 104,674 | — | 104,674 | |||||||||||||||
| Mortgages — Other | — | 25,093 | — | 25,093 | |||||||||||||||
| Municipal Bonds | — | 6,094 | — | 6,094 | |||||||||||||||
| Sovereign | — | 4,276 | — | 4,276 | |||||||||||||||
Fair Value Measurement Information: (cont'd)
| Investment Type | Level 1 Unadjusted quoted prices (000) | Level 2 Other significant observable inputs (000) | Level 3 Significant unobservable inputs (000) | Total (000) | |||||||||||||||
| Fixed Income Securities (cont'd) | |||||||||||||||||||
| U.S. Agency Securities | $ | — | $ | 4,674 | $ | — | $ | 4,674 | |||||||||||
| U.S. Treasury Security | — | 12,456 | — | 12,456 | |||||||||||||||
| Total Fixed Income Securities | — | 282,465 | — | 282,465 | |||||||||||||||
| Short-Term Investments | |||||||||||||||||||
| Investment Company | 17,246 | — | — | 17,246 | |||||||||||||||
| Repurchase Agreements | — | 279 | — | 279 | |||||||||||||||
| U.S. Treasury Security | — | 290 | — | 290 | |||||||||||||||
| Total Short-Term Investments | 17,246 | 569 | — | 17,815 | |||||||||||||||
| Foreign Currency Exchange Contracts | — | 668 | — | 668 | |||||||||||||||
| Futures Contracts | 236 | — | — | 236 | |||||||||||||||
| Interest Rate Swap Agreements | — | 2,313 | — | 2,313 | |||||||||||||||
| Total Assets | 17,482 | 286,015 | — | 303,497 | |||||||||||||||
The accompanying notes are an integral part of the financial statements.
49
2011 Annual Report
September 30, 2011
Portfolio of Investments (cont'd)
Core Plus Fixed Income Portfolio
Fair Value Measurement Information: (cont'd)
| Investment Type | Level 1 Unadjusted quoted prices (000) | Level 2 Other significant observable inputs (000) | Level 3 Significant unobservable inputs (000) | Total (000) | |||||||||||||||
| Liabilities: | |||||||||||||||||||
| Foreign Currency Exchange Contracts | $ | — | $ | (656 | ) | $ | — | $ | (656 | ) | |||||||||
| Futures Contracts | (302 | ) | — | — | (302 | ) | |||||||||||||
| Interest Rate Swap Agreements | — | (2,782 | ) | — | (2,782 | ) | |||||||||||||
| Total Liabilities | (302 | ) | (3,438 | ) | — | (3,740 | ) | ||||||||||||
| Total | $ | 17,180 | $ | 282,577 | $ | — | $ | 299,757 | |||||||||||
Transfers between investment levels may occur as the markets fluctuate and/or the availability of data used in an investment's valuation changes. The Portfolio recognizes transfers between the levels as of the end of the period. As of September 30, 2011, the Portfolio did not have any significant investments transfer between investment levels.
Fair Value Measurement Information: (cont'd)
Following is a reconciliation of investments in which significant unobservable inputs (Level 3) were used in determining fair value.
| Fixed Income Securities (000) | |||||||
| Beginning Balance | $ | — | @ | ||||
| Purchases | — | ||||||
| Sales | (4 | ) | |||||
| Amortization of discount | — | ||||||
| Transfers in | — | ||||||
| Transfers out | — | ||||||
| Change in unrealized appreciation/depreciation | — | @ | |||||
| Realized gains (losses) | 4 | ||||||
| Ending Balance | $ | — | |||||
| Net change in unrealized appreciation/depreciation from investments still held as of September 30, 2011 | $ | — | |||||
@ Value is less than $500.
The accompanying notes are an integral part of the financial statements.
50
2011 Annual Report
September 30, 2011
Investment Overview (unaudited)
Investment Grade Fixed Income Portfolio
Performance
For the fiscal year ended September 30, 2011, the Portfolio's Class I had a total return based on net asset value and reinvestment of distributions per share of 4.05%, net of fees. The Portfolio's Class I underperformed against its benchmark the Barclays Capital U.S. Aggregate Index (the "Index"), which returned 5.26%.
Factors Affecting Performance
• Financial markets were volatile during much of the 12-month period, with political upheaval across the Middle East at the beginning of 2011. Markets were further disrupted by the earthquake in Japan in March, as investors feared supply chain disruptions for electronics and auto components. In the summer, investors focused on the U.S. debt ceiling issue. Then, in August, one of the three major bond rating agencies, Standard & Poor's downgraded the U.S.'s credit rating from AAA to AA+. August and September were the most volatile months as concerns about the European sovereign debt crisis and a slowdown in global growth led to a dramatic sell-off in risky assets.
• The Federal Reserve's second round of quantitative easing (QE2), an asset purchase program intended to stimulate the economy by encouraging banks to lend, ended in June. Amidst renewed weakness in economic indicators in the second half of the period, the Fed announced that it would extend the maturity of its Treasury holdings to put downward pressure on longer-term interest rates. In addition, to provide support to the mortgage market, the Fed will re-invest principal payments from its mortgage and agency holdings into mortgages instead of Treasuries.
• Investment-grade corporate debt spreads versus Treasuries narrowed in the first half of the period. Corporate balance sheets have been strong, with near all-time highs in profit margins, cash flow generation and cash on balance sheet. However, in the third quarter of 2011, the credit market, especially the financial sector, was negatively affected by the increased risk aversion due to the European debt crisis and signs of slowing economic growth. Overall investment-grade corporate spreads ended the period almost 60 basis points wider after tightening about 40 basis points in first few months of the year.
• The agency mortgage sector generated positive returns versus duration neutral Treasuries. The Treasury's announcement in the first quarter that it would reduce its mortgage-backed securities portfolio initially prompted a negative reaction in the market. However, the market recovered, as the Treasury planned to sell its portfolio over a 12-month period, promising not to disrupt the market. During the second quarter, the Treasury started selling leveraged agency mortgage bonds. This supply was absorbed by the market without much impact on spreads. Toward the end of the period, the sector, especially higher coupon mortgages, came under some pressure due to concerns about a government-sponsored universal refinancing program. However, we believe the sector should remain well supported given the relatively attractive yield and the Fed's plan to re-invest principal payments from their mortgage and agency holdings into mortgages.
• The U.S. Treasury yield curve flattened during the period, with yields on 2-, 5-, 10-, and 30-year Treasuries declining by 18, 32, 59, and 77 basis points, respectively.
• The Portfolio's overweight position in the investment-grade credit sector, particularly banking, detracted from relative performance.
• The Portfolio's positioning in the commercial mortgage backed securities (CMBS) sector hurt performance as the sector experienced substantial spread widening in the third quarter of 2011.
• The Portfolio's mortgage strategy helped performance. This was primarily due to an allocation to agency mortgage derivatives through interest only (IO) and inverse interest only (IIO) securities.
Management Strategies
• Throughout the period, the Portfolio was positioned with an overweight to investment-grade credit as corporate valuations relative to fundamentals have been attractive. We reduced some credit exposure a few months ago but continue to maintain an overweight to the sector.
• Additionally, interest rate positioning contributed to performance. The Portfolio was positioned to benefit from an anticipated flattening (or, reduction
51
2011 Annual Report
September 30, 2011
Investment Overview (unaudited) (cont'd)
Investment Grade Fixed Income Portfolio
in the difference of yield spreads) between the short and intermediate parts of the yield curve. We unwound the position profitably toward the end of the reporting period.
• In terms of mortgage strategy, the Portfolio has had a position in IO and IIO securities. Prepayment speeds have been slow, which has been beneficial for this position. A number of factors, such as increased credit requirements and fees, have mitigated prepayments and presented hurdles for borrowers looking to refinance.
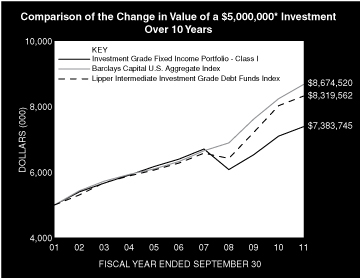
* Minimum Investment
In accordance with SEC regulations, the Portfolio's performance shown assumes that all recurring fees (including management fees) were deducted and all dividends and distributions were reinvested. The performance of Class P, Class H, and Class L shares will vary from the Class I shares based upon their different inception dates and will be negatively impacted by additional fees assessed to those classes.
Performance Compared to the Barclays Capital U.S. Aggregate Index(1) and the Lipper Intermediate Investment Grade Debt Funds Index(2)
| Period Ended September 30, 2011 Total Returns(3) | |||||||||||||||||||
| Average Annual | |||||||||||||||||||
| One Year | Five Years | Ten Years | Since Inception(8) | ||||||||||||||||
| Portfolio — Class I Shares w/o sales charges(4) | 4.05 | % | 2.91 | % | 3.98 | % | 6.57 | % | |||||||||||
| Barclays Capital U.S. Aggregate Index | 5.26 | 6.53 | 5.66 | 7.14 | |||||||||||||||
| Lipper Intermediate Investment Grade Debt Funds Index | 3.66 | 5.78 | 5.22 | 6.59 | |||||||||||||||
| Portfolio — Class P Shares w/o sales charges(5) | 3.99 | 2.76 | — | 3.74 | |||||||||||||||
| Barclays Capital U.S. Aggregate Index | 5.26 | 6.53 | 5.66 | 5.83 | |||||||||||||||
| Lipper Intermediate Investment Grade Debt Funds Index | 3.66 | 5.78 | — | 5.40 | |||||||||||||||
| Portfolio — Class H Shares w/o sales charges(6) | 3.89 | — | — | 1.26 | |||||||||||||||
| Portfolio — Class H Shares with maximum 3.50% sales charges(6) | 0.24 | — | — | 0.31 | |||||||||||||||
| Barclays Capital U.S. Aggregate Index | 5.26 | — | — | 6.34 | |||||||||||||||
| Lipper Intermediate Investment Grade Debt Funds Index | 3.66 | — | — | 5.72 | |||||||||||||||
| Portfolio — Class L Shares w/o sales charges(7) | 3.51 | — | — | 4.12 | |||||||||||||||
| Barclays Capital U.S. Aggregate Index | 5.26 | — | — | 7.48 | |||||||||||||||
| Lipper Intermediate Investment Grade Debt Funds Index | 3.66 | — | — | 7.32 | |||||||||||||||
Performance data quoted represents past performance, which is no guarantee of future results, and current performance may be lower or higher than the figures shown. Performance assumes that all dividends and distributions, if any, were reinvested. For the most recent month-end performance figures, please visit www.morganstanley.com/im. Investment returns and principal value will fluctuate so that Portfolio shares, when redeemed, may be worth more or less than their original cost. Total returns do not reflect the deduction of taxes that a shareholder would pay on Portfolio distributions or the redemption of Portfolio shares. Performance of share classes will vary due to differences in sales charges and expenses.
(1) The Barclays Capital U.S. Aggregate Index tracks the performance of all U.S. government agency and Treasury securities, investment-grade corporate debt securities, agency mortgage-backed securities, asset-backed securities and commercial mortgage-backed securities. The Index is unmanaged and its returns do not include any sales charges or fees. Such costs would lower performance. It is not possible to invest directly in an index.
52
2011 Annual Report
September 30, 2011
Investment Overview (unaudited) (cont'd)
Investment Grade Fixed Income Portfolio
(2) The Lipper Intermediate Investment Grade Debt Funds Index is an equally weighted performance index of the largest qualifying funds (based on net assets) in the Lipper Intermediate Investment Grade Debt Funds classification. The Index, which is adjusted for capital gains distributions and income dividends, is unmanaged and should not be considered an investment. There are currently 30 funds represented in this Index. As of the date of this report, the Portfolio was in the Lipper Intermediate Investment Grade Debt Funds classification.
(3) Total returns for the Portfolio reflect expenses waived and/or reimbursed, if applicable, by the Adviser and Distributor. Without such waivers and/or reimbursements, total returns would have been lower. Fee waivers and/or reimbursements are expected to continue until such time that the Fund's Board of Trustees acts to discontinue such waivers and/or reimbursements.
(4) Commenced operations on August 31, 1990.
(5) Commenced operations on May 20, 2002.
(6) Commenced operations on January 2, 2008.
(7) Commenced operations on June 16, 2008.
(8) For comparative purposes, average annual listed for the Indexes refer to the inception date or initial offering of the respective share class of the Portfolio, not the inception of the Indexes.
Portfolio Composition*
| Classification | Percentage of Total Investments | ||||||
| Agency Fixed Rate Mortgages | 28.7 | % | |||||
| Other** | 20.0 | ||||||
| Finance | 16.0 | ||||||
| Industrials | 13.4 | ||||||
| Collateralized Mortgage Obligations — Agency Collateral Series | 9.9 | ||||||
| Asset-Backed Securities | 7.0 | ||||||
| Commercial Mortgage Backed Securities | 5.0 | ||||||
| Total Investments | 100.0 | %*** | |||||
* Percentages indicated are based upon total investments (excluding Securities held as Collateral on Loaned Securities) as of September 30, 2011.
** Industries and/or investment types representing less than 5% of total investments.
*** Does not include open long/short futures contracts with a value of approximately $27,339,000 and net unrealized depreciation of approximately $79,000.
53
2011 Annual Report
September 30, 2011
Portfolio of Investments
Investment Grade Fixed Income Portfolio
| Face Amount (000) | Value (000) | ||||||||||
| Fixed Income Securities (95.8%) | |||||||||||
| Agency Fixed Rate Mortgages (28.9%) | |||||||||||
| Federal Home Loan Mortgage Corporation, | |||||||||||
| Gold Pools: | |||||||||||
| 5.00%, 10/1/35 | $ | 604 | $ | 651 | |||||||
| 6.00%, 2/1/32 - 10/1/38 | 708 | 780 | |||||||||
| 6.50%, 7/1/25 - 3/1/32 | 105 | 119 | |||||||||
| 7.50%, 5/1/16 - 5/1/35 | 148 | 166 | |||||||||
| 8.00%, 8/1/32 | 47 | 56 | |||||||||
| 8.50%, 8/1/31 | 50 | 60 | |||||||||
| October TBA: | |||||||||||
| 4.00%, 10/25/41 (a) | 500 | 523 | |||||||||
| Federal National Mortgage Association, | |||||||||||
| Conventional Pools: | |||||||||||
| 4.50%, 8/1/40 - 8/1/41 | 3,869 | 4,112 | |||||||||
| 5.00%, 3/1/39 - 3/1/41 | 2,121 | 2,306 | |||||||||
| 5.50%, 8/1/35 - 2/1/38 | 3,823 | 4,177 | |||||||||
| 6.00%, 10/1/31 - 7/1/37 | 595 | 654 | |||||||||
| 6.50%, 6/1/26 - 2/1/39 | 560 | 628 | |||||||||
| 7.00%, 10/1/28 - 6/1/32 | 86 | 99 | |||||||||
| 7.50%, 8/1/37 | 124 | 145 | |||||||||
| 8.00%, 2/1/12 - 4/1/33 | 92 | 108 | |||||||||
| 8.50%, 10/1/32 | 92 | 108 | |||||||||
| 11.25%, 8/1/13 | 3 | 3 | |||||||||
| October TBA: | |||||||||||
| 4.50%, 10/25/41 (a) | 440 | 467 | |||||||||
| Government National Mortgage Association, | |||||||||||
| October TBA: | |||||||||||
| 3.50%, 10/25/41 (a) | 790 | 826 | |||||||||
| 4.00%, 10/25/41 (a) | 975 | 1,043 | |||||||||
| Various Pools: | |||||||||||
| 4.50%, 4/15/39 - 5/15/40 | 2,261 | 2,464 | |||||||||
| 19,495 | |||||||||||
| Asset-Backed Securities (7.1%) | |||||||||||
| Ally Master Owner Trust | |||||||||||
| 2.88%, 4/15/15 (b) | 250 | 256 | |||||||||
| ARI Fleet Lease Trust | |||||||||||
| 1.68%, 8/15/18 (b)(c) | 63 | 63 | |||||||||
| Brazos Higher Education Authority | |||||||||||
| 1.10%, 7/25/29 (c) | 375 | 371 | |||||||||
| CarMax Auto Owner Trust | |||||||||||
| 1.29%, 9/15/15 | 250 | 252 | |||||||||
| CLI Funding LLC | |||||||||||
| 4.50%, 3/18/26 (b) | 239 | 242 | |||||||||
| CVS Pass-Through Trust, | |||||||||||
| 6.04%, 12/10/28 | 197 | 208 | |||||||||
| 8.35%, 7/10/31 (b) | 144 | 180 | |||||||||
| Discover Card Master Trust | |||||||||||
| 0.58%, 8/15/16 (c) | 325 | 326 | |||||||||
| Enterprise Fleet Financing LLC | |||||||||||
| 1.43%, 10/20/16 (b) | 213 | 213 | |||||||||
| Ford Credit Floorplan Master Owner Trust | |||||||||||
| 2.12%, 2/15/16 | 200 | 204 | |||||||||
| Face Amount (000) | Value (000) | ||||||||||
| FUEL Trust | |||||||||||
| 4.21%, 4/15/16 (b) | $ | 200 | $ | 199 | |||||||
| Great America Leasing Receivables | |||||||||||
| 1.69%, 2/15/14 (b) | 325 | 327 | |||||||||
| Louisiana Public Facilities Authority | |||||||||||
| 1.15%, 1/25/20 (c) | 350 | 344 | |||||||||
| Macquarie Equipment Funding Trust | |||||||||||
| 1.21%, 9/20/13 (b) | 300 | 300 | |||||||||
| Mercedes-Benz Auto Lease Trust | |||||||||||
| 1.18%, 11/15/13 (b) | 400 | 402 | |||||||||
| MMCA Automobile Trust | |||||||||||
| 1.22%, 1/15/15 (b) | 250 | 251 | |||||||||
| North Carolina State Education Assistance Authority | |||||||||||
| 1.15%, 1/26/26 (c) | 250 | 246 | |||||||||
| Panhandle-Plains Higher Education Authority, Inc. | |||||||||||
| 1.21%, 7/1/24 (c) | 125 | 124 | |||||||||
| Residential Asset Securities Corp. | |||||||||||
| 0.34%, 4/25/37 (c) | 14 | 14 | |||||||||
| Textainer Marine Containers Ltd. | |||||||||||
| 4.70%, 6/15/26 (b) | 244 | 246 | |||||||||
| 4,768 | |||||||||||
| Collateralized Mortgage Obligations — Agency Collateral Series (9.9%) | |||||||||||
| Federal Home Loan Mortgage Corporation, | |||||||||||
| 2.70%, 5/25/18 | 375 | 377 | |||||||||
| 3.15%, 2/25/18 | 250 | 262 | |||||||||
| 3.87%, 4/25/21 | 350 | 379 | |||||||||
| IO | |||||||||||
| 0.84%, 1/25/21 (c) | 2,593 | 113 | |||||||||
| IO REMIC | |||||||||||
| 5.00%, 12/15/20 - 12/15/37 | 1,532 | 212 | |||||||||
| 5.72%, 6/15/41 (c) | 7,239 | 861 | |||||||||
| 5.74%, 6/15/40 (c) | 882 | 138 | |||||||||
| 5.91%, 7/15/37 (c) | 732 | 105 | |||||||||
| 6.24%, 6/15/40 (c) | 2,716 | 520 | |||||||||
| IO STRIPS | |||||||||||
| 8.00%, 1/1/28 | 32 | 7 | |||||||||
| PAC REMIC | |||||||||||
| 10.00%, 6/15/20 | 3 | 3 | |||||||||
| REMIC | |||||||||||
| 22.09%, 5/15/41 (c)(d) | 394 | 435 | |||||||||
| Federal National Mortgage Association, | |||||||||||
| 3.76%, 6/25/21 | 120 | 130 | |||||||||
| IO | |||||||||||
| 6.16%, 9/25/20 (c) | 1,981 | 516 | |||||||||
| IO REMIC | |||||||||||
| 6.47%, 2/25/24 (c) | 616 | 68 | |||||||||
| REMIC | |||||||||||
| 6.04%, 10/25/40 (c) | 166 | 188 | |||||||||
| 7.00%, 9/25/32 | 190 | 224 | |||||||||
| 9.16%, 10/25/41 | 254 | 250 | |||||||||
| Government National Mortgage Association, | |||||||||||
| IO | |||||||||||
| 6.32%, 12/20/40 (c) | 2,781 | 463 | |||||||||
The accompanying notes are an integral part of the financial statements.
54
2011 Annual Report
September 30, 2011
Portfolio of Investments (cont'd)
Investment Grade Fixed Income Portfolio
| Face Amount (000) | Value (000) | ||||||||||
| Collateralized Mortgage Obligations — Agency Collateral Series (cont'd) | |||||||||||
| IO REMIC | |||||||||||
| 0.85%, 8/20/58 (c) | $ | 3,314 | $ | 108 | |||||||
| 4.50%, 6/20/39 | 788 | 128 | |||||||||
| 5.00%, 2/16/41 | 192 | 40 | |||||||||
| 5.22%, 6/20/41 (c) | 1,183 | 168 | |||||||||
| 5.82%, 11/16/40 (c) | 1,339 | 270 | |||||||||
| 6.02%, 10/20/37 (c) | 1,044 | 88 | |||||||||
| 6.35%, 6/20/40 (c) | 918 | 163 | |||||||||
| 6.37%, 4/16/41 (c) | 1,445 | 290 | |||||||||
| 6.44%, 4/16/41 (c) | 1,028 | 184 | |||||||||
| 6,690 | |||||||||||
| Commercial Mortgage Backed Securities (5.0%) | |||||||||||
| Citigroup Commercial Mortgage Trust (See Note G-2) | |||||||||||
| 5.92%, 3/15/49 (c) | 493 | 538 | |||||||||
| DBUBS Mortgage Trust, | |||||||||||
| 4.54%, 7/10/44 (b) | 425 | 435 | |||||||||
| 5.00%, 11/10/46 (b) | 300 | 323 | |||||||||
| 5.47%, 11/10/46 (b)(c) | 210 | 197 | |||||||||
| GS Mortgage Securities Corp. II, | |||||||||||
| 5.36%, 3/10/44 (b)(c) | 200 | 186 | |||||||||
| 5.55%, 4/10/38 (c) | 230 | 245 | |||||||||
| JP Morgan Chase Commercial Mortgage Securities Corp., | |||||||||||
| 4.17%, 8/15/46 | 260 | 265 | |||||||||
| 4.39%, 7/15/46 (b) | 400 | 400 | |||||||||
| 4.72%, 2/16/46 (b) | 380 | 392 | |||||||||
| WF-RBS Commercial Mortgage Trust | |||||||||||
| 4.87%, 2/15/44 (b)(c) | 370 | 391 | |||||||||
| 3,372 | |||||||||||
| Corporate Bonds (33.4%) | |||||||||||
| Finance (16.1%) | |||||||||||
| ABB Treasury Center USA, Inc. | |||||||||||
| 2.50%, 6/15/16 (b) | 195 | 199 | |||||||||
| Abbey National Treasury Services PLC | |||||||||||
| 3.88%, 11/10/14 (b) | 146 | 140 | |||||||||
| Aegon N.V. | |||||||||||
| 4.63%, 12/1/15 | 200 | 205 | |||||||||
| American International Group, Inc. | |||||||||||
| 6.40%, 12/15/20 | 225 | 230 | |||||||||
| Bank of America Corp., | |||||||||||
| 5.63%, 7/1/20 | 45 | 41 | |||||||||
| 5.75%, 12/1/17 | 465 | 437 | |||||||||
| Barclays Bank PLC, | |||||||||||
| 6.05%, 12/4/17 (b) | 115 | 106 | |||||||||
| 6.75%, 5/22/19 (e) | 106 | 115 | |||||||||
| BBVA US Senior SAU | |||||||||||
| 3.25%, 5/16/14 | 200 | 188 | |||||||||
| Bear Stearns Cos. LLC (The) | |||||||||||
| 6.40%, 10/2/17 | 285 | 324 | |||||||||
| Berkshire Hathaway, Inc. | |||||||||||
| 3.75%, 8/15/21 | 265 | 269 | |||||||||
| BNP Paribas SA | |||||||||||
| 5.00%, 1/15/21 | 150 | 147 | |||||||||
| Face Amount (000) | Value (000) | ||||||||||
| Boston Properties LP | |||||||||||
| 5.88%, 10/15/19 | $ | 30 | $ | 33 | |||||||
| Brookfield Asset Management, Inc., | |||||||||||
| 5.80%, 4/25/17 | 70 | 74 | |||||||||
| 7.13%, 6/15/12 | 230 | 238 | |||||||||
| Capital One Bank, USA NA | |||||||||||
| 8.80%, 7/15/19 | 285 | 336 | |||||||||
| Citigroup, Inc. (See Note G-2), | |||||||||||
| 6.13%, 11/21/17 | 390 | 417 | |||||||||
| 8.50%, 5/22/19 | 76 | 92 | |||||||||
| Coventry Health Care, Inc. | |||||||||||
| 5.45%, 6/15/21 | 130 | 141 | |||||||||
| Credit Suisse, | |||||||||||
| 5.40%, 1/14/20 | 175 | 168 | |||||||||
| 6.00%, 2/15/18 | 61 | 62 | |||||||||
| Dexus Diversified Trust/Dexus Office Trust | |||||||||||
| 5.60%, 3/15/21 (b)(e) | 125 | 131 | |||||||||
| Digital Realty Trust LP | |||||||||||
| 5.25%, 3/15/21 | 200 | 198 | |||||||||
| Farmers Exchange Capital | |||||||||||
| 7.05%, 7/15/28 (b) | 425 | 457 | |||||||||
| Fifth Third Bancorp | |||||||||||
| 3.63%, 1/25/16 | 80 | 81 | |||||||||
| General Electric Capital Corp., | |||||||||||
| 5.30%, 2/11/21 | 120 | 125 | |||||||||
| 5.63%, 5/1/18 | 410 | 449 | |||||||||
| MTN | |||||||||||
| 6.00%, 8/7/19 | 231 | 260 | |||||||||
| Goldman Sachs Group, Inc. (The), | |||||||||||
| 6.15%, 4/1/18 | 550 | 571 | |||||||||
| 7.50%, 2/15/19 | 120 | 134 | |||||||||
| Hartford Financial Services Group, Inc. | |||||||||||
| 5.50%, 3/30/20 | 125 | 122 | |||||||||
| HBOS PLC | |||||||||||
| 6.75%, 5/21/18 (b) | 357 | 305 | |||||||||
| HCP, Inc., | |||||||||||
| 5.38%, 2/1/21 | 50 | 50 | |||||||||
| 5.63%, 5/1/17 | 125 | 130 | |||||||||
| HSBC Holdings PLC | |||||||||||
| 5.10%, 4/5/21 | 155 | 160 | |||||||||
| ING Bank N.V. | |||||||||||
| 4.00%, 3/15/16 (b) | 200 | 201 | |||||||||
| Intesa Sanpaolo SpA | |||||||||||
| 6.50%, 2/24/21 (b) | 110 | 98 | |||||||||
| JPMorgan Chase & Co. | |||||||||||
| 4.95%, 3/25/20 | 70 | 74 | |||||||||
| Merrill Lynch & Co., Inc., | |||||||||||
| MTN | |||||||||||
| 6.88%, 4/25/18 | 67 | 67 | |||||||||
| MetLife, Inc. | |||||||||||
| 7.72%, 2/15/19 | 70 | 86 | |||||||||
| NASDAQ OMX Group, Inc. (The) | |||||||||||
| 5.55%, 1/15/20 | 70 | 70 | |||||||||
The accompanying notes are an integral part of the financial statements.
55
2011 Annual Report
September 30, 2011
Portfolio of Investments (cont'd)
Investment Grade Fixed Income Portfolio
| Face Amount (000) | Value (000) | ||||||||||
| Finance (cont'd) | |||||||||||
| Nationwide Building Society | |||||||||||
| 6.25%, 2/25/20 (b) | $ | 385 | $ | 389 | |||||||
| Nationwide Financial Services | |||||||||||
| 5.38%, 3/25/21 (b) | 100 | 98 | |||||||||
| Nordea Bank AB | |||||||||||
| 4.88%, 5/13/21 (b) | 200 | 171 | |||||||||
| Pacific LifeCorp | |||||||||||
| 6.00%, 2/10/20 (b) | 150 | 161 | |||||||||
| Platinum Underwriters Finance, Inc., | |||||||||||
| Series B | |||||||||||
| 7.50%, 6/1/17 | 134 | 146 | |||||||||
| PNC Funding Corp. | |||||||||||
| 5.13%, 2/8/20 | 110 | 122 | |||||||||
| Principal Financial Group, Inc. | |||||||||||
| 8.88%, 5/15/19 | 167 | 213 | |||||||||
| Prudential Financial, Inc. | |||||||||||
| 7.38%, 6/15/19 | 100 | 117 | |||||||||
| Reinsurance Group of America, Inc. | |||||||||||
| 6.45%, 11/15/19 | 136 | 155 | |||||||||
| Royal Bank of Scotland PLC (The) | |||||||||||
| 4.88%, 3/16/15 | 125 | 122 | |||||||||
| Santander Holdings USA, Inc. | |||||||||||
| 4.63%, 4/19/16 | 55 | 53 | |||||||||
| Santander US Debt SA Unipersonal | |||||||||||
| 3.72%, 1/20/15 (b) | 200 | 186 | |||||||||
| Societe Generale SA | |||||||||||
| 5.20%, 4/15/21 (b) | 200 | 174 | |||||||||
| Standard Chartered Bank | |||||||||||
| 6.40%, 9/26/17 (b) | 100 | 105 | |||||||||
| Sumitomo Mitsui Banking Corp. | |||||||||||
| 2.90%, 7/22/16 (b) | 200 | 202 | |||||||||
| UnitedHealth Group, Inc. | |||||||||||
| 6.63%, 11/15/37 | 225 | 286 | |||||||||
| Ventas Realty LP/Ventas Capital Corp. | |||||||||||
| 4.75%, 6/1/21 | 150 | 144 | |||||||||
| Wachovia Corp. | |||||||||||
| 5.63%, 10/15/16 | 100 | 108 | |||||||||
| WEA Finance LLC | |||||||||||
| 4.63%, 5/10/21 (b) | 175 | 167 | |||||||||
| 10,850 | |||||||||||
| Industrials (13.5%) | |||||||||||
| Agilent Technologies, Inc. | |||||||||||
| 5.50%, 9/14/15 | 126 | 138 | |||||||||
| Air Products & Chemicals, Inc. | |||||||||||
| 2.00%, 8/2/16 | 180 | 183 | |||||||||
| Albemarle Corp. | |||||||||||
| 4.50%, 12/15/20 | 125 | 135 | |||||||||
| Altria Group, Inc., | |||||||||||
| 4.13%, 9/11/15 | 115 | 123 | |||||||||
| 9.25%, 8/6/19 | 88 | 115 | |||||||||
| Anglo American Capital PLC | |||||||||||
| 9.38%, 4/8/19 (b) | 100 | 133 | |||||||||
| Face Amount (000) | Value (000) | ||||||||||
| ArcelorMittal | |||||||||||
| 9.85%, 6/1/19 | $ | 109 | $ | 124 | |||||||
| AT&T, Inc., | |||||||||||
| 3.88%, 8/15/21 | 70 | 72 | |||||||||
| 6.30%, 1/15/38 | 80 | 92 | |||||||||
| 6.55%, 2/15/39 | 100 | 119 | |||||||||
| BAA Funding Ltd. | |||||||||||
| 4.88%, 7/15/21 (b) | 190 | 194 | |||||||||
| Barrick North America Finance LLC | |||||||||||
| 4.40%, 5/30/21 | 110 | 113 | |||||||||
| BAT International Finance PLC | |||||||||||
| 9.50%, 11/15/18 (b) | 190 | 258 | |||||||||
| Bemis Co., Inc. | |||||||||||
| 4.50%, 10/15/21 (f) | 120 | 122 | |||||||||
| Best Buy Co., Inc. | |||||||||||
| 3.75%, 3/15/16 | 180 | 175 | |||||||||
| Boeing Capital Corp. | |||||||||||
| 2.13%, 8/15/16 | 175 | 177 | |||||||||
| Bunge Ltd. Finance Corp. | |||||||||||
| 8.50%, 6/15/19 | 99 | 124 | |||||||||
| Burlington Northern Santa Fe LLC | |||||||||||
| 5.65%, 5/1/17 | 130 | 150 | |||||||||
| Comcast Corp., | |||||||||||
| 5.15%, 3/1/20 | 110 | 124 | |||||||||
| 5.70%, 5/15/18 | 32 | 37 | |||||||||
| Cooper US, Inc. | |||||||||||
| 5.25%, 11/15/12 | 139 | 146 | |||||||||
| COX Communications, Inc. | |||||||||||
| 8.38%, 3/1/39 (b) | 36 | 50 | |||||||||
| CRH America, Inc. | |||||||||||
| 6.00%, 9/30/16 | 150 | 161 | |||||||||
| Daimler Finance North America LLC, | |||||||||||
| 7.30%, 1/15/12 | 163 | 166 | |||||||||
| 8.50%, 1/18/31 | 71 | 101 | |||||||||
| Darden Restaurants, Inc. | |||||||||||
| 6.20%, 10/15/17 | 235 | 274 | |||||||||
| DirecTV Holdings LLC/DirecTV Financing Co., Inc., | |||||||||||
| 5.88%, 10/1/19 | 122 | 137 | |||||||||
| 7.63%, 5/15/16 | 18 | 19 | |||||||||
| Fiserv, Inc. | |||||||||||
| 3.13%, 6/15/16 | 130 | 132 | |||||||||
| Georgia-Pacific LLC | |||||||||||
| 5.40%, 11/1/20 (b) | 95 | 97 | |||||||||
| Gilead Sciences, Inc. | |||||||||||
| 4.50%, 4/1/21 | 155 | 167 | |||||||||
| Grupo Bimbo SAB de CV | |||||||||||
| 4.88%, 6/30/20 (b) | 125 | 127 | |||||||||
| Harley-Davidson Funding Corp. | |||||||||||
| 6.80%, 6/15/18 (b) | 115 | 134 | |||||||||
| Holcim US Finance Sarl & Cie SCS | |||||||||||
| 6.00%, 12/30/19 (b) | 82 | 87 | |||||||||
| Home Depot, Inc. | |||||||||||
| 5.88%, 12/16/36 | 197 | 230 | |||||||||
| International Paper Co. | |||||||||||
| 7.50%, 8/15/21 | 115 | 133 | |||||||||
The accompanying notes are an integral part of the financial statements.
56
2011 Annual Report
September 30, 2011
Portfolio of Investments (cont'd)
Investment Grade Fixed Income Portfolio
| Face Amount (000) | Value (000) | ||||||||||
| Industrials (cont'd) | |||||||||||
| Kinross Gold Corp. | |||||||||||
| 5.13%, 9/1/21 (b) | $ | 130 | $ | 129 | |||||||
| KLA-Tencor Corp. | |||||||||||
| 6.90%, 5/1/18 | 116 | 133 | |||||||||
| Kraft Foods, Inc. | |||||||||||
| 5.38%, 2/10/20 | 220 | 249 | |||||||||
| L-3 Communications Corp. | |||||||||||
| 4.75%, 7/15/20 | 145 | 150 | |||||||||
| Marathon Petroleum Corp. | |||||||||||
| 5.13%, 3/1/21 (b) | 75 | 78 | |||||||||
| Mosaic Co. (The) | |||||||||||
| 7.63%, 12/1/16 (b) | 65 | 68 | |||||||||
| NBC Universal Media LLC | |||||||||||
| 5.15%, 4/30/20 | 150 | 165 | |||||||||
| News America, Inc. | |||||||||||
| 4.50%, 2/15/21 | 85 | 86 | |||||||||
| Omnicom Group, Inc. | |||||||||||
| 4.45%, 8/15/20 | 75 | 76 | |||||||||
| Petrobras International Finance Co. | |||||||||||
| 5.75%, 1/20/20 | 180 | 189 | |||||||||
| Potash Corp. of Saskatchewan, Inc. | |||||||||||
| 5.88%, 12/1/36 | 75 | 90 | |||||||||
| Quest Diagnostics, Inc. | |||||||||||
| 6.95%, 7/1/37 | 105 | 132 | |||||||||
| Rio Tinto Finance USA Ltd. | |||||||||||
| 9.00%, 5/1/19 | 35 | 47 | |||||||||
| Sanofi | |||||||||||
| 4.00%, 3/29/21 | 150 | 163 | |||||||||
| Teck Resources Ltd., | |||||||||||
| 4.75%, 1/15/22 (e) | 95 | 97 | |||||||||
| 6.25%, 7/15/41 | 110 | 116 | |||||||||
| Telecom Italia Capital SA, | |||||||||||
| 7.00%, 6/4/18 | 17 | 17 | |||||||||
| 7.18%, 6/18/19 | 119 | 119 | |||||||||
| Telefonica Europe BV | |||||||||||
| 8.25%, 9/15/30 | 184 | 206 | |||||||||
| Telstra Corp. Ltd. | |||||||||||
| 4.80%, 10/12/21 (b) | 120 | 126 | |||||||||
| Thermo Fisher Scientific, Inc. | |||||||||||
| 3.60%, 8/15/21 | 180 | 187 | |||||||||
| Time Warner Cable, Inc. | |||||||||||
| 6.75%, 6/15/39 | 80 | 92 | |||||||||
| Time Warner, Inc., | |||||||||||
| 4.75%, 3/29/21 | 100 | 105 | |||||||||
| 7.70%, 5/1/32 | 119 | 151 | |||||||||
| Vale Overseas Ltd., | |||||||||||
| 5.63%, 9/15/19 | 116 | 123 | |||||||||
| 6.88%, 11/10/39 | 21 | 23 | |||||||||
| Verizon Communications, Inc., | |||||||||||
| 4.60%, 4/1/21 (e) | 170 | 188 | |||||||||
| 6.35%, 4/1/19 | 125 | 151 | |||||||||
| VF Corp. | |||||||||||
| 3.50%, 9/1/21 | 120 | 122 | |||||||||
| Face Amount (000) | Value (000) | ||||||||||
| Viacom, Inc. | |||||||||||
| 6.88%, 4/30/36 | $ | 126 | $ | 151 | |||||||
| Vivendi SA | |||||||||||
| 6.63%, 4/4/18 (b) | 102 | 116 | |||||||||
| Wesfarmers Ltd. | |||||||||||
| 2.98%, 5/18/16 (b) | 100 | 101 | |||||||||
| Woolworths Ltd. | |||||||||||
| 4.00%, 9/22/20 (b) | 140 | 146 | |||||||||
| WPP Finance UK | |||||||||||
| 8.00%, 9/15/14 | 136 | 154 | |||||||||
| 9,115 | |||||||||||
| Utilities (3.8%) | |||||||||||
| EDF SA | |||||||||||
| 4.60%, 1/27/20 (b) | 90 | 95 | |||||||||
| Enel Finance International N.V. | |||||||||||
| 5.13%, 10/7/19 (b) | 300 | 282 | |||||||||
| Energy Transfer Partners LP | |||||||||||
| 9.00%, 4/15/19 | 150 | 181 | |||||||||
| Enterprise Products Operating LLC | |||||||||||
| 6.50%, 1/31/19 | 269 | 317 | |||||||||
| Exelon Generation Co. LLC | |||||||||||
| 6.25%, 10/1/39 | 350 | 408 | |||||||||
| FirstEnergy Solutions Corp. | |||||||||||
| 6.05%, 8/15/21 | 221 | 245 | |||||||||
| Iberdrola Finance Ireland Ltd. | |||||||||||
| 5.00%, 9/11/19 (b) | 175 | 169 | |||||||||
| Kinder Morgan Energy Partners LP | |||||||||||
| 5.95%, 2/15/18 | 300 | 342 | |||||||||
| Plains All American Pipeline LP/PAA Finance Corp. | |||||||||||
| 6.70%, 5/15/36 | 306 | 350 | |||||||||
| PPL WEM Holdings PLC | |||||||||||
| 3.90%, 5/1/16 (b) | 150 | 157 | |||||||||
| 2,546 | |||||||||||
| 22,511 | |||||||||||
| Municipal Bonds (1.8%) | |||||||||||
| Chicago Transit Authority | |||||||||||
| 6.20%, 12/1/40 | 110 | 128 | |||||||||
| City of Chicago, IL | |||||||||||
| 6.40%, 1/1/40 | 40 | 48 | |||||||||
| City of New York, NY, Series G-1 | |||||||||||
| 5.97%, 3/1/36 | 95 | 116 | |||||||||
| Illinois State Toll Highway Authority, Highway Revenue, Build America Bonds | |||||||||||
| 6.18%, 1/1/34 | 231 | 272 | |||||||||
| Municipal Electric Authority of Georgia, | |||||||||||
| 6.64%, 4/1/57 | 95 | 104 | |||||||||
| 6.66%, 4/1/57 | 175 | 187 | |||||||||
| New York City Transitional Finance Authority | |||||||||||
| 5.27%, 5/1/27 | 90 | 101 | |||||||||
| State of California, General Obligation Bonds | |||||||||||
| 5.95%, 4/1/16 | 195 | 222 | |||||||||
| 1,178 | |||||||||||
The accompanying notes are an integral part of the financial statements.
57
2011 Annual Report
September 30, 2011
Portfolio of Investments (cont'd)
Investment Grade Fixed Income Portfolio
| Face Amount (000) | Value (000) | ||||||||||
| Sovereign (1.1%) | |||||||||||
| Bermuda Government International Bond | |||||||||||
| 5.60%, 7/20/20 (b)(e) | $ | 125 | $ | 135 | |||||||
| Brazilian Government International Bond | |||||||||||
| 6.00%, 1/17/17 | 289 | 331 | |||||||||
| Export - Import Bank of Korea | |||||||||||
| 4.13%, 9/9/15 | 100 | 101 | |||||||||
| Korea Development Bank | |||||||||||
| 4.38%, 8/10/15 | 140 | 143 | |||||||||
| 710 | |||||||||||
| U.S. Agency Securities (4.4%) | |||||||||||
| Federal National Mortgage Association, | |||||||||||
| 1.25%, 9/28/16 | 250 | 250 | |||||||||
| 2.50%, 5/15/14 | 1,360 | 1,427 | |||||||||
| 5.38%, 6/12/17 | 1,065 | 1,293 | |||||||||
| 2,970 | |||||||||||
| U.S. Treasury Securities (4.2%) | |||||||||||
| U.S. Treasury Bonds, | |||||||||||
| 3.50%, 2/15/39 | 1,535 | 1,707 | |||||||||
| 4.63%, 2/15/40 | 550 | 735 | |||||||||
| U.S. Treasury Note | |||||||||||
| 1.25%, 8/31/15 (e) | 409 | 419 | |||||||||
| 2,861 | |||||||||||
| Total Fixed Income Securities (Cost $61,819) | 64,555 | ||||||||||
| Shares | |||||||||||
| Short-Term Investments (6.5%) | |||||||||||
| Securities held as Collateral on Loaned Securities (1.5%) | |||||||||||
| Investment Company (1.4%) | |||||||||||
| Morgan Stanley Institutional Liquidity Funds — Money Market Portfolio — Institutional Class (See Note G-2) | 907,637 | 908 | |||||||||
| Face Amount (000) | |||||||||||
| Repurchase Agreements (0.1%) | |||||||||||
| Merrill Lynch & Co., Inc., (0.10%, dated 9/30/11, due 10/3/11; proceeds $24; fully collateralized by a U.S. Government Agency; Government National Mortgage Association 4.00% due 5/16/38; valued at $24) | $ | 24 | 24 | ||||||||
| Nomura Holdings, Inc., (0.14%, dated 9/30/11, due 10/3/11; proceeds $48; fully collateralized by U.S. Government Agencies; Federal Home Loan Mortgage Corporation 4.00% due 7/1/26; Federal National Mortgage Association 3.00% due 1/1/26; valued at $49) | 48 | 48 | |||||||||
| 72 | |||||||||||
| Total Securities held as Collateral on Loaned Securities (Cost $980) | 980 | ||||||||||
| Shares | Value (000) | ||||||||||
| Investment Company (4.8%) | |||||||||||
| Morgan Stanley Institutional Liquidity Funds — Money Market Portfolio — Institutional Class (See Note G-2) | 3,233,071 | $ | 3,233 | ||||||||
| Face Amount (000) | |||||||||||
| U.S. Treasury Security (0.2%) | |||||||||||
| U.S. Treasury Bill | |||||||||||
| 0.02%, 3/22/12 (g)(h) | $ | 125 | 125 | ||||||||
| Total Short-Term Investments (Cost $4,338) | 4,338 | ||||||||||
| Total Investments (102.3%) (Cost $66,157) Including $961 of Securities Loaned (i) | 68,893 | ||||||||||
| Liabilities in Excess of Other Assets (-2.3%) | (1,522 | ) | |||||||||
| Net Assets (100.0%) | $ | 67,371 | |||||||||
(a) Security is subject to delayed delivery.
(b) 144A security — Certain conditions for public sale may exist. Unless otherwise noted, these securities are deemed to be liquid.
(c) Variable/Floating Rate Security — Interest rate changes on these instruments are based on changes in a designated base rate. The rates shown are those in effect on September 30, 2011.
(d) Inverse Floating Rate Security — Interest rate fluctuates with an inverse relationship to an associated interest rate. Indicated rate is the effective rate at September 30, 2011.
(e) All or a portion of this security was on loan at September 30, 2011.
(f) When-issued security.
(g) Rate shown is the yield to maturity at September 30, 2011.
(h) All or a portion of the security was pledged to cover margin requirements for futures contracts.
(i) Securities are available for collateral in connection with securities purchased on a forward commitment basis and futures contracts.
IO Interest Only.
MTN Medium Term Note.
PAC Planned Amortization Class.
REMIC Real Estate Mortgage Investment Conduit.
STRIPS Separate Trading of Registered Interest and Principal of Securities.
TBA To Be Announced.
The accompanying notes are an integral part of the financial statements.
58
2011 Annual Report
September 30, 2011
Portfolio of Investments (cont'd)
Investment Grade Fixed Income Portfolio
Futures Contracts:
The Portfolio had the following futures contracts open at period end:
| Number of Contracts | Value (000) | Expiration Date | Unrealized Appreciation (Depreciation) (000) | ||||||||||||||||
| Long: | |||||||||||||||||||
| U.S. Treasury 2 yr. Note | 48 | $ | 10,570 | Dec-11 | $ | (17 | ) | ||||||||||||
| U.S. Treasury 5 yr. Note | 32 | 3,920 | Dec-11 | (5 | ) | ||||||||||||||
| U.S. Treasury Ultra Long Bond | 5 | 793 | Dec-11 | (12 | ) | ||||||||||||||
| Short: | |||||||||||||||||||
| U.S. Treasury 10 yr. Note | 85 | (11,058 | ) | Dec-11 | (44 | ) | |||||||||||||
| U.S. Treasury 30 yr. Bond | 7 | (998 | ) | Dec-11 | (1 | ) | |||||||||||||
| $ | (79 | ) | |||||||||||||||||
Fair Value Measurement Information:
The following is a summary of the inputs used to value the Portfolio's net assets as of September 30, 2011. (See Note A-6 to the financial statements for further information regarding fair value measurement.)
| Investment Type | Level 1 Unadjusted quoted prices (000) | Level 2 Other significant observable inputs (000) | Level 3 Significant unobservable inputs (000) | Total (000) | |||||||||||||||
| Assets: | |||||||||||||||||||
| Fixed Income Securities | |||||||||||||||||||
| Agency Fixed Rate Mortgages | $ | — | $ | 19,495 | $ | — | $ | 19,495 | |||||||||||
| Asset-Backed Securities | — | 4,768 | — | 4,768 | |||||||||||||||
| Collateralized Mortgage Obligations — Agency Collateral Series | — | 6,690 | — | 6,690 | |||||||||||||||
| Commercial Mortgage Backed Securities | — | 3,372 | — | 3,372 | |||||||||||||||
| Corporate Bonds | — | 22,511 | — | 22,511 | |||||||||||||||
| Municipal Bonds | — | 1,178 | — | 1,178 | |||||||||||||||
| Sovereign | — | 710 | — | 710 | |||||||||||||||
| U.S. Agency Securities | — | 2,970 | — | 2,970 | |||||||||||||||
| U.S. Treasury Securities | — | 2,861 | — | 2,861 | |||||||||||||||
| Total Fixed Income Securities | — | 64,555 | — | 64,555 | |||||||||||||||
Fair Value Measurement Information: (cont'd)
| Investment Type | Level 1 Unadjusted quoted prices (000) | Level 2 Other significant observable inputs (000) | Level 3 Significant unobservable inputs (000) | Total (000) | |||||||||||||||
| Short-Term Investments | |||||||||||||||||||
| Investment Company | $ | 4,141 | $ | — | $ | — | $ | 4,141 | |||||||||||
| Repurchase Agreements | — | 72 | — | 72 | |||||||||||||||
| U.S. Treasury Security | — | 125 | — | 125 | |||||||||||||||
| Total Short-Term Investments | 4,141 | 197 | — | 4,338 | |||||||||||||||
| Total Assets | 4,141 | 64,752 | — | 68,893 | |||||||||||||||
| Liabilities: | |||||||||||||||||||
| Futures Contracts | (79 | ) | — | — | (79 | ) | |||||||||||||
| Total | $ | 4,062 | $ | 64,752 | $ | — | $ | 68,814 | |||||||||||
Transfers between investment levels may occur as the markets fluctuate and/or the availability of data used in an investment's valuation changes. The Portfolio recognizes transfers between the levels as of the end of the period. As of September 30, 2011, the Portfolio did not have any significant investments transfer between investment levels.
The accompanying notes are an integral part of the financial statements.
59
2011 Annual Report
September 30, 2011
Investment Overview (unaudited)
Limited Duration Portfolio
Performance
For the fiscal year ended September 30, 2011, the Portfolio's Class I had a total return based on net asset value and reinvestment of distributions per share of 0.71%, net of fees. The Portfolio's Class I underperformed against its benchmark, the Barclays Capital 1-3 Year U.S. Government/Credit Index (the "Index"), which returned 1.28% and also underperformed against the Citigroup 1-3 Year Treasury/Government Sponsored Index which returned 1.21%.
Factors Affecting Performance
• Financial markets were volatile during much of the 12-month period, with political upheaval across the Middle East at the beginning of 2011. Markets were further disrupted by the earthquake in Japan in March, as investors feared supply chain disruptions for electronics and auto components. In the summer investors focused on the U.S. debt ceiling issue. Then, in August, one of the three major bond rating agencies, Standard & Poor's, downgraded the U.S.'s credit rating from AAA to AA+. August and September were the most volatile months as concerns about the European sovereign debt crisis and a slowdown in global growth led to a dramatic sell-off in risky assets.
• The Federal Reserve's second round of quantitative easing (QE2), an asset purchase program intended to stimulate the economy by encouraging banks to lend, ended in June. Amidst renewed weakness in economic indicators in the second half of the period, the Fed announced that it would extend the maturity of its Treasury holdings to put downward pressure on longer-term interest rates. In addition, to provide support to the mortgage market, the Fed will re-invest principal payments from its mortgage and agency holdings into mortgages instead of Treasuries.
• Investment-grade corporate debt spreads versus Treasuries narrowed in the first half of the period. Corporate balance sheets have been strong, with near all-time highs in profit margins, cash flow generation and cash on balance sheet. However, in the third quarter of 2011, the credit market, especially the financial sector, was negatively affected by the increased risk aversion due to the European debt crisis and signs of slowing economic growth. Overall, short maturity investment-grade corporate spreads ended the period almost 65 basis points wider after tightening about 30 basis points in first few months of the period.
• The asset-backed security (ABS) sector was relatively stable over the period. High quality ABS spreads tightened over the first few months but then stabilized.
• The U.S. Treasury yield curve flattened during the period, with yields on 2-, 5-, 10-, and 30-year Treasuries declining by 18, 32, 59, and 77 basis points, respectively.
• The Portfolio's overweight position in the investment-grade credit sector, particularly banking, detracted from relative performance.
• The Portfolio benefitted from an allocation to ABS as spreads in the sector tightened over the period and the bonds provided attractive carry.
Management Strategies
• Throughout the period, the Portfolio was positioned with an overweight to investment-grade credit as corporate valuations relative to fundamentals have been attractive. We continue to maintain an overweight to the sector.
• The Portfolio also has an allocation to short, high quality ABS. This is primarily in credit card, auto and equipment securities.
• Additionally, interest rate positioning contributed to performance. The Portfolio was positioned to benefit from an anticipated flattening (or, reduction in the difference of yield spreads) between the short and intermediate parts of the yield curve. We unwound the position profitably towards the end of the reporting period.
60
2011 Annual Report
September 30, 2011
Investment Overview (unaudited) (cont'd)
Limited Duration Portfolio

* Minimum Investment
In accordance with SEC regulations, the Portfolio's performance shown assumes that all recurring fees (including management fees) were deducted and all dividends and distributions were reinvested. The performance of Class P shares will vary from the Class I shares based upon their different inception dates and will be negatively impacted by additional fees assessed to that class.
Performance Compared to the Barclays Capital 1-3 Year U.S. Government/Credit Index(1), the Citigroup 1-3 Year Treasury/Government Sponsored Index(2) and the Lipper Short Investment Grade Debt Funds Index(3)
| Period Ended September 30, 2011 Total Returns(4) | |||||||||||||||||||
| Average Annual | |||||||||||||||||||
| One Year | Five Years | Ten Years | Since Inception(7) | ||||||||||||||||
| Portfolio — Class I Shares w/o sales charges(5) | 0.71 | % | –1.79 | % | 0.53 | % | 3.27 | % | |||||||||||
| Barclays Capital 1-3 Year U.S. Government/Credit Index. | 1.28 | 4.15 | 3.68 | 5.00 | |||||||||||||||
| Citigroup 1-3 Year Treasury/ Government Sponsored Index | 1.21 | 3.95 | 3.45 | 4.85 | |||||||||||||||
| Lipper Short Investment Grade Debt Funds Index | 1.26 | 3.37 | 3.06 | 4.53 | |||||||||||||||
| Portfolio — Class P Shares w/o sales charges(6) | 0.45 | — | — | –3.48 | |||||||||||||||
| Barclays Capital 1-3 Year U.S. Government/Credit Index. | 1.28 | — | — | 3.78 | |||||||||||||||
| Citigroup 1-3 Year Treasury/ Government Sponsored Index | 1.21 | — | — | 3.49 | |||||||||||||||
| Lipper Short Investment Grade Debt Funds Index | 1.26 | — | — | 3.02 | |||||||||||||||
Performance data quoted represents past performance, which is no guarantee of future results, and current performance may be lower or higher than the figures shown. Performance assumes that all dividends and distributions, if any, were reinvested. For the most recent month-end performance figures, please visit www.morganstanley.com/im. Investment returns and principal value will fluctuate so that Portfolio shares, when redeemed, may be worth more or less than their original cost. Total returns do not reflect the deduction of taxes that a shareholder would pay on Portfolio distributions or the redemption of Portfolio shares. Performance of share classes will vary due to differences in expenses.
(1) The Barclays Capital 1-3 Year U.S. Government/Credit Index tracks the securities in the 1-3 year maturity range of the Barclays Capital U.S. Government/Credit Index which tracks investment-grade (BBB-/Baa3) or higher publicly traded fixed-rate U.S. government, U.S. agency, and corporate issues. The Index is unmanaged and its returns do not include any sales charges or fees. Such costs would lower performance. It is not possible to invest directly in an index. The benchmark for the Portfolio is changing from the Citigroup 1-3 Year Treasury/Government Sponsored Index to the Barclays Capital 1-3 Year U.S. Government/Credit Index to more accurately reflect the Portfolio's investible universe.
(2) The Citigroup 1-3 Year Treasury/Government Sponsored Index is a fixed income market-value weighted index that includes all U.S. Treasury and U.S. agency securities with remaining maturities of at least one year and not longer than three years. The Index is unmanaged and its returns do not include any sales charges or fees. Such costs would lower performance. It is not possible to invest directly in an index.
(3) The Lipper Short Investment Grade Debt Funds Index is an equally weighted performance index of the largest qualifying funds (based on net assets) in the Lipper Short Investment Grade Debt Funds classification. The Index, which is adjusted for capital gains distributions and income dividends, is unmanaged and should not be considered an investment. There are currently 30 funds represented in this Index. As of the date of this report, the Portfolio was in the Lipper Short Investment Grade Debt Funds classification.
(4) Total returns for the Portfolio reflect expenses waived and/or reimbursed, if applicable, by the Adviser. Without such waivers and/or reimbursements, total returns would have been lower. Fee waivers and/or reimbursements are expected to continue until such time that the Fund's Board of Trustees acts to discontinue such waivers and/or reimbursements.
(5) Commenced operations on March 31, 1992.
(6) Commenced operations on September 28, 2007.
(7) For comparative purposes, average annual since inception returns listed for the Indexes refer to the inception date or initial offering of the share class of the Portfolio, not the inception of the Indexes.
Portfolio Composition
| Classification | Percentage of Total Investments | ||||||
| Finance | 30.4 | % | |||||
| Asset-Backed Securities | 24.2 | ||||||
| Industrials | 22.1 | ||||||
| Other* | 16.5 | ||||||
| Non-U.S. Government — Guaranteed | 6.8 | ||||||
| Total Investments | 100.0 | %** | |||||
* Industries and/or investment types representing less than 5% of total investments.
** Does not include open long/short futures contracts with a value of approximately $12,278,000 and net unrealized depreciation of approximately $17,000 and does not include open swap agreements with net unrealized depreciation of approximately $528,000.
61
2011 Annual Report
September 30, 2011
Portfolio of Investments
Limited Duration Portfolio
| Face Amount (000) | Value (000) | ||||||||||
| Fixed Income Securities (95.6%) | |||||||||||
| Agency Adjustable Rate Mortgages (0.7%) | |||||||||||
| Federal Home Loan Mortgage Corporation, | |||||||||||
| Conventional Pools: | |||||||||||
| 5.46%, 1/1/38 | $ | 305 | $ | 326 | |||||||
| Federal National Mortgage Association, | |||||||||||
| Conventional Pools: | |||||||||||
| 2.43%, 5/1/35 | 881 | 928 | |||||||||
| 1,254 | |||||||||||
| Agency Bond — Banking (FDIC Guaranteed) (1.4%) | |||||||||||
| FDIC Structured Sale Guaranteed Notes | |||||||||||
| Zero Coupon, 10/25/11 (a) | 2,300 | 2,300 | |||||||||
| Agency Fixed Rate Mortgages (0.9%) | |||||||||||
| Federal Home Loan Mortgage Corporation, | |||||||||||
| Gold Pools: | |||||||||||
| 6.50%, 9/1/19 - 11/1/29 | 18 | 22 | |||||||||
| 7.50%, 11/1/19 | 2 | 3 | |||||||||
| 12.00%, 6/1/15 | 5 | 5 | |||||||||
| Federal National Mortgage Association, | |||||||||||
| Conventional Pools: | |||||||||||
| 6.50%, 3/1/18 - 10/1/32 | 1,134 | 1,280 | |||||||||
| 7.00%, 7/1/29 - 12/1/33 | 65 | 75 | |||||||||
| Government National Mortgage Association, | |||||||||||
| Various Pools: | |||||||||||
| 9.00%, 11/15/16 - 12/15/16 | 46 | 51 | |||||||||
| 1,436 | |||||||||||
| Asset-Backed Securities (24.2%) | |||||||||||
| Ally Master Owner Trust, | |||||||||||
| 1.98%, 1/15/15 (a)(b) | 275 | 279 | |||||||||
| 2.15%, 1/15/16 | 700 | 711 | |||||||||
| 2.88%, 4/15/15 (a) | 650 | 667 | |||||||||
| American Express Credit Account Master Trust | |||||||||||
| 1.48%, 3/15/17 (b) | 2,325 | 2,399 | |||||||||
| ARI Fleet Lease Trust | |||||||||||
| 1.68%, 8/15/18 (a)(b) | 305 | 307 | |||||||||
| Bank of America Auto Trust | |||||||||||
| 2.13%, 9/15/13 (a) | 600 | 602 | |||||||||
| BMW Floorplan Master Owner Trust | |||||||||||
| 1.38%, 9/15/14 (a)(b) | 2,600 | 2,620 | |||||||||
| Capital One Multi-Asset Execution Trust | |||||||||||
| 0.31%, 9/15/15 (b) | 1,355 | 1,354 | |||||||||
| Chase Issuance Trust | |||||||||||
| 1.78%, 4/15/14 (b) | 1,600 | 1,613 | |||||||||
| Chesapeake Funding LLC | |||||||||||
| 2.23%, 12/15/20 (a)(b) | 483 | 485 | |||||||||
| Citibank Credit Card Issuance Trust (See Note G-2) | |||||||||||
| 2.25%, 12/23/14 | 1,950 | 1,990 | |||||||||
| CNH Equipment Trust, | |||||||||||
| 1.17%, 5/15/15 | 1,725 | 1,729 | |||||||||
| 1.54%, 7/15/14 | 1,178 | 1,182 | |||||||||
| Discover Card Master Trust | |||||||||||
| 1.53%, 12/15/14 (b) | 3,000 | 3,026 | |||||||||
| Face Amount (000) | Value (000) | ||||||||||
| Ford Credit Floorplan Master Owner Trust, | |||||||||||
| 1.78%, 9/15/14 (b) | $ | 2,600 | $ | 2,629 | |||||||
| 4.20%, 2/15/17 (a) | 1,150 | 1,250 | |||||||||
| GE Capital Credit Card Master Note Trust | |||||||||||
| 2.33%, 4/15/15 (b) | 3,850 | 3,891 | |||||||||
| GE Equipment Midticket LLC | |||||||||||
| 0.94%, 7/14/14 (a) | 1,200 | 1,201 | |||||||||
| Harley-Davidson Motorcycle Trust, | |||||||||||
| 1.16%, 2/15/15 | 1,825 | 1,833 | |||||||||
| 1.74%, 9/15/13 | 660 | 662 | |||||||||
| 1.87%, 2/15/14 | 878 | 881 | |||||||||
| Huntington Auto Trust | |||||||||||
| 3.94%, 6/17/13 (a) | 441 | 444 | |||||||||
| Macquarie Equipment Funding Trust | |||||||||||
| 1.21%, 9/20/13 (a) | 1,525 | 1,526 | |||||||||
| MMAF Equipment Finance LLC | |||||||||||
| 2.37%, 11/15/13 (a) | 995 | 1,000 | |||||||||
| MMCA Automobile Trust | |||||||||||
| 1.39%, 1/15/14 (a) | 1,330 | 1,333 | |||||||||
| Navistar Financial Corp. Owner Trust | |||||||||||
| 1.47%, 10/18/12 (a) | 567 | 568 | |||||||||
| Nissan Auto Lease Trust | |||||||||||
| 1.12%, 12/15/13 | 1,625 | 1,633 | |||||||||
| Nissan Master Owner Trust Receivables | |||||||||||
| 1.38%, 1/15/15 (a)(b) | 625 | 631 | |||||||||
| North Carolina State Education Assistance Authority, | |||||||||||
| 0.70%, 1/25/21 (b) | 879 | 878 | |||||||||
| 1.14%, 7/25/25 (b) | 625 | 605 | |||||||||
| Panhandle-Plains Higher Education Authority, Inc. | |||||||||||
| 1.21%, 7/1/24 (b) | 275 | 272 | |||||||||
| Wheels SPV LLC | |||||||||||
| 1.78%, 3/15/18 (a)(b) | 413 | 415 | |||||||||
| 40,616 | |||||||||||
| Collateralized Mortgage Obligation — Agency Collateral Series (1.4%) | |||||||||||
| Federal Home Loan Mortgage Corporation, | |||||||||||
| REMIC | |||||||||||
| 7.50%, 9/15/29 | 1,970 | 2,288 | |||||||||
| Commercial Mortgage Backed Security (0.4%) | |||||||||||
| Wachovia Bank Commercial Mortgage Trust | |||||||||||
| 5.50%, 7/15/41 (b) | 665 | 716 | |||||||||
| Corporate Bonds (56.9%) | |||||||||||
| Finance (30.4%) | |||||||||||
| ABB Treasury Center USA, Inc. | |||||||||||
| 2.50%, 6/15/16 (a) | 745 | 762 | |||||||||
| Abbey National Treasury Services PLC, | |||||||||||
| 2.88%, 4/25/14 | 615 | 580 | |||||||||
| 3.88%, 11/10/14 (a) | 1,850 | 1,778 | |||||||||
| Aflac, Inc. | |||||||||||
| 3.45%, 8/15/15 | 325 | 332 | |||||||||
| American Express Co. | |||||||||||
| 7.25%, 5/20/14 | 1,680 | 1,905 | |||||||||
The accompanying notes are an integral part of the financial statements.
62
2011 Annual Report
September 30, 2011
Portfolio of Investments (cont'd)
Limited Duration Portfolio
| Face Amount (000) | Value (000) | ||||||||||
| Finance (cont'd) | |||||||||||
| American International Group, Inc. | |||||||||||
| 3.65%, 1/15/14 | $ | 745 | $ | 727 | |||||||
| Banco Bradesco SA | |||||||||||
| 4.13%, 5/16/16 (a) | 660 | 663 | |||||||||
| Bank of America Corp., | |||||||||||
| Series 1 | |||||||||||
| 3.75%, 7/12/16 | 2,245 | 2,045 | |||||||||
| Bank One Corp. | |||||||||||
| 5.25%, 1/30/13 | 1,450 | 1,504 | |||||||||
| Barclays Bank PLC | |||||||||||
| 2.50%, 1/23/13 | 1,030 | 1,023 | |||||||||
| BBVA Bancomer SA | |||||||||||
| 4.50%, 3/10/16 (a) | 955 | 898 | |||||||||
| BBVA US Senior SAU | |||||||||||
| 3.25%, 5/16/14 | 700 | 656 | |||||||||
| BNP Paribas SA | |||||||||||
| 3.60%, 2/23/16 | 920 | 906 | |||||||||
| BP Capital Markets PLC | |||||||||||
| 3.88%, 3/10/15 | 595 | 631 | |||||||||
| Canadian Imperial Bank of Commerce | |||||||||||
| 1.45%, 9/13/13 | 1,130 | 1,137 | |||||||||
| Capital One Financial Corp. | |||||||||||
| 7.38%, 5/23/14 | 875 | 978 | |||||||||
| Cie de Financement Foncier | |||||||||||
| 2.25%, 3/7/14 (a) | 1,400 | 1,395 | |||||||||
| Citigroup, Inc. (See Note G-2) | |||||||||||
| 4.59%, 12/15/15 | 1,385 | 1,423 | |||||||||
| Commonwealth Bank of Australia | |||||||||||
| 2.75%, 10/15/12 (a) | 2,400 | 2,441 | |||||||||
| Credit Suisse | |||||||||||
| 5.50%, 5/1/14 | 840 | 889 | |||||||||
| Deutsche Bank AG | |||||||||||
| 2.38%, 1/11/13 | 1,105 | 1,098 | |||||||||
| Fifth Third Bancorp | |||||||||||
| 3.63%, 1/25/16 | 395 | 402 | |||||||||
| General Electric Capital Corp. | |||||||||||
| 2.95%, 5/9/16 | 2,790 | 2,799 | |||||||||
| Genworth Life Institutional Funding Trust | |||||||||||
| 5.88%, 5/3/13 (a) | 865 | 878 | |||||||||
| Goldman Sachs Group, Inc. (The) | |||||||||||
| 3.70%, 8/1/15 | 1,250 | 1,225 | |||||||||
| HCP, Inc. | |||||||||||
| 2.70%, 2/1/14 | 575 | 567 | |||||||||
| HSBC Finance Corp., | |||||||||||
| 6.38%, 10/15/11 | 285 | 285 | |||||||||
| 7.00%, 5/15/12 | 700 | 721 | |||||||||
| Intesa Sanpaolo SpA | |||||||||||
| 3.63%, 8/12/15 (a) | 550 | 482 | |||||||||
| Jefferies Group, Inc. | |||||||||||
| 3.88%, 11/9/15 | 250 | 245 | |||||||||
| JPMorgan Chase & Co. | |||||||||||
| 3.15%, 7/5/16 | 1,025 | 1,019 | |||||||||
| Face Amount (000) | Value (000) | ||||||||||
| Macquarie Group Ltd. | |||||||||||
| 7.30%, 8/1/14 (a) | $ | 720 | $ | 780 | |||||||
| Metropolitan Life Global Funding I | |||||||||||
| 2.00%, 1/10/14 (a) | 950 | 955 | |||||||||
| Monumental Global Funding III | |||||||||||
| 5.25%, 1/15/14 (a) | 1,115 | 1,181 | |||||||||
| National Australia Bank Ltd. | |||||||||||
| 3.00%, 7/27/16 (a) | 900 | 903 | |||||||||
| Nationwide Building Society | |||||||||||
| 4.65%, 2/25/15 (a) | 840 | 849 | |||||||||
| Nissan Motor Acceptance Corp. | |||||||||||
| 3.25%, 1/30/13 (a) | 90 | 92 | |||||||||
| Nordea Bank AB | |||||||||||
| 2.50%, 11/13/12 (a) | 1,135 | 1,144 | |||||||||
| Northern Trust Corp. | |||||||||||
| 5.50%, 8/15/13 | 1,060 | 1,150 | |||||||||
| Principal Financial Group, Inc. | |||||||||||
| 7.88%, 5/15/14 | 816 | 927 | |||||||||
| Prudential Financial, Inc. | |||||||||||
| 4.75%, 9/17/15 | 930 | 972 | |||||||||
| Royal Bank of Scotland PLC (The), | |||||||||||
| 2.63%, 5/11/12 (a) | 3,230 | 3,272 | |||||||||
| 4.88%, 3/16/15 | 355 | 348 | |||||||||
| Societe Generale SA | |||||||||||
| 3.10%, 9/14/15 (a) | 320 | 289 | |||||||||
| Standard Chartered PLC | |||||||||||
| 3.85%, 4/27/15 (a) | 940 | 964 | |||||||||
| Svenska Handelsbanken AB | |||||||||||
| 2.88%, 9/14/12 (a) | 1,060 | 1,077 | |||||||||
| TD Ameritrade Holding Corp. | |||||||||||
| 2.95%, 12/1/12 | 1,200 | 1,219 | |||||||||
| UBS AG | |||||||||||
| 3.88%, 1/15/15 | 1,140 | 1,136 | |||||||||
| Wells Fargo & Co. | |||||||||||
| 3.68%, 6/15/16 | 1,350 | 1,406 | |||||||||
| 51,058 | |||||||||||
| Industrials (22.1%) | |||||||||||
| Agilent Technologies, Inc. | |||||||||||
| 4.45%, 9/14/12 | 1,325 | 1,363 | |||||||||
| Altria Group, Inc. | |||||||||||
| 4.13%, 9/11/15 | 750 | 803 | |||||||||
| Anglo American Capital PLC | |||||||||||
| 9.38%, 4/8/14 (a) | 1,100 | 1,279 | |||||||||
| Anheuser-Busch InBev Worldwide, Inc., | |||||||||||
| 4.13%, 1/15/15 | 350 | 380 | |||||||||
| 5.38%, 11/15/14 | 785 | 878 | |||||||||
| Applied Materials, Inc. | |||||||||||
| 2.65%, 6/15/16 | 455 | 467 | |||||||||
| ArcelorMittal | |||||||||||
| 9.00%, 2/15/15 | 610 | 671 | |||||||||
| AT&T, Inc. | |||||||||||
| 4.95%, 1/15/13 | 2,510 | 2,630 | |||||||||
The accompanying notes are an integral part of the financial statements.
63
2011 Annual Report
September 30, 2011
Portfolio of Investments (cont'd)
Limited Duration Portfolio
| Face Amount (000) | Value (000) | ||||||||||
| Industrials (cont'd) | |||||||||||
| Bacardi Ltd. | |||||||||||
| 7.45%, 4/1/14 (a) | $ | 835 | $ | 953 | |||||||
| Barrick Gold Corp. | |||||||||||
| 1.75%, 5/30/14 | 660 | 664 | |||||||||
| Best Buy Co., Inc. | |||||||||||
| 3.75%, 3/15/16 | 875 | 849 | |||||||||
| Bunge Ltd. Finance Corp. | |||||||||||
| 5.35%, 4/15/14 | 830 | 876 | |||||||||
| Comcast Corp. | |||||||||||
| 6.50%, 1/15/15 | 870 | 992 | |||||||||
| COX Communications, Inc. | |||||||||||
| 4.63%, 6/1/13 | 690 | 726 | |||||||||
| Daimler Finance North America LLC | |||||||||||
| 1.88%, 9/15/14 (a) | 785 | 775 | |||||||||
| Danaher Corp. | |||||||||||
| 1.30%, 6/23/14 | 255 | 258 | |||||||||
| Delhaize Group SA | |||||||||||
| 5.88%, 2/1/14 | 1,025 | 1,117 | |||||||||
| DirecTV Holdings LLC/DirecTV Financing Co., Inc. | |||||||||||
| 4.75%, 10/1/14 | 695 | 753 | |||||||||
| Dow Chemical Co. (The) | |||||||||||
| 5.90%, 2/15/15 | 1,105 | 1,221 | |||||||||
| EOG Co. of Canada | |||||||||||
| 7.00%, 12/1/11 (a) | 1,325 | 1,339 | |||||||||
| Harley-Davidson Funding Corp. | |||||||||||
| 5.25%, 12/15/12 (a) | 820 | 850 | |||||||||
| Home Depot, Inc. | |||||||||||
| 5.40%, 3/1/16 | 630 | 714 | |||||||||
| Kinross Gold Corp. | |||||||||||
| 3.63%, 9/1/16 (a) | 740 | 732 | |||||||||
| Kraft Foods, Inc. | |||||||||||
| 6.75%, 2/19/14 | 875 | 977 | |||||||||
| Kroger Co. (The) | |||||||||||
| 7.50%, 1/15/14 | 725 | 821 | |||||||||
| Marathon Petroleum Corp. | |||||||||||
| 3.50%, 3/1/16 (a) | 1,070 | 1,104 | |||||||||
| Marriott International, Inc. | |||||||||||
| 4.63%, 6/15/12 | 1,300 | 1,328 | |||||||||
| McKesson Corp. | |||||||||||
| 3.25%, 3/1/16 | 1,070 | 1,129 | |||||||||
| NBC Universal Media LLC | |||||||||||
| 2.10%, 4/1/14 | 835 | 848 | |||||||||
| News America, Inc. | |||||||||||
| 5.30%, 12/15/14 | 455 | 495 | |||||||||
| Potash Corp. of Saskatchewan, Inc. | |||||||||||
| 5.25%, 5/15/14 | 1,105 | 1,217 | |||||||||
| Quest Diagnostics, Inc. | |||||||||||
| 3.20%, 4/1/16 | 925 | 961 | |||||||||
| Stryker Corp. | |||||||||||
| 2.00%, 9/30/16 | 715 | 719 | |||||||||
| Face Amount (000) | Value (000) | ||||||||||
| Telecom Italia Capital SA | |||||||||||
| 5.25%, 11/15/13 | $ | 1,055 | $ | 1,032 | |||||||
| Texas Instruments, Inc. | |||||||||||
| 1.38%, 5/15/14 | 955 | 966 | |||||||||
| Time Warner Cable, Inc. | |||||||||||
| 8.25%, 2/14/14 | 700 | 796 | |||||||||
| Viacom, Inc. | |||||||||||
| 4.38%, 9/15/14 | 1,100 | 1,176 | |||||||||
| Vodafone Group PLC | |||||||||||
| 5.00%, 12/16/13 | 1,060 | 1,144 | |||||||||
| Waste Management, Inc. | |||||||||||
| 2.60%, 9/1/16 | 725 | 728 | |||||||||
| Wesfarmers Ltd. | |||||||||||
| 2.98%, 5/18/16 (a) | 395 | 400 | |||||||||
| 37,131 | |||||||||||
| Utilities (4.4%) | |||||||||||
| Commonwealth Edison Co. | |||||||||||
| 1.63%, 1/15/14 | 400 | 403 | |||||||||
| EDF SA | |||||||||||
| 5.50%, 1/26/14 (a) | 1,105 | 1,184 | |||||||||
| Enel Finance International N.V. | |||||||||||
| 3.88%, 10/7/14 (a) | 1,115 | 1,089 | |||||||||
| FirstEnergy Solutions Corp. | |||||||||||
| 4.80%, 2/15/15 | 755 | 801 | |||||||||
| NextEra Energy Capital Holdings, Inc. | |||||||||||
| 5.35%, 6/15/13 | 825 | 879 | |||||||||
| Plains All American Pipeline L.P./PAA Finance Corp. | |||||||||||
| 4.25%, 9/1/12 | 1,140 | 1,172 | |||||||||
| Sempra Energy | |||||||||||
| 2.00%, 3/15/14 | 915 | 925 | |||||||||
| Spectra Energy Capital LLC | |||||||||||
| 5.90%, 9/15/13 | 965 | 1,034 | |||||||||
| 7,487 | |||||||||||
| 95,676 | |||||||||||
| Mortgage — Other (0.4%) | |||||||||||
| FDIC Structured Sale Guaranteed Notes | |||||||||||
| 0.79%, 2/25/48 (a)(b) | 633 | 635 | |||||||||
| Non-U.S. Government — Guaranteed (6.8%) | |||||||||||
| Commonwealth Bank of Australia | |||||||||||
| 2.50%, 12/10/12 (a) | 2,300 | 2,351 | |||||||||
| Swedbank AB | |||||||||||
| 2.90%, 1/14/13 (a) | 5,900 | 6,084 | |||||||||
| Westpac Securities NZ Ltd. | |||||||||||
| 2.50%, 5/25/12 (a) | 3,020 | 3,055 | |||||||||
| 11,490 | |||||||||||
| U.S. Treasury Security (2.5%) | |||||||||||
| U.S. Treasury Note | |||||||||||
| 2.38%, 6/30/18 | 3,975 | 4,229 | |||||||||
| Total Fixed Income Securities (Cost $159,070) | 160,640 | ||||||||||
The accompanying notes are an integral part of the financial statements.
64
2011 Annual Report
September 30, 2011
Portfolio of Investments (cont'd)
Limited Duration Portfolio
| Shares | Value (000) | ||||||||||
| Short-Term Investments (4.5%) | |||||||||||
| Investment Company (3.5%) | |||||||||||
| Morgan Stanley Institutional Liquidity Funds — Money Market Portfolio — Institutional Class (See Note G-2) | 5,845,929 | $ | 5,846 | ||||||||
| Face Amount (000) | |||||||||||
| U.S. Treasury Security (1.0%) | |||||||||||
| U.S. Treasury Bill | |||||||||||
| 0.02%, 3/22/12 (c)(d)(e) | $ | 1,675 | 1,675 | ||||||||
| Total Short-Term Investments (Cost $7,521) | 7,521 | ||||||||||
| Total Investments (100.1%) (Cost $166,591) (f) | 168,161 | ||||||||||
| Liabilities in Excess of Other Assets (-0.1%) | (156 | ) | |||||||||
| Net Assets (100.0%) | $ | 168,005 | |||||||||
(a) 144A security — Certain conditions for public sale may exist. Unless otherwise noted, these securities are deemed to be liquid.
(b) Variable/Floating Rate Security — Interest rate changes on these instruments are based on changes in a designated base rate. The rates shown are those in effect on September 30, 2011.
(c) Rate shown is the yield to maturity at September 30, 2011.
(d) All or a portion of the security was pledged as collateral for swap agreements.
(e) All or a portion of the security was pledged to cover margin requirements for futures contracts.
(f) Securities are available for collateral in connection with open futures contracts and swap agreements.
FDIC Federal Deposit Insurance Corporation.
REMIC Real Estate Mortgage Investment Conduit.
Futures Contracts:
The Portfolio had the following futures contracts open at period end:
| Number of Contracts | Value (000) | Expiration Date | Unrealized Appreciation (Depreciation) (000) | ||||||||||||||||
| Long: | |||||||||||||||||||
| U.S. Treasury 10 yr. Note | 4 | $ | 520 | Dec-11 | $ | 2 | |||||||||||||
| Short: | |||||||||||||||||||
| U.S. Treasury 5 yr. Note | 96 | (11,758 | ) | Dec-11 | (19 | ) | |||||||||||||
| $ | (17 | ) | |||||||||||||||||
Zero Coupon Swap Agreements
The Portfolio had the following zero coupon swap agreements open at period end:
| Swap Counterparty | Notional Amount (000) | Floating Rate Index | Pay/Receive Floating Rate | Termination Date | Premium Paid (Received) (000) | Unrealized Appreciation (Depreciation) (000) | |||||||||||||||||||||
| Deutsche Bank | $ | 4,696 | 3 Month LIBOR | Pay | 11/15/21 | $ | 170 | $ | 743 | ||||||||||||||||||
| Deutsche Bank | 4,009 | 3 Month LIBOR | Receive | 11/15/21 | (280 | ) | (1,271 | ) | |||||||||||||||||||
| $ | (528 | ) | |||||||||||||||||||||||||
LIBOR London Interbank Offered Rate.
The accompanying notes are an integral part of the financial statements.
65
2011 Annual Report
September 30, 2011
Portfolio of Investments (cont'd)
Limited Duration Portfolio
Fair Value Measurement Information:
The following is a summary of the inputs used to value the Portfolio's net assets as of September 30, 2011. (See Note A-6 to the financial statements for further information regarding fair value measurement.)
| Investment Type | Level 1 Unadjusted quoted prices (000) | Level 2 Other significant observable inputs (000) | Level 3 Significant unobservable inputs (000) | Total (000) | |||||||||||||||
| Assets: | |||||||||||||||||||
| Fixed Income Securities | |||||||||||||||||||
| Agency Adjustable Rate Mortgages | $ | — | $ | 1,254 | $ | — | $ | 1,254 | |||||||||||
| Agency Bond — Banking (FDIC Guaranteed) | — | 2,300 | — | 2,300 | |||||||||||||||
| Agency Fixed Rate Mortgages | — | 1,436 | — | 1,436 | |||||||||||||||
| Asset-Backed Securities | — | 40,616 | — | 40,616 | |||||||||||||||
| Collateralized Mortgage Obligations — Agency Collateral Series | — | 2,288 | — | 2,288 | |||||||||||||||
| Commercial Mortgage Backed Security | — | 716 | — | 716 | |||||||||||||||
| Corporate Bonds | — | 95,676 | — | 95,676 | |||||||||||||||
| Mortgage — Other | — | 635 | — | 635 | |||||||||||||||
| Non-U.S. Government — Guaranteed | — | 11,490 | — | 11,490 | |||||||||||||||
| U.S. Treasury Security | — | 4,229 | — | 4,229 | |||||||||||||||
| Total Fixed Income Securities | — | 160,640 | — | 160,640 | |||||||||||||||
Fair Value Measurement Information: (cont'd)
| Investment Type | Level 1 Unadjusted Quoted prices (000) | Level 2 Other significant observable inputs (000) | Level 3 Significant unobservable inputs (000) | Total (000) | |||||||||||||||
| Short-Term Investments | |||||||||||||||||||
| Investment Company | $ | 5,846 | $ | — | $ | — | $ | 5,846 | |||||||||||
| U.S. Treasury Security | — | 1,675 | — | 1,675 | |||||||||||||||
| Total Short-Term Investments | 5,846 | 1,675 | — | 7,521 | |||||||||||||||
| Futures Contracts | 2 | — | — | 2 | |||||||||||||||
| Zero Coupon Swap Agreements | — | 743 | — | 743 | |||||||||||||||
| Total Assets | 5,848 | 163,058 | — | 168,906 | |||||||||||||||
| Liabilities: | |||||||||||||||||||
| Futures Contracts | (19 | ) | — | — | (19 | ) | |||||||||||||
| Zero Coupon Swap Agreements | — | (1,271 | ) | — | (1,271 | ) | |||||||||||||
| Total Liabilities | (19 | ) | (1,271 | ) | — | (1,290 | ) | ||||||||||||
| Total | $ | 5,829 | $ | 161,787 | $ | — | $ | 167,616 | |||||||||||
Transfers between investment levels may occur as the markets fluctuate and/or the availability of data used in an investment's valuation changes. The Portfolio recognizes transfers between the levels as of the end of the period. As of September 30, 2011, the Portfolio did not have any significant investments transfer between investment levels.
The accompanying notes are an integral part of the financial statements.
66
2011 Annual Report
September 30, 2011
Investment Overview (unaudited)
Long Duration Fixed Income Portfolio
Performance
For the fiscal year ended September 30, 2011, the Portfolio's Class I had a total return based on net asset value and reinvestment of distributions per share of 11.40%, net of fees. The Portfolio's Class I underperformed against its benchmark the Barclays Capital U.S. Long Government/Credit Index (the "Index"), which returned 12.74%.
Factors Affecting Performance
• Financial markets were volatile during much of the 12-month period, with political upheaval across the Middle East at the beginning of 2011. Markets were further disrupted by the earthquake in Japan in March, as investors feared supply chain disruptions for electronics and auto components. In the summer investors focused on the U.S. debt ceiling issue. Then, in August, one of the three major bond rating agencies, Standard & Poor's, downgraded the U.S.'s credit rating from AAA to AA+. August and September were the most volatile months as concerns about the European sovereign debt crisis and a slowdown in global growth led to a dramatic sell-off in risky assets.
• The Federal Reserve's second round of quantitative easing (QE2), an asset purchase program intended to stimulate the economy by encouraging banks to lend, ended in June. Amidst renewed weakness in economic indicators in the second half of the period, the Fed announced that it would extend the maturity of its Treasury holdings to put downward pressure on longer-term interest rates. In addition, to provide support to the mortgage market, the Fed will re-invest principal payments from its mortgage and agency holdings into mortgages instead of Treasuries.
• Investment-grade corporate debt spreads versus Treasuries narrowed in the first half of the period. Corporate balance sheets have been strong, with near all-time highs in profit margins, cash flow generation and cash on balance sheet. However, in the third quarter of 2011, the credit market, especially the financial sector, was negatively affected by the increased risk aversion due to the European debt crisis and signs of slowing economic growth. Overall, long maturity investment-grade corporate spreads ended the period almost 80 basis points wider after tightening about 35 basis points in first few months of the reporting period.
• The U.S. Treasury yield curve flattened during the period, with yields on 2-, 5-, 10-, and 30-year Treasuries declining by 18, 32, 59, and 77 basis points, respectively.
• The Portfolio's overweight position in the investment-grade credit sector, particularly banking, detracted from relative performance.
• The Portfolio's interest-rate positioning helped offset some of the underperformance from the credit sector.
Management Strategies
• Throughout the period, the Portfolio was positioned with an overweight to investment-grade credit as corporate valuations relative to fundamentals have been attractive. We reduced some credit exposure a few months ago but continue to maintain an overweight to the sector.
• With regard to interest rate strategy, the Portfolio was positioned to benefit from an anticipated flattening (or, reduction in the difference of yield spreads) between the short and intermediate parts of the yield curve. We unwound the position profitably towards the end of the reporting period.

* Minimum Investment
** Commenced operations on July 21, 2006.
In accordance with SEC regulations, the Portfolio's performance shown assumes that all recurring fees (including management fees) were deducted and all dividends and distributions were reinvested. The performance of Class P shares will vary from the Class I shares based upon being negatively impacted by additional fees assessed to that class.
67
2011 Annual Report
September 30, 2011
Investment Overview (unaudited) (cont'd)
Long Duration Fixed Income Portfolio
Performance Compared to the Barclays Capital U.S. Long Government/Credit Index(1) and Lipper Corporate Debt Funds BBB-Rated Index(2)
| Period Ended September 30, 2011 Total Returns(3) | |||||||||||||||||||
| Average Annual | |||||||||||||||||||
| One Year | Five Years | Ten Years | Since Inception(5) | ||||||||||||||||
| Portfolio — Class I Shares w/o sales charges(4) | 11.40 | % | 9.86 | % | — | 10.47 | % | ||||||||||||
| Barclays Capital U.S. Long Government/Credit Index | 12.74 | 9.39 | — | 10.14 | |||||||||||||||
| Lipper Corporate Debt Funds BBB-Rated Index | 5.36 | 6.18 | — | 6.63 | |||||||||||||||
| Portfolio — Class P Shares w/o sales charges(4) | 11.13 | 9.58 | — | 10.19 | |||||||||||||||
| Barclays Capital U.S. Long Government/Credit Index | 12.74 | 9.39 | — | 10.14 | |||||||||||||||
| Lipper Corporate Debt Funds BBB-Rated Index | 5.36 | 6.18 | — | 6.63 | |||||||||||||||
Performance data quoted represents past performance, which is no guarantee of future results, and current performance may be lower or higher than the figures shown. Performance assumes that all dividends and distributions, if any, were reinvested. For the most recent month-end performance figures, please visit www.morganstanley.com/im. Investment return and principal value will fluctuate so that Portfolio shares, when redeemed, may be worth more or less than their original cost. Total returns do not reflect the deduction of taxes that a shareholder would pay on Portfolio distributions or the redemption of Portfolio shares. Performance of share classes will vary due to differences in expenses.
(1) The Barclays Capital U.S. Long Government/Credit Index tracks the securities in the long maturity range of the Barclays Capital U.S. Government/Credit Index which tracks investment-grade (BBB-/Baa3) or higher publicly traded fixed-rate U.S. government, U.S. agency, and corporate issues. The Index is unmanaged and its returns do not include any sales charges or fees. Such costs would lower performance. It is not possible to invest directly in an index.
(2) The Lipper Corporate Debt Funds BBB-Rated Index is an equally weighted performance index of the largest qualifying funds (based on net assets) in the Lipper Corporate Debt Funds BBB-Rated classification. The Index, which is adjusted for capital gains distributions and income dividends, is unmanaged and should not be considered an investment. There are currently 30 funds represented in this Index. As of the date of this report, the Portfolio was in the Lipper Corporate Debt Funds BBB-Rated classification.
(3) Total returns for the Portfolio reflect expenses waived and/or reimbursed, if applicable, by the Adviser. Without such waivers and/or reimbursements, total returns would have been lower. Fee waivers and/or reimbursements are expected to continue until such time that the Fund's Board of Trustees acts to discontinue such waivers and/or reimbursements.
(4) Commenced operations on July 21, 2006.
(5) For comparative purposes, average annual since inception returns listed for the Indexes refer to the inception date or initial offering of the respective share class of the Portfolio, not the inception of the Indexes.
Portfolio Composition
| Classification | Percentage of Total Investments | ||||||
| U.S. Treasury Securities | 37.2 | % | |||||
| Industrials | 25.9 | ||||||
| Finance | 10.9 | ||||||
| Utilities | 9.7 | ||||||
| Other* | 9.3 | ||||||
| Municipal Bonds | 7.0 | ||||||
| Total Investments | 100.0 | %** | |||||
* Industries and/or investment types representing less than 5% of total investments.
** Does not include open long/short futures contracts with a value of approximately $1,441,000 and net unrealized appreciation of approximately $24,000. Also does not include open foreign currency exchange contracts with net unrealized depreciation of approximately $4,000 and open swap agreements with net unrealized depreciation of approximately $117,000.
68
2011 Annual Report
September 30, 2011
Portfolio of Investments
Long Duration Fixed Income Portfolio
| Face Amount (000) | Value (000) | ||||||||||
| Fixed Income Securities (95.9%) | |||||||||||
| Asset-Backed Securities (0.6%) | |||||||||||
| CVS Pass-Through Trust, | |||||||||||
| 6.04%, 12/10/28 | $ | 97 | $ | 102 | |||||||
| 8.35%, 7/10/31 (a) | 29 | 36 | |||||||||
| 138 | |||||||||||
| Corporate Bonds (46.2%) | |||||||||||
| Finance (10.8%) | |||||||||||
| ACE INA Holdings, Inc. | |||||||||||
| 6.70%, 5/15/36 | 40 | 51 | |||||||||
| Aetna, Inc. | |||||||||||
| 6.63%, 6/15/36 | 40 | 51 | |||||||||
| Aflac, Inc. | |||||||||||
| 6.90%, 12/17/39 | 75 | 77 | |||||||||
| AIG SunAmerica Global Financing X | |||||||||||
| 6.90%, 3/15/32 (a) | 17 | 18 | |||||||||
| Allstate Corp. (The), | |||||||||||
| 5.95%, 4/1/36 | 65 | 73 | |||||||||
| 6.13%, 12/15/32 | 30 | 34 | |||||||||
| American Express Co. | |||||||||||
| 8.13%, 5/20/19 | 45 | 57 | |||||||||
| Bear Stearns Cos. LLC (The) | |||||||||||
| 7.25%, 2/1/18 | 45 | 53 | |||||||||
| Chubb Corp. (The) | |||||||||||
| 6.50%, 5/15/38 | 30 | 37 | |||||||||
| Citigroup, Inc. (See Note G-2), | |||||||||||
| 5.85%, 12/11/34 | 225 | 218 | |||||||||
| 6.88%, 3/5/38 | 30 | 33 | |||||||||
| Credit Suisse USA, Inc. | |||||||||||
| 7.13%, 7/15/32 | 50 | 57 | |||||||||
| Farmers Exchange Capital | |||||||||||
| 7.05%, 7/15/28 (a) | 100 | 107 | |||||||||
| General Electric Capital Corp., | |||||||||||
| 5.88%, 1/14/38 | 130 | 134 | |||||||||
| 6.15%, 8/7/37 | 5 | 5 | |||||||||
| 6.75%, 3/15/32 | 140 | 160 | |||||||||
| Goldman Sachs Group, Inc. (The) | |||||||||||
| 6.75%, 10/1/37 | 290 | 266 | |||||||||
| Hartford Financial Services Group, Inc. | |||||||||||
| 6.63%, 3/30/40 | 75 | 70 | |||||||||
| HSBC Holdings PLC | |||||||||||
| 6.50%, 5/2/36 | 235 | 237 | |||||||||
| JPMorgan Chase & Co. | |||||||||||
| 6.40%, 5/15/38 | 55 | 63 | |||||||||
| JPMorgan Chase Capital XXVII | |||||||||||
| 7.00%, 11/1/39 | 55 | 55 | |||||||||
| Lincoln National Corp. | |||||||||||
| 6.30%, 10/9/37 | 20 | 19 | |||||||||
| Merrill Lynch & Co., Inc. | |||||||||||
| 7.75%, 5/14/38 | 175 | 163 | |||||||||
| MetLife, Inc., | |||||||||||
| 5.70%, 6/15/35 | 95 | 102 | |||||||||
| 10.75%, 8/1/69 | 30 | 38 | |||||||||
| Face Amount (000) | Value (000) | ||||||||||
| Principal Financial Group, Inc. | |||||||||||
| 6.05%, 10/15/36 | $ | 70 | $ | 75 | |||||||
| Protective Life Corp. | |||||||||||
| 8.45%, 10/15/39 | 50 | 58 | |||||||||
| Prudential Financial, Inc. | |||||||||||
| 6.63%, 12/1/37 | 55 | 60 | |||||||||
| UnitedHealth Group, Inc., | |||||||||||
| 5.80%, 3/15/36 | 80 | 93 | |||||||||
| 6.88%, 2/15/38 | 50 | 66 | |||||||||
| WellPoint, Inc., | |||||||||||
| 5.95%, 12/15/34 | 15 | 18 | |||||||||
| 6.38%, 6/15/37 | 65 | 79 | |||||||||
| 2,627 | |||||||||||
| Industrials (25.8%) | |||||||||||
| Agrium, Inc. | |||||||||||
| 7.13%, 5/23/36 | 55 | 73 | |||||||||
| Alcoa, Inc. | |||||||||||
| 5.95%, 2/1/37 | 20 | 19 | |||||||||
| Altria Group, Inc., | |||||||||||
| 9.95%, 11/10/38 | 45 | 64 | |||||||||
| 10.20%, 2/6/39 | 80 | 116 | |||||||||
| Anadarko Petroleum Corp. | |||||||||||
| 6.20%, 3/15/40 | 100 | 104 | |||||||||
| ArcelorMittal | |||||||||||
| 7.00%, 10/15/39 | 30 | 27 | |||||||||
| AT&T, Inc., | |||||||||||
| 5.35%, 9/1/40 | 265 | 278 | |||||||||
| 5.55%, 8/15/41 | 60 | 65 | |||||||||
| 6.30%, 1/15/38 | 30 | 34 | |||||||||
| BSKYB Finance UK PLC | |||||||||||
| 6.50%, 10/15/35 (a) | 50 | 58 | |||||||||
| Bunge Ltd. Finance Corp. | |||||||||||
| 8.50%, 6/15/19 | 40 | 50 | |||||||||
| Burlington Northern Santa Fe LLC | |||||||||||
| 6.15%, 5/1/37 | 55 | 68 | |||||||||
| CBS Corp. | |||||||||||
| 7.88%, 7/30/30 | 35 | 44 | |||||||||
| CenturyLink, Inc., Series P | |||||||||||
| 7.60%, 9/15/39 | 120 | 108 | |||||||||
| Comcast Corp. | |||||||||||
| 6.95%, 8/15/37 | 100 | 120 | |||||||||
| ConAgra Foods, Inc. | |||||||||||
| 8.25%, 9/15/30 | 80 | 103 | |||||||||
| Corning, Inc. | |||||||||||
| 7.25%, 8/15/36 | 85 | 105 | |||||||||
| COX Communications, Inc. | |||||||||||
| 8.38%, 3/1/39 (a) | 20 | 28 | |||||||||
| CSX Corp. | |||||||||||
| 6.15%, 5/1/37 | 60 | 74 | |||||||||
| Daimler Finance North America LLC | |||||||||||
| 8.50%, 1/18/31 | 65 | 92 | |||||||||
The accompanying notes are an integral part of the financial statements.
69
2011 Annual Report
September 30, 2011
Portfolio of Investments (cont'd)
Long Duration Fixed Income Portfolio
| Face Amount (000) | Value (000) | ||||||||||
| Industrials (cont'd) | |||||||||||
| Darden Restaurants, Inc. | |||||||||||
| 6.80%, 10/15/37 | $ | 50 | $ | 61 | |||||||
| Delhaize Group SA | |||||||||||
| 5.70%, 10/1/40 | 85 | 88 | |||||||||
| Deutsche Telekom International Finance BV | |||||||||||
| 8.75%, 6/15/30 | 85 | 114 | |||||||||
| DirecTV Holdings LLC/DirecTV Financing Co., Inc. | |||||||||||
| 6.35%, 3/15/40 | 40 | 45 | |||||||||
| Dr. Pepper Snapple Group, Inc. | |||||||||||
| 7.45%, 5/1/38 | 75 | 104 | |||||||||
| Grupo Televisa SA | |||||||||||
| 6.63%, 1/15/40 | 75 | 80 | |||||||||
| Harley-Davidson Funding Corp. | |||||||||||
| 6.80%, 6/15/18 (a) | 40 | 47 | |||||||||
| Hess Corp. | |||||||||||
| 7.13%, 3/15/33 | 55 | 70 | |||||||||
| Holcim Capital Corp. Ltd. | |||||||||||
| 6.88%, 9/29/39 (a) | 100 | 109 | |||||||||
| Home Depot, Inc. | |||||||||||
| 5.88%, 12/16/36 | 140 | 164 | |||||||||
| Illinois Tool Works, Inc. | |||||||||||
| 4.88%, 9/15/41 (a) | 50 | 56 | |||||||||
| International Paper Co. | |||||||||||
| 7.30%, 11/15/39 | 95 | 107 | |||||||||
| JC Penney Corp., Inc. | |||||||||||
| 7.40%, 4/1/37 | 50 | 46 | |||||||||
| KLA-Tencor Corp. | |||||||||||
| 6.90%, 5/1/18 | 45 | 51 | |||||||||
| Kohl's Corp. | |||||||||||
| 6.88%, 12/15/37 | 55 | 70 | |||||||||
| Koninklijke KPN N.V. | |||||||||||
| 8.38%, 10/1/30 | 25 | 32 | |||||||||
| Koninklijke Philips Electronics N.V. | |||||||||||
| 6.88%, 3/11/38 | 70 | 91 | |||||||||
| Kraft Foods, Inc. | |||||||||||
| 6.88%, 1/26/39 | 90 | 114 | |||||||||
| Kroger Co. (The) | |||||||||||
| 6.90%, 4/15/38 | 80 | 104 | |||||||||
| Lorillard Tobacco Co. | |||||||||||
| 8.13%, 5/1/40 | 45 | 54 | |||||||||
| Lowe's Cos., Inc. | |||||||||||
| 6.65%, 9/15/37 | 45 | 58 | |||||||||
| Meccanica Holdings USA, Inc. | |||||||||||
| 6.25%, 1/15/40 (a) | 100 | 86 | |||||||||
| NBC Universal Media LLC | |||||||||||
| 6.40%, 4/30/40 | 45 | 53 | |||||||||
| News America, Inc. | |||||||||||
| 6.40%, 12/15/35 | 105 | 114 | |||||||||
| Petro-Canada, | |||||||||||
| 5.95%, 5/15/35 | 55 | 60 | |||||||||
| 6.80%, 5/15/38 | 100 | 121 | |||||||||
| Petrobras International Finance Co. | |||||||||||
| 6.88%, 1/20/40 | 95 | 101 | |||||||||
| Face Amount (000) | Value (000) | ||||||||||
| Potash Corp. of Saskatchewan, Inc. | |||||||||||
| 5.88%, 12/1/36 | $ | 85 | $ | 102 | |||||||
| Quest Diagnostics, Inc., | |||||||||||
| 5.75%, 1/30/40 | 30 | 33 | |||||||||
| 6.95%, 7/1/37 | 80 | 101 | |||||||||
| Qwest Corp. | |||||||||||
| 6.88%, 9/15/33 | 40 | 38 | |||||||||
| Ralcorp Holdings, Inc. | |||||||||||
| 6.63%, 8/15/39 | 90 | 91 | |||||||||
| Rio Tinto Alcan, Inc. | |||||||||||
| 6.13%, 12/15/33 | 25 | 29 | |||||||||
| Rio Tinto Finance USA Ltd. | |||||||||||
| 7.13%, 7/15/28 | 40 | 53 | |||||||||
| Southern Copper Corp. | |||||||||||
| 6.75%, 4/16/40 | 100 | 99 | |||||||||
| Talisman Energy, Inc. | |||||||||||
| 6.25%, 2/1/38 | 45 | 51 | |||||||||
| Target Corp. | |||||||||||
| 7.00%, 1/15/38 | 100 | 137 | |||||||||
| Telecom Italia Capital SA | |||||||||||
| 7.20%, 7/18/36 | 105 | 96 | |||||||||
| Telefonica Europe BV | |||||||||||
| 8.25%, 9/15/30 | 115 | 129 | |||||||||
| Teva Pharmaceutical Finance Co. LLC | |||||||||||
| 6.15%, 2/1/36 | 25 | 31 | |||||||||
| Time Warner Cable, Inc. | |||||||||||
| 6.55%, 5/1/37 | 85 | 95 | |||||||||
| Time Warner, Inc. | |||||||||||
| 7.70%, 5/1/32 | 195 | 248 | |||||||||
| Transocean, Inc. | |||||||||||
| 6.80%, 3/15/38 | 80 | 83 | |||||||||
| Union Pacific Corp. | |||||||||||
| 6.25%, 5/1/34 | 115 | 145 | |||||||||
| Vale Overseas Ltd. | |||||||||||
| 6.88%, 11/21/36 | 50 | 54 | |||||||||
| Valero Energy Corp., | |||||||||||
| 6.63%, 6/15/37 | 65 | 70 | |||||||||
| 9.38%, 3/15/19 | 40 | 51 | |||||||||
| Verizon Communications, Inc., | |||||||||||
| 5.85%, 9/15/35 | 120 | 141 | |||||||||
| 8.95%, 3/1/39 | 115 | 178 | |||||||||
| Vivendi SA | |||||||||||
| 6.63%, 4/4/18 (a) | 40 | 45 | |||||||||
| Vodafone Group PLC | |||||||||||
| 6.15%, 2/27/37 | 45 | 56 | |||||||||
| Wal-Mart Stores, Inc. | |||||||||||
| 6.50%, 8/15/37 | 35 | 47 | |||||||||
| Waste Management, Inc. | |||||||||||
| 6.13%, 11/30/39 | 95 | 116 | |||||||||
| Williams Cos., Inc. (The) | |||||||||||
| 7.75%, 6/15/31 | 63 | 76 | |||||||||
| Xerox Corp. | |||||||||||
| 5.63%, 12/15/19 | 20 | 22 | |||||||||
| 6,247 | |||||||||||
The accompanying notes are an integral part of the financial statements.
70
2011 Annual Report
September 30, 2011
Portfolio of Investments (cont'd)
Long Duration Fixed Income Portfolio
| Face Amount (000) | Value (000) | ||||||||||
| Utilities (9.6%) | |||||||||||
| Columbus Southern Power Co. | |||||||||||
| 6.60%, 3/1/33 | $ | 30 | $ | 39 | |||||||
| Constellation Energy Group, Inc. | |||||||||||
| 7.60%, 4/1/32 | 75 | 91 | |||||||||
| Detroit Edison Co. (The) | |||||||||||
| 6.35%, 10/15/32 | 60 | 77 | |||||||||
| E.ON International Finance BV | |||||||||||
| 6.65%, 4/30/38 (a) | 25 | 31 | |||||||||
| EDF SA | |||||||||||
| 5.60%, 1/27/40 (a) | 30 | 32 | |||||||||
| Enbridge Energy Partners LP | |||||||||||
| 7.50%, 4/15/38 | 50 | 63 | |||||||||
| Enel Finance International N.V. | |||||||||||
| 6.00%, 10/7/39 (a) | 100 | 85 | |||||||||
| Energy Transfer Partners LP, | |||||||||||
| 7.50%, 7/1/38 | 60 | 65 | |||||||||
| 9.00%, 4/15/19 | 40 | 48 | |||||||||
| Entergy Louisiana LLC | |||||||||||
| 5.40%, 11/1/24 | 50 | 57 | |||||||||
| Enterprise Products Operating LLC | |||||||||||
| 6.65%, 10/15/34 | 30 | 35 | |||||||||
| Exelon Generation Co. LLC | |||||||||||
| 6.25%, 10/1/39 | 175 | 204 | |||||||||
| FirstEnergy Solutions Corp. | |||||||||||
| 6.80%, 8/15/39 | 180 | 197 | |||||||||
| Kinder Morgan Energy Partners LP, | |||||||||||
| 6.50%, 2/1/37 | 65 | 70 | |||||||||
| 6.95%, 1/15/38 | 85 | 95 | |||||||||
| 7.30%, 8/15/33 | 5 | 6 | |||||||||
| Nevada Power Co. | |||||||||||
| 6.65%, 4/1/36 | 125 | 166 | |||||||||
| Nisource Finance Corp. | |||||||||||
| 6.13%, 3/1/22 | 85 | 97 | |||||||||
| Ohio Edison Co. | |||||||||||
| 6.88%, 7/15/36 | 65 | 81 | |||||||||
| Ohio Power Co. | |||||||||||
| 6.60%, 2/15/33 | 110 | 141 | |||||||||
| Oncor Electric Delivery Co. LLC | |||||||||||
| 7.50%, 9/1/38 | 25 | 36 | |||||||||
| Oneok Partners LP | |||||||||||
| 6.85%, 10/15/37 | 75 | 90 | |||||||||
| Plains All American Pipeline LP/PAA Finance Corp., | |||||||||||
| 6.65%, 1/15/37 | 40 | 44 | |||||||||
| 6.70%, 5/15/36 | 75 | 86 | |||||||||
| PPL Electric Utilities Corp. | |||||||||||
| 6.45%, 8/15/37 | 30 | 41 | |||||||||
| Sempra Energy | |||||||||||
| 6.00%, 10/15/39 | 125 | 152 | |||||||||
| Spectra Energy Capital LLC | |||||||||||
| 7.50%, 9/15/38 | 45 | 59 | |||||||||
| Tennessee Gas Pipeline Co. | |||||||||||
| 7.00%, 10/15/28 | 125 | 147 | |||||||||
| 2,335 | |||||||||||
| 11,209 | |||||||||||
| Face Amount (000) | Value (000) | ||||||||||
| Municipal Bonds (6.9%) | |||||||||||
| American Municipal Power, Inc. | |||||||||||
| 6.05%, 2/15/43 | $ | 55 | $ | 64 | |||||||
| Bay Area Toll Authority | |||||||||||
| 6.26%, 4/1/49 | 90 | 117 | |||||||||
| Chicago Board of Education | |||||||||||
| 6.14%, 12/1/39 | 50 | 56 | |||||||||
| Chicago Transit Authority | |||||||||||
| 6.20%, 12/1/40 | 85 | 99 | |||||||||
| City of New York, NY, Series G-1 | |||||||||||
| 5.97%, 3/1/36 | 40 | 49 | |||||||||
| County of Clark N.V. | |||||||||||
| 6.82%, 7/1/45 | 105 | 133 | |||||||||
| County of Cook | |||||||||||
| 6.23%, 11/15/34 | 45 | 53 | |||||||||
| District of Columbia | |||||||||||
| 5.59%, 12/1/34 | 65 | 79 | |||||||||
| Illinois State Toll Highway Authority, Highway Revenue, Build America Bonds | |||||||||||
| 6.18%, 1/1/34 | 70 | 82 | |||||||||
| Indianapolis Local Public Improvement Bond Bank | |||||||||||
| 6.12%, 1/15/40 | 35 | 45 | |||||||||
| Los Angeles Unified School District | |||||||||||
| 6.76%, 7/1/34 | 45 | 57 | |||||||||
| Metropolitan Transportation Authority | |||||||||||
| 6.67%, 11/15/39 | 70 | 88 | |||||||||
| Municipal Electric Authority of Georgia, | |||||||||||
| 6.64%, 4/1/57 | 65 | 71 | |||||||||
| 6.66%, 4/1/57 | 25 | 27 | |||||||||
| New Jersey Transportation Trust Fund Authority | |||||||||||
| 6.56%, 12/15/40 | 35 | 44 | |||||||||
| New York City Municipal Water Finance Authority | |||||||||||
| 5.72%, 6/15/42 | 30 | 37 | |||||||||
| New York City Transitional Finance Authority | |||||||||||
| 5.27%, 5/1/27 | 40 | 45 | |||||||||
| North Texas Tollway Authority | |||||||||||
| 6.72%, 1/1/49 | 90 | 115 | |||||||||
| San Diego County Water Authority | |||||||||||
| 6.14%, 5/1/49 | 25 | 32 | |||||||||
| San Francisco City & County Public Utilities Commission | |||||||||||
| 6.00%, 11/1/40 | 55 | 65 | |||||||||
| State of California, General Obligation Bonds | |||||||||||
| 7.55%, 4/1/39 | 160 | 199 | |||||||||
| State of Illinois | |||||||||||
| 6.63%, 2/1/35 | 50 | 53 | |||||||||
| State of Washington | |||||||||||
| 5.09%, 8/1/33 | 65 | 73 | |||||||||
| 1,683 | |||||||||||
The accompanying notes are an integral part of the financial statements.
71
2011 Annual Report
September 30, 2011
Portfolio of Investments (cont'd)
Long Duration Fixed Income Portfolio
| Face Amount (000) | Value (000) | ||||||||||
| Sovereign (2.7%) | |||||||||||
| Brazilian Government International Bond | |||||||||||
| 8.25%, 1/20/34 | $ | 210 | $ | 296 | |||||||
| Mexico Government International Bond | |||||||||||
| 6.05%, 1/11/40 | 165 | 187 | |||||||||
| Panama Government International Bond | |||||||||||
| 9.38%, 4/1/29 | 43 | 65 | |||||||||
| Peruvian Government International Bond | |||||||||||
| 8.75%, 11/21/33 | 35 | 50 | |||||||||
| Republic of Italy | |||||||||||
| 5.38%, 6/15/33 | 55 | 51 | |||||||||
| 649 | |||||||||||
| U.S. Agency Security (2.6%) | |||||||||||
| Federal Home Loan Mortgage Corporation | |||||||||||
| 6.75%, 3/15/31 | 417 | 633 | |||||||||
| U.S. Treasury Securities (36.9%) | |||||||||||
| U.S. Treasury Bonds, | |||||||||||
| 3.50%, 2/15/39 | 2,060 | 2,291 | |||||||||
| 3.88%, 8/15/40 | 1,620 | 1,925 | |||||||||
| 4.25%, 11/15/40 | 1,500 | 1,897 | |||||||||
| 4.75%, 2/15/41 | 240 | 328 | |||||||||
| 5.50%, 8/15/28 | 1,305 | 1,823 | |||||||||
| 6.75%, 8/15/26 | 450 | 690 | |||||||||
| 8,954 | |||||||||||
| Total Fixed Income Securities (Cost $19,698) | 23,266 | ||||||||||
| Shares | Value (000) | ||||||||||
| Short-Term Investments (3.4%) | |||||||||||
| Investment Company (2.6%) | |||||||||||
| Morgan Stanley Institutional Liquidity Funds — Money Market Portfolio — Institutional Class (See Note G-2) | 635,581 | $ | 636 | ||||||||
| Face Amount (000) | |||||||||||
| U.S. Treasury Security (0.8%) | |||||||||||
| U.S. Treasury Bill | |||||||||||
| 0.02%, 3/22/12 (b)(c) | $ | 180 | 180 | ||||||||
| Total Short-Term Investments (Cost $816) | 816 | ||||||||||
| Total Investments (99.3%) (Cost $20,514) (d) | 24,082 | ||||||||||
| Other Assets in Excess of Liabilities (0.7%) | 172 | ||||||||||
| Net Assets (100.0%) | $ | 24,254 | |||||||||
(a) 144A security — Certain conditions for public sale may exist. Unless otherwise noted, these securities are deemed to be liquid.
(b) Rate shown is the yield to maturity at September 30, 2011.
(c) All or a portion of the security was pledged as collateral for swap agreements.
(d) Securities are available for collateral in connection with open foreign currency exchange contracts, futures contracts and swap agreements.
Foreign Currency Exchange Contracts Information:
The Portfolio had the following foreign currency exchange contracts open at period end:
| Counterparty | Currency to Deliver (000) | Value (000) | Settlement Date | In Exchange For (000) | Value (000) | Unrealized Appreciation (Depreciation) (000) | |||||||||||||||||||||
| JP Morgan Chase | CLP | 39,000 | $ | 75 | 10/14/11 | USD | 81 | $ | 81 | $ | 6 | ||||||||||||||||
| UBS AG | SGD | 102 | 78 | 10/14/11 | USD | 82 | 82 | 4 | |||||||||||||||||||
| UBS AG | USD | 83 | 83 | 10/14/11 | CLP | 39,000 | 75 | (8 | ) | ||||||||||||||||||
| UBS AG | USD | 84 | 84 | 10/14/11 | SGD | 102 | 78 | (6 | ) | ||||||||||||||||||
| $ | 320 | $ | 316 | $ | (4 | ) | |||||||||||||||||||||
Futures Contracts:
The Portfolio had the following futures contracts open at period end:
| Number of Contracts | Value (000) | Expiration Date | Unrealized Appreciation (Depreciation) (000) | ||||||||||||||||
| Long: | |||||||||||||||||||
| U.S. Treasury 10 yr. Note | 5 | $ | 650 | Dec-11 | $ | (2 | ) | ||||||||||||
| U.S. Treasury 30 yr. Bond | 4 | 571 | Dec-11 | 26 | |||||||||||||||
| Short: | |||||||||||||||||||
| U.S. Treasury 2 yr. Note | 1 | (220 | ) | Dec-11 | — | @ | |||||||||||||
| $ | 24 | ||||||||||||||||||
The accompanying notes are an integral part of the financial statements.
72
2011 Annual Report
September 30, 2011
Portfolio of Investments (cont'd)
Long Duration Fixed Income Portfolio
Interest Rate Swap Agreements
The Portfolio had the following interest rate swap agreements open at period end:
| Swap Counterparty | Floating Rate Index | Pay/Receive Floating Rate | Fixed Rate | Termination Date | Notional Amount (000) | Unrealized Appreciation (Depreciation) (000) | |||||||||||||||||||||
| Bank of America | 6 Month EURIBOR | Pay | 4.26 | % | 8/18/26 | EUR | 1,090 | $ | 40 | ||||||||||||||||||
| Bank of America | 3 Month LIBOR | Receive | 4.35 | 8/18/26 | $ | 1,460 | (52 | ) | |||||||||||||||||||
| Bank of America | 6 Month EURIBOR | Receive | 3.61 | 8/18/31 | EUR | 1,375 | (34 | ) | |||||||||||||||||||
| Bank of America | 3 Month LIBOR | Pay | 4.15 | 8/18/31 | $ | 1,810 | 56 | ||||||||||||||||||||
| Barclays Capital | 3 Month STIBOR | Pay | 2.76 | 7/30/12 | SEK | 30,824 | 23 | ||||||||||||||||||||
| Barclays Capital | 3 Month STIBOR | Pay | 2.30 | 9/12/12 | 16,440 | 2 | |||||||||||||||||||||
| Barclays Capital | 3 Month STIBOR | Receive | 2.89 | 7/29/13 | 36,086 | (51 | ) | ||||||||||||||||||||
| Credit Suisse | 3 Month CDOR | Pay | 4.07 | 9/8/20 | CAD | 1,115 | 42 | ||||||||||||||||||||
| Goldman Sachs | 3 Month CDOR | Receive | 2.70 | 7/15/15 | 2,740 | (57 | ) | ||||||||||||||||||||
| $ | (31 | ) | |||||||||||||||||||||||||
Zero Coupon Swap Agreements
The Portfolio had the following zero coupon swap agreements open at period end:
| Swap Counterparty | Notional Amount (000) | Floating Rate Index | Pay/Receive Floating Rate | Termination Date | Premium Paid (Received) (000) | Unrealized Appreciation (Depreciation) (000) | |||||||||||||||||||||
| Barclays Capital | $ | 609 | 3 Month LIBOR | Receive | 11/15/19 | $ | (44 | ) | $ | (184 | ) | ||||||||||||||||
| Barclays Capital | 722 | 3 Month LIBOR | Pay | 11/15/19 | 25 | 98 | |||||||||||||||||||||
| $ | (86 | ) | |||||||||||||||||||||||||
@ Value is less than $500.
CDOR Canadian Dealer Offered Rate.
EURIBOR Euro Interbank Offered Rate.
LIBOR London Interbank Offered Rate.
STIBOR Stockholm Interbank Offered Rate.
CAD Canadian Dollar
CLP Chilean Peso
EUR Euro
SEK Swedish Krona
SGD Singapore Dollar
USD United States Dollar
The accompanying notes are an integral part of the financial statements.
73
2011 Annual Report
September 30, 2011
Portfolio of Investments (cont'd)
Long Duration Fixed Income Portfolio
Fair Value Measurement Information:
The following is a summary of the inputs used to value the Portfolio's net assets as of September 30, 2011. (See Note A-6 to the financial statements for further information regarding fair value measurement.)
| Investment Type | Level 1 Unadjusted quoted prices (000) | Level 2 Other significant observable inputs (000) | Level 3 Significant unobservable inputs (000) | Total (000) | |||||||||||||||
| Assets: | |||||||||||||||||||
| Fixed Income Securities | |||||||||||||||||||
| Asset-Backed Securities | $ | — | $ | 138 | $ | — | $ | 138 | |||||||||||
| Corporate Bonds | — | 11,209 | — | 11,209 | |||||||||||||||
| Municipal Bonds | — | 1,683 | — | 1,683 | |||||||||||||||
| Sovereign | — | 649 | — | 649 | |||||||||||||||
| U.S. Agency Security | — | 633 | — | 633 | |||||||||||||||
| U.S. Treasury Securities | — | 8,954 | — | 8,954 | |||||||||||||||
| Total Fixed Income Securities | — | 23,266 | — | 23,266 | |||||||||||||||
| Short-Term Investments | |||||||||||||||||||
| Investment Company | 636 | — | — | 636 | |||||||||||||||
| U.S. Treasury Security | — | 180 | — | 180 | |||||||||||||||
| Total Short-Term Investments | 636 | 180 | — | 816 | |||||||||||||||
| Foreign Currency Exchange Contracts | — | 10 | — | 10 | |||||||||||||||
| Futures Contracts | 26 | — | — | 26 | |||||||||||||||
| Interest Rate Swap Agreements | — | 163 | — | 163 | |||||||||||||||
| Zero Coupon Swap Agreements | — | 98 | — | 98 | |||||||||||||||
| Total Assets | 662 | 23,717 | — | 24,379 | |||||||||||||||
Fair Value Measurement Information: (cont'd)
| Investment Type | Level 1 Unadjusted quoted prices (000) | Level 2 Other significant observable inputs (000) | Level 3 Significant unobservable inputs (000) | Total (000) | |||||||||||||||
| Liabilities: | |||||||||||||||||||
| Foreign Currency Exchange Contracts | $ | — | $ | (14 | ) | $ | — | $ | (14 | ) | |||||||||
| Futures Contracts | (2 | ) | — | — | (2 | ) | |||||||||||||
| Interest Rate Swap Agreements | — | (194 | ) | — | (194 | ) | |||||||||||||
| Zero Coupon Swap Agreements | — | (184 | ) | — | (184 | ) | |||||||||||||
| Total Liabilities | (2 | ) | (392 | ) | — | (394 | ) | ||||||||||||
| Total | $ | 660 | $ | 23,325 | $ | — | $ | 23,985 | |||||||||||
Transfers between investment levels may occur as the markets fluctuate and/or the availability of data used in an investment's valuation changes. The Portfolio recognizes transfers between the levels as of the end of the period. As of September 30, 2011, the Portfolio did not have any significant investments transfer between investment levels.
The accompanying notes are an integral part of the financial statements.
74
2011 Annual Report
September 30, 2011
Statements of Assets and Liabilities
| Balanced Portfolio (000) | Mid Cap Growth Portfolio (000) | Core Fixed Income Portfolio (000) | Core Plus Fixed Income Portfolio (000) | ||||||||||||||||
| Assets: | |||||||||||||||||||
| Investments in Securities of Unaffiliated Issuers, at Cost | $ | 42,263 | $ | 6,091,402 | $ | 60,526 | $ | 282,077 | |||||||||||
| Investments in Securities of Affiliated Issuers, at Cost | 4,619 | 280,754 | 3,503 | 20,785 | |||||||||||||||
| Total Investments in Securities, at Cost | 46,882 | 6,372,156 | 64,029 | 302,862 | |||||||||||||||
| Foreign Currency, at Cost | 25 | — | — | 1 | |||||||||||||||
| Investments in Securities of Unaffiliated Issuers, at Value(1) | 39,849 | 6,129,335 | 62,467 | 279,516 | |||||||||||||||
| Investments in Securities of Affiliated Issuers, at Value | 4,500 | 280,754 | 3,536 | 20,764 | |||||||||||||||
| Total Investments in Securities, at Value(1) | 44,349 | 6,410,089 | 66,003 | 300,280 | |||||||||||||||
| Foreign Currency, at Value | 19 | — | — | 1 | |||||||||||||||
| Receivable for Investments Sold | 202 | 23,662 | 3,146 | 7,645 | |||||||||||||||
| Receivable for Portfolio Shares Sold | 2 | 18,291 | 26 | 3,452 | |||||||||||||||
| Dividends Receivable | 28 | 3,963 | — | — | |||||||||||||||
| Interest Receivable | 144 | — | 494 | 2,653 | |||||||||||||||
| Unrealized Appreciation on Swap Agreements | 143 | — | 233 | 2,313 | |||||||||||||||
| Unrealized Appreciation on Foreign Currency Exchange Contracts | 203 | — | — | 668 | |||||||||||||||
| Tax Reclaim Receivable | 2 | 694 | 2 | 11 | |||||||||||||||
| Receivable for Variation Margin | 214 | — | — | 229 | |||||||||||||||
| Receivable from Affiliates | 3 | 21 | 10 | 53 | |||||||||||||||
| Premium Paid on Open Swap Agreements | — | — | 59 | — | |||||||||||||||
| Due from Adviser | — | — | 6 | — | |||||||||||||||
| Other Assets | 7 | 169 | 7 | 12 | |||||||||||||||
| Total Assets | 45,316 | 6,456,889 | 69,986 | 317,317 | |||||||||||||||
| Liabilities: | |||||||||||||||||||
| Collateral on Securities Loaned, at Value | 1,886 | — | 516 | 3,793 | |||||||||||||||
| Payable for Investments Purchased | 990 | 47,306 | 4,746 | 8,654 | |||||||||||||||
| Payable for Investment Advisory Fees | 50 | 9,129 | — | 278 | |||||||||||||||
| Payable for Portfolio Shares Redeemed | 13 | 3,467 | 130 | 203 | |||||||||||||||
| Unrealized Depreciation on Swap Agreements | 168 | — | 439 | 2,782 | |||||||||||||||
| Payable for Sub Transfer Agency Fees | 11 | 2,906 | 72 | 90 | |||||||||||||||
| Unrealized Depreciation on Foreign Currency Exchange Contracts | 75 | — | — | 656 | |||||||||||||||
| Due to Broker | — | — | — | 720 | |||||||||||||||
| Payable for Shareholder Servicing Fees — Class P | 4 | 589 | — | @ | 1 | ||||||||||||||
| Payable for Administration Fees | 3 | 459 | 4 | 20 | |||||||||||||||
| Payable for Trustees' Fees and Expenses | 9 | 102 | 6 | 104 | |||||||||||||||
| Payable for Professional Fees | 31 | 78 | 30 | 54 | |||||||||||||||
| Premium Received on Open Swap Agreements | — | — | 105 | — | |||||||||||||||
| Payable for Custodian Fees | 22 | 24 | 6 | 26 | |||||||||||||||
| Payable for Transfer Agent Fees | 1 | 9 | 1 | 2 | |||||||||||||||
| Payable for Variation Margin | — | — | 11 | — | |||||||||||||||
| Other Liabilities | 4 | 284 | 10 | 54 | |||||||||||||||
| Total Liabilities | 3,267 | 64,353 | 6,076 | 17,437 | |||||||||||||||
| Net Assets | $ | 42,049 | $ | 6,392,536 | $ | 63,910 | $ | 299,880 | |||||||||||
| Net Assets Consist Of: | |||||||||||||||||||
| Paid-in-Capital | $ | 50,573 | $ | 6,040,800 | $ | 100,688 | $ | 781,269 | |||||||||||
| Undistributed (Distributions in Excess of) Net Investment Income | 328 | (908 | ) | 976 | 6,415 | ||||||||||||||
| Accumulated Net Realized Gain (Loss) | (6,344 | ) | 314,715 | (39,451 | ) | (484,700 | ) | ||||||||||||
| Unrealized Appreciation (Depreciation) on: | |||||||||||||||||||
| Investments | (2,414 | ) | 37,933 | 1,941 | (2,561 | ) | |||||||||||||
| Investments in Affiliates | (119 | ) | — | 33 | (21 | ) | |||||||||||||
| Futures Contracts | (72 | ) | — | (71 | ) | (66 | ) | ||||||||||||
| Swap Agreements | (25 | ) | — | (206 | ) | (469 | ) | ||||||||||||
| Foreign Currency Exchange Contracts | 128 | — | — | 12 | |||||||||||||||
| Foreign Currency Translations | (6 | ) | (4 | ) | — | 1 | |||||||||||||
| Net Assets | $ | 42,049 | $ | 6,392,536 | $ | 63,910 | $ | 299,880 | |||||||||||
The accompanying notes are an integral part of the financial statements.
75
2011 Annual Report
September 30, 2011
Statements of Assets and Liabilities (cont'd)
| Balanced Portfolio (000) | Mid Cap Growth Portfolio (000) | Core Fixed Income Portfolio (000) | Core Plus Fixed Income Portfolio (000) | ||||||||||||||||
| CLASS I: | |||||||||||||||||||
| Net Assets | $ | 25,192 | $ | 3,797,139 | $ | 63,866 | $ | 295,226 | |||||||||||
| Shares Outstanding (unlimited number of shares authorized, no par value) (not in 000s) | 2,015,139 | 112,832,923 | 6,333,879 | 29,748,572 | |||||||||||||||
| Net Asset Value, Offering and Redemption Price Per Share | $ | 12.50 | $ | 33.65 | $ | 10.08 | $ | 9.92 | |||||||||||
| CLASS P: | |||||||||||||||||||
| Net Assets | $ | 16,857 | $ | 2,595,397 | $ | 44 | $ | 4,654 | |||||||||||
| Shares Outstanding (unlimited number of shares authorized, no par value) (not in 000s) | 1,352,060 | 79,726,365 | 4,333 | 468,466 | |||||||||||||||
| Net Asset Value, Offering and Redemption Price Per Share | $ | 12.47 | $ | 32.55 | $ | 10.14 | $ | 9.94 | |||||||||||
| (1) Including: Securities on Loan, at Value: | $ | 2,122 | $ | — | $ | 509 | $ | 3,721 | |||||||||||
@ Amount is less than $500.
The accompanying notes are an integral part of the financial statements.
76
2011 Annual Report
September 30, 2011
Statements of Assets and Liabilities
| Investment Grade Fixed Income Portfolio (000) | Limited Duration Portfolio (000) | Long Duration Fixed Income Portfolio (000) | |||||||||||||
| Assets: | |||||||||||||||
| Investments in Securities of Unaffiliated Issuers, at Cost | $ | 61,144 | $ | 157,368 | $ | 19,626 | |||||||||
| Investments in Securities of Affiliated Issuers, at Cost | 5,013 | 9,223 | 888 | ||||||||||||
| Total Investments in Securities, at Cost | 66,157 | 166,591 | 20,514 | ||||||||||||
| Foreign Currency, at Cost | — | — | — | @ | |||||||||||
| Investments in Securities of Unaffiliated Issuers, at Value(1) | 63,705 | 158,902 | 23,195 | ||||||||||||
| Investments in Securities of Affiliated Issuers, at Value | 5,188 | 9,259 | 887 | ||||||||||||
| Total Investments in Securities, at Value(1) | 68,893 | 168,161 | 24,082 | ||||||||||||
| Foreign Currency, at Value | — | — | — | @ | |||||||||||
| Cash | — | 16 | — | ||||||||||||
| Receivable for Investments Sold | 2,052 | — | — | ||||||||||||
| Interest Receivable | 577 | 1,162 | 276 | ||||||||||||
| Unrealized Appreciation on Swap Agreements | — | 743 | 261 | ||||||||||||
| Premium Paid on Open Swap Agreements | — | 170 | 25 | ||||||||||||
| Receivable from Affiliates | 14 | 31 | 4 | ||||||||||||
| Receivable for Variation Margin | — | 3 | 38 | ||||||||||||
| Due from Adviser | — | — | 23 | ||||||||||||
| Receivable for Portfolio Shares Sold | — | 13 | — | ||||||||||||
| Unrealized Appreciation on Foreign Currency Exchange Contracts | — | — | 10 | ||||||||||||
| Tax Reclaim Receivable | 1 | 3 | — | @ | |||||||||||
| Other Assets | 3 | 11 | 11 | ||||||||||||
| Total Assets | 71,540 | 170,313 | 24,730 | ||||||||||||
| Liabilities: | |||||||||||||||
| Collateral on Securities Loaned, at Value | 980 | — | — | ||||||||||||
| Payable for Investments Purchased | 2,963 | — | — | ||||||||||||
| Unrealized Depreciation on Swap Agreements | — | 1,271 | 378 | ||||||||||||
| Payable for Portfolio Shares Redeemed | 49 | 397 | — | ||||||||||||
| Premium Received on Open Swap Agreements | — | 280 | 44 | ||||||||||||
| Payable for Investment Advisory Fees | 68 | 131 | — | ||||||||||||
| Payable for Sub Transfer Agency Fees | 31 | 146 | — | ||||||||||||
| Payable for Professional Fees | 29 | 23 | 29 | ||||||||||||
| Payable for Trustees' Fees and Expenses | 16 | 8 | — | @ | |||||||||||
| Payable for Administration Fees | 5 | 11 | 2 | ||||||||||||
| Unrealized Depreciation on Foreign Currency Exchange Contracts | — | — | 14 | ||||||||||||
| Payable for Custodian Fees | 6 | 5 | 2 | ||||||||||||
| Payable for Variation Margin | 5 | — | — | ||||||||||||
| Payable for Transfer Agent Fees | 1 | 1 | — | @ | |||||||||||
| Payable for Shareholder Servicing Fees — Class P | — | @ | — | @ | — | @ | |||||||||
| Payable for Shareholder Servicing Fees — Class H | — | @ | — | — | |||||||||||
| Payable for Distribution and Shareholder Servicing Fees — Class L | 2 | — | — | ||||||||||||
| Other Liabilities | 14 | 35 | 7 | ||||||||||||
| Total Liabilities | 4,169 | 2,308 | 476 | ||||||||||||
| Net Assets | $ | 67,371 | $ | 168,005 | $ | 24,254 | |||||||||
| Net Assets Consist Of: | |||||||||||||||
| Paid-in-Capital | $ | 126,499 | $ | 424,823 | $ | 20,236 | |||||||||
| Undistributed Net Investment Income | 916 | 822 | 338 | ||||||||||||
| Accumulated Net Realized Gain (Loss) | (62,701 | ) | (258,665 | ) | 210 | ||||||||||
| Unrealized Appreciation (Depreciation) on: | |||||||||||||||
| Investments | 2,561 | 1,534 | 3,569 | ||||||||||||
| Investments in Affiliates | 175 | 36 | (1 | ) | |||||||||||
| Futures Contracts | (79 | ) | (17 | ) | 24 | ||||||||||
| Swap Agreements | — | (528 | ) | (117 | ) | ||||||||||
| Foreign Currency Exchange Contracts | — | — | (4 | ) | |||||||||||
| Foreign Currency Translations | — | — | (1 | ) | |||||||||||
| Net Assets | $ | 67,371 | $ | 168,005 | $ | 24,254 | |||||||||
The accompanying notes are an integral part of the financial statements.
77
2011 Annual Report
September 30, 2011
Statements of Assets and Liabilities (cont'd)
| Investment Grade Fixed Income Portfolio (000) | Limited Duration Portfolio (000) | Long Duration Fixed Income Portfolio (000) | |||||||||||||
| CLASS I: | |||||||||||||||
| Net Assets | $ | 62,410 | $ | 167,811 | $ | 23,660 | |||||||||
| Shares Outstanding (unlimited number of shares authorized, no par value) (not in 000s) | 6,074,315 | 21,763,293 | 1,989,114 | ||||||||||||
| Net Asset Value, Offering and Redemption Price Per Share | $ | 10.27 | $ | 7.71 | $ | 11.89 | |||||||||
| CLASS P: | |||||||||||||||
| Net Assets | $ | 408 | $ | 194 | $ | 594 | |||||||||
| Shares Outstanding (unlimited number of shares authorized, no par value) (not in 000s) | 39,713 | 25,099 | 50,000 | ||||||||||||
| Net Asset Value, Offering and Redemption Price Per Share | $ | 10.27 | $ | 7.71 | $ | 11.88 | |||||||||
| CLASS H: | |||||||||||||||
| Net Assets | $ | 473 | $ | — | $ | — | |||||||||
| Shares Outstanding (unlimited number of shares authorized, no par value) (not in 000s) | 46,025 | — | — | ||||||||||||
| Net Asset Value, Redemption Price Per Share | $ | 10.27 | $ | — | $ | — | |||||||||
| Maximum Sales Load | 3.50 | % | — | — | |||||||||||
| Maximum Sales Charge | $ | 0.37 | $ | — | $ | — | |||||||||
| Maximum Offering Price Per Share | $ | 10.64 | $ | — | $ | — | |||||||||
| CLASS L: | |||||||||||||||
| Net Assets | $ | 4,080 | $ | — | $ | — | |||||||||
| Shares Outstanding (unlimited number of shares authorized, no par value) (not in 000s) | 397,506 | — | — | ||||||||||||
| Net Asset Value, Offering and Redemption Price Per Share | $ | 10.26 | $ | — | $ | — | |||||||||
| (1) Including: Securities on Loan, at Value: | $ | 961 | $ | — | $ | — | |||||||||
@ Amount is less than $500.
The accompanying notes are an integral part of the financial statements.
78
2011 Annual Report
September 30, 2011
Statements of Operations
| Balanced Portfolio (000) | Mid Cap Growth Portfolio (000) | Core Fixed Income Portfolio (000) | Core Plus Fixed Income Portfolio (000) | ||||||||||||||||
| Investment Income: | |||||||||||||||||||
| Dividends from Securities of Affiliated Issuers | $ | 7 | $ | 532 | $ | 2 | $ | 20 | |||||||||||
| Dividends from Securities of Unaffiliated Issuers | 480 | 54,547 | — | — | |||||||||||||||
| Interest from Securities of Unaffiliated Issuers | 727 | — | 2,645 | 16,388 | |||||||||||||||
| Interest from Securities of Affiliated Issuers | 17 | — | 55 | 248 | |||||||||||||||
| Income from Securities Loaned — Net | 12 | — | 16 | 31 | |||||||||||||||
| Less: Foreign Taxes Withheld | (— | @) | (1,917 | ) | (— | @) | (8 | ) | |||||||||||
| Total Investment Income | 1,243 | 53,162 | 2,718 | 16,679 | |||||||||||||||
| Expenses: | |||||||||||||||||||
| Investment Advisory Fees (Note B) | 211 | 34,802 | 259 | 1,378 | |||||||||||||||
| Sub Transfer Agency Fees | 19 | 6,135 | 154 | 229 | |||||||||||||||
| Administration Fees (Note C) | 37 | 5,568 | 55 | 294 | |||||||||||||||
| Custodian Fees (Note F) | 141 | 458 | 50 | 180 | |||||||||||||||
| Shareholder Reporting Fees | 13 | 709 | 11 | 31 | |||||||||||||||
| Professional Fees | 63 | 261 | 61 | 101 | |||||||||||||||
| Registration Fees | 27 | 162 | 30 | 38 | |||||||||||||||
| Trustees' Fees and Expenses | 2 | 180 | 3 | 13 | |||||||||||||||
| Transfer Agency Fees (Note E) | 19 | 136 | 8 | 25 | |||||||||||||||
| Pricing Fees | 67 | 6 | 35 | 61 | |||||||||||||||
| Shareholder Servicing Fees — Investment Class (Note D) | 4 | — | — | 7 | |||||||||||||||
| Shareholder Servicing Fees — Class P (Note D) | 45 | 7,370 | — | @ | 14 | ||||||||||||||
| Other Expenses | 13 | 173 | 16 | 59 | |||||||||||||||
| Total Expenses | 661 | 55,960 | 682 | 2,430 | |||||||||||||||
| Voluntary Waiver of Investment Advisory Fees (Note B) | — | — | (259 | ) | — | ||||||||||||||
| Expenses Reimbursed by Advisor (Note B) | — | — | (77 | ) | — | ||||||||||||||
| Rebate from Morgan Stanley Affiliate (Note G-2) | (7 | ) | (456 | ) | (2 | ) | (18 | ) | |||||||||||
| Net Expenses | 654 | 55,504 | 344 | 2,412 | |||||||||||||||
| Net Investment Income (Loss) | 589 | (2,342 | ) | 2,374 | 14,267 | ||||||||||||||
| Realized Gain (Loss): | |||||||||||||||||||
| Investments Sold | 4,187 | 659,245 | 2,645 | 23,224 | |||||||||||||||
| Investments in Affiliates | 28 | — | 269 | 1,698 | |||||||||||||||
| Foreign Currency Exchange Contracts | 23 | — | — | (325 | ) | ||||||||||||||
| Foreign Currency Transactions | 8 | (432 | ) | — | 8 | ||||||||||||||
| Futures Contracts | 207 | — | 38 | 1,802 | |||||||||||||||
| Swap Agreements | (138 | ) | — | (1,075 | ) | (5,460 | ) | ||||||||||||
| Net Realized Gain | 4,315 | 658,813 | 1,877 | 20,947 | |||||||||||||||
| Change in Unrealized Appreciation (Depreciation): | |||||||||||||||||||
| Investments | (4,148 | ) | (763,733 | ) | (2,102 | ) | (26,379 | ) | |||||||||||
| Investments in Affiliates | (165 | ) | — | (269 | ) | (1,858 | ) | ||||||||||||
| Foreign Currency Exchange Contracts | 132 | — | — | 12 | |||||||||||||||
| Foreign Currency Translations | (9 | ) | (7 | ) | — | 1 | |||||||||||||
| Futures Contracts | (144 | ) | — | (96 | ) | (334 | ) | ||||||||||||
| Swap Agreements | 106 | — | 1,044 | 5,391 | |||||||||||||||
| Net Change in Unrealized Appreciation (Depreciation) | (4,228 | ) | (763,740 | ) | (1,423 | ) | (23,167 | ) | |||||||||||
| Net Realized Gain (Loss) and Change in Unrealized Appreciation (Depreciation) | 87 | (104,927 | ) | 454 | (2,220 | ) | |||||||||||||
| Net Increase (Decrease) in Net Assets Resulting from Operations | $ | 676 | $ | (107,269 | ) | $ | 2,828 | $ | 12,047 | ||||||||||
@ Amount is less than $500.
The accompanying notes are an integral part of the financial statements.
79
2011 Annual Report
September 30, 2011
Statements of Operations
| Investment Grade Fixed Income Portfolio (000) | Limited Duration Portfolio (000) | Long Duration Fixed Income Portfolio (000) | |||||||||||||
| Investment Income: | |||||||||||||||
| Dividends from Securities of Affiliated Issuers | $ | 3 | $ | 4 | $ | 1 | |||||||||
| Interest from Securities of Unaffiliated Issuers | 3,034 | 4,990 | 1,287 | ||||||||||||
| Interest from Securities of Affiliated Issuers | 95 | 111 | 17 | ||||||||||||
| Income from Securities Loaned — Net | 17 | — | — | ||||||||||||
| Less: Foreign Taxes Withheld | (2 | ) | (2 | ) | — | ||||||||||
| Total Investment Income | 3,147 | 5,103 | 1,305 | ||||||||||||
| Expenses: | |||||||||||||||
| Investment Advisory Fees (Note B) | 290 | 564 | 94 | ||||||||||||
| Administration Fees (Note C) | 62 | 150 | 20 | ||||||||||||
| Sub Transfer Agency Fees | 20 | 190 | — | ||||||||||||
| Professional Fees | 60 | 56 | 59 | ||||||||||||
| Custodian Fees (Note F) | 56 | 47 | 34 | ||||||||||||
| Registration Fees | 58 | 23 | 21 | ||||||||||||
| Pricing Fees | 35 | 26 | 37 | ||||||||||||
| Transfer Agency Fees (Note E) | 15 | 11 | 6 | ||||||||||||
| Shareholder Reporting Fees | — | @ | 30 | — | @ | ||||||||||
| Trustees' Fees and Expenses | 2 | 7 | 2 | ||||||||||||
| Shareholder Servicing Fees — Class P (Note D) | 1 | — | @ | 1 | |||||||||||
| Shareholder Servicing Fees — Class H (Note D) | 1 | — | — | ||||||||||||
| Distribution and Shareholder Servicing Fees — Class L (Note D) | 23 | — | — | ||||||||||||
| Other Expenses | 19 | 15 | 8 | ||||||||||||
| Total Expenses | 642 | 1,119 | 282 | ||||||||||||
| Voluntary Waiver of Investment Advisory Fees (Note B) | — | — | (94 | ) | |||||||||||
| Expenses Reimbursed by Advisor (Note B) | — | — | (61 | ) | |||||||||||
| Voluntary Waiver of Shareholder Servicing Fees — Class P (Note D) | (— | @) | — | — | |||||||||||
| Rebate from Morgan Stanley Affiliate (Note G-2) | (3 | ) | (3 | ) | (1 | ) | |||||||||
| Net Expenses | 639 | 1,116 | 126 | ||||||||||||
| Net Investment Income | 2,508 | 3,987 | 1,179 | ||||||||||||
| Realized Gain (Loss): | |||||||||||||||
| Investments Sold | 3,198 | 3,096 | 673 | ||||||||||||
| Investments in Affiliates | 346 | 74 | 31 | ||||||||||||
| Foreign Currency Exchange Contracts | — | — | (1 | ) | |||||||||||
| Foreign Currency Transactions | — | — | (— | @) | |||||||||||
| Futures Contracts | (184 | ) | (298 | ) | (9 | ) | |||||||||
| Swap Agreements | (1,266 | ) | (3,029 | ) | (244 | ) | |||||||||
| Net Realized Gain (Loss) | 2,094 | (157 | ) | 450 | |||||||||||
| Change in Unrealized Appreciation (Depreciation): | |||||||||||||||
| Investments | (2,317 | ) | (4,972 | ) | (22 | ) | |||||||||
| Investments in Affiliates | (351 | ) | (97 | ) | (39 | ) | |||||||||
| Foreign Currency Exchange Contracts | — | — | (4 | ) | |||||||||||
| Foreign Currency Translations | — | — | (1 | ) | |||||||||||
| Futures Contracts | (89 | ) | (56 | ) | 34 | ||||||||||
| Swap Agreements | 1,117 | 2,687 | 258 | ||||||||||||
| Net Change in Unrealized Appreciation (Depreciation) | (1,640 | ) | (2,438 | ) | 226 | ||||||||||
| Net Realized Gain (Loss) and Change in Unrealized Appreciation (Depreciation) | 454 | (2,595 | ) | 676 | |||||||||||
| Net Increase in Net Assets Resulting from Operations | $ | 2,962 | $ | 1,392 | $ | 1,855 | |||||||||
@ Amount is less than $500.
The accompanying notes are an integral part of the financial statements.
80
2011 Annual Report
September 30, 2011
Statements of Changes in Net Assets
| Balanced Portfolio | Mid Cap Growth Portfolio | ||||||||||||||||||
| Year Ended September 30, 2011 (000) | Year Ended September 30, 2010 (000) | Year Ended September 30, 2011 (000) | Year Ended September 30, 2010 (000) | ||||||||||||||||
| Increase (Decrease) in Net Assets: | |||||||||||||||||||
| Operations: | |||||||||||||||||||
| Net Investment Income | $ | 589 | $ | 815 | $ | (2,342 | ) | $ | 11,374 | ||||||||||
| Net Realized Gain (Loss) | 4,315 | (2,288 | ) | 658,813 | 188,204 | ||||||||||||||
| Net Change in Unrealized Appreciation (Depreciation) | (4,228 | ) | 6,588 | (763,740 | ) | 777,428 | |||||||||||||
| Net Increase (Decrease) in Net Assets Resulting from Operations | 676 | 5,115 | (107,269 | ) | 977,006 | ||||||||||||||
| Distributions from and/or in Excess of: | |||||||||||||||||||
| Class I: | |||||||||||||||||||
| Net Investment Income | (410 | ) | (537 | ) | (9,653 | ) | (492 | ) | |||||||||||
| Investment Class: | |||||||||||||||||||
| Net Investment Income | (41 | )* | (85 | ) | — | — | |||||||||||||
| Class P: | |||||||||||||||||||
| Net Investment Income | (234 | ) | (296 | ) | (2,780 | ) | — | ||||||||||||
| Total Distributions | (685 | ) | (918 | ) | (12,433 | ) | (492 | ) | |||||||||||
| Capital Share Transactions:(1) | |||||||||||||||||||
| Class I: | |||||||||||||||||||
| Subscribed | 1,198 | 481 | 1,490,614 | 889,304 | |||||||||||||||
| Distributions Reinvested | 406 | 537 | 8,865 | 472 | |||||||||||||||
| Conversion from Investment Class | 5,798 | — | — | — | |||||||||||||||
| Redeemed | (4,609 | ) | (26,425 | ) | (614,738 | ) | (420,200 | ) | |||||||||||
| Investment Class: | |||||||||||||||||||
| Subscribed | 168 | * | 294 | — | — | ||||||||||||||
| Distributions Reinvested | 41 | * | 85 | — | — | ||||||||||||||
| Conversion to Class I | (5,798 | ) | — | — | — | ||||||||||||||
| Redeemed | (73 | )* | (105 | ) | — | — | |||||||||||||
| Class P: | |||||||||||||||||||
| Subscribed | 1,375 | 1,623 | 1,017,179 | 1,024,930 | |||||||||||||||
| Distributions Reinvested | 234 | 295 | 2,751 | — | |||||||||||||||
| Redeemed | (1,852 | ) | (4,318 | ) | (869,991 | ) | (566,573 | ) | |||||||||||
| Net Increase (Decrease) in Net Assets Resulting from Capital Share Transactions | (3,112 | ) | (27,533 | ) | 1,034,680 | 927,933 | |||||||||||||
| Total Increase (Decrease) in Net Assets | (3,121 | ) | (23,336 | ) | 914,978 | 1,904,447 | |||||||||||||
| Net Assets: | |||||||||||||||||||
| Beginning of Period | 45,170 | 68,506 | 5,477,558 | 3,573,111 | |||||||||||||||
| End of Period | $ | 42,049 | $ | 45,170 | $ | 6,392,536 | $ | 5,477,558 | |||||||||||
| Undistributed (Distribution in Excess of) Net Investment Income Included in End of Period Net Assets | $ | 328 | $ | 353 | $ | (908 | ) | $ | 10,899 | ||||||||||
| (1) Capital Share Transactions: | |||||||||||||||||||
| Class I: | |||||||||||||||||||
| Shares Subscribed | 92 | 40 | 38,900 | 29,554 | |||||||||||||||
| Shares Issued on Distributions Reinvested | 30 | 45 | 238 | 17 | |||||||||||||||
| Conversion from Investment Class | 432 | — | — | — | |||||||||||||||
| Shares Redeemed | (348 | ) | (2,184 | ) | (16,008 | ) | (14,261 | ) | |||||||||||
| Net Increase (Decrease) in Class I Shares Outstanding | 206 | (2,099 | ) | 23,130 | 15,310 | ||||||||||||||
| Investment Class: | |||||||||||||||||||
| Shares Subscribed | 13 | * | 25 | — | — | ||||||||||||||
| Shares Issued on Distributions Reinvested | 3 | * | 7 | — | — | ||||||||||||||
| Conversion to Class I | (433 | ) | — | — | — | ||||||||||||||
| Shares Redeemed | (5 | )* | (8 | ) | — | — | |||||||||||||
| Net Increase (Decrease) in Investment Class Shares Outstanding | (422 | ) | 24 | — | — | ||||||||||||||
| Class P: | |||||||||||||||||||
| Shares Subscribed | 104 | 134 | 27,862 | 35,479 | |||||||||||||||
| Shares Issued on Distributions Reinvested | 18 | 25 | 76 | — | |||||||||||||||
| Shares Redeemed | (141 | ) | (360 | ) | (24,055 | ) | (19,574 | ) | |||||||||||
| Net Increase (Decrease) in Class P Shares Outstanding | (19 | ) | (201 | ) | 3,883 | 15,905 | |||||||||||||
* For the period October 1, 2010 through March 22, 2011.
The accompanying notes are an integral part of the financial statements.
81
2011 Annual Report
September 30, 2011
Statements of Changes in Net Assets
| Core Fixed Income Portfolio | Core Plus Fixed Income Portfolio | ||||||||||||||||||
| Year Ended September 30, 2011 (000) | Year Ended September 30, 2010 (000) | Year Ended September 30, 2011 (000) | Year Ended September 30, 2010 (000) | ||||||||||||||||
| Increase (Decrease) in Net Assets: | |||||||||||||||||||
| Operations: | |||||||||||||||||||
| Net Investment Income | $ | 2,374 | $ | 2,982 | $ | 14,267 | $ | 29,105 | |||||||||||
| Net Realized Gain | 1,877 | 3,011 | 20,947 | 37,667 | |||||||||||||||
| Net Change in Unrealized Appreciation (Depreciation) | (1,423 | ) | 754 | (23,167 | ) | 5,313 | |||||||||||||
| Net Increase in Net Assets Resulting from Operations | 2,828 | 6,747 | 12,047 | 72,085 | |||||||||||||||
| Distributions from and/or in Excess of: | |||||||||||||||||||
| Class I: | |||||||||||||||||||
| Net Investment Income | (2,131 | ) | (2,890 | ) | (15,254 | ) | (26,942 | ) | |||||||||||
| Investment Class: | |||||||||||||||||||
| Net Investment Income | — | — | (898 | )* | (3,836 | ) | |||||||||||||
| Class P: | |||||||||||||||||||
| Net Investment Income | (4 | ) | (6 | ) | (206 | ) | (197 | ) | |||||||||||
| Total Distributions | (2,135 | ) | (2,896 | ) | (16,358 | ) | (30,975 | ) | |||||||||||
| Capital Share Transactions:(1) | |||||||||||||||||||
| Class I: | |||||||||||||||||||
| Subscribed | 2,966 | 5,258 | 42,742 | 124,974 | |||||||||||||||
| Distributions Reinvested | 2,131 | 2,881 | 15,228 | 26,764 | |||||||||||||||
| Conversion from Investment Class | — | — | 94 | — | |||||||||||||||
| Redeemed | (17,577 | ) | (30,097 | ) | (193,906 | ) | (549,999 | ) | |||||||||||
| Investment Class: | |||||||||||||||||||
| Subscribed | — | — | — | 26 | |||||||||||||||
| Conversion to Class I | — | — | (94 | ) | — | ||||||||||||||
| Redeemed | — | — | (92,182 | )* | (27,291 | ) | |||||||||||||
| Class P: | |||||||||||||||||||
| Subscribed | 6 | — | 1,120 | 779 | |||||||||||||||
| Distributions Reinvested | 4 | 6 | 206 | 196 | |||||||||||||||
| Redeemed | (173 | ) | (21 | ) | (2,394 | ) | (2,028 | ) | |||||||||||
| Net Decrease in Net Assets Resulting from Capital Share Transactions | (12,643 | ) | (21,973 | ) | (229,186 | ) | (426,579 | ) | |||||||||||
| Total Decrease in Net Assets | (11,950 | ) | (18,122 | ) | (233,497 | ) | (385,469 | ) | |||||||||||
| Net Assets: | |||||||||||||||||||
| Beginning of Period | 75,860 | 93,982 | 533,377 | 918,846 | |||||||||||||||
| End of Period | $ | 63,910 | $ | 75,860 | $ | 299,880 | $ | 533,377 | |||||||||||
| Undistributed Net Investment Income Included in End of Period Net Assets | $ | 976 | $ | 528 | $ | 6,415 | $ | 5,908 | |||||||||||
| (1) Capital Share Transactions: | |||||||||||||||||||
| Class I: | |||||||||||||||||||
| Shares Subscribed | 302 | 548 | 4,346 | 13,192 | |||||||||||||||
| Shares Issued on Distributions Reinvested | 217 | 303 | 1,559 | 2,836 | |||||||||||||||
| Conversion from Investment Class | — | — | 10 | — | |||||||||||||||
| Shares Redeemed | (1,778 | ) | (3,142 | ) | (19,801 | ) | (57,130 | ) | |||||||||||
| Net Decrease in Class I Shares Outstanding | (1,259 | ) | (2,291 | ) | (13,886 | ) | (41,102 | ) | |||||||||||
| Investment Class: | |||||||||||||||||||
| Shares Subscribed | — | — | — | — | @@ | ||||||||||||||
| Conversion to Class I | — | — | (9 | ) | — | ||||||||||||||
| Shares Redeemed | — | — | (9,331 | )* | (2,839 | ) | |||||||||||||
| Net Decrease in Investment Class Shares Outstanding | — | — | (9,340 | ) | (2,839 | ) | |||||||||||||
| Class P: | |||||||||||||||||||
| Shares Subscribed | 1 | — | 114 | 80 | |||||||||||||||
| Shares Issued on Distributions Reinvested | — | @@ | 1 | 21 | 21 | ||||||||||||||
| Shares Redeemed | (18 | ) | (2 | ) | (242 | ) | (212 | ) | |||||||||||
| Net Decrease in Class P Shares Outstanding | (17 | ) | (1 | ) | (107 | ) | (111 | ) | |||||||||||
* For the period October 1, 2010 through March 14, 2011.
@@ Amount is less than 500 shares.
The accompanying notes are an integral part of the financial statements.
82
2011 Annual Report
September 30, 2011
Statements of Changes in Net Assets
| Investment Grade Fixed Income Portfolio | Limited Duration Portfolio | ||||||||||||||||||
| Year Ended September 30, 2011 (000) | Year Ended September 30, 2010 (000) | Year Ended September 30, 2011 (000) | Year Ended September 30, 2010 (000) | ||||||||||||||||
| Increase (Decrease) in Net Assets: | |||||||||||||||||||
| Operations: | |||||||||||||||||||
| Net Investment Income | $ | 2,508 | $ | 3,231 | $ | 3,987 | $ | 5,691 | |||||||||||
| Net Realized Gain (loss) | 2,094 | 4,355 | (157 | ) | 4,599 | ||||||||||||||
| Net Change in Unrealized Appreciation (Depreciation) | (1,640 | ) | 232 | (2,438 | ) | (1,698 | ) | ||||||||||||
| Net Increase in Net Assets Resulting from Operations | 2,962 | 7,818 | 1,392 | 8,592 | |||||||||||||||
| Distributions from and/or in Excess of: | |||||||||||||||||||
| Class I: | |||||||||||||||||||
| Net Investment Income | (2,195 | ) | (3,953 | ) | (3,268 | ) | (5,286 | ) | |||||||||||
| Paid-in-Capital | — | — | — | (161 | ) | ||||||||||||||
| Class P: | |||||||||||||||||||
| Net Investment Income | (14 | ) | (24 | ) | (2 | ) | (2 | ) | |||||||||||
| Paid-in-Capital | — | — | — | (— | @) | ||||||||||||||
| Class H: | |||||||||||||||||||
| Net Investment Income | (5 | ) | (6 | ) | — | — | |||||||||||||
| Class L: | |||||||||||||||||||
| Net Investment Income | (119 | ) | (200 | ) | — | — | |||||||||||||
| Total Distributions | (2,333 | ) | (4,183 | ) | (3,270 | ) | (5,449 | ) | |||||||||||
| Capital Share Transactions:(1) | |||||||||||||||||||
| Class I: | |||||||||||||||||||
| Subscribed | 4,447 | 6,110 | 11,161 | 13,427 | |||||||||||||||
| Distributions Reinvested | 2,100 | 3,815 | 3,267 | 5,446 | |||||||||||||||
| Redeemed | (24,083 | ) | (74,847 | ) | (53,349 | ) | (76,202 | ) | |||||||||||
| Class P: | |||||||||||||||||||
| Subscribed | 10 | — | @ | 250 | — | ||||||||||||||
| Distributions Reinvested | 14 | 23 | 2 | 2 | |||||||||||||||
| Redeemed | (207 | ) | (69 | ) | (108 | ) | (119 | ) | |||||||||||
| Class H: | |||||||||||||||||||
| Subscribed | 301 | — | @ | — | — | ||||||||||||||
| Distributions Reinvested | 2 | 3 | — | — | |||||||||||||||
| Redeemed | (1 | ) | (2 | ) | — | — | |||||||||||||
| Class L: | |||||||||||||||||||
| Subscribed | 266 | 1,986 | — | — | |||||||||||||||
| Distributions Reinvested | 115 | 194 | — | — | |||||||||||||||
| Redeemed | (1,827 | ) | (2,065 | ) | — | — | |||||||||||||
| Net Decrease in Net Assets Resulting from Capital Share Transactions | (18,863 | ) | (64,852 | ) | (38,777 | ) | (57,446 | ) | |||||||||||
| Total Decrease in Net Assets | (18,234 | ) | (61,217 | ) | (40,655 | ) | (54,303 | ) | |||||||||||
| Net Assets: | |||||||||||||||||||
| Beginning of Period | 85,605 | 146,822 | 208,660 | 262,963 | |||||||||||||||
| End of Period | $ | 67,371 | $ | 85,605 | $ | 168,005 | $ | 208,660 | |||||||||||
| Undistributed (Distribution in Excess of) Net Investment Income Included in End of Period Net Assets | $ | 916 | $ | 527 | $ | 822 | $ | (13 | ) | ||||||||||
@ Amount is less than $500.
The accompanying notes are an integral part of the financial statements.
83
2011 Annual Report
September 30, 2011
Statements of Changes in Net Assets (cont'd)
| Investment Grade Fixed Income Portfolio | Limited Duration Portfolio | ||||||||||||||||||
| Year Ended September 30, 2011 (000) | Year Ended September 30, 2010 (000) | Year Ended September 30, 2011 (000) | Year Ended September 30, 2010 (000) | ||||||||||||||||
| (1) Capital Share Transactions: | |||||||||||||||||||
| Class I: | |||||||||||||||||||
| Shares Subscribed | 443 | 622 | 1,439 | 1,742 | |||||||||||||||
| Shares Issued on Distributions Reinvested | 210 | 392 | 421 | 708 | |||||||||||||||
| Shares Redeemed | (2,383 | ) | (7,658 | ) | (6,875 | ) | (9,893 | ) | |||||||||||
| Net Decrease in Class I Shares Outstanding | (1,730 | ) | (6,644 | ) | (5,015 | ) | (7,443 | ) | |||||||||||
| Class P: | |||||||||||||||||||
| Shares Subscribed | 1 | — | @@ | 32 | — | ||||||||||||||
| Shares Issued on Distributions Reinvested | 1 | 2 | — | @@ | — | @@ | |||||||||||||
| Shares Redeemed | (20 | ) | (7 | ) | (14 | ) | (16 | ) | |||||||||||
| Net Increase (Decrease) in Class P Shares Outstanding | (18 | ) | (5 | ) | 18 | (16 | ) | ||||||||||||
| Class H: | |||||||||||||||||||
| Shares Subscribed | 29 | — | @@ | — | — | ||||||||||||||
| Shares Issued on Distributions Reinvested | — | @@ | — | @@ | — | — | |||||||||||||
| Shares Redeemed | (— | @@) | (— | @@) | — | — | |||||||||||||
| Net Increase in Class H Shares Outstanding | 29 | — | @@ | — | — | ||||||||||||||
| Class L: | |||||||||||||||||||
| Shares Subscribed | 27 | 202 | — | — | |||||||||||||||
| Shares Issued on Distributions Reinvested | 12 | 20 | — | — | |||||||||||||||
| Shares Redeemed | (183 | ) | (210 | ) | — | — | |||||||||||||
| Net Increase (Decrease) in Class L Shares Outstanding | (144 | ) | 12 | — | — | ||||||||||||||
@@ Amount is less than 500 shares.
The accompanying notes are an integral part of the financial statements.
84
2011 Annual Report
September 30, 2011
Statements of Changes in Net Assets
| Long Duration Fixed Income Portfolio | |||||||||||
| Year Ended September 30, 2011 (000) | Year Ended September 30, 2010 (000) | ||||||||||
| Increase (Decrease) in Net Assets: | |||||||||||
| Operations: | |||||||||||
| Net Investment Income | $ | 1,179 | $ | 1,525 | |||||||
| Net Realized Gain | 450 | 1,608 | |||||||||
| Net Change in Unrealized Appreciation (Depreciation) | 226 | 675 | |||||||||
| Net Increase in Net Assets Resulting from Operations | 1,855 | 3,808 | |||||||||
| Distributions from and/or in Excess of: | |||||||||||
| Class I: | |||||||||||
| Net Investment Income | (1,088 | ) | (1,518 | ) | |||||||
| Net Realized Gain | (1,496 | ) | (1,612 | ) | |||||||
| Class P: | |||||||||||
| Net Investment Income | (22 | ) | (26 | ) | |||||||
| Net Realized Gain | (27 | ) | (30 | ) | |||||||
| Total Distributions | (2,633 | ) | (3,186 | ) | |||||||
| Capital Share Transactions:(1) | |||||||||||
| Class I: | |||||||||||
| Subscribed | 221 | 7 | |||||||||
| Distributions Reinvested | 236 | 326 | |||||||||
| Redeemed | (8,365 | ) | — | ||||||||
| Class P: | |||||||||||
| Subscribed | — | — | |||||||||
| Redeemed | — | — | |||||||||
| Net Increase (Decrease) in Net Assets Resulting from Capital Share Transactions | (7,908 | ) | 333 | ||||||||
| Total Increase (Decrease) in Net Assets | (8,686 | ) | 955 | ||||||||
| Net Assets: | |||||||||||
| Beginning of Period | 32,940 | 31,985 | |||||||||
| End of Period | $ | 24,254 | $ | 32,940 | |||||||
| Undistributed Net Investment Income Included in End of Period Net Assets | $ | 338 | $ | 295 | |||||||
| (1) Capital Share Transactions: | |||||||||||
| Class I: | |||||||||||
| Shares Subscribed | 19 | — | @@ | ||||||||
| Shares Issued on Distributions Reinvested | 23 | 30 | |||||||||
| Shares Redeemed | (811 | ) | — | ||||||||
| Net Increase (Decrease) in Class I Shares Outstanding | (769 | ) | 30 | ||||||||
| Class P: | |||||||||||
| Shares Subscribed | — | — | |||||||||
| Shares Redeemed | — | — | |||||||||
| Net Increase (Decrease) in Class P Shares Outstanding | — | — | |||||||||
@@ Amount is less than 500 shares.
The accompanying notes are an integral part of the financial statements.
85
2011 Annual Report
September 30, 2011
Financial Highlights
Balanced Portfolio
| Class I | |||||||||||||||||||||||
| Year Ended September 30, | |||||||||||||||||||||||
| Selected Per Share Data and Ratios | 2011 | 2010 | 2009 | 2008 | 2007 | ||||||||||||||||||
| Net Asset Value, Beginning of Period | $ | 12.55 | $ | 11.66 | $ | 11.87 | $ | 14.69 | $ | 12.63 | |||||||||||||
| Income (Loss) from Investment Operations: | |||||||||||||||||||||||
| Net Investment Income† | 0.18 | 0.21 | 0.16 | 0.38 | 0.32 | ||||||||||||||||||
| Net Realized and Unrealized Gain (Loss) | (0.02 | ) | 0.91 | 0.17 | (2.84 | ) | 2.00 | ||||||||||||||||
| Total from Investment Operations | 0.16 | 1.12 | 0.33 | (2.46 | ) | 2.32 | |||||||||||||||||
| Distributions from and/or in Excess of: | |||||||||||||||||||||||
| Net Investment Income | (0.21 | ) | (0.23 | ) | (0.54 | ) | (0.36 | ) | (0.26 | ) | |||||||||||||
| Redemption Fees | — | — | 0.00 | ‡ | 0.00 | ‡ | 0.00 | ‡ | |||||||||||||||
| Net Asset Value, End of Period | $ | 12.50 | $ | 12.55 | $ | 11.66 | $ | 11.87 | $ | 14.69 | |||||||||||||
| Total Return++ | 1.07 | % | 9.77 | % | 3.45 | %** | (17.02 | )% | 18.57 | % | |||||||||||||
| Ratios and Supplemental Data: | |||||||||||||||||||||||
| Net Assets, End of Period (Thousands) | $ | 25,192 | $ | 22,706 | $ | 45,567 | $ | 40,799 | $ | 310,886 | |||||||||||||
| Ratio of Expenses to Average Net Assets (1) | 1.30 | %+†† | 0.89 | %+†† | 0.67 | %+ | 0.57 | %+ | 0.61 | %+ | |||||||||||||
| Ratio of Net Investment Income to Average Net Assets (1) | 1.35 | %+†† | 1.73 | %+†† | 1.56 | %+ | 2.66 | %+ | 2.35 | %+ | |||||||||||||
| Ratio of Rebate from Morgan Stanley Affiliates to Average Net Assets | 0.01 | % | 0.01 | % | 0.04 | % | 0.05 | % | 0.00 | %§ | |||||||||||||
| Portfolio Turnover Rate | 164 | % | 176 | % | 171 | % | 148 | % | 60 | % | |||||||||||||
| (1) Supplemental Information on the Ratios to Average Net Assets: | |||||||||||||||||||||||
| Ratios Before Expense Limitation: | |||||||||||||||||||||||
| Expenses to Average Net Assets | N/A | N/A | N/A | 0.58 | %+ | N/A | |||||||||||||||||
| Net Investment Income to Average Net Assets | N/A | N/A | N/A | 2.65 | %+ | N/A | |||||||||||||||||
† Per share amount is based on average shares outstanding.
‡ Amount is less than $0.005 per share.
++ Calculated based on the net asset value as of the last business day of the period.
** Performance was positively impacted by approximately 0.79% due to the receipt of proceeds from the settlements of class action suits involving primarily two of the Portfolio's past holdings. This was a one-time settlement, and as a result, the impact on the NAV and consequently the performance will not likely be repeated in the future. Had these settlements not occurred, the total return for Class I shares would have been approximately 2.66%.
+ The Ratios of Expenses and Net Investment Income reflect the rebate of certain Portfolio expenses in connection with the investments in Morgan Stanley affiliates during the period. The effect of the rebate on the ratios is disclosed in the above table as "Ratio of Rebate from Morgan Stanley Affiliates to Average Net Assets."
†† Reflects overall Portfolio ratios for investment income and non-class specific expenses.
§ Amount is less than 0.005%.
The accompanying notes are an integral part of the financial statements.
86
2011 Annual Report
September 30, 2011
Financial Highlights
Balanced Portfolio
| Class P | |||||||||||||||||||||||
| Year Ended September 30, | |||||||||||||||||||||||
| Selected Per Share Data and Ratios | 2011 | 2010 | 2009 | 2008 | 2007 | ||||||||||||||||||
| Net Asset Value, Beginning of Period | $ | 12.52 | $ | 11.63 | $ | 11.84 | $ | 14.66 | $ | 12.61 | |||||||||||||
| Income (Loss) from Investment Operations: | |||||||||||||||||||||||
| Net Investment Income† | 0.15 | 0.18 | 0.13 | 0.32 | 0.29 | ||||||||||||||||||
| Net Realized and Unrealized Gain (Loss) | (0.03 | ) | 0.91 | 0.17 | (2.81 | ) | 1.98 | ||||||||||||||||
| Total from Investment Operations | 0.12 | 1.09 | 0.30 | (2.49 | ) | 2.27 | |||||||||||||||||
| Distributions from and/or in Excess of: | |||||||||||||||||||||||
| Net Investment Income | (0.17 | ) | (0.20 | ) | (0.51 | ) | (0.33 | ) | (0.22 | ) | |||||||||||||
| Redemption Fees | — | — | 0.00 | ‡ | 0.00 | ‡ | 0.00 | ‡ | |||||||||||||||
| Net Asset Value, End of Period | $ | 12.47 | $ | 12.52 | $ | 11.63 | $ | 11.84 | $ | 14.66 | |||||||||||||
| Total Return++ | 0.83 | % | 9.52 | % | 3.15 | %** | (17.26 | )% | 18.23 | % | |||||||||||||
| Ratios and Supplemental Data: | |||||||||||||||||||||||
| Net Assets, End of Period (Thousands) | $ | 16,857 | $ | 17,169 | $ | 18,290 | $ | 32,398 | $ | 31,183 | |||||||||||||
| Ratio of Expenses to Average Net Assets (1) | 1.55 | %+†† | 1.14 | %+†† | 1.03 | %+ | 0.90 | %+ | 0.87 | %+ | |||||||||||||
| Ratio of Net Investment Income to Average Net Assets (1) | 1.10 | %+†† | 1.48 | %+†† | 1.27 | %+ | 2.35 | %+ | 2.11 | %+ | |||||||||||||
| Ratio of Rebate from Morgan Stanley Affiliates to Average Net Assets | 0.01 | % | 0.01 | % | 0.04 | % | 0.06 | % | 0.00 | %§ | |||||||||||||
| Portfolio Turnover Rate | 164 | % | 176 | % | 171 | % | 148 | % | 60 | % | |||||||||||||
| (1) Supplemental Information on the Ratios to Average Net Assets: | |||||||||||||||||||||||
| Ratios Before Expense Limitation: | |||||||||||||||||||||||
| Expenses to Average Net Assets | N/A | N/A | 1.08 | %+ | 0.91 | %+ | N/A | ||||||||||||||||
| Net Investment Income to Average Net Assets | N/A | N/A | 1.22 | %+ | 2.34 | %+ | N/A | ||||||||||||||||
† Per share amount is based on average shares outstanding.
‡ Amount is less than $0.005 per share.
++ Calculated based on the net asset value as of the last business day of the period.
** Performance was positively impacted by approximately 0.80% due to the receipt of proceeds from the settlements of class action suits involving primarily two of the Portfolio's past holdings. This was a one-time settlement, and as a result, the impact on the NAV and consequently the performance will not likely be repeated in the future. Had these settlements not occurred, the total return for Class P shares would have been approximately 2.35%.
+ The Ratios of Expenses and Net Investment Income reflect the rebate of certain Portfolio expenses in connection with the investments in Morgan Stanley affiliates during the period. The effect of the rebate on the ratios is disclosed in the above table as "Ratio of Rebate from Morgan Stanley Affiliates to Average Net Assets."
†† Reflects overall Portfolio ratios for investment income and non-class specific expenses.
§ Amount is less than 0.005%.
The accompanying notes are an integral part of the financial statements.
87
2011 Annual Report
September 30, 2011
Financial Highlights
Mid Cap Growth Portfolio
| Class I | |||||||||||||||||||||||
| Year Ended September 30, | |||||||||||||||||||||||
| Selected Per Share Data and Ratios | 2011 | 2010 | 2009 | 2008 | 2007 | ||||||||||||||||||
| Net Asset Value, Beginning of Period | $ | 33.58 | $ | 26.96 | $ | 23.99 | $ | 33.68 | $ | 25.21 | |||||||||||||
| Income (Loss) from Investment Operations: | |||||||||||||||||||||||
| Net Investment Income† | 0.03 | 0.11 | 0.03 | 0.05¥ | 0.17 | ||||||||||||||||||
| Net Realized and Unrealized Gain (Loss) | 0.14 | 6.52 | 2.94 | (9.58 | ) | 8.42 | |||||||||||||||||
| Total from Investment Operations | 0.17 | 6.63 | 2.97 | (9.53 | ) | 8.59 | |||||||||||||||||
| Distributions from and/or in Excess of: | |||||||||||||||||||||||
| Net Investment Income | (0.10 | ) | (0.01 | ) | — | (0.16 | ) | (0.12 | ) | ||||||||||||||
| Redemption Fees | — | — | 0.00 | ‡ | 0.00 | ‡ | 0.00 | ‡ | |||||||||||||||
| Net Asset Value, End of Period | $ | 33.65 | $ | 33.58 | $ | 26.96 | $ | 23.99 | $ | 33.68 | |||||||||||||
| Total Return++ | 0.47 | % | 24.58 | % | 12.38 | %** | (28.42 | )%¥ | 34.24 | % | |||||||||||||
| Ratios and Supplemental Data: | |||||||||||||||||||||||
| Net Assets, End of Period (Thousands) | $ | 3,797,139 | $ | 3,012,006 | $ | 2,005,809 | $ | 1,609,506 | $ | 1,647,326 | |||||||||||||
| Ratio of Expenses to Average Net Assets | 0.69 | %+†† | 0.68 | %+†† | 0.69 | %+ | 0.63 | %+ | 0.63 | %+ | |||||||||||||
| Ratio of Net Investment Income to Average Net Assets | 0.07 | %+†† | 0.38 | %+†† | 0.16 | %+ | 0.17 | %+ | 0.57 | %+ | |||||||||||||
| Ratio of Rebate from Morgan Stanley Affiliates to Average Net Assets | 0.01 | % | 0.01 | % | 0.01 | % | 0.00 | %§ | 0.00 | %§ | |||||||||||||
| Portfolio Turnover Rate | 35 | % | 23 | % | 27 | % | 37 | % | 64 | % | |||||||||||||
† Per share amount is based on average shares outstanding.
¥ During the year, the Portfolio received a regulatory settlement from an unaffiliated third party, which had an impact of less than $0.005 on net investment income per share and less than 0.005% on total returns for Class I.
‡ Amount is less than $0.005 per share.
++ Calculated based on the net asset value as of the last business day of the period.
** Performance was positively impacted by approximately 0.04% due to the receipt of proceeds from the settlements of class action suits involving primarily two of the Portfolio's past holdings. This was a one-time settlement, and as a result, the impact on the NAV and consequently the performance will not likely be repeated in the future. Had these settlements not occurred, the total return for Class I shares would have been approximately 12.34%.
+ The Ratios of Expenses and Net Investment Income reflect the rebate of certain Portfolio expenses in connection with the investments in Morgan Stanley affiliates during the period. The effect of the rebate on the ratios is disclosed in the above table as "Ratio of Rebate from Morgan Stanley Affiliates to Average Net Assets."
†† Reflects overall Portfolio ratios for investment income and non-class specific expenses.
§ Amount is less than 0.005%.
The accompanying notes are an integral part of the financial statements.
88
2011 Annual Report
September 30, 2011
Financial Highlights
Mid Cap Growth Portfolio
| Class P | |||||||||||||||||||||||
| Year Ended September 30, | |||||||||||||||||||||||
| Selected Per Share Data and Ratios | 2011 | 2010 | 2009 | 2008 | 2007 | ||||||||||||||||||
| Net Asset Value, Beginning of Period | $ | 32.51 | $ | 26.15 | $ | 23.33 | $ | 32.78 | $ | 24.54 | |||||||||||||
| Income (Loss) from Investment Operations: | |||||||||||||||||||||||
| Net Investment Income (Loss)† | (0.07 | ) | 0.04 | (0.02 | ) | (0.02 | )¥ | 0.09 | |||||||||||||||
| Net Realized and Unrealized Gain (Loss) | 0.15 | 6.32 | 2.84 | (9.34 | ) | 8.20 | |||||||||||||||||
| Total from Investment Operations | 0.08 | 6.36 | 2.82 | (9.36 | ) | 8.29 | |||||||||||||||||
| Distributions from and/or in Excess of: | |||||||||||||||||||||||
| Net Investment Income | (0.04 | ) | — | — | (0.09 | ) | (0.05 | ) | |||||||||||||||
| Redemption Fees | — | — | 0.00 | ‡ | 0.00 | ‡ | 0.00 | ‡ | |||||||||||||||
| Net Asset Value, End of Period | $ | 32.55 | $ | 32.51 | $ | 26.15 | $ | 23.33 | $ | 32.78 | |||||||||||||
| Total Return++ | 0.22 | % | 24.32 | % | 12.04 | %** | (28.59 | )%¥ | 33.89 | % | |||||||||||||
| Ratios and Supplemental Data: | |||||||||||||||||||||||
| Net Assets, End of Period (Thousands) | $ | 2,595,397 | $ | 2,465,552 | $ | 1,567,302 | $ | 1,236,945 | $ | 1,520,096 | |||||||||||||
| Ratio of Expenses to Average Net Assets (1) | 0.94 | %+†† | 0.93 | %+†† | 0.96 | %+ | 0.88 | %+ | 0.88 | %+ | |||||||||||||
| Ratio of Net Investment Income (Loss) to Average Net Assets (1) | (0.18 | )%+†† | 0.13 | %+†† | (0.11 | )%+ | (0.07 | )%+ | 0.31 | %+ | |||||||||||||
| Ratio of Rebate from Morgan Stanley Affiliates to Average Net Assets | 0.01 | % | 0.01 | % | 0.01 | % | 0.00 | %§ | 0.00 | %§ | |||||||||||||
| Portfolio Turnover Rate | 35 | % | 23 | % | 27 | % | 37 | % | 64 | % | |||||||||||||
| (1) Supplemental Information on the Ratios to Average Net Assets: | |||||||||||||||||||||||
| Ratios Before Expense Limitation: | |||||||||||||||||||||||
| Expenses to Average Net Assets | N/A | N/A | N/A | 0.89 | %+ | N/A | |||||||||||||||||
| Net Investment Loss to Average Net Assets | N/A | N/A | N/A | (0.08 | )%+ | N/A | |||||||||||||||||
† Per share amount is based on average shares outstanding.
¥ During the year, the Portfolio received a regulatory settlement from an unaffiliated third party, which had an impact of less than $0.005 on net investment income per share and less than 0.005% on total returns for Class P.
‡ Amount is less than $0.005 per share.
++ Calculated based on the net asset value as of the last business day of the period.
** Performance was positively impacted by approximately 0.04% due to the receipt of proceeds from the settlements of class action suits involving primarily two of the Portfolio's past holdings. This was a one-time settlement, and as a result, the impact on the NAV and consequently the performance will not likely be repeated in the future. Had these settlements not occurred, the total return for Class P shares would have been approximately 12.00%.
+ The Ratios of Expenses and Net Investment Income (Loss) reflect the rebate of certain Portfolio expenses in connection with the investments in Morgan Stanley affiliates during the period. The effect of the rebate on the ratios is disclosed in the above table as "Ratio of Rebate from Morgan Stanley Affiliates to Average Net Assets."
†† Reflects overall Portfolio ratios for investment income and non-class specific expenses.
§ Amount is less than 0.005%.
The accompanying notes are an integral part of the financial statements.
89
2011 Annual Report
September 30, 2011
Financial Highlights
Core Fixed Income Portfolio
| Class I | |||||||||||||||||||||||
| Year Ended September 30, | |||||||||||||||||||||||
| Selected Per Share Data and Ratios | 2011 | 2010 | 2009 | 2008 | 2007 | ||||||||||||||||||
| Net Asset Value, Beginning of Period | $ | 9.96 | $ | 9.49 | $ | 9.18 | $ | 10.77 | $ | 10.80 | |||||||||||||
| Income (Loss) from Investment Operations: | |||||||||||||||||||||||
| Net Investment Income† | 0.34 | 0.34 | 0.34 | 0.53 | 0.52 | ||||||||||||||||||
| Net Realized and Unrealized Gain (Loss) | 0.08 | 0.45 | 0.57 | (1.60 | ) | (0.02 | ) | ||||||||||||||||
| Total from Investment Operations | 0.42 | 0.79 | 0.91 | (1.07 | ) | 0.50 | |||||||||||||||||
| Distributions from and/or in Excess of: | |||||||||||||||||||||||
| Net Investment Income | (0.30 | ) | (0.32 | ) | (0.60 | ) | (0.52 | ) | (0.53 | ) | |||||||||||||
| Redemption Fees | — | — | 0.00 | ‡ | 0.00 | ‡ | 0.00 | ‡ | |||||||||||||||
| Net Asset Value, End of Period | $ | 10.08 | $ | 9.96 | $ | 9.49 | $ | 9.18 | $ | 10.77 | |||||||||||||
| Total Return++ | 4.34 | % | 8.57 | % | 10.41 | % | (10.40 | )% | 4.76 | % | |||||||||||||
| Ratios and Supplemental Data: | |||||||||||||||||||||||
| Net Assets, End of Period (Thousands) | $ | 63,866 | $ | 75,651 | $ | 93,768 | $ | 186,305 | $ | 308,111 | |||||||||||||
| Ratio of Expenses to Average Net Assets (1) | 0.50 | %+†† | 0.50 | %+†† | 0.50 | %+ | 0.49 | %+ | 0.49 | %+ | |||||||||||||
| Ratio of Net Investment Income to Average Net Assets (1) | 3.43 | %+†† | 3.58 | %+†† | 3.73 | %+ | 5.11 | %+ | 4.83 | %+ | |||||||||||||
| Ratio of Rebate from Morgan Stanley Affiliates to Average Net Assets | 0.00 | %§ | 0.00 | %§ | 0.01 | % | 0.01 | % | 0.01 | % | |||||||||||||
| Portfolio Turnover Rate | 234 | % | 261 | % | 437 | % | 306 | % | 107 | % | |||||||||||||
| (1) Supplemental Information on the Ratios to Average Net Assets: | |||||||||||||||||||||||
| Ratios Before Expense Limitation: | |||||||||||||||||||||||
| Expenses to Average Net Assets | 0.99 | %†† | 0.67 | %+†† | 0.61 | %+ | 0.53 | %+ | 0.54 | %+ | |||||||||||||
| Net Investment Income to Average Net Assets | 2.94 | %†† | 3.41 | %+†† | 3.62 | %+ | 5.07 | %+ | 4.78 | %+ | |||||||||||||
† Per share amount is based on average shares outstanding.
‡ Amount is less than $0.005 per share.
++ Calculated based on the net asset value as of the last business day of the period.
+ The Ratios of Expenses and Net Investment Income reflect the rebate of certain Portfolio expenses in connection with the investments in Morgan Stanley affiliates during the period. The effect of the rebate on the ratios is disclosed in the above table as "Ratio of Rebate from Morgan Stanley Affiliates to Average Net Assets."
†† Reflects overall Portfolio ratios for investment income and non-class specific expenses.
§ Amount is less than 0.005%.
The accompanying notes are an integral part of the financial statements.
90
2011 Annual Report
September 30, 2011
Financial Highlights
Core Fixed Income Portfolio
| Class P | |||||||||||||||||||||||
| Year Ended September 30, | |||||||||||||||||||||||
| Selected Per Share Data and Ratios | 2011 | 2010 | 2009 | 2008 | 2007 | ||||||||||||||||||
| Net Asset Value, Beginning of Period | $ | 10.01 | $ | 9.53 | $ | 9.12 | $ | 10.71 | $ | 10.74 | |||||||||||||
| Income (Loss) from Investment Operations: | |||||||||||||||||||||||
| Net Investment Income† | 0.31 | 0.32 | 0.31 | 0.50 | 0.49 | ||||||||||||||||||
| Net Realized and Unrealized Gain (Loss) | 0.09 | 0.46 | 0.58 | (1.60 | ) | (0.02 | ) | ||||||||||||||||
| Total from Investment Operations | 0.40 | 0.78 | 0.89 | (1.10 | ) | 0.47 | |||||||||||||||||
| Distributions from and/or in Excess of: | |||||||||||||||||||||||
| Net Investment Income | (0.27 | ) | (0.30 | ) | (0.48 | ) | (0.49 | ) | (0.50 | ) | |||||||||||||
| Redemption Fees | — | — | 0.00 | ‡ | 0.00 | ‡ | 0.00 | ‡ | |||||||||||||||
| Net Asset Value, End of Period | $ | 10.14 | $ | 10.01 | $ | 9.53 | $ | 9.12 | $ | 10.71 | |||||||||||||
| Total Return++ | 4.11 | % | 8.47 | % | 10.10 | % | (10.68 | )% | 4.53 | % | |||||||||||||
| Ratios and Supplemental Data: | |||||||||||||||||||||||
| Net Assets, End of Period (Thousands) | $ | 44 | $ | 209 | $ | 214 | $ | 487 | $ | 11,805 | |||||||||||||
| Ratio of Expenses to Average Net Assets (1) | 0.75 | %+†† | 0.75 | %+†† | 0.75 | %+ | 0.74 | %+ | 0.74 | %+ | |||||||||||||
| Ratio of Net Investment Income to Average Net Assets (1) | 3.18 | %+†† | 3.33 | %+†† | 3.48 | %+ | 4.87 | %+ | 4.58 | %+ | |||||||||||||
| Ratio of Rebate from Morgan Stanley Affiliates to Average Net Assets | 0.00 | %§ | 0.00 | %§ | 0.01 | % | 0.01 | % | 0.01 | % | |||||||||||||
| Portfolio Turnover Rate | 234 | % | 261 | % | 437 | % | 306 | % | 107 | % | |||||||||||||
| (1) Supplemental Information on the Ratios to Average Net Assets: | |||||||||||||||||||||||
| Ratios Before Expense Limitation: | |||||||||||||||||||||||
| Expenses to Average Net Assets | 1.24 | %†† | 0.92 | %+†† | 0.86 | %+ | 0.78 | %+ | 0.79 | %+ | |||||||||||||
| Net Investment Income to Average Net Assets | 2.69 | %†† | 3.16 | %+†† | 3.37 | %+ | 4.84 | %+ | 4.54 | %+ | |||||||||||||
† Per share amount is based on average shares outstanding.
‡ Amount is less than $0.005 per share.
++ Calculated based on the net asset value as of the last business day of the period.
+ The Ratios of Expenses and Net Investment Income reflect the rebate of certain Portfolio expenses in connection with the investments in Morgan Stanley affiliates during the period. The effect of the rebate on the ratios is disclosed in the above table as "Ratio of Rebate from Morgan Stanley Affiliates to Average Net Assets."
†† Reflects overall Portfolio ratios for investment income and non-class specific expenses.
§ Amount is less than 0.005%.
The accompanying notes are an integral part of the financial statements.
91
2011 Annual Report
September 30, 2011
Financial Highlights
Core Plus Fixed Income Portfolio
| Class I | |||||||||||||||||||||||
| Year Ended September 30, | |||||||||||||||||||||||
| Selected Per Share Data and Ratios | 2011 | 2010 | 2009 | 2008 | 2007 | ||||||||||||||||||
| Net Asset Value, Beginning of Period | $ | 9.96 | $ | 9.41 | $ | 9.41 | $ | 11.40 | $ | 11.52 | |||||||||||||
| Income (Loss) from Investment Operations: | |||||||||||||||||||||||
| Net Investment Income† | 0.38 | 0.34 | 0.41 | 0.66 | 0.58 | ||||||||||||||||||
| Net Realized and Unrealized Gain (Loss) | (0.02 | ) | 0.57 | 0.27 | (2.10 | ) | (0.05 | ) | |||||||||||||||
| Total from Investment Operations | 0.36 | 0.91 | 0.68 | (1.44 | ) | 0.53 | |||||||||||||||||
| Distributions from and/or in Excess of: | |||||||||||||||||||||||
| Net Investment Income | (0.40 | ) | (0.36 | ) | (0.68 | ) | (0.55 | ) | (0.65 | ) | |||||||||||||
| Redemption Fees | — | — | 0.00 | ‡ | 0.00 | ‡ | 0.00 | ‡ | |||||||||||||||
| Net Asset Value, End of Period | $ | 9.92 | $ | 9.96 | $ | 9.41 | $ | 9.41 | $ | 11.40 | |||||||||||||
| Total Return++ | 3.74 | % | 10.02 | % | 7.56 | % | (13.07 | )% | 4.77 | % | |||||||||||||
| Ratios and Supplemental Data: | |||||||||||||||||||||||
| Net Assets, End of Period (Thousands) | $ | 295,226 | $ | 434,657 | $ | 797,788 | $ | 1,210,286 | $ | 2,367,043 | |||||||||||||
| Ratio of Expenses to Average Net Assets (1) | 0.66 | %+†† | 0.51 | %+†† | 0.49 | %+ | 0.45 | %+ | 0.44 | %+ | |||||||||||||
| Ratio of Net Investment Income to Average Net Assets (1) | 3.88 | %+†† | 3.53 | %+†† | 4.56 | %+ | 6.13 | %+ | 5.10 | %+ | |||||||||||||
| Ratio of Rebate from Morgan Stanley Affiliates to Average Net Assets | 0.00 | %§ | 0.01 | % | 0.00 | %§ | 0.01 | % | 0.00 | %§ | |||||||||||||
| Portfolio Turnover Rate | 225 | % | 270 | % | 402 | % | 320 | % | 139 | % | |||||||||||||
| (1) Supplemental Information on the Ratios to Average Net Assets: | |||||||||||||||||||||||
| Ratios Before Expense Limitation: | |||||||||||||||||||||||
| Expenses to Average Net Assets | N/A | N/A | 0.50 | %+ | 0.45 | %+ | N/A | ||||||||||||||||
| Net Investment Income to Average Net Assets | N/A | N/A | 4.55 | %+ | 6.13 | %+ | N/A | ||||||||||||||||
† Per share amount is based on average shares outstanding.
‡ Amount is less than $0.005 per share.
++ Calculated based on the net asset value as of the last business day of the period.
+ The Ratios of Expenses and Net Investment Income reflect the rebate of certain Portfolio expenses in connection with the investments in Morgan Stanley affiliates during the period. The effect of the rebate on the ratios is disclosed in the above table as "Ratio of Rebate from Morgan Stanley Affiliates to Average Net Assets."
†† Reflects overall Portfolio ratios for investment income and non-class specific expenses.
§ Amount is less than 0.005%.
The accompanying notes are an integral part of the financial statements.
92
2011 Annual Report
September 30, 2011
Financial Highlights
Core Plus Fixed Income Portfolio
| Class P | |||||||||||||||||||||||
| Year Ended September 30, | |||||||||||||||||||||||
| Selected Per Share Data and Ratios | 2011 | 2010 | 2009 | 2008 | 2007 | ||||||||||||||||||
| Net Asset Value, Beginning of Period | $ | 9.97 | $ | 9.40 | $ | 9.40 | $ | 11.38 | $ | 11.50 | |||||||||||||
| Income (Loss) from Investment Operations: | |||||||||||||||||||||||
| Net Investment Income† | 0.36 | 0.31 | 0.41 | 0.63 | 0.55 | ||||||||||||||||||
| Net Realized and Unrealized Gain (Loss) | (0.02 | ) | 0.57 | 0.24 | (2.09 | ) | (0.05 | ) | |||||||||||||||
| Total from Investment Operations | 0.34 | 0.88 | 0.65 | (1.46 | ) | 0.50 | |||||||||||||||||
| Distributions from and/or in Excess of: | |||||||||||||||||||||||
| Net Investment Income | (0.37 | ) | (0.31 | ) | (0.65 | ) | (0.52 | ) | (0.62 | ) | |||||||||||||
| Redemption Fees | — | — | 0.00 | ‡ | 0.00 | ‡ | 0.00 | ‡ | |||||||||||||||
| Net Asset Value, End of Period | $ | 9.94 | $ | 9.97 | $ | 9.40 | $ | 9.40 | $ | 11.38 | |||||||||||||
| Total Return++ | 3.57 | % | 9.73 | % | 7.26 | % | (13.23 | )% | 4.42 | % | |||||||||||||
| Ratios and Supplemental Data: | |||||||||||||||||||||||
| Net Assets, End of Period (Thousands) | $ | 4,654 | $ | 5,732 | $ | 6,442 | $ | 97,823 | $ | 137,733 | |||||||||||||
| Ratio of Expenses to Average Net Assets (1) | 0.91 | %+†† | 0.76 | %+†† | 0.73 | %+ | 0.70 | %+ | 0.69 | %+ | |||||||||||||
| Ratio of Net Investment Income to Average Net Assets (1) | 3.63 | %+†† | 3.28 | %+†† | 4.56 | %+ | 5.87 | %+ | 4.84 | %+ | |||||||||||||
| Ratio of Rebate from Morgan Stanley Affiliates to Average Net Assets | 0.00 | %§ | 0.01 | % | 0.00 | %§ | 0.01 | % | 0.00 | %§ | |||||||||||||
| Portfolio Turnover Rate | 225 | % | 270 | % | 402 | % | 320 | % | 139 | % | |||||||||||||
| (1) Supplemental Information on the Ratios to Average Net Assets: | |||||||||||||||||||||||
| Ratios Before Expense Limitation: | |||||||||||||||||||||||
| Expenses to Average Net Assets | N/A | N/A | N/A | 0.70 | %+ | N/A | |||||||||||||||||
| Net Investment Income to Average Net Assets | N/A | N/A | N/A | 5.87 | %+ | N/A | |||||||||||||||||
† Per share amount is based on average shares outstanding.
‡ Amount is less than $0.005 per share.
++ Calculated based on the net asset value as of the last business day of the period.
+ The Ratios of Expenses and Net Investment Income reflect the rebate of certain Portfolio expenses in connection with the investments in Morgan Stanley affiliates during the period. The effect of the rebate on the ratios is disclosed in the above table as "Ratio of Rebate from Morgan Stanley Affiliates to Average Net Assets."
†† Reflects overall Portfolio ratios for investment income and non-class specific expenses.
§ Amount is less than 0.005%.
The accompanying notes are an integral part of the financial statements.
93
2011 Annual Report
September 30, 2011
Financial Highlights
Investment Grade Fixed Income Portfolio
| Class I | |||||||||||||||||||||||
| Year Ended September 30, | |||||||||||||||||||||||
| Selected Per Share Data and Ratios | 2011 | 2010 | 2009 | 2008 | 2007 | ||||||||||||||||||
| Net Asset Value, Beginning of Period | $ | 10.17 | $ | 9.75 | $ | 9.61 | $ | 11.15 | $ | 11.22 | |||||||||||||
| Income (Loss) from Investment Operations: | |||||||||||||||||||||||
| Net Investment Income† | 0.33 | 0.33 | 0.31 | 0.55 | 0.52 | ||||||||||||||||||
| Net Realized and Unrealized Gain (Loss) | 0.07 | 0.49 | 0.38 | (1.57 | ) | 0.01 | |||||||||||||||||
| Total from Investment Operations | 0.40 | 0.82 | 0.69 | (1.02 | ) | 0.53 | |||||||||||||||||
| Distributions from and/or in Excess of: | |||||||||||||||||||||||
| Net Investment Income | (0.30 | ) | (0.40 | ) | (0.55 | ) | (0.52 | ) | (0.60 | ) | |||||||||||||
| Redemption Fees | — | — | 0.00 | ‡ | 0.00 | ‡ | 0.00 | ‡ | |||||||||||||||
| Net Asset Value, End of Period | $ | 10.27 | $ | 10.17 | $ | 9.75 | $ | 9.61 | $ | 11.15 | |||||||||||||
| Total Return++ | 4.05 | % | 8.65 | % | 7.46 | % | (9.37 | )% | 4.82 | % | |||||||||||||
| Ratios and Supplemental Data: | |||||||||||||||||||||||
| Net Assets, End of Period (Thousands) | $ | 62,410 | $ | 79,337 | $ | 140,890 | $ | 316,894 | $ | 519,504 | |||||||||||||
| Ratio of Expenses to Average Net Assets | 0.80 | %+†† | 0.76 | %+†† | 0.56 | %+ | 0.52 | %+ | 0.50 | %+ | |||||||||||||
| Ratio of Net Investment Income to Average Net Assets | 3.27 | %+†† | 3.36 | %+†† | 3.30 | %+ | 5.18 | %+ | 4.74 | %+ | |||||||||||||
| Ratio of Rebate from Morgan Stanley Affiliates to Average Net Assets | 0.00 | %§ | 0.00 | %§ | 0.01 | % | 0.01 | % | 0.00 | %§ | |||||||||||||
| Portfolio Turnover Rate | 224 | % | 277 | % | 545 | % | 325 | % | 124 | % | |||||||||||||
† Per share amount is based on average shares outstanding.
‡ Amount is less than $0.005 per share.
++ Calculated based on the net asset value as of the last business day of the period.
+ The Ratios of Expenses and Net Investment Income reflect the rebate of certain Portfolio expenses in connection with the investments in Morgan Stanley affiliates during the period. The effect of the rebate on the ratios is disclosed in the above table as "Ratio of Rebate from Morgan Stanley Affiliates to Average Net Assets."
†† Reflects overall Portfolio ratios for investment income and non-class specific expenses.
§ Amount is less than 0.005%.
The accompanying notes are an integral part of the financial statements.
94
2011 Annual Report
September 30, 2011
Financial Highlights
Investment Grade Fixed Income Portfolio
| Class P | |||||||||||||||||||||||
| Year Ended September 30, | |||||||||||||||||||||||
| Selected Per Share Data and Ratios | 2011 | 2010 | 2009 | 2008 | 2007 | ||||||||||||||||||
| Net Asset Value, Beginning of Period | $ | 10.16 | $ | 9.74 | $ | 9.60 | $ | 11.14 | $ | 11.21 | |||||||||||||
| Income (Loss) from Investment Operations: | |||||||||||||||||||||||
| Net Investment Income† | 0.31 | 0.31 | 0.30 | 0.53 | 0.51 | ||||||||||||||||||
| Net Realized and Unrealized Gain (Loss) | 0.08 | 0.49 | 0.38 | (1.57 | ) | 0.00 | ‡ | ||||||||||||||||
| Total from Investment Operations | 0.39 | 0.80 | 0.68 | (1.04 | ) | 0.51 | |||||||||||||||||
| Distributions from and/or in Excess of: | |||||||||||||||||||||||
| Net Investment Income | (0.28 | ) | (0.38 | ) | (0.54 | ) | (0.50 | ) | (0.58 | ) | |||||||||||||
| Redemption Fees | — | — | 0.00 | ‡ | 0.00 | ‡ | 0.00 | ‡ | |||||||||||||||
| Net Asset Value, End of Period | $ | 10.27 | $ | 10.16 | $ | 9.74 | $ | 9.60 | $ | 11.14 | |||||||||||||
| Total Return++ | 3.99 | % | 8.50 | % | 7.44 | % | (9.60 | )% | 4.56 | % | |||||||||||||
| Ratios and Supplemental Data: | |||||||||||||||||||||||
| Net Assets, End of Period (Thousands) | $ | 408 | $ | 590 | $ | 611 | $ | 842 | $ | 1,177 | |||||||||||||
| Ratio of Expenses to Average Net Assets (1) | 0.95 | %+†† | 0.91 | %+†† | 0.69 | %+ | 0.67 | %+ | 0.65 | %+ | |||||||||||||
| Ratio of Net Investment Income to Average Net Assets (1) | 3.12 | %+†† | 3.21 | %+†† | 3.19 | %+ | 5.01 | %+ | 4.59 | %+ | |||||||||||||
| Ratio of Rebate from Morgan Stanley Affiliates to Average Net Assets | 0.00 | %§ | 0.00 | %§ | 0.01 | % | 0.01 | % | 0.00 | %§ | |||||||||||||
| Portfolio Turnover Rate | 224 | % | 277 | % | 545 | % | 325 | % | 124 | % | |||||||||||||
| (1) Supplemental Information on the Ratios to Average Net Assets: | |||||||||||||||||||||||
| Ratios Before Expense Limitation: | |||||||||||||||||||||||
| Expenses to Average Net Assets | 1.05 | %†† | 1.01 | %+†† | 0.79 | %+ | 0.77 | %+ | 0.75 | %+ | |||||||||||||
| Net Investment Income to Average Net Assets | 3.02 | %†† | 3.11 | %+†† | 3.09 | %+ | 4.91 | %+ | 4.49 | %+ | |||||||||||||
† Per share amount is based on average shares outstanding.
‡ Amount is less than $0.005 per share.
++ Calculated based on the net asset value as of the last business day of the period.
+ The Ratios of Expenses and Net Investment Income reflect the rebate of certain Portfolio expenses in connection with the investments in Morgan Stanley affiliates during the period. The effect of the rebate on the ratios is disclosed in the above table as "Ratio of Rebate from Morgan Stanley Affiliates to Average Net Assets."
†† Reflects overall Portfolio ratios for investment income and non-class specific expenses.
§ Amount is less than 0.005%.
The accompanying notes are an integral part of the financial statements.
95
2011 Annual Report
September 30, 2011
Financial Highlights
Investment Grade Fixed Income Portfolio
| Class H | |||||||||||||||||||
| Year Ended September 30, | Period from January 2, 2008^ to | ||||||||||||||||||
| Selected Per Share Data and Ratios | 2011 | 2010 | 2009 | September 30, 2008 | |||||||||||||||
| Net Asset Value, Beginning of Period | $ | 10.16 | $ | 9.74 | $ | 9.53 | $ | 11.15 | |||||||||||
| Income (Loss) from Investment Operations: | |||||||||||||||||||
| Net Investment Income† | 0.31 | 0.31 | 0.28 | 0.21 | |||||||||||||||
| Net Realized and Unrealized Gain (Loss) | 0.07 | 0.48 | 0.39 | (1.68 | ) | ||||||||||||||
| Total from Investment Operations | 0.38 | 0.79 | 0.67 | (1.47 | ) | ||||||||||||||
| Distributions from and/or in Excess of: | |||||||||||||||||||
| Net Investment Income | (0.27 | ) | (0.37 | ) | (0.46 | ) | (0.15 | ) | |||||||||||
| Redemption Fees | — | — | 0.00 | ‡ | — | ||||||||||||||
| Net Asset Value, End of Period | $ | 10.27 | $ | 10.16 | $ | 9.74 | $ | 9.53 | |||||||||||
| Total Return++ | 3.89 | % | 8.39 | % | 7.21 | % | (13.21 | )%# | |||||||||||
| Ratios and Supplemental Data: | |||||||||||||||||||
| Net Assets, End of Period (Thousands) | $ | 473 | $ | 170 | $ | 162 | $ | 85 | |||||||||||
| Ratio of Expenses to Average Net Assets | 1.05 | %+†† | 1.01 | %+†† | 0.81 | %+ | 2.98 | %+* | |||||||||||
| Ratio of Net Investment Income to Average Net Assets | 3.02 | %+†† | 3.11 | %+†† | 2.94 | %+ | 2.71 | %+* | |||||||||||
| Ratio of Rebate from Morgan Stanley Affiliates to Average Net Assets | 0.00 | %§ | 0.00 | %§ | 0.01 | % | 0.01 | %* | |||||||||||
| Portfolio Turnover Rate | 224 | % | 277 | % | 545 | % | 325 | %# | |||||||||||
^ Commencement of Operations.
† Per share amount is based on average shares outstanding.
‡ Amount is less than $0.005 per share.
++ Calculated based on the net asset value which does not reflect sales charges, if applicable, as of the last business day of the period.
# Not Annualized.
+ The Ratios of Expenses and Net Investment Income reflect the rebate of certain Portfolio expenses in connection with the investments in Morgan Stanley affiliates during the period. The effect of the rebate on the ratios is disclosed in the above table as "Ratio of Rebate from Morgan Stanley Affiliates to Average Net Assets."
†† Reflects overall Portfolio ratios for investment income and non-class specific expenses.
* Annualized.
§ Amount is less than 0.005%.
The accompanying notes are an integral part of the financial statements.
96
2011 Annual Report
September 30, 2011
Financial Highlights
Investment Grade Fixed Income Portfolio
| Class L | |||||||||||||||||||
| Year Ended September 30, | Period from June 16, 2008^ to | ||||||||||||||||||
| Selected Per Share Data and Ratios | 2011 | 2010 | 2009 | September 30, 2008 | |||||||||||||||
| Net Asset Value, Beginning of Period | $ | 10.15 | $ | 9.74 | $ | 9.63 | $ | 10.12 | |||||||||||
| Income (Loss) from Investment Operations: | |||||||||||||||||||
| Net Investment Income† | 0.28 | 0.28 | 0.24 | 0.12 | |||||||||||||||
| Net Realized and Unrealized Gain (Loss) | 0.08 | 0.48 | 0.41 | (0.60 | ) | ||||||||||||||
| Total from Investment Operations | 0.36 | 0.76 | 0.65 | (0.48 | ) | ||||||||||||||
| Distributions from and/or in Excess of: | |||||||||||||||||||
| Net Investment Income | (0.25 | ) | (0.35 | ) | (0.54 | ) | (0.01 | ) | |||||||||||
| Redemption Fees | — | — | 0.00 | ‡ | — | ||||||||||||||
| Net Asset Value, End of Period | $ | 10.26 | $ | 10.15 | $ | 9.74 | $ | 9.63 | |||||||||||
| Total Return++ | 3.51 | % | 8.15 | % | 7.08 | % | (4.73 | )%# | |||||||||||
| Ratios and Supplemental Data: | |||||||||||||||||||
| Net Assets, End of Period (Thousands) | $ | 4,080 | $ | 5,508 | $ | 5,159 | $ | 58 | |||||||||||
| Ratio of Expenses to Average Net Assets | 1.30 | %+†† | 1.26 | %+†† | 1.06 | %+ | 1.15 | %+* | |||||||||||
| Ratio of Net Investment Income to Average Net Assets | 2.77 | %+†† | 2.86 | %+†† | 2.58 | %+ | 4.34 | %+* | |||||||||||
| Ratio of Rebate from Morgan Stanley Affiliates to Average Net Assets | 0.00 | %§ | 0.00 | %§ | 0.01 | % | 0.01 | %* | |||||||||||
| Portfolio Turnover Rate | 224 | % | 277 | % | 545 | % | 325 | %# | |||||||||||
^ Commencement of Operations.
† Per share amount is based on average shares outstanding.
‡ Amount is less than $0.005 per share.
++ Calculated based on the net asset value as of the last business day of the period.
# Not Annualized.
+ The Ratios of Expenses and Net Investment Income reflect the rebate of certain Portfolio expenses in connection with the investments in Morgan Stanley affiliates during the period. The effect of the rebate on the ratios is disclosed in the above table as "Ratio of Rebate from Morgan Stanley Affiliates to Average Net Assets."
†† Reflects overall Portfolio ratios for investment income and non-class specific expenses.
* Annualized.
§ Amount is less than 0.005%.
The accompanying notes are an integral part of the financial statements.
97
2011 Annual Report
September 30, 2011
Financial Highlights
Limited Duration Portfolio
| Class I | |||||||||||||||||||||||
| Year Ended September 30, | |||||||||||||||||||||||
| Selected Per Share Data and Ratios | 2011 | 2010 | 2009 | 2008 | 2007 | ||||||||||||||||||
| Net Asset Value, Beginning of Period | $ | 7.79 | $ | 7.68 | $ | 8.00 | $ | 10.24 | $ | 10.34 | |||||||||||||
| Income (Loss) from Investment Operations: | |||||||||||||||||||||||
| Net Investment Income† | 0.16 | 0.18 | 0.24 | 0.49 | 0.51 | ||||||||||||||||||
| Net Realized and Unrealized Gain (Loss) | (0.10 | ) | 0.10 | (0.12 | ) | (2.22 | ) | (0.08 | ) | ||||||||||||||
| Total from Investment Operations | 0.06 | 0.28 | 0.12 | (1.73 | ) | 0.43 | |||||||||||||||||
| Distributions from and/or in Excess of: | |||||||||||||||||||||||
| Net Investment Income | (0.14 | ) | (0.16 | ) | (0.44 | ) | (0.51 | ) | (0.53 | ) | |||||||||||||
| Paid-in-Capital | — | (0.01 | ) | — | — | — | |||||||||||||||||
| Total Distributions | (0.14 | ) | (0.17 | ) | (0.44 | ) | (0.51 | ) | (0.53 | ) | |||||||||||||
| Redemption Fees | — | — | 0.00 | ‡ | — | 0.00 | ‡ | ||||||||||||||||
| Net Asset Value, End of Period | $ | 7.71 | $ | 7.79 | $ | 7.68 | $ | 8.00 | $ | 10.24 | |||||||||||||
| Total Return++ | 0.71 | % | 3.74 | % | 1.77 | % | (17.57 | )% | 4.26 | % | |||||||||||||
| Ratios and Supplemental Data: | |||||||||||||||||||||||
| Net Assets, End of Period (Thousands) | $ | 167,811 | $ | 208,608 | $ | 262,794 | $ | 568,156 | $ | 1,058,151 | |||||||||||||
| Ratio of Expenses to Average Net Assets (1) | 0.59 | %+†† | 0.55 | %+†† | 0.45 | %+ | 0.43 | %+ | 0.45 | %+ | |||||||||||||
| Ratio of Net Investment Income to Average Net Assets (1) | 2.12 | %+†† | 2.39 | %+†† | 3.16 | %+ | 5.22 | %+ | 4.94 | %+ | |||||||||||||
| Ratio of Rebate from Morgan Stanley Affiliates to Average Net Assets | 0.00 | %§ | 0.00 | %§ | 0.00 | %§ | 0.01 | % | 0.00 | %§ | |||||||||||||
| Portfolio Turnover Rate | 35 | % | 95 | % | 110 | % | 20 | % | 56 | % | |||||||||||||
| (1) Supplemental Information on the Ratios to Average Net Assets: | |||||||||||||||||||||||
| Ratios Before Expense Limitation: | |||||||||||||||||||||||
| Expenses to Average Net Assets | N/A | N/A | N/A | 0.43 | %+ | N/A | |||||||||||||||||
| Net Investment Income to Average Net Assets | N/A | N/A | N/A | 5.22 | %+ | N/A | |||||||||||||||||
† Per share amount is based on average shares outstanding.
‡ Amount is less than $0.005 per share.
++ Calculated based on the net asset value as of the last business day of the period.
+ The Ratios of Expenses and Net Investment Income reflect the rebate of certain Portfolio expenses in connection with the investments in Morgan Stanley affiliates during the period. The effect of the rebate on the ratios is disclosed in the above table as "Ratio of Rebate from Morgan Stanley Affiliates to Average Net Assets."
†† Reflects overall Portfolio ratios for investment income and non-class specific expenses.
§ Amount is less than 0.005%.
The accompanying notes are an integral part of the financial statements.
98
2011 Annual Report
September 30, 2011
Financial Highlights
Limited Duration Portfolio
| Class P | |||||||||||||||||||||||
| Year Ended September 30, | Period from September 28, 2007^ to | ||||||||||||||||||||||
| Selected Per Share Data and Ratios | 2011 | 2010 | 2009 | 2008 | September 30, 2007 | ||||||||||||||||||
| Net Asset Value, Beginning of Period | $ | 7.79 | $ | 7.68 | $ | 8.00 | $ | 10.24 | $ | 10.24 | |||||||||||||
| Income (Loss) from Investment Operations: | |||||||||||||||||||||||
| Net Investment Income† | 0.15 | 0.17 | 0.22 | 0.47 | 0.00 | ‡ | |||||||||||||||||
| Net Realized and Unrealized Gain (Loss) | (0.12 | ) | 0.09 | (0.12 | ) | (2.23 | ) | (0.00 | )‡ | ||||||||||||||
| Total from Investment Operations | 0.03 | 0.26 | 0.10 | (1.76 | ) | 0.00 | ‡ | ||||||||||||||||
| Distributions from and/or in Excess of: | |||||||||||||||||||||||
| Net Investment Income | (0.11 | ) | (0.15 | ) | (0.42 | ) | (0.48 | ) | — | ||||||||||||||
| Paid-in-Capital | — | (0.00 | )‡ | — | — | — | |||||||||||||||||
| Total Distributions | (0.11 | ) | (0.15 | ) | (0.42 | ) | (0.48 | ) | — | ||||||||||||||
| Redemption Fees | — | — | 0.00 | ‡ | — | 0.00 | ‡ | ||||||||||||||||
| Net Asset Value, End of Period | $ | 7.71 | $ | 7.79 | $ | 7.68 | $ | 8.00 | $ | 10.24 | |||||||||||||
| Total Return++ | 0.45 | % | 3.48 | % | 1.52 | % | (17.77 | )% | — | ||||||||||||||
| Ratios and Supplemental Data: | |||||||||||||||||||||||
| Net Assets, End of Period (Thousands) | $ | 194 | $ | 52 | $ | 169 | $ | 294 | $ | 1,020 | |||||||||||||
| Ratio of Expenses to Average Net Assets | 0.84 | %+†† | 0.80 | %+†† | 0.70 | %+ | 0.68 | %+ | 0.59 | %+* | |||||||||||||
| Ratio of Net Investment Income to Average Net Assets | 1.87 | %+†† | 2.14 | %+†† | 2.87 | %+ | 4.95 | %+ | 5.38 | %+* | |||||||||||||
| Ratio of Rebate from Morgan Stanley Affiliates to Average Net Assets | 0.00 | %§ | 0.00 | %§ | 0.00 | %§ | 0.01 | % | 0.06 | %* | |||||||||||||
| Portfolio Turnover Rate | 35 | % | 95 | % | 110 | % | 20 | % | 56 | %# | |||||||||||||
^ Commencement of Operations.
† Per share amount is based on average shares outstanding.
‡ Amount is less than $0.005 per share.
++ Calculated based on the net asset value as of the last business day of the period.
+ The Ratios of Expenses and Net Investment Income reflect the rebate of certain Portfolio expenses in connection with the investments in Morgan Stanley affiliates during the period. The effect of the rebate on the ratios is disclosed in the above table as "Ratio of Rebate from Morgan Stanley Affiliates to Average Net Assets."
†† Reflects overall Portfolio ratios for investment income and non-class specific expenses.
* Annualized.
§ Amount is less than 0.005%.
# Not Annualized.
The accompanying notes are an integral part of the financial statements.
99
2011 Annual Report
September 30, 2011
Financial Highlights
Long Duration Fixed Income Portfolio
| Class I | |||||||||||||||||||||||
| Year Ended September 30, | |||||||||||||||||||||||
| Selected Per Share Data and Ratios | 2011 | 2010 | 2009 | 2008 | 2007 | ||||||||||||||||||
| Net Asset Value, Beginning of Period | $ | 11.73 | $ | 11.52 | $ | 9.93 | $ | 10.33 | $ | 10.48 | |||||||||||||
| Income (Loss) from Investment Operations: | |||||||||||||||||||||||
| Net Investment Income† | 0.50 | 0.55 | 0.49 | 0.46 | 0.49 | ||||||||||||||||||
| Net Realized and Unrealized Gain (Loss) | 0.66 | 0.80 | 1.66 | (0.37 | ) | (0.18 | ) | ||||||||||||||||
| Total from Investment Operations | 1.16 | 1.35 | 2.15 | 0.09 | 0.31 | ||||||||||||||||||
| Distributions from and/or in Excess of: | |||||||||||||||||||||||
| Net Investment Income | (0.46 | ) | (0.55 | ) | (0.56 | ) | (0.49 | ) | (0.43 | ) | |||||||||||||
| Net Realized Gain | (0.54 | ) | (0.59 | ) | — | — | (0.03 | ) | |||||||||||||||
| Total Distributions | (1.00 | ) | (1.14 | ) | (0.56 | ) | (0.49 | ) | (0.46 | ) | |||||||||||||
| Net Asset Value, End of Period | $ | 11.89 | $ | 11.73 | $ | 11.52 | $ | 9.93 | $ | 10.33 | |||||||||||||
| Total Return++ | 11.40 | % | 13.09 | % | 22.19 | % | 0.87 | % | 3.06 | % | |||||||||||||
| Ratios and Supplemental Data: | |||||||||||||||||||||||
| Net Assets, End of Period (Thousands) | $ | 23,660 | $ | 32,354 | $ | 31,410 | $ | 27,438 | $ | 25,297 | |||||||||||||
| Ratio of Expenses to Average Net Assets (1) | 0.50 | %+†† | 0.50 | %+†† | 0.50 | %+ | 0.49 | %+ | 0.50 | %+ | |||||||||||||
| Ratio of Net Investment Income to Average Net Assets (1) | 4.69 | %+†† | 4.98 | %+†† | 4.68 | %+ | 4.44 | %+ | 4.73 | %+ | |||||||||||||
| Ratio of Rebate from Morgan Stanley Affiliates to Average Net Assets | 0.00 | %§ | 0.00 | %§ | 0.00 | %§ | 0.01 | % | 0.00 | %§ | |||||||||||||
| Portfolio Turnover Rate | 59 | % | 90 | % | 80 | % | 63 | % | 49 | % | |||||||||||||
| (1) Supplemental Information on the Ratios to Average Net Assets: | |||||||||||||||||||||||
| Ratios Before Expense Limitation: | |||||||||||||||||||||||
| Expenses to Average Net Assets | 1.12 | %†† | 0.79 | %+†† | 0.80 | %+ | 0.75 | %+ | 0.94 | %+ | |||||||||||||
| Net Investment Income to Average Net Assets | 4.07 | %†† | 4.69 | %+†† | 4.38 | %+ | 4.18 | %+ | 4.29 | %+ | |||||||||||||
† Per share amount is based on average shares outstanding.
++ Calculated based on the net asset value as of the last business day of the period.
+ The Ratios of Expenses and Net Investment Income reflect the rebate of certain Portfolio expenses in connection with the investments in Morgan Stanley affiliates during the period. The effect of the rebate on the ratios is disclosed in the above table as "Ratio of Rebate from Morgan Stanley Affiliates to Average Net Assets."
†† Reflects overall Portfolio ratios for investment income and non-class specific expenses.
§ Amount is less than 0.005%.
The accompanying notes are an integral part of the financial statements.
100
2011 Annual Report
September 30, 2011
Financial Highlights
Long Duration Fixed Income Portfolio
| Class P | |||||||||||||||||||||||
| Year Ended September 30, | |||||||||||||||||||||||
| Selected Per Share Data and Ratios | 2011 | 2010 | 2009 | 2008 | 2007 | ||||||||||||||||||
| Net Asset Value, Beginning of Period | $ | 11.72 | $ | 11.51 | $ | 9.92 | $ | 10.32 | $ | 10.48 | |||||||||||||
| Income (Loss) from Investment Operations: | |||||||||||||||||||||||
| Net Investment Income† | 0.48 | 0.51 | 0.46 | 0.44 | 0.46 | ||||||||||||||||||
| Net Realized and Unrealized Gain (Loss) | 0.65 | 0.82 | 1.67 | (0.37 | ) | (0.19 | ) | ||||||||||||||||
| Total from Investment Operations | 1.13 | 1.33 | 2.13 | 0.07 | 0.27 | ||||||||||||||||||
| Distributions from and/or in Excess of: | |||||||||||||||||||||||
| Net Investment Income | (0.43 | ) | (0.53 | ) | (0.54 | ) | (0.47 | ) | (0.40 | ) | |||||||||||||
| Net Realized Gain | (0.54 | ) | (0.59 | ) | — | — | (0.03 | ) | |||||||||||||||
| Total Distributions | (0.97 | ) | (1.12 | ) | (0.54 | ) | (0.47 | ) | (0.43 | ) | |||||||||||||
| Net Asset Value, End of Period | $ | 11.88 | $ | 11.72 | $ | 11.51 | $ | 9.92 | $ | 10.32 | |||||||||||||
| Total Return++ | 11.13 | % | 12.81 | % | 21.91 | % | 0.61 | % | 2.72 | % | |||||||||||||
| Ratios and Supplemental Data: | |||||||||||||||||||||||
| Net Assets, End of Period (Thousands) | $ | 594 | $ | 586 | $ | 575 | $ | 496 | $ | 516 | |||||||||||||
| Ratio of Expenses to Average Net Assets (1) | 0.75 | %+†† | 0.75 | %+†† | 0.75 | %+ | 0.74 | %+ | 0.75 | %+ | |||||||||||||
| Ratio of Net Investment Income to Average Net Assets (1) | 4.44 | %+†† | 4.73 | %+†† | 4.43 | %+ | 4.18 | %+ | 4.48 | %+ | |||||||||||||
| Ratio of Rebate from Morgan Stanley Affiliates to Average Net Assets | 0.00 | %§ | 0.00 | %§ | 0.00 | %§ | 0.01 | % | 0.00 | %§ | |||||||||||||
| Portfolio Turnover Rate | 59 | % | 90 | % | 80 | % | 63 | % | 49 | % | |||||||||||||
| (1) Supplemental Information on the Ratios to Average Net Assets: | |||||||||||||||||||||||
| Ratios Before Expense Limitation: | |||||||||||||||||||||||
| Expenses to Average Net Assets | 1.37 | %†† | 1.04 | %+†† | 1.05 | %+ | 1.00 | %+ | 1.19 | %+ | |||||||||||||
| Net Investment Income to Average Net Assets | 3.82 | %†† | 4.44 | %+†† | 4.13 | %+ | 3.92 | %+ | 4.04 | %+ | |||||||||||||
† Per share amount is based on average shares outstanding.
++ Calculated based on the net asset value as of the last business day of the period.
+ The Ratios of Expenses and Net Investment Income reflect the rebate of certain Portfolio expenses in connection with the investments in Morgan Stanley affiliates during the period. The effect of the rebate on the ratios is disclosed in the above table as "Ratio of Rebate from Morgan Stanley Affiliates to Average Net Assets."
†† Reflects overall Portfolio ratios for investment income and non-class specific expenses.
§ Amount is less than 0.005%.
The accompanying notes are an integral part of the financial statements.
101
2011 Annual Report
September 30, 2011
Notes to Financial Statements
Morgan Stanley Institutional Fund Trust ("MSIFT'' or the "Fund'') is registered under the Investment Company Act of 1940, as amended (the "Act''), as an open-end management investment company. The Fund is comprised of seven separate, active portfolios (individually referred to as a "Portfolio", collectively as the "Portfolios"). All Portfolios are considered diversified for purposes of the Act.
The Fund offers up to four different classes of shares for certain Portfolios — Class I shares, Class P shares, Class H shares and Class L shares. Each class of shares has identical voting rights (except shareholders of each Class have exclusive voting rights regarding any matter relating solely to that particular Class of shares), dividend, liquidation and other rights, except each class bears different shareholder service fees as described in Note D.
The Fund has suspended offering shares of the Mid Cap Growth Portfolio to new investors. The Fund will continue to offer shares of the Portfolio to existing shareholders. The Fund may recommence offering shares of the Portfolio to new investors in the future.
The Board of Trustees of the Fund approved closing and eliminating the Investment Class of the Balanced Portfolio and the Core Plus Fixed Income Portfolio. Consequently, the Portfolios ceased offering Investment Class shares at the close of business on March 25, 2011 and share class was subsequently eliminated.
A. Significant Accounting Policies: The following significant accounting policies are in conformity with U.S. generally accepted accounting principles ("GAAP"). Such policies are consistently followed by the Portfolio in the preparation of its financial statements. U.S. GAAP may require management to make estimates and assumptions that affect the reported amounts and disclosures in the financial statements. Actual results may differ from those estimates.
1. Security Valuation: Bonds and other fixed income securities may be valued according to the broadest and most representative market. In addition, bonds and other fixed income securities may be valued on the basis of prices provided by a pricing service. The prices provided by a pricing service take into account broker dealer market price quotations for institutional size trading in similar groups of securities, security quality, maturity, coupon and other security characteristics as well as any developments related to the specific securities. Short-term debt securities purchased with remaining maturities of 60 days or less are valued at amortized cost, unless the Board of Trustees (the "Trustees") determines such valuation does not reflect the securities' market value, in which case these securities will be valued at their fair value as determined in good faith under procedures adopted by the Trustees. Equity securities listed on a U.S. exchange are valued at the latest quoted sales price on the valuation date. Equity securities listed or traded on NASDAQ, for which market quotations are available, are valued at the NASDAQ Official Closing Price. Securities listed on a foreign exchange are valued at their closing price, except as noted below. Unlisted and listed equity securities not traded on the valuation date, for which market quotations are readily available, are valued at the mean between the current bid and asked prices obtained from reputable brokers.
All other securities and investments for which market values are not readily available, including restricted securities, and those securities for which it is inappropriate to determine prices in accordance with the aforementioned procedures, are valued at fair value as determined in good faith under procedures adopted by the Trustees, although the actual calculations may be done by others. Factors considered in making this determination may include, but are not limited to, information obtained by contacting the issuer, analysts, or the appropriate stock exchange (for exchange-traded securities), analysis of the issuer's financial statements or other available documents and, if necessary, available information concerning other securities in similar circumstances.
Most foreign markets close before the New York Stock Exchange ("NYSE"). Occasionally, developments that could affect the closing prices of securities and other assets may occur between the times at which valuations of such securities are determined (that is, close of the foreign market on which the securities trade) and the close of business on the NYSE. If these developments are expected to materially affect the value of the securities, the valuations may be adjusted to reflect the estimated fair value as of the close of the NYSE, as determined in good faith under procedures established by the Trustees.
2. Foreign Currency Translation and Foreign Investments: The books and records of the Portfolios are maintained in U.S. dollars. Foreign currency amounts are translated into U.S. dollars at the bid prices of such currencies against U.S. dollars quoted by a bank. Net realized gains (losses) on foreign currency transactions represent net foreign exchange gains (losses) from foreign currency exchange contracts, disposition of foreign currencies, currency gains (losses) realized between the trade and settlement dates on securities transactions, and the difference between the amount of investment income and foreign withholding taxes recorded on the Portfolio's books and the U.S. dollar equivalent amounts actually received or paid.
102
2011 Annual Report
September 30, 2011
Notes to Financial Statements (cont'd)
Certain Portfolios' net assets include foreign denominated securities and currency. The net assets of these Portfolios are presented at the foreign exchange rates and market values at the close of the period. The Portfolios do not isolate that portion of the results of operations arising as a result of changes in the foreign exchange rates from the fluctuations arising from changes in the market prices of the securities held at period end. Similarly, the Portfolios do not isolate the effect of changes in foreign exchange rates from the fluctuations arising from changes in the market prices of securities sold during the period. Accordingly, the components of realized and unrealized foreign currency gains (losses) representing foreign exchange changes on investments is included in the reported net realized and unrealized gains (losses) on investment transactions and balances. Changes in currency exchange rates will affect the value of and investment income from such securities and currency.
Foreign security and currency transactions may involve certain considerations and risks not typically associated with those of U.S. dollar denominated transactions as a result of, among other factors, fluctuations of exchange rates in relation to the U.S. dollar, the possibility of lower levels of governmental supervision and regulation of foreign securities markets and the possibility of political or economic instability.
3. Derivatives: Certain Portfolios use derivative instruments for a variety of purposes, including hedging, risk management, portfolio management or to earn income. Derivatives are financial instruments whose value is based on the value of another underlying asset, interest rate, index or financial instrument. A derivative instrument often has risks similar to its underlying instrument and may have additional risks, including imperfect correlation between the value of the derivative and the underlying instrument, risks of default by the other party to certain transactions, magnification of losses incurred due to changes in the market value of the securities, instruments, indices or interest rates to which they relate, and risks that the transactions may not be liquid. The use of derivatives involves risks that are different from, and possibly greater than, the risks associated with other portfolio investments. Derivatives may involve the use of highly specialized instruments that require investment techniques and risk analyses different from those associated with other portfolio investments. All of a Portfolio's holdings, including derivative instruments, are marked to market each day with the change in value reflected in unrealized appreciation (depreciation). Upon disposition, a realized gain or loss is recognized.
Certain derivative transactions may give rise to a form of leverage. Leverage associated with derivative transactions may cause the Portfolios to liquidate portfolio positions when it may not be advantageous to do so to satisfy its obligations or to meet earmarking or segregation requirements, pursuant to applicable Securities and Exchange Commission rules and regulations, or may cause the Portfolios to be more volatile than if the Portfolios had not been leveraged. Although the Investment Adviser seeks to use derivatives to further the Portfolios' investment objectives, there is no assurance that the use of derivatives will achieve this result.
Following is a description of the derivative instruments and techniques that certain Portfolios used during the period and their associated risks:
Futures: A futures contract is a standardized agreement between two parties to buy or sell a specific quantity of an underlying instrument at a specific price at a specific future time. The value of a futures contract tends to increase and decrease in tandem with the value of the underlying instrument. Futures contracts are bilateral agreements, with both the purchaser and the seller equally obligated to complete the transaction. Depending on the terms of the particular contract, futures contracts are settled through either physical delivery of the underlying instrument on the settlement date or by payment of a cash settlement amount on the settlement date. During the period the futures contract is open, payments are received from or made to the broker based upon changes in the value of the contract (the variation margin). The risk of loss associated with a futures contract is in excess of the variation margin reflected as part of "Due from (to) Brokers" on the Statements of Assets and Liabilities. A decision as to whether, when and how to use futures involves the exercise of skill and judgment and even a well conceived futures transaction may be unsuccessful because of market behavior or unexpected events. In addition to the derivatives risks discussed above, the prices of futures can be highly volatile, using futures can lower total return, and the potential loss from futures can exceed a Portfolio's initial investment in such contracts.
Swaps: A swap agreement is an agreement between two parties pursuant to which the parties exchange payments at specified dates on the basis of a specified notional amount, with the payments calculated by reference to specified securities, indexes, reference rates, currencies or other instruments. Most swap agreements provide that when the period payment dates for both parties are the same, the payments are made on a net basis (i.e., the two
103
2011 Annual Report
September 30, 2011
Notes to Financial Statements (cont'd)
payment streams are netted out, with only the net amount paid by one party to the other). A Portfolio's obligations or rights under a swap agreement entered into on a net basis will generally be equal only to the net amount to be paid or received under the agreement, based on the relative values of the positions held by each counterparty. In a zero coupon interest rate swap, payment only occurs at maturity, at which time one counterparty pays the total compounded fixed rate over the life of the swap and the other pays the total compounded floating rate that would have been earned had a series of floating rate investments been rolled over through the life of the swap. Swap agreements are not entered into or traded on exchanges and there is no central clearing or guaranty function for swaps. Therefore, swaps are subject to credit risk or the risk of default or non-performance by the counterparty. Swaps could result in losses if interest rate or foreign currency exchange rates or credit quality changes are not correctly anticipated by a Portfolio or if the reference index, security or investments do not perform as expected.
When a Portfolio has an unrealized loss on a swap agreement, the Portfolio has instructed the custodian to pledge cash or liquid securities as collateral with a value approximately equal to the amount of the unrealized loss. Collateral pledges are monitored and subsequently adjusted if and when the swap valuations fluctuate. Cash collateral is included with "Due from (to) Broker" on the Statements of Assets and Liabilities. For cash collateral received, a Portfolio pays a monthly fee to the counterparty based on the effective rate for Federal Funds. This fee, when paid, is included within realized gain (loss) on swap agreements on the Statements of Operations.
A Portfolio's use of swaps may include those based on the credit of an underlying security, commonly referred to as "credit default swaps." Where a Portfolio is the buyer of a credit default swap contract, it would be entitled to receive the par (or other agreed-upon) value of a referenced debt obligation from the counterparty to the contract only in the event of a default or similar event by a third party on the debt obligation. If no default occurs, such Portfolio would have paid to the counterparty a periodic stream of payments over the term of the contract and received no benefit from the contract. When a Portfolio is the seller of a credit default swap contract, it receives the stream of payments but is obligated to pay upon default or similar event of the referenced debt obligation.
Upfront payments received or paid by a Portfolio will be reflected as an asset or liability on the Statements of Assets and Liabilities.
Foreign Currency Exchange Contracts: In connection with their investments in foreign securities, certain Portfolios also entered into contracts with banks, brokers or dealers to purchase or sell securities or foreign currencies at a future date. A foreign currency exchange contract ("currency contracts") is a negotiated agreement between the contracting parties to exchange a specified amount of currency at a specified future time at a specified rate. The rate can be higher or lower than the spot rate between the currencies that are the subject of the currency contract. Currency contracts may be used to protect against uncertainty in the level of future foreign currency exchange rates or to gain or modify exposure to a particular currency. Hedging a Portfolio's currency risks involves the risk of mismatching a Portfolio's objectives under a currency contract with the value of securities denominated in a particular currency. Furthermore, such transactions reduce or preclude the opportunity for gain if the value of the currency should move in the direction opposite to the position taken. There is an additional risk to the effect that currency contracts create exposure to currencies in which a Portfolio's securities are not denominated. Unanticipated changes in currency prices may result in poorer overall performance for a Portfolio than if it had not entered into such contracts. A currency contract is marked-to-market daily and the change in market value is recorded by the Portfolio as unrealized gain or loss. The Portfolio records realized gains (losses) when the currency contract is closed equal to the difference between the value of the currency contract at the time it was opened and the value at the time it was closed.
Financial Accounting Standards Board ("FASB") Accounting Standards CodificationTM ("ASC") "Derivatives and Hedging: Overall" ("ASC 815") is intended to improve financial reporting about derivative instruments by requiring enhanced disclosures to enable investors to better understand how and why the Portfolios use derivative instruments, how these derivative instruments are accounted for and their effects a Portfolio's financial position and results of operations.
104
2011 Annual Report
September 30, 2011
Notes to Financial Statements (cont'd)
The following table sets forth the fair value of each Portfolio's derivative contracts by primary risk exposure as of September 30, 2011.
| Primary Risk Exposure | Statements of Assets and Liabilities | Foreign Currency Exchange Contracts (000) | Futures Contracts (000)(a) | Swaps Agreements (000) | |||||||||||||||
| Balanced Portfolio: | |||||||||||||||||||
| Currency Risk | Receivables | $ | 203 | $ | — | $ | — | ||||||||||||
| Equity Risk | Receivables | — | 23 | — | |||||||||||||||
| Interest Rate Risk | Receivables | — | 7 | 143 | |||||||||||||||
| Total Receivables | $ | 203 | $ | 30 | $ | 143 | |||||||||||||
| Currency Risk | Payables | 75 | — | — | |||||||||||||||
| Equity Risk | Payables | — | 78 | — | |||||||||||||||
| Interest Rate Risk | Payables | — | 24 | 168 | |||||||||||||||
| Total Payables | $ | 75 | $ | 102 | $ | 168 | |||||||||||||
| Core Fixed Income Portfolio: | |||||||||||||||||||
| Interest Rate Risk | Receivables | $ | — | $ | — | $ | 233 | ||||||||||||
| Interest Rate Risk | Payables | $ | — | $ | 71 | $ | 439 | ||||||||||||
| Core Plus Fixed Income Portfolio: | |||||||||||||||||||
| Currency Risk | Receivables | $ | 668 | $ | — | $ | — | ||||||||||||
| Interest Rate Risk | Receivables | — | 236 | 2,313 | |||||||||||||||
| Total Receivables | $ | 668 | $ | 236 | $ | 2,313 | |||||||||||||
| Currency Risk | Payables | 656 | — | — | |||||||||||||||
| Interest Rate Risk | Payables | — | 302 | 2,782 | |||||||||||||||
| Total Payables | $ | 656 | $ | 302 | $ | 2,782 | |||||||||||||
| Investment Grade Fixed Income Portfolio: | |||||||||||||||||||
| Interest Rate Risk | Payables | $ | — | $ | 79 | $ | — | ||||||||||||
| Limited Duration Portfolio: | |||||||||||||||||||
| Interest Rate Risk | Receivables | $ | — | $ | 2 | $ | 743 | ||||||||||||
| Interest Rate Risk | Payables | $ | — | $ | 19 | $ | 1,271 | ||||||||||||
| Long Duration Fixed Income Portfolio: | |||||||||||||||||||
| Currency Risk | Receivables | $ | 10 | $ | — | $ | — | ||||||||||||
| Interest Rate Risk | Receivables | — | 26 | 261 | |||||||||||||||
| Total Receivables | $ | 10 | $ | 26 | $ | 261 | |||||||||||||
| Currency Risk | Payables | 14 | — | — | |||||||||||||||
| Interest Rate Risk | Payables | — | 2 | 378 | |||||||||||||||
| Total Payables | $ | 14 | $ | 2 | $ | 378 | |||||||||||||
(a) This amount represents the cumulative appreciation (depreciation) of futures contracts as reported in the Portfolio of Investments. The Statements of Assets and Liabilities only reflect the current day variation margin, receivable/payable to brokers.
The following tables set forth by primary risk exposure the Portfolio's realized gains (losses) and change in unrealized appreciation (depreciation) by type of derivative contract for the year ended September 30, 2011 in accordance with ASC 815.
| Realized Gain (Loss) | |||||||||||||||
| Portfolio | Primary Risk Exposure | Derivative Type | Value (000) | ||||||||||||
| Balanced Portfolio | Foreign Currency | ||||||||||||||
| Currency Risk | Exchange Contracts | $ | 23 | ||||||||||||
| Equity Risk | Futures Contracts | 277 | |||||||||||||
| Interest Rate Risk | Futures Contracts | (70 | ) | ||||||||||||
| Interest Rate Risk | Swap Agreements | (138 | ) | ||||||||||||
| Total | $ | 92 | |||||||||||||
| Change in Unrealized Appreciation (Depreciation) | |||||||||||||||
| Portfolio | Primary Risk Exposure | Derivative Type | Value (000) | ||||||||||||
| Balanced Portfolio | Foreign Currency | ||||||||||||||
| Currency Risk | Exchange Contracts | $ | 132 | ||||||||||||
| Equity Risk | Futures Contracts | (128 | ) | ||||||||||||
| Interest Rate Risk | Futures Contracts | (16 | ) | ||||||||||||
| Interest Rate Risk | Swap Agreements | 106 | |||||||||||||
| Total | $ | 94 | |||||||||||||
| Realized Gain (Loss) | |||||||||||||||
| Portfolio | Primary Risk Exposure | Derivative Type | Value (000) | ||||||||||||
| Core Fixed Income Portfolio | Interest Rate Risk | Futures Contracts | $ | 38 | |||||||||||
| Interest Rate Risk | Swap Agreements | (1,023 | ) | ||||||||||||
| Credit Risk | Swap Agreements | (52 | ) | ||||||||||||
| Total | $ | (1,037 | ) | ||||||||||||
| Change in Unrealized Appreciation (Depreciation) | |||||||||||||||
| Portfolio | Primary Risk Exposure | Derivative Type | Value (000) | ||||||||||||
| Core Fixed Income Portfolio | Interest Rate Risk | Futures Contracts | $ | (96 | ) | ||||||||||
| Interest Rate Risk | Swap Agreements | 995 | |||||||||||||
| Credit Risk | Swap Agreements | 49 | |||||||||||||
| Total | $ | 948 | |||||||||||||
| Realized Gain (Loss) | |||||||||||||||
| Portfolio | Primary Risk Exposure | Derivative Type | Value (000) | ||||||||||||
| Core Plus Fixed Income | Foreign Currency | ||||||||||||||
| Portfolio | Currency Risk | Exchange Contracts | $ | (325 | ) | ||||||||||
| Interest Rate Risk | Futures Contracts | 1,802 | |||||||||||||
| Interest Rate Risk | Swap Agreements | (5,179 | ) | ||||||||||||
| Credit Risk | Swap Agreements | (281 | ) | ||||||||||||
| Total | $ | (3,983 | ) | ||||||||||||
| Change in Unrealized Appreciation (Depreciation) | |||||||||||||||
| Portfolio | Primary Risk Exposure | Derivative Type | Value (000) | ||||||||||||
| Core Plus Fixed Income | Foreign Currency | ||||||||||||||
| Portfolio | Currency Risk | Exchange Contracts | $ | 12 | |||||||||||
| Interest Rate Risk | Futures Contracts | (334 | ) | ||||||||||||
| Interest Rate Risk | Swap Agreements | 5,128 | |||||||||||||
| Credit Risk | Swap Agreements | 263 | |||||||||||||
| Total | $ | 5,069 | |||||||||||||
| Realized Gain (Loss) | |||||||||||||||
| Portfolio | Primary Risk Exposure | Derivative Type | Value (000) | ||||||||||||
| Investment Grade Fixed | |||||||||||||||
| Income Portfolio | Interest Rate Risk | Futures Contracts | $ | (184 | ) | ||||||||||
| Interest Rate Risk | Swap Agreements | (1,211 | ) | ||||||||||||
| Credit Risk | Swap Agreements | (55 | ) | ||||||||||||
| Total | $ | (1,450 | ) | ||||||||||||
| Change in Unrealized Appreciation (Depreciation) | |||||||||||||||
| Portfolio | Primary Risk Exposure | Derivative Type | Value (000) | ||||||||||||
| Investment Grade Fixed | |||||||||||||||
| Income Portfolio | Interest Rate Risk | Futures Contracts | $ | (89 | ) | ||||||||||
| Interest Rate Risk | Swap Agreements | 1,064 | |||||||||||||
| Credit Risk | Swap Agreements | 53 | |||||||||||||
| Total | $ | 1,028 | |||||||||||||
105
2011 Annual Report
September 30, 2011
Notes to Financial Statements (cont'd)
| Realized Gain (Loss) | |||||||||||||||
| Portfolio | Primary Risk Exposure | Derivative Type | Value (000) | ||||||||||||
| Limited Duration Portfolio | Interest Rate Risk | Futures Contracts | $ | (298 | ) | ||||||||||
| Interest Rate Risk | Swap Agreements | (3,029 | ) | ||||||||||||
| Total | $ | (3,327 | ) | ||||||||||||
| Change in Unrealized Appreciation (Depreciation) | |||||||||||||||
| Portfolio | Primary Risk Exposure | Derivative Type | Value (000) | ||||||||||||
| Limited Duration Portfolio | Interest Rate Risk | Futures Contracts | $ | (56 | ) | ||||||||||
| Interest Rate Risk | Swap Agreements | 2,687 | |||||||||||||
| Total | $ | 2,631 | |||||||||||||
| Realized Gain (Loss) | |||||||||||||||
| Portfolio | Primary Risk Exposure | Derivative Type | Value (000) | ||||||||||||
| Long Duration Fixed Income | Foreign Currency | ||||||||||||||
| Portfolio | Currency Risk | Exchange Contracts | $ | (1 | ) | ||||||||||
| Interest Rate Risk | Futures Contracts | (9 | ) | ||||||||||||
| Interest Rate Risk | Swap Agreements | (244 | ) | ||||||||||||
| Total | $ | (254 | ) | ||||||||||||
| Change in Unrealized Appreciation (Depreciation) | |||||||||||||||
| Portfolio | Primary Risk Exposure | Derivative Type | Value (000) | ||||||||||||
| Long Duration Fixed Income | Foreign Currency | ||||||||||||||
| Portfolio | Currency Risk | Exchange Contracts | $ | (4 | ) | ||||||||||
| Interest Rate Risk | Futures Contracts | 34 | |||||||||||||
| Interest Rate Risk | Swap Agreements | 258 | |||||||||||||
| Total | $ | 288 | |||||||||||||
For the year ended September 30, 2011, Balanced, Core Plus Fixed Income and Long Duration Fixed Income Portfolio's average monthly principal amount of foreign exchange contracts was approximately $5,247,000, $10,378,000 and $174,000, average monthly original value of futures contracts was approximately $11,866,000, $105,396,000, and $5,428,000, and average monthly notional value of swap agreements was approximately $13,084,000, $296,269,000 and $21,580,000, respectively. Core Fixed Income, Investment Grade Fixed Income and Limited Duration Portfolio's average monthly original value of futures contracts was approximately $14,960,000, $19,175,000, and $32,813,000 and average monthly notional value of swap agreements was approximately $19,577,000, $18,015,000, and $49,737,000, respectively.
4. When-Issued/Delayed Delivery Securities: Certain Portfolios purchase and sell when-issued and delayed delivery securities. Securities purchased on a when-issued or delayed delivery basis are purchased for delivery beyond the normal settlement date at a stated price and yield, and no income accrues to the Portfolio on such securities prior to delivery. Payment and delivery for when-issued and delayed delivery securities can take place up to 120 days after the date of the transaction. When a Portfolio enters into a purchase transaction on a when-issued or delayed delivery basis, it establishes either a segregated account in which it maintains liquid assets in an amount at least equal in value to the Portfolio's commitments to purchase such securities or designates such assets as segregated on the Portfolio's records. Purchasing securities on a when-issued or delayed delivery basis may involve a risk that the market price at the time of delivery may be lower than the agreed upon purchase price, in which case there could be an unrealized loss at the time of delivery. Purchasing investments on a when-issued or delayed delivery basis may be considered a form of leverage which may increase the impact that gains (losses) may have on the Portfolio.
5. Fair Value Measurement: FASB ASC 820, "Fair Value Measurements and Disclosures" ("ASC 820"), defines fair value as the value that the Fund would receive to sell an investment or pay to transfer a liability in a timely transaction with an independent buyer in the principal market, or in the absence of a principal market the most advantageous market for the investment or liability. ASC 820 establishes a three-tier hierarchy to distinguish between (1) inputs that reflect the assumptions market participants would use in valuing an asset or liability developed based on market data obtained from sources independent of the reporting entity (observable inputs) and (2) inputs that reflect the reporting entity's own assumptions about the assumptions market participants would use in valuing an asset or liability developed based on the best information available in the circumstances (unobservable inputs) and to establish classification of fair value measurements for disclosure purposes. Various inputs are used in determining the value of the Fund's investments. The inputs are summarized in the three broad levels listed below.
• Level 1 – unadjusted quoted prices in active markets for identical investments
• Level 2 – other significant observable inputs (including quoted prices for similar investments, interest rates, prepayment speeds, credit risk, etc.)
• Level 3 – significant unobservable inputs including the Fund's own assumptions in determining the fair value of investments. Factors considered in making this determination may include, but are not limited to, information obtained by contacting the issuer, analysts, or the appropriate stock exchange (for exchange-traded securities), analysis of the issuer's financial statements or other available documents and, if necessary, available information concerning other securities in similar circumstances
106
2011 Annual Report
September 30, 2011
Notes to Financial Statements (cont'd)
The inputs or methodology used for valuing securities are not necessarily an indication of the risk associated with investing in those securities and the determination of the significance of a particular input to the fair value measurement in its entirety requires judgment and considers factors specific to each security.
In May 2011, FASB issued Accounting Standards Update ("ASU") 2011-04. The amendments in this update are the results of the work of FASB and the International Accounting Standards Board to develop common requirements for measuring fair value and for disclosing information about fair value measurements, which are effective during interim and annual periods beginning after December 15, 2011. Consequently, these amendments improve the comparability of fair value measurements presented and disclosed in the financial statements prepared in accordance with U.S. GAAP and International Financial Reporting Standards. At this time, the Fund's management is evaluating the implications of ASU 2011-04.
6. Indemnifications: The Fund enters into contracts that contain a variety of indemnifications. The Fund's maximum exposure under these arrangements is unknown. However, the Fund has not had prior claims or losses pursuant to these contracts and expects the risk of loss to be remote.
7. Other: Security transactions are accounted for on the date the securities are purchased or sold for financial reporting purposes. Realized gains (losses) on the sale of investment securities are determined on the specific identified cost basis. Dividend income and distributions are recorded on the ex-dividend date (except for certain foreign dividends which may be recorded as soon as the Fund is informed of such dividends) net of applicable withholding taxes. Interest income is recognized on the accrual basis except where collection is in doubt. Discounts and premiums on securities purchased are amortized according to the effective yield method over their respective lives. Most expenses of the Fund can be directly attributed to a particular Portfolio. Expenses which cannot be directly attributed are apportioned among the Portfolios based upon relative net assets or other appropriate measures. Income, expenses (other than class specific expenses) and realized and unrealized gains or losses are allocated to each class of shares based upon their relative net assets
B. Investment Advisory Fees: Morgan Stanley Investment Management Inc. (the "Adviser" or "MS Investment Management") a wholly-owned subsidiary of Morgan Stanley, performs investment advisory services under the terms of an Investment Advisory Agreement, paid quarterly, at the annual rates listed below, to each Portfolio's average daily net assets.
| Portfolio | Average Daily Net Assets | Advisory Fee | |||||||||
| Balanced | 0.450 | % | |||||||||
| Mid Cap Growth | 0.500 | ||||||||||
| Core Fixed Income | 0.375 | ||||||||||
| Core Plus Fixed Income | first $1 billion | 0.375 | |||||||||
| over $1 billion | 0.300 | ||||||||||
| Investment Grade Fixed Income | 0.375 | ||||||||||
| Limited Duration | 0.300 | ||||||||||
| Long Duration Fixed Income | 0.375 | ||||||||||
With respect to certain portfolios, the Adviser has agreed to reduce the fees payable to it and, if necessary, reimburse the Portfolio for certain expenses, after giving effect to custody fee offsets, so that annual operating expenses will not exceed expense limitations established for each class of shares as presented in the table below.
| Expense Limitations | |||||||||||
| Portfolio | Class I | Class P | |||||||||
| Core Fixed Income | 0.50 | % | 0.75 | % | |||||||
| Long Duration Fixed Income | 0.50 | % | 0.75 | % | |||||||
The fee waivers and/or expense reimbursements are expected to continue (such that the Total Annual Portfolio Operating Expenses After Fee Waivers and/or Expense Reimbursements do not exceed those amounts listed above) for one year or until such time that the Fund's Board of Trustees acts to discontinue all or a portion of such waivers and/or reimbursements when it deems such action is appropriate. For the year ended September 30, 2011, the Portfolios had advisory fees waived and/or certain expenses reimbursed as follows:
| Portfolio | Adivsory Fees Waived and/or Reimbursed (000) | ||||||
| Core Fixed Income | $ | 336 | |||||
| Long Duration Fixed Income | 155 | ||||||
C. Administration Fees: MS Investment Management (the "Administrator") also provides the Fund with administrative services pursuant to an administration agreement for an annual fee, accrued daily and paid monthly, of 0.08% of each Portfolio's average daily net assets.
Under a Sub-Administration Agreement between the Administrator and State Street Bank and Trust Company ("State Street"), State Street provides certain administrative services to the Fund. For such services, the Administrator pays State Street a portion of the fee the Administrator receives from the Fund.
D. Distribution and Shareholder Servicing Fees: Morgan Stanley Distribution, Inc. ("MSDI" or the "Distributor"), a wholly-owned subsidiary of the Adviser, serves as the distributor of the Fund.
Pursuant to a Shareholder Service Plan, each Portfolio may pay the Distributor a shareholder servicing fee, accrued daily and paid monthly, at an annual rate of up to 0.15% of the Portfolio's average daily net assets attributable to Investment
107
2011 Annual Report
September 30, 2011
Notes to Financial Statements (cont'd)
Class shares. Pursuant to a Shareholder Service Plan, each Portfolio may pay the Distributor and other affiliated and unaffiliated broker-dealers, financial institutions and/or intermediaries a service fee, accrued daily and paid monthly, at an annual rate of up to 0.25% of the Portfolio's average daily net assets attributable to Class P and Class H shares, respectively. The shareholder servicing fee is used to support the expenses associated with servicing and maintaining accounts. The Distributor has voluntarily agreed to waive 0.10% of the 0.25% shareholder servicing fee it is entitled to receive from the Class P shares' average daily net assets for the Investment Grade Fixed Income Portfolio. On March 25, 2011, the Balanced Portfolio and Core Plus Fixed Income Portfolio ceased offering the Investment Class.
In addition, the Fund has adopted a Distribution and Shareholder Services Plan with respect to Class L shares pursuant to Rule 12b-1 under the Act. Under the Distribution and Shareholder Services Plan, each applicable Portfolio pays the Distributor a distribution fee, accrued daily and paid monthly, at an annual rate of 0.25% and a shareholder service fee, accrued daily and paid monthly, at an annual rate of 0.25% of the Portfolio's average daily net assets attributable to Class L shares.
The distribution and shareholder servicing fees are used to support the expenses associated with servicing and maintaining accounts. The Distributor may compensate other parties for providing shareholder support services to investors who purchase Class P, Class H and Class L shares.
E. Dividend Disbursing and Transfer Agent: The Fund's dividend disbursing and transfer agent is Morgan Stanley Services Company Inc. ("Morgan Stanley Services"). Pursuant to a transfer agency agreement, the Fund pays Morgan Stanley Services a fee based on the number of classes, accounts and transactions relating to the Portfolios of the Fund.
F. Custodian Fees: State Street (the "Custodian") serves as Custodian for the Fund in accordance with a custodian agreement. The Custodian holds cash, securities, and other assets of the Fund as required by the Act.
The Fund has entered into an arrangement with its Custodian whereby credits realized on uninvested cash balances were used to offset a portion of each Portfolio's expenses. If applicable, these custodian credits are shown as "Expense Offset" in the Statements of Operations.
G. Portfolio Investment Activity:
1. Security Transactions: During the year ended September 30, 2011, purchases and sales of investment securities, other than long-term U.S. Government securities and short-term investments, were:
| Portfolio | Purchases (000) | Sales (000) | |||||||||
| Balanced | $ | 29,439 | $ | 31,751 | |||||||
| Mid Cap Growth | 3,188,739 | 2,334,082 | |||||||||
| Core Fixed Income | 13,614 | 16,654 | |||||||||
| Core Plus Fixed Income | 123,362 | 238,820 | |||||||||
| Investment Grade Fixed Income | 16,570 | 18,678 | |||||||||
| Limited Duration | 53,462 | 75,229 | |||||||||
| Long Duration Fixed Income | 958 | 6,584 | |||||||||
During the year ended September 30, 2011, purchases and sales of long-term U.S. government securities were:
| Portfolio | Purchases (000) | Sales (000) | |||||||||
| Balanced | $ | 39,292 | $ | 38,951 | |||||||
| Core Fixed Income | 145,915 | 155,464 | |||||||||
| Core Plus Fixed Income | 691,133 | 815,386 | |||||||||
| Investment Grade Fixed Income | 152,793 | 170,851 | |||||||||
| Limited Duration | 10,460 | 26,910 | |||||||||
| Long Duration Fixed Income | 13,655 | 17,597 | |||||||||
2. Transactions with Affiliates: The Portfolios invest in the Institutional Class of portfolios within the Morgan Stanley Institutional Liquidity Funds (the "Liquidity Funds"), an open-end management investment company managed by the Adviser, both directly, and as a portion of the securities held as collateral on loaned securities. A summary of the Portfolio's transactions in shares of the Liquidity Funds during the year ended September 30, 2011 is as follows:
| Portfolio | Value September 30, 2010 (000) | Purchases at Cost (000) | Sales (000) | Dividend Income (000) | Value September 30, 2011 (000) | ||||||||||||||||||
| Balanced | $ | 13,223 | $ | 23,937 | $ | 33,204 | $ | 7 | $ | 3,956 | |||||||||||||
| Mid Cap Growth | 359,619 | 2,087,765 | 2,166,630 | 532 | 280,754 | ||||||||||||||||||
| Core Fixed Income | 13,668 | 51,846 | 62,434 | 2 | 3,080 | ||||||||||||||||||
| Core Plus Fixed Income | 29,017 | 390,371 | 402,142 | 20 | 17,246 | ||||||||||||||||||
| Investment Grade Fixed Income | 10,754 | 60,211 | 66,824 | 3 | 4,141 | ||||||||||||||||||
| Limited Duration | 2,778 | 54,271 | 51,203 | 4 | 5,846 | ||||||||||||||||||
| Long Duration Fixed Income | 323 | 14,338 | 14,025 | 1 | 636 | ||||||||||||||||||
Investment Advisory fees paid by the Portfolios are reduced by an amount equal to its pro-rata share of the advisory and administration fees paid by the Portfolios due to its investment in the Liquidity Funds ("Rebate"). For the year ended September 30, 2011, advisory fees paid were reduced as follows:
| Portfolio | Rebate (000) | ||||||
| Balanced | $ | 6 | |||||
| Mid Cap Growth | 456 | ||||||
| Core Fixed Income | 2 | ||||||
| Core Plus Fixed Income | 18 | ||||||
| Investment Grade Fixed Income | 3 | ||||||
| Limited Duration | 3 | ||||||
| Long Duration Fixed Income | 1 | ||||||
108
2011 Annual Report
September 30, 2011
Notes to Financial Statements (cont'd)
The Balanced Portfolio invests in Morgan Stanley Institutional Fund, Inc. — Emerging Markets Portfolio ("Emerging Markets Portfolio"), an open-end management investment company advised by an affiliate of the Adviser. Investment Advisory fees paid by the Portfolio are reduced by an amount equal to its pro-rata share of the advisory and administration fees paid by the Emerging Markets Portfolio. For the year ended September 30, 2011, advisory fees paid were reduced by approximately $1,000 relating to the Portfolio's investment in the Emerging Markets Portfolio. The Emerging Markets Portfolio has a cost basis of approximately $118,000 at September 30, 2011.
A summary of the Balanced Portfolio's transactions in shares of the Emerging Markets Portfolio during the year ended September 30, 2011 is as follows:
| Value September 30, 2010 (000) | Purchases at Cost (000) | Sales (000) | Realized Gain/Loss (000) | Dividend Income (000) | Value September 30, 2011 (000) | ||||||||||||||||||
| $ | — | $ | 118 | $ | — | $ | — | $ | — | $ | 93 | ||||||||||||
For the year ended September 30, 2011, the following Portfolios invest in Citigroup, Inc., and its affiliated broker/dealers which may be deemed affiliates of the Adviser, Administrator and Distributor under Section 17 of the Act.
| Portfolio | Value September 30, 2010 (000) | Purchases at Cost (000) | Sales (000) | Realized Gain/Loss (000) | Interest Income (000) | Value September 30, 2011 (000) | |||||||||||||||||||||
| Balanced | $ | 443 | $ | 301 | $ | 182 | $ | 28 | $ | 17 | $ | 451 | |||||||||||||||
| Core Fixed Income | 1,307 | — | 850 | 269 | 55 | 456 | |||||||||||||||||||||
| Core Plus Fixed Income | 8,990 | 1,741 | 7,038 | 1,698 | 248 | 3,518 | |||||||||||||||||||||
| Investment Grade Fixed Income | 2,153 | — | 1,098 | 346 | 95 | 1,047 | |||||||||||||||||||||
| Limited Duration | 4,030 | 1,434 | 2,003 | 74 | 111 | 3,413 | |||||||||||||||||||||
| Long Duration Fixed Income | 404 | �� | — | 144 | 31 | 17 | 251 | ||||||||||||||||||||
During the year ended September 30, 2011, the following Portfolio incurred brokerage commissions with Morgan Stanley & Co., LLC, an affiliate of the Adviser, Administrator and Distributor, for portfolio transactions executed on behalf of the Portfolio:
| Portfolio | Broker Commissions (000) | ||||||
| Mid Cap Growth | $ | 28 | |||||
During the year ended September 30, 2011, the following Portfolios paid brokerage commissions with Citigroup, Inc. and its affiliated broker/dealers, which may be deemed affiliates of the Adviser, Administrator and Distributor under Section 17 of the Act:
| Portfolio | Broker Commissions (000) | ||||||
| Balanced | $ | 3 | |||||
| Mid Cap Growth | 30 | ||||||
H. Securities Lending: Certain Portfolios lend securities to qualified financial institutions, such as broker-dealers, to earn additional income. Any increase or decrease in the fair value of the securities loaned that might occur and any interest earned or dividends declared on those securities during the term of the loan would remain in the Portfolio. Portfolios that lend securities receive cash or securities as collateral in an amount equal to or exceeding 100% of the current fair value of the loaned securities. The collateral is marked to market daily, by the securities lending agent, to ensure that a minimum of 100% collateral coverage is maintained.
Based on pre-established guidelines, the securities lending agent invests any cash collateral that is received in an affiliated money market portfolio and repurchase agreements. Securities lending income is generated from the earnings on the invested collateral and borrowing fees, less any rebates owed to the borrowers and compensation to the lending agent, and is recorded as "Income from Securities Loaned — Net" in the Portfolios' Statements of Operations. Risks in securities lending transactions are that a borrower may not provide additional collateral when required or return the securities when due, and that the value of the short-term investments will be less than the amount of cash collateral plus any rebate that is required to be returned to the borrower.
The value of the loaned securities and related collateral outstanding at September 30, 2011 were as follows:
| Portfolio | Value of Loaned Securities (000) | Value of Cash Collateral* (000) | Value of Non-Cash Collateral** (000) | Uninvested Cash Collateral (000) | |||||||||||||||
| Balanced | $ | 2,122 | $ | 1,886 | $ | 301 | — | @ | |||||||||||
| Core Fixed Income | 509 | 516 | — | — | @ | ||||||||||||||
| Core Plus Fixed Income | 3,721 | 3,793 | — | — | @ | ||||||||||||||
| Investment Grade Fixed Income | 961 | 980 | — | — | @ | ||||||||||||||
@ Amount is less than $500.
* The Portfolios invest cash collateral received in Repurchase Agreements and the Morgan Stanley Institutional Liquidity Fund as reported in the Portfolios of Investments.
** The Portfolio received non-cash collateral in the form of U.S. Government Agencies and Obligations, which the Portfolio cannot sell or repledge and, accordingly, are not reflected in the Portfolio of Investments.
I. Federal Income Taxes: It is each Portfolio's intention to continue to qualify as a regulated investment company and distribute all of its taxable income. Accordingly, no provision for Federal income taxes is required in the financial statements.
109
2011 Annual Report
September 30, 2011
Notes to Financial Statements (cont'd)
Dividend income and distributions to shareholders are recorded on the ex-dividend date. Interest income is recognized on the accrual basis. Dividends from net investment income, if any, are declared and paid quarterly except for those of the Limited Duration Portfolio which are declared and paid monthly and those of the Mid Cap Growth Portfolio, which are declared and paid annually. Net realized capital gains, if any, are distributed at least annually.
A Portfolio may be subject to taxes imposed by countries in which it invests. Such taxes are generally based on income and/or capital gains earned or repatriated. Taxes are accrued based on net investment income, net realized gains and net unrealized appreciation as such income and/or gains are earned. Taxes may also be based on transactions in foreign currency and are accrued based on the value of investments denominated in such currency.
FASB ASC 740-10 "Income Taxes — Overall" sets forth a minimum threshold for financial statement recognition of the benefit of a tax position taken or expected to be taken in a tax return. Management has concluded there are no significant uncertain tax positions that would require recognition in the financial statements. If applicable, the Portfolios recognize interest accrued related to unrecognized tax benefits in "Interest Expense" and penalties in "Other Expenses" on the Statements of Operations. The Portfolios file tax returns with the U.S. Internal Revenue Service, New York and various states. Generally, each of the tax years in the four-year period ended September 30, 2011, remains subject to examination by taxing authorities.
The tax character of distributions paid may differ from the character of distributions shown on the Statements of Changes in Net Assets due to short-term capital gains being treated as ordinary income for tax purposes. The tax character of distributions paid during fiscal 2011 and 2010 was as follows:
| 2011 Distributions Paid From: | 2010 Distributions Paid From: | ||||||||||||||||||||||||||
| Portfolio | Ordinary Income (000) | Long- term Capital Gain (000) | Paid-in Capital (000) | Ordinary Income (000) | Long- term Capital Gain (000) | Paid-in Capital (000) | |||||||||||||||||||||
| Balanced | $ | 685 | $ | — | $ | — | $ | 918 | $ | — | $ | — | |||||||||||||||
| Mid Cap Growth | 8,346 | 4,087 | — | 492 | — | — | |||||||||||||||||||||
| Core Fixed Income | 2,135 | — | — | 2,896 | — | — | |||||||||||||||||||||
| Core Plus Fixed Income | 16,358 | — | — | 30,975 | — | — | |||||||||||||||||||||
| Investment Grade Fixed Income | 2,333 | — | — | 4,183 | — | — | |||||||||||||||||||||
| Limited Duration | 3,270 | — | — | 5,288 | — | 161 | |||||||||||||||||||||
| Long Duration Fixed Income | 1,794 | 839 | — | 1,544 | 1,642 | — | |||||||||||||||||||||
The amount and character of income and gains to be distributed are determined in accordance with income tax regulations which may differ from U.S. GAAP. These book/tax differences are either considered temporary or permanent in nature.
Temporary differences are attributable to differing book and tax treatments for the timing of the recognition of gains (losses) on certain investment transactions and the timing of the deductibility of certain expenses.
Permanent differences, primarily due to differing treatments of gains (losses) related to foreign currency transactions, foreign futures transactions, basis adjustments for swap transactions, net operating losses, distribution redesignations, nondeductible expenses, paydown adjustments and expiration of capital loss carryforwards, resulted in the following reclassifications among the components of net assets at September 30, 2011:
| Portfolio | Accumulated Undistributed (Distributions in Excess of) Net Investment Income (Loss) (000) | Accumulated Net Realized Gain (Loss) (000) | Paid-in-Capital (000) | ||||||||||||
| Balanced | $ | 71 | $ | 3,291 | $ | (3,362 | ) | ||||||||
| Mid Cap Growth | 2,968 | 423 | (3,391 | ) | |||||||||||
| Core Fixed Income | 209 | (158 | ) | (51 | ) | ||||||||||
| Core Plus Fixed Income | 2,598 | 18,557 | (21,155 | ) | |||||||||||
| Investment Grade Fixed Income | 214 | (214 | ) | — | @ | ||||||||||
| Limited Duration | 118 | (107 | ) | (11 | ) | ||||||||||
| Long Duration Fixed Income | (26 | ) | 26 | — | @ | ||||||||||
@ Amount is less than $500
At September 30, 2011, the components of distributable earnings on a tax basis were as follows:
| Portfolio | Undistributed Ordinary Income (000) | Undistributed Long-term Capital Gain (000) | |||||||||
| Balanced | $ | 446 | $ | — | |||||||
| Mid Cap Growth | — | 310,861 | |||||||||
| Core Fixed Income | 976 | — | |||||||||
| Core Plus Fixed Income | 6,494 | — | |||||||||
| Investment Grade Fixed Income | 917 | — | |||||||||
| Limited Duration | 825 | — | |||||||||
| Long Duration Fixed Income | 338 | 371 | |||||||||
110
2011 Annual Report
September 30, 2011
Notes to Financial Statements (cont'd)
At September 30, 2011, cost, unrealized appreciation, unrealized depreciation, and net unrealized appreciation (depreciation) for U.S. Federal income tax purposes of the investments of each of the Portfolios were:
| Portfolio | Cost (000) | Appreciation (000) | Depreciation (000) | Net Appreciation (Depreciation) (000) | |||||||||||||||
| Balanced | $ | 47,137 | $ | 2,531 | $ | (5,319 | ) | $ | (2,788 | ) | |||||||||
| Mid Cap Growth | 6,368,301 | 793,164 | (751,376 | ) | 41,788 | ||||||||||||||
| Core Fixed Income | 64,029 | 2,599 | (625 | ) | 1,974 | ||||||||||||||
| Core Plus Fixed Income | 303,544 | 30,909 | (34,171 | ) | (3,262 | ) | |||||||||||||
| Investment Grade Fixed Income | 66,175 | 3,276 | (558 | ) | 2,718 | ||||||||||||||
| Limited Duration | �� | 166,591 | 2,523 | (953 | ) | 1,570 | |||||||||||||
| Long Duration Fixed Income | 20,575 | 3,591 | (84 | ) | 3,507 | ||||||||||||||
At September 30, 2011, the following Portfolios had for Federal income tax purposes unused capital losses, which will expire on the indicated dates:
| Expiration Date September 30, | |||||||||||||||||||
| Portfolio | 2012 (000) | 2013 (000) | 2014 (000) | 2015 (000) | |||||||||||||||
| Balanced | $ | — | $ | — | $ | — | $ | — | |||||||||||
| Core Fixed Income | — | — | — | — | |||||||||||||||
| Core Plus Fixed Income | — | — | 7,135 | 15,680 | |||||||||||||||
| Investment Grade Fixed Income | — | — | — | — | |||||||||||||||
| Limited Duration | — | 8,019 | 8,229 | 7,068 | |||||||||||||||
| Expiration Date September 30, | |||||||||||||||||||||||
| Portfolio | 2016 (000) | 2017 (000) | 2018 (000) | 2019 (000) | Total (000) | ||||||||||||||||||
| Balanced | $ | — | $ | 3,501 | $ | 2,441 | $ | — | $ | 5,942 | |||||||||||||
| Core Fixed Income | 196 | 35,829 | 3,319 | — | 39,344 | ||||||||||||||||||
| Core Plus Fixed Income | 5,336 | 254,264 | 201,462 | — | 483,877 | ||||||||||||||||||
| Investment Grade Fixed Income | 2,526 | 51,893 | 8,130 | — | 62,549 | ||||||||||||||||||
| Limited Duration | 265 | 200,864 | 33,504 | — | 257,949 | ||||||||||||||||||
During the year ended September 30, 2011, the following Portfolios expired capital loss carryforwards for U.S. Federal income tax purposes as follows:
| Portfolio | Expired Capital Loss Carryforwards (000) | ||||||
| Balanced | $ | 3,362 | |||||
| Core Plus Fixed Income | 21,148 | ||||||
To the extent that capital loss carryforwards are used to offset any future capital gains realized during the carryover period as provided by U.S. Federal income tax regulations, no capital gains tax liability will be incurred by a Portfolio for gains realized and not distributed. To the extent that capital gains are offset, such gains will not be distributed to the shareholders. During the year ended September 30, 2011, the following Portfolios utilized capital loss carryforwards for U.S. Federal income tax purposes of approximately:
| Portfolio | Capital Loss Carryforward Utilized (000) | ||||||
| Balanced | $ | 1,248 | |||||
| Mid Cap Growth | 344,519 | ||||||
| Core Fixed Income | 1,374 | ||||||
| Core Plus Fixed Income | 15,782 | ||||||
| Investment Grade Fixed Income | 1,604 | ||||||
| Limited Duration | 234 | ||||||
Net capital and currency losses incurred after October 31 and within the taxable year are deemed to arise on the first day of the Portfolio's next taxable year. For the year ended September 30, 2011, the Portfolio deferred to October 1, 2011 for U.S. Federal income tax purposes, post-October capital and currency losses as indicated:
| Post-October | |||||||||||
| Portfolio | Captial Losses (000) | Currency Losses (000) | |||||||||
| Mid Cap Growth | $ | — | $ | 842 | |||||||
| Limited Duration | 726 | — | |||||||||
J. Other (unaudited): At September 30, 2011, certain Portfolios had otherwise unaffiliated record owners of 10% or greater. Investment activities of these shareholders could have a material impact on these Portfolios.
These Portfolios and the aggregate percentage of such owners were as follows:
| Percentage of Ownership | |||||||||||||||
| Portfolio | Class H | Class I | Class P | ||||||||||||
| Balanced | — | % | 43.1 | % | 96.5 | % | |||||||||
| Mid Cap Growth | — | 42.0 | 69.4 | ||||||||||||
| Core Fixed Income | — | — | 14.3 | ||||||||||||
| Core Plus Fixed Income | — | 38.9 | 40.1 | ||||||||||||
| Investment Grade Fixed Income | 63.5 | — | — | ||||||||||||
111
2011 Annual Report
September 30, 2011
Report of Independent Registered Public Accounting Firm
To the Shareholders and Board of Trustees of
Morgan Stanley Institutional Fund Trust:
We have audited the accompanying statements of assets and liabilities of Balanced Portfolio, Mid Cap Growth Portfolio, Core Fixed Income Portfolio, Core Plus Fixed Income Portfolio, Investment Grade Fixed Income Portfolio, Limited Duration Portfolio, and Long Duration Fixed Income Portfolio (the "Funds") (seven of the Portfolios comprising Morgan Stanley Institutional Fund Trust), including the portfolios of investments, as of September 30, 2011 and the related statements of operations for the year then ended, statements of changes in net assets for each of the two years in the period then ended and the financial highlights for each of the periods indicated therein. These financial statements and financial highlights are the responsibility of the Funds' management. Our responsibility is to express an opinion on these financial statements and financial highlights based on our audits.
We conducted our audits in accordance with the standards of the Public Company Accounting Oversight Board (United States). Those standards require that we plan and perform the audit to obtain reasonable assurance about whether the financial statements and financial highlights are free of material misstatement. We were not engaged to perform an audit of the Funds' internal control over financial reporting. Our audits included consideration of internal control over financial reporting as a basis for designing audit procedures that are appropriate in the circumstances, but not for the purpose of expressing an opinion on the effectiveness of the Fund's internal control over financial reporting. Accordingly, we express no such opinion. An audit also includes examining, on a test basis, evidence supporting the amounts and disclosures in the financial statements and financial highlights, assessing the accounting principles used and significant estimates made by management, and evaluating the overall financial statement presentation. Our procedures included confirmation of securities owned as of September 30, 2011, by correspondence with the custodian and others, or by other appropriate auditing procedures where replies from others were not received. We believe that our audits provide a reasonable basis for our opinion.
In our opinion, the financial statements and financial highlights referred to above present fairly, in all material respects, the financial position of each of the aforementioned portfolios comprising Morgan Stanley Institutional Fund Trust at September 30, 2011, the results of their operations for the year then ended, the changes in their net assets for each of the two years for the period then ended and financial highlights for each of the periods indicated therein, in conformity with U.S. generally accepted accounting principles.

Boston, Massachusetts
November 23, 2011
112
2011 Annual Report
September 30, 2011
Federal Income Tax Information (unaudited)
For Federal income tax purposes, the following information is furnished with respect to the distributions paid by each applicable Portfolio during the taxable year ended September 30, 2011.
For corporate shareholders, the percentages of dividends paid by the following Portfolios qualified for the dividends received deduction. (Please consult your tax advisor to determine if any portion of the dividends you received is exempt from state income tax.):
| Portfolio | Div. Received Deduction % | ||||||
| Balanced | 55.7 | % | |||||
| Mid Cap Growth | 67.1 | ||||||
The following Portfolio designated and paid the following amounts as a long-term capital gain distribution:
| Portfolio | Amount (000) | ||||||
| Long Duration Fixed Income | $ | 838 | |||||
| Mid Cap Growth | 4,087 | ||||||
For Federal income tax purposes, the following information is furnished with respect to the earnings of each applicable Portfolio for the taxable year ended September 30, 2011.
When distributed, certain earnings may be subject to a maximum tax rate of 15% as provided for the Jobs and Growth Tax Relief Reconciliation Act of 2003. Each of the applicable Portfolios designated up to the following maximum amounts as taxable at this lower rate:
| Portfolio | Amount (000) | ||||||
| Balanced | $ | 450 | |||||
| Mid Cap Growth | 34,232 | ||||||
In January, each applicable Portfolio provides tax information to shareholders for the preceding calendar year.
113
2011 Annual Report
September 30, 2011
U.S. Privacy Policy (unaudited)
AN IMPORTANT NOTICE CONCERNING OUR U.S. PRIVACY POLICY
Morgan Stanley Institutional Fund, Inc. and Morgan Stanley Institutional Fund Trust, (collectively, the "Fund") is required by federal law to provide you with a copy of its privacy policy ("Policy") annually.
This Policy applies to current and former individual clients of Morgan Stanley Distribution, Inc., as well as to current and former individual investors in Morgan Stanley mutual funds and related companies.
This Policy is not applicable to partnerships, corporations, trusts or other non-individual clients or account holders, nor is this Policy applicable to individuals who are either beneficiaries of a trust for which we serve as trustee or participants in an employee benefit plan administered or advised by us. This Policy is, however, applicable to individuals who select us to be a custodian of securities or assets in individual retirement accounts, 401(k) accounts, 529 Educational Savings Accounts, accounts subject to the Uniform Gifts to Minors Act, or similar accounts. We may amend this Policy at any time, and will inform you of any changes to this Policy as required by law.
WE RESPECT YOUR PRIVACY
We appreciate that you have provided us with your personal financial information and understand your concerns about safeguarding such information. We strive to maintain the privacy of such information while we help you achieve your financial objectives. This Policy describes what nonpublic personal information we collect about you, how we collect it, when we may share it with others, and how others may use it. It discusses the steps you may take to limit our sharing of information about you with affiliated Morgan Stanley companies ("affiliated companies"). It also discloses how you may limit our affiliates' use of shared information for marketing purposes. Throughout this Policy, we refer to the nonpublic information that personally identifies you or your accounts as "personal information."
1. WHAT PERSONAL INFORMATION DO WE COLLECT ABOUT YOU?
To better serve you and manage our business, it is important that we collect and maintain accurate information about you. We obtain this information from applications and other forms you submit to us, from your dealings with us, from consumer reporting agencies, from our websites and from third parties and other sources. For example:
• We collect information such as your name, address, e-mail address, telephone/fax numbers, assets, income and investment objectives through application forms you submit to us.
• We may obtain information about account balances, your use of account(s) and the types of products and services you prefer to receive from us through your dealings and transactions with us and other sources.
• We may obtain information about your creditworthiness and credit history from consumer reporting agencies.
• We may collect background information from and through third-party vendors to verify representations you have made and to comply with various regulatory requirements.
• If you interact with us through our public and private Web sites, we may collect information that you provide directly through online communications (such as an e-mail address). We may also collect information about your Internet service provider, your domain name, your computer's operating system and Web browser, your use of our Web sites and your product and service preferences, through the use of "cookies.'' "Cookies'' recognize your computer each time you return to one of our sites, and help to improve our sites' content and personalize your experience on our sites by, for example, suggesting offerings that may interest you. Please consult the Terms of Use of these sites for more details on our use of cookies.
2. WHEN DO WE DISCLOSE PERSONAL INFORMATION WE COLLECT ABOUT YOU?
To provide you with the products and services you request, to better serve you, to manage our business and as otherwise required or permitted by law, we may disclose personal information we collect about you to other affiliated companies and to nonaffiliated third parties.
114
2011 Annual Report
September 30, 2011
U.S. Privacy Policy (unaudited) (cont'd)
a. Information we disclose to our affiliated companies.
In order to manage your account(s) effectively, including servicing and processing your transactions, to let you know about products and services offered by us and affiliated companies, to manage our business, and as otherwise required or permitted by law, we may disclose personal information about you to other affiliated companies. Offers for products and services from affiliated companies are developed under conditions designed to safeguard your personal information.
b. Information we disclose to third parties.
We do not disclose personal information that we collect about you to nonaffiliated third parties except to enable them to provide marketing services on our behalf, to perform joint marketing agreements with other financial institutions, and as otherwise required or permitted by law. For example, some instances where we may disclose information about you to third parties include: for servicing and processing transactions, to offer our own products and services, to protect against fraud, for institutional risk control, to respond to judicial process or to perform services on our behalf. When we share personal information with a nonaffiliated third party, they are required to limit their use of personal information about you to the particular purpose for which it was shared and they are not allowed to share personal information about you with others except to fulfill that limited purpose or as may be required by law.
3. HOW DO WE PROTECT THE SECURITY AND CONFIDENTIALITY OF PERSONAL INFORMATION WE COLLECT ABOUT YOU?
We maintain physical, electronic and procedural security measures to help safeguard the personal information we collect about you. We have internal policies governing the proper handling of client information. Third parties that provide support or marketing services on our behalf may also receive personal information about you, and we require them to adhere to confidentiality standards with respect to such information.
4. HOW CAN YOU LIMIT OUR SHARING OF CERTAIN PERSONAL INFORMATION ABOUT YOU WITH OUR AFFILIATED COMPANIES FOR ELIGIBILITY DETERMINATION?
We respect your privacy and offer you choices as to whether we share with our affiliated companies personal information that was collected to determine your eligibility for products and services such as credit reports and other information that you have provided to us or that we may obtain from third parties ("eligibility information"). Please note that, even if you direct us not to share certain eligibility information with our affiliated companies, we may still share your personal information, including eligibility information, with those companies under circumstances that are permitted under applicable law, such as to process transactions or to service your account. We may also share certain other types of personal information with affiliated companies — such as your name, address, telephone number, e-mail address and account number(s), and information about your transactions and experiences with us.
5. HOW CAN YOU LIMIT THE USE OF CERTAIN PERSONAL INFORMATION ABOUT YOU BY OUR AFFILIATED COMPANIES FOR MARKETING?
You may limit our affiliated companies from using certain personal information about you that we may share with them for marketing their products or services to you. This information includes our transactions and other experiences with you such as your assets and account history. Please note that, even if you choose to limit our affiliated companies from using certain personal information about you that we may share with them for marketing their products and services to you, we may still share such personal information about you with them, including our transactions and experiences with you, for other purposes as permitted under applicable law.
115
2011 Annual Report
September 30, 2011
U.S. Privacy Policy (unaudited) (cont'd)
6. HOW CAN YOU SEND US AN OPT-OUT INSTRUCTION?
If you wish to limit our sharing of certain personal information about you with our affiliated companies for "eligibility purposes" and for our affiliated companies' use in marketing products and services to you as described in this notice, you may do so by:
• Calling us at (800) 548 - 7786
Monday–Friday between 8a.m. and 5p.m. (EST)
• Writing to us at the following address:
Morgan Stanley Institutional Privacy Department
201 Plaza Two - 3rd Floor
Jersey City, NJ 07311
If you choose to write to us, your written request should include: your name, address, telephone number and account number(s) to which the opt-out applies and should not be sent with any other correspondence. In order to process your request, we require that the request be provided by you directly and not through a third party. Once you have informed us about your privacy preferences, your opt-out preference will remain in effect with respect to this Policy (as it may be amended) until you notify us otherwise. If you are a joint account owner, we will accept instructions from any one of you and apply those instructions to the entire account. Please allow approximately 30 days from our receipt of your opt-out for your instructions to become effective.
Please understand that if you opt-out, you and any joint account holders may not receive certain Morgan Stanley or our affiliated companies' products and services that could help you manage your financial resources and achieve your investment objectives.
If you have more than one account with us or our affiliates, you may receive multiple privacy policies from us, and would need to follow the directions stated in each particular policy for each account you have with us.
7. WHAT IF AN AFFILIATED COMPANY BECOMES A NONAFFILIATED THIRD PARTY?
If, at any time in the future, an affiliated company becomes a nonaffiliated third party, further disclosures of personal information made to the former affiliated company will be limited to those described in Section 2(b) above relating to nonaffiliated third parties. If you elected under Section 6 to limit disclosures we make to affiliated companies, or use of personal information by affiliated companies, your election will not apply to use by any former affiliated company of your personal information in their possession once it becomes a nonaffiliated third party.
SPECIAL NOTICE TO RESIDENTS OF VERMONT
This section supplements our Policy with respect to our individual clients who have a Vermont address and supersedes anything to the contrary in the above Policy with respect to those clients only.
The State of Vermont requires financial institutions to obtain your consent prior to sharing personal information that they collect about you with affiliated companies and nonaffiliated third parties other than in certain limited circumstances. Except as permitted by law, we will not share personal information we collect about you with nonaffiliated third parties or other affiliated companies unless you provide us with your written consent to share such information ("opt-in").
If you wish to receive offers for investment products and services offered by or through other affiliated companies, please notify us in writing at the following address:
Morgan Stanley Institutional Privacy Department
201 Plaza Two - 3rd Floor
Jersey City, NJ 07311
Your authorization should include: your name, address, telephone number and account number(s) to which the opt-in applies and should not be sent with any other correspondence. In order to process your authorization, we require that the authorization be provided by you directly and not through a third-party.
SPECIAL NOTICE TO RESIDENTS OF CALIFORNIA
The following section supplements our Policy with respect to our individual clients who have a California address and supersedes anything to the contrary in the above Policy with respect to those clients only.
In response to a California law, if your account has a California home address, your personal information will not be disclosed to nonaffiliated third parties except as permitted by applicable California law, and we will limit sharing such personal information with our affiliates to comply with California privacy laws that apply to us.
116
2011 Annual Report
September 30, 2011
Trustee and Officer Information (unaudited)
Independent Trustees:
| Name, Age and Address of Independent Trustee | Position(s) Held with Registrant | Term of Office and Length of Time Served* | Principal Occupation(s) During Past 5 Years | Number of Portfolios in Fund Complex Overseen by Independent Trustee** | Other Directorships Held by Independent Trustee*** | ||||||||||||||||||
| Frank L. Bowman (66) c/o Kramer Levin Naftalis & Frankel LLP Counsel to the Independent Trustees 1177 Avenue of the Americas New York, NY 10036 | Trustee | Since August 2006 | President, Strategic Decisions, LLC (consulting) (since February 2009); Director or Trustee of various Morgan Stanley Funds (since August 2006); Chairperson of the Insurance Sub-Committee of the Compliance and Insurance Committee (since February 2007); served as President and Chief Executive Officer of the Nuclear Energy Institute (policy organization) (February 2005 through November 2008); retired as Admiral, U.S. Navy after serving over 38 years on active duty including 8 years as Director of the Naval Nuclear Propulsion Program in the Department of the Navy and the U.S. Department of Energy (1996-2004); served as Chief of Naval Personnel (July 1994-September 1996) and on the joint staff as Director of Political-Military Affairs (June 1992 to July 1994); Knighted as Honorary Knight Commander of the Most Excellent Order of the British Empire; Awarded the Officer de l'Orde National du Mérite by the French Government; elected to the National Academy of Engineering (2009). | 102 | Director of BP p.l.c.; Director of Naval and Nuclear Technologies LLP; Director of the Armed Services YMCA of the USA and the Naval Submarine League; Director of the American Shipbuilding Suppliers Association; Member of the National Security Advisory Council of the Center for U.S. Global Engagement and a member of the CNA military Advisory Board. | ||||||||||||||||||
| Michael Bozic (70) c/o Kramer Levin Naftalis & Frankel LLP Counsel to the Independent Trustees 1177 Avenue of the Americas New York, NY 10036 | Trustee | Since April 1994 | Private investor; Chairperson of the Compliance and Insurance Committee (since October 2006); Director or Trustee of various Morgan Stanley Funds (since April 1994); formerly, Chairperson of the Insurance Committee (July 2006-September 2006); Vice Chairman of Kmart Corporation (December 1998-October 2000), Chairman and Chief Executive Officer of Levitz Furniture Corporation (November 1995-November 1998) and President and Chief Executive Officer of Hills Department Stores (May 1991-July 1995); variously Chairman, Chief Executive Officer, President and Chief Operating Officer (1987-1991) of the Sears Merchandise Group of Sears, Roebuck & Co. | 104 | Director of various business organizations. | ||||||||||||||||||
| Kathleen A. Dennis (58) c/o Kramer Levin Naftalis & Frankel LLP Counsel to the Independent Trustees 1177 Avenue of the Americas New York, NY 10036 | Trustee | Since August 2006 | President, Cedarwood Associates (mutual fund and investment management consulting) (since July 2006); Chairperson of the Money Market and Alternatives Sub-Committee of the Investment Committee (since October 2006) and Director or Trustee of various Morgan Stanley Funds (since August 2006); formerly, Senior Managing Director of Victory Capital Management (1993-2006). | 102 | Director of various non-profit organizations. | ||||||||||||||||||
| Dr. Manuel H. Johnson (62) c/o Johnson Smick Group, Inc. 888 16th Street, N.W. Suite 740 Washington, D.C. 20006 | Trustee | Since July 1991 | Senior Partner, Johnson Smick International, Inc. (consulting firm); Chairperson of the Investment Committee (since October 2006) and Director or Trustee of various Morgan Stanley Funds (since July 1991); Co-Chairman and a founder of the Group of Seven Council (G7C) (international economic commission); formerly, Chairperson of the Audit Committee (July 1991-September 2006), Vice Chairman of the Board of Governors of the Federal Reserve System and Assistant Secretary of the U.S. Treasury. | 104 | Director of NVR, Inc. (home construction); Director of Evergreen Energy; Director of Greenwich Capital Holdings. | ||||||||||||||||||
| Joseph J. Kearns (69) c/o Kearns & Associates LLC PMB754 22631 Pacific Coast Highway Malibu, CA 90265 | Trustee | Since August 1994 | President, Kearns & Associates LLC (investment consulting); Chairperson of the Audit Committee (since October 2006) and Director or Trustee of various Morgan Stanley Funds (since August 1994); formerly, Deputy Chairperson of the Audit Committee (July 2003-September 2006) and Chairperson of the Audit Committee of various Morgan Stanley Funds (since August 1994); CFO of the J. Paul Getty Trust. | 105 | Director of Electro Rent Corporation (equipment leasing) and The Ford Family Foundation. | ||||||||||||||||||
117
2011 Annual Report
September 30, 2011
Trustee and Officer Information (unaudited) (cont'd)
Independent Trustees: (cont'd)
| Name, Age and Address of Independent Trustee | Position(s) Held with Registrant | Term of Office and Length of Time Served* | Principal Occupation(s) During Past 5 Years | Number of Portfolios in Fund Complex Overseen by Independent Trustee** | Other Directorships Held by Independent Trustee*** | ||||||||||||||||||
| Michael F. Klein (52) c/o Kramer Levin Naftalis & Frankel LLP Counsel to the Independent Trustees 1177 Avenue of the Americas New York, NY 10036 | Trustee | Since August 2006 | Managing Director, Aetos Capital, LLC (since March 2000) and Co-President, Aetos Alternatives Management, LLC (since January 2004); Chairperson of the Fixed Income Sub-Committee of the Investment Committee (since October 2006) and Director or Trustee of various Morgan Stanley Funds (since August 2006); formerly, Managing Director, Morgan Stanley & Co. LLC. and Morgan Stanley Dean Witter Investment Management, President, various Morgan Stanley Funds (June 1998-March 2000) and Principal, Morgan Stanley & Co. LLC. and Morgan Stanley Dean Witter Investment Management (August 1997-December 1999). | 102 | Director of certain investment funds managed or sponsored by Aetos Capital, LLC. Director of Sanitized AG and Sanitized Marketing AG (specialty chemicals). | ||||||||||||||||||
| Michael E. Nugent (75) c/o Triumph Capital, L.P. 445 Park Avenue New York, NY 10022 | Chairperson of the Board and Trustee | Chairperson of the Boards since July 2006 and Trustee since July 1991 | General Partner, Triumph Capital, L.P. (private investment partnership); Chairperson of the Boards of various Morgan Stanley Funds (since July 2006); Director or Trustee of the various Morgan Stanley Funds (since July 1991); formerly, Chairperson of the Insurance Committee (until July 2006). | 104 | None. | ||||||||||||||||||
| W. Allen Reed (64) c/o Kramer Levin Naftalis & Frankel LLP Counsel to the Independent Trustees 1177 Avenue of the Americas New York, NY 10036 | Trustee | Since August 2006 | Chairperson of the Equity Sub-Committee of the Investment Committee (since October 2006) and Director or Trustee of various Morgan Stanley Funds (since August 2006); formerly, President and CEO of General Motors Asset Management; Chairman and Chief Executive Officer of the GM Trust Bank and Corporate Vice President of General Motors Corporation (August 1994-December 2005). | 102 | Director of Temple-Inland Industries (packaging and forest products); Director of Legg Mason, Inc. and Director of the Auburn University Foundation; formerly, Director of iShares, Inc. (2001-2006). | ||||||||||||||||||
| Fergus Reid (79) c/o Joe Pietryka, Inc. 85 Charles Colman Blvd. Pawling, NY 12564 | Trustee | Since June 1992 | Chairman, Joe Pietryka, Inc.; Chairperson of the Governance Committee and Director or Trustee of various Morgan Stanley Funds (since June 1992). | 105 | Trustee and Director of certain investment companies in the JPMorgan Funds complex managed by JP Morgan Investment Management Inc. | ||||||||||||||||||
118
2011 Annual Report
September 30, 2011
Trustee and Officer Information (unaudited) (cont'd)
Interested Trustee:
| Name, Age and Address of Independent Trustee | Position(s) Held with Registrant | Length of Time Served* | Principal Occupation(s) During Past 5 Years | Number of Portfolios in Fund Complex Overseen by Interested Trustee** | Other Directorships Held by Interested Trustee*** | ||||||||||||||||||
| James F. Higgins (63) c/o Morgan Stanley Services Company Inc. Harborside Financial Center 201 Plaza Two Jersey City, NJ 07311 | Trustee | Since June 2000 | Director or Trustee of various Morgan Stanley Funds (since June 2000); Senior Advisor of Morgan Stanley (since August 2000). | 103 | Director of AXA Financial, Inc. and The Equitable Life Assurance Society of the United States (financial services). | ||||||||||||||||||
* Each Trustee serves an indefinite term, until his or her successor is elected.
** The Fund Complex includes all open-end and closed-end funds (including all of their portfolios) advised by Morgan Stanley Investment Management Inc. (the "Adviser") (as of December 31, 2010) and any funds that have an adviser that is an affiliated person of the Adviser (including but not limited to Morgan Stanley AIP GP LP).
*** This includes any directorships at public companies and registered investment companies held by the Trustee at any time during the past five years.
119
2011 Annual Report
September 30, 2011
Trustee and Officer Information (unaudited) (cont'd)
Executive Officers:
| Name, Age and Address of Executive Officer | Position(s) Held with Registrant | Length of Time Served* | Principal Occupation(s) During Past 5 Years | ||||||||||||
| Arthur Lev (50) 522 Fifth Avenue New York, NY 10036 | President and Principal Executive Officer—Equity and Fixed Income Funds | Since June 2011 | President and Principal Executive Officer (since June 2011) of the Equity and Fixed Income Funds in the Fund Complex; Head of the Long Only Business of Morgan Stanley Investment Management (since February 2011); Managing Director of the Adviser and various entities affiliated with the Adviser (since December 2006). Formerly, Chief Strategy Officer of Morgan Stanley Investment Management's Traditional Asset Management business (November 2010-February 2011); General Counsel of Morgan Stanley Investment Management (December 2006-October 2010); Partner and General Counsel of FrontPoint Partners LLC (July 2002 to December 2006); Managing Director and General Counsel of Morgan Stanley Investment Management (May 2000 to June 2002). | ||||||||||||
| Mary Ann Picciotto (38) c/o Morgan Stanley Services Company Inc. Harborside Financial Center 201 Plaza Two Jersey City, NJ 07311 | Chief Compliance Officer | Since May 2010 | Executive Director of the Adviser and various entities affiliated with the Adviser; Chief Compliance Officer of various Morgan Stanley Funds (since May 2010); Chief Compliance Officer of the Adviser (since April 2007). | ||||||||||||
| Stefanie V. Chang Yu (44) 522 Fifth Avenue New York, NY 10036 | Vice President | Since December 1997 | Managing Director of the Adviser and various entities affiliated with the Adviser; Vice President of various Morgan Stanley Funds (since December 1997). Formerly, Secretary of the Adviser and various entities affiliated with the Adviser. | ||||||||||||
| Francis J. Smith (46) c/o Morgan Stanley Services Company Inc. Harborside Financial Center 201 Plaza Two Jersey City, NJ 07311 | Treasurer and Principal Financial Officer | Treasurer since July 2003 and Principal Financial Officer since September 2002 | Executive Director of the Adviser and various entities affiliated with the Adviser; Treasurer and Principal Financial Officer of various Morgan Stanley Funds (since July 2003). | ||||||||||||
| Mary E. Mullin (44) 522 Fifth Avenue New York, NY 10036 | Secretary | Since June 1999 | Executive Director of the Adviser and various entities affiliated with the Adviser; Secretary of various Morgan Stanley Funds (since June 1999). | ||||||||||||
* Each Officer serves an indefinite term, until his or her successor is elected.
120
Investment Adviser and Administrator
Morgan Stanley Investment Management Inc.
522 Fifth Avenue
New York, New York 10036
Distributor
Morgan Stanley Distribution, Inc.
100 Front Street, Suite 400
West Conshohocken, Pennsylvania 19428
Dividend Disbursing and Transfer Agent
Morgan Stanley Services Company Inc.
P.O. Box 219804
Kansas City, Missouri 64121
Custodian
State Street Bank and Trust Company
One Lincoln Street
Boston, Massachusetts 02111
Legal Counsel
Dechert LLP
1095 Avenue of the Americas
New York, New York 10036
Independent Registered Public Accounting Firm
Ernst & Young LLP
200 Clarendon Street
Boston, Massachusetts 02116
Reporting to Shareholders
Each Morgan Stanley Fund provides a complete schedule of portfolio holdings in its semi-annual and annual reports within 60 days of the end of the Fund's second and fourth fiscal quarters. The semi-annual reports and the annual reports are filed electronically with the Securities and Exchange Commission (SEC) on Form N-CSRS and Form N-CSR, respectively. Morgan Stanley also delivers the semi-annual and annual reports to Fund shareholders and makes these reports available on its public website, www.morganstanley.com/im. Each Morgan Stanley Fund also files a complete schedule of portfolio holdings with the SEC for the Fund's first and third fiscal quarters on Form N-Q. Morgan Stanley does not deliver the reports for the first and third fiscal quarters to shareholders nor are the reports posted to the Morgan Stanley public website. You may, however, obtain the Form N-Q filings (as well as the Form N-CSR and N-CSRS filings) by accessing the SEC's website, www.sec.gov. You may also review and copy them at the SEC's public reference room in Washington, DC. Information on the operation of the SEC's Public Reference Room may be obtained by calling the SEC toll free at 1-(800) SEC-0330. You can also request copies of these materials, upon payment of a duplicating fee, by electronic request at the SEC's email address (publicinfo@sec.gov) or by writing the Public Reference section of the SEC, Washington, DC 20549-0102.
Proxy Voting Policies and Procedures and Proxy Voting Record
You may obtain a copy of the Fund's Proxy Voting Policy and Procedures and information regarding how the Fund voted proxies relating to portfolio securities during the most recent twelve-month period ended June 30, without charge, upon request, by calling toll free 1-(800) 548-7786 or by visiting our website at www.morganstanley.com/im. This information is also available on the SEC's website at www.sec.gov.
This report is authorized for distribution only when preceded or accompanied by a prospectus of the Morgan Stanley Institutional Fund Trust which describes in detail each Investment Portfolio's investment policies, risks, fees and expenses. Please read the prospectus carefully before you invest or send money. For additional information, including information regarding the investments comprising the Portfolio, please visit our website at www.morganstanley.com/im or call toll free 1-(800) 548-7786.
121
Printed in U.S.A.
This Report has been prepared for shareholders and may be distributed to others only if preceded or accompanied by a current prospectus.
Morgan Stanley Investment Management Inc.
522 Fifth Avenue
New York, NY 10036
© 2011 Morgan Stanley

IFEQFIANN
IU11-02350P-Y09/11
INVESTMENT MANAGEMENT

Morgan Stanley
Institutional Fund Trust
Balanced Portfolio
Balanced Portfolio
Equity Portfolio
Mid Cap Growth Portfolio
Fixed Income Portfolios
Core Fixed Income Portfolio
Core Plus Fixed Income Portfolio
Corporate Bond Portfolio
(formerly Investment Grade Fixed Income Portfolio)
High Yield Portfolio
Limited Duration Portfolio
Long Duration Fixed Income Portfolio
Semi-Annual
Report
March 31, 2012


(This Page has been left blank intentionally.)
2012 Semi-Annual Report
March 31, 2012
Table of Contents
| Shareholders' Letter | 2 | ||||||
| Expense Examples | 3 | ||||||
| Portfolios of Investments | |||||||
| Balanced Portfolio: | |||||||
| Balanced | 4 | ||||||
| Equity Portfolio: | |||||||
| Mid Cap Growth | 16 | ||||||
| Fixed Income Portfolios: | |||||||
| Core Fixed Income | 19 | ||||||
| Core Plus Fixed Income | 26 | ||||||
| Corporate Bond (formerly Investment Grade Fixed Income) | 34 | ||||||
| High Yield | 41 | ||||||
| Limited Duration | 44 | ||||||
| Long Duration Fixed Income | 49 | ||||||
| Statements of Assets and Liabilities | 54 | ||||||
| Statements of Operations | 58 | ||||||
| Statements of Changes in Net Assets | 60 | ||||||
| Financial Highlights | 65 | ||||||
| Notes to Financial Statements | 85 | ||||||
| U.S. Privacy Policy | 95 | ||||||
| Trustee and Officer Information | 98 | ||||||
This report is authorized for distribution only when preceded or accompanied by prospectuses of the Morgan Stanley Institutional Fund Trust. To receive a prospectus and/or SAI, which contains more complete information such as investment objectives, charges, expenses, policies for voting proxies, risk considerations, and describes in detail each of the Portfolio's investment policies to the prospective investor, please call toll free 1-(800) 548-7786. Please read the prospectuses carefully before you invest or send money.
Additionally, you can access portfolio information including performance, characteristics, and investment team commentary through Morgan Stanley Investment Management's website: www.morganstanley.com/im.
Market forecasts provided in this report may not necessarily come to pass. There is no guarantee that any sectors mentioned will continue to perform as discussed herein or that securities in such sectors will be held by the Portfolio in the future. There is no assurance that a Portfolio will achieve its investment objective. Portfolios are subject to market risk, which is the possibility that market values of securities owned by the Portfolio will decline and, therefore, the value of the Portfolio's shares may be less than what you paid for them. Accordingly, you can lose money investing in Portfolios. Please see the prospectus for more complete information on investment risks.
1
2012 Semi-Annual Report
March 31, 2012
Shareholders' Letter
Dear Shareholders:
We are pleased to present to you the Morgan Stanley Institutional Fund Trust's (the "Fund") Semi-Annual Report for the six months ended March 31, 2012. Our Fund currently offers 8 portfolios providing investors with asset allocation, domestic equity and fixed-income products. The Fund's portfolios, together with the portfolios of the Morgan Stanley Institutional Fund, Inc., provide investors with a means to help them meet specific investment needs and to allocate their investments among equities and fixed income.
Sincerely,

Arthur Lev
President and Principal Executive Officer
April 2012
2
2012 Semi-Annual Report
March 31, 2012
Expense Examples (unaudited)
As a shareholder of the Portfolio, you may incur two types of costs: (1) transactional costs, including sales charge (loads) on purchase payments, if applicable; and (2) ongoing costs, including management fees, distribution and shareholder servicing fees; and other Portfolio expenses. These examples are intended to help you understand your ongoing costs (in dollars) of investing in the Portfolio and to compare these costs with the ongoing costs of investing in other mutual funds.
These examples are based on an investment of $1,000 invested at the beginning of the six-month period ended March 31, 2012 and held for the entire six-month period.
Actual Expenses
The table below provides information about actual account values and actual expenses. You may use the information in this table, together with the amount you invested, to estimate the expenses that you paid over the period. Simply divide your account value by $1,000 (for example, an $8,600 account value divided by $1,000 = 8.6), then multiply the result by the number in the table under the heading entitled "Actual Expenses Paid During Period" to estimate the expenses you paid on your account during this period.
Please note that "Actual Expenses Paid During Period" are grossed up to reflect Portfolio expenses prior to the effect of Expense Offset (See Note F in the Notes to Financial Statements). Therefore, the annualized net expense ratios may differ from the ratio of expenses to average net assets shown in the Financial Highlights.
Hypothetical Example for Comparison Purposes
The table below provides information about hypothetical account values and hypothetical expenses based on the Portfolio's actual expense ratio and an assumed rate of return of 5% per year before expenses, which is not the Portfolio's actual return. The hypothetical account values and expenses may not be used to estimate the actual ending account balance or expenses you paid for the period. You may use this information to compare the ongoing costs of investing in the Portfolio and other funds. To do so, compare this 5% hypothetical example with the 5% hypothetical examples that appear in the shareholder reports of the other funds.
Please note that the expenses shown in the table are meant to highlight your ongoing costs only and do not reflect any transactional costs, such as sales charges (loads, if applicable). Therefore, the hypothetical account values and hypothetical expenses are useful in comparing ongoing costs only, and will not help you determine the relative total costs of owning different funds. In addition, if these transactional costs were included, your costs would have been higher.
| Portfolio | Beginning Account Value 10/1/11 | Actual Ending Account Value 3/31/12 | Hypothetical Ending Account Value | Actual Expenses Paid During Period* | Hypothetical Expenses Paid During Period* | Net Expense Ratio During Period** | |||||||||||||||||||||
| Balanced Portfolio Class I | $ | 1,000.00 | $ | 1,173.20 | $ | 1,019.20 | $ | 6.30 | $ | 5.86 | 1.16 | % | |||||||||||||||
| Balanced Portfolio Class P | 1,000.00 | 1,171.30 | 1,017.95 | 7.65 | 7.11 | 1.41 | |||||||||||||||||||||
| Mid Cap Growth Portfolio Class I | 1,000.00 | 1,215.50 | 1,021.50 | 3.88 | 3.54 | 0.70 | |||||||||||||||||||||
| Mid Cap Growth Portfolio Class P | 1,000.00 | 1,213.80 | 1,020.25 | 5.26 | 4.80 | 0.95 | |||||||||||||||||||||
| Core Fixed Income Portfolio Class I | 1,000.00 | 1,031.20 | 1,022.55 | 2.49 | 2.48 | 0.49 | |||||||||||||||||||||
| Core Fixed Income Portfolio Class P | 1,000.00 | 1,029.70 | 1,021.30 | 3.75 | 3.74 | 0.74 | |||||||||||||||||||||
| Core Plus Fixed Income Portfolio Class I | 1,000.00 | 1,045.20 | 1,022.05 | 3.02 | 2.98 | 0.59 | |||||||||||||||||||||
| Core Plus Fixed Income Portfolio Class P | 1,000.00 | 1,042.70 | 1,020.80 | 4.29 | 4.24 | 0.84 | |||||||||||||||||||||
| Corporate Bond Portfolio Class I | 1,000.00 | 1,040.60 | 1,021.20 | 3.88 | 3.84 | 0.76 | |||||||||||||||||||||
| Corporate Bond Portfolio Class P | 1,000.00 | 1,039.80 | 1,020.45 | 4.64 | 4.60 | 0.91 | |||||||||||||||||||||
| Corporate Bond Portfolio Class H | 1,000.00 | 1,039.20 | 1,019.95 | 5.15 | 5.10 | 1.01 | |||||||||||||||||||||
| Corporate Bond Portfolio Class L | 1,000.00 | 1,038.00 | 1,018.70 | 6.42 | 6.36 | 1.26 | |||||||||||||||||||||
| High Yield Portfolio Class I | 1,000.00 | 1,023.00 | 1,006.18 | 1.07 | + | 1.06 | 0.73 | ||||||||||||||||||||
| High Yield Portfolio Class P | 1,000.00 | 1,023.00 | 1,005.82 | 1.44 | + | 1.42 | 0.98 | ||||||||||||||||||||
| High Yield Portfolio Class H | 1,000.00 | 1,023.00 | 1,005.82 | 1.44 | + | 1.42 | 0.98 | ||||||||||||||||||||
| High Yield Portfolio Class L | 1,000.00 | 1,023.00 | 1,005.46 | 1.80 | + | 1.79 | 1.23 | ||||||||||||||||||||
| Limited Duration Portfolio Class I | 1,000.00 | 1,019.00 | 1,022.15 | 2.88 | 2.88 | 0.57 | |||||||||||||||||||||
| Limited Duration Portfolio Class P | 1,000.00 | 1,017.70 | 1,020.90 | 4.14 | 4.14 | 0.82 | |||||||||||||||||||||
| Long Duration Fixed Income Portfolio Class I | 1,000.00 | 1,010.00 | 1,022.50 | 2.51 | 2.53 | 0.50 | |||||||||||||||||||||
| Long Duration Fixed Income Portfolio Class P | 1,000.00 | 1,007.90 | 1,021.25 | 3.76 | 3.79 | 0.75 | |||||||||||||||||||||
* Expenses are calculated using each Portfolio Class' annualized net expense ratio (as disclosed), multiplied by the average account value over the period, and multiplied by 183/366 (to reflect the most recent one-half year period).
** Annualized.
+ Expenses are calculated using each Portfolio Class' annualized net expense ratio (as disclosed), multiplied by the average account value over the period, and multiplied by 53/366 (to reflect the actual days in period).
3
2012 Semi-Annual Report
March 31, 2012 (unaudited)
Portfolio of Investments
Balanced Portfolio
| Face Amount (000) | Value (000) | ||||||||||
| Fixed Income Securities (36.5%) | |||||||||||
| Agency Adjustable Rate Mortgage (0.1%) | |||||||||||
| Federal National Mortgage Association, | |||||||||||
| Conventional Pools: | |||||||||||
| 2.39%, 5/1/35 | $ | 59 | $ | 63 | |||||||
| Agency Fixed Rate Mortgages (9.0%) | |||||||||||
| Federal Home Loan Mortgage Corporation, | |||||||||||
| April TBA: | |||||||||||
| 3.00%, 4/25/27 (a) | 150 | 155 | |||||||||
| Gold Pools: | |||||||||||
| 4.00%, 12/1/41 | 86 | 91 | |||||||||
| 4.50%, 6/1/39 | 504 | 535 | |||||||||
| 5.00%, 10/1/35 | 292 | 315 | |||||||||
| 7.50%, 5/1/35 | 16 | 19 | |||||||||
| Federal National Mortgage Association, | |||||||||||
| April TBA: | |||||||||||
| 2.50%, 4/25/27 (a) | 150 | 152 | |||||||||
| Conventional Pools: | |||||||||||
| 4.00%, 11/1/41 | 65 | 68 | |||||||||
| 5.00%, 9/1/39 - 5/1/41 | 315 | 343 | |||||||||
| 5.50%, 5/1/37 - 8/1/38 | 390 | 428 | |||||||||
| 6.00%, 1/1/38 | 85 | 94 | |||||||||
| 7.50%, 8/1/37 | 31 | 37 | |||||||||
| Government National Mortgage Association, | |||||||||||
| April TBA: | |||||||||||
| 3.50%, 4/25/42 (a) | 370 | 386 | |||||||||
| 4.00%, 4/25/42 (a) | 825 | 886 | |||||||||
| Various Pools: | |||||||||||
| 4.50%, 4/15/39 - 8/15/39 | 149 | 163 | |||||||||
| 3,672 | |||||||||||
| Asset-Backed Securities (0.8%) | |||||||||||
| FUEL Trust | |||||||||||
| 4.21%, 4/15/16 (b) | 200 | 205 | |||||||||
| Santander Drive Auto Receivables Trust | |||||||||||
| 3.06%, 11/15/17 | 50 | 50 | |||||||||
| U-Haul S Fleet LLC | |||||||||||
| 4.90%, 10/25/23 (b) | 83 | 87 | |||||||||
| 342 | |||||||||||
| Collateralized Mortgage Obligations — Agency Collateral Series (0.8%) | |||||||||||
| Federal Home Loan Mortgage Corporation, | |||||||||||
| 2.97%, 10/25/21 | 90 | 92 | |||||||||
| IO | |||||||||||
| 0.68%, 1/25/21 (c) | 695 | 29 | |||||||||
| IO PAC REMIC | |||||||||||
| 6.23%, 6/15/40 (c) | 463 | 89 | |||||||||
| Federal National Mortgage Association, | |||||||||||
| IO REMIC | |||||||||||
| 5.00%, 8/25/37 | 84 | 5 | |||||||||
| 6.36%, 9/25/38 (c) | 189 | 40 | |||||||||
| Government National Mortgage Association, | |||||||||||
| IO REMIC | |||||||||||
| 6.34%, 6/20/40 (c) | 130 | 23 | |||||||||
| 6.36%, 4/16/41 (c) | 310 | 59 | |||||||||
| 337 | |||||||||||
| Face Amount (000) | Value (000) | ||||||||||
| Commercial Mortgage Backed Securities (0.6%) | |||||||||||
| Citigroup Commercial Mortgage Trust (See Note G-2) | |||||||||||
| 6.07%, 12/10/49 (c) | $ | 50 | $ | 58 | |||||||
| JP Morgan Chase Commercial Mortgage Securities Corp., | |||||||||||
| 4.17%, 8/15/46 | 70 | 76 | |||||||||
| 4.39%, 7/15/46 (b) | 100 | 109 | |||||||||
| 243 | |||||||||||
| Corporate Bonds (8.0%) | |||||||||||
| Finance (3.6%) | |||||||||||
| ABB Treasury Center USA, Inc. | |||||||||||
| 2.50%, 6/15/16 (b) | 55 | 56 | |||||||||
| Abbey National Treasury Services PLC, | |||||||||||
| MTN | |||||||||||
| 3.88%, 11/10/14 (b) | 100 | 101 | |||||||||
| Bank of America Corp. | |||||||||||
| 5.63%, 7/1/20 | 15 | 16 | |||||||||
| BNP Paribas SA | |||||||||||
| 5.00%, 1/15/21 | 40 | 40 | |||||||||
| Brandywine Operating Partnership LP | |||||||||||
| 4.95%, 4/15/18 | 50 | 51 | |||||||||
| Cigna Corp. | |||||||||||
| 2.75%, 11/15/16 | 50 | 51 | |||||||||
| Citigroup, Inc. (See Note G-2), | |||||||||||
| 6.13%, 5/15/18 | 100 | 112 | |||||||||
| 8.50%, 5/22/19 | 5 | 6 | |||||||||
| CNA Financial Corp. | |||||||||||
| 5.75%, 8/15/21 | 45 | 48 | |||||||||
| Coventry Health Care, Inc. | |||||||||||
| 5.45%, 6/15/21 | 35 | 38 | |||||||||
| General Electric Capital Corp. | |||||||||||
| 5.88%, 1/14/38 | 50 | 55 | |||||||||
| Genworth Financial, Inc. | |||||||||||
| 7.20%, 2/15/21 | 30 | 31 | |||||||||
| Goldman Sachs Group, Inc. (The) | |||||||||||
| 5.75%, 1/24/22 | 80 | 82 | |||||||||
| Hartford Financial Services Group, Inc. | |||||||||||
| 5.50%, 3/30/20 | 25 | 27 | |||||||||
| HSBC Holdings PLC | |||||||||||
| 4.00%, 3/30/22 | 45 | 45 | |||||||||
| JPMorgan Chase & Co., | |||||||||||
| 3.15%, 7/5/16 | 60 | 62 | |||||||||
| 4.95%, 3/25/20 | 25 | 27 | |||||||||
| Lloyds TSB Bank PLC | |||||||||||
| 5.80%, 1/13/20 (b) | 100 | 103 | |||||||||
| Macquarie Bank Ltd. | |||||||||||
| 6.63%, 4/7/21 (b) | 25 | 25 | |||||||||
| Macquarie Group Ltd. | |||||||||||
| 6.00%, 1/14/20 (b) | 25 | 25 | |||||||||
| Merrill Lynch & Co., Inc., | |||||||||||
| MTN | |||||||||||
| 6.88%, 4/25/18 | 40 | 44 | |||||||||
The accompanying notes are an integral part of the financial statements.
4
2012 Semi-Annual Report
March 31, 2012 (unaudited)
Portfolio of Investments (cont'd)
Balanced Portfolio
| Face Amount (000) | Value (000) | ||||||||||
| Finance (cont'd) | |||||||||||
| MetLife, Inc. | |||||||||||
| 7.72%, 2/15/19 | $ | 20 | $ | 25 | |||||||
| Nationwide Financial Services | |||||||||||
| 5.38%, 3/25/21 (b) | 25 | 26 | |||||||||
| Pacific LifeCorp | |||||||||||
| 6.00%, 2/10/20 (b) | 25 | 27 | |||||||||
| Prudential Financial, Inc. | |||||||||||
| 7.38%, 6/15/19 | 50 | 62 | |||||||||
| Santander Holdings USA, Inc. | |||||||||||
| 4.63%, 4/19/16 | 10 | 10 | |||||||||
| Standard Chartered PLC | |||||||||||
| 3.85%, 4/27/15 (b) | 100 | 104 | |||||||||
| UDR, Inc., | |||||||||||
| Series 0001 MTN | |||||||||||
| 4.63%, 1/10/22 | 30 | 31 | |||||||||
| UnitedHealth Group, Inc. | |||||||||||
| 6.63%, 11/15/37 | 40 | 51 | |||||||||
| Wachovia Corp. | |||||||||||
| 5.63%, 10/15/16 | 25 | 28 | |||||||||
| Wells Operating Partnership II LP | |||||||||||
| 5.88%, 4/1/18 | 50 | 51 | |||||||||
| 1,460 | |||||||||||
| Industrials (3.8%) | |||||||||||
| Altria Group, Inc. | |||||||||||
| 4.13%, 9/11/15 | 40 | 44 | |||||||||
| ArcelorMittal | |||||||||||
| 9.85%, 6/1/19 | 25 | 30 | |||||||||
| AT&T, Inc. | |||||||||||
| 6.30%, 1/15/38 | 50 | 59 | |||||||||
| Barrick Gold Corp. | |||||||||||
| 3.85%, 4/1/22 | 65 | 65 | |||||||||
| Bemis Co., Inc. | |||||||||||
| 4.50%, 10/15/21 | 70 | 73 | |||||||||
| Boston Scientific Corp. | |||||||||||
| 6.00%, 1/15/20 | 30 | 35 | |||||||||
| Comcast Corp. | |||||||||||
| 5.70%, 5/15/18 | 30 | 35 | |||||||||
| CRH America, Inc. | |||||||||||
| 6.00%, 9/30/16 | 40 | 44 | |||||||||
| CVS Caremark Corp. | |||||||||||
| 6.60%, 3/15/19 | 80 | 99 | |||||||||
| Darden Restaurants, Inc. | |||||||||||
| 6.20%, 10/15/17 | 50 | 57 | |||||||||
| DirecTV Holdings LLC/DirecTV Financing Co., Inc. | |||||||||||
| 5.88%, 10/1/19 | 35 | 40 | |||||||||
| Ecolab, Inc. | |||||||||||
| 3.00%, 12/8/16 | 30 | 31 | |||||||||
| Georgia-Pacific LLC | |||||||||||
| 5.40%, 11/1/20 (b)(d) | 80 | 90 | |||||||||
| Gilead Sciences, Inc., | |||||||||||
| 4.50%, 4/1/21 | 30 | 32 | |||||||||
| 5.65%, 12/1/41 | 20 | 21 | |||||||||
| Harley-Davidson Funding Corp. | |||||||||||
| 6.80%, 6/15/18 (b) | 30 | 35 | |||||||||
| Face Amount (000) | Value (000) | ||||||||||
| Hewlett-Packard Co. | |||||||||||
| 4.65%, 12/9/21 | $ | 50 | $ | 52 | |||||||
| Kohl's Corp. | |||||||||||
| 6.88%, 12/15/37 | 30 | 36 | |||||||||
| Koninklijke Philips Electronics | |||||||||||
| 3.75%, 3/15/22 | 50 | 50 | |||||||||
| Life Technologies Corp. | |||||||||||
| 6.00%, 3/1/20 | 40 | 46 | |||||||||
| Macy's Retail Holdings, Inc. | |||||||||||
| 3.88%, 1/15/22 | 20 | 20 | |||||||||
| NBC Universal Media LLC | |||||||||||
| 5.15%, 4/30/20 | 55 | 62 | |||||||||
| Phillips 66 | |||||||||||
| 4.30%, 4/1/22 (b) | 25 | 26 | |||||||||
| Quest Diagnostics, Inc. | |||||||||||
| 6.95%, 7/1/37 | 10 | 12 | |||||||||
| Sonoco Products Co. | |||||||||||
| 5.75%, 11/1/40 | 40 | 43 | |||||||||
| Telstra Corp., Ltd. | |||||||||||
| 4.80%, 10/12/21 (b) | 60 | 65 | |||||||||
| Teva Pharmaceutical Finance IV BV | |||||||||||
| 3.65%, 11/10/21 | 60 | 61 | |||||||||
| Time Warner, Inc. | |||||||||||
| 4.75%, 3/29/21 | 45 | 50 | |||||||||
| Valspar Corp. | |||||||||||
| 4.20%, 1/15/22 | 15 | 15 | |||||||||
| Verisk Analytics, Inc. | |||||||||||
| 5.80%, 5/1/21 | 55 | 59 | |||||||||
| Verizon Communications, Inc. | |||||||||||
| 8.95%, 3/1/39 | 45 | 70 | |||||||||
| Wesfarmers Ltd. | |||||||||||
| 2.98%, 5/18/16 (b) | 50 | 51 | |||||||||
| Yum! Brands, Inc. | |||||||||||
| 6.88%, 11/15/37 | 40 | 51 | |||||||||
| 1,559 | |||||||||||
| Utilities (0.6%) | |||||||||||
| EDF SA | |||||||||||
| 4.60%, 1/27/20 (b) | 25 | 26 | |||||||||
| Energy Transfer Partners LP | |||||||||||
| 9.00%, 4/15/19 | 12 | 15 | |||||||||
| Enterprise Products Operating LLC | |||||||||||
| 5.20%, 9/1/20 | 50 | 56 | |||||||||
| EQT Corp. | |||||||||||
| 4.88%, 11/15/21 | 25 | 25 | |||||||||
| FirstEnergy Solutions Corp. | |||||||||||
| 6.05%, 8/15/21 | 40 | 45 | |||||||||
| Plains All American Pipeline LP/PAA Finance Corp. | |||||||||||
| 8.75%, 5/1/19 | 30 | 39 | |||||||||
| PPL WEM Holdings PLC | |||||||||||
| 3.90%, 5/1/16 (b) | 40 | 42 | |||||||||
| 248 | |||||||||||
| 3,267 | |||||||||||
The accompanying notes are an integral part of the financial statements.
5
2012 Semi-Annual Report
March 31, 2012 (unaudited)
Portfolio of Investments (cont'd)
Balanced Portfolio
| Face Amount (000) | Value (000) | ||||||||||
| Mortgages — Other (1.3%) | |||||||||||
| Banc of America Alternative Loan Trust, | |||||||||||
| 5.86%, 10/25/36 | $ | 66 | $ | 44 | |||||||
| 5.91%, 10/25/36 (c) | 125 | 83 | |||||||||
| 6.00%, 4/25/36 | 69 | 69 | |||||||||
| Chase Mortgage Finance Corp. | |||||||||||
| 6.00%, 11/25/36 | 72 | 61 | |||||||||
| Chaseflex Trust | |||||||||||
| 6.00%, 2/25/37 | 65 | 46 | |||||||||
| First Horizon Alternative Mortgage Securities | |||||||||||
| 6.25%, 8/25/36 | 40 | 30 | |||||||||
| GSR Mortgage Loan Trust | |||||||||||
| 5.75%, 1/25/37 | 74 | 70 | |||||||||
| Lehman Mortgage Trust, | |||||||||||
| 5.50%, 11/25/35 | 41 | 39 | |||||||||
| 6.50%, 9/25/37 | 86 | 65 | |||||||||
| Residential Accredit Loans, Inc. | |||||||||||
| 0.74%, 3/25/35 (c) | 54 | 30 | |||||||||
| 537 | |||||||||||
| Municipal Bonds (0.1%) | |||||||||||
| State of California, General Obligation Bonds | |||||||||||
| 5.95%, 4/1/16 | 40 | 45 | |||||||||
| Sovereign (0.4%) | |||||||||||
| Brazilian Government International Bond | |||||||||||
| 4.88%, 1/22/21 | 90 | 102 | |||||||||
| Mexico Government International Bond | |||||||||||
| 3.63%, 3/15/22 | 80 | 82 | |||||||||
| 184 | |||||||||||
| U.S. Agency Securities (1.4%) | |||||||||||
| Federal National Mortgage Association, | |||||||||||
| 1.25%, 9/28/16 | 350 | 352 | |||||||||
| 5.38%, 6/12/17 | 170 | 205 | |||||||||
| 557 | |||||||||||
| U.S. Treasury Securities (14.0%) | |||||||||||
| U.S. Treasury Bonds, | |||||||||||
| 3.50%, 2/15/39 | 310 | 322 | |||||||||
| 3.88%, 8/15/40 (d) | 400 | 443 | |||||||||
| 5.25%, 11/15/28 | 310 | 405 | |||||||||
| U.S. Treasury Notes, | |||||||||||
| 0.50%, 11/15/13 | 725 | 727 | |||||||||
| 0.75%, 6/15/14 | 230 | 232 | |||||||||
| 1.25%, 8/31/15 | 1,080 | 1,103 | |||||||||
| 1.75%, 3/31/14 | 745 | 766 | |||||||||
| 2.25%, 1/31/15 | 580 | 608 | |||||||||
| 3.00%, 8/31/16 - 9/30/16 | 675 | 736 | |||||||||
| 3.63%, 8/15/19 | 330 | 375 | |||||||||
| 5,717 | |||||||||||
| Total Fixed Income Securities (Cost $14,615) | 14,964 | ||||||||||
| Shares | Value (000) | ||||||||||
| Common Stocks (49.5%) | |||||||||||
| Aerospace & Defense (1.5%) | |||||||||||
| Alliant Techsystems, Inc. (d) | 648 | $ | 32 | ||||||||
| Boeing Co. (The) | 601 | 45 | |||||||||
| Exelis, Inc. | 594 | 7 | |||||||||
| General Dynamics Corp. | 504 | 37 | |||||||||
| Goodrich Corp. | 197 | 25 | |||||||||
| Honeywell International, Inc. | 1,602 | 98 | |||||||||
| Huntington Ingalls Industries, Inc. (d)(e) | 53 | 2 | |||||||||
| L-3 Communications Holdings, Inc. (d) | 200 | 14 | |||||||||
| Lockheed Martin Corp. (d) | 262 | 23 | |||||||||
| Northrop Grumman Corp. | 222 | 13 | |||||||||
| Precision Castparts Corp. | 385 | 67 | |||||||||
| Raytheon Co. (d) | 1,435 | 76 | |||||||||
| Rockwell Collins, Inc. | 375 | 22 | |||||||||
| Textron, Inc. | 500 | 14 | |||||||||
| United Technologies Corp. | 1,579 | 131 | |||||||||
| 606 | |||||||||||
| Air Freight & Logistics (0.4%) | |||||||||||
| C.H. Robinson Worldwide, Inc. (d) | 200 | 13 | |||||||||
| Expeditors International of Washington, Inc. | 200 | 9 | |||||||||
| FedEx Corp. | 400 | 37 | |||||||||
| United Parcel Service, Inc., Class B (d) | 1,153 | 93 | |||||||||
| 152 | |||||||||||
| Airlines (0.0%) | |||||||||||
| Southwest Airlines Co. | 1,300 | 11 | |||||||||
| Auto Components (0.3%) | |||||||||||
| BorgWarner, Inc. (e) | 835 | 71 | |||||||||
| Johnson Controls, Inc. (d) | 1,614 | 52 | |||||||||
| 123 | |||||||||||
| Automobiles (0.0%) | |||||||||||
| Ford Motor Co. (d) | 531 | 7 | |||||||||
| Beverages (0.8%) | |||||||||||
| Brown-Forman Corp., Class B | 119 | 10 | |||||||||
| Coca-Cola Co. (The) | 2,226 | 165 | |||||||||
| Coca-Cola Enterprises, Inc. | 577 | 16 | |||||||||
| Constellation Brands, Inc., Class A (d)(e) | 500 | 12 | |||||||||
| Molson Coors Brewing Co. | 400 | 18 | |||||||||
| PepsiCo, Inc. | 1,485 | 99 | |||||||||
| 320 | |||||||||||
| Biotechnology (0.5%) | |||||||||||
| Amgen, Inc. | 1,071 | 73 | |||||||||
| Biogen Idec, Inc. (e) | 314 | 39 | |||||||||
| Celgene Corp. (e) | 508 | 39 | |||||||||
| Gilead Sciences, Inc. (e) | 1,059 | 52 | |||||||||
| 203 | |||||||||||
| Capital Markets (0.7%) | |||||||||||
| Ameriprise Financial, Inc. | 100 | 6 | |||||||||
| Bank of New York Mellon Corp. (The) | 1,914 | 46 | |||||||||
| BlackRock, Inc. | 31 | 6 | |||||||||
| Charles Schwab Corp. (The) | 747 | 11 | |||||||||
The accompanying notes are an integral part of the financial statements.
6
2012 Semi-Annual Report
March 31, 2012 (unaudited)
Portfolio of Investments (cont'd)
Balanced Portfolio
| Shares | Value (000) | ||||||||||
| Capital Markets (cont'd) | |||||||||||
| Franklin Resources, Inc. (d) | 124 | $ | 15 | ||||||||
| Goldman Sachs Group, Inc. (The) | 990 | 123 | |||||||||
| Invesco Ltd. | 500 | 13 | |||||||||
| Janus Capital Group, Inc. | 200 | 2 | |||||||||
| Legg Mason, Inc. | 342 | 10 | |||||||||
| Northern Trust Corp. | 130 | 6 | |||||||||
| State Street Corp. | 716 | 33 | |||||||||
| T. Rowe Price Group, Inc. | 165 | 11 | |||||||||
| 282 | |||||||||||
| Chemicals (1.0%) | |||||||||||
| Air Products & Chemicals, Inc. (d) | 191 | 18 | |||||||||
| CF Industries Holdings, Inc. | 412 | 75 | |||||||||
| Dow Chemical Co. (The) (d) | 1,113 | 39 | |||||||||
| Eastman Chemical Co. | 200 | 10 | |||||||||
| Ecolab, Inc. (d) | 226 | 14 | |||||||||
| EI du Pont de Nemours & Co. | 2,121 | 112 | |||||||||
| FMC Corp. (d) | 119 | 13 | |||||||||
| International Flavors & Fragrances, Inc. (d) | 119 | 7 | |||||||||
| Monsanto Co. | 530 | 42 | |||||||||
| Mosaic Co. (The) | 52 | 3 | |||||||||
| PPG Industries, Inc. | 211 | 20 | |||||||||
| Praxair, Inc. | 369 | 42 | |||||||||
| Sherwin-Williams Co. (The) | 119 | 13 | |||||||||
| Sigma-Aldrich Corp. | 139 | 10 | |||||||||
| 418 | |||||||||||
| Commercial Banks (1.4%) | |||||||||||
| BB&T Corp. (d) | 1,177 | 37 | |||||||||
| Comerica, Inc. (d) | 400 | 13 | |||||||||
| Fifth Third Bancorp (d) | 1,511 | 21 | |||||||||
| Huntington Bancshares, Inc. | 1,600 | 10 | |||||||||
| KeyCorp | 1,356 | 12 | |||||||||
| M&T Bank Corp. (d) | 174 | 15 | |||||||||
| PNC Financial Services Group, Inc. | 803 | 52 | |||||||||
| Regions Financial Corp. | 2,532 | 17 | |||||||||
| SunTrust Banks, Inc. | 908 | 22 | |||||||||
| US Bancorp | 2,852 | 90 | |||||||||
| Wells Fargo & Co. | 7,534 | 257 | |||||||||
| Zions Bancorporation (d) | 400 | 9 | |||||||||
| 555 | |||||||||||
| Commercial Services & Supplies (0.2%) | |||||||||||
| Avery Dennison Corp. (d) | 234 | 7 | |||||||||
| Cintas Corp. | 287 | 11 | |||||||||
| Iron Mountain, Inc. (d) | 206 | 6 | |||||||||
| Pitney Bowes, Inc. | 429 | 7 | |||||||||
| Republic Services, Inc. | 446 | 14 | |||||||||
| RR Donnelley & Sons Co. (d) | 458 | 6 | |||||||||
| Stericycle, Inc. (d)(e) | 119 | 10 | |||||||||
| Waste Management, Inc. | 1,009 | 35 | |||||||||
| 96 | |||||||||||
| Communications Equipment (1.2%) | |||||||||||
| Ciena Corp. (d)(e) | 7,434 | 120 | |||||||||
| Cisco Systems, Inc. | 6,986 | 148 | |||||||||
| Shares | Value (000) | ||||||||||
| Juniper Networks, Inc. (d)(e) | 839 | $ | 19 | ||||||||
| Motorola Mobility Holdings, Inc. (e) | 410 | 16 | |||||||||
| Motorola Solutions, Inc. | 368 | 19 | |||||||||
| QUALCOMM, Inc. | 2,239 | 152 | |||||||||
| 474 | |||||||||||
| Computers & Peripherals (2.6%) | |||||||||||
| Apple, Inc. (e) | 1,233 | 739 | |||||||||
| Dell, Inc. (d)(e) | 1,924 | 32 | |||||||||
| EMC Corp. (e) | 2,971 | 89 | |||||||||
| Hewlett-Packard Co. | 3,963 | 95 | |||||||||
| Lexmark International, Inc., Class A (d) | 100 | 3 | |||||||||
| NetApp, Inc. (e) | 607 | 27 | |||||||||
| SanDisk Corp. (e) | 1,918 | 95 | |||||||||
| 1,080 | |||||||||||
| Construction & Engineering (0.3%) | |||||||||||
| Foster Wheeler AG (e) | 1,881 | 43 | |||||||||
| Jacobs Engineering Group, Inc. (e) | 200 | 9 | |||||||||
| URS Corp. | 1,683 | 71 | |||||||||
| 123 | |||||||||||
| Consumer Finance (0.3%) | |||||||||||
| American Express Co. | 944 | 54 | |||||||||
| Capital One Financial Corp. | 783 | 44 | |||||||||
| Discover Financial Services | 993 | 33 | |||||||||
| SLM Corp. | 444 | 7 | |||||||||
| 138 | |||||||||||
| Containers & Packaging (0.0%) | |||||||||||
| Ball Corp. | 239 | 10 | |||||||||
| Distributors (0.0%) | |||||||||||
| Genuine Parts Co. | 200 | 13 | |||||||||
| Diversified Consumer Services (0.1%) | |||||||||||
| Apollo Group, Inc., Class A (d)(e) | 258 | 10 | |||||||||
| DeVry, Inc. (d) | 119 | 4 | |||||||||
| H&R Block, Inc. (d) | 916 | 15 | |||||||||
| 29 | |||||||||||
| Diversified Financial Services (2.0%) | |||||||||||
| Bank of America Corp. | 18,046 | 173 | |||||||||
| Citigroup, Inc. (See Note G-2) (d) | 5,096 | 186 | |||||||||
| CME Group, Inc. | 138 | 40 | |||||||||
| JPMorgan Chase & Co. | 8,415 | 387 | |||||||||
| Leucadia National Corp. (d) | 123 | 3 | |||||||||
| Moody's Corp. (d) | 109 | 5 | |||||||||
| NASDAQ OMX Group, Inc. (The) (e) | 136 | 3 | |||||||||
| NYSE Euronext (d) | 331 | 10 | |||||||||
| 807 | |||||||||||
| Diversified Telecommunication Services (1.2%) | |||||||||||
| AT&T, Inc. | 7,477 | 234 | |||||||||
| CenturyLink, Inc. (d) | 1,957 | 76 | |||||||||
| Frontier Communications Corp. | 2,518 | 10 | |||||||||
| Verizon Communications, Inc. | 4,999 | 191 | |||||||||
| 511 | |||||||||||
The accompanying notes are an integral part of the financial statements.
7
2012 Semi-Annual Report
March 31, 2012 (unaudited)
Portfolio of Investments (cont'd)
Balanced Portfolio
| Shares | Value (000) | ||||||||||
| Electric Utilities (0.8%) | |||||||||||
| American Electric Power Co., Inc. | 769 | $ | 30 | ||||||||
| Duke Energy Corp. | 1,615 | 34 | |||||||||
| Edison International (d) | 735 | 31 | |||||||||
| Exelon Corp. | 633 | 25 | |||||||||
| FirstEnergy Corp. (d) | 395 | 18 | |||||||||
| NextEra Energy, Inc. (d) | 635 | 39 | |||||||||
| Pepco Holdings, Inc. | 85 | 2 | |||||||||
| PPL Corp. | 735 | 21 | |||||||||
| Progress Energy, Inc. | 405 | 21 | |||||||||
| Southern Co. (The) (d) | 2,119 | 95 | |||||||||
| 316 | |||||||||||
| Electrical Equipment (0.1%) | |||||||||||
| Emerson Electric Co. | 812 | 42 | |||||||||
| Electronic Equipment, Instruments & Components (0.3%) | |||||||||||
| Amphenol Corp., Class A (d) | 285 | 17 | |||||||||
| Arrow Electronics, Inc. (e) | 1,669 | 70 | |||||||||
| Corning, Inc. | 2,375 | 33 | |||||||||
| Jabil Circuit, Inc. | 300 | 8 | |||||||||
| Molex, Inc. | 164 | 5 | |||||||||
| 133 | |||||||||||
| Energy Equipment & Services (1.2%) | |||||||||||
| Baker Hughes, Inc. | 639 | 27 | |||||||||
| Cameron International Corp. (d)(e) | 717 | 38 | |||||||||
| Diamond Offshore Drilling, Inc. (d) | 139 | 9 | |||||||||
| FMC Technologies, Inc. (e) | 754 | 38 | |||||||||
| Halliburton Co. | 1,609 | 54 | |||||||||
| National Oilwell Varco, Inc. (d) | 1,068 | 85 | |||||||||
| Noble Corp. (e) | 596 | 22 | |||||||||
| Schlumberger Ltd. | 3,137 | 219 | |||||||||
| 492 | |||||||||||
| Food & Staples Retailing (1.2%) | |||||||||||
| Costco Wholesale Corp. | 595 | 54 | |||||||||
| CVS Caremark Corp. | 1,673 | 75 | |||||||||
| Kroger Co. (The) | 772 | 19 | |||||||||
| Safeway, Inc. | 2,695 | 55 | |||||||||
| Sysco Corp. | 1,087 | 32 | |||||||||
| Wal-Mart Stores, Inc. (d) | 2,687 | 164 | |||||||||
| Walgreen Co. (d) | 458 | 15 | |||||||||
| Whole Foods Market, Inc. | 705 | 59 | |||||||||
| 473 | |||||||||||
| Food Products (1.2%) | |||||||||||
| Archer-Daniels-Midland Co. | 1,016 | 32 | |||||||||
| Campbell Soup Co. (d) | 400 | 14 | |||||||||
| ConAgra Foods, Inc. | 3,093 | 81 | |||||||||
| General Mills, Inc. | 1,024 | 40 | |||||||||
| H.J. Heinz Co. (d) | 543 | 29 | |||||||||
| Hershey Co. (The) | 200 | 12 | |||||||||
| JM Smucker Co. (The) (d) | 223 | 18 | |||||||||
| Kellogg Co. | 462 | 25 | |||||||||
| Kraft Foods, Inc., Class A | 2,284 | 87 | |||||||||
| Shares | Value (000) | ||||||||||
| Mead Johnson Nutrition Co. | 324 | $ | 27 | ||||||||
| Sara Lee Corp. | 878 | 19 | |||||||||
| Smithfield Foods, Inc. (d)(e) | 3,334 | 74 | |||||||||
| Tyson Foods, Inc., Class A | 700 | 13 | |||||||||
| 471 | |||||||||||
| Health Care Equipment & Supplies (0.8%) | |||||||||||
| Baxter International, Inc. | 708 | 42 | |||||||||
| Becton Dickinson and Co. | 461 | 36 | |||||||||
| Boston Scientific Corp. (d)(e) | 2,517 | 15 | |||||||||
| CR Bard, Inc. | 139 | 14 | |||||||||
| Intuitive Surgical, Inc. (d)(e) | 135 | 73 | |||||||||
| Medtronic, Inc. (d) | 1,071 | 42 | |||||||||
| St. Jude Medical, Inc. | 569 | 25 | |||||||||
| Stryker Corp. (d) | 590 | 33 | |||||||||
| Varian Medical Systems, Inc. (d)(e) | 258 | 18 | |||||||||
| Zimmer Holdings, Inc. (d) | 302 | 19 | |||||||||
| 317 | |||||||||||
| Health Care Providers & Services (1.6%) | |||||||||||
| Aetna, Inc. | 519 | 26 | |||||||||
| AmerisourceBergen Corp. (d) | 638 | 25 | |||||||||
| Cardinal Health, Inc. | 439 | 19 | |||||||||
| Cigna Corp. | 465 | 23 | |||||||||
| Coventry Health Care, Inc. | 2,409 | 86 | |||||||||
| DaVita, Inc. (e) | 139 | 12 | |||||||||
| Express Scripts, Inc. (e) | 766 | 41 | |||||||||
| HealthSouth Corp. (d)(e) | 3,600 | 74 | |||||||||
| Laboratory Corp. of America Holdings (e) | 183 | 17 | |||||||||
| McKesson Corp. | 319 | 28 | |||||||||
| Medco Health Solutions, Inc. (e) | 543 | 38 | |||||||||
| Omnicare, Inc. (d) | 2,218 | 79 | |||||||||
| Patterson Cos., Inc. (d) | 358 | 12 | |||||||||
| Quest Diagnostics, Inc. | 139 | 8 | |||||||||
| Tenet Healthcare Corp. (d)(e) | 1,432 | 8 | |||||||||
| UnitedHealth Group, Inc. | 750 | 44 | |||||||||
| Universal Health Services, Inc., Class B (d) | 1,501 | 63 | |||||||||
| WellPoint, Inc. (d) | 419 | 31 | |||||||||
| 634 | |||||||||||
| Health Care Technology (0.1%) | |||||||||||
| Cerner Corp. (e) | 292 | 22 | |||||||||
| Hotels, Restaurants & Leisure (1.1%) | |||||||||||
| Carnival Corp. | 653 | 21 | |||||||||
| Darden Restaurants, Inc. (d) | 138 | 7 | |||||||||
| International Game Technology (d) | 996 | 17 | |||||||||
| Marriott International, Inc., Class A (d) | 318 | 12 | |||||||||
| Marriott Vacations Worldwide Corp. (e) | 31 | 1 | |||||||||
| McDonald's Corp. | 1,555 | 152 | |||||||||
| Starbucks Corp. | 1,011 | 56 | |||||||||
| Starwood Hotels & Resorts Worldwide, Inc. | 175 | 10 | |||||||||
| Wyndham Worldwide Corp. | 477 | 22 | |||||||||
| Wynn Resorts Ltd. | 119 | 15 | |||||||||
| Yum! Brands, Inc. | 1,638 | 117 | |||||||||
| 430 | |||||||||||
The accompanying notes are an integral part of the financial statements.
8
2012 Semi-Annual Report
March 31, 2012 (unaudited)
Portfolio of Investments (cont'd)
Balanced Portfolio
| Shares | Value (000) | ||||||||||
| Household Durables (0.2%) | |||||||||||
| Harman International Industries, Inc. | 139 | $ | 6 | ||||||||
| Toll Brothers, Inc. (d)(e) | 3,034 | 73 | |||||||||
| 79 | |||||||||||
| Household Products (1.0%) | |||||||||||
| Colgate-Palmolive Co. | 712 | 69 | |||||||||
| Kimberly-Clark Corp. | 701 | 52 | |||||||||
| Procter & Gamble Co. (The) | 4,267 | 287 | |||||||||
| 408 | |||||||||||
| Independent Power Producers & Energy Traders (0.1%) | |||||||||||
| AES Corp. (The) (d)(e) | 1,404 | 19 | |||||||||
| NRG Energy, Inc. (e) | 1,611 | 25 | |||||||||
| 44 | |||||||||||
| Industrial Conglomerates (1.1%) | |||||||||||
| 3M Co. | 802 | 72 | |||||||||
| Danaher Corp. (d) | 1,009 | 56 | |||||||||
| General Electric Co. | 10,833 | 217 | |||||||||
| Tyco International Ltd. | 1,702 | 96 | |||||||||
| 441 | |||||||||||
| Information Technology Services (1.5%) | |||||||||||
| Accenture PLC, Class A | 82 | 5 | |||||||||
| Automatic Data Processing, Inc. | 528 | 29 | |||||||||
| Cognizant Technology Solutions Corp., Class A (e) | 421 | 32 | |||||||||
| Fidelity National Information Services, Inc. | 100 | 3 | |||||||||
| International Business Machines Corp. | 1,940 | 405 | |||||||||
| Mastercard, Inc., Class A | 123 | 52 | |||||||||
| Paychex, Inc. | 450 | 14 | |||||||||
| Visa, Inc., Class A (d) | 555 | 66 | |||||||||
| Western Union Co. (The) | 1,290 | 23 | |||||||||
| 629 | |||||||||||
| Insurance (1.8%) | |||||||||||
| Aflac, Inc. | 471 | 22 | |||||||||
| Allstate Corp. (The) (d) | 889 | 29 | |||||||||
| AON Corp. | 380 | 19 | |||||||||
| Assurant, Inc. (d) | 1,261 | 51 | |||||||||
| Berkshire Hathaway, Inc., Class B (e) | 989 | 80 | |||||||||
| Chubb Corp. (The) | 1,546 | 107 | |||||||||
| Fidelity National Financial, Inc. (d) | 2,892 | 52 | |||||||||
| Hartford Financial Services Group, Inc. | 685 | 14 | |||||||||
| Lincoln National Corp. (d) | 1,593 | 42 | |||||||||
| Loews Corp. | 737 | 29 | |||||||||
| Marsh & McLennan Cos., Inc. (d) | 737 | 24 | |||||||||
| MetLife, Inc. (d) | 1,293 | 48 | |||||||||
| PartnerRe Ltd. | 652 | 44 | |||||||||
| Principal Financial Group, Inc. | 1,490 | 44 | |||||||||
| Progressive Corp. (The) (d) | 713 | 17 | |||||||||
| Prudential Financial, Inc. (d) | 380 | 24 | |||||||||
| Travelers Cos., Inc. (The) | 685 | 41 | |||||||||
| Unum Group (d) | 2,400 | 59 | |||||||||
| 746 | |||||||||||
| Shares | Value (000) | ||||||||||
| Internet & Catalog Retail (0.3%) | |||||||||||
| Amazon.com, Inc. (e) | 446 | $ | 90 | ||||||||
| Expedia, Inc. (d) | 201 | 7 | |||||||||
| NetFlix, Inc. (d)(e) | 100 | 11 | |||||||||
| Priceline.com, Inc. (d)(e) | 37 | 27 | |||||||||
| TripAdvisor, Inc. (d)(e) | 201 | 7 | |||||||||
| 142 | |||||||||||
| Internet Software & Services (0.8%) | |||||||||||
| eBay, Inc. (e) | 1,582 | 58 | |||||||||
| Google, Inc., Class A (e) | 344 | 221 | |||||||||
| Yahoo!, Inc. (e) | 3,657 | 56 | |||||||||
| 335 | |||||||||||
| Leisure Equipment & Products (0.1%) | |||||||||||
| Hasbro, Inc. (d) | 358 | 13 | |||||||||
| Mattel, Inc. | 477 | 16 | |||||||||
| 29 | |||||||||||
| Life Sciences Tools & Services (0.2%) | |||||||||||
| Agilent Technologies, Inc. (d) | 153 | 7 | |||||||||
| Life Technologies Corp. (e) | 265 | 13 | |||||||||
| Thermo Fisher Scientific, Inc. | 818 | 46 | |||||||||
| 66 | |||||||||||
| Machinery (1.0%) | |||||||||||
| Caterpillar, Inc. | 1,340 | 143 | |||||||||
| Cummins, Inc. (d) | 458 | 55 | |||||||||
| Deere & Co. | 551 | 44 | |||||||||
| Eaton Corp. | 300 | 15 | |||||||||
| Illinois Tool Works, Inc. (d) | 1,867 | 107 | |||||||||
| ITT Corp. (d) | 297 | 7 | |||||||||
| PACCAR, Inc. | 255 | 12 | |||||||||
| Stanley Black & Decker, Inc. | 139 | 11 | |||||||||
| Xylem, Inc. | 594 | 16 | |||||||||
| 410 | |||||||||||
| Media (1.7%) | |||||||||||
| AMC Networks, Inc., Class A (e) | 119 | 5 | |||||||||
| Cablevision Systems Corp. (d) | 477 | 7 | |||||||||
| CBS Corp., Class B | 768 | 26 | |||||||||
| Comcast Corp., Class A | 4,271 | 128 | |||||||||
| DIRECTV, Class A (e) | 1,303 | 64 | |||||||||
| Discovery Communications, Inc. (d)(e) | 377 | 19 | |||||||||
| Gannett Co., Inc. (d) | 600 | 9 | |||||||||
| Interpublic Group of Cos., Inc. (The) | 835 | 10 | |||||||||
| McGraw-Hill Cos., Inc. (The) | 465 | 23 | |||||||||
| News Corp., Class A | 2,959 | 58 | |||||||||
| Omnicom Group, Inc. (d) | 437 | 22 | |||||||||
| Scripps Networks Interactive, Inc., Class A (d) | 100 | 5 | |||||||||
| Time Warner Cable, Inc. (d) | 546 | 45 | |||||||||
| Time Warner, Inc. | 3,039 | 115 | |||||||||
| Viacom, Inc., Class B | 1,020 | 48 | |||||||||
| Walt Disney Co. (The) (d) | 2,516 | 110 | |||||||||
| 694 | |||||||||||
The accompanying notes are an integral part of the financial statements.
9
2012 Semi-Annual Report
March 31, 2012 (unaudited)
Portfolio of Investments (cont'd)
Balanced Portfolio
| Shares | Value (000) | ||||||||||
| Metals & Mining (0.5%) | |||||||||||
| Alcoa, Inc. (d) | 1,129 | $ | 11 | ||||||||
| Allegheny Technologies, Inc. | 200 | 8 | |||||||||
| Cliffs Natural Resources, Inc. | 139 | 10 | |||||||||
| Freeport-McMoRan Copper & Gold, Inc. | 1,048 | 40 | |||||||||
| Molycorp, Inc. (e) | 867 | 29 | |||||||||
| Newmont Mining Corp. | 443 | 23 | |||||||||
| Nucor Corp. | 187 | 8 | |||||||||
| Steel Dynamics, Inc. (d) | 4,992 | 73 | |||||||||
| United States Steel Corp. (d) | 100 | 3 | |||||||||
| 205 | |||||||||||
| Multi-Utilities (0.7%) | |||||||||||
| CenterPoint Energy, Inc. (d) | 58 | 1 | |||||||||
| Consolidated Edison, Inc. | 405 | 24 | |||||||||
| Dominion Resources, Inc. (d) | 1,934 | 99 | |||||||||
| DTE Energy Co. | 58 | 3 | |||||||||
| Integrys Energy Group, Inc. | 1,062 | 56 | |||||||||
| NiSource, Inc. (d) | 58 | 2 | |||||||||
| PG&E Corp. (d) | 735 | 32 | |||||||||
| Public Service Enterprise Group, Inc. | 769 | 24 | |||||||||
| Sempra Energy | 405 | 24 | |||||||||
| Wisconsin Energy Corp. (d) | 455 | 16 | |||||||||
| Xcel Energy, Inc. | 769 | 20 | |||||||||
| 301 | |||||||||||
| Multiline Retail (0.3%) | |||||||||||
| Family Dollar Stores, Inc. | 200 | 12 | |||||||||
| JC Penney Co., Inc. (d) | 400 | 14 | |||||||||
| Kohl's Corp. | 295 | 15 | |||||||||
| Macy's, Inc. | 446 | 18 | |||||||||
| Nordstrom, Inc. | 161 | 9 | |||||||||
| Target Corp. | 904 | 53 | |||||||||
| 121 | |||||||||||
| Office Electronics (0.0%) | |||||||||||
| Xerox Corp. | 1,624 | 13 | |||||||||
| Oil, Gas & Consumable Fuels (3.9%) | |||||||||||
| Anadarko Petroleum Corp. | 1,850 | 145 | |||||||||
| Apache Corp. | 704 | 71 | |||||||||
| Chesapeake Energy Corp. (d) | 3,206 | 74 | |||||||||
| Chevron Corp. | 1,993 | 214 | |||||||||
| ConocoPhillips | 1,969 | 150 | |||||||||
| Consol Energy, Inc. (d) | 753 | 26 | |||||||||
| Denbury Resources, Inc. (e) | 1,251 | 23 | |||||||||
| Devon Energy Corp. | 703 | 50 | |||||||||
| El Paso Corp. | 1,270 | 38 | |||||||||
| EOG Resources, Inc. | 468 | 52 | |||||||||
| Exxon Mobil Corp. | 3,901 | 338 | |||||||||
| Hess Corp. | 1,010 | 60 | |||||||||
| Marathon Oil Corp. | 700 | 22 | |||||||||
| Marathon Petroleum Corp. | 450 | 19 | |||||||||
| Murphy Oil Corp. | 255 | 14 | |||||||||
| Newfield Exploration Co. (e) | 377 | 13 | |||||||||
| Noble Energy, Inc. | 257 | 25 | |||||||||
| Shares | Value (000) | ||||||||||
| Occidental Petroleum Corp. | 1,179 | $ | 112 | ||||||||
| Peabody Energy Corp. | 761 | 22 | |||||||||
| Pioneer Natural Resources Co. | 377 | 42 | |||||||||
| Southwestern Energy Co. (e) | 1,090 | 33 | |||||||||
| Spectra Energy Corp. (d) | 754 | 24 | |||||||||
| Valero Energy Corp. | 649 | 17 | |||||||||
| Williams Cos., Inc. (The) | 779 | 24 | |||||||||
| WPX Energy, Inc. (e) | 326 | 6 | |||||||||
| 1,614 | |||||||||||
| Paper & Forest Products (0.1%) | |||||||||||
| International Paper Co. | 425 | 15 | |||||||||
| MeadWestvaco Corp. | 1,449 | 46 | |||||||||
| 61 | |||||||||||
| Personal Products (0.0%) | |||||||||||
| Avon Products, Inc. (d) | 701 | 14 | |||||||||
| Estee Lauder Cos., Inc. (The), Class A (d) | 70 | 4 | |||||||||
| 18 | |||||||||||
| Pharmaceuticals (2.6%) | |||||||||||
| Abbott Laboratories | 2,333 | 143 | |||||||||
| Allergan, Inc. | 559 | 53 | |||||||||
| Bristol-Myers Squibb Co. | 4,662 | 157 | |||||||||
| Eli Lilly & Co. | 879 | 36 | |||||||||
| Hospira, Inc. (e) | 820 | 31 | |||||||||
| Johnson & Johnson | 3,694 | 244 | |||||||||
| Merck & Co., Inc. | 4,012 | 154 | |||||||||
| Pfizer, Inc. | 11,439 | 259 | |||||||||
| 1,077 | |||||||||||
| Professional Services (0.0%) | |||||||||||
| Dun & Bradstreet Corp. (The) | 119 | 10 | |||||||||
| Equifax, Inc. | 149 | 7 | |||||||||
| 17 | |||||||||||
| Real Estate Investment Trusts (REITs) (1.0%) | |||||||||||
| American Tower Corp., Class A | 698 | 44 | |||||||||
| AvalonBay Communities, Inc. REIT | 139 | 20 | |||||||||
| Boston Properties, Inc. REIT | 190 | 20 | |||||||||
| Equity Residential REIT (d) | 523 | 33 | |||||||||
| HCP, Inc. REIT | 533 | 21 | |||||||||
| Health Care, Inc. REIT | 217 | 12 | |||||||||
| Host Hotels & Resorts, Inc. REIT (d) | 1,058 | 17 | |||||||||
| Kimco Realty Corp. REIT | 824 | 16 | |||||||||
| Plum Creek Timber Co., Inc. REIT (d) | 374 | 16 | |||||||||
| ProLogis, Inc. REIT | 744 | 27 | |||||||||
| Public Storage REIT | 213 | 29 | |||||||||
| Simon Property Group, Inc. REIT (d) | 512 | 75 | |||||||||
| Ventas, Inc. REIT (d) | 446 | 25 | |||||||||
| Vornado Realty Trust REIT | 218 | 18 | |||||||||
| Weyerhaeuser Co. REIT | 837 | 18 | |||||||||
| 391 | |||||||||||
| Real Estate Management & Development (0.0%) | |||||||||||
| CBRE Group, Inc. (e) | 716 | 14 | |||||||||
The accompanying notes are an integral part of the financial statements.
10
2012 Semi-Annual Report
March 31, 2012 (unaudited)
Portfolio of Investments (cont'd)
Balanced Portfolio
| Shares | Value (000) | ||||||||||
| Road & Rail (0.5%) | |||||||||||
| CSX Corp. | 1,552 | $ | 33 | ||||||||
| Norfolk Southern Corp. | 1,204 | 79 | |||||||||
| Union Pacific Corp. | 694 | 75 | |||||||||
| 187 | |||||||||||
| Semiconductors & Semiconductor Equipment (2.6%) | |||||||||||
| Advanced Micro Devices, Inc. (d)(e) | 2,132 | 17 | |||||||||
| Altera Corp. | 1,104 | 44 | |||||||||
| Analog Devices, Inc. (d) | 978 | 40 | |||||||||
| Applied Materials, Inc. | 4,295 | 53 | |||||||||
| Broadcom Corp., Class A (d)(e) | 1,506 | 59 | |||||||||
| First Solar, Inc. (d)(e) | 72 | 2 | |||||||||
| Intel Corp. | 18,335 | 515 | |||||||||
| KLA-Tencor Corp. | 519 | 28 | |||||||||
| Linear Technology Corp. | 829 | 28 | |||||||||
| LSI Corp. (e) | 2,024 | 18 | |||||||||
| Microchip Technology, Inc. (d) | 663 | 25 | |||||||||
| Micron Technology, Inc. (e) | 3,283 | 27 | |||||||||
| NVIDIA Corp. (e) | 2,018 | 31 | |||||||||
| Texas Instruments, Inc. | 3,879 | 130 | |||||||||
| Xilinx, Inc. (d) | 871 | 32 | |||||||||
| 1,049 | |||||||||||
| Software (1.8%) | |||||||||||
| Adobe Systems, Inc. (e) | 932 | 32 | |||||||||
| Citrix Systems, Inc. (e) | 414 | 33 | |||||||||
| Intuit, Inc. (d) | 466 | 28 | |||||||||
| Microsoft Corp. | 11,488 | 370 | |||||||||
| Oracle Corp. | 4,572 | 133 | |||||||||
| Red Hat, Inc. (e) | 1,513 | 91 | |||||||||
| Salesforce.com, Inc. (d)(e) | 313 | 48 | |||||||||
| Symantec Corp. (e) | 1,072 | 20 | |||||||||
| 755 | |||||||||||
| Specialty Retail (1.3%) | |||||||||||
| AutoZone, Inc. (e) | 39 | 15 | |||||||||
| Bed Bath & Beyond, Inc. (d)(e) | 386 | 26 | |||||||||
| Best Buy Co., Inc. (d) | 368 | 9 | |||||||||
| CarMax, Inc. (e) | 442 | 15 | |||||||||
| Gap, Inc. (The) (d) | 5,287 | 138 | |||||||||
| Home Depot, Inc. | 3,305 | 166 | |||||||||
| Lowe's Cos., Inc. | 1,294 | 41 | |||||||||
| Ltd. Brands, Inc. (d) | 422 | 20 | |||||||||
| O'Reilly Automotive, Inc. (e) | 134 | 12 | |||||||||
| Ross Stores, Inc. | 168 | 10 | |||||||||
| Staples, Inc. | 921 | 15 | |||||||||
| Tiffany & Co. (d) | 134 | 9 | |||||||||
| TJX Cos., Inc. | 1,140 | 45 | |||||||||
| 521 | |||||||||||
| Textiles, Apparel & Luxury Goods (0.5%) | |||||||||||
| Coach, Inc. | 501 | 39 | |||||||||
| NIKE, Inc., Class B | 404 | 44 | |||||||||
| Shares | Value (000) | ||||||||||
| Ralph Lauren Corp. | 142 | $ | 25 | ||||||||
| VF Corp. | 546 | 79 | |||||||||
| 187 | |||||||||||
| Thrifts & Mortgage Finance (0.0%) | |||||||||||
| Hudson City Bancorp, Inc. (d) | 400 | 3 | |||||||||
| People's United Financial, Inc. (d) | 1,100 | 14 | |||||||||
| 17 | |||||||||||
| Tobacco (1.0%) | |||||||||||
| Altria Group, Inc. | 2,587 | 80 | |||||||||
| Lorillard, Inc. | 200 | 26 | |||||||||
| Philip Morris International, Inc. | 2,584 | 229 | |||||||||
| Reynolds American, Inc. | 2,031 | 84 | |||||||||
| 419 | |||||||||||
| Wireless Telecommunication Services (0.0%) | |||||||||||
| MetroPCS Communications, Inc. (e) | 600 | 5 | |||||||||
| Sprint Nextel Corp. (e) | 2,982 | 9 | |||||||||
| 14 | |||||||||||
| Total Common Stocks (Cost $19,143) | 20,292 | ||||||||||
| Convertible Preferred Stock (0.4%) | |||||||||||
| Alternative Energy (0.4%) | |||||||||||
| Better Place, Inc. (e)(f)(g) (Cost $84) | 33,466 | 152 | |||||||||
| Investment Companies (1.0%) | |||||||||||
| iShares MSCI EMU Index Fund (d) | 200 | 6 | |||||||||
| Morgan Stanley Institutional Fund, Inc. — Emerging Markets Portfolio (See Note G-2) | 4,388 | 108 | |||||||||
| Technology Select Sector SPDR Fund (d) | 9,300 | 280 | |||||||||
| Total Investment Companies (Cost $371) | 394 | ||||||||||
| No. of Rights | |||||||||||
| Right (0.0%) | |||||||||||
| Pharmaceuticals (0.0%) | |||||||||||
| Sanofi (France) (e) (Cost $—@) | 54 | — | @ | ||||||||
| Shares | |||||||||||
| Short-Term Investments (31.5%) | |||||||||||
| Securities held as Collateral on Loaned Securities (17.3%) | |||||||||||
| Investment Company (14.5%) | |||||||||||
| Morgan Stanley Institutional Liquidity Funds — Money Market Portfolio — Institutional Class (See Note G-2) | 5,948,699 | 5,949 | |||||||||
| Face Amount (000) | |||||||||||
| Repurchase Agreements (2.8%) | |||||||||||
| Barclays Capital, Inc., (0.15%, dated 3/30/12, due 4/2/12; proceeds $158; fully collateralized by a U.S. Government Agency; Federal National Mortgage Association 4.00% due 1/1/42; valued at $161) | $ | 158 | 158 | ||||||||
The accompanying notes are an integral part of the financial statements.
11
2012 Semi-Annual Report
March 31, 2012 (unaudited)
Portfolio of Investments (cont'd)
Balanced Portfolio
| Face Amount (000) | Value (000) | ||||||||||
| Repurchase Agreements (cont'd) | |||||||||||
| Merrill Lynch & Co., Inc., (0.25%, dated 3/30/12, due 4/2/12; proceeds $976; fully collateralized by Common Stocks; Alliance Data Systems Corp.; American International Group, Inc.; Boeing Co. (The); Energy Transfer Equity LP; Freeport-McMoRan Copper & Gold, Inc.; GNC Holdings, Inc.; Hershey Co. (The); L-3 Communications Holdings, Inc.; McKesson Corp.; Teva Pharmaceutical Industries Ltd.; Two Harbors Investment Corp.; Vale SA; valued at $1,054) | $ | 976 | $ | 976 | |||||||
| 1,134 | |||||||||||
| Total Securities held as Collateral on Loaned Securities (Cost $7,083) | 7,083 | ||||||||||
| Shares | |||||||||||
| Investment Company (13.0%) | |||||||||||
| Morgan Stanley Institutional Liquidity Funds — Money Market Portfolio — Institutional Class (See Note G-2) (Cost $5,317) | 5,316,709 | 5,317 | |||||||||
| Face Amount (000) | |||||||||||
| U.S. Treasury Security (1.2%) | |||||||||||
| U.S. Treasury Bill | |||||||||||
| 0.09%, 6/7/12 (h) | $ | 500 | 500 | ||||||||
| Total Short-Term Investments (Cost $12,900) | 12,900 | ||||||||||
| Total Investments (118.9%) (Cost $47,113) Including $7,630 of Securities Loaned (i) | 48,702 | ||||||||||
| Liabilities in Excess of Other Assets (-18.9%) | (7,732 | ) | |||||||||
| Net Assets (100.0%) | $ | 40,970 | |||||||||
(a) Security is subject to delayed delivery.
(b) 144A security — Certain conditions for public sale may exist. Unless otherwise noted, these securities are deemed to be liquid.
(c) Variable/Floating Rate Security — Interest rate changes on these instruments are based on changes in a designated base rate. The rates shown are those in effect on March 31, 2012.
(d) All or a portion of this security was on loan at March 31, 2012.
(e) Non-income producing security.
(f) At March 31, 2012, the Portfolio held a fair valued security valued at approximately $152,000, representing 0.4% of net assets. This security has been fair valued as determined in good faith under procedures established by and under the general supervision of the Fund's Trustees.
(g) Security has been deemed illiquid at March 31, 2012.
(h) Rate shown is the yield to maturity at March 31, 2012.
(i) Securities are available for collateral in connection with securities purchased on a forward commitment basis, open foreign currency exchange contracts, futures contracts and swap agreements.
@ Value is less than $500.
IO Interest Only.
MTN Medium Term Note.
PAC Planned Amortization Class.
REMIC Real Estate Mortgage Investment Conduit.
SPDR Standard & Poor's Depository Receipt.
TBA To Be Announced.
Foreign Currency Exchange Contracts Information:
The Portfolio had the following foreign currency exchange contracts open at period end:
| Counterparty | Currency to Deliver (000) | Value (000) | Settlement Date | In Exchange For (000) | Value (000) | Unrealized Appreciation (Depreciation) (000) | |||||||||||||||||||||
| Goldman Sachs International | NOK | 276 | $ | 48 | 4/4/12 | USD | 49 | $ | 49 | $ | 1 | ||||||||||||||||
| JPMorgan Chase Bank | USD | 96 | 96 | 4/4/12 | NOK | 545 | 96 | (— | )@ | ||||||||||||||||||
| UBS AG | NOK | — | @ | — | @ | 4/4/12 | USD | — | @ | — | @ | (— | )@ | ||||||||||||||
| UBS AG | NOK | 269 | 47 | 4/4/12 | USD | 47 | 47 | — | @ | ||||||||||||||||||
| Goldman Sachs International | USD | 42 | 42 | 4/5/12 | CHF | 38 | 42 | — | @ | ||||||||||||||||||
| Goldman Sachs International | USD | — | @ | — | @ | 4/5/12 | SEK | — | @ | — | @ | (— | )@ | ||||||||||||||
| JPMorgan Chase Bank | CHF | 38 | 42 | 4/5/12 | USD | 42 | 42 | (— | )@ | ||||||||||||||||||
| UBS AG | SEK | 190 | 29 | 4/5/12 | USD | 29 | 29 | (— | )@ | ||||||||||||||||||
| UBS AG | USD | — | @ | — | @ | 4/5/12 | CHF | — | @ | — | @ | — | @ | ||||||||||||||
| UBS AG | USD | 28 | 28 | 4/5/12 | SEK | 190 | 29 | 1 | |||||||||||||||||||
| Deutsche Bank AG London | AUD | 418 | 433 | 4/19/12 | USD | 439 | 439 | 6 | |||||||||||||||||||
| Deutsche Bank AG London | AUD | 475 | 492 | 4/19/12 | USD | 497 | 497 | 5 | |||||||||||||||||||
| Deutsche Bank AG London | USD | 440 | 440 | 4/19/12 | EUR | 335 | 447 | 7 | |||||||||||||||||||
| Goldman Sachs International | EUR | 152 | 202 | 4/19/12 | USD | 199 | 199 | (3 | ) | ||||||||||||||||||
| JPMorgan Chase Bank | NOK | 394 | 69 | 4/19/12 | USD | 69 | 69 | — | @ | ||||||||||||||||||
| JPMorgan Chase Bank | USD | 50 | 50 | 4/19/12 | SEK | 340 | 51 | 1 | |||||||||||||||||||
| State Street Bank and Trust Co. | CLP | 580,930 | 1,186 | 4/19/12 | USD | 1,193 | 1,193 | 7 | |||||||||||||||||||
| UBS AG | BRL | 80 | 43 | 4/19/12 | USD | 44 | 44 | 1 | |||||||||||||||||||
| UBS AG | EUR | 411 | 548 | 4/19/12 | USD | 539 | 539 | (9 | ) | ||||||||||||||||||
| UBS AG | GBP | 45 | 72 | 4/19/12 | USD | 70 | 70 | (2 | ) | ||||||||||||||||||
| $ | 3,867 | $ | 3,882 | $ | 15 | ||||||||||||||||||||||
The accompanying notes are an integral part of the financial statements.
12
2012 Semi-Annual Report
March 31, 2012 (unaudited)
Portfolio of Investments (cont'd)
Balanced Portfolio
Futures Contracts:
The Portfolio had the following futures contracts open at period end:
| Number of Contracts | Value (000) | Expiration Date | Unrealized Appreciation (Depreciation) (000) | ||||||||||||||||
| Long: | |||||||||||||||||||
| DAX Index (Germany) | 4 | $ | 928 | Jun-12 | $ | 12 | |||||||||||||
| Euro Stoxx 50 Index (Germany) | 13 | 418 | Jun-12 | (11 | ) | ||||||||||||||
| FTSE 100 Index (United Kingdom) | 1 | 92 | Jun-12 | (1 | ) | ||||||||||||||
| FTSE MIB Index (United Kingdom) | 4 | 420 | Jun-12 | (15 | ) | ||||||||||||||
| NIKKEI 225 Index (Japan) | 6 | 368 | Jun-12 | 9 | |||||||||||||||
| S+P 500 E-Mini Index | 83 | 5,823 | Jun-12 | 57 | |||||||||||||||
| U.S. Treasury 10 yr. Note | 6 | 777 | Jun-12 | 8 | |||||||||||||||
| U.S. Treasury 30 yr. Bond | 1 | 138 | Jun-12 | 2 | |||||||||||||||
| Short: | |||||||||||||||||||
| ASX Spi 200 Index (Australia) | 1 | (113 | ) | Jun-12 | (1 | ) | |||||||||||||
| Copper High Grade Index | 1 | (96 | ) | May-12 | 4 | ||||||||||||||
| IBEX 35 Index (United Kingdom) | 4 | (423 | ) | Apr-12 | — | @ | |||||||||||||
| MSCI Emerging Market E-Mini | 15 | (779 | ) | Jun-12 | 11 | ||||||||||||||
| S+P TSE 60 Index | 8 | (1,129 | ) | Jun-12 | 2 | ||||||||||||||
| U.S. Treasury 2 yr. Note | 2 | (440 | ) | Jun-12 | (— | )@ | |||||||||||||
| Ultra Long U.S. Treasury Bond | 4 | (604 | ) | Jun-12 | (3 | ) | |||||||||||||
| $ | 74 | ||||||||||||||||||
Interest Rate Swap Agreements:
The Portfolio had the following interest rate swap agreements open at period end:
| Swap Counterparty | Floating Rate Index | Pay/Receive Floating Rate | Fixed Rate | Termination Date | Notional Amount (000) | Unrealized Appreciation (Depreciation) (000) | |||||||||||||||||||||
| Bank of America NA | 6 Month EURIBOR | Pay | 4.26 | % | 8/18/26 | EUR | 910 | $ | 40 | ||||||||||||||||||
| Bank of America NA | 3 Month LIBOR | Receive | 4.35 | 8/18/26 | $ | 1,220 | (22 | ) | |||||||||||||||||||
| Bank of America NA | 6 Month EURIBOR | Receive | 3.61 | 8/18/31 | EUR | 1,150 | (35 | ) | |||||||||||||||||||
| Bank of America NA | 3 Month LIBOR | Pay | 4.15 | 8/18/31 | $ | 1,515 | 21 | ||||||||||||||||||||
| Goldman Sachs — International | 3 Month LIBOR | Receive | 2.42 | 3/22/22 | 173 | (2 | ) | ||||||||||||||||||||
| JP Morgan Chase | 3 Month LIBOR | Receive | 2.43 | 3/22/22 | 84 | (1 | ) | ||||||||||||||||||||
| $ | 1 | ||||||||||||||||||||||||||
Total Return Swap Agreements:
The Portfolio had the following total return swap agreements open at period end:
| Counterparty | Index | Notional Amount (000) | Floating Rate | Pay/Receive Total Return of Referenced Index | Maturity Date | Unrealized Appreciation (Depreciation) (000) | |||||||||||||||||||||
| Goldman Sachs | Custom Construction Index | $ | 445 | 1-Month USD-LIBOR-minus 0.47% | Pay | 3/27/13 | $ | 9 | |||||||||||||||||||
| Goldman Sachs | Custom Miners Index | 145 | 1-Month USD-LIBOR-minus 0.35% | Pay | 2/13/13 | 1 | |||||||||||||||||||||
| Goldman Sachs | Custom Miners Index | 268 | 1-Month USD-LIBOR-minus 0.35% | Pay | 2/13/13 | 1 | |||||||||||||||||||||
| Bank of America NA | Merrill Lynch Custom Luxury Basket Index | 432 | 3-Month USD-LIBOR-minus 0.15% | Pay | 3/26/13 | 2 | |||||||||||||||||||||
| Bank of America NA | Merrill Lynch Custom Test Index | 431 | 3-Month USD-LIBOR-minus 0.10% | Pay | 3/26/13 | (3 | ) | ||||||||||||||||||||
| $ | 10 | ||||||||||||||||||||||||||
@ Value is less than $500.
EURIBOR Euro Interbank Offered Rate.
LIBOR London Interbank Offered Rate.
The accompanying notes are an integral part of the financial statements.
13
2012 Semi-Annual Report
March 31, 2012 (unaudited)
Portfolio of Investments (cont'd)
Balanced Portfolio
AUD — Australian Dollar
BRL — Brazilian Real
CHF — Swiss Franc
CLP — Chilean Peso
EUR — Euro
GBP — British Pound
NOK — Norwegian Krone
SEK — Swedish Krona
USD — United States Dollar
Fair Value Measurement Information:
The following is a summary of the inputs used to value the Portfolio's investments as of March 31, 2012. (See Note A-5 to the financial statements for further information regarding fair value measurement.)
| Investment Type | Level 1 Unadjusted quoted prices (000) | Level 2 Other significant observable inputs (000) | Level 3 Significant unobservable inputs (000) | Total (000) | |||||||||||||||
| Assets: | |||||||||||||||||||
| Fixed Income Securities | |||||||||||||||||||
| Agency Adjustable Rate Mortgage | $ | — | $ | 63 | $ | — | $ | 63 | |||||||||||
| Agency Fixed Rate Mortgages | — | 3,672 | — | 3,672 | |||||||||||||||
| Asset-Backed Securities | — | 342 | — | 342 | |||||||||||||||
| Collateralized Mortgage Obligations — Agency Collateral Series | — | 337 | — | 337 | |||||||||||||||
| Commercial Mortgage Backed Securities | — | 243 | — | 243 | |||||||||||||||
| Corporate Bonds | — | 3,267 | — | 3,267 | |||||||||||||||
| Mortgages — Other | — | 537 | — | 537 | |||||||||||||||
| Municipal Bonds | — | 45 | — | 45 | |||||||||||||||
| Sovereign | — | 184 | — | 184 | |||||||||||||||
| U.S. Agency Securities | — | 557 | — | 557 | |||||||||||||||
| U.S. Treasury Securities | — | 5,717 | — | 5,717 | |||||||||||||||
| Total Fixed Income Securities | — | 14,964 | — | 14,964 | |||||||||||||||
| Common Stocks | |||||||||||||||||||
| Aerospace & Defense | 606 | — | — | 606 | |||||||||||||||
| Air Freight & Logistics | 152 | — | — | 152 | |||||||||||||||
| Airlines | 11 | — | — | 11 | |||||||||||||||
| Auto Components | 123 | — | — | 123 | |||||||||||||||
| Automobiles | 7 | — | — | 7 | |||||||||||||||
| Beverages | 320 | — | — | 320 | |||||||||||||||
| Biotechnology | 203 | — | — | 203 | |||||||||||||||
| Capital Markets | 282 | — | — | 282 | |||||||||||||||
| Chemicals | 418 | — | — | 418 | |||||||||||||||
| Commercial Banks | 555 | — | — | 555 | |||||||||||||||
| Commercial Services & Supplies | 96 | — | — | 96 | |||||||||||||||
| Communications Equipment | 474 | — | — | 474 | |||||||||||||||
| Computers & Peripherals | 1,080 | — | — | 1,080 | |||||||||||||||
| Construction & Engineering | 123 | — | — | 123 | |||||||||||||||
| Consumer Finance | 138 | — | — | 138 | |||||||||||||||
| Containers & Packaging | 10 | ��� | — | 10 | |||||||||||||||
| Distributors | 13 | — | — | 13 | |||||||||||||||
| Diversified Consumer Services | 29 | — | — | 29 | |||||||||||||||
Fair Value Measurement Information: (cont'd)
| Investment Type | Level 1 Unadjusted quoted prices (000) | Level 2 Other significant observable inputs (000) | Level 3 Significant unobservable inputs (000) | Total (000) | |||||||||||||||
| Common Stocks (cont'd) | |||||||||||||||||||
| Diversified Financial Services | $ | 807 | $ | — | $ | — | $ | 807 | |||||||||||
| Diversified Telecommunication Services | 511 | — | — | 511 | |||||||||||||||
| Electric Utilities | 316 | — | — | 316 | |||||||||||||||
| Electrical Equipment | 42 | — | — | 42 | |||||||||||||||
| Electronic Equipment, Instruments & Components | 133 | — | — | 133 | |||||||||||||||
| Energy Equipment & Services | 492 | — | — | 492 | |||||||||||||||
| Food & Staples Retailing | 473 | — | — | 473 | |||||||||||||||
| Food Products | 471 | — | — | 471 | |||||||||||||||
| Health Care Equipment & Supplies | 317 | — | — | 317 | |||||||||||||||
| Health Care Providers & Services | 634 | — | — | 634 | |||||||||||||||
| Health Care Technology | 22 | — | — | 22 | |||||||||||||||
| Hotels, Restaurants & Leisure | 430 | — | — | 430 | |||||||||||||||
| Household Durables | 79 | — | — | 79 | |||||||||||||||
| Household Products | 408 | — | — | 408 | |||||||||||||||
| Independent Power Producers & Energy Traders | 44 | — | — | 44 | |||||||||||||||
| Industrial Conglomerates | 441 | — | — | 441 | |||||||||||||||
| Information Technology Services | 629 | — | — | 629 | |||||||||||||||
| Insurance | 746 | — | — | 746 | |||||||||||||||
| Internet & Catalog Retail | 142 | — | — | 142 | |||||||||||||||
| Internet Software & Services | 335 | — | — | 335 | |||||||||||||||
| Leisure Equipment & Products | 29 | — | — | 29 | |||||||||||||||
| Life Sciences Tools & Services | 66 | — | — | 66 | |||||||||||||||
| Machinery | 410 | — | — | 410 | |||||||||||||||
| Media | 694 | — | — | 694 | |||||||||||||||
| Metals & Mining | 205 | — | — | 205 | |||||||||||||||
| Multi-Utilities | 301 | — | — | 301 | |||||||||||||||
| Multiline Retail | 121 | — | — | 121 | |||||||||||||||
| Office Electronics | 13 | — | — | 13 | |||||||||||||||
| Oil, Gas & Consumable Fuels | 1,614 | — | — | 1,614 | |||||||||||||||
| Paper & Forest Products | 61 | — | — | 61 | |||||||||||||||
| Personal Products | 18 | — | — | 18 | |||||||||||||||
| Pharmaceuticals | 1,077 | — | — | 1,077 | |||||||||||||||
| Professional Services | 17 | — | — | 17 | |||||||||||||||
| Real Estate Investment Trusts (REITs) | 391 | — | — | 391 | |||||||||||||||
| Real Estate Management & Development | 14 | — | — | 14 | |||||||||||||||
| Road & Rail | 187 | — | — | 187 | |||||||||||||||
The accompanying notes are an integral part of the financial statements.
14
2012 Semi-Annual Report
March 31, 2012 (unaudited)
Portfolio of Investments (cont'd)
Balanced Portfolio
Fair Value Measurement Information: (cont'd)
| Investment Type | Level 1 Unadjusted quoted prices (000) | Level 2 Other significant observable inputs (000) | Level 3 Significant unobservable inputs (000) | Total (000) | |||||||||||||||
| Common Stocks (cont'd) | |||||||||||||||||||
| Semiconductors & Semiconductor Equipment | $ | 1,049 | $ | — | $ | — | $ | 1,049 | |||||||||||
| Software | 755 | — | — | 755 | |||||||||||||||
| Specialty Retail | 521 | — | — | 521 | |||||||||||||||
| Textiles, Apparel & Luxury Goods | 187 | — | — | 187 | |||||||||||||||
| Thrifts & Mortgage Finance | 17 | — | — | 17 | |||||||||||||||
| Tobacco | 419 | — | — | 419 | |||||||||||||||
| Wireless Telecommunication Services | 14 | — | — | 14 | |||||||||||||||
| Total Common Stocks | 20,292 | — | — | 20,292 | |||||||||||||||
| Convertible Preferred Stock | — | — | 152 | 152 | |||||||||||||||
| Investment Companies | 394 | — | — | 394 | |||||||||||||||
| Right | — | @ | — | — | — | @ | |||||||||||||
| Short-Term Investments | |||||||||||||||||||
| Repurchase Agreements | — | 1,134 | — | 1,134 | |||||||||||||||
| Investment Company | 11,266 | — | — | 11,266 | |||||||||||||||
| U.S. Treasury Security | — | 500 | — | 500 | |||||||||||||||
| Total Short-Term Investments | 11,266 | 1,634 | — | 12,900 | |||||||||||||||
| Foreign Currency Exchange Contracts | — | 29 | — | 29 | |||||||||||||||
| Futures Contracts | 105 | — | — | 105 | |||||||||||||||
| Interest Rate Swap Agreements | — | 61 | — | 61 | |||||||||||||||
| Total Return Swap Agreements | — | 13 | — | 13 | |||||||||||||||
| Total Assets | 32,057 | 16,701 | 152 | 48,910 | |||||||||||||||
| Liabilities: | |||||||||||||||||||
| Foreign Currency Exchange Contracts | — | (14 | ) | — | (14 | ) | |||||||||||||
| Futures Contracts | (31 | ) | — | — | (31 | ) | |||||||||||||
| Interest Rate Swap Agreements | — | (60 | ) | — | (60 | ) | |||||||||||||
| Total Return Swap Agreements | — | (3 | ) | — | (3 | ) | |||||||||||||
| Total Liabilities | (31 | ) | (77 | ) | — | (108 | ) | ||||||||||||
| Total | $ | 32,026 | $ | 16,624 | $ | 152 | $ | 48,802 | |||||||||||
Transfers between investment levels may occur as the markets fluctuate and/or the availability of data used in an investment's valuation changes. The Portfolio recognizes transfers between the levels as of the end of the period. As of March 31, 2012, the Portfolio did not have any significant investments transfer between investment levels.
Fair Value Measurement Information: (cont'd)
Following is a reconciliation of investments in which significant unobservable inputs (Level 3) were used in determining fair value.
| Convertible Preferred Stock (000) | |||||||
| Beginning Balance | $ | 84 | |||||
| Purchases | — | ||||||
| Sales | — | ||||||
| Amortization of discount | — | ||||||
| Transfers in | — | ||||||
| Transfers out | — | ||||||
| Change in unrealized appreciation (depreciation) | 68 | ||||||
| Realized gains (losses) | — | ||||||
| Ending Balance | $ | 152 | |||||
| Net change in unrealized appreciation/depreciation from investments still held as of March 31, 2012 | $ | 68 | |||||
@ Value is less than $500.
Portfolio Composition*
| Classification | Percentage of Total Investments | ||||||
| Common Stocks | 48.8 | % | |||||
| Fixed Income Securities | 35.9 | ||||||
| Short-Term Investments | 14.0 | ||||||
| Other** | 1.3 | ||||||
| Total Investments | 100.0 | %*** | |||||
* Percentages indicated are based upon total investments (excluding Securities held as Collateral on Loaned Securities) as of March 31, 2012.
** Industries and/or investment types representing less than 5% of total investments.
*** Does not include open long/short futures contracts with a value of approximately $12,548,000 and net unrealized appreciation of approximately $74,000. Also does not include open foreign currency exchange contracts with net unrealized appreciation of approximately $15,000 and open swap agreements with net unrealized appreciation of approximately $11,000.
The accompanying notes are an integral part of the financial statements.
15
2012 Semi-Annual Report
March 31, 2012 (unaudited)
Portfolio of Investments
Mid Cap Growth Portfolio
| Shares | Value (000) | ||||||||||
| Common Stocks (96.9%) | |||||||||||
| Air Transport (2.0%) | |||||||||||
| Expeditors International of Washington, Inc. | 3,004,615 | $ | 139,745 | ||||||||
| Alternative Energy (2.6%) | |||||||||||
| Range Resources Corp. | 2,047,125 | 119,020 | |||||||||
| Ultra Petroleum Corp. (a) | 2,977,886 | 67,389 | |||||||||
| 186,409 | |||||||||||
| Asset Management & Custodian (0.7%) | |||||||||||
| Greenhill & Co., Inc. | 1,073,048 | 46,828 | |||||||||
| Biotechnology (3.8%) | |||||||||||
| IDEXX Laboratories, Inc. (a) | 1,280,698 | 111,997 | |||||||||
| Illumina, Inc. (a) | 2,938,723 | 154,606 | |||||||||
| 266,603 | |||||||||||
| Cement (1.1%) | |||||||||||
| Martin Marietta Materials, Inc. | 888,183 | 76,055 | |||||||||
| Chemicals: Diversified (2.6%) | |||||||||||
| Intrepid Potash, Inc. (a) | 3,116,709 | 75,830 | |||||||||
| Rockwood Holdings, Inc. (a) | 2,056,282 | 107,235 | |||||||||
| 183,065 | |||||||||||
| Commercial Services (8.4%) | |||||||||||
| Gartner, Inc. (a) | 2,571,500 | 109,649 | |||||||||
| Intertek Group PLC (United Kingdom) | 3,156,547 | 126,778 | |||||||||
| Leucadia National Corp. | 3,380,338 | 88,227 | |||||||||
| MercadoLibre, Inc. (Brazil) | 695,150 | 67,978 | |||||||||
| Weight Watchers International, Inc. | 2,636,286 | 203,495 | |||||||||
| 596,127 | |||||||||||
| Communications Technology (5.0%) | |||||||||||
| Millicom International Cellular SA SDR (Sweden) | 571,172 | 64,751 | |||||||||
| Motorola Solutions, Inc. | 5,676,901 | 288,557 | |||||||||
| 353,308 | |||||||||||
| Computer Services, Software & Systems (16.0%) | |||||||||||
| Akamai Technologies, Inc. (a) | 3,324,944 | 122,025 | |||||||||
| Alibaba.com Ltd. (China) (a)(b) | 31,471,356 | 53,495 | |||||||||
| Citrix Systems, Inc. (a) | 783,246 | 61,806 | |||||||||
| IHS, Inc., Class A (a) | 1,164,845 | 109,088 | |||||||||
| LinkedIn Corp., Class A (a) | 2,049,409 | 209,019 | |||||||||
| Red Hat, Inc. (a) | 1,832,620 | 109,756 | |||||||||
| Salesforce.com, Inc. (a) | 1,045,265 | 161,504 | |||||||||
| Solera Holdings, Inc. | 2,707,326 | 124,239 | |||||||||
| Zynga, Inc., Class A (a) | 10,638,003 | 139,890 | |||||||||
| Zynga, Inc., Class B (a)(c)(d) | 3,390,490 | 42,347 | |||||||||
| 1,133,169 | |||||||||||
| Computer Technology (3.6%) | |||||||||||
| NVIDIA Corp. (a) | 1,396,016 | 21,485 | |||||||||
| Yandex N.V., Class A (Russia) (a) | 6,056,854 | 162,747 | |||||||||
| Youku.com, Inc. ADR (China) (a) | 3,106,136 | 68,304 | |||||||||
| 252,536 | |||||||||||
| Consumer Lending (1.5%) | |||||||||||
| IntercontinentalExchange, Inc. (a) | 776,648 | 106,727 | |||||||||
| Shares | Value (000) | ||||||||||
| Consumer Services: Miscellaneous (2.2%) | |||||||||||
| Qualicorp SA (Brazil) (a) | 10,808,545 | $ | 92,664 | ||||||||
| Sun Art Retail Group Ltd. (Hong Kong) (a) | 45,309,110 | 61,380 | |||||||||
| 154,044 | |||||||||||
| Cosmetics (0.9%) | |||||||||||
| Natura Cosmeticos SA (Brazil) | 2,917,711 | 63,455 | |||||||||
| Diversified Materials & Processing (1.4%) | |||||||||||
| Schindler Holding AG (Switzerland) | 838,395 | 100,864 | |||||||||
| Diversified Media (3.0%) | |||||||||||
| Factset Research Systems, Inc. | 1,027,933 | 101,806 | |||||||||
| McGraw-Hill Cos., Inc. (The) | 2,311,282 | 112,028 | |||||||||
| 213,834 | |||||||||||
| Diversified Retail (9.2%) | |||||||||||
| Ctrip.com International Ltd. ADR (China) (a) | 2,278,685 | 49,311 | |||||||||
| Dollar Tree, Inc. (a) | 1,137,155 | 107,450 | |||||||||
| Fastenal Co. | 4,968,859 | 268,815 | |||||||||
| Groupon, Inc. (a) | 935,773 | 17,199 | |||||||||
| Groupon, Inc. Series A (a)(c)(d) | 5,992,988 | 106,495 | |||||||||
| NetFlix, Inc. (a) | 857,715 | 98,672 | |||||||||
| 647,942 | |||||||||||
| Education Services (0.9%) | |||||||||||
| New Oriental Education & Technology Group, Inc. ADR (China) (a) | 2,450,769 | 67,298 | |||||||||
| Electronic Entertainment (0.8%) | |||||||||||
| Nexon Co., Ltd. (Korea, Republic of) (a) | 3,097,745 | 53,968 | |||||||||
| Financial Data & Systems (5.4%) | |||||||||||
| MSCI, Inc., Class A (a) | 5,067,356 | 186,530 | |||||||||
| Verisk Analytics, Inc., Class A (a) | 4,088,659 | 192,044 | |||||||||
| 378,574 | |||||||||||
| Health Care Services (2.6%) | |||||||||||
| athenahealth, Inc. (a) | 1,159,804 | 85,965 | |||||||||
| Stericycle, Inc. (a) | 1,151,676 | 96,326 | |||||||||
| 182,291 | |||||||||||
| Media (0.5%) | |||||||||||
| Legend Pictures LLC Ltd. (a)(c)(d) | 34,510 | 36,896 | |||||||||
| Medical & Dental Instruments & Supplies (1.2%) | |||||||||||
| Techne Corp. | 1,227,668 | 86,060 | |||||||||
| Medical Equipment (3.9%) | |||||||||||
| Intuitive Surgical, Inc. (a) | 506,387 | 274,335 | |||||||||
| Metals & Minerals: Diversified (1.6%) | |||||||||||
| Lynas Corp. Ltd. (Australia) (a) | 23,242,119 | 26,363 | |||||||||
| Molycorp, Inc. (a) | 2,602,753 | 88,051 | |||||||||
| 114,414 | |||||||||||
| Pharmaceuticals (5.1%) | |||||||||||
| Ironwood Pharmaceuticals, Inc. (a) | 3,422,223 | 45,550 | |||||||||
| Mead Johnson Nutrition Co. | 2,282,409 | 188,253 | |||||||||
| Valeant Pharmaceuticals International, Inc. (Canada) (a) | 2,372,203 | 127,363 | |||||||||
| 361,166 | |||||||||||
The accompanying notes are an integral part of the financial statements.
16
2012 Semi-Annual Report
March 31, 2012 (unaudited)
Portfolio of Investments (cont'd)
Mid Cap Growth Portfolio
| Shares | Value (000) | ||||||||||
| Publishing (1.4%) | |||||||||||
| Morningstar, Inc. | 1,541,657 | $ | 97,201 | ||||||||
| Recreational Vehicles & Boats (3.6%) | |||||||||||
| Edenred (France) | 8,459,946 | 254,545 | |||||||||
| Restaurants (1.2%) | |||||||||||
| Dunkin' Brands Group, Inc. | 2,756,896 | 83,010 | |||||||||
| Scientific Instruments: Pollution Control (1.0%) | |||||||||||
| Covanta Holding Corp. | 4,560,544 | 74,018 | |||||||||
| Semiconductors & Components (2.0%) | |||||||||||
| ARM Holdings PLC ADR (United Kingdom) | 3,882,222 | 109,828 | |||||||||
| First Solar, Inc. (a) | 1,139,195 | 28,537 | |||||||||
| 138,365 | |||||||||||
| Utilities: Electrical (1.7%) | |||||||||||
| Brookfield Infrastructure Partners LP (Canada) | 3,774,214 | 119,265 | |||||||||
| Total Common Stocks (Cost $5,610,323) | 6,842,117 | ||||||||||
| Convertible Preferred Stocks (1.1%) | |||||||||||
| Alternative Energy (0.8%) | |||||||||||
| Better Place, Inc. (a)(c)(d) | 9,009,542 | 40,903 | |||||||||
| Better Place, Inc. Series C (a)(c)(d) | 2,796,975 | 12,698 | |||||||||
| 53,601 | |||||||||||
| Computer Services, Software & Systems (0.1%) | |||||||||||
| Workday, Inc. (a)(c)(d) | 805,930 | 10,687 | |||||||||
| Technology: Miscellaneous (0.2%) | |||||||||||
| Peixe Urbano, Inc. (Brazil) (a)(c)(d) | 542,936 | 17,874 | |||||||||
| Total Convertible Preferred Stocks (Cost $63,782) | 82,162 | ||||||||||
| Short-Term Investment (2.5%) | |||||||||||
| Investment Company (2.5%) | |||||||||||
| Morgan Stanley Institutional Liquidity Funds — Money Market Portfolio — Institutional Class (See Note G-2) (Cost $174,656) | 174,655,713 | 174,656 | |||||||||
| Total Investments (100.5%) (Cost $5,848,761) | 7,098,935 | ||||||||||
| Liabilities in Excess of Other Assets (-0.5%) | (38,705 | ) | |||||||||
| Net Assets (100.0%) | $ | 7,060,230 | |||||||||
(a) Non-income producing security.
(b) Security trades on the Hong Kong exchange.
(c) At March 31, 2012, the Portfolio held fair valued securities valued at approximately $267,900,000, representing 3.8% of net assets. These securities have been fair valued as determined in good faith under procedures established by and under the general supervision of the Fund's Trustees.
(d) Security has been deemed illiquid at March 31, 2012.
ADR American Depositary Receipt.
SDR Swedish Depositary Receipt.
Fair Value Measurement Information:
The following is a summary of the inputs used to value the Portfolio's investments as of March 31, 2012. (See Note A-5 to the financial statements for further information regarding fair value measurement.)
| Investment Type | Level 1 Unadjusted quoted prices (000) | Level 2 Other significant observable inputs (000) | Level 3 Significant unobservable inputs (000) | Total (000) | |||||||||||||||
| Assets: | |||||||||||||||||||
| Common Stocks | |||||||||||||||||||
| Air Transport | $ | 139,745 | $ | — | $ | — | $ | 139,745 | |||||||||||
| Alternative Energy | 186,409 | — | — | 186,409 | |||||||||||||||
| Asset Management & Custodian | 46,828 | — | — | 46,828 | |||||||||||||||
| Biotechnology | 266,603 | — | — | 266,603 | |||||||||||||||
| Cement | 76,055 | — | — | 76,055 | |||||||||||||||
| Chemicals: Diversified | 183,065 | — | — | 183,065 | |||||||||||||||
| Commercial Services | 596,127 | — | — | 596,127 | |||||||||||||||
| Communications Technology | 353,308 | — | — | 353,308 | |||||||||||||||
| Computer Services, Software & Systems | 1,090,822 | — | 42,347 | 1,133,169 | |||||||||||||||
| Computer Technology | 252,536 | — | — | 252,536 | |||||||||||||||
| Consumer Lending | 106,727 | — | — | 106,727 | |||||||||||||||
| Consumer Services: Miscellaneous | 154,044 | — | — | 154,044 | |||||||||||||||
| Cosmetics | 63,455 | — | — | 63,455 | |||||||||||||||
| Diversified Materials & Processing | 100,864 | — | — | 100,864 | |||||||||||||||
| Diversified Media | 213,834 | — | — | 213,834 | |||||||||||||||
| Diversified Retail | 541,447 | — | 106,495 | 647,942 | |||||||||||||||
| Education Services | 67,298 | — | — | 67,298 | |||||||||||||||
| Electronic Entertainment | 53,968 | — | — | 53,968 | |||||||||||||||
| Financial Data & Systems | 378,574 | — | — | 378,574 | |||||||||||||||
| Health Care Services | 182,291 | — | — | 182,291 | |||||||||||||||
| Media | — | — | 36,896 | 36,896 | |||||||||||||||
| Medical & Dental Instruments & Supplies | 86,060 | — | — | 86,060 | |||||||||||||||
| Medical Equipment | 274,335 | — | — | 274,335 | |||||||||||||||
| Metals & Minerals: Diversified | 114,414 | — | — | 114,414 | |||||||||||||||
| Pharmaceuticals | 361,166 | — | — | 361,166 | |||||||||||||||
| Publishing | 97,201 | — | — | 97,201 | |||||||||||||||
| Recreational Vehicles & Boats | 254,545 | — | — | 254,545 | |||||||||||||||
| Restaurants | 83,010 | — | — | 83,010 | |||||||||||||||
| Scientific Instruments: Pollution Control | 74,018 | — | — | 74,018 | |||||||||||||||
| Semiconductors & Components | 138,365 | — | — | 138,365 | |||||||||||||||
| Utilities: Electrical | 119,265 | — | — | 119,265 | |||||||||||||||
| Total Common Stocks | 6,656,379 | — | 185,738 | 6,842,117 | |||||||||||||||
| Convertible Preferred Stocks | — | — | 82,162 | 82,162 | |||||||||||||||
| Short-Term Investment — | |||||||||||||||||||
| Investment Company | 174,656 | — | — | 174,656 | |||||||||||||||
| Total Assets | $ | 6,831,035 | $ | — | $ | 267,900 | $ | 7,098,935 | |||||||||||
The accompanying notes are an integral part of the financial statements.
17
2012 Semi-Annual Report
March 31, 2012 (unaudited)
Portfolio of Investments (cont'd)
Mid Cap Growth Portfolio
Fair Value Measurement Information: (cont'd)
Transfers between investment levels may occur as the markets fluctuate and/or the availability of data used in an investment's valuation changes. The Portfolio recognizes transfers between the levels as of the end of the period. As of March 31, 2012, securities with a total value of approximately $587,312,000 transferred from Level 2 to Level 1. At September 30, 2011 the fair market value of certain securities were adjusted due to developments which occurred between the time of the close of foreign markets which they trade and the close of business on the NYSE which resulted in their Level 2 classification.
Following is a reconciliation of investments in which significant unobservable inputs (Level 3) were used in determining fair value.
| Common Stocks (000) | Convertible Preferred Stocks (000) | Preferred Stock (000) | |||||||||||||
| Beginning Balance | $ | — | $ | 118,412 | $ | 47,566 | |||||||||
| Purchases | 36,896 | 41,259 | — | ||||||||||||
| Sales | — | — | — | ||||||||||||
| Amortization of discount | — | — | — | ||||||||||||
| Transfers in | — | — | — | ||||||||||||
| Transfers out | — | — | — | ||||||||||||
| Corporate Action | 94,895 | (47,329 | ) | (47,566 | ) | ||||||||||
| Change in unrealized appreciation (depreciation) | 53,947 | (30,180 | ) | — | |||||||||||
| Realized gains (losses) | — | — | — | ||||||||||||
| Ending Balance | $ | 185,738 | $ | 82,162 | $ | — | |||||||||
| Net change in unrealized appreciation/depreciation from investments still held as of March 31, 2012 | $ | 5,389 | $ | 18,379 | $ | — | |||||||||
Portfolio Composition
| Classification | Percentage of Total Investments | ||||||
| Other* | 51.1 | % | |||||
| Computer Services, Software & Systems | 16.0 | ||||||
| Diversified Retail | 9.1 | ||||||
| Commercial Services | 8.4 | ||||||
| Financial Data & Systems | 5.3 | ||||||
| Pharmaceuticals | 5.1 | ||||||
| Communications Technology | 5.0 | ||||||
| Total Investments | 100.0 | % | |||||
* Industries representing less than 5% of total investments.
The accompanying notes are an integral part of the financial statements.
18
2012 Semi-Annual Report
March 31, 2012 (unaudited)
Portfolio of Investments
Core Fixed Income Portfolio
| Face Amount (000) | Value (000) | ||||||||||
| Fixed Income Securities (96.2%) | |||||||||||
| Agency Fixed Rate Mortgages (28.4%) | |||||||||||
| Federal Home Loan Mortgage Corporation, | |||||||||||
| April TBA: | |||||||||||
| 3.00%, 4/25/27 (a) | $ | 1,205 | $ | 1,246 | |||||||
| 3.50%, 4/25/42 (a) | 610 | 625 | |||||||||
| Gold Pools: | |||||||||||
| 4.00%, 12/1/41 | 288 | 302 | |||||||||
| 5.00%, 10/1/35 | 937 | 1,010 | |||||||||
| 6.00%, 5/1/37 - 10/1/38 | 353 | 392 | |||||||||
| 7.50%, 5/1/35 | 64 | 77 | |||||||||
| 8.00%, 8/1/32 | 32 | 39 | |||||||||
| 8.50%, 8/1/31 | 52 | 64 | |||||||||
| Federal National Mortgage Association, | |||||||||||
| April TBA: | |||||||||||
| 2.50%, 4/25/27 (a) | 605 | 613 | |||||||||
| 4.50%, 4/25/42 (a) | 275 | 293 | |||||||||
| Conventional Pools: | |||||||||||
| 4.00%, 11/1/41 - 12/1/41 | 1,680 | 1,764 | |||||||||
| 4.50%, 8/1/40 - 8/1/41 | 2,196 | 2,351 | |||||||||
| 5.00%, 3/1/39 | 896 | 983 | |||||||||
| 5.50%, 4/1/34 - 2/1/38 | 2,120 | 2,323 | |||||||||
| 6.00%, 1/1/38 | 230 | 253 | |||||||||
| 6.50%, 7/1/29 - 2/1/33 | 389 | 445 | |||||||||
| 7.00%, 10/1/31 - 12/1/31 | 3 | 3 | |||||||||
| 7.50%, 8/1/37 | 108 | 130 | |||||||||
| 8.00%, 4/1/33 | 79 | 96 | |||||||||
| 8.50%, 10/1/32 | 78 | 95 | |||||||||
| Government National Mortgage Association, | |||||||||||
| April TBA: | |||||||||||
| 3.50%, 4/25/42 (a) | 1,305 | 1,361 | |||||||||
| 4.00%, 4/25/42 (a) | 1,935 | 2,076 | |||||||||
| Various Pools: | |||||||||||
| 4.50%, 4/15/39 - 8/15/39 | 590 | 644 | |||||||||
| 17,185 | |||||||||||
| Asset-Backed Securities (6.1%) | |||||||||||
| Ally Master Owner Trust | |||||||||||
| 2.88%, 4/15/15 (b) | 225 | 229 | |||||||||
| ARI Fleet Lease Trust | |||||||||||
| 1.69%, 8/15/18 (b)(c) | 30 | 30 | |||||||||
| Brazos Higher Education Authority | |||||||||||
| 1.41%, 7/25/29 (c) | 325 | 318 | |||||||||
| CVS Pass-Through Trust | |||||||||||
| 6.04%, 12/10/28 | 73 | 81 | |||||||||
| Discover Card Master Trust | |||||||||||
| 0.59%, 8/15/16 (c) | 300 | 302 | |||||||||
| Enterprise Fleet Financing LLC, | |||||||||||
| 1.43%, 10/20/16 (b) | 200 | 200 | |||||||||
| 1.62%, 5/20/17 (b) | 120 | 120 | |||||||||
| Ford Credit Floorplan Master Owner Trust | |||||||||||
| 2.12%, 2/15/16 | 175 | 179 | |||||||||
| Face Amount (000) | Value (000) | ||||||||||
| FUEL Trust | |||||||||||
| 4.21%, 4/15/16 (b) | $ | 200 | $ | 205 | |||||||
| Great America Leasing Receivables | |||||||||||
| 1.69%, 2/15/14 (b) | 300 | 301 | |||||||||
| Louisiana Public Facilities Authority | |||||||||||
| 1.46%, 4/26/27 (c) | 325 | 316 | |||||||||
| Macquarie Equipment Funding Trust | |||||||||||
| 1.21%, 9/20/13 (b) | 234 | 234 | |||||||||
| Mercedes-Benz Auto Lease Trust | |||||||||||
| 1.18%, 11/15/13 (b) | 350 | 351 | |||||||||
| MMCA Automobile Trust | |||||||||||
| 1.22%, 1/15/15 (b) | 225 | 226 | |||||||||
| North Carolina State Education Assistance Authority | |||||||||||
| 1.46%, 1/26/26 (c) | 225 | 222 | |||||||||
| Panhandle-Plains Higher Education Authority, Inc. | |||||||||||
| 1.42%, 7/1/24 (c) | 125 | 123 | |||||||||
| Textainer Marine Containers Ltd. | |||||||||||
| 4.70%, 6/15/26 (b) | 231 | 236 | |||||||||
| 3,673 | |||||||||||
| Collateralized Mortgage Obligations — Agency Collateral Series (6.8%) | |||||||||||
| Federal Home Loan Mortgage Corporation, | |||||||||||
| 2.32%, 10/25/18 | 155 | 157 | |||||||||
| 2.70%, 5/25/18 | 335 | 348 | |||||||||
| 2.97%, 10/25/21 | 300 | 306 | |||||||||
| 3.87%, 4/25/21 | 325 | 353 | |||||||||
| IO | |||||||||||
| 0.68%, 1/25/21 (c) | 2,283 | 96 | |||||||||
| IO PAC REMIC | |||||||||||
| 6.23%, 6/15/40 (c) | 1,946 | 374 | |||||||||
| IO STRIPS | |||||||||||
| 8.00%, 1/1/28 | 22 | 6 | |||||||||
| REMIC | |||||||||||
| 6.66%, 1/15/42 (c)(d) | 126 | 119 | |||||||||
| Federal National Mortgage Association, | |||||||||||
| 3.76%, 6/25/21 | 110 | 117 | |||||||||
| IO | |||||||||||
| 6.15%, 9/25/20 (c) | 1,773 | 497 | |||||||||
| IO REMIC | |||||||||||
| 6.36%, 9/25/38 (c) | 607 | 129 | |||||||||
| REMIC | |||||||||||
| 6.66%, 1/25/42 (c)(d) | 312 | 298 | |||||||||
| 9.11%, 10/25/41 (c)(d) | 219 | 211 | |||||||||
| Government National Mortgage Association, | |||||||||||
| IO | |||||||||||
| 1.37%, 4/16/53 (c) | 4,545 | 368 | |||||||||
| IO REMIC | |||||||||||
| 0.85%, 8/20/58 (c) | 2,953 | 100 | |||||||||
| 5.00%, 2/16/41 | 177 | 33 | |||||||||
| 5.81%, 11/16/40 (c) | 1,182 | 227 | |||||||||
| 6.34%, 6/20/40 (c) | 874 | 155 | |||||||||
| 6.36%, 4/16/41 (c) | 1,239 | 236 | |||||||||
| 4,130 | |||||||||||
The accompanying notes are an integral part of the financial statements.
19
2012 Semi-Annual Report
March 31, 2012 (unaudited)
Portfolio of Investments (cont'd)
Core Fixed Income Portfolio
| Face Amount (000) | Value (000) | ||||||||||
| Commercial Mortgage Backed Securities (3.3%) | |||||||||||
| DBUBS Mortgage Trust | |||||||||||
| 4.54%, 7/10/44 (b) | $ | 350 | $ | 382 | |||||||
| GS Mortgage Securities Corp. II | |||||||||||
| 3.71%, 8/10/44 | 240 | 251 | |||||||||
| JP Morgan Chase Commercial Mortgage Securities Corp., | |||||||||||
| 4.17%, 8/15/46 | 240 | 260 | |||||||||
| 4.39%, 7/15/46 (b) | 350 | 381 | |||||||||
| 4.72%, 2/15/46 (b) | 335 | 372 | |||||||||
| WF-RBS Commercial Mortgage Trust | |||||||||||
| 4.87%, 2/15/44 (b)(c) | 315 | 352 | |||||||||
| 1,998 | |||||||||||
| Corporate Bonds (29.0%) | |||||||||||
| Finance (10.7%) | |||||||||||
| ABB Treasury Center USA, Inc. | |||||||||||
| 2.50%, 6/15/16 (b) | 175 | 179 | |||||||||
| Abbey National Treasury Services PLC | |||||||||||
| 3.88%, 11/10/14 (b) | 140 | 141 | |||||||||
| Aegon N.V. | |||||||||||
| 4.63%, 12/1/15 | 175 | 186 | |||||||||
| Barclays Bank PLC | |||||||||||
| 6.05%, 12/4/17 (b) | 100 | 103 | |||||||||
| Berkshire Hathaway, Inc. | |||||||||||
| 3.75%, 8/15/21 (e) | 235 | 243 | |||||||||
| BNP Paribas SA | |||||||||||
| 5.00%, 1/15/21 | 135 | 137 | |||||||||
| Boston Properties LP | |||||||||||
| 5.88%, 10/15/19 | 30 | 34 | |||||||||
| Brookfield Asset Management, Inc. | |||||||||||
| 5.80%, 4/25/17 | 65 | 70 | |||||||||
| Cigna Corp., | |||||||||||
| 2.75%, 11/15/16 | 70 | 71 | |||||||||
| 5.38%, 2/15/42 | 10 | 10 | |||||||||
| Citigroup, Inc. (See Note G-2), | |||||||||||
| 6.13%, 11/21/17 (e) | 15 | 17 | |||||||||
| 6.13%, 5/15/18 | 180 | 202 | |||||||||
| 8.50%, 5/22/19 | 85 | 105 | |||||||||
| Cooperatieve Centrale Raiffeisen-Boerenleenbank BA/Utrect | |||||||||||
| 3.38%, 1/19/17 | 130 | 133 | |||||||||
| Coventry Health Care, Inc. | |||||||||||
| 5.45%, 6/15/21 | 120 | 132 | |||||||||
| Credit Suisse, | |||||||||||
| 5.40%, 1/14/20 (e) | 135 | 139 | |||||||||
| 6.00%, 2/15/18 | 60 | 65 | |||||||||
| Dexus Diversified Trust/Dexus Office Trust | |||||||||||
| 5.60%, 3/15/21 (b) | 100 | 100 | |||||||||
| Digital Realty Trust LP | |||||||||||
| 5.25%, 3/15/21 | 100 | 103 | |||||||||
| DNB Bank ASA | |||||||||||
| 3.20%, 4/3/17 (b)(f) | 205 | 206 | |||||||||
| Face Amount (000) | Value (000) | ||||||||||
| ERP Operating LP | |||||||||||
| 4.63%, 12/15/21 | $ | 45 | $ | 48 | |||||||
| General Electric Capital Corp., | |||||||||||
| 5.30%, 2/11/21 | 110 | 119 | |||||||||
| Series G | |||||||||||
| 6.00%, 8/7/19 | 190 | 222 | |||||||||
| Goldman Sachs Group, Inc. (The) | |||||||||||
| 5.75%, 1/24/22 | 285 | 294 | |||||||||
| Hartford Financial Services Group, Inc. | |||||||||||
| 5.50%, 3/30/20 (e) | 110 | 118 | |||||||||
| HBOS PLC, | |||||||||||
| Series G | |||||||||||
| 6.75%, 5/21/18 (b) | 340 | 320 | |||||||||
| HSBC Holdings PLC | |||||||||||
| 4.00%, 3/30/22 | 165 | 164 | |||||||||
| JPMorgan Chase & Co. | |||||||||||
| 4.95%, 3/25/20 | 80 | 86 | |||||||||
| MetLife, Inc. | |||||||||||
| 7.72%, 2/15/19 | 60 | 76 | |||||||||
| Mizuho Corporate Bank Ltd. | |||||||||||
| 2.55%, 3/17/17 (b)(e) | 205 | 205 | |||||||||
| National Australia Bank | |||||||||||
| 2.75%, 3/9/17 | 250 | 249 | |||||||||
| Nationwide Building Society | |||||||||||
| 6.25%, 2/25/20 (b) | 145 | 151 | |||||||||
| Nationwide Financial Services | |||||||||||
| 5.38%, 3/25/21 (b) | 75 | 77 | |||||||||
| Nordea Bank AB | |||||||||||
| 4.88%, 5/13/21 (b) | 200 | 195 | |||||||||
| Pacific LifeCorp | |||||||||||
| 6.00%, 2/10/20 (b) | 125 | 137 | |||||||||
| Platinum Underwriters Finance, Inc., | |||||||||||
| Series B | |||||||||||
| 7.50%, 6/1/17 | 120 | 128 | |||||||||
| Principal Financial Group, Inc. | |||||||||||
| 8.88%, 5/15/19 | 100 | 128 | |||||||||
| Prudential Financial, Inc. | |||||||||||
| 7.38%, 6/15/19 (e) | 270 | 334 | |||||||||
| Santander Holdings USA, Inc. | |||||||||||
| 4.63%, 4/19/16 (e) | 40 | 41 | |||||||||
| Societe Generale SA | |||||||||||
| 5.20%, 4/15/21 (b)(e) | 200 | 192 | |||||||||
| Standard Chartered Bank | |||||||||||
| 6.40%, 9/26/17 (b) | 100 | 111 | |||||||||
| Svenska Handelsbanken AB | |||||||||||
| 2.88%, 4/4/17 (f) | 250 | 250 | |||||||||
| UDR, Inc., | |||||||||||
| Series 0001 MTN | |||||||||||
| 4.63%, 1/10/22 | 85 | 87 | |||||||||
| UnitedHealth Group, Inc. | |||||||||||
| 6.63%, 11/15/37 | 120 | 152 | |||||||||
| Wachovia Corp. | |||||||||||
| 5.63%, 10/15/16 | 60 | 67 | |||||||||
The accompanying notes are an integral part of the financial statements.
20
2012 Semi-Annual Report
March 31, 2012 (unaudited)
Portfolio of Investments (cont'd)
Core Fixed Income Portfolio
| Face Amount (000) | Value (000) | ||||||||||
| Finance (cont'd) | |||||||||||
| WEA Finance LLC | |||||||||||
| 4.63%, 5/10/21 (b) | $ | 75 | $ | 76 | |||||||
| Wells Fargo & Co. | |||||||||||
| 5.63%, 12/11/17 (e) | 60 | 70 | |||||||||
| 6,473 | |||||||||||
| Industrials (15.9%) | |||||||||||
| Agilent Technologies, Inc. | |||||||||||
| 5.50%, 9/14/15 | 120 | 135 | |||||||||
| Air Products & Chemicals, Inc. | |||||||||||
| 2.00%, 8/2/16 | 165 | 169 | |||||||||
| Albemarle Corp. | |||||||||||
| 4.50%, 12/15/20 | 110 | 118 | |||||||||
| Altria Group, Inc., | |||||||||||
| 4.13%, 9/11/15 | 50 | 55 | |||||||||
| 9.25%, 8/6/19 | 125 | 168 | |||||||||
| American Honda Finance Corp. | |||||||||||
| 2.13%, 2/28/17 (b) | 200 | 201 | |||||||||
| Anglo American Capital PLC | |||||||||||
| 9.38%, 4/8/19 (b) | 100 | 132 | |||||||||
| ArcelorMittal | |||||||||||
| 9.85%, 6/1/19 (e) | 100 | 120 | |||||||||
| Aristotle Holding, Inc. | |||||||||||
| 2.65%, 2/15/17 (b) | 110 | 111 | |||||||||
| AT&T, Inc., | |||||||||||
| 3.88%, 8/15/21 (e) | 45 | 48 | |||||||||
| 6.30%, 1/15/38 | 170 | 200 | |||||||||
| BAA Funding Ltd. | |||||||||||
| 4.88%, 7/15/21 (b)(e) | 170 | 174 | |||||||||
| Barrick Gold Corp. | |||||||||||
| 3.85%, 4/1/22 | 75 | 75 | |||||||||
| Barrick North America Finance LLC | |||||||||||
| 4.40%, 5/30/21 | 95 | 100 | |||||||||
| BAT International Finance PLC | |||||||||||
| 9.50%, 11/15/18 (b) | 165 | 225 | |||||||||
| Bemis Co., Inc. | |||||||||||
| 4.50%, 10/15/21 | 110 | 115 | |||||||||
| Best Buy Co., Inc. | |||||||||||
| 3.75%, 3/15/16 (e) | 165 | 167 | |||||||||
| Boeing Capital Corp. | |||||||||||
| 2.13%, 8/15/16 (e) | 175 | 181 | |||||||||
| Bunge Ltd. Finance Corp. | |||||||||||
| 8.50%, 6/15/19 | 85 | 104 | |||||||||
| Burlington Northern Santa Fe LLC | |||||||||||
| 5.65%, 5/1/17 | 115 | 134 | |||||||||
| Canadian Oil Sands Ltd. | |||||||||||
| 7.75%, 5/15/19 (b) | 125 | 153 | |||||||||
| Coca-Cola Co. (The) | |||||||||||
| 1.65%, 3/14/18 | 150 | 149 | |||||||||
| Comcast Corp., | |||||||||||
| 5.15%, 3/1/20 (e) | 75 | 86 | |||||||||
| 5.70%, 5/15/18 | 50 | 59 | |||||||||
| Face Amount (000) | Value (000) | ||||||||||
| ConAgra Foods, Inc. | |||||||||||
| 8.25%, 9/15/30 | $ | 115 | $ | 146 | |||||||
| Corning, Inc. | |||||||||||
| 4.75%, 3/15/42 (e) | 50 | 49 | |||||||||
| CRH America, Inc. | |||||||||||
| 6.00%, 9/30/16 | 135 | 147 | |||||||||
| Daimler Finance North America LLC | |||||||||||
| 8.50%, 1/18/31 | 55 | 80 | |||||||||
| Darden Restaurants, Inc. | |||||||||||
| 6.20%, 10/15/17 | 205 | 232 | |||||||||
| Delhaize Group SA | |||||||||||
| 5.70%, 10/1/40 | 106 | 98 | |||||||||
| Deutsche Telekom International Finance BV | |||||||||||
| 8.75%, 6/15/30 | 65 | 90 | |||||||||
| DirecTV Holdings LLC/DirecTV Financing Co., Inc., | |||||||||||
| 3.80%, 3/15/22 (b) | 75 | 74 | |||||||||
| 5.88%, 10/1/19 (e) | 125 | 143 | |||||||||
| Ecolab, Inc. | |||||||||||
| 3.00%, 12/8/16 | 90 | 94 | |||||||||
| Fiserv, Inc. | |||||||||||
| 3.13%, 6/15/16 | 80 | 82 | |||||||||
| Georgia-Pacific LLC | |||||||||||
| 5.40%, 11/1/20 (b)(e) | 90 | 101 | |||||||||
| Gilead Sciences, Inc., | |||||||||||
| 4.50%, 4/1/21 (e) | 95 | 101 | |||||||||
| 5.65%, 12/1/41 | 75 | 80 | |||||||||
| Grupo Bimbo SAB de CV | |||||||||||
| 4.88%, 6/30/20 (b) | 100 | 106 | |||||||||
| Harley-Davidson Funding Corp. | |||||||||||
| 6.80%, 6/15/18 (b) | 105 | 123 | |||||||||
| Hess Corp. | |||||||||||
| 6.00%, 1/15/40 | 175 | 201 | |||||||||
| Hewlett-Packard Co. | |||||||||||
| 4.65%, 12/9/21 | 165 | 173 | |||||||||
| Holcim US Finance Sarl & Cie SCS | |||||||||||
| 6.00%, 12/30/19 (b) | 85 | 88 | |||||||||
| Kinross Gold Corp. | |||||||||||
| 5.13%, 9/1/21 (b)(e) | 115 | 117 | |||||||||
| KLA-Tencor Corp. | |||||||||||
| 6.90%, 5/1/18 | 145 | 173 | |||||||||
| Koninklijke Philips Electronics | |||||||||||
| 3.75%, 3/15/22 | 150 | 151 | |||||||||
| Kraft Foods, Inc. | |||||||||||
| 5.38%, 2/10/20 | 195 | 226 | |||||||||
| L-3 Communications Corp. | |||||||||||
| 4.75%, 7/15/20 (e) | 135 | 140 | |||||||||
| Macy's Retail Holdings, Inc. | |||||||||||
| 3.88%, 1/15/22 | 55 | 55 | |||||||||
| Marathon Petroleum Corp. | |||||||||||
| 5.13%, 3/1/21 (e) | 195 | 212 | |||||||||
| NBC Universal Media LLC | |||||||||||
| 5.15%, 4/30/20 | 140 | 159 | |||||||||
The accompanying notes are an integral part of the financial statements.
21
2012 Semi-Annual Report
March 31, 2012 (unaudited)
Portfolio of Investments (cont'd)
Core Fixed Income Portfolio
| Face Amount (000) | Value (000) | ||||||||||
| Industrials (cont'd) | |||||||||||
| News America, Inc. | |||||||||||
| 4.50%, 2/15/21 | $ | 75 | $ | 80 | |||||||
| Nordstrom, Inc. | |||||||||||
| 4.00%, 10/15/21 | 85 | 91 | |||||||||
| PepsiCo, Inc. | |||||||||||
| 2.75%, 3/5/22 | 125 | 122 | |||||||||
| Phillips 66 | |||||||||||
| 4.30%, 4/1/22 (b) | 100 | 102 | |||||||||
| Quest Diagnostics, Inc. | |||||||||||
| 6.95%, 7/1/37 | 95 | 116 | |||||||||
| SABMiller Holdings, Inc. | |||||||||||
| 3.75%, 1/15/22 (b) | 200 | 204 | |||||||||
| Sanofi | |||||||||||
| 4.00%, 3/29/21 (e) | 135 | 147 | |||||||||
| Sonoco Products Co. | |||||||||||
| 5.75%, 11/1/40 | 100 | 107 | |||||||||
| Syngenta Finance | |||||||||||
| 3.13%, 3/28/22 | 80 | 81 | |||||||||
| Telstra Corp., Ltd. | |||||||||||
| 4.80%, 10/12/21 (b)(e) | 100 | 109 | |||||||||
| Teva Pharmaceutical Finance IV BV | |||||||||||
| 3.65%, 11/10/21 | 215 | 218 | |||||||||
| Time Warner Cable, Inc., | |||||||||||
| 6.75%, 6/15/39 (e) | 40 | 48 | |||||||||
| 8.75%, 2/14/19 (e) | 55 | 72 | |||||||||
| Time Warner, Inc., | |||||||||||
| 4.70%, 1/15/21 | 100 | 109 | |||||||||
| 4.75%, 3/29/21 (e) | 90 | 99 | |||||||||
| 5.88%, 11/15/16 | 75 | 88 | |||||||||
| Total Capital International SA | |||||||||||
| 2.88%, 2/17/22 (e) | 150 | 144 | |||||||||
| Vale Overseas Ltd. | |||||||||||
| 5.63%, 9/15/19 | 110 | 123 | |||||||||
| Valspar Corp. | |||||||||||
| 4.20%, 1/15/22 | 155 | 159 | |||||||||
| Verizon Communications, Inc., | |||||||||||
| 4.60%, 4/1/21 (e) | 30 | 33 | |||||||||
| 8.95%, 3/1/39 | 50 | 77 | |||||||||
| VF Corp. | |||||||||||
| 3.50%, 9/1/21 | 105 | 108 | |||||||||
| Vivendi SA | |||||||||||
| 6.63%, 4/4/18 (b) | 120 | 135 | |||||||||
| Volkswagen International Finance | |||||||||||
| 2.38%, 3/22/17 (b) | 115 | 116 | |||||||||
| Wesfarmers Ltd. | |||||||||||
| 2.98%, 5/18/16 (b) | 85 | �� | 87 | ||||||||
| Woolworths Ltd. | |||||||||||
| 4.00%, 9/22/20 (b) | 125 | 129 | |||||||||
| WPP Finance UK | |||||||||||
| 8.00%, 9/15/14 | 100 | 115 | |||||||||
| 9,639 | |||||||||||
| Face Amount (000) | Value (000) | ||||||||||
| Utilities (2.4%) | |||||||||||
| EDF SA | |||||||||||
| 4.60%, 1/27/20 (b) | $ | 80 | $ | 85 | |||||||
| Energy Transfer Partners LP | |||||||||||
| 9.00%, 4/15/19 | 58 | 72 | |||||||||
| Enterprise Products Operating LLC, | |||||||||||
| 5.25%, 1/31/20 (e) | 50 | 56 | |||||||||
| Series N | |||||||||||
| 6.50%, 1/31/19 | 160 | 190 | |||||||||
| Exelon Generation Co., LLC | |||||||||||
| 6.25%, 10/1/39 | 140 | 164 | |||||||||
| FirstEnergy Solutions Corp. | |||||||||||
| 6.05%, 8/15/21 | 225 | 253 | |||||||||
| Kinder Morgan Energy Partners LP | |||||||||||
| 5.95%, 2/15/18 | 160 | 187 | |||||||||
| Plains All American Pipeline LP/PAA Finance Corp., | |||||||||||
| 6.70%, 5/15/36 | 160 | 188 | |||||||||
| 8.75%, 5/1/19 (e) | 65 | 85 | |||||||||
| PPL WEM Holdings PLC | |||||||||||
| 3.90%, 5/1/16 (b) | 150 | 156 | |||||||||
| 1,436 | |||||||||||
| 17,548 | |||||||||||
| Municipal Bonds (1.5%) | |||||||||||
| Chicago, IL, Transit Authority | |||||||||||
| 6.20%, 12/1/40 | 100 | 114 | |||||||||
| City of Chicago, IL, | |||||||||||
| O'Hare International Airport Revenue | |||||||||||
| 6.40%, 1/1/40 | 40 | 49 | |||||||||
| City of New York, NY, | |||||||||||
| Series G-1 | |||||||||||
| 5.97%, 3/1/36 | 85 | 104 | |||||||||
| Illinois State Toll Highway Authority, Highway Revenue, Build America Bonds | |||||||||||
| 6.18%, 1/1/34 | 130 | 156 | |||||||||
| Municipal Electric Authority of Georgia | |||||||||||
| 6.66%, 4/1/57 | 155 | 174 | |||||||||
| New York City Transitional Finance Authority | |||||||||||
| 5.27%, 5/1/27 | 80 | 95 | |||||||||
| State of California, General Obligation Bonds | |||||||||||
| 5.95%, 4/1/16 | 175 | 198 | |||||||||
| 890 | |||||||||||
| Sovereign (1.2%) | |||||||||||
| Bermuda Government International Bond | |||||||||||
| 5.60%, 7/20/20 (b) | 100 | 113 | |||||||||
| Brazilian Government International Bond | |||||||||||
| 4.88%, 1/22/21 (e) | 220 | 250 | |||||||||
| Korea Development Bank | |||||||||||
| 4.38%, 8/10/15 | 130 | 138 | |||||||||
| Mexico Government International Bond | |||||||||||
| 3.63%, 3/15/22 (e) | 200 | 205 | |||||||||
| 706 | |||||||||||
The accompanying notes are an integral part of the financial statements.
22
2012 Semi-Annual Report
March 31, 2012 (unaudited)
Portfolio of Investments (cont'd)
Core Fixed Income Portfolio
| Face Amount (000) | Value (000) | ||||||||||
| U.S. Agency Securities (2.0%) | |||||||||||
| Federal National Mortgage Association, | |||||||||||
| 1.25%, 9/28/16 | $ | 230 | $ | 232 | |||||||
| 5.38%, 6/12/17 | 700 | 844 | |||||||||
| 6.63%, 11/15/30 | 100 | 142 | |||||||||
| 1,218 | |||||||||||
| U.S. Treasury Securities (17.9%) | |||||||||||
| U.S. Treasury Bonds | |||||||||||
| 3.88%, 8/15/40 (e) | 1,840 | 2,036 | |||||||||
| U.S. Treasury Notes, | |||||||||||
| 1.00%, 9/30/16 | 600 | 602 | |||||||||
| 1.25%, 10/31/15 | 2,165 | 2,208 | |||||||||
| 1.75%, 3/31/14 - 7/31/15 | 2,380 | 2,457 | |||||||||
| 2.25%, 3/31/16 (e) | 3,305 | 3,497 | |||||||||
| 10,800 | |||||||||||
| Total Fixed Income Securities (Cost $56,263) | 58,148 | ||||||||||
| Shares | |||||||||||
| Short-Term Investments (24.5%) | |||||||||||
| Securities held as Collateral on Loaned Securities (10.8%) | |||||||||||
| Investment Company (9.1%) | |||||||||||
| Morgan Stanley Institutional Liquidity Funds — Money Market Portfolio — Institutional Class (See Note G-2) | 5,464,006 | 5,464 | |||||||||
| Face Amount (000) | |||||||||||
| Repurchase Agreements (1.7%) | |||||||||||
| Barclays Capital, Inc., (0.15%, dated 3/30/12, due 4/2/12; proceeds $145; fully collateralized by a U.S. Government Agency; Federal National Mortgage Association 4.00% due 1/1/42; valued at $148) | $ | 145 | 145 | ||||||||
| Merrill Lynch & Co., Inc., (0.25%, dated 3/30/12, due 4/2/12; proceeds $896; fully collateralized by Common Stocks; Alliance Data Systems Corp.; American International Group, Inc.; Boeing Co. (The); Energy Transfer Equity LP; Freeport-McMoRan Copper & Gold, Inc.; GNC Holdings, Inc.; Hershey Co. (The); L-3 Communications Holdings, Inc.; McKesson Corp.; Teva Pharmaceutical Industries Ltd.; Two Harbors Investment Corp.; Vale SA; valued at $968) | 896 | 896 | |||||||||
| 1,041 | |||||||||||
| Total Securities held as Collateral on Loaned Securities (Cost $6,505) | 6,505 | ||||||||||
| Shares | |||||||||||
| Investment Company (6.7%) | |||||||||||
| Morgan Stanley Institutional Liquidity Funds — Money Market Portfolio — Institutional Class (See Note G-2) (Cost $4,059) | 4,058,702 | 4,059 | |||||||||
| Face Amount (000) | Value (000) | ||||||||||
| U.S. Treasury Securities (7.0%) | |||||||||||
| U.S. Treasury Bills, | |||||||||||
| 0.05%, 6/7/12 (g) | $ | 1,875 | $ | 1,874 | |||||||
| 0.07%, 5/10/12 (e)(g) | 2,000 | 2,000 | |||||||||
| 0.14%, 8/30/12 (g)(h)(i) | 363 | 363 | |||||||||
| 4,237 | |||||||||||
| Total Short-Term Investments (Cost $14,801) | 14,801 | ||||||||||
| Total Investments (120.7%) (Cost $71,064) Including $8,402 of Securities Loaned (j) | 72,949 | ||||||||||
| Liabilities in Excess of Other Assets (-20.7%) | (12,531 | ) | |||||||||
| Net Assets (100.0%) | $ | 60,418 | |||||||||
(a) Security is subject to delayed delivery.
(b) 144A security — Certain conditions for public sale may exist. Unless otherwise noted, these securities are deemed to be liquid.
(c) Variable/Floating Rate Security — Interest rate changes on these instruments are based on changes in a designated base rate. The rates shown are those in effect on March 31, 2012.
(d) Inverse Floating Rate Security — Interest rate fluctuates with an inverse relationship to an associated interest rate. Indicated rate is the effective rate at March 31, 2012.
(e) All or a portion of this security was on loan at March 31, 2012.
(f) When-issued security.
(g) Rate shown is the yield to maturity at March 31, 2012.
(h) All or a portion of the security was pledged as collateral for swap agreements.
(i) All or a portion of the security was pledged to cover margin requirements for futures contracts.
(j) Securities are available for collateral in connection with purchase of when-issued securities, securities purchased on a forward commitment basis, open futures contracts and swap agreements.
IO Interest Only.
MTN Medium Term Note.
PAC Planned Amortization Class.
REMIC Real Estate Mortgage Investment Conduit.
STRIPS Separate Trading of Registered Interest and Principal of Securities.
TBA To Be Announced.
The accompanying notes are an integral part of the financial statements.
23
2012 Semi-Annual Report
March 31, 2012 (unaudited)
Portfolio of Investments (cont'd)
Core Fixed Income Portfolio
Futures Contracts:
The Portfolio had the following futures contracts open at period end:
| Number of Contracts | Value (000) | Expiration Date | Unrealized Appreciation (Depreciation) (000) | ||||||||||||||||
| Long: | |||||||||||||||||||
| U.S. Treasury 2 yr. Note | 16 | $ | 3,522 | Jun-12 | $ | (2 | ) | ||||||||||||
| Short: | |||||||||||||||||||
| U.S. Treasury 5 yr. Note | 11 | (1,348 | ) | Jun-12 | (1 | ) | |||||||||||||
| U.S. Treasury 10 yr. Note | 11 | (1,424 | ) | Jun-12 | (4 | ) | |||||||||||||
| U.S. Treasury 10 yr. Note | 3 | (344 | ) | Jun-12 | (4 | ) | |||||||||||||
| U.S. Treasury 30 yr. Bond | 3 | (413 | ) | Jun-12 | 12 | ||||||||||||||
| Ultra Long U.S. Treasury Bond | 4 | (604 | ) | Jun-12 | (11 | ) | |||||||||||||
| $ | (10 | ) | |||||||||||||||||
Zero Coupon Swap Agreements:
The Portfolio had the following zero coupon swap agreements open at period end:
| Swap Counterparty | Notional Amount (000) | Floating Rate Index | Pay/Receive Floating Rate | Termination Date | Premium Paid (Received) (000) | Unrealized Appreciation (Depreciation) (000) | |||||||||||||||||||||
| Barclays Capital | $ | 1,726 | 3 Month LIBOR | Pay | 11/15/19 | $ | 59 | $ | 246 | ||||||||||||||||||
| Barclays Capital | 1,457 | 3 Month LIBOR | Receive | 11/15/19 | (105 | ) | (455 | ) | |||||||||||||||||||
| $ | (209 | ) | |||||||||||||||||||||||||
LIBOR London Interbank Offered Rate.
Fair Value Measurement Information:
The following is a summary of the inputs used to value the Portfolio's investments as of March 31, 2012. (See Note A-5 to the financial statements for further information regarding fair value measurement.)
| Investment Type | Level 1 Unadjusted quoted prices (000) | Level 2 Other significant observable inputs (000) | Level 3 Significant unobservable inputs (000) | Total (000) | |||||||||||||||
| Assets: | |||||||||||||||||||
| Fixed Income Securities | |||||||||||||||||||
| Agency Fixed Rate Mortgages | $ | — | $ | 17,185 | $ | — | $ | 17,185 | |||||||||||
| Asset-Backed Securities | — | 3,673 | — | 3,673 | |||||||||||||||
| Collateralized Mortgage Obligations — Agency Collateral Series | — | 4,130 | — | 4,130 | |||||||||||||||
| Commercial Mortgage Backed Securities | — | 1,998 | — | 1,998 | |||||||||||||||
| Corporate Bonds | — | 17,548 | — | 17,548 | |||||||||||||||
| Municipal Bonds | — | 890 | — | 890 | |||||||||||||||
| Sovereign | — | 706 | — | 706 | |||||||||||||||
| U.S. Agency Securities | — | 1,218 | — | 1,218 | |||||||||||||||
Fair Value Measurement Information: (cont'd)
| Investment Type | Level 1 Unadjusted quoted prices (000) | Level 2 Other significant observable inputs (000) | Level 3 Significant unobservable inputs (000) | Total (000) | |||||||||||||||
| Fixed Income Securities (cont'd) | |||||||||||||||||||
| U.S. Treasury Securities | $ | — | $ | 10,800 | $ | — | $ | 10,800 | |||||||||||
| Total Fixed Income Securities | — | 58,148 | — | 58,148 | |||||||||||||||
| Short-Term Investments | |||||||||||||||||||
| Repurchase Agreements | — | 1,041 | — | 1,041 | |||||||||||||||
| Investment Companies | 9,523 | — | — | 9,523 | |||||||||||||||
| U.S. Treasury Securities | — | 4,237 | — | 4,237 | |||||||||||||||
| Total Short-Term Investments | 9,523 | 5,278 | — | 14,801 | |||||||||||||||
| Futures Contracts | 12 | — | — | 12 | |||||||||||||||
| Zero Coupon Swap Agreements | — | 246 | — | 246 | |||||||||||||||
| Total Assets | 9,535 | 63,672 | — | 73,207 | |||||||||||||||
| Liabilities: | |||||||||||||||||||
| Futures Contracts | (22 | ) | — | — | (22 | ) | |||||||||||||
| Zero Coupon Swap Agreements | — | (455 | ) | — | (455 | ) | |||||||||||||
| Total Liabilities | (22 | ) | (455 | ) | — | (477 | ) | ||||||||||||
| Total | $ | 9,513 | $ | 63,217 | $ | — | $ | 72,730 | |||||||||||
The accompanying notes are an integral part of the financial statements.
24
2012 Semi-Annual Report
March 31, 2012 (unaudited)
Portfolio of Investments (cont'd)
Core Fixed Income Portfolio
Fair Value Measurement Information: (cont'd)
Transfers between investment levels may occur as the markets fluctuate and/or the availability of data used in an investment's valuation changes. The Portfolio recognizes transfers between the levels as of the end of the period. As of March 31, 2012, the Portfolio did not have any significant investments transfer between investment levels.
Portfolio Composition*
| Classification | Percentage of Total Investments | ||||||
| Agency Fixed Rate Mortgages | 25.9 | % | |||||
| U.S. Treasury Securities | 16.3 | ||||||
| Industrials | 14.5 | ||||||
| Short-Term Investments | 12.5 | ||||||
| Finance | 9.7 | ||||||
| Other** | 9.4 | ||||||
| Collateralized Mortgage Obligations — Agency Collateral Series | 6.2 | ||||||
| Asset-Backed Securities | 5.5 | ||||||
| Total Investments | 100.0 | %*** | |||||
* Percentages indicated are based upon total investments (excluding Securities held as Collateral on Loaned Securities) as of March 31, 2012.
** Industries and/or investment types representing less than 5% of total investments.
*** Does not include open long/short futures contracts with an underlying face amount of approximately $7,655,000 and net unrealized depreciation of approximately $10,000 and open swap agreements with net unrealized depreciation of approximately $209,000.
The accompanying notes are an integral part of the financial statements.
25
2012 Semi-Annual Report
March 31, 2012 (unaudited)
Portfolio of Investments
Core Plus Fixed Income Portfolio
| Face Amount (000) | Value (000) | ||||||||||
| Fixed Income Securities (96.0%) | |||||||||||
| Agency Adjustable Rate Mortgages (0.7%) | |||||||||||
| Federal National Mortgage Association, | |||||||||||
| Conventional Pools: | |||||||||||
| 2.39%, 5/1/35 | $ | 1,884 | $ | 1,993 | |||||||
| Agency Fixed Rate Mortgages (27.4%) | |||||||||||
| Federal Home Loan Mortgage Corporation, | |||||||||||
| April TBA: | |||||||||||
| 3.00%, 4/25/27 (a) | 2,600 | 2,689 | |||||||||
| 3.50%, 4/25/42 (a) | 2,680 | 2,747 | |||||||||
| Conventional Pools: | |||||||||||
| 12.00%, 2/1/15 | 1 | 1 | |||||||||
| 13.00%, 6/1/19 | — | @ | — | @ | |||||||
| Gold Pools: | |||||||||||
| 4.00%, 12/1/41 | 2,883 | 3,022 | |||||||||
| 4.50%, 6/1/39 - 3/1/41 | 9,486 | 10,067 | |||||||||
| 5.00%, 10/1/35 | 352 | 380 | |||||||||
| 6.00%, 10/1/36 - 8/1/38 | 1,789 | 1,980 | |||||||||
| 6.50%, 3/1/16 - 8/1/33 | 433 | 492 | |||||||||
| 7.00%, 6/1/28 - 11/1/31 | 152 | 177 | |||||||||
| Federal National Mortgage Association, | |||||||||||
| April TBA: | |||||||||||
| 2.50%, 4/25/27 (a) | 2,720 | 2,758 | |||||||||
| 4.50%, 4/25/42 (a) | 2,550 | 2,713 | |||||||||
| Conventional Pools: | |||||||||||
| 4.00%, 11/1/41 - 1/1/42 | 13,165 | 13,822 | |||||||||
| 5.00%, 1/1/37 - 3/1/41 | 3,375 | 3,664 | |||||||||
| 5.50%, 6/1/35 - 5/1/41 | 10,825 | 11,878 | |||||||||
| 6.00%, 5/1/38 | 2,045 | 2,256 | |||||||||
| 6.50%, 11/1/23 - 1/1/34 | 5,285 | 6,039 | |||||||||
| 7.00%, 11/1/13 - 1/1/34 | 816 | 945 | |||||||||
| 8.50%, 1/1/15 | 3 | 3 | |||||||||
| 9.50%, 4/1/30 | 720 | 864 | |||||||||
| 12.00%, 11/1/15 | 25 | 26 | |||||||||
| 12.50%, 9/1/15 | 5 | 5 | |||||||||
| Government National Mortgage Association, | |||||||||||
| April TBA: | |||||||||||
| 3.50%, 4/25/42 (a) | 3,125 | 3,257 | |||||||||
| 4.00%, 4/25/42 (a) | 2,700 | 2,897 | |||||||||
| Various Pool | |||||||||||
| 4.50%, 8/15/39 | 746 | 814 | |||||||||
| 73,496 | |||||||||||
| Asset-Backed Securities (2.5%) | |||||||||||
| ARI Fleet Lease Trust | |||||||||||
| 1.69%, 8/15/18 (b)(c) | 197 | 197 | |||||||||
| Contimortgage Home Equity Trust | |||||||||||
| 8.10%, 8/15/25 | 43 | 43 | |||||||||
| CVS Pass-Through Trust | |||||||||||
| 6.04%, 12/10/28 | 636 | 700 | |||||||||
| FUEL Trust | |||||||||||
| 4.21%, 4/15/16 (c) | 860 | 883 | |||||||||
| Mid-State Trust | |||||||||||
| 8.33%, 4/1/30 | 33 | 33 | |||||||||
| Face Amount (000) | Value (000) | ||||||||||
| Santander Drive Auto Receivables Trust | |||||||||||
| 3.06%, 11/15/17 | $ | 1,075 | $ | 1,078 | |||||||
| SLM Student Loan Trust | |||||||||||
| 4.37%, 4/17/28 (c) | 825 | 857 | |||||||||
| Textainer Marine Containers Ltd. | |||||||||||
| 4.70%, 6/15/26 (c) | 694 | 709 | |||||||||
| U-Haul S Fleet LLC | |||||||||||
| 4.90%, 10/25/23 (c) | 1,556 | 1,625 | |||||||||
| Westlake Automobile Receivables Trust | |||||||||||
| 5.00%, 5/15/15 (c) | 534 | 539 | |||||||||
| 6,664 | |||||||||||
| Collateralized Mortgage Obligations — Agency Collateral Series (4.7%) | |||||||||||
| Federal Home Loan Mortgage Corporation, | |||||||||||
| IO | |||||||||||
| 0.68%, 1/25/21 (b) | 10,125 | 428 | |||||||||
| IO PAC REMIC | |||||||||||
| 6.23%, 6/15/40 (b) | 11,121 | 2,136 | |||||||||
| IO STRIPS | |||||||||||
| 7.50%, 12/1/29 | 92 | 21 | |||||||||
| 8.00%, 1/1/28 | 157 | 42 | |||||||||
| PAC REMIC | |||||||||||
| 9.50%, 4/15/20 | 1 | 2 | |||||||||
| REMIC | |||||||||||
| 6.66%, 1/15/42 (b)(d) | 593 | 557 | |||||||||
| Federal National Mortgage Association, | |||||||||||
| IO | |||||||||||
| 6.15%, 9/25/20 (b) | 5,220 | 1,463 | |||||||||
| IO PAC REMIC | |||||||||||
| 8.00%, 9/18/27 | 415 | 96 | |||||||||
| IO REMIC | |||||||||||
| 5.00%, 8/25/37 | 2,523 | 138 | |||||||||
| 6.00%, 7/25/33 | 684 | 113 | |||||||||
| 6.36%, 9/25/38 (b) | 2,886 | 614 | |||||||||
| IO STRIPS | |||||||||||
| 6.50%, 9/1/29 - 12/1/29 | 1,785 | 275 | |||||||||
| 8.00%, 4/1/24 | 509 | 110 | |||||||||
| 8.50%, 10/1/25 | 131 | 26 | |||||||||
| 9.00%, 11/1/26 | 125 | 30 | |||||||||
| REMIC | |||||||||||
| 6.66%, 1/25/42 (b)(d) | 1,485 | 1,422 | |||||||||
| 7.00%, 9/25/32 | 855 | 1,014 | |||||||||
| 9.11%, 10/25/41 (b)(d) | 973 | 939 | |||||||||
| 63.02%, 9/25/20 (b)(d) | 10 | 20 | |||||||||
| Government National Mortgage Association, | |||||||||||
| IO REMIC | |||||||||||
| 5.00%, 2/16/41 | 930 | 173 | |||||||||
| 5.81%, 11/16/40 (b) | 5,181 | 994 | |||||||||
| 6.34%, 6/20/40 (b) | 3,806 | 675 | |||||||||
| 6.36%, 4/16/41 (b) | 6,817 | 1,299 | |||||||||
| 12,587 | |||||||||||
The accompanying notes are an integral part of the financial statements.
26
2012 Semi-Annual Report
March 31, 2012 (unaudited)
Portfolio of Investments (cont'd)
Core Plus Fixed Income Portfolio
| Face Amount (000) | Value (000) | ||||||||||
| Commercial Mortgage Backed Securities (2.6%) | |||||||||||
| Banc of America Merrill Lynch Commercial Mortgage, Inc. | |||||||||||
| 5.67%, 4/10/49 (b) | $ | 795 | $ | 794 | |||||||
| Bear Stearns Commercial Mortgage Securities | |||||||||||
| 5.47%, 1/12/45 (b) | 1,526 | 1,737 | |||||||||
| DBUBS Mortgage Trust | |||||||||||
| 5.45%, 7/10/44 (b)(c) | 325 | 329 | |||||||||
| FREMF Mortgage Trust | |||||||||||
| 5.16%, 2/25/47 (b)(c) | 525 | 543 | |||||||||
| Greenwich Capital Commercial Funding Corp. | |||||||||||
| 5.87%, 12/10/49 (b) | 960 | 929 | |||||||||
| JP Morgan Chase Commercial Mortgage Securities Corp., | |||||||||||
| 4.17%, 8/15/46 | 1,100 | 1,190 | |||||||||
| 4.80%, 7/15/46 (c) | 775 | 806 | |||||||||
| 6.06%, 2/15/51 (b) | 730 | 724 | |||||||||
| 7,052 | |||||||||||
| Corporate Bonds (36.7%) | |||||||||||
| Finance (13.9%) | |||||||||||
| ABB Treasury Center USA, Inc. | |||||||||||
| 2.50%, 6/15/16 (c) | 800 | 817 | |||||||||
| Abbey National Treasury Services PLC | |||||||||||
| 3.88%, 11/10/14 (c) | 439 | 442 | |||||||||
| ABN Amro Bank N.V. | |||||||||||
| 4.25%, 2/2/17 (c) | 465 | 473 | |||||||||
| Aegon N.V. | |||||||||||
| 4.63%, 12/1/15 (e) | 830 | 880 | |||||||||
| Affiliated Managers Group, Inc. | |||||||||||
| 3.95%, 8/15/38 (e) | 496 | 548 | |||||||||
| Alexandria Real Estate Equities, Inc. | |||||||||||
| 4.60%, 4/1/22 | 400 | 392 | |||||||||
| American International Group, Inc. | |||||||||||
| 6.40%, 12/15/20 | 375 | 425 | |||||||||
| Barclays Bank PLC | |||||||||||
| 6.05%, 12/4/17 (c)(e) | 600 | 620 | |||||||||
| BBVA Bancomer SA | |||||||||||
| 4.50%, 3/10/16 (c) | 525 | 543 | |||||||||
| Bear Stearns Cos. LLC (The) | |||||||||||
| 7.25%, 2/1/18 (e) | 490 | 592 | |||||||||
| BNP Paribas SA | |||||||||||
| 5.00%, 1/15/21 | 615 | 622 | |||||||||
| Brandywine Operating Partnership LP | |||||||||||
| 4.95%, 4/15/18 | 750 | 766 | |||||||||
| Brookfield Asset Management, Inc. | |||||||||||
| 5.80%, 4/25/17 (e) | 300 | 325 | |||||||||
| Capital One Bank, USA NA | |||||||||||
| 8.80%, 7/15/19 | 555 | 680 | |||||||||
| Cigna Corp., | |||||||||||
| 2.75%, 11/15/16 | 335 | 340 | |||||||||
| 5.38%, 2/15/42 | 45 | 46 | |||||||||
| Face Amount (000) | Value (000) | ||||||||||
| Citigroup, Inc. (See Note G-2) | |||||||||||
| 8.50%, 5/22/19 (e) | $ | 704 | $ | 869 | |||||||
| 5.88%, 5/29/37 | 264 | 272 | |||||||||
| CNA Financial Corp. | |||||||||||
| 5.75%, 8/15/21 | 315 | 336 | |||||||||
| Cooperatieve Centrale Raiffeisen-Boerenleenbank BA/Utrect | |||||||||||
| 3.38%, 1/19/17 (e) | 615 | 629 | |||||||||
| Coventry Health Care, Inc. | |||||||||||
| 5.45%, 6/15/21 | 540 | 592 | |||||||||
| Credit Suisse | |||||||||||
| 6.00%, 2/15/18 (e) | 369 | 400 | |||||||||
| Dexus Diversified Trust/Dexus Office Trust | |||||||||||
| 5.60%, 3/15/21 (c) | 600 | 599 | |||||||||
| Digital Realty Trust LP | |||||||||||
| 4.50%, 7/15/15 | 400 | 420 | |||||||||
| Discover Bank | |||||||||||
| 7.00%, 4/15/20 (e) | 575 | 661 | |||||||||
| DNB Bank ASA | |||||||||||
| 3.20%, 4/3/17 (c)(f) | 685 | 688 | |||||||||
| ERP Operating LP | |||||||||||
| 4.63%, 12/15/21 | 205 | 216 | |||||||||
| Farmers Insurance Exchange | |||||||||||
| 8.63%, 5/1/24 (c) | 320 | 404 | |||||||||
| General Electric Capital Corp., | |||||||||||
| 5.30%, 2/11/21 (e) | 630 | 684 | |||||||||
| Series G | |||||||||||
| 6.00%, 8/7/19 | 694 | 812 | |||||||||
| Genworth Financial, Inc. | |||||||||||
| 7.20%, 2/15/21 | 625 | 638 | |||||||||
| Goldman Sachs Group, Inc. (The) | |||||||||||
| 5.75%, 1/24/22 | 1,355 | 1,397 | |||||||||
| Goodman Funding Pty Ltd. | |||||||||||
| 6.38%, 4/15/21 (c) | 850 | 881 | |||||||||
| Hartford Financial Services Group, Inc. | |||||||||||
| 5.50%, 3/30/20 (e) | 645 | 690 | |||||||||
| HBOS PLC, | |||||||||||
| Series G | |||||||||||
| 6.75%, 5/21/18 (c) | 1,388 | 1,304 | |||||||||
| Health Care REIT, Inc. | |||||||||||
| 4.75%, 7/15/27 | 520 | 582 | |||||||||
| HSBC Holdings PLC | |||||||||||
| 4.00%, 3/30/22 | 635 | 631 | |||||||||
| ING Bank | |||||||||||
| 3.75%, 3/7/17 (c) | 600 | 595 | |||||||||
| JPMorgan Chase Bank NA | |||||||||||
| 6.00%, 10/1/17 (e) | 715 | 819 | |||||||||
| Macquarie Bank Ltd. | |||||||||||
| 6.63%, 4/7/21 (c) | 490 | 493 | |||||||||
| Merrill Lynch & Co., Inc., | |||||||||||
| MTN | |||||||||||
| 6.88%, 4/25/18 | 908 | 1,011 | |||||||||
The accompanying notes are an integral part of the financial statements.
27
2012 Semi-Annual Report
March 31, 2012 (unaudited)
Portfolio of Investments (cont'd)
Core Plus Fixed Income Portfolio
| Face Amount (000) | Value (000) | ||||||||||
| Finance (cont'd) | |||||||||||
| MetLife, Inc. | |||||||||||
| 7.72%, 2/15/19 | $ | 285 | $ | 360 | |||||||
| Mizuho Corporate Bank Ltd. | |||||||||||
| 2.55%, 3/17/17 (c)(e) | 570 | 571 | |||||||||
| National Australia Bank | |||||||||||
| 2.75%, 3/9/17 | 545 | 543 | |||||||||
| Nationwide Building Society | |||||||||||
| 6.25%, 2/25/20 (c) | 645 | 670 | |||||||||
| Nationwide Financial Services | |||||||||||
| 5.38%, 3/25/21 (c) | 450 | 461 | |||||||||
| Nordea Bank AB | |||||||||||
| 4.88%, 5/13/21 (c) | 765 | 746 | |||||||||
| Platinum Underwriters Finance, Inc., | |||||||||||
| Series B | |||||||||||
| 7.50%, 6/1/17 (e) | 791 | 847 | |||||||||
| Principal Financial Group, Inc. | |||||||||||
| 8.88%, 5/15/19 | 308 | 394 | |||||||||
| QBE Capital Funding III Ltd. | |||||||||||
| 7.25%, 5/24/41 (b)(c)(e) | 550 | 519 | |||||||||
| Regions Financial Corp. | |||||||||||
| 5.75%, 6/15/15 (e) | 545 | 576 | |||||||||
| Santander Holdings USA, Inc. | |||||||||||
| 4.63%, 4/19/16 (e) | 250 | 254 | |||||||||
| SLM Corp., | |||||||||||
| MTN | |||||||||||
| 6.25%, 1/25/16 | 580 | 604 | |||||||||
| Societe Generale SA | |||||||||||
| 5.20%, 4/15/21 (c)(e) | 455 | 438 | |||||||||
| Standard Chartered Bank | |||||||||||
| 6.40%, 9/26/17 (c) | 790 | 880 | |||||||||
| Svenska Handelsbanken AB | |||||||||||
| 2.88%, 4/4/17 (f) | 695 | 696 | |||||||||
| UDR, Inc., | |||||||||||
| Series 0001 MTN | |||||||||||
| 4.63%, 1/10/22 | 410 | 421 | |||||||||
| UnitedHealth Group, Inc., | |||||||||||
| 3.38%, 11/15/21 (e) | 235 | 242 | |||||||||
| 4.63%, 11/15/41 (e) | 265 | 266 | |||||||||
| Vornado Realty LP | |||||||||||
| 3.88%, 4/15/25 | 507 | 510 | |||||||||
| Wachovia Bank NA | |||||||||||
| 6.00%, 11/15/17 | 415 | 477 | |||||||||
| Wachovia Corp. | |||||||||||
| 5.63%, 10/15/16 | 400 | 446 | |||||||||
| WEA Finance LLC | |||||||||||
| 4.63%, 5/10/21 (c) | 325 | 329 | |||||||||
| Wells Operating Partnership II LP | |||||||||||
| 5.88%, 4/1/18 | 800 | 811 | |||||||||
| 37,195 | |||||||||||
| Industrials (21.1%) | |||||||||||
| Alpha Natural Resources, Inc., | |||||||||||
| 6.00%, 6/1/19 (e) | 100 | 91 | |||||||||
| 6.25%, 6/1/21 (e) | 280 | 254 | |||||||||
| Face Amount (000) | Value (000) | ||||||||||
| Altria Group, Inc., | |||||||||||
| 4.13%, 9/11/15 | $ | 45 | $ | 49 | |||||||
| 9.25%, 8/6/19 | 687 | 925 | |||||||||
| American Honda Finance Corp. | |||||||||||
| 2.13%, 2/28/17 (c) | 770 | 774 | |||||||||
| AMERIGROUP Corp. | |||||||||||
| 7.50%, 11/15/19 | 415 | 457 | |||||||||
| ArcelorMittal | |||||||||||
| 9.85%, 6/1/19 (e) | 666 | 802 | |||||||||
| Archer-Daniels-Midland Co. | |||||||||||
| 0.88%, 2/15/14 | 535 | 550 | |||||||||
| Aristotle Holding, Inc. | |||||||||||
| 2.65%, 2/15/17 (c) | 485 | 491 | |||||||||
| AT&T, Inc. | |||||||||||
| 6.30%, 1/15/38 (e) | 500 | 590 | |||||||||
| BAA Funding Ltd. | |||||||||||
| 4.88%, 7/15/21 (c)(e) | 750 | 766 | |||||||||
| Barrick Gold Corp. | |||||||||||
| 3.85%, 4/1/22 | 340 | 340 | |||||||||
| Barrick North America Finance LLC | |||||||||||
| 4.40%, 5/30/21 | 430 | 454 | |||||||||
| BAT International Finance PLC | |||||||||||
| 9.50%, 11/15/18 (c) | 405 | 553 | |||||||||
| Bemis Co., Inc. | |||||||||||
| 4.50%, 10/15/21 | 525 | 550 | |||||||||
| Best Buy Co., Inc. | |||||||||||
| 3.75%, 3/15/16 (e) | 545 | 550 | |||||||||
| Bombardier, Inc. | |||||||||||
| 7.75%, 3/15/20 (c)(e) | 575 | 644 | |||||||||
| Boston Scientific Corp. | |||||||||||
| 6.00%, 1/15/20 | 480 | 552 | |||||||||
| Bunge Ltd. Finance Corp. | |||||||||||
| 8.50%, 6/15/19 | 566 | 692 | |||||||||
| Burlington Northern Santa Fe LLC | |||||||||||
| 3.05%, 3/15/22 | 725 | 714 | |||||||||
| Canadian Oil Sands Ltd. | |||||||||||
| 7.75%, 5/15/19 (c) | 425 | 519 | |||||||||
| CBS Corp. | |||||||||||
| 8.88%, 5/15/19 | 500 | 658 | |||||||||
| CenturyLink, Inc., | |||||||||||
| 5.80%, 3/15/22 | 380 | 372 | |||||||||
| 6.45%, 6/15/21 (e) | 440 | 452 | |||||||||
| CF Industries, Inc. | |||||||||||
| 6.88%, 5/1/18 | 1,075 | 1,243 | |||||||||
| Chesapeake Energy Corp., | |||||||||||
| 2.50%, 5/15/37 | 455 | 415 | |||||||||
| 6.78%, 3/15/19 (e) | 425 | 422 | |||||||||
| Chrysler Group LLC/CG Co-Issuer, Inc. | |||||||||||
| 8.00%, 6/15/19 (e) | 760 | 768 | |||||||||
| Cimarex Energy Co. | |||||||||||
| 5.88%, 5/1/22 (f) | 400 | 409 | |||||||||
| Comcast Corp. | |||||||||||
| 5.70%, 5/15/18 | 98 | 116 | |||||||||
The accompanying notes are an integral part of the financial statements.
28
2012 Semi-Annual Report
March 31, 2012 (unaudited)
Portfolio of Investments (cont'd)
Core Plus Fixed Income Portfolio
| Face Amount (000) | Value (000) | ||||||||||
| Industrials (cont'd) | |||||||||||
| ConAgra Foods, Inc. | |||||||||||
| 8.25%, 9/15/30 | $ | 425 | $ | 541 | |||||||
| Concho Resources, Inc. | |||||||||||
| 7.00%, 1/15/21 (e) | 115 | 124 | |||||||||
| Constellation Brands, Inc. | |||||||||||
| 7.25%, 9/1/16 | 370 | 421 | |||||||||
| Continental Resources, Inc. | |||||||||||
| 7.13%, 4/1/21 | 575 | 641 | |||||||||
| Corning, Inc., | |||||||||||
| 4.75%, 3/15/42 (e) | 200 | 194 | |||||||||
| 7.25%, 8/15/36 | 270 | 323 | |||||||||
| CRH America, Inc. | |||||||||||
| 6.00%, 9/30/16 (e) | 580 | 632 | |||||||||
| CSC Holdings LLC | |||||||||||
| 6.75%, 11/15/21 (c)(e) | 470 | 492 | |||||||||
| Daimler Finance North America LLC | |||||||||||
| 8.50%, 1/18/31 (e) | 224 | 327 | |||||||||
| Darden Restaurants, Inc. | |||||||||||
| 6.20%, 10/15/17 | 520 | 587 | |||||||||
| Delhaize Group SA | |||||||||||
| 5.70%, 10/1/40 | 433 | 402 | |||||||||
| DirecTV Holdings LLC/DirecTV Financing Co., Inc. | |||||||||||
| 3.80%, 3/15/22 (c) | 675 | 667 | |||||||||
| DISH DBS Corp. | |||||||||||
| 7.13%, 2/1/16 | 580 | 645 | |||||||||
| Ecolab, Inc. | |||||||||||
| 3.00%, 12/8/16 (e) | 435 | 453 | |||||||||
| Fidelity National Information Services, Inc. | |||||||||||
| 5.00%, 3/15/22 (c) | 989 | 979 | |||||||||
| Fiserv, Inc. | |||||||||||
| 3.13%, 6/15/16 | 360 | 368 | |||||||||
| FMG Resources August 2006 Pty Ltd., | |||||||||||
| 6.38%, 2/1/16 (c) | 380 | 381 | |||||||||
| 6.88%, 2/1/18 (c)(e) | 140 | 141 | |||||||||
| Frontier Communications Corp. | |||||||||||
| 8.50%, 4/15/20 (e) | 75 | 79 | |||||||||
| Gap, Inc. (The) | |||||||||||
| 5.95%, 4/12/21 (e) | 645 | 652 | |||||||||
| Georgia-Pacific LLC | |||||||||||
| 8.88%, 5/15/31 | 480 | 649 | |||||||||
| Gilead Sciences, Inc. | |||||||||||
| 5.65%, 12/1/41 | 490 | 525 | |||||||||
| Grupo Bimbo SAB de CV | |||||||||||
| 4.88%, 6/30/20 (c) | 735 | 778 | |||||||||
| Harley-Davidson Funding Corp. | |||||||||||
| 6.80%, 6/15/18 (c) | 630 | 737 | |||||||||
| Hewlett-Packard Co. | |||||||||||
| 4.65%, 12/9/21 | 780 | 818 | |||||||||
| Holcim US Finance Sarl & Cie SCS | |||||||||||
| 6.00%, 12/30/19 (c) | 483 | 500 | |||||||||
| Home Depot, Inc. (The) | |||||||||||
| 5.88%, 12/16/36 | 443 | 533 | |||||||||
| Face Amount (000) | Value (000) | ||||||||||
| Hyatt Hotels Corp. | |||||||||||
| 6.88%, 8/15/19 (c) | $ | 545 | $ | 629 | |||||||
| Ingram Micro, Inc. | |||||||||||
| 5.25%, 9/1/17 | 295 | 311 | |||||||||
| Intel Corp. | |||||||||||
| 2.95%, 12/15/35 (e) | 588 | 679 | |||||||||
| International Game Technology | |||||||||||
| 3.25%, 5/1/14 | 492 | 560 | |||||||||
| Kinross Gold Corp. | |||||||||||
| 5.13%, 9/1/21 (c)(e) | 520 | 529 | |||||||||
| KLA-Tencor Corp. | |||||||||||
| 6.90%, 5/1/18 | 659 | 787 | |||||||||
| Koninklijke Philips Electronics | |||||||||||
| 3.75%, 3/15/22 | 850 | 857 | |||||||||
| Lafarge SA | |||||||||||
| 6.20%, 7/9/15 (c) | 765 | 806 | |||||||||
| Lam Research Corp. | |||||||||||
| 1.25%, 5/15/18 (c)(e) | 651 | 687 | |||||||||
| Life Technologies Corp. | |||||||||||
| 6.00%, 3/1/20 | 605 | 693 | |||||||||
| LyondellBasell Industries N.V. | |||||||||||
| 5.00%, 4/15/19 (c)(f) | 950 | 952 | |||||||||
| Macy's Retail Holdings, Inc. | |||||||||||
| 3.88%, 1/15/22 (e) | 265 | 266 | |||||||||
| Marathon Petroleum Corp. | |||||||||||
| 5.13%, 3/1/21 (e) | 750 | 817 | |||||||||
| MeadWestvaco Corp. | |||||||||||
| 7.38%, 9/1/19 (e) | 155 | 181 | |||||||||
| Medtronic, Inc., | |||||||||||
| Series B | |||||||||||
| 1.63%, 4/15/13 | 563 | 571 | |||||||||
| Micron Technology, Inc. | |||||||||||
| 1.88%, 6/1/14 | 466 | 476 | |||||||||
| Microsoft Corp. | |||||||||||
| Zero Coupon, 6/15/13 (c)(e) | 534 | 587 | |||||||||
| Molson Coors Brewing Co. | |||||||||||
| 2.50%, 7/30/13 (e) | 497 | 522 | |||||||||
| NBC Universal Media LLC | |||||||||||
| 5.15%, 4/30/20 (e) | 915 | 1,037 | |||||||||
| News America, Inc. | |||||||||||
| 4.50%, 2/15/21 (e) | 340 | 363 | |||||||||
| PepsiCo, Inc. | |||||||||||
| 2.75%, 3/5/22 | 600 | 585 | |||||||||
| Phillips 66 | |||||||||||
| 4.30%, 4/1/22 (c) | 750 | 764 | |||||||||
| Pioneer Natural Resources Co. | |||||||||||
| 7.50%, 1/15/20 | 375 | 461 | |||||||||
| priceline.com, Inc. | |||||||||||
| 1.00%, 3/15/18 (c) | 155 | 165 | |||||||||
| Quest Diagnostics, Inc. | |||||||||||
| 6.95%, 7/1/37 | 400 | 490 | |||||||||
| RadioShack Corp. | |||||||||||
| 2.50%, 8/1/13 (c) | 563 | 539 | |||||||||
The accompanying notes are an integral part of the financial statements.
29
2012 Semi-Annual Report
March 31, 2012 (unaudited)
Portfolio of Investments (cont'd)
Core Plus Fixed Income Portfolio
| Face Amount (000) | Value (000) | ||||||||||
| Industrials (cont'd) | |||||||||||
| Sable International Finance Ltd. | |||||||||||
| 7.75%, 2/15/17 (c) | $ | 681 | $ | 715 | |||||||
| SABMiller Holdings, Inc. | |||||||||||
| 3.75%, 1/15/22 (c) | 420 | 428 | |||||||||
| SBA Telecommunications, Inc. | |||||||||||
| 8.25%, 8/15/19 (e) | 565 | 626 | |||||||||
| Sonoco Products Co. | |||||||||||
| 5.75%, 11/1/40 | 370 | 395 | |||||||||
| Symantec Corp., | |||||||||||
| Series B | |||||||||||
| 1.00%, 6/15/13 (e) | 488 | 549 | |||||||||
| Syngenta Finance | |||||||||||
| 3.13%, 3/28/22 | 360 | 363 | |||||||||
| Teva Pharmaceutical Finance IV BV | |||||||||||
| 3.65%, 11/10/21 | 525 | 533 | |||||||||
| Time Warner, Inc., | |||||||||||
| 4.70%, 1/15/21 | 200 | 219 | |||||||||
| 4.75%, 3/29/21 (e) | 405 | 446 | |||||||||
| 5.88%, 11/15/16 (e) | 170 | 199 | |||||||||
| Total Capital International SA | |||||||||||
| 2.88%, 2/17/22 (e) | 650 | 625 | |||||||||
| Vale Overseas Ltd. | |||||||||||
| 5.63%, 9/15/19 (e) | 694 | 779 | |||||||||
| Valspar Corp. | |||||||||||
| 4.20%, 1/15/22 | 605 | 621 | |||||||||
| Verisk Analytics, Inc. | |||||||||||
| 5.80%, 5/1/21 | 550 | 588 | |||||||||
| Vivendi SA | |||||||||||
| 6.63%, 4/4/18 (c) | 758 | 853 | |||||||||
| Volkswagen International Finance N.V. | |||||||||||
| 2.38%, 3/22/17 (c)(e) | 550 | 553 | |||||||||
| Weatherford Bermuda | |||||||||||
| 4.50%, 4/15/22 | 375 | 375 | |||||||||
| Wesfarmers Ltd. | |||||||||||
| 2.98%, 5/18/16 (c)(e) | 390 | 399 | |||||||||
| WPP Finance UK | |||||||||||
| 8.00%, 9/15/14 | 664 | 762 | |||||||||
| Wyndham Worldwide Corp. | |||||||||||
| 4.25%, 3/1/22 (e) | 680 | 668 | |||||||||
| Wynn Las Vegas LLC/Wynn Las Vegas Capital Corp. | |||||||||||
| 5.38%, 3/15/22 (c)(e) | 700 | 684 | |||||||||
| 56,455 | |||||||||||
| Utilities (1.7%) | |||||||||||
| Energy Transfer Partners LP | |||||||||||
| 9.00%, 4/15/19 | 308 | 383 | |||||||||
| Enterprise Products Operating LLC | |||||||||||
| 5.20%, 9/1/20 (e) | 635 | 710 | |||||||||
| EQT Corp. | |||||||||||
| 4.88%, 11/15/21 | 375 | 380 | |||||||||
| Exelon Generation Co., LLC | |||||||||||
| 6.25%, 10/1/39 | 445 | 523 | |||||||||
| Face Amount (000) | Value (000) | ||||||||||
| FirstEnergy Solutions Corp. | |||||||||||
| 6.05%, 8/15/21 | $ | 869 | $ | 977 | |||||||
| MarkWest Energy Partners LP/MarkWest Energy Finance Corp. | |||||||||||
| 6.25%, 6/15/22 | 225 | 237 | |||||||||
| Plains All American Pipeline LP/PAA Finance Corp. | |||||||||||
| 6.70%, 5/15/36 (e) | 614 | 719 | |||||||||
| PPL WEM Holdings PLC | |||||||||||
| 3.90%, 5/1/16 (c) | 625 | 651 | |||||||||
| 4,580 | |||||||||||
| 98,230 | |||||||||||
| Mortgages — Other (6.8%) | |||||||||||
| Banc of America Alternative Loan Trust, | |||||||||||
| 5.86%, 10/25/36 (b) | 1,194 | 799 | |||||||||
| 5.91%, 10/25/36 (b) | 2,050 | 1,354 | |||||||||
| 6.00%, 4/25/36 | 832 | 833 | |||||||||
| Banc of America Funding Corp. | |||||||||||
| 0.61%, 8/25/36 (b) | 658 | 599 | |||||||||
| Chase Mortgage Finance Corp., | |||||||||||
| 5.50%, 11/25/35 | 1,024 | 984 | |||||||||
| 6.00%, 11/25/36 | 1,199 | 1,016 | |||||||||
| Chaseflex Trust | |||||||||||
| 6.00%, 2/25/37 | 1,918 | 1,362 | |||||||||
| First Horizon Alternative Mortgage Securities | |||||||||||
| 6.25%, 8/25/36 | 1,262 | 937 | |||||||||
| GS Mortgage Securities Corp. | |||||||||||
| 7.50%, 9/25/36 (b)(c) | 1,445 | 1,106 | |||||||||
| JP Morgan Mortgage Trust, | |||||||||||
| 6.00%, 6/25/37 | 837 | 772 | |||||||||
| 6.25%, 7/25/36 | 1,186 | 1,111 | |||||||||
| Lehman Mortgage Trust, | |||||||||||
| 5.50%, 11/25/35 - 2/25/36 | 2,766 | 2,501 | |||||||||
| 6.50%, 9/25/37 | 2,520 | 1,914 | |||||||||
| WaMu Mortgage Pass-Through Certificates, | |||||||||||
| 1.14%, 7/25/46 (b) | 2,054 | 1,351 | |||||||||
| 5.13%, 6/25/37 (b) | 2,089 | 1,533 | |||||||||
| 18,172 | |||||||||||
| Municipal Bonds (1.8%) | |||||||||||
| Chicago, IL, Transit Authority | |||||||||||
| 6.20%, 12/1/40 | 665 | 755 | |||||||||
| City of Chicago, IL, | |||||||||||
| O'Hare International Airport Revenue | |||||||||||
| 6.40%, 1/1/40 | 255 | 313 | |||||||||
| City of New York, NY, | |||||||||||
| Series G-1 | |||||||||||
| 5.97%, 3/1/36 | 270 | 332 | |||||||||
| Illinois State Toll Highway Authority, | |||||||||||
| Highway Revenue, Build America Bonds | |||||||||||
| 6.18%, 1/1/34 | 877 | 1,053 | |||||||||
| Municipal Electric Authority of Georgia, | |||||||||||
| 6.64%, 4/1/57 | 283 | 319 | |||||||||
| 6.66%, 4/1/57 | 320 | 359 | |||||||||
The accompanying notes are an integral part of the financial statements.
30
2012 Semi-Annual Report
March 31, 2012 (unaudited)
Portfolio of Investments (cont'd)
Core Plus Fixed Income Portfolio
| Face Amount (000) | Value (000) | ||||||||||
| Municipal Bonds (cont'd) | |||||||||||
| New York City, NY, Transitional Finance Authority | |||||||||||
| 5.27%, 5/1/27 | $ | 540 | $ | 640 | |||||||
| State of California, | |||||||||||
| General Obligation Bonds | |||||||||||
| 5.95%, 4/1/16 | 830 | 942 | |||||||||
| 4,713 | |||||||||||
| Sovereign (1.7%) | |||||||||||
| Bermuda Government International Bond | |||||||||||
| 5.60%, 7/20/20 (c) | 775 | 879 | |||||||||
| Brazilian Government International Bond | |||||||||||
| 4.88%, 1/22/21 (e) | 800 | 909 | |||||||||
| Korea Development Bank (The) | |||||||||||
| 4.38%, 8/10/15 | 875 | 927 | |||||||||
| Korea Finance Corp. | |||||||||||
| 4.63%, 11/16/21 | 670 | 687 | |||||||||
| Mexico Government International Bond | |||||||||||
| 3.63%, 3/15/22 (e) | 400 | 410 | |||||||||
| Russian Foreign Bond — Eurobond | |||||||||||
| 3.25%, 4/4/17 (c)(f) | 800 | 807 | |||||||||
| 4,619 | |||||||||||
| U.S. Agency Securities (1.7%) | |||||||||||
| Federal Home Loan Mortgage Corporation, | |||||||||||
| 3.75%, 3/27/19 (e) | 3,500 | 3,933 | |||||||||
| 6.75%, 3/15/31 | 470 | 679 | |||||||||
| 4,612 | |||||||||||
| U.S. Treasury Securities (9.4%) | |||||||||||
| U.S. Treasury Bonds | |||||||||||
| 3.88%, 8/15/40 (e) | 10,400 | 11,505 | |||||||||
| U.S. Treasury Notes, | |||||||||||
| 1.00%, 9/30/16 | 5,365 | 5,384 | |||||||||
| 1.75%, 7/31/15 | 7,900 | 8,193 | |||||||||
| 25,082 | |||||||||||
| Total Fixed Income Securities (Cost $251,423) | 257,220 | ||||||||||
| Shares | |||||||||||
| Short-Term Investments (17.0%) | |||||||||||
| Securities held as Collateral on Loaned Securities (5.8%) | |||||||||||
| Investment Company (4.9%) | |||||||||||
| Morgan Stanley Institutional Liquidity Funds — Money Market Portfolio — Institutional Class (See Note G-2) | 12,991,378 | 12,991 | |||||||||
| Face Amount (000) | |||||||||||
| Repurchase Agreements (0.9%) | |||||||||||
| Barclays Capital, Inc., (0.15%, dated 3/30/12, due 4/2/12; proceeds $345; fully collateralized by a U.S. Government Agency; Federal National Mortgage Association 4.00% due 1/1/42; valued at $352) | $ | 345 | 345 | ||||||||
| Face Amount (000) | Value (000) | ||||||||||
| Merrill Lynch & Co., Inc., (0.25%, dated 3/30/12, due 4/2/12; proceeds $2,132; fully collateralized by Common Stocks; Alliance Data Systems Corp.; American International Group, Inc.; Boeing Co. (The); Energy Transfer Equity LP; Freeport-McMoRan Copper & Gold, Inc.; GNC Holdings, Inc.; Hershey Co. (The); L-3 Communications Holdings, Inc.; McKesson Corp.; Teva Pharmaceutical Industries Ltd.; Two Harbors Investment Corp.; Vale SA; valued at $2,302) | $ | 2,132 | $ | 2,132 | |||||||
| 2,477 | |||||||||||
| Total Securities held as Collateral on Loaned Securities (Cost $15,468) | 15,468 | ||||||||||
| Shares | |||||||||||
| Investment Company (9.1%) | |||||||||||
| Morgan Stanley Institutional Liquidity Funds — Money Market Portfolio — Institutional Class (See Note G-2) (Cost $24,349) | 24,348,953 | 24,349 | |||||||||
| Face Amount (000) | |||||||||||
| U.S. Treasury Security (2.1%) | |||||||||||
| U.S. Treasury Bill | |||||||||||
| 0.05%, 6/7/12 (g) | $ | 5,700 | 5,699 | ||||||||
| Total Short-Term Investments (Cost $45,517) | 45,516 | ||||||||||
| Total Investments (113.0%) (Cost $296,940) Including $20,904 of Securities Loaned (h) | 302,736 | ||||||||||
| Liabilities in Excess of Other Assets (-13.0%) | (34,779 | ) | |||||||||
| Net Assets (100.0%) | $ | 267,957 | |||||||||
(a) Security is subject to delayed delivery.
(b) Variable/Floating Rate Security — Interest rate changes on these instruments are based on changes in a designated base rate. The rates shown are those in effect on March 31, 2012.
(c) 144A security — Certain conditions for public sale may exist. Unless otherwise noted, these securities are deemed to be liquid.
(d) Inverse Floating Rate Security — Interest rate fluctuates with an inverse relationship to an associated interest rate. Indicated rate is the effective rate at March 31, 2012.
(e) All or a portion of this security was on loan at March 31, 2012.
(f) When-issued security.
(g) Rate shown is the yield to maturity at March 31, 2012.
(h) Securities are available for collateral in connection with purchase of when-issued securities, securities purchased on a forward commitment basis, open foreign currency exchange contracts, futures contracts and swap agreements.
@ Face Amount/Value is less than $500.
IO Interest Only.
MTN Medium Term Note.
PAC Planned Amortization Class.
REIT Real Estate Investment Trust.
REMIC Real Estate Mortgage Investment Conduit.
STRIPS Separate Trading of Registered Interest and Principal of Securities.
TBA To Be Announced.
The accompanying notes are an integral part of the financial statements.
31
2012 Semi-Annual Report
March 31, 2012 (unaudited)
Portfolio of Investments (cont'd)
Core Plus Fixed Income Portfolio
Foreign Currency Exchange Contracts Information:
The Portfolio had the following foreign currency exchange contracts open at period end:
| Counterparty | Currency to Deliver (000) | Value (000) | Settlement Date | In Exchange For (000) | Value (000) | Unrealized Appreciation (Depreciation) (000) | |||||||||||||||||||||
| Goldman Sachs International | NOK | 3,943 | $ | 692 | 4/4/12 | USD | 702 | $ | 702 | $ | 10 | ||||||||||||||||
| JPMorgan Chase Bank | USD | 1,443 | 1,443 | 4/4/12 | NOK | 8,215 | 1,442 | (1 | ) | ||||||||||||||||||
| UBS AG | NOK | 1 | — | @ | 4/4/12 | USD | — | @ | — | @ | (— | )@ | |||||||||||||||
| UBS AG | NOK | 4,271 | 750 | 4/4/12 | USD | 753 | 753 | 3 | |||||||||||||||||||
| Goldman Sachs International | AUD | 2,780 | 2,879 | 4/5/12 | USD | 2,953 | 2,953 | 74 | |||||||||||||||||||
| Goldman Sachs International | USD | 648 | 648 | 4/5/12 | CHF | 592 | 655 | 7 | |||||||||||||||||||
| Goldman Sachs International | USD | — | @ | — | @ | 4/5/12 | SEK | 1 | — | @ | (— | )@ | |||||||||||||||
| JPMorgan Chase Bank | CHF | 592 | 655 | 4/5/12 | USD | 649 | 649 | (6 | ) | ||||||||||||||||||
| UBS AG | CAD | 2,921 | 2,928 | 4/5/12 | USD | 2,927 | 2,927 | (1 | ) | ||||||||||||||||||
| UBS AG | SEK | 3,010 | 455 | 4/5/12 | USD | 452 | 452 | (3 | ) | ||||||||||||||||||
| UBS AG | USD | 2,929 | 2,929 | 4/5/12 | CAD | 2,921 | 2,928 | (1 | ) | ||||||||||||||||||
| UBS AG | USD | — | @ | — | @ | 4/5/12 | CHF | — | @ | — | @ | — | @ | ||||||||||||||
| UBS AG | USD | 442 | 442 | 4/5/12 | SEK | 3,009 | 455 | 13 | |||||||||||||||||||
| Wells Fargo Bank | USD | 2,881 | 2,881 | 4/5/12 | AUD | 2,780 | 2,879 | (2 | ) | ||||||||||||||||||
| UBS AG | USD | 2,926 | 2,926 | 4/30/12 | CAD | 2,921 | 2,927 | 1 | |||||||||||||||||||
| Wells Fargo Bank | AUD | 2,780 | 2,871 | 4/30/12 | USD | 2,873 | 2,873 | 2 | |||||||||||||||||||
| $ | 22,499 | $ | 22,595 | $ | 96 | ||||||||||||||||||||||
Futures Contracts:
The Portfolio had the following futures contracts open at period end:
| Number of Contracts | Value (000) | Expiration Date | Unrealized Appreciation (Depreciation) (000) | ||||||||||||||||
| Long: | |||||||||||||||||||
| U.S. Treasury 2 yr. Note | 151 | $ | 33,241 | Jun-12 | $ | (21 | ) | ||||||||||||
| U.S. Treasury 5 yr. Note | 27 | 3,309 | Jun-12 | (7 | ) | ||||||||||||||
| Short: | |||||||||||||||||||
| U.S. Treasury 10 yr. Note | 38 | (4,921 | ) | Jun-12 | 7 | ||||||||||||||
| U.S. Treasury 30 yr. Bond | 7 | (964 | ) | Jun-12 | 17 | ||||||||||||||
| Ultra Long U.S. Treasury Bond | 25 | (3,774 | ) | Jun-12 | (63 | ) | |||||||||||||
| $ | (67 | ) | |||||||||||||||||
Interest Rate Swap Agreements:
The Portfolio had the following interest rate swap agreements open at period end:
| Swap Counterparty | Floating Rate Index | Pay/Receive Floating Rate | Fixed Rate | Termination Date | Notional Amount (000) | Unrealized Appreciation (Depreciation) (000) | |||||||||||||||||||||
| Bank of America NA | 6 Month EURIBOR | Pay | 4.26 | % | 8/18/26 | EUR | 14,435 | $ | 644 | ||||||||||||||||||
| Bank of America NA | 3 Month LIBOR | Receive | 4.35 | 8/18/26 | $ | 19,325 | (342 | ) | |||||||||||||||||||
| Bank of America NA | 6 Month EURIBOR | Receive | 3.61 | 8/18/31 | EUR | 18,225 | (561 | ) | |||||||||||||||||||
| Bank of America NA | 3 Month LIBOR | Pay | 4.15 | 8/18/31 | $ | 23,970 | 329 | ||||||||||||||||||||
| Goldman Sachs International | 3 Month LIBOR | Receive | 2.42 | 3/22/22 | 3,020 | (41 | ) | ||||||||||||||||||||
| JPMorgan Chase Bank | 3 Month LIBOR | Receive | 2.43 | 3/22/22 | 1,464 | (22 | ) | ||||||||||||||||||||
| $ | 7 | ||||||||||||||||||||||||||
The accompanying notes are an integral part of the financial statements.
32
2012 Semi-Annual Report
March 31, 2012 (unaudited)
Portfolio of Investments (cont'd)
Core Plus Fixed Income Portfolio
@ Value is less than $500.
EURIBOR Euro Interbank Offered Rate.
LIBOR London Interbank Offered Rate.
AUD — Australian Dollar
CAD — Canadian Dollar
CHF — Swiss Franc
EUR — Euro
NOK — Norwegian Krone
SEK — Swedish Krona
USD — United States Dollar
Fair Value Measurement Information:
The following is a summary of the inputs used to value the Portfolio's investments as of March 31, 2012. (See Note A-5 to the financial statements for further information regarding fair value measurement.)
| Investment Type | Level 1 Unadjusted quoted prices (000) | Level 2 Other significant observable inputs (000) | Level 3 Significant unobservable inputs (000) | Total (000) | |||||||||||||||
| Assets: | |||||||||||||||||||
| Fixed Income Securities | |||||||||||||||||||
| Agency Adjustable Rate Mortgages | $ | — | $ | 1,993 | $ | — | $ | 1,993 | |||||||||||
| Agency Fixed Rate Mortgages | — | 73,496 | — | 73,496 | |||||||||||||||
| Asset-Backed Securities | — | 6,664 | — | 6,664 | |||||||||||||||
| Collateralized Mortgage Obligations — Agency Collateral Series | — | 12,587 | — | 12,587 | |||||||||||||||
| Commercial Mortgage Backed Securities | — | 7,052 | — | 7,052 | |||||||||||||||
| Corporate Bonds | — | 98,230 | — | 98,230 | |||||||||||||||
| Mortgages — Other | — | 18,172 | — | 18,172 | |||||||||||||||
| Municipal Bonds | — | 4,713 | — | 4,713 | |||||||||||||||
| Sovereign | — | 4,619 | — | 4,619 | |||||||||||||||
| U.S. Agency Securities | — | 4,612 | — | 4,612 | |||||||||||||||
| U.S. Treasury Securities | — | 25,082 | — | 25,082 | |||||||||||||||
| Total Fixed Income Securities | — | 257,220 | — | 257,220 | |||||||||||||||
| Short-Term Investments | |||||||||||||||||||
| Repurchase Agreements | — | 2,477 | — | 2,477 | |||||||||||||||
| Investment Company | 37,340 | — | — | 37,340 | |||||||||||||||
| U.S. Treasury Security | — | 5,699 | — | 5,699 | |||||||||||||||
| Total Short-Term Investments | 37,340 | 8,176 | — | 45,516 | |||||||||||||||
| Foreign Currency Exchange Contracts | — | 110 | — | 110 | |||||||||||||||
| Futures Contracts | 24 | — | — | 24 | |||||||||||||||
| Interest Rate Swap Agreements | — | 973 | — | 973 | |||||||||||||||
| Total Assets | 37,364 | 266,479 | — | 303,843 | |||||||||||||||
Fair Value Measurement Information: (cont'd)
| Investment Type | Level 1 Unadjusted quoted prices (000) | Level 2 Other significant observable inputs (000) | Level 3 Significant unobservable inputs (000) | Total (000) | |||||||||||||||
| Liabilities: | |||||||||||||||||||
| Foreign Currency Exchange Contracts | $ | — | $ | (14 | ) | $ | — | $ | (14 | ) | |||||||||
| Futures Contracts | (91 | ) | — | — | (91 | ) | |||||||||||||
| Interest Rate Swap Agreements | — | (966 | ) | — | (966 | ) | |||||||||||||
| Total Liabilities | (91 | ) | (980 | ) | — | (1,071 | ) | ||||||||||||
| Total | $ | 37,273 | $ | 265,499 | $ | — | $ | 302,772 | |||||||||||
Transfers between investment levels may occur as the markets fluctuate and/or the availability of data used in an investment's valuation changes. The Portfolio recognizes transfers between the levels as of the end of the period. As of March 31, 2012, the Portfolio did not have any significant investments transfer between investment levels.
Portfolio Composition*
| Classification | Percentage of Total Investments | ||||||
| Agency Fixed Rate Mortgages | 25.6 | % | |||||
| Industrials | 19.7 | ||||||
| Other** | 16.3 | ||||||
| Finance | 12.9 | ||||||
| Short-Term Investments | 10.5 | ||||||
| U.S. Treasury Securities | 8.7 | ||||||
| Mortgages — Other | 6.3 | ||||||
| Total Investments | 100.0 | %*** | |||||
* Percentages indicated are based upon total investments (excluding Securities held as Collateral on Loaned Securities) as of March 31, 2012.
** Industries and/or investment types representing less than 5% of total investments.
*** Does not include open long/short futures contracts with a value of approximately $46,209,000 and net unrealized depreciation of approximately $67,000. Also, does not include open foreign currency exchange contracts with net unrealized appreciation of approximately $96,000 and open swap agreements with net unrealized appreciation of approximately $7,000.
The accompanying notes are an integral part of the financial statements.
33
2012 Semi-Annual Report
March 31, 2012 (unaudited)
Portfolio of Investments
Corporate Bond Portfolio
| Face Amount (000) | Value (000) | ||||||||||
| Fixed Income Securities (98.4%) | |||||||||||
| Asset-Backed Securities (1.0%) | |||||||||||
| CVS Pass-Through Trust, | |||||||||||
| 6.04%, 12/10/28 | $ | 86 | $ | 94 | |||||||
| 8.35%, 7/10/31 (a) | 143 | 181 | |||||||||
| FUEL Trust | |||||||||||
| 4.21%, 4/15/16 (a) | 200 | 205 | |||||||||
| 480 | |||||||||||
| Collateralized Mortgage Obligations — Agency Collateral Series (0.0%) | |||||||||||
| Federal Home Loan Mortgage Corporation, | |||||||||||
| IO STRIPS | |||||||||||
| 8.00%, 1/1/28 | 30 | 8 | |||||||||
| Corporate Bonds (97.1%) | |||||||||||
| Finance (36.6%) | |||||||||||
| ABB Treasury Center USA, Inc. | |||||||||||
| 2.50%, 6/15/16 (a) | 195 | 199 | |||||||||
| Abbey National Treasury Services PLC, | |||||||||||
| MTN | |||||||||||
| 3.88%, 11/10/14 (a) | 146 | 147 | |||||||||
| ABN Amro Bank | |||||||||||
| 4.25%, 2/2/17 (a) | 210 | 214 | |||||||||
| Aegon N.V. | |||||||||||
| 4.63%, 12/1/15 | 320 | 339 | |||||||||
| Alexandria Real Estate Equities, Inc. | |||||||||||
| 4.60%, 4/1/22 | 150 | 147 | |||||||||
| American Express Co. | |||||||||||
| 8.13%, 5/20/19 | 250 | 327 | |||||||||
| American Financial Group, Inc. | |||||||||||
| 9.88%, 6/15/19 | 225 | 275 | |||||||||
| American International Group, Inc. | |||||||||||
| 6.40%, 12/15/20 | 345 | 391 | |||||||||
| Bank of America Corp. | |||||||||||
| 5.63%, 7/1/20 | 850 | 888 | |||||||||
| Barclays Bank PLC, | |||||||||||
| 5.13%, 1/8/20 | 300 | 314 | |||||||||
| 6.05%, 12/4/17 (a) | 115 | 119 | |||||||||
| Bear Stearns Cos. LLC (The) | |||||||||||
| 5.55%, 1/22/17 | 200 | 221 | |||||||||
| Berkshire Hathaway, Inc. | |||||||||||
| 3.75%, 8/15/21 (b) | 265 | 274 | |||||||||
| BNP Paribas SA | |||||||||||
| 5.00%, 1/15/21 | 320 | 324 | |||||||||
| Boston Properties LP | |||||||||||
| 5.88%, 10/15/19 | 30 | 34 | |||||||||
| Brandywine Operating Partnership LP | |||||||||||
| 4.95%, 4/15/18 | 215 | 220 | |||||||||
| Brookfield Asset Management, Inc. | |||||||||||
| 5.80%, 4/25/17 | 70 | 76 | |||||||||
| Capital One Bank, USA NA | |||||||||||
| 8.80%, 7/15/19 | 285 | 349 | |||||||||
| Capital One Capital VI | |||||||||||
| 8.88%, 5/15/40 | 150 | 152 | |||||||||
| Face Amount (000) | Value (000) | ||||||||||
| Cigna Corp. | |||||||||||
| 5.38%, 2/15/42 | $ | 85 | $ | 88 | |||||||
| Citigroup, Inc. (See Note G-2), | |||||||||||
| 4.45%, 1/10/17 | 125 | 131 | |||||||||
| 6.13%, 11/21/17 - 5/15/18 | 930 | 1,042 | |||||||||
| 8.50%, 5/22/19 | 76 | 94 | |||||||||
| CNA Financial Corp. | |||||||||||
| 5.75%, 8/15/21 | 250 | 267 | |||||||||
| Cooperatieve Centrale Raiffeisen-Boerenleenbank BA/Utrect | |||||||||||
| 3.88%, 2/8/22 | 260 | 252 | |||||||||
| Credit Suisse, | |||||||||||
| 5.40%, 1/14/20 | 295 | 304 | |||||||||
| 6.00%, 2/15/18 (b) | 61 | 66 | |||||||||
| Dexus Diversified Trust/Dexus Office Trust | |||||||||||
| 5.60%, 3/15/21 (a) | 225 | 225 | |||||||||
| Digital Realty Trust LP | |||||||||||
| 5.25%, 3/15/21 | 100 | 103 | |||||||||
| DNB Bank ASA | |||||||||||
| 3.20%, 4/3/17 (a)(c) | 255 | 256 | |||||||||
| ERP Operating LP | |||||||||||
| 4.63%, 12/15/21 | 90 | 95 | |||||||||
| Farmers Exchange Capital | |||||||||||
| 7.05%, 7/15/28 (a) | 215 | 236 | |||||||||
| General Electric Capital Corp., | |||||||||||
| 5.30%, 2/11/21 | 120 | 130 | |||||||||
| MTN | |||||||||||
| 5.88%, 1/14/38 (b) | 350 | 386 | |||||||||
| Series G | |||||||||||
| 6.00%, 8/7/19 | 666 | 779 | |||||||||
| Goldman Sachs Group, Inc. (The), | |||||||||||
| 5.75%, 1/24/22 | 360 | 371 | |||||||||
| 6.15%, 4/1/18 | 840 | 907 | |||||||||
| Goodman Funding Pty Ltd. | |||||||||||
| 6.38%, 4/15/21 (a) | 250 | 259 | |||||||||
| Hartford Financial Services Group, Inc. | |||||||||||
| 5.50%, 3/30/20 (b) | 275 | 294 | |||||||||
| HBOS PLC, | |||||||||||
| Series G | |||||||||||
| 6.75%, 5/21/18 (a) | 357 | 336 | |||||||||
| HCP, Inc. | |||||||||||
| 5.63%, 5/1/17 | 95 | 105 | |||||||||
| HSBC Holdings PLC, | |||||||||||
| 4.00%, 3/30/22 | 235 | 233 | |||||||||
| 4.88%, 1/14/22 | 275 | 292 | |||||||||
| Huntington Bancshares, Inc. | |||||||||||
| 7.00%, 12/15/20 | 140 | 158 | |||||||||
| ING Bank | |||||||||||
| 3.75%, 3/7/17 (a) | 200 | 198 | |||||||||
| JPMorgan Chase & Co. | |||||||||||
| 4.35%, 8/15/21 | 250 | 256 | |||||||||
| JPMorgan Chase Capital XXVII | |||||||||||
| 7.00%, 11/1/39 (b) | 400 | 407 | |||||||||
The accompanying notes are an integral part of the financial statements.
34
2012 Semi-Annual Report
March 31, 2012 (unaudited)
Portfolio of Investments (cont'd)
Corporate Bond Portfolio
| Face Amount (000) | Value (000) | ||||||||||
| Finance (cont'd) | |||||||||||
| Macquarie Group Ltd. | |||||||||||
| 6.00%, 1/14/20 (a) | $ | 215 | $ | 215 | |||||||
| Merrill Lynch & Co., Inc., | |||||||||||
| MTN | |||||||||||
| 6.88%, 4/25/18 | 217 | 242 | |||||||||
| MetLife, Inc. | |||||||||||
| 7.72%, 2/15/19 | 70 | 88 | |||||||||
| Mizuho Corporate Bank Ltd. | |||||||||||
| 2.55%, 3/17/17 (a)(b) | 245 | 245 | |||||||||
| National Australia Bank | |||||||||||
| 2.75%, 3/9/17 | 250 | 249 | |||||||||
| Nationwide Building Society | |||||||||||
| 6.25%, 2/25/20 (a) | 260 | 270 | |||||||||
| Nationwide Financial Services | |||||||||||
| 5.38%, 3/25/21 (a) | 175 | 180 | |||||||||
| Nordea Bank AB | |||||||||||
| 4.88%, 5/13/21 (a) | 200 | 195 | |||||||||
| Pacific LifeCorp | |||||||||||
| 6.00%, 2/10/20 (a) | 150 | 164 | |||||||||
| Platinum Underwriters Finance, Inc., | |||||||||||
| Series B | |||||||||||
| 7.50%, 6/1/17 | 234 | 250 | |||||||||
| PNC Funding Corp. | |||||||||||
| 5.13%, 2/8/20 (b) | 110 | 125 | |||||||||
| Principal Financial Group, Inc. | |||||||||||
| 8.88%, 5/15/19 | 167 | 214 | |||||||||
| Protective Life Corp. | |||||||||||
| 7.38%, 10/15/19 | 175 | 194 | |||||||||
| Prudential Financial, Inc. | |||||||||||
| 7.38%, 6/15/19 (b) | 200 | 248 | |||||||||
| Royal Bank of Scotland PLC (The) | |||||||||||
| 4.88%, 3/16/15 (b) | 255 | 265 | |||||||||
| Santander Holdings USA, Inc. | |||||||||||
| 4.63%, 4/19/16 | 55 | 56 | |||||||||
| Santander US Debt SA Unipersonal | |||||||||||
| 3.72%, 1/20/15 (a) | 200 | 195 | |||||||||
| SLM Corp., | |||||||||||
| MTN | |||||||||||
| 6.25%, 1/25/16 | 320 | 333 | |||||||||
| 8.00%, 3/25/20 | 90 | 97 | |||||||||
| Societe Generale SA | |||||||||||
| 5.20%, 4/15/21 (a)(b) | 200 | 192 | |||||||||
| Standard Chartered Bank | |||||||||||
| 6.40%, 9/26/17 (a) | 200 | 223 | |||||||||
| Svenska Handelsbanken AB | |||||||||||
| 2.88%, 4/4/17 (c) | 250 | 250 | |||||||||
| UDR, Inc., | |||||||||||
| MTN | |||||||||||
| 4.63%, 1/10/22 | 180 | 185 | |||||||||
| UnitedHealth Group, Inc. | |||||||||||
| 6.63%, 11/15/37 | 225 | 286 | |||||||||
| Face Amount (000) | Value (000) | ||||||||||
| Wachovia Corp. | |||||||||||
| 5.63%, 10/15/16 | $ | 245 | $ | 273 | |||||||
| WEA Finance LLC | |||||||||||
| 4.63%, 5/10/21 (a) | 75 | 76 | |||||||||
| Wells Operating Partnership II LP | |||||||||||
| 5.88%, 4/1/18 | 125 | 127 | |||||||||
| 18,717 | |||||||||||
| Industrials (50.6%) | |||||||||||
| Agilent Technologies, Inc. | |||||||||||
| 5.50%, 9/14/15 | 126 | 142 | |||||||||
| Altria Group, Inc. | |||||||||||
| 9.25%, 8/6/19 | 288 | 388 | |||||||||
| American Honda Finance Corp. | |||||||||||
| 2.13%, 2/28/17 (a) | 400 | 402 | |||||||||
| American Tower Corp. | |||||||||||
| 4.70%, 3/15/22 | 200 | 202 | |||||||||
| Amgen, Inc., | |||||||||||
| 2.50%, 11/15/16 | 240 | 247 | |||||||||
| 3.88%, 11/15/21 | 80 | 82 | |||||||||
| Anadarko Petroleum Corp. | |||||||||||
| 6.95%, 6/15/19 | 150 | 183 | |||||||||
| Anglo American Capital PLC | |||||||||||
| 9.38%, 4/8/19 (a) | 100 | 132 | |||||||||
| ArcelorMittal | |||||||||||
| 9.85%, 6/1/19 (b) | 209 | 252 | |||||||||
| Aristotle Holding, Inc. | |||||||||||
| 2.65%, 2/15/17 (a) | 225 | 228 | |||||||||
| AstraZeneca PLC | |||||||||||
| 6.45%, 9/15/37 (b) | 125 | 164 | |||||||||
| AT&T, Inc., | |||||||||||
| 5.55%, 8/15/41 (b) | 250 | 278 | |||||||||
| 6.30%, 1/15/38 | 340 | 401 | |||||||||
| 6.55%, 2/15/39 (b) | 100 | 122 | |||||||||
| BAA Funding Ltd. | |||||||||||
| 4.88%, 7/15/21 (a)(b) | 190 | 194 | |||||||||
| Barrick Gold Corp. | |||||||||||
| 3.85%, 4/1/22 | 180 | 180 | |||||||||
| Barrick North America Finance LLC | |||||||||||
| 4.40%, 5/30/21 | 245 | 259 | |||||||||
| BAT International Finance PLC | |||||||||||
| 9.50%, 11/15/18 (a) | 190 | 260 | |||||||||
| Bemis Co., Inc. | |||||||||||
| 4.50%, 10/15/21 | 230 | 241 | |||||||||
| Best Buy Co., Inc. | |||||||||||
| 3.75%, 3/15/16 (b) | 220 | 222 | |||||||||
| Boeing Capital Corp. | |||||||||||
| 2.13%, 8/15/16 (b) | 175 | 181 | |||||||||
| Boston Scientific Corp. | |||||||||||
| 6.00%, 1/15/20 | 105 | 121 | |||||||||
| Bunge Ltd. Finance Corp. | |||||||||||
| 8.50%, 6/15/19 | 149 | 182 | |||||||||
| Burlington Northern Santa Fe LLC, | |||||||||||
| 3.05%, 3/15/22 | 150 | 148 | |||||||||
| 5.65%, 5/1/17 | 130 | 151 | |||||||||
The accompanying notes are an integral part of the financial statements.
35
2012 Semi-Annual Report
March 31, 2012 (unaudited)
Portfolio of Investments (cont'd)
Corporate Bond Portfolio
| Face Amount (000) | Value (000) | ||||||||||
| Industrials (cont'd) | |||||||||||
| Canadian Natural Resources Ltd. | |||||||||||
| 6.25%, 3/15/38 | $ | 150 | $ | 184 | |||||||
| Canadian Oil Sands Ltd., | |||||||||||
| 6.00%, 4/1/42 (a)(b) | 50 | 50 | |||||||||
| 7.75%, 5/15/19 (a) | 175 | 214 | |||||||||
| Caterpillar, Inc. | |||||||||||
| 3.90%, 5/27/21 (b) | 130 | 143 | |||||||||
| CenturyLink, Inc., | |||||||||||
| 5.80%, 3/15/22 | 295 | 289 | |||||||||
| 6.45%, 6/15/21 | 180 | 185 | |||||||||
| Chesapeake Energy Corp. | |||||||||||
| 6.78%, 3/15/19 | 325 | 323 | |||||||||
| Cimarex Energy Co. | |||||||||||
| 5.88%, 5/1/22 (c) | 75 | 77 | |||||||||
| Cisco Systems, Inc. | |||||||||||
| 3.15%, 3/14/17 (b) | 300 | 325 | |||||||||
| Comcast Corp., | |||||||||||
| 5.15%, 3/1/20 (b) | 110 | 127 | |||||||||
| 5.70%, 5/15/18 | 232 | 274 | |||||||||
| 6.45%, 3/15/37 | 100 | 120 | |||||||||
| Corning, Inc., | |||||||||||
| 4.75%, 3/15/42 (b) | 50 | 49 | |||||||||
| 7.25%, 8/15/36 | 100 | 120 | |||||||||
| CRH America, Inc. | |||||||||||
| 6.00%, 9/30/16 | 400 | 436 | |||||||||
| Daimler Finance North America LLC | |||||||||||
| 8.50%, 1/18/31 | 161 | 235 | |||||||||
| Darden Restaurants, Inc. | |||||||||||
| 6.20%, 10/15/17 | 235 | 265 | |||||||||
| Delhaize Group SA | |||||||||||
| 5.70%, 10/1/40 | 125 | 116 | |||||||||
| Deutsche Telekom International Finance BV | |||||||||||
| 8.75%, 6/15/30 | 100 | 138 | |||||||||
| DirecTV Holdings LLC/DirecTV Financing Co., Inc., | |||||||||||
| 3.80%, 3/15/22 (a) | 300 | 296 | |||||||||
| 5.88%, 10/1/19 | 170 | 195 | |||||||||
| Dr. Pepper Snapple Group, Inc. | |||||||||||
| 7.45%, 5/1/38 | 100 | 135 | |||||||||
| Ecolab, Inc. | |||||||||||
| 3.00%, 12/8/16 | 190 | 198 | |||||||||
| Fidelity National Information Services, Inc. | |||||||||||
| 5.00%, 3/15/22 (a) | 266 | 263 | |||||||||
| Fiserv, Inc. | |||||||||||
| 3.13%, 6/15/16 | 190 | 194 | |||||||||
| Gap, Inc. (The) | |||||||||||
| 5.95%, 4/12/21 (b) | 185 | 187 | |||||||||
| Georgia-Pacific LLC, | |||||||||||
| 5.40%, 11/1/20 (a)(b) | 95 | 106 | |||||||||
| 8.88%, 5/15/31 | 100 | 135 | |||||||||
| Gilead Sciences, Inc., | |||||||||||
| 4.50%, 4/1/21 (b) | 115 | 122 | |||||||||
| 5.65%, 12/1/41 | 100 | 107 | |||||||||
| Face Amount (000) | Value (000) | ||||||||||
| Grupo Bimbo SAB de CV | |||||||||||
| 4.88%, 6/30/20 (a) | $ | 225 | $ | 238 | |||||||
| Halliburton Co. | |||||||||||
| 4.50%, 11/15/41 (b) | 175 | 178 | |||||||||
| Harley-Davidson Funding Corp. | |||||||||||
| 6.80%, 6/15/18 (a) | 245 | 287 | |||||||||
| Hess Corp. | |||||||||||
| 6.00%, 1/15/40 | 200 | 230 | |||||||||
| Hewlett-Packard Co., | |||||||||||
| 2.60%, 9/15/17 | 80 | 80 | |||||||||
| 4.65%, 12/9/21 | 285 | 299 | |||||||||
| Holcim US Finance Sarl & Cie SCS | |||||||||||
| 6.00%, 12/30/19 (a) | 182 | 188 | |||||||||
| Home Depot, Inc. (The) | |||||||||||
| 5.88%, 12/16/36 | 222 | 267 | |||||||||
| Hyatt Hotels Corp. | |||||||||||
| 6.88%, 8/15/19 (a) | 80 | 92 | |||||||||
| Incitec Pivot Ltd. | |||||||||||
| 4.00%, 12/7/15 (a) | 160 | 162 | |||||||||
| International Business Machines Corp., | |||||||||||
| 1.25%, 2/6/17 | 200 | 199 | |||||||||
| 2.00%, 1/5/16 (b) | 300 | 308 | |||||||||
| International Paper Co. | |||||||||||
| 4.75%, 2/15/22 (b) | 255 | 269 | |||||||||
| John Deere Capital Corp. | |||||||||||
| 3.90%, 7/12/21 | 175 | 189 | |||||||||
| Kinross Gold Corp. | |||||||||||
| 5.13%, 9/1/21 (a)(b) | 180 | 183 | |||||||||
| KLA-Tencor Corp. | |||||||||||
| 6.90%, 5/1/18 | 116 | 138 | |||||||||
| Kohl's Corp. | |||||||||||
| 6.88%, 12/15/37 | 104 | 126 | |||||||||
| Koninklijke Philips Electronics | |||||||||||
| 3.75%, 3/15/22 | 300 | 302 | |||||||||
| Kraft Foods, Inc., | |||||||||||
| 5.38%, 2/10/20 | 120 | 139 | |||||||||
| 6.88%, 1/26/39 (b) | 225 | 283 | |||||||||
| Kroger Co. (The) | |||||||||||
| 6.90%, 4/15/38 | 80 | 100 | |||||||||
| L-3 Communications Corp., | |||||||||||
| 4.75%, 7/15/20 | 145 | 150 | |||||||||
| 4.95%, 2/15/21 (b) | 65 | 68 | |||||||||
| Lorillard Tobacco Co. | |||||||||||
| 8.13%, 6/23/19 (b) | 300 | 373 | |||||||||
| Lubrizol Corp. | |||||||||||
| 8.88%, 2/1/19 | 165 | 224 | |||||||||
| LyondellBasell Industries N.V. (Netherlands) | |||||||||||
| 5.00%, 4/15/19 (a)(c) | 200 | 201 | |||||||||
| Macy's Retail Holdings, Inc. | |||||||||||
| 3.88%, 1/15/22 | 115 | 116 | |||||||||
| Marathon Petroleum Corp., | |||||||||||
| 5.13%, 3/1/21 (b) | 195 | 212 | |||||||||
| 6.50%, 3/1/41 | 75 | 81 | |||||||||
The accompanying notes are an integral part of the financial statements.
36
2012 Semi-Annual Report
March 31, 2012 (unaudited)
Portfolio of Investments (cont'd)
Corporate Bond Portfolio
| Face Amount (000) | Value (000) | ||||||||||
| Industrials (cont'd) | |||||||||||
| McDonald's Corp. | |||||||||||
| 2.63%, 1/15/22 (b) | $ | 250 | $ | 247 | |||||||
| McKesson Corp. | |||||||||||
| 4.75%, 3/1/21 (b) | 150 | 170 | |||||||||
| MeadWestvaco Corp. | |||||||||||
| 7.38%, 9/1/19 (b) | 120 | 140 | |||||||||
| NBC Universal Media LLC | |||||||||||
| 5.15%, 4/30/20 | 265 | 300 | |||||||||
| News America, Inc. | |||||||||||
| 4.50%, 2/15/21 | 85 | 91 | |||||||||
| Nordstrom, Inc. | |||||||||||
| 4.00%, 10/15/21 | 90 | 96 | |||||||||
| PepsiCo, Inc. | |||||||||||
| 2.75%, 3/5/22 | 275 | 268 | |||||||||
| Petro-Canada | |||||||||||
| 6.80%, 5/15/38 (b) | 145 | 186 | |||||||||
| Philip Morris International, Inc. | |||||||||||
| 4.50%, 3/20/42 | 150 | 149 | |||||||||
| Phillips 66 | |||||||||||
| 4.30%, 4/1/22 (a) | 300 | 306 | |||||||||
| Potash Corp. of Saskatchewan, Inc. | |||||||||||
| 5.88%, 12/1/36 | 75 | 91 | |||||||||
| Quest Diagnostics, Inc. | |||||||||||
| 6.95%, 7/1/37 | 195 | 239 | |||||||||
| Roper Industries, Inc. | |||||||||||
| 6.25%, 9/1/19 | 230 | 270 | |||||||||
| SABMiller Holdings, Inc. | |||||||||||
| 3.75%, 1/15/22 (a) | 200 | 204 | |||||||||
| Sanofi | |||||||||||
| 4.00%, 3/29/21 (b) | 150 | 164 | |||||||||
| Sonoco Products Co. | |||||||||||
| 5.75%, 11/1/40 | 150 | 160 | |||||||||
| Stryker Corp. | |||||||||||
| 2.00%, 9/30/16 | 325 | 333 | |||||||||
| Syngenta Finance | |||||||||||
| 4.38%, 3/28/42 | 75 | 76 | |||||||||
| Teck Resources Ltd. | |||||||||||
| 6.25%, 7/15/41 | 90 | 98 | |||||||||
| Telecom Italia Capital SA | |||||||||||
| 7.18%, 6/18/19 (b) | 209 | 224 | |||||||||
| Telefonica Europe BV | |||||||||||
| 8.25%, 9/15/30 | 184 | 201 | |||||||||
| Telstra Corp., Ltd. | |||||||||||
| 4.80%, 10/12/21 (a)(b) | 120 | 131 | |||||||||
| Teva Pharmaceutical Finance IV BV | |||||||||||
| 3.65%, 11/10/21 | 250 | 254 | |||||||||
| Time Warner Cable, Inc., | |||||||||||
| 6.75%, 6/15/39 (b) | 80 | 96 | |||||||||
| 8.75%, 2/14/19 (b) | 100 | 131 | |||||||||
| Time Warner, Inc. | |||||||||||
| 7.70%, 5/1/32 (b) | 340 | 445 | |||||||||
| Face Amount (000) | Value (000) | ||||||||||
| Total Capital International SA | |||||||||||
| 2.88%, 2/17/22 (b) | $ | 300 | $ | 288 | |||||||
| Union Pacific Corp. | |||||||||||
| 6.15%, 5/1/37 | 150 | 180 | |||||||||
| URS Corp. | |||||||||||
| 3.85%, 4/1/17 (a) | 300 | 299 | |||||||||
| Vale Overseas Ltd., | |||||||||||
| 5.63%, 9/15/19 | 116 | 130 | |||||||||
| 6.88%, 11/10/39 (b) | 21 | 25 | |||||||||
| Valero Energy Corp. | |||||||||||
| 6.13%, 2/1/20 (b) | 150 | 173 | |||||||||
| Valspar Corp. | |||||||||||
| 4.20%, 1/15/22 | 290 | 297 | |||||||||
| Verisk Analytics, Inc. | |||||||||||
| 5.80%, 5/1/21 | 185 | 198 | |||||||||
| Verizon Communications, Inc., | |||||||||||
| 4.60%, 4/1/21 (b) | 170 | 189 | |||||||||
| 6.35%, 4/1/19 | 125 | 152 | |||||||||
| 8.95%, 3/1/39 | 150 | 233 | |||||||||
| VF Corp. | |||||||||||
| 3.50%, 9/1/21 | 120 | 123 | |||||||||
| Viacom, Inc. | |||||||||||
| 6.88%, 4/30/36 | 100 | 126 | |||||||||
| Vivendi SA | |||||||||||
| 6.63%, 4/4/18 (a) | 102 | 115 | |||||||||
| Volkswagen International Finance | |||||||||||
| 2.38%, 3/22/17 (a) | 160 | 161 | |||||||||
| Waste Management, Inc. | |||||||||||
| 6.13%, 11/30/39 (b) | 100 | 122 | |||||||||
| Weatherford Bermuda | |||||||||||
| 4.50%, 4/15/22 | 150 | 150 | |||||||||
| Wesfarmers Ltd. | |||||||||||
| 2.98%, 5/18/16 (a) | 100 | 102 | |||||||||
| Woolworths Ltd. | |||||||||||
| 4.00%, 9/22/20 (a) | 140 | 144 | |||||||||
| WPP Finance UK | |||||||||||
| 8.00%, 9/15/14 | 136 | 156 | |||||||||
| Wyndham Worldwide Corp. | |||||||||||
| 4.25%, 3/1/22 (b) | 255 | 250 | |||||||||
| Wynn Las Vegas LLC/Wynn Las Vegas Capital Corp. | |||||||||||
| 5.38%, 3/15/22 (a)(b) | 325 | 318 | |||||||||
| Yum! Brands, Inc. | |||||||||||
| 6.88%, 11/15/37 | 175 | 224 | |||||||||
| 25,877 | |||||||||||
| Utilities (9.9%) | |||||||||||
| Appalachian Power Co. | |||||||||||
| 7.00%, 4/1/38 | 150 | 197 | |||||||||
| Boston Gas Co. | |||||||||||
| 4.49%, 2/15/42 (a) | 125 | 126 | |||||||||
| Consolidated Edison Co. of New York, Inc. | |||||||||||
| 6.65%, 4/1/19 | 100 | 125 | |||||||||
| Duke Energy Carolinas | |||||||||||
| 1.75%, 12/15/16 (b) | 320 | 324 | |||||||||
The accompanying notes are an integral part of the financial statements.
37
2012 Semi-Annual Report
March 31, 2012 (unaudited)
Portfolio of Investments (cont'd)
Corporate Bond Portfolio
| Face Amount (000) | Value (000) | ||||||||||
| Utilities (cont'd) | |||||||||||
| EDF SA | |||||||||||
| 4.60%, 1/27/20 (a)(b) | $ | 90 | $ | 95 | |||||||
| Enel Finance International N.V. | |||||||||||
| 5.13%, 10/7/19 (a)(b) | 200 | 197 | |||||||||
| Energy Transfer Partners LP | |||||||||||
| 9.00%, 4/15/19 | 105 | 130 | |||||||||
| Enterprise Products Operating LLC, | |||||||||||
| 5.25%, 1/31/20 (b) | 25 | 28 | |||||||||
| Series N | |||||||||||
| 6.50%, 1/31/19 | 529 | 629 | |||||||||
| EQT Corp. | |||||||||||
| 4.88%, 11/15/21 | 200 | 203 | |||||||||
| Exelon Generation Co., LLC | |||||||||||
| 6.25%, 10/1/39 | 175 | 205 | |||||||||
| FirstEnergy Solutions Corp., | |||||||||||
| 6.05%, 8/15/21 | 171 | 192 | |||||||||
| 6.80%, 8/15/39 | 125 | 140 | |||||||||
| Iberdrola Finance Ireland Ltd. | |||||||||||
| 5.00%, 9/11/19 (a) | 175 | 178 | |||||||||
| Kinder Morgan Energy Partners LP | |||||||||||
| 5.95%, 2/15/18 | 300 | 351 | |||||||||
| Nevada Power Co. | |||||||||||
| 6.65%, 4/1/36 | 150 | 193 | |||||||||
| Plains All American Pipeline LP/PAA Finance Corp. | |||||||||||
| 6.70%, 5/15/36 | 181 | 212 | |||||||||
| PPL WEM Holdings PLC | |||||||||||
| 3.90%, 5/1/16 (a) | 315 | 328 | |||||||||
| PSEG Power LLC | |||||||||||
| 8.63%, 4/15/31 | 200 | 285 | |||||||||
| Sempra Energy | |||||||||||
| 6.00%, 10/15/39 | 125 | 151 | |||||||||
| Spectra Energy Capital LLC | |||||||||||
| 8.00%, 10/1/19 | 50 | 63 | |||||||||
| UIL Holdings Corp. | |||||||||||
| 4.63%, 10/1/20 | 375 | 380 | |||||||||
| Virginia Electric and Power Co. | |||||||||||
| 2.95%, 1/15/22 | 325 | 322 | |||||||||
| 5,054 | |||||||||||
| 49,648 | |||||||||||
| Sovereign (0.3%) | |||||||||||
| Bermuda Government International Bond | |||||||||||
| 5.60%, 7/20/20 (a) | 125 | 142 | |||||||||
| Total Fixed Income Securities (Cost $48,614) | 50,278 | ||||||||||
| Shares | |||||||||||
| Short-Term Investments (20.0%) | |||||||||||
| Securities held as Collateral on Loaned Securities (18.4%) | |||||||||||
| Investment Company (15.5%) | |||||||||||
| Morgan Stanley Institutional Liquidity Funds — Money Market Portfolio — Institutional Class (See Note G-2) | 7,913,899 | 7,914 | |||||||||
| Face Amount (000) | Value (000) | ||||||||||
| Repurchase Agreements (2.9%) | |||||||||||
| Barclays Capital, Inc., (0.15%, dated 3/30/12, due 4/2/12; proceeds $210; fully collateralized by a U.S. Government Agency; Federal National Mortgage Association 4.00% due 1/1/42; valued at $214) | $ | 210 | $ | 210 | |||||||
| Merrill Lynch & Co., Inc., (0.25%, dated 3/30/12, due 4/2/12; proceeds $1,298; fully collateralized by Common Stocks; Alliance Data Systems Corp.; American International Group, Inc.; Boeing Co. (The); Energy Transfer Equity LP; Freeport-McMoRan Copper & Gold, Inc.; GNC Holdings, Inc.; Hershey Co. (The); L-3 Communications Holdings, Inc.; McKesson Corp.; Teva Pharmaceutical Industries Ltd.; Two Harbors Investment Corp.; Vale SA; valued at $1,402) | 1,298 | 1,298 | |||||||||
| 1,508 | |||||||||||
| Total Securities held as Collateral on Loaned Securities (Cost $9,422) | 9,422 | ||||||||||
| Shares | |||||||||||
| Investment Company (1.4%) | |||||||||||
| Morgan Stanley Institutional Liquidity Funds — Money Market Portfolio — Institutional Class (See Note G-2) (Cost $723) | 723,124 | 723 | |||||||||
| Face Amount (000) | |||||||||||
| U.S. Treasury Security (0.2%) | |||||||||||
| U.S. Treasury Bill | |||||||||||
| 0.14%, 8/30/12 (d)(e) | $ | 95 | 95 | ||||||||
| Total Short-Term Investments (Cost $10,240) | 10,240 | ||||||||||
| Total Investments (118.4%) (Cost $58,854) Including $9,206 of Securities Loaned (f) | 60,518 | ||||||||||
| Liabilities in Excess of Other Assets (-18.4%) | (9,395 | ) | |||||||||
| Net Assets (100.0%) | $ | 51,123 | |||||||||
(a) 144A security — Certain conditions for public sale may exist. Unless otherwise noted, these securities are deemed to be liquid.
(b) All or a portion of this security was on loan at March 31, 2012.
(c) When-issued security.
(d) Rate shown is the yield to maturity at March 31, 2012.
(e) All or a portion of the security was pledged as collateral for swap agreements.
(f) Securities are available for collateral in connection with purchase of when-issued securities, open futures contracts and swap agreements.
IO Interest Only.
MTN Medium Term Note.
STRIPS Separate Trading of Registered Interest and Principal of Securities.
The accompanying notes are an integral part of the financial statements.
38
2012 Semi-Annual Report
March 31, 2012 (unaudited)
Portfolio of Investments (cont'd)
Corporate Bond Portfolio
Futures Contracts:
The Portfolio had the following futures contracts open at period end:
| Number of Contracts | Value (000) | Expiration Date | Unrealized Appreciation (Depreciation) (000) | ||||||||||||||||
| Long: | |||||||||||||||||||
| U.S. Treasury 2 yr. Note | 40 | $ | 8,806 | Jun-12 | $ | (5 | ) | ||||||||||||
| U.S. Treasury 5 yr. Note | 1 | 122 | Jun-12 | 1 | |||||||||||||||
| U.S. Treasury Ultra Long Bond | 9 | 1,359 | Jun-12 | (26 | ) | ||||||||||||||
| Short: | |||||||||||||||||||
| U.S. Treasury 10 yr. Note | 54 | (6,992 | ) | Jun-12 | (20 | ) | |||||||||||||
| U.S. Treasury 30 yr. Bond | 15 | (2,066 | ) | Jun-12 | 51 | ||||||||||||||
| $ | 1 | ||||||||||||||||||
Interest Rate Swap Agreements:
The Portfolio had the following interest rate swap agreements open at period end:
| Swap Counterparty | Floating Rate Index | Pay/Receive Floating Rate | Fixed Rate | Termination Date | Notional Amount (000) | Unrealized Appreciation (Depreciation) (000) | |||||||||||||||||||||
| Goldman Sachs | 3 Month LIBOR | Receive | 2.42 | % | 3/22/22 | $ | 642 | $ | (8 | ) | |||||||||||||||||
| JP Morgan Chase | 3 Month LIBOR | Receive | 2.43 | 3/22/22 | 311 | (5 | ) | ||||||||||||||||||||
| $ | (13 | ) | |||||||||||||||||||||||||
LIBOR London Interbank Offered Rate
Fair Value Measurement Information:
The following is a summary of the inputs used to value the Portfolio's investments as of March 31, 2012. (See Note A-5 to the financial statements for further information regarding fair value measurement.)
| Investment Type | Level 1 Unadjusted quoted prices (000) | Level 2 Other significant observable inputs (000) | Level 3 Significant unobservable inputs (000) | Total (000) | |||||||||||||||
| Assets: | |||||||||||||||||||
| Fixed Income Securities | |||||||||||||||||||
| Asset-Backed Securities | $ | — | $ | 480 | $ | — | $ | 480 | |||||||||||
| Collateralized Mortgage Obligations — Agency Collateral Series | — | 8 | — | 8 | |||||||||||||||
| Corporate Bonds | — | 49,648 | — | 49,648 | |||||||||||||||
| Sovereign | — | 142 | — | 142 | |||||||||||||||
| Total Fixed Income Securities | — | 50,278 | — | 50,278 | |||||||||||||||
| Short-Term Investments | |||||||||||||||||||
| Repurchase Agreements | — | 1,508 | — | 1,508 | |||||||||||||||
| Investment Company | 8,637 | — | — | 8,637 | |||||||||||||||
| U.S. Treasury Security | — | 95 | — | 95 | |||||||||||||||
| Total Short-Term Investments | 8,637 | 1,603 | — | 10,240 | |||||||||||||||
Fair Value Measurement Information: (cont'd)
| Investment Type | Level 1 Unadjusted quoted prices (000) | Level 2 Other significant observable inputs (000) | Level 3 Significant unobservable inputs (000) | Total (000) | |||||||||||||||
| Futures Contracts | $ | 52 | $ | — | $ | — | $ | 52 | |||||||||||
| Total Assets | 8,689 | 51,881 | — | 60,570 | |||||||||||||||
| Liabilities: | |||||||||||||||||||
| Futures Contracts | (51 | ) | — | — | (51 | ) | |||||||||||||
| Interest Rate Swap Agreements | — | (13 | ) | — | (13 | ) | |||||||||||||
| Total Liabilities | (51 | ) | (13 | ) | — | (64 | ) | ||||||||||||
| Total | $ | 8,638 | $ | 51,868 | $ | — | $ | 60,506 | |||||||||||
Transfers between investment levels may occur as the markets fluctuate and/or the availability of data used in an investment's valuation changes. The Portfolio recognizes transfers between the levels as of the end of the period. As of March 31, 2012, the Portfolio did not have any significant investments transfer between investment levels.
The accompanying notes are an integral part of the financial statements.
39
2012 Semi-Annual Report
March 31, 2012 (unaudited)
Portfolio of Investments (cont'd)
Corporate Bond Portfolio
Portfolio Composition*
| Classification | Percentage of Total Investments | ||||||
| Industrials | 50.7 | % | |||||
| Finance | 36.6 | ||||||
| Utilities | 9.9 | ||||||
| Other** | 2.8 | ||||||
| Total Investments | 100.0 | %*** | |||||
* Percentages indicated are based upon total investments (excluding Securities held as Collateral on Loaned Securities) as of March 31, 2012.
** Industries representing less than 5% of total investments.
*** Does not include open long/short futures contracts with an underlying face amount of approximately $19,345,000 and net unrealized appreciation of approximately $1,000 and open swap agreements with total unrealized depreciation of approximately $13,000.
The accompanying notes are an integral part of the financial statements.
40
2012 Semi-Annual Report
March 31, 2012 (unaudited)
Portfolio of Investments
High Yield Portfolio
| Face Amount (000) | Value (000) | ||||||||||
| Fixed Income Securities (97.8%) | |||||||||||
| Corporate Bonds (97.8%) | |||||||||||
| Basic Materials (3.4%) | |||||||||||
| FMG Resources August 2006 Pty Ltd. | |||||||||||
| 6.88%, 4/1/22 (a) | $ | 100 | $ | 98 | |||||||
| Ineos Group Holdings Ltd. | |||||||||||
| 8.50%, 2/15/16 (a) | 150 | 142 | |||||||||
| Kraton Polymers LLC/Kraton Polymers Capital Corp. | |||||||||||
| 6.75%, 3/1/19 | 100 | 104 | |||||||||
| 344 | |||||||||||
| Communications (6.0%) | |||||||||||
| Avaya, Inc. | |||||||||||
| 7.00%, 4/1/19 (a) | 150 | 151 | |||||||||
| Cablevision Systems Corp. | |||||||||||
| 7.75%, 4/15/18 | 100 | 105 | |||||||||
| CommScope, Inc. | |||||||||||
| 8.25%, 1/15/19 (a) | 100 | 107 | |||||||||
| GXS Worldwide, Inc. | |||||||||||
| 9.75%, 6/15/15 | 150 | 147 | |||||||||
| Level 3 Financing, Inc. | |||||||||||
| 8.13%, 7/1/19 (a) | 100 | 104 | |||||||||
| 614 | |||||||||||
| Consumer Discretionary (4.0%) | |||||||||||
| IDQ Holdings, Inc. | |||||||||||
| 11.50%, 4/1/17 (a) | 150 | 154 | |||||||||
| Monitronics International, Inc. | |||||||||||
| 9.13%, 4/1/20 (a) | 150 | 153 | |||||||||
| Silgan Holdings, Inc. | |||||||||||
| 5.00%, 4/1/20 (a) | 100 | 100 | |||||||||
| 407 | |||||||||||
| Consumer, Cyclical (23.8%) | |||||||||||
| Academy Ltd./Academy Finance Corp. | |||||||||||
| 9.25%, 8/1/19 (a) | 150 | 155 | |||||||||
| Ameristar Casinos, Inc. | |||||||||||
| 7.50%, 4/15/21 | 100 | 105 | |||||||||
| Burlington Coat Factory Warehouse Corp. | |||||||||||
| 10.00%, 2/15/19 | 150 | 157 | |||||||||
| Caesars Entertainment Operating Co., Inc. | |||||||||||
| 10.00%, 12/15/18 | 150 | 117 | |||||||||
| Caesars Operating Escrow LLC/Caesars Escrow Corp. | |||||||||||
| 8.50%, 2/15/20 (a) | 50 | 51 | |||||||||
| Chester Downs & Marina LLC | |||||||||||
| 9.25%, 2/1/20 (a) | 100 | 106 | |||||||||
| Chrysler Group LLC/CG Co-Issuer, Inc. | |||||||||||
| 8.00%, 6/15/19 | 200 | 202 | |||||||||
| CKE Restaurants, Inc. | |||||||||||
| 11.38%, 7/15/18 | 100 | 115 | |||||||||
| Face Amount (000) | Value (000) | ||||||||||
| Diamond Resorts Corp. | |||||||||||
| 12.00%, 8/15/18 | $ | 150 | $ | 161 | |||||||
| Gap, Inc. (The) | |||||||||||
| 5.95%, 4/12/21 | 100 | 101 | |||||||||
| INTCOMEX, Inc. | |||||||||||
| 13.25%, 12/15/14 | 150 | 151 | |||||||||
| Lions Gate Entertainment, Inc. | |||||||||||
| 10.25%, 11/1/16 (a) | 150 | 166 | |||||||||
| Logan's Roadhouse, Inc. | |||||||||||
| 10.75%, 10/15/17 | 150 | 147 | |||||||||
| MGM Resorts International | |||||||||||
| 8.63%, 2/1/19 (a) | 100 | 108 | |||||||||
| Realogy Corp. | |||||||||||
| 7.63%, 1/15/20 (a) | 50 | 53 | |||||||||
| Rite Aid Corp. | |||||||||||
| 9.50%, 6/15/17 | 150 | 151 | |||||||||
| Sabre Holdings Corp. | |||||||||||
| 8.35%, 3/15/16 | 150 | 137 | |||||||||
| Snoqualmie Entertainment Authority | |||||||||||
| 9.13%, 2/1/15 (a) | 150 | 151 | |||||||||
| VWR Funding, Inc., Series B | |||||||||||
| 10.25%, 7/15/15 (b) | 100 | 104 | |||||||||
| 2,438 | |||||||||||
| Consumer, Non-Cyclical (20.6%) | |||||||||||
| Amscan Holdings, Inc. | |||||||||||
| 8.75%, 5/1/14 | 52 | 52 | |||||||||
| Apria Healthcare Group, Inc. | |||||||||||
| 11.25%, 11/1/14 | 100 | 105 | |||||||||
| Armored Autogroup, Inc. | |||||||||||
| 9.25%, 11/1/18 (a) | 150 | 126 | |||||||||
| BioScrip, Inc. | |||||||||||
| 10.25%, 10/1/15 | 100 | 109 | |||||||||
| Bumble Bee Holdco SCA, PIK | |||||||||||
| 9.63%, 3/15/18 (a)(c) | 200 | 183 | |||||||||
| Emergency Medical Services Corp. | |||||||||||
| 8.13%, 6/1/19 | 150 | 155 | |||||||||
| HCA, Inc. | |||||||||||
| 5.88%, 3/15/22 | 100 | 100 | |||||||||
| inVentiv Health, Inc. | |||||||||||
| 10.00%, 8/15/18 (a) | 150 | 136 | |||||||||
| Kindred Healthcare, Inc. | |||||||||||
| 8.25%, 6/1/19 | 150 | 131 | |||||||||
| Knowledge Learning Corp. | |||||||||||
| 7.75%, 2/1/15 (a) | 150 | 125 | |||||||||
| NCO Group, Inc. | |||||||||||
| 11.88%, 11/15/14 | 150 | 155 | |||||||||
| Pinnacle Foods Finance LLC/Pinnacle Foods Finance Corp. | |||||||||||
| 8.25%, 9/1/17 | 100 | 109 | |||||||||
| ServiceMaster Co. | |||||||||||
| 8.00%, 2/15/20 (a) | 100 | 107 | |||||||||
The accompanying notes are an integral part of the financial statements.
41
2012 Semi-Annual Report
March 31, 2012 (unaudited)
Portfolio of Investments (cont'd)
High Yield Portfolio
| Face Amount (000) | Value (000) | ||||||||||
| Consumer, Non-Cyclical (cont'd) | |||||||||||
| Spectrum Brands, Inc. | |||||||||||
| 6.75%, 3/15/20 (a) | $ | 100 | $ | 101 | |||||||
| US Foodservice | |||||||||||
| 8.50%, 6/30/19 (a) | 150 | 153 | |||||||||
| Vanguard Health Holding Co. II LLC/Vanguard Holding Co. II, Inc. | |||||||||||
| 8.00%, 2/1/18 | 100 | 103 | |||||||||
| YCC Holdings LLC/Yankee Finance, Inc., PIK | |||||||||||
| 10.25%, 2/15/16 (c) | 150 | 154 | |||||||||
| 2,104 | |||||||||||
| Diversified (1.0%) | |||||||||||
| CCM Merger, Inc. | |||||||||||
| 9.13%, 5/1/19 (a)100 | 101 | ||||||||||
| Energy (7.3%) | |||||||||||
| Chesapeake Energy Corp. | |||||||||||
| 6.78%, 3/15/19 | 100 | 99 | |||||||||
| Concho Resources, Inc. | |||||||||||
| 5.50%, 10/1/22 | 50 | 49 | |||||||||
| Continental Resources, Inc. | |||||||||||
| 5.00%, 9/15/22 (a) | 100 | 101 | |||||||||
| Hercules Offshore, Inc. | |||||||||||
| 7.13%, 4/1/17 (a)(d) | 100 | 100 | |||||||||
| Key Energy Services, Inc. | |||||||||||
| 6.75%, 3/1/21 (a) | 100 | 103 | |||||||||
| Linn Energy LLC/Linn Energy Finance Corp. | |||||||||||
| 6.25%, 11/1/19 (a) | 50 | 49 | |||||||||
| Penn Virginia Corp. | |||||||||||
| 10.38%, 6/15/16 | 150 | 148 | |||||||||
| PetroBakken Energy Ltd. | |||||||||||
| 8.63%, 2/1/20 (a) | 100 | 104 | |||||||||
| 753 | |||||||||||
| Finance (8.7%) | |||||||||||
| E*Trade Financial Corp. | |||||||||||
| 7.88%, 12/1/15 | 150 | 153 | |||||||||
| Icahn Enterprises LP/Icahn Enterprises Finance Corp. | |||||||||||
| 7.75%, 1/15/16 | 100 | 104 | |||||||||
| Kennedy-Wilson, Inc. | |||||||||||
| 8.75%, 4/1/19 | 150 | 157 | |||||||||
| Neuberger Berman Group LLC/Neuberger Berman Finance Corp. | |||||||||||
| 5.88%, 3/15/22 (a) | 100 | 101 | |||||||||
| Nuveen Investments, Inc. | |||||||||||
| 10.50%, 11/15/15 | 125 | 130 | |||||||||
| Regions Financial Corp. | |||||||||||
| 5.75%, 6/15/15 | 100 | 106 | |||||||||
| USI Holdings Corp. | |||||||||||
| 4.38%, 11/15/14 (a)(b) | 150 | 141 | |||||||||
| 892 | |||||||||||
| Face Amount (000) | Value (000) | ||||||||||
| Industrials (11.2%) | |||||||||||
| Atkore International, Inc. | |||||||||||
| 9.88%, 1/1/18 | $ | 100 | $ | 105 | |||||||
| Griffon Corp. | |||||||||||
| 7.13%, 4/1/18 | 100 | 104 | |||||||||
| JB Poindexter & Co., Inc. | |||||||||||
| 9.00%, 4/1/22 (a)(d) | 100 | 103 | |||||||||
| Kratos Defense & Security Solutions, Inc. | |||||||||||
| 10.00%, 6/1/17 | 150 | 163 | |||||||||
| Marquette Transportation Co./Marquette Transportation Finance Corp. | |||||||||||
| 10.88%, 1/15/17 | 150 | 159 | |||||||||
| Pregis Corp. | |||||||||||
| 12.38%, 10/15/13 | 135 | 136 | |||||||||
| Quality Distribution LLC/QD Capital Corp. | |||||||||||
| 9.88%, 11/1/18 | 150 | 165 | |||||||||
| Sequa Corp. | |||||||||||
| 11.75%, 12/1/15 (a) | 150 | 160 | |||||||||
| Terex Corp. | |||||||||||
| 6.50%, 4/1/20 | 50 | 51 | |||||||||
| 1,146 | |||||||||||
| Technology (9.2%) | |||||||||||
| BE Aerospace, Inc. | |||||||||||
| 5.25%, 4/1/22 | 50 | 51 | |||||||||
| CDW LLC/CDW Finance Corp. | |||||||||||
| 8.50%, 4/1/19 | 100 | 107 | |||||||||
| First Data Corp., | |||||||||||
| 10.55%, 9/24/15 | 200 | 204 | |||||||||
| Freescale Semiconductor, Inc. | |||||||||||
| 9.25%, 4/15/18 (a) | 100 | 110 | |||||||||
| Harron Communications LP/Harron Finance Corp. | |||||||||||
| 9.13%, 4/1/20 (a)(d) | 150 | 155 | |||||||||
| iGate Corp. | |||||||||||
| 9.00%, 5/1/16 | 100 | 109 | |||||||||
| Lawson Software, Inc. | |||||||||||
| 9.38%, 4/1/19 (a)(d) | 150 | 156 | |||||||||
| Lawson Software, Inc. | |||||||||||
| 11.50%, 7/15/18 (a) | 45 | 50 | |||||||||
| 942 | |||||||||||
| Utilities (2.6%) | |||||||||||
| AES Corp. (The) | |||||||||||
| 7.38%, 7/1/21 (a) | 100 | 111 | |||||||||
| CMS Energy Corp. | |||||||||||
| 5.05%, 3/15/22 | 100 | 101 | |||||||||
| United Maritime Group LLC/United Maritime Group Finance Corp. | |||||||||||
| 11.75%, 6/15/15 | 50 | 52 | |||||||||
| 264 | |||||||||||
| Total Fixed Income Securities (Cost $9,898) | 10,005 | ||||||||||
The accompanying notes are an integral part of the financial statements.
42
2012 Semi-Annual Report
March 31, 2012 (unaudited)
Portfolio of Investments (cont'd)
High Yield Portfolio
| Shares | Value (000) | ||||||||||
| Short-Term Investment (1.0%) | |||||||||||
| Investment Company (1.0%) | |||||||||||
| Morgan Stanley Institutional Liquidity Funds — Money Market Portfolio — Institutional Class (See Note G-2) (Cost $101) | 100,716 | $ | 101 | ||||||||
| Total Investments (98.8%) (Cost $9,999) | 10,106 | ||||||||||
| Other Assets in Excess of Liabilities (1.2%) | 127 | ||||||||||
| Net Assets (100.0%) | $ | 10,233 | |||||||||
(a) 144A security — Certain conditions for public sale may exist. Unless otherwise noted, these securities are deemed to be liquid.
(b) Variable/Floating Rate Security — Interest rate changes on these instruments are based on changes in a designated base rate. The rates shown are those in effect on March 31, 2012.
(c) Payment-in-kind security.
(d) When-issued security.
PIK Payment-in-Kind. Income may be paid in additional securities or cash at the discretion of the issuer.
Fair Value Measurement Information:
The following is a summary of the inputs used to value the fundcode not found's investments as of March 31, 2012. (See Note A-5 to the financial statements for further information regarding fair value measurement.)
| Investment Type | Level 1 Unadjusted quoted prices (000) | Level 2 Other significant observable inputs (000) | Level 3 Significant unobservable inputs (000) | Total (000) | |||||||||||||||
| Assets: | |||||||||||||||||||
| Fixed Income Securities — Corporate Bonds | $ | — | $ | 10,005 | $ | — | $ | 10,005 | |||||||||||
| Short-Term Investment — Investment Company | 101 | — | — | 101 | |||||||||||||||
| Total Assets | $ | 101 | $ | 10,005 | $ | — | $ | 10,106 | |||||||||||
Transfers between investment levels may occur as the markets fluctuate and/or the availability of data used in an investment's valuation changes. The Portfolio recognizes transfers between the levels as of the end of the period. As of March 31, 2012, the Portfolio did not have any significant investments transfer between investment levels.
Portfolio Composition
| Classification | Percentage of Total Investments | ||||||
| Consumer, Cyclical | 24.1 | % | |||||
| Consumer, Non-Cyclical | 20.8 | ||||||
| Other* | 12.1 | ||||||
| Industrials | 11.3 | ||||||
| Technology | 9.3 | ||||||
| Finance | 8.8 | ||||||
| Energy | 7.5 | ||||||
| Communications | 6.1 | ||||||
| Total Investments | 100.0 | % | |||||
* Industries and/or investment types representing less than 5% of total investments.
The accompanying notes are an integral part of the financial statements.
43
2012 Semi-Annual Report
March 31, 2012 (unaudited)
Portfolio of Investments
Limited Duration Portfolio
| Face Amount (000) | Value (000) | ||||||||||
| Fixed Income Securities (97.9%) | |||||||||||
| Agency Adjustable Rate Mortgages (0.7%) | |||||||||||
| Federal Home Loan Mortgage Corporation, Conventional Pools: | |||||||||||
| 5.45%, 1/1/38 | $ | 281 | $ | 300 | |||||||
| Federal National Mortgage Association, Conventional Pools: | |||||||||||
| 2.39%, 5/1/35 | 820 | 868 | |||||||||
| 1,168 | |||||||||||
| Agency Fixed Rate Mortgages (0.8%) | |||||||||||
| Federal Home Loan Mortgage Corporation, Gold Pools: | |||||||||||
| 6.50%, 9/1/19 - 11/1/29 | 17 | 21 | |||||||||
| 7.50%, 11/1/19 | 2 | 2 | |||||||||
| 12.00%, 6/1/15 | 3 | 3 | |||||||||
| Federal National Mortgage Association, Conventional Pools: | |||||||||||
| 6.50%, 2/1/28 - 10/1/32 | 1,011 | 1,153 | |||||||||
| 7.00%, 7/1/29 - 12/1/33 | 65 | 75 | |||||||||
| Government National Mortgage Association, Various Pools: | |||||||||||
| 9.00%, 11/15/16 - 12/15/16 | 42 | 47 | |||||||||
| �� | 1,301 | ||||||||||
| Asset-Backed Securities (22.0%) | |||||||||||
| Ally Master Owner Trust, | |||||||||||
| 1.99%, 1/15/15 (a)(b) | 275 | 278 | |||||||||
| 2.15%, 1/15/16 | 700 | 715 | |||||||||
| 2.88%, 4/15/15 (a) | 650 | 662 | |||||||||
| American Express Credit Account Master Trust | |||||||||||
| 1.49%, 3/15/17 (b) | 2,325 | 2,391 | |||||||||
| ARI Fleet Lease Trust | |||||||||||
| 1.69%, 8/15/18 (a)(b) | 168 | 169 | |||||||||
| Bank of America Auto Trust | |||||||||||
| 2.13%, 9/15/13 (a) | 100 | 100 | |||||||||
| BMW Floorplan Master Owner Trust | |||||||||||
| 1.39%, 9/15/14 (a)(b) | 2,600 | 2,613 | |||||||||
| Capital One Multi-Asset Execution Trust | |||||||||||
| 0.32%, 9/15/15 (b) | 1,355 | 1,355 | |||||||||
| Chase Issuance Trust | |||||||||||
| 1.79%, 4/15/14 (b) | 1,600 | 1,601 | |||||||||
| Chesapeake Funding LLC | |||||||||||
| 2.24%, 12/15/20 (a)(b) | 260 | 261 | |||||||||
| Citibank Credit Card Issuance Trust (See Note G-2) | |||||||||||
| 2.25%, 12/23/14 | 1,950 | 1,975 | |||||||||
| CNH Equipment Trust, | |||||||||||
| 1.17%, 5/15/15 | 1,368 | 1,370 | |||||||||
| 1.54%, 7/15/14 | 287 | 288 | |||||||||
| Discover Card Master Trust | |||||||||||
| 1.54%, 12/15/14 (b) | 3,000 | 3,008 | |||||||||
| Ford Credit Floorplan Master Owner Trust, | |||||||||||
| 1.79%, 9/15/14 (b) | 2,600 | 2,618 | |||||||||
| 4.20%, 2/15/17 (a) | 1,150 | 1,246 | |||||||||
| Face Amount (000) | Value (000) | ||||||||||
| GE Capital Credit Card Master Note Trust | |||||||||||
| 2.34%, 4/15/15 (b) | $ | 3,850 | $ | 3,847 | |||||||
| GE Equipment Midticket LLC | |||||||||||
| 0.94%, 7/14/14 (a) | 928 | 928 | |||||||||
| Harley-Davidson Motorcycle Trust, | |||||||||||
| 1.16%, 2/15/15 | 1,825 | 1,831 | |||||||||
| 1.74%, 9/15/13 | 193 | 193 | |||||||||
| 1.87%, 2/15/14 | 263 | 264 | |||||||||
| Macquarie Equipment Funding Trust | |||||||||||
| 1.21%, 9/20/13 (a) | 1,295 | 1,296 | |||||||||
| MMAF Equipment Finance LLC | |||||||||||
| 2.37%, 11/15/13 (a) | 549 | 551 | |||||||||
| MMCA Automobile Trust | |||||||||||
| 1.39%, 1/15/14 (a) | 736 | 737 | |||||||||
| Nissan Auto Lease Trust | |||||||||||
| 1.12%, 12/15/13 | 1,625 | 1,631 | |||||||||
| Nissan Master Owner Trust Receivables | |||||||||||
| 1.39%, 1/15/15 (a)(b) | 625 | 630 | |||||||||
| North Carolina State Education Assistance Authority, | |||||||||||
| 1.01%, 1/25/21 (b) | 732 | 730 | |||||||||
| 1.36%, 7/25/25 (b) | 625 | 614 | |||||||||
| Panhandle-Plains Higher Education Authority, Inc. | |||||||||||
| 1.42%, 7/1/24 (b) | 275 | 270 | |||||||||
| Wheels SPV LLC | |||||||||||
| 1.79%, 3/15/18 (a)(b) | 204 | 204 | |||||||||
| 34,376 | |||||||||||
| Collateralized Mortgage Obligation — Agency Collateral Series (1.4%) | |||||||||||
| Federal Home Loan Mortgage Corporation, REMIC | |||||||||||
| 7.50%, 9/15/29 | 1,811 | 2,153 | |||||||||
| Commercial Mortgage Backed Security (0.5%) | |||||||||||
| Wachovia Bank Commercial Mortgage Trust | |||||||||||
| 5.32%, 7/15/41 (b) | 665 | 715 | |||||||||
| Corporate Bonds (58.3%) | |||||||||||
| Finance (25.6%) | |||||||||||
| ABB Treasury Center USA, Inc. | |||||||||||
| 2.50%, 6/15/16 (a) | 745 | 760 | |||||||||
| Abbey National Treasury Services PLC | |||||||||||
| 2.88%, 4/25/14 | 615 | 613 | |||||||||
| ABN Amro Bank | |||||||||||
| 4.25%, 2/2/17 (a) | 400 | 407 | |||||||||
| Aflac, Inc. | |||||||||||
| 3.45%, 8/15/15 | 325 | 342 | |||||||||
| American Express Co. | |||||||||||
| 7.25%, 5/20/14 | 1,680 | 1,892 | |||||||||
| American International Group, Inc. | |||||||||||
| 3.65%, 1/15/14 | 745 | 759 | |||||||||
| Bank of America Corp., Series 1 | |||||||||||
| 3.75%, 7/12/16 | 1,295 | 1,303 | |||||||||
| Barclays Bank PLC | |||||||||||
| 2.50%, 1/23/13 | 1,030 | 1,039 | |||||||||
The accompanying notes are an integral part of the financial statements.
44
2012 Semi-Annual Report
March 31, 2012 (unaudited)
Portfolio of Investments (cont'd)
Limited Duration Portfolio
| Face Amount (000) | Value (000) | ||||||||||
| Finance (cont'd) | |||||||||||
| BBVA Bancomer SA | |||||||||||
| 4.50%, 3/10/16 (a) | $ | 955 | $ | 988 | |||||||
| BNP Paribas SA | |||||||||||
| 3.60%, 2/23/16 | 920 | 930 | |||||||||
| BP Capital Markets PLC | |||||||||||
| 3.88%, 3/10/15 | 595 | 639 | |||||||||
| Canadian Imperial Bank of Commerce | |||||||||||
| 1.45%, 9/13/13 | 1,130 | 1,142 | |||||||||
| Capital One Financial Corp. | |||||||||||
| 7.38%, 5/23/14 | 875 | 969 | |||||||||
| Citigroup, Inc. (See Note G-2) | |||||||||||
| 4.45%, 1/10/17 | 1,125 | 1,180 | |||||||||
| CNH Capital LLC | |||||||||||
| 6.25%, 11/1/16 (a) | 130 | 140 | |||||||||
| Commonwealth Bank of Australia | |||||||||||
| 1.95%, 3/16/15 | 735 | 740 | |||||||||
| Cooperatieve Centrale Raiffeisen-Boerenleenbank BA/Utrect | |||||||||||
| 3.38%, 1/19/17 | 330 | 338 | |||||||||
| Credit Suisse | |||||||||||
| 5.50%, 5/1/14 | 840 | 901 | |||||||||
| Deutsche Bank AG | |||||||||||
| 2.38%, 1/11/13 | 1,105 | 1,114 | |||||||||
| DNB Bank ASA | |||||||||||
| 3.20%, 4/3/17 (a)(c) | 610 | 613 | |||||||||
| General Electric Capital Corp. | |||||||||||
| 2.95%, 5/9/16 | 2,790 | 2,913 | |||||||||
| Genworth Life Institutional Funding Trust | |||||||||||
| 5.88%, 5/3/13 (a) | 865 | 898 | |||||||||
| Goldman Sachs Group, Inc. (The) | |||||||||||
| 3.63%, 2/7/16 | 1,250 | 1,251 | |||||||||
| HCP, Inc. | |||||||||||
| 2.70%, 2/1/14 | 575 | 583 | |||||||||
| HSBC USA, Inc. | |||||||||||
| 2.38%, 2/13/15 | 775 | 781 | |||||||||
| Icahn Enterprises LP/Icahn Enterprises Finance Corp. | |||||||||||
| 7.75%, 1/15/16 | 375 | 390 | |||||||||
| ING Bank | |||||||||||
| 3.75%, 3/7/17 (a) | 600 | 595 | |||||||||
| Intesa Sanpaolo SpA | |||||||||||
| 3.63%, 8/12/15 (a) | 550 | 526 | |||||||||
| JPMorgan Chase & Co., | |||||||||||
| 1.88%, 3/20/15 | 475 | 477 | |||||||||
| 3.15%, 7/5/16 | 1,025 | 1,058 | |||||||||
| Macquarie Group Ltd. | |||||||||||
| 7.30%, 8/1/14 (a) | 720 | 772 | |||||||||
| Metropolitan Life Global Funding I | |||||||||||
| 2.00%, 1/10/14 (a) | 950 | 965 | |||||||||
| Monumental Global Funding III | |||||||||||
| 5.25%, 1/15/14 (a) | 1,115 | 1,183 | |||||||||
| Face Amount (000) | Value (000) | ||||||||||
| National Australia Bank Ltd. | |||||||||||
| 3.00%, 7/27/16 (a) | $ | 900 | $ | 917 | |||||||
| Nationwide Building Society | |||||||||||
| 4.65%, 2/25/15 (a) | 840 | 864 | |||||||||
| Nissan Motor Acceptance Corp. | |||||||||||
| 3.25%, 1/30/13 (a) | 90 | 91 | |||||||||
| Nordea Bank AB | |||||||||||
| 2.25%, 3/20/15 (a) | 635 | 636 | |||||||||
| Northern Trust Corp. | |||||||||||
| 5.50%, 8/15/13 | 1,060 | 1,128 | |||||||||
| Principal Financial Group, Inc. | |||||||||||
| 7.88%, 5/15/14 | 816 | 901 | |||||||||
| Prudential Financial, Inc., MTN | |||||||||||
| 4.75%, 9/17/15 | 930 | 1,010 | |||||||||
| Standard Chartered PLC | |||||||||||
| 3.85%, 4/27/15 (a) | 940 | 977 | |||||||||
| Svenska Handelsbanken AB | |||||||||||
| 2.88%, 4/4/17 (c) | 645 | 646 | |||||||||
| UBS AG | |||||||||||
| 3.88%, 1/15/15 | 1,140 | 1,187 | |||||||||
| US Bancorp | |||||||||||
| 2.20%, 11/15/16 | 940 | 959 | |||||||||
| Wells Fargo & Co. | |||||||||||
| 3.68%, 6/15/16 | 1,350 | 1,443 | |||||||||
| 39,960 | |||||||||||
| Industrials (27.2%) | |||||||||||
| Agilent Technologies, Inc. | |||||||||||
| 4.45%, 9/14/12 | 1,325 | 1,345 | |||||||||
| Altria Group, Inc. | |||||||||||
| 4.13%, 9/11/15 | 750 | 819 | |||||||||
| Anglo American Capital PLC | |||||||||||
| 9.38%, 4/8/14 (a) | 1,100 | 1,267 | |||||||||
| Anheuser-Busch InBev Worldwide, Inc., | |||||||||||
| 4.13%, 1/15/15 | 350 | 379 | |||||||||
| 5.38%, 11/15/14 | 785 | 872 | |||||||||
| Applied Materials, Inc. | |||||||||||
| 2.65%, 6/15/16 | 455 | 472 | |||||||||
| Apria Healthcare Group, Inc. | |||||||||||
| 11.25%, 11/1/14 | 375 | 394 | |||||||||
| ArcelorMittal | |||||||||||
| 9.00%, 2/15/15 | 610 | 702 | |||||||||
| Aristotle Holding, Inc., | |||||||||||
| 2.65%, 2/15/17 (a) | 35 | 35 | |||||||||
| 2.75%, 11/21/14 (a) | 580 | 596 | |||||||||
| AT&T, Inc. | |||||||||||
| 4.95%, 1/15/13 | 2,510 | 2,596 | |||||||||
| Bacardi Ltd. | |||||||||||
| 7.45%, 4/1/14 (a) | 835 | 933 | |||||||||
| Barrick Gold Corp. | |||||||||||
| 1.75%, 5/30/14 | 660 | 668 | |||||||||
| Best Buy Co., Inc. | |||||||||||
| 3.75%, 3/15/16 | 875 | 883 | |||||||||
The accompanying notes are an integral part of the financial statements.
45
2012 Semi-Annual Report
March 31, 2012 (unaudited)
Portfolio of Investments (cont'd)
Limited Duration Portfolio
| Face Amount (000) | Value (000) | ||||||||||
| Industrials (cont'd) | |||||||||||
| Bunge Ltd. Finance Corp. | |||||||||||
| 5.35%, 4/15/14 | $ | 830 | $ | 881 | |||||||
| Coca-Cola Co. (The) | |||||||||||
| 0.75%, 3/13/15 | 1,195 | 1,193 | |||||||||
| Comcast Corp. | |||||||||||
| 6.50%, 1/15/15 | 870 | 993 | |||||||||
| COX Communications, Inc. | |||||||||||
| 4.63%, 6/1/13 | 690 | 721 | |||||||||
| Daimler Finance North America LLC | |||||||||||
| 1.88%, 9/15/14 (a) | 785 | 797 | |||||||||
| Danaher Corp. | |||||||||||
| 1.30%, 6/23/14 | 255 | 259 | |||||||||
| Delhaize Group SA | |||||||||||
| 5.88%, 2/1/14 | 1,025 | 1,103 | |||||||||
| DirecTV Holdings LLC /DirecTV Financing Co., Inc. | |||||||||||
| 4.75%, 10/1/14 | 695 | 756 | |||||||||
| Ecolab, Inc. | |||||||||||
| 3.00%, 12/8/16 | 320 | 333 | |||||||||
| Ford Motor Credit Co. LLC | |||||||||||
| 5.63%, 9/15/15 | 375 | 400 | |||||||||
| Gilead Sciences, Inc. | |||||||||||
| 3.05%, 12/1/16 | 1,000 | 1,048 | |||||||||
| Harley-Davidson Funding Corp. | |||||||||||
| 5.25%, 12/15/12 (a) | 820 | 842 | |||||||||
| Hewlett-Packard Co. | |||||||||||
| 3.30%, 12/9/16 | 815 | 849 | |||||||||
| Home Depot, Inc. | |||||||||||
| 5.40%, 3/1/16 | 630 | 728 | |||||||||
| Kinross Gold Corp. | |||||||||||
| 3.63%, 9/1/16 (a) | 740 | 745 | |||||||||
| Kraft Foods, Inc. | |||||||||||
| 6.75%, 2/19/14 | 875 | 967 | |||||||||
| Kroger Co. (The) | |||||||||||
| 7.50%, 1/15/14 | 725 | 809 | |||||||||
| Marathon Petroleum Corp. | |||||||||||
| 3.50%, 3/1/16 | 1,070 | 1,116 | |||||||||
| Marriott International, Inc. | |||||||||||
| 4.63%, 6/15/12 | 1,300 | 1,308 | |||||||||
| McKesson Corp. | |||||||||||
| 3.25%, 3/1/16 | 1,070 | 1,147 | |||||||||
| NBC Universal Media LLC | |||||||||||
| 2.10%, 4/1/14 | 835 | 853 | |||||||||
| News America, Inc. | |||||||||||
| 5.30%, 12/15/14 | 455 | 504 | |||||||||
| PepsiCo, Inc. | |||||||||||
| 0.75%, 3/5/15 | 525 | 523 | |||||||||
| Phillips 66 | |||||||||||
| 1.95%, 3/5/15 (a) | 200 | 202 | |||||||||
| Potash Corp. of Saskatchewan, Inc. | |||||||||||
| 5.25%, 5/15/14 | 1,105 | 1,205 | |||||||||
| Quest Diagnostics, Inc. | |||||||||||
| 3.20%, 4/1/16 | 925 | 970 | |||||||||
| Face Amount (000) | Value (000) | ||||||||||
| Stryker Corp. | |||||||||||
| 2.00%, 9/30/16 | $ | 715 | $ | 734 | |||||||
| Tesoro Corp. | |||||||||||
| 6.63%, 11/1/15 | 350 | 360 | |||||||||
| Texas Instruments, Inc. | |||||||||||
| 1.38%, 5/15/14 | 955 | 970 | |||||||||
| Time Warner Cable, Inc. | |||||||||||
| 8.25%, 2/14/14 | 700 | 793 | |||||||||
| Tyco Electronics Group SA | |||||||||||
| 1.60%, 2/3/15 | 170 | 170 | |||||||||
| United Air Lines, Inc. | |||||||||||
| 9.88%, 8/1/13 (a) | 400 | 422 | |||||||||
| Verizon Communications, Inc. | |||||||||||
| 1.25%, 11/3/14 | 715 | 723 | |||||||||
| Viacom, Inc. | |||||||||||
| 4.38%, 9/15/14 | 1,100 | 1,187 | |||||||||
| Vodafone Group PLC | |||||||||||
| 5.00%, 12/16/13 | 1,060 | 1,134 | |||||||||
| Volkswagen International Finance | |||||||||||
| 1.63%, 3/22/15 (a) | 1,195 | 1,196 | |||||||||
| Waste Management, Inc. | |||||||||||
| 2.60%, 9/1/16 | 725 | 744 | |||||||||
| Wesfarmers Ltd. | |||||||||||
| 2.98%, 5/18/16 (a) | 395 | 404 | |||||||||
| WMG Acquisition Corp. | |||||||||||
| 9.50%, 6/15/16 | 350 | 383 | |||||||||
| 42,433 | |||||||||||
| Utilities (5.5%) | |||||||||||
| AES Corp. (The) | |||||||||||
| 7.75%, 10/15/15 | 350 | 392 | |||||||||
| Commonwealth Edison Co. | |||||||||||
| 1.63%, 1/15/14 | 805 | 818 | |||||||||
| EDF SA | |||||||||||
| 5.50%, 1/26/14 (a) | 1,105 | 1,186 | |||||||||
| Enel Finance International N.V. | |||||||||||
| 3.88%, 10/7/14 (a) | 1,115 | 1,126 | |||||||||
| FirstEnergy Solutions Corp. | |||||||||||
| 4.80%, 2/15/15 | 755 | 817 | |||||||||
| NextEra Energy Capital Holdings, Inc. | |||||||||||
| 5.35%, 6/15/13 | 825 | 868 | |||||||||
| Plains All American Pipeline L.P./PAA Finance Corp. | |||||||||||
| 4.25%, 9/1/12 | 1,140 | 1,154 | |||||||||
| Sempra Energy | |||||||||||
| 2.00%, 3/15/14 | 915 | 934 | |||||||||
| Spectra Energy Capital LLC | |||||||||||
| 5.90%, 9/15/13 | 965 | 1,025 | |||||||||
| TransCanada PipeLines Ltd. | |||||||||||
| 0.88%, 3/2/15 | 300 | 300 | |||||||||
| 8,620 | |||||||||||
| 91,013 | |||||||||||
| Mortgage — Other (0.3%) | |||||||||||
| FDIC Structured Sale Guaranteed Notes | |||||||||||
| 0.55%, 2/25/48 (a)(b) | 531 | 532 | |||||||||
The accompanying notes are an integral part of the financial statements.
46
2012 Semi-Annual Report
March 31, 2012 (unaudited)
Portfolio of Investments (cont'd)
Limited Duration Portfolio
| Face Amount (000) | Value (000) | ||||||||||
| Non-U.S. Government — Guaranteed (8.7%) | |||||||||||
| Commonwealth Bank of Australia | |||||||||||
| 2.50%, 12/10/12 (a) | $ | 2,300 | $ | 2,328 | |||||||
| Royal Bank of Scotland PLC (The) | |||||||||||
| 2.63%, 5/11/12 (a) | 2,230 | 2,230 | |||||||||
| Swedbank AB | |||||||||||
| 2.90%, 1/14/13 (a) | 5,900 | 6,001 | |||||||||
| Westpac Securities NZ Ltd. | |||||||||||
| 2.50%, 5/25/12 (a) | 3,020 | 3,018 | |||||||||
| 13,577 | |||||||||||
| U.S. Treasury Securities (5.2%) | |||||||||||
| U.S. Treasury Notes, | |||||||||||
| 0.50%, 11/15/13 | 4,050 | 4,063 | |||||||||
| 1.25%, 8/31/15 | 3,100 | 3,166 | |||||||||
| 2.38%, 6/30/18 | 875 | 926 | |||||||||
| 8,155 | |||||||||||
| Total Fixed Income Securities (Cost $150,116) | 152,990 | ||||||||||
| Shares | |||||||||||
| Short-Term Investments (2.9%) | |||||||||||
| Investment Company (2.6%) | |||||||||||
| Morgan Stanley Institutional Liquidity Funds — Money Market Portfolio — Institutional Class (See Note G-2) (Cost $4,014) | 4,014,149 | 4,014 | |||||||||
| Face Amount (000) | Value (000) | ||||||||||
| U.S. Treasury Security (0.3%) | |||||||||||
| U.S. Treasury Bill | |||||||||||
| 0.14%, 8/30/12 (e)(f)(g) | $ | 510 | $ | 510 | |||||||
| Total Short-Term Investments (Cost $4,524) | 4,524 | ||||||||||
| Total Investments (100.8%) (Cost $154,640) (h) | 157,514 | ||||||||||
| Liabilities in Excess of Other Assets (-0.8%) | (1,266 | ) | |||||||||
| Net Assets (100.0%) | $ | 156,248 | |||||||||
(a) 144A security — Certain conditions for public sale may exist. Unless otherwise noted, these securities are deemed to be liquid.
(b) Variable/Floating Rate Security — Interest rate changes on these instruments are based on changes in a designated base rate. The rates shown are those in effect on March 31, 2012.
(c) When-issued security.
(d) Non-income producing security.
(e) Rate shown is the yield to maturity at March 31, 2012.
(f) All or a portion of the security was pledged to cover margin requirements for futures contracts.
(g) All or a portion of the security was pledged as collateral for swap agreements.
(h) Securities are available for collateral in connection with purchase of when-issued securities, open futures contracts and swap agreements.
FDIC Federal Deposit Insurance Corporation.
MTN Medium Term Note.
REMIC Real Estate Mortgage Investment Conduit.
Futures Contracts:
The Portfolio had the following futures contracts open at period end:
| Number of Contracts | Value (000) | Expiration Date | Unrealized Appreciation (Depreciation) (000) | ||||||||||||||||
| Long: | |||||||||||||||||||
| U.S. Treasury 2 yr. Note | 186 | $ | 40,946 | Jun-12 | $ | (28 | ) | ||||||||||||
| U.S. Treasury 10 yr. Note | 10 | 1,295 | Jun-12 | (19 | ) | ||||||||||||||
| Short: | |||||||||||||||||||
| U.S. Treasury 5 yr. Note | 125 | (15,317 | ) | Jun-12 | 70 | ||||||||||||||
| $ | 23 | ||||||||||||||||||
Zero Coupon Swap Agreements:
The Portfolio had the following zero coupon swap agreements open at period end:
| Swap Counterparty | Notional Amount (000) | Floating Rate Index | Pay/Receive Floating Rate | Termination Date | Premium Paid (Received) (000) | Unrealized Appreciation (Depreciation) (000) | |||||||||||||||||||||
| Deutsche Bank | $ | 4,696 | 3 Month LIBOR | Pay | 11/15/21 | $ | 170 | $ | 729 | ||||||||||||||||||
| Deutsche Bank | 4,009 | 3 Month LIBOR | Receive | 11/15/21 | (280 | ) | (1,266 | ) | |||||||||||||||||||
| $ | (537 | ) | |||||||||||||||||||||||||
LIBOR London Interbank Offered Rate.
The accompanying notes are an integral part of the financial statements.
47
2012 Semi-Annual Report
March 31, 2012 (unaudited)
Portfolio of Investments (cont'd)
Limited Duration Portfolio
Fair Value Measurement Information:
The following is a summary of the inputs used to value the Portfolio's investments as of March 31, 2012. (See Note A-5 to the financial statements for further information regarding fair value measurement.)
| Investment Type | Level 1 Unadjusted quoted prices (000) | Level 2 Other significant observable inputs (000) | Level 3 Significant unobservable inputs (000) | Total (000) | |||||||||||||||
| Assets: | |||||||||||||||||||
| Fixed Income Securities | |||||||||||||||||||
| Agency Adjustable Rate Mortgages | $ | — | $ | 1,168 | $ | — | $ | 1,168 | |||||||||||
| Agency Fixed Rate Mortgages | — | 1,301 | — | 1,301 | |||||||||||||||
| Asset-Backed Securities | — | 34,376 | — | 34,376 | |||||||||||||||
| Collateralized Mortgage Obligations — Agency Collateral Series | — | 2,153 | — | 2,153 | |||||||||||||||
| Commercial Mortgage Backed Security | — | 715 | — | 715 | |||||||||||||||
| Corporate Bonds | — | 91,013 | — | 91,013 | |||||||||||||||
| Mortgages — Other | — | 532 | — | 532 | |||||||||||||||
| Non-U.S. Government — Guaranteed | — | 13,577 | — | 13,577 | |||||||||||||||
| U.S. Treasury Securities | — | 8,155 | — | 8,155 | |||||||||||||||
| Total Fixed Income Securities | — | 152,990 | — | 152,990 | |||||||||||||||
| Short-Term Investments | |||||||||||||||||||
| Investment Company | 4,014 | — | — | 4,014 | |||||||||||||||
| U.S. Treasury Security | — | 510 | — | 510 | |||||||||||||||
| Total Short-Term Investments | 4,014 | 510 | — | 4,524 | |||||||||||||||
| Futures Contracts | 70 | — | — | 70 | |||||||||||||||
| Zero Coupon Swap Agreements | — | 729 | — | 729 | |||||||||||||||
| Total Assets | 4,084 | 154,229 | — | 158,313 | |||||||||||||||
| Liabilities: | |||||||||||||||||||
| Futures Contracts | (47 | ) | — | — | (47 | ) | |||||||||||||
| Zero Coupon Swap Agreements | — | (1,266 | ) | — | (1,266 | ) | |||||||||||||
| Total Liabilities | (47 | ) | (1,266 | ) | — | (1,313 | ) | ||||||||||||
| Total | $ | 4,037 | $ | 152,963 | $ | — | $ | 157,000 | |||||||||||
Transfers between investment levels may occur as the markets fluctuate and/or the availability of data used in an investment's valuation changes. The Portfolio recognizes transfers between the levels as of the end of the period. As of March 31, 2012, the Portfolio did not have any significant investments transfer between investment levels.
Portfolio Composition
| Classification | Percentage of Total Investments | ||||||
| Industrials | 26.9 | % | |||||
| Finance | 25.4 | ||||||
| Asset-Backed Securities | 21.8 | ||||||
| Non-U.S. Government — Guaranteed | 8.6 | ||||||
| Other* | 6.3 | ||||||
| Utilities | 5.5 | ||||||
| U.S. Treasury Securities | 5.5 | ||||||
| Total Investments | 100.0 | %** | |||||
* Industries and/or investment types representing less than 5% of total investments.
** Does not include open long/short futures contracts with an underlying face amount of approximately $57,558,000 and net unrealized appreciation of approximately $23,000 and open swap agreements with net unrealized depreciation of approximately $537,000.
The accompanying notes are an integral part of the financial statements.
48
2012 Semi-Annual Report
March 31, 2012 (unaudited)
Portfolio of Investments
Long Duration Fixed Income Portfolio
| Face Amount (000) | Value (000) | ||||||||||
| Fixed Income Securities (95.6%) | |||||||||||
| Asset-Backed Securities (0.6%) | |||||||||||
| CVS Pass-Through Trust, | |||||||||||
| 6.04%, 12/10/28 | $ | 95 | $ | 105 | |||||||
| 8.35%, 7/10/31 (a) | 29 | 36 | |||||||||
| 141 | |||||||||||
| Corporate Bonds (47.0%) | |||||||||||
| Finance (11.4%) | |||||||||||
| ACE INA Holdings, Inc. | |||||||||||
| 6.70%, 5/15/36 | 40 | 52 | |||||||||
| Aetna, Inc. | |||||||||||
| 6.63%, 6/15/36 | 40 | 50 | |||||||||
| Aflac, Inc. | |||||||||||
| 6.90%, 12/17/39 | 75 | 88 | |||||||||
| AIG SunAmerica Global Financing X | |||||||||||
| 6.90%, 3/15/32 (a) | 17 | 19 | |||||||||
| Allstate Corp. (The), | |||||||||||
| 5.95%, 4/1/36 | 65 | 74 | |||||||||
| 6.13%, 12/15/32 | 30 | 35 | |||||||||
| American Express Co. | |||||||||||
| 8.13%, 5/20/19 | 45 | 59 | |||||||||
| Bear Stearns Cos. LLC (The) | |||||||||||
| 7.25%, 2/1/18 | 45 | 54 | |||||||||
| Chubb Corp. (The) | |||||||||||
| 6.50%, 5/15/38 | 30 | 39 | |||||||||
| Cigna Corp. | |||||||||||
| 5.38%, 2/15/42 | 35 | 36 | |||||||||
| Citigroup, Inc.(See Note G-2), | |||||||||||
| 5.85%, 12/11/34 | 225 | 231 | |||||||||
| 6.88%, 3/5/38 | 30 | 35 | |||||||||
| Credit Suisse USA, Inc. | |||||||||||
| 7.13%, 7/15/32 | 50 | 60 | |||||||||
| Farmers Exchange Capital | |||||||||||
| 7.05%, 7/15/28 (a) | 100 | 109 | |||||||||
| General Electric Capital Corp., | |||||||||||
| 5.88%, 1/14/38 | 155 | 171 | |||||||||
| MTN | |||||||||||
| 6.15%, 8/7/37 | 5 | 6 | |||||||||
| 6.75%, 3/15/32 | 140 | 168 | |||||||||
| Goldman Sachs Group, Inc. (The) | |||||||||||
| 6.75%, 10/1/37 | 290 | 284 | |||||||||
| Hartford Financial Services Group, Inc. | |||||||||||
| 6.63%, 3/30/40 | 75 | 78 | |||||||||
| HSBC Holdings PLC | |||||||||||
| 6.50%, 5/2/36 | 235 | 262 | |||||||||
| JPMorgan Chase & Co. | |||||||||||
| 6.40%, 5/15/38 | 55 | 66 | |||||||||
| JPMorgan Chase Capital XXVII | |||||||||||
| 7.00%, 11/1/39 | 55 | 56 | |||||||||
| Lincoln National Corp. | |||||||||||
| 6.30%, 10/9/37 | 20 | 22 | |||||||||
| Face Amount (000) | Value (000) | ||||||||||
| Merrill Lynch & Co., Inc. | |||||||||||
| 7.75%, 5/14/38 | $ | 175 | $ | 192 | |||||||
| MetLife, Inc. | |||||||||||
| 5.70%, 6/15/35 | 95 | 111 | |||||||||
| Principal Financial Group, Inc. | |||||||||||
| 6.05%, 10/15/36 | 70 | 76 | |||||||||
| Protective Life Corp. | |||||||||||
| 8.45%, 10/15/39 | 50 | 58 | |||||||||
| Prudential Financial, Inc., | |||||||||||
| MTN | |||||||||||
| 6.63%, 12/1/37 | 55 | 64 | |||||||||
| UnitedHealth Group, Inc., | |||||||||||
| 5.80%, 3/15/36 | 80 | 92 | |||||||||
| 6.88%, 2/15/38 | 50 | 66 | |||||||||
| WellPoint, Inc. | |||||||||||
| 6.38%, 6/15/37 | 30 | 37 | |||||||||
| 2,750 | |||||||||||
| Industrials (26.8%) | |||||||||||
| Agrium, Inc. | |||||||||||
| 7.13%, 5/23/36 | 55 | 69 | |||||||||
| Alcoa, Inc. | |||||||||||
| 5.95%, 2/1/37 | 20 | 20 | |||||||||
| Altria Group, Inc., | |||||||||||
| 9.95%, 11/10/38 | 45 | 69 | |||||||||
| 10.20%, 2/6/39 | 80 | 124 | |||||||||
| Amgen, Inc. | |||||||||||
| 5.15%, 11/15/41 | 35 | 35 | |||||||||
| Anadarko Petroleum Corp. | |||||||||||
| 6.20%, 3/15/40 | 100 | 114 | |||||||||
| ArcelorMittal | |||||||||||
| 7.00%, 10/15/39 | 30 | 29 | |||||||||
| AT&T, Inc., | |||||||||||
| 5.35%, 9/1/40 | 325 | 347 | |||||||||
| 5.55%, 8/15/41 | 60 | 67 | |||||||||
| 6.30%, 1/15/38 | 30 | 35 | |||||||||
| BSKYB Finance UK PLC | |||||||||||
| 6.50%, 10/15/35 (a) | 50 | 56 | |||||||||
| Bunge Ltd. Finance Corp. | |||||||||||
| 8.50%, 6/15/19 | 40 | 49 | |||||||||
| Burlington Northern Santa Fe LLC | |||||||||||
| 6.15%, 5/1/37 | 55 | 66 | |||||||||
| Canadian Natural Resources Ltd. | |||||||||||
| 6.25%, 3/15/38 | 75 | 92 | |||||||||
| Canadian Oil Sands Ltd. | |||||||||||
| 6.00%, 4/1/42 (a) | 25 | 25 | |||||||||
| CBS Corp. | |||||||||||
| 7.88%, 7/30/30 | 35 | 45 | |||||||||
| CenturyLink, Inc., | |||||||||||
| Series P | |||||||||||
| 7.60%, 9/15/39 | 120 | 114 | |||||||||
| Comcast Corp. | |||||||||||
| 6.95%, 8/15/37 | 100 | 127 | |||||||||
The accompanying notes are an integral part of the financial statements.
49
2012 Semi-Annual Report
March 31, 2012 (unaudited)
Portfolio of Investments (cont'd)
Long Duration Fixed Income Portfolio
| Face Amount (000) | Value (000) | ||||||||||
| Industrials (cont'd) | |||||||||||
| ConAgra Foods, Inc. | |||||||||||
| 8.25%, 9/15/30 | $ | 65 | $ | 83 | |||||||
| Corning, Inc. | |||||||||||
| 7.25%, 8/15/36 | 85 | 102 | |||||||||
| CSX Corp. | |||||||||||
| 6.15%, 5/1/37 | 60 | 70 | |||||||||
| Daimler Finance North America LLC | |||||||||||
| 8.50%, 1/18/31 | 65 | 95 | |||||||||
| Darden Restaurants, Inc. | |||||||||||
| 6.80%, 10/15/37 | 50 | 57 | |||||||||
| Delhaize Group SA | |||||||||||
| 5.70%, 10/1/40 | 105 | 97 | |||||||||
| Deutsche Telekom International Finance BV | |||||||||||
| 8.75%, 6/15/30 | 85 | 117 | |||||||||
| DirecTV Holdings LLC/DirecTV Financing Co., Inc. | |||||||||||
| 6.35%, 3/15/40 | 40 | 44 | |||||||||
| Dr. Pepper Snapple Group, Inc. | |||||||||||
| 7.45%, 5/1/38 | 75 | 102 | |||||||||
| Grupo Televisa SA | |||||||||||
| 6.63%, 1/15/40 | 75 | 86 | |||||||||
| Halliburton Co. | |||||||||||
| 4.50%, 11/15/41 | 50 | 51 | |||||||||
| Harley-Davidson Funding Corp. | |||||||||||
| 6.80%, 6/15/18 (a) | 40 | 47 | |||||||||
| Hess Corp. | |||||||||||
| 7.13%, 3/15/33 | 55 | 70 | |||||||||
| Hewlett-Packard Co. | |||||||||||
| 6.00%, 9/15/41 | 75 | 82 | |||||||||
| Holcim Capital Corp. Ltd. | |||||||||||
| 6.88%, 9/29/39 (a) | 100 | 101 | |||||||||
| Home Depot, Inc. (The) | |||||||||||
| 5.88%, 12/16/36 | 140 | 168 | |||||||||
| Illinois Tool Works, Inc. | |||||||||||
| 4.88%, 9/15/41 (a) | 50 | 54 | |||||||||
| International Paper Co. | |||||||||||
| 7.30%, 11/15/39 | 95 | 116 | |||||||||
| JC Penney Corp., Inc. | |||||||||||
| 7.40%, 4/1/37 | 50 | 49 | |||||||||
| KLA-Tencor Corp. | |||||||||||
| 6.90%, 5/1/18 | 45 | 54 | |||||||||
| Kohl's Corp. | |||||||||||
| 6.88%, 12/15/37 | 55 | 67 | |||||||||
| Koninklijke KPN N.V. | |||||||||||
| 8.38%, 10/1/30 | 25 | 32 | |||||||||
| Koninklijke Philips Electronics N.V. | |||||||||||
| 6.88%, 3/11/38 | 70 | 87 | |||||||||
| Kraft Foods, Inc. | |||||||||||
| 6.88%, 1/26/39 | 150 | 189 | |||||||||
| Kroger Co. (The) | |||||||||||
| 6.90%, 4/15/38 | 80 | 100 | |||||||||
| Lorillard Tobacco Co. | |||||||||||
| 8.13%, 5/1/40 | 45 | 55 | |||||||||
| Face Amount (000) | Value (000) | ||||||||||
| Lowe's Cos., Inc. | |||||||||||
| 6.65%, 9/15/37 | $ | 45 | $ | 58 | |||||||
| Marathon Petroleum Corp. | |||||||||||
| 6.50%, 3/1/41 | 100 | 108 | |||||||||
| NBC Universal Media LLC | |||||||||||
| 6.40%, 4/30/40 | 45 | 54 | |||||||||
| News America, Inc. | |||||||||||
| 6.40%, 12/15/35 | 105 | 119 | |||||||||
| Petro-Canada, | |||||||||||
| 5.95%, 5/15/35 | 55 | 64 | |||||||||
| 6.80%, 5/15/38 | 100 | 128 | |||||||||
| Petrobras International Finance Co. | |||||||||||
| 6.88%, 1/20/40 | 60 | 71 | |||||||||
| Philip Morris International, Inc. | |||||||||||
| 4.50%, 3/20/42 | 75 | 74 | |||||||||
| Potash Corp. of Saskatchewan, Inc. | |||||||||||
| 5.88%, 12/1/36 | 85 | 103 | |||||||||
| Quest Diagnostics, Inc., | |||||||||||
| 5.75%, 1/30/40 | 30 | 31 | |||||||||
| 6.95%, 7/1/37 | 80 | 98 | |||||||||
| Qwest Corp. | |||||||||||
| 6.88%, 9/15/33 | 40 | 40 | |||||||||
| Ralcorp Holdings, Inc. | |||||||||||
| 6.63%, 8/15/39 | 90 | 91 | |||||||||
| Rio Tinto Alcan, Inc. | |||||||||||
| 6.13%, 12/15/33 | 25 | 29 | |||||||||
| Rio Tinto Finance USA Ltd. | |||||||||||
| 7.13%, 7/15/28 | 40 | 52 | |||||||||
| Southern Copper Corp. | |||||||||||
| 6.75%, 4/16/40 | 100 | 109 | |||||||||
| Syngenta Finance | |||||||||||
| 4.38%, 3/28/42 | 30 | 30 | |||||||||
| Target Corp. | |||||||||||
| 7.00%, 1/15/38 | 100 | 135 | |||||||||
| Telecom Italia Capital SA | |||||||||||
| 7.20%, 7/18/36 | 40 | 39 | |||||||||
| Telefonica Europe BV | |||||||||||
| 8.25%, 9/15/30 | 35 | 38 | |||||||||
| Teva Pharmaceutical Finance Co. LLC | |||||||||||
| 6.15%, 2/1/36 | 25 | 30 | |||||||||
| Time Warner Cable, Inc. | |||||||||||
| 6.55%, 5/1/37 | 85 | 99 | |||||||||
| Time Warner, Inc. | |||||||||||
| 7.70%, 5/1/32 | 195 | 255 | |||||||||
| Union Pacific Corp. | |||||||||||
| 6.25%, 5/1/34 | 115 | 141 | |||||||||
| Vale Overseas Ltd. | |||||||||||
| 6.88%, 11/21/36 | 50 | 58 | |||||||||
| Valero Energy Corp., | |||||||||||
| 6.63%, 6/15/37 | 65 | 71 | |||||||||
| 9.38%, 3/15/19 | 40 | 53 | |||||||||
The accompanying notes are an integral part of the financial statements.
50
2012 Semi-Annual Report
March 31, 2012 (unaudited)
Portfolio of Investments (cont'd)
Long Duration Fixed Income Portfolio
| Face Amount (000) | Value (000) | ||||||||||
| Industrials (cont'd) | |||||||||||
| Verizon Communications, Inc., | |||||||||||
| 5.85%, 9/15/35 | $ | 120 | $ | 138 | |||||||
| 8.95%, 3/1/39 | 115 | 178 | |||||||||
| Vivendi SA | |||||||||||
| 6.63%, 4/4/18 (a) | 40 | 45 | |||||||||
| Vodafone Group PLC | |||||||||||
| 6.15%, 2/27/37 | 45 | 55 | |||||||||
| Wal-Mart Stores, Inc. | |||||||||||
| 6.50%, 8/15/37 | 35 | 46 | |||||||||
| Waste Management, Inc. | |||||||||||
| 6.13%, 11/30/39 | 95 | 116 | |||||||||
| Williams Cos., Inc. (The) | |||||||||||
| 7.75%, 6/15/31 | 39 | 48 | |||||||||
| Xerox Corp. | |||||||||||
| 5.63%, 12/15/19 | 20 | 22 | |||||||||
| 6,484 | |||||||||||
| Utilities (8.8%) | |||||||||||
| Columbus Southern Power Co. | |||||||||||
| 6.60%, 3/1/33 | 30 | 37 | |||||||||
| Constellation Energy Group, Inc. | |||||||||||
| 7.60%, 4/1/32 | 75 | 98 | |||||||||
| Detroit Edison Co. (The) | |||||||||||
| 6.35%, 10/15/32 | 60 | 74 | |||||||||
| E.ON International Finance BV | |||||||||||
| 6.65%, 4/30/38 (a) | 25 | 32 | |||||||||
| EDF SA | |||||||||||
| 5.60%, 1/27/40 (a) | 30 | 31 | |||||||||
| Enbridge Energy Partners LP | |||||||||||
| 7.50%, 4/15/38 | 50 | 64 | |||||||||
| Energy Transfer Partners LP, | |||||||||||
| 7.50%, 7/1/38 | 60 | 68 | |||||||||
| 9.00%, 4/15/19 | 19 | 23 | |||||||||
| Entergy Louisiana LLC | |||||||||||
| 5.40%, 11/1/24 | 50 | 58 | |||||||||
| Enterprise Products Operating LLC | |||||||||||
| 5.95%, 2/1/41 | 100 | 112 | |||||||||
| Exelon Generation Co., LLC | |||||||||||
| 6.25%, 10/1/39 | 175 | 205 | |||||||||
| FirstEnergy Solutions Corp. | |||||||||||
| 6.80%, 8/15/39 | 180 | 201 | |||||||||
| Kinder Morgan Energy Partners LP | |||||||||||
| 6.50%, 2/1/37 | 65 | 72 | |||||||||
| Nevada Power Co. | |||||||||||
| 6.65%, 4/1/36 | 125 | 160 | |||||||||
| Nisource Finance Corp. | |||||||||||
| 6.13%, 3/1/22 | 85 | 99 | |||||||||
| Ohio Power Co. | |||||||||||
| 6.60%, 2/15/33 | 110 | 135 | |||||||||
| Oncor Electric Delivery Co. LLC | |||||||||||
| 7.50%, 9/1/38 | 25 | 32 | |||||||||
| Face Amount (000) | Value (000) | ||||||||||
| ONEOK Partners LP | |||||||||||
| 6.85%, 10/15/37 | $ | 75 | $ | 90 | |||||||
| Plains All American Pipeline LP/PAA Finance Corp., | |||||||||||
| 6.65%, 1/15/37 | 40 | 47 | |||||||||
| 6.70%, 5/15/36 | 75 | 88 | |||||||||
| PPL Electric Utilities Corp. | |||||||||||
| 6.45%, 8/15/37 | 30 | 40 | |||||||||
| Sempra Energy | |||||||||||
| 6.00%, 10/15/39 | 125 | 151 | |||||||||
| Spectra Energy Capital LLC | |||||||||||
| 7.50%, 9/15/38 | 45 | 57 | |||||||||
| Tennessee Gas Pipeline Co. | |||||||||||
| 7.00%, 10/15/28 | 125 | 142 | |||||||||
| 2,116 | |||||||||||
| 11,350 | |||||||||||
| Municipal Bonds (6.5%) | |||||||||||
| American Municipal Power, Inc. | |||||||||||
| 6.05%, 2/15/43 | 55 | 61 | |||||||||
| Bay Area Toll Authority | |||||||||||
| 6.26%, 4/1/49 | 90 | 116 | |||||||||
| Chicago, IL Board of Education | |||||||||||
| 6.14%, 12/1/39 | 50 | 56 | |||||||||
| Chicago, IL Transit Authority | |||||||||||
| 6.20%, 12/1/40 | 85 | 97 | |||||||||
| City of New York, NY, | |||||||||||
| Series G-1 | |||||||||||
| 5.97%, 3/1/36 | 40 | 49 | |||||||||
| City of San Francisco, CA, | |||||||||||
| Public Utilities Commission Water Revenue | |||||||||||
| 6.00%, 11/1/40 | 55 | 66 | |||||||||
| County of Clark N.V. | |||||||||||
| 6.82%, 7/1/45 | 105 | 139 | |||||||||
| District of Columbia | |||||||||||
| 5.59%, 12/1/34 | 65 | 79 | |||||||||
| Illinois State Toll Highway Authority, | |||||||||||
| Highway Revenue, Build America Bonds | |||||||||||
| 6.18%, 1/1/34 | 70 | 84 | |||||||||
| Indianapolis, IN Local Public Improvement Bond Bank | |||||||||||
| 6.12%, 1/15/40 | 35 | 44 | |||||||||
| Los Angeles, CA Unified School District | |||||||||||
| 6.76%, 7/1/34 | 45 | 58 | |||||||||
| Municipal Electric Authority of Georgia, | |||||||||||
| 6.64%, 4/1/57 | 65 | 73 | |||||||||
| 6.66%, 4/1/57 | 25 | 28 | |||||||||
| New Jersey Transportation Trust Fund Authority | |||||||||||
| 6.56%, 12/15/40 | 35 | 45 | |||||||||
| New York City, NY Municipal Water Finance Authority | |||||||||||
| 5.72%, 6/15/42 | 30 | 38 | |||||||||
| New York City, NY Transitional Finance Authority | |||||||||||
| 5.27%, 5/1/27 | 40 | 47 | |||||||||
| North Texas Tollway Authority | |||||||||||
| 6.72%, 1/1/49 | 90 | 116 | |||||||||
The accompanying notes are an integral part of the financial statements.
51
2012 Semi-Annual Report
March 31, 2012 (unaudited)
Portfolio of Investments (cont'd)
Long Duration Fixed Income Portfolio
| Face Amount (000) | Value (000) | ||||||||||
| Municipal Bonds (cont'd) | |||||||||||
| San Diego, CA County Water Authority | |||||||||||
| 6.14%, 5/1/49 | $ | 25 | $ | 32 | |||||||
| State of California, General Obligation Bonds | |||||||||||
| 7.55%, 4/1/39 | 160 | 206 | |||||||||
| State of Illinois | |||||||||||
| 6.63%, 2/1/35 | 50 | 55 | |||||||||
| State of Washington | |||||||||||
| 5.09%, 8/1/33 | 65 | 74 | |||||||||
| 1,563 | |||||||||||
| Sovereign (3.0%) | |||||||||||
| Brazilian Government International Bond | |||||||||||
| 8.25%, 1/20/34 | 210 | 318 | |||||||||
| Mexico Government International Bond | |||||||||||
| 6.05%, 1/11/40 | 165 | 200 | |||||||||
| Panama Government International Bond | |||||||||||
| 9.38%, 4/1/29 | 43 | 69 | |||||||||
| Peruvian Government International Bond | |||||||||||
| 8.75%, 11/21/33 | 35 | 54 | |||||||||
| Petroleos Mexicanos | |||||||||||
| 4.88%, 1/24/22 (a) | 70 | 74 | |||||||||
| 715 | |||||||||||
| U.S. Agency Security (2.5%) | |||||||||||
| Federal Home Loan Mortgage Corporation | |||||||||||
| 6.75%, 3/15/31 | 417 | 602 | |||||||||
| U.S. Treasury Securities (36.0%) | |||||||||||
| U.S. Treasury Bonds, | |||||||||||
| 3.13%, 11/15/41 | 1,240 | 1,189 | |||||||||
| 3.50%, 2/15/39 | 1,060 | 1,101 | |||||||||
| 3.75%, 8/15/41 | 885 | 957 | |||||||||
| 3.88%, 8/15/40 | 860 | 951 | |||||||||
| 4.25%, 11/15/40 | 1,500 | 1,767 | |||||||||
| 5.50%, 8/15/28 | 1,455 | 1,948 | |||||||||
| 6.75%, 8/15/26 | 530 | 783 | |||||||||
| 8,696 | |||||||||||
| Total Fixed Income Securities (Cost $20,318) | 23,067 | ||||||||||
| Shares | Value (000) | ||||||||||
| Short-Term Investment (3.6%) | |||||||||||
| Investment Company (3.6%) | |||||||||||
| Morgan Stanley Institutional Liquidity Funds — Money Market Portfolio — Institutional Class (See Note G-2) (Cost $876) | 875,832 | $ | 876 | ||||||||
| Total Investments (99.2%) (Cost $21,194) (b) | 23,943 | ||||||||||
| Other Assets in Excess of Liabilities (0.8%) | 196 | ||||||||||
| Net Assets (100.0%) | $ | 24,139 | |||||||||
(a) 144A security — Certain conditions for public sale may exist. Unless otherwise noted, these securities are deemed to be liquid.
(b) Securities are available for collateral in connection with futures contracts and swap agreements.
MTN Medium Term Note.
Futures Contracts:
The Portfolio had the following futures contracts open at period end:
| Number of Contracts | Value (000) | Expiration Date | Unrealized Appreciation (Depreciation) (000) | ||||||||||||||||
| Long: | |||||||||||||||||||
| U.S. Treasury 10 yr. Note | 18 | $ | 2,331 | Jun-12 | $ | 12 | |||||||||||||
| Short: | |||||||||||||||||||
| U.S. Treasury 2 yr. Note | 4 | (880 | ) | Jun-12 | (1 | ) | |||||||||||||
| U.S. Treasury 5 yr. Note | 3 | (368 | ) | Jun-12 | 2 | ||||||||||||||
| $ | 13 | ||||||||||||||||||
Interest Rate Swap Agreements:
The Portfolio had the following interest rate swap agreements open at period end:
| Swap Counterparty | Floating Rate Index | Pay/Receive Floating Rate | Fixed Rate | Termination Date | Notional Amount (000) | Unrealized Appreciation (Depreciation) (000) | |||||||||||||||||||||
| Bank of America NA | 6 Month EURIBOR | Pay | 4.26 | % | 8/18/26 | EUR | 1,090 | $ | 48 | ||||||||||||||||||
| Bank of America NA | 3 Month LIBOR | Receive | 4.35 | 8/18/26 | $ | 1,460 | (26 | ) | |||||||||||||||||||
| Bank of America NA | 6 Month EURIBOR | Receive | 3.61 | 8/18/31 | EUR | 1,375 | (42 | ) | |||||||||||||||||||
| Bank of America NA | 3 Month LIBOR | Pay | 4.15 | 8/18/31 | $ | 1,810 | 25 | ||||||||||||||||||||
| Goldman Sachs International | 3 Month LIBOR | Receive | 2.42 | 3/22/22 | 273 | (4 | ) | ||||||||||||||||||||
| JP Morgan Chase | 3 Month LIBOR | Receive | 2.43 | 3/22/22 | 132 | (2 | ) | ||||||||||||||||||||
| $ | (1 | ) | |||||||||||||||||||||||||
The accompanying notes are an integral part of the financial statements.
52
2012 Semi-Annual Report
March 31, 2012 (unaudited)
Portfolio of Investments (cont'd)
Long Duration Fixed Income Portfolio
Zero Coupon Swap Agreements:
The Portfolio had the following zero coupon swap agreements open at period end:
| Swap Counterparty | Notional Amount (000) | Floating Rate Index | Pay/Receive Floating Rate | Termination Date | Premium Paid (Received) (000) | Unrealized Appreciation (Depreciation) (000) | |||||||||||||||||||||
| Barclays Capital | $ | 609 | 3 Month LIBOR | Receive | 11/15/19 | $ | (44 | ) | $ | (190 | ) | ||||||||||||||||
| Barclays Capital | 722 | 3 Month LIBOR | Pay | 11/15/19 | 25 | 103 | |||||||||||||||||||||
| $ | (87 | ) | |||||||||||||||||||||||||
EURIBOR Euro Interbank Offered Rate.
LIBOR London Interbank Offered Rate.
EUR Euro
Fair Value Measurement Information:
The following is a summary of the inputs used to value the Portfolio's investments as of March 31, 2012. (See Note A-5 to the financial statements for further information regarding fair value measurement.)
| Investment Type | Level 1 Unadjusted quoted prices (000) | Level 2 Other significant observable inputs (000) | Level 3 Significant unobservable inputs (000) | Total (000) | |||||||||||||||
| Assets: | |||||||||||||||||||
| Fixed Income Securities | |||||||||||||||||||
| Asset-Backed Securities | $ | — | $ | 141 | $ | — | $ | 141 | |||||||||||
| Corporate Bonds | — | 11,350 | — | 11,350 | |||||||||||||||
| Municipal Bonds | — | 1,563 | — | 1,563 | |||||||||||||||
| Sovereign | — | 715 | — | 715 | |||||||||||||||
| U.S. Agency Securities | — | 602 | — | 602 | |||||||||||||||
| U.S. Treasury Securities | — | 8,696 | — | 8,696 | |||||||||||||||
| Total Fixed Income Securities | — | 23,067 | — | 23,067 | |||||||||||||||
| Short-Term Investment — Investment Company | 876 | — | — | 876 | |||||||||||||||
| Futures Contracts | 14 | — | — | 14 | |||||||||||||||
| Interest Rate Swap Agreements | — | 73 | — | 73 | |||||||||||||||
| Zero Coupon Swap Agreements | — | 103 | — | 103 | |||||||||||||||
| Total Assets | 890 | 23,243 | — | 24,133 | |||||||||||||||
| Liabilities: | |||||||||||||||||||
| Futures Contracts | (1 | ) | — | — | (1 | ) | |||||||||||||
| Interest Rate Swap Agreements | — | (74 | ) | — | (74 | ) | |||||||||||||
| Zero Coupon Swap Agreements | — | (190 | ) | — | (190 | ) | |||||||||||||
| Total Liabilities | (1 | ) | (264 | ) | — | (265 | ) | ||||||||||||
| Total | $ | 889 | $ | 22,979 | $ | — | $ | 23,868 | |||||||||||
Transfers between investment levels may occur as the markets fluctuate and/or the availability of data used in an investment's valuation changes. The Portfolio recognizes transfers between the levels as of the end of the period. As of March 31, 2012, the Portfolio did not have any significant investments transfer between investment levels.
Portfolio Composition
| Classification | Percentage of Total Investments | ||||||
| U.S. Treasury Securities | 36.3 | % | |||||
| Industrials | 27.1 | ||||||
| Finance | 11.5 | ||||||
| Other* | 9.7 | ||||||
| Utilities | 8.9 | ||||||
| Municipal Bonds | 6.5 | ||||||
| Total Investments | 100.0 | %** | |||||
* Industries and/or investment types representing less than 5% of total investments.
** Does not include open long/short futures contracts with an underlying face amount of approximately $3,579,000 and net unrealized appreciation of approximately $13,000. Also does not include open swap agreements with net unrealized depreciation of approximately $88,000.
The accompanying notes are an integral part of the financial statements.
53
2012 Semi-Annual Report
March 31, 2012 (unaudited)
Statements of Assets and Liabilities
| Balanced Portfolio (000) | Mid Cap Growth Portfolio (000) | Core Fixed Income Portfolio (000) | Core Plus Fixed Income Portfolio (000) | ||||||||||||||||
| Assets: | |||||||||||||||||||
| Investments in Securities of Unaffiliated Issuers, at Cost | $ | 35,356 | $ | 5,674,105 | $ | 61,255 | $ | 258,559 | |||||||||||
| Investments in Securities of Affiliated Issuers, at Cost | 11,757 | 174,656 | 9,809 | 38,381 | |||||||||||||||
| Total Investments in Securities, at Cost | 47,113 | 5,848,761 | 71,064 | 296,940 | |||||||||||||||
| Foreign Currency, at Cost | 87 | 1,200 | — | 1 | |||||||||||||||
| Investments in Securities of Unaffiliated Issuers, at Value(1) | 36,966 | 6,924,279 | 63,102 | 264,255 | |||||||||||||||
| Investments in Securities of Affiliated Issuers, at Value | 11,736 | 174,656 | 9,847 | 38,481 | |||||||||||||||
| Total Investments in Securities, at Value(1) | 48,702 | 7,098,935 | 72,949 | 302,736 | |||||||||||||||
| Foreign Currency, at Value | 90 | 1,207 | — | 1 | |||||||||||||||
| Cash | 21 | 413 | 20 | 47 | |||||||||||||||
| Receivable for Portfolio Shares Sold | 3 | 5,447 | 14 | 109 | |||||||||||||||
| Dividends Receivable | 25 | 4,622 | — | — | |||||||||||||||
| Interest Receivable | 97 | — | 395 | 1,930 | |||||||||||||||
| Receivable for Investments Sold | 80 | — | 806 | 1,140 | |||||||||||||||
| Unrealized Appreciation on Swap Agreements | 74 | — | 246 | 973 | |||||||||||||||
| Tax Reclaim Receivable | 1 | 1,068 | 1 | — | @ | ||||||||||||||
| Receivable for Variation Margin | 794 | — | 17 | 184 | |||||||||||||||
| Unrealized Appreciation on Foreign Currency Exchange Contracts | 29 | — | — | 110 | |||||||||||||||
| Receivable from Affiliates | 4 | 21 | 8 | 29 | |||||||||||||||
| Premium Paid on Open Swap Agreements | — | — | 59 | — | |||||||||||||||
| Other Assets | 14 | 281 | 14 | 28 | |||||||||||||||
| Total Assets | 49,934 | 7,111,994 | 74,529 | 307,287 | |||||||||||||||
| Liabilities: | |||||||||||||||||||
| Collateral on Securities Loaned, at Value | 7,104 | — | 6,525 | 15,515 | |||||||||||||||
| Payable for Investments Purchased | 1,664 | 23,247 | 6,819 | 21,574 | |||||||||||||||
| Payable for Portfolio Shares Redeemed | — | 16,334 | 109 | 401 | |||||||||||||||
| Payable for Investment Advisory Fees | 45 | 8,192 | 17 | 258 | |||||||||||||||
| Payable for Sub Transfer Agency Fees | 8 | 2,702 | 24 | 53 | |||||||||||||||
| Unrealized Depreciation on Swap Agreements | 63 | — | 455 | 966 | |||||||||||||||
| Payable for Administration Fees | 3 | 470 | 4 | 18 | |||||||||||||||
| Payable for Shareholder Servicing Fees — Class P | 4 | 460 | — | @ | 1 | ||||||||||||||
| Bank Overdraft | — | — | — | 313 | |||||||||||||||
| Payable for Professional Fees | 24 | 77 | 28 | 50 | |||||||||||||||
| Payable for Trustees' Fees and Expenses | 7 | 30 | 4 | 84 | |||||||||||||||
| Premium Received on Open Swap Agreements | — | — | 105 | — | |||||||||||||||
| Unrealized Depreciation on Foreign Currency Exchange Contracts | 14 | — | — | 14 | |||||||||||||||
| Payable for Custodian Fees | 7 | — | 2 | 14 | |||||||||||||||
| Payable for Transfer Agent Fees | 1 | 14 | 1 | 2 | |||||||||||||||
| Other Liabilities | 20 | 238 | 18 | 67 | |||||||||||||||
| Total Liabilities | 8,964 | 51,764 | 14,111 | 39,330 | |||||||||||||||
| Net Assets | $ | 40,970 | $ | 7,060,230 | $ | 60,418 | $ | 267,957 | |||||||||||
| Net Assets Consist of: | |||||||||||||||||||
| Paid-in-Capital | $ | 43,047 | $ | 5,796,734 | $ | 96,514 | $ | 743,262 | |||||||||||
| Undistributed (Distributions in Excess of) Net Investment Income | 266 | (3,611 | ) | 758 | 5,935 | ||||||||||||||
| Accumulated Net Realized Gain (Loss) | (4,035 | ) | 17,052 | (38,520 | ) | (487,072 | ) | ||||||||||||
| Unrealized Appreciation (Depreciation) on: | |||||||||||||||||||
| Investments | 1,610 | 1,250,174 | 1,847 | 5,696 | |||||||||||||||
| Investments in Affiliates | (21 | ) | — | 38 | 100 | ||||||||||||||
| Futures Contracts | 74 | — | (10 | ) | (67 | ) | |||||||||||||
| Swap Agreements | 11 | — | (209 | ) | 7 | ||||||||||||||
| Foreign Currency Exchange Contracts | 15 | — | — | 96 | |||||||||||||||
| Foreign Currency Translations | 3 | (119 | ) | — | (— | )@ | |||||||||||||
| Net Assets | $ | 40,970 | $ | 7,060,230 | $ | 60,418 | $ | 267,957 | |||||||||||
The accompanying notes are an integral part of the financial statements.
54
2012 Semi-Annual Report
March 31, 2012 (unaudited)
Statements of Assets and Liabilities (cont'd)
| Balanced Portfolio (000) | Mid Cap Growth Portfolio (000) | Core Fixed Income Portfolio (000) | Core Plus Fixed Income Portfolio (000) | ||||||||||||||||
| CLASS I: | |||||||||||||||||||
| Net Assets | $ | 21,196 | $ | 4,870,199 | $ | 60,292 | $ | 264,083 | |||||||||||
| Shares Outstanding (unlimited number of shares authorized, no par value) (not in 000s) | 1,457,781 | 125,785,817 | 5,912,953 | 26,042,890 | |||||||||||||||
| Net Asset Value, Offering and Redemption Price Per Share | $ | 14.54 | $ | 38.72 | $ | 10.20 | $ | 10.14 | |||||||||||
| CLASS P: | |||||||||||||||||||
| Net Assets | $ | 19,774 | $ | 2,190,031 | $ | 126 | $ | 3,874 | |||||||||||
| Shares Outstanding (unlimited number of shares authorized, no par value) (not in 000s) | 1,363,871 | 58,660,088 | 12,253 | 381,496 | |||||||||||||||
| Net Asset Value, Offering and Redemption Price Per Share | $ | 14.50 | $ | 37.33 | $ | 10.26 | $ | 10.15 | |||||||||||
| (1) Including: Securities on Loan, at Value: | $ | 7,630 | $ | — | $ | 8,402 | $ | 20,904 | |||||||||||
@ Amount is less than $500.
The accompanying notes are an integral part of the financial statements.
55
2012 Semi-Annual Report
March 31, 2012 (unaudited)
Statements of Assets and Liabilities
| Corporate Bond Portfolio (000) | High Yield Portfolio (000) | Limited Duration Portfolio (000) | Long Duration Fixed Income Portfolio (000) | ||||||||||||||||
| Assets: | |||||||||||||||||||
| Investments in Securities of Unaffiliated Issuers, at Cost | $ | 49,028 | $ | 9,898 | $ | 147,491 | $ | 20,066 | |||||||||||
| Investments in Securities of Affiliated Issuers, at Cost | 9,826 | 101 | 7,149 | 1,128 | |||||||||||||||
| Total Investments in Securities, at Cost | 58,854 | 9,999 | 154,640 | 21,194 | |||||||||||||||
| Foreign Currency, at Cost | — | — | — | — | @ | ||||||||||||||
| Investments in Securities of Unaffiliated Issuers, at Value(1) | 50,614 | 10,005 | 150,345 | 22,801 | |||||||||||||||
| Investments in Securities of Affiliated Issuers, at Value | 9,904 | 101 | 7,169 | 1,142 | |||||||||||||||
| Total Investments in Securities, at Value(1) | 60,518 | 10,106 | 157,514 | 23,943 | |||||||||||||||
| Foreign Currency, at Value | — | — | — | — | @ | ||||||||||||||
| Cash | 29 | — | 19 | — | |||||||||||||||
| Interest Receivable | 607 | 210 | 1,019 | 277 | |||||||||||||||
| Receivable for Investments Sold | 609 | 418 | — | — | |||||||||||||||
| Unrealized Appreciation on Swap Agreements | — | — | 729 | 176 | |||||||||||||||
| Premium Paid on Open Swap Agreements | — | — | 170 | 25 | |||||||||||||||
| Receivable for Portfolio Shares Sold | 65 | — | 10 | — | |||||||||||||||
| Receivable for Variation Margin | 22 | — | 6 | 41 | |||||||||||||||
| Receivable from Affiliates | 25 | — | @ | 24 | 4 | ||||||||||||||
| Due from Adviser | — | 22 | — | 11 | |||||||||||||||
| Tax Reclaim Receivable | — | @ | — | — | — | ||||||||||||||
| Prepaid Offering Cost | — | 108 | — | — | |||||||||||||||
| Other Assets | 59 | 5 | 19 | 6 | |||||||||||||||
| Total Assets | 61,934 | 10,869 | 159,510 | 24,483 | |||||||||||||||
| Liabilities: | |||||||||||||||||||
| Collateral on Securities Loaned, at Value | 9,451 | — | — | — | |||||||||||||||
| Payable for Investments Purchased | 1,189 | 500 | 1,254 | — | |||||||||||||||
| Unrealized Depreciation on Swap Agreements | 13 | — | 1,266 | 264 | |||||||||||||||
| Premium Received on Open Swap Agreements | — | — | 280 | 44 | |||||||||||||||
| Payable for Portfolio Shares Redeemed | 48 | — | 201 | — | |||||||||||||||
| Payable for Investment Advisory Fees | 57 | — | 117 | — | |||||||||||||||
| Payable for Offering Cost Fees | — | 119 | — | — | |||||||||||||||
| Payable for Professional Fees | 14 | 12 | 19 | 21 | |||||||||||||||
| Payable for Sub Transfer Agency Fees | 12 | — | 52 | — | @ | ||||||||||||||
| Payable for Administration Fees | 4 | 1 | 11 | 2 | |||||||||||||||
| Payable for Trustees' Fees and Expenses | 14 | — | 4 | — | |||||||||||||||
| Payable for Custodian Fees | 1 | 2 | 3 | 3 | |||||||||||||||
| Payable for Transfer Agent Fees | 2 | 1 | 1 | 1 | |||||||||||||||
| Payable for Shareholder Servicing Fees — Class P | — | @ | — | @ | — | @ | — | @ | |||||||||||
| Payable for Shareholder Servicing Fees — Class H | — | @ | — | @ | — | — | |||||||||||||
| Payable for Distribution and Shareholder Servicing Fees — Class L | 2 | — | @ | — | — | ||||||||||||||
| Other Liabilities | 4 | 1 | 54 | 9 | |||||||||||||||
| Total Liabilities | 10,811 | 636 | 3,262 | 344 | |||||||||||||||
| Net Assets | $ | 51,123 | $ | 10,233 | $ | 156,248 | $ | 24,139 | |||||||||||
| Net Assets Consist of: | |||||||||||||||||||
| Paid-in-Capital | $ | 108,969 | $ | 10,000 | $ | 412,164 | $ | 20,785 | |||||||||||
| Undistributed Net Investment Income | 748 | 99 | 499 | 322 | |||||||||||||||
| Accumulated Net Realized Gain (Loss) | (60,246 | ) | 27 | (258,775 | ) | 358 | |||||||||||||
| Unrealized Appreciation (Depreciation) on: | |||||||||||||||||||
| Investments | 1,586 | 107 | 2,854 | 2,735 | |||||||||||||||
| Investments in Affiliates | 78 | — | 20 | 14 | |||||||||||||||
| Futures Contracts | 1 | — | 23 | 13 | |||||||||||||||
| Swap Agreements | (13 | ) | — | (537 | ) | (88 | ) | ||||||||||||
| Net Assets | $ | 51,123 | $ | 10,233 | $ | 156,248 | $ | 24,139 | |||||||||||
The accompanying notes are an integral part of the financial statements.
56
2012 Semi-Annual Report
March 31, 2012 (unaudited)
Statements of Assets and Liabilities (cont'd)
| Corporate Bond Portfolio (000) | High Yield Portfolio (000) | Limited Duration Portfolio (000) | Long Duration Fixed Income Portfolio (000) | ||||||||||||||||
| CLASS I: | |||||||||||||||||||
| Net Assets | $ | 46,389 | $ | 9,927 | $ | 156,123 | $ | 23,561 | |||||||||||
| Shares Outstanding (unlimited number of shares authorized, no par value) (not in 000s) | 4,429,096 | 970,000 | 20,128,383 | 2,035,437 | |||||||||||||||
| Net Asset Value, Offering and Redemption Price Per Share | $ | 10.47 | $ | 10.23 | $ | 7.76 | $ | 11.58 | |||||||||||
| CLASS P: | |||||||||||||||||||
| Net Assets | $ | 626 | $ | 102 | $ | 125 | $ | 578 | |||||||||||
| Shares Outstanding (unlimited number of shares authorized, no par value) (not in 000s) | 59,820 | 10,000 | 16,112 | 50,000 | |||||||||||||||
| Net Asset Value, Offering and Redemption Price Per Share | $ | 10.47 | $ | 10.23 | $ | 7.76 | $ | 11.56 | |||||||||||
| CLASS H: | |||||||||||||||||||
| Net Assets | $ | 170 | $ | 102 | $ | — | $ | — | |||||||||||
| Shares Outstanding (unlimited number of shares authorized, no par value) (not in 000s) | 16,275 | 10,000 | — | — | |||||||||||||||
| Net Asset Value, Redemption Price Per Share | $ | 10.47 | $ | 10.23 | $ | — | $ | — | |||||||||||
| Maximum Sales Load | 3.50 | % | 3.50 | % | — | — | |||||||||||||
| Maximum Sales Charge | $ | 0.38 | $ | 0.37 | $ | — | $ | — | |||||||||||
| Maximum Offering Price Per Share | $ | 10.85 | $ | 10.60 | $ | — | $ | — | |||||||||||
| CLASS L: | |||||||||||||||||||
| Net Assets | $ | 3,938 | $ | 102 | $ | — | $ | — | |||||||||||
| Shares Outstanding (unlimited number of shares authorized, no par value) (not in 000s) | 376,372 | 10,000 | — | — | |||||||||||||||
| Net Asset Value, Offering and Redemption Price Per Share | $ | 10.46 | $ | 10.23 | $ | — | $ | — | |||||||||||
| (1) Including: Securities on Loan, at Value: | $ | 9,206 | $ | — | $ | — | $ | — | |||||||||||
@ Amount is less than $500.
The accompanying notes are an integral part of the financial statements.
57
2012 Semi-Annual Report
March 31, 2012 (unaudited)
Statements of Operations
For the Six Months Ended March 31, 2012
| Balanced Portfolio (000) | Mid Cap Growth Portfolio (000) | Core Fixed Income Portfolio (000) | Core Plus Fixed Income Portfolio (000) | ||||||||||||||||
| Investment Income: | |||||||||||||||||||
| Dividends from Securities of Unaffiliated Issuers | $ | 239 | $ | 23,892 | $ | — | $ | — | |||||||||||
| Interest from Securities of Unaffiliated Issuers | 298 | — | @ | 1,109 | 6,879 | ||||||||||||||
| Dividends from Securities of Affiliated Issuers | 5 | 108 | 2 | 9 | |||||||||||||||
| Interest from Securities of Affiliated Issuers | 6 | — | 10 | 77 | |||||||||||||||
| Income from Securities Loaned — Net | 8 | — | 4 | 12 | |||||||||||||||
| Less: Foreign Taxes Withheld | — | (568 | ) | (— | )@ | — | |||||||||||||
| Total Investment Income | 556 | 23,432 | 1,125 | 6,977 | |||||||||||||||
| Expenses: | |||||||||||||||||||
| Investment Advisory Fees (Note B) | 96 | 16,573 | 117 | 542 | |||||||||||||||
| Sub Transfer Agency Fees | 7 | 3,133 | 23 | 60 | |||||||||||||||
| Shareholder Servicing Fees — Class P (Note D) | 23 | 2,927 | — | @ | 5 | ||||||||||||||
| Administration Fees (Note C) | 17 | 2,652 | 25 | 116 | |||||||||||||||
| Custodian Fees (Note F) | 41 | 289 | 15 | 44 | |||||||||||||||
| Shareholder Reporting Fees | 11 | 327 | 12 | 15 | |||||||||||||||
| Professional Fees | 31 | 28 | 32 | 41 | |||||||||||||||
| Registration Fees | 9 | 100 | 12 | 9 | |||||||||||||||
| Trustees' Fees and Expenses | 1 | 104 | 1 | 4 | |||||||||||||||
| Transfer Agency Fees (Note E) | 9 | 71 | 3 | 12 | |||||||||||||||
| Pricing Fees | 29 | 4 | 15 | 24 | |||||||||||||||
| Other Expenses | 1 | 75 | 3 | — | |||||||||||||||
| Total Expenses | 275 | 26,283 | 258 | 872 | |||||||||||||||
| Voluntary Waiver of Investment Advisory Fees (Note B) | — | — | (101 | ) | — | ||||||||||||||
| Rebate from Morgan Stanley Affiliate (Note G-2) | (4 | ) | (148 | ) | (3 | ) | (11 | ) | |||||||||||
| Net Expenses | 271 | 26,135 | 154 | 861 | |||||||||||||||
| Net Investment Income (Loss) | 285 | (2,703 | ) | 971 | 6,116 | ||||||||||||||
| Realized Gain (Loss): | |||||||||||||||||||
| Investments Sold | 1,155 | 50,214 | 981 | (3,476 | ) | ||||||||||||||
| Investments in Affiliates | 11 | — | 24 | 179 | |||||||||||||||
| Foreign Currency Exchange Contracts | 97 | — | — | 206 | |||||||||||||||
| Foreign Currency Transactions | 3 | (3 | ) | — | 974 | ||||||||||||||
| Futures Contracts | 1,247 | — | (74 | ) | 320 | ||||||||||||||
| Swap Agreements | (204 | ) | — | — | (575 | ) | |||||||||||||
| Net Realized Gain (Loss) | 2,309 | 50,211 | 931 | (2,372 | ) | ||||||||||||||
| Change in Unrealized Appreciation (Depreciation): | |||||||||||||||||||
| Investments | 4,024 | 1,212,241 | (94 | ) | 8,257 | ||||||||||||||
| Investments in Affiliates | 98 | — | 5 | 121 | |||||||||||||||
| Foreign Currency Exchange Contracts | (113 | ) | — | — | 84 | ||||||||||||||
| Foreign Currency Translations | 9 | (115 | ) | — | (1 | ) | |||||||||||||
| Futures Contracts | 146 | — | 61 | (1 | ) | ||||||||||||||
| Swap Agreements | 36 | — | (3 | ) | 476 | ||||||||||||||
| Net Change in Unrealized Appreciation (Depreciation) | 4,200 | 1,212,126 | (31 | ) | 8,936 | ||||||||||||||
| Net Realized Gain (Loss) and Change in Unrealized Appreciation (Depreciation) | 6,509 | 1,262,337 | 900 | 6,564 | |||||||||||||||
| Net Increase in Net Assets Resulting from Operations | $ | 6,794 | $ | 1,259,634 | $ | 1,871 | $ | 12,680 | |||||||||||
@ Amount is less than $500.
The accompanying notes are an integral part of the financial statements.
58
2012 Semi-Annual Report
March 31, 2012 (unaudited)
Statements of Operations
For the Six Months Ended March 31, 2012
| Corporate Bond Portfolio (000) | High Yield Portfolio* (000) | Limited Duration Portfolio (000) | Long Duration Fixed Income Portfolio (000) | ||||||||||||||||
| Investment Income: | |||||||||||||||||||
| Interest from Securities of Unaffiliated Issuers | $ | 1,385 | $ | 110 | $ | 2,077 | $ | 543 | |||||||||||
| Interest from Securities of Affiliated Issuers | 31 | — | 46 | 8 | |||||||||||||||
| Income from Securities Loaned — Net | 5 | — | — | — | |||||||||||||||
| Dividends from Securities of Affiliated Issuers | 1 | — | @ | 2 | — | @ | |||||||||||||
| Less: Foreign Taxes Withheld | (— | )@ | — | (1 | ) | (— | )@ | ||||||||||||
| Total Investment Income | 1,422 | 110 | 2,124 | 551 | |||||||||||||||
| Expenses: | |||||||||||||||||||
| Investment Advisory Fees (Note B) | 120 | 9 | 241 | 45 | |||||||||||||||
| Administration Fees (Note C) | 26 | 1 | 64 | 10 | |||||||||||||||
| Professional Fees | 28 | 12 | 27 | 26 | |||||||||||||||
| Sub Transfer Agency Fees | 10 | — | 48 | 1 | |||||||||||||||
| Custodian Fees (Note F) | 17 | 2 | 14 | 11 | |||||||||||||||
| Pricing Fees | 15 | 1 | 11 | 13 | |||||||||||||||
| Shareholder Reporting Fees | 8 | — | @ | 31 | — | @ | |||||||||||||
| Registration Fees | 11 | — | 10 | 15 | |||||||||||||||
| Transfer Agency Fees (Note E) | 8 | 2 | �� | 4 | 3 | ||||||||||||||
| Offering Costs | — | 15 | — | — | |||||||||||||||
| Shareholder Servicing Fees — Class P (Note D) | 1 | — | @ | — | @ | 1 | |||||||||||||
| Shareholder Servicing Fees — Class H (Note D) | — | @ | — | @ | — | — | |||||||||||||
| Distribution and Shareholder Servicing Fees — Class L (Note D) | 10 | — | @ | — | — | ||||||||||||||
| Trustees' Fees and Expenses | 1 | — | 2 | — | @ | ||||||||||||||
| Other Expenses | 1 | — | 2 | 2 | |||||||||||||||
| Total Expenses | 256 | 42 | 454 | 127 | |||||||||||||||
| Voluntary Waiver of Shareholder Servicing Fees — Class P (Note D) | (— | )@ | — | — | — | ||||||||||||||
| Voluntary Waiver of Investment Advisory Fees (Note B) | — | (9 | ) | — | (45 | ) | |||||||||||||
| Expenses Reimbursed by Advisor (Note B) | — | (22 | ) | — | (21 | ) | |||||||||||||
| Rebate from Morgan Stanley Affiliate (Note G-2) | (2 | ) | (— | )@ | (2 | ) | (— | )@ | |||||||||||
| Net Expenses | 254 | 11 | 452 | 61 | |||||||||||||||
| Net Investment Income | 1,168 | 99 | 1,672 | 490 | |||||||||||||||
| Realized Gain (Loss): | |||||||||||||||||||
| Investments Sold | 2,387 | 27 | (46 | ) | 551 | ||||||||||||||
| Investments in Affiliates | 153 | — | 46 | — | |||||||||||||||
| Foreign Currency Exchange Contracts | — | — | — | (4 | ) | ||||||||||||||
| Foreign Currency Transactions | — | — | — | (— | )@ | ||||||||||||||
| Futures Contracts | (85 | ) | — | (110 | ) | 15 | |||||||||||||
| Swap Agreements | — | — | — | (41 | ) | ||||||||||||||
| Net Realized Gain (Loss) | 2,455 | 27 | (110 | ) | 521 | ||||||||||||||
| Change in Unrealized Appreciation (Depreciation): | |||||||||||||||||||
| Investments | (975 | ) | 107 | 1,320 | (834 | ) | |||||||||||||
| Investments in Affiliates | (97 | ) | — | (16 | ) | 15 | |||||||||||||
| Foreign Currency Exchange Contracts | — | — | — | 4 | |||||||||||||||
| Foreign Currency Translations | — | — | — | 1 | |||||||||||||||
| Futures Contracts | 80 | — | 40 | (11 | ) | ||||||||||||||
| Swap Agreements | (13 | ) | — | (9 | ) | 29 | |||||||||||||
| Net Change in Unrealized Appreciation (Depreciation) | (1,005 | ) | 107 | 1,335 | (796 | ) | |||||||||||||
| Net Realized Gain (Loss) and Change in Unrealized Appreciation (Depreciation) | 1,450 | 134 | 1,225 | (275 | ) | ||||||||||||||
| Net Increase in Net Assets Resulting from Operations | $ | 2,618 | $ | 233 | $ | 2,897 | $ | 215 | |||||||||||
@ Amount is less than $500.
* Commencement of Operations February 7, 2012.
The accompanying notes are an integral part of the financial statements.
59
2012 Semi-Annual Report
March 31, 2012
Statements of Changes in Net Assets
| Balanced Portfolio | Mid Cap Growth Portfolio | ||||||||||||||||||
| Six Months Ended March 31, 2012 (unaudited) (000) | Year Ended September 30, 2011 (000) | Six Months Ended March 31, 2012 (unaudited) (000) | Year Ended September 30, 2011 (000) | ||||||||||||||||
| Increase (Decrease) in Net Assets: | |||||||||||||||||||
| Operations: | |||||||||||||||||||
| Net Investment Income (Loss) | $ | 285 | $ | 589 | $ | (2,703 | ) | $ | (2,342 | ) | |||||||||
| Net Realized Gain | 2,309 | 4,315 | 50,211 | 658,813 | |||||||||||||||
| Net Change in Unrealized Appreciation (Depreciation) | 4,200 | (4,228 | ) | 1,212,126 | (763,740 | ) | |||||||||||||
| Net Increase (Decrease) in Net Assets Resulting from Operations | 6,794 | 676 | 1,259,634 | (107,269 | ) | ||||||||||||||
| Distributions from and/or in Excess of: | |||||||||||||||||||
| Class I: | |||||||||||||||||||
| Net Investment Income | (221 | ) | (410 | ) | — | (9,653 | ) | ||||||||||||
| Net Realized Gain | — | — | (211,942 | ) | — | ||||||||||||||
| Investment Class: | |||||||||||||||||||
| Net Investment Income | — | (41 | )* | — | — | ||||||||||||||
| Class P: | |||||||||||||||||||
| Net Investment Income | (126 | ) | (234 | ) | — | (2,780 | ) | ||||||||||||
| Net Realized Gain | — | — | (135,932 | ) | — | ||||||||||||||
| Total Distributions | (347 | ) | (685 | ) | (347,874 | ) | (12,433 | ) | |||||||||||
| Capital Share Transactions:(1) | |||||||||||||||||||
| Class I: | |||||||||||||||||||
| Subscribed | 313 | 1,198 | 607,585 | 1,490,614 | |||||||||||||||
| Distributions Reinvested | 221 | 406 | 199,699 | 8,865 | |||||||||||||||
| Conversion from Investment Class | — | 5,798 | — | — | |||||||||||||||
| Redeemed | (8,231 | ) | (4,609 | ) | (360,937 | ) | (614,738 | ) | |||||||||||
| Investment Class: | |||||||||||||||||||
| Subscribed | — | 168 | * | — | — | ||||||||||||||
| Distributions Reinvested | — | 41 | * | — | — | ||||||||||||||
| Conversion to Class I | — | (5,798 | ) | — | — | ||||||||||||||
| Redeemed | — | (73 | )* | — | — | ||||||||||||||
| Class P: | |||||||||||||||||||
| Subscribed | 794 | 1,375 | 142,678 | 1,017,179 | |||||||||||||||
| Distributions Reinvested | 126 | 234 | 110,582 | 2,751 | |||||||||||||||
| Redeemed | (749 | ) | (1,852 | ) | (943,673 | ) | (869,991 | ) | |||||||||||
| Net Increase (Decrease) in Net Assets Resulting from Capital Share Transactions | (7,526 | ) | (3,112 | ) | (244,066 | ) | 1,034,680 | ||||||||||||
| Total Increase (Decrease) in Net Assets | (1,079 | ) | (3,121 | ) | 667,694 | 914,978 | |||||||||||||
| Net Assets: | |||||||||||||||||||
| Beginning of Period | 42,049 | 45,170 | 6,392,536 | 5,477,558 | |||||||||||||||
| End of Period | $ | 40,970 | $ | 42,049 | $ | 7,060,230 | $ | 6,392,536 | |||||||||||
| Undistributed (Distribution in Excess of) Net Investment Income Included in End of Period Net Assets | $ | 266 | $ | 328 | $ | (3,611 | ) | $ | (908 | ) | |||||||||
| (1) Capital Share Transactions: | |||||||||||||||||||
| Class I: | |||||||||||||||||||
| Shares Subscribed | 23 | 92 | 16,956 | 38,900 | |||||||||||||||
| Shares Issued on Distributions Reinvested | 17 | 30 | 6,154 | 238 | |||||||||||||||
| Conversion from Investment Class | — | 432 | — | — | |||||||||||||||
| Shares Redeemed | (597 | ) | (348 | ) | (10,157 | ) | (16,008 | ) | |||||||||||
| Net Increase (Decrease) in Class I Shares Outstanding | (557 | ) | 206 | 12,953 | 23,130 | ||||||||||||||
| Investment Class: | |||||||||||||||||||
| Shares Subscribed | — | 13 | * | — | — | ||||||||||||||
| Shares Issued on Distributions Reinvested | — | 3 | * | — | — | ||||||||||||||
| Conversion to Class I | — | (433 | ) | — | — | ||||||||||||||
| Shares Redeemed | — | (5 | )* | — | — | ||||||||||||||
| Net Decrease in Investment Class Shares Outstanding | — | (422 | ) | — | — | ||||||||||||||
| Class P: | |||||||||||||||||||
| Shares Subscribed | 57 | 104 | 4,126 | 27,862 | |||||||||||||||
| Shares Issued on Distributions Reinvested | 10 | 18 | 3,531 | 76 | |||||||||||||||
| Shares Redeemed | (55 | ) | (141 | ) | (28,723 | ) | (24,055 | ) | |||||||||||
| Net Increase (Decrease) in Class P Shares Outstanding | 12 | (19 | ) | (21,066 | ) | 3,883 | |||||||||||||
* For the period October 1, 2010 through March 22, 2011.
The accompanying notes are an integral part of the financial statements.
60
2012 Semi-Annual Report
March 31, 2012
Statements of Changes in Net Assets
| Core Fixed Income Portfolio | Core Plus Fixed Income Portfolio | ||||||||||||||||||
| Six Months Ended March 31, 2012 (unaudited) (000) | Year Ended September 30, 2011 (000) | Six Months Ended March 31, 2012 (unaudited) (000) | Year Ended September 30, 2011 (000) | ||||||||||||||||
| Increase (Decrease) in Net Assets: | |||||||||||||||||||
| Operations: | |||||||||||||||||||
| Net Investment Income | $ | 971 | $ | 2,374 | $ | 6,116 | $ | 14,267 | |||||||||||
| Net Realized Gain (Loss) | 931 | 1,877 | (2,372 | ) | 20,947 | ||||||||||||||
| Net Change in Unrealized Appreciation (Depreciation) | (31 | ) | (1,423 | ) | 8,936 | (23,167 | ) | ||||||||||||
| Net Increase in Net Assets Resulting from Operations | 1,871 | 2,828 | 12,680 | 12,047 | |||||||||||||||
| Distributions from and/or in Excess of: | |||||||||||||||||||
| Class I: | |||||||||||||||||||
| Net Investment Income | (1,188 | ) | (2,131 | ) | (6,502 | ) | (15,254 | ) | |||||||||||
| Investment Class: | |||||||||||||||||||
| Net Investment Income | — | — | — | (898 | )* | ||||||||||||||
| Class P: | |||||||||||||||||||
| Net Investment Income | (1 | ) | (4 | ) | (94 | ) | (206 | ) | |||||||||||
| Total Distributions | (1,189 | ) | (2,135 | ) | (6,596 | ) | (16,358 | ) | |||||||||||
| Capital Share Transactions:(1) | |||||||||||||||||||
| Class I: | |||||||||||||||||||
| Subscribed | 816 | 2,966 | 16,481 | 42,742 | |||||||||||||||
| Distributions Reinvested | 1,188 | 2,131 | 6,481 | 15,228 | |||||||||||||||
| Conversion from Investment Class | — | — | — | 94 | |||||||||||||||
| Redeemed | (6,259 | ) | (17,577 | ) | (60,108 | ) | (193,906 | ) | |||||||||||
| Investment Class: | |||||||||||||||||||
| Conversion to Class I | — | — | — | (94 | ) | ||||||||||||||
| Redeemed | — | — | — | (92,182 | )* | ||||||||||||||
| Class P: | |||||||||||||||||||
| Subscribed | 90 | 6 | 409 | 1,120 | |||||||||||||||
| Distributions Reinvested | 1 | 4 | 94 | 206 | |||||||||||||||
| Redeemed | (10 | ) | (173 | ) | (1,364 | ) | (2,394 | ) | |||||||||||
| Net Decrease in Net Assets Resulting from Capital Share Transactions | (4,174 | ) | (12,643 | ) | (38,007 | ) | (229,186 | ) | |||||||||||
| Total Decrease in Net Assets | (3,492 | ) | (11,950 | ) | (31,923 | ) | (233,497 | ) | |||||||||||
| Net Assets: | |||||||||||||||||||
| Beginning of Period | 63,910 | 75,860 | 299,880 | 533,377 | |||||||||||||||
| End of Period | $ | 60,418 | $ | 63,910 | $ | 267,957 | $ | 299,880 | |||||||||||
| Undistributed Net Investment Income Included in End of Period Net Assets | $ | 758 | $ | 976 | $ | 5,935 | $ | 6,415 | |||||||||||
| (1) Capital Share Transactions: | |||||||||||||||||||
| Class I: | |||||||||||||||||||
| Shares Subscribed | 81 | 302 | 1,652 | 4,346 | |||||||||||||||
| Shares Issued on Distributions Reinvested | 119 | 217 | 661 | 1,559 | |||||||||||||||
| Conversion from Investment Class | — | — | — | 10 | |||||||||||||||
| Shares Redeemed | (621 | ) | (1,778 | ) | (6,019 | ) | (19,801 | ) | |||||||||||
| Net Decrease in Class I Shares Outstanding | (421 | ) | (1,259 | ) | (3,706 | ) | (13,886 | ) | |||||||||||
| Investment Class: | |||||||||||||||||||
| Conversion to Class I | — | — | — | (9 | ) | ||||||||||||||
| Shares Redeemed | — | — | — | (9,331 | )* | ||||||||||||||
| Net Decrease in Investment Class Shares Outstanding | — | — | — | (9,340 | ) | ||||||||||||||
| Class P: | |||||||||||||||||||
| Shares Subscribed | 9 | 1 | 41 | 114 | |||||||||||||||
| Shares Issued on Distributions Reinvested | — | @@ | — | @@ | 9 | 21 | |||||||||||||
| Shares Redeemed | (1 | ) | (18 | ) | (137 | ) | (242 | ) | |||||||||||
| Net Increase (Decrease) in Class P Shares Outstanding | 8 | (17 | ) | (87 | ) | (107 | ) | ||||||||||||
* For the period October 1, 2010 through March 14, 2011.
@@ Amount is less than 500 shares.
The accompanying notes are an integral part of the financial statements.
61
2012 Semi-Annual Report
March 31, 2012
Statements of Changes in Net Assets
| Corporate Bond Portfolio | High Yield Portfolio | ||||||||||||||
| Six Months Ended March 31, 2012 (unaudited) (000) | Year Ended September 30, 2011 (000) | Period from February 7, 2012^ to March 31, 2012 (unaudited) (000) | |||||||||||||
| Increase (Decrease) in Net Assets: | |||||||||||||||
| Operations: | |||||||||||||||
| Net Investment Income | $ | 1,168 | $ | 2,508 | $ | 99 | |||||||||
| Net Realized Gain | 2,455 | 2,094 | 27 | ||||||||||||
| Net Change in Unrealized Appreciation (Depreciation) | (1,005 | ) | (1,640 | ) | 107 | ||||||||||
| Net Increase in Net Assets Resulting from Operations | 2,618 | 2,962 | 233 | ||||||||||||
| Distributions from and/or in Excess of: | |||||||||||||||
| Class I: | |||||||||||||||
| Net Investment Income | (1,252 | ) | (2,195 | ) | — | ||||||||||
| Class P: | |||||||||||||||
| Net Investment Income | (8 | ) | (14 | ) | — | ||||||||||
| Class H: | |||||||||||||||
| Net Investment Income | (5 | ) | (5 | ) | — | ||||||||||
| Class L: | |||||||||||||||
| Net Investment Income | (71 | ) | (119 | ) | — | ||||||||||
| Total Distributions | (1,336 | ) | (2,333 | ) | — | ||||||||||
| Capital Share Transactions:(1) | |||||||||||||||
| Class I: | |||||||||||||||
| Subscribed | 928 | 4,447 | 9,700 | ||||||||||||
| Distributions Reinvested | 1,251 | 2,100 | — | ||||||||||||
| Redeemed | (19,400 | ) | (24,083 | ) | — | ||||||||||
| Class P: | |||||||||||||||
| Subscribed | 281 | 10 | 100 | ||||||||||||
| Distributions Reinvested | 8 | 14 | — | ||||||||||||
| Redeemed | (79 | ) | (207 | ) | — | ||||||||||
| Class H: | |||||||||||||||
| Subscribed | — | 301 | 100 | ||||||||||||
| Distributions Reinvested | 4 | 2 | — | ||||||||||||
| Redeemed | (308 | ) | (1 | ) | — | ||||||||||
| Class L: | |||||||||||||||
| Subscribed | 19 | 266 | 100 | ||||||||||||
| Distributions Reinvested | 71 | 115 | — | ||||||||||||
| Redeemed | (305 | ) | (1,827 | ) | — | ||||||||||
| Net Increase (Decrease) in Net Assets Resulting from Capital Share Transactions | (17,530 | ) | (18,863 | ) | 10,000 | ||||||||||
| Total Increase (Decrease) in Net Assets | (16,248 | ) | (18,234 | ) | 10,233 | ||||||||||
| Net Assets: | |||||||||||||||
| Beginning of Period | 67,371 | 85,605 | — | ||||||||||||
| End of Period | $ | 51,123 | $ | 67,371 | $ | 10,233 | |||||||||
| Undistributed Net Investment Income Included in End of Period Net Assets | $ | 748 | $ | 916 | $ | 99 | |||||||||
The accompanying notes are an integral part of the financial statements.
62
2012 Semi-Annual Report
March 31, 2012
Statements of Changes in Net Assets (cont'd)
| Corporate Bond Portfolio | High Yield Portfolio | ||||||||||||||
| Six Months Ended March 31, 2012 (unaudited) (000) | Year Ended September 30, 2011 (000) | Period from February 7, 2012^ to March 31, 2012 (unaudited) (000) | |||||||||||||
| (1) Capital Share Transactions: | |||||||||||||||
| Class I: | |||||||||||||||
| Shares Subscribed | 90 | 443 | 970 | ||||||||||||
| Shares Issued on Distributions Reinvested | 123 | 210 | — | ||||||||||||
| Shares Redeemed | (1,858 | ) | (2,383 | ) | — | ||||||||||
| Net Increase (Decrease) in Class I Shares Outstanding | (1,645 | ) | (1,730 | ) | 970 | ||||||||||
| Class P: | |||||||||||||||
| Shares Subscribed | 27 | 1 | 10 | ||||||||||||
| Shares Issued on Distributions Reinvested | 1 | 1 | — | ||||||||||||
| Shares Redeemed | (8 | ) | (20 | ) | — | ||||||||||
| Net Increase (Decrease) in Class P Shares Outstanding | 20 | (18 | ) | 10 | |||||||||||
| Class H: | |||||||||||||||
| Shares Subscribed | — | 29 | 10 | ||||||||||||
| Shares Issued on Distributions Reinvested | — | @@ | — | @@ | — | ||||||||||
| Shares Redeemed | (30 | ) | (— | )@@ | — | ||||||||||
| Net Increase (Decrease) in Class H Shares Outstanding | (30 | ) | 29 | 10 | |||||||||||
| Class L: | |||||||||||||||
| Shares Subscribed | 1 | 27 | 10 | ||||||||||||
| Shares Issued on Distributions Reinvested | 7 | 12 | — | ||||||||||||
| Shares Redeemed | (29 | ) | (183 | ) | — | ||||||||||
| Net Increase (Decrease) in Class L Shares Outstanding | (21 | ) | (144 | ) | 10 | ||||||||||
^ Commencement of Operations.
@@ Amount is less than 500 shares.
The accompanying notes are an integral part of the financial statements.
63
2012 Semi-Annual Report
March 31, 2012
Statements of Changes in Net Assets
| Limited Duration Portfolio | Long Duration Fixed Income Portfolio | ||||||||||||||||||
| Six Months Ended March 31, 2012 (unaudited) (000) | Year Ended September 30, 2011 (000) | Six Months Ended March 31, 2012 (unaudited) (000) | Year Ended September 30, 2011 (000) | ||||||||||||||||
| Increase (Decrease) in Net Assets: | |||||||||||||||||||
| Operations: | |||||||||||||||||||
| Net Investment Income | $ | 1,672 | $ | 3,987 | $ | 490 | $ | 1,179 | |||||||||||
| Net Realized Gain (Loss) | (110 | ) | (157 | ) | 521 | 450 | |||||||||||||
| Net Change in Unrealized Appreciation (Depreciation) | 1,335 | (2,438 | ) | (796 | ) | 226 | |||||||||||||
| Net Increase in Net Assets Resulting from Operations | 2,897 | 1,392 | 215 | 1,855 | |||||||||||||||
| Distributions from and/or in Excess of: | |||||||||||||||||||
| Class I: | |||||||||||||||||||
| Net Investment Income | (1,993 | ) | (3,268 | ) | (494 | ) | (1,088 | ) | |||||||||||
| Net Realized Gain | — | — | (364 | ) | (1,496 | ) | |||||||||||||
| Class P: | |||||||||||||||||||
| Net Investment Income | (2 | ) | (2 | ) | (12 | ) | (22 | ) | |||||||||||
| Net Realized Gain | — | — | (9 | ) | (27 | ) | |||||||||||||
| Total Distributions | (1,995 | ) | (3,270 | ) | (879 | ) | (2,633 | ) | |||||||||||
| Capital Share Transactions:(1) | |||||||||||||||||||
| Class I: | |||||||||||||||||||
| Subscribed | 4,597 | 11,161 | 791 | 221 | |||||||||||||||
| Distributions Reinvested | 1,992 | 3,267 | 2 | 236 | |||||||||||||||
| Redeemed | (19,178 | ) | (53,349 | ) | (244 | ) | (8,365 | ) | |||||||||||
| Class P: | |||||||||||||||||||
| Subscribed | 40 | 250 | — | — | |||||||||||||||
| Distributions Reinvested | 2 | 2 | — | — | |||||||||||||||
| Redeemed | (112 | ) | (108 | ) | — | — | |||||||||||||
| Net Increase (Decrease) in Net Assets Resulting from Capital Share Transactions | (12,659 | ) | (38,777 | ) | 549 | (7,908 | ) | ||||||||||||
| Total Decrease in Net Assets | (11,757 | ) | (40,655 | ) | (115 | ) | (8,686 | ) | |||||||||||
| Net Assets: | |||||||||||||||||||
| Beginning of Period | 168,005 | 208,660 | 24,254 | 32,940 | |||||||||||||||
| End of Period | $ | 156,248 | $ | 168,005 | $ | 24,139 | $ | 24,254 | |||||||||||
| Undistributed Net Investment Income Included in End of Period Net Assets | $ | 499 | $ | 822 | $ | 322 | $ | 338 | |||||||||||
| (1) Capital Share Transactions: | |||||||||||||||||||
| Class I: | |||||||||||||||||||
| Shares Subscribed | 594 | 1,439 | 67 | 19 | |||||||||||||||
| Shares Issued on Distributions Reinvested | 259 | 421 | — | @@ | 23 | ||||||||||||||
| Shares Redeemed | (2,488 | ) | (6,875 | ) | (21 | ) | (811 | ) | |||||||||||
| Net Increase (Decrease) in Class I Shares Outstanding | (1,635 | ) | (5,015 | ) | 46 | (769 | ) | ||||||||||||
| Class P: | |||||||||||||||||||
| Shares Subscribed | 5 | 32 | — | — | |||||||||||||||
| Shares Issued on Distributions Reinvested | — | @@ | — | @@ | — | — | |||||||||||||
| Shares Redeemed | (14 | ) | (14 | ) | — | — | |||||||||||||
| Net Increase (Decrease) in Class P Shares Outstanding | (9 | ) | 18 | — | — | ||||||||||||||
@@ Amount is less than 500 shares.
The accompanying notes are an integral part of the financial statements.
64
2012 Semi-Annual Report
March 31, 2012
Financial Highlights
Balanced Portfolio
| Class I | |||||||||||||||||||||||||||
| Six Months Ended March 31, 2012 | Year Ended September 30, | ||||||||||||||||||||||||||
| Selected Per Share Data and Ratios | (unaudited) | 2011 | 2010 | 2009 | 2008 | 2007 | |||||||||||||||||||||
| Net Asset Value, Beginning of Period | $ | 12.50 | $ | 12.55 | $ | 11.66 | $ | 11.87 | $ | 14.69 | $ | 12.63 | |||||||||||||||
| Income (Loss) from Investment Operations: | |||||||||||||||||||||||||||
| Net Investment Income† | 0.10 | 0.18 | 0.21 | 0.16 | 0.38 | 0.32 | |||||||||||||||||||||
| Net Realized and Unrealized Gain (Loss) | 2.05 | (0.02 | ) | 0.91 | 0.17 | (2.84 | ) | 2.00 | |||||||||||||||||||
| Total from Investment Operations | 2.15 | 0.16 | 1.12 | 0.33 | (2.46 | ) | 2.32 | ||||||||||||||||||||
| Distributions from and/or in Excess of: | |||||||||||||||||||||||||||
| Net Investment Income | (0.11 | ) | (0.21 | ) | (0.23 | ) | (0.54 | ) | (0.36 | ) | (0.26 | ) | |||||||||||||||
| Redemption Fees | — | — | — | 0.00 | ‡ | 0.00 | ‡ | 0.00 | ‡ | ||||||||||||||||||
| Net Asset Value, End of Period | $ | 14.54 | $ | 12.50 | $ | 12.55 | $ | 11.66 | $ | 11.87 | $ | 14.69 | |||||||||||||||
| Total Return++ | 17.32 | %# | 1.07 | % | 9.77 | % | 3.45 | %** | (17.02 | )% | 18.57 | % | |||||||||||||||
| Ratios and Supplemental Data: | |||||||||||||||||||||||||||
| Net Assets, End of Period (Thousands) | $ | 21,196 | $ | 25,192 | $ | 22,706 | $ | 45,567 | $ | 40,799 | $ | 310,886 | |||||||||||||||
| Ratio of Expenses to Average Net Assets (1) | 1.16 | %*+†† | 1.30 | %+†† | 0.89 | %+†† | 0.67 | %+ | 0.57 | %+ | 0.61 | %+ | |||||||||||||||
| Ratio of Net Investment Income to Average Net Assets (1) | 1.44 | %*+†† | 1.35 | %+†† | 1.73 | %+†† | 1.56 | %+ | 2.66 | %+ | 2.35 | %+ | |||||||||||||||
| Ratio of Rebate from Morgan Stanley Affiliates to Average Net Assets | 0.02 | %* | 0.01 | % | 0.01 | % | 0.04 | % | 0.05 | % | 0.00 | %§ | |||||||||||||||
| Portfolio Turnover Rate | 58 | %# | 164 | % | 176 | % | 171 | % | 148 | % | 60 | % | |||||||||||||||
| (1) Supplemental Information on the Ratios to Average Net Assets: | |||||||||||||||||||||||||||
| Ratios Before Expense Limitation: | |||||||||||||||||||||||||||
| Expenses to Average Net Assets | N/A | N/A | N/A | N/A | 0.58 | %+ | N/A | ||||||||||||||||||||
| Net Investment Income to Average Net Assets | N/A | N/A | N/A | N/A | 2.65 | %+ | N/A | ||||||||||||||||||||
† Per share amount is based on average shares outstanding.
‡ Amount is less than $0.005 per share.
++ Calculated based on the net asset value as of the last business day of the period.
# Not Annualized.
** Performance was positively impacted by approximately 0.79% due to the receipt of proceeds from the settlements of class action suits involving primarily two of the Portfolio's past holdings. This was a one-time settlement, and as a result, the impact on the NAV and consequently the performance will not likely be repeated in the future. Had these settlements not occurred, the total return for Class I shares would have been approximately 2.66%.
* Annualized.
+ The Ratios of Expenses and Net Investment Income reflect the rebate of certain Portfolio expenses in connection with the investments in Morgan Stanley affiliates during the period. The effect of the rebate on the ratios is disclosed in the above table as "Ratio of Rebate from Morgan Stanley Affiliates to Average Net Assets."
†† Reflects overall Portfolio ratios for investment income and non-class specific expenses.
§ Amount is less than 0.005%.
The accompanying notes are an integral part of the financial statements.
65
2012 Semi-Annual Report
March 31, 2012
Financial Highlights
Balanced Portfolio
| Class P | |||||||||||||||||||||||||||
| Six Months Ended March 31, 2012 | Year Ended September 30, | ||||||||||||||||||||||||||
| Selected Per Share Data and Ratios | (unaudited) | 2011 | 2010 | 2009 | 2008 | 2007 | |||||||||||||||||||||
| Net Asset Value, Beginning of Period | $ | 12.47 | $ | 12.52 | $ | 11.63 | $ | 11.84 | $ | 14.66 | $ | 12.61 | |||||||||||||||
| Income (Loss) from Investment Operations: | |||||||||||||||||||||||||||
| Net Investment Income† | 0.08 | 0.15 | 0.18 | 0.13 | 0.32 | 0.29 | |||||||||||||||||||||
| Net Realized and Unrealized Gain (Loss) | 2.04 | (0.03 | ) | 0.91 | 0.17 | (2.81 | ) | 1.98 | |||||||||||||||||||
| Total from Investment Operations | 2.12 | 0.12 | 1.09 | 0.30 | (2.49 | ) | 2.27 | ||||||||||||||||||||
| Distributions from and/or in Excess of: | |||||||||||||||||||||||||||
| Net Investment Income | (0.09 | ) | (0.17 | ) | (0.20 | ) | (0.51 | ) | (0.33 | ) | (0.22 | ) | |||||||||||||||
| Redemption Fees | — | — | — | 0.00 | ‡ | 0.00 | ‡ | 0.00 | ‡ | ||||||||||||||||||
| Net Asset Value, End of Period | $ | 14.50 | $ | 12.47 | $ | 12.52 | $ | 11.63 | $ | 11.84 | $ | 14.66 | |||||||||||||||
| Total Return++ | 17.13 | %# | 0.83 | % | 9.52 | % | 3.15 | %** | (17.26 | )% | 18.23 | % | |||||||||||||||
| Ratios and Supplemental Data: | |||||||||||||||||||||||||||
| Net Assets, End of Period (Thousands) | $ | 19,774 | $ | 16,857 | $ | 17,169 | $ | 18,290 | $ | 32,398 | $ | 31,183 | |||||||||||||||
| Ratio of Expenses to Average Net Assets (1) | 1.41 | %*+†† | 1.55 | %+†† | 1.14 | %+†† | 1.03 | %+ | 0.90 | %+ | 0.87 | %+ | |||||||||||||||
| Ratio of Net Investment Income to Average Net Assets (1) | 1.19 | %*+†† | 1.10 | %+†† | 1.48 | %+†† | 1.27 | %+ | 2.35 | %+ | 2.11 | %+ | |||||||||||||||
| Ratio of Rebate from Morgan Stanley Affiliates to Average Net Assets | 0.02 | %* | 0.01 | % | 0.01 | % | 0.04 | % | 0.06 | % | 0.00 | %§ | |||||||||||||||
| Portfolio Turnover Rate | 58 | %# | 164 | % | 176 | % | 171 | % | 148 | % | 60 | % | |||||||||||||||
| (1) Supplemental Information on the Ratios to Average Net Assets: | |||||||||||||||||||||||||||
| Ratios Before Expense Limitation: | |||||||||||||||||||||||||||
| Expenses to Average Net Assets | N/A | N/A | N/A | 1.08 | %+ | 0.91 | %+ | N/A | |||||||||||||||||||
| Net Investment Income to Average Net Assets | N/A | N/A | N/A | 1.22 | %+ | 2.34 | %+ | N/A | |||||||||||||||||||
† Per share amount is based on average shares outstanding.
‡ Amount is less than $0.005 per share.
++ Calculated based on the net asset value as of the last business day of the period.
# Not Annualized.
** Performance was positively impacted by approximately 0.80% due to the receipt of proceeds from the settlements of class action suits involving primarily two of the Portfolio's past holdings. This was a one-time settlement, and as a result, the impact on the NAV and consequently the performance will not likely be repeated in the future. Had these settlements not occurred, the total return for Class P shares would have been approximately 2.35%.
* Annualized.
+ The Ratios of Expenses and Net Investment Income reflect the rebate of certain Portfolio expenses in connection with the investments in Morgan Stanley affiliates during the period. The effect of the rebate on the ratios is disclosed in the above table as "Ratio of Rebate from Morgan Stanley Affiliates to Average Net Assets."
†† Reflects overall Portfolio ratios for investment income and non-class specific expenses.
§ Amount is less than 0.005%.
The accompanying notes are an integral part of the financial statements.
66
2012 Semi-Annual Report
March 31, 2012
Financial Highlights
Mid Cap Growth Portfolio
| Class I | |||||||||||||||||||||||||||
| Six Months Ended March 31, 2012 | Year Ended September 30, | ||||||||||||||||||||||||||
| Selected Per Share Data and Ratios | (unaudited) | 2011 | 2010 | 2009 | 2008 | 2007 | |||||||||||||||||||||
| Net Asset Value, Beginning of Period | $ | 33.65 | $ | 33.58 | $ | 26.96 | $ | 23.99 | $ | 33.68 | $ | 25.21 | |||||||||||||||
| Income (Loss) from Investment Operations: | |||||||||||||||||||||||||||
| Net Investment Income† | 0.00 | ‡ | 0.03 | 0.11 | 0.03 | 0.05 | ^^ | 0.17 | |||||||||||||||||||
| Net Realized and Unrealized Gain (Loss) | 6.90 | 0.14 | 6.52 | 2.94 | (9.58 | ) | 8.42 | ||||||||||||||||||||
| Total from Investment Operations | 6.90 | 0.17 | 6.63 | 2.97 | (9.53 | ) | 8.59 | ||||||||||||||||||||
| Distributions from and/or in Excess of: | |||||||||||||||||||||||||||
| Net Investment Income | — | (0.10 | ) | (0.01 | ) | — | (0.16 | ) | (0.12 | ) | |||||||||||||||||
| Net Realized Gain | (1.83 | ) | — | — | — | — | — | ||||||||||||||||||||
| Total Distributions | (1.83 | ) | (0.10 | ) | (0.01 | ) | — | (0.16 | ) | (0.12 | ) | ||||||||||||||||
| Redemption Fees | — | — | — | 0.00 | ‡ | 0.00 | ‡ | 0.00 | ‡ | ||||||||||||||||||
| Net Asset Value, End of Period | $ | 38.72 | $ | 33.65 | $ | 33.58 | $ | 26.96 | $ | 23.99 | $ | 33.68 | |||||||||||||||
| Total Return++ | 21.55 | %# | 0.47 | % | 24.58 | % | 12.38 | %** | (28.42 | )%^^ | 34.24 | % | |||||||||||||||
| Ratios and Supplemental Data: | |||||||||||||||||||||||||||
| Net Assets, End of Period (Thousands) | $ | 4,870,199 | $ | 3,797,139 | $ | 3,012,006 | $ | 2,005,809 | $ | 1,609,506 | $ | 1,647,326 | |||||||||||||||
| Ratio of Expenses to Average Net Assets | 0.70 | %*+†† | 0.69 | %+†† | 0.68 | %+†† | 0.69 | %+ | 0.63 | %+ | 0.63 | %+ | |||||||||||||||
| Ratio of Net Investment Income to Average Net Assets | 0.01 | %*+†† | 0.07 | %+†† | 0.38 | %+†† | 0.16 | %+ | 0.17 | %+ | 0.57 | %+ | |||||||||||||||
| Ratio of Rebate from Morgan Stanley Affiliates to Average Net Assets | 0.00 | %*§ | 0.01 | % | 0.01 | % | 0.01 | % | 0.00 | %§ | 0.00 | %§ | |||||||||||||||
| Portfolio Turnover Rate | 9 | %# | 35 | % | 23 | % | 27 | % | 37 | % | 64 | % | |||||||||||||||
† Per share amount is based on average shares outstanding.
‡ Amount is less than $0.005 per share.
^^ During the year, the Portfolio received a regulatory settlement from an unaffiliated third party, which had an impact of less than $0.005 on net investment income per share and less than 0.005% on total returns for Class I.
++ Calculated based on the net asset value as of the last business day of the period.
# Not Annualized.
** Performance was positively impacted by approximately 0.04% due to the receipt of proceeds from the settlements of class action suits involving primarily two of the Portfolio's past holdings. This was a one-time settlement, and as a result, the impact on the NAV and consequently the performance will not likely be repeated in the future. Had these settlements not occurred, the total return for Class I shares would have been approximately 12.34%.
* Annualized.
+ The Ratios of Expenses and Net Investment Income reflect the rebate of certain Portfolio expenses in connection with the investments in Morgan Stanley affiliates during the period. The effect of the rebate on the ratios is disclosed in the above table as "Ratio of Rebate from Morgan Stanley Affiliates to Average Net Assets."
†† Reflects overall Portfolio ratios for investment income and non-class specific expenses.
§ Amount is less than 0.005%.
The accompanying notes are an integral part of the financial statements.
67
2012 Semi-Annual Report
March 31, 2012
Financial Highlights
Mid Cap Growth Portfolio
| Class P | |||||||||||||||||||||||||||
| Six Months Ended March 31, 2012 | Year Ended September 30, | ||||||||||||||||||||||||||
| Selected Per Share Data and Ratios | (unaudited) | 2011 | 2010 | 2009 | 2008 | 2007 | |||||||||||||||||||||
| Net Asset Value, Beginning of Period | $ | 32.55 | $ | 32.51 | $ | 26.15 | $ | 23.33 | $ | 32.78 | $ | 24.54 | |||||||||||||||
| Income (Loss) from Investment Operations: | |||||||||||||||||||||||||||
| Net Investment Income (Loss)† | (0.04 | ) | (0.07 | ) | 0.04 | (0.02 | ) | (0.02 | )^^ | 0.09 | |||||||||||||||||
| Net Realized and Unrealized Gain (Loss) | 6.65 | 0.15 | 6.32 | 2.84 | (9.34 | ) | 8.20 | ||||||||||||||||||||
| Total from Investment Operations | 6.61 | 0.08 | 6.36 | 2.82 | (9.36 | ) | 8.29 | ||||||||||||||||||||
| Distributions from and/or in Excess of: | |||||||||||||||||||||||||||
| Net Investment Income | — | (0.04 | ) | — | — | (0.09 | ) | (0.05 | ) | ||||||||||||||||||
| Net Realized Gain | (1.83 | ) | — | — | — | — | — | ||||||||||||||||||||
| Total Distributions | (1.83 | ) | (0.04 | ) | — | — | (0.09 | ) | (0.05 | ) | |||||||||||||||||
| Redemption Fees | — | — | — | 0.00 | ‡ | 0.00 | ‡ | 0.00 | ‡ | ||||||||||||||||||
| Net Asset Value, End of Period | $ | 37.33 | $ | 32.55 | $ | 32.51 | $ | 26.15 | $ | 23.33 | $ | 32.78 | |||||||||||||||
| Total Return++ | 21.38 | %# | 0.22 | % | 24.32 | % | 12.04 | %** | (28.59 | )%^^ | 33.89 | % | |||||||||||||||
| Ratios and Supplemental Data: | |||||||||||||||||||||||||||
| Net Assets, End of Period (Thousands) | $ | 2,190,031 | $ | 2,595,397 | $ | 2,465,552 | $ | 1,567,302 | $ | 1,236,945 | $ | 1,520,096 | |||||||||||||||
| Ratio of Expenses to Average Net Assets (1) | 0.95 | %*+†† | 0.94 | %+†† | 0.93 | %+†† | 0.96 | %+ | 0.88 | %+ | 0.88 | %+ | |||||||||||||||
| Ratio of Net Investment Income (Loss) to Average Net Assets (1) | (0.24 | )%*+†† | (0.18 | )%+†† | 0.13 | %+†† | (0.11 | )%+ | (0.07 | )%+ | 0.31 | %+ | |||||||||||||||
| Ratio of Rebate from Morgan Stanley Affiliates to Average Net Assets | 0.00 | %*§ | 0.01 | % | 0.01 | % | 0.01 | % | 0.00 | %§ | 0.00 | %§ | |||||||||||||||
| Portfolio Turnover Rate | 9 | %# | 35 | % | 23 | % | 27 | % | 37 | % | 64 | % | |||||||||||||||
| (1) Supplemental Information on the Ratios to Average Net Assets: | |||||||||||||||||||||||||||
| Ratios Before Expense Limitation: | |||||||||||||||||||||||||||
| Expenses to Average Net Assets | N/A | N/A | N/A | N/A | 0.89 | %+ | N/A | ||||||||||||||||||||
| Net Investment Loss to Average Net Assets | N/A | N/A | N/A | N/A | (0.08 | )%+ | N/A | ||||||||||||||||||||
† Per share amount is based on average shares outstanding.
^^ During the year, the Portfolio received a regulatory settlement from an unaffiliated third party, which had an impact of less than $0.005 on net investment income per share and less than 0.005% on total returns for Class P.
‡ Amount is less than $0.005 per share.
++ Calculated based on the net asset value as of the last business day of the period.
# Not Annualized.
** Performance was positively impacted by approximately 0.04% due to the receipt of proceeds from the settlements of class action suits involving primarily two of the Portfolio's past holdings. This was a one-time settlement, and as a result, the impact on the NAV and consequently the performance will not likely be repeated in the future. Had these settlements not occurred, the total return for Class P shares would have been approximately 12.00%.
* Annualized.
+ The Ratios of Expenses and Net Investment Income (Loss) reflect the rebate of certain Portfolio expenses in connection with the investments in Morgan Stanley affiliates during the period. The effect of the rebate on the ratios is disclosed in the above table as "Ratio of Rebate from Morgan Stanley Affiliates to Average Net Assets."
†† Reflects overall Portfolio ratios for investment income and non-class specific expenses.
§ Amount is less than 0.005%.
The accompanying notes are an integral part of the financial statements.
68
2012 Semi-Annual Report
March 31, 2012
Financial Highlights
Core Fixed Income Portfolio
| Class I | |||||||||||||||||||||||||||
| Six Months Ended March 31, 2012 | Year Ended September 30, | ||||||||||||||||||||||||||
| Selected Per Share Data and Ratios | (unaudited) | 2011 | 2010 | 2009 | 2008 | 2007 | |||||||||||||||||||||
| Net Asset Value, Beginning of Period | $ | 10.08 | $ | 9.96 | $ | 9.49 | $ | 9.18 | $ | 10.77 | $ | 10.80 | |||||||||||||||
| Income (Loss) from Investment Operations: | |||||||||||||||||||||||||||
| Net Investment Income† | 0.16 | 0.34 | 0.34 | 0.34 | 0.53 | 0.52 | |||||||||||||||||||||
| Net Realized and Unrealized Gain (Loss) | 0.15 | 0.08 | 0.45 | 0.57 | (1.60 | ) | (0.02 | ) | |||||||||||||||||||
| Total from Investment Operations | 0.31 | 0.42 | 0.79 | 0.91 | (1.07 | ) | 0.50 | ||||||||||||||||||||
| Distributions from and/or in Excess of: | |||||||||||||||||||||||||||
| Net Investment Income | (0.19 | ) | (0.30 | ) | (0.32 | ) | (0.60 | ) | (0.52 | ) | (0.53 | ) | |||||||||||||||
| Redemption Fees | — | — | — | 0.00 | ‡ | 0.00 | ‡ | 0.00 | ‡ | ||||||||||||||||||
| Net Asset Value, End of Period | $ | 10.20 | $ | 10.08 | $ | 9.96 | $ | 9.49 | $ | 9.18 | $ | 10.77 | |||||||||||||||
| Total Return++ | 3.12 | %# | 4.34 | % | 8.57 | % | 10.41 | % | (10.40 | )% | 4.76 | % | |||||||||||||||
| Ratios and Supplemental Data: | |||||||||||||||||||||||||||
| Net Assets, End of Period (Thousands) | $ | 60,292 | $ | 63,866 | $ | 75,651 | $ | 93,768 | $ | 186,305 | $ | 308,111 | |||||||||||||||
| Ratio of Expenses to Average Net Assets (1) | 0.49 | %*+†† | 0.50 | %+†† | 0.50 | %+†† | 0.50 | %+ | 0.49 | %+ | 0.49 | %+ | |||||||||||||||
| Ratio of Net Investment Income to Average Net Assets (1) | 3.13 | %*+†† | 3.43 | %+†† | 3.58 | %+†† | 3.73 | %+ | 5.11 | %+ | 4.83 | %+ | |||||||||||||||
| Ratio of Rebate from Morgan Stanley Affiliates to Average Net Assets | 0.01 | %* | 0.00 | %§ | 0.00 | %§ | 0.01 | % | 0.01 | % | 0.01 | % | |||||||||||||||
| Portfolio Turnover Rate | 102 | %# | 234 | % | 261 | % | 437 | % | 306 | % | 107 | % | |||||||||||||||
| (1) Supplemental Information on the Ratios to Average Net Assets: | |||||||||||||||||||||||||||
| Ratios Before Expense Limitation: | |||||||||||||||||||||||||||
| Expenses to Average Net Assets | 0.83 | %*†† | 0.99 | %†† | 0.67 | %+†† | 0.61 | %+ | 0.53 | %+ | 0.54 | %+ | |||||||||||||||
| Net Investment Income to Average Net Assets | 2.79 | %*†† | 2.94 | %†† | 3.41 | %+†† | 3.62 | %+ | 5.07 | %+ | 4.78 | %+ | |||||||||||||||
† Per share amount is based on average shares outstanding.
‡ Amount is less than $0.005 per share.
++ Calculated based on the net asset value as of the last business day of the period.
# Not Annualized.
* Annualized.
+ The Ratios of Expenses and Net Investment Income reflect the rebate of certain Portfolio expenses in connection with the investments in Morgan Stanley affiliates during the period. The effect of the rebate on the ratios is disclosed in the above table as "Ratio of Rebate from Morgan Stanley Affiliates to Average Net Assets."
†† Reflects overall Portfolio ratios for investment income and non-class specific expenses.
§ Amount is less than 0.005%.
The accompanying notes are an integral part of the financial statements.
69
2012 Semi-Annual Report
March 31, 2012
Financial Highlights
Core Fixed Income Portfolio
| Class P | |||||||||||||||||||||||||||
| Six Months Ended March 31, 2012 | Year Ended September 30, | ||||||||||||||||||||||||||
| Selected Per Share Data and Ratios | (unaudited) | 2011 | 2010 | 2009 | 2008 | 2007 | |||||||||||||||||||||
| Net Asset Value, Beginning of Period | $ | 10.14 | $ | 10.01 | $ | 9.53 | $ | 9.12 | $ | 10.71 | $ | 10.74 | |||||||||||||||
| Income (Loss) from Investment Operations: | |||||||||||||||||||||||||||
| Net Investment Income† | 0.15 | 0.31 | 0.32 | 0.31 | 0.50 | 0.49 | |||||||||||||||||||||
| Net Realized and Unrealized Gain (Loss) | 0.15 | 0.09 | 0.46 | 0.58 | (1.60 | ) | (0.02 | ) | |||||||||||||||||||
| Total from Investment Operations | 0.30 | 0.40 | 0.78 | 0.89 | (1.10 | ) | 0.47 | ||||||||||||||||||||
| Distributions from and/or in Excess of: | |||||||||||||||||||||||||||
| Net Investment Income | (0.18 | ) | (0.27 | ) | (0.30 | ) | (0.48 | ) | (0.49 | ) | (0.50 | ) | |||||||||||||||
| Redemption Fees | — | — | — | 0.00 | ‡ | 0.00 | ‡ | 0.00 | ‡ | ||||||||||||||||||
| Net Asset Value, End of Period | $ | 10.26 | $ | 10.14 | $ | 10.01 | $ | 9.53 | $ | 9.12 | $ | 10.71 | |||||||||||||||
| Total Return++ | 2.97 | %# | 4.11 | % | 8.47 | % | 10.10 | % | (10.68 | )% | 4.53 | % | |||||||||||||||
| Ratios and Supplemental Data: | |||||||||||||||||||||||||||
| Net Assets, End of Period (Thousands) | $ | 126 | $ | 44 | $ | 209 | $ | 214 | $ | 487 | $ | 11,805 | |||||||||||||||
| Ratio of Expenses to Average Net Assets (1) | 0.74 | %*+†† | 0.75 | %+†† | 0.75 | %+†† | 0.75 | %+ | 0.74 | %+ | 0.74 | %+ | |||||||||||||||
| Ratio of Net Investment Income to Average Net Assets (1) | 2.88 | %*+†† | 3.18 | %+†† | 3.33 | %+†† | 3.48 | %+ | 4.87 | %+ | 4.58 | %+ | |||||||||||||||
| Ratio of Rebate from Morgan Stanley Affiliates to Average Net Assets | 0.01 | %* | 0.00 | %§ | 0.00 | %§ | 0.01 | % | 0.01 | % | 0.01 | % | |||||||||||||||
| Portfolio Turnover Rate | 102 | %# | 234 | % | 261 | % | 437 | % | 306 | % | 107 | % | |||||||||||||||
| (1) Supplemental Information on the Ratios to Average Net Assets: | |||||||||||||||||||||||||||
| Ratios Before Expense Limitation: | |||||||||||||||||||||||||||
| Expenses to Average Net Assets | 1.08 | %*†† | 1.24 | %†† | 0.92 | %+†† | 0.86 | %+ | 0.78 | %+ | 0.79 | %+ | |||||||||||||||
| Net Investment Income to Average Net Assets | 2.54 | %*†† | 2.69 | %†† | 3.16 | %+†† | 3.37 | %+ | 4.84 | %+ | 4.54 | %+ | |||||||||||||||
† Per share amount is based on average shares outstanding.
‡ Amount is less than $0.005 per share.
++ Calculated based on the net asset value as of the last business day of the period.
# Not Annualized.
* Annualized.
+ The Ratios of Expenses and Net Investment Income reflect the rebate of certain Portfolio expenses in connection with the investments in Morgan Stanley affiliates during the period. The effect of the rebate on the ratios is disclosed in the above table as "Ratio of Rebate from Morgan Stanley Affiliates to Average Net Assets."
†† Reflects overall Portfolio ratios for investment income and non-class specific expenses.
§ Amount is less than 0.005%.
The accompanying notes are an integral part of the financial statements.
70
2012 Semi-Annual Report
March 31, 2012
Financial Highlights
Core Plus Fixed Income Portfolio
| Class I | |||||||||||||||||||||||||||
| Six Months Ended March 31, 2012 | Year Ended September 30, | ||||||||||||||||||||||||||
| Selected Per Share Data and Ratios | (unaudited) | 2011 | 2010 | 2009 | 2008 | 2007 | |||||||||||||||||||||
| Net Asset Value, Beginning of Period | $ | 9.92 | $ | 9.96 | $ | 9.41 | $ | 9.41 | $ | 11.40 | $ | 11.52 | |||||||||||||||
| Income (Loss) from Investment Operations: | |||||||||||||||||||||||||||
| Net Investment Income† | 0.21 | 0.38 | 0.34 | 0.41 | 0.66 | 0.58 | |||||||||||||||||||||
| Net Realized and Unrealized Gain (Loss) | 0.23 | (0.02 | ) | 0.57 | 0.27 | (2.10 | ) | (0.05 | ) | ||||||||||||||||||
| Total from Investment Operations | 0.44 | 0.36 | 0.91 | 0.68 | (1.44 | ) | 0.53 | ||||||||||||||||||||
| Distributions from and/or in Excess of: | |||||||||||||||||||||||||||
| Net Investment Income | (0.22 | ) | (0.40 | ) | (0.36 | ) | (0.68 | ) | (0.55 | ) | (0.65 | ) | |||||||||||||||
| Redemption Fees | — | — | — | 0.00 | ‡ | 0.00 | ‡ | 0.00 | ‡ | ||||||||||||||||||
| Net Asset Value, End of Period | $ | 10.14 | $ | 9.92 | $ | 9.96 | $ | 9.41 | $ | 9.41 | $ | 11.40 | |||||||||||||||
| Total Return++ | 4.52 | %# | 3.74 | % | 10.02 | % | 7.56 | % | (13.07 | )% | 4.77 | % | |||||||||||||||
| Ratios and Supplemental Data: | |||||||||||||||||||||||||||
| Net Assets, End of Period (Thousands) | $ | 264,083 | $ | 295,226 | $ | 434,657 | $ | 797,788 | $ | 1,210,286 | $ | 2,367,043 | |||||||||||||||
| Ratio of Expenses to Average Net Assets (1) | 0.59 | %*+†† | 0.66 | %+†† | 0.51 | %+†† | 0.49 | %+ | 0.45 | %+ | 0.44 | %+ | |||||||||||||||
| Ratio of Net Investment Income to Average Net Assets (1) | 4.24 | %*+†† | 3.88 | %+†† | 3.53 | %+†† | 4.56 | %+ | 6.13 | %+ | 5.10 | %+ | |||||||||||||||
| Ratio of Rebate from Morgan Stanley Affiliates to Average Net Assets | 0.01 | %* | 0.00 | %§ | 0.01 | % | 0.00 | %§ | 0.01 | % | 0.00 | %§ | |||||||||||||||
| Portfolio Turnover Rate | 85 | %# | 225 | % | 270 | % | 402 | % | 320 | % | 139 | % | |||||||||||||||
| (1) Supplemental Information on the Ratios to Average Net Assets: | |||||||||||||||||||||||||||
| Ratios Before Expense Limitation: | |||||||||||||||||||||||||||
| Expenses to Average Net Assets | N/A | N/A | N/A | 0.50 | %+ | 0.45 | %+ | N/A | |||||||||||||||||||
| Net Investment Income to Average Net Assets | N/A | N/A | N/A | 4.55 | %+ | 6.13 | %+ | N/A | |||||||||||||||||||
† Per share amount is based on average shares outstanding.
‡ Amount is less than $0.005 per share.
++ Calculated based on the net asset value as of the last business day of the period.
# Not Annualized.
* Annualized.
+ The Ratios of Expenses and Net Investment Income reflect the rebate of certain Portfolio expenses in connection with the investments in Morgan Stanley affiliates during the period. The effect of the rebate on the ratios is disclosed in the above table as "Ratio of Rebate from Morgan Stanley Affiliates to Average Net Assets."
†† Reflects overall Portfolio ratios for investment income and non-class specific expenses.
§ Amount is less than 0.005%.
The accompanying notes are an integral part of the financial statements.
71
2012 Semi-Annual Report
March 31, 2012
Financial Highlights
Core Plus Fixed Income Portfolio
| Class P | |||||||||||||||||||||||||||
| Six Months Ended March 31, 2012 | Year Ended September 30, | ||||||||||||||||||||||||||
| Selected Per Share Data and Ratios | (unaudited) | 2011 | 2010 | 2009 | 2008 | 2007 | |||||||||||||||||||||
| Net Asset Value, Beginning of Period | $ | 9.94 | $ | 9.97 | $ | 9.40 | $ | 9.40 | $ | 11.38 | $ | 11.50 | |||||||||||||||
| Income (Loss) from Investment Operations: | |||||||||||||||||||||||||||
| Net Investment Income† | 0.20 | 0.36 | 0.31 | 0.41 | 0.63 | 0.55 | |||||||||||||||||||||
| Net Realized and Unrealized Gain (Loss) | 0.22 | (0.02 | ) | 0.57 | 0.24 | (2.09 | ) | (0.05 | ) | ||||||||||||||||||
| Total from Investment Operations | 0.42 | 0.34 | 0.88 | 0.65 | (1.46 | ) | 0.50 | ||||||||||||||||||||
| Distributions from and/or in Excess of: | |||||||||||||||||||||||||||
| Net Investment Income | (0.21 | ) | (0.37 | ) | (0.31 | ) | (0.65 | ) | (0.52 | ) | (0.62 | ) | |||||||||||||||
| Redemption Fees | — | — | — | 0.00 | ‡ | 0.00 | ‡ | 0.00 | ‡ | ||||||||||||||||||
| Net Asset Value, End of Period | $ | 10.15 | $ | 9.94 | $ | 9.97 | $ | 9.40 | $ | 9.40 | $ | 11.38 | |||||||||||||||
| Total Return++ | 4.27 | %# | 3.57 | % | 9.73 | % | 7.26 | % | (13.23 | )% | 4.42 | % | |||||||||||||||
| Ratios and Supplemental Data: | |||||||||||||||||||||||||||
| Net Assets, End of Period (Thousands) | $ | 3,874 | $ | 4,654 | $ | 5,732 | $ | 6,442 | $ | 97,823 | $ | 137,733 | |||||||||||||||
| Ratio of Expenses to Average Net Assets (1) | 0.84 | %*+†† | 0.91 | %+†† | 0.76 | %+†† | 0.73 | %+ | 0.70 | %+ | 0.69 | %+ | |||||||||||||||
| Ratio of Net Investment Income to Average Net Assets (1) | 3.99 | %*+†† | 3.63 | %+†† | 3.28 | %+†† | 4.56 | %+ | 5.87 | %+ | 4.84 | %+ | |||||||||||||||
| Ratio of Rebate from Morgan Stanley Affiliates to Average Net Assets | 0.01 | %* | 0.00 | %§ | 0.01 | % | 0.00 | %§ | 0.01 | % | 0.00 | %§ | |||||||||||||||
| Portfolio Turnover Rate | 85 | %# | 225 | % | 270 | % | 402 | % | 320 | % | 139 | % | |||||||||||||||
| (1) Supplemental Information on the Ratios to Average Net Assets: | |||||||||||||||||||||||||||
| Ratios Before Expense Limitation: | |||||||||||||||||||||||||||
| Expenses to Average Net Assets | N/A | N/A | N/A | N/A | 0.70 | %+ | N/A | ||||||||||||||||||||
| Net Investment Income to Average Net Assets | N/A | N/A | N/A | N/A | 5.87 | %+ | N/A | ||||||||||||||||||||
† Per share amount is based on average shares outstanding.
‡ Amount is less than $0.005 per share.
++ Calculated based on the net asset value as of the last business day of the period.
# Not Annualized.
* Annualized.
+ The Ratios of Expenses and Net Investment Income reflect the rebate of certain Portfolio expenses in connection with the investments in Morgan Stanley affiliates during the period. The effect of the rebate on the ratios is disclosed in the above table as "Ratio of Rebate from Morgan Stanley Affiliates to Average Net Assets."
†† Reflects overall Portfolio ratios for investment income and non-class specific expenses.
§ Amount is less than 0.005%.
The accompanying notes are an integral part of the financial statements.
72
2012 Semi-Annual Report
March 31, 2012
Financial Highlights
Corporate Bond Portfolio
| Class I | |||||||||||||||||||||||||||
| Six Months Ended March 31, 2012 | Year Ended September 30, | ||||||||||||||||||||||||||
| Selected Per Share Data and Ratios | (unaudited) | 2011 | 2010 | 2009 | 2008 | 2007 | |||||||||||||||||||||
| Net Asset Value, Beginning of Period | $ | 10.27 | $ | 10.17 | $ | 9.75 | $ | 9.61 | $ | 11.15 | $ | 11.22 | |||||||||||||||
| Income (Loss) from Investment Operations: | |||||||||||||||||||||||||||
| Net Investment Income† | 0.19 | 0.33 | 0.33 | 0.31 | 0.55 | 0.52 | |||||||||||||||||||||
| Net Realized and Unrealized Gain (Loss) | 0.22 | 0.07 | 0.49 | 0.38 | (1.57 | ) | 0.01 | ||||||||||||||||||||
| Total from Investment Operations | 0.41 | 0.40 | 0.82 | 0.69 | (1.02 | ) | 0.53 | ||||||||||||||||||||
| Distributions from and/or in Excess of: | |||||||||||||||||||||||||||
| Net Investment Income | (0.21 | ) | (0.30 | ) | (0.40 | ) | (0.55 | ) | (0.52 | ) | (0.60 | ) | |||||||||||||||
| Redemption Fees | — | — | — | 0.00 | ‡ | 0.00 | ‡ | 0.00 | ‡ | ||||||||||||||||||
| Net Asset Value, End of Period | $ | 10.47 | $ | 10.27 | $ | 10.17 | $ | 9.75 | $ | 9.61 | $ | 11.15 | |||||||||||||||
| Total Return++ | 4.06 | %# | 4.05 | % | 8.65 | % | 7.46 | % | (9.37 | )% | 4.82 | % | |||||||||||||||
| Ratios and Supplemental Data: | |||||||||||||||||||||||||||
| Net Assets, End of Period (Thousands) | $ | 46,389 | $ | 62,410 | $ | 79,337 | $ | 140,890 | $ | 316,894 | $ | 519,504 | |||||||||||||||
| Ratio of Expenses to Average Net Assets | 0.76 | %*+†† | 0.80 | %+†† | 0.76 | %+†† | 0.56 | %+ | 0.52 | %+ | 0.50 | %+ | |||||||||||||||
| Ratio of Net Investment Income to Average Net Assets | 3.70 | %*+†† | 3.27 | %+†† | 3.36 | %+†† | 3.30 | %+ | 5.18 | %+ | 4.74 | %+ | |||||||||||||||
| Ratio of Rebate from Morgan Stanley Affiliates to Average Net Assets | 0.01 | %* | 0.00 | %§ | 0.00 | %§ | 0.01 | % | 0.01 | % | 0.00 | %§ | |||||||||||||||
| Portfolio Turnover Rate | 91 | %# | 224 | % | 277 | % | 545 | % | 325 | % | 124 | % | |||||||||||||||
† Per share amount is based on average shares outstanding.
‡ Amount is less than $0.005 per share.
++ Calculated based on the net asset value as of the last business day of the period.
# Not Annualized.
* Annualized.
+ The Ratios of Expenses and Net Investment Income reflect the rebate of certain Portfolio expenses in connection with the investments in Morgan Stanley affiliates during the period. The effect of the rebate on the ratios is disclosed in the above table as "Ratio of Rebate from Morgan Stanley Affiliates to Average Net Assets."
†† Reflects overall Portfolio ratios for investment income and non-class specific expenses.
§ Amount is less than 0.005%.
The accompanying notes are an integral part of the financial statements.
73
2012 Semi-Annual Report
March 31, 2012
Financial Highlights
Corporate Bond Portfolio
| Class P | |||||||||||||||||||||||||||
| Six Months Ended March 31, 2012 | Year Ended September 30, | ||||||||||||||||||||||||||
| Selected Per Share Data and Ratios | (unaudited) | 2011 | 2010 | 2009 | 2008 | 2007 | |||||||||||||||||||||
| Net Asset Value, Beginning of Period | $ | 10.27 | $ | 10.16 | $ | 9.74 | $ | 9.60 | $ | 11.14 | $ | 11.21 | |||||||||||||||
| Income (Loss) from Investment Operations: | |||||||||||||||||||||||||||
| Net Investment Income† | 0.18 | 0.31 | 0.31 | 0.30 | 0.53 | 0.51 | |||||||||||||||||||||
| Net Realized and Unrealized Gain (Loss) | 0.22 | 0.08 | 0.49 | 0.38 | (1.57 | ) | 0.00 | ‡ | |||||||||||||||||||
| Total from Investment Operations | 0.40 | 0.39 | 0.80 | 0.68 | (1.04 | ) | 0.51 | ||||||||||||||||||||
| Distributions from and/or in Excess of: | |||||||||||||||||||||||||||
| Net Investment Income | (0.20 | ) | (0.28 | ) | (0.38 | ) | (0.54 | ) | (0.50 | ) | (0.58 | ) | |||||||||||||||
| Redemption Fees | — | — | — | 0.00 | ‡ | 0.00 | ‡ | 0.00 | ‡ | ||||||||||||||||||
| Net Asset Value, End of Period | $ | 10.47 | $ | 10.27 | $ | 10.16 | $ | 9.74 | $ | 9.60 | $ | 11.14 | |||||||||||||||
| Total Return++ | 3.98 | %# | 3.99 | % | 8.50 | % | 7.44 | % | (9.60 | )% | 4.56 | % | |||||||||||||||
| Ratios and Supplemental Data: | |||||||||||||||||||||||||||
| Net Assets, End of Period (Thousands) | $ | 626 | $ | 408 | $ | 590 | $ | 611 | $ | 842 | $ | 1,177 | |||||||||||||||
| Ratio of Expenses to Average Net Assets (1) | 0.91 | %*+†† | 0.95 | %+†† | 0.91 | %+†† | 0.69 | %+ | 0.67 | %+ | 0.65 | %+ | |||||||||||||||
| Ratio of Net Investment Income to Average Net Assets (1) | 3.55 | %*+†† | 3.12 | %+†† | 3.21 | %+†† | 3.19 | %+ | 5.01 | %+ | 4.59 | %+ | |||||||||||||||
| Ratio of Rebate from Morgan Stanley Affiliates to Average Net Assets | 0.01 | %* | 0.00 | %§ | 0.00 | %§ | 0.01 | % | 0.01 | % | 0.00 | %§ | |||||||||||||||
| Portfolio Turnover Rate | 91 | %# | 224 | % | 277 | % | 545 | % | 325 | % | 124 | % | |||||||||||||||
| (1) Supplemental Information on the Ratios to Average Net Assets: | |||||||||||||||||||||||||||
| Ratios Before Expense Limitation: | |||||||||||||||||||||||||||
| Expenses to Average Net Assets | 1.01 | %*†† | 1.05 | %†† | 1.01 | %+†† | 0.79 | %+ | 0.77 | %+ | 0.75 | %+ | |||||||||||||||
| Net Investment Income to Average Net Assets | 3.45 | %*†† | 3.02 | %†† | 3.11 | %+†† | 3.09 | %+ | 4.91 | %+ | 4.49 | %+ | |||||||||||||||
† Per share amount is based on average shares outstanding.
‡ Amount is less than $0.005 per share.
++ Calculated based on the net asset value as of the last business day of the period.
# Not Annualized.
* Annualized.
+ The Ratios of Expenses and Net Investment Income reflect the rebate of certain Portfolio expenses in connection with the investments in Morgan Stanley affiliates during the period. The effect of the rebate on the ratios is disclosed in the above table as "Ratio of Rebate from Morgan Stanley Affiliates to Average Net Assets."
†† Reflects overall Portfolio ratios for investment income and non-class specific expenses.
§ Amount is less than 0.005%.
The accompanying notes are an integral part of the financial statements.
74
2012 Semi-Annual Report
March 31, 2012
Financial Highlights
Corporate Bond Portfolio
| Class H | |||||||||||||||||||||||
| Six Months Ended March 31, 2012 | Year Ended September 30, | Period from January 2, 2008^ to | |||||||||||||||||||||
| Selected Per Share Data and Ratios | (unaudited) | 2011 | 2010 | 2009 | September 30, 2008 | ||||||||||||||||||
| Net Asset Value, Beginning of Period | $ | 10.27 | $ | 10.16 | $ | 9.74 | $ | 9.53 | $ | 11.15 | |||||||||||||
| Income (Loss) from Investment Operations: | |||||||||||||||||||||||
| Net Investment Income† | 0.18 | 0.31 | 0.31 | 0.28 | 0.21 | ||||||||||||||||||
| Net Realized and Unrealized Gain (Loss) | 0.22 | 0.07 | 0.48 | 0.39 | (1.68 | ) | |||||||||||||||||
| Total from Investment Operations | 0.40 | 0.38 | 0.79 | 0.67 | (1.47 | ) | |||||||||||||||||
| Distributions from and/or in Excess of: | |||||||||||||||||||||||
| Net Investment Income | (0.20 | ) | (0.27 | ) | (0.37 | ) | (0.46 | ) | (0.15 | ) | |||||||||||||
| Redemption Fees | — | — | — | 0.00 | ‡ | — | |||||||||||||||||
| Net Asset Value, End of Period | $ | 10.47 | $ | 10.27 | $ | 10.16 | $ | 9.74 | $ | 9.53 | |||||||||||||
| Total Return++ | 3.92 | %# | 3.89 | % | 8.39 | % | 7.21 | % | (13.21 | )%# | |||||||||||||
| Ratios and Supplemental Data: | |||||||||||||||||||||||
| Net Assets, End of Period (Thousands) | $ | 170 | $ | 473 | $ | 170 | $ | 162 | $ | 85 | |||||||||||||
| Ratio of Expenses to Average Net Assets | 1.01 | %*+†† | 1.05 | %+†† | 1.01 | %+†† | 0.81 | %+ | 2.98 | %*+ | |||||||||||||
| Ratio of Net Investment Income to Average Net Assets | 3.45 | %*+†† | 3.02 | %+†† | 3.11 | %+†† | 2.94 | %+ | 2.71 | %*+ | |||||||||||||
| Rebate from Morgan Stanley Affiliates to Average Net Assets | 0.01 | %* | 0.00 | %§ | 0.00 | %§ | 0.01 | % | 0.01 | %* | |||||||||||||
| Portfolio Turnover Rate | 91 | %# | 224 | % | 277 | % | 545 | % | 325 | %# | |||||||||||||
^ Commencement of Operations.
† Per share amount is based on average shares outstanding.
‡ Amount is less than $0.005 per share.
++ Calculated based on the net asset value which does not reflect sales charges, if applicable, as of the last business day of the period.
# Not Annualized.
* Annualized.
+ The Ratios of Expenses and Net Investment Income reflect the rebate of certain Portfolio expenses in connection with the investments in Morgan Stanley affiliates during the period. The effect of the rebate on the ratios is disclosed in the above table as "Ratio of Rebate from Morgan Stanley Affiliates to Average Net Assets."
†† Reflects overall Portfolio ratios for investment income and non-class specific expenses.
§ Amount is less than 0.005%.
The accompanying notes are an integral part of the financial statements.
75
2012 Semi-Annual Report
March 31, 2012
Financial Highlights
Corporate Bond Portfolio
| Class L | |||||||||||||||||||||||
| Six Months Ended March 31, 2012 | Year Ended September 30, | Period from June 16, 2008^ to | |||||||||||||||||||||
| Selected Per Share Data and Ratios | (unaudited) | 2011 | 2010 | 2009 | September 30, 2008 | ||||||||||||||||||
| Net Asset Value, Beginning of Period | $ | 10.26 | $ | 10.15 | $ | 9.74 | $ | 9.63 | $ | 10.12 | |||||||||||||
| Income (Loss) from Investment Operations: | |||||||||||||||||||||||
| Net Investment Income† | 0.16 | 0.28 | 0.28 | 0.24 | 0.12 | ||||||||||||||||||
| Net Realized and Unrealized Gain (Loss) | 0.22 | 0.08 | 0.48 | 0.41 | (0.60 | ) | |||||||||||||||||
| Total from Investment Operations | 0.38 | 0.36 | 0.76 | 0.65 | (0.48 | ) | |||||||||||||||||
| Distributions from and/or in Excess of: | |||||||||||||||||||||||
| Net Investment Income | (0.18 | ) | (0.25 | ) | (0.35 | ) | (0.54 | ) | (0.01 | ) | |||||||||||||
| Redemption Fees | — | — | — | 0.00 | ‡ | — | |||||||||||||||||
| Net Asset Value, End of Period | $ | 10.46 | $ | 10.26 | $ | 10.15 | $ | 9.74 | $ | 9.63 | |||||||||||||
| Total Return++ | 3.80 | %# | 3.51 | % | 8.15 | % | 7.08 | % | (4.73 | )%# | |||||||||||||
| Ratios and Supplemental Data: | |||||||||||||||||||||||
| Net Assets, End of Period (Thousands) | $ | 3,938 | $ | 4,080 | $ | 5,508 | $ | 5,159 | $ | 58 | |||||||||||||
| Ratio of Expenses to Average Net Assets | 1.26 | %*+†† | 1.30 | %+†† | 1.26 | %+†† | 1.06 | %+ | 1.15 | %*+ | |||||||||||||
| Ratio of Net Investment Income to Average Net Assets | 3.20 | %*+†† | 2.77 | %+†† | 2.86 | %+†† | 2.58 | %+ | 4.34 | %*+ | |||||||||||||
| Ratio of Rebate from Morgan Stanley Affiliates to Average Net Assets | 0.01 | %* | 0.00 | %§ | 0.00 | %§ | 0.01 | % | 0.01 | %* | |||||||||||||
| Portfolio Turnover Rate | 91 | %# | 224 | % | 277 | % | 545 | % | 325 | %# | |||||||||||||
^ Commencement of Operations.
† Per share amount is based on average shares outstanding.
‡ Amount is less than $0.005 per share.
++ Calculated based on the net asset value as of the last business day of the period.
# Not Annualized.
* Annualized.
+ The Ratios of Expenses and Net Investment Income reflect the rebate of certain Portfolio expenses in connection with the investments in Morgan Stanley affiliates during the period. The effect of the rebate on the ratios is disclosed in the above table as "Ratio of Rebate from Morgan Stanley Affiliates to Average Net Assets."
†† Reflects overall Portfolio ratios for investment income and non-class specific expenses.
§ Amount is less than 0.005%.
The accompanying notes are an integral part of the financial statements.
76
2012 Semi-Annual Report
March 31, 2012
Financial Highlights
High Yield Portfolio
| Class I | |||||||
| Selected Per Share Data and Ratios | Period from February 7, 2012^ to March 31, 2012 (unaudited) | ||||||
| Net Asset Value, Beginning of Period | $ | 10.00 | |||||
| Income (Loss) from Investment Operations: | |||||||
| Net Investment Income† | 0.10 | ||||||
| Net Realized and Unrealized Gain | 0.13 | ||||||
| Total from Investment Operations | 0.23 | ||||||
| Net Asset Value, End of Period | $ | 10.23 | |||||
| Total Return++ | 2.30 | %# | |||||
| Ratios and Supplemental Data:†† | |||||||
| Net Assets, End of Period (Thousands) | $ | 9,927 | |||||
| Ratio of Expenses to Average Net Assets (1) | 0.73 | %*+ | |||||
| Ratio of Net Investment Income to Average Net Assets (1) | 6.80 | %*+ | |||||
| Ratio of Rebate from Morgan Stanley Affiliates to Average Net Assets | 0.02 | %* | |||||
| Portfolio Turnover Rate | 51 | %# | |||||
| (1) Supplemental Information on the Ratios to Average Net Assets:†† | |||||||
| Ratios Before Expense Limitation: | |||||||
| Expenses to Average Net Assets | 2.85 | %* | |||||
| Net Investment Income to Average Net Assets | 4.68 | %* | |||||
^ Commencement of Operations.
† Per share amount is based on average shares outstanding.
++ Calculated based on the net asset value as of the last business day of the period.
# Not Annualized.
* Annualized.
+ The Ratios of Expenses and Net Investment Income reflect the rebate of certain Portfolio expenses in connection with the investments in Morgan Stanley affiliates during the period. The effect of the rebate on the ratios is disclosed in the above table as "Ratio of Rebate from Morgan Stanley Affiliates to Average Net Assets."
†† Reflects overall Portfolio ratios for investment income and non-class specific expenses.
The accompanying notes are an integral part of the financial statements.
77
2012 Semi-Annual Report
March 31, 2012
Financial Highlights
High Yield Portfolio
| Class P | |||||||
| Selected Per Share Data and Ratios | Period from February 7, 2012^ to March 31, 2012 (unaudited) | ||||||
| Net Asset Value, Beginning of Period | $ | 10.00 | |||||
| Income (Loss) from Investment Operations: | |||||||
| Net Investment Income† | 0.09 | ||||||
| Net Realized and Unrealized Gain | 0.14 | ||||||
| Total from Investment Operations | 0.23 | ||||||
| Net Asset Value, End of Period | $ | 10.23 | |||||
| Total Return++ | 2.30 | %# | |||||
| Ratios and Supplemental Data:†† | |||||||
| Net Assets, End of Period (Thousands) | $ | 102 | |||||
| Ratio of Expenses to Average Net Assets (1) | 0.98 | %*+ | |||||
| Ratio of Net Investment Income to Average Net Assets (1) | 6.55 | %*+ | |||||
| Ratio of Rebate from Morgan Stanley Affiliates to Average Net Assets | 0.02 | %* | |||||
| Portfolio Turnover Rate | 51 | %# | |||||
| (1) Supplemental Information on the Ratios to Average Net Assets:†† | |||||||
| Ratios Before Expense Limitation: | |||||||
| Expenses to Average Net Assets | 3.10 | %* | |||||
| Net Investment Income to Average Net Assets | 4.43 | %* | |||||
^ Commencement of Operations.
† Per share amount is based on average shares outstanding.
++ Calculated based on the net asset value as of the last business day of the period.
# Not Annualized.
* Annualized.
+ The Ratios of Expenses and Net Investment Income reflect the rebate of certain Portfolio expenses in connection with the investments in Morgan Stanley affiliates during the period. The effect of the rebate on the ratios is disclosed in the above table as "Ratio of Rebate from Morgan Stanley Affiliates to Average Net Assets."
†† Reflects overall Portfolio ratios for investment income and non-class specific expenses.
The accompanying notes are an integral part of the financial statements.
78
2012 Semi-Annual Report
March 31, 2012
Financial Highlights
High Yield Portfolio
| Class H | |||||||
| Selected Per Share Data and Ratios | Period from February 7, 2012^ to March 31, 2012 (unaudited) | ||||||
| Net Asset Value, Beginning of Period | $ | 10.00 | |||||
| Income (Loss) from Investment Operations: | |||||||
| Net Investment Income† | 0.09 | ||||||
| Net Realized and Unrealized Gain | 0.14 | ||||||
| Total from Investment Operations | 0.23 | ||||||
| Net Asset Value, End of Period | $ | 10.23 | |||||
| Total Return++ | 2.30 | %# | |||||
| Ratios and Supplemental Data:†† | |||||||
| Net Assets, End of Period (Thousands) | $ | 102 | |||||
| Ratio of Expenses to Average Net Assets (1) | 0.98 | %*+ | |||||
| Ratio of Net Investment Income to Average Net Assets (1) | 6.55 | %*+ | |||||
| Rebate from Morgan Stanley Affiliates to Average Net Assets | 0.02 | %* | |||||
| Portfolio Turnover Rate | 51 | %# | |||||
| (1) Supplemental Information on the Ratios to Average Net Assets:†† | |||||||
| Ratios Before Expense Limitation: | |||||||
| Expense to Average Net Assets | 3.10 | %* | |||||
| Net Investment Income to Average Net Assets | 4.43 | %* | |||||
^ Commencement of Operations.
† Per share amount is based on average shares outstanding.
++ Calculated based on the net asset value which does not reflect sales charges, if applicable, as of the last business day of the period.
# Not Annualized.
* Annualized.
+ The Ratios of Expenses and Net Investment Income reflect the rebate of certain Portfolio expenses in connection with the investments in Morgan Stanley affiliates during the period. The effect of the rebate on the ratios is disclosed in the above table as "Ratio of Rebate from Morgan Stanley Affiliates to Average Net Assets."
†† Reflects overall Portfolio ratios for investment income and non-class specific expenses.
The accompanying notes are an integral part of the financial statements.
79
2012 Semi-Annual Report
March 31, 2012
Financial Highlights
High Yield Portfolio
| Class L | |||||||
| Selected Per Share Data and Ratios | Period from February 7, 2012^ to March 31, 2012 (unaudited) | ||||||
| Net Asset Value, Beginning of Period | $ | 10.00 | |||||
| Income (Loss) from Investment Operations: | |||||||
| Net Investment Income† | 0.09 | ||||||
| Net Realized and Unrealized Gain | 0.14 | ||||||
| Total from Investment Operations | 0.23 | ||||||
| Net Asset Value, End of Period | $ | 10.23 | |||||
| Total Return++ | 2.30 | %# | |||||
| Ratios and Supplemental Data:†† | |||||||
| Net Assets, End of Period (Thousands) | $ | 102 | |||||
| Ratio of Expenses to Average Net Assets (1) | 1.23 | %*+ | |||||
| Ratio of Net Investment Income to Average Net Assets (1) | 6.30 | %*+ | |||||
| Ratio of Rebate from Morgan Stanley Affiliates to Average Net Assets | 0.02 | %* | |||||
| Portfolio Turnover Rate | 51 | %# | |||||
| (1) Supplemental Information on the Ratios to Average Net Assets:†† | |||||||
| Ratios Before Expense Limitation: | |||||||
| Expenses to Average Net Assets | 3.35 | %* | |||||
| Net Investment Income to Average Net Assets | 4.18 | %* | |||||
^ Commencement of Operations.
† Per share amount is based on average shares outstanding.
++ Calculated based on the net asset value as of the last business day of the period.
# Not Annualized.
* Annualized.
+ The Ratios of Expenses and Net Investment Income reflect the rebate of certain Portfolio expenses in connection with the investments in Morgan Stanley affiliates during the period. The effect of the rebate on the ratios is disclosed in the above table as "Ratio of Rebate from Morgan Stanley Affiliates to Average Net Assets."
†† Reflects overall Portfolio ratios for investment income and non-class specific expenses.
The accompanying notes are an integral part of the financial statements.
80
2012 Semi-Annual Report
March 31, 2012
Financial Highlights
Limited Duration Portfolio
| Class I | |||||||||||||||||||||||||||
| Six Months Ended March 31, 2012 | Year Ended September 30, | ||||||||||||||||||||||||||
| Selected Per Share Data and Ratios | (unaudited) | 2011 | 2010 | 2009 | 2008 | 2007 | |||||||||||||||||||||
| Net Asset Value, Beginning of Period | $ | 7.71 | $ | 7.79 | $ | 7.68 | $ | 8.00 | $ | 10.24 | $ | 10.34 | |||||||||||||||
| Income (Loss) from Investment Operations: | |||||||||||||||||||||||||||
| Net Investment Income† | 0.08 | 0.16 | 0.18 | 0.24 | 0.49 | 0.51 | |||||||||||||||||||||
| Net Realized and Unrealized Gain (Loss) | 0.07 | (0.10 | ) | 0.10 | (0.12 | ) | (2.22 | ) | (0.08 | ) | |||||||||||||||||
| Total from Investment Operations | 0.15 | 0.06 | 0.28 | 0.12 | (1.73 | ) | 0.43 | ||||||||||||||||||||
| Distributions from and/or in Excess of: | |||||||||||||||||||||||||||
| Net Investment Income | (0.10 | ) | (0.14 | ) | (0.16 | ) | (0.44 | ) | (0.51 | ) | (0.53 | ) | |||||||||||||||
| Paid-in-Capital | — | — | (0.01 | ) | — | — | — | ||||||||||||||||||||
| Total Distributions | (0.10 | ) | (0.14 | ) | (0.17 | ) | (0.44 | ) | (0.51 | ) | (0.53 | ) | |||||||||||||||
| Redemption Fees | — | — | — | 0.00 | ‡ | — | 0.00 | ‡ | |||||||||||||||||||
| Net Asset Value, End of Period | $ | 7.76 | $ | 7.71 | $ | 7.79 | $ | 7.68 | $ | 8.00 | $ | 10.24 | |||||||||||||||
| Total Return++ | 1.90 | %# | 0.71 | % | 3.74 | % | 1.77 | % | (17.57 | )% | 4.26 | % | |||||||||||||||
| Ratios and Supplemental Data: | |||||||||||||||||||||||||||
| Net Assets, End of Period (Thousands) | $ | 156,123 | $ | 167,811 | $ | 208,608 | $ | 262,794 | $ | 568,156 | $ | 1,058,151 | |||||||||||||||
| Ratio of Expenses to Average Net Assets (1) | 0.57 | %*+†† | 0.59 | %+†† | 0.55 | %+†† | 0.45 | %+ | 0.43 | %+ | 0.45 | %+ | |||||||||||||||
| Ratio of Net Investment Income to Average Net Assets (1) | 2.07 | %*+†† | 2.12 | %+†† | 2.39 | %+†† | 3.16 | %+ | 5.22 | %+ | 4.94 | %+ | |||||||||||||||
| Ratio of Rebate from Morgan Stanley Affiliates to Average Net Assets | 0.00 | %*§ | 0.00 | %§ | 0.00 | %§ | 0.00 | %§ | 0.01 | % | 0.00 | %§ | |||||||||||||||
| Portfolio Turnover Rate | 17 | %# | 35 | % | 95 | % | 110 | % | 20 | % | 56 | % | |||||||||||||||
| (1) Supplemental Information on the Ratios to Average Net Assets: | |||||||||||||||||||||||||||
| Ratios Before Expense Limitation: | |||||||||||||||||||||||||||
| Expenses to Average Net Assets | N/A | N/A | N/A | N/A | 0.43 | %+ | N/A | ||||||||||||||||||||
| Net Investment Income to Average Net Assets | N/A | N/A | N/A | N/A | 5.22 | %+ | N/A | ||||||||||||||||||||
† Per share amount is based on average shares outstanding.
‡ Amount is less than $0.005 per share.
++ Calculated based on the net asset value as of the last business day of the period.
# Not Annualized.
* Annualized.
+ The Ratios of Expenses and Net Investment Income reflect the rebate of certain Portfolio expenses in connection with the investments in Morgan Stanley affiliates during the period. The effect of the rebate on the ratios is disclosed in the above table as "Ratio of Rebate from Morgan Stanley Affiliates to Average Net Assets."
†† Reflects overall Portfolio ratios for investment income and non-class specific expenses.
§ Amount is less than 0.005%.
The accompanying notes are an integral part of the financial statements.
81
2012 Semi-Annual Report
March 31, 2012
Financial Highlights
Limited Duration Portfolio
| Class P | |||||||||||||||||||||||||||
| Six Months Ended March 31, 2012 | Year Ended September 30, | Period from September 28, 2007^ to | |||||||||||||||||||||||||
| Selected Per Share Data and Ratios | (unaudited) | 2011 | 2010 | 2009 | 2008 | September 30, 2007 | |||||||||||||||||||||
| Net Asset Value, Beginning of Period | $ | 7.71 | $ | 7.79 | $ | 7.68 | $ | 8.00 | $ | 10.24 | $ | 10.24 | |||||||||||||||
| Income (Loss) from Investment Operations: | |||||||||||||||||||||||||||
| Net Investment Income† | 0.07 | 0.15 | 0.17 | 0.22 | 0.47 | 0.00 | ‡ | ||||||||||||||||||||
| Net Realized and Unrealized Gain (Loss) | 0.07 | (0.12 | ) | 0.09 | (0.12 | ) | (2.23 | ) | (0.00 | )‡ | |||||||||||||||||
| Total from Investment Operations | 0.14 | 0.03 | 0.26 | 0.10 | (1.76 | ) | 0.00 | ‡ | |||||||||||||||||||
| Distributions from and/or in Excess of: | |||||||||||||||||||||||||||
| Net Investment Income | (0.09 | ) | (0.11 | ) | (0.15 | ) | (0.42 | ) | (0.48 | ) | — | ||||||||||||||||
| Paid-in-Capital | — | — | (0.00 | )‡ | — | — | — | ||||||||||||||||||||
| Total Distributions | (0.09 | ) | (0.11 | ) | (0.15 | ) | (0.42 | ) | (0.48 | ) | — | ||||||||||||||||
| Redemption Fees | — | — | — | 0.00 | ‡ | — | 0.00 | ‡ | |||||||||||||||||||
| Net Asset Value, End of Period | $ | 7.76 | $ | 7.71 | $ | 7.79 | $ | 7.68 | $ | 8.00 | $ | 10.24 | |||||||||||||||
| Total Return++ | 1.77 | %# | 0.45 | % | 3.48 | % | 1.52 | % | (17.77 | )% | — | ||||||||||||||||
| Ratios and Supplemental Data: | |||||||||||||||||||||||||||
| Net Assets, End of Period (Thousands) | $ | 125 | $ | 194 | $ | 52 | $ | 169 | $ | 294 | $ | 1,020 | |||||||||||||||
| Ratio of Expenses to Average Net Assets | 0.82 | %*+†† | 0.84 | %+†† | 0.80 | %+†† | 0.70 | %+ | 0.68 | %+ | 0.59 | %*+ | |||||||||||||||
| Ratio of Net Investment Income to Average Net Assets | 1.82 | %*+†† | 1.87 | %+†† | 2.14 | %+†† | 2.87 | %+ | 4.95 | %+ | 5.38 | %*+ | |||||||||||||||
| Ratio of Rebate from Morgan Stanley Affiliates to Average Net Assets | 0.00 | %*§ | 0.00 | %§ | 0.00 | %§ | 0.00 | %§ | 0.01 | % | 0.06 | %* | |||||||||||||||
| Portfolio Turnover Rate | 17 | %# | 35 | % | 95 | % | 110 | % | 20 | % | 56 | %# | |||||||||||||||
^ Commencement of Operations.
† Per share amount is based on average shares outstanding.
‡ Amount is less than $0.005 per share.
++ Calculated based on the net asset value as of the last business day of the period.
# Not Annualized.
* Annualized.
+ The Ratios of Expenses and Net Investment Income reflect the rebate of certain Portfolio expenses in connection with the investments in Morgan Stanley affiliates during the period. The effect of the rebate on the ratios is disclosed in the above table as "Ratio of Rebate from Morgan Stanley Affiliates to Average Net Assets."
†† Reflects overall Portfolio ratios for investment income and non-class specific expenses.
§ Amount is less than 0.005%.
The accompanying notes are an integral part of the financial statements.
82
2012 Semi-Annual Report
March 31, 2012
Financial Highlights
Long Duration Fixed Income Portfolio
| Class I | |||||||||||||||||||||||||||
| Six Months Ended March 31, 2012 | Year Ended September 30, | ||||||||||||||||||||||||||
| Selected Per Share Data and Ratios | (unaudited) | 2011 | 2010 | 2009 | 2008 | 2007 | |||||||||||||||||||||
| Net Asset Value, Beginning of Period | $ | 11.89 | $ | 11.73 | $ | 11.52 | $ | 9.93 | $ | 10.33 | $ | 10.48 | |||||||||||||||
| Income (Loss) from Investment Operations: | |||||||||||||||||||||||||||
| Net Investment Income† | 0.24 | 0.50 | 0.55 | 0.49 | 0.46 | 0.49 | |||||||||||||||||||||
| Net Realized and Unrealized Gain (Loss) | (0.12 | ) | 0.66 | 0.80 | 1.66 | (0.37 | ) | (0.18 | ) | ||||||||||||||||||
| Total from Investment Operations | 0.12 | 1.16 | 1.35 | 2.15 | 0.09 | 0.31 | |||||||||||||||||||||
| Distributions from and/or in Excess of: | |||||||||||||||||||||||||||
| Net Investment Income | (0.25 | ) | (0.46 | ) | (0.55 | ) | (0.56 | ) | (0.49 | ) | (0.43 | ) | |||||||||||||||
| Net Realized Gain | (0.18 | ) | (0.54 | ) | (0.59 | ) | — | — | (0.03 | ) | |||||||||||||||||
| Total Distributions | (0.43 | ) | (1.00 | ) | (1.14 | ) | (0.56 | ) | (0.49 | ) | (0.46 | ) | |||||||||||||||
| Net Asset Value, End of Period | $ | 11.58 | $ | 11.89 | $ | 11.73 | $ | 11.52 | $ | 9.93 | $ | 10.33 | |||||||||||||||
| Total Return++ | 1.00 | %# | 11.40 | % | 13.09 | % | 22.19 | % | 0.87 | % | 3.06 | % | |||||||||||||||
| Ratios and Supplemental Data: | |||||||||||||||||||||||||||
| Net Assets, End of Period (Thousands) | $ | 23,561 | $ | 23,660 | $ | 32,354 | $ | 31,410 | $ | 27,438 | $ | 25,297 | |||||||||||||||
| Ratio of Expenses to Average Net Assets (1) | 0.50 | %*+†† | 0.50 | %+†† | 0.50 | %+†† | 0.50 | %+ | 0.49 | %+ | 0.50 | %+ | |||||||||||||||
| Ratio of Net Investment Income to Average Net Assets (1) | 4.12 | %*+†† | 4.69 | %+†† | 4.98 | %+†† | 4.68 | %+ | 4.44 | %+ | 4.73 | %+ | |||||||||||||||
| Ratio of Rebate from Morgan Stanley Affiliates to Average Net Assets | 0.00 | %*§ | 0.00 | %§ | 0.00 | %§ | 0.00 | %§ | 0.01 | % | 0.00 | %§ | |||||||||||||||
| Portfolio Turnover Rate | 18 | %# | 59 | % | 90 | % | 80 | % | 63 | % | 49 | % | |||||||||||||||
| (1) Supplemental Information on the Ratios to Average Net Assets: | |||||||||||||||||||||||||||
| Ratios Before Expense Limitation: | |||||||||||||||||||||||||||
| Expenses to Average Net Assets | 1.05 | %*†† | 1.12 | %†† | 0.79 | %+†† | 0.80 | %+ | 0.75 | %+ | 0.94 | %+ | |||||||||||||||
| Net Investment Income to Average Net Assets | 3.57 | %*†† | 4.07 | %†† | 4.69 | %+†† | 4.38 | %+ | 4.18 | %+ | 4.29 | %+ | |||||||||||||||
† Per share amount is based on average shares outstanding.
++ Calculated based on the net asset value as of the last business day of the period.
# Not Annualized.
* Annualized.
+ The Ratios of Expenses and Net Investment Income reflect the rebate of certain Portfolio expenses in connection with the investments in Morgan Stanley affiliates during the period. The effect of the rebate on the ratios is disclosed in the above table as "Ratio of Rebate from Morgan Stanley Affiliates to Average Net Assets."
†† Reflects overall Portfolio ratios for investment income and non-class specific expenses.
§ Amount is less than 0.005%.
The accompanying notes are an integral part of the financial statements.
83
2012 Semi-Annual Report
March 31, 2012
Financial Highlights
Long Duration Fixed Income Portfolio
| Class P | |||||||||||||||||||||||||||
| Six Months Ended March 31, 2012 | Year Ended September 30, | ||||||||||||||||||||||||||
| Selected Per Share Data and Ratios | (unaudited) | 2011 | 2010 | 2009 | 2008 | 2007 | |||||||||||||||||||||
| Net Asset Value, Beginning of Period | $ | 11.88 | $ | 11.72 | $ | 11.51 | $ | 9.92 | $ | 10.32 | $ | 10.48 | |||||||||||||||
| Income (Loss) from Investment Operations: | |||||||||||||||||||||||||||
| Net Investment Income† | 0.23 | 0.48 | 0.51 | 0.46 | 0.44 | 0.46 | |||||||||||||||||||||
| Net Realized and Unrealized Gain (Loss) | (0.13 | ) | 0.65 | 0.82 | 1.67 | (0.37 | ) | (0.19 | ) | ||||||||||||||||||
| Total from Investment Operations | 0.10 | 1.13 | 1.33 | 2.13 | 0.07 | 0.27 | |||||||||||||||||||||
| Distributions from and/or in Excess of: | |||||||||||||||||||||||||||
| Net Investment Income | (0.24 | ) | (0.43 | ) | (0.53 | ) | (0.54 | ) | (0.47 | ) | (0.40 | ) | |||||||||||||||
| Net Realized Gain | (0.18 | ) | (0.54 | ) | (0.59 | ) | — | — | (0.03 | ) | |||||||||||||||||
| Total Distributions | (0.42 | ) | (0.97 | ) | (1.12 | ) | (0.54 | ) | (0.47 | ) | (0.43 | ) | |||||||||||||||
| Net Asset Value, End of Period | $ | 11.56 | $ | 11.88 | $ | 11.72 | $ | 11.51 | $ | 9.92 | $ | 10.32 | |||||||||||||||
| Total Return++ | 0.79 | %# | 11.13 | % | 12.81 | % | 21.91 | % | 0.61 | % | 2.72 | % | |||||||||||||||
| Ratios and Supplemental Data: | |||||||||||||||||||||||||||
| Net Assets, End of Period (Thousands) | $ | 578 | $ | 594 | $ | 586 | $ | 575 | $ | 496 | $ | 516 | |||||||||||||||
| Ratio of Expenses to Average Net Assets (1) | 0.75 | %*+†† | 0.75 | %+†† | 0.75 | %+†† | 0.75 | %+ | 0.74 | %+ | 0.75 | %+ | |||||||||||||||
| Ratio of Net Investment Income to Average Net Assets (1) | 3.87 | %*+†† | 4.44 | %+†† | 4.73 | %+†† | 4.43 | %+ | 4.18 | %+ | 4.48 | %+ | |||||||||||||||
| Ratio of Rebate from Morgan Stanley Affiliates to Average Net Assets | 0.00 | %*§ | 0.00 | %§ | 0.00 | %§ | 0.00 | %§ | 0.01 | % | 0.00 | %§ | |||||||||||||||
| Portfolio Turnover Rate | 18 | %# | 59 | % | 90 | % | 80 | % | 63 | % | 49 | % | |||||||||||||||
| (1) Supplemental Information on the Ratios to Average Net Assets: | |||||||||||||||||||||||||||
| Ratios Before Expense Limitation: | |||||||||||||||||||||||||||
| Expenses to Average Net Assets | 1.30 | %*†† | 1.37 | %†† | 1.04 | %+†† | 1.05 | %+ | 1.00 | %+ | 1.19 | %+ | |||||||||||||||
| Net Investment Income to Average Net Assets | 3.32 | %*†† | 3.82 | %†† | 4.44 | %+†† | 4.13 | %+ | 3.92 | %+ | 4.04 | %+ | |||||||||||||||
† Per share amount is based on average shares outstanding.
++ Calculated based on the net asset value as of the last business day of the period.
# Not Annualized.
* Annualized.
+ The Ratios of Expenses and Net Investment Income reflect the rebate of certain Portfolio expenses in connection with the investments in Morgan Stanley affiliates during the period. The effect of the rebate on the ratios is disclosed in the above table as "Ratio of Rebate from Morgan Stanley Affiliates to Average Net Assets."
†† Reflects overall Portfolio ratios for investment income and non-class specific expenses.
§ Amount is less than 0.005%.
The accompanying notes are an integral part of the financial statements.
84
2012 Semi-Annual Report
March 31, 2012 (unaudited)
Notes to Financial Statements
Morgan Stanley Institutional Fund Trust ("MSIFT" or the "Fund") is registered under the Investment Company Act of 1940, as amended (the "Act"), as an open-end management investment company. The Fund is comprised of eight separate, active portfolios (individually referred to as a "Portfolio", collectively as the "Portfolios"). All Portfolios are considered diversified for purposes of the Act.
The Fund offers up to four different classes of shares for certain Portfolios — Class I shares, Class P shares, Class H shares and Class L shares. Each class of shares has identical voting rights (except shareholders of each Class have exclusive voting rights regarding any matter relating solely to that particular Class of shares), dividend, liquidation and other rights, except each class bears different distribution and shareholder service fees as described in Note D.
The Fund has suspended offering shares of the Mid Cap Growth Portfolio to new investors. The Fund will continue to offer shares of the Portfolio to existing shareholders. The Fund may recommence offering shares of the Portfolio to new investors in the future.
A. Significant Accounting Policies: The following significant accounting policies are in conformity with U.S. generally accepted accounting principles ("GAAP"). Such policies are consistently followed by the Portfolio in the preparation of its financial statements. GAAP may require management to make estimates and assumptions that affect the reported amounts and disclosures in the financial statements. Actual results may differ from those estimates.
1. Security Valuation: Bonds and other fixed income securities may be valued according to the broadest and most representative market. In addition, bonds and other fixed income securities may be valued on the basis of prices provided by a pricing service. The prices provided by a pricing service take into account broker dealer market price quotations for institutional size trading in similar groups of securities, security quality, maturity, coupon and other security characteristics as well as any developments related to the specific securities. Short-term debt securities purchased with remaining maturities of 60 days or less are valued at amortized cost, unless the Board of Trustees (the "Trustees") determines such valuation does not reflect the securities' market value, in which case these securities will be valued at their fair value as determined in good faith under procedures adopted by the Trustees. Equity securities listed on a U.S. exchange are valued at the latest quoted sales price on the valuation date. Equity securities listed or traded on NASDAQ, for which market quotations are available, are valued at the NASDAQ Official Closing Price. Securities listed on a foreign exchange are valued at their closing price, except as noted below. Unlisted and listed equity securities not traded on the valuation date, for which market quotations are readily available, are valued at the mean between the current bid and asked prices obtained from reputable brokers.
All other securities and investments for which market values are not readily available, including restricted securities, and those securities for which it is inappropriate to determine prices in accordance with the aforementioned procedures, are valued at fair value as determined in good faith under procedures adopted by the Trustees, although the actual calculations may be done by others. Factors considered in making this determination may include, but are not limited to, information obtained by contacting the issuer, analysts, or the appropriate stock exchange (for exchange-traded securities), analysis of the issuer's financial statements or other available documents and, if necessary, available information concerning other securities in similar circumstances.
Most foreign markets close before the New York Stock Exchange ("NYSE"). Occasionally, developments that could affect the closing prices of securities and other assets may occur between the times at which valuations of such securities are determined (that is, close of the foreign market on which the securities trade) and the close of business on the NYSE. If these developments are expected to materially affect the value of the securities, the valuations may be adjusted to reflect the estimated fair value as of the close of the NYSE, as determined in good faith under procedures established by the Trustees.
2. Foreign Currency Translation and Foreign Investments: The books and records of the Portfolios are maintained in U.S. dollars. Foreign currency amounts are translated into U.S. dollars at the bid prices of such currencies against U.S. dollars quoted by a bank. Net realized gains (losses) on foreign currency transactions represent net foreign exchange gains (losses) from foreign currency exchange contracts, disposition of foreign currencies, currency gains (losses) realized between the trade and settlement dates on securities transactions, and the difference between the amount of investment income and foreign withholding taxes recorded on the Portfolio's books and the U.S. dollar equivalent amounts actually received or paid.
Certain Portfolios' net assets include foreign denominated securities and currency. The net assets of these Portfolios are presented at the foreign exchange rates and market values at the close of the period. The Portfolios do not isolate that portion of the results of operations arising as a result of changes in the foreign exchange rates from the fluctuations arising from changes in the market prices of the
85
2012 Semi-Annual Report
March 31, 2012 (unaudited)
Notes to Financial Statements (cont'd)
securities held at period end. Similarly, the Portfolios do not isolate the effect of changes in foreign exchange rates from the fluctuations arising from changes in the market prices of securities sold during the period. Accordingly, the components of realized and unrealized foreign currency gains (losses) representing foreign exchange changes on investments is included in the reported net realized and unrealized gains (losses) on investment transactions and balances. Changes in currency exchange rates will affect the value of and investment income from such securities and currency.
Foreign security and currency transactions may involve certain considerations and risks not typically associated with those of U.S. dollar denominated transactions as a result of, among other factors, fluctuations of exchange rates in relation to the U.S. dollar, the possibility of lower levels of governmental supervision and regulation of foreign securities markets and the possibility of political or economic instability.
3. Derivatives: Certain Portfolios use derivative instruments for a variety of purposes, including hedging, risk management, portfolio management or to earn income. Derivatives are financial instruments whose value is based on the value of another underlying asset, interest rate, index or financial instrument. A derivative instrument often has risks similar to its underlying instrument and may have additional risks, including imperfect correlation between the value of the derivative and the underlying instrument, risks of default by the other party to certain transactions, magnification of losses incurred due to changes in the market value of the securities, instruments, indices or interest rates to which they relate, and risks that the transactions may not be liquid. The use of derivatives involves risks that are different from, and possibly greater than, the risks associated with other portfolio investments. Derivatives may involve the use of highly specialized instruments that require investment techniques and risk analyses different from those associated with other portfolio investments. All of a Portfolio's holdings, including derivative instruments, are marked to market each day with the change in value reflected in unrealized appreciation (depreciation). Upon disposition, a realized gain or loss is recognized.
Certain derivative transactions may give rise to a form of leverage. Leverage associated with derivative transactions may cause the Portfolios to liquidate portfolio positions when it may not be advantageous to do so to satisfy its obligations or to meet earmarking or segregation requirements, pursuant to applicable Securities and Exchange Commission rules and regulations, or may cause the Portfolios to be more volatile than if the Portfolios had not been leveraged. Although the Adviser seeks to use derivatives to further the Portfolios' investment objectives, there is no assurance that the use of derivatives will achieve this result.
Following is a description of the derivative instruments and techniques that certain Portfolios used during the period and their associated risks:
Futures: A futures contract is a standardized agreement between two parties to buy or sell a specific quantity of an underlying instrument at a specific price at a specific future time. The value of a futures contract tends to increase and decrease in tandem with the value of the underlying instrument. Depending on the terms of the particular contract, futures contracts are settled through either physical delivery of the underlying instrument on the settlement date or by payment of a cash settlement amount on the settlement date. During the period the futures contract is open, payments are received from or made to the broker based upon changes in the value of the contract (the variation margin). A decision as to whether, when and how to use futures involves the exercise of skill and judgment and even a well conceived futures transaction may be unsuccessful because of market behavior or unexpected events. In addition to the derivatives risks discussed above, the prices of futures can be highly volatile, using futures can lower total return, and the potential loss from futures can exceed a Portfolio's initial investment in such contracts.
Swaps: An over the counter ("OTC") swap agreement is an agreement between two parties pursuant to which the parties exchange payments at specified dates on the basis of a specified notional amount, with the payments calculated by reference to specified securities, indexes, reference rates, currencies or other instruments. A small percentage of swap agreements are cleared through a central clearing house. Most swap agreements provide that when the period payment dates for both parties are the same, the payments are made on a net basis (i.e., the two payment streams are netted out, with only the net amount paid by one party to the other). The Portfolio's obligations or rights under a swap agreement entered into on a net basis will generally be equal only to the net amount to be paid or received under the agreement, based on the relative values of the positions held by each counterparty. Most swap agreements are not entered into or traded on exchanges and there is no central clearing or guaranty function for swaps. These OTC swaps are often subject to credit risk or the risk of default or non-performance by the counterparty. Swaps could result in losses if interest rate or foreign currency exchange rates or credit quality changes are not correctly anticipated by the Portfolio or if the reference index, security or investments do not perform as expected.
86
2012 Semi-Annual Report
March 31, 2012 (unaudited)
Notes to Financial Statements (cont'd)
When a Portfolio has an unrealized loss on a swap agreement, the Portfolio has instructed the custodian to pledge cash or liquid securities as collateral with a value approximately equal to the amount of the unrealized loss. Collateral pledges are monitored and subsequently adjusted if and when the swap valuations fluctuate. Cash collateral is included with "Due from (to) Broker" on the Statements of Assets and Liabilities. For cash collateral received, a Portfolio pays a monthly fee to the counterparty based on the effective rate for Federal Funds. This fee, when paid, is included within realized gain (loss) on swap agreements on the Statements of Operations.
Upfront payments received or paid by a Portfolio will be reflected as an asset or liability in the Statements of Assets and Liabilities.
Foreign Currency Exchange Contracts: In connection with their investments in foreign securities, certain Portfolios also entered into contracts with banks, brokers or dealers to purchase or sell foreign currencies at a future date. A foreign currency exchange contract ("currency contracts") is a negotiated agreement between the contracting parties to exchange a specified amount of currency at a specified future time at a specified rate. The rate can be higher or lower than the spot rate between the currencies that are the subject of the currency contract. Currency contracts are used to protect against uncertainty in the level of future foreign currency exchange rates or to gain or modify exposure to a particular currency. Hedging a Portfolio's currency risks involves the risk of mismatching a Portfolio's objectives under a currency contract with the value of securities denominated in a particular currency. Furthermore, such transactions reduce or preclude the opportunity for gain if the value of the currency should move in the direction opposite to the position taken. There is an additional risk to the effect that currency contracts create exposure to currencies in which a Portfolio's securities are not denominated. Unanticipated changes in currency prices may result in poorer overall performance for a Portfolio than if it had not entered into such currency contracts. The use of currency contracts involves the risk of loss from the insolvency or bankruptcy of the counterparty to the contract or the failure of the counterparty to make payments or otherwise comply with the terms of the contract. A currency contract is marked-to-market daily and the change in market value is recorded by the Portfolio as unrealized gain or loss. The Portfolio records realized gains (losses) when the currency contract is closed equal to the difference between the value of the currency contract at the time it was opened and the value at the time it was closed.
Financial Accounting Standards Board ("FASB") Accounting Standards CodificationTM ("ASC") 815, "Derivatives and Hedging: Overall" ("ASC 815"), is intended to improve financial reporting about derivative instruments by requiring enhanced disclosures to enable investors to better understand how and why the Portfolios use derivative instruments, how these derivative instruments are accounted for and their effects on the Portfolio's financial position and results of operations.
The following table sets forth the fair value of each Portfolio's derivative contracts by primary risk exposure as of March 31, 2012.
| Primary Risk Exposure | Statements of Assets and Liabilities | Foreign Currency Exchange Contracts (000) | Futures Contracts (000)(a) | Swap Agreements (000) | |||||||||||||||
| Balanced Portfolio: | |||||||||||||||||||
| Currency Risk | Receivables | $ | 29 | $ | — | $ | — | ||||||||||||
| Equity Risk | Receivables | — | 91 | 13 | |||||||||||||||
| Commodity Risk | Receivables | — | 4 | — | |||||||||||||||
| Interest Rate Risk | Receivables | — | 10 | 61 | |||||||||||||||
| Total Receivables | $ | 29 | $ | 105 | $ | 74 | |||||||||||||
| Currency Risk | Payables | 14 | — | — | |||||||||||||||
| Equity Risk | Payables | — | 28 | 3 | |||||||||||||||
| Interest Rate Risk | Payables | — | 3 | 60 | |||||||||||||||
| Total Payables | $ | 14 | $ | 31 | $ | 63 | |||||||||||||
| Core Fixed Income Portfolio: | |||||||||||||||||||
| Interest Rate Risk | Receivables | $ | — | $ | 12 | $ | 246 | ||||||||||||
| Interest Rate Risk | Payables | $ | — | $ | 22 | $ | 455 | ||||||||||||
| Core Plus Fixed Income Portfolio: | |||||||||||||||||||
| Currency Risk | Receivables | $ | 110 | $ | — | $ | — | ||||||||||||
| Interest Rate Risk | Receivables | — | 24 | 973 | |||||||||||||||
| Total Receivables | $ | 110 | $ | 24 | $ | 973 | |||||||||||||
| Currency Risk | Payables | 14 | — | — | |||||||||||||||
| Interest Rate Risk | Payables | — | 91 | 966 | |||||||||||||||
| Total Payables | $ | 14 | $ | 91 | $ | 966 | |||||||||||||
| Corporate Bond Portfolio: | |||||||||||||||||||
| Interest Rate Risk | Receivables | $ | — | $ | 52 | $ | — | ||||||||||||
| Interest Rate Risk | Payables | $ | — | $ | 51 | $ | 13 | ||||||||||||
| Limited Duration Portfolio: | |||||||||||||||||||
| Interest Rate Risk | Receivables | $ | — | $ | 70 | $ | 729 | ||||||||||||
| Interest Rate Risk | Payables | $ | — | $ | 47 | $ | 1,266 | ||||||||||||
| Long Duration Fixed Income Portfolio: | |||||||||||||||||||
| Interest Rate Risk | Receivables | $ | — | $ | 14 | $ | 176 | ||||||||||||
| Interest Rate Risk | Payables | $ | — | $ | 1 | $ | 264 | ||||||||||||
(a) This amount represents the cumulative appreciation (depreciation) of futures contracts as reported in the Portfolio of Investments. The Statements of Assets and Liabilities only reflect the current day net variation margin, receivable/payable to brokers.
87
2012 Semi-Annual Report
March 31, 2012 (unaudited)
Notes to Financial Statements (cont'd)
The following tables set forth by primary risk exposure the Portfolio's realized gains (losses) and change in unrealized appreciation (depreciation) by type of derivative contract for the six months ended March 31, 2012 in accordance with ASC 815.
| Realized Gain (Loss) | |||||||||||||||
| Portfolio | Primary Risk Exposure | Derivative Type | Value (000) | ||||||||||||
| Balanced | Foreign Currency | ||||||||||||||
| Currency Risk | Exchange Contracts | $ | 97 | ||||||||||||
| Equity Risk | Futures Contracts | 1,262 | |||||||||||||
| Commodity Risk | Futures Contracts | (8 | ) | ||||||||||||
| Interest Rate Risk | Futures Contracts | (7 | ) | ||||||||||||
| Equity Risk | Swap Agreements | (177 | ) | ||||||||||||
| Interest Rate Risk | Swap Agreements | (27 | ) | ||||||||||||
| Total | $ | 1,140 | |||||||||||||
| Change in Unrealized Appreciation (Depreciation) | |||||||||||||||
| Portfolio | Primary Risk Exposure | Derivative Type | Value (000) | ||||||||||||
| Balanced | Foreign Currency | ||||||||||||||
| Currency Risk | Exchange Contracts | $ | (113 | ) | |||||||||||
| Equity Risk | Futures Contracts | 118 | |||||||||||||
| Commodity Risk | Futures Contracts | 4 | |||||||||||||
| Interest Rate Risk | Futures Contracts | 24 | |||||||||||||
| Equity Risk | Swap Agreements | 10 | |||||||||||||
| Interest Rate Risk | Swap Agreements | 26 | |||||||||||||
| Total | $ | 69 | |||||||||||||
| Realized Gain (Loss) | |||||||||||||||
| Portfolio | Primary Risk Exposure | Derivative Type | Value (000) | ||||||||||||
| Core Fixed Income | Interest Rate Risk | Futures Contracts | $ | (74 | ) | ||||||||||
| Change in Unrealized Appreciation (Depreciation) | |||||||||||||||
| Portfolio | Primary Risk Exposure | Derivative Type | Value (000) | ||||||||||||
| Core Fixed Income | Interest Rate Risk | Futures Contracts | $ | 61 | |||||||||||
| Interest Rate Risk | Swap Agreements | (3 | ) | ||||||||||||
| Total | $ | 58 | |||||||||||||
| Realized Gain (Loss) | |||||||||||||||
| Portfolio | Primary Risk Exposure | Derivative Type | Value (000) | ||||||||||||
| Core Plus Fixed Income | Foreign Currency | ||||||||||||||
| Currency Risk | Exchange Contracts | $ | 206 | ||||||||||||
| Interest Rate Risk | Futures Contracts | 320 | |||||||||||||
| Interest Rate Risk | Swap Agreements | (575 | ) | ||||||||||||
| Total | $ | (49 | ) | ||||||||||||
| Change in Unrealized Appreciation (Depreciation) | |||||||||||||||
| Portfolio | Primary Risk Exposure | Derivative Type | Value (000) | ||||||||||||
| Core Plus Fixed Income | Foreign Currency | ||||||||||||||
| Currency Risk | Exchange Contracts | $ | 84 | ||||||||||||
| Interest Rate Risk | Futures Contracts | (1 | ) | ||||||||||||
| Interest Rate Risk | Swap Agreements | 476 | |||||||||||||
| Total | $ | 559 | |||||||||||||
| Realized Gain (Loss) | |||||||||||||||
| Portfolio | Primary Risk Exposure | Derivative Type | Value (000) | ||||||||||||
| Corporate Bond | Interest Rate Risk | Futures Contracts | $ | (85 | ) | ||||||||||
| Change in Unrealized Appreciation (Depreciation) | |||||||||||||||
| Portfolio | Primary Risk Exposure | Derivative Type | Value (000) | ||||||||||||
| Corporate Bond | Interest Rate Risk | Futures Contracts | $ | 80 | |||||||||||
| Interest Rate Risk | Swap Agreements | (13 | ) | ||||||||||||
| Total | $ | 67 | |||||||||||||
| Realized Gain (Loss) | |||||||||||||||
| Portfolio | Primary Risk Exposure | Derivative Type | Value (000) | ||||||||||||
| Limited Duration | Interest Rate Risk | Futures Contracts | $ | (110 | ) | ||||||||||
| Change in Unrealized Appreciation (Depreciation) | |||||||||||||||
| Portfolio | Primary Risk Exposure | Derivative Type | Value (000) | ||||||||||||
| Limited Duration | Interest Rate Risk | Futures Contracts | $ | 40 | |||||||||||
| Interest Rate Risk | Swap Agreements | (9 | ) | ||||||||||||
| Total | $ | 31 | |||||||||||||
| Realized Gain (Loss) | |||||||||||||||
| Portfolio | Primary Risk Exposure | Derivative Type | Value (000) | ||||||||||||
| Long Duration Fixed Income | Foreign Currency | ||||||||||||||
| Currency Risk | Exchange Contracts | $ | (4 | ) | |||||||||||
| Interest Rate Risk | Futures Contracts | 15 | |||||||||||||
| Interest Rate Risk | Swap Agreements | (41 | ) | ||||||||||||
| Total | $ | (30 | ) | ||||||||||||
| Change in Unrealized Appreciation (Depreciation) | |||||||||||||||
| Portfolio | Primary Risk Exposure | Derivative Type | Value (000) | ||||||||||||
| Long Duration Fixed Income | �� | Foreign Currency | |||||||||||||
| Currency Risk | Exchange Contracts | $ | 4 | ||||||||||||
| Interest Rate Risk | Futures Contracts | (11 | ) | ||||||||||||
| Interest Rate Risk | Swap Agreements | 29 | |||||||||||||
| Total | $ | 22 | |||||||||||||
For the six months ended March 31, 2012, Balanced and Core Plus Fixed Income Portfolio's average monthly principal amount of foreign currency exchange contracts was approximately $5,993,000 and $14,196,000, average monthly original value of futures contracts was approximately $12,025,000 and $86,207,000, and average monthly notional value of swap agreements was approximately $18,892,000 and $284,485,000, respectively. Core Fixed Income, Corporate Bond, Limited Duration, and Long Duration Fixed Income Portfolio's average monthly original value of futures contracts was approximately $15,066,000, $27,073,000, $43,738,000, and $2,238,000 and average monthly notional value of swap agreements was approximately $3,837,000, $159,000, $11,059,000, and $22,645,000, respectively.
4. When-Issued/Delayed Delivery Securities: Certain Portfolios purchase and sell when-issued and delayed delivery securities. Securities purchased on a when-issued or delayed delivery basis are purchased for delivery beyond the normal settlement date at a stated price and yield, and no income accrues to the Portfolio on such securities prior to delivery date. Payment and delivery for when-issued and delayed delivery securities can take place up to 120 days
88
2012 Semi-Annual Report
March 31, 2012 (unaudited)
Notes to Financial Statements (cont'd)
after the date of the transaction. When the Portfolio enters into a purchase transaction on a when-issued or delayed delivery basis, securities are available for collateral in an amount at least equal in value to the Portfolio's commitments to purchase such securities. Purchasing securities on a when-issued or delayed delivery basis may involve a risk that the market price at the time of delivery may be lower than the agreed upon purchase price, in which case there could be an unrealized loss at the time of delivery. Purchasing investments on a when-issued or delayed delivery basis may be considered a form of leverage which may increase the impact that gains (losses) may have on the Portfolio.
5. Fair Value Measurement: FASB ASC 820, "Fair Value Measurements and Disclosures" ("ASC 820"), defines fair value as the value that the Fund would receive to sell an investment or pay to transfer a liability in a timely transaction with an independent buyer in the principal market, or in the absence of a principal market the most advantageous market for the investment or liability. ASC 820 establishes a three-tier hierarchy to distinguish between (1) inputs that reflect the assumptions market participants would use in valuing an asset or liability developed based on market data obtained from sources independent of the reporting entity (observable inputs) and (2) inputs that reflect the reporting entity's own assumptions about the assumptions market participants would use in valuing an asset or liability developed based on the best information available in the circumstances (unobservable inputs) and to establish classification of fair value measurements for disclosure purposes. Various inputs are used in determining the value of the Fund's investments. The inputs are summarized in the three broad levels listed below.
• Level 1 – unadjusted quoted prices in active markets for identical investments
• Level 2 – other significant observable inputs (including quoted prices for similar investments, interest rates, prepayment speeds, credit risk, etc.)
• Level 3 – significant unobservable inputs including the Fund's own assumptions in determining the fair value of investments. Factors considered in making this determination may include, but are not limited to, information obtained by contacting the issuer, analysts, or the appropriate stock exchange (for exchange-traded securities), analysis of the issuer's financial statements or other available documents and, if necessary, available information concerning other securities in similar circumstances
The inputs or methodology used for valuing securities are not necessarily an indication of the risk associated with investing in those securities and the determination of the significance of a particular input to the fair value measurement in its entirety requires judgment and considers factors specific to each security.
In May 2011, FASB issued Accounting Standards Update ("ASU") 2011-04. The amendments in this update are the results of the work of FASB and the International Accounting Standards Board to develop common requirements for measuring fair value and for disclosing information about fair value measurements, which are effective during interim and annual periods beginning after December 15, 2011. Consequently, these amendments improve the comparability of fair value measurements presented and disclosed in the financial statements prepared in accordance with GAAP and International Financial Reporting Standards. At this time, the Fund's management is evaluating the implications of ASU 2011-04.
6. Indemnifications: The Fund enters into contracts that contain a variety of indemnifications. The Fund's maximum exposure under these arrangements is unknown. However, the Fund has not had prior claims or losses pursuant to these contracts and expects the risk of loss to be remote.
7. Other: Security transactions are accounted for on the date the securities are purchased or sold. Realized gains (losses) on the sale of investment securities are determined on the specific identified cost basis. Dividend income and distributions are recorded on the ex-dividend date (except for certain foreign dividends which may be recorded as soon as the Fund is informed of such dividends) net of applicable withholding taxes. Interest income is recognized on the accrual basis except where collection is in doubt. Discounts and premiums on securities purchased are amortized according to the effective yield method over their respective lives. Most expenses of the Fund can be directly attributed to a particular Portfolio. Expenses which cannot be directly attributed are apportioned among the Portfolios based upon relative net assets or other appropriate measures. Income, expenses (other than class specific expenses) and realized and unrealized gains or losses are allocated to each class of shares based upon their relative net assets.
B. Investment Advisory Fees: Morgan Stanley Investment Management Inc. (the "Adviser"), a wholly-owned subsidiary of Morgan Stanley, provides the Fund with investment advisory services under the terms of an Investment Advisory
89
2012 Semi-Annual Report
March 31, 2012 (unaudited)
Notes to Financial Statements (cont'd)
Agreement, paid quarterly, at the annual rates of the average daily net assets indicated below.
| Portfolio | Average Daily Net Assets | Advisory Fee | |||||||||
| Balanced | 0.450 | % | |||||||||
| Mid Cap Growth | 0.500 | ||||||||||
| Core Fixed Income | 0.375 | ||||||||||
| Core Plus Fixed Income | first $1 billion over $1 billion | 0.375 0.300 | |||||||||
| Corporate Bond | 0.375 | ||||||||||
| High Yield | 0.600 | ||||||||||
| Limited Duration | 0.300 | ||||||||||
| Long Duration Fixed Income | 0.375 | ||||||||||
The Adviser has agreed to reduce its advisory fee and/or reimburse certain Portfolios, if necessary, if such fees would cause the total annual operating expenses of the Portfolios to exceed its expense limitations. In determining the actual amount of fee waiver and/or expense reimbursement for the Portfolios, if any, the Adviser excludes from annual operating expenses certain investment related expenses.
| Expense Limitations | |||||||||||||||||||
| Portfolio | Class I | Class P | Class H | Class L | |||||||||||||||
| Core Fixed Income | 0.50 | % | 0.75 | % | — | % | — | % | |||||||||||
| High Yield | 0.75 | 1.00 | 1.00 | 1.25 | |||||||||||||||
| Long Duration Fixed Income | 0.50 | 0.75 | — | — | |||||||||||||||
The fee waivers and/or expense reimbursements for the Portfolios will continue for at least one year or until such time that the Fund's Board of Trustees acts to discontinue all or a portion of such waivers and/or expense reimbursements when it deems such action is appropriate. For the six months ended March 31, 2012, the Portfolios had advisory fees waived and/or certain expenses reimbursed as follows:
| Portfolio | Adivsory Fees Waived and/or Reimbursed (000) | ||||||
| Core Fixed Income | $ | 101 | |||||
| High Yield | 31 | ||||||
| Long Duration Fixed Income | 66 | ||||||
C. Administration Fees: The Adviser also serves as Administrator to the Fund and provides administrative services pursuant to an Administration Agreement for an annual fee, accrued daily and paid monthly, of 0.08% of each Portfolio's average daily net assets.
Under a Sub-Administration Agreement between the Administrator and State Street Bank and Trust Company ("State Street"), State Street provides certain administrative services to the Fund. For such services, the Administrator pays State Street a portion of the fee the Administrator receives from the Fund.
D. Distribution and Shareholder Servicing Fees: Morgan Stanley Distribution, Inc. ("MSDI" or the "Distributor"), a wholly-owned subsidiary of the Adviser, serves as the Distributor of the Fund.
Pursuant to a Shareholder Services Plan, each Portfolio may pay the Distributor and other affiliated and unaffiliated broker-dealers, financial institutions and/or intermediaries a service fee, accrued daily and paid monthly, at an annual rate of up to 0.25% of the Portfolio's average daily net assets attributable to Class P and Class H shares, respectively. The Distributor has agreed to waive 0.10% of the 0.25% shareholder servicing fee it is entitled to receive from the Class P shares' average daily net assets for the Corporate Bond Portfolio.
The Fund has adopted a Distribution and Shareholder Services Plan with respect to Class L shares pursuant to Rule 12b-1 under the Act. Under the Distribution and Shareholder Services Plan, the Portfolio pays the Distributor a distribution fee, accrued daily and paid monthly, at an annual rate of 0.25% and a shareholder service fee, accrued daily and paid monthly, at an annual rate of 0.25% of the Portfolio's average daily net assets attributable to Class L shares. For the six months ended March 31, 2012, the Corporate Bond Portfolio waived less than $500.
The distribution and shareholder servicing fees are used to support the expenses associated with servicing and maintaining accounts. The Distributor may compensate other parties for providing shareholder support services to investors who purchase Class P, Class H and Class L shares.
E. Dividend Disbursing and Transfer Agent: The Fund's dividend disbursing and transfer agent is Morgan Stanley Services Company Inc. ("Morgan Stanley Services"). Pursuant to a transfer agency agreement, the Fund pays Morgan Stanley Services a fee based on the number of classes, accounts and transactions relating to the Portfolios of the Fund.
F. Custodian Fees: State Street (the "Custodian") serves as Custodian for the Fund in accordance with a custodian agreement. The Custodian holds cash, securities, and other assets of the Fund as required by the Act.
The Fund has entered into an arrangement with its Custodian whereby credits realized on uninvested cash balances were used to offset a portion of each Portfolio's expenses. If applicable, these custodian credits are shown as "Expense Offset" in the Statements of Operations.
90
2012 Semi-Annual Report
March 31, 2012 (unaudited)
Notes to Financial Statements (cont'd)
G. Portfolio Investment Activity:
1. Security Transactions: During the six months ended March 31, 2012, purchases and sales of investment securities, other than long-term U.S. Government securities and short-term investments, were:
| Portfolio | Purchases (000) | Sales (000) | |||||||||
| Balanced | $ | 5,650 | $ | 14,852 | |||||||
| Mid Cap Growth | 598,673 | 1,065,979 | |||||||||
| Core Fixed Income | 6,940 | 13,565 | |||||||||
| Core Plus Fixed Income | 43,369 | 72,558 | |||||||||
| Corporate Bond | 48,038 | 31,803 | |||||||||
| High Yield | 13,833 | 3,961 | |||||||||
| Limited Duration | 19,119 | 23,893 | |||||||||
| Long Duration Fixed Income | 982 | 1,167 | |||||||||
During the six months ended March 31, 2012, purchases and sales of long-term U.S. government securities were:
| Portfolio | Purchases (000) | Sales (000) | |||||||||
| Balanced | $ | 16,690 | $ | 15,817 | |||||||
| Core Fixed Income | 54,449 | 52,354 | |||||||||
| Core Plus Fixed Income | 191,767 | 192,190 | |||||||||
| Corporate Bond | 7,519 | 39,180 | |||||||||
| Limited Duration | 8,253 | 4,929 | |||||||||
| Long Duration Fixed Income | 3,349 | 3,079 | |||||||||
2. Transactions with Affiliates: The Portfolios invest in the Institutional Class of the Morgan Stanley Institutional Liquidity Funds — (the "Liquidity Funds"), an open-end management investment company managed by the Adviser, both directly, and as a portion of the securities held as collateral on loaned securities. A summary of the Portfolio's transactions in shares of the Liquidity Funds during the six months ended March 31, 2012 is as follows:
| Portfolio | Value September 30, 2011 (000) | Purchases at Cost (000) | Sales (000) | Dividend Income (000) | Value March 31, 2012 (000) | ||||||||||||||||||
| Balanced | $ | 3,956 | $ | 21,994 | $ | 14,684 | $ | 3 | $ | 11,266 | |||||||||||||
| Mid Cap Growth | 280,754 | 615,399 | 721,497 | 108 | 174,656 | ||||||||||||||||||
| Core Fixed Income | 3,080 | 24,562 | 18,119 | 2 | 9,523 | ||||||||||||||||||
| Core Plus Fixed Income | 17,246 | 128,701 | 108,607 | 9 | 37,340 | ||||||||||||||||||
| Corporate Bond | 4,141 | 41,870 | 37,374 | 1 | 8,637 | ||||||||||||||||||
| High Yield | — | 10,961 | 10,860 | — | @ | 101 | |||||||||||||||||
| Limited Duration | 5,846 | 28,544 | 30,376 | 2 | 4,014 | ||||||||||||||||||
| Long Duration Fixed Income | 636 | 2,342 | 2,102 | — | @ | 876 | |||||||||||||||||
@ Amount is less than $500.
Investment Advisory fees paid by the Portfolios are reduced by an amount equal to its pro-rata share of the advisory and administration fees paid by the Portfolios due to its investment in the Liquidity Funds ("Rebate"). For the six months ended March 31, 2012, advisory fees paid were reduced as follows:
| Portfolio | Rebate (000) | ||||||
| Balanced | $ | 3 | |||||
| Mid Cap Growth | 148 | ||||||
| Core Fixed Income | 3 | ||||||
| Core Plus Fixed Income | 11 | ||||||
| Corporate Bond | 2 | ||||||
| High Yield | — | @ | |||||
| Limited Duration | 2 | ||||||
| Long Duration Fixed Income | — | @ | |||||
@ Amount is less than $500.
The Balanced Portfolio invests in Morgan Stanley Institutional Fund, Inc. — Emerging Markets Portfolio ("Emerging Markets Portfolio"), an open-end management investment company advised by an affiliate of the Adviser. Investment Advisory fees paid by the Portfolio are reduced by an amount equal to its pro-rata share of the advisory and administration fees paid by the Emerging Markets Portfolio. For the six months ended March 31, 2012, advisory fees paid were reduced by approximately $1,000 relating to the Portfolio's investment in the Emerging Markets Portfolio. The Emerging Markets Portfolio has a cost basis of approximately $120,000 at March 31, 2012.
A summary of the Balanced Portfolio's transactions in shares of the Emerging Markets Portfolio during the six months ended March 31, 2012 is as follows:
| Value September 30, 2011 (000) | Purchases at Cost (000) | Sales (000) | Realized Gain/Loss (000) | Dividend Income (000) | Value March 31, 2012 (000) | ||||||||||||||||||
| $ | 93 | $ | 2 | $ | — | $ | — | $ | 2 | $ | 108 | ||||||||||||
For the six months ended March 31, 2012, the following Portfolios invested in Citigroup, Inc., and its affiliated broker/dealers which may be deemed affiliates of the Adviser, Administrator and Distributor under Section 17 of the Act.
| Portfolio | Value September 30, 2011 (000) | Purchases at Cost (000) | Sales (000) | Realized Gain/Loss (000) | Dividend/ Interest Income (000) | Value March 31, 2012 (000) | |||||||||||||||||||||
| Balanced | $ | 451 | $ | 114 | $ | 300 | $ | 11 | $ | 6 | $ | 362 | |||||||||||||||
| Core Fixed Income | 456 | — | 161 | 24 | 10 | 324 | |||||||||||||||||||||
| Core Plus Fixed Income | 3,518 | — | 2,672 | 179 | 77 | 1,141 | |||||||||||||||||||||
| Corporate Bond | 1,047 | 1,212 | 1,046 | 153 | 31 | 1,267 | |||||||||||||||||||||
| Limited Duration | 3,413 | 1,189 | 1,472 | 46 | 46 | 3,155 | |||||||||||||||||||||
| Long Duration Fixed Income | 251 | — | — | — | 8 | 266 | |||||||||||||||||||||
91
2012 Semi-Annual Report
March 31, 2012 (unaudited)
Notes to Financial Statements (cont'd)
During the six months ended March 31, 2012, the following Portfolios incurred brokerage commissions with Citigroup, Inc. and its affiliated broker/dealers, which may be deemed affiliates of the Adviser, Administrator and Distributor under Section 17 of the Act:
| Portfolio | Broker Commissions (000) | ||||||
| Mid Cap Growth | $ | 2 | |||||
The Fund has an unfunded Deferred Compensation Plan (the "Compensation Plan"), which allows each independent Trustee to defer payment of all, or a portion, of the fees he or she receives for serving on the Board of Trustees. Each eligible Trustee generally may elect to have the deferred amounts credited with a return equal to the total return on one or more of the Morgan Stanley funds that are offered as investment options under the Compensation Plan. Appreciation/depreciation and distributions received from these investments are recorded with an offsetting increase/decrease in the deferred compensation obligation and do not affect the net asset value of the Portfolio.
H. Securities Lending: Certain Portfolios lend securities to qualified financial institutions, such as broker-dealers, to earn additional income. Any increase or decrease in the fair value of the securities loaned that might occur and any interest earned or dividends declared on those securities during the term of the loan would remain in the Portfolio. Portfolios that lend securities receive cash or securities as collateral in an amount equal to or exceeding 100% of the current fair value of the loaned securities. The collateral is marked-to-market daily, by the securities lending agent, to ensure that a minimum of 100% collateral coverage is maintained.
Based on pre-established guidelines, the securities lending agent invests any cash collateral that is received in an affiliated money market portfolio and repurchase agreements backed by the U.S. Treasury and Agency securities. Securities lending income is generated from the earnings on the invested collateral and borrowing fees, less any rebates owed to the borrowers and compensation to the lending agent, and is recorded as "Income from Securities Loaned — Net" in the Portfolios' Statements of Operations. Risks in securities lending transactions are that a borrower may not provide additional collateral when required or return the securities when due, and that the value of the short-term investments will be less than the amount of cash collateral plus any rebate that is required to be returned to the borrower.
The value of the loaned securities and related collateral outstanding at March 31, 2012 were as follows:
| Portfolio | Value of Loaned Securities (000) | Value of Collateral Outstanding (000) | Invested Cash Collateral* (000) | Uninvested Cash Collateral (000) | Value of Non-Cash Collateral** (000) | ||||||||||||||||||
| Balanced | $ | 7,630 | $ | 7,793 | $ | 7,083 | $ | 21 | $ | 689 | |||||||||||||
| Core Fixed Income | 8,402 | 8,639 | 6,505 | 20 | 2,114 | ||||||||||||||||||
| Core Plus Fixed Income | 20,904 | 21,488 | 15,468 | 47 | 5,973 | ||||||||||||||||||
| Corporate Bond | 9,206 | 9,451 | 9,422 | 29 | — | ||||||||||||||||||
* The Portfolios invest cash collateral received in Repurchase Agreements and the Morgan Stanley Institutional Liquidity Funds as reported in the Portfolios of Investments.
** The Portfolios received non-cash collateral in the form of U.S. Government Agencies and Obligations, which the Portfolios cannot sell or repledge and, accordingly, are not reflected in the Portfolios of Investments.
I. Federal Income Taxes: It is each Portfolio's intention to continue to qualify as a regulated investment company and distribute all of its taxable and tax-exempt income. Accordingly, no provision for Federal income taxes is required in the financial statements.
Dividend income and distributions to shareholders are recorded on the ex-dividend date. Interest income is recognized on the accrual basis. Dividends from net investment income, if any, are declared and paid quarterly except for those of the High Yield Portfolio and the Limited Duration Portfolio which are declared and paid monthly and those of the Mid Cap Growth Portfolio, which are declared and paid annually. Net realized capital gains, if any, are distributed at least annually.
A Portfolio may be subject to taxes imposed by countries in which it invests. Such taxes are generally based on income and/or capital gains earned or repatriated. Taxes are accrued based on net investment income, net realized gains and net unrealized appreciation as such income and/or gains are earned. Taxes may also be based on transactions in foreign currency and are accrued based on the value of investments denominated in such currency.
FASB ASC 740-10 "Income Taxes — Overall" sets forth a minimum threshold for financial statement recognition of the benefit of a tax position taken or expected to be taken in a tax return. Management has concluded there are no significant uncertain tax positions that would require recognition in the financial statements. If applicable, the Portfolios recognize interest accrued related to unrecognized tax benefits in "Interest Expense" and penalties in "Other Expenses" in the Statements of Operations. The Portfolios file tax returns with the U.S. Internal Revenue Service, New York and various states. Each of the tax years in the four-year period ended September 30, 2011, remains subject to examination by taxing authorities.
92
2012 Semi-Annual Report
March 31, 2012 (unaudited)
Notes to Financial Statements (cont'd)
The tax character of distributions paid may differ from the character of distributions shown in the Statements of Changes in Net Assets due to short-term capital gains being treated as ordinary income for tax purposes. The tax character of distributions paid during fiscal 2011 and 2010 was as follows:
| 2011 Distributions Paid From: | 2010 Distributions Paid From: | ||||||||||||||||||||||||||
| Portfolio | Ordinary Income (000) | Long- term Capital Gain (000) | Paid-In Capital (000) | Ordinary Income (000) | Long- term Capital Gain (000) | Paid-In Capital (000) | |||||||||||||||||||||
| Balanced | $ | 685 | $ | — | $ | — | $ | 918 | $ | — | $ | — | |||||||||||||||
| Mid Cap Growth | 8,346 | 4,087 | — | 492 | — | — | |||||||||||||||||||||
| Core Fixed Income | 2,135 | — | — | 2,896 | — | — | |||||||||||||||||||||
| Core Plus Fixed Income | 16,358 | — | — | 30,975 | — | — | |||||||||||||||||||||
| Corporate Bond | 2,333 | — | — | 4,183 | — | — | |||||||||||||||||||||
| Limited Duration | 3,270 | — | — | 5,288 | — | 161 | |||||||||||||||||||||
| Long Duration Fixed Income | 1,794 | 839 | — | 1,544 | 1,642 | — | |||||||||||||||||||||
The amount and character of income and gains to be distributed are determined in accordance with income tax regulations which may differ from GAAP. These book/tax differences are either considered temporary or permanent in nature.
Temporary differences are attributable to differing book and tax treatments for the timing of the recognition of gains (losses) on certain investment transactions and the timing of the deductibility of certain expenses.
Permanent differences, primarily due to differing treatments of gains (losses) related to foreign currency transactions, foreign futures transactions, basis adjustments for swap transactions, net operating losses, distribution redesignations, nondeductible expenses, paydown adjustments and expiration of capital loss carryforwards, resulted in the following reclassifications among the components of net assets at September 30, 2011:
| Portfolio | Accumulated Undistributed (Distributions in Excess of) Net Investment Income (Loss) (000) | Accumulated Net Realized Gain (Loss) (000) | Paid-In Capital (000) | ||||||||||||
| Balanced | $ | 71 | $ | 3,291 | $ | (3,362 | ) | ||||||||
| Mid Cap Growth | 2,968 | 423 | (3,391 | ) | |||||||||||
| Core Fixed Income | 209 | (158 | ) | (51 | ) | ||||||||||
| Core Plus Fixed Income | 2,598 | 18,557 | (21,155 | ) | |||||||||||
| Corporate Bond | 214 | (214 | ) | — | @ | ||||||||||
| Limited Duration | 118 | (107 | ) | (11 | ) | ||||||||||
| Long Duration Fixed Income | (26 | ) | 26 | — | @ | ||||||||||
@ Amount is less than $500.
At September 30, 2011, the components of distributable earnings on a tax basis were as follows:
| Portfolio | Undistributed Ordinary Income (000) | Undistributed Long-term Capital Gain (000) | |||||||||
| Balanced | $ | 446 | $ | — | |||||||
| Mid Cap Growth | — | 310,861 | |||||||||
| Core Fixed Income | 976 | — | |||||||||
| Core Plus Fixed Income | 6,494 | — | |||||||||
| Corporate Bond | 917 | — | |||||||||
| Limited Duration | 825 | — | |||||||||
| Long Duration Fixed Income | 338 | 371 | |||||||||
At March 31, 2012, cost, unrealized appreciation, unrealized depreciation, and net unrealized appreciation (depreciation) for U.S. Federal income tax purposes of the investments of each of the Portfolios were:
| Portfolio | Cost (000) | Appreciation (000) | Depreciation (000) | Net Appreciation (Depreciation) (000) | |||||||||||||||
| Balanced | $ | 47,113 | $ | 2,779 | $ | (1,190 | ) | $ | 1,589 | ||||||||||
| Mid Cap Growth | 5,848,761 | 1,647,763 | (397,589 | ) | 1,250,174 | ||||||||||||||
| Core Fixed Income | 71,064 | 2,204 | (319 | ) | 1,885 | ||||||||||||||
| Core Plus Fixed Income | 296,940 | 10,412 | (4,616 | ) | 5,796 | ||||||||||||||
| Corporate Bond | 58,854 | 1,946 | (282 | ) | 1,664 | ||||||||||||||
| High Yield | 9,999 | 165 | (58 | ) | 107 | ||||||||||||||
| Limited Duration | 154,640 | 3,045 | (171 | ) | 2,874 | ||||||||||||||
| Long Duration Fixed Income | 21,194 | 2,904 | (155 | ) | 2,749 | ||||||||||||||
On December 22, 2010, the Regulated Investment Company Modernization Act of 2010 (the "Modernization Act") was signed into law. The Modernization Act modernizes several tax provisions related to Regulated Investment Companies ("RICs") and their shareholders. One key change made by the Modernization Act is that capital losses will generally retain their character as short-term or long-term and may be carried forward indefinitely to offset future gains. These losses are utilized before other capital loss carryforwards that expire. Generally, the Modernization Act is effective for taxable years beginning after December 22, 2010.
At September 30, 2011, the following Portfolios had available for Federal income tax purposes unused capital losses, which will expire on the indicated dates:
| Expiration Date September 30, | |||||||||||||||||||
| Portfolio | 2012 (000) | 2013 (000) | 2014 (000) | 2015 (000) | |||||||||||||||
| Balanced | $ | — | $ | — | $ | — | $ | — | |||||||||||
| Core Fixed Income | — | — | — | — | |||||||||||||||
| Core Plus Fixed Income | — | — | 7,135 | 15,680 | |||||||||||||||
| Corporate Bond | — | — | — | — | |||||||||||||||
| Limited Duration | — | 8,019 | 8,229 | 7,068 | |||||||||||||||
93
2012 Semi-Annual Report
March 31, 2012 (unaudited)
Notes to Financial Statements (cont'd)
| Expiration Date September 30, | |||||||||||||||||||||||
| Portfolio | 2016 (000) | 2017 (000) | 2018 (000) | 2019 (000) | Total (000) | ||||||||||||||||||
| Balanced | $ | — | $ | 3,501 | $ | 2,441 | $ | — | $ | 5,942 | |||||||||||||
| Core Fixed Income | 196 | 35,829 | 3,319 | — | 39,344 | ||||||||||||||||||
| Core Plus Fixed Income | 5,336 | 254,264 | 201,462 | — | 483,877 | ||||||||||||||||||
| Corporate Bond | 2,526 | 51,893 | 8,130 | — | 62,549 | ||||||||||||||||||
| Limited Duration | 265 | 200,864 | 33,504 | — | 257,949 | ||||||||||||||||||
During the year ended September 30, 2011, the following Portfolios expired capital loss carryforwards for U.S. Federal income tax purposes as follows:
| Portfolio | Expired Capital Loss Carryforwards (000) | ||||||
| Balanced | $ | 3,362 | |||||
| Core Plus Fixed Income | 21,148 | ||||||
To the extent that capital loss carryovers are used to offset any future capital gains realized during the carryover period as provided by U.S. Federal income tax regulations, no capital gains tax liability will be incurred by a Portfolio for gains realized and not distributed. To the extent that capital gains are offset, such gains will not be distributed to the shareholders. During the year ended September 30, 2011, the following Portfolios utilized capital loss carryforwards for U.S. Federal income tax purposes of approximately:
| Portfolio | Capital Loss Carryforwards Utilized (000) | ||||||
| Balanced | $ | 1,248 | |||||
| Mid Cap Growth | 344,519 | ||||||
| Core Fixed Income | 1,374 | ||||||
| Core Plus Fixed Income | 15,782 | ||||||
| Corporate Bond | 1,604 | ||||||
| Limited Duration | 234 | ||||||
Capital losses and specified ordinary losses, including currency losses, incurred after October 31 and other ordinary losses incurred after December 31 but within the taxable year are deemed to arise on the first day of the Portfolio's next taxable year. For the year ended September 30, 2011, the Portfolios deferred to October 1, 2011 for U.S. Federal Income tax purposes the following losses:
| Post-October | |||||||||||
| Portfolio | Capital Losses (000) | Currency Losses (000) | |||||||||
| Mid Cap Growth | $ | — | $ | 842 | |||||||
| Limited Duration | 726 | — | |||||||||
J. Other: At March 31, 2012, certain Portfolios had otherwise unaffiliated record owners of 10% or greater. Investment activities of these shareholders could have a material impact on these Portfolios. These Portfolios and the aggregate percentage of such owners were as follows:
| Percentage of Ownership | |||||||||||
| Portfolio | Class I | Class P | |||||||||
| Balanced | 60.5 | % | 96.5 | % | |||||||
| Mid Cap Growth | 43.7 | 59.5 | |||||||||
| Core Plus Fixed Income | 45.6 | 45.7 | |||||||||
K. Subsequent Events: The Balanced, Core Fixed Income, Core Plus Fixed Income and Limited Duration Portfolios commenced operations on April 30, 2012 with Class H and Class L shares.
The Board of Trustees of the Fund approved a Plan of Liquidation with respect to the Long Duration Fixed Income Portfolio (the "Portfolio"). Pursuant to the Plan of Liquidation, substantially all of the assets of the Portfolio will be liquidated, known liabilities of the Portfolio will be satisfied, the remaining proceeds will be distributed to the Portfolio's shareholders, and all of the issued and outstanding shares of the Portfolio will be redeemed (the "Liquidation"). The Liquidation is expected to occur on or about May 11, 2012.
The Board of Trustees of the Fund approved various changes with respect to the Balanced Portfolio (the "Portfolio"), effective on or about July 16, 2012, including (i) changing the Portfolio's name to Global Strategist Portfolio, (ii) changing the Portfolio's principal investment strategies and (iii) changing the Portfolio's primary benchmark index to the Morgan Stanley Capital International (MSCI) All Country World Index (ACWI).
94
2012 Semi-Annual Report
March 31, 2012 (unaudited)
U.S. Privacy Policy
AN IMPORTANT NOTICE CONCERNING OUR U.S. PRIVACY POLICY
This privacy notice describes the U.S. privacy policy of Morgan Stanley Distribution, Inc., and the Morgan Stanley family of mutual funds ("us", "our", "we").
We are required by federal law to provide you with notice of our U.S. privacy policy ("Policy"). This Policy applies to both our current and former clients unless we state otherwise and is intended for individual clients who purchase products or receive services from us for personal, family or household purposes. This Policy is not applicable to partnerships, corporations, trusts or other non-individual clients or account holders, nor is this Policy applicable to individuals who are either beneficiaries of a trust for which we serve as trustee or participants in an employee benefit plan administered or advised by us. This Policy is, however, applicable to individuals who select us to be a custodian of securities or assets in individual retirement accounts, 401(k) accounts, or accounts subject to the Uniform Gifts to Minors Act.
This notice sets out our business practices to protect your privacy; how we collect and share personal information about you; and how you can limit our sharing or certain uses by others of this information. We may amend this Policy at any time, and will inform you of any changes to our Policy as required by law.
WE RESPECT YOUR PRIVACY
We appreciate that you have provided us with your personal financial information and understand your concerns about your information. We strive to safeguard the information our clients entrust to us. Protecting the confidentiality and security of client information is an important part of how we conduct our business.
This notice describes what personal information we collect about you, how we collect it, when we may share it with others, and how certain others may use it. It discusses the steps you may take to limit our sharing of certain information about you with our affiliated companies, including, but not limited to our affiliated banking businesses, brokerage firms and credit service affiliates. It also discloses how you may limit our affiliates' use of shared information for marketing purposes.
Throughout this Policy, we refer to the nonpublic information that personally identifies you as "personal information." We also use the term "affiliated company" in this notice. An affiliated company is a company in our family of companies and includes companies with the Morgan Stanley name. These affiliated companies are financial institutions such as broker-dealers, banks, investment advisers and credit card issuers. We refer to any company that is not an affiliated company as a nonaffiliated third party. For purposes of Section 5 of this notice, and your ability to limit certain uses of personal information by our affiliates, this notice applies to the use of personal information by our affiliated companies.
1. WHAT PERSONAL INFORMATION DO WE COLLECT FROM YOU?
We may collect the following types of information about you: (i) information provided by you, including information from applications and other forms we receive from you, (ii) information about your transactions with us or our affiliates, (iii) information about your transactions with nonaffiliated third parties, (iv) information from consumer reporting agencies, (v) information obtained from our websites, and (vi) information obtained from other sources. For example:
• We collect information such as your name, address, e-mail address, telephone/fax numbers, assets, income and investment objectives through applications and other forms you submit to us.
• We may obtain information about account balances, your use of account(s) and the types of products and services you prefer to receive from us through your dealings and transactions with us and other sources.
• We may obtain information about your creditworthiness and credit history from consumer reporting agencies.
• We may collect background information from and through third-party vendors to verify representations you have made and to comply with various regulatory requirements.
2. WHEN DO WE DISCLOSE PERSONAL INFORMATION WE COLLECT ABOUT YOU?
We may disclose personal information we collect about you in each of the categories listed above to affiliated and nonaffiliated third parties.
95
2012 Semi-Annual Report
March 31, 2012 (unaudited)
U.S. Privacy Policy (cont'd)
a. Information we disclose to affiliated companies.
We may disclose personal information that we collect about you to our affiliated companies to manage your account(s) effectively, to service and process your transactions, and to let you know about products and services offered by us and affiliated companies, to manage our business, and as otherwise required or permitted by law. Offers for products and services from affiliated companies are developed under conditions designed to safeguard your personal information.
b. Information we disclose to third parties.
We may disclose personal information that we collect about you to nonaffiliated third parties to provide marketing services on our behalf or to other financial institutions with whom we have joint marketing agreements. We may also disclose all of the information we collect to other nonaffiliated third parties for our everyday business purposes, such as to process transactions, maintain account(s), respond to court orders and legal investigations, report to credit bureaus, offer our own products and services, protect against fraud, for institutional risk control, to perform services on our behalf, and as otherwise required or permitted by law.
When we share personal information about you with a nonaffiliated third party, they are required to limit their use of personal information about you to the particular purpose for which it was shared and they are not allowed to share personal information about you with others except to fulfill that limited purpose or as may be permitted or required by law.
3. HOW DO WE PROTECT THE SECURITY AND CONFIDENTIALITY OF PERSONAL INFORMATION WE COLLECT ABOUT YOU?
We maintain physical, electronic and procedural security measures that comply with applicable law and regulations to help safeguard the personal information we collect about you. We have internal policies governing the proper handling of client information by employees. Third parties that provide support or marketing services on our behalf may also receive personal information about you, and we require them to adhere to appropriate security standards with respect to such information.
4. HOW CAN YOU LIMIT OUR SHARING CERTAIN PERSONAL INFORMATION ABOUT YOU WITH OUR AFFILIATED COMPANIES FOR ELIGIBILITY DETERMINATION?
By following the opt-out procedures in Section 6, below, you may limit the extent to which we share with our affiliated companies, personal information that was collected to determine your eligibility for products and services such as your credit reports and other information that you have provided to us or that we may obtain from third parties ("eligibility information"). Eligibility information does not include your identification information or personal information pertaining to our transactions or experiences with you. Please note that, even if you direct us not to share eligibility information with our affiliated companies, we may still share your personal information, including eligibility information, with our affiliated companies under circumstances that are permitted under applicable law, such as to process transactions or to service your account.
5. HOW CAN YOU LIMIT THE USE OF CERTAIN PERSONAL INFORMATION ABOUT YOU BY OUR AFFILIATED COMPANIES FOR MARKETING?
By following the opt-out instructions in Section 6, below, you may limit our affiliated companies from marketing their products or services to you based on personal information we disclose to them. This information may include, for example, your income and account history with us. Please note that, even if you choose to limit our affiliated companies from using personal information about you that we may share with them for marketing their products and services to you, our affiliated companies may use your personal information that they obtain from us to market to you in circumstances permitted by law, such as if the affiliated party has its own relationship with you.
96
2012 Semi-Annual Report
March 31, 2012 (unaudited)
U.S. Privacy Policy (cont'd)
6. HOW CAN YOU SEND US AN OPT-OUT INSTRUCTION?
If you wish to limit our sharing of eligibility information about you with our affiliated companies, or our affiliated companies' use of personal information for marketing purposes, as described in this notice, you may do so by:
• Calling us at (800) 548-7786
Monday–Friday between 8a.m. and 5p.m. (EST)
• Writing to us at the following address:
Morgan Stanley Services Company Inc.
c/o Privacy Coordinator
201 Plaza Two, 3rd Floor
Jersey City, New Jersey 07311
If you choose to write to us, your request should include: your name, address, telephone number and account number(s) to which the opt-out applies and whether you are opting out with respect to sharing of eligibility information (Section 4 above), or information used for marketing (Section 5 above), or both. Written opt-out requests should not be sent with any other correspondence. In order to process your request, we require that the request be provided by you directly and not through a third party. Once you have informed us about your privacy preferences, your opt-out preference will remain in effect with respect to this Policy (as it may be amended) until you notify us otherwise. If you are a joint account owner, we will accept instructions from any one of you and apply those instructions to the entire account.
Please understand that if you limit our sharing or our affiliated companies' use of personal information, you and any joint account holder(s) may not receive information about our affiliated companies' products and services, including products or services that could help you manage your financial resources and achieve your investment objectives.
If you have more than one account or relationship with us, please specify the accounts to which you would like us to apply your privacy choices. If you have accounts or relationships with our affiliates, you may receive multiple privacy policies from them, and will need to separately notify those companies of your privacy choices for those accounts or relationships.
7. WHAT IF AN AFFILIATED COMPANY BECOMES A NONAFFILIATED THIRD PARTY?
If, at any time in the future, an affiliated company becomes a nonaffiliated third party, further disclosures of personal information made to the former affiliated company will be limited to those described in Section 2(b) above relating to nonaffiliated third parties. If you elected under Section 6 to limit disclosures we make to affiliated companies, or use of personal information by affiliated companies, your election will not apply to use by any former affiliated company of your personal information in their possession once it becomes a nonaffiliated third party.
SPECIAL NOTICE TO RESIDENTS OF VERMONT
The following section supplements our Policy with respect to our individual clients who have a Vermont address and supersedes anything to the contrary in the above Policy with respect to those clients only.
The State of Vermont requires financial institutions to obtain your consent prior to sharing personal information that they collect about you with nonaffiliated third parties, or eligibility information with affiliated companies, other than in certain limited circumstances. Except as permitted by law, we will not share personal information we collect about you with nonaffiliated third parties or eligibility information with affiliated companies, unless you provide us with your written consent to share such information.
SPECIAL NOTICE TO RESIDENTS OF CALIFORNIA
The following section supplements our Policy with respect to our individual clients who have a California address and supersedes anything to the contrary in the above Policy with respect to those clients only.
In response to a California law, if your account has a California home address, your personal information will not be disclosed to nonaffiliated third parties except as permitted by applicable California law, and we will limit sharing such personal information with our affiliates to comply with California privacy laws that apply to us.
©2012 Morgan Stanley
97
2012 Semi-Annual Report
March 31, 2012 (unaudited)
Trustee and Officer Information
Trustees
Michael E. Nugent
Frank L. Bowman
Michael Bozic
Kathleen A. Dennis
James F. Higgins
Dr. Manuel H. Johnson
Joseph J. Kearns
Michael F. Klein
W. Allen Reed
Fergus Reid
Officers
Michael E. Nugent
Chairperson of the Board and Trustee
Arthur Lev
President and Principal Executive Officer
Mary Ann Picciotto
Chief Compliance Officer
Stefanie V. Chang Yu
Vice President
Mary E. Mullin
Secretary
Francis J. Smith
Treasurer and Principal Financial Officer
Investment Adviser and Administrator
Morgan Stanley Investment Management Inc.
522 Fifth Avenue
New York, New York 10036
Distributor
Morgan Stanley Distribution, Inc.
522 Fifth Avenue
New York, New York 10036
Dividend Disbursing and Transfer Agent
Morgan Stanley Services Company Inc.
P.O. Box 219804
Kansas City, Missouri 64121
Custodian
State Street Bank and Trust Company
One Lincoln Street
Boston, Massachusetts 02111
Legal Counsel
Dechert LLP
1095 Avenue of the Americas
New York, New York 10036
Independent Registered Public Accounting Firm
Ernst & Young LLP
200 Clarendon Street
Boston, Massachusetts 02116
Reporting to Shareholders
Each Morgan Stanley Fund provides a complete schedule of portfolio holdings in its semi-annual and annual reports within 60 days of the end of the Fund's second and fourth fiscal quarters. The semi-annual reports and the annual reports are filed electronically with the Securities and Exchange Commission (SEC) on Form N-CSRS and Form N-CSR, respectively. Morgan Stanley also delivers the semi-annual and annual reports to Fund shareholders and makes these reports available on its public website, www.morganstanley.com/im. Each Morgan Stanley Fund also files a complete schedule of portfolio holdings with the SEC for the Fund's first and third fiscal quarters on Form N-Q. Morgan Stanley does not deliver the reports for the first and third fiscal quarters to shareholders nor are the reports posted to the Morgan Stanley public website. You may, however, obtain the Form N-Q filings (as well as the Form N-CSR and N-CSRS filings) by accessing the SEC's website, www.sec.gov. You may also review and copy them at the SEC's public reference room in Washington, DC. Information on the operation of the SEC's Public Reference Room may be obtained by calling the SEC toll free at 1-(800) SEC-0330. You can also request copies of these materials, upon payment of a duplicating fee, by electronic request at the SEC's email address (publicinfo@sec.gov) or by writing the Public Reference section of the SEC, Washington, DC 20549-0102.
Proxy Voting Policies and Procedures and Proxy Voting Record
You may obtain a copy of the Fund's Proxy Voting Policy and Procedures and information regarding how the Fund voted proxies relating to portfolio securities during the most recent twelve-month period ended June 30, without charge, upon request, by calling toll free 1-(800) 548-7786 or by visiting our website at www.morganstanley.com/im. This information is also available on the SEC's website at www.sec.gov.
This report is authorized for distribution only when preceded or accompanied by a prospectus of the Morgan Stanley Institutional Fund Trust which describes in detail each Investment Portfolio's investment policies, risks, fees and expenses. Please read the prospectus carefully before you invest or send money. For additional information, including information regarding the investments comprising the Portfolio, please visit our website at www.morganstanley.com/im or call toll free 1-(800) 548-7786.
98
(This Page has been left blank intentionally.)
(This Page has been left blank intentionally.)
Printed in U.S.A.
This Report has been prepared for shareholders and may be distributed to others only if preceded or accompanied by a current prospectus.
Morgan Stanley Investment Management Inc.
522 Fifth Avenue
New York, New York 10036
© 2012 Morgan Stanley

IFEQFISAN 3/12
IU12-01055P-Y03/12

June 29, 2012
Supplement
SUPPLEMENT DATED JUNE 29, 2012 TO THE PROSPECTUS OF
MORGAN STANLEY MID CAP GROWTH FUND
Dated January 31, 2012
The first sentence of the first paragraph of the section of the Prospectus entitled "Shareholder Information—How to Exchange Shares—Permissible Fund Exchanges." is hereby deleted and replaced with the following:
You may exchange shares of any Class of the Fund for the same Class of: Morgan Stanley European Equity Fund Inc., Morgan Stanley Focus Growth Fund, Morgan Stanley Global Fixed Income Opportunities Fund, Morgan Stanley Global Infrastructure Fund, Morgan Stanley Global Strategist Fund, Morgan Stanley International Fund, Morgan Stanley International Value Equity Fund, Morgan Stanley Mortgage Securities Trust, Morgan Stanley Multi Cap Growth Trust and Morgan Stanley U.S. Government Securities Trust (each, a "Morgan Stanley Multi-Class Fund"), if available, or for shares of Morgan Stanley California Tax-Free Daily Income Trust, Morgan Stanley Liquid Asset Fund Inc., Morgan Stanley New York Municipal Money Market Trust, Morgan Stanley Tax-Free Daily Income Trust and Morgan Stanley U.S. Government Money Market Trust (each, a "Morgan Stanley Money Market Fund") or the Morgan Stanley Limited Duration U.S. Government Trust, if available, without the imposition of an exchange fee.
PLEASE RETAIN THIS SUPPLEMENT FOR FUTURE REFERENCE.
DGRSPT2 6/12

May 14, 2012
Supplement
SUPPLEMENT DATED MAY 14, 2012 TO THE PROSPECTUS OF
MORGAN STANLEY MID CAP GROWTH FUND
Dated January 31, 2012
Effective as of the close of business on May 16, 2012, Class B shares of the Fund will be closed for purchases by new investors.
PLEASE RETAIN THIS SUPPLEMENT FOR FUTURE REFERENCE.
DGRSPT1 5/12

May 2, 2012
Supplement
SUPPLEMENT DATED MAY 2, 2012 TO THE PROSPECTUS OF
MORGAN STANLEY MID CAP GROWTH FUND
Dated January 31, 2012
The Board of Trustees (the "Board") of Morgan Stanley Mid Cap Growth Fund (the "Fund") approved an Agreement and Plan of Reorganization by and between the Fund and Morgan Stanley Institutional Fund Trust, on behalf of its series Mid Cap Growth Portfolio ("Mid Cap Growth"), pursuant to which substantially all of the assets of the Fund would be combined with those of Mid Cap Growth and shareholders of the Fund would become shareholders of Mid Cap Growth, receiving shares of Mid Cap Growth equal to the value of their holdings in the Fund (the "Reorganization"). Each shareholder of the Fund would receive the Class of shares of Mid Cap Growth that corresponds to the Class of shares of the Fund currently held by that shareholder. The Reorganization is subject to the approval of shareholders of the Fund at a special meeting of shareholders scheduled to be held during the third quarter of 2012. A proxy statement formally detailing the proposal, the reasons for the Reorganization and information concerning Mid Cap Growth is expected to be distributed to shareholders of the Fund during the third quarter of 2012.
PLEASE RETAIN THIS SUPPLEMENT FOR FUTURE REFERENCE.
DGRSPT 5/12
INVESTMENT MANAGEMENT

Morgan Stanley
Mid Cap Growth Fund

A mutual fund that seeks long-term capital growth.
| Share Class | Ticker Symbol | ||||||
| Class A | DGRAX | ||||||
| Class B | DGRBX | ||||||
| Class C | DGRCX | ||||||
| Class I | DGRDX | ||||||
Prospectus
January 31, 2012
The Securities and Exchange Commission ("SEC") has not approved or disapproved these securities or passed upon the adequacy of this Prospectus. Any representation to the contrary is a criminal offense.
Contents
Fund Summary
| Investment Objective | 1 | ||||||
| Fees and Expenses | 1 | ||||||
| Portfolio Turnover | 2 | ||||||
| Principal Investment Strategies | 2 | ||||||
| Principal Risks | 2 | ||||||
| Past Performance | 3 | ||||||
| Adviser | 4 | ||||||
| Purchase and Sale of Fund Shares | 4 | ||||||
| Tax Information | 5 | ||||||
| Payments to Broker-Dealers and Other Financial Intermediaries | 5 | ||||||
Fund Details
| Additional Information about the Fund's Investment Objective, Strategies and Risks | 6 | ||||||
| Portfolio Holdings | 13 | ||||||
| Fund Management | 13 | ||||||
Shareholder Information
| Pricing Fund Shares | 15 | ||||||
| How to Buy Shares | 16 | ||||||
| How to Exchange Shares | 18 | ||||||
| How to Sell Shares | 19 | ||||||
| Distributions | 22 | ||||||
| Frequent Purchases and Redemptions of Fund Shares | 23 | ||||||
| Tax Consequences | 24 | ||||||
| Share Class Arrangements | 25 | ||||||
| Additional Information | 33 | ||||||
| Financial Highlights | 34 | ||||||
This Prospectus contains important information about the Fund. Please read it carefully and keep it for future reference.
Fund Summary
Investment Objective
Morgan Stanley Mid Cap Growth Fund seeks long-term capital growth.
Fees and Expenses
The table below describes the fees and expenses that you may pay if you buy and hold shares of the Fund. You may qualify for sales charge discounts if you and your family invest, or agree to invest in the future, at least $25,000 in the Morgan Stanley Funds. More information about these and other discounts is available from your financial adviser and in the "Share Class Arrangements" section beginning on page 25 of this Prospectus and in the "Purchase, Redemption and Pricing of Shares" section beginning on page 51 of the Fund's Statement of Additional Information ("SAI").
Shareholder Fees (fees paid directly from your investment)
| Class A | Class B | Class C | Class I | ||||||||||||||||
| Maximum sales charge (load) imposed on purchases (as a percentage of offering price) | 5.25 | %1 | None | None | None | ||||||||||||||
| Maximum deferred sales charge (load) (as a percentage based on the lesser of the offering price or net asset value at redemption) | None2 | 5.00 | %3 | 1.00 | %3 | None | |||||||||||||
Annual Fund Operating Expenses
(expenses that you pay each year as a percentage of the value of your investment)
| Class A | Class B | Class C | Class I | ||||||||||||||||
| Advisory fee | 0.42 | % | 0.42 | % | 0.42 | % | 0.42 | % | |||||||||||
| Distribution and service (12b-1) fees | 0.25 | % | 1.00 | % | 1.00 | % | None | ||||||||||||
| Other expenses | 0.30 | % | 0.30 | % | 0.30 | % | 0.30 | % | |||||||||||
| Total annual Fund operating expenses | 0.97 | % | 1.72 | % | 1.72 | % | 0.72 | % | |||||||||||
Example
The example below is intended to help you compare the cost of investing in the Fund with the cost of investing in other mutual funds.
The example assumes that you invest $10,000 in the Fund, your investment has a 5% return each year, and the Fund's operating expenses remain the same (except for the ten-year amounts for Class B shares which reflect the conversion to Class A shares eight years after the end of the calendar month in which shares were purchased). Although your actual costs may be higher or lower, based on these assumptions your costs would be:
If You SOLD Your Shares:
| 1 Year | 3 Years | 5 Years | 10 Years | ||||||||||||||||
| Class A | $ | 619 | $ | 818 | $ | 1,033 | $ | 1,652 | |||||||||||
| Class B | $ | 675 | $ | 842 | $ | 1,133 | $ | 1,831 | |||||||||||
| Class C | $ | 275 | $ | 542 | $ | 933 | $ | 2,030 | |||||||||||
| Class I | $ | 74 | $ | 230 | $ | 401 | $ | 894 | |||||||||||
If You HELD Your Shares:
| 1 Year | 3 Years | 5 Years | 10 Years | ||||||||||||||||
| Class A | $ | 619 | $ | 818 | $ | 1,033 | $ | 1,652 | |||||||||||
| Class B | $ | 175 | $ | 542 | $ | 933 | $ | 1,831 | |||||||||||
| Class C | $ | 175 | $ | 542 | $ | 933 | $ | 2,030 | |||||||||||
| Class I | $ | 74 | $ | 230 | $ | 401 | $ | 894 | |||||||||||
(1) Reduced for purchases of $25,000 and over.
(2) Investments that are not subject to any sales charges at the time of purchase are subject to a contingent deferred sales charge ("CDSC") of 1.00% that will be imposed if you sell your shares within 18 months after purchase, except for certain specific circumstances.
(3) The Class B CDSC is scaled down to 1.00% during the sixth year, reaching zero thereafter, and the Class C CDSC is only applicable if you sell your shares within one year after purchase. See "Share Class Arrangements" for a complete discussion of the CDSC.
morganstanley.com/im
1
Portfolio Turnover
The Fund pays transaction costs, such as commissions, when it buys and sells securities (or "turns over" its portfolio). A higher portfolio turnover rate may indicate higher transaction costs and may result in higher taxes when Fund shares are held in a taxable account. These costs, which are not reflected in Total annual Fund operating expenses or in the Example, affect the Fund's performance. During the most recent fiscal year, the Fund's portfolio turnover rate was 46% of the average value of its portfolio.
Principal Investment Strategies
The Fund will normally invest at least 80% of its assets in common stocks (including depositary receipts) and other equity securities of medium capitalization companies. The Fund's other equity securities may include convertible securities and preferred stocks. The Fund's "Adviser," Morgan Stanley Investment Management Inc., seeks to invest primarily in established and emerging companies with capitalizations within the range of companies included in the Russell MidCap® Growth Index, which as of December 31, 2011 was between $117 million and $20.4 billion. The Adviser emphasizes a bottom-up stock selection process, seeking attractive investments on an individual company basis. The Adviser seeks to invest in high quality companies it believes have sustainable competitive advantages and the ability to redeploy capital at high rates of return. The Adviser typically favors companies with rising returns on invested capital, above average business visibility, strong free cash flow generation and an attractive risk/reward. The Fund may also use derivative instruments as discussed herein. These derivative instruments will be counted toward the 80% policy discussed above to the extent they have economic characteristics similar to the securities included within that policy.
The Fund may also invest in initial public offerings ("IPOs") and privately placed and restricted securities.
The Fund may invest up to 25% of its net assets in foreign securities, including emerging market securities, and securities classified as American Depositary Receipts ("ADRs"), Global Depositary Receipts ("GDRs"), American Depositary Shares ("ADSs"), Global Depositary Shares ("GDSs") or local shares of non-U.S. issuers. The Fund may also invest in U.S. dollar-denominated foreign securities that are traded on a U.S. national securities exchange. The 25% limitation, however, does not apply to securities of foreign companies that are listed in the United States on a national securities exchange.
The Fund may utilize forward foreign currency exchange contracts, which are derivatives, in connection with its investments in foreign securities.
Principal Risks
There is no assurance that the Fund will achieve its investment objective and you can lose money investing in this Fund. The principal risks of investing in the Fund include:
• Common Stock and Other Equity Securities. In general, stock and other equity security values fluctuate, and sometimes widely fluctuate, in response to activities specific to the company as well as general market, economic and political conditions. To the extent that the Fund invests in convertible securities, and the convertible security's investment value is greater than its conversion value, its price will be likely to increase when interest rates fall and decrease when interest rates rise. If the conversion value exceeds the investment value, the price of the convertible security will tend to fluctuate directly with the price of the underlying equity security.
• Small and Medium Capitalization Companies. Investments in small and medium capitalization companies entail greater risks than those associated with larger, more established companies. Often the stock of these companies may be more volatile and less liquid than the stock of more established companies. These stocks may have returns that vary, sometimes significantly, from the overall stock market.
• Foreign and Emerging Market Securities. Investments in foreign markets entail special risks such as currency, political, economic and market risks. There also may be greater market volatility, less reliable financial information, higher transaction and custody costs, decreased market liquidity and less government and exchange regulation associated with investments in foreign markets. The risks of investing in emerging market countries are greater than risks associated with investments in foreign developed countries. In addition, the Fund's investments may be denominated in foreign currencies and therefore, changes in the value of a country's currency compared to the U.S. dollar may affect the value of the Fund's investments. Hedging the Fund's currency risks
2
through forward foreign currency exchange contracts involves the risk of mismatching the Fund's objectives under a forward foreign currency exchange contract with the value of securities denominated in a particular currency. There is additional risk that such transactions reduce or preclude the opportunity for gain and that currency contracts create exposure to currencies in which the Fund's securities are not denominated. The use of forward foreign currency exchange contracts involves the risk of loss from the insolvency or bankruptcy of the counterparty to the contract or the failure of the counterparty to make payments or otherwise comply with the terms of the contract.
• Shares of IPOs. Fund purchases of shares issued in IPOs expose the Fund to the additional risks associated with companies that have little operating history as public companies, as well as to the risks inherent in those sectors of the market where these new issuers operate. The market for IPO issuers has been volatile, and share prices of certain newly-public companies have fluctuated in significant amounts over short periods of time.
• Privately Placed Securities. The Fund's investments may also include privately placed securities, which are subject to resale restrictions. These securities will have the effect of increasing the level of Fund illiquidity to the extent the Fund may be unable to sell or transfer these securities due to restrictions on transfers or on the ability to find buyers interested in purchasing the securities. The illiquidity of the market, as well as the lack of publicly available information regarding these securities, may also adversely affect the ability of the Fund's Trustees to arrive at a fair value for certain securities at certain times and could make it difficult for the Fund to sell certain securities.
Shares of the Fund are not bank deposits and are not guaranteed or insured by the Federal Deposit Insurance Corporation or any other government agency.
Past Performance
The bar chart and table below provide some indication of the risks of investing in the Fund by showing changes in the Fund's Class B shares' performance from year to year and by showing how the Fund's average annual returns for the one, five and 10 year periods compared with those of a broad measure of market performance, as well as an index that represents a group of similar mutual funds, over time. The performance of the other Classes will differ because the Classes have different ongoing fees. The performance information in the bar chart does not reflect the deduction of sales charges; if these amounts were reflected, returns would be less than shown. The Fund's returns in the table include the maximum applicable sales charge for each Class and assume you sold your shares at the end of each period (unless otherwise noted). The Fund's past performance (before and after taxes) does not indicate how the Fund will perform in the future. Updated performance information is available online at www.morganstanley.com/im or by calling toll-free (800) 869-NEWS.
Annual Total Returns—Calendar Years

High Quarter 6/30/09 26.22%
Low Quarter 12/31/08 –27.19%
Average Annual Total Returns For Periods Ended
December 31, 2011
| Past 1 Year | Past 5 Years | Past 10 Years | |||||||||||||
| Class A: Return Before Taxes | –11.27 | % | 3.65 | % | 6.73 | % | |||||||||
| Class B: Return Before Taxes | –11.42 | % | 3.66 | % | 6.65 | %* | |||||||||
| Return After Taxes on Distributions1 | –12.19 | % | 2.93 | % | 6.30 | %* | |||||||||
| Returns After Taxes on Distributions and Sale of Fund Shares | –6.43 | % | 3.01 | % | 5.79 | %* | |||||||||
| Class C: Return Before Taxes | –7.91 | % | 3.99 | % | 6.50 | % | |||||||||
| Class I: Return Before Taxes | –6.10 | % | 5.02 | % | 7.55 | % | |||||||||
| Russell Midcap® Growth Index (reflects no deduction for fees, expenses or taxes)2 | –1.65 | % | 2.44 | % | 5.29 | % | |||||||||
| Lipper Multi-Cap Growth Funds Index (reflects no deduction for taxes)3 | –4.02 | % | 0.87 | % | 2.78 | % | |||||||||
morganstanley.com/im
3
* Effective April 2005, Class B shares will generally convert to Class A shares approximately eight years after the end of the calendar month in which the shares were purchased. The "Past 10 Years" performance for Class B shares reflects this conversion.
(1) These returns do not reflect any tax consequences from a sale of your shares at the end of each period, but they do reflect any applicable sales charges on such a sale.
(2) The Russell Midcap® Growth Index measures the performance of the mid-cap growth segment of the U.S. equity universe. It includes those Russell Midcap® Index companies with higher price-to-book ratios and higher forecasted growth values. The Russell Midcap® Index is a subset of the Russell 1000® Index and includes approximately 800 of the smallest securities in the Russell 1000® Index, which in turn consists of approximately 1,000 the largest U.S. securities based on a combination of market capitalization and current index membership. It is not possible to invest directly in an index.
(3) The Lipper Multi-Cap Growth Funds Index is an equally weighted performance index of the largest qualifying funds (based on net assets) in the Lipper Multi-Cap Growth Funds classification. There are currently 30 funds represented in this Index.
The after-tax returns shown in the table above are calculated using the historical highest individual federal marginal income tax rates during the period shown and do not reflect the impact of state and local taxes. After-tax returns for the Fund's other Classes will vary from the Class B shares' returns. Actual after-tax returns depend on an investor's tax situation and may differ from those shown, and after-tax returns are not relevant to investors who hold their Fund shares through tax-deferred arrangements, such as 401(k) plans or individual retirement accounts. After-tax returns may be higher than before-tax returns due to foreign tax credits and/or an assumed benefit from capital losses that would have been realized had Fund shares been sold at the end of the relevant periods, as applicable.
Adviser
Adviser. Morgan Stanley Investment Management Inc.
Portfolio Managers. The Fund is managed by members of the Growth team. Information about the members jointly and primarily responsible for the day-to-day management of the Fund's portfolio is shown below:
| Name | Title with Adviser | Date Began Managing Fund | |||||||||
| Dennis P. Lynch | Managing Director | October 2002 | |||||||||
| Name | Title with Adviser | Date Began Managing Fund | |||||||||
| David S. Cohen | Managing Director | October 2003 | |||||||||
| Sam G. Chainani | Managing Director | June 2004 | |||||||||
| Alexander T. Norton | Executive Director | July 2005 | |||||||||
| Jason C. Yeung | Managing Director | September 2007 | |||||||||
| Armistead B. Nash | Executive Director | September 2008 | |||||||||
Purchase and Sale of Fund Shares
Minimum Investment Amounts
| Minimum Investment | |||||||||||
| Investment Options | Initial | Additional | |||||||||
| Regular Account | $ | 1,000 | $ | 100 | |||||||
| Individual Retirement Account | $ | 1,000 | $ | 100 | |||||||
| Coverdell Education Savings Account | $ | 500 | $ | 100 | |||||||
| EasyInvest® (Automatically from your checking or savings account or Money Market Fund) | $100* | $100* | |||||||||
* Provided your schedule of investments totals $1,000 in 12 months.
Effective at the close of business March 31, 2011, the Fund suspended offering its shares to new investors, except in certain circumstances. For more information, please refer to the "How to Buy Shares" section beginning on page 16.
You may not be subject to the minimum investment requirements under certain circumstances. For more information, please refer to the "How to Buy Shares—Minimum Investment Amounts" section beginning on page 17 of this Prospectus.
You can purchase or sell Fund shares by contacting your Morgan Stanley Smith Barney Financial Advisor or other authorized financial representative. You can also sell Fund shares at any time by telephonic request to the Fund or by enrolling in a systematic withdrawal plan. In addition, you can purchase additional Fund shares or sell Fund shares by written request to the Fund.
Your shares will be sold at the next price calculated after we receive your order to redeem. If you redeem Class A, Class B or Class C shares, your net sale proceeds are reduced by the amount of any applicable CDSC.
4
To contact a Morgan Stanley Smith Barney Financial Advisor, call toll-free 1-866-MORGAN8 for the telephone number of the Morgan Stanley Smith Barney office nearest you or access our office locator at www.morganstanley.com. To sell shares by telephone, call (800) 869-NEWS. To purchase additional Fund shares or sell Fund shares by mail, contact the Fund's transfer agent, Morgan Stanley Services Company Inc. (the "Transfer Agent"), at: Morgan Stanley Services Company Inc., P.O. Box 219885, Kansas City, MO 64121-9885 (for purchases) or Morgan Stanley Services Company Inc., P.O. Box 219886, Kansas City, MO 64121-9886 (for sales). For more information, please refer to the "How to Buy Shares" and "How to Sell Shares" sections beginning on page 16 and page 19, respectively, of this Prospectus.
Tax Information
The Fund intends to make distributions that may be taxed as ordinary income or capital gains, unless you are investing through a tax-deferred arrangement, such as a 401(k) plan or an individual retirement account.
Payments to Broker-Dealers and Other Financial Intermediaries
If you purchase the Fund through a broker-dealer or other financial intermediary (such as a bank), the Adviser and/or the Fund's "Distributor," Morgan Stanley Distribution, Inc., may pay the intermediary for the sale of Fund shares and related services. These payments, which may be significant in amount, may create a conflict of interest by influencing the broker-dealer or other intermediary and your salesperson to recommend the Fund over another investment. Ask your salesperson or visit your financial intermediary's web site for more information.
www.morganstanley.com/im
5
Fund Details
Additional Information about the Fund's Investment Objective, Strategies and Risks
Investment Objective
Morgan Stanley Mid Cap Growth Fund seeks long-term capital growth.
Capital Growth
An investment objective having the goal of selecting securities with the potential to rise in price rather than pay out income.
Principal Investment Strategies
The Fund will normally invest at least 80% of its assets in common stocks (including depositary receipts) and other equity securities of medium capitalization companies. The Fund's other equity securities may include convertible securities and preferred stocks. The Adviser seeks to invest primarily in established and emerging companies with capitalizations within the range of companies included in the Russell MidCap® Growth Index, which as of December 31, 2011 was between $117 million and $20.4 billion. The Adviser emphasizes a bottom-up stock selection process, seeking attractive investments on an individual company basis. The Adviser seeks to invest in high quality companies it believes have sustainable competitive advantages and the ability to redeploy capital at high rates of return. The Adviser typically favors companies with rising returns on invested capital, above average business visibility, strong free cash flow generation and an attractive risk/reward. The Fund may also use derivative instruments as discussed herein. The derivative instruments will be counted toward the 80% policy discussed above to the extent they have economic characteristics similar to the securities included within that policy. The Adviser generally considers selling an investment when it determines the company no longer satisfies its investment criteria.
The Fund may also invest in securities issued in IPOs and privately placed and restricted securities.
The remaining 20% of the Fund's assets may be invested in equity securities of issuers other than medium capitalization companies and in fixed-income securities issued or guaranteed by the U.S. government, its agencies or instrumentalities, and corporate debt securities rated Baa or better by Moody's Investors Service, Inc. ("Moody's"), or BBB or better by Standard & Poor's Ratings Group, a division of The McGraw-Hill Companies, Inc. ("Standard & Poor's"), or, if not rated, judged to be of comparable quality by the Adviser. In addition, the Fund may invest in real estate investment trusts ("REITs").
6
The Fund may invest up to 25% of its net assets in foreign securities, including emerging market securities and securities classified as ADRs, GDRs, ADSs, GDSs or local shares of non-U.S. issuers. The Fund may also invest in U.S. dollar-denominated foreign securities that are traded on a U.S. exchange. The 25% limitation, however, does not apply to securities of foreign companies that are listed in the United States on a national securities exchange.
The Fund may also use forward foreign currency exchange contracts, which are derivatives, in connection with its investments in foreign securities.
Common stock is a share ownership or equity interest in a corporation. It may or may not pay dividends, as some companies reinvest all of their profits back into their businesses, while others pay out some of their profits to shareholders as dividends. A convertible security is a bond, preferred stock or other security that may be converted into a prescribed amount of common stock at a prestated price. A depositary receipt is generally issued by a bank or financial institution and represents an ownership interest in the common stock or other equity securities of a foreign company.
In pursuing the Fund's investment objective, the Adviser has considerable leeway in deciding which investments it buys, holds or sells on a day-to-day basis and which trading strategies it uses. For example, the Adviser in its discretion may determine to use some permitted trading strategies while not using others.
Additional Investment Strategy Information
This section provides additional information relating to the Fund's investment strategies.
Fixed-Income Securities. Fixed-income securities are debt securities such as bonds, notes or commercial paper. The issuer of the debt security borrows money from the investor who buys the security. Most debt securities pay either fixed or adjustable rates of interest at regular intervals until they mature, at which point investors get their principal back. The Fund's fixed-income investments may include zero coupon securities which are purchased at a discount and generally accrue interest, but make no interest payments until maturity.
U.S. Government Securities. The U.S. government securities that the Fund may purchase include U.S. Treasury bills, notes and bonds, all of which are direct obligations of the U.S. Government. In addition, the Fund may purchase securities issued by agencies and instrumentalities of the U.S. Government which are backed by the full faith and credit of the United States. The Fund may also purchase securities issued by agencies and instrumentalities which are not backed by the full faith and credit of the United States, but whose issuing agency or instrumentality has the right to borrow, to meet its obligations, from the U.S. Treasury. Further, the Fund may purchase securities issued by agencies and instrumentalities which are backed solely by the credit of the issuing agency or instrumentality.
REITs. REITs pool investors' funds for investments primarily in real estate properties or real estate-related loans. They may also include, among other businesses, real estate developers, brokers and operating companies whose products and services are significantly related to the real estate industry such as building suppliers and mortgage lenders.
Derivatives. The Fund may, but it is not required to, use derivative instruments for a variety of purposes, including hedging, risk management, portfolio management or to earn income. Derivatives are financial instruments whose value is based on the value of another underlying asset, interest rate, index or financial instrument. The Fund's use of
7
derivatives may involve the purchase and sale of derivative instruments such as futures, options, swaps and structured investments and other related instruments and techniques.
Defensive Investing. The Fund may take temporary "defensive" positions in attempting to respond to adverse market conditions. The Fund may invest any amount of its assets in cash or money market instruments in a defensive posture that may be inconsistent with the Fund's principal investment strategies when the Adviser believes it is advisable to do so.
Although taking a defensive posture is designed to protect the Fund from an anticipated market downturn, it could have the effect of reducing the benefit from any upswing in the market. When the Fund takes a defensive position, it may not achieve its investment objective.
***
The percentage limitations relating to the composition of the Fund's portfolio apply at the time the Fund acquires an investment. Subsequent percentage changes that result from market fluctuations generally will not require the Fund to sell any portfolio security. However, the Fund may be required to sell its illiquid securities holdings, or reduce its borrowings, if any, in response to fluctuations in the value of such holdings. The Fund may change its principal investment strategies without shareholder approval; however, you would be notified of any changes.
Principal Risks
There is no assurance that the Fund will achieve its investment objective. The Fund's share price and return will fluctuate with changes in the market value of the Fund's portfolio securities. When you sell Fund shares, they may be worth less than what you paid for them and, accordingly, you can lose money investing in this Fund.
Common Stocks and Other Equity Securities. A principal risk of investing in the Fund is associated with its investments in common stocks and other equity investments. In general, stock and other equity security values fluctuate in response to activities specific to the company as well as general market, economic and political conditions. These prices can fluctuate widely in response to these factors.
Investments in convertible securities subject the Fund to the risks associated with both fixed-income securities and common stocks. To the extent that a convertible security's investment value is greater than its conversion value, its price will be likely to increase when interest rates fall and decrease when interest rates rise, as with a fixed-income security. If the conversion value exceeds the investment value, the price of the convertible security will tend to fluctuate directly with the price of the underlying equity security.
Preferred stock generally has a preference as to dividends and liquidation over an issuer's common stock but ranks junior to debt securities in an issuer's capital structure. Unlike interest payments on debt securities, preferred stock dividends are payable only if declared by the issuer's board of directors. Preferred stock also may be subject to optional or mandatory redemption provisions.
8
Small and Medium Capitalization Companies. The Fund's investments in small and medium capitalization companies carry more risk than investments in larger companies. While some of the Fund's holdings in these companies may be listed on a national securities exchange, such securities are more likely to be traded in the over-the-counter market. The low market liquidity of these securities may have an adverse impact on the Fund's ability to sell certain securities at favorable prices and may also make it difficult for the Fund to obtain market quotations based on actual trades for purposes of valuing the Fund's securities. Investing in lesser-known, small- and mid-capitalization companies involves greater risk of volatility of the Fund's net asset value than is customarily associated with larger, more established companies. Often small and medium capitalization companies and the industries in which they are focused are still evolving and, while this may offer better growth potential than larger, more established companies, it also may make them more sensitive to changing market conditions.
Foreign and Emerging Market Securities. The Fund's investments in foreign securities involve risks that are in addition to the risks associated with domestic securities. One additional risk is currency risk. While the price of Fund shares is quoted in U.S. dollars, the Fund may convert U.S. dollars to a foreign market's local currency to purchase a security in that market. If the value of that local currency falls relative to the U.S. dollar, the U.S. dollar value of the foreign security will decrease. This is true even if the foreign security's local price remains unchanged.
Foreign securities also have risks related to economic and political developments abroad, including expropriations, confiscatory taxation, exchange control regulation, limitations on the use or transfer of Fund assets and any effects of foreign social, economic or political instability. Foreign companies, in general, are not subject to the regulatory requirements of U.S. companies and, as such, there may be less publicly available information about these companies. Moreover, foreign accounting, auditing and financial reporting standards generally are different from those applicable to U.S. companies. Finally, in the event of a default of any foreign debt obligations, it may be more difficult for the Fund to obtain or enforce a judgment against the issuers of the securities.
Securities of foreign issuers may be less liquid than comparable securities of U.S. issuers and, as such, their price changes may be more volatile. Furthermore, foreign exchanges and broker-dealers are generally subject to less government and exchange scrutiny and regulation than their U.S. counterparts. In addition, differences in clearance and settlement procedures in foreign markets may cause delays in settlement of the Fund's trades effected in those markets and could result in losses to the Fund due to subsequent declines in the value of the securities subject to the trades.
The foreign securities in which the Fund may invest may be issued by issuers located in emerging market or developing countries. Compared to the United States and other developed countries, emerging market or developing countries may have relatively unstable governments, economies based on only a few industries and securities markets that trade a small number of securities. Securities issued by companies located in these countries tend to be especially volatile and may be less liquid than securities traded in developed countries. In the past, securities in these countries have been characterized by greater potential loss than securities of companies located in developed countries.
Depositary receipts involve many of the same risks as those associated with direct investment in foreign securities. In addition, the underlying issuers of certain depositary receipts, particularly unsponsored or unregistered depositary receipts, are under no obligation to distribute shareholder communications to the holders of such receipts, or to pass through to them any voting rights with respect to the deposited securities.
9
In connection with its investments in foreign securities, the Fund also may enter into contracts with banks, brokers or dealers to purchase or sell securities or foreign currencies at a future date ("forward contracts"). A foreign currency forward contract is a negotiated agreement between the contracting parties to exchange a specified amount of currency at a specified future time at a specified rate. The rate can be higher or lower than the spot rate between the currencies that are the subject of the contract. Foreign currency forward contracts may be used to protect against uncertainty in the level of future foreign currency exchange rates or to gain or modify exposure to a particular currency. In addition, the Fund may use cross currency hedging or proxy hedging with respect to currencies in which the Fund has or expects to have portfolio or currency exposure. Cross currency hedges involve the sale of one currency against the positive exposure to a different currency and may be used for hedging purposes or to establish an active exposure to the exchange rate between any two currencies. Hedging the Fund's currency risks involves the risk of mismatching the Fund's objectives under a forward or futures contract with the value of securities denominated in a particular currency. Furthermore, such transactions reduce or preclude the opportunity for gain if the value of the currency should move in the direction opposite to the position taken. There is an additional risk to the effect that currency contracts create exposure to currencies in which the Fund's securities are not denominated. Unanticipated changes in currency prices may result in poorer overall performance for the Fund than if it had not entered into such contracts. The use of forward foreign currency exchange contracts involves the risk of loss from the insolvency or bankruptcy of the counterparty to the contract or the failure of the counterparty to make payments or otherwise comply with the terms of the contract.
Shares of IPOs. Fund purchases of shares issued in IPOs expose the Fund to the additional risks associated with companies that have little operating history as public companies, as well as to the risks inherent in those sectors of the market where these new issuers operate. The market for IPO issuers has been volatile, and share prices of certain newly-public companies have fluctuated in significant amounts over short periods of time. In addition, the Adviser cannot guarantee continued access to IPOs.
Privately Placed Securities. The Fund's investments may also include privately placed securities, which are subject to resale restrictions. These securities will have the effect of increasing the level of Fund illiquidity to the extent the Fund may be unable to sell or transfer these securities due to restrictions on transfers or on the ability to find buyers interested in purchasing the securities. The illiquidity of the market, as well as the lack of publicly available information regarding these securities, may also adversely affect the ability of the Fund's Trustees to arrive at a fair value for certain securities at certain times and could make it difficult for the Fund to sell certain securities.
Other Risks. The performance of the Fund also will depend on whether or not the Adviser is successful in applying the Fund's investment strategies. The Fund is subject to other risks from its permissible investments, including the risks associated with its investments in fixed-income securities, U.S. government securities REITs and derivatives. For more information about these risks, see the "Additional Risk Information" section.
Additional Risk Information
This section provides additional information relating to the risks of investing in the Fund.
10
Fixed-Income Securities. All fixed-income securities are subject to two types of risk: credit risk and interest rate risk. Credit risk refers to the possibility that the issuer of a security will be unable to make interest payments and/or repay the principal on its debt.
Interest rate risk refers to fluctuations in the value of a fixed-income security resulting from changes in the general level of interest rates. When the general level of interest rates goes up, the prices of most fixed-income securities go down. When the general level of interest rates goes down, the prices of most fixed-income securities go up. (Zero coupon securities are typically subject to greater price fluctuations than comparable securities that pay interest.)
The Fund is not limited as to the maturities of the fixed-income securities in which it may invest. Thus, a rise in the general level of interest rates may cause the price of the Fund's fixed-income securities to fall substantially. A portion of the Fund's securities may be rated below investment grade. Securities rated below investment grade are commonly known as "junk bonds" and may have speculative credit risk characteristics.
U.S. Government Securities. With respect to the Fund's investments in U.S. government securities issued by agencies and instrumentalities which are not backed by the full faith and credit of the United States, there is a risk that the U.S. Government will not provide financial support to these agencies if it is not obligated to do so by law. The maximum potential liability of the issuers of some U.S. government securities held by the Fund may greatly exceed their current resources, including their legal right to support from the U.S. Treasury. It is possible that these issuers will not have the funds to meet their payment obligations in the future.
REITs. REITs generally derive their income from rents on the underlying properties or interest on the underlying loans, and their value is impacted by changes in the value of the underlying property or changes in the interest rates affecting the underlying loans owned by the REITs. REITs are more susceptible to risks associated with the ownership of real estate and the real estate industry in general. These risks can include fluctuations in the value of underlying properties; defaults by borrowers or tenants; market saturation; changes in general and local economic conditions; decreases in market rates for rents; increases in competition, property taxes, capital expenditures or operating expenses; and other economic, political or regulatory occurrences affecting the real estate industry. In addition, REITs depend upon specialized management skills, may not be diversified (which may increase the volatility of a REIT's value), may have less trading volume and may be subject to more abrupt or erratic price movements than the overall securities market. Operating REITS requires specialized managements skills and the Fund indirectly bears REIT management expenses along with the direct expenses of the Fund. REITs are not taxed on income distributed to shareholders provided they comply with several requirements of the Internal Revenue Code of 1986, as amended (the "Internal Revenue Code"). REITs are subject to the risk of failing to qualify for tax-free pass-through of income under the Internal Revenue Code.
Derivatives. A derivative instrument often has risks similar to its underlying instrument and may have additional risks, including imperfect correlation between the value of the derivative and the underlying instrument, risks of default by the other party to certain transactions, magnification of losses incurred due to changes in the market value of the securities, instruments, indices or interest rates to which they relate, and risks that the transactions may not be liquid. The use of derivatives involves risks that are different from, and possibly greater than, the risks associated with other portfolio investments. Derivatives may involve the use of highly specialized instruments that require investment techniques and risk analyses different from those associated with other portfolio investments.
11
Certain derivative transactions may give rise to a form of leverage. Leverage magnifies the potential for gain and the risk of loss. Leverage associated with derivative transactions may cause the Fund to liquidate portfolio positions when it may not be advantageous to do so to satisfy its obligations or to meet earmarking or segregation requirements, pursuant to applicable SEC rules and regulations, or may cause the Fund to be more volatile than if the Fund had not been leveraged. Although the Adviser seeks to use derivatives to further the Fund's investment objectives, there is no assurance that the use of derivatives will achieve this result.
The derivative instruments and techniques that the Fund may principally use include:
Futures. A futures contract is a standardized agreement to buy or sell a specific quantity of an underlying instrument at a specific price at a specific future time. The value of a futures contract tends to increase and decrease in tandem with the value of the underlying instrument. Futures contracts are bilateral agreements, with both the purchaser and the seller equally obligated to complete the transaction. Depending on the terms of the particular contract, futures contracts are settled through either physical delivery of the underlying instrument on the settlement date or by payment of a cash settlement amount on the settlement date. A decision as to whether, when and how to use futures involves the exercise of skill and judgment and even a well conceived futures transaction may be unsuccessful because of market behavior or unexpected events. In addition to the derivatives risks discussed above, the prices of futures can be highly volatile, using futures can lower total return, and the potential loss from futures can exceed the Fund's initial investment in such contracts.
Options. If the Fund buys an option, it buys a legal contract giving it the right to buy or sell a specific amount of the underlying instrument or futures contract on the underlying instrument at an agreed-upon price typically in exchange for a premium paid by the Fund. If the Fund sells an option, it sells to another person the right to buy from or sell to the Fund a specific amount of the underlying instrument or futures contract on the underlying instrument at an agreed upon price typically in exchange for a premium received by the Fund. A decision as to whether, when and how to use options involves the exercise of skill and judgment and even a well-conceived option transaction may be unsuccessful because of market behavior or unexpected events. The prices of options can be highly volatile and the use of options can lower total returns.
Swaps. A swap contract is an agreement between two parties pursuant to which the parties exchange payments at specified dates on the basis of a specified notional amount, with the payments calculated by reference to specified securities, indexes, reference rates, currencies or other instruments. Most swap agreements provide that when the period payment dates for both parties are the same, the payments are made on a net basis (i.e., the two payment streams are netted out, with only the net amount paid by one party to the other). The Fund's obligations or rights under a swap contract entered into on a net basis will generally be equal only to the net amount to be paid or received under the agreement, based on the relative values of the positions held by each counterparty. With limited exceptions, swap agreements are generally not entered into or traded on exchanges. For most swaps, there is no central clearing or guaranty function. Therefore, swaps are generally subject to credit risk or the risk of default or non-performance by the counterparty. Swaps could result in losses if interest rate or foreign currency exchange rates or credit quality changes are not correctly anticipated by the Fund or if the reference index, security or investments do not perform as expected.
12
Structured Investments. The Fund also may invest a portion of its assets in structured investments. A structured investment is a derivative security designed to offer a return linked to a particular underlying security, currency or market. Structured investments may come in various forms including notes, warrants and options to purchase securities. The Fund will typically use structured investments to gain exposure to a permitted underlying security, currency or market when direct access to a market is limited or inefficient from a tax or cost standpoint. Investments in structured investments involve risks including counterparty risk and market risk. Holders of structured investments bear risks of the underlying investment and are subject to counterparty risk because the Fund is relying on the creditworthiness of such counterparty and has no rights with respect to the issuer of the underlying investment. Certain structured investments may be thinly traded or have a limited trading market and may have the effect of increasing the Fund's illiquidity to the extent that the Fund, at a particular point in time, may be unable to find qualified buyers for these securities.
Portfolio Holdings
A description of the Fund's policies and procedures with respect to the disclosure of the Fund's portfolio securities is available in the Fund's SAI.
Morgan Stanley Investment Management Inc.
The Adviser, together with its affiliated asset management companies, had approximately $287.4 billion in assets under management or supervision as of December 31, 2011.
Fund Management
The Fund has retained the Adviser—Morgan Stanley Investment Management Inc.—to provide investment advisory services. The Adviser is a wholly-owned subsidiary of Morgan Stanley, a preeminent global financial services firm engaged in securities trading and brokerage activities, as well as providing investment banking, research and analysis, financing and financial advisory services. The Adviser's address is 522 Fifth Avenue, New York, NY 10036.
The Fund is managed by members of the Growth team. The team consists of portfolio managers and analysts. Current members of the team jointly and primarily responsible for the day-to-day management of the Fund's portfolio are Dennis P. Lynch, David S. Cohen, Sam G. Chainani, Alexander T. Norton, Jason C. Yeung and Armistead B. Nash.
Mr. Lynch has been associated with the Adviser in an investment management capacity since 1998. Mr. Cohen has been associated with the Adviser in an investment management capacity since 1993. Mr. Chainani has been associated with the Adviser in an investment management capacity since 1996. Mr. Norton has been associated with the Adviser in an investment management capacity since 2000. Mr. Yeung has been associated with the Adviser in an investment management capacity since 2002. Mr. Nash has been associated with the Adviser in an investment management capacity since 2002.
Mr. Lynch is the lead portfolio manager of the Fund. Messrs. Cohen, Chainani, Norton, Yeung and Nash are co-portfolio managers. Members of the team collaborate to manage the assets of the Fund.
13
The Fund's SAI provides additional information about the portfolio managers' compensation structure, other accounts managed by the portfolio managers and the portfolio managers' ownership of securities in the Fund.
The composition of the team may change from time to time.
The Fund pays the Adviser a monthly advisory fee as full compensation for the services and facilities furnished to the Fund, and for Fund expenses assumed by the Adviser. The fee is based on the Fund's average daily net assets. For the fiscal year ended September 30, 2011, the Fund paid total investment advisory compensation amounting to 0.42% of the Fund's average daily net assets.
A discussion regarding the Board of Trustees' approval of the investment advisory agreement is available in the Fund's annual report to shareholders for the period ended September 30, 2011.
14
Shareholder Information
Pricing Fund Shares
The price of Fund shares (excluding sales charges), called "net asset value," is based on the value of the Fund's portfolio securities. While the assets of each Class are invested in a single portfolio of securities, the net asset value of each Class will differ because the Classes have different ongoing distribution fees.
The net asset value per share of the Fund is determined once daily at the New York Stock Exchange ("NYSE") close (normally 4:00 p.m. Eastern time) on each day that the NYSE is open. Shares will not be priced on days that the NYSE is closed.
The value of the Fund's portfolio securities is based on the securities' market price when available. When a market price is not readily available, including circumstances under which the Adviser determines that a security's market price is not accurate, a portfolio security is valued at its fair value, as determined under procedures established by the Fund's Board of Trustees.
In addition, with respect to securities that primarily are listed on foreign exchanges, when an event occurs after the close of such exchanges that is likely to have changed the value of the securities (e.g., a percentage change in value of one or more U.S. securities indices in excess of specified thresholds), such securities will be valued at their fair value, as determined under procedures established by the Fund's Board of Trustees. Securities also may be fair valued in the event of a significant development affecting a country or region or an issuer-specific development which is likely to have changed the value of the security.
In these cases, the Fund's net asset value will reflect certain portfolio securities' fair value rather than their market price. Fair value pricing involves subjective judgment and it is possible that the fair value determined for a security is materially different than the value that could be realized upon the sale of that security. With respect to securities that are primarily listed on foreign exchanges, the value of the Fund's portfolio securities may change on days when you will not be able to purchase or sell your shares.
To the extent the Fund invests in open-end management companies that are registered under the Investment Company Act of 1940, as amended ("Investment Company Act"), the Fund's net asset value is calculated based upon the net asset value of such funds. The prospectuses for such funds explain the circumstances under which they will use fair value pricing and its effects.
An exception to the Fund's general policy of using market prices concerns its short-term debt portfolio securities. Debt securities with remaining maturities of 60 days or less at the time of purchase are valued at amortized cost. However, if the cost does not reflect the securities' market value, these securities will be valued at their fair value.
15
Contacting a Financial Advisor
If you are new to the Morgan Stanley Funds and would like to contact a Morgan Stanley Smith Barney Financial Advisor, call toll-free 1-866-MORGAN8 for the telephone number of the Morgan Stanley Smith Barney office nearest you. You may also access our office locator on our Internet site at: www.morganstanley.com
How to Buy Shares
Effective at the close of business on March 31, 2011, the Fund suspended offering its shares to new investors, except as follows. The Fund continues to offer its shares (1) through certain retirement plan accounts, (2) to clients of certain registered investment advisers who currently offer shares of the Fund in their asset allocation programs, (3) to directors and trustees of the Morgan Stanley Funds, (4) to Morgan Stanley affiliates and their employees and (5) to benefit plans sponsored by Morgan Stanley and its affiliates. The Fund continues to offer its shares to existing shareholders and, as market conditions permit, may recommence offering shares of the Fund to other new investors in the future. Any such offerings of the Fund's shares may be limited in amount and may commence and terminate without any prior notice.
You may open a new account to buy Fund shares or buy additional Fund shares for an existing account by contacting your Morgan Stanley Smith Barney Financial Advisor or other authorized financial representative. Your Financial Advisor will assist you, step-by-step, with the procedures to invest in the Fund. The Transfer Agent, in its sole discretion, may allow you to purchase shares directly by calling and requesting an application.
To help the U.S. Government fight the funding of terrorism and money laundering activities, federal law requires all financial institutions to obtain, verify and record information that identifies each person who opens an account. What this means to you: when you open an account, we will ask your name, address, date of birth and other information that will allow us to identify you. If we are unable to verify your identity, we reserve the right to restrict additional transactions and/or liquidate your account at the next calculated net asset value after your account is closed (less any applicable sales/account charges and/or tax penalties) or take any other action required by law. In accordance with federal law requirements, the Fund has implemented an anti-money laundering compliance program, which includes the designation of an anti-money laundering compliance officer.
Because every investor has different immediate financial needs and long-term investment goals, the Fund offers investors four Classes of shares: Classes A, B, C and I. Class I shares are only offered to a limited group of investors. Each Class of shares offers a distinct structure of sales charges, distribution and service fees, and other features that are designed to address a variety of needs. Your Morgan Stanley Smith Barney Financial Advisor or other authorized financial representative can help you decide which Class may be most appropriate for you. When purchasing Fund shares, you must specify which Class of shares you wish to purchase.
When you buy Fund shares, the shares are purchased at the next share price calculated (plus any applicable front-end sales charge for Class A shares) after we receive your purchase order. Your payment is due on the third business day after you place your purchase order. We reserve the right to reject any order for the purchase of Fund shares for any reason.
16
Order Processing Fees. Your financial intermediary may charge processing or other fees in connection with the purchase or sale of the Fund's shares. Please consult your financial representative for more information regarding any such fees.
EasyInvest®
A purchase plan that allows you to transfer money automatically from your checking or savings account or from a Money Market Fund on a semi-monthly, monthly or quarterly basis. Contact your Morgan Stanley Smith Barney Financial Advisor for further information about this service.
Minimum Investment Amounts
| Minimum Investment | |||||||||||
| Investment Options | Initial | Additional | |||||||||
| Regular Account | $ | 1,000 | $ | 100 | |||||||
| Individual Retirement Account | $ | 1,000 | $ | 100 | |||||||
| Coverdell Education Savings Account | $ | 500 | $ | 100 | |||||||
| EasyInvest® (Automatically from your checking or savings account or Money Market Fund) | $ | 100 | * | $ | 100 | * | |||||
* Provided your schedule of investments totals $1,000 in 12 months.
There is no minimum investment amount if you purchase Fund shares through: (1) the Adviser's mutual fund asset allocation program; (2) a program, approved by the Fund's Distributor, in which you pay an asset-based fee for advisory, administrative and/or brokerage services; (3) the following programs approved by the Fund's Distributor: (i) qualified state tuition plans described in Section 529 of the Internal Revenue Code or (ii) certain other investment programs that do not charge an asset-based fee; (4) employer-sponsored employee benefit plan accounts; (5) certain deferred compensation programs established by the Adviser or its affiliates for their employees or the Fund's Trustees; or (6) the reinvestment of dividends in additional Fund shares.
Investment Options for Certain Institutional and Other Investors/Class I Shares. To be eligible to purchase Class I shares, you must qualify under one of the investor categories specified in the "Share Class Arrangements" section of this Prospectus.
Subsequent Investments Sent Directly to the Fund. In addition to buying additional Fund shares for an existing account by contacting your Morgan Stanley Smith Barney Financial Advisor, you may send a check directly to the Fund. To buy additional shares in this manner:
n Write a "letter of instruction" to the Fund specifying the name(s) on the account, the account number, the social security or tax identification number, the Class of shares you wish to purchase and the investment amount (which would include any applicable front-end sales charge). The letter must be signed by the account owner(s).
n Make out a check for the total amount payable to: Morgan Stanley Mid Cap Growth Fund.
n Mail the letter and check to Morgan Stanley Services Company Inc. at P.O. Box 219885, Kansas City, MO 64121-9885.
17
How to Exchange Shares
Permissible Fund Exchanges. You may exchange shares of any Class of the Fund for the same Class of any other continuously offered Morgan Stanley Multi-Class Fund or for shares of a Morgan Stanley Money Market Fund or the Morgan Stanley Limited Duration U.S. Government Trust, without the imposition of an exchange fee. In addition, Class Q shares of the Morgan Stanley Global Infrastructure Fund may be exchanged for Class A shares of the Fund without payment of sales charges (including contingent deferred sales charges ("CDSCs")) or the imposition of an exchange fee. Front-end sales charges are not imposed on exchanges of Class A shares.
The current prospectus for each Morgan Stanley Fund describes its investment objective(s), policies and investment minimums, and should be read before investment. Since exchanges are available only into continuously offered Morgan Stanley Funds, exchanges are not available into Morgan Stanley Funds, or classes of Morgan Stanley Funds that are not currently being offered for purchase.
Exchange Procedures. You can process an exchange by contacting your Morgan Stanley Smith Barney Financial Advisor or other authorized financial representative. You may also write the Transfer Agent or call toll-free (800) 869-NEWS, our automated telephone system (which is generally accessible 24 hours a day, seven days a week), to place an exchange order. You automatically have the telephone exchange privilege unless you indicate otherwise by checking the applicable box on the new account application form. If you hold share certificates, no exchanges may be processed until we have received all applicable share certificates.
Exchange requests received on a business day prior to the time shares of the funds involved in the request are priced will be processed on the date of receipt. "Processing" a request means that shares of the fund which you are exchanging will be redeemed at the net asset value per share next determined on the date of receipt. Shares of the fund that you are purchasing will also normally be purchased at the net asset value per share, plus any applicable sales charge, next determined on the date of receipt. Exchange requests received on a business day after the time that shares of the funds involved in the request are priced will be processed on the next business day in the manner described herein.
The Fund may terminate or revise the exchange privilege upon required notice or in certain cases without notice. See "Limitations on Exchanges." The check writing privilege is not available for Money Market Fund shares you acquire in an exchange.
Telephone Exchanges. Morgan Stanley and its subsidiaries, including the Transfer Agent, and the Fund employ procedures considered by them to be reasonable to confirm that instructions communicated by telephone are genuine. Such procedures may include requiring certain personal identification information prior to acting upon telephone instructions, tape-recording telephone communications and providing written confirmation of instructions communicated by telephone. If reasonable procedures are employed, none of Morgan Stanley, the Transfer Agent or the Fund will be liable for following telephone instructions which it reasonably believes to be genuine. Telephone exchanges may not be available if you cannot reach the Transfer Agent by telephone, whether because all telephone lines are busy or for any other reason; in such case, a shareholder would have to use the Fund's other exchange procedures described in this section.
18
Telephone instructions will be accepted if received by the Transfer Agent between 9:00 a.m. and 4:00 p.m. Eastern time on any day the NYSE is open for business. During periods of drastic economic or market changes, it is possible that the telephone exchange procedures may be difficult to implement, although this has not been the case with the Fund in the past.
Margin Accounts. If you have pledged your Fund shares in a margin account, contact your Morgan Stanley Smith Barney Financial Advisor or other authorized financial representative regarding restrictions on the exchange of such shares.
Tax Considerations of Exchanges. If you exchange shares of the Fund for shares of another Morgan Stanley Fund, there are important tax considerations. For tax purposes, the exchange out of the Fund is considered a sale of Fund shares and the exchange into the other fund is considered a purchase. As a result, you may realize a capital gain or loss.
You should review the "Tax Consequences" section and consult your own tax professional about the tax consequences of an exchange.
Limitations on Exchanges. Certain patterns of past exchanges and/or purchase or sale transactions involving the Fund or other Morgan Stanley Funds may result in the Fund rejecting, limiting or prohibiting, at its sole discretion, and without prior notice, additional purchases and/or exchanges and may result in a shareholder's account being closed. Determinations in this regard may be made based on the frequency or dollar amount of the previous exchanges or purchase or sale transactions. The Fund reserves the right to reject an exchange request for any reason.
CDSC Calculations on Exchanges. See the "Share Class Arrangements" section of this Prospectus for a discussion of how applicable CDSCs are calculated for shares of one Morgan Stanley Fund that are exchanged for shares of another.
For further information regarding exchange privileges, you should contact your Morgan Stanley Smith Barney Financial Advisor or call toll-free (800) 869-NEWS.
How to Sell Shares
You can sell some or all of your Fund shares at any time. If you sell Class A, Class B or Class C shares, your net sale proceeds are reduced by the amount of any applicable CDSC. Your shares will be sold at the next price calculated after we receive your order to sell as described below.
| Options | Procedures | ||||||
| Contact Your Financial Advisor | To sell your shares, simply call your Morgan Stanley Smith Barney Financial Advisor or other authorized financial representative. Payment will be sent to the address to which the account is registered or deposited in your brokerage account. | ||||||
19
| Options | Procedures | ||||||
| By Telephone | You can sell your shares by telephone and have the proceeds sent to the address of record or your bank account on record. You automatically have the telephone redemption privilege unless you indicate otherwise by checking the applicable box on the new account application form. Before processing a telephone redemption, keep the following information in mind: n You can establish this option at the time you open the account by completing the Morgan Stanley Funds New Account Application or subsequently by calling toll-free (800) 869-NEWS. n Call toll-free (800) 869-NEWS to process a telephone redemption using our automated telephone system which is generally accessible 24 hours a day, seven days a week. n Your request must be received prior to market close, generally 4:00 p.m. Eastern time. n If your account has multiple owners, the Transfer Agent may rely on the instructions of any one owner. n Proceeds must be made payable to the name(s) and address in which the account is registered. n You may redeem amounts of $50,000 or less daily if the proceeds are to be paid by check or by Automated Clearing House. n This privilege is not available if the address on your account has changed within 15 calendar days prior to your telephone redemption request. n Telephone redemption is available for most accounts other than accounts with shares represented by certificates. If you request to sell shares that were recently purchased by check, the proceeds of that sale may not be sent to you until it has been verified that the check has cleared, which may take up to 15 calendar days from the date of purchase. Morgan Stanley and its subsidiaries, including the Transfer Agent, employ procedures considered by them to be reasonable to confirm that instructions communicated by telephone are genuine. Such procedures may include requiring certain personal identification information prior to acting upon telephone instructions, tape-recording telephone communications and providing written confirmation of instructions communicated by telephone. If reasonable procedures are employed, neither Morgan Stanley nor the Transfer Agent will be liable for following telephone instructions which it reasonably believes to be genuine. Telephone redemptions may not be available if a shareholder cannot reach the Transfer Agent by telephone, whether because all telephone lines are busy or for any other reason; in such case, a shareholder would have to use the Fund's other redemption procedures described in this section. | ||||||
| By Letter | You can also sell your shares by writing a "letter of instruction" that includes: n your account number; n the name of the Fund; n the dollar amount or the number of shares you wish to sell; n the Class of shares you wish to sell; and n the signature of each owner as it appears on the account. | ||||||
20
| Options | Procedures | ||||||
| By Letter (continued) | If you are requesting payment to anyone other than the registered owner(s) or that payment be sent to any address other than the address of the registered owner(s) or pre-designated bank account, you will need a signature guarantee. You can obtain a signature guarantee from an eligible guarantor acceptable to the Transfer Agent. (You should contact the Transfer Agent toll-free at (800) 869-NEWS for a determination as to whether a particular institution is an eligible guarantor.) A notary public cannot provide a signature guarantee. Additional documentation may be required for shares held by a corporation, partnership, trustee or executor. Mail the letter to Morgan Stanley Services Company Inc. at P.O. Box 219886, Kansas City, MO 64121-9886. If you hold share certificates, you must return the certificates, along with the letter and any required additional documentation. A check will be mailed to the name(s) and address in which the account is registered, or otherwise according to your instructions. | ||||||
| Systematic Withdrawal Plan | If your investment in all of the Morgan Stanley Funds has a total market value of at least $10,000, you may elect to withdraw amounts of $25 or more, or in any whole percentage of a fund's balance (provided the amount is at least $25), on a monthly, quarterly, semi-annual or annual basis, from any fund with a balance of at least $1,000. Each time you add a fund to the plan, you must meet the plan requirements. Amounts withdrawn are subject to any applicable CDSC. A CDSC may be waived under certain circumstances. See the Class B waiver categories listed in the "Share Class Arrangements" section of this Prospectus. To sign up for the systematic withdrawal plan, contact your Morgan Stanley Smith Barney Financial Advisor or call toll-free (800) 869-NEWS. You may terminate or suspend your plan at any time. Please remember that withdrawals from the plan are sales of shares, not Fund "distributions," and ultimately may exhaust yo ur account balance. The Fund may terminate or revise the plan at any time. | ||||||
Payment for Sold Shares. After we receive your complete instructions to sell as described above, a check will be mailed to you within seven days, although we will attempt to make payment within one business day. Payment may also be sent to your brokerage account.
Payment may be postponed or the right to sell your shares suspended under unusual circumstances. If you request to sell shares that were recently purchased by check, the proceeds of the sale may not be sent to you until it has been verified that the check has cleared, which may take up to 15 calendar days from the date of purchase.
Payments-in-Kind. If we determine that it is in the best interest of the Fund not to pay redemption proceeds in cash, we may pay you partly or entirely by distributing to you securities held by the Fund. Such in-kind securities may be illiquid and difficult or impossible for a shareholder to sell at a time and at a price that a shareholder would like. Redemptions paid in such securities generally will give rise to income, gain or loss for income tax purposes in the same
21
manner as redemptions paid in cash. In addition, you may incur brokerage costs and a further gain or loss for income tax purposes when you ultimately sell the securities.
Order Processing Fees. Your financial intermediary may charge processing or other fees in connection with the purchase or sale of the Fund's shares. Please consult your financial representative for more information regarding any such fees.
Tax Considerations. Normally, your sale of Fund shares is subject to federal and state income tax. You should review the "Tax Consequences" section of this Prospectus and consult your own tax professional about the tax consequences of a sale.
Reinstatement Privilege. If you sell Fund shares and have not previously exercised the reinstatement privilege, you may, within 35 days after the date of sale, invest any portion of the proceeds in the same Class of Fund shares at their net asset value and receive a pro rata credit for any CDSC paid in connection with the sale.
Involuntary Sales. The Fund reserves the right, on 60 days' notice, to sell the shares of any shareholder (other than shares held in an individual retirement account ("IRA") or 403(b) Custodial Account) whose shares, due to sales by the shareholder, have a value below $100, or in the case of an account opened through EasyInvest®, if after 12 months the shareholder has invested less than $1,000 in the account.
However, before the Fund sells your shares in this manner, we will notify you and allow you 60 days to make an additional investment in an amount that will increase the value of your account to at least the required amount before the sale is processed. No CDSC will be imposed on any involuntary sale.
Margin Accounts. If you have pledged your Fund shares in a margin account, contact your Morgan Stanley Smith Barney Financial Advisor or other authorized financial representative regarding restrictions on the sale of such shares.
Targeted
DividendsSM
You may select to have your Fund distributions automatically invested in other Classes of Fund shares or Classes of another Morgan Stanley Fund that you own. Contact your Morgan Stanley Smith Barney Financial Advisor for further information about this service.
Distributions
The Fund passes substantially all of its earnings from income and capital gains along to its investors as "distributions." The Fund earns income from stocks and interest from fixed-income investments. These amounts are passed along to Fund shareholders as "income dividend distributions." The Fund realizes capital gains whe never it sells securities for a higher price than it paid for them. These amounts may be passed along as "capital gain distributions."
The Fund declares income dividends separately for each Class. Distributions paid on Class A and Class I shares usually will be higher than for Class B and Class C shares because distribution fees that Class B and Class C shares pay are higher. Normally, income dividends are distributed to shareholders annually. Capital gains, if any, are usually distributed in December. The Fund, however, may retain and reinvest any long-term capital gains. The Fund may at times make payments from sources other
22
than income or capital gains that represent a return of a portion of your investment. These payments would not be taxable to you as a shareholder, but would have the effect of reducing your basis in the Fund.
Distributions are reinvested automatically in additional shares of the same Class and automatically credited to your account, unless you request in writing that all distributions be paid in cash. If you elect the cash option, the Fund will mail a check to you no later than seven business days after the distribution is declared. However, if you purchase Fund shares through a Morgan Stanley Smith Barney Financial Advisor or other authorized financial representative within three business days prior to the record date for the distribution, the distribution will automatically be paid to you in cash, even if you did not request to receive all distributions in cash. No interest will accrue on uncashed checks. If you wish to change how your distributions are paid, your request should be received by the Transfer Agent at least five business days prior to the record date of the distributions.
Frequent Purchases and Redemptions of Fund Shares
Frequent purchases and redemptions of Fund shares by Fund shareholders are referred to as "market-timing" or "short-term trading" and may present risks for other share holders of the Fund, which may include, among other things, dilution in the value of Fund shares held by long-term shareholders, interference with the efficient management of the Fund's portfolio, increased brokerage and administrative costs, incurring unwanted taxable gains and forcing the Fund to hold excess levels of cash.
In addition, the Fund is subject to the risk that market-timers and/or short-term traders may take advantage of time zone differences between the foreign markets on which the Fund's portfolio securities trade and the time the Fund's net asset value is calculated ("time-zone arbitrage"). For example, a market-timer may purchase shares of the Fund based on events occurring after foreign market closing prices are established, but before the Fund's net asset value calculation, that are likely to result in higher prices in foreign markets the following day. The market-timer would redeem the Fund's shares the next day, when the Fund's share price would reflect the increased prices in foreign markets, for a quick profit at the expense of long-term Fund shareholders.
Investments in other types of securities also may be susceptible to short-term trading strategies. These investments include securities that are, among other things, thinly traded, traded infrequently or relatively illiquid, which have the risk that the current market price for the securities may not accurately reflect current market values. A shareholder may seek to engage in short-term trading to take advantage of these pricing differences (referred to as "price ar bitrage"). Investments in certain fixed-income securities may be adversely affected by price arbitrage trading strategies.
The Fund's policies with respect to valuing portfolio securities are described in "Shareholder Information—Pricing Fund Shares."
The Fund discourages and does not accommodate frequent purchases and redemptions of Fund shares by Fund shareholders and the Fund's Board of Trustees has adopted policies and procedures with respect to such frequent purchases and redemptions. The Fund's policies with respect to purchases, redemptions and exchanges of Fund shares are described in the "How to Buy Shares," "How to Exchange Shares" and "How to Sell Shares" sections of this Prospectus. Except as described in each of these sections, and with respect to trades that occur through omnibus accounts
23
at intermediaries, as described below, the Fund's policies regarding frequent trading of Fund shares are applied uniformly to all shareholders. With respect to trades that occur through omnibus accounts at intermediaries, such as investment managers, broker-dealers, transfer agents and third party administrators, the Fund (i) requests assurance that such intermediaries currently selling Fund shares have in place internal policies and procedures reasonably designed to address market-timing concerns and has instructed such intermediaries to notify the Fund immediately if they are unable to comply with such policies and procedures, and (ii) requires all prospective intermediaries to agree to cooperate in enforcing the Fund's policies (or, upon prior written approval only, an intermediary's own policies) with respect to frequent purchases, redemptions and exchanges of Fund shares.
Omnibus accounts generally do not identify customers' trading activity to the Fund on an individual ongoing basis. Therefore, with respect to trades that occur through omnibus accounts at financial intermediaries, to some extent, the Fund relies on the financial intermediary to monitor frequent short-term trading within the Fund by the financial intermediary's customers. However, the Fund or the Distributor has entered into agreements with financial intermediaries whereby intermediaries are required to provide certain customer identification and transaction information upon the Fund's request. The Fund may use this information to help identify and prevent market-timing activity in the Fund. There can be no assurance that the Fund will be able to identify or prevent all market-timing activities.
Tax Consequences
As with any investment, you should consider how your Fund investment will be taxed. The tax information in this Prospectus is provided as general information. You should consult your own tax professional about the tax consequences of an investment in the Fund.
Unless your investment in the Fund is through a tax-deferred retirement account, such as a 401(k) plan or IRA, you need to be aware of the possible tax consequences when:
n The Fund makes distributions; and
n You sell Fund shares, including an exchange to another Morgan Stanley Fund.
Taxes on Distributions. Your distributions are normally subject to federal and state income tax when they are paid, whether you take them in cash or reinvest them in Fund shares. A distribution also may be subject to local income tax. Any income dividend distributions and any short-term capital gain distributions are taxable to you as ordinary income. Any long-term capital gain distributions are taxable as long-term capital gains, no matter how long you have owned shares in the Fund.
Under current law (through 2012), if certain holding period requirements are met with respect to your shares, a portion of the income dividends you receive may be taxed at the same rate as long-term capital gains. However, even if income received in the form of income dividends is taxed at the same rates as long-term capital gains, such income will not be considered long-term capital gains for other federal income tax purposes. For example, you generally will not be permitted to offset income dividends with capital losses. Short-term capital gain distributions will continue to be taxed at ordinary income rates.
24
You will be sent a statement (IRS Form 1099-DIV) by February of each year showing the taxable distributions paid to you in the previous year. The statement provides information on your dividends and any capital gains for tax purposes.
Taxes on Sales. Your sale of Fund shares normally is subject to federal and state income tax and may result in a taxable gain or loss to you. A sale also may be subject to local income tax. Your exchange of Fund shares for shares of another Morgan Stanley Fund is treated for tax purposes like a sale of your original shares and a purchase of your new shares. Thus, the exchange may, like a sale, result in a taxable gain or loss to you and will give you a new tax basis for your new shares.
Due to recent legislation, the Fund (or its administrative agent) is required to report to the U.S. Internal Revenue Service ("IRS") and furnish to Fund shareholders the cost basis information for sale transactions of shares purchased on or after January 1, 2012. Shareholders may elect to have one of several cost basis methods applied to their account when calculating the cost basis of shares sold, including average cost, FIFO ("first-in, first-out"), or some other specific identification method. Unless you instruct otherwise, the Fund will use average cost as its default cost basis method, and will treat sales as first coming from shares purchased prior to January 1, 2012. If average cost is used for the first sale of Fund shares covered by these new rules, the shareholder may only use an alternative cost basis method for shares purchased prospectively. Fund shareholders should consult with their tax advisors to determine the best cost basis method for their tax situation.
When you open your Fund account, you should provide your social security or tax identification number on your investment application. By providing this information, you will avoid being subject to federal backup withholding tax on taxable distributions and redemption proceeds (as of the date of this Prospectus this rate is 28% and is scheduled to increase to 31% after 2012). Any withheld amount would be sent to the IRS as an advance payment of your taxes due on your income.
Share Class Arrangements
The Fund offers several Classes of shares having different distribution arrangements designed to provide you with different purchase options according to your investment needs. Your Morgan Stanley Smith Barney Financial Advisor or other authorized financial representative can help you decide which Class may be appropriate for you.
The general public is offered three Classes: Class A shares, Class B shares and Class C shares, which differ principally in terms of sales charges and ongoing expenses. A fourth Class, Class I shares, is offered only to a limited category of investors. Shares that you acquire through reinvested distributions will not be subject to any front-end sales charge or CDSC.
Sales personnel may receive different compensation for selling each Class of shares. The sales charges applicable to each Class provide for the distribution financing of shares of that Class.
25
The chart below compares the sales charge and annual 12b-1 fee applicable to each Class:
| Class | Sales Charge | Maximum Annual 12b-1 Fee | |||||||||
| A | Maximum 5.25% initial sales charge reduced for purchases of $25,000 or more; shares purchased without an initial sales charge are generally subject to a 1.00% CDSC if sold | ||||||||||
| during the first 18 months | 0.25 | % | |||||||||
| B | Maximum 5.00% CDSC during the first year decreasing to 0% after six years | 1.00 | % | ||||||||
| C | 1.00% CDSC during the first year | 1.00 | % | ||||||||
| I | None | None | |||||||||
While Class B and Class C shares do not have any front-end sales charges, their higher ongoing annual expenses (due to higher 12b-1 fees) mean that over time you could end up paying more for these shares than if you were to pay front-end sales charges for Class A shares.
Certain shareholders may be eligible for reduced sales charges (i.e., breakpoint discounts), CDSC waivers and eligibility minimums. Please see the information for each Class set forth below for specific eligibility requirements. You must notify your Morgan Stanley Smith Barney Financial Advisor or other authorized financial representative (or the Transfer Agent if you purchase shares directly through the Fund) at the time a purchase order (or in the case of Class B or Class C shares, a redemption order) is placed that the purchase (or redemption) qualifies for a reduced sales charge (i.e., breakpoint discount), CDSC waiver or eligibility minimum. Similar notification must be made in writing when an order is placed by mail. The reduced sales charge, CDSC waiver or eligibility minimum will not be granted if: (i) notification is not furnished at the time of order; or (ii) a review of the records of Morgan Stanley Smith Barney, Morgan Stanley & Co. LLC ("Morgan Stanley & Co.") or other authorized dealer of Fund shares, or the Transfer Agent does not confirm your represented holdings.
In order to obtain a reduced sales charge (i.e., breakpoint discount) or to meet an eligibility minimum, it may be necessary at the time of purchase for you to inform your Morgan Stanley Smith Barney Financial Advisor or other authorized financial representative (or the Transfer Agent if you purchase shares directly through the Fund) of the existence of other accounts in which there are holdings eligible to be aggregated to meet the sales load breakpoints or eligibility minimums. In order to verify your eligibility, you may be required to provide account statements and/or confirmations regarding shares of the Fund or other Morgan Stanley Funds held in all related accounts described below at Morgan Stanley Smith Barney, Morgan Stanley & Co. or by other authorized dealers, as well as shares held by related parties, such as members of the same family or household, in order to determine whether you have met a sales load breakpoint or eligibility minimum. The Fund makes available, in a clear and prominent format, free of charge, on its web site, www.morganstanley.com, information regarding applicable sales loads, reduced sales charges (i.e., breakpoint discounts), sales load waivers and eligibility minimums. The web site includes hyperlinks that facilitate access to the information.
CLASS A SHARES Class A shares are sold at net asset value plus an initial sales charge of up to 5.25% of the public offering price. The initial sales charge is reduced for purchases of $25,000 or more according to the schedule below. Investments of $1 million or more are not subject to an initial sales charge, but are generally subject to a CDSC of 1.00% on sales made within 18 months after the last day of the month of purchase. The CDSC will be assessed in the same manner and with the same CDSC waivers as with Class B shares. In addition, the CDSC on Class A shares will be
26
waived in connection with sales of Class A shares for which no commission or transaction fee was paid by the Distributor to authorized dealers at the time of purchase of such shares. Class A shares are also subject to a distribution and shareholder services (12b-1) fee of up to 0.25% of the average daily net assets of the Class. The maximum annual 12b-1 fee payable by Class A shares is lower than the maximum annual 12b-1 fee payable by Class B or Class C shares.
The offering price of Class A shares includes a sales charge (expressed as a percentage of the public offering price) on a single transaction as shown in the following table:
Front-End Sales Charge or FSC
An initial sales charge you pay when purchasing Class A shares that is based on a percentage of the offering price. The percentage declines based upon the dollar value of Class A shares you purchase. We offer three ways to reduce your Class A sales charges—the Combined Purchase Privilege, Right of Accumulation and Letter of Intent.
| Front-End Sales Charge | |||||||||||
| Amount of Single Transaction | Percentage of Public Offering Price | Approximate Percentage of Net Amount Invested | |||||||||
| Less than $25,000 | 5.25 | % | 5.54 | % | |||||||
| $25,000 but less than $50,000 | 4.75 | % | 4.99 | % | |||||||
| $50,000 but less than $100,000 | 4.00 | % | 4.17 | % | |||||||
| $100,000 but less than $250,000 | 3.00 | % | 3.09 | % | |||||||
| $250,000 but less than $500,000 | 2.50 | % | 2.56 | % | |||||||
| $500,000 but less than $1 million | 2.00 | % | 2.04 | % | |||||||
| $1 million and over | 0.00 | % | 0.00 | % | |||||||
You may benefit from a reduced sales charge schedule (i.e., breakpoint discount) for purchases of Class A shares of the Fund, by combining, in a single transaction, your purchase with purchases of Class A shares of the Fund by the following related accounts:
n A single account (including an individual, trust or fiduciary account).
n A family member account (limited to spouse, and children under the age of 21).
n Pension, profit sharing or other employee benefit plans of companies and their affiliates.
n Employer sponsored and individual retirement accounts (including IRAs, Keogh, 401(k), 403(b), 408(k), and 457(b) Plans).
n Tax-exempt organizations.
n Groups organized for a purpose other than to buy mutual fund shares.
Combined Purchase Privilege. You will have the benefit of reduced sales charges by combining purchases of Class A shares of the Fund for any related account in a single transaction with purchases of any class of shares of other Morgan Stanley Multi-Class Funds for the related account or any other related account. For the purpose of this combined purchase privilege, a "related account" is:
n A single account (including an individual account, a joint account and a trust account established solely for the benefit of the individual).
n A family member account (limited to spouse, and children under the age of 21, but including trust accounts established solely for the benefit of a spouse, or children under the age of 21).
n An IRA and single participant retirement account (such as a Keogh).
n An UGMA/UTMA account.
27
Right of Accumulation. You may benefit from a reduced sales charge if the cumulative net asset value of Class A shares of the Fund purchased in a single transaction, together with the net asset value of all classes of shares of Morgan Stanley Multi-Class Funds (including shares of Morgan Stanley Non-Multi-Class Funds which resulted from an exchange from Morgan Stanley Multi-Class Funds) held in related accounts, amounts to $25,000 or more. For the purposes of the right of accumulation privilege, a related account is any one of the accounts listed under "Combined Purchase Privilege" above.
Notification. You must notify your Morgan Stanley Smith Barney Financial Advisor or other authorized financial representative (or the Transfer Agent if you purchase shares directly through the Fund) at the time a purchase order is placed, that the purchase qualifies for a reduced sales charge under any of the privileges discussed above. Similar notification must be made in writing when an order is placed by mail. The reduced sales charge will not be granted if: (i) notification is not furnished at the time of the order; or (ii) a review of the records of Morgan Stanley Smith Barney or other authorized dealer of Fund shares or the Transfer Agent does not confirm your represented holdings.
In order to obtain a reduced sales charge under any of the privileges discussed above, it may be necessary at the time of purchase for you to inform your Morgan Stanley Smith Barney Financial Advisor or other authorized financial representative (or the Transfer Agent if you purchase shares directly through the Fund) of the existence of other accounts in which there are holdings eligible to be aggregated to meet the sales load breakpoint and/or right of accumulation threshold. In order to verify your eligibility, you may be required to provide account statements and/or confirmations regarding shares of the Fund or other Morgan Stanley Funds held in all related accounts described above at Morgan Stanley Smith Barney or by other authorized dealers, as well as shares held by related parties, such as members of the same family or household, in order to determine whether you have met the sales load breakpoint and/or right of accumulation threshold. The Fund makes available, in a clear and prominent format, free of charge, on its web site, www.morganstanley.com, information regarding applicable sales loads and reduced sales charges (i.e., breakpoint discounts). The web site includes hyperlinks that facilitate access to the information.
Letter of Intent. The above schedule of reduced sales charges for larger purchases also will be available to you if you enter into a written "Letter of Intent." A Letter of Intent provides for the purchase of Class A shares of the Fund or other Multi-Class Funds within a 13-month period. The initial purchase under a Letter of Intent must be at least 5% of the stated investment goal. The Letter of Intent does not preclude the Fund (or any other Multi-Class Fund) from discontinuing sales of its shares. To determine the applicable sales charge reduction, you may also include: (1) the cost of shares of other Morgan Stanley Funds which were previously purchased at a price including a front-end sales charge during the 90-day period prior to the Distributor receiving the Letter of Intent, and (2) the historical cost of shares of other funds you currently own acquired in exchange for shares of funds purchased during that period at a price including a front-end sales charge. You may combine purchases and exchanges by family members (limited to spouse, and children under the age of 21) during the periods referenced in (1) and (2) above. You should retain any records necessary to substantiate historical costs because the Fund, the Transfer Agent and any financial intermediaries may not maintain this information. You can obtain a Letter of Intent by contacting your Morgan Stanley Smith Barney Financial Advisor or other authorized financial representative, or by calling toll-free (800) 869-NEWS. If you do not achieve the stated investment goal within the 13-month period, you are required to pay the difference between the sales charges otherwise applicable and sales charges actually paid, which may be deducted from your investment. Shares acquired through reinvestment of distributions are not aggregated to achieve the stated investment goal.
28
Other Sales Charge Waivers. In addition to investments of $1 million or more, your purchase of Class A shares is not subject to a front-end sales charge (or a CDSC upon sale) if your account qualifies under one of the following categories:
n A trust for which a banking affiliate of the Adviser provides discretionary trustee services.
n Persons participating in a fee-based investment program (subject to all of its terms and conditions, including termination fees, and mandatory sale or transfer restrictions on termination) approved by the Fund's Distributor, pursuant to which they pay an asset-based fee for investment advisory, administrative and/or brokerage services.
n Qualified state tuition plans described in Section 529 of the Internal Revenue Code and donor-advised charitable gift funds (subject to all applicable terms and conditions) and certain other investment programs that do not charge an asset-based fee and have been approved by the Fund's Distributor.
n Employer-sponsored employee benefit plans, whether or not qualified under the Internal Revenue Code, for which an entity independent from Morgan Stanley serves as recordkeeper under an alliance or similar agreement with Morgan Stanley's Retirement Plan Solutions ("Morgan Stanley Eligible Plans").
n A Morgan Stanley Eligible Plan whose Class B shares have converted to Class A shares, regardless of the plan's asset size or number of eligible employees.
n Insurance company separate accounts that have been approved by the Fund's Distributor.
n Current or retired Directors or Trustees of the Morgan Stanley Funds, such persons' spouses, and children under the age of 21, and trust accounts for which any of such persons is a beneficiary.
n Current or retired directors, officers and employees of Morgan Stanley and any of its subsidiaries, such persons' spouses, and children under the age of 21, and trust accounts for which any of such persons is a beneficiary.
CLASS B SHARES Class B shares are offered at net asset value with no initial sales charge but are subject to a CDSC, as set forth in the table below. For the purpose of calculating the CDSC, shares are deemed to have been purchased on the last day of the month during which they were purchased.
Contingent Deferred Sales Charge or CDSC
A fee you pay when you sell shares of certain Morgan Stanley Funds purchased without an initial sales charge. This fee declines the longer you hold your shares as set forth in the table.
| Year Since Purchase Payment Made | CDSC as a Percentage of Amount Redeemed | ||||||
| First | 5.0 | % | |||||
| Second | 4.0 | % | |||||
| Third | 3.0 | % | |||||
| Fourth | 2.0 | % | |||||
| Fifth | 2.0 | % | |||||
| Sixth | 1.0 | % | |||||
| Seventh and thereafter | None | ||||||
29
The CDSC is assessed on an amount equal to the lesser of the then market value of the shares or the historical cost of the shares (which is the amount actually paid for the shares at the time of original purchase) being redeemed. Accordingly, no sales charge is imposed on increases in net asset value above the initial purchase price. In determining whether a CDSC applies to a redemption, it is assumed that the shares being redeemed first are any shares in the shareholder's Fund account that are not subject to a CDSC, followed by shares held the longest in the shareholder's account.
Broker-dealers or other financial intermediaries may impose a limit on the dollar value of a Class B share purchase order that they will accept. You should discuss with your financial advisor which share class is most appropriate for you, based on the size of your investment, your expected time horizon for holding the shares and other factors, bearing in mind the availability of reduced sales loads on Class A share purchases of $25,000 or more and for existing shareholders who hold over $25,000 in Morgan Stanley Funds.
CDSC Waivers. A CDSC, if otherwise applicable, will be waived in the case of:
n Sales of shares held at the time you die or become disabled (within the definition in Section 72(m)(7) of the Internal Revenue Code which relates to the ability to engage in gainful employment), if the shares are: (i) registered either in your individual name or in the names of you and your spouse as joint tenants with right of survivorship; (ii) registered in the name of a trust of which (a) you are the settlor and that is revocable by you (i.e., a "living trust") or (b) you and your spouse are the settlors and that is revocable by you or your spouse (i.e., a "joint living trust"); or (iii) held in a qualified corporate or self-employed retirement plan, IRA or 403(b) Custodial Account; provided in each case that the sale is requested within one year after your death or initial determination of disability.
n Sales in connection with the following retirement plan "distributions": (i) lump-sum or other distributions from a qualified corporate or self-employed retirement plan following retirement (or, in the case of a "key employee" of a "top heavy" plan, following attainment of age 59 1/2); (ii) required minimum distributions and certain other distributions (such as those following attainment of age 59 1/2) from an IRA or 403(b) Custodial Account, or (iii) a tax-free return of an excess IRA contribution (a "distribution" does not include a direct transfer of IRA, 403(b) Custodial Account or retirement plan assets to a successor custodian or trustee).
n Sales of shares in connection with the systematic withdrawal plan of up to 12% annually of the value of each fund from which plan sales are made. The percentage is determined on the date you establish the systematic withdrawal plan and based on the next calculated share price. You may have this CDSC waiver applied in amounts up to 1% per month, 3% per quarter, 6% semi-annually or 12% annually. Shares with no CDSC will be sold first, followed by those with the lowest CDSC. As such, the waiver benefit will be reduced by the amount of your shares that are not subject to a CDSC. If you suspend your participation in the plan, you may later resume plan payments without requiring a new determination of the account value for the 12% CDSC waiver.
The Fund's Distributor may require confirmation of your entitlement before granting a CDSC waiver. If you believe you are eligible for a CDSC waiver, please contact your Morgan Stanley Smith Barney Financial Advisor or other authorized financial representative or call toll-free (800) 869-NEWS.
Distribution Fee. Class B shares are subject to an annual distribution and shareholder services (12b-1) fee of up to 1.00% of the average daily net assets of Class B shares. The maximum annual 12b-1 fee payable by Class B shares is higher than the maximum annual 12b-1 fee payable by Class A shares.
30
Conversion Feature. After eight years, Class B shares generally will convert automatically to Class A shares of the Fund with no initial sales charge. The eight-year period runs from the last day of the month in which the shares were purchased or, in the case of Class B shares acquired through an exchange, from the last day of the month in which the original Class B shares were purchased; the shares will convert to Class A shares based on their relative net asset values in the month following the eight-year period. At the same time, an equal proportion of Class B shares acquired through automatically reinvested distributions will convert to Class A shares on the same basis. This conversion will be suspended during any period in which the expense ratio of the Class B shares of the Fund is lower than the expense ratio of the Class A shares of the Fund.
In the case of Class B shares held in a Morgan Stanley Eligible Plan, the plan is treated as a single investor and all Class B shares will convert to Class A shares on the conversion date of the Class B shares of a Morgan Stanley Fund purchased by that plan.
If you exchange your Class B shares for shares of a Money Market Fund or the Limited Duration U.S. Government Trust, the holding period for conversion is frozen as of the last day of the month of the exchange and resumes on the last day of the month you exchange back into Class B shares.
Exchanging Shares Subject to a CDSC. There are special considerations when you exchange Fund shares that are subject to a CDSC. When determining the length of time you held the shares and the corresponding CDSC rate, any period (starting at the end of the month) during which you held shares of a fund that does not charge a CDSC will not be counted. Thus, in effect the "holding period" for purposes of calculating the CDSC is frozen upon exchanging into a fund that does not charge a CDSC.
For example, if you held Class B shares of the Fund for one year, exchanged to Class B of another Morgan Stanley Multi-Class Fund for another year, then sold your shares, a CDSC rate of 4% would be imposed on the shares based on a two-year holding period—one year for each fund. However, if you had exchanged the shares of the Fund for a Money Market Fund (which does not charge a CDSC) instead of the Multi-Class Fund, then sold your shares, a CDSC rate of 5% would be imposed on the shares based on a one-year holding period. The one year in the Money Market Fund would not be counted. Nevertheless, if shares subject to a CDSC are exchanged for a fund that does not charge a CDSC, you will receive a credit when you sell the shares equal to the 12b-1 fees, if any, you paid on those shares while in that fund up to the amount of any applicable CDSC.
CLASS C SHARES Class C shares are sold at net asset value with no initial sales charge, but are subject to a CDSC of 1.00% on sales made within one year after the last day of the month of purchase. The CDSC will be assessed in the same manner and with the same CDSC waivers as with Class B shares.
Broker-dealers or other financial intermediaries may impose a limit on the dollar value of a Class C share purchase order that they will accept. For example, a Morgan Stanley Smith Barney Financial Advisor generally will not accept purchase orders for Class C shares that in the aggregate amount to $250,000 or more. You should discuss with your financial advisor which share class is most appropriate for you based on the size of your investment, your expected time horizon for holding the shares and other factors, bearing in mind the availability of reduced sales loads on Class A share purchases of $25,000 or more and for existing shareholders who hold over $25,000 in Morgan Stanley Funds.
31
Distribution Fee. Class C shares are subject to an annual distribution and shareholder services (12b-1) fee of up to 1.00% of the average daily net assets of that Class. The maximum annual 12b-1 fee payable by Class C shares is higher than the maximum annual 12b-1 fee payable by Class A shares. Unlike Class B shares, Class C shares have no conversion feature and, accordingly, an investor that purchases Class C shares may be subject to distribution and shareholder services (12b-1) fees applicable to Class C shares for as long as the investor owns such shares.
CLASS I SHARES Class I shares are offered without any sales charge on purchases or sales and without any distribution and shareholder services (12b-1) fee. Class I shares are offered only to investors meeting an initial investment minimum of $5 million ($25 million for Morgan Stanley Eligible Plans) and the following investor categories:
n Investors participating in the Adviser's or an affiliate's mutual fund asset allocation program (subject to all of its terms and conditions, including termination fees, and mandatory sale or transfer restrictions on termination) pursuant to which they pay an asset-based fee.
n Persons participating in a fee-based investment program (subject to all of its terms and conditions, including termination fees, and mandatory sale or transfer restrictions on termination) approved by the Fund's Distributor pursuant to which they pay an asset-based fee for investment advisory, administrative and/or brokerage services.
n Certain investment programs that do not charge an asset-based fee and have been approved by the Fund's Distributor.
n Employee benefit plans maintained by Morgan Stanley or any of its subsidiaries for the benefit of certain employees of Morgan Stanley and its subsidiaries.
n Certain unit investment trusts sponsored by Morgan Stanley & Co. or its affiliates.
n Certain other open-end investment companies whose shares are distributed by the Fund's Distributor.
n Investors who were shareholders of the Dean Witter Retirement Series on September 11, 1998 for additional purchases for their former Dean Witter Retirement Series accounts.
n The Adviser and its affiliates with respect to shares held in connection with certain deferred compensation programs established for their employees or the Fund's Trustees.
A purchase order that meets the requirements for investment in Class I shares can be made only in Class I shares.
Class I shares are not offered for investments made through Section 529 plans, donor-advised charitable gift funds and insurance company separate accounts (regardless of the size of the investment).
Meeting Class I Eligibility Minimums. To meet the $5 million ($25 million for Morgan Stanley Eligible Plans) initial investment to qualify to purchase Class I shares you may combine: (1) purchases in a single transaction of Class I shares of the Fund and other Morgan Stanley Multi-Class Funds; and/or (2) previous purchases of Class A and Class I shares of Multi-Class Funds you currently own, along with shares of Morgan Stanley Funds you currently own that you acquired in exchange for those shares. Shareholders cannot combine purchases made by family members or a shareholder's other related accounts in a single transaction for purposes of meeting the $5 million initial investment minimum requirement to qualify to purchase Class I shares.
32
NO SALES CHARGES FOR REINVESTED CASH DISTRIBUTIONS If you receive a cash payment representing an ordinary dividend or capital gain and you reinvest that amount in the applicable Class of shares by returning the check within 30 days of the payment date, the purchased shares would not be subject to an initial sales charge or CDSC.
PLAN OF DISTRIBUTION (RULE 12b-1 FEES) The Fund has adopted a Plan of Distribution in accordance with Rule 12b-1 under the Investment Company Act with respect to the Class A, Class B and Class C shares. (Class I shares are offered without any 12b-1 fee.) The Plan allows the Fund to pay distribution fees for the sale and distribution of these shares. It also allows the Fund to pay for services to shareholders of Class A, Class B and Class C shares. Because these fees are paid out of the Fund's assets on an ongoing basis, over time these fees will increase the cost of your investment and reduce your return in these Classes and may cost you more than paying other types of sales charges.
Additional Information
The Adviser and/or Distributor may pay compensation (out of their own funds and not as an expense of the Fund) to certain affiliated or unaffiliated broker-dealers or other financial intermediaries or service providers in connection with the sale, distribution, marketing or retention of Fund shares and/or shareholder servicing. Such compensation may be significant in amount and the prospect of receiving any such additional compensation may provide such affiliated or unaffiliated entities with an incentive to favor sales of shares of the Fund over other investment options. Any such payments will not change the net asset value or the price of the Fund's shares. For more information, please see the Fund's SAI.
33
Financial Highlights
The financial highlights table is intended to help you understand the Fund's financial performance for the periods indicated. Certain information reflects financial results for a single Fund share throughout each period. The total returns in the table represent the rate an investor would have earned or lost on an investment in the Fund (assuming reinvestment of all dividends and distributions). The ratio of expenses to average net assets listed in the tables below for each class of shares of the Fund are based on the average net assets of the Fund for each of the periods listed in the tables. To the extent that the Fund's average net assets decrease over the Fund's next fiscal year, such expense ratios can be expected to increase, potentially significantly, because certain fixed costs will be spread over a smaller amount of assets.
The information for the fiscal year ended September 30, 2011 has been audited by Ernst & Young LLP, an independent registered public accounting firm, whose report, along with the Fund's financial statements, are incorporated by reference in the SAI from the Fund's annual report, which is available upon request. The financial highlights for each of the years in the four-year period ended September 30, 2010 have been audited by another independent registered public accounting firm.
CLASS A SHARES
| For the Year Ended September 30, | 2011 | 2010^ | 2009^ | 2008^ | 2007^ | ||||||||||||||||||
| Selected Per Share Data: | |||||||||||||||||||||||
| Net asset value, beginning of period | $ | 30.13 | $ | 24.22 | $ | 23.78 | $ | 35.96 | $ | 27.00 | |||||||||||||
| Income (loss) from investment operations: | |||||||||||||||||||||||
| Net investment income (loss)(1) | (0.07 | ) | 0.01 | (0.06 | ) | (0.05 | ) | 0.05 | |||||||||||||||
| Net realized and unrealized gain (loss) | 0.33 | 5.90 | 1.83 | (9.46 | ) | 8.91 | |||||||||||||||||
| Total income (loss) from investment operations | 0.26 | 5.91 | 1.77 | (9.51 | ) | 8.96 | |||||||||||||||||
| Less distributions from net realized gain | — | — | (1.33 | ) | (2.67 | ) | — | ||||||||||||||||
| Net asset value, end of period | $ | 30.39 | $ | 30.13 | $ | 24.22 | $ | 23.78 | $ | 35.96 | |||||||||||||
| Total Return(2) | 0.86 | % | 24.40 | % | 10.94 | % | (28.53 | )% | 33.19 | % | |||||||||||||
| Ratios to Average Net Assets(3): | |||||||||||||||||||||||
| Total expenses | 0.97 | %(4) | 1.04 | %(4) | 1.17 | %(4) | 0.99 | %(4) | 1.01 | %(4) | |||||||||||||
| Net investment income (loss) | (0.19 | )%(4) | 0.02 | %(4) | (0.34 | )%(4) | (0.17 | )%(4) | 0.15 | %(4) | |||||||||||||
| Rebate from Morgan Stanley affiliate | 0.00 | %(5) | 0.00 | %(5) | 0.00 | %(5) | 0.00 | %(5) | 0.00 | %(5) | |||||||||||||
| Supplemental Data: | |||||||||||||||||||||||
| Net assets, end of period, in thousands | $ | 302,166 | $ | 319,321 | $ | 228,332 | $ | 232,192 | $ | 295,694 | |||||||||||||
| Portfolio turnover rate | 46 | % | 46 | % | 27 | % | 59 | % | 72 | % | |||||||||||||
^ Beginning with the year ended September 30, 2011, the Fund was audited by Ernst & Young LLP. The previous years were audited by another independent registered public accounting firm.
(1) The per share amounts were computed using an average number of shares outstanding during the period.
(2) Does not reflect the deduction of sales charge. Calculated based on the net asset value as of the last business day of the period.
(3) Reflects overall Fund ratios for investment income and non-class specific expenses.
(4) The ratios reflect the rebate of certain Fund expenses in connection with investments in a Morgan Stanley affiliate during the period. The effect of the rebate on the ratios is disclosed in the above table as "Rebate from Morgan Stanley affiliate."
(5) Amount is less than 0.005%.
34
CLASS B SHARES
| For the Year Ended September 30, | 2011 | 2010^ | 2009^ | 2008^ | 2007^ | ||||||||||||||||||
| Selected Per Share Data: | |||||||||||||||||||||||
| Net asset value, beginning of period | $ | 26.34 | $ | 21.34 | $ | 21.33 | $ | 32.76 | $ | 24.78 | |||||||||||||
| Income (loss) from investment operations: | |||||||||||||||||||||||
| Net investment loss(1) | (0.28 | ) | (0.17 | ) | (0.17 | ) | (0.25 | ) | (0.17 | ) | |||||||||||||
| Net realized and unrealized gain (loss) | 0.31 | 5.17 | 1.51 | (8.51 | ) | 8.15 | |||||||||||||||||
| Total income (loss) from investment operations | 0.03 | 5.00 | 1.34 | (8.76 | ) | 7.98 | |||||||||||||||||
| Less distributions from net realized gain | — | — | (1.33 | ) | (2.67 | ) | — | ||||||||||||||||
| Net asset value, end of period | $ | 26.37 | $ | 26.34 | $ | 21.34 | $ | 21.33 | $ | 32.76 | |||||||||||||
| Total Return(2) | 0.11 | % | 23.43 | % | 10.12 | % | (29.08 | )% | 32.24 | % | |||||||||||||
| Ratios to Average Net Assets(3): | |||||||||||||||||||||||
| Total expenses | 1.72 | %(4) | 1.79 | %(4) | 1.92 | %(4) | 1.75 | %(4) | 1.77 | %(4) | |||||||||||||
| Net investment loss | (0.94 | )%(4) | (0.73 | )%(4) | (1.09 | )%(4) | (0.93 | )%(4) | (0.61 | )%(4) | |||||||||||||
| Rebate from Morgan Stanley affiliate | 0.00 | %(5) | 0.00 | %(5) | 0.00 | %(5) | 0.00 | %(5) | 0.00 | %(5) | |||||||||||||
| Supplemental Data: | |||||||||||||||||||||||
| Net assets, end of period, in thousands | $ | 10,338 | $ | 16,315 | $ | 21,541 | $ | 33,659 | $ | 126,446 | |||||||||||||
| Portfolio turnover rate | 46 | % | 46 | % | 27 | % | 59 | % | 72 | % | |||||||||||||
^ Beginning with the year ended September 30, 2011, the Fund was audited by Ernst & Young LLP. The previous years were audited by another independent registered public accounting firm.
(1) The per share amounts were computed using an average number of shares outstanding during the period.
(2) Does not reflect the deduction of sales charge. Calculated based on the net asset value as of the last business day of the period.
(3) Reflects overall Fund ratios for investment income and non-class specific expenses.
(4) The ratios reflect the rebate of certain Fund expenses in connection with investments in a Morgan Stanley affiliate during the period. The effect of the rebate on the ratios is disclosed in the above table as "Rebate from Morgan Stanley affiliate."
(5) Amount is less than 0.005%.
35
Financial Highlights (Continued)
CLASS C SHARES
| For the Year Ended September 30, | 2011 | 2010^ | 2009^ | 2008^ | 2007^ | ||||||||||||||||||
| Selected Per Share Data: | |||||||||||||||||||||||
| Net asset value, beginning of period | $ | 26.46 | $ | 21.43 | $ | 21.41 | $ | 32.88 | $ | 24.87 | |||||||||||||
| Income (loss) from investment operations: | |||||||||||||||||||||||
| Net investment loss(1) | (0.29 | ) | (0.17 | ) | (0.17 | ) | (0.25 | ) | (0.17 | ) | |||||||||||||
| Net realized and unrealized gain (loss) | 0.31 | 5.20 | 1.52 | (8.55 | ) | 8.18 | |||||||||||||||||
| Total income (loss) from investment operations | 0.02 | 5.03 | 1.35 | (8.80 | ) | 8.01 | |||||||||||||||||
| Less distributions from net realized gain | — | — | (1.33 | ) | (2.67 | ) | — | ||||||||||||||||
| Net asset value, end of period | $ | 26.48 | $ | 26.46 | $ | 21.43 | $ | 21.41 | $ | 32.88 | |||||||||||||
| Total Return(2) | 0.11 | % | 23.47 | % | 10.12 | % | (29.08 | )% | 32.21 | % | |||||||||||||
| Ratios to Average Net Assets(3): | |||||||||||||||||||||||
| Total expenses | 1.72 | %(4) | 1.79 | %(4) | 1.92 | %(4) | 1.72 | %(4) | 1.77 | %(4) | |||||||||||||
| Net investment loss | (0.94 | )%(4) | (0.73 | )%(4) | (1.09 | )%(4) | (0.90 | )%(4) | (0.61 | )%(4) | |||||||||||||
| Rebate from Morgan Stanley affiliate | 0.00 | %(5) | 0.00 | %(5) | 0.00 | %(5) | 0.00 | %(5) | 0.00 | %(5) | |||||||||||||
| Supplemental Data: | |||||||||||||||||||||||
| Net assets, end of period, in thousands | $ | 20,491 | $ | 18,090 | $ | 15,339 | $ | 17,085 | $ | 29,267 | |||||||||||||
| Portfolio turnover rate | 46 | % | 46 | % | 27 | % | 59 | % | 72 | % | |||||||||||||
^ Beginning with the year ended September 30, 2011, the Fund was audited by Ernst & Young LLP. The previous years were audited by another independent registered public accounting firm.
(1) The per share amounts were computed using an average number of shares outstanding during the period.
(2) Does not reflect the deduction of sales charge. Calculated based on the net asset value as of the last business day of the period.
(3) Reflects overall Fund ratios for investment income and non-class specific expenses.
(4) The ratios reflect the rebate of certain Fund expenses in connection with investments in a Morgan Stanley affiliate during the period. The effect of the rebate on the ratios is disclosed in the above table as "Rebate from Morgan Stanley affiliate."
(5) Amount is less than 0.005%.
36
CLASS I SHARES
| For the Year Ended September 30, | 2011 | 2010^ | 2009^ | 2008^ | 2007^ | ||||||||||||||||||
| Selected Per Share Data: | |||||||||||||||||||||||
| Net asset value, beginning of period | $ | 31.32 | $ | 25.13 | $ | 24.53 | $ | 36.94 | $ | 27.66 | |||||||||||||
| Income (loss) from investment operations: | |||||||||||||||||||||||
| Net investment income(1) | 0.02 | 0.07 | 0.00 | (2) | 0.03 | 0.12 | |||||||||||||||||
| Net realized and unrealized gain (loss) | 0.32 | 6.12 | 1.93 | (9.77 | ) | 9.16 | |||||||||||||||||
| Total income (loss) from investment operations | 0.34 | 6.19 | 1.93 | (9.74 | ) | 9.28 | |||||||||||||||||
| Less distributions from net realized gain | — | — | (1.33 | ) | (2.67 | ) | — | ||||||||||||||||
| Net asset value, end of period | $ | 31.66 | $ | 31.32 | $ | 25.13 | $ | 24.53 | $ | 36.94 | |||||||||||||
| Total Return(3) | 1.12 | % | 24.63 | % | 11.27 | % | (28.39 | )% | 33.55 | % | |||||||||||||
| Ratios to Average Net Assets(4): | |||||||||||||||||||||||
| Total expenses | 0.72 | %(5) | 0.79 | %(5) | 0.92 | %(5) | 0.75 | %(5) | 0.77 | %(5) | |||||||||||||
| Net investment income (loss) | 0.06 | %(5) | 0.27 | %(5) | (0.09 | )%(5) | 0.07 | %(5) | 0.39 | %(5) | |||||||||||||
| Rebate from Morgan Stanley affiliate | 0.00 | %(6) | 0.00 | %(6) | 0.00 | %(6) | 0.00 | %(6) | 0.00 | %(6) | |||||||||||||
| Supplemental Data: | |||||||||||||||||||||||
| Net assets, end of period, in thousands | $ | 2,297 | $ | 2,589 | $ | 1,795 | $ | 10,158 | $ | 23,024 | |||||||||||||
| Portfolio turnover rate | 46 | % | 46 | % | 27 | % | 59 | % | 72 | % | |||||||||||||
^ Beginning with the year ended September 30, 2011, the Fund was audited by Ernst & Young LLP. The previous years were audited by another independent registered public accounting firm.
(1) The per share amounts were computed using an average number of shares outstanding during the period.
(2) Amount is less than $0.005.
(3) Calculated based on the net asset value as of the last business day of the period.
(4) Reflects overall Fund ratios for investment income and non-class specific expenses.
(5) The ratios reflect the rebate of certain Fund expenses in connection with investments in a Morgan Stanley affiliate during the period. The effect of the rebate on the ratios is disclosed in the above table as "Rebate from Morgan Stanley affiliate."
(6) Amount is less than 0.005%.
37
Additional information about the Fund's investments is available in the Fund's Annual and Semiannual Reports to Shareholders. In the Fund's Annual Report, you will find a discussion of the market conditions and investment strategies that significantly affected the Fund's performance during its last fiscal year.
The Fund's Statement of Additional Information also provides additional information about the Fund. The Statement of Additional Information is incorporated herein by reference (legally is part of this Prospectus). For a free copy of the Fund's Annual Report, Semiannual Report or Statement of Additional Information, to request other information about the Fund or to make shareholder inquiries, please call toll-free (800) 869-NEWS. Free copies of these documents are also available from our Internet site at: www.morganstanley.com/im.
You also may obtain information about the Fund by calling your Morgan Stanley Smith Barney Financial Advisor or by visiting our Internet site.
Information about the Fund (including the Statement of Additional Information) can be reviewed and copied at the SEC Public Reference Room in Washington, DC. Information about the Reference Room's operations may be obtained by calling the SEC at (202) 551-8090. Reports and other information about the Fund are available on the EDGAR Database on the SEC's Internet site at: www.sec.gov and copies of this information may be obtained, after paying a duplicating fee, by electronic request at the following E-mail address: publicinfo@sec.gov, or by writing to the Public Reference Section of the SEC, Washington, DC 20549-1520.

INVESTMENT MANAGEMENT
Morgan Stanley
Mid Cap Growth Fund

Prospectus
January 31, 2012
(THE FUND'S INVESTMENT COMPANY ACT FILE NO. IS 811-3639)
Morgan Stanley Distribution, Inc., member FINRA.
© 2012 Morgan Stanley

DGRPRO-00
INVESTMENT MANAGEMENT

Welcome, Shareholder:
In this report, you'll learn about how your investment in Morgan Stanley Mid Cap Growth Fund performed during the annual period. We will provide an overview of the market conditions, and discuss some of the factors that affected performance during the reporting period. In addition, this report includes the Fund's financial statements and a list of Fund investments.
This material must be preceded or accompanied by a prospectus for the fund being offered.
Market forecasts provided in this report may not necessarily come to pass. There is no assurance that the Fund will achieve its investment objective. The Fund is subject to market risk, which is the possibility that market values of securities owned by the Fund will decline and, therefore, the value of the Fund's shares may be less than what you paid for them. Accordingly, you can lose money investing in this Fund. Please see the prospectus for more complete information on investment risks.
Fund Report (unaudited)
For the year ended September 30, 2011
| Total Return for the 12 Months Ended September 30, 2011 | |||||||||||||||||||||||
| Class A | Class B | Class C | Class I | Russell Midcap® Growth Index1 | Lipper Multi-Cap Growth Funds Index2 | ||||||||||||||||||
| 0.86 | % | 0.11 | % | 0.11 | % | 1.12 | % | 0.80 | % | 0.70 | % | ||||||||||||
The performance of the Fund's four share classes varies because each has different expenses. The Fund's total returns assume the reinvestment of all distributions but do not reflect the deduction of any applicable sales charges. Such costs would lower performance. See Performance Summary for standardized performance and benchmark information.
Market Conditions
The stock market had been moving slowly upward in the first half of the 12-month period, with a slight pullback in March following news of political turmoil in the Middle East (which caused oil prices to rise) and a major natural disaster in Japan (which prompted fears of supply chain disruptions for the auto and electronics industries). However, the remainder of the period saw considerable volatility which negated the market's gains from the first six months. Delays in approving an increase for the U.S. debt ceiling followed by the downgrade of U.S. bonds by credit rating agency Standard & Poor's led to a major sell-off in the stock market in July and August. The European sovereign debt crisis also appeared to worsen during the period and its policy solutions continued to face significant political hurdles. Concerns about the fragile state of economic growth in the U.S. and globally weighed on the market for the remainder of the period.
Performance Analysis
Morgan Stanley Mid Cap Growth Fund Class A and I shares outperformed while Class B and C shares underperformed the Russell Midcap® Growth Index (the "Index") and the Lipper Multi-Cap Growth Funds Index for the 12 months ended September 30, 2011, assuming no deduction of applicable sales charges.
Stock selection in the producer durables sector was favorable for performance. A number of holdings performed well within this sector including some in back office support, human resources and consulting; engineering and contracting services; and international trade and diversified logistics. Also bolstering relative gains were stock selection and an underweight in health care, where the Fund additionally benefited from holdings in the medical and dental instruments and supplies industry and a holding in a medical equipment stock. The materials and processing sector aided returns as well, driven by the strong performance of a holding in a metal fabricating stock.
However, an underweight in the consumer staples sector was the largest detractor from relative performance. Our holdings performed well for the most part but the portfolio lacked exposure to other consumer staples stocks in the Index that had strong gains during the period. The consumer discretionary sector also dampened relative results. Holdings in an internet video streaming company, an online travel booking provider (not represented in the Index) and a cosmetics company (also not represented in the Index) had disappointing results. In addition, an underweight relative to the Index in this sector had a negative effect on relative results. Stock selection in the technology sector hampered performance, primarily due to several holdings in the computer services software and systems industry (two of which are not represented in the Index).
2
There is no guarantee that any sectors mentioned will continue to perform as discussed herein or that securities in such sectors will be held by the Fund in the future.
| TOP 10 HOLDINGS as of 09/30/11 | |||||||
| Motorola Solutions, Inc. | 3.9 | % | |||||
| Edenred (France) | 3.3 | ||||||
| Intuitive Surgical, Inc. | 3.0 | ||||||
| Fastenal Co. | 2.8 | ||||||
| Mead Johnson Nutrition Co. | 2.6 | ||||||
| MSCI, Inc., Class A | 2.6 | ||||||
| Red Hat, Inc. | 2.5 | ||||||
| Verisk Analytics, Inc., Class A | 2.3 | ||||||
| Solera Holdings, Inc. | 2.3 | ||||||
| Expeditors International of Washington, Inc. | 2.0 | ||||||
| TOP FIVE INDUSTRIES as of 09/30/11 | |||||||
| Computer Services, Software & Systems | 12.2 | % | |||||
| Diversified Retail | 8.9 | ||||||
| Pharmaceuticals | 6.3 | ||||||
| Commercial Services | 5.5 | ||||||
| Communications Technology | 5.1 | ||||||
Subject to change daily. Provided for informational purposes only and should not be deemed as a recommendation to buy or sell the securities mentioned above. Top 10 holdings and top five industries are as a percentage of net assets. Morgan Stanley is a full-service securities firm engaged in securities trading and brokerage activities, investment banking, research and analysis, financing and financial advisory services.
Investment Strategy
The Fund will normally invest at least 80 percent of its assets in common stocks (including depositary receipts) and other equity securities of medium capitalization companies. The Fund's other equity securities may include convertible securities and preferred stocks. The Fund's "Investment Adviser," Morgan Stanley Investment Management Inc. seeks to invest primarily in high quality, established and emerging companies it believes have sustainable competitive advantages and the ability to redeploy capital at high rates of return. The Investment Adviser typically favors companies with rising returns on invested capital, above average business visibility, strong free cash flow generation and an attractive risk/reward profile. The Fund may also use derivative instruments as discussed in the Fund's prospectus. These derivative instruments will be counted toward the 80 percent policy discussed above to the extent they have economic characteristics similar to the securities included within that policy.
For More Information About Portfolio Holdings
Each Morgan Stanley fund provides a complete schedule of portfolio holdings in its semiannual and annual reports within 60 days of the end of the fund's second and fourth fiscal quarters. The semiannual reports and the annual reports are filed electronically with the Securities and Exchange Commission (SEC) on Form N-CSRS and Form N-CSR, respectively. Morgan Stanley also delivers the semiannual and annual reports to fund shareholders and makes these reports available on its public web site, www.morganstanley.com. Each Morgan Stanley fund also files a complete schedule of portfolio holdings with the SEC for the fund's first and
3
third fiscal quarters on Form N-Q. Morgan Stanley does not deliver the reports for the first and third fiscal quarters to shareholders, nor are the reports posted to the Morgan Stanley public web site. You may, however, obtain the Form N-Q filings (as well as the Form N-CSR and N-CSRS filings) by accessing the SEC's web site, http://www.sec.gov. You may also review and copy them at the SEC's public reference room in Washington, DC. Information on the operation of the SEC's public reference room may be obtained by calling the SEC at (800) SEC-0330. You can also request copies of these materials, upon payment of a duplicating fee, by electronic request at the SEC's e-mail address (publicinfo@sec.gov) or by writing the public reference section of the SEC, Washington, DC 20549-1520.
Proxy Voting Policy and Procedures and Proxy Voting Record
You may obtain a copy of the Fund's Proxy Voting Policy and Procedures without charge, upon request, by calling toll free (800) 869-NEWS or by visiting the Mutual Fund Center on our web site at www.morganstanley.com. It is also available on the SEC's web site at http://www.sec.gov.
You may obtain information regarding how the Fund voted proxies relating to portfolio securities during the most recent twelve-month period ended June 30 without charge by visiting the Mutual Fund Center on our web site at www.morganstanley.com. This information is also available on the SEC's web site at http://www.sec.gov.
Householding Notice
To reduce printing and mailing costs, the Fund attempts to eliminate duplicate mailings to the same address. The Fund delivers a single copy of certain shareholder documents, including shareholder reports, prospectuses and proxy materials, to investors with the same last name who reside at the same address. Your participation in this program will continue for an unlimited period of time unless you instruct us otherwise. You can request multiple copies of these documents by calling (800) 869-NEWS, 8:00 a.m. to 8:00 p.m., ET. Once our Customer Service Center has received your instructions, we will begin sending individual copies for each account within 30 days.
4
(This page has been left blank intentionally.)
Performance Summary (unaudited)
Performance of $10,000 Investment—Class B
Over 10 Years

6
| Average Annual Total Returns—Period Ended September 30, 2011 (unaudited) | |||||||||||||||||||
| Symbol | Class A Shares* (since 07/28/97) DGRAX | Class B Shares** (since 04/29/83) DGRBX | Class C Shares† (since 07/28/97) DGRCX | Class I Shares†† (since 07/28/97) DGRDX | |||||||||||||||
| 1 Year | 0.86 –4.43 4 | %3 | 0.11 –4.89 4 | %3 | 0.11 –0.89 4 | %3 | 1.12 — | %3 | |||||||||||
| 5 Years | 5.79 3 4.65 4 | 5.00 3 4.67 4 | 5.00 3 5.00 4 | 6.05 3 — | |||||||||||||||
| 10 Years | 8.94 3 8.35 4 | 8.27 3 8.27 4 | 8.12 3 8.12 4 | 9.18 3 — | |||||||||||||||
| Since Inception | 6.84 3 6.43 4 | 7.83 3 7.83 4 | 6.04 3 6.04 4 | 7.08 3 — | |||||||||||||||
Performance data quoted represents past performance, which is no guarantee of future results and current performance may be lower or higher than the figures shown. For most recent month-end performance figures, please visit www.morganstanley.com/im or speak with your Financial Advisor. Investment returns and principal value will fluctuate and fund shares, when redeemed, may be worth more or less than their original cost. The graph and table do not reflect the deduction of taxes that a shareholder would pay on fund distributions or the redemption of fund shares. Performance for Class A, Class B, Class C, and Class I shares will vary due to differences in sales charges and expenses. See the Fund's current prospectus for complete details on fees and sales charges.
* The maximum front-end sales charge for Class A is 5.25%.
** The maximum contingent deferred sales charge (CDSC) for Class B is 5.0%. The CDSC declines to 0% after six years. Effective April 2005, Class B shares will generally convert to Class A shares approximately eight years after the end of the calendar month in which the shares were purchased. Performance for periods greater than eight years reflects this conversion (beginning April 2005).
† The maximum contingent deferred sales charge for Class C is 1.0% for shares redeemed within one year of purchase.
†† Class I has no sales charge.
(1) The Russell Midcap® Growth Index measures the performance of the mid-cap growth segment of the U.S. equity universe. It includes those Russell Midcap® Index companies with higher price-to-book ratios and higher forecasted growth values. The Russell Midcap® Index is a subset of the Russell 1000® Index and includes approximately 800 of the smallest securities in the Russell 1000® Index, which in turn consists of approximately 1,000 of the largest U.S. securities based on a combination of market capitalization and current index membership. The Index is unmanaged and its returns do not include any sales charges or fees. Such costs would lower performance. It is not possible to invest directly in an index.
(2) The Lipper Multi-Cap Growth Funds Index is an equally weighted performance index of the largest qualifying funds (based on net assets) in the Lipper Multi-Cap Growth Funds classification. The Index, which is adjusted for capital gains distributions and income dividends, is unmanaged and should not be considered an investment. There are currently 30 funds represented in this Index. The Fund was in the Lipper Multi-Cap Growth Funds classification as of the date of this report.
(3) Figure shown assumes reinvestment of all distributions and does not reflect the deduction of any sales charges.
(4) Figure shown assumes reinvestment of all distributions and the deduction of the maximum applicable sales charge. See the Fund's current prospectus for complete details on fees and sales charges.
‡ Ending value assuming a complete redemption on September 30, 2011.
7
Expense Example (unaudited)
As a shareholder of the Fund, you incur two types of costs: (1) transaction costs, including sales charges (loads) on purchase payments and (2) ongoing costs, including advisory fees; distribution and service (12b-1) fees; and other Fund expenses. This example is intended to help you understand your ongoing costs (in dollars) of investing in the Fund and to compare these costs with the ongoing costs of investing in other mutual funds.
The example is based on an investment of $1,000 invested at the beginning of the period and held for the entire period 04/01/11 – 09/30/11.
Actual Expenses
The first line of the table below provides information about actual account values and actual expenses. You may use the information in this line, together with the amount you invested, to estimate the expenses that you paid over the period. Simply divide your account value by $1,000 (for example, an $8,600 account value divided by $1,000 = 8.6), then multiply the result by the number in the first line under the heading entitled "Expenses Paid During Period" to estimate the expenses you paid on your account during this period.
Hypothetical Example for Comparison Purposes
The second line of the table below provides information about hypothetical expenses based on the Fund's actual expense ratio and an assumed rate of return of 5% per year before expenses, which is not the Fund's actual return. The hypothetical account values and expenses may not be used to estimate the actual ending account balance or expenses you paid for the period. You may use this information to compare the ongoing cost of investing in the Fund and other funds. To do so, compare this 5% hypothetical example with the 5% hypothetical examples that appear in the shareholder reports of the other funds.
Please note that the expenses shown in the table are meant to highlight your ongoing costs only and do not reflect any transactional costs, such as sales charges (loads). Therefore, the second line of the table is useful in comparing ongoing costs, and will not help you determine the relative total cost of owning different funds. In addition, if these transactional costs were included, your costs would have been higher.
| Beginning Account Value | Ending Account Value | Expenses Paid During Period@ | |||||||||||||
| 04/01/11 | 09/30/11 | 04/01/11 – 09/30/11 | |||||||||||||
| Class A | |||||||||||||||
| Actual (–16.42% return) | $ | 1,000.00 | $ | 835.80 | $ | 4.56 | |||||||||
| Hypothetical (5% annual return before expenses) | $ | 1,000.00 | $ | 1,020.10 | $ | 5.01 | |||||||||
| Class B | |||||||||||||||
| Actual (–16.74% return) | $ | 1,000.00 | $ | 832.60 | $ | 7.99 | |||||||||
| Hypothetical (5% annual return before expenses) | $ | 1,000.00 | $ | 1,016.34 | $ | 8.80 | |||||||||
| Class C | |||||||||||||||
| Actual (–16.72% return) | $ | 1,000.00 | $ | 832.80 | $ | 7.99 | |||||||||
| Hypothetical (5% annual return before expenses) | $ | 1,000.00 | $ | 1,016.34 | $ | 8.80 | |||||||||
| Class I | |||||||||||||||
| Actual (–16.31% return) | $ | 1,000.00 | $ | 836.90 | $ | 3.41 | |||||||||
| Hypothetical (5% annual return before expenses) | $ | 1,000.00 | $ | 1,021.36 | $ | 3.75 | |||||||||
@ Expenses are equal to the Fund's annualized expense ratios of 0.99%, 1.74%, 1.74% and 0.74% for Class A, Class B, Class C and Class I shares, respectively, multiplied by the average account value over the period, multiplied by 183/365 (to reflect the one-half year period).
8
Investment Advisory Agreement Approval (unaudited)
Nature, Extent and Quality of Services
The Board reviewed and considered the nature and extent of the investment advisory services provided by the Investment Adviser (as defined herein) under the advisory agreement, including portfolio management, investment research and equity and fixed income securities trading. The Board also reviewed and considered the nature and extent of the non-advisory, administrative services provided by the Fund's Administrator (as defined herein) under the administration agreement, including accounting, clerical, bookkeeping, compliance, business management and planning, and the provision of supplies, office space and utilities at the Investment Adviser's expense. (The Investment Adviser and the Administrator together are referred to as the "Adviser" and the advisory and administration agreements together are referred to as the "Management Agreement.") The Board also compared the nature of the services provided by the Adviser with similar services provided by non-affiliated advisers as reported to the Board by Lipper, Inc. ("Lipper").
The Board reviewed and considered the qualifications of the portfolio managers, the senior administrative managers and other key personnel of the Adviser who provide the administrative and advisory services to the Fund. The Board determined that the Adviser's portfolio managers and key personnel are well qualified by education and/or training and experience to perform the services in an efficient and professional manner. The Board concluded that the nature and extent of the advisory and administrative services provided were necessary and appropriate for the conduct of the business and investment activities of the Fund and supported its decision to approve the Management Agreement.
Performance, Fees and Expenses of the Fund
The Board reviewed the performance, fees and expenses of the Fund compared to its peers, as determined by Lipper, and to appropriate benchmarks where applicable. The Board discussed with the Adviser the performance goals and the actual results achieved in managing the Fund. When considering a fund's performance, the Board and the Adviser place emphasis on trends and longer-term returns (focusing on one-year, three-year and five-year performance as of December 31, 2010, or since inception, as applicable). When a fund underperforms its benchmark and/or its peer group average, the Board and the Adviser discuss the causes of such underperformance and, where necessary, they discuss specific changes to investment strategy or investment personnel. The Board noted that the Fund's performance was better than its peer group average for the one-, three- and five-year periods. The Board discussed with the Adviser the level of the advisory and administration fees (together, the "management fee") for this Fund relative to comparable funds and/or other accounts advised by the Adviser and/or compared to its peers as determined by Lipper. In addition to the management fee, the Board also reviewed the Fund's total expense ratio. The Board noted that the Fund's management fee and total expense ratio were lower than its peer group average. After discussion, the Board concluded that the Fund's management fee, total expense ratio and performance were competitive with its peer group average.
9
Economies of Scale
The Board considered the size and growth prospects of the Fund and how that relates to the Fund's total expense ratio and particularly the Fund's management fee rate, which includes a breakpoint. In conjunction with its review of the Adviser's profitability, the Board discussed with the Adviser how a change in assets can affect the efficiency or effectiveness of managing the Fund and whether the management fee level is appropriate relative to current and projected asset levels and/or whether the management fee structure reflects economies of scale as asset levels change. The Board has determined that its review of the actual and potential economies of scale of the Fund supports its decision to approve the Management Agreement.
Profitability of the Adviser and Affiliates
The Board considered information concerning the costs incurred and profits realized by the Adviser and its affiliates during the last year from their relationship with the Fund and during the last two years from their relationship with the Morgan Stanley Fund Complex and reviewed with the Adviser the cost allocation methodology used to determine the profitability of the Adviser and affiliates. The Board has determined that its review of the analysis of the Adviser's expenses and profitability supports its decision to approve the Management Agreement.
Other Benefits of the Relationship
The Board considered other benefits to the Adviser and its affiliates derived from their relationship with the Fund and other funds advised by the Adviser. These benefits may include, among other things, "float" benefits derived from handling of checks for purchases and sales, research received by the Adviser generated from commission dollars spent on funds' portfolio trading and fees for distribution and/or shareholder servicing. The Board reviewed with the Adviser each of these arrangements and the reasonableness of the Adviser's costs relative to the services performed. The Board has determined that its review of the other benefits received by the Adviser or its affiliates supports its decision to approve the Management Agreement.
Resources of the Adviser and Historical Relationship Between the Fund and the Adviser
The Board considered whether the Adviser is financially sound and has the resources necessary to perform its obligations under the Management Agreement. The Board also reviewed and considered the historical relationship between the Fund and the Adviser, including the organizational structure of the Adviser, the policies and procedures formulated and adopted by the Adviser for managing the Fund's operations and the Board's confidence in the competence and integrity of the senior managers and key personnel of the Adviser. The Board concluded that the Adviser has the financial resources necessary to fulfill its obligations under the Management Agreement and that it is beneficial for the Fund to continue its relationship with the Adviser.
10
Other Factors and Current Trends
The Board considered the controls and procedures adopted and implemented by the Adviser and monitored by the Fund's Chief Compliance Officer and concluded that the conduct of business by the Adviser indicates a good faith effort on its part to adhere to high ethical standards in the conduct of the Fund's business.
General Conclusion
After considering and weighing all of the above factors, the Board concluded that it would be in the best interest of the Fund and its shareholders to approve renewal of the Management Agreement for another year. In reaching this conclusion the Board did not give particular weight to any single factor referenced above. The Board considered these factors over the course of numerous meetings, some of which were in executive session with only the independent Board members and their counsel present. It is possible that individual Board members may have weighed these factors differently in reaching their individual decisions to approve the Management Agreement.
11
Morgan Stanley Mid Cap Growth Fund
Portfolio of Investments n September 30, 2011
| NUMBER OF SHARES | VALUE | ||||||||||
| Common Stocks (91.4%) | |||||||||||
| Air Transport (2.0%) | |||||||||||
| 167,187 | Expeditors International of Washington, Inc. | $ | 6,779,433 | ||||||||
| Alternative Energy (3.4%) | |||||||||||
| 113,296 | Range Resources Corp. | 6,623,284 | |||||||||
| 164,808 | Ultra Petroleum Corp. (a) | 4,568,478 | |||||||||
| 11,191,762 | |||||||||||
| Asset Management & Custodian (0.5%) | |||||||||||
| 59,387 | Greenhill & Co., Inc. | 1,697,874 | |||||||||
| Biotechnology (3.5%) | |||||||||||
| 72,624 | IDEXX Laboratories, Inc. (a) | 5,008,877 | |||||||||
| 162,640 | Illumina, Inc. (a) | 6,655,229 | |||||||||
| 11,664,106 | |||||||||||
| Cement (0.9%) | |||||||||||
| 49,156 | Martin Marietta Materials, Inc. | 3,107,642 | |||||||||
| Chemicals: Diversified (2.4%) | |||||||||||
| 172,491 | Intrepid Potash, Inc. (a) | 4,289,851 | |||||||||
| 114,011 | Rockwood Holdings, Inc. (a) | 3,841,031 | |||||||||
| 8,130,882 | |||||||||||
| Commercial Services (5.5%) | |||||||||||
| 142,317 | Gartner, Inc. (a) | 4,962,594 | |||||||||
| 194,080 | Intertek Group PLC (United Kingdom) | 5,564,562 | |||||||||
| 187,065 | Leucadia National Corp. | 4,242,634 | |||||||||
| 60,342 | Weight Watchers International, Inc. | 3,514,922 | |||||||||
| 18,284,712 | |||||||||||
| Communications Technology (5.1%) | |||||||||||
| 39,898 | Millicom International Cellular SA SDR (Sweden) | 3,995,704 | |||||||||
| 314,182 | Motorola Solutions, Inc. | 13,164,226 | |||||||||
| 17,159,930 | |||||||||||
| Computer Services, Software & Systems (12.2%) | |||||||||||
| 187,973 | Akamai Technologies, Inc. (a) | 3,736,903 | |||||||||
| NUMBER OF SHARES | VALUE | ||||||||||
| 1,741,900 | Alibaba.com Ltd. (China) (b) | $ | 1,607,493 | ||||||||
| 43,348 | Citrix Systems, Inc. (a) | 2,363,767 | |||||||||
| 64,392 | IHS, Inc. Class A (a) | 4,817,166 | |||||||||
| 57,529 | LinkedIn Corp. Class A (a) | 4,491,864 | |||||||||
| 197,333 | Red Hat, Inc. (a) | 8,339,293 | |||||||||
| 263,694 | Renren, Inc. ADR (China) (a) | 1,344,839 | |||||||||
| 57,849 | Salesforce.com, Inc. (a) | 6,610,984 | |||||||||
| 149,834 | Solera Holdings, Inc. | 7,566,617 | |||||||||
| 40,878,926 | |||||||||||
| Computer Technology (3.0%) | |||||||||||
| 76,371 | NVIDIA Corp. (a) | 954,637 | |||||||||
| 294,546 | Yandex N.V. Class A (Russia) (a) | 6,011,684 | |||||||||
| 177,135 | Youku.com, Inc. ADR (China) (a) | 2,897,929 | |||||||||
| 9,864,250 | |||||||||||
| Consumer Lending (1.4%) | |||||||||||
| 40,260 | Intercontinental Exchange, Inc. (a) | 4,761,148 | |||||||||
| Consumer Services: Miscellaneous (2.4%) | |||||||||||
| 621,653 | Qualicorp SA (Brazil) (a) | 4,628,715 | |||||||||
| 3,165,500 | Sun Art Retail Group Ltd. (Hong Kong) (a) | 3,259,004 | |||||||||
| 7,887,719 | |||||||||||
| Cosmetics (0.8%) | |||||||||||
| 162,217 | Natura Cosmeticos SA (Brazil) | 2,760,773 | |||||||||
| Diversified Materials & Processing (1.6%) | |||||||||||
| 50,794 | Schindler Holding AG (Switzerland) | 5,438,612 | |||||||||
| Diversified Media (3.1%) | |||||||||||
| 56,890 | Factset Research Systems, Inc. | 5,061,503 | |||||||||
| 130,739 | McGraw-Hill Cos., Inc. (The) | 5,360,299 | |||||||||
| 10,421,802 | |||||||||||
| Diversified Retail (8.9%) | |||||||||||
| 16,526 | Chipotle Mexican Grill, Inc. (a) | 5,006,551 | |||||||||
See Notes to Financial Statements
12
Morgan Stanley Mid Cap Growth Fund
Portfolio of Investments n September 30, 2011 continued
| NUMBER OF SHARES | VALUE | ||||||||||
| 139,939 | Ctrip.com International Ltd. ADR (China) (a) | $ | 4,500,438 | ||||||||
| 75,763 | Dollar Tree, Inc. (a) | 5,690,559 | |||||||||
| 280,860 | Fastenal Co. | 9,347,021 | |||||||||
| 46,905 | NetFlix, Inc. (a) | 5,307,770 | |||||||||
| 29,852,339 | |||||||||||
| Education Services (1.0%) | |||||||||||
| 146,984 | New Oriental Education & Technology Group, Inc. ADR (China) (a) | 3,376,223 | |||||||||
| Financial Data & Systems (4.9%) | |||||||||||
| 282,759 | MSCI, Inc. Class A (a) | 8,576,081 | |||||||||
| 226,282 | Verisk Analytics, Inc. Class A (a) | 7,867,825 | |||||||||
| 16,443,906 | |||||||||||
| Health Care Services (2.6%) | |||||||||||
| 61,239 | athenahealth, Inc. (a) | 3,646,782 | |||||||||
| 62,911 | Stericycle, Inc. (a) | 5,078,176 | |||||||||
| 8,724,958 | |||||||||||
| Medical & Dental Instruments & Supplies (1.3%) | |||||||||||
| 65,400 | Techne Corp. | 4,447,854 | |||||||||
| Medical Equipment (3.1%) | |||||||||||
| 28,025 | Intuitive Surgical, Inc. (a) | 10,208,947 | |||||||||
| Metals & Minerals: Diversified (1.8%) | |||||||||||
| 1,286,310 | Lynas Corp. Ltd. (Australia) (a) | 1,299,944 | |||||||||
| 144,047 | Molycorp, Inc. (a) | 4,734,825 | |||||||||
| 6,034,769 | |||||||||||
| Pharmaceuticals (6.3%) | |||||||||||
| 95,794 | Gen-Probe, Inc. (a) | 5,484,207 | |||||||||
| 189,187 | Ironwood Pharmaceuticals, Inc. (a) | 2,043,219 | |||||||||
| 126,318 | Mead Johnson Nutrition Co. | 8,694,468 | |||||||||
| 135,257 | Valeant Pharmaceuticals International, Inc. (Canada) | 5,020,740 | |||||||||
| 21,242,634 | |||||||||||
| NUMBER OF SHARES | VALUE | ||||||||||
| Publishing (1.4%) | |||||||||||
| 85,321 | Morningstar, Inc. | $ | 4,815,517 | ||||||||
| Recreational Vehicles & Boats (3.3%) | |||||||||||
| 468,207 | Edenred (France) | 11,131,657 | |||||||||
| Restaurants (1.3%) | |||||||||||
| 155,908 | Dunkin' Brands Group, Inc. (a) | 4,318,652 | |||||||||
| Scientific Instruments: Pollution Control (1.2%) | |||||||||||
| 252,398 | Covanta Holding Corp. | 3,833,926 | |||||||||
| Semiconductors & Components (2.8%) | |||||||||||
| 211,945 | ARM Holdings PLC ADR (United Kingdom) | 5,404,597 | |||||||||
| 64,455 | First Solar, Inc. (a) | 4,074,201 | |||||||||
| 9,478,798 | |||||||||||
| Shipping (1.3%) | |||||||||||
| 65,070 | C.H. Robinson Worldwide, Inc. | 4,455,343 | |||||||||
| Textiles Apparel & Shoes (1.4%) | |||||||||||
| 93,324 | Lululemon Athletica, Inc. (Canada) (a) | 4,540,213 | |||||||||
| Utilities: Electrical (1.0%) | |||||||||||
| 140,260 | Brookfield Infrastructure Partners LP (Canada) | 3,413,928 | |||||||||
| Total Common Stocks (Cost $287,923,530) | 306,349,235 | ||||||||||
| Convertible Preferred Stocks (2.2%) | |||||||||||
| Alternative Energy (0.4%) | |||||||||||
| 515,519 | Better Place, Inc. (a)(c)(d) | 1,546,557 | |||||||||
| Computer Technology (1.8%) | |||||||||||
| 93,188 | Groupon, Inc. Series G (a)(c)(d) | 5,964,032 | |||||||||
| Total Convertible Preferred Stocks (Cost $4,490,366) | 7,510,589 | ||||||||||
See Notes to Financial Statements
13
Morgan Stanley Mid Cap Growth Fund
Portfolio of Investments n September 30, 2011 continued
| NUMBER OF SHARES | VALUE | ||||||||||
| Preferred Stock (0.9%) | |||||||||||
| Leisure Time | |||||||||||
| 205,470 | Zynga, Inc. Series C (Cost $2,882,562) (a)(c)(d) | $ | 2,882,562 | ||||||||
| NUMBER OF SHARES (000) | |||||||||||
| Short-Term Investment (6.0%) | |||||||||||
| Investment Company | |||||||||||
| 20,294 | Morgan Stanley Institutional Liquidity Funds - Money Market Portfolio - Institutional Class (See Note 5) (Cost $20,294,108) | 20,294,108 | |||||||||
| Total Investments (Cost $315,590,566) (e)(f) | 100.5 | % | 337,036,494 | ||||||||
| Liabilities in Excess of Other Assets | (0.5 | ) | (1,743,834 | ) | |||||||
| Net Assets | 100.0 | % | $ | 335,292,660 | |||||||
ADR American Depositary Receipt.
SDR Swedish Depositary Receipt.
(a) Non-income producing security.
(b) Security trades on the Hong Kong exchange.
(c) Illiquid security. Resale is restricted to qualified institutional investors.
(d) At September 30, 2011, the Fund held fair valued securities valued at $10,393,151, representing 3.1% of net assets. These securities have been fair valued as determined in good faith under procedures established by and under the general supervision of the Fund's Trustees.
(e) The market value and percentage of net assets, $26,858,364 and 8.0%, respectively, represent the securities that have been fair valued under the fair valuation policy for international investments as described in Note 1A within the Notes to the Financial Statements.
(f) The aggregate cost for federal income tax purposes is $316,805,757. The aggregate gross unrealized appreciation is $53,427,949 and the aggregate gross unrealized depreciation is $33,197,212 resulting in net unrealized appreciation of $20,230,737.
See Notes to Financial Statements
14
Morgan Stanley Mid Cap Growth Fund
Summary of Investments n September 30, 2011
| INDUSTRY | VALUE | PERCENT OF TOTAL INVESTMENTS | |||||||||
| Computer Services, Software & Systems | $ | 40,878,926 | 12.1 | % | |||||||
| Diversified Retail | 29,852,339 | 8.9 | |||||||||
| Pharmaceuticals | 21,242,634 | 6.3 | |||||||||
| Investment Company | 20,294,108 | 6.0 | |||||||||
| Commercial Services | 18,284,712 | 5.4 | |||||||||
| Communications Technology | 17,159,930 | 5.1 | |||||||||
| Financial Data & Systems | 16,443,906 | 4.9 | |||||||||
| Computer Technology | 15,828,282 | 4.7 | |||||||||
| Alternative Energy | 12,738,319 | 3.8 | |||||||||
| Biotechnology | 11,664,106 | 3.5 | |||||||||
| Recreational Vehicles & Boats | 11,131,657 | 3.3 | |||||||||
| Diversified Media | 10,421,802 | 3.1 | |||||||||
| Medical Equipment | 10,208,947 | 3.0 | |||||||||
| Semiconductors & Components | 9,478,798 | 2.8 | |||||||||
| Health Care Services | 8,724,958 | 2.6 | |||||||||
| Chemicals: Diversified | 8,130,882 | 2.4 | �� | ||||||||
| Consumer Services: Miscellaneous | 7,887,719 | 2.4 | |||||||||
| Air Transport | 6,779,433 | 2.0 | |||||||||
| INDUSTRY | VALUE | PERCENT OF TOTAL INVESTMENTS | |||||||||
| Metals & Minerals: Diversified | $ | 6,034,769 | 1.8 | % | |||||||
| Diversified Materials & Processing | 5,438,612 | 1.6 | |||||||||
| Publishing | 4,815,517 | 1.4 | |||||||||
| Consumer Lending | 4,761,148 | 1.4 | |||||||||
| Textiles Apparel & Shoes | 4,540,213 | 1.4 | |||||||||
| Shipping | 4,455,343 | 1.3 | |||||||||
| Medical & Dental Instruments & Supplies | 4,447,854 | 1.3 | |||||||||
| Restaurants | 4,318,652 | 1.3 | |||||||||
| Scientific Instruments: Pollution Control | 3,833,926 | 1.1 | |||||||||
| Utilities: Electrical | 3,413,928 | 1.0 | |||||||||
| Education Services | 3,376,223 | 1.0 | |||||||||
| Cement | 3,107,642 | 0.9 | |||||||||
| Leisure Time | 2,882,562 | 0.9 | |||||||||
| Cosmetics | 2,760,773 | 0.8 | |||||||||
| Asset Management & Custodian | 1,697,874 | 0.5 | |||||||||
| $ | 337,036,494 | 100.0 | % | ||||||||
See Notes to Financial Statements
15
Morgan Stanley Mid Cap Growth Fund
Financial Statements
Statement of Assets and Liabilities
September 30, 2011
| Assets: | |||||||
| Investments in securities, at value (cost $295,296,458) | $ | 316,742,386 | |||||
| Investment in affiliate, at value (cost $20,294,108) | 20,294,108 | ||||||
| Total investments in securities, at value (cost $315,590,566) | 337,036,494 | ||||||
| Receivable for: | |||||||
| Investments sold | 1,206,578 | ||||||
| Dividends | 203,294 | ||||||
| Shares of beneficial interest sold | 109,445 | ||||||
| Foreign withholding taxes reclaimed | 41,234 | ||||||
| Dividends from affiliate | 1,531 | ||||||
| Prepaid expenses and other assets | 30,364 | ||||||
| Total Assets | 338,628,940 | ||||||
| Liabilities: | |||||||
| Payable for: | |||||||
| Investments purchased | 2,514,217 | ||||||
| Shares of beneficial interest redeemed | 335,791 | ||||||
| Investment advisory fee | 125,884 | ||||||
| Transfer agent fee | 99,954 | ||||||
| Distribution fee | 95,421 | ||||||
| Administration fee | 23,978 | ||||||
| Accrued expenses and other payables | 141,035 | ||||||
| Total Liabilities | 3,336,280 | ||||||
| Net Assets | $ | 335,292,660 | |||||
| Composition of Net Assets: | |||||||
| Paid-in-capital | $ | 303,682,293 | |||||
| Net unrealized appreciation | 21,446,027 | ||||||
| Accumulated net investment loss | (144,558 | ) | |||||
| Accumulated undistributed net realized gain | 10,308,898 | ||||||
| Net Assets | $ | 335,292,660 | |||||
| Class A Shares: | |||||||
| Net Assets | $ | 302,165,708 | |||||
| Shares Outstanding (unlimited shares authorized, $.01 par value) | 9,943,582 | ||||||
| Net Asset Value Per Share | $ | 30.39 | |||||
| Maximum Offering Price Per Share, (net asset value plus 5.54% of net asset value) | $ | 32.07 | |||||
| Class B Shares: | |||||||
| Net Assets | $ | 10,338,171 | |||||
| Shares Outstanding (unlimited shares authorized, $.01 par value) | 392,023 | ||||||
| Net Asset Value Per Share | $ | 26.37 | |||||
| Class C Shares: | |||||||
| Net Assets | $ | 20,491,360 | |||||
| Shares Outstanding (unlimited shares authorized, $.01 par value) | 773,697 | ||||||
| Net Asset Value Per Share | $ | 26.48 | |||||
| Class I Shares: | |||||||
| Net Assets | $ | 2,297,421 | |||||
| Shares Outstanding (unlimited shares authorized, $.01 par value) | 72,554 | ||||||
| Net Asset Value Per Share | $ | 31.66 | |||||
Statement of Operations
For the year ended September 30, 2011
| Net Investment Loss: Income | |||||||
| Dividends (net of $105,699 foreign withholding tax) | $ | 3,034,489 | |||||
| Dividends from affiliate (Note 5) | 27,152 | ||||||
| Total Income | 3,061,641 | ||||||
| Expenses | |||||||
| Investment advisory fee (Note 3) | 1,652,356 | ||||||
| Distribution fee (Class A shares) (Note 4) | 877,075 | ||||||
| Distribution fee (Class B shares) (Note 4) | 157,401 | ||||||
| Distribution fee (Class C shares) (Note 4) | 236,105 | ||||||
| Transfer agent fees and expenses | 530,708 | ||||||
| Administration fee (Note 3) | 314,734 | ||||||
| Professional fees | 113,346 | ||||||
| Shareholder reports and notices | 81,772 | ||||||
| Registration fees | 66,729 | ||||||
| Custodian fees | 48,708 | ||||||
| Trustees' fees and expenses | 12,410 | ||||||
| Other | 27,795 | ||||||
| Total Expenses | 4,119,139 | ||||||
| Less: rebate from Morgan Stanley affiliated cash sweep (Note 5) | (17,411 | ) | |||||
| Net Expenses | 4,101,728 | ||||||
| Net Investment Loss | (1,040,087 | ) | |||||
| Realized and Unrealized Gain (Loss): Realized Gain on: | |||||||
| Investments | 43,500,274 | ||||||
| Foreign currency translation | 2,297 | ||||||
| Net Realized Gain | 43,502,571 | ||||||
| Change in Unrealized Appreciation/Depreciation on: | |||||||
| Investments | (36,546,693 | ) | |||||
| Foreign currency translation | (94 | ) | |||||
| Net Change in Unrealized Appreciation/Depreciation | (36,546,787 | ) | |||||
| Net Gain | 6,955,784 | ||||||
| Net Increase | $ | 5,915,697 | |||||
See Notes to Financial Statements
16
Morgan Stanley Mid Cap Growth Fund
Financial Statements continued
Statements of Changes in Net Assets
| FOR THE YEAR ENDED SEPTEMBER 30, 2011 | FOR THE YEAR ENDED SEPTEMBER 30, 2010^ | ||||||||||
| Increase (Decrease) in Net Assets: Operations: | |||||||||||
| Net investment loss | $ | (1,040,087 | ) | $ | (194,731 | ) | |||||
| Net realized gain | 43,502,571 | 9,765,966 | |||||||||
| Net change in unrealized appreciation/depreciation | (36,546,787 | ) | 53,865,109 | ||||||||
| Net Increase | 5,915,697 | 63,436,344 | |||||||||
| Net increase (decrease) from transactions in shares of beneficial interest | (26,939,096 | ) | 25,872,709 | ||||||||
| Net Increase (Decrease) | (21,023,399 | ) | 89,309,053 | ||||||||
| Net Assets: | |||||||||||
| Beginning of period | 356,316,059 | 267,007,006 | |||||||||
| End of Period (Including accumulated net investment loss of $(144,558) and $(395,518), respectively) | $ | 335,292,660 | $ | 356,316,059 | |||||||
^ Beginning with the year ended September 30, 2011, the Fund was audited by Ernst & Young LLP. The previous year was audited by another independent registered public accounting firm.
See Notes to Financial Statements
17
Morgan Stanley Mid Cap Growth Fund
Notes to Financial Statements n September 30, 2011
1. Organization and Accounting Policies
Morgan Stanley Mid Cap Growth Fund (the "Fund"), is registered under the Investment Company Act of 1940, as amended (the "Act"), as a diversified, open-end management investment company. The Fund's investment objective is to seek long-term capital growth. The Fund was organized as a Massachusetts business trust on December 28, 1982 and commenced operations on April 29, 1983. On July 28, 1997, the Fund converted to a multiple class share structure.
The Fund offers Class A shares, Class B shares, Class C shares and Class I shares. The four classes are substantially the same except that most Class A shares are subject to a sales charge imposed at the time of purchase and some Class A shares, and most Class B shares and Class C shares are subject to a contingent deferred sales charge imposed on shares redeemed within eighteen months, six years and one year, respectively. Class I shares are not subject to a sales charge. Additionally, Class A shares, Class B shares and Class C shares incur distribution expenses.
The following is a summary of significant accounting policies:
A. Valuation of Investments — (1) An equity portfolio security listed or traded on the New York Stock Exchange ("NYSE") or American Stock Exchange or other domestic exchange is valued at its latest sale price prior to the time when assets are valued; if there were no sales that day, the security is valued at the mean between the last reported bid and ask price; (2) an equity portfolio security listed or traded on the Nasdaq is valued at the Nasdaq Official Closing Price; if there were no sales that day, the security is valued at the mean between the last reported bid and ask price; (3) all other domestic securities for which over-the-counter market quotations are readily available are valued at the mean between the last reported bid and ask price. In cases where a security is traded on more than one exchange, the security is valued on the exchange designated as the primary market; (4) for equity securities traded on foreign exchanges, the last reported sale price or the latest bid price may be used if there were no sales on a particular day; (5) when market quotations are not readily available, including circumstances under which Morgan Stanley Investment Management Inc. (the "Adviser"), a wholly owned subsidiary of Morgan Stanley, determines that the latest sale price, the bid price or the mean between the last reported bid and ask price do not reflect a security's market value, portfolio securities are valued at their fair value as determined in good faith under procedures established by and under the general supervision of the Fund's Trustees. Occasionally, developments affecting the closing prices of securities and other assets may occur between the times at which valuations of such securities are determined (that is, close of the foreign market on which the securities trade) and the close of business on the NYSE. If developments occur during such periods that are expected to materially affect the value of such securities, such valuations may be adjusted to reflect the estimated fair value of such securities as of the close of the NYSE, as determined in good faith by the Fund's Trustees or by the Adviser using a pricing service and/or procedures approved by the Trustees of the Fund; (6) certain portfolio securities
18
Morgan Stanley Mid Cap Growth Fund
Notes to Financial Statements n September 30, 2011 continued
may be valued by an outside pricing service approved by the Fund's Trustees; (7) investments in mutual funds, including the Morgan Stanley Institutional Liquidity Funds, are valued at the net asset value as of the close of each business day; and (8) short-term debt securities having a maturity date of more than sixty days at time of purchase are valued on a mark-to-market basis until sixty days prior to maturity and thereafter at amortized cost based on their value on the 61st day. Short-term debt securities having a maturity date of sixty days or less at the time of purchase are valued at amortized cost, which approximates fair value.
B. Accounting for Investments — Security transactions are accounted for on the trade date (date the order to buy or sell is executed). Realized gains and losses on security transactions are determined by the identified cost method. Dividend income and other distributions are recorded on the ex-dividend date. Discounts are accreted and premiums are amortized over the life of the respective securities and are included in interest income. Interest income is accrued daily as earned.
C. Multiple Class Allocations — Investment income, expenses (other than distribution fees), and realized and unrealized gains and losses are allocated to each class of shares based upon the relative net asset value on the date such items are recognized. Distribution fees are charged directly to the respective class.
D. Foreign Currency Translation — The books and records of the Fund are maintained in U.S. dollars as follows: (1) the foreign currency market value of investment securities, other assets and liabilities and foreign currency exchange contracts are translated at the exchange rates prevailing at the end of the period; and (2) purchases, sales, income and expenses are translated at the exchange rates prevailing on the respective dates of such transactions. The resultant exchange gains and losses are recorded as realized and unrealized gains/losses on foreign currency exchange contracts and foreign currency translations. Pursuant to U.S. federal income tax regulations, certain foreign exchange gains/losses included in realized and unrealized gains/losses are included in or are a reduction of ordinary income for federal income tax purposes. The Fund does not isolate that portion of the results of operations arising as a result of changes in the foreign exchange rates from the changes in the market prices of the securities held.
E. Federal Income Tax Policy — It is the Fund's policy to comply with the requirements of Subchapter M of the Internal Revenue Code applicable to regulated investment companies and to distribute substantially all of its taxable income to its shareholders. Therefore, no federal income tax provision is required. The Fund files tax returns with the U.S. Internal Revenue Service, New York State and New York City. The Fund recognizes the tax effects of a tax position taken or expected to be taken in a tax return only if it is more likely than not to be sustained based solely on its technical merits as of the reporting date. The more-likely-than-not threshold must continue to be met in each reporting period
19
Morgan Stanley Mid Cap Growth Fund
Notes to Financial Statements n September 30, 2011 continued
to support continued recognition of the benefit. The difference between the tax benefit recognized in the financial statements for a tax position taken and the tax benefit claimed in the income tax return is referred to as an unrecognized tax benefit. There are no unrecognized tax benefits in the accompanying financial statements. If applicable, the Fund recognizes interest accrued related to unrecognized tax benefits in interest expense and penalties in "other expenses" in the Statement of Operations. Each of the tax years in the four-year period ended September 30, 2011 remains subject to examination by taxing authorities.
F. Dividends and Distributions to Shareholders — Dividends and distributions to shareholders are recorded on the ex-dividend date.
G. Use of Estimates — The preparation of financial statements in accordance with generally accepted accounting principles in the United States ("GAAP") requires management to make estimates and assumptions that affect the reported amounts and disclosures. Actual results could differ from those estimates.
H. Indemnifications — The Fund enters into contracts that contain a variety of indemnifications. The Fund's maximum exposure under these arrangements is unknown. However, the Fund has not had prior claims or losses pursuant to these contracts and expects the risk of loss to be remote.
2. Fair Valuation Measurements
Financial Accounting Standards Board ("FASB") Accounting Standards Codification ("ASC") 820, Fair Value Measurements and Disclosures ("ASC 820"), defines fair value as the value that the Fund would receive to sell an investment or pay to transfer a liability in a timely transaction with an independent buyer in the principal market, or in the absence of a principal market the most advantageous market for the investment or liability. ASC 820 establishes a three-tier hierarchy to distinguish between (1) inputs that reflect the assumptions market participants would use in valuing an asset or liability developed based on market data obtained from sources independent of the reporting entity (observable inputs); and (2) inputs that reflect the reporting entity's own assumptions about the assumptions market participants would use in valuing an asset or liability developed based on the best information available in the circumstances (unobservable inputs) and to establish classification of fair value measurements for disclosure purposes. Various inputs are used in determining the value of the Fund's investments. The inputs are summarized in the three broad levels listed below.
• Level 1 — unadjusted quoted prices in active markets for identical investments
• Level 2 — other significant observable inputs (including quoted prices for similar investments, interest rates, prepayment speeds, credit risk, etc.)
20
Morgan Stanley Mid Cap Growth Fund
Notes to Financial Statements n September 30, 2011 continued
• Level 3 — significant unobservable inputs including the Fund's own assumptions in determining the fair value of investments. Factors considered in making this determination may include, but are not limited to, information obtained by contacting the issuer, analysts, or the appropriate stock exchange (for exchange-traded securities), analysis of the issuer's financial statements or other available documents and, if necessary, available information concerning other securities in similar circumstances
The inputs or methodology used for valuing securities are not necessarily an indication of the risk associated with investing in those securities and the determination of the significance of a particular input to the fair value measurement in its entirety requires judgment and considers factors specific to each security.
The following is a summary of the inputs used as of September 30, 2011 in valuing the Fund's investments carried at fair value:
| FAIR VALUE MEASUREMENTS AT SEPTEMBER 30, 2011 USING | |||||||||||||||||||
| INVESTMENT TYPE | TOTAL | UNADJUSTED QUOTED PRICES IN ACTIVE MARKETS FOR IDENTICAL INVESTMENTS (LEVEL 1) | OTHER SIGNIFICANT OBSERVABLE INPUTS (LEVEL 2) | SIGNIFICANT UNOBSERVABLE INPUTS (LEVEL 3) | |||||||||||||||
| Assets: | |||||||||||||||||||
| Common Stocks | |||||||||||||||||||
| Air Transport | $ | 6,779,433 | $ | 6,779,433 | — | — | |||||||||||||
| Alternative Energy | 11,191,762 | 11,191,762 | — | — | |||||||||||||||
| Asset Management & Custodian | 1,697,874 | 1,697,874 | — | — | |||||||||||||||
| Biotechnology | 11,664,106 | 11,664,106 | — | — | |||||||||||||||
| Cement | 3,107,642 | 3,107,642 | — | — | |||||||||||||||
| Chemicals: Diversified | 8,130,882 | 8,130,882 | — | — | |||||||||||||||
| Commercial Services | 18,284,712 | 12,720,150 | $ | 5,564,562 | — | ||||||||||||||
| Communications Technology | 17,159,930 | 13,164,226 | 3,995,704 | — | |||||||||||||||
| Computer Services, Software & Systems | 40,878,926 | 39,271,433 | 1,607,493 | — | |||||||||||||||
| Computer Technology | 9,864,250 | 9,864,250 | — | — | |||||||||||||||
| Consumer Lending | 4,761,148 | 4,761,148 | — | — | |||||||||||||||
| Consumer Services: Miscellaneous | 7,887,719 | 4,628,715 | 3,259,004 | — | |||||||||||||||
| Cosmetics | 2,760,773 | 2,760,773 | — | — | |||||||||||||||
| Diversified Materials & Processing | 5,438,612 | 5,438,612 | — | — | |||||||||||||||
| Diversified Media | 10,421,802 | 10,421,802 | — | — | |||||||||||||||
| Diversified Retail | 29,852,339 | 29,852,339 | — | — | |||||||||||||||
| Education Services | 3,376,223 | 3,376,223 | — | — | |||||||||||||||
| Financial Data & Systems | 16,443,906 | 16,443,906 | — | — | |||||||||||||||
| Health Care Services | 8,724,958 | 8,724,958 | — | — | |||||||||||||||
| Medical & Dental Instruments & Supplies | 4,447,854 | 4,447,854 | — | — | |||||||||||||||
21
Morgan Stanley Mid Cap Growth Fund
Notes to Financial Statements n September 30, 2011 continued
| FAIR VALUE MEASUREMENTS AT SEPTEMBER 30, 2011 USING | |||||||||||||||||||
| INVESTMENT TYPE | TOTAL | UNADJUSTED QUOTED PRICES IN ACTIVE MARKETS FOR IDENTICAL INVESTMENTS (LEVEL 1) | OTHER SIGNIFICANT OBSERVABLE INPUTS (LEVEL 2) | SIGNIFICANT UNOBSERVABLE INPUTS (LEVEL 3) | |||||||||||||||
| Medical Equipment | $ | 10,208,947 | $ | 10,208,947 | — | — | |||||||||||||
| Metals & Minerals: Diversified | 6,034,769 | 4,734,825 | $ | 1,299,944 | — | ||||||||||||||
| Pharmaceuticals | 21,242,634 | 21,242,634 | — | — | |||||||||||||||
| Publishing | 4,815,517 | 4,815,517 | — | — | |||||||||||||||
| Recreational Vehicles & Boats | 11,131,657 | — | 11,131,657 | — | |||||||||||||||
| Restaurants | 4,318,652 | 4,318,652 | — | — | |||||||||||||||
| Scientific Instruments: Pollution Control | 3,833,926 | 3,833,926 | — | — | |||||||||||||||
| Semiconductors & Components | 9,478,798 | 9,478,798 | — | — | |||||||||||||||
| Shipping | 4,455,343 | 4,455,343 | — | — | |||||||||||||||
| Textiles Apparel & Shoes | 4,540,213 | 4,540,213 | — | — | |||||||||||||||
| Utilities: Electrical | 3,413,928 | 3,413,928 | — | — | |||||||||||||||
| Total Common Stocks | 306,349,235 | 279,490,871 | 26,858,364 | — | |||||||||||||||
| Convertible Preferred Stocks | 7,510,589 | — | — | $ | 7,510,589 | ||||||||||||||
| Preferred Stock | 2,882,562 | — | — | 2,882,562 | |||||||||||||||
| Short-Term Investment - Investment Company | 20,294,108 | 20,294,108 | — | — | |||||||||||||||
| Total Assets | $ | 337,036,494 | $ | 299,784,979 | $ | 26,858,364 | $ | 10,393,151 | |||||||||||
Transfers between investment levels may occur as the markets fluctuate and/or the availability of data used in an investment's valuation changes. The Fund recognizes transfers between the levels as of the end of the period. As of September 30, 2011, securities with a total value of $19,603,657 transferred from Level 1 to Level 2. At September 30, 2011, the fair market value of certain securities were adjusted due to developments which occurred between the time of the close of the foreign markets on which they trade and the close of business on the NYSE which resulted in their Level 2 classification.
22
Morgan Stanley Mid Cap Growth Fund
Notes to Financial Statements n September 30, 2011 continued
Following is a reconciliation of investments in which significant unobservable inputs (Level 3) were used in determining fair value:
| PREFERRED STOCKS | CONVERTIBLE PREFERRED STOCKS | ||||||||||
| Beginning Balance | — | $ | 1,546,557 | ||||||||
| Net purchases (sales) | $ | 2,882,562 | 2,943,809 | ||||||||
| Amortization of discount | — | — | |||||||||
| Transfers in | — | — | |||||||||
| Transfers out | — | — | |||||||||
| Change in unrealized appreciation/depreciation | — | 3,020,223 | |||||||||
| Realized gains (losses) | — | — | |||||||||
| Ending Balance | $ | 2,882,562 | $ | 7,510,589 | |||||||
| Net change in unrealized appreciation/ depreciation from investments still held as of September 30, 2011 | — | $ | 3,020,223 | ||||||||
3. Investment Advisory/Administration Agreements
Pursuant to an Investment Advisory Agreement with the Adviser, the Fund pays an advisory fee, accrued daily and payable monthly, by applying the following annual rates to the net assets of the Fund determined as of the close of each business day: 0.42% to the portion of the daily net assets not exceeding $500 million; and 0.395% to the portion of the daily net assets exceeding $500 million.
Pursuant to an Administration Agreement with Morgan Stanley Services Company Inc. (the "Administrator"), an affiliate of the Adviser, the Fund pays an administration fee, accrued daily and payable monthly, by applying the annual rate of 0.08% to the Fund's daily net assets.
Under a Sub-Administration Agreement between the Administrator and State Street Bank and Trust Company ("State Street"), State Street provides certain administrative services to the Fund. For such services, the Administrator pays State Street a portion of the fee the Administrator receives from the Fund.
4. Plan of Distribution
Shares of the Fund are distributed by Morgan Stanley Distribution, Inc. (the "Distributor"), an affiliate of the Adviser and Administrator. The Fund has adopted a Plan of Distribution (the "Plan") pursuant to Rule 12b-1 under the Act. The Plan provides that the Fund will pay the Distributor a fee which is accrued daily and paid monthly at the following annual rates: (i) Class A — up to 0.25% of the average daily net assets of Class A shares; (ii) Class B — up to 1.00% of the average daily net assets of Class B shares; and (iii) Class C — up to 1.00% of the average daily net assets of Class C shares.
23
Morgan Stanley Mid Cap Growth Fund
Notes to Financial Statements n September 30, 2011 continued
In the case of Class B shares, provided that the Plan continues in effect, any cumulative expenses incurred by the Distributor but not yet recovered may be recovered through the payment of future distribution fees from the Fund pursuant to the Plan and contingent deferred sales charges paid by investors upon redemption of Class B shares. Although there is no legal obligation for the Fund to pay expenses incurred in excess of payments made to the Distributor under the Plan and the proceeds of contingent deferred sales charges paid by investors upon redemption of shares, if for any reason the Plan is terminated, the Trustees will consider at that time the manner in which to treat such expenses. The Distributor has advised the Fund that such excess amounts totaled $31,190,249 at September 30, 2011.
In the case of Class A shares and Class C shares, expenses incurred pursuant to the Plan in any calendar year in excess of 0.25% or 1.00% of the average daily net assets of Class A shares or Class C shares, respectively, will not be reimbursed by the Fund through payments in any subsequent year, except that expenses representing a gross sales credit to Morgan Stanley Smith Barney Financial Advisors and other authorized financial representatives at the time of sale may be reimbursed in the subsequent calendar year. For the year ended September 30, 2011, the distribution fee was accrued for Class A shares and Class C shares at the annual rate of 0.25% and 1.00%, respectively.
The Distributor has informed the Fund that for the year ended September 30, 2011, it received contingent deferred sales charges from certain redemptions of the Fund's Class A shares, Class B shares and Class C shares of $500, $6,971 and $4,021, respectively, and received $181,210 in front-end sales charges from sales of the Fund's Class A shares. The respective shareholders pay such charges, which are not an expense of the Fund.
5. Security Transactions and Transactions with Affiliates
The cost of purchases and proceeds from sales of investment securities, excluding short-term investments, for the year ended September 30, 2011 aggregated $170,873,425 and $187,026,992, respectively.
The Fund invests in the Institutional Class of the Morgan Stanley Institutional Liquidity Funds – Money Market Portfolio (the "Liquidity Funds"), an open-end management investment company managed by the Adviser. Investment advisory fees paid by the Fund are reduced by an amount equal to its pro-rata share of the advisory and administration fees paid by the Fund due to its investment in the Liquidity Funds. For the year ended September 30, 2011, advisory fees paid were reduced by $17,411 relating to the Fund's investment in the Liquidity Funds.
24
Morgan Stanley Mid Cap Growth Fund
Notes to Financial Statements n September 30, 2011 continued
A summary of the Fund's transactions in shares of the Liquidity Funds during the year ended September 30, 2011 is as follows:
| VALUE SEPTEMBER 30, 2010 | PURCHASES AT COST | SALES | DIVIDEND INCOME | VALUE SEPTEMBER 30, 2011 | |||||||||||||||
| $ | 37,320,156 | $ | 125,858,803 | $ | 142,884,851 | $ | 27,152 | $ | 20,294,108 | ||||||||||
For the year ended September 30, 2011, the Fund incurred brokerage commissions of $1,704 with Morgan Stanley & Co., LLC, an affiliate of the Adviser, Administrator and Distributor, for portfolio transactions executed on behalf of the Fund.
For the year ended year ended September 30, 2011, the Fund incurred broker commissions of $2,026 with Citigroup, Inc., and its affiliated broker/dealers, which may be deemed to be affiliates of the Adviser, Administrator and Distributor under Section 17 of the Act, for the portfolio transactions executed on behalf of the Fund.
Morgan Stanley Services Company Inc., an affiliate of the Adviser and Distributor, is the Fund's transfer agent.
The Fund has an unfunded noncontributory defined benefit pension plan covering certain independent Trustees of the Fund who will have served as independent Trustees for at least five years at the time of retirement. Benefits under this plan are based on factors which include years of service and compensation. The Trustees voted to close the plan to new participants and eliminate the future benefits growth due to increases to compensation after July 31, 2003. Aggregate pension costs for the year ended September 30, 2011, included in "trustees' fees and expenses" in the Statement of Operations amounted to $470. At September 30, 2011, the Fund had an accrued pension liability of $60,439, which is included in "accrued expenses and other payables" in the Statement of Assets and Liabilities.
The Fund has an unfunded Deferred Compensation Plan (the "Compensation Plan"), which allows each independent Trustee to defer payment of all, or a portion, of the fees he or she receives for serving on the Board of Trustees. Each eligible Trustee generally may elect to have the deferred amounts credited with a return equal to the total return on one or more of the Morgan Stanley funds that are offered as investment options under the Compensation Plan. Appreciation/depreciation and distributions received from these investments are recorded with an offsetting increase/decrease in the deferred compensation obligation and do not affect the net asset value of the Fund.
25
Morgan Stanley Mid Cap Growth Fund
Notes to Financial Statements n September 30, 2011 continued
6. Shares of Beneficial Interest+
Transactions in shares of beneficial interest were as follows:
| FOR THE YEAR ENDED SEPTEMBER 30, 2011 | FOR THE YEAR ENDED SEPTEMBER 30, 2010 | ||||||||||||||||||
| SHARES | AMOUNT | SHARES | AMOUNT | ||||||||||||||||
| CLASS A SHARES | |||||||||||||||||||
| Sold | 2,162,956 | $ | 74,977,651 | 2,810,940 | $ | 78,334,996 | |||||||||||||
| Conversion from Class B | 159,254 | 5,567,470 | 46,614 | 1,234,515 | |||||||||||||||
| Redeemed | (2,977,065 | ) | (102,727,503 | ) | (1,685,973 | ) | (44,330,032 | ) | |||||||||||
| Net increase (decrease) — Class A | (654,855 | ) | (22,182,382 | ) | 1,171,581 | 35,239,479 | |||||||||||||
| CLASS B SHARES | |||||||||||||||||||
| Sold | 55,593 | 1,621,613 | 38,252 | 883,012 | |||||||||||||||
| Conversion to Class A | (182,856 | ) | (5,567,470 | ) | (53,118 | ) | (1,234,515 | ) | |||||||||||
| Redeemed | (100,037 | ) | (3,002,660 | ) | (375,353 | ) | (8,647,301 | ) | |||||||||||
| Net decrease — Class B | (227,300 | ) | (6,948,517 | ) | (390,219 | ) | (8,998,804 | ) | |||||||||||
| CLASS C SHARES | |||||||||||||||||||
| Sold | 216,397 | 6,353,209 | 100,864 | 2,374,794 | |||||||||||||||
| Redeemed | (126,456 | ) | (3,802,312 | ) | (132,859 | ) | (3,058,243 | ) | |||||||||||
| Net increase (decrease) — Class C | 89,941 | 2,550,897 | (31,995 | ) | (683,449 | ) | |||||||||||||
| CLASS I SHARES | |||||||||||||||||||
| Sold | 44,096 | 1,565,256 | 21,025 | 580,998 | |||||||||||||||
| Redeemed | (54,209 | ) | (1,924,350 | ) | (9,769 | ) | (265,515 | ) | |||||||||||
| Net increase (decrease) — Class I | (10,113 | ) | (359,094 | ) | 11,256 | 315,483 | |||||||||||||
| Net increase (decrease) in Fund | (802,327 | ) | $ | (26,939,096 | ) | 760,623 | $ | 25,872,709 | |||||||||||
+ On March 31, 2011, the Fund suspended offering its shares to new investors, with certain exception as set forth in the Fund's Prospectus. The Fund will continue to offer its shares to existing shareholders and may recommence offering its shares to new investors in the future.
7. Expense Offset
The Fund has entered into an arrangement with State Street ("Custodian"), whereby credits realized on uninvested cash balances were used to offset a portion of the Fund's expenses. If applicable, these custodian credits are shown as "expense offset" in the Statement of Operations.
8. Federal Income Tax Status
The amount of dividends and distributions from net investment income and net realized capital gains are determined in accordance with federal income tax regulations which may differ from GAAP. These "book/tax" differences are either considered temporary or permanent in nature. To the extent these
26
Morgan Stanley Mid Cap Growth Fund
Notes to Financial Statements n September 30, 2011 continued
differences are permanent in nature, such amounts are reclassified within the capital accounts based on their federal tax-basis treatment; temporary differences do not require reclassification. Dividends and distributions which exceed net investment income and net realized capital gains for tax purposes are reported as distributions of paid-in-capital.
As of September 30, 2011, the tax-basis components of accumulated earnings were as follows:
| Undistributed ordinary income | — | ||||||||||
| Undistributed long-term gains | $ | 11,517,632 | |||||||||
| Net accumulated earnings | 11,517,632 | ||||||||||
| Post-October losses | (73,542 | ) | |||||||||
| Temporary differences | (64,559 | ) | |||||||||
| Net unrealized appreciation | 20,230,836 | ||||||||||
| Total accumulated earnings | $ | 31,610,367 | |||||||||
During the year ended September, 30, 2011, the Fund utilized its net capital loss carryforward of $30,874,816.
As of September 30, 2011, the Fund had temporary book/tax differences primarily attributable to post-October losses (foreign currency losses incurred after October 31 within the taxable year which are deemed to arise on the first business day of the Fund's next taxable year), capital loss deferrals on wash sales and nondeductible expenses.
Permanent differences, primarily due to foreign currency gains and a net operating loss, resulted in the following reclassifications among the Fund's components of net assets at September 30, 2011:
| ACCUMULATED NET INVESTMENT LOSS | ACCUMULATED UNDISTRIBUTED NET REALIZED GAIN | PAID-IN-CAPITAL | |||||||||
| $ | 1,291,047 | $ | (2,716 | ) | $ | (1,288,331 | ) | ||||
9. Accounting Pronouncement
In May 2011, FASB issued Accounting Standards Update ("ASU") 2011-04. The amendments in this update are the results of the work of FASB and the International Accounting Standards Board to develop common requirements for measuring fair value and for disclosing information about fair value measurements, which are effective during interim and annual periods beginning after December 15, 2011. Consequently, these amendments improve the comparability of fair value measurements presented and disclosed in the financial statements prepared in accordance with U.S. GAAP and International Financial Reporting Standards. At this time, the Fund's management is evaluating the implications of ASU 2011-04.
27
Morgan Stanley Mid Cap Growth Fund
Financial Highlights
Selected ratios and per share data for a share of beneficial interest outstanding throughout each period:
| FOR THE YEAR ENDED SEPTEMBER 30, | |||||||||||||||||||||||
| 2011 | 2010^ | 2009^ | 2008^ | 2007^ | |||||||||||||||||||
| Class A Shares | |||||||||||||||||||||||
| Selected Per Share Data: | |||||||||||||||||||||||
| Net asset value, beginning of period | $ | 30.13 | $ | 24.22 | $ | 23.78 | $ | 35.96 | $ | 27.00 | |||||||||||||
| Income (loss) from investment operations: | |||||||||||||||||||||||
| Net investment income (loss)(1) | (0.07 | ) | 0.01 | (0.06 | ) | (0.05 | ) | 0.05 | |||||||||||||||
| Net realized and unrealized gain (loss) | 0.33 | 5.90 | 1.83 | (9.46 | ) | 8.91 | |||||||||||||||||
| Total income (loss) from investment operations | 0.26 | 5.91 | 1.77 | (9.51 | ) | 8.96 | |||||||||||||||||
| Less distributions from net realized gain | — | — | (1.33 | ) | (2.67 | ) | — | ||||||||||||||||
| Net asset value, end of period | $ | 30.39 | $ | 30.13 | $ | 24.22 | $ | 23.78 | $ | 35.96 | |||||||||||||
| Total Return(2) | 0.86 | % | 24.40 | % | 10.94 | % | (28.53 | )% | 33.19 | % | |||||||||||||
| Ratios to Average Net Assets(3): | |||||||||||||||||||||||
| Total expenses | 0.97 | %(4) | 1.04 | %(4) | 1.17 | %(4) | 0.99 | %(4) | 1.01 | %(4) | |||||||||||||
| Net investment income (loss) | (0.19 | )%(4) | 0.02 | %(4) | (0.34 | )%(4) | (0.17 | )%(4) | 0.15 | %(4) | |||||||||||||
| Rebate from Morgan Stanley affiliate | 0.00 | %(5) | 0.00 | %(5) | 0.00 | %(5) | 0.00 | %(5) | 0.00 | %(5) | |||||||||||||
| Supplemental Data: | |||||||||||||||||||||||
| Net assets, end of period, in thousands | $ | 302,166 | $ | 319,321 | $ | 228,332 | $ | 232,192 | $ | 295,694 | |||||||||||||
| Portfolio turnover rate | 46 | % | 46 | % | 27 | % | 59 | % | 72 | % | |||||||||||||
^ Beginning with the year ended September 30, 2011, the Fund was audited by Ernst & Young LLP. The previous years were audited by another independent registered public accounting firm.
(1) The per share amounts were computed using an average number of shares outstanding during the period.
(2) Does not reflect the deduction of sales charge. Calculated based on the net asset value as of the last business day of the period.
(3) Reflects overall Fund ratios for investment income and non-class specific expenses.
(4) The ratios reflect the rebate of certain Fund expenses in connection with investments in a Morgan Stanley affiliate during the period. The effect of the rebate on the ratios is disclosed in the above table as "Rebate from Morgan Stanley affiliate."
(5) Amount is less than 0.005%.
See Notes to Financial Statements
28
Morgan Stanley Mid Cap Growth Fund
Financial Highlights continued
| FOR THE YEAR ENDED SEPTEMBER 30, | |||||||||||||||||||||||
| 2011 | 2010^ | 2009^ | 2008^ | 2007^ | |||||||||||||||||||
| Class B Shares | |||||||||||||||||||||||
| Selected Per Share Data: | |||||||||||||||||||||||
| Net asset value, beginning of period | $ | 26.34 | $ | 21.34 | $ | 21.33 | $ | 32.76 | $ | 24.78 | |||||||||||||
| Income (loss) from investment operations: | |||||||||||||||||||||||
| Net investment loss(1) | (0.28 | ) | (0.17 | ) | (0.17 | ) | (0.25 | ) | (0.17 | ) | |||||||||||||
| Net realized and unrealized gain (loss) | 0.31 | 5.17 | 1.51 | (8.51 | ) | 8.15 | |||||||||||||||||
| Total income (loss) from investment operations | 0.03 | 5.00 | 1.34 | (8.76 | ) | 7.98 | |||||||||||||||||
| Less distributions from net realized gain | — | — | (1.33 | ) | (2.67 | ) | — | ||||||||||||||||
| Net asset value, end of period | $ | 26.37 | $ | 26.34 | $ | 21.34 | $ | 21.33 | $ | 32.76 | |||||||||||||
| Total Return(2) | 0.11 | % | 23.43 | % | 10.12 | % | (29.08 | )% | 32.24 | % | |||||||||||||
| Ratios to Average Net Assets(3): | |||||||||||||||||||||||
| Total expenses | 1.72 | %(4) | 1.79 | %(4) | 1.92 | %(4) | 1.75 | %(4) | 1.77 | %(4) | |||||||||||||
| Net investment loss | (0.94 | )%(4) | (0.73 | )%(4) | (1.09 | )%(4) | (0.93 | )%(4) | (0.61 | )%(4) | |||||||||||||
| Rebate from Morgan Stanley affiliate | 0.00 | %(5) | 0.00 | %(5) | 0.00 | %(5) | 0.00 | %(5) | 0.00 | %(5) | |||||||||||||
| Supplemental Data: | |||||||||||||||||||||||
| Net assets, end of period, in thousands | $ | 10,338 | $ | 16,315 | $ | 21,541 | $ | 33,659 | $ | 126,446 | |||||||||||||
| Portfolio turnover rate | 46 | % | 46 | % | 27 | % | 59 | % | 72 | % | |||||||||||||
^ Beginning with the year ended September 30, 2011, the Fund was audited by Ernst & Young LLP. The previous years were audited by another independent registered public accounting firm.
(1) The per share amounts were computed using an average number of shares outstanding during the period.
(2) Does not reflect the deduction of sales charge. Calculated based on the net asset value as of the last business day of the period.
(3) Reflects overall Fund ratios for investment income and non-class specific expenses.
(4) The ratios reflect the rebate of certain Fund expenses in connection with investments in a Morgan Stanley affiliate during the period. The effect of the rebate on the ratios is disclosed in the above table as "Rebate from Morgan Stanley affiliate."
(5) Amount is less than 0.005%.
See Notes to Financial Statements
29
Morgan Stanley Mid Cap Growth Fund
Financial Highlights continued
| FOR THE YEAR ENDED SEPTEMBER 30, | |||||||||||||||||||||||
| 2011 | 2010^ | 2009^ | 2008^ | 2007^ | |||||||||||||||||||
| Class C Shares | |||||||||||||||||||||||
| Selected Per Share Data: | |||||||||||||||||||||||
| Net asset value, beginning of period | $ | 26.46 | $ | 21.43 | $ | 21.41 | $ | 32.88 | $ | 24.87 | |||||||||||||
| Income (loss) from investment operations: | |||||||||||||||||||||||
| Net investment loss(1) | (0.29 | ) | (0.17 | ) | (0.17 | ) | (0.25 | ) | (0.17 | ) | |||||||||||||
| Net realized and unrealized gain (loss) | 0.31 | 5.20 | 1.52 | (8.55 | ) | 8.18 | |||||||||||||||||
| Total income (loss) from investment operations | 0.02 | 5.03 | 1.35 | (8.80 | ) | 8.01 | |||||||||||||||||
| Less distributions from net realized gain | — | — | (1.33 | ) | (2.67 | ) | — | ||||||||||||||||
| Net asset value, end of period | $ | 26.48 | $ | 26.46 | $ | 21.43 | $ | 21.41 | $ | 32.88 | |||||||||||||
| Total Return(2) | 0.11 | % | 23.47 | % | 10.12 | % | (29.08 | )% | 32.21 | % | |||||||||||||
| Ratios to Average Net Assets(3): | |||||||||||||||||||||||
| Total expenses | 1.72 | %(4) | 1.79 | %(4) | 1.92 | %(4) | 1.72 | %(4) | 1.77 | %(4) | |||||||||||||
| Net investment loss | (0.94 | )%(4) | (0.73 | )%(4) | (1.09 | )%(4) | (0.90 | )%(4) | (0.61 | )%(4) | |||||||||||||
| Rebate from Morgan Stanley affiliate | 0.00 | %(5) | 0.00 | %(5) | 0.00 | %(5) | 0.00 | %(5) | 0.00 | %(5) | |||||||||||||
| Supplemental Data: | |||||||||||||||||||||||
| Net assets, end of period, in thousands | $ | 20,491 | $ | 18,090 | $ | 15,339 | $ | 17,085 | $ | 29,267 | |||||||||||||
| Portfolio turnover rate | 46 | % | 46 | % | 27 | % | 59 | % | 72 | % | |||||||||||||
^ Beginning with the year ended September 30, 2011, the Fund was audited by Ernst & Young LLP. The previous years were audited by another independent registered public accounting firm.
(1) The per share amounts were computed using an average number of shares outstanding during the period.
(2) Does not reflect the deduction of sales charge. Calculated based on the net asset value as of the last business day of the period.
(3) Reflects overall Fund ratios for investment income and non-class specific expenses.
(4) The ratios reflect the rebate of certain Fund expenses in connection with investments in a Morgan Stanley affiliate during the period. The effect of the rebate on the ratios is disclosed in the above table as "Rebate from Morgan Stanley affiliate."
(5) Amount is less than 0.005%.
See Notes to Financial Statements
30
Morgan Stanley Mid Cap Growth Fund
Financial Highlights continued
| FOR THE YEAR ENDED SEPTEMBER 30, | |||||||||||||||||||||||
| 2011 | 2010^ | 2009^ | 2008^ | 2007^ | |||||||||||||||||||
| Class I Shares | |||||||||||||||||||||||
| Selected Per Share Data: | |||||||||||||||||||||||
| Net asset value, beginning of period | $ | 31.32 | $ | 25.13 | $ | 24.53 | $ | 36.94 | $ | 27.66 | |||||||||||||
| Income (loss) from investment operations: | |||||||||||||||||||||||
| Net investment income(1) | 0.02 | 0.07 | 0.00 | (2) | 0.03 | 0.12 | |||||||||||||||||
| Net realized and unrealized gain (loss) | 0.32 | 6.12 | 1.93 | (9.77 | ) | 9.16 | |||||||||||||||||
| Total income (loss) from investment operations | 0.34 | 6.19 | 1.93 | (9.74 | ) | 9.28 | |||||||||||||||||
| Less distributions from net realized gain | — | — | (1.33 | ) | (2.67 | ) | — | ||||||||||||||||
| Net asset value, end of period | $ | 31.66 | $ | 31.32 | $ | 25.13 | $ | 24.53 | $ | 36.94 | |||||||||||||
| Total Return(3) | 1.12 | % | 24.63 | % | 11.27 | % | (28.39 | )% | 33.55 | % | |||||||||||||
| Ratios to Average Net Assets(4): | |||||||||||||||||||||||
| Total expenses | 0.72 | %(5) | 0.79 | %(5) | 0.92 | %(5) | 0.75 | %(5) | 0.77 | %(5) | |||||||||||||
| Net investment income (loss) | 0.06 | %(5) | 0.27 | %(5) | (0.09 | )%(5) | 0.07 | %(5) | 0.39 | %(5) | |||||||||||||
| Rebate from Morgan Stanley affiliate | 0.00 | %(6) | 0.00 | %(6) | 0.00 | %(6) | 0.00 | %(6) | 0.00 | %(6) | |||||||||||||
| Supplemental Data: | |||||||||||||||||||||||
| Net assets, end of period, in thousands | $ | 2,297 | $ | 2,589 | $ | 1,795 | $ | 10,158 | $ | 23,024 | |||||||||||||
| Portfolio turnover rate | 46 | % | 46 | % | 27 | % | 59 | % | 72 | % | |||||||||||||
^ Beginning with the year ended September 30, 2011, the Fund was audited by Ernst & Young LLP. The previous years were audited by another independent registered public accounting firm.
(1) The per share amounts were computed using an average number of shares outstanding during the period.
(2) Amount is less than $0.005.
(3) Calculated based on the net asset value as of the last business day of the period.
(4) Reflects overall Fund ratios for investment income and non-class specific expenses.
(5) The ratios reflect the rebate of certain Fund expenses in connection with investments in a Morgan Stanley affiliate during the period. The effect of the rebate on the ratios is disclosed in the above table as "Rebate from Morgan Stanley affiliate."
(6) Amount is less than 0.005%.
See Notes to Financial Statements
31
Morgan Stanley Mid Cap Growth Fund
Report of Independent Registered Public Accounting Firm
To the Shareholders and Board of Trustees of
Morgan Stanley Mid Cap Growth Fund:
We have audited the accompanying statement of assets and liabilities of Morgan Stanley Mid Cap Growth Fund (the "Fund"), including the portfolio of investments, as of September 30, 2011, and the related statements of operations, changes in net assets, and financial highlights for the year then ended. These financial statements and financial highlights are the responsibility of the Fund's management. Our responsibility is to express an opinion on these financial statements and financial highlights based on our audit. The statement of changes in net assets for the year ended September 30, 2010 and the financial highlights for each of the four years ended September 30, 2010 were audited by another independent registered public accounting firm whose report, dated November 24, 2010, expressed an unqualified opinion on that statement of changes in net assets and those financial highlights.
We conducted our audit in accordance with the standards of the Public Company Accounting Oversight Board (United States). Those standards require that we plan and perform the audit to obtain reasonable assurance about whether the financial statements and financial highlights are free of material misstatement. The Fund was not required to have, nor were we engaged to perform, an audit of its internal control over financial reporting. Our audit included consideration of internal control over financial reporting as a basis for designing audit procedures that are appropriate in the circumstances, but not for the purpose of expressing an opinion on the effectiveness of the Fund's internal control over financial reporting. Accordingly, we express no such opinion. An audit also includes examining, on a test basis, evidence supporting the amounts and disclosures in the financial statements, assessing the accounting principles used and significant estimates made by management, as well as evaluating the overall financial statement presentation. Our procedures included confirmation of securities owned as of September 30, 2011, by correspondence with the custodian and others or by other appropriate auditing procedures where replies from others were not received. We believe that our audit provides a reasonable basis for our opinion.
In our opinion, the financial statements and financial highlights referred to above present fairly, in all material respects, the financial position of Morgan Stanley Mid Cap Growth Fund as of September 30, 2011, the results of its operations, the changes in its net assets, and the financial highlights for the year then ended, in conformity with U.S. generally accepted accounting principles.

Boston, Massachusetts
November 23, 2011
32
Morgan Stanley Mid Cap Growth Fund
Change in Independent Registered Public Accounting Firm (unaudited)
On June 7, 2011, Deloitte & Touche LLP were dismissed as the Independent Registered Public Accounting Firm of the Fund.
The reports of Deloitte & Touche LLP on the financial statements of the Fund for the past two fiscal years contained no adverse opinion or disclaimer of opinion and were not qualified or modified as to uncertainty, audit scope or accounting principle.
In connection with its audits for the two most recent fiscal years, there have been no disagreements with Deloitte & Touche LLP on any matter of accounting principles or practices, financial statement disclosure, or auditing scope or procedure, which disagreements, if not resolved to the satisfaction of Deloitte & Touche LLP, would have caused them to make reference thereto in their reports on the financial statements for such years.
On June 7, 2011, the Fund, with the approval of its Board of Trustees and its Audit Committee, engaged Ernst & Young LLP as its new Independent Registered Public Accounting Firm.
33
Morgan Stanley Mid Cap Growth Fund
An Important Notice Concerning Our U.S. Privacy Policy (unaudited)
We are required by federal law to provide you with a copy of our privacy policy ("Policy") annually.
This Policy applies to current and former individual clients of Morgan Stanley Distribution, Inc., as well as current and former individual investors in Morgan Stanley mutual funds and related companies.
This Policy is not applicable to partnerships, corporations, trusts or other non-individual clients or account holders, nor is this Policy applicable to individuals who are either beneficiaries of a trust for which we serve as trustee or participants in an employee benefit plan administered or advised by us. This Policy is, however, applicable to individuals who select us to be a custodian of securities or assets in individual retirement accounts, 401(k) accounts, 529 Educational Savings Accounts, accounts subject to the Uniform Gifts to Minors Act, or similar accounts. We may amend this Policy at any time, and will inform you of any changes to this Policy as required by law.
We Respect Your Privacy
We appreciate that you have provided us with your personal financial information and understand your concerns about safeguarding such information. We strive to maintain the privacy of such information while we help you achieve your financial objectives. This Policy describes what nonpublic personal information we collect about you, how we collect it, when we may share it with others, and how others may use it. It discusses the steps you may take to limit our sharing of information about you with affiliated Morgan Stanley companies ("affiliated companies"). It also discloses how you may limit our affiliates' use of shared information for marketing purposes. Throughout this Policy, we refer to the nonpublic information that personally identifies you or your accounts as "personal information."
1. What Personal Information Do We Collect About You?
To better serve you and manage our business, it is important that we collect and maintain accurate information about you. We obtain this information from applications and other forms you submit to us, from your dealings with us, from consumer reporting agencies, from our websites and from third parties and other sources.
For example:
• We collect information such as your name, address, e-mail address, telephone/fax numbers, assets, income and investment objectives through application forms you submit to us.
• We may obtain information about account balances, your use of account(s) and the types of products and services you prefer to receive from us through your dealings and transactions with us and other sources.
34
Morgan Stanley Mid Cap Growth Fund
An Important Notice Concerning Our U.S. Privacy Policy (unaudited) continued
• We may obtain information about your creditworthiness and credit history from consumer reporting agencies.
• We may collect background information from and through third-party vendors to verify representations you have made and to comply with various regulatory requirements.
• If you interact with us through our public and private Web sites, we may collect information that you provide directly through online communications (such as an e-mail address). We may also collect information about your Internet service provider, your domain name, your computer's operating system and Web browser, your use of our Web sites and your product and service preferences, through the use of "cookies." "Cookies" recognize your computer each time you return to one of our sites, and help to improve our sites' content and personalize your experience on our sites by, for example, suggesting offerings that may interest you. Please consult the Terms of Use of these sites for more details on our use of cookies.
2. When Do We Disclose Personal Information We Collect About You?
To provide you with the products and services you request, to better serve you, to manage our business and as otherwise required or permitted by law, we may disclose personal information we collect about you to other affiliated companies and to nonaffiliated third parties.
a. Information We Disclose to Our Affiliated Companies. In order to manage your account(s) effectively, including servicing and processing your transactions, to let you know about products and services offered by us and affiliated companies, to manage our business, and as otherwise required or permitted by law, we may disclose personal information about you to other affiliated companies. Offers for products and services from affiliated companies are developed under conditions designed to safeguard your personal information.
b. Information We Disclose to Third Parties. We do not disclose personal information that we collect about you to nonaffiliated third parties except to enable them to provide marketing services on our behalf, to perform joint marketing agreements with other financial institutions, and as otherwise required or permitted by law. For example, some instances where we may disclose information about you to third parties include: for servicing and processing transactions, to offer our own products and services, to protect against fraud, for institutional risk control, to respond to judicial process or to perform services on our behalf. When we share personal information with a nonaffiliated third party, they are required to limit their use of personal information about you to the particular purpose for which it was shared and they are not allowed to share personal information about you with others except to fulfill that limited purpose or as may be required by law.
35
Morgan Stanley Mid Cap Growth Fund
An Important Notice Concerning Our U.S. Privacy Policy (unaudited) continued
3. How Do We Protect the Security and Confidentiality of Personal Information We Collect About You?
We maintain physical, electronic and procedural security measures to help safeguard the personal information we collect about you. We have internal policies governing the proper handling of client information. Third parties that provide support or marketing services on our behalf may also receive personal information about you, and we require them to adhere to confidentiality standards with respect to such information.
4. How Can You Limit Our Sharing of Certain Personal Information About You with Our Affiliated Companies for Eligibility Determination?
We respect your privacy and offer you choices as to whether we share with our affiliated companies personal information that was collected to determine your eligibility for products and services such as credit reports and other information that you have provided to us or that we may obtain from third parties ("eligibility information"). Please note that, even if you direct us not to share certain eligibility information with our affiliated companies, we may still share your personal information, including eligibility information, with those companies under circumstances that are permitted under applicable law, such as to process transactions or to service your account. We may also share certain other types of personal information with affiliated companies — such as your name, address, telephone number, e-mail address and account number(s), and information about your transactions and experiences with us.
5. How Can You Limit the Use of Certain Personal Information About You by Our Affiliated Companies for Marketing?
You may limit our affiliated companies from using certain personal information about you that we may share with them for marketing their products or services to you. This information includes our transactions and other experiences with you such as your assets and account history. Please note that, even if you choose to limit our affiliated companies from using certain personal information about you that we may share with them for marketing their products and services to you, we may still share such personal information about you with them, including our transactions and experiences with you, for other purposes as permitted under applicable law.
6. How Can You Send Us an Opt-Out Instruction?
If you wish to limit our sharing of certain personal information about you with our affiliated companies for "eligibility purposes" and for our affiliated companies' use in marketing products and services to you as described in this notice, you may do so by:
• Calling us at (800) 869-6397
Monday–Friday between 8a.m. and 6p.m. (EST)
36
Morgan Stanley Mid Cap Growth Fund
An Important Notice Concerning Our U.S. Privacy Policy (unaudited) continued
• Writing to us at the following address:
Morgan Stanley Privacy Department
Harborside Financial Center
201 Plaza Two, 3rd Floor
Jersey City, NJ 07311
If you choose to write to us, your written request should include: your name, address, telephone number and account number(s) to which the opt-out applies and should not be sent with any other correspondence. In order to process your request, we require that the request be provided by you directly and not through a third party. Once you have informed us about your privacy preferences, your opt-out preference will remain in effect with respect to this Policy (as it may be amended) until you notify us otherwise. If you are a joint account owner, we will accept instructions from any one of you and apply those instructions to the entire account. Please allow approximately 30 days from our receipt of your opt-out for your instructions to become effective.
Please understand that if you opt-out, you and any joint account holders may not receive certain Morgan Stanley or our affiliated companies' products and services that could help you manage your financial resources and achieve your investment objectives.
If you have more than one account with us or our affiliates, you may receive multiple privacy policies from us, and would need to follow the directions stated in each particular policy for each account you have with us.
7. What if an affiliated company becomes a nonaffiliated third party?
If, at any time in the future, an affiliated company becomes a nonaffiliated third party, further disclosures of personal information made to the former affiliated company will be limited to those described in Section 2(b) above relating to nonaffiliated third parties. If you elected under Section 6 to limit disclosures we make to affiliated companies, or use of personal information by affiliated companies, your election will not apply to use by any former affiliated company of your personal information in their possession once it becomes a nonaffiliated third party.
Special Notice to Residents of Vermont
This section supplements our Policy with respect to our individual clients who have a Vermont address and supersedes anything to the contrary in the above Policy with respect to those clients only.
The State of Vermont requires financial institutions to obtain your consent prior to sharing personal information that they collect about you with affiliated companies and nonaffiliated third parties other than in certain limited circumstances. Except as permitted by law, we will not share personal information we
37
Morgan Stanley Mid Cap Growth Fund
An Important Notice Concerning Our U.S. Privacy Policy (unaudited) continued
collect about you with nonaffiliated third parties or other affiliated companies unless you provide us with your written consent to share such information ("opt-in").
If you wish to receive offers for investment products and services offered by or through other affiliated companies, please notify us in writing at the following address:
Morgan Stanley Privacy Department
Harborside Financial Center
201 Plaza Two, 3rd Floor
Jersey City, NJ 07311
Your authorization should include: your name, address, telephone number and account number(s) to which the opt-in applies and should not be sent with any other correspondence. In order to process your authorization, we require that the authorization be provided by you directly and not through a third-party.
Special Notice to Residents of California
The following section supplements our Policy with respect to our individual clients who have a California address and supersedes anything to the contrary in the above Policy with respect to those clients only.
In response to a California law, if your account has a California home address, your personal information will not be disclosed to nonaffiliated third parties except as permitted by applicable California law, and we will limit sharing such personal information with our affiliates to comply with California privacy laws that apply to us.
38
Morgan Stanley Mid Cap Growth Fund
Trustee and Officer Information (unaudited)
Independent Trustees:
| Name, Age and Address of Independent Trustee | Position(s) Held with Registrant | Length of Time Served* | Principal Occupation(s) During Past 5 Years | Number of Portfolios in Fund Complex Overseen by Independent Trustee** | Other Directorships Held by Independent Trustee*** | ||||||||||||||||||
| Frank L. Bowman (66) c/o Kramer Levin Naftalis & Frankel LLP Counsel to the Independent Trustees 1177 Avenue of the Americas New York, NY 10036 | Trustee | Since August 2006 | President, Strategic Decisions, LLC (consulting) (since February 2009); Director or Trustee of various Morgan Stanley Funds (since August 2006); Chairperson of the Insurance Sub-Committee of the Compliance and Insurance Committee (since February 2007); served as President and Chief Executive Officer of the Nuclear Energy Institute (policy organization) (February 2005 through November 2008); retired as Admiral, U.S. Navy after serving over 38 years on active duty including 8 years as Director of the Naval Nuclear Propulsion Program in the Department of the Navy and the U.S. Department of Energy (1996-2004); served as Chief of Naval Personnel (July 1994-September 1996) and on the joint staff as Director of Political-Military Affairs (June 1992 to July 1994); Knighted as Honorary Knight Commander of the Most Excellent Order of the British Empire; Awarded the Officer de l'Orde National du Mérite by the French Government; elected to the National Academy of Engineering (2009). | 102 | Director of BP p.l.c.; Director of Naval and Nuclear Technologies LLP; Director of the Armed Services YMCA of the USA and the Naval Submarine League; Director of the American Shipbuilding Suppliers Association; Member of the National Security Advisory Council of the Center for U.S. Global Engagement and a member of the CNA military Advisory Board. | ||||||||||||||||||
| Michael Bozic (70) c/o Kramer Levin Naftalis & Frankel LLP Counsel to the Independent Trustees 1177 Avenue of the Americas New York, NY 10036 | Trustee | Since April 1994 | Private investor; Chairperson of the Compliance and Insurance Committee (since October 2006); Director or Trustee of various Morgan Stanley Funds (since April 1994); formerly, Chairperson of the Insurance Committee (July 2006-September 2006); Vice Chairman of Kmart Corporation (December 1998-October 2000), Chairman and Chief Executive Officer of Levitz Furniture Corporation (November 1995-November 1998) and President and Chief Executive Officer of Hills Department Stores (May 1991-July 1995); variously Chairman, Chief Executive Officer, President and Chief Operating Officer (1987-1991) of the Sears Merchandise Group of Sears, Roebuck & Co. | 104 | Director of various business organizations. | ||||||||||||||||||
39
Morgan Stanley Mid Cap Growth Fund
Trustee and Officer Information (unaudited) continued
| Name, Age and Address of Independent Trustee | Position(s) Held with Registrant | Length of Time Served* | Principal Occupation(s) During Past 5 Years | Number of Portfolios in Fund Complex Overseen by Independent Trustee** | Other Directorships Held by Independent Trustee*** | ||||||||||||||||||
| Kathleen A. Dennis (58) c/o Kramer Levin Naftalis & Frankel LLP Counsel to the Independent Trustees 1177 Avenue of the Americas New York, NY 10036 | Trustee | Since August 2006 | President, Cedarwood Associates (mutual fund and investment management consulting) (since July 2006); Chairperson of the Money Market and Alternatives Sub-Committee of the Investment Committee (since October 2006) and Director or Trustee of various Morgan Stanley Funds (since August 2006); formerly, Senior Managing Director of Victory Capital Management (1993-2006). | 102 | Director of various non-profit organizations. | ||||||||||||||||||
| Dr. Manuel H. Johnson (62) c/o Johnson Smick Group, Inc. 888 16th Street, N.W. Suite 740 Washington, D.C. 20006 | Trustee | Since July 1991 | Senior Partner, Johnson Smick International, Inc. (consulting firm); Chairperson of the Investment Committee (since October 2006) and Director or Trustee of various Morgan Stanley Funds (since July 1991); Co-Chairman and a founder of the Group of Seven Council (G7C) (international economic commission); formerly, Chairperson of the Audit Committee (July 1991-September 2006), Vice Chairman of the Board of Governors of the Federal Reserve System and Assistant Secretary of the U.S. Treasury. | 104 | Director of NVR, Inc. (home construction); Director of Evergreen Energy; Director of Greenwich Capital Holdings. | ||||||||||||||||||
| Joseph J. Kearns (69) c/o Kearns & Associates LLC PMB754 22631 Pacific Coast Highway Malibu, CA 90265 | Trustee | Since August 1994 | President, Kearns & Associates LLC (investment consulting); Chairperson of the Audit Committee (since October 2006) and Director or Trustee of various Morgan Stanley Funds (since August 1994); formerly, Deputy Chairperson of the Audit Committee (July 2003-September 2006) and Chairperson of the Audit Committee of various Morgan Stanley Funds (since August 1994); CFO of the J. Paul Getty Trust. | 105 | Director of Electro Rent Corporation (equipment leasing) and The Ford Family Foundation. | ||||||||||||||||||
40
Morgan Stanley Mid Cap Growth Fund
Trustee and Officer Information (unaudited) continued
| Name, Age and Address of Independent Trustee | Position(s) Held with Registrant | Length of Time Served* | Principal Occupation(s) During Past 5 Years | Number of Portfolios in Fund Complex Overseen by Independent Trustee** | Other Directorships Held by Independent Trustee*** | ||||||||||||||||||
| Michael F. Klein (52) c/o Kramer Levin Naftalis & Frankel LLP Counsel to the Independent Trustees 1177 Avenue of the Americas New York, NY 10036 | Trustee | Since August 2006 | Managing Director, Aetos Capital, LLC (since March 2000) and Co-President, Aetos Alternatives Management, LLC (since January 2004); Chairperson of the Fixed Income Sub-Committee of the Investment Committee (since October 2006) and Director or Trustee of various Morgan Stanley Funds (since August 2006); formerly, Managing Director, Morgan Stanley & Co. Inc. and Morgan Stanley Dean Witter Investment Management, President, Morgan Stanley Funds (June 1998-March 2000) and Principal, Morgan Stanley & Co. Inc. and Morgan Stanley Dean Witter Investment Management (August 1997-December 1999). | 102 | Director of certain investment funds managed or sponsored by Aetos Capital, LLC. Director of Sanitized AG and Sanitized Marketing AG (specialty chemicals). | ||||||||||||||||||
| Michael E. Nugent (75) c/o Triumph Capital, L.P. 445 Park Avenue New York, NY 10022 | Chairperson of the Board and Trustee | Chairperson of the Boards since July 2006 and Trustee since July 1991 | General Partner, Triumph Capital, L.P. (private investment partnership); Chairperson of the Boards of various Morgan Stanley Funds (since July 2006); Director or Trustee of the Funds (since July 1991); formerly, Chairperson of the Insurance Committee (until July 2006). | 104 | None. | ||||||||||||||||||
41
Morgan Stanley Mid Cap Growth Fund
Trustee and Officer Information (unaudited) continued
| Name, Age and Address of Independent Trustee | Position(s) Held with Registrant | Length of Time Served* | Principal Occupation(s) During Past 5 Years | Number of Portfolios in Fund Complex Overseen by Independent Trustee** | Other Directorships Held by Independent Trustee*** | ||||||||||||||||||
| W. Allen Reed (64) c/o Kramer Levin Naftalis & Frankel LLP Counsel to the Independent Trustees 1177 Avenue of the Americas New York, NY 10036 | Trustee | Since August 2006 | Chairperson of the Equity Sub-Committee of the Investment Committee (since October 2006) and Director or Trustee of various Morgan Stanley Funds (since August 2006); formerly, President and CEO of General Motors Asset Management; Chairman and Chief Executive Officer of the GM Trust Bank and Corporate Vice President of General Motors Corporation (August 1994-December 2005). | 102 | Director of Temple-Inland Industries (packaging and forest products); Director of Legg Mason, Inc. and Director of the Auburn University Foundation; formerly, Director of iShares, Inc. (2001-2006). | ||||||||||||||||||
| Fergus Reid (79) c/o Joe Pietryka, Inc. 85 Charles Colman Blvd. Pawling, NY 12564 | Trustee | Since June 1992 | Chairman, Joe Pietryka, Inc.; Chairperson of the Governance Committee and Director or Trustee of various Morgan Stanley Funds (since June 1992). | 105 | Trustee and Director of certain investment companies in the JPMorgan Funds complex managed by JP Morgan Investment Management Inc. | ||||||||||||||||||
Interested Trustee:
| Name, Age and Address of Interested Trustee | Position(s) Held with Registrant | Length of Time Served* | Principal Occupation(s) During Past 5 Years | Number of Portfolios in Fund Complex Overseen by Interested Trustee** | Other Directorships Held by Interested Trustee*** | ||||||||||||||||||
| James F. Higgins (63) c/o Morgan Stanley Services Company Inc. Harborside Financial Center 201 Plaza Two Jersey City, NJ 07311 | Trustee | Since June 2000 | Director or Trustee of various Morgan Stanley Funds (since June 2000); Senior Advisor of Morgan Stanley (since August 2000). | 103 | Director of AXA Financial, Inc. and The Equitable Life Assurance Society of the United States (financial services). | ||||||||||||||||||
* Each Trustee serves an indefinite term, until his or her successor is elected.
** The Fund Complex includes all open-end and closed-end funds (including all of their portfolios) advised by Morgan Stanley Investment Management Inc. (the "Adviser") (as of December 31, 2010) and any funds that have an adviser that is an affiliated person of the Adviser (including but not limited to Morgan Stanley AIP GP LP).
*** This includes any directorships at public companies and registered investment companies held by the Trustee at any time during the past five years.
42
Morgan Stanley Mid Cap Growth Fund
Trustee and Officer Information (unaudited) continued
Executive Officers:
| Name, Age and Address of Executive Officer | Position(s) Held with Registrant | Length of Time Served* | Principal Occupation(s) During Past 5 Years | ||||||||||||
| Arthur Lev (50) 522 Fifth Avenue New York, NY 10036 | President and Principal Executive Officer – Equity and Fixed Income Funds | Since June 2011 | President and Principal Executive Officer (since June 2011) of the Equity and Fixed Income Funds in the Fund Complex; Head of the Long Only Business of Morgan Stanley Investment Management (since February 2011); Managing Director of the Adviser and various entities affiliated with the Adviser (since December 2006). Formerly, Chief Strategy Officer of Morgan Stanley Investment Management's Traditional Asset Management business (November 2010-February 2011); General Counsel of Morgan Stanley Investment Management (December 2006-October 2010); Partner and General Counsel of FrontPoint Partners LLC (July 2002 to December 2006); Managing Director and General Counsel of Morgan Stanley Investment Management (May 2000 to June 2002). | ||||||||||||
| Mary Ann Picciotto (38) c/o Morgan Stanley Services Company Inc. Harborside Financial Center 201 Plaza Two Jersey City, NJ 07311 | Chief Compliance Officer | Since May 2010 | Executive Director of the Adviser and various entities affiliated with the Adviser; Chief Compliance Officer of various Morgan Stanley Funds (since May 2010); Chief Compliance Officer of the Adviser (since April 2007). | ||||||||||||
| Stefanie V. Chang Yu (44) 522 Fifth Avenue New York, NY 10036 | Vice President | Since December 1997 | Managing Director of the Adviser and various entities affiliated with the Adviser; Vice President of various Morgan Stanley Funds (since December 1997). Formerly, Secretary of the Adviser and various entities affiliated with the Adviser. | ||||||||||||
| Francis J. Smith (46) c/o Morgan Stanley Services Company Inc. Harborside Financial Center 201 Plaza Two Jersey City, NJ 07311 | Treasurer and Principal Financial Officer | Treasurer since July 2003 and Principal Financial Officer since September 2002 | Executive Director of the Adviser and various entities affiliated with the Adviser; Treasurer and Principal Financial Officer of various Morgan Stanley Funds (since July 2003). | ||||||||||||
| Mary E. Mullin (44) 522 Fifth Avenue New York, NY 10036 | Secretary | Since June 1999 | Executive Director of the Adviser and various entities affiliated with the Adviser; Secretary of various Morgan Stanley Funds (since June 1999). | ||||||||||||
* Each Officer serves an indefinite term, until his or her successor is elected.
43

INVESTMENT MANAGEMENT
Morgan Stanley
Mid Cap Growth Fund

Annual Report
September 30, 2011
Trustees
Frank L. Bowman
Michael Bozic
Kathleen A. Dennis
James F. Higgins
Dr. Manuel H. Johnson
Joseph J. Kearns
Michael F. Klein
Michael E. Nugent
W. Allen Reed
Fergus Reid
Officers
Michael E. Nugent
Chairperson of the Board
Arthur Lev
President and Principal Executive Officer
Mary Ann Picciotto
Chief Compliance Officer
Stefanie V. Chang Yu
Vice President
Francis J. Smith
Treasurer and Principal Financial Officer
Mary E. Mullin
Secretary
Transfer Agent
Morgan Stanley Services Company Inc.
P.O. Box 219886
Kansas City, Missouri 64121
Custodian
State Street Bank and Trust Company
One Lincoln Street
Boston, Massachusetts 02111
Independent Registered Public Accounting Firm
Ernst & Young LLP
200 Clarendon Street
Boston, Massachusetts 02116
Legal Counsel
Dechert LLP
1095 Avenue of the Americas
New York, New York 10036
Counsel to the Independent Trustees
Kramer Levin Naftalis & Frankel LLP
1177 Avenue of the Americas
New York, New York 10036
Investment Adviser
Morgan Stanley Investment Management Inc.
522 Fifth Avenue
New York, New York 10036
This report is submitted for the general information of the shareholders of the Fund. For more detailed information about the Fund, its fees and expenses and other pertinent information, please read its Prospectus. The Fund's Statement of Additional Information contains additional information about the Fund, including its trustees. It is available, without charge, by calling (800) 869-NEWS.
This report is not authorized for distribution to prospective investors in the Fund unless preceded or accompanied by an effective Prospectus. Read the Prospectus carefully before investing.
Morgan Stanley Distribution, Inc., member FINRA.
© 2011 Morgan Stanley

DGRANN
IU11-02316P-Y09/11
Trustees
Frank L. Bowman
Michael Bozic
Kathleen A. Dennis
James F. Higgins
Dr. Manuel H. Johnson
Joseph J. Kearns
Michael F. Klein
Michael E. Nugent
W. Allen Reed
Fergus Reid
Officers
Michael E. Nugent
Chairperson of the Board
Arthur Lev
President and Principal Executive Officer
Mary Ann Picciotto
Chief Compliance Officer
Stefanie V. Chang Yu
Vice President
Francis J. Smith
Treasurer and Principal Financial Officer
Mary E. Mullin
Secretary
Transfer Agent
Morgan Stanley Services Company Inc.
P.O. Box 219886
Kansas City, Missouri 64121
Custodian
State Street Bank and Trust Company
One Lincoln Street
Boston, Massachusetts 02111
Independent Registered Public Accounting Firm
Ernst & Young LLP
200 Clarendon Street
Boston, Massachusetts 02116
Legal Counsel
Dechert LLP
1095 Avenue of the Americas
New York, New York 10036
Counsel to the Independent Trustees
Kramer Levin Naftalis & Frankel LLP
1177 Avenue of the Americas
New York, New York 10036
Investment Adviser
Morgan Stanley Investment Management Inc.
522 Fifth Avenue
New York, New York 10036
The financial statements included herein have been taken from the records of the Fund without examination by the independent auditors and accordingly they do not express an opinion thereon.
This report is submitted for the general information of the shareholders of the Fund. For more detailed information about the Fund, its fees and expenses and other pertinent information, please read its Prospectus. The Fund's Statement of Additional Information contains additional information about the Fund, including its trustees. It is available, without charge, by calling (800) 869-NEWS.
This report is not authorized for distribution to prospective investors in the Fund unless preceded or accompanied by an effective Prospectus. Read the Prospectus carefully before investing.
Morgan Stanley Distribution, Inc., member FINRA.
© 2012 Morgan Stanley
DGRSAN
IU12-00974P-Y03/12


INVESTMENT MANAGEMENT
Morgan Stanley
Mid Cap Growth Fund

Semiannual Report
March 31, 2012

Morgan Stanley Mid Cap Growth Fund
Table of Contents
| Welcome Shareholder | 3 | ||||||
| Fund Report | 4 | ||||||
| Performance Summary | 7 | ||||||
| Expense Example | 8 | ||||||
| Portfolio of Investments | 9 | ||||||
| Statement of Assets and Liabilities | 13 | ||||||
| Statement of Operations | 14 | ||||||
| Statements of Changes in Net Assets | 15 | ||||||
| Notes to Financial Statements | 16 | ||||||
| Financial Highlights | 27 | ||||||
| U.S. Privacy Policy | 31 | ||||||
2
Welcome Shareholder,
We are pleased to provide this semiannual report, in which you will learn how your investment in Morgan Stanley Mid Cap Growth Fund performed during the latest six-month period. It includes an overview of the market conditions and discusses some of the factors that affected performance during the reporting period. In addition, the report contains financial statements and a list of portfolio holdings.
Morgan Stanley Investment Management is a client-centric, investor-led organization. Our global presence, intellectual capital, and breadth of products and services enable us to partner with investors to meet the evolving challenges of today's financial markets. We aim to deliver superior investment service and to empower our clients to make the informed decisions that help them reach their investment goals.
As always, we thank you for selecting Morgan Stanley Investment Management, and look forward to working with you in the months and years ahead.
This material must be preceded or accompanied by a prospectus for the fund being offered.
Market forecasts provided in this report may not necessarily come to pass. There is no assurance that the Fund will achieve its investment objective. The Fund is subject to market risk, which is the possibility that market values of securities owned by the Fund will decline and, therefore, the value of the Fund's shares may be less than what you paid for them. Accordingly, you can lose money investing in this Fund. Please see the prospectus for more complete information on investment risks.
3
Fund Report (unaudited)
For the six months ended March 31, 2012
| Total Return for the 6 Months Ended March 31, 2012 | |||||||||||||||||||||||
| Class A | Class B | Class C | Class I | Russell Midcap® Growth Index1 | Lipper Multi-Cap Growth Funds Index2 | ||||||||||||||||||
| 21.13 | % | 20.70 | % | 20.64 | % | 21.26 | % | 27.39 | % | 24.87 | % | ||||||||||||
The performance of the Fund's four share classes varies because each has different expenses. The Fund's total returns assume the reinvestment of all distributions but do not reflect the deduction of any applicable sales charges. Such costs would lower performance. See Performance Summary for standardized performance and benchmark information.
Market Conditions
The stock market rose strongly in the six-month period ended March 31, 2012. In October of 2011, the market rallied on the announcement of a more comprehensive debt crisis plan for the eurozone and easing concerns about recession in the U.S. The debt crisis still faced a number of unresolved issues and U.S. economic news appeared mixed at times but the overall tone of investor sentiment continued to improve in the first three months of 2012. Central bank actions around the world helped shore up confidence in Europe's banks and bought more time for policy makers. In the U.S., unemployment remained high and the housing market was still weak, but investors were optimistic about positive consumer data (in part driven by unseasonably warm weather early in the year). Despite the market's gains, concerns lingered at the end of the period about the sustainability of corporate profit margins and the impact on earnings if margins begin to decline, as well as the expiration of fiscal stimulus and tax cuts in 2013, which could act as a drag on the economy.
Performance Analysis
All share classes of Morgan Stanley Mid Cap Growth Fund underperformed the Russell Midcap® Growth Index (the "Index") and the Lipper Multi-Cap Growth Funds Index for the six months ended March 31, 2012, assuming no deduction of applicable sales charges.
The largest detractor from relative performance was stock selection in the energy sector, due to weak performance from holdings in a solar power equipment maker and a crude oil producer. Stock selection in the consumer discretionary sector was disadvantageous. A position in a Chinese travel booking web site detracted from performance in the sector. Stock selection in the technology sector also disappointed, particularly the Fund's exposure to a software service provider to the auto insurance industry, a daily online deals web site, and a Chinese online social networking service.
The portfolio saw relative gains elsewhere. In the health care sector, stock selection was beneficial to performance. Holdings in medical and dental instruments and supplies, medical equipment, and pharmaceuticals were positive contributors. Stock selection in the utilities sector also bolstered performance. The Fund held only two stocks in the sector and both performed well during the period. The consumer staples sector was additive to performance as well, due to both stock selection and an underweight in the sector. The Fund's sole holding in the sector generated gains during the period.
4
There is no guarantee that any sectors mentioned will continue to perform as discussed herein or that securities in such sectors will be held by the Fund in the future.
| TOP 10 HOLDINGS as of 03/31/12 | |||||||
| Motorola Solutions, Inc. | 4.0 | % | |||||
| Intuitive Surgical, Inc. | 3.8 | ||||||
| Fastenal Co. | 3.8 | ||||||
| Edenred (France) | 3.6 | ||||||
| LinkedIn Corp., Class A | 2.9 | ||||||
| Weight Watchers International, Inc. | 2.9 | ||||||
| Verisk Analytics, Inc., Class A | 2.7 | ||||||
| Mead Johnson Nutrition Co. | 2.6 | ||||||
| MSCI, Inc., Class A | 2.6 | ||||||
| Yandex N.V., Class A (Russia) | 2.3 | ||||||
| TOP FIVE INDUSTRIES as of 03/31/12 | |||||||
| Computer Services, Software & Systems | 16.0 | % | |||||
| Diversified Retail | 9.2 | ||||||
| Commercial Services | 8.2 | ||||||
| Financial Data & Systems | 5.3 | ||||||
| Pharmaceuticals | 5.1 | ||||||
Subject to change daily. Provided for informational purposes only and should not be deemed as a recommendation to buy or sell the securities mentioned above. Top 10 holdings and top five industries are as a percentage of net assets. Morgan Stanley is a full-service securities firm engaged in securities trading and brokerage activities, investment banking, research and analysis, financing and financial advisory services.
Investment Strategy
The Fund will normally invest at least 80 percent of its assets in common stocks (including depositary receipts) and other equity securities of medium capitalization companies. The Fund's other equity securities may include convertible securities and preferred stocks. The Fund's "Adviser," Morgan Stanley Investment Management Inc., seeks to invest primarily in established and emerging companies with capitalizations within the range of companies included in the Russell MidCap® Growth Index, which as of December 31, 2011 was between $117 million and $20.4 billion. The Adviser emphasizes a bottom-up stock selection process, seeking attractive investments on an individual company basis. The Adviser seeks to invest in high quality companies it believes have sustainable competitive advantages and the ability to redeploy capital at high rates of return. The Adviser typically favors companies with rising returns on invested capital, above average business visibility, strong free cash flow generation and an attractive risk/reward. The Fund may also use derivative instruments as discussed in the Fund's prospectus. These derivative instruments will be counted toward the 80 percent policy discussed above to the extent they have economic characteristics similar to the securities included within that policy.
For More Information About Portfolio Holdings
Each Morgan Stanley fund provides a complete schedule of portfolio holdings in its semiannual and annual reports within 60 days of the end of the fund's second and fourth fiscal quarters. The semiannual reports and the annual reports are filed electronically
5
with the Securities and Exchange Commission (SEC) on Form N-CSRS and Form N-CSR, respectively. Morgan Stanley also delivers the semiannual and annual reports to fund shareholders and makes these reports available on its public web site, www.morganstanley.com. Each Morgan Stanley fund also files a complete schedule of portfolio holdings with the SEC for the fund's first and third fiscal quarters on Form N-Q. Morgan Stanley does not deliver the reports for the first and third fiscal quarters to shareholders, nor are the reports posted to the Morgan Stanley public web site. You may, however, obtain the Form N-Q filings (as well as the Form N-CSR and N-CSRS filings) by accessing the SEC's web site, http://www.sec.gov. You may also review and copy them at the SEC's public reference room in Washington, DC. Information on the operation of the SEC's public reference room may be obtained by calling the SEC at (800) SEC-0330. You can also request copies of these materials, upon payment of a duplicating fee, by electronic request at the SEC's e-mail address (publicinfo@sec.gov) or by writing the public reference section of the SEC, Washington, DC 20549-1520.
Proxy Voting Policy and Procedures and Proxy Voting Record
You may obtain a copy of the Fund's Proxy Voting Policy and Procedures without charge, upon request, by calling toll free (800) 869-NEWS or by visiting the Mutual Fund Center on our web site at www.morganstanley.com. It is also available on the SEC's web site at http://www.sec.gov.
You may obtain information regarding how the Fund voted proxies relating to portfolio securities during the most recent twelve-month period ended June 30 without charge by visiting the Mutual Fund Center on our web site at www.morganstanley.com. This information is also available on the SEC's web site at http://www.sec.gov.
Householding Notice
To reduce printing and mailing costs, the Fund attempts to eliminate duplicate mailings to the same address. The Fund delivers a single copy of certain shareholder documents, including shareholder reports, prospectuses and proxy materials, to investors with the same last name who reside at the same address. Your participation in this program will continue for an unlimited period of time unless you instruct us otherwise. You can request multiple copies of these documents by calling (800) 869-NEWS, 8:00 a.m. to 8:00 p.m., ET. Once our Customer Service Center has received your instructions, we will begin sending individual copies for each account within 30 days.
6
Performance Summary (unaudited)
| Average Annual Total Returns—Period Ended March 31, 2012 | |||||||||||||||||||
| Symbol | Class A Shares* (since 07/28/97) DGRAX | Class B Shares** (since 04/29/83) DGRBX | Class C Shares† (since 07/28/97) DGRCX | Class I Shares†† (since 07/28/97) DGRDX | |||||||||||||||
| 1 Year | 1.24 –4.06 4 | %3 | 0.50 –4.25 4 | %3 | 0.47 –0.48 4 | %3 | 1.49 — | %3 | |||||||||||
| 5 Years | 7.54 3 6.39 4 | 6.73 3 6.42 4 | 6.73 3 6.73 4 | 7.79 3 — | |||||||||||||||
| 10 Years | 9.41 3 8.82 4 | 8.74 3 8.74 4 | 8.59 3 8.59 4 | 9.67 3 — | |||||||||||||||
| Since Inception | 8.00 3 7.61 4 | 8.40 3 8.40 4 | 7.19 3 7.19 4 | 8.24 3 — | |||||||||||||||
| Gross Expense Ratio | 0.97 | 1.72 | 1.72 | 0.72 | |||||||||||||||
Performance data quoted represents past performance, which is no guarantee of future results and current performance may be lower or higher than the figures shown. For most recent month-end performance figures, please visit www.morganstanley.com/im or speak with your Financial Advisor. Investment returns and principal value will fluctuate and fund shares, when redeemed, may be worth more or less than their original cost. The table does not reflect the deduction of taxes that a shareholder would pay on fund distributions or the redemption of fund shares. Performance for Class A, Class B, Class C, and Class I shares will vary due to differences in sales charges and expenses. See the Fund's current prospectus for complete details on fees and sales charges. Expense ratios are as of each Fund's fiscal year end as outlined in the Fund's current prospectus.
* The maximum front-end sales charge for Class A is 5.25%.
** The maximum contingent deferred sales charge (CDSC) for Class B is 5.0%. The CDSC declines to 0% after six years. Effective April 2005, Class B shares will generally convert to Class A shares approximately eight years after the end of the calendar month in which the shares were purchased. Performance for periods greater than eight years reflects this conversion (beginning April 2005).
† The maximum contingent deferred sales charge for Class C is 1.0% for shares redeemed within one year of purchase.
†† Class I has no sales charge.
(1) The Russell Midcap® Growth Index measures the performance of the mid-cap growth segment of the U.S. equity universe. It includes those Russell Midcap® Index companies with higher price-to-book ratios and higher forecasted growth values. The Russell Midcap® Index is a subset of the Russell 1000® Index and includes approximately 800 of the smallest securities in the Russell 1000® Index, which in turn consists of approximately 1,000 of the largest U.S. securities based on a combination of market capitalization and current index membership. The Index is unmanaged and its returns do not include any sales charges or fees. Such costs would lower performance. It is not possible to invest directly in an index.
(2) The Lipper Multi-Cap Growth Funds Index is an equally weighted performance index of the largest qualifying funds (based on net assets) in the Lipper Multi-Cap Growth Funds classification. The Index, which is adjusted for capital gains distributions and income dividends, is unmanaged and should not be considered an investment. There are currently 30 funds represented in this Index. The Fund was in the Lipper Multi-Cap Growth Funds classification as of the date of this report.
(3) Figure shown assumes reinvestment of all distributions and does not reflect the deduction of any sales charges.
(4) Figure shown assumes reinvestment of all distributions and the deduction of the maximum applicable sales charge. See the Fund's current prospectus for complete details on fees and sales charges.
7
Expense Example (unaudited)
As a shareholder of the Fund, you incur two types of costs: (1) transaction costs, including sales charges (loads) on purchase payments and (2) ongoing costs, including advisory fees; distribution and service (12b-1) fees; and other Fund expenses. This example is intended to help you understand your ongoing costs (in dollars) of investing in the Fund and to compare these costs with the ongoing costs of investing in other mutual funds.
The example is based on an investment of $1,000 invested at the beginning of the period and held for the entire period 10/01/11 – 03/31/12.
Actual Expenses
The first line of the table below provides information about actual account values and actual expenses. You may use the information in this line, together with the amount you invested, to estimate the expenses that you paid over the period. Simply divide your account value by $1,000 (for example, an $8,600 account value divided by $1,000 = 8.6), then multiply the result by the number in the first line under the heading entitled "Expenses Paid During Period" to estimate the expenses you paid on your account during this period.
Hypothetical Example for Comparison Purposes
The second line of the table below provides information about hypothetical expenses based on the Fund's actual expense ratio and an assumed rate of return of 5% per year before expenses, which is not the Fund's actual return. The hypothetical account values and expenses may not be used to estimate the actual ending account balance or expenses you paid for the period. You may use this information to compare the ongoing cost of investing in the Fund and other funds. To do so, compare this 5% hypothetical example with the 5% hypothetical examples that appear in the shareholder reports of the other funds.
Please note that the expenses shown in the table are meant to highlight your ongoing costs only and do not reflect any transactional costs, such as sales charges (loads). Therefore, the second line of the table is useful in comparing ongoing costs, and will not help you determine the relative total cost of owning different funds. In addition, if these transactional costs were included, your costs would have been higher.
| Beginning Account Value | Ending Account Value | Expenses Paid During Period@ | |||||||||||||
| 10/01/11 | 03/31/12 | 10/01/11 – 03/31/12 | |||||||||||||
| Class A | |||||||||||||||
| Actual (21.13% return) | $ | 1,000.00 | $ | 1,211.30 | $ | 5.36 | |||||||||
| Hypothetical (5% annual return before expenses) | $ | 1,000.00 | $ | 1,020.15 | $ | 4.90 | |||||||||
| Class B | |||||||||||||||
| Actual (20.70% return) | $ | 1,000.00 | $ | 1,207.00 | $ | 9.49 | |||||||||
| Hypothetical (5% annual return before expenses) | $ | 1,000.00 | $ | 1,016.40 | $ | 8.67 | |||||||||
| Class C | |||||||||||||||
| Actual (20.64% return) | $ | 1,000.00 | $ | 1,206.40 | $ | 8.99 | |||||||||
| Hypothetical (5% annual return before expenses) | $ | 1,000.00 | $ | 1,016.85 | $ | 8.22 | |||||||||
| Class I | |||||||||||||||
| Actual (21.26% return) | $ | 1,000.00 | $ | 1,212.60 | $ | 3.98 | |||||||||
| Hypothetical (5% annual return before expenses) | $ | 1,000.00 | $ | 1,021.40 | $ | 3.64 | |||||||||
@ Expenses are equal to the Fund's annualized expense ratios of 0.97%, 1.72%, 1.63% and 0.72% for Class A, Class B, Class C and Class I shares, respectively, multiplied by the average account value over the period, multiplied by 183/366 (to reflect the one-half year period). If the Fund had borne all of its expenses, the annualized expense ratio would have been 0.98%, 1.73%, 1.64%, 0.73% for Class A, Class B, Class C and Class I shares, respectively.
8
Morgan Stanley Mid Cap Growth Fund
Portfolio of Investments n March 31, 2012 (unaudited)
| NUMBER OF SHARES | VALUE | ||||||||||
| Common Stocks (95.9%) | |||||||||||
| Air Transport (2.0%) | |||||||||||
| 149,257 | Expeditors International of Washington, Inc. | $ | 6,941,943 | ||||||||
| Alternative Energy (2.6%) | |||||||||||
| 101,693 | Range Resources Corp. | 5,912,431 | |||||||||
| 147,929 | Ultra Petroleum Corp. (a) | 3,347,633 | |||||||||
| 9,260,064 | |||||||||||
| Asset Management & Custodian (0.7%) | |||||||||||
| 53,305 | Greenhill & Co., Inc. | 2,326,230 | |||||||||
| Biotechnology (3.7%) | |||||||||||
| 63,620 | IDEXX Laboratories, Inc. (a) | 5,563,569 | |||||||||
| 145,983 | Illumina, Inc. (a) | 7,680,166 | |||||||||
| 13,243,735 | |||||||||||
| Cement (1.1%) | |||||||||||
| 44,121 | Martin Marietta Materials, Inc. | 3,778,081 | |||||||||
| Chemicals: Diversified (2.6%) | |||||||||||
| 154,825 | Intrepid Potash, Inc. (a) | 3,766,892 | |||||||||
| 102,147 | Rockwood Holdings, Inc. (a) | 5,326,966 | |||||||||
| 9,093,858 | |||||||||||
| Commercial Services (8.2%) | |||||||||||
| 127,741 | Gartner, Inc. (a) | 5,446,876 | |||||||||
| 156,804 | Intertek Group PLC (United Kingdom) | 6,297,793 | |||||||||
| 167,921 | Leucadia National Corp. | 4,382,738 | |||||||||
| 30,265 | MercadoLibre, Inc. (Brazil) | 2,959,614 | |||||||||
| 130,960 | Weight Watchers International, Inc. | 10,108,803 | |||||||||
| 29,195,824 | |||||||||||
| NUMBER OF SHARES | VALUE | ||||||||||
| Communications Technology (4.9%) | |||||||||||
| 28,373 | Millicom International Cellular SA SDR (Sweden) | $ | 3,216,505 | ||||||||
| 282,005 | Motorola Solutions, Inc. | 14,334,314 | |||||||||
| 17,550,819 | |||||||||||
| Computer Services, Software & Systems (15.9%) | |||||||||||
| 165,169 | Akamai Technologies, Inc. (a) | 6,061,703 | |||||||||
| 1,563,400 | Alibaba.com Ltd. (China) (a)(b) | 2,657,491 | |||||||||
| 38,908 | Citrix Systems, Inc. (a) | 3,070,230 | |||||||||
| 57,865 | IHS, Inc., Class A (a) | 5,419,057 | |||||||||
| 101,806 | LinkedIn Corp., Class A (a) | 10,383,194 | |||||||||
| 91,037 | Red Hat, Inc. (a) | 5,452,206 | |||||||||
| 51,924 | Salesforce.com, Inc. (a) | 8,022,777 | |||||||||
| 134,489 | Solera Holdings, Inc. | 6,171,700 | |||||||||
| 501,353 | Zynga, Inc., Class A (a) | 6,592,792 | |||||||||
| 205,470 | Zynga, Inc., Class B (a)(c)(d) | 2,566,321 | |||||||||
| 56,397,471 | |||||||||||
| Computer Technology (3.5%) | |||||||||||
| 69,348 | NVIDIA Corp. (a) | 1,067,265 | |||||||||
| 300,879 | Yandex N.V., Class A (Russia) (a) | 8,084,619 | |||||||||
| 154,300 | Youku.com, Inc. ADR (China) (a) | 3,393,057 | |||||||||
| 12,544,941 | |||||||||||
| Consumer Lending (1.5%) | |||||||||||
| 38,581 | IntercontinentalExchange, Inc. (a) | 5,301,801 | |||||||||
See Notes to Financial Statements
9
Morgan Stanley Mid Cap Growth Fund
Portfolio of Investments n March 31, 2012 (unaudited) continued
| NUMBER OF SHARES | VALUE | ||||||||||
| Consumer Services: Miscellaneous (2.2%) | |||||||||||
| 536,923 | Qualicorp SA (Brazil) (a) | $ | 4,603,164 | ||||||||
| 2,251,000 | Sun Art Retail Group Ltd. (Hong Kong) (a) | 3,049,432 | |||||||||
| 7,652,596 | |||||||||||
| Cosmetics (0.9%) | |||||||||||
| 144,940 | Natura Cosmeticos SA (Brazil) | 3,152,164 | |||||||||
| Diversified Materials & Processing (1.4%) | |||||||||||
| 41,648 | Schindler Holding AG (Switzerland) | 5,010,494 | |||||||||
| Diversified Media (3.0%) | |||||||||||
| 51,063 | Factset Research Systems, Inc. | 5,057,280 | |||||||||
| 114,815 | McGraw-Hill Cos., Inc. (The) | 5,565,083 | |||||||||
| 10,622,363 | |||||||||||
| Diversified Retail (9.2%) | |||||||||||
| 113,196 | Ctrip.com International Ltd. ADR (China) (a) | 2,449,562 | |||||||||
| 56,489 | Dollar Tree, Inc. (a) | 5,337,646 | |||||||||
| 246,832 | Fastenal Co. | 13,353,611 | |||||||||
| 372,752 | Groupon, Inc., Series A (a)(c)(d) | 6,623,803 | |||||||||
| 42,608 | NetFlix, Inc. (a) | 4,901,624 | |||||||||
| 32,666,246 | |||||||||||
| Education Services (0.9%) | |||||||||||
| 121,744 | New Oriental Education & Technology Group, Inc. ADR (China) (a) | 3,343,090 | |||||||||
| Electronic Entertainment (0.8%) | |||||||||||
| 153,905 | Nexon Co., Ltd. (Korea, Republic of) (a) | 2,681,298 | |||||||||
| Financial Data & Systems (5.3%) | |||||||||||
| 251,725 | MSCI, Inc., Class A (a) | 9,265,997 | |||||||||
| NUMBER OF SHARES | VALUE | ||||||||||
| 203,107 | Verisk Analytics, Inc., Class A (a) | $ | 9,539,936 | ||||||||
| 18,805,933 | |||||||||||
| Health Care Services (2.5%) | |||||||||||
| 57,614 | athenahealth, Inc. (a) | 4,270,350 | |||||||||
| 57,210 | Stericycle, Inc. (a) | 4,785,044 | |||||||||
| 9,055,394 | |||||||||||
| Media (0.5%) | |||||||||||
| 1,792 | Legend Pictures LLC Ltd. (a)(c)(d) | 1,915,881 | |||||||||
| Medical & Dental Instruments & Supplies (1.2%) | |||||||||||
| 60,985 | Techne Corp. | 4,275,049 | |||||||||
| Medical Equipment (3.8%) | |||||||||||
| 25,155 | Intuitive Surgical, Inc. (a) | 13,627,721 | |||||||||
| Metals & Minerals: Diversified (1.6%) | |||||||||||
| 1,154,571 | Lynas Corp., Ltd. (Australia) (a) | 1,309,578 | |||||||||
| 129,294 | Molycorp, Inc. (a) | 4,374,016 | |||||||||
| 5,683,594 | |||||||||||
| Pharmaceuticals (5.1%) | |||||||||||
| 170,002 | Ironwood Pharmaceuticals, Inc. (a) | 2,262,727 | |||||||||
| 113,381 | Mead Johnson Nutrition Co. | 9,351,665 | |||||||||
| 117,841 | Valeant Pharmaceuticals International, Inc. (Canada) (a) | 6,326,883 | |||||||||
| 17,941,275 | |||||||||||
| Publishing (1.4%) | |||||||||||
| 76,583 | Morningstar, Inc. | 4,828,558 | |||||||||
| Recreational Vehicles & Boats (3.6%) | |||||||||||
| 420,255 | Edenred (France) | 12,644,743 | |||||||||
See Notes to Financial Statements
10
Morgan Stanley Mid Cap Growth Fund
Portfolio of Investments n March 31, 2012 (unaudited) continued
| NUMBER OF SHARES | VALUE | ||||||||||
| Restaurants (1.2%) | |||||||||||
| 136,951 | Dunkin' Brands Group, Inc. | $ | 4,123,595 | ||||||||
| Scientific Instruments: Pollution Control (1.0%) | |||||||||||
| 226,549 | Covanta Holding Corp. | 3,676,890 | |||||||||
| Semiconductors & Components (1.9%) | |||||||||||
| 192,853 | ARM Holdings PLC ADR (United Kingdom) | 5,455,811 | |||||||||
| 56,590 | First Solar, Inc. (a) | 1,417,580 | |||||||||
| 6,873,391 | |||||||||||
| Utilities: Electrical (1.7%) | |||||||||||
| 187,487 | Brookfield Infrastructure Partners LP (Canada) | 5,924,589 | |||||||||
| Total Common Stocks (Cost $268,784,405) | 340,139,631 | ||||||||||
| Convertible Preferred Stocks (1.2%) | |||||||||||
| Alternative Energy (0.8%) | |||||||||||
| 618,623 | Better Place, Inc. (a)(c)(d) | 2,808,548 | |||||||||
| Computer Services, Software & Systems (0.1%) | |||||||||||
| 41,492 | Workday, Inc. (a)(c)(d) | 550,184 | |||||||||
| Technology: Miscellaneous (0.3%) | |||||||||||
| 28,639 | Peixe Urbano, Inc. (Brazil) (a)(c)(d) | 942,822 | |||||||||
| Total Convertible Preferred Stocks (Cost $3,039,562) | 4,301,554 | ||||||||||
| NUMBER OF SHARES (000) | VALUE | ||||||||||
| Short-Term Investment (3.7%) | |||||||||||
| Investment Company | |||||||||||
| 12,961 | Morgan Stanley Institutional Liquidity Funds - Money Market Portfolio - Institutional Class (See Note 5) (Cost $12,960,646) | $ | 12,960,646 | ||||||||
| Total Investments (Cost $284,784,613) | 100.8 | % | 357,401,831 | ||||||||
| Liabilities in Excess of Other Assets | (0.8 | ) | (2,891,059 | ) | |||||||
| Net Assets | 100.0 | % | $ | 354,510,772 | |||||||
ADR American Depositary Receipt.
SDR Swedish Depositary Receipt.
(a) Non-income producing security.
(b) Security trades on the Hong Kong exchange.
(c) At March 31, 2012, the Fund held fair valued securities valued at $15,407,559, representing 4.3% of net assets. These securities have been fair valued as determined in good faith under procedures established by and under the general supervision of the Fund's Trustees.
(d) Illiquid security. Resale is restricted to qualified institutional investors.
See Notes to Financial Statements
11
Morgan Stanley Mid Cap Growth Fund
Portfolio of Investments n March 31, 2012 (unaudited) continued
Summary of Investments
| INDUSTRY | VALUE | PERCENT OF TOTAL INVESTMENTS | |||||||||
| Computer Services, Software & Systems | $ | 56,947,655 | 15.9 | % | |||||||
| Diversified Retail | 32,666,246 | 9.1 | |||||||||
| Commercial Services | 29,195,824 | 8.2 | |||||||||
| Financial Data & Systems | 18,805,933 | 5.3 | |||||||||
| Pharmaceuticals | 17,941,275 | 5.0 | |||||||||
| Communications Technology | 17,550,819 | 4.9 | |||||||||
| Medical Equipment | 13,627,721 | 3.8 | |||||||||
| Biotechnology | 13,243,735 | 3.7 | |||||||||
| Investment Company | 12,960,646 | 3.6 | |||||||||
| Recreational Vehicles & Boats | 12,644,743 | 3.5 | |||||||||
| Computer Technology | 12,544,941 | 3.5 | |||||||||
| Alternative Energy | 12,068,612 | 3.4 | |||||||||
| Diversified Media | 10,622,363 | 3.0 | |||||||||
| Chemicals: Diversified | 9,093,858 | 2.5 | |||||||||
| Health Care Services | 9,055,394 | 2.5 | |||||||||
| Consumer Services: Miscellaneous | 7,652,596 | 2.1 | |||||||||
| Air Transport | 6,941,943 | 1.9 | |||||||||
| Semiconductors & Components | 6,873,391 | 1.9 | |||||||||
| Utilities: Electrical | 5,924,589 | 1.7 | |||||||||
| Metals & Minerals: Diversified | 5,683,594 | 1.6 | |||||||||
| Consumer Lending | 5,301,801 | 1.5 | |||||||||
| Diversified Materials & Processing | 5,010,494 | 1.4 | |||||||||
| Publishing | 4,828,558 | 1.4 | |||||||||
| Medical & Dental Instruments & Supplies | 4,275,049 | 1.2 | |||||||||
| Restaurants | 4,123,595 | 1.2 | |||||||||
| Cement | 3,778,081 | 1.1 | |||||||||
| Scientific Instruments: Pollution Control | 3,676,890 | 1.0 | |||||||||
| Education Services | 3,343,090 | 0.9 | |||||||||
| INDUSTRY | VALUE | PERCENT OF TOTAL INVESTMENTS | |||||||||
| Cosmetics | $ | 3,152,164 | 0.9 | % | |||||||
| Electronic Entertainment | 2,681,298 | 0.8 | |||||||||
| Asset Management & Custodian | 2,326,230 | 0.7 | |||||||||
| Media | 1,915,881 | 0.5 | |||||||||
| Technology: Miscellaneous | 942,822 | 0.3 | |||||||||
| $ | 357,401,831 | 100.0 | % | ||||||||
See Notes to Financial Statements
12
Morgan Stanley Mid Cap Growth Fund
Financial Statements
Statement of Assets and Liabilities
March 31, 2012 (unaudited)
| Assets: | |||||||
| Investments in securities, at value (cost $271,823,967) | $ | 344,441,185 | |||||
| Investment in affiliate, at value (cost $12,960,646) | 12,960,646 | ||||||
| Total investments in securities, at value (cost $284,784,613) | 357,401,831 | ||||||
| Cash (including foreign currency valued at $59,978 with a cost of $59,609) | 59,978 | ||||||
| Receivable for: | |||||||
| Dividends | 231,067 | ||||||
| Shares of beneficial interest sold | 118,874 | ||||||
| Foreign withholding taxes reclaimed | 59,858 | ||||||
| Dividends from affiliate | 1,128 | ||||||
| Prepaid expenses and other assets | 63,585 | ||||||
| Total Assets | 357,936,321 | ||||||
| Liabilities: | |||||||
| Payable for: | |||||||
| Shares of beneficial interest redeemed | 1,662,473 | ||||||
| Investments purchased | 1,289,866 | ||||||
| Investment advisory fee | 124,124 | ||||||
| Transfer agent fee | 104,154 | ||||||
| Distribution fee | 93,143 | ||||||
| Administration fee | 23,811 | ||||||
| Accrued expenses and other payables | 127,978 | ||||||
| Total Liabilities | 3,425,549 | ||||||
| Net Assets | $ | 354,510,772 | |||||
| Composition of Net Assets: | |||||||
| Paid-in-capital | $ | 272,932,951 | |||||
| Net unrealized appreciation | 72,611,477 | ||||||
| Accumulated net investment loss | (710,427 | ) | |||||
| Accumulated undistributed net realized gain | 9,676,771 | ||||||
| Net Assets | $ | 354,510,772 | |||||
| Class A Shares: | |||||||
| Net Assets | $ | 318,957,205 | |||||
| Shares Outstanding (unlimited shares authorized, $.01 par value) | 9,098,319 | ||||||
| Net Asset Value Per Share | $ | 35.06 | |||||
| Maximum Offering Price Per Share, (net asset value plus 5.54% of net asset value) | $ | 37.00 | |||||
| Class B Shares: | |||||||
| Net Assets | $ | 8,903,203 | |||||
| Shares Outstanding (unlimited shares authorized, $.01 par value) | 296,031 | ||||||
| Net Asset Value Per Share | $ | 30.08 | |||||
| Class C Shares: | |||||||
| Net Assets | $ | 22,099,016 | |||||
| Shares Outstanding (unlimited shares authorized, $.01 par value) | 731,129 | ||||||
| Net Asset Value Per Share | $ | 30.23 | |||||
| Class I Shares: | |||||||
| Net Assets | $ | 4,551,348 | |||||
| Shares Outstanding (unlimited shares authorized, $.01 par value) | 124,183 | ||||||
| Net Asset Value Per Share | $ | 36.65 | |||||
See Notes to Financial Statements
13
Morgan Stanley Mid Cap Growth Fund
Financial Statements continued
Statement of Operations
For the six months ended March 31, 2012 (unaudited)
| Net Investment Loss: Income | |||||||
| Dividends (net of $28,145 foreign withholding tax) | $ | 1,163,675 | |||||
| Dividends from affiliate (Note 5) | 6,517 | ||||||
| Total Income | 1,170,192 | ||||||
| Expenses | |||||||
| Investment advisory fee (Note 3) | 707,696 | ||||||
| Distribution fee (Class A shares) (Note 4) | 378,574 | ||||||
| Distribution fee (Class B shares) (Note 4) | 48,879 | ||||||
| Distribution fee (Class C shares) (Note 4) | 96,904 | ||||||
| Transfer agent fees and expenses | 222,820 | ||||||
| Administration fee (Note 3) | 134,799 | ||||||
| Shareholder reports and notices | 38,593 | ||||||
| Registration fees | 35,198 | ||||||
| Professional fees | 34,847 | ||||||
| Custodian fees | 23,201 | ||||||
| Trustees' fees and expenses | 7,906 | ||||||
| Other | 18,707 | ||||||
| Total Expenses | 1,748,124 | ||||||
| Less: rebate from Morgan Stanley affiliated cash sweep (Note 5) | (12,063 | ) | |||||
| Net Expenses | 1,736,061 | ||||||
| Net Investment Loss | (565,869 | ) | |||||
| Realized and Unrealized Gain (Loss): Realized Gain on: | |||||||
| Investments | 14,494,260 | ||||||
| Foreign currency translation | 318 | ||||||
| Net Realized Gain | 14,494,578 | ||||||
| Change in Unrealized Appreciation/Depreciation on: | |||||||
| Investments | 51,171,290 | ||||||
| Foreign currency translation | (5,840 | ) | |||||
| Net Change in Unrealized Appreciation/Depreciation | 51,165,450 | ||||||
| Net Gain | 65,660,028 | ||||||
| Net Increase | $ | 65,094,159 | |||||
See Notes to Financial Statements
14
Morgan Stanley Mid Cap Growth Fund
Financial Statements continued
Statements of Changes in Net Assets
| FOR THE SIX MONTHS ENDED MARCH 31, 2012 | FOR THE YEAR ENDED SEPTEMBER 30, 2011 | ||||||||||
| (unaudited) | |||||||||||
| Increase (Decrease) in Net Assets: Operations: | |||||||||||
| Net investment loss | $ | (565,869 | ) | $ | (1,040,087 | ) | |||||
| Net realized gain | 14,494,578 | 43,502,571 | |||||||||
| Net change in unrealized appreciation/depreciation | 51,165,450 | (36,546,787 | ) | ||||||||
| Net Increase | 65,094,159 | 5,915,697 | |||||||||
| Distributions to Shareholders from Net Realized Gain: | |||||||||||
| Class A shares | (13,416,415 | ) | — | ||||||||
| Class B shares | (521,872 | ) | — | ||||||||
| Class C shares | (1,091,152 | ) | — | ||||||||
| Class I shares | (97,266 | ) | — | ||||||||
| Total Distributions | (15,126,705 | ) | — | ||||||||
| Net decrease from transactions in shares of beneficial interest | (30,749,342 | ) | (26,939,096 | ) | |||||||
| Net Increase (Decrease) | 19,218,112 | (21,023,399 | ) | ||||||||
| Net Assets: | |||||||||||
| Beginning of period | 335,292,660 | 356,316,059 | |||||||||
| End of Period (Including accumulated net investment losses of $(710,427) and $(144,558), respectively) | $ | 354,510,772 | $ | 335,292,660 | |||||||
See Notes to Financial Statements
15
Morgan Stanley Mid Cap Growth Fund
Notes to Financial Statements n March 31, 2012 (unaudited)
1. Organization and Accounting Policies
Morgan Stanley Mid Cap Growth Fund (the "Fund"), is registered under the Investment Company Act of 1940, as amended (the "Act"), as a diversified, open-end management investment company. The Fund's investment objective is to seek long-term capital growth. The Fund was organized as a Massachusetts business trust on December 28, 1982 and commenced operations on April 29, 1983. On July 28, 1997, the Fund converted to a multiple class share structure.
The Fund offers Class A shares, Class B shares, Class C shares and Class I shares. The four classes are substantially the same except that most Class A shares are subject to a sales charge imposed at the time of purchase and some Class A shares, and most Class B shares and Class C shares are subject to a contingent deferred sales charge imposed on shares redeemed within eighteen months, six years and one year, respectively. Class I shares are not subject to a sales charge. Additionally, Class A shares, Class B shares and Class C shares incur distribution expenses.
The following is a summary of significant accounting policies:
A. Valuation of Investments — (1) An equity portfolio security listed or traded on the New York Stock Exchange ("NYSE") or American Stock Exchange or other domestic exchange is valued at its latest sale price prior to the time when assets are valued; if there were no sales that day, the security is valued at the mean between the last reported bid and ask price; (2) an equity portfolio security listed or traded on the Nasdaq is valued at the Nasdaq Official Closing Price; if there were no sales that day, the security is valued at the mean between the last reported bid and ask price; (3) all other domestic securities for which over-the-counter market quotations are readily available are valued at the mean between the last reported bid and ask price. In cases where a security is traded on more than one domestic exchange, the security is valued on the exchange designated as the primary market; (4) for equity securities traded on foreign exchanges, the last reported sale price or the latest bid price may be used if there were no sales on a particular day; (5) when market quotations are not readily available, including circumstances under which Morgan Stanley Investment Management Inc. (the "Adviser"), a wholly owned subsidiary of Morgan Stanley, determines that the latest sale price, the bid price or the mean between the last reported bid and ask price do not reflect a security's fair value, portfolio securities are valued at their fair value as determined in good faith under procedures established by and under the general supervision of the Fund's Trustees. Occasionally, developments affecting the closing prices of securities and other assets may occur between the times at which valuations of such securities are determined (that is, close of the foreign market on which the securities trade) and the close of business on the NYSE. If developments occur during such periods that are expected to materially affect the value of such securities, such valuations may be adjusted to reflect the estimated fair value of such securities as of the close of the NYSE, as determined in good faith by the Fund's Trustees or by the Adviser using a pricing service and/or procedures approved by the Trustees of the Fund; (6) certain portfolio securities
16
Morgan Stanley Mid Cap Growth Fund
Notes to Financial Statements n March 31, 2012 (unaudited) continued
may be valued by an outside pricing service approved by the Fund's Trustees; (7) investments in mutual funds, including the Morgan Stanley Institutional Liquidity Funds, are valued at the net asset value as of the close of each business day; and (8) short-term debt securities having a maturity date of more than sixty days at time of purchase are valued on a mark-to-market basis until sixty days prior to maturity and thereafter at amortized cost based on their value on the 61st day. Short-term debt securities having a maturity date of sixty days or less at the time of purchase are valued at amortized cost, which approximates fair value.
B. Accounting for Investments — Security transactions are accounted for on the trade date (date the order to buy or sell is executed). Realized gains and losses on security transactions are determined by the identified cost method. Dividend income and other distributions are recorded on the ex-dividend date. Discounts are accreted and premiums are amortized over the life of the respective securities and are included in interest income. Interest income is accrued daily as earned.
C. Multiple Class Allocations — Investment income, expenses (other than distribution fees), and realized and unrealized gains and losses are allocated to each class of shares based upon the relative net asset value on the date such items are recognized. Distribution fees are charged directly to the respective class.
D. Foreign Currency Translation — The books and records of the Fund are maintained in U.S. dollars as follows: (1) the foreign currency market value of investment securities, other assets and liabilities and foreign currency exchange contracts are translated at the exchange rates prevailing at the end of the period; and (2) purchases, sales, income and expenses are translated at the exchange rates prevailing on the respective dates of such transactions. The resultant exchange gains and losses are recorded as realized and unrealized gains/losses on foreign currency exchange contracts and foreign currency translations. Pursuant to U.S. federal income tax regulations, certain foreign exchange gains/losses included in realized and unrealized gains/losses are included in or are a reduction of ordinary income for federal income tax purposes. The Fund does not isolate that portion of the results of operations arising as a result of changes in the foreign exchange rates from the changes in the market prices of the securities held.
E. Dividends and Distributions to Shareholders — Dividends and distributions to shareholders are recorded on the ex-dividend date.
F. Use of Estimates — The preparation of financial statements in accordance with generally accepted accounting principles in the United States ("GAAP") requires management to make estimates and assumptions that affect the reported amounts and disclosures. Actual results could differ from those estimates.
17
Morgan Stanley Mid Cap Growth Fund
Notes to Financial Statements n March 31, 2012 (unaudited) continued
G. Indemnifications — The Fund enters into contracts that contain a variety of indemnifications. The Fund's maximum exposure under these arrangements is unknown. However, the Fund has not had prior claims or losses pursuant to these contracts and expects the risk of loss to be remote.
2. Fair Valuation Measurements
Financial Accounting Standards Board ("FASB") Accounting Standards Codification ("ASC") 820, Fair Value Measurements and Disclosures ("ASC 820"), defines fair value as the value that the Fund would receive to sell an investment or pay to transfer a liability in a timely transaction with an independent buyer in the principal market, or in the absence of a principal market the most advantageous market for the investment or liability. ASC 820 establishes a three-tier hierarchy to distinguish between (1) inputs that reflect the assumptions market participants would use in valuing an asset or liability developed based on market data obtained from sources independent of the reporting entity (observable inputs); and (2) inputs that reflect the reporting entity's own assumptions about the assumptions market participants would use in valuing an asset or liability developed based on the best information available in the circumstances (unobservable inputs) and to establish classification of fair value measurements for disclosure purposes. Various inputs are used in determining the value of the Fund's investments. The inputs are summarized in the three broad levels listed below.
• Level 1 — unadjusted quoted prices in active markets for identical investments
• Level 2 — other significant observable inputs (including quoted prices for similar investments, interest rates, prepayment speeds, credit risk, etc.)
• Level 3 — significant unobservable inputs including the Fund's own assumptions in determining the fair value of investments. Factors considered in making this determination may include, but are not limited to, information obtained by contacting the issuer, analysts, or the appropriate stock exchange (for exchange-traded securities), analysis of the issuer's financial statements or other available documents and, if necessary, available information concerning other securities in similar circumstances
The inputs or methodology used for valuing securities are not necessarily an indication of the risk associated with investing in those securities and the determination of the significance of a particular input to the fair value measurement in its entirety requires judgment and considers factors specific to each security.
18
Morgan Stanley Mid Cap Growth Fund
Notes to Financial Statements n March 31, 2012 (unaudited) continued
The following is a summary of the inputs used to value the Fund's investments as of March 31, 2012.
| INVESTMENT TYPE | LEVEL 1 UNADJUSTED QUOTED PRICES | LEVEL 2 OTHER SIGNIFICANT OBSERVABLE INPUTS | LEVEL 3 SIGNIFICANT UNOBSERVABLE INPUTS | TOTAL | |||||||||||||||
| Assets: | |||||||||||||||||||
| Common Stocks | |||||||||||||||||||
| Air Transport | $ | 6,941,943 | $ | — | $ | — | $ | 6,941,943 | |||||||||||
| Alternative Energy | 9,260,064 | — | — | 9,260,064 | |||||||||||||||
| Asset Management & Custodian | 2,326,230 | — | — | 2,326,230 | |||||||||||||||
| Biotechnology | 13,243,735 | — | — | 13,243,735 | |||||||||||||||
| Cement | 3,778,081 | — | — | 3,778,081 | |||||||||||||||
| Chemicals: Diversified | 9,093,858 | — | — | 9,093,858 | |||||||||||||||
| Commercial Services | 29,195,824 | — | — | 29,195,824 | |||||||||||||||
| Communications Technology | 17,550,819 | — | — | 17,550,819 | |||||||||||||||
| Computer Services, Software & Systems | 53,831,150 | — | 2,566,321 | 56,397,471 | |||||||||||||||
| Computer Technology | 12,544,941 | — | — | 12,544,941 | |||||||||||||||
| Consumer Lending | 5,301,801 | — | — | 5,301,801 | |||||||||||||||
| Consumer Services: Miscellaneous | 7,652,596 | — | — | 7,652,596 | |||||||||||||||
| Cosmetics | 3,152,164 | — | — | 3,152,164 | |||||||||||||||
| Diversified Materials & Processing | 5,010,494 | — | — | 5,010,494 | |||||||||||||||
| Diversified Media | 10,622,363 | — | — | 10,622,363 | |||||||||||||||
| Diversified Retail | 26,042,443 | — | 6,623,803 | 32,666,246 | |||||||||||||||
| Education Services | 3,343,090 | — | — | 3,343,090 | |||||||||||||||
| Electronic Entertainment | 2,681,298 | — | — | 2,681,298 | |||||||||||||||
| Financial Data & Systems | 18,805,933 | — | — | 18,805,933 | |||||||||||||||
| Health Care Services | 9,055,394 | — | — | 9,055,394 | |||||||||||||||
| Media | — | — | 1,915,881 | 1,915,881 | |||||||||||||||
| Medical & Dental Instruments & Supplies | 4,275,049 | — | — | 4,275,049 | |||||||||||||||
| Medical Equipment | 13,627,721 | — | — | 13,627,721 | |||||||||||||||
| Metals & Minerals: Diversified | 5,683,594 | — | — | 5,683,594 | |||||||||||||||
| Pharmaceuticals | 17,941,275 | — | — | 17,941,275 | |||||||||||||||
| Publishing | 4,828,558 | — | — | 4,828,558 | |||||||||||||||
| Recreational Vehicles & Boats | 12,644,743 | — | — | 12,644,743 | |||||||||||||||
| Restaurants | 4,123,595 | — | — | 4,123,595 | |||||||||||||||
| Scientific Instruments: Pollution Control | 3,676,890 | — | — | 3,676,890 | |||||||||||||||
| Semiconductors & Components | 6,873,391 | — | — | 6,873,391 | |||||||||||||||
| Utilities: Electrical | 5,924,589 | — | — | 5,924,589 | |||||||||||||||
| Total Common Stocks | 329,033,626 | — | 11,106,005 | 340,139,631 | |||||||||||||||
| Convertible Preferred Stocks | — | — | 4,301,554 | 4,301,554 | |||||||||||||||
| Short-Term Investment | |||||||||||||||||||
| Investment Company | 12,960,646 | — | — | 12,960,646 | |||||||||||||||
| Total Assets | $ | 341,994,272 | $ | — | $ | 15,407,559 | $ | 357,401,831 | |||||||||||
19
Morgan Stanley Mid Cap Growth Fund
Notes to Financial Statements n March 31, 2012 (unaudited) continued
Transfers between investment levels may occur as the markets fluctuate and/or the availability of data used in an investment's valuation changes. The Fund recognizes transfers between the levels as of the end of the period. As of March 31, 2012, securities with a total value of $29,175,542 transferred from Level 2 to Level 1. At September 30, 2011, the fair market value of certain securities were adjusted due to developments which occurred between the time of the close of the foreign markets on which they trade and the close of business on the NYSE which resulted in their Level 2 classification.
Following is a reconciliation of investments in which significant unobservable inputs (Level 3) were used in determining fair value:
| COMMON STOCKS | CONVERTIBLE PREFERRED STOCKS | PREFERRED STOCK | |||||||||||||
| Beginning Balance | $ | — | $ | 7,510,589 | $ | 2,882,562 | |||||||||
| Purchases | 1,915,881 | 1,493,006 | — | ||||||||||||
| Sales | — | — | — | ||||||||||||
| Amortization of discount | — | — | — | ||||||||||||
| Transfers in | — | — | — | ||||||||||||
| Transfers out | — | — | — | ||||||||||||
| Corporate Action | 5,826,371 | (2,943,809 | ) | (2,882,562 | ) | ||||||||||
| Change in unrealized appreciation (depreciation) | 3,363,753 | (1,758,232 | ) | — | |||||||||||
| Realized gains (losses) | — | — | — | ||||||||||||
| Ending Balance | $ | 11,106,005 | $ | 4,301,554 | $ | — | |||||||||
| Net change in unrealized appreciation/depreciation from investments still held as of March 31, 2012 | $ | 343,530 | $ | 1,261,991 | $ | — | |||||||||
3. Investment Advisory/Administration Agreements
Pursuant to an Investment Advisory Agreement with the Adviser, the Fund pays an advisory fee, accrued daily and payable monthly, by applying the following annual rates to net assets of the Fund determined as of the close of each business day: 0.42% to the portion of the daily net assets not exceeding $500 million; and 0.395% to the portion of the daily net assets exceeding $500 million.
Pursuant to an Administration Agreement with Morgan Stanley Services Company Inc. (the "Administrator"), an affiliate of the Adviser, the Fund pays an administration fee, accrued daily and payable monthly, by applying the annual rate of 0.08% to the Fund's daily net assets.
Under a Sub-Administration Agreement between the Administrator and State Street Bank and Trust Company ("State Street"), State Street provides certain administrative services to the Fund. For such services, the Administrator pays State Street a portion of the fee the Administrator receives from the Fund.
20
Morgan Stanley Mid Cap Growth Fund
Notes to Financial Statements n March 31, 2012 (unaudited) continued
4. Plan of Distribution
Shares of the Fund are distributed by Morgan Stanley Distribution, Inc. (the "Distributor"), an affiliate of the Adviser and Administrator. The Fund has adopted a Plan of Distribution (the "Plan") pursuant to Rule 12b-1 under the Act. The Plan provides that the Fund will pay the Distributor a fee which is accrued daily and paid monthly at the following annual rates: (i) Class A — up to 0.25% of the average daily net assets of Class A shares; (ii) Class B — up to 1.00% of the average daily net assets of Class B shares; and (iii) Class C — up to 1.00% of the average daily net assets of Class C shares.
In the case of Class B shares, provided that the Plan continues in effect, any cumulative expenses incurred by the Distributor but not yet recovered may be recovered through the payment of future distribution fees from the Fund pursuant to the Plan and contingent deferred sales charges paid by investors upon redemption of Class B shares. Although there is no legal obligation for the Fund to pay expenses incurred in excess of payments made to the Distributor under the Plan and the proceeds of contingent deferred sales charges paid by investors upon redemption of shares, if for any reason the Plan is terminated, the Trustees will consider at that time the manner in which to treat such expenses. The Distributor has advised the Fund that such excess amounts totaled $31,343,309 at March 31, 2012.
In the case of Class A shares and Class C shares, expenses incurred pursuant to the Plan in any calendar year in excess of 0.25% or 1.00% of the average daily net assets of Class A shares or Class C shares, respectively, will not be reimbursed by the Fund through payments in any subsequent year, except that expenses representing a gross sales credit to Morgan Stanley Smith Barney Financial Advisors and other authorized financial representatives at the time of sale may be reimbursed in the subsequent calendar year. For the six months ended March 31, 2012, the distribution fee was accrued for Class A shares and Class C shares at the annual rate of 0.25% and 0.91%, respectively.
The Distributor has informed the Fund that for the six months ended March 31, 2012, it received contingent deferred sales charges from certain redemptions of the Fund's Class A shares, Class B shares and Class C shares of $67, $5,051 and $1,987, respectively, and received $21,505 in front-end sales charges from sales of the Fund's Class A shares. The respective shareholders pay such charges, which are not an expense of the Fund.
5. Security Transactions and Transactions with Affiliates
The cost of purchases and proceeds from sales of investment securities, excluding short-term investments, for the six months ended March 31, 2012 aggregated $27,741,542 and $65,624,344, respectively.
21
Morgan Stanley Mid Cap Growth Fund
Notes to Financial Statements n March 31, 2012 (unaudited) continued
The Fund invests in the Institutional Class of the Morgan Stanley Institutional Liquidity Funds — Money Market Portfolio (the "Liquidity Funds"), an open-end management investment company managed by the Adviser. Investment advisory fees paid by the Fund are reduced by an amount equal to its pro-rata share of the advisory and administration fees paid by the Fund due to its investment in the Liquidity Funds. For the six months ended March 31, 2012, advisory fees paid were reduced by $12,063 relating to the Fund's investment in the Liquidity Funds.
A summary of the Fund's transactions in shares of the Liquidity Funds during the six months ended March 31, 2012 is as follows:
| VALUE SEPTEMBER 30, 2011 | PURCHASES AT COST | SALES | DIVIDEND INCOME | VALUE MARCH 31, 2012 | |||||||||||||||
| $ | 20,294,108 | $ | 47,868,927 | $ | 55,202,389 | $ | 6,517 | $ | 12,960,646 | ||||||||||
For the six months ended March 31, 2012, the Fund incurred broker commissions of $84 with Citigroup, Inc., and its affiliated broker/dealers, which may be deemed to be affiliates of the Adviser, Administrator and Distributor under Section 17 of the Act, for the portfolio transactions executed on behalf of the Fund.
Morgan Stanley Services Company Inc., an affiliate of the Adviser and Distributor, is the Fund's transfer agent.
The Fund has an unfunded noncontributory defined benefit pension plan covering certain independent Trustees of the Fund who will have served as independent Trustees for at least five years at the time of retirement. Benefits under this plan are based on factors which include years of service and compensation. The Trustees voted to close the plan to new participants and eliminate the future benefits growth due to increases to compensation after July 31, 2003. Aggregate pension costs for the six months ended March 31, 2012, included in "trustees' fees and expenses" in the Statement of Operations amounted to $2,158. At March 31, 2012, the Fund had an accrued pension liability of $59,796, which is included in "accrued expenses and other payables" in the Statement of Assets and Liabilities.
The Fund has an unfunded Deferred Compensation Plan (the "Compensation Plan"), which allows each independent Trustee to defer payment of all, or a portion, of the fees he or she receives for serving on the Board of Trustees. Each eligible Trustee generally may elect to have the deferred amounts credited with a return equal to the total return on one or more of the Morgan Stanley funds that are offered as investment options under the Compensation Plan. Appreciation/depreciation and distributions received from these investments are recorded with an offsetting increase/decrease in the deferred compensation obligation and do not affect the net asset value of the Fund.
22
Morgan Stanley Mid Cap Growth Fund
Notes to Financial Statements n March 31, 2012 (unaudited) continued
6. Shares of Beneficial Interest+
Transactions in shares of beneficial interest were as follows:
| FOR THE SIX MONTHS ENDED MARCH 31, 2012 | FOR THE YEAR ENDED SEPTEMBER 30, 2011 | ||||||||||||||||||
| (unaudited) | |||||||||||||||||||
| SHARES | AMOUNT | SHARES | AMOUNT | ||||||||||||||||
| CLASS A SHARES | |||||||||||||||||||
| Sold | 342,513 | $ | 11,096,282 | 2,162,956 | $ | 74,977,651 | |||||||||||||
| Conversion from Class B | 65,718 | 2,139,156 | 159,254 | 5,567,470 | |||||||||||||||
| Reinvestment of distributions | 438,682 | 12,901,624 | — | — | |||||||||||||||
| Redeemed | (1,692,176 | ) | (54,517,717 | ) | (2,977,065 | ) | (102,727,503 | ) | |||||||||||
| Net decrease — Class A | (845,263 | ) | (28,380,655 | ) | (654,855 | ) | (22,182,382 | ) | |||||||||||
| CLASS B SHARES | |||||||||||||||||||
| Sold | 2,174 | 60,365 | 55,593 | 1,621,613 | |||||||||||||||
| Conversion to Class A | (76,328 | ) | (2,139,156 | ) | (182,856 | ) | (5,567,470 | ) | |||||||||||
| Reinvestment of distributions | 18,905 | 477,922 | — | — | |||||||||||||||
| Redeemed | (40,743 | ) | (1,144,990 | ) | (100,037 | ) | (3,002,660 | ) | |||||||||||
| Net decrease — Class B | (95,992 | ) | (2,745,859 | ) | (227,300 | ) | (6,948,517 | ) | |||||||||||
| CLASS C SHARES | |||||||||||||||||||
| Sold | 5,080 | 146,511 | 216,397 | 6,353,209 | |||||||||||||||
| Reinvestment of distributions | 42,208 | 1,072,092 | — | — | |||||||||||||||
| Redeemed | (89,856 | ) | (2,516,745 | ) | (126,456 | ) | (3,802,312 | ) | |||||||||||
| Net increase (decrease) — Class C | (42,568 | ) | (1,298,142 | ) | 89,941 | 2,550,897 | |||||||||||||
| CLASS I SHARES | |||||||||||||||||||
| Sold | 76,632 | 2,513,225 | 44,096 | 1,565,256 | |||||||||||||||
| Reinvestment of distributions | 2,871 | 88,203 | — | — | |||||||||||||||
| Redeemed | (27,874 | ) | (926,114 | ) | (54,209 | ) | (1,924,350 | ) | |||||||||||
| Net increase (decrease) — Class I | 51,629 | 1,675,314 | (10,113 | ) | (359,094 | ) | |||||||||||||
| Net decrease in Fund | (932,194 | ) | $ | (30,749,342 | ) | (802,327 | ) | $ | (26,939,096 | ) | |||||||||
+ On March 31, 2011, the Fund suspended offering its shares to new investors, with certain exceptions as set forth in the Fund's prospectus. The Fund will continue to offer its shares to existing shareholders and may recommence offering its shares to new investors in the future.
7. Expense Offset
The Fund has entered into an arrangement with State Street (the "Custodian"), whereby credits realized on uninvested cash balances were used to offset a portion of the Fund's expenses. If applicable, these custodian credits are shown as "expense offset" in the Statement of Operations.
23
Morgan Stanley Mid Cap Growth Fund
Notes to Financial Statements n March 31, 2012 (unaudited) continued
8. Federal Income Tax Status
It is the Fund's intention to continue to qualify as a regulated investment company and distribute all of its taxable and tax-exempt income. Accordingly, no provision for Federal income taxes is required in the financial statements.
Dividend income and distributions to shareholders are recorded on the ex-dividend date. Interest income is recognized on an accrual basis. Dividends from net investment income, if any, are declared and paid annually. Net realized capital gains, if any, are distributed at least annually.
The Fund may be subject to taxes imposed by countries in which it invests. Such taxes are generally based on income and/or capital gains earned or repatriated. Taxes are accrued based on net investment income, net realized gains and net unrealized appreciation as such income and/or gains are earned. Taxes may also be based on transactions in foreign currency and are accrued based on the value of investments denominated in such currency.
FASB ASC 740-10, Income Taxes — Overall, sets forth a minimum threshold for financial statement recognition of the benefit of a tax position taken or expected to be taken in a tax return. Management has concluded there are no significant uncertain tax positions that would require recognition in the financial statements. If applicable, the Fund recognizes interest accrued related to unrecognized tax benefits in "Interest Expense" and penalties in ''Other Expenses" in the Statement of Operations. The Fund files tax returns with the U.S. Internal Revenue Service, New York and various states. Each of the tax years in the four-year period ended September 30, 2011, remains subject to examination by taxing authorities.
The tax character of distributions paid may differ from the character of distributions shown in the Statements of Changes in Net Assets due to short-term capital gains being treated as ordinary income for tax purposes. There were no distributions paid during the years ended 2011 and 2010.
The amount and character of income and gains to be distributed are determined in accordance with income tax regulations which may differ from GAAP. These book/tax differences are either considered temporary or permanent in nature.
Temporary differences are primarily due to differing book and tax treatments in the timing of the recognition of gains (losses) on certain investment transactions and the timing of the deductibility of certain expenses.
24
Morgan Stanley Mid Cap Growth Fund
Notes to Financial Statements n March 31, 2012 (unaudited) continued
Permanent differences, primarily due to foreign currency gains and a net operating loss, resulted in the following reclassifications among the Fund's components of net assets at September 30, 2011:
| ACCUMULATED NET INVESTMENT LOSS | ACCUMULATED UNDISTRIBUTED NET REALIZED GAIN | PAID-IN-CAPITAL | |||||||||
| $ | 1,291,047 | $ | (2,716 | ) | $ | (1,288,331 | ) | ||||
At September 30, 2011, the components of distributable earnings for the Fund on a tax basis were as follows:
| UNDISTRIBUTED ORDINARY INCOME | UNDISTRIBUTED LONG-TERM CAPITAL GAINS | ||||||
| $ | — | $ | 11,517,632 | ||||
At March 31, 2012, the aggregate cost for federal income tax purposes approximates the aggregate cost for book purposes. The aggregate gross unrealized appreciation is $89,167,687 and the aggregate gross unrealized depreciation is $16,550,469 resulting in net unrealized appreciation of $72,617,218.
On December 22, 2010, the Regulated Investment Company Modernization Act of 2010 (the "Modernization Act") was signed into law. The Modernization Act modernizes several tax provisions related to Regulated Investment Companies ("RICs") and their shareholders. One key change made by the Modernization Act is that capital losses will generally retain their character as short-term or long-term and may be carried forward indefinitely to offset future gains. These losses are utilized before other capital loss carryforwards that expire. Generally, the Modernization Act is effective for taxable years beginning after December 22, 2010.
To the extent that capital loss carryforwards are used to offset any future capital gains realized during the carryover period as provided by U.S. Federal income tax regulations, no capital gains tax liability will be incurred by a Fund for gains realized and not distributed. To the extent that capital gains are offset, such gains will not be distributed to the shareholders. During the year ended September 30, 2011, the Fund utilized capital loss carryforwards for U.S. Federal income tax purposes of approximately $30,874,816.
Capital losses and specified ordinary losses, including currency losses, incurred after October 31 and other ordinary losses incurred after December 31 but within the taxable year are deemed to arise on
25
Morgan Stanley Mid Cap Growth Fund
Notes to Financial Statements n March 31, 2012 (unaudited) continued
the first day of the Fund's next taxable year. For the year ended September 30, 2011, the Fund deferred to October 1, 2011 for U.S. Federal income tax purposes the following losses:
| POST-OCTOBER CURRENCY AND SPECIFIED ORDINARY LOSSES | POST-OCTOBER CAPITAL LOSSES | ||||||
| $ | 73,542 | $ | — | ||||
9. Accounting Pronouncement
In May 2011, FASB issued Accounting Standards Update ("ASU") 2011-04. The amendments in this update are the results of the work of FASB and the International Accounting Standards Board to develop common requirements for measuring fair value and for disclosing information about fair value measurements, which are effective during interim and annual periods beginning after December 15, 2011. Consequently, these amendments improve the comparability of fair value measurements presented and disclosed in the financial statements prepared in accordance with GAAP and International Financial Reporting Standards. At this time, the Fund's management is evaluating the implications of ASU 2011-04.
26
Morgan Stanley Mid Cap Growth Fund
Financial Highlights
Selected ratios and per share data for a share of beneficial interest outstanding throughout each period:
| FOR THE SIX MONTHS ENDED | FOR THE YEAR ENDED SEPTEMBER 30, | ||||||||||||||||||||||||||
| MARCH 31, 2012 | 2011 | 2010^ | 2009^ | 2008^ | 2007^ | ||||||||||||||||||||||
| (unaudited) | |||||||||||||||||||||||||||
| Class A Shares | |||||||||||||||||||||||||||
| Selected Per Share Data: | |||||||||||||||||||||||||||
| Net asset value, beginning of period | $ | 30.39 | $ | 30.13 | $ | 24.22 | $ | 23.78 | $ | 35.96 | $ | 27.00 | |||||||||||||||
| Income (loss) from investment operations: | |||||||||||||||||||||||||||
| Net investment income (loss)(1) | (0.04 | ) | (0.07 | ) | 0.01 | (0.06 | ) | (0.05 | ) | 0.05 | |||||||||||||||||
| Net realized and unrealized gain (loss) | 6.18 | 0.33 | 5.90 | 1.83 | (9.46 | ) | 8.91 | ||||||||||||||||||||
| Total income (loss) from investment operations | 6.14 | 0.26 | 5.91 | 1.77 | (9.51 | ) | 8.96 | ||||||||||||||||||||
| Less distributions from net realized gain | (1.47 | ) | — | — | (1.33 | ) | (2.67 | ) | — | ||||||||||||||||||
| Net asset value, end of period | $ | 35.06 | $ | 30.39 | $ | 30.13 | $ | 24.22 | $ | 23.78 | $ | 35.96 | |||||||||||||||
| Total Return(2) | 21.13 | %(6) | 0.86 | % | 24.40 | % | 10.94 | % | (28.53 | )% | 33.19 | % | |||||||||||||||
| Ratios to Average Net Assets(3): | |||||||||||||||||||||||||||
| Total expenses | 0.97 | %(4)(7) | 0.97 | %(4) | 1.04 | %(4) | 1.17 | %(4) | 0.99 | %(4) | 1.01 | %(4) | |||||||||||||||
| Net investment income (loss) | (0.28 | )%(4)(7) | (0.19 | )%(4) | 0.02 | %(4) | (0.34 | )%(4) | (0.17 | )%(4) | 0.15 | %(4) | |||||||||||||||
| Rebate from Morgan Stanley affiliate | 0.01 | %(7) | 0.00 | %(5) | 0.00 | %(5) | 0.00 | %(5) | 0.00 | %(5) | 0.00 | %(5) | |||||||||||||||
| Supplemental Data: | |||||||||||||||||||||||||||
| Net assets, end of period, in thousands | $ | 318,957 | $ | 302,166 | $ | 319,321 | $ | 228,332 | $ | 232,192 | $ | 295,694 | |||||||||||||||
| Portfolio turnover rate | 8 | %(6) | 46 | % | 46 | % | 27 | % | 59 | % | 72 | % | |||||||||||||||
^ Beginning with the year ended September 30, 2011, the Fund was audited by Ernst & Young LLP. The previous years were audited by another independent registered public accounting firm.
(1) The per share amounts were computed using an average number of shares outstanding during the period.
(2) Does not reflect the deduction of sales charge. Calculated based on the net asset value as of the last business day of the period.
(3) Reflects overall Fund ratios for investment income and non-class specific expenses.
(4) The ratios reflect the rebate of certain Fund expenses in connection with investments in a Morgan Stanley affiliate during the period. The effect of the rebate on the ratios is disclosed in the above table as "Rebate from Morgan Stanley affiliate."
(5) Amount is less than 0.005%.
(6) Not annualized.
(7) Annualized.
See Notes to Financial Statements
27
Morgan Stanley Mid Cap Growth Fund
Financial Highlights continued
| FOR THE SIX MONTHS ENDED | FOR THE YEAR ENDED SEPTEMBER 30, | ||||||||||||||||||||||||||
| MARCH 31, 2012 | 2011 | 2010^ | 2009^ | 2008^ | 2007^ | ||||||||||||||||||||||
| (unaudited) | |||||||||||||||||||||||||||
| Class B Shares | |||||||||||||||||||||||||||
| Selected Per Share Data: | |||||||||||||||||||||||||||
| Net asset value, beginning of period | $ | 26.37 | $ | 26.34 | $ | 21.34 | $ | 21.33 | $ | 32.76 | $ | 24.78 | |||||||||||||||
| Income (loss) from investment operations: | |||||||||||||||||||||||||||
| Net investment loss(1) | (0.14 | ) | (0.28 | ) | (0.17 | ) | (0.17 | ) | (0.25 | ) | (0.17 | ) | |||||||||||||||
| Net realized and unrealized gain (loss) | 5.32 | 0.31 | 5.17 | 1.51 | (8.51 | ) | 8.15 | ||||||||||||||||||||
| Total income (loss) from investment operations | 5.18 | 0.03 | 5.00 | 1.34 | (8.76 | ) | 7.98 | ||||||||||||||||||||
| Less distributions from net realized gain | (1.47 | ) | — | — | (1.33 | ) | (2.67 | ) | — | ||||||||||||||||||
| Net asset value, end of period | $ | 30.08 | $ | 26.37 | $ | 26.34 | $ | 21.34 | $ | 21.33 | $ | 32.76 | |||||||||||||||
| Total Return(2) | 20.70 | %(6) | 0.11 | % | 23.43 | % | 10.12 | % | (29.08 | )% | 32.24 | % | |||||||||||||||
| Ratios to Average Net Assets(3): | |||||||||||||||||||||||||||
| Total expenses | 1.72 | %(4)(7) | 1.72 | %(4) | 1.79 | %(4) | 1.92 | %(4) | 1.75 | %(4) | 1.77 | %(4) | |||||||||||||||
| Net investment loss | (1.03 | )%(4)(7) | (0.94 | )%(4) | (0.73 | )%(4) | (1.09 | )%(4) | (0.93 | )%(4) | (0.61 | )%(4) | |||||||||||||||
| Rebate from Morgan Stanley affiliate | 0.01 | %(7) | 0.00 | %(5) | 0.00 | %(5) | 0.00 | %(5) | 0.00 | %(5) | 0.00 | %(5) | |||||||||||||||
| Supplemental Data: | |||||||||||||||||||||||||||
| Net assets, end of period, in thousands | $ | 8,903 | $ | 10,338 | $ | 16,315 | $ | 21,541 | $ | 33,659 | $ | 126,446 | |||||||||||||||
| Portfolio turnover rate | 8 | %(6) | 46 | % | 46 | % | 27 | % | 59 | % | 72 | % | |||||||||||||||
^ Beginning with the year ended September 30, 2011, the Fund was audited by Ernst & Young LLP. The previous years were audited by another independent registered public accounting firm.
(1) The per share amounts were computed using an average number of shares outstanding during the period.
(2) Does not reflect the deduction of sales charge. Calculated based on the net asset value as of the last business day of the period.
(3) Reflects overall Fund ratios for investment income and non-class specific expenses.
(4) The ratios reflect the rebate of certain Fund expenses in connection with investments in a Morgan Stanley affiliate during the period. The effect of the rebate on the ratios is disclosed in the above table as "Rebate from Morgan Stanley affiliate."
(5) Amount is less than 0.005%.
(6) Not annualized.
(7) Annualized.
See Notes to Financial Statements
28
Morgan Stanley Mid Cap Growth Fund
Financial Highlights continued
| FOR THE SIX MONTHS ENDED | FOR THE YEAR ENDED SEPTEMBER 30, | ||||||||||||||||||||||||||
| MARCH 31, 2012 | 2011 | 2010^ | 2009^ | 2008^ | 2007^ | ||||||||||||||||||||||
| (unaudited) | |||||||||||||||||||||||||||
| Class C Shares | |||||||||||||||||||||||||||
| Selected Per Share Data: | |||||||||||||||||||||||||||
| Net asset value, beginning of period | $ | 26.48 | $ | 26.46 | $ | 21.43 | $ | 21.41 | $ | 32.88 | $ | 24.87 | |||||||||||||||
| Income (loss) from investment operations: | |||||||||||||||||||||||||||
| Net investment loss(1) | (0.13 | ) | (0.29 | ) | (0.17 | ) | (0.17 | ) | (0.25 | ) | (0.17 | ) | |||||||||||||||
| Net realized and unrealized gain (loss) | 5.35 | 0.31 | 5.20 | 1.52 | (8.55 | ) | 8.18 | ||||||||||||||||||||
| Total income (loss) from investment operations | 5.22 | 0.02 | 5.03 | 1.35 | (8.80 | ) | 8.01 | ||||||||||||||||||||
| Less distributions from net realized gain | (1.47 | ) | — | — | (1.33 | ) | (2.67 | ) | — | ||||||||||||||||||
| Net asset value, end of period | $ | 30.23 | $ | 26.48 | $ | 26.46 | $ | 21.43 | $ | 21.41 | $ | 32.88 | |||||||||||||||
| Total Return(2) | 20.64 | %(6) | 0.11 | % | 23.47 | % | 10.12 | % | (29.08 | )% | 32.21 | % | |||||||||||||||
| Ratios to Average Net Assets(3): | |||||||||||||||||||||||||||
| Total expenses | 1.63 | %(4)(7) | 1.72 | %(4) | 1.79 | %(4) | 1.92 | %(4) | 1.72 | %(4) | 1.77 | %(4) | |||||||||||||||
| Net investment loss | (0.94 | )%(4)(7) | (0.94 | )%(4) | (0.73 | )%(4) | (1.09 | )%(4) | (0.90 | )%(4) | (0.61 | )%(4) | |||||||||||||||
| Rebate from Morgan Stanley affiliate | 0.01 | %(7) | 0.00 | %(5) | 0.00 | %(5) | 0.00 | %(5) | 0.00 | %(5) | 0.00 | %(5) | |||||||||||||||
| Supplemental Data: | |||||||||||||||||||||||||||
| Net assets, end of period, in thousands | $ | 22,099 | $ | 20,491 | $ | 18,090 | $ | 15,339 | $ | 17,085 | $ | 29,267 | |||||||||||||||
| Portfolio turnover rate | 8 | %(6) | 46 | % | 46 | % | 27 | % | 59 | % | 72 | % | |||||||||||||||
^ Beginning with the year ended September 30, 2011, the Fund was audited by Ernst & Young LLP. The previous years were audited by another independent registered public accounting firm.
(1) The per share amounts were computed using an average number of shares outstanding during the period.
(2) Does not reflect the deduction of sales charge. Calculated based on the net asset value as of the last business day of the period.
(3) Reflects overall Fund ratios for investment income and non-class specific expenses.
(4) The ratios reflect the rebate of certain Fund expenses in connection with investments in a Morgan Stanley affiliate during the period. The effect of the rebate on the ratios is disclosed in the above table as "Rebate from Morgan Stanley affiliate."
(5) Amount is less than 0.005%.
(6) Not annualized.
(7) Annualized.
See Notes to Financial Statements
29
Morgan Stanley Mid Cap Growth Fund
Financial Highlights continued
| FOR THE SIX MONTHS ENDED | FOR THE YEAR ENDED SEPTEMBER 30, | ||||||||||||||||||||||||||
| MARCH 31, 2012 | 2011 | 2010^ | 2009^ | 2008^ | 2007^ | ||||||||||||||||||||||
| (unaudited) | |||||||||||||||||||||||||||
| Class I Shares | |||||||||||||||||||||||||||
| Selected Per Share Data: | |||||||||||||||||||||||||||
| Net asset value, beginning of period | $ | 31.66 | $ | 31.32 | $ | 25.13 | $ | 24.53 | $ | 36.94 | $ | 27.66 | |||||||||||||||
| Income (loss) from investment operations: | |||||||||||||||||||||||||||
| Net investment income (loss)(1) | (0.00 | )(2) | 0.02 | 0.07 | 0.00 | (2) | 0.03 | 0.12 | |||||||||||||||||||
| Net realized and unrealized gain (loss) | 6.46 | 0.32 | 6.12 | 1.93 | (9.77 | ) | 9.16 | ||||||||||||||||||||
| Total income (loss) from investment operations | 6.46 | 0.34 | 6.19 | 1.93 | (9.74 | ) | 9.28 | ||||||||||||||||||||
| Less distributions from net realized gain | (1.47 | ) | — | — | (1.33 | ) | (2.67 | ) | — | ||||||||||||||||||
| Net asset value, end of period | $ | 36.65 | $ | 31.66 | $ | 31.32 | $ | 25.13 | $ | 24.53 | $ | 36.94 | |||||||||||||||
| Total Return(3) | 21.26 | %(7) | 1.12 | % | 24.63 | % | 11.27 | % | (28.39 | )% | 33.55 | % | |||||||||||||||
| Ratios to Average Net Assets(4): | |||||||||||||||||||||||||||
| Total expenses | 0.72 | %(5)(8) | 0.72 | %(5) | 0.79 | %(5) | 0.92 | %(5) | 0.75 | %(5) | 0.77 | %(5) | |||||||||||||||
| Net investment income (loss) | (0.03 | )%(5)(8) | 0.06 | %(5) | 0.27 | %(5) | (0.09 | )%(5) | 0.07 | %(5) | 0.39 | %(5) | |||||||||||||||
| Rebate from Morgan Stanley affiliate | 0.01 | %(8) | 0.00 | %(6) | 0.00 | %(6) | 0.00 | %(6) | 0.00 | %(6) | 0.00 | %(6) | |||||||||||||||
| Supplemental Data: | |||||||||||||||||||||||||||
| Net assets, end of period, in thousands | $ | 4,551 | $ | 2,297 | $ | 2,589 | $ | 1,795 | $ | 10,158 | $ | 23,024 | |||||||||||||||
| Portfolio turnover rate | 8 | %(7) | 46 | % | 46 | % | 27 | % | 59 | % | 72 | % | |||||||||||||||
^ Beginning with the year ended September 30, 2011, the Fund was audited by Ernst & Young LLP. The previous years were audited by another independent registered public accounting firm.
(1) The per share amounts were computed using an average number of shares outstanding during the period.
(2) Amount is less than $0.005.
(3) Calculated based on the net asset value as of the last business day of the period.
(4) Reflects overall Fund ratios for investment income and non-class specific expenses.
(5) The ratios reflect the rebate of certain Fund expenses in connection with investments in a Morgan Stanley affiliate during the period. The effect of the rebate on the ratios is disclosed in the above table as "Rebate from Morgan Stanley affiliate."
(6) Amount is less than 0.005%.
(7) Not annualized.
(8) Annualized.
See Notes to Financial Statements
30
Morgan Stanley Mid Cap Growth Fund
U.S. Privacy Policy (unaudited)
An Important Notice Concerning Our U.S. Privacy Policy
This privacy notice describes the U.S. privacy policy of Morgan Stanley Distribution, Inc., and the Morgan Stanley family of mutual funds ("us", "our", "we").
We are required by federal law to provide you with notice of our U.S. privacy policy ("Policy"). This Policy applies to both our current and former clients unless we state otherwise and is intended for individual clients who purchase products or receive services from us for personal, family or household purposes. This Policy is not applicable to partnerships, corporations, trusts or other non-individual clients or account holders, nor is this Policy applicable to individuals who are either beneficiaries of a trust for which we serve as trustee or participants in an employee benefit plan administered or advised by us. This Policy is, however, applicable to individuals who select us to be a custodian of securities or assets in individual retirement accounts, 401(k) accounts, or accounts subject to the Uniform Gifts to Minors Act.
This notice sets out our business practices to protect your privacy; how we collect and share personal information about you; and how you can limit our sharing or certain uses by others of this information. We may amend this Policy at any time, and will inform you of any changes to our Policy as required by law.
We Respect Your Privacy
We appreciate that you have provided us with your personal financial information and understand your concerns about your information. We strive to safeguard the information our clients entrust to us. Protecting the confidentiality and security of client information is an important part of how we conduct our business.
This notice describes what personal information we collect about you, how we collect it, when we may share it with others, and how certain others may use it. It discusses the steps you may take to limit our sharing of certain information about you with our affiliated companies, including, but not limited to our affiliated banking businesses, brokerage firms and credit service affiliates. It also discloses how you may limit our affiliates' use of shared information for marketing purposes.
Throughout this Policy, we refer to the nonpublic information that personally identifies you as "personal information." We also use the term "affiliated company" in this notice. An affiliated company is a company in our family of companies and includes companies with the Morgan Stanley name. These affiliated companies are financial institutions such as broker-dealers, banks, investment advisers and credit card issuers. We refer to any company that is not an affiliated company as a nonaffiliated third party. For purposes of Section 5 of this notice, and your ability to limit certain uses of personal information by our affiliates, this notice applies to the use of personal information by our affiliated companies.
1. What Personal Information Do We Collect From You?
We may collect the following types of information about you: (i) information provided by you, including information from applications and other forms we receive from you, (ii) information about your
31
Morgan Stanley Mid Cap Growth Fund
U.S. Privacy Policy (unaudited) continued
transactions with us or our affiliates, (iii) information about your transactions with nonaffiliated third parties, (iv) information from consumer reporting agencies, (v) information obtained from our websites, and (vi) information obtained from other sources. For example:
• We collect information such as your name, address, e-mail address, telephone/fax numbers, assets, income and investment objectives through applications and other forms you submit to us.
• We may obtain information about account balances, your use of account(s) and the types of products and services you prefer to receive from us through your dealings and transactions with us and other sources.
• We may obtain information about your creditworthiness and credit history from consumer reporting agencies.
• We may collect background information from and through third-party vendors to verify representations you have made and to comply with various regulatory requirements.
2. When Do We Disclose Personal Information We Collect About You?
We may disclose personal information we collect about you in each of the categories listed above to affiliated and nonaffiliated third parties.
a. Information We Disclose to Affiliated Companies. We may disclose personal information that we collect about you to our affiliated companies to manage your account(s) effectively, to service and process your transactions, and to let you know about products and services offered by us and affiliated companies, to manage our business, and as otherwise required or permitted by law. Offers for products and services from affiliated companies are developed under conditions designed to safeguard your personal information.
b. Information We Disclose to Third Parties. We may disclose personal information that we collect about you to nonaffiliated third parties to provide marketing services on our behalf or to other financial institutions with whom we have joint marketing agreements. We may also disclose all of the information we collect to other nonaffiliated third parties for our everyday business purposes, such as to process transactions, maintain account(s), respond to court orders and legal investigations, report to credit bureaus, offer our own products and services, protect against fraud, for institutional risk control, to perform services on our behalf, and as otherwise required or permitted by law.
When we share personal information about you with a nonaffiliated third party, they are required to limit their use of personal information about you to the particular purpose for which it was shared and they are not allowed to share personal information about you with others except to fulfill that limited purpose or as may be permitted or required by law.
32
Morgan Stanley Mid Cap Growth Fund
U.S. Privacy Policy (unaudited) continued
3. How Do We Protect The Security and Confidentiality Of Personal Information We Collect About You?
We maintain physical, electronic and procedural security measures that comply with applicable law and regulations to help safeguard the personal information we collect about you. We have internal policies governing the proper handling of client information by employees. Third parties that provide support or marketing services on our behalf may also receive personal information about you, and we require them to adhere to appropriate security standards with respect to such information.
4. How Can You Limit Our Sharing Certain Personal Information About You With Our Affiliated Companies For Eligibility Determination?
By following the opt-out procedures in Section 6, below, you may limit the extent to which we share with our affiliated companies, personal information that was collected to determine your eligibility for products and services such as your credit reports and other information that you have provided to us or that we may obtain from third parties ("eligibility information"). Eligibility information does not include your identification information or personal information pertaining to our transactions or experiences with you. Please note that, even if you direct us not to share eligibility information with our affiliated companies, we may still share your personal information, including eligibility information, with our affiliated companies under circumstances that are permitted under applicable law, such as to process transactions or to service your account.
5. How Can You Limit the Use of Certain Personal Information About You by Our Affiliated Companies for Marketing?
By following the opt-out instructions in Section 6, below, you may limit our affiliated companies from marketing their products or services to you based on personal information we disclose to them. This information may include, for example, your income and account history with us. Please note that, even if you choose to limit our affiliated companies from using personal information about you that we may share with them for marketing their products and services to you, our affiliated companies may use your personal information that they obtain from us to market to you in circumstances permitted by law, such as if the affiliated party has its own relationship with you.
6. How Can You Send Us an Opt-Out Instruction?
If you wish to limit our sharing of eligibility information about you with our affiliated companies, or our affiliated companies' use of personal information for marketing purposes, as described in this notice, you may do so by:
• Calling us at (800) 548-7786
Monday–Friday between 8a.m. and 5p.m. (EST)
33
Morgan Stanley Mid Cap Growth Fund
U.S. Privacy Policy (unaudited) continued
• Writing to us at the following address:
Morgan Stanley Services Company Inc.
c/o Privacy Coordinator
201 Plaza Two, 3rd Floor
Jersey City, New Jersey 07311
If you choose to write to us, your request should include: your name, address, telephone number and account number(s) to which the opt-out applies and whether you are opting out with respect to sharing of eligibility information (Section 4 above), or information used for marketing (Section 5 above), or both. Written opt-out requests should not be sent with any other correspondence. In order to process your request, we require that the request be provided by you directly and not through a third party. Once you have informed us about your privacy preferences, your opt-out preference will remain in effect with respect to this Policy (as it may be amended) until you notify us otherwise. If you are a joint account owner, we will accept instructions from any one of you and apply those instructions to the entire account.
Please understand that if you limit our sharing or our affiliated companies' use of personal information, you and any joint account holder(s) may not receive information about our affiliated companies' products and services, including products or services that could help you manage your financial resources and achieve your investment objectives.
If you have more than one account or relationship with us, please specify the accounts to which you would like us to apply your privacy choices. If you have accounts or relationships with our affiliates, you may receive multiple privacy policies from them, and will need to separately notify those companies of your privacy choices for those accounts or relationships.
7. What if an affiliated company becomes a nonaffiliated third party?
If, at any time in the future, an affiliated company becomes a nonaffiliated third party, further disclosures of personal information made to the former affiliated company will be limited to those described in Section 2(b) above relating to nonaffiliated third parties. If you elected under Section 6 to limit disclosures we make to affiliated companies, or use of personal information by affiliated companies, your election will not apply to use by any former affiliated company of your personal information in their possession once it becomes a nonaffiliated third party.
Special Notice to Residents of Vermont
The following section supplements our Policy with respect to our individual clients who have a Vermont address and supersedes anything to the contrary in the above Policy with respect to those clients only.
The State of Vermont requires financial institutions to obtain your consent prior to sharing personal information that they collect about you with nonaffiliated third parties, or eligibility information with
34
Morgan Stanley Mid Cap Growth Fund
U.S. Privacy Policy (unaudited) continued
affiliated companies, other than in certain limited circumstances. Except as permitted by law, we will not share personal information we collect about you with nonaffiliated third parties or eligibility information with affiliated companies, unless you provide us with your written consent to share such information.
Special Notice to Residents of California
The following section supplements our Policy with respect to our individual clients who have a California address and supersedes anything to the contrary in the above Policy with respect to those clients only.
In response to a California law, if your account has a California home address, your personal information will not be disclosed to nonaffiliated third parties except as permitted by applicable California law, and we will limit sharing such personal information with our affiliates to comply with California privacy laws that apply to us.
35

June 29, 2012
Supplement
SUPPLEMENT DATED JUNE 29, 2012 TO THE PROSPECTUS OF
MORGAN STANLEY GLOBAL STRATEGIST FUND
Dated November 30, 2011
The first paragraph of the section of the Prospectus entitled "Shareholder Information—How to Exchange Shares—Permissible Fund Exchanges." is hereby deleted and replaced with the following:
You may exchange shares of any Class of the Fund for the same Class of: Morgan Stanley European Equity Fund Inc., Morgan Stanley Focus Growth Fund, Morgan Stanley Global Fixed Income Opportunities Fund, Morgan Stanley Global Infrastructure Fund, Morgan Stanley International Fund, Morgan Stanley International Value Equity Fund, Morgan Stanley Mid Cap Growth Fund, Morgan Stanley Mortgage Securities Trust, Morgan Stanley Multi Cap Growth Trust and Morgan Stanley U.S. Government Securities Trust (each, a "Morgan Stanley Multi-Class Fund"), if available, or for shares of Morgan Stanley California Tax-Free Daily Income Trust, Morgan Stanley Liquid Asset Fund Inc., Morgan Stanley New York Municipal Money Market Trust, Morgan Stanley Tax-Free Daily Income Trust and Morgan Stanley U.S. Government Money Market Trust (each, a "Morgan Stanley Money Market Fund") or the Morgan Stanley Limited Duration U.S. Government Trust, if available, without the imposition of an exchange fee. In addition, Class Q shares of Morgan Stanley Global Infrastructure Fund may be exchanged for Class A shares of the Fund without payment of sales charges (including contingent deferred sales charges ("CDSCs")) or the imposition of an exchange fee. Front-end sales charges are not imposed on exchanges of Class A shares.
PLEASE RETAIN THIS SUPPLEMENT FOR FUTURE REFERENCE.
SRTSPT4 6/12

May 14, 2012
Supplement
SUPPLEMENT DATED MAY 14, 2012 TO THE PROSPECTUS OF
MORGAN STANLEY GLOBAL STRATEGIST FUND
Dated November 30, 2011
Effective as of the close of business on May 16, 2012, Class B shares of the Fund will be closed for purchases by new investors.
PLEASE RETAIN THIS SUPPLEMENT FOR FUTURE REFERENCE.
SRTSPT3 5/12

May 2, 2012
Supplement
SUPPLEMENT DATED MAY 2, 2012 TO THE PROSPECTUS OF
MORGAN STANLEY GLOBAL STRATEGIST FUND
Dated November 30, 2011
The Board of Trustees (the "Board") of Morgan Stanley Global Strategist Fund (the "Fund") approved an Agreement and Plan of Reorganization by and between the Fund and Morgan Stanley Institutional Fund Trust, on behalf of its series Balanced Portfolio ("Balanced"), pursuant to which substantially all of the assets of the Fund would be combined with those of Balanced and shareholders of the Fund would become shareholders of Balanced, receiving shares of Balanced equal to the value of their holdings in the Fund (the "Reorganization"). Each shareholder of the Fund would receive the Class of shares of Balanced that corresponds to the Class of shares of the Fund currently held by that shareholder. The Reorganization is subject to the approval of shareholders of the Fund at a special meeting of shareholders scheduled to be held during the third quarter of 2012. A proxy statement formally detailing the proposal, the reasons for the Reorganization and information concerning Balanced is expected to be distributed to shareholders of the Fund during the third quarter of 2012.
PLEASE RETAIN THIS SUPPLEMENT FOR FUTURE REFERENCE.
SRTSPT2 5/12
INVESTMENT MANAGEMENT

Morgan Stanley
Global Strategist Fund

A mutual fund that seeks to maximize the total return on its investments.
Share Class | Ticker Symbol | ||||||
| Class A | SRTAX | ||||||
| Class B | SRTBX | ||||||
| Class C | SRTCX | ||||||
| Class I | SRTDX | ||||||
| Class R | SRTRX | ||||||
| Class W | SRTWX | ||||||
Prospectus
November 30, 2011
The Securities and Exchange Commission ("SEC") has not approved or disapproved these securities or passed upon the adequacy of this Prospectus. Any representation to the contrary is a criminal offense.
Contents
Fund Summary
| Investment Objective | 1 | ||||||
| Fees and Expenses | 1 | ||||||
| Portfolio Turnover | 2 | ||||||
| Principal Investment Strategies | 2 | ||||||
| Principal Risks | 2 | ||||||
| Past Performance | 4 | ||||||
| Adviser | 5 | ||||||
| Purchase and Sale of Fund Shares | 5 | ||||||
| Tax Information | 6 | ||||||
| Payments to Broker-Dealers and Other Financial Intermediaries | 6 | ||||||
Fund Details
| Additional Information about the Fund's Investment Objective, Strategies and Risks | 7 | ||||||
| Portfolio Holdings | 14 | ||||||
| Fund Management | 15 | ||||||
Shareholder Information
| Pricing Fund Shares | 16 | ||||||
| How to Buy Shares | 17 | ||||||
| How to Exchange Shares | 18 | ||||||
| How to Sell Shares | 20 | ||||||
| Distributions | 23 | ||||||
| Frequent Purchases and Redemptions of Fund Shares | 24 | ||||||
| Tax Consequences | 25 | ||||||
| Share Class Arrangements | 26 | ||||||
| Additional Information | 35 | ||||||
| Financial Highlights | 36 | ||||||
| Morgan Stanley Funds | Inside Back Cover | ||||||
This Prospectus contains important information about the Fund. Please read it carefully and keep it for future reference.
Fund Summary
Investment Objective
 Morgan Stanley Global Strategist Fund seeks to maximize the total return on its investments.
Fees and Expenses
 The table below describes the fees and expenses that you may pay if you buy and hold shares of the Fund. You may qualify for sales charge discounts if you and your family invest, or agree to invest in the future, at least $25,000 in the Morgan Stanley Funds. More information about these and other discounts is available from your financial adviser and in the "Share Class Arrangements" section beginning on page 26 of this Prospectus and in the "Purchase, Redemption and Pricing of Shares" section beginning on page 53 of the Fund's Statement of Additional Information ("SAI").
Shareholder Fees (fees paid directly from your investment)
| Class A | Class B | Class C | Class I | Class R | Class W | ||||||||||||||||||||||
| Maximum sales charge (load) imposed on purchases (as a percentage of offering price) | 5.25 | %1 | None | None | None | None | None | ||||||||||||||||||||
| Maximum deferred sales charge (load) (as a percentage based on the lesser of the offering price or net asset value at redemption) | None2 | 5.00 | %3 | 1.00 | %3 | None | None | None | |||||||||||||||||||
Annual Fund Operating Expenses (expenses that you pay each year as a percentage of the value of your investment)
| Class A | Class B | Class C | Class I | Class R | Class W | ||||||||||||||||||||||
| Advisory fee | 0.42 | % | 0.42 | % | 0.42 | % | 0.42 | % | 0.42 | % | 0.42 | % | |||||||||||||||
| Distribution and service (12b-1) fees | 0.25 | % | 1.00 | % | 1.00 | % | None | 0.50 | % | 0.35 | % | ||||||||||||||||
| Other expenses | 0.31 | % | 0.31 | % | 0.31 | % | 0.31 | % | 0.31 | % | 0.31 | % | |||||||||||||||
| Total annual Fund operating expenses | 0.98 | % | 1.73 | % | 1.73 | % | 0.73 | % | 1.23 | %4 | 1.08 | %4 | |||||||||||||||
Example
The example below is intended to help you compare the cost of investing in the Fund with the cost of investing in other mutual funds.
The example assumes that you invest $10,000 in the Fund, your investment has a 5% return each year, and the Fund's operating expenses remain the same (except for the ten-year amounts for Class B shares which reflect the conversion to Class A shares eight years after the end of the calendar month in which shares were purchased). Although your actual costs may be higher or lower, based on these assumptions your costs would be:
If You SOLD Your Shares:
| 1 Year | 3 Years | 5 Years | 10 Years | ||||||||||||||||
| Class A | $ | 620 | $ | 821 | $ | 1,038 | $ | 1,663 | |||||||||||
| Class B | $ | 676 | $ | 845 | $ | 1,139 | $ | 1,842 | |||||||||||
| Class C | $ | 276 | $ | 545 | $ | 939 | $ | 2,041 | |||||||||||
| Class I | $ | 75 | $ | 233 | $ | 406 | $ | 906 | |||||||||||
| Class R4 | $ | 125 | $ | 390 | $ | 676 | $ | 1,489 | |||||||||||
| Class W4 | $ | 110 | $ | 343 | $ | 595 | $ | 1,317 | |||||||||||
morganstanley.com/im
1
If You HELD Your Shares:
| 1 Year | 3 Years | 5 Years | 10 Years | ||||||||||||||||
| Class A | $ | 620 | $ | 821 | $ | 1,038 | $ | 1,663 | |||||||||||
| Class B | $ | 176 | $ | 545 | $ | 939 | $ | 1,842 | |||||||||||
| Class C | $ | 176 | $ | 545 | $ | 939 | $ | 2,041 | |||||||||||
| Class I | $ | 75 | $ | 233 | $ | 406 | $ | 906 | |||||||||||
| Class R4 | $ | 125 | $ | 390 | $ | 676 | $ | 1,489 | |||||||||||
| Class W4 | $ | 110 | $ | 343 | $ | 595 | $ | 1,317 | |||||||||||
(1) Reduced for purchases of $25,000 and over.
(2) Investments that are not subject to any sales charges at the time of purchase are subject to a contingent deferred sales charge ("CDSC") of 1.00% that will be imposed if you sell your shares within 18 months after purchase, except for certain specific circumstances.
(3) The Class B CDSC is scaled down to 1.00% during the sixth year, reaching zero thereafter and the Class C CDSC is only applicable if you sell your shares within one year after purchase. See "Share Class Arrangements" for a complete discussion of the CDSC.
(4) As of the date of the Prospectus, Class R and Class W shares were not operational. The expense information shown is that of Class I and includes the distribution and shareholder services fees of 0.50% in the case of Class R shares and 0.35% in the case of Class W shares.
Portfolio Turnover
 The Fund pays transaction costs, such as commissions, when it buys and sells securities (or "turns over" its portfolio). A higher portfolio turnover rate may indicate higher transaction costs and may result in higher taxes when Fund shares are held in a taxable account. These costs, which are not reflected in Total annual Fund operating expenses or in the Example, affect the Fund's performance. During the most recent fiscal year, the Fund's portfolio turnover rate was 123% of the average value of its portfolio.
Principal Investment Strategies
 The Fund's Adviser, Morgan Stanley Investment Management Inc., seeks to achieve the Fund's investment objective by investing primarily in a blend of equity and fixed-income securities of U.S. and non-U.S. issuers. Equity securities may include common and preferred stocks, depositary receipts, convertible securities, equity-linked securities, real estate investment trusts ("REITs"), and rights and warrants to purchase equity securities. Fixed income securities may include mortgage-related or mortgage-backed securities, floating rate securities, inflation-linked fixed income securities, securities issued or guaranteed by the U.S. Government, its agencies or instrumentalities, securities issued or guaranteed by non-U.S. governments, their agencies, or instrumentalities, corporate bonds and notes issued by U.S. and non-U.S. entities.
The Adviser will utilize a top-down investment approach that focuses on asset class, sector, region, country, and currency selection. The portfolio's allocations will be based upon the Adviser's evaluations and analyses, taking into account results of its fundamental market research and recommendations generated by the Adviser's quantitative models. Investment decisions will be made without regard to any particular allocation as to geographical location, sector, credit rating, maturity, currency denomination or market capitalization. The Fund may invest in any country, including developing or emerging market countries. The Fund's investments may be U.S. and non-U.S. dollar denominated.
The Fund may invest a portion of its assets in below investment grade fixed income securities. The Fund may also invest in restricted and illiquid securities. The Fund may, but is not required to, use derivative instruments for a variety of purposes, including hedging, risk management, portfolio management or to earn income. The Fund's use of derivatives may involve the purchase and sale of derivative instruments such as options, futures, swaps, structured investments (including commodity-linked notes) and other related instruments and techniques. The Fund may also invest in forward foreign currency exchange contracts, which are also derivatives, in connection with its investments in foreign securities.
The mortgage-backed securities in which the Fund may invest include mortgage pass-through securities which represent a participation interest in a pool of mortgage loans originated by U.S. governmental or private lenders such as banks.
Principal Risks
 There is no assurance that the Fund will achieve its investment objective and you can lose money investing in this Fund. The principal risks of investing in the Fund include:
• Common Stock and Other Equity Securities. In general, stock and other equity security values fluctuate, and
2
sometimes widely fluctuate, in response to activities specific to the company as well as general market, economic and political conditions. Investments in convertible securities subject the Fund to the risks associated with both fixed-income securities, including credit risk and interest rate risk, and common stocks.
• Fixed-Income Securities. All fixed-income securities are subject to two types of risk: credit risk and interest rate risk. Credit risk refers to the possibility that the issuer of a security will be unable to make interest payments and/or repay the principal on its debt. Certain of the Fund's investments may have speculative characteristics. Interest rate risk refers to fluctuations in the value of a fixed-income security resulting from changes in the general level of interest rates. When the general level of interest rates goes up, the prices of most fixed-income securities go down. When the general level of interest rates goes down, the prices of most fixed-income securities go up. Because the Fund is not limited as to the maturities of the fixed-income securities in which it may invest, a rise in the general level of interest rates may cause the price of the Fund's portfolio securities to fall substantially. In addition, a portion of the Fund's securities may be rated below investment grade, commonly known as "junk bonds," and may have speculative risk characteristics.
• Mortgage-Backed Securities. Mortgage-backed securities entail prepayment risk, which generally increases during a period of falling interest rates. Certain mortgage-backed securities may be more volatile and less liquid than other traditional types of debt securities. In addition, an unexpectedly high rate of defaults on the mortgages held by a mortgage pool may adversely affect the value of a mortgage-backed security and could result in losses to the Fund. The risk of such defaults is generally higher in the case of mortgage pools that include subprime mortgages.
• REITs. REITs are susceptible to risks associated with the ownership of real estate and the real estate industry in general. In addition, REITs depend on specialized management skills, may not be diversified, may have less trading volume and may be subject to more abrupt or erratic price movements than the overall securities market. Investments in REITs may involve duplication of management fees and certain other expenses.
• Foreign and Emerging Market Securities. Investments in foreign markets entail special risks such as currency, political, economic and market risks. There also may be greater market volatility, less reliable financial information, higher transaction and custody costs, decreased market liquidity and less government and exchange regulation associated with investments in foreign markets. The risks of investing in emerging market countries are greater than risks associated with investments in foreign developed countries. Hedging the Fund's currency risks through forward foreign currency exchange contracts involves the risk of mismatching the Fund's objectives under a forward foreign currency exchange contract with the value of securities denominated in a particular currency. There is additional risk that such transactions reduce or preclude the opportunity for gain and that currency contracts create exposure to currencies in which the Fund's securities are not denominated.
• U.S. Government Securities. With respect to U.S. government securities that are not backed by the full faith and credit of the U.S. Government, there is the risk that the U.S. Government will not provide financial support to such U.S. government agencies, instrumentalities or sponsored enterprises if it is not obligated to do so by law.
• Liquidity Risk. The Fund's investments in restricted and illiquid securities may entail greater risk than investments in publicly traded securities. These securities may be more difficult to sell, particularly in times of market turmoil. Illiquid securities may be more difficult to value. If the Fund is forced to sell an illiquid security to fund redemptions or for other cash needs, it may be forced to sell the security at a loss.
• Derivatives. A derivative instrument often has risks similar to its underlying instrument and may have additional risks, including imperfect correlation between the value of the derivative and the underlying instrument, risks of default by the other party to certain transactions, magnification of losses incurred due to changes in the market value of the securities, instruments, indices or interest rates to which they relate, and risks that the transactions may not be liquid. Certain derivative transactions may give rise to a form of leverage. Leverage magnifies the potential for gain and the risk of loss.
morganstanley.com/im
3
Shares of the Fund are not bank deposits and are not guaranteed or insured by the FDIC or any other government agency.
Past Performance
 The bar chart and table below provide some indication of the risks of investing in the Fund by showing changes in the Fund's Class B shares' performance from year to year and by showing how the Fund's average annual returns for the one, five and 10 year periods compared with those of broad measures of market performance, as well as an index that represents a group of similar mutual funds, over time. The performance of the other Classes will differ because the Classes have different ongoing fees. The performance information in the bar chart does not reflect the deduction of sales charges; if these amounts were reflected, returns would be less than shown. The Fund's returns in the table include the maximum applicable sales charge for each Class and assume you sold your shares at the end of each period (unless otherwise noted). The Fund's past performance (before and after taxes) does not indicate how the Fund will perform in the future. Updated performance information is available online at www.morganstanley.com/im or by calling toll-free (800) 869-NEWS.
Annual Total Returns—Calendar Years

The year-to-date total return as of September 30, 2011 was –9.23%.
Best Quarter (ended June 30, 2003) : 13.80%
Worst Quarter (ended September 30, 2002) : –12.84%
Average Annual Total Returns For Periods Ended December 31, 2010
| Past 1 Year | Past 5 Years | Past 10 Years | |||||||||||||||||
| Class A: | Return Before Taxes | 4.72 | % | 3.47 | % | 2.96 | % | ||||||||||||
| Class B: | Return Before Taxes | 5.07 | % | 3.52 | % | 2.88 | %* | ||||||||||||
| Return After Taxes on Distributions1 | 2.45% | 2.38% | 2.16%* | ||||||||||||||||
| Return After Taxes on Distributions and Sale of Fund Shares | 6.25% | 2.87% | 2.32%* | ||||||||||||||||
| Class C: | Return Before Taxes | 8.84 | % | 3.84 | % | 2.75 | % | ||||||||||||
| Class I: | Return Before Taxes | 10.86 | % | 4.85 | % | 3.76 | % | ||||||||||||
| Class R2: | Return Before Taxes | — | — | — | |||||||||||||||
| Class W2: | Return Before Taxes | — | — | — | |||||||||||||||
| MSCI All Country World Index (reflects no deduction for fees, expenses or taxes)3 | 12.67% | 3.44% | 3.20% | ||||||||||||||||
| Barclays Capital U.S. Government/ Credit Index (reflects no deduction for fees, expenses or taxes)4 | 6.59% | 5.56% | 5.83% | ||||||||||||||||
| Lipper Global Flexible Portfolio Funds Index (reflects no deduction for taxes)5 | 11.92% | 3.19% | 3.94% | ||||||||||||||||
| Lipper Flexible Portfolio Funds Index (reflects no deduction for taxes)6 | 12.91% | 4.75% | 3.64% | ||||||||||||||||
* Effective April 2005, Class B shares will generally convert to Class A shares approximately eight years after the end of the calendar month in which the shares were purchased. The "Past 10 Years" performance for Class B shares reflects this conversion.
(1) These returns do not reflect any tax consequences from a sale of your shares at the end of each period, but they do reflect any applicable sales charges on such a sale.
(2) Class R and Class W had not commenced operations as of the date of this Prospectus and therefore do not have return information to report. Return information for the Fund's Class R and Class W shares will be shown in the Average Annual Total Returns table in future prospectuses offering the Fund's Class R
4
and Class W shares after the Fund's Class R and Class W shares have return information for a full calendar year to report.
(3) The Morgan Stanley Capital International (MSCI) All Country World Index (ACWI) is a free float-adjusted market capitalization weighted index designed to measure the equity market performance of developed and emerging markets. The term "free float" represents the portion of shares outstanding that are deemed to be available for purchase in the public equity markets by investors. It is not possible to invest directly in an index.
(4) The Barclays Capital U.S. Government/Credit Index tracks the performance of government and corporate obligations, including U.S. government agency and Treasury securities and corporate and Yankee bonds. It is not possible to invest directly in an index.
(5) The Lipper Global Flexible Funds Index is an equally weighted performance index of the largest qualifying funds (based on net assets) in the Lipper Global Flexible Funds classification. The Index, which is adjusted for capital gains distributions and income dividends, is unmanaged and should not be considered an investment. There are currently 30 funds represented in this Index. The Fund was in the Lipper Flexible Portfolio Funds classification as of December 31, 2010, however, it is in the Lipper Global Flexible Funds classification as of the date of this Prospectus.
(6) The Lipper Flexible Portfolio Funds Index is an equally weighted performance index of the largest qualifying funds (based on net assets) in the Lipper Flexible Portfolio Funds classification. There are currently 30 funds represented in this Index.
The after-tax returns shown in the table above are calculated using the historical highest individual federal marginal income tax rates during the period shown and do not reflect the impact of state and local taxes. After-tax returns for the Fund's other Classes will vary from the Class B shares' returns. Actual after-tax returns depend on an investor's tax situation and may differ from those shown, and after-tax returns are not relevant to investors who hold their Fund shares through tax-deferred arrangements, such as 401(k) plans or individual retirement accounts. After-tax returns may be higher than before-tax returns due to foreign tax credits and/or an assumed benefit from capital losses that would have been realized had Fund shares been sold at the end of the relevant periods, as applicable.
Adviser
 Adviser. Morgan Stanley Investment Management Inc.
Portfolio Managers. The Fund is managed by members of the Global Asset Allocation team. Information about the members jointly and primarily responsible for the day-to-day management of the Fund's portfolio is shown below:
| Name | Title with Adviser | Date Began Managing Fund | |||||||||
| Mark A. Bavoso | Managing Director | January 1994 | |||||||||
| Cyril Moullé-Berteaux | Managing Director | August 2011 | |||||||||
Purchase and Sale of Fund Shares
 Minimum Investment Amounts
| Minimum Investment | |||||||||||
| Investment Options | Initial | Additional | |||||||||
| Regular Account | $ | 1,000 | $ | 100 | |||||||
| Individual Retirement Account | $ | 1,000 | $ | 100 | |||||||
| Coverdell Education Savings Account | $ | 500 | $ | 100 | |||||||
| EasyInvest® (Automatically from your checking or savings account or Money Market Fund) | $ | 100 | * | $ | 100 | * | |||||
* Provided your schedule of investments totals $1,000 in 12 months.
You may not be subject to the minimum investment requirements under certain circumstances. For more information, please refer to the "How to Buy Shares—Minimum Investment Amounts" section beginning on page 18 of this Prospectus.
You can purchase or sell Fund shares by contacting your Morgan Stanley Smith Barney Financial Advisor or other authorized financial representative. You can also sell Fund shares at any time by telephonic request to the Fund or by enrolling in a systematic withdrawal plan. In addition, you can purchase additional Fund shares or sell Fund shares by written request to the Fund.
Your shares will be sold at the next price calculated after we receive your order to redeem. If you redeem Class A, Class B or Class C shares, your net sale proceeds are reduced by the amount of any applicable CDSC.
To contact a Morgan Stanley Smith Barney Financial Advisor, call toll-free 1-866-MORGAN8 for the telephone number of the Morgan Stanley Smith Barney office nearest you or access our office locator at www.morganstanley.com. To sell shares by telephone, call (800) 869-NEWS. To purchase additional Fund
morganstanley.com/im
5
shares or sell Fund shares by mail, contact the Fund's transfer agent, Morgan Stanley Services Company Inc. (the "Transfer Agent"), at: Morgan Stanley Services Company Inc., P.O. Box 219885, Kansas City, MO 64121-9885 (for purchases) or Morgan Stanley Services Company Inc., P.O. Box 219886, Kansas City, MO 64121-9886 (for sales). For more information, please refer to the "How to Buy Shares" and "How to Sell Shares" sections beginning on page 17 and page 20, respectively, of this Prospectus.
Tax Information
 The Fund intends to make distributions that may be taxed as ordinary income or capital gains, unless you are investing through a tax-deferred arrangement, such as a 401(k) plan or an individual retirement account.
Payments to Broker-Dealers and Other Financial Intermediaries
 If you purchase the Fund through a broker-dealer or other financial intermediary (such as a bank), the Adviser and/or the Fund's distributor may pay the intermediary for the sale of Fund shares and related services. These payments, which may be significant in amount, may create a conflict of interest by influencing the broker-dealer or other intermediary and your salesperson to recommend the Fund over another investment. Ask your salesperson or visit your financial intermediary's web site for more information.
6
Fund Details
Additional Information about the Fund's Investment Objective, Strategies and Risks
Investment Objective
 Morgan Stanley Global Strategist Fund seeks to maximize the total return on its investments.
Principal Investment Strategies
 The Adviser seeks to achieve the Fund's investment objective by investing primarily in a blend of equity and fixed-income securities of U.S. and non-U.S. issuers. Equity securities may include common and preferred stocks, depositary receipts, convertible securities, equity-linked securities, REITs, and rights and warrants to purchase equity securities. Fixed income securities may include mortgage-related or mortgage-backed securities, floating rate securities, inflation-linked fixed income securities, securities issued or guaranteed by the U.S. Government, its agencies or instrumentalities, securities issued or guaranteed by non-U.S. governments, their agencies, or instrumentalities, corporate bonds and notes issued by U.S. and non-U.S. entities.
The Adviser will utilize a top-down investment approach that focuses on asset class, sector, region, country, and currency selection. The portfolio's allocations will be based upon the Adviser's evaluations and analyses, taking into account results of its fundamental market research and recommendations generated by the Adviser's quantitative models. Investment decisions will be made without regard to any particular allocation as to geographical location, sector, credit rating, maturity, currency denomination or market capitalization. The Fund may invest in any country, including developing or emerging market countries. The Fund's investments may be U.S. and non-U.S. dollar denominated. In determining whether to sell a security, the Adviser considers a number of factors, including changes in capital appreciation potential, or the overall assessment of asset class, sector, region, country and currency selection shifts.
The Fund may purchase certain non-publicly traded "restricted" securities. These securities may include "144A" securities, which are exempt from registration and may only be resold to qualified institutional buyers. The Fund may invest up to 15% of its assets in illiquid securities, including restricted securities that are illiquid. The Fund may invest an unlimited amount in restricted securities that are considered by the Adviser to be liquid.
Total Return
An investment objective having the goal of selecting securities with the potential to rise in price and pay out income.
7
The Fund may invest a portion of its assets in below investment grade fixed income securities and repurchase agreements. The Fund may also invest up to 10% of its total assets in other investment companies, including exchange-traded funds ("ETFs"). The Fund may, but is not required to, use derivative instruments for a variety of purposes, including hedging, risk management, portfolio management or to earn income. Derivatives are financial instruments whose value is based on the value of an underlying asset, interest rate, index or financial instrument. The Fund's use of derivatives may involve the purchase and sale of derivative instruments such as options, futures, swaps, structured investments (including commodity-linked notes) and other related instruments and techniques. The Fund may also invest in forward foreign currency exchange contracts, which are also derivatives, in connection with its investments in foreign securities.
Common stock is a share ownership or equity interest in a corporation. It may or may not pay dividends, as some companies reinvest all of their profits back into their businesses, while others pay out some of their profits to shareholders as dividends. A depositary receipt is generally issued by a bank or financial institution and represents an ownership interest in the common stock or other equity securities of a foreign company. REITs pool investors' funds for investments primarily in real estate properties and real estate-related loans.
The mortgage-backed securities in which the Fund may invest include mortgage pass-through securities which represent a participation interest in a pool of mortgage loans originated by U.S. governmental or private lenders such as banks.
In pursuing the Fund's investment objective, the Adviser has considerable leeway in deciding which investments it buys, holds or sells on a day-to-day basis and which trading strategies it uses. For example, the Adviser in its discretion may determine to use some permitted trading strategies while not using others.
Additional Investment Strategy Information
 This section provides additional information relating to the Fund's investment strategies.
Investment Companies and ETFs. The Fund may invest up to 10% of its assets in the securities of other open-end, closed-end and unregistered investment companies, including foreign investment companies and ETFs.
Repurchase Agreements. Repurchase agreements are contracts in which a financial institution sells a security and agrees to buy it back on a specific date (usually within seven days) and at a higher price, which reflects an agreed-upon interest rate.
Defensive Investing. The Fund may take temporary "defensive" positions in attempting to respond to adverse market conditions. The Fund may invest any amount of its assets in cash or money market instruments in a defensive posture that may be inconsistent with the Fund's principal investment strategies when the Adviser believes it is advisable to do so.
8
Although taking a defensive posture is designed to protect the Fund from an anticipated market downturn, it could have the effect of reducing the benefit from any upswing in the market. When the Fund takes a defensive position, it may not achieve its investment objective.
***
The percentage limitations relating to the composition of the Fund's portfolio apply at the time the Fund acquires an investment. Subsequent percentage changes that result from market fluctuations generally will not require the Fund to sell any portfolio security. However, the Fund may be required to sell its illiquid securities holdings, or reduce its borrowings, if any, in response to fluctuations in the value of such holdings. The Fund may change its principal investment strategies without shareholder approval; however, you would be notified of any changes.
Principal Risks
 There is no assurance that the Fund will achieve its investment objective. The Fund's share price and return will fluctuate with changes in the market value of the Fund's portfolio securities. When you sell Fund shares, they may be worth less than what you paid for them and, accordingly, you can lose money investing in this Fund.
Common Stocks and Other Equity Securities. A principal risk of investing in the Fund is associated with its common stock and other equity investments. In general, stock and other equity security values fluctuate in response to activities specific to the company as well as general market, economic and political conditions. These prices can fluctuate widely in response to these factors.
Convertible securities are securities that generally pay interest and may be converted into common stock. These securities may carry risks associated with both common stock and fixed-income securities. To the extent that a convertible security's investment value is greater than its conversion value, its price will be likely to increase when interest rates fall and decrease when interest rates rise, as with a fixed-income security. If the conversion value exceeds the investment value, the price of the convertible security will tend to fluctuate directly with the price of the underlying equity security.
Fixed-Income Securities. All fixed-income securities are subject to two types of risk: credit risk and interest rate risk. Credit risk refers to the possibility that the issuer of a security will be unable to make interest payments and/or repay the principal on its debt.
Interest rate risk refers to fluctuations in the value of a fixed-income security resulting from changes in the general level of interest rates. When the general level of interest rates goes up, the prices of most fixed-income securities go down. When the general level of interest rates goes down, the prices of most fixed-income securities go up. (Zero coupon securities are typically subject to greater price fluctuations than comparable securities that pay interest.)
The Fund is not limited as to the maturities of the fixed-income securities in which it may invest. Thus, a rise in the general level of interest rates may cause the price of the Fund's portfolio securities to fall substantially. A portion of the Fund's securities may be rated below investment grade. Securities rated below investment grade are commonly known as "junk bonds" and may have speculative credit risk characteristics.
9
Mortgage-Backed Securities. Mortgage-backed securities in which the Fund may invest have different risk characteristics than traditional debt securities. Although, generally, the value of fixed-income securities increases during periods of falling interest rates and decreases during periods of rising interest rates, this is not always the case with mortgage-backed securities. This is due to the fact that principal on underlying mortgages may be prepaid at any time, as well as other factors. Generally, prepayments will increase during a period of falling interest rates and decrease during a period of rising interest rates. The rate of prepayments also may be influenced by economic and other factors. Prepayment risk includes the possibility that, as interest rates fall, securities with stated interest rates may have the principal prepaid earlier than expected, requiring the Fund to invest the proceeds at generally lower interest rates.
Investments in mortgage-backed securities are made based upon, among other things, expectations regarding the rate of prepayments on underlying mortgage pools. Rates of prepayment, faster or slower than expected by the Adviser, could reduce the Fund's yield, increase the volatility of the Fund and/or cause a decline in net asset value. Certain mortgage-backed securities may be more volatile and less liquid than other traditional types of debt securities.
The Fund may invest in mortgage pass-through securities that are issued or guaranteed by the U.S. Government. These securities are either direct obligations of the U.S. Government or the issuing agency or instrumentality has the right to borrow from the U.S. Treasury to meet its obligations although it is not legally required to extend credit to the agency or instrumentality. Certain of the U.S. government securities purchased by the Fund are not backed by the full faith and credit of the United States and there is a risk that the U.S. Government will not provide financial support to these agencies if it is not obligated to do so by law. It is possible that these issuers will not have the funds to meet their payment obligations in the future.
To the extent the Fund invests in mortgage securities offered by non-governmental issuers, such as commercial banks, savings and loan institutions, private mortgage insurance companies, mortgage bankers and other secondary market issuers, the Fund may be subject to additional risks. Timely payment of interest and principal of non-governmental issuers is supported by various forms of private insurance or guarantees, including individual loan, title, pool and hazard insurance purchased by the issuer. There can be no assurance that the private insurers can meet their obligations under the policies. An unexpectedly high rate of defaults on the mortgages held by a mortgage pool may adversely affect the value of a mortgage-backed security and could result in losses to the Fund. The risk of such defaults is generally higher in the case of mortgage pools that include subprime mortgages. Subprime mortgages refer to loans made to borrowers with weakened credit histories or with a lower capacity to make timely payments on their mortgages.
REITs. REITs pool investors' funds for investments primarily in real estate properties or real estate-related loans. REITs generally derive their income from rents on the underlying properties or interest on the underlying loans, and their value is impacted by changes in the value of the underlying property or changes in interest rates affecting the underlying loans owned by the REITs. REITs are more susceptible to risks associated with the ownership of real estate and the real estate industry in general. These risks can include fluctuations in the value of underlying properties; defaults by borrowers or tenants; market saturation; changes in general and local economic conditions; decreases in market rates for rents; increases in competition, property taxes, capital expenditures or operating expenses; and other economic, political or regulatory occurrences affecting the real estate industry. In addition, REITs depend upon specialized management skills, may not be diversified (which may increase the volatility of a REIT's value), may have less trading volume and may be subject to more abrupt or erratic price movements than the overall securities market.
10
Operating REITs requires specialized management skills and the Fund indirectly bears REIT management expenses along with the direct expenses of the Fund. REITs are not taxed on income distributed to shareholders provided they comply with several requirements of the Internal Revenue Code of 1986, as amended (the "Code"). REITs are subject to the risk of failing to qualify for tax-free pass-through of income under the Code.
Foreign and Emerging Market Securities. The Fund's investments in foreign securities involve risks that are in addition to the risks associated with domestic securities. One additional risk is currency risk. While the price of Fund shares is quoted in U.S. dollars, the Fund may convert U.S. dollars to a foreign market's local currency to purchase a security in that market. If the value of that local currency falls relative to the U.S. dollar, the U.S. dollar value of the foreign security will decrease. This is true even if the foreign security's local price remains unchanged.
Foreign securities also have risks related to economic and political developments abroad, including expropriations, confiscatory taxation, exchange control regulation, limitations on the use or transfer of Fund assets and any effects of foreign social, economic or political instability. Foreign companies, in general, are not subject to the regulatory requirements of U.S. companies and, as such, there may be less publicly available information about these companies. Moreover, foreign accounting, auditing and financial reporting standards generally are different from those applicable to U.S. companies. Finally, in the event of a default of any foreign debt obligations, it may be more difficult for the Fund to obtain or enforce a judgment against the issuers of the securities.
Securities of foreign issuers may be less liquid than comparable securities of U.S. issuers and, as such, their price changes may be more volatile. Furthermore, foreign exchanges and broker-dealers are generally subject to less government and exchange scrutiny and regulation than their U.S. counterparts. In addition, differences in clearance and settlement procedures in foreign markets may cause delays in settlement of the Fund's trades effected in those markets and could result in losses to the Fund due to subsequent declines in the value of the securities subject to the trades.
The foreign securities in which the Fund may invest may be issued by governments of, or issuers located in, emerging market or developing countries. Compared to the United States and other developed countries, emerging market or developing countries may have relatively unstable governments, economies based on only a few industries and securities markets that trade a small number of securities. Prices of these securities tend to be especially volatile and, in the past, securities in these countries have offered greater potential loss (as well as gain) than securities of companies located in developed countries.
Depositary receipts involve many of the same risks as those associated with direct investment in foreign securities. In addition, the underlying issuers of certain depositary receipts, particularly unsponsored or unregistered depositary receipts, are under no obligation to distribute shareholder communications to the holders of such receipts, or to pass through to them any voting rights with respect to the deposited securities.
In connection with its investments in foreign securities, the Fund also may enter into forward contracts. A forward foreign currency exchange contract is a negotiated agreement between the contracting parties to exchange a specified amount of currency at a specified future time at a specified rate. The rate can be higher or lower than the spot rate between the currencies that are the subject of the contract. Forward foreign currency exchange contracts may be used to protect against uncertainty in the level of future foreign currency exchange rates or to gain or modify exposure to a
11
particular currency. In addition, the Fund may use cross currency hedging or proxy hedging with respect to currencies in which the Fund has or expects to have portfolio or currency exposure. Cross currency hedges involve the sale of one currency against the positive exposure to a different currency and may be used for hedging purposes or to establish an active exposure to the exchange rate between any two currencies. Hedging the Fund's currency risks involves the risk of mismatching the Fund's objectives under a forward or futures contract with the value of securities denominated in a particular currency. Furthermore, such transactions reduce or preclude the opportunity for gain if the value of the currency should move in the direction opposite to the position taken. There is an additional risk to the effect that currency contracts create exposure to currencies in which the Fund's securities are not denominated. Unanticipated changes in currency prices may result in poorer overall performance for the Fund than if it had not entered into such contracts. The use of forward foreign currency exchange contracts involves the risk of loss from the insolvency or bankruptcy of the counterparty to the contract or the failure of the counterparty to make payments or otherwise comply with the terms of the contract.
U.S. Government Securities. The Fund may purchase U.S. government securities that are not backed by the full faith and credit of the United States. With respect to these U.S. government securities, there is the risk that the U.S. Government will not provide financial support to such U.S. government agencies, instrumentalities or sponsored enterprises if it is not obligated to do so by law. The maximum potential liability of the issuers of some U.S. government securities held by the Fund may greatly exceed their current resources, including their legal right to support from the U.S. Treasury. It is possible that these issuers will not have the funds to meet their payment obligations in the future.
Under the FDIC Temporary Liquidity Guarantee Program, the FDIC guarantees the payment of principal and interest on the newly issued senior secured debt of banks, thrift institutions and certain holding companies. The FDIC guarantee of such debt under this Temporary Liquidity Guarantee Program is subject to the full faith and credit of the U.S. Government and expires no later than December 31, 2012. The interest from U.S. government securities generally is not subject to state and local taxation. However, the interest on securities guaranteed under the Temporary Liquidity Guarantee Program or other similar FDIC programs may be subject to state and local income taxes and therefore may cause additional state and local tax consequences for shareholders of any fund that purchases such securities. With respect to securities guaranteed under the FDIC Temporary Liquidity Guarantee Program, there is no designated period within which the FDIC is required to make guarantee payments.
Liquidity Risk. The Fund's investments in restricted and illiquid securities may entail greater risk than investments in publicly traded securities. These securities may be more difficult to sell, particularly in times of market turmoil. Illiquid securities may be more difficult to value. If the Fund is forced to sell an illiquid security to fund redemptions or for other cash needs, it may be forced to sell the security at a loss.
Derivatives. A derivative instrument often has risks similar to its underlying instrument and may have additional risks, including imperfect correlation between the value of the derivative and the underlying instrument, risks of default by the counterparty to certain transactions, magnification of losses incurred due to changes in the market value of the securities, instruments, indices or interest rates to which they relate, and risks that the transactions may not be liquid. The use of derivatives involves risks that are different from, and possibly greater than, the risks associated with other portfolio investments. Derivatives may involve the use of highly specialized instruments that require investment techniques and risk analyses different from those associated with other portfolio investments.
12
Certain derivative transactions may give rise to a form of leverage. Leverage magnifies the potential for gain and the risk of loss. Leverage associated with derivative transactions may cause the Fund to liquidate portfolio positions when it may not be advantageous to do so to satisfy its obligations or to meet earmarking or segregation requirements, pursuant to applicable rules and regulations of the Securities and Exchange Commission ("SEC"), or may cause the Fund to be more volatile than if the Fund had not been leveraged. Although the Adviser seeks to use derivatives to further the Fund's investment objective, there is no assurance that the use of derivatives will achieve this result.
The derivative instruments and techniques that the Fund may principally use include:
Futures. A futures contract is a standardized exchange-traded agreement to buy or sell a specific quantity of an underlying instrument at a specific price at a specific future time. The value of a futures contract tends to increase and decrease in tandem with the value of the underlying instrument. Depending on the terms of the particular contract, futures contracts are settled through either physical delivery of the underlying instrument on the settlement date or by payment of a cash settlement amount on the settlement date. A decision as to whether, when and how to use futures involves the exercise of skill and judgment and even a well conceived futures transaction may be unsuccessful because of market behavior or unexpected events. In addition to the derivatives risks discussed above, the prices of futures can be highly volatile, using futures can lower total return, and the potential loss from futures can exceed the Fund's initial investment in such contracts.
Options. If the Fund buys an option, it buys a legal contract giving it the right to buy or sell a specific amount of the underlying instrument or futures contract on the underlying instrument at an agreed-upon price typically in exchange for a premium paid by the Fund. If the Fund sells an option, it sells to another person the right to buy from or sell to the Fund a specific amount of the underlying instrument or futures contract on the underlying instrument at an agreed-upon price typically in exchange for a premium received by the Fund. A decision as to whether, when and how to use options involves the exercise of skill and judgment and even a well conceived option transaction may be unsuccessful because of market behavior or unexpected events. The prices of options can be highly volatile and the use of options can lower total returns.
Swaps. A swap contract is an agreement between two parties pursuant to which the parties exchange payments at specified dates on the basis of a specified notional amount, with the payments calculated by reference to specified securities, indexes, reference rates, currencies or other instruments. Most swap agreements provide that when the period payment dates for both parties are the same, the payments are made on a net basis (i.e., the two payment streams are netted out, with only the net amount paid by one party to the other). The Fund's obligations or rights under a swap contract entered into on a net basis will generally be equal only to the net amount to be paid or received under the agreement, based on the relative values of the positions held by each counterparty. Swap agreements currently are not entered into or traded on exchanges and there is no central clearing or guaranty function for swaps. Therefore, swaps are subject to credit risk or the risk of default or non-performance by the counterparty. Swaps could result in losses if interest rate or foreign currency exchange rates or credit quality changes are not correctly anticipated by the Fund or if the reference index, security or investments do not perform as expected. The Fund's use of swaps may include those based on the credit of an underlying security, commonly referred to as "credit default swaps." Where the Fund is the buyer of a credit default swap contract, it would be entitled to receive the par (or other agreed-upon) value of a referenced debt obligation from the counterparty to the contract only in the event of a default or similar event by a
13
third party on the debt obligation. If no default occurs, the Fund would have paid to the counterparty a periodic stream of payments over the term of the contract and received no benefit from the contract. When the Fund is the seller of a credit default swap contract, it receives the stream of payments but is obligated to pay upon default or similar event of the referenced debt obligation.
Structured Investments. The Fund also may invest a portion of its assets in structured investments. A structured investment is a derivative security designed to offer a return linked to a particular underlying security, currency or market. Structured investments may come in various forms including notes, warrants and options to purchase securities. The Fund will typically use structured investments to gain exposure to a permitted underlying security, currency or market when direct access to a market is limited or inefficient from a tax or cost standpoint. Investments in structured investments involve risks including counterparty risk and market risk. Holders of structured investments bear risks of the underlying investment and are subject to counterparty risk because the Fund is relying on the creditworthiness of such counterparty and has no rights with respect to the issuer of the underlying investment. Certain structured investments may be thinly traded or have a limited trading market and may have the effect of increasing the Fund's illiquidity to the extent that the Fund, at a particular point in time, may be unable to find qualified buyers for these securities.
Other Risks. The performance of the Fund also will depend on whether or not the Adviser is successful in applying the Fund's investment strategies. The Fund is also subject to other risks from its permissible investments, including the risks associated with its investments in investment companies and ETFs and repurchase agreements. For more information about these risks, see the "Additional Risk Information" section.
Additional Risk Information
 This section provides additional information relating to the risks of investing in the Fund.
Investment Companies and ETFs. An investment in an investment company, including ETFs, is subject to the underlying risks of that entity's portfolio securities. For example, if a investment company held common stocks, the Fund would also be exposed to the risk of investing in common stocks. In addition to the Fund's fees and expenses, the Fund would bear its share of the investment company's or ETF's fees and expenses.
Repurchase Agreements. Repurchase agreements are subject to risks associated with the possibility of default by the seller at a time when the collateral has declined in value, or insolvency of the seller, which may affect the Fund's right to control the collateral.
Portfolio Holdings
 A description of the Fund's policies and procedures with respect to the disclosure of the Fund's portfolio securities is available in the Fund's SAI.
14
Fund Management
 The Fund has retained the Adviser—Morgan Stanley Investment Management Inc.—to provide investment advisory services. The Adviser is a wholly-owned subsidiary of Morgan Stanley, a preeminent global financial services firm engaged in securities trading and brokerage activities, as well as providing investment banking, research and analysis, financing and financial advisory services. The Adviser's address is 522 Fifth Avenue, New York, NY 10036.
The Fund is managed by members of the Global Asset Allocation team. The team consists of portfolio managers and analysts. Current members of the team jointly and primarily responsible for the day-to-day management of the Fund's portfolio are Mark A. Bavoso and Cyril Moullé-Berteaux.
Mr. Bavoso has been associated with the Adviser in an investment management capacity since 1986. Mr. Moullé-Berteaux has been associated with the Adviser in an investment management capacity since August 2011. Mr. Moullé-Berteaux was a founding partner and portfolio manager of Traxis Partners LP from March 2003 to July 2011.
Team members collaborate to manage the assets of the Fund.
The Fund's SAI provides additional information about the portfolio managers' compensation structure, other accounts managed by the portfolio managers and the portfolio managers' ownership of securities in the Fund.
The composition of the team may change from time to time.
The Fund pays the Adviser a monthly advisory fee as full compensation for the services and facilities furnished to the Fund, and for Fund expenses assumed by the Adviser. The fee is based on the Fund's average daily net assets. For the fiscal year ended July 31, 2011, the Fund paid total investment advisory compensation amounting to 40% of the Fund's average daily net assets.
A discussion regarding the Board of Trustees' approval of the investment advisory agreement is available in the Fund's annual report to shareholders for the period ended July 31, 2011.
Morgan Stanley Investment
Management Inc.
The Adviser, together with its affiliated asset management companies, had approximately $268.2 billion in assets under management or supervision as of September 30, 2011.
15
Shareholder Information
Pricing Fund Shares
 The price of Fund shares (excluding sales charges), called "net asset value," is based on the value of the Fund's portfolio securities. While the assets of each Class are invested in a single portfolio of securities, the net asset value of each Class will differ because the Classes have different ongoing distribution fees.
The net asset value per share of the Fund is determined once daily at the New York Stock Exchange ("NYSE") close (normally 4:00 pm Eastern time) on each day that the NYSE is open. Shares will not be priced on days that the NYSE is closed.
The value of the Fund's portfolio securities is based on the securities' market price when available. When a market price is not readily available, including circumstances under which the Adviser determines that a security's market price is not accurate, a portfolio security is valued at its fair value, as determined under procedures established by the Fund's Board of Trustees.
In addition, with respect to securities that primarily are listed on foreign exchanges, when an event occurs after the close of such exchanges that is likely to have changed the value of the securities (e.g., a percentage change in value of one or more U.S. securities indices in excess of specified thresholds), such securities will be valued at their fair value, as determined under procedures established by the Fund's Board of Trustees. Securities also may be fair valued in the event of a significant development affecting a country or region or an issuer-specific development which is likely to have changed the value of the security.
In these cases, the Fund's net asset value will reflect certain portfolio securities' fair value rather than their market price. Fair value pricing involves subjective judgment and it is possible that the fair value determined for a security is materially different than the value that could be realized upon the sale of that security. With respect to securities that are primarily listed on foreign exchanges, the value of the Fund's portfolio securities may change on days when you will not be able to purchase or sell your shares.
To the extent the Fund invests in open-end management companies that are registered under the Investment Company Act of 1940, as amended ("Investment Company Act"), the Fund's net asset value is calculated based upon the net asset value of such funds. The prospectuses for such funds explain the circumstances under which they will use fair value pricing and its effects.
An exception to the Fund's general policy of using market prices concerns its short-term debt portfolio securities. Debt securities with remaining maturities of 60 days or less at the time of purchase are valued at amortized cost. However, if the cost does not reflect the securities' market value, these securities will be valued at their fair value.
16
How to Buy Shares
 You may open a new account to buy Fund shares or buy additional Fund shares for an existing account by contacting your Morgan Stanley Smith Barney Financial Advisor or other authorized financial representative. Your Financial Advisor will assist you, step-by-step, with the procedures to invest in the Fund. The Transfer Agent, in its sole discretion, may allow you to purchase shares directly by calling and requesting an application.
To help the government fight the funding of terrorism and money laundering activities, federal law requires all financial institutions to obtain, verify and record information that identifies each person who opens an account. What this means to you: when you open an account, we will ask your name, address, date of birth and other information that will allow us to identify you. If we are unable to verify your identity, we reserve the right to restrict additional transactions and/or liquidate your account at the next calculated net asset value after your account is closed (less any applicable sales/account charges and/or tax penalties) or take any other action required by law. In accordance with federal law requirements, the Fund has implemented an anti-money laundering compliance program, which includes the designation of an anti-money laundering compliance officer.
Because every investor has different immediate financial needs and long-term investment goals, the Fund offers investors six Classes of shares: Classes A, B, C, I, R and W. Class I, R and W shares are only offered to a limited group of investors. Each Class of shares offers a distinct structure of sales charges, distribution and service fees, and other features that are designed to address a variety of needs. Your Morgan Stanley Smith Barney Financial Advisor or other authorized financial representative can help you decide which Class may be most appropriate for you. When purchasing Fund shares, you must specify which Class of shares you wish to purchase.
When you buy Fund shares, the shares are purchased at the next share price calculated (plus any applicable front-end sales charge for Class A shares) after we receive your purchase order. Your payment is due on the third business day after you place your purchase order. We reserve the right to reject any order for the purchase of Fund shares for any reason.
Order Processing Fees. Your financial intermediary may charge processing or other fees in connection with the purchase or sale of the Fund's shares. Please consult your financial representative for more information regarding any such fees.
Contacting a Financial Advisor
If you are new to the Morgan Stanley Funds and would like to contact a Morgan Stanley Smith Barney Financial Advisor, call toll-free 1-866-MORGAN8 for the telephone number of the Morgan Stanley Smith Barney office nearest you. You may also access our office locator on our Internet site at: www.morganstanley.com
17
EasyInvest®
A purchase plan that allows you to transfer money automatically from your checking or savings account or from a Money Market Fund on a semi-monthly, monthly or quarterly basis. Contact your Morgan Stanley Smith Barney Financial Advisor for further information about this service.
Minimum Investment Amounts
| Minimum Investment | |||||||||||
| Investment Options | Initial | Additional | |||||||||
| Regular Account | $ | 1,000 | $ | 100 | |||||||
| Individual Retirement Account | $ | 1,000 | $ | 100 | |||||||
| Coverdell Education Savings Account | $ | 500 | $ | 100 | |||||||
| EasyInvest® (Automatically from your checking or savings account or Money Market Fund) | $ | 100 | * | $ | 100 | * | |||||
* Provided your schedule of investments totals $1,000 in 12 months.
There is no minimum investment amount if you purchase Fund shares through: (1) the Adviser's mutual fund asset allocation program; (2) a program, approved by the Fund's distributor, in which you pay an asset-based fee for advisory, administrative and/or brokerage services; (3) the following programs approved by the Fund's distributor: (i) qualified state tuition plans described in Section 529 of the Code or (ii) certain other investment programs that do not charge an asset-based fee; (4) employer-sponsored employee benefit plan accounts; (5) certain deferred compensation programs established by the Adviser or its affiliates for their employees or the Fund's Trustees; or (6) the reinvestment of dividends in additional Fund shares.
Investment Options for Certain Institutional and Other Investors/Class I, Class R and Class W Shares. To be eligible to purchase Class I, Class R or Class W shares, you must qualify under one of the investor categories specified in the "Share Class Arrangements" section of this Prospectus.
Subsequent Investments Sent Directly to the Fund. In addition to buying additional Fund shares for an existing account by contacting your Morgan Stanley Smith Barney Financial Advisor, you may send a check directly to the Fund. To buy additional shares in this manner:
n Write a "letter of instruction" to the Fund specifying the name(s) on the account, the account number, the social security or tax identification number, the Class of shares you wish to purchase and the investment amount (which would include any applicable front-end sales charge). The letter must be signed by the account owner(s).
n Make out a check for the total amount payable to: Morgan Stanley Global Strategist Fund.
n Mail the letter and check to Morgan Stanley Services Company Inc. at P.O. Box 219885, Kansas City, MO 64121-9885.
How to Exchange Shares
 Permissible Fund Exchanges. You may exchange shares of any Class of the Fund for the same Class of any other continuously offered Multi-Class Fund, or for shares of a Money Market Fund or the Limited Duration U.S. Government Trust, without the imposition of an
18
exchange fee. In addition, Class Q shares of Morgan Stanley Global Infrastructure Fund may be exchanged for Class A shares of the Fund without payment of sales charges (including contingent deferred sales charges ("CDSCs")) or the imposition of an exchange fee. Front-end sales charges are not imposed on exchanges of Class A shares. See the inside back cover of this Prospectus for each Morgan Stanley Fund's designation as a Multi-Class Fund or Money Market Fund. If a Morgan Stanley Fund is not listed, consult the inside back cover of that fund's current prospectus for its designation.
The current prospectus for each Morgan Stanley Fund describes its investment objective(s), policies and investment minimums, and should be read before investment. Since exchanges are available only into continuously offered Morgan Stanley Funds, exchanges are not available into Morgan Stanley Funds, or classes of Morgan Stanley Funds that are not currently being offered for purchase.
Exchange Procedures. You can process an exchange by contacting your Morgan Stanley Smith Barney Financial Advisor or other authorized financial representative. You may also write the Transfer Agent or call toll-free (800) 869-NEWS, our automated telephone system (which is generally accessible 24 hours a day, seven days a week), to place an exchange order. You automatically have the telephone exchange privilege unless you indicate otherwise by checking the applicable box on the new account application form. If you hold share certificates, no exchanges may be processed until we have received all applicable share certificates.
Exchange requests received on a business day prior to the time shares of the funds involved in the request are priced will be processed on the date of receipt. "Processing" a request means that shares of the fund which you are exchanging will be redeemed at the net asset value per share next determined on the date of receipt. Shares of the fund that you are purchasing will also normally be purchased at the net asset value per share, plus any applicable sales charge, next determined on the date of receipt. Exchange requests received on a business day after the time that shares of the funds involved in the request are priced will be processed on the next business day in the manner described herein.
The Fund may terminate or revise the exchange privilege upon required notice or in certain cases without notice. See "Limitations on Exchanges." The check writing privilege is not available for Money Market Fund shares you acquire in an exchange.
Telephone Exchanges. Morgan Stanley and its subsidiaries, including the Transfer Agent, and the Fund employ procedures considered by them to be reasonable to confirm that instructions communicated by telephone are genuine. Such procedures may include requiring certain personal identification information prior to acting upon telephone instructions, tape-recording telephone communications and providing written confirmation of instructions communicated by telephone. If reasonable procedures are employed, none of Morgan Stanley, the Transfer Agent or the Fund will be liable for following telephone instructions which it reasonably believes to be genuine. Telephone exchanges may not be available if you cannot reach the Transfer Agent by telephone, whether because all telephone lines are busy or for any other reason; in such case, a shareholder would have to use the Fund's other exchange procedures described in this section.
19
Telephone instructions will be accepted if received by the Transfer Agent between 9:00 a.m. and 4:00 p.m. Eastern time on any day the NYSE is open for business. During periods of drastic economic or market changes, it is possible that the telephone exchange procedures may be difficult to implement, although this has not been the case with the Fund in the past.
Margin Accounts. If you have pledged your Fund shares in a margin account, contact your Morgan Stanley Smith Barney Financial Advisor or other authorized financial representative regarding restrictions on the exchange of such shares.
Tax Considerations of Exchanges. If you exchange shares of the Fund for shares of another Morgan Stanley Fund, there are important tax considerations. For tax purposes, the exchange out of the Fund is considered a sale of Fund shares and the exchange into the other fund is considered a purchase. As a result, you may realize a capital gain or loss.
You should review the "Tax Consequences" section and consult your own tax professional about the tax consequences of an exchange.
Limitations on Exchanges. Certain patterns of past exchanges and/or purchase or sale transactions involving the Fund or other Morgan Stanley Funds may result in the Fund rejecting, limiting or prohibiting, at its sole discretion, and without prior notice, additional purchases and/or exchanges and may result in a shareholder's account being closed. Determinations in this regard may be made based on the frequency or dollar amount of the previous exchanges or purchase or sale transactions. The Fund reserves the right to reject an exchange request for any reason.
CDSC Calculations on Exchanges. See the "Share Class Arrangements" section of this Prospectus for a discussion of how applicable CDSCs are calculated for shares of one Morgan Stanley Fund that are exchanged for shares of another.
For further information regarding exchange privileges, you should contact your Morgan Stanley Smith Barney Financial Advisor or call toll-free (800) 869-NEWS.
How to Sell Shares
 You can sell some or all of your Fund shares at any time. If you sell Class A, Class B or Class C shares, your net sale proceeds are reduced by the amount of any applicable CDSC. Your shares will be sold at the next price calculated after we receive your order to sell as described below.
| Options | Procedures | ||||||
| Contact your Financial Advisor | To sell your shares, simply call your Morgan Stanley Smith Barney Financial Advisor or other authorized financial representative. Payment will be sent to the address to which the account is registered or deposited in your brokerage account. | ||||||
20
| Options | Procedures | ||||||
| By Telephone | You can sell your shares by telephone and have the proceeds sent to the address of record or your bank account on record. You automatically have the telephone redemption privilege unless you indicate otherwise by checking the applicable box on the new account application form. Before processing a telephone redemption, keep the following information in mind: n You can establish this option at the time you open the account by completing the Morgan Stanley Funds New Account Application or subsequently by calling toll-free (800) 869-NEWS. n Call toll-free (800) 869-NEWS to process a telephone redemption using our automated telephone system which is generally accessible 24 hours a day, seven days a week. n Your request must be received prior to market close, generally 4:00 p.m. Eastern time. n If your account has multiple owners, the Transfer Agent may rely on the instructions of any one owner. n Proceeds must be made payable to the name(s) and address in which the account is registered. n You may redeem amounts of $50,000 or less daily if the proceeds are to be paid by check or by Automated Clearing House. n This privilege is not available if the address on your account has changed within 15 calendar days prior to your telephone redemption request. n Telephone redemption is available for most accounts other than accounts with shares represented by certificates. If you request to sell shares that were recently purchased by check, the proceeds of that sale may not be sent to you until it has been verified that the check has cleared, which may take up to 15 calendar days from the date of purchase. Morgan Stanley and its subsidiaries, including the Transfer Agent, employ procedures considered by them to be reasonable to confirm that instructions communicated by telephone are genuine. Such procedures may include requiring certain personal identification information prior to acting upon telephone instructions, tape-recording telephone communications and providing written confirmation of instructions communicated by telephone. If reasonable procedures are employed, neither Morgan Stanley nor the Transfer Agent will be liable for following telephone instructions which it reasonably believes to be genuine. Telephone redemptions may not be available if a shareholder cannot reach the Transfer Agent by telephone, whether because all telephone lines are busy or for any other reason; in such case, a shareholder would have to use the Fund's other redemption procedures described in this section. | ||||||
21
| Options | Procedures | ||||||
| By Letter | You can also sell your shares by writing a "letter of instruction" that includes: n your account number; n the name of the Fund; n the dollar amount or the number of shares you wish to sell; n the Class of shares you wish to sell; and n the signature of each owner as it appears on the account. If you are requesting payment to anyone other than the registered owner(s) or that payment be sent to any address other than the address of the registered owner(s) or pre-designated bank account, you will need a signature guarantee. You can obtain a signature guarantee from an eligible guarantor acceptable to the Transfer Agent. (You should contact the Transfer Agent toll-free at (800) 869-NEWS for a determination as to whether a particular institution is an eligible guarantor.) A notary public cannot provide a signature guarantee. Additional documentation may be required for shares held by a corporation, partnership, trustee or executor. Mail the letter to Morgan Stanley Services Company Inc. at P.O. Box 219886, Kansas City, MO 64121-9886. If you hold share certificates, you must return the certificates, along with the letter and any required additional documentation. A check will be mailed to the name(s) and address in which the account is registered, or otherwise according to your instructions. | ||||||
| Systematic Withdrawal Plan | If your investment in all of the Morgan Stanley Funds has a total market value of at least $10,000, you may elect to withdraw amounts of $25 or more, or in any whole percentage of a fund's balance (provided the amount is at least $25), on a monthly, quarterly, semi-annual or annual basis, from any fund with a balance of at least $1,000. Each time you add a fund to the plan, you must meet the plan requirements. Amounts withdrawn are subject to any applicable CDSC. A CDSC may be waived under certain circumstances. See the Class B waiver categories listed in the "Share Class Arrangements" section of this Prospectus. To sign up for the systematic withdrawal plan, contact your Morgan Stanley Smith Barney Financial Advisor or call toll-free (800) 869-NEWS. You may terminate or suspend your plan at any time. Please remember that withdrawals from the plan are sales of shares, not Fund "distributions," and ultimately may exhaust your account balance. The Fund may terminate or revise the plan at any time. | ||||||
Payment for Sold Shares. After we receive your complete instructions to sell, as described above, a check will be mailed to you within seven days, although we will attempt to make payment within one business day. Payment may also be sent to your brokerage account.
Payment may be postponed or the right to sell your shares suspended under unusual circumstances. If you request to sell shares that were recently purchased by check, the proceeds of the sale may not be sent to you until it has been verified that the check has cleared, which may take up to 15 calendar days from the date of purchase.
22
Payments-in-Kind. If we determine that it is in the best interest of the Fund not to pay redemption proceeds in cash, we may pay you partly or entirely by distributing to you securities held by the Fund. Such in-kind securities may be illiquid and difficult or impossible for a shareholder to sell at a time and at a price that a shareholder would like. Redemptions paid in such securities generally will give rise to income, gain or loss for income tax purposes in the same manner as redemptions paid in cash. In addition, you may incur brokerage costs and a further gain or loss for income tax purposes when you ultimately sell the securities.
Order Processing Fees. Your financial intermediary may charge processing or other fees in connection with the purchase or sale of the Fund's shares. Please consult your financial representative for more information regarding any such fees.
Tax Considerations. Normally, your sale of Fund shares is subject to federal and state income tax. You should review the "Tax Consequences" section of this Prospectus and consult your own tax professional about the tax consequences of a sale.
Reinstatement Privilege. If you sell Fund shares and have not previously exercised the reinstatement privilege, you may, within 35 days after the date of sale, invest any portion of the proceeds in the same Class of Fund shares at their net asset value and receive a pro rata credit for any CDSC paid in connection with the sale.
Involuntary Sales. The Fund reserves the right, on 60 days' notice, to sell the shares of any shareholder (other than shares held in an individual retirement account ("IRA") or 403(b) Custodial Account) whose shares, due to sales by the shareholder, have a value below $100, or in the case of an account opened through EasyInvest®, if after 12 months the shareholder has invested less than $1,000 in the account.
However, before the Fund sells your shares in this manner, we will notify you and allow you 60 days to make an additional investment in an amount that will increase the value of your account to at least the required amount before the sale is processed. No CDSC will be imposed on any involuntary sale.
Margin Accounts. If you have pledged your Fund shares in a margin account, contact your Morgan Stanley Smith Barney Financial Advisor or other authorized financial representative regarding restrictions on the sale of such shares.
Targeted
DividendsSM
You may select to have your Fund distributions automatically invested in other Classes of Fund shares or Classes of another Morgan Stanley Fund that you own. Contact your Morgan Stanley Smith Barney Financial Advisor for further information about this service.
Distributions
 The Fund passes substantially all of its earnings from income and capital gains along to its investors as "distributions." The Fund earns income from stocks and interest from fixed-income investments. These amounts are passed along to Fund shareholders as "income dividend distributions." The Fund realizes capital gains whenever it sells securities for a higher price than it paid for them. These amounts may be passed along as "capital gain distributions."
23
The Fund declares income dividends separately for each Class. Distributions paid on Class A, Class I, Class R and Class W shares usually will be higher than for Class B and Class C shares because distribution fees that Class B and Class C shares pay are higher. Normally, income dividends are distributed to shareholders annually. Capital gains, if any, are usually distributed in December. The Fund, however, may retain and reinvest any long-term capital gains. The Fund may at times make payments from sources other than income or capital gains that represent a return of a portion of your investment. These payments would not be taxable to you as a shareholder, but would have the effect of reducing your basis in the Fund.
Distributions are reinvested automatically in additional shares of the same Class and automatically credited to your account, unless you request in writing that all distributions be paid in cash. If you elect the cash option, the Fund will mail a check to you no later than seven business days after the distribution is declared. However, if you purchase Fund shares through a Morgan Stanley Smith Barney Financial Advisor or other authorized financial representative within three business days prior to the record date for the distribution, the distribution will automatically be paid to you in cash, even if you did not request to receive all distributions in cash. No interest will accrue on uncashed checks. If you wish to change how your distributions are paid, your request should be received by the Transfer Agent at least five business days prior to the record date of the distributions.
Frequent Purchases and Redemptions of Fund Shares
 Frequent purchases and redemptions of Fund shares by Fund shareholders are referred to as "market-timing" or "short-term trading" and may present risks for other shareholders of the Fund, which may include, among other things, dilution in the value of Fund shares held by long-term shareholders, interference with the efficient management of the Fund's portfolio, increased brokerage and administrative costs, incurring unwanted taxable gains and forcing the Fund to hold excess levels of cash.
In addition, the Fund is subject to the risk that market-timers and/or short-term traders may take advantage of time zone differences between the foreign markets on which the Fund's portfolio securities trade and the time the Fund's net asset value is calculated ("time-zone arbitrage"). For example, a market-timer may purchase shares of the Fund based on events occurring after foreign market closing prices are established, but before the Fund's net asset value calculation, that are likely to result in higher prices in foreign markets the following day. The market-timer would redeem the Fund's shares the next day when the Fund's share price would reflect the increased prices in foreign markets, for a quick profit at the expense of long-term Fund shareholders.
Investments in other types of securities also may be susceptible to short-term trading strategies. These investments include securities that are, among other things, thinly traded, traded infrequently or relatively illiquid, which have the risk that the current market price for the securities may not accurately reflect current market values. A shareholder may seek to engage in short-term trading to take advantage of these pricing differences (referred to as "price arbitrage"). Investments in certain fixed-income securities may be adversely affected by price arbitrage trading strategies.
The Fund's policies with respect to valuing portfolio securities are described in "Shareholder Information—Pricing Fund Shares."
24
The Fund discourages and does not accommodate frequent purchases and redemptions of Fund shares by Fund shareholders and the Fund's Board of Trustees has adopted policies and procedures with respect to such frequent purchases and redemptions. The Fund's policies with respect to purchases, redemptions and exchanges of Fund shares are described in the "How to Buy Shares," "How to Exchange Shares" and "How to Sell Shares" sections of this Prospectus. Except as described in each of these sections, and with respect to trades that occur through omnibus accounts at intermediaries, as described below, the Fund's policies regarding frequent trading of Fund shares are applied uniformly to all shareholders. With respect to trades that occur through omnibus accounts at intermediaries, such as investment managers, broker-dealers, transfer agents and third party administrators, the Fund (i) has requested assurance that such intermediaries currently selling Fund shares have in place internal policies and procedures reasonably designed to address market-timing concerns and has instructed such intermediaries to notify the Fund immediately if they are unable to comply with such policies and procedures, and (ii) requires all prospective intermediaries to agree to cooperate in enforcing the Fund's policies with respect to frequent purchases, redemptions and exchanges of Fund shares.
Omnibus accounts generally do not identify customers' trading activity to the Fund on an individual ongoing basis. Therefore, with respect to trades that occur through omnibus accounts at financial intermediaries, to some extent, the Fund relies on the financial intermediary to monitor frequent short-term trading within the Fund by the financial intermediary's customers. However, the Fund or the distributor has entered into agreements with financial intermediaries whereby intermediaries are required to provide certain customer identification and transaction information upon the Fund's request. The Fund may use this information to help identify and prevent market-timing activity in the Fund. There can be no assurance that the Fund will be able to identify or prevent all market-timing activities.
Tax Consequences
 As with any investment, you should consider how your Fund investment will be taxed. The tax information in this Prospectus is provided as general information. You should consult your own tax professional about the tax consequences of an investment in the Fund.
Unless your investment in the Fund is through a tax-deferred retirement account, such as a 401(k) plan or IRA, you need to be aware of the possible tax consequences when:
n The Fund makes distributions; and
n You sell Fund shares, including an exchange to another Morgan Stanley Fund.
Taxes on Distributions. Your distributions are normally subject to federal and state income tax when they are paid, whether you take them in cash or reinvest them in Fund shares. A distribution also may be subject to local income tax. Any income dividend distributions and any short-term capital gain distributions are taxable to you as ordinary income. Any long-term capital gain distributions are taxable as long-term capital gains, no matter how long you have owned shares in the Fund.
Under current law (through 2012), if certain holding period requirements are met with respect to your shares, a portion of the income dividends you receive may be taxed at the same rate as long-term capital gains. However, even if income received in the form of income dividends is taxed at the same rate as long-term capital gains, such income will not be considered long-term capital gains for other federal income tax purposes. For example, you generally will not be
25
permitted to offset income dividends with capital losses. Short-term capital gain distributions will continue to be taxed at ordinary income rates.
If more than 50% of the Fund's assets are invested in foreign securities at the end of any fiscal year, the Fund may elect to permit shareholders to take a credit or deduction on their federal income tax return for foreign taxes paid by the Fund.
You will be sent a statement (IRS Form 1099-DIV) by February of each year showing the taxable distributions paid to you in the previous year. The statement provides information on your dividends and any capital gains for tax purposes.
Taxes on Sales. Your sale of Fund shares normally is subject to federal and state income tax and may result in a taxable gain or loss to you. A sale also may be subject to local income tax. Your exchange of Fund shares for shares of another Morgan Stanley Fund is treated for tax purposes like a sale of your original shares and a purchase of your new shares. Thus, the exchange may, like a sale, result in a taxable gain or loss to you and will give you a new tax basis for your new shares.
Due to recent legislation, the Fund (or its administrative agent) is required to report to the Internal Revenue Service and furnish to Fund shareholders the cost basis information for sale transactions of shares purchased on or after January 1, 2012. Shareholders may elect to have one of several cost basis methods applied to their account when calculating the cost basis of shares sold, including average cost, FIFO, or some other specific identification method. Unless you instruct otherwise, the Fund will use average cost as its default cost basis method, and will treat sales as first coming from shares purchased prior to January 1, 2012. If average cost is used for the first sale of Fund shares covered by these new rules, the shareholder may only use an alternative cost basis method for shares purchased prospectively. Fund shareholders should consult with their tax advisors to determine the best cost basis method for their tax situation.
When you open your Fund account, you should provide your social security or tax identification number on your investment application. By providing this information, you will avoid being subject to federal backup withholding tax on taxable distributions and redemption proceeds (as of the date of this Prospectus this rate is 28% and is scheduled to increase to 31% after 2012). Any withheld amount would be sent to the IRS as an advance payment of your taxes due on your income.
Share Class Arrangements
 The Fund offers several Classes of shares having different distribution arrangements designed to provide you with different purchase options according to your investment needs. Your Morgan Stanley Smith Barney Financial Advisor or other authorized financial representative can help you decide which Class may be appropriate for you.
The general public is offered three Classes: Class A shares, Class B shares and Class C shares, which differ principally in terms of sales charges and ongoing expenses. Class I, Class R and Class W shares are offered only to limited categories of investors. Shares that you acquire through reinvested distributions will not be subject to any front-end sales charge or CDSC.
Sales personnel may receive different compensation for selling each Class of shares. The sales charges applicable to each Class provide for the distribution financing of shares of that Class.
26
The chart below compares the sales charge and annual 12b-1 fee applicable to each Class:
| Class | Sales Charge | Maximum Annual 12b-1 Fee | |||||||||
| A | Maximum 5.25% initial sales charge reduced for purchases of $25,000 or more; shares purchased without an initial sales charge are generally subject to a 1.00% CDSC if sold during the first 18 months | 0.25 | % | ||||||||
| B | Maximum 5.00% CDSC during the first year decreasing to 0% after six years | 1.00 | % | ||||||||
| C | 1.00% CDSC during the first year | 1.00 | % | ||||||||
| I | None | None | |||||||||
| R | None | 0.50 | % | ||||||||
| W | None | 0.35 | % | ||||||||
While Class B, Class C, Class R and Class W shares do not have any front-end sales charges, their higher ongoing annual expenses (due to higher 12b-1 fees) mean that over time you could end up paying more for these shares than if you were to pay front-end sales charges for Class A shares.
Certain shareholders may be eligible for reduced sales charges (i.e., breakpoint discounts), CDSC waivers and eligibility minimums. Please see the information for each Class set forth below for specific eligibility requirements. You must notify your Morgan Stanley Smith Barney Financial Advisor or other authorized financial representative (or the Transfer Agent if you purchase shares directly through the Fund) at the time a purchase order (or in the case of Class B or Class C shares, a redemption order) is placed, that the purchase (or redemption) qualifies for a reduced sales charge (i.e., breakpoint discount), CDSC waiver or eligibility minimum. Similar notification must be made in writing when an order is placed by mail. The reduced sales charge, CDSC waiver or eligibility minimum will not be granted if: (i) notification is not furnished at the time of order; or (ii) a review of the records of Morgan Stanley Smith Barney, Morgan Stanley & Co. LLC ("Morgan Stanley & Co.") or other authorized dealer of Fund shares, or the Transfer Agent does not confirm your represented holdings.
In order to obtain a reduced sales charge (i.e., breakpoint discount) or to meet an eligibility minimum, it may be necessary at the time of purchase for you to inform your Morgan Stanley Smith Barney Financial Advisor or other authorized financial representative (or the Transfer Agent if you purchase shares directly through the Fund) of the existence of other accounts in which there are holdings eligible to be aggregated to meet the sales load breakpoints or eligibility minimums. In order to verify your eligibility, you may be required to provide account statements and/or confirmations regarding shares of the Fund or other Morgan Stanley Funds held in all related accounts described below at Morgan Stanley Smith Barney, Morgan Stanley & Co. or by other authorized dealers, as well as shares held by related parties, such as members of the same family or household, in order to determine whether you have met a sales load breakpoint or eligibility minimum. The Fund makes available, in a clear and prominent format, free of charge, on its web site, www.morganstanley.com, information regarding applicable sales loads, reduced sales charges (i.e., breakpoint discounts), sales load waivers and eligibility minimums. The web site includes hyperlinks that facilitate access to the information.
27
CLASS A SHARES Class A shares are sold at net asset value plus an initial sales charge of up to 5.25% of the public offering price. The initial sales charge is reduced for purchases of $25,000 or more according to the schedule below. Investments of $1 million or more are not subject to an initial sales charge, but are generally subject to a CDSC of 1.00% on sales made within 18 months after the last day of the month of purchase. The CDSC will be assessed in the same manner and with the same CDSC waivers as with Class B shares. In addition, the CDSC on Class A shares will be waived in connection with sales of Class A shares for which no commission or transaction fee was paid by the distributor to authorized dealers at the time of purchase of such shares. Class A shares are also subject to a distribution and shareholder services (12b-1) fee of up to 0.25% of the average daily net assets of the Class. The maximum annual 12b-1 fee payable by Class A shares is lower than the maximum annual 12b-1 fee payable by Class B, Class C, Class R or Class W shares.
The offering price of Class A shares includes a sales charge (expressed as a percentage of the public offering price) on a single transaction as shown in the following table:
Front-End Sales Charge or FSC
An initial sales charge you pay when purchasing Class A shares that is based on a percentage of the offering price. The percentage declines based upon the dollar value of Class A shares you purchase. We offer three ways to reduce your Class A sales charges—the Combined Purchase Privilege, Right of Accumulation and Letter of Intent.
| Front-End Sales Charge | |||||||||||
| Amount of Single Transaction | Percentage of Public Offering Price | Approximate Percentage of Net Amount Invested | |||||||||
| Less than $25,000 | 5.25 | % | 5.54 | % | |||||||
| $25,000 but less than $50,000 | 4.75 | % | 4.99 | % | |||||||
| $50,000 but less than $100,000 | 4.00 | % | 4.17 | % | |||||||
| $100,000 but less than $250,000 | 3.00 | % | 3.09 | % | |||||||
| $250,000 but less than $500,000 | 2.50 | % | 2.56 | % | |||||||
| $500,000 but less than $1 million | 2.00 | % | 2.04 | % | |||||||
| $1 million and over | 0.00 | % | 0.00 | % | |||||||
You may benefit from a reduced sales charge schedule (i.e., breakpoint discount) for purchases of Class A shares of the Fund by combining, in a single transaction, your purchase with purchases of Class A shares of the Fund by the following related accounts:
n A single account (including an individual, trust or fiduciary account).
n A family member account (limited to spouse, and children under the age of 21).
n Pension, profit sharing or other employee benefit plans of companies and their affiliates.
n Employer sponsored and individual retirement accounts (including IRAs, Keogh, 401(k), 403(b), 408(k) and 457(b) Plans).
n Tax-exempt organizations.
n Groups organized for a purpose other than to buy mutual fund shares.
Combined Purchase Privilege. You will have the benefit of reduced sales charges by combining purchases of Class A shares of the Fund for any related account in a single transaction with purchases
28
of any class of shares of other Morgan Stanley Multi-Class Funds for the related account or any other related account. For the purpose of this combined purchase privilege, a "related account" is:
n A single account (including an individual account, a joint account and a trust account established solely for the benefit of the individual).
n A family member account (limited to spouse, and children under the age of 21, but including trust accounts established solely for the benefit of a spouse, or children under the age of 21).
n An IRA and single participant retirement account (such as a Keogh).
n An UGMA/UTMA account.
Right of Accumulation. You may benefit from a reduced sales charge if the cumulative net asset value of Class A shares of the Fund purchased in a single transaction, together with the net asset value of all classes of shares of Morgan Stanley Multi-Class Funds (including shares of Morgan Stanley Non-Multi-Class Funds which resulted from an exchange from Morgan Stanley Multi-Class Funds) held in related accounts, amounts to $25,000 or more. For the purposes of the right of accumulation privilege, a related account is any one of the accounts listed under "Combined Purchase Privilege" above.
Notification. You must notify your Morgan Stanley Smith Barney Financial Advisor or other authorized financial representative (or the Transfer Agent if you purchase shares directly through the Fund) at the time a purchase order is placed, that the purchase qualifies for a reduced sales charge under any of the privileges discussed above. Similar notification must be made in writing when an order is placed by mail. The reduced sales charge will not be granted if: (i) notification is not furnished at the time of the order; or (ii) a review of the records of Morgan Stanley Smith Barney or other authorized dealer of Fund shares or the Transfer Agent does not confirm your represented holdings.
In order to obtain a reduced sales charge under any of the privileges discussed above, it may be necessary at the time of purchase for you to inform your Morgan Stanley Smith Barney Financial Advisor or other authorized financial representative (or the Transfer Agent if you purchase shares directly through the Fund) of the existence of other accounts in which there are holdings eligible to be aggregated to meet the sales load breakpoint and/or right of accumulation threshold. In order to verify your eligibility, you may be required to provide account statements and/or confirmations regarding shares of the Fund or other Morgan Stanley Funds held in all related accounts described above at Morgan Stanley Smith Barney or by other authorized dealers, as well as shares held by related parties, such as members of the same family or household, in order to determine whether you have met the sales load breakpoint and/or right of accumulation threshold. The Fund makes available, in a clear and prominent format, free of charge, on its web site, www.morganstanley.com, information regarding applicable sales loads and reduced sales charges (i.e., breakpoint discounts). The web site includes hyperlinks that facilitate access to the information.
Letter of Intent. The above schedule of reduced sales charges for larger purchases also will be available to you if you enter into a written "Letter of Intent." A Letter of Intent provides for the purchase of Class A shares of the Fund or other Multi-Class Funds within a 13-month period. The initial purchase under a Letter of Intent must be at least 5% of the stated investment goal. The Letter of Intent does not preclude the Fund (or any other Multi-Class Fund) from discontinuing sales of its shares. To determine the applicable sales charge reduction, you may also include: (1) the cost of shares of other Morgan Stanley Funds which were previously purchased at a price including a front-end sales charge during the 90-day period prior to the distributor receiving the Letter of Intent, and (2) the historical cost of shares of
29
other funds you currently own acquired in exchange for shares of funds purchased during that period at a price including a front-end sales charge. You may combine purchases and exchanges by family members (limited to spouse, and children under the age of 21) during the periods referenced in (1) and (2) above. You should retain any records necessary to substantiate historical costs because the Fund, the Transfer Agent and any financial intermediaries may not maintain this information. You can obtain a Letter of Intent by contacting your Morgan Stanley Smith Barney Financial Advisor or other authorized financial representative, or by calling toll-free (800) 869-NEWS. If you do not achieve the stated investment goal within the 13-month period, you are required to pay the difference between the sales charges otherwise applicable and sales charges actually paid, which may be deducted from your investment. Shares acquired through reinvestment of distributions are not aggregated to achieve the stated investment goal.
Other Sales Charge Waivers. In addition to investments of $1 million or more, your purchase of Class A shares is not subject to a front-end sales charge (or a CDSC upon sale) if your account qualifies under one of the following categories:
n A trust for which a banking affiliate of the Adviser provides discretionary trustee services.
n Persons participating in a fee-based investment program (subject to all of its terms and conditions, including termination fees, and mandatory sale or transfer restrictions on termination) approved by the Fund's distributor, pursuant to which they pay an asset-based fee for investment advisory, administrative and/or brokerage services.
n Qualified state tuition plans described in Section 529 of the Code and donor-advised charitable gift funds (subject to all applicable terms and conditions) and certain other investment programs that do not charge an asset-based fee and have been approved by the Fund's distributor.
n Employer-sponsored employee benefit plans, whether or not qualified under the Code, for which an entity independent from Morgan Stanley serves as recordkeeper under an alliance or similar agreement with Morgan Stanley's Retirement Plan Solutions ("Morgan Stanley Eligible Plans").
n A Morgan Stanley Eligible Plan whose Class B shares have converted to Class A shares, regardless of the plan's asset size or number of eligible employees.
n Insurance company separate accounts that have been approved by the Fund's distributor.
n Current or retired Directors or Trustees of the Morgan Stanley Funds, such persons' spouses, and children under the age of 21, and trust accounts for which any of such persons is a beneficiary.
n Current or retired directors, officers and employees of Morgan Stanley and any of its subsidiaries, such persons' spouses, and children under the age of 21, and trust accounts for which any of such persons is a beneficiary.
30
CLASS B SHARES Class B shares are offered at net asset value with no initial sales charge but are subject to a CDSC, as set forth in the table below. For the purpose of calculating the CDSC, shares are deemed to have been purchased on the last day of the month during which they were purchased.
| Year Since Purchase Payment Made | CDSC as a Percentage of Amount Redeemed | ||||||
| First | 5.0 | % | |||||
| Second | 4.0 | % | |||||
| Third | 3.0 | % | |||||
| Fourth | 2.0 | % | |||||
| Fifth | 2.0 | % | |||||
| Sixth | 1.0 | % | |||||
| Seventh and thereafter | None | ||||||
The CDSC is assessed on an amount equal to the lesser of the then market value of the shares or the historical cost of the shares (which is the amount actually paid for the shares at the time of original purchase) being redeemed. Accordingly, no sales charge is imposed on increases in net asset value above the initial purchase price. In determining whether a CDSC applies to a redemption, it is assumed that the shares being redeemed first are any shares in the shareholder's Fund account that are not subject to a CDSC, followed by shares held the longest in the shareholder's account.
Broker-dealers or other financial intermediaries may impose a limit on the dollar value of a Class B share purchase order that they will accept. You should discuss with your financial advisor which share class is most appropriate for you, based on the size of your investment, your expected time horizon for holding the shares and other factors, bearing in mind the availability of reduced sales loads on Class A share purchases of $25,000 or more and for existing shareholders who hold over $25,000 in Morgan Stanley Funds.
CDSC Waivers. A CDSC, if otherwise applicable, will be waived in the case of:
n Sales of shares held at the time you die or become disabled (within the definition in Section 72(m)(7) of the Code, which relates to the ability to engage in gainful employment), if the shares are: (i) registered either in your individual name or in the names of you and your spouse as joint tenants with right of survivorship; (ii) registered in the name of a trust of which (a) you are the settlor and that is revocable by you (i.e., a "living trust") or (b) you and your spouse are the settlors and that is revocable by you or your spouse (i.e., a "joint living trust"); or (iii) held in a qualified corporate or self-employed retirement plan, IRA or 403(b) Custodial Account; provided in each case that the sale is requested within one year after your death or initial determination of disability.
n Sales in connection with the following retirement plan "distributions": (i) lump-sum or other distributions from a qualified corporate or self-employed retirement plan following retirement (or, in the case of a "key employee" of a "top heavy" plan, following attainment of age 59 1/2);
Contingent Deferred Sales Charge or CDSC
A fee you pay when you sell shares of certain Morgan Stanley Funds purchased without an initial sales charge. This fee declines the longer you hold your shares as set forth in the table.
31
(ii) required minimum distributions and certain other distributions (such as those following attainment of age 59 1/2) from an IRA or 403(b) Custodial Account; or (iii) a tax-free return of an excess IRA contribution (a "distribution" does not include a direct transfer of IRA, 403(b) Custodial Account or retirement plan assets to a successor custodian or trustee).
n Sales of shares in connection with the systematic withdrawal plan of up to 12% annually of the value of each fund from which plan sales are made. The percentage is determined on the date you establish the systematic withdrawal plan and based on the next calculated share price. You may have this CDSC waiver applied in amounts up to 1% per month, 3% per quarter, 6% semi-annually or 12% annually. Shares with no CDSC will be sold first, followed by those with the lowest CDSC. As such, the waiver benefit will be reduced by the amount of your shares that are not subject to a CDSC. If you suspend your participation in the plan, you may later resume plan payments without requiring a new determination of the account value for the 12% CDSC waiver.
The Fund's distributor may require confirmation of your entitlement before granting a CDSC waiver. If you believe you are eligible for a CDSC waiver, please contact your Morgan Stanley Smith Barney Financial Advisor or other authorized financial representative or call toll-free (800) 869-NEWS.
Distribution Fee. Class B shares are subject to an annual distribution and shareholder services (12b-1) fee of up to 1.00% of the average daily net assets of Class B shares. The maximum annual 12b-1 fee payable by Class B shares is higher than the maximum annual 12b-1 fee payable by Class A, Class R and Class W shares.
Conversion Feature. After eight years, Class B shares generally will convert automatically to Class A shares of the Fund with no initial sales charge. The eight-year period runs from the last day of the month in which the shares were purchased or, in the case of Class B shares acquired through an exchange, from the last day of the month in which the original Class B shares were purchased; the shares will convert to Class A shares based on their relative net asset values in the month following the eight-year period. At the same time, an equal proportion of Class B shares acquired through automatically reinvested distributions will convert to Class A shares on the same basis. This conversion will be suspended during any period in which the expense ratio of the Class B shares of the Fund is lower than the expense ratio of the Class A shares of the Fund.
In the case of Class B shares held in a Morgan Stanley Eligible Plan, the plan is treated as a single investor and all Class B shares will convert to Class A shares on the conversion date of the Class B shares of a Morgan Stanley Fund purchased by that plan.
If you exchange your Class B shares for shares of a Money Market Fund or the Limited Duration U.S. Government Trust, the holding period for conversion is frozen as of the last day of the month of the exchange and resumes on the last day of the month you exchange back into Class B shares.
Exchanging Shares Subject to a CDSC. There are special considerations when you exchange Fund shares that are subject to a CDSC. When determining the length of time you held the shares and the corresponding CDSC rate, any period (starting at the end of the month) during which you held shares of a fund that does not charge a CDSC will
32
not be counted. Thus, in effect the "holding period" for purposes of calculating the CDSC is frozen upon exchanging into a fund that does not charge a CDSC.
For example, if you held Class B shares of the Fund for one year, exchanged to Class B of another Morgan Stanley Multi-Class Fund for another year, then sold your shares, a CDSC rate of 4% would be imposed on the shares based on a two year holding period—one year for each fund. However, if you had exchanged the shares of the Fund for a Money Market Fund (which does not charge a CDSC) instead of the Multi-Class Fund, then sold your shares, a CDSC rate of 5% would be imposed on the shares based on a one-year holding period. The one year in the Money Market Fund would not be counted. Nevertheless, if shares subject to a CDSC are exchanged for a fund that does not charge a CDSC, you will receive a credit when you sell the shares equal to the 12b-1 fees, if any, you paid on those shares while in that fund up to the amount of any applicable CDSC.
CLASS C SHARES Class C shares are sold at net asset value with no initial sales charge, but are subject to a CDSC of 1.00% on sales made within one year after the last day of the month of purchase. The CDSC will be assessed in the same manner and with the same CDSC waivers as with Class B shares.
Brokers, dealers or other financial intermediaries may impose a limit on the dollar value of a Class C share purchase order that they will accept. For example, a Morgan Stanley Smith Barney Financial Advisor generally will not accept purchase orders for Class C shares that in the aggregate amount to $250,000 or more. You should discuss with your financial advisor which share class is most appropriate for you based on the size of your investment, your expected time horizon for holding the shares and other factors, bearing in mind the availability of reduced sales loads on Class A share purchases of $25,000 or more and for existing shareholders who hold over $25,000 in Morgan Stanley Funds.
Distribution Fee. Class C shares are subject to an annual distribution and shareholder services (12b-1) fee of up to 1.00% of the average daily net assets of that Class. The maximum annual 12b-1 fee payable by Class C shares is higher than the maximum annual 12b-1 fee payable by Class A shares. Unlike Class B shares, Class C shares have no conversion feature and, accordingly, an investor that purchases Class C shares may be subject to distribution and shareholder services (12b-1) fees applicable to Class C shares for as long as the investor owns such shares.
CLASS I SHARES Class I shares are offered without any sales charge on purchases or sales and without any distribution and shareholder services (12b-1) fee. Class I shares are offered only to investors meeting an initial investment minimum of $5 million ($25 million for Morgan Stanley Eligible Plans) and the following investor categories:
n Investors participating in the Adviser's or an affiliate's mutual fund asset allocation program (subject to all of its terms and conditions, including termination fees, and mandatory sale or transfer restrictions on termination) pursuant to which they pay an asset-based fee.
n Persons participating in a fee-based investment program (subject to all of its terms and conditions, including termination fees, and mandatory sale or transfer restrictions on termination) approved by the Fund's distributor pursuant to which they pay an asset-based fee for investment advisory, administrative and/or brokerage services.
n Certain investment programs that do not charge an asset-based fee and have been approved by the Fund's distributor.
33
n Employee benefit plans maintained by Morgan Stanley or any of its subsidiaries for the benefit of certain employees of Morgan Stanley and its subsidiaries.
n Certain unit investment trusts sponsored by Morgan Stanley & Co. or its affiliates.
n Certain other open-end investment companies whose shares are distributed by the Fund's distributor.
n Investors who were shareholders of the Dean Witter Retirement Series on September 11, 1998 for additional purchases for their former Dean Witter Retirement Series accounts.
n The Adviser and its affiliates with respect to shares held in connection with certain deferred compensation programs established for their employees or the Fund's Trustees.
A purchase order that meets the requirements for investment in Class I shares can be made only in Class I shares.
Class I shares are not offered for investments made through Section 529 plans, donor-advised charitable gift funds and insurance company separate accounts (regardless of the size of the investment).
Meeting Class I Eligibility Minimums. To meet the $5 million ($25 million for Morgan Stanley Eligible Plans) initial investment to qualify to purchase Class I shares you may combine: (1) purchases in a single transaction of Class I shares of the Fund and other Morgan Stanley Multi-Class Funds; and/or (2) previous purchases of Class A and Class I shares of Multi-Class Funds you currently own, along with shares of Morgan Stanley Funds you currently own that you acquired in exchange for those shares. Shareholders cannot combine purchases made by family members or a shareholder's other related accounts in a single transaction for purposes of meeting the $5 million initial investment minimum requirement to qualify to purchase Class I shares.
CLASS R SHARES Class R shares are offered without any sales charge on purchases or sales. Class R shares are subject to an annual distribution and shareholder services (12b-1) fee of up to 0.50% of the average daily net assets of Class R shares. Class R shares are offered only to certain tax-exempt retirement plans (including, 401(k) plans, 457 plans, employee-sponsored 403(b) plans, profit-sharing and money purchase pension plans, defined benefit plans and non-qualified deferred compensation plans) held in plan level or omnibus accounts. Individual retirement plans, such as IRAs, are not eligible to purchase Class R shares. As of the date of this Prospectus, Class R shares have not commenced operations.
CLASS W SHARES Class W shares are offered without any sales charge on purchases or sales. Class W shares are subject to an annual distribution and shareholder services (12b-1) fee of up to 0.35% of the average daily net assets of Class W shares. Class W shares are offered only to investors purchasing through investment programs managed by investment professionals, including discretionary managed account programs approved by the Fund's distributor. As of the date of this Prospectus, Class W shares have not commenced operations.
NO SALES CHARGES FOR REINVESTED CASH DISTRIBUTIONS If you receive a cash payment representing an ordinary dividend or capital gain and you reinvest that amount in the applicable Class of shares by returning the check within 30 days of the payment date, the purchased shares would not be subject to an initial sales charge or CDSC.
34
PLAN OF DISTRIBUTION (RULE 12b-1 FEES) The Fund has adopted a Plan of Distribution in accordance with Rule 12b-1 under the Investment Company Act with respect to the Class A, Class B and Class C shares and has adopted a Plan of Distribution and a Shareholder Services Plan in accordance with Rule 12b-1 under the Investment Company Act with respect to the Class R and Class W shares. (Class I shares are offered without any 12b-1 fee.) The Plans allow the Fund to pay distribution and/or shareholder services fees for these shares. Because these fees are paid out of the Fund's assets on an ongoing basis, over time these fees will increase the cost of your investment and reduce your return in these Classes and may cost you more than paying other types of sales charges.
Additional Information
 The Adviser and/or distributor may pay compensation (out of their own funds and not as an expense of the Fund) to certain affiliated or unaffiliated brokers-dealers or other financial intermediaries or service providers in connection with the sale, distribution, marketing or retention of Fund shares and/or shareholder servicing. Such compensation may be significant in amount and the prospect of receiving any such additional compensation may provide such affiliated or unaffiliated entities with an incentive to favor sales of shares of the Fund over other investment options. Any such payments will not change the net asset value or the price of the Fund's shares. For more information, please see the Fund's SAI.
35
Financial Highlights
The financial highlights table is intended to help you understand the Fund's financial performance for the periods indicated. Certain information reflects financial results for a single Fund share throughout each period. The total returns in the table represent the rate an investor would have earned or lost on an investment in the Fund (assuming reinvestment of all dividends and distributions). The ratio of expenses to average net assets listed in the tables below for each class of shares of the Fund are based on the average net assets of the Fund for each of the periods listed in the tables. To the extent that the Fund's average net assets decrease over the Fund's next fiscal year, such expense ratios can be expected to increase, potentially significantly, because certain fixed costs will be spread over a smaller amount of assets.
The information for the year ended July 31, 2011 has been audited by Ernst & Young LLP, an independent registered public accounting firm, whose report, along with the Fund's financial statements, are incorporated by reference in the SAI from the Fund's annual report, which is available upon request. The financial highlights for each of the years in the four-year period ended July 31, 2010 have been audited by another independent registered public accounting firm.
CLASS A SHARES
| For the Year Ended July 31, | 2011 | 2010^ | 2009^ | 2008^ | 2007^ | ||||||||||||||||||
| Selected Per Share Data: | |||||||||||||||||||||||
| Net asset value, beginning of period | $ | 17.33 | $ | 16.23 | $ | 18.07 | $ | 20.57 | $ | 19.74 | |||||||||||||
| Income (loss) from investment operations: | |||||||||||||||||||||||
| Net investment income(1) | 0.25 | 0.21 | 0.25 | 0.45 | 0.50 | ||||||||||||||||||
| Net realized and unrealized gain (loss) | 1.87 | 1.17 | (1.74 | ) | (1.23 | ) | 2.07 | ||||||||||||||||
| Total income (loss) from investment operations | 2.12 | 1.38 | (1.49 | ) | (0.78 | ) | 2.57 | ||||||||||||||||
| Less dividends and distributions from: | |||||||||||||||||||||||
| Net investment income | (0.12 | ) | (0.28 | ) | (0.30 | ) | (0.49 | ) | (0.51 | ) | |||||||||||||
| Net realized gain | (2.62 | ) | — | (0.05 | ) | (1.23 | ) | (1.23 | ) | ||||||||||||||
| Total dividends and distributions | (2.74 | ) | (0.28 | ) | (0.35 | ) | (1.72 | ) | (1.74 | ) | |||||||||||||
| Net asset value, end of period | $ | 16.71 | $ | 17.33 | $ | 16.23 | $ | 18.07 | $ | 20.57 | |||||||||||||
| Total Return(2) | 13.13 | % | 8.52 | % | (8.06 | )% | (4.27 | )% | 13.30 | % | |||||||||||||
| Ratios to Average Net Assets(3): | |||||||||||||||||||||||
| Total expenses | 0.96 | %(4) | 0.91 | %(4) | 0.95 | %(4) | 0.90 | %(4) | 0.92 | %(4) | |||||||||||||
| Net investment income | 1.47 | %(4) | 1.24 | %(4) | 1.64 | %(4) | 2.30 | %(4) | 2.44 | %(4) | |||||||||||||
| Rebate from Morgan Stanley affiliate | 0.02 | % | 0.03 | % | 0.02 | % | 0.02 | % | 0.00 | %(5) | |||||||||||||
| Supplemental Data: | |||||||||||||||||||||||
| Net assets, end of period, in thousands | $ | 457,333 | $ | 459,742 | $ | 457,914 | $ | 504,350 | $ | 553,395 | |||||||||||||
| Portfolio turnover rate | 123 | % | 173 | % | 83 | % | 42 | % | 42 | % | |||||||||||||
^ Beginning with the year ended July 31, 2011, the Fund was audited by Ernst & Young LLP. The previous years were audited by another independent registered public accounting firm.
(1) The per share amounts were computed using an average number of shares outstanding during the period.
(2) Does not reflect the deduction of sales charge. Calculated based on the net asset value as of the last business day of the period.
(3) Reflects overall Fund ratios for investment income and non-class specific expenses.
(4) The ratios reflect the rebate of certain Fund expenses in connection with investments in a Morgan Stanley affiliate during the period. The effect of the rebate on the ratios is disclosed in the above table as "Rebate from Morgan Stanley affiliate."
(5) Amount is less than 0.005%.
36
CLASS B SHARES
| For the Year Ended July 31, | 2011 | 2010^ | 2009^ | 2008^ | 2007^ | ||||||||||||||||||
| Selected Per Share Data: | |||||||||||||||||||||||
| Net asset value, beginning of period | $ | 17.42 | $ | 16.30 | $ | 18.14 | $ | 20.63 | $ | 19.79 | |||||||||||||
| Income (loss) from investment operations: | |||||||||||||||||||||||
| Net investment income(1) | 0.12 | 0.08 | 0.14 | 0.30 | 0.35 | ||||||||||||||||||
| Net realized and unrealized gain (loss) | 1.88 | 1.18 | (1.75 | ) | (1.23 | ) | 2.07 | ||||||||||||||||
| Total income (loss) from investment operations | 2.00 | 1.26 | (1.61 | ) | (0.93 | ) | 2.42 | ||||||||||||||||
| Less dividends and distributions from: | |||||||||||||||||||||||
| Net investment income | (0.04 | ) | (0.14 | ) | (0.18 | ) | (0.33 | ) | (0.35 | ) | |||||||||||||
| Net realized gain | (2.62 | ) | — | (0.05 | ) | (1.23 | ) | (1.23 | ) | ||||||||||||||
| Total dividends and distributions | (2.66 | ) | (0.14 | ) | (0.23 | ) | (1.56 | ) | (1.58 | ) | |||||||||||||
| Net asset value, end of period | $ | 16.76 | $ | 17.42 | $ | 16.30 | $ | 18.14 | $ | 20.63 | |||||||||||||
| Total Return(2) | 12.28 | % | 7.74 | % | (8.77 | )% | (5.02 | )% | 12.50 | % | |||||||||||||
| Ratios to Average Net Assets(3): | |||||||||||||||||||||||
| Total expenses | 1.71 | %(4) | 1.66 | %(4) | 1.70 | %(4) | 1.66 | %(4) | 1.67 | %(4) | |||||||||||||
| Net investment income | 0.72 | %(4) | 0.49 | %(4) | 0.89 | %(4) | 1.54 | %(4) | 1.69 | %(4) | |||||||||||||
| Rebate from Morgan Stanley affiliate | 0.02 | % | 0.03 | % | 0.02 | % | 0.02 | % | 0.00 | %(5) | |||||||||||||
| Supplemental Data: | |||||||||||||||||||||||
| Net assets, end of period, in thousands | $ | 34,374 | $ | 57,559 | $ | 90,105 | $ | 175,410 | $ | 276,329 | |||||||||||||
| Portfolio turnover rate | 123 | % | 173 | % | 83 | % | 42 | % | 42 | % | |||||||||||||
^ Beginning with the year ended July 31, 2011, the Fund was audited by Ernst & Young LLP. The previous years were audited by another independent registered public accounting firm.
(1) The per share amounts were computed using an average number of shares outstanding during the period.
(2) Does not reflect the deduction of sales charge. Calculated based on the net asset value as of the last business day of the period.
(3) Reflects overall Fund ratios for investment income and non-class specific expenses.
(4) The ratios reflect the rebate of certain Fund expenses in connection with investments in a Morgan Stanley affiliate during the period. The effect of the rebate on the ratios is disclosed in the above table as "Rebate from Morgan Stanley affiliate."
(5) Amount is less than 0.005%.
37
Financial Highlights (Continued)
CLASS C SHARES
| For the Year Ended July 31, | 2011 | 2010^ | 2009^ | 2008^ | 2007^ | ||||||||||||||||||
| Selected Per Share Data: | |||||||||||||||||||||||
| Net asset value, beginning of period | $ | 17.24 | $ | 16.15 | $ | 17.99 | $ | 20.48 | $ | 19.66 | |||||||||||||
| Income (loss) from investment operations: | |||||||||||||||||||||||
| Net investment income(1) | 0.12 | 0.08 | 0.14 | 0.30 | 0.35 | ||||||||||||||||||
| Net realized and unrealized gain (loss) | 1.86 | 1.16 | (1.74 | ) | (1.22 | ) | 2.06 | ||||||||||||||||
| Total income (loss) from investment operations | 1.98 | 1.24 | (1.60 | ) | (0.92 | ) | 2.41 | ||||||||||||||||
| Less dividends and distributions from: | |||||||||||||||||||||||
| Net investment income | (0.05 | ) | (0.15 | ) | (0.19 | ) | (0.34 | ) | (0.36 | ) | |||||||||||||
| Net realized gain | (2.62 | ) | — | (0.05 | ) | (1.23 | ) | (1.23 | ) | ||||||||||||||
| Total dividends and distributions | (2.67 | ) | (0.15 | ) | (0.24 | ) | (1.57 | ) | (1.59 | ) | |||||||||||||
| Net asset value, end of period | $ | 16.55 | $ | 17.24 | $ | 16.15 | $ | 17.99 | $ | 20.48 | |||||||||||||
| Total Return(2) | 12.23 | % | 7.76 | % | (8.78 | )% | (4.94 | )% | 12.47 | % | |||||||||||||
| Ratios to Average Net Assets(3): | |||||||||||||||||||||||
| Total expenses | 1.71 | %(4) | 1.66 | %(4) | 1.70 | %(4) | 1.64 | %(4)(5) | 1.64 | %(4) | |||||||||||||
| Net investment income | 0.72 | %(4) | 0.49 | %(4) | 0.89 | %(4) | 1.56 | %(4)(5) | 1.72 | %(4) | |||||||||||||
| Rebate from Morgan Stanley affiliate | 0.02 | % | 0.03 | % | 0.02 | % | 0.02 | % | 0.00 | %(6) | |||||||||||||
| Supplemental Data: | |||||||||||||||||||||||
| Net assets, end of period, in thousands | $ | 43,411 | $ | 41,439 | $ | 40,203 | $ | 44,664 | $ | 48,192 | |||||||||||||
| Portfolio turnover rate | 123 | % | 173 | % | 83 | % | 42 | % | 42 | % | |||||||||||||
^ Beginning with the year ended July 31, 2011, the Fund was audited by Ernst & Young LLP. The previous years were audited by another independent registered public accounting firm.
(1) The per share amounts were computed using an average number of shares outstanding during the period.
(2) Does not reflect the deduction of sales charge. Calculated based on the net asset value as of the last business day of the period.
(3) Reflects overall Fund ratios for investment income and non-class specific expenses.
(4) The ratios reflect the rebate of certain Fund expenses in connection with investments in a Morgan Stanley affiliate during the period. The effect of the rebate on the ratios is disclosed in the above table as "Rebate from Morgan Stanley affiliate."
(5) If the Fund had borne all its expenses that were reimbursed or waived by the Investment Adviser and Administrator, the annualized expense and net investment income ratios would have been 1.65% and 1.55%, respectively.
(6) Amount is less than 0.005%.
38
CLASS I SHARES
| For the Year Ended July 31, | 2011 | 2010^ | 2009^ | 2008^ | 2007^ | ||||||||||||||||||
| Selected Per Share Data: | |||||||||||||||||||||||
| Net asset value, beginning of period | $ | 17.35 | $ | 16.25 | $ | 18.10 | $ | 20.59 | $ | 19.76 | |||||||||||||
| Income (loss) from investment operations: | |||||||||||||||||||||||
| Net investment income(1) | 0.30 | 0.25 | 0.29 | 0.51 | 0.55 | ||||||||||||||||||
| Net realized and unrealized gain (loss) | 1.87 | 1.17 | (1.75 | ) | (1.23 | ) | 2.07 | ||||||||||||||||
| Total income (loss) from investment operations | 2.17 | 1.42 | (1.46 | ) | (0.72 | ) | 2.62 | ||||||||||||||||
| Less dividends and distributions from: | |||||||||||||||||||||||
| Net investment income | (0.14 | ) | (0.32 | ) | (0.34 | ) | (0.54 | ) | (0.56 | ) | |||||||||||||
| Net realized gain | (2.62 | ) | — | (0.05 | ) | (1.23 | ) | (1.23 | ) | ||||||||||||||
| Total dividends and distributions | (2.76 | ) | (0.32 | ) | (0.39 | ) | (1.77 | ) | (1.79 | ) | |||||||||||||
| Net asset value, end of period | $ | 16.76 | $ | 17.35 | $ | 16.25 | $ | 18.10 | $ | 20.59 | |||||||||||||
| Total Return(2) | 13.38 | % | 8.84 | % | (7.86 | )% | (4.02 | )% | 13.62 | % | |||||||||||||
| Ratios to Average Net Assets(3): | |||||||||||||||||||||||
| Total expenses | 0.71 | %(4) | 0.66 | %(4) | 0.70 | %(4) | 0.66 | %(4) | 0.67 | %(4) | |||||||||||||
| Net investment income | 1.72 | %(4) | 1.49 | %(4) | 1.89 | %(4) | 2.54 | %(4) | 2.69 | %(4) | |||||||||||||
| Rebate from Morgan Stanley affiliate | 0.02 | % | 0.03 | % | 0.02 | % | 0.02 | % | 0.00 | %(5) | |||||||||||||
| Supplemental Data: | |||||||||||||||||||||||
| Net assets, end of period, in thousands | $ | 27,116 | $ | 26,228 | $ | 26,901 | $ | 27,823 | $ | 66,753 | |||||||||||||
| Portfolio turnover rate | 123 | % | 173 | % | 83 | % | 42 | % | 42 | % | |||||||||||||
^ Beginning with the year ended July 31, 2011, the Fund was audited by Ernst & Young LLP. The previous years were audited by another independent registered public accounting firm.
(1) The per share amounts were computed using an average number of shares outstanding during the period.
(2) Calculated based on the net asset value as of the last business day of the period.
(3) Reflects overall Fund ratios for investment income and non-class specific expenses.
(4) The ratios reflect the rebate of certain Fund expenses in connection with investments in a Morgan Stanley affiliate during the period. The effect of the rebate on the ratios is disclosed in the above table as "Rebate from Morgan Stanley affiliate."
(5) Amount is less than 0.005%.
39
Notes
40
Morgan Stanley Funds
EQUITY
ASSET ALLOCATION
Global Strategist Fund
INTERNATIONAL
European Equity Fund
International Fund
International Value Equity Fund
U.S. GROWTH
Focus Growth Fund
Mid Cap Growth Fund
Multi Cap Growth Trust
SPECIALTY
Global Infrastructure Fund
FIXED INCOME
TAXABLE SHORT TERM
Limited Duration U.S. Government Trust*
TAXABLE INTERMEDIATE TERM
Flexible Income Trust
Mortgage Securities Trust
U.S. Government Securities Trust
MONEY MARKET
TAXABLE
Liquid Asset Fund*
U.S. Government Money Market Trust*
TAX-EXEMPT
California Tax-Free Daily Income Trust*
New York Municipal Money Market Trust
Tax-Free Daily Income Trust*
There may be funds created or terminated after this Prospectus was published. Please consult the inside back cover of a new fund's prospectus for its designations, e.g. Multi-Class Fund or Money Market Fund.
Unless otherwise noted, each listed Morgan Stanley Fund is a Multi-Class Fund. A Multi-Class Fund is a mutual fund offering multiple classes of shares.
* Single-Class Fund(s)
41
Additional information about the Fund's investments is available in the Fund's Annual and Semiannual Reports to Shareholders. In the Fund's Annual Report, you will find a discussion of the market conditions and investment strategies that significantly affected the Fund's performance during its last fiscal year.
The Fund's Statement of Additional Information also provides additional information about the Fund. The Statement of Additional Information is incorporated herein by reference (legally is part of this Prospectus). For a free copy of the Fund's Annual Report, Semiannual Report or Statement of Additional Information, to request other information about the Fund or to make shareholder inquiries, please call toll-free (800) 869-NEWS. Free copies of these documents are also available from our Internet site at: www.morganstanley.com/im.
You also may obtain information about the Fund by calling your Morgan Stanley Smith Barney Financial Advisor or by visiting our Internet site.
Information about the Fund (including the Statement of Additional Information) can be reviewed and copied at the SEC Public Reference Room in Washington, DC. Information about the Reference Room's operations may be obtained by calling the SEC at (202) 551-8090. Reports and other information about the Fund are available on the EDGAR Database on the SEC's Internet site at: www.sec.gov and copies of this information may be obtained, after paying a duplicating fee, by electronic request at the following E-mail address: publicinfo@sec.gov, or by writing to the Public Reference Section of the SEC, Washington, DC 20549-1520.
(THE FUND'S INVESTMENT COMPANY ACT FILE NO. IS 811-5634)
Morgan Stanley Distribution, Inc., member FINRA.
© 2011 Morgan Stanley


INVESTMENT MANAGEMENT
Morgan Stanley
Global Strategist Fund

Prospectus
November 30, 2011
SRTPRO-00
INVESTMENT MANAGEMENT

Welcome, Shareholder:
In this report, you'll learn about how your investment in Morgan Stanley Global Strategist Fund performed during the annual period. We will provide an overview of the market conditions, and discuss some of the factors that affected performance during the reporting period. In addition, this report includes the Fund's financial statements and a list of Fund investments.
This material must be preceded or accompanied by a prospectus for the fund being offered.
Market forecasts provided in this report may not necessarily come to pass. There is no assurance that the Fund will achieve its investment objective. The Fund is subject to market risk, which is the possibility that market values of securities owned by the Fund will decline and, therefore, the value of the Fund's shares may be less than what you paid for them. Accordingly, you can lose money investing in this Fund. Please see the prospectus for more complete information on investment risks.
Fund Report (unaudited)
For the year ended July 31, 2011
| Total Return for the 12 Months Ended July 31, 2011 | |||||||||||||||||||||||||||
| Class A | Class B | Class C | Class I | MSCI All Country World Index1 | Barclays Capital U.S. Government/ Credit Index2 | Lipper Global Flexible Portfolio Funds Index3 | |||||||||||||||||||||
| 13.13 | % | 12.28 | % | 12.23 | % | 13.38 | % | 18.39 | % | 4.52 | % | 13.33 | % | ||||||||||||||
The performance of the Fund's four share classes varies because each has different expenses. The Fund's total returns assume the reinvestment of all distributions but do not reflect the deduction of any applicable sales charges. Such costs would lower performance. See Performance Summary for standardized performance and benchmark information.
Market Conditions
Global equity markets (as measured by the MSCI All Country World Index) experienced significant volatility as macroeconomic events took center stage throughout 2010 and 2011. After a period of consolidation in July, August and September of 2010, global stocks began a prolonged advance that lasted into early February 2011. This 32 percent advance, fueled primarily by accommodative global central bank policies and improving global economic data, carried stocks to highs last seen in 2008.
Unfortunately, this rally quickly came to a halt on the back of the March earthquake and resulting tsunami in Japan. The tsunami affected the global economy as supply chains were suddenly interrupted, prompting economists to lower growth expectations. This natural disaster also served to exacerbate other challenges to global growth that had been festering: higher oil and gasoline prices, the European sovereign debt crisis, unrest in a number of Middle East countries, and a severe winter that had already affected much of the globe.
While global equities recovered and climbed to yet higher highs, the headwinds created by all of these factors began to weigh heavily on investors as the period under review (July 2010 to July 2011) ended.
Performance Analysis
All share classes of Morgan Stanley Global Strategist Fund underperformed the MSCI All Country World Index (the "Index") and outperformed the Barclays Capital U.S. Government/Credit Index, while Class A, B, and C shares underperformed and Class I shares outperformed the Lipper Global Flexible Portfolio Funds Index for the 12 months ended July 31, 2011, assuming no deduction of applicable sales charges.
The Fund's underperformance versus the all-equity Index (MSCI All Country World Index) can be directly attributed to its asset allocation mandate and lower volatility and risk profile. Factors that detracted from performance included the Fund's exposures to global fixed income and cash equivalents, which are not part of the all-equity benchmark, and an overweight to U.S. dividend-paying, large-capitalization equities.
Although the Fund underperformed the Index, factors that contributed positively to performance included higher relative exposures to global growth equities (including information technology, materials and energy, as well as geographic exposures to China, India and
2
other emerging markets in excess of benchmark index weights) and commodities.
The Fund's underperformance versus the Lipper Global Flexible Portfolio Funds Index can be directly attributed to the Fund's higher cash levels and lower risk profile and beta exposure when compared to its peers within this category. Finally, the Fund's outperformance versus the Barclays Capital U.S. Government/Credit Bond Index can be attributed to its exposure to both global equities and commodities.
The Fund maintained a relatively balanced asset allocation blend throughout the period under review, with global equity exposures averaging 60 percent (within a range of approximately 300 basis points above or below that level), 30 percent global fixed income exposures (within a range of approximately 200 basis points above or below that level), commodity exposures ranging from 2 percent to 5 percent of total Fund assets and cash equivalents ranging from 3 percent to 6 percent.
The Fund's asset allocation on July 31, 2011 stood at 60.3 percent global equities, 32.4 percent global fixed income, 4.0 percent diversified commodities and 3.3 percent cash equivalents.
There is no guarantee that any sectors mentioned will continue to perform as discussed herein or that securities in such sectors will be held by the Fund in the future.
| TOP 10 HOLDINGS as of 07/31/11 | |||||||
| Deutsche Bank AG, Series 0005 | 4.0 | % | |||||
| U.S. Treasury Notes | 1.5 | ||||||
| Japan Government Ten Year Bond (Japan) | 1.0 | ||||||
| U.S. Treasury Bond Principal STRIPS | 0.9 | ||||||
| Japan Government Ten Year Bond (Japan) | 0.9 | ||||||
| Government of Japan (Japan) | 0.8 | ||||||
| United Kingdom Gilt (United Kingdom) | 0.8 | ||||||
| Canadian Government Bond (Canada) | 0.7 | ||||||
| U.S. Treasury Bonds | 0.7 | ||||||
| Exxon Mobil Corp. | 0.7 | ||||||
| PORTFOLIO COMPOSITION as of 07/31/11* | |||||||
| Common Stocks | 54.7 | % | |||||
| Sovereign | 13.6 | ||||||
| Corporate Bonds | 10.1 | ||||||
| Short-Term Investments | 7.6 | ||||||
| Commodity Linked Securities | 3.9 | ||||||
| U.S. Treasury Securities | 3.8 | ||||||
| Agency Fixed Rate Mortgages | 3.6 | ||||||
| Investment Company | 1.1 | ||||||
| Commercial Mortgage Backed Securities | 1.0 | ||||||
| Asset-Backed Securities | 0.5 | ||||||
| Municipal Bonds | 0.1 | ||||||
* Does not include open long/short futures contracts with an underlying face amount of $131,908,031 and net unrealized depreciation of $1,116,643. Also does not include open swap agreements with net unrealized depreciation of $712,863 and open foreign currency exchange contracts with unrealized appreciation of $753,408.
Subject to change daily. Provided for informational purposes only and should not be deemed as a recommendation to buy or sell the securities mentioned above. Top 10 holdings are as a percentage of net assets and portfolio composition are as a percentage of total investments. Morgan Stanley is a full-service securities firm engaged in securities trading and brokerage activities, investment banking, research and analysis, financing and financial advisory services.
3
Investment Strategy
The Fund's Investment Adviser, Morgan Stanley Investment Management Inc., seeks to achieve the Fund's investment objective by investing primarily in a blend of equity and fixed-income securities of U.S. and non-U.S. issuers. Equity securities may include common and preferred stocks, depositary receipts, convertible securities, equity-linked securities, real estate investment trusts ("REITs"), and rights and warrants to purchase equity securities. Fixed income securities may include mortgage-related or mortgage-backed securities, floating rate securities, inflation-linked fixed income securities, securities issued or guaranteed by the U.S. Government, its agencies or instrumentalities, securities issued or guaranteed by non-U.S. governments, their agencies, or instrumentalities, corporate bonds and notes issued by U.S. and non-U.S. entities.
For More Information About Portfolio Holdings
Each Morgan Stanley fund provides a complete schedule of portfolio holdings in its semiannual and annual reports within 60 days of the end of the fund's second and fourth fiscal quarters. The semiannual reports and the annual reports are filed electronically with the Securities and Exchange Commission (SEC) on Form N-CSRS and Form N-CSR, respectively. Morgan Stanley also delivers the semiannual and annual reports to fund shareholders and makes these reports available on its public web site, www.morganstanley.com. Each Morgan Stanley fund also files a complete schedule of portfolio holdings with the SEC for the fund's first and third fiscal quarters on Form N-Q. Morgan Stanley does not deliver the reports for the first and third fiscal quarters to shareholders, nor are the reports posted to the Morgan Stanley public web site. You may, however, obtain the Form N-Q filings (as well as the Form N-CSR and N-CSRS filings) by accessing the SEC's web site, http://www.sec.gov. You may also review and copy them at the SEC's public reference room in Washington, DC. Information on the operation of the SEC's public reference room may be obtained by calling the SEC at (800) SEC-0330. You can also request copies of these materials, upon payment of a duplicating fee, by electronic request at the SEC's e-mail address (publicinfo@sec.gov) or by writing the public reference section of the SEC, Washington, DC 20549-1520.
4
Proxy Voting Policy and Procedures and Proxy Voting Record
You may obtain a copy of the Fund's Proxy Voting Policy and Procedures without charge, upon request, by calling toll free (800) 869-NEWS or by visiting the Mutual Fund Center on our web site at www.morganstanley.com. It is also available on the SEC's web site at http://www.sec.gov.
You may obtain information regarding how the Fund voted proxies relating to portfolio securities during the most recent twelve-month period ended June 30 without charge by visiting the Mutual Fund Center on our web site at www.morganstanley.com. This information is also available on the SEC's web site at http://www.sec.gov.
Householding Notice
To reduce printing and mailing costs, the Fund attempts to eliminate duplicate mailings to the same address. The Fund delivers a single copy of certain shareholder documents, including shareholder reports, prospectuses and proxy materials, to investors with the same last name who reside at the same address. Your participation in this program will continue for an unlimited period of time unless you instruct us otherwise. You can request multiple copies of these documents by calling (800) 869-NEWS, 8:00 a.m. to 8:00 p.m., ET. Once our Customer Service Center has received your instructions, we will begin sending individual copies for each account within 30 days.
5
Performance Summary (unaudited)
Performance of $10,000 Investment—Class B
Over 10 Years

6
| Average Annual Total Returns—Period Ended July 31, 2011 (unaudited) | |||||||||||||||||||
| Symbol | Class A Shares* (since 07/28/97) SRTAX | Class B Shares** (since 10/31/88) SRTBX | Class C Shares† (since 07/28/97) SRTCX | Class I Shares†† (since 07/28/97) SRTDX | |||||||||||||||
| 1 Year | 13.13 7.19 5 | %4 | 12.28 7.47 5 | %4 | 12.23 11.27 5 | %4 | 13.38 — | %4 | |||||||||||
| 5 Years | 4.13 4 3.02 5 | 3.35 4 3.05 5 | 3.36 4 3.36 5 | 4.39 4 — | |||||||||||||||
| 10 Years | 4.72 4 4.16 5 | 4.09 4 4.09 5 | 3.94 4 3.94 5 | 4.97 4 — | |||||||||||||||
| Since Inception | 5.61 4 5.20 5 | 8.50 4 8.50 5 | 4.81 4 4.81 5 | 5.86 4 — | |||||||||||||||
Performance data quoted represents past performance, which is no guarantee of future results and current performance may be lower or higher than the figures shown. For most recent month-end performance figures, please visit www.morganstanley.com/im or speak with your Financial Advisor. Investment returns and principal value will fluctuate and fund shares, when redeemed, may be worth more or less than their original cost. The graph and table do not reflect the deduction of taxes that a shareholder would pay on fund distributions or the redemption of fund shares. Performance for Class A, Class B, Class C, and Class I shares will vary due to differences in sales charges and expenses. See the Fund's current prospectus for complete details on fees and sales charges.
* The maximum front-end sales charge for Class A is 5.25%.
** The maximum contingent deferred sales charge (CDSC) for Class B is 5.0%. The CDSC declines to 0% after six years. Effective April 2005, Class B shares will generally convert to Class A shares approximately eight years after the end of the calendar month in which the shares were purchased. Performance for periods greater than eight years reflects this conversion (beginning April 2005).
† The maximum contingent deferred sales charge for Class C is 1.0% for shares redeemed within one year of purchase.
†† Class I has no sales charge.
(1) The Morgan Stanley Capital International (MSCI) All Country World Index (ACWI) is a free float-adjusted market capitalization weighted index designed to measure the equity market performance of developed and emerging markets. The term "free float" represents the portion of shares outstanding that are deemed to be available for purchase in the public equity markets by investors. The Index is unmanaged and its returns do not include any sales charges or fees. Such costs would lower performance. It is not possible to invest directly in an index.
(2) The Barclays Capital U.S. Government/Credit Index tracks the performance of government and corporate obligations, including U.S. government agency and Treasury securities and corporate and Yankee bonds. The Index is unmanged and its returns do not include any sales charges or fees. Such costs would lower performance. It is not possible to invest directly in an index.
(3) The Lipper Global Flexible Portfolio Funds Index is an equally weighted performance index of the largest qualifying funds (based on net assets) in the Lipper Global Flexible Portfolio Funds classification. The Index, which is adjusted for capital gains distributions and income dividends, is unmanaged and should not be considered an investment. There are currently 30 funds represented in this Index. The Fund was in the Lipper Global Flexible Portfolio Funds classification as of the date of this report.
(4) Figure shown assumes reinvestment of all distributions and does not reflect the deduction of any sales charges.
(5) Figure shown assumes reinvestment of all distributions and the deduction of the maximum applicable sales charge. See the Fund's current prospectus for complete details on fees and sales charges.
‡ Ending value assuming a complete redemption on July 31, 2011.
7
Expense Example (unaudited)
As a shareholder of the Fund, you incur two types of costs: (1) transaction costs, including sales charges (loads) on purchase payments and (2) ongoing costs, including advisory fees; distribution and service (12b-1) fees; and other Fund expenses. This example is intended to help you understand your ongoing costs (in dollars) of investing in the Fund and to compare these costs with the ongoing costs of investing in other mutual funds.
The example is based on an investment of $1,000 invested at the beginning of the period and held for the entire period 02/01/11 – 07/31/11.
Actual Expenses
The first line of the table below provides information about actual account values and actual expenses. You may use the information in this line, together with the amount you invested, to estimate the expenses that you paid over the period. Simply divide your account value by $1,000 (for example, an $8,600 account value divided by $1,000 = 8.6), then multiply the result by the number in the first line under the heading entitled "Expenses Paid During Period" to estimate the expenses you paid on your account during this period.
Hypothetical Example for Comparison Purposes
The second line of the table below provides information about hypothetical expenses based on the Fund's actual expense ratio and an assumed rate of return of 5% per year before expenses, which is not the Fund's actual return. The hypothetical account values and expenses may not be used to estimate the actual ending account balance or expenses you paid for the period. You may use this information to compare the ongoing cost of investing in the Fund and other funds. To do so, compare this 5% hypothetical example with the 5% hypothetical examples that appear in the shareholder reports of the other funds.
Please note that the expenses shown in the table are meant to highlight your ongoing costs only and do not reflect any transactional costs, such as sales charges (loads). Therefore, the second line of the table is useful in comparing ongoing costs, and will not help you determine the relative total cost of owning different funds. In addition, if these transactional costs were included, your costs would have been higher.
| Beginning Account Value | Ending Account Value | Expenses Paid During Period@ | |||||||||||||
| 02/01/11 | 07/31/11 | 02/01/11 – 07/31/11 | |||||||||||||
| Class A | |||||||||||||||
| Actual (2.01% return) | $ | 1,000.00 | $ | 1,020.10 | $ | 4.91 | |||||||||
| Hypothetical (5% annual return before expenses) | $ | 1,000.00 | $ | 1,019.93 | $ | 4.91 | |||||||||
| Class B | |||||||||||||||
| Actual (1.64% return) | $ | 1,000.00 | $ | 1,016.40 | $ | 8.65 | |||||||||
| Hypothetical (5% annual return before expenses) | $ | 1,000.00 | $ | 1,016.22 | $ | 8.65 | |||||||||
| Class C | |||||||||||||||
| Actual (1.66% return) | $ | 1,000.00 | $ | 1,016.60 | $ | 8.65 | |||||||||
| Hypothetical (5% annual return before expenses) | $ | 1,000.00 | $ | 1,016.22 | $ | 8.65 | |||||||||
| Class I | |||||||||||||||
| Actual (2.20% return) | $ | 1,000.00 | $ | 1,022.00 | $ | 3.66 | |||||||||
| Hypothetical (5% annual return before expenses) | $ | 1,000.00 | $ | 1,021.17 | $ | 3.66 | |||||||||
@ Expenses are equal to the Fund's annualized expense ratios of 0.98%, 1.73%, 1.73% and 0.73% for Class A, Class B, Class C and Class I shares, respectively, multiplied by the average account value over the period, multiplied by 181/365 (to reflect the one-half year period). If the Fund had borne all of its expenses, the annualized expense ratios would have been 0.99%, 1.74%, 1.74% and 0.74% for Class A, Class B, Class C and Class I shares, respectively.
8
Investment Advisory Agreement Approval (unaudited)
Nature, Extent and Quality of Services
The Board reviewed and considered the nature and extent of the investment advisory services provided by the Investment Adviser (as defined herein) under the advisory agreement, including portfolio management, investment research and equity and fixed income securities trading. The Board also reviewed and considered the nature and extent of the non-advisory, administrative services provided by the Fund's Administrator (as defined herein) under the administration agreement, including accounting, clerical, bookkeeping, compliance, business management and planning, and the provision of supplies, office space and utilities at the Investment Adviser's expense. (The Investment Adviser and the Administrator together are referred to as the "Adviser" and the advisory and administration agreements together are referred to as the "Management Agreement.") The Board also compared the nature of the services provided by the Adviser with similar services provided by non-affiliated advisers as reported to the Board by Lipper, Inc. ("Lipper").
The Board reviewed and considered the qualifications of the portfolio managers, the senior administrative managers and other key personnel of the Adviser who provide the advisory and administrative services to the Fund. The Board determined that the Adviser's portfolio managers and key personnel are well qualified by education and/or training and experience to perform the services in an efficient and professional manner. The Board concluded that the nature and extent of the advisory and administrative services provided were necessary and appropriate for the conduct of the business and investment activities of the Fund and supported its decision to approve the Management Agreement.
Performance, Fees and Expenses of the Fund
The Board reviewed the performance, fees and expenses of the Fund compared to its peers, as determined by Lipper, and to appropriate benchmarks where applicable. The Board discussed with the Adviser the performance goals and the actual results achieved in managing the Fund. When considering a fund's performance, the Board and the Adviser place emphasis on trends and longer-term returns (focusing on one-year, three-year and five-year performance, as of December 31, 2010, or since inception, as applicable). When a fund underperforms its benchmark and/or its peer group average, the Board and the Adviser discuss the causes of such underperformance and, where necessary, they discuss specific changes to investment strategy or investment personnel. The Board noted that the Fund's performance was better than its peer group average for the one- and three-year periods but below its peer group average for the five-year period. The Board discussed with the Adviser the level of the advisory and administration fees (together, the "management fee") for this Fund relative to comparable funds and/or other accounts advised by the Adviser and/or compared to its peers as determined by Lipper. In addition to the management fee, the Board also reviewed the Fund's total expense ratio. The Board noted that the Fund's management fee and total expense ratio were lower than its peer group average. After discussion, the Board concluded that the Fund's management fee, total expense ratio and performance were competitive with its peer group average.
9
Economies of Scale
The Board considered the size and growth prospects of the Fund and how that relates to the Fund's total expense ratio and particularly the Fund's management fee rate, which includes a breakpoint. In conjunction with its review of the Adviser's profitability, the Board discussed with the Adviser how a change in assets can affect the efficiency or effectiveness of managing the Fund and whether the management fee level is appropriate relative to current and projected asset levels and/or whether the management fee structure reflects economies of scale as asset levels change. The Board has determined that its review of the actual and potential economies of scale of the Fund support its decision to approve the Management Agreement.
Profitability of the Adviser and Affiliates
The Board considered information concerning the costs incurred and profits realized by the Adviser and its affiliates during the last year from their relationship with the Fund and during the last two years from their relationship with the Morgan Stanley Fund Complex and reviewed with the Adviser the cost allocation methodology used to determine the profitability of the Adviser and affiliates. The Board has determined that its review of the analysis of the Adviser's expenses and profitability supports its decision to approve the Management Agreement.
Other Benefits of the Relationship
The Board considered other benefits to the Adviser and its affiliates derived from their relationship with the Fund and other funds advised by the Adviser. These benefits may include, among other things, "float" benefits derived from handling of checks for purchases and sales, research received by the Adviser generated from commission dollars spent on funds' portfolio trading and fees for distribution and/or shareholder servicing. The Board reviewed with the Adviser each of these arrangements and the reasonableness of the Adviser's costs relative to the services performed. The Board has determined that its review of the other benefits received by the Adviser or its affiliates supports its decision to approve the Management Agreement.
Resources of the Adviser and Historical Relationship Between the Fund and the Adviser
The Board considered whether the Adviser is financially sound and has the resources necessary to perform its obligations under the Management Agreement. The Board also reviewed and considered the historical relationship between the Fund and the Adviser, including the organizational structure of the Adviser, the policies and procedures formulated and adopted by the Adviser for managing the Fund's operations and the Board's confidence in the competence and integrity of the senior managers and key personnel of the Adviser. The Board concluded that the Adviser has the financial resources necessary to fulfill its obligations under the Management Agreement and that it is beneficial for the Fund to continue its relationship with the Adviser.
10
Other Factors and Current Trends
The Board considered the controls and procedures adopted and implemented by the Adviser and monitored by the Fund's Chief Compliance Officer and concluded that the conduct of business by the Adviser indicates a good faith effort on its part to adhere to high ethical standards in the conduct of the Fund's business.
General Conclusion
After considering and weighing all of the above factors, the Board concluded that it would be in the best interest of the Fund and its shareholders to approve renewal of the Management Agreement for another year. In reaching this conclusion the Board did not give particular weight to any single factor referenced above. The Board considered these factors over the course of numerous meetings, some of which were in executive session with only the independent Board members and their counsel present. It is possible that individual Board members may have weighed these factors differently in reaching their individual decisions to approve the Management Agreement.
11
Morgan Stanley Global Strategist Fund
Portfolio of Investments n July 31, 2011
| NUMBER OF SHARES | VALUE | ||||||||||
| Common Stocks (55.0%) | |||||||||||
| Australia (2.0%) | |||||||||||
| Air Freight & Logistics | |||||||||||
| 9,047 | Toll Holdings Ltd. | $ | 44,955 | ||||||||
| Beverages | |||||||||||
| 7,069 | Coca-Cola Amatil Ltd. | 87,771 | |||||||||
| 34,406 | Foster's Group Ltd. | 190,746 | |||||||||
| 11,468 | Treasury Wine Estates Ltd. (a) | 43,252 | |||||||||
| 321,769 | |||||||||||
| Biotechnology | |||||||||||
| 6,876 | CSL Ltd. | 232,013 | |||||||||
| Capital Markets | |||||||||||
| 4,098 | Macquarie Group Ltd. | 123,928 | |||||||||
| Chemicals | |||||||||||
| 20,816 | Incitec Pivot Ltd. | 90,363 | |||||||||
| 5,073 | Orica Ltd. | 143,072 | |||||||||
| 233,435 | |||||||||||
| Commercial Banks | |||||||||||
| 33,478 | Australia & New Zealand Banking Group Ltd. | 764,787 | |||||||||
| 17,491 | Commonwealth Bank of Australia | 945,402 | |||||||||
| 28,069 | National Australia Bank Ltd. | 738,749 | |||||||||
| 34,431 | Westpac Banking Corp. | 770,950 | |||||||||
| 3,219,888 | |||||||||||
| Commercial Services & Supplies | |||||||||||
| 17,604 | Brambles Ltd. | 133,825 | |||||||||
| Construction & Engineering | |||||||||||
| 2,027 | Leighton Holdings Ltd. | 46,940 | |||||||||
| Containers & Packaging | |||||||||||
| 15,296 | Amcor Ltd. | 118,327 | |||||||||
| NUMBER OF SHARES | VALUE | ||||||||||
| Diversified Financial Services | |||||||||||
| 2,386 | ASX Ltd. | $ | 78,282 | ||||||||
| Diversified Telecommunication Services | |||||||||||
| 60,099 | Telstra Corp. Ltd. | 197,294 | |||||||||
| Energy Equipment & Services | |||||||||||
| 2,456 | WorleyParsons Ltd. | 74,243 | |||||||||
| Food & Staples Retailing | |||||||||||
| 12,676 | Wesfarmers Ltd. | 407,750 | |||||||||
| 2,388 | Wesfarmers Ltd. (PPS) | 77,857 | |||||||||
| 15,531 | Woolworths Ltd. | 459,272 | |||||||||
| 944,879 | |||||||||||
| Health Care Equipment & Supplies | |||||||||||
| 773 | Cochlear Ltd. | 60,200 | |||||||||
| Health Care Providers & Services | |||||||||||
| 4,764 | Sonic Healthcare Ltd. | 63,635 | |||||||||
| Hotels, Restaurants & Leisure | |||||||||||
| 8,910 | Crown Ltd. | 87,221 | |||||||||
| 10,695 | Echo Entertainment Group Ltd. (a) | 47,116 | |||||||||
| 8,584 | TABCORP Holdings Ltd. | 30,330 | |||||||||
| 164,667 | |||||||||||
| Information Technology Services | |||||||||||
| 6,506 | Computershare Ltd. | 58,595 | |||||||||
| Insurance | |||||||||||
| 40,346 | AMP Ltd. | 201,837 | |||||||||
| 30,701 | Insurance Australia Group Ltd. | 110,482 | |||||||||
See Notes to Financial Statements
12
Morgan Stanley Global Strategist Fund
Portfolio of Investments n July 31, 2011 continued
| NUMBER OF SHARES | VALUE | ||||||||||
| 17,105 | QBE Insurance Group Ltd. | $ | 307,749 | ||||||||
| 15,816 | Suncorp Group Ltd. | 128,438 | |||||||||
| 748,506 | |||||||||||
| Media | |||||||||||
| 39,248 | Fairfax Media Ltd. | 37,956 | |||||||||
| Metals & Mining | |||||||||||
| 44,558 | Alumina Ltd. | 105,823 | |||||||||
| 40,502 | BHP Billiton Ltd. | 1,852,747 | |||||||||
| 26,754 | BlueScope Steel Ltd. | 33,446 | |||||||||
| 6,321 | DuluxGroup Ltd. | 18,108 | |||||||||
| 16,804 | Fortescue Metals Group Ltd. | 116,217 | |||||||||
| 5,772 | Newcrest Mining Ltd. | 250,440 | |||||||||
| 17,194 | OneSteel Ltd. | 33,287 | |||||||||
| 5,339 | Rio Tinto Ltd. | 467,707 | |||||||||
| 2,877,775 | |||||||||||
| Multi-Utilities | |||||||||||
| 5,600 | AGL Energy Ltd. | 87,238 | |||||||||
| Oil, Gas & Consumable Fuels | |||||||||||
| 13,082 | Origin Energy Ltd. | 210,831 | |||||||||
| 11,090 | Santos Ltd. | 156,973 | |||||||||
| 7,238 | Woodside Petroleum Ltd. | 305,019 | |||||||||
| 672,823 | |||||||||||
| Real Estate Investment Trusts (REITs) | |||||||||||
| 65,324 | Dexus Property Group REIT (Stapled Securities) (b) | 62,019 | |||||||||
| 80,650 | Goodman Group REIT (Stapled Securities) (b) | 60,170 | |||||||||
| 26,937 | GPT Group REIT (Stapled Securities) (b) | 88,973 | |||||||||
| NUMBER OF SHARES | VALUE | ||||||||||
| 38,679 | Mirvac Group REIT (Stapled Securities) (b)(c) | $ | 48,819 | ||||||||
| 28,561 | Stockland REIT (Stapled Securities) (b)(c) | 95,556 | |||||||||
| 25,964 | Westfield Group REIT (Stapled Securities) (b)(c) | 226,774 | |||||||||
| 25,951 | Westfield Retail Trust REIT | 69,474 | |||||||||
| 651,785 | |||||||||||
| Road & Rail | |||||||||||
| 36,313 | Asciano Ltd. (Stapled Securities) (b)(c) | 66,475 | |||||||||
| Transportation Infrastructure | |||||||||||
| 16,094 | Transurban Group (Stapled Securities) (b) | 90,404 | |||||||||
| Total Australia | 11,349,837 | ||||||||||
| Austria (0.0%) | |||||||||||
| Metals & Mining | |||||||||||
| 1,329 | Voestalpine AG | 68,841 | |||||||||
| Real Estate Management & Development | |||||||||||
| 3,664 | Immofinanz AG (a) | 14,104 | |||||||||
| Total Austria | 82,945 | ||||||||||
| Belgium (0.2%) | |||||||||||
| Beverages | |||||||||||
| 8,295 | Anheuser-Busch InBev N.V. | 478,085 | |||||||||
| Chemicals | |||||||||||
| 1,567 | Umicore SA | 79,777 | |||||||||
| Commercial Banks | |||||||||||
| 3,297 | KBC Groep N.V. | 115,860 | |||||||||
See Notes to Financial Statements
13
Morgan Stanley Global Strategist Fund
Portfolio of Investments n July 31, 2011 continued
| NUMBER OF SHARES | VALUE | ||||||||||
| Diversified Financial Services | |||||||||||
| 1,726 | Groupe Bruxelles Lambert SA | $ | 145,297 | ||||||||
| Food & Staples Retailing | |||||||||||
| 905 | Colruyt SA | 43,988 | |||||||||
| 3,851 | Delhaize Group SA | 276,323 | |||||||||
| 320,311 | |||||||||||
| Insurance | |||||||||||
| 30,051 | Ageas | 61,679 | |||||||||
| Total Belgium | 1,201,009 | ||||||||||
| Brazil (1.2%) | |||||||||||
| Beverages | |||||||||||
| 12,500 | Cia de Bebidas das Americas (Preference) | 369,072 | |||||||||
| Commercial Banks | |||||||||||
| 28,291 | Banco Bradesco SA (Preference) | 538,147 | |||||||||
| 7,700 | Banco do Brasil SA | 130,530 | |||||||||
| 7,600 | Banco Santander Brasil SA (Units) | 71,401 | |||||||||
| 28,541 | Itau Unibanco Holding SA (Preference) | 578,605 | |||||||||
| 40,511 | Itausa - Investimentos Itau SA (Preference) | 272,189 | |||||||||
| 1,590,872 | |||||||||||
| Diversified Financial Services | |||||||||||
| 18,100 | BM&F Bovespa SA | 105,856 | |||||||||
| Diversified Telecommunication Services | |||||||||||
| 5,707 | Tele Norte Leste Participacoes SA (Preference) | 79,081 | |||||||||
| NUMBER OF SHARES | VALUE | ||||||||||
| 3,574 | Telecomunicacoes de Sao Paulo SA (Preference) | $ | 112,462 | ||||||||
| 191,543 | |||||||||||
| Electric Utilities | |||||||||||
| 11,628 | Centrais Eletricas Brasileiras SA (Preference) | 176,574 | |||||||||
| 9,201 | Cia Energetica de Minas Gerais (Preference) | 175,910 | |||||||||
| 352,484 | |||||||||||
| Food Products | |||||||||||
| 9,300 | BRF - Brasil Foods SA | 176,903 | |||||||||
| Household Durables | |||||||||||
| 3,500 | Cyrela Brazil Realty SA Empreendimentos e Participacoes | 34,304 | |||||||||
| 10,800 | PDG Realty SA Empreendimentos e Participacoes | 57,104 | |||||||||
| 91,408 | |||||||||||
| Information Technology Services | |||||||||||
| 3,400 | Cielo SA | 94,490 | |||||||||
| 5,100 | Redecard SA | 87,804 | |||||||||
| 182,294 | |||||||||||
| Metals & Mining | |||||||||||
| 4,591 | Bradespar SA (Preference) | 118,175 | |||||||||
| 13,100 | Cia Siderurgica Nacional SA | 136,672 | |||||||||
| 9,327 | Gerdau SA (Preference) | 84,318 | |||||||||
| 4,467 | Metalurgica Gerdau SA (Preference) | 51,097 | |||||||||
| 4,100 | Usinas Siderurgicas de Minas Gerais SA | 56,047 | |||||||||
See Notes to Financial Statements
14
Morgan Stanley Global Strategist Fund
Portfolio of Investments n July 31, 2011 continued
| NUMBER OF SHARES | VALUE | ||||||||||
| 7,926 | Usinas Siderurgicas de Minas Gerais SA (Preference) | $ | 56,985 | ||||||||
| 18,100 | Vale SA | 585,652 | |||||||||
| 29,313 | Vale SA (Preference) | 862,086 | |||||||||
| 1,951,032 | |||||||||||
| Oil, Gas & Consumable Fuels | |||||||||||
| 17,000 | OGX Petroleo e Gas Participacoes SA (a) | 141,626 | |||||||||
| 31,100 | Petroleo Brasileiro SA | 522,394 | |||||||||
| 43,330 | Petroleo Brasileiro SA (Preference) | 656,579 | |||||||||
| 6,400 | Ultrapar Participacoes SA (Preference) | 114,311 | |||||||||
| 1,434,910 | |||||||||||
| Personal Products | |||||||||||
| 3,800 | Natura Cosmeticos SA | 86,372 | |||||||||
| Road & Rail | |||||||||||
| 5,500 | All America Latina Logistica SA | 39,720 | |||||||||
| Transportation Infrastructure | |||||||||||
| 3,700 | CCR SA | 111,392 | |||||||||
| Total Brazil | 6,683,858 | ||||||||||
| Canada (2.7%) | |||||||||||
| Aerospace & Defense | |||||||||||
| 19,400 | Bombardier, Inc. | 117,360 | |||||||||
| Auto Components | |||||||||||
| 3,400 | Magna International, Inc. | 165,828 | |||||||||
| Capital Markets | |||||||||||
| 2,800 | IGM Financial, Inc. | 140,960 | |||||||||
| Chemicals | |||||||||||
| 2,200 | Agrium, Inc. | 192,519 | |||||||||
| NUMBER OF SHARES | VALUE | ||||||||||
| 11,400 | Potash Corp. of Saskatchewan, Inc. | $ | 658,144 | ||||||||
| 850,663 | |||||||||||
| Commercial Banks | |||||||||||
| 7,100 | Bank of Montreal | 446,086 | |||||||||
| 12,400 | Bank of Nova Scotia | 703,158 | |||||||||
| 5,200 | Canadian Imperial Bank of Commerce | 397,191 | |||||||||
| 2,100 | National Bank of Canada | 162,756 | |||||||||
| 17,100 | Royal Bank of Canada | 919,922 | |||||||||
| 11,300 | Toronto-Dominion Bank (The) | 904,639 | |||||||||
| 3,533,752 | |||||||||||
| Communications Equipment | |||||||||||
| 6,300 | Research In Motion Ltd. (a) | 157,789 | |||||||||
| Construction & Engineering | |||||||||||
| 2,800 | SNC-Lavalin Group, Inc. | 158,279 | |||||||||
| Diversified Telecommunication Services | |||||||||||
| 7,200 | BCE, Inc. | 274,752 | |||||||||
| Electric Utilities | |||||||||||
| 2,000 | Fortis, Inc. | 66,272 | |||||||||
| Food & Staples Retailing | |||||||||||
| 3,500 | Shoppers Drug Mart Corp. | 146,967 | |||||||||
| Hotels, Restaurants & Leisure | |||||||||||
| 4,300 | Tim Hortons, Inc. | 206,348 | |||||||||
| Independent Power Producers & Energy Traders | |||||||||||
| 3,400 | TransAlta Corp. | 75,192 | |||||||||
See Notes to Financial Statements
15
Morgan Stanley Global Strategist Fund
Portfolio of Investments n July 31, 2011 continued
| NUMBER OF SHARES | VALUE | ||||||||||
| Insurance | |||||||||||
| 300 | Fairfax Financial Holdings Ltd. | $ | 118,060 | ||||||||
| 6,200 | Great-West Lifeco, Inc. | 154,895 | |||||||||
| 1,900 | Intact Financial Corp. | 110,267 | |||||||||
| 24,700 | Manulife Financial Corp. | 392,429 | |||||||||
| 5,500 | Power Corp. of Canada | 145,926 | |||||||||
| 5,200 | Power Financial Corp. | 153,423 | |||||||||
| 8,000 | Sun Life Financial, Inc. | 221,131 | |||||||||
| 1,296,131 | |||||||||||
| Media | |||||||||||
| 5,200 | Shaw Communications, Inc. | 117,448 | |||||||||
| 5,100 | Thomson Reuters Corp. | 175,400 | |||||||||
| 292,848 | |||||||||||
| Metals & Mining | |||||||||||
| 2,300 | Agnico-Eagle Mines Ltd. | 127,921 | |||||||||
| 13,100 | Barrick Gold Corp. | 624,528 | |||||||||
| 7,400 | Eldorado Gold Corp. | 127,406 | |||||||||
| 1,400 | First Quantum Minerals Ltd. | 194,091 | |||||||||
| 9,800 | Goldcorp, Inc. | 468,640 | |||||||||
| 11,900 | Kinross Gold Corp. | 194,446 | |||||||||
| 4,800 | Silver Wheaton Corp. | 172,869 | |||||||||
| 6,500 | Teck Resources Ltd. | 322,058 | |||||||||
| 10,100 | Yamana Gold, Inc. | 131,502 | |||||||||
| 2,363,461 | |||||||||||
| Oil, Gas & Consumable Fuels | |||||||||||
| 5,600 | Cameco Corp. | 148,931 | |||||||||
| 14,400 | Canadian Natural Resources Ltd. | 581,456 | |||||||||
| 3,500 | Canadian Oil Sands Ltd. | 95,646 | |||||||||
| NUMBER OF SHARES | VALUE | ||||||||||
| 10,000 | Cenovus Energy, Inc. | $ | 384,426 | ||||||||
| 2,700 | Crescent Point Energy Corp. | 121,372 | |||||||||
| 11,600 | Enbridge, Inc. | 380,859 | |||||||||
| 10,500 | EnCana Corp. | 308,038 | |||||||||
| 3,600 | Husky Energy, Inc. | 100,790 | |||||||||
| 3,500 | Imperial Oil Ltd. | 153,854 | |||||||||
| 8,200 | Nexen, Inc. | 191,301 | |||||||||
| 5,700 | Penn West Petroleum Ltd. | 126,952 | |||||||||
| 1,400 | Petrobank Energy & Resources Ltd. (a) | 21,686 | |||||||||
| 859 | Petrominerales Ltd. | 27,403 | |||||||||
| 19,800 | Suncor Energy, Inc. | 758,884 | |||||||||
| 14,200 | Talisman Energy, Inc. | 258,601 | |||||||||
| 8,800 | TransCanada Corp. | 369,702 | |||||||||
| 4,029,901 | |||||||||||
| Real Estate Management & Development | |||||||||||
| 7,500 | Brookfield Asset Management, Inc. Class A | 236,276 | |||||||||
| 5,800 | Brookfield Office Properties, Inc. | 110,179 | |||||||||
| 346,455 | |||||||||||
| Road & Rail | |||||||||||
| 6,100 | Canadian National Railway Co. | 457,380 | |||||||||
| 2,300 | Canadian Pacific Railway Ltd. | 146,866 | |||||||||
| 604,246 | |||||||||||
| Wireless Telecommunication Services | |||||||||||
| 5,400 | Rogers Communications, Inc. | 206,177 | |||||||||
| Total Canada | 15,033,381 | ||||||||||
See Notes to Financial Statements
16
Morgan Stanley Global Strategist Fund
Portfolio of Investments n July 31, 2011 continued
| NUMBER OF SHARES | VALUE | ||||||||||
| Chile (0.0%) | |||||||||||
| Metals & Mining | |||||||||||
| 2,716 | Antofagasta PLC | $ | 62,202 | ||||||||
| China (0.1%) | |||||||||||
| Insurance | |||||||||||
| 67,200 | AIA Group Ltd. (a) | 246,483 | |||||||||
| Denmark (0.2%) | |||||||||||
| Chemicals | |||||||||||
| 552 | Novozymes A/S Class B | 90,124 | |||||||||
| Commercial Banks | |||||||||||
| 6,264 | Danske Bank A/S (a) | 121,267 | |||||||||
| Electrical Equipment | |||||||||||
| 3,486 | Vestas Wind Systems A/S (a) | 76,209 | |||||||||
| Marine | |||||||||||
| 5 | AP Moller - Maersk A/S | 36,822 | |||||||||
| 11 | AP Moller - Maersk A/S Series B | 84,068 | |||||||||
| 120,890 | |||||||||||
| Pharmaceuticals | |||||||||||
| 4,315 | Novo Nordisk A/S Series B | 528,369 | |||||||||
| Road & Rail | |||||||||||
| 3,265 | DSV A/S | 72,255 | |||||||||
| Total Denmark | 1,009,114 | ||||||||||
| Finland (0.2%) | |||||||||||
| Auto Components | |||||||||||
| 1,401 | Nokian Renkaat OYJ | 65,634 | |||||||||
| Communications Equipment | |||||||||||
| 41,228 | Nokia OYJ | 238,575 | |||||||||
| Electric Utilities | |||||||||||
| 7,220 | Fortum OYJ | 190,587 | |||||||||
| NUMBER OF SHARES | VALUE | ||||||||||
| Insurance | |||||||||||
| 4,244 | Sampo OYJ Class A | $ | 129,049 | ||||||||
| Machinery | |||||||||||
| 3,007 | Kone OYJ Class B | 174,385 | |||||||||
| Paper & Forest Products | |||||||||||
| 13,819 | UPM-Kymmene OYJ | 215,516 | |||||||||
| Total Finland | 1,013,746 | ||||||||||
| France (2.2%) | |||||||||||
| Aerospace & Defense | |||||||||||
| 1,262 | Thales SA | 53,966 | |||||||||
| Auto Components | |||||||||||
| 2,197 | Cie Generale des Etablissements Michelin Series B | 184,002 | |||||||||
| Automobiles | |||||||||||
| 1,221 | Peugeot SA | 46,163 | |||||||||
| 1,898 | Renault SA | 100,870 | |||||||||
| 147,033 | |||||||||||
| Beverages | |||||||||||
| 2,197 | Pernod-Ricard SA | 217,046 | |||||||||
| Building Products | |||||||||||
| 2,658 | Cie de St-Gobain | 153,052 | |||||||||
| Chemicals | |||||||||||
| 3,073 | Air Liquide SA | 421,121 | |||||||||
| Commercial Banks | |||||||||||
| 12,271 | BNP Paribas SA | 793,321 | |||||||||
| 8,087 | Credit Agricole SA | 98,970 | |||||||||
| 8,194 | Societe Generale SA | 404,293 | |||||||||
| 1,296,584 | |||||||||||
| Commercial Services & Supplies | |||||||||||
| 1,823 | Edenred | 52,505 | |||||||||
| Communications Equipment | |||||||||||
| 36,703 | Alcatel-Lucent (a) | 147,859 | |||||||||
See Notes to Financial Statements
17
Morgan Stanley Global Strategist Fund
Portfolio of Investments n July 31, 2011 continued
| NUMBER OF SHARES | VALUE | ||||||||||
| Construction & Engineering | |||||||||||
| 3,026 | Bouygues SA | $ | 114,029 | ||||||||
| 5,798 | Vinci SA | 335,005 | |||||||||
| 449,034 | |||||||||||
| Construction Materials | |||||||||||
| 5,300 | Lafarge SA | 282,841 | |||||||||
| Diversified Telecommunication Services | |||||||||||
| 23,872 | France Telecom SA | 493,014 | |||||||||
| Electric Utilities | |||||||||||
| 3,650 | EDF SA | 138,545 | |||||||||
| Electrical Equipment | |||||||||||
| 4,878 | Alstom SA | 255,939 | |||||||||
| Energy Equipment & Services | |||||||||||
| 1,748 | Cie Generale de Geophysique- Veritas (a) | 58,592 | |||||||||
| 1,075 | Technip SA | 117,175 | |||||||||
| 175,767 | |||||||||||
| Food & Staples Retailing | |||||||||||
| 6,563 | Carrefour SA | 192,632 | |||||||||
| Food Products | |||||||||||
| 8,201 | Danone | 583,525 | |||||||||
| Health Care Equipment & Supplies | |||||||||||
| 1,811 | Cie Generale d'Optique Essilor International SA | 145,123 | |||||||||
| Hotels, Restaurants & Leisure | |||||||||||
| 1,422 | Accor SA | 62,488 | |||||||||
| 1,449 | Sodexo | 110,498 | |||||||||
| 172,986 | |||||||||||
| NUMBER OF SHARES | VALUE | ||||||||||
| Information Technology Services | |||||||||||
| 2,091 | Cap Gemini SA | $ | 102,605 | ||||||||
| Insurance | |||||||||||
| 20,005 | AXA SA | 373,049 | |||||||||
| Machinery | |||||||||||
| 2,864 | Vallourec SA | 290,526 | |||||||||
| Media | |||||||||||
| 799 | Eutelsat Communications SA | 34,452 | |||||||||
| 651 | JCDecaux SA (a) | 17,909 | |||||||||
| 1,047 | Publicis Groupe SA | 53,141 | |||||||||
| 2,383 | SES SA | 64,415 | |||||||||
| 1,176 | Societe Television Francaise 1 | 22,360 | |||||||||
| 19,316 | Vivendi SA | 460,624 | |||||||||
| 652,901 | |||||||||||
| Metals & Mining | |||||||||||
| 14,753 | ArcelorMittal | 458,559 | |||||||||
| Multi-Utilities | |||||||||||
| 15,042 | GDF Suez | 490,508 | |||||||||
| 4,572 | Suez Environnement Co. | 84,557 | |||||||||
| 6,294 | Veolia Environnement SA | 142,107 | |||||||||
| 717,172 | |||||||||||
| Multiline Retail | |||||||||||
| 1,608 | PPR | 296,233 | |||||||||
| Oil, Gas & Consumable Fuels | |||||||||||
| 25,761 | Total SA | 1,388,514 | |||||||||
| Personal Products | |||||||||||
| 2,915 | L'Oreal SA | 349,660 | |||||||||
| Pharmaceuticals | |||||||||||
| 14,245 | Sanofi | 1,105,813 | |||||||||
| Professional Services | |||||||||||
| 581 | Bureau Veritas SA | 47,335 | |||||||||
See Notes to Financial Statements
18
Morgan Stanley Global Strategist Fund
Portfolio of Investments n July 31, 2011 continued
| NUMBER OF SHARES | VALUE | ||||||||||
| Real Estate Investment Trusts (REITs) | |||||||||||
| 86 | ICADE REIT | $ | 9,882 | ||||||||
| 1,957 | Unibail-Rodamco SE REIT | 435,691 | |||||||||
| 445,573 | |||||||||||
| Textiles, Apparel & Luxury Goods | |||||||||||
| 841 | Christian Dior SA | 133,991 | |||||||||
| 2,824 | LVMH Moet Hennessy Louis Vuitton SA | 515,419 | |||||||||
| 649,410 | |||||||||||
| Transportation Infrastructure | |||||||||||
| 480 | Aeroports de Paris (ADP) | 43,527 | |||||||||
| 8,247 | Groupe Eurotunnel SA | 87,738 | |||||||||
| 131,265 | |||||||||||
| Total France | 12,571,189 | ||||||||||
| Germany (2.2%) | |||||||||||
| Air Freight & Logistics | |||||||||||
| 6,962 | Deutsche Post AG | 123,053 | |||||||||
| Airlines | |||||||||||
| 4,169 | Deutsche Lufthansa AG | 84,097 | |||||||||
| Auto Components | |||||||||||
| 611 | Continental AG (a) | 60,995 | |||||||||
| Automobiles | |||||||||||
| 4,034 | Bayerische Motoren Werke AG | 404,473 | |||||||||
| 9,037 | Daimler AG (Registered) | 657,489 | |||||||||
| 898 | Porsche Automobil Holding SE (Preference) | 68,987 | |||||||||
| 372 | Volkswagen AG | 68,241 | |||||||||
| NUMBER OF SHARES | VALUE | ||||||||||
| 2,127 | Volkswagen AG (Preference) | $ | 425,015 | ||||||||
| 1,624,205 | |||||||||||
| Capital Markets | |||||||||||
| 13,651 | Deutsche Bank AG (Registered) | 752,430 | |||||||||
| Chemicals | |||||||||||
| 15,460 | BASF SE | 1,403,478 | |||||||||
| 1,711 | K&S AG | 137,005 | |||||||||
| 1,060 | Lanxess AG | 85,484 | |||||||||
| 1,898 | Linde AG | 340,714 | |||||||||
| 1,966,681 | |||||||||||
| Commercial Banks | |||||||||||
| 55,397 | Commerzbank AG (a) | 210,433 | |||||||||
| Diversified Financial Services | |||||||||||
| 1,518 | Deutsche Boerse AG (a) | 112,008 | |||||||||
| Diversified Telecommunication Services | |||||||||||
| 38,920 | Deutsche Telekom AG | 606,107 | |||||||||
| Electric Utilities | |||||||||||
| 23,874 | E.ON AG | 659,013 | |||||||||
| Food & Staples Retailing | |||||||||||
| 1,485 | Metro AG | 82,197 | |||||||||
| Food Products | |||||||||||
| 526 | Suedzucker AG | 18,562 | |||||||||
| Health Care Equipment & Supplies | |||||||||||
| 1,482 | Fresenius SE & Co. KGaA | 158,689 | |||||||||
| Health Care Providers & Services | |||||||||||
| 2,175 | Fresenius Medical Care AG & Co. KGaA | 166,822 | |||||||||
See Notes to Financial Statements
19
Morgan Stanley Global Strategist Fund
Portfolio of Investments n July 31, 2011 continued
| NUMBER OF SHARES | VALUE | ||||||||||
| Hotels, Restaurants & Leisure | |||||||||||
| 1,926 | TUI AG (a) | $ | 17,859 | ||||||||
| Household Products | |||||||||||
| 2,028 | Henkel AG & Co. KGaA | 110,453 | |||||||||
| 2,292 | Henkel AG & Co. KGaA (Preference) | 154,764 | |||||||||
| 265,217 | |||||||||||
| Industrial Conglomerates | |||||||||||
| 11,391 | Siemens AG (Registered) | 1,462,161 | |||||||||
| Insurance | |||||||||||
| 6,033 | Allianz SE | 788,892 | |||||||||
| 2,525 | Muenchener Rueckversicherungs AG (Registered) | 373,779 | |||||||||
| 1,162,671 | |||||||||||
| Life Sciences Tools & Services | |||||||||||
| 3,223 | QIAGEN N.V. (a) | 54,277 | |||||||||
| Media | |||||||||||
| 300 | Axel Springer AG | 13,228 | |||||||||
| 474 | Kabel Deutschland Holding AG (a) | 26,729 | |||||||||
| 686 | ProSiebenSat.1 Media AG | 17,684 | |||||||||
| 57,641 | |||||||||||
| Metals & Mining | |||||||||||
| 7,442 | ThyssenKrupp AG | 329,645 | |||||||||
| Multi-Utilities | |||||||||||
| 4,818 | RWE AG | 252,850 | |||||||||
| Personal Products | |||||||||||
| 1,091 | Beiersdorf AG | 70,367 | |||||||||
| NUMBER OF SHARES | VALUE | ||||||||||
| Pharmaceuticals | |||||||||||
| 10,028 | Bayer AG (Registered) | $ | 805,614 | ||||||||
| 672 | Merck KGaA | 71,818 | |||||||||
| 877,432 | |||||||||||
| Semiconductors & Semiconductor Equipment | |||||||||||
| 14,309 | Infineon Technologies AG | 143,545 | |||||||||
| Software | |||||||||||
| 13,756 | SAP AG | 862,216 | |||||||||
| Specialty Retail | |||||||||||
| 8,106 | Esprit Holdings Ltd. (d) | 23,626 | |||||||||
| Textiles, Apparel & Luxury Goods | |||||||||||
| 2,433 | Adidas AG | 180,788 | |||||||||
| Transportation Infrastructure | |||||||||||
| 344 | Fraport AG Frankfurt Airport Services Worldwide | 27,574 | |||||||||
| Total Germany | 12,413,161 | ||||||||||
| Greece (0.0%) | |||||||||||
| Commercial Banks | |||||||||||
| 14,355 | National Bank of Greece SA (a) | 97,291 | |||||||||
| Hong Kong (0.4%) | |||||||||||
| Commercial Banks | |||||||||||
| 15,457 | Bank of East Asia Ltd. | 59,804 | |||||||||
| 36,500 | BOC Hong Kong Holdings Ltd. | 109,363 | |||||||||
| 11,500 | Hang Seng Bank Ltd. | 180,527 | |||||||||
| 349,694 | |||||||||||
See Notes to Financial Statements
20
Morgan Stanley Global Strategist Fund
Portfolio of Investments n July 31, 2011 continued
| NUMBER OF SHARES | VALUE | ||||||||||
| Diversified Financial Services | |||||||||||
| 9,823 | Hong Kong Exchanges and Clearing Ltd. | $ | 202,345 | ||||||||
| Electric Utilities | |||||||||||
| 19,000 | CLP Holdings Ltd. | 175,609 | |||||||||
| 14,500 | Power Assets Holdings Ltd. | 119,993 | |||||||||
| 295,602 | |||||||||||
| Gas Utilities | |||||||||||
| 39,600 | Hong Kong & China Gas Co., Ltd. | 96,889 | |||||||||
| Hotels, Restaurants & Leisure | |||||||||||
| 28,400 | Sands China Ltd. (a) | 85,808 | |||||||||
| Industrial Conglomerates | |||||||||||
| 21,000 | Hutchison Whampoa Ltd. | 244,272 | |||||||||
| Real Estate Investment Trusts (REITs) | |||||||||||
| 19,412 | Link REIT (The) REIT | 67,876 | |||||||||
| Real Estate Management & Development | |||||||||||
| 14,000 | Cheung Kong Holdings Ltd. | 213,393 | |||||||||
| 8,000 | Hang Lung Group Ltd. | 48,268 | |||||||||
| 22,000 | Hang Lung Properties Ltd. | 81,574 | |||||||||
| 11,148 | Henderson Land Development Co., Ltd. | 70,512 | |||||||||
| 7,000 | Kerry Properties Ltd. | 34,036 | |||||||||
| 26,197 | New World Development Co., Ltd. | 38,490 | |||||||||
| NUMBER OF SHARES | VALUE | ||||||||||
| 18,133 | Sino Land Co., Ltd. | $ | 30,678 | ||||||||
| 13,000 | Sun Hung Kai Properties Ltd. | 197,382 | |||||||||
| 6,500 | Swire Pacific Ltd. | 91,647 | |||||||||
| 13,200 | Wharf Holdings Ltd. | 96,878 | |||||||||
| 10,000 | Wheelock & Co., Ltd. | 43,096 | |||||||||
| 945,954 | |||||||||||
| Road & Rail | |||||||||||
| 15,242 | MTR Corp. | 51,743 | |||||||||
| Total Hong Kong | 2,340,183 | ||||||||||
| India (0.0%) | |||||||||||
| Oil, Gas & Consumable Fuels | |||||||||||
| 16,376 | Cairn Energy PLC (a) | 98,738 | |||||||||
| Indonesia (0.3%) | |||||||||||
| Automobiles | |||||||||||
| 29,000 | Astra International Tbk PT | 239,929 | |||||||||
| Commercial Banks | |||||||||||
| 169,000 | Bank Central Asia Tbk PT | 164,451 | |||||||||
| 46,500 | Bank Danamon Indonesia Tbk PT | 29,752 | |||||||||
| 103,500 | Bank Mandiri Tbk PT | 95,326 | |||||||||
| 70,000 | Bank Negara Indonesia Persero Tbk PT | 36,530 | |||||||||
| 161,000 | Bank Rakyat Indonesia Persero Tbk PT | 130,610 | |||||||||
| 456,669 | |||||||||||
| Construction Materials | |||||||||||
| 20,500 | Indocement Tunggal Prakarsa Tbk PT | 37,181 | |||||||||
| 56,000 | Semen Gresik Persero Tbk PT | 62,133 | |||||||||
| 99,314 | |||||||||||
See Notes to Financial Statements
21
Morgan Stanley Global Strategist Fund
Portfolio of Investments n July 31, 2011 continued
| NUMBER OF SHARES | VALUE | ||||||||||
| Diversified Telecommunication Services | |||||||||||
| 131,000 | Telekomunikasi Indonesia Tbk PT | $ | 113,029 | ||||||||
| Food Products | |||||||||||
| 69,000 | Indofood Sukses Makmur Tbk PT | 51,515 | |||||||||
| Gas Utilities | |||||||||||
| 159,000 | Perusahaan Gas Negara PT | 74,198 | |||||||||
| Household Products | |||||||||||
| 19,000 | Unilever Indonesia Tbk PT | 34,849 | |||||||||
| Machinery | |||||||||||
| 25,787 | United Tractors Tbk PT | 82,574 | |||||||||
| Oil, Gas & Consumable Fuels | |||||||||||
| 153,800 | Adaro Energy Tbk PT | 47,645 | |||||||||
| 257,500 | Bumi Resources Tbk PT | 92,105 | |||||||||
| 6,000 | Indo Tambangraya Megah PT | 35,629 | |||||||||
| 12,500 | Tambang Batubara Bukit Asam Tbk PT | 31,270 | |||||||||
| 206,649 | |||||||||||
| Tobacco | |||||||||||
| 9,500 | Gudang Garam Tbk PT | 56,775 | |||||||||
| Total Indonesia | 1,415,501 | ||||||||||
| Israel (0.1%) | |||||||||||
| Pharmaceuticals | |||||||||||
| 14,798 | Teva Pharmaceutical Industries Ltd. ADR | 690,179 | |||||||||
| NUMBER OF SHARES | VALUE | ||||||||||
| Italy (0.6%) | |||||||||||
| Aerospace & Defense | |||||||||||
| 4,799 | Finmeccanica SpA | $ | 36,786 | ||||||||
| Automobiles | |||||||||||
| 8,670 | Fiat SpA | 85,239 | |||||||||
| Commercial Banks | |||||||||||
| 135,244 | Intesa Sanpaolo SpA | 312,236 | |||||||||
| 199,907 | UniCredit SpA | 355,147 | |||||||||
| 667,383 | |||||||||||
| Diversified Telecommunication Services | |||||||||||
| 302,129 | Telecom Italia SpA | 352,819 | |||||||||
| Electric Utilities | |||||||||||
| 96,474 | Enel SpA | 553,876 | |||||||||
| Energy Equipment & Services | |||||||||||
| 2,888 | Saipem SpA | 150,053 | |||||||||
| Gas Utilities | |||||||||||
| 52,205 | Snam Rete Gas SpA | 301,404 | |||||||||
| Insurance | |||||||||||
| 23,389 | Assicurazioni Generali SpA | 442,807 | |||||||||
| Machinary | |||||||||||
| 5,967 | Fiat Industrial SpA (a) | 78,793 | |||||||||
| Oil, Gas & Consumable Fuels | |||||||||||
| 36,931 | ENI SpA | 800,716 | |||||||||
| Textiles, Apparel & Luxury Goods | |||||||||||
| 1,567 | Luxottica Group SpA | 49,723 | |||||||||
| Transportation Infrastructure | |||||||||||
| 4,173 | Atlantia SpA | 77,072 | |||||||||
| Total Italy | 3,596,671 | ||||||||||
See Notes to Financial Statements
22
Morgan Stanley Global Strategist Fund
Portfolio of Investments n July 31, 2011 continued
| NUMBER OF SHARES | VALUE | ||||||||||
| Japan (5.0%) | |||||||||||
| Air Freight & Logistics | |||||||||||
| 9,000 | Yamato Holdings Co., Ltd. | $ | 154,401 | ||||||||
| Auto Components | |||||||||||
| 3,700 | Aisin Seiki Co., Ltd. | 143,308 | |||||||||
| 9,000 | Bridgestone Corp. | 224,192 | |||||||||
| 8,500 | Denso Corp. | 303,067 | |||||||||
| 3,600 | Toyota Industries Corp. | 118,014 | |||||||||
| 788,581 | |||||||||||
| Automobiles | |||||||||||
| 20,695 | Honda Motor Co., Ltd. ADR | 823,247 | |||||||||
| 24,000 | Mazda Motor Corp. (a) | 66,308 | |||||||||
| 97,000 | Mitsubishi Motors Corp. (a) | 127,025 | |||||||||
| 33,300 | Nissan Motor Co., Ltd. | 356,326 | |||||||||
| 5,600 | Suzuki Motor Corp. | 130,062 | |||||||||
| 38,200 | Toyota Motor Corp. | 1,563,435 | |||||||||
| 3,066,403 | |||||||||||
| Beverages | |||||||||||
| 4,800 | Asahi Group Holdings Ltd. | 101,632 | |||||||||
| 13,000 | Kirin Holdings Co., Ltd. | 191,305 | |||||||||
| 292,937 | |||||||||||
| Building Products | |||||||||||
| 15,000 | Asahi Glass Co., Ltd. | 173,656 | |||||||||
| 3,500 | Daikin Industries Ltd. | 124,329 | |||||||||
| 5,300 | JS Group Corp. | 132,828 | |||||||||
| 430,813 | |||||||||||
| Capital Markets | |||||||||||
| 31,000 | Daiwa Securities Group, Inc. | 135,136 | |||||||||
| 49,000 | Nomura Holdings, Inc. | 238,991 | |||||||||
| 374,127 | |||||||||||
| NUMBER OF SHARES | VALUE | ||||||||||
| Chemicals | |||||||||||
| 26,000 | Asahi Kasei Corp. | $ | 183,836 | ||||||||
| 3,000 | JSR Corp. | 61,290 | |||||||||
| 5,000 | Kuraray Co., Ltd. | 75,635 | |||||||||
| 20,000 | Mitsubishi Chemical Holdings Corp. | 156,420 | |||||||||
| 2,200 | Nitto Denko Corp. | 106,101 | |||||||||
| 4,300 | Shin-Etsu Chemical Co., Ltd. | 232,314 | |||||||||
| 22,000 | Sumitomo Chemical Co., Ltd. | 111,874 | |||||||||
| 26,000 | Toray Industries, Inc. | 202,043 | |||||||||
| 1,129,513 | |||||||||||
| Commercial Banks | |||||||||||
| 22,000 | Bank of Yokohama Ltd. (The) | 107,947 | |||||||||
| 14,000 | Chiba Bank Ltd. (The) | 88,819 | |||||||||
| 193,500 | Mizuho Financial Group, Inc. | 318,704 | |||||||||
| 7,600 | Resona Holdings, Inc. | 37,651 | |||||||||
| 12,000 | Shizuoka Bank Ltd. (The) | 112,914 | |||||||||
| 18,100 | Sumitomo Mitsui Financial Group, Inc. | 571,407 | |||||||||
| 37,000 | Sumitomo Mitsui Trust Holdings, Inc. | 136,281 | |||||||||
| 1,373,723 | |||||||||||
| Commercial Services & Supplies | |||||||||||
| 11,000 | Dai Nippon Printing Co., Ltd. | 124,980 | |||||||||
| 2,800 | Secom Co., Ltd. | 139,988 | |||||||||
| 11,000 | Toppan Printing Co., Ltd. | 87,046 | |||||||||
| 352,014 | |||||||||||
| Computers & Peripherals | |||||||||||
| 25,000 | Fujitsu Ltd. | 147,275 | |||||||||
| 58,000 | Toshiba Corp. | 302,315 | |||||||||
| 449,590 | |||||||||||
See Notes to Financial Statements
23
Morgan Stanley Global Strategist Fund
Portfolio of Investments n July 31, 2011 continued
| NUMBER OF SHARES | VALUE | ||||||||||
| Construction & Engineering | |||||||||||
| 3,000 | JGC Corp. | $ | 93,595 | ||||||||
| Diversified Financial Services | |||||||||||
| 1,380 | ORIX Corp. | 149,271 | |||||||||
| Diversified Telecommunication Services | |||||||||||
| 8,000 | Nippon Telegraph & Telephone Corp. | 395,247 | |||||||||
| Electric Utilities | |||||||||||
| 7,800 | Chubu Electric Power Co., Inc. | 134,221 | |||||||||
| 3,700 | Chugoku Electric Power Co., Inc. (The) | 59,922 | |||||||||
| 4,200 | Hokkaido Electric Power Co., Inc. | 64,660 | |||||||||
| 3,900 | Hokuriku Electric Power Co. | 70,106 | |||||||||
| 6,200 | Kansai Electric Power Co., Inc. (The) | 104,836 | |||||||||
| 3,900 | Kyushu Electric Power Co., Inc. | 61,650 | |||||||||
| 5,800 | Shikoku Electric Power Co., Inc. | 127,071 | |||||||||
| 6,600 | Tohoku Electric Power Co., Inc. | 85,289 | |||||||||
| 13,700 | Tokyo Electric Power Co., Inc. (The) | 75,445 | |||||||||
| 783,200 | |||||||||||
| Electrical Equipment | |||||||||||
| 27,000 | Mitsubishi Electric Corp. | 318,818 | |||||||||
| 1,400 | Nidec Corp. | 139,162 | |||||||||
| 23,800 | Sumitomo Electric Industries Ltd. | 356,229 | |||||||||
| 814,209 | |||||||||||
| NUMBER OF SHARES | VALUE | ||||||||||
| Electronic Equipment, Instruments & Components | |||||||||||
| 7,800 | FUJIFILM Holdings Corp. | $ | 236,094 | ||||||||
| 66,000 | Hitachi Ltd. | 410,042 | |||||||||
| 5,000 | Hoya Corp. | 121,625 | |||||||||
| 2,000 | Ibiden Co., Ltd. | 60,926 | |||||||||
| 600 | Keyence Corp. | 169,446 | |||||||||
| 2,100 | Kyocera Corp. | 224,691 | |||||||||
| 2,900 | Murata Manufacturing Co., Ltd. | 188,693 | |||||||||
| 6,000 | Nippon Electric Glass Co., Ltd. | 75,943 | |||||||||
| 2,800 | Omron Corp. | 78,877 | |||||||||
| 1,400 | TDK Corp. | 72,408 | |||||||||
| 1,638,745 | |||||||||||
| Food & Staples Retailing | |||||||||||
| 11,600 | Aeon Co., Ltd. | 146,172 | |||||||||
| 11,300 | Seven & I Holdings Co., Ltd. | 321,851 | |||||||||
| 468,023 | |||||||||||
| Food Products | |||||||||||
| 15,000 | Ajinomoto Co., Inc. | 185,709 | |||||||||
| Gas Utilities | |||||||||||
| 38,000 | Osaka Gas Co., Ltd. | 150,463 | |||||||||
| 34,000 | Tokyo Gas Co., Ltd. | 162,198 | |||||||||
| 312,661 | |||||||||||
| Health Care Equipment & Supplies | |||||||||||
| 3,500 | Olympus Corp. | 124,575 | |||||||||
| 2,900 | Terumo Corp. | 163,371 | |||||||||
| 287,946 | |||||||||||
| Household Durables | |||||||||||
| 25,300 | Panasonic Corp. | 301,019 | |||||||||
See Notes to Financial Statements
24
Morgan Stanley Global Strategist Fund
Portfolio of Investments n July 31, 2011 continued
| NUMBER OF SHARES | VALUE | ||||||||||
| 12,000 | Sekisui House Ltd. | $ | 114,771 | ||||||||
| 15,000 | Sharp Corp. | 138,382 | |||||||||
| 13,635 | Sony Corp. ADR | 342,239 | |||||||||
| 896,411 | |||||||||||
| Household Products | |||||||||||
| 2,400 | Unicharm Corp. | 108,404 | |||||||||
| Independent Power Producers & Energy Traders | |||||||||||
| 2,700 | Electric Power Development Co. Ltd. | 71,178 | |||||||||
| Industrial Conglomerates | |||||||||||
| 31,000 | Hankyu Hanshin Holdings, Inc. | 124,742 | |||||||||
| Information Technology Services | |||||||||||
| 30 | NTT Data Corp. | 104,091 | |||||||||
| Insurance | |||||||||||
| 5,000 | MS&AD Insurance Group Holdings | 125,678 | |||||||||
| 4,200 | T&D Holdings, Inc. | 103,347 | |||||||||
| 6,500 | Tokio Marine Holdings, Inc. | 191,796 | |||||||||
| 420,821 | |||||||||||
| Internet & Catalog Retail | |||||||||||
| 139 | Rakuten, Inc. | 141,585 | |||||||||
| Internet Software & Services | |||||||||||
| 276 | Yahoo! Japan Corp. | 97,816 | |||||||||
| Leisure Equipment & Products | |||||||||||
| 4,600 | Nikon Corp. | 108,018 | |||||||||
| Machinery | |||||||||||
| 2,500 | FANUC Corp. | 473,599 | |||||||||
| NUMBER OF SHARES | VALUE | ||||||||||
| 5,000 | Japan Steel Works Ltd. (The) | $ | 35,229 | ||||||||
| 38,000 | Kawasaki Heavy Industries Ltd. | 139,418 | |||||||||
| 13,600 | Komatsu Ltd. | 424,328 | |||||||||
| 18,000 | Kubota Corp. | 163,189 | |||||||||
| 1,600 | Makita Corp. | 75,312 | |||||||||
| 49,000 | Mitsubishi Heavy Industries Ltd. | 228,835 | |||||||||
| 5,000 | NGK Insulators Ltd. | 91,525 | |||||||||
| 10,000 | NSK Ltd. | 97,284 | |||||||||
| 800 | SMC Corp. | 147,238 | |||||||||
| 1,875,957 | |||||||||||
| Marine | |||||||||||
| 18,000 | Mitsui OSK Lines Ltd. | 94,577 | |||||||||
| 34,000 | Nippon Yusen KK | 124,863 | |||||||||
| 219,440 | |||||||||||
| Media | |||||||||||
| 3,200 | Dentsu, Inc. | 99,931 | |||||||||
| Metals & Mining | |||||||||||
| 5,800 | JFE Holdings, Inc. | 157,999 | |||||||||
| 73,000 | Kobe Steel Ltd. | 160,954 | |||||||||
| 74,000 | Nippon Steel Corp. | 249,605 | |||||||||
| 49,000 | Sumitomo Metal Industries Ltd. | 117,621 | |||||||||
| 8,000 | Sumitomo Metal Mining Co., Ltd. | 141,819 | |||||||||
| 827,998 | |||||||||||
| Multiline Retail | |||||||||||
| 5,400 | Isetan Mitsukoshi Holdings Ltd. | 57,298 | |||||||||
| Office Electronics | |||||||||||
| 14,400 | Canon, Inc. | 700,282 | |||||||||
| 5,000 | Konica Minolta Holdings, Inc. | 40,614 | |||||||||
| 11,000 | Ricoh Co., Ltd. | 118,754 | |||||||||
| 859,650 | |||||||||||
See Notes to Financial Statements
25
Morgan Stanley Global Strategist Fund
Portfolio of Investments n July 31, 2011 continued
| NUMBER OF SHARES | VALUE | ||||||||||
| Oil, Gas & Consumable Fuels | |||||||||||
| 12 | Inpex Corp. | $ | 93,147 | ||||||||
| Paper & Forest Products | |||||||||||
| 13,000 | OJI Paper Co., Ltd. | 65,145 | |||||||||
| Personal Products | |||||||||||
| 8,100 | Kao Corp. | 229,244 | |||||||||
| 6,500 | Shiseido Co., Ltd. | 124,868 | |||||||||
| 354,112 | |||||||||||
| Pharmaceuticals | |||||||||||
| 5,100 | Astellas Pharma, Inc. | 198,299 | |||||||||
| 4,900 | Chugai Pharmaceutical Co., Ltd. | 86,991 | |||||||||
| 9,700 | Daiichi Sankyo Co., Ltd. | 200,540 | |||||||||
| 3,800 | Eisai Co., Ltd. | 154,387 | |||||||||
| 1,500 | Ono Pharmaceutical Co., Ltd. | 83,939 | |||||||||
| 6,400 | Shionogi & Co., Ltd. | 110,613 | |||||||||
| 10,200 | Takeda Pharmaceutical Co., Ltd. | 487,367 | |||||||||
| 1,322,136 | |||||||||||
| Real Estate Investment Trusts (REITs) | |||||||||||
| 8 | Japan Real Estate Investment Corp. REIT | 80,307 | |||||||||
| 8 | Nippon Building Fund, Inc. REIT | 81,977 | |||||||||
| 162,284 | |||||||||||
| Real Estate Management & Development | |||||||||||
| 1,400 | Daito Trust Construction Co., Ltd. | 134,756 | |||||||||
| 11,000 | Daiwa House Industry Co., Ltd. | 148,073 | |||||||||
| NUMBER OF SHARES | VALUE | ||||||||||
| 16,000 | Mitsubishi Estate Co., Ltd. | $ | 287,297 | ||||||||
| 12,000 | Mitsui Fudosan Co., Ltd. | 228,624 | |||||||||
| 7,000 | Sumitomo Realty & Development Co., Ltd. | 173,041 | |||||||||
| 971,791 | |||||||||||
| Road & Rail | |||||||||||
| 23 | Central Japan Railway Co. | 198,550 | |||||||||
| 4,800 | East Japan Railway Co. | 301,535 | |||||||||
| 10,000 | Keikyu Corp. | 77,885 | |||||||||
| 10,000 | Keio Corp. | 60,463 | |||||||||
| 41,000 | Kintetsu Corp. | 138,674 | |||||||||
| 22,000 | Nippon Express Co., Ltd. | 97,066 | |||||||||
| 16,000 | Odakyu Electric Railway Co. Ltd. | 138,107 | |||||||||
| 33,000 | Tobu Railway Co., Ltd. | 143,934 | |||||||||
| 18,000 | Tokyu Corp. | 80,769 | |||||||||
| 2,800 | West Japan Railway Co. | 119,091 | |||||||||
| 1,356,074 | |||||||||||
| Semiconductors & Semiconductor Equipment | |||||||||||
| 2,300 | Advantest Corp. | 40,834 | |||||||||
| 1,200 | Rohm Co., Ltd. | 70,067 | |||||||||
| 2,000 | Tokyo Electron Ltd. | 107,869 | |||||||||
| 218,770 | |||||||||||
| Software | |||||||||||
| 1,300 | Nintendo Co., Ltd. | 207,283 | |||||||||
| 1,800 | Trend Micro, Inc. | 56,473 | |||||||||
| 263,756 | |||||||||||
See Notes to Financial Statements
26
Morgan Stanley Global Strategist Fund
Portfolio of Investments n July 31, 2011 continued
| NUMBER OF SHARES | VALUE | ||||||||||
| Specialty Retail | |||||||||||
| 600 | Fast Retailing Co., Ltd. | $ | 106,448 | ||||||||
| 1,370 | Yamada Denki Co., Ltd. | 109,300 | |||||||||
| 215,748 | |||||||||||
| Tobacco | |||||||||||
| 82 | Japan Tobacco, Inc. | 373,319 | |||||||||
| Trading Companies & Distributors | |||||||||||
| 22,000 | ITOCHU Corp. | 254,873 | |||||||||
| 30,000 | Marubeni Corp. | 224,870 | |||||||||
| 17,700 | Mitsubishi Corp. | 475,094 | |||||||||
| 27,100 | Mitsui & Co., Ltd. | 511,358 | |||||||||
| 16,000 | Sumitomo Corp. | 226,585 | |||||||||
| 1,692,780 | |||||||||||
| Wireless Telecommunication Services | |||||||||||
| 53 | KDDI Corp. | 394,343 | |||||||||
| 202 | NTT DoCoMo, Inc. | 371,001 | |||||||||
| 10,200 | Softbank Corp. | 398,062 | |||||||||
| 1,163,406 | |||||||||||
| Total Japan | 27,806,516 | ||||||||||
| Kazakhstan (0.0%) | |||||||||||
| Metals & Mining | |||||||||||
| 2,888 | Kazakhmys PLC | 63,216 | |||||||||
| Luxembourg (0.0%) | |||||||||||
| Media | |||||||||||
| 252 | SES SA | 6,800 | |||||||||
| Netherlands (0.5%) | |||||||||||
| Air Freight & Logistics | |||||||||||
| 4,151 | PostNL N.V. | 32,333 | |||||||||
| 4,151 | TNT Express N.V. (a) | 42,050 | |||||||||
| 74,383 | |||||||||||
| NUMBER OF SHARES | VALUE | ||||||||||
| Beverages | |||||||||||
| 4,165 | Heineken N.V. | $ | 246,149 | ||||||||
| Chemicals | |||||||||||
| 4,900 | Akzo Nobel N.V. | 298,425 | |||||||||
| 3,775 | Koninklijke DSM N.V. | 213,634 | |||||||||
| 1,076 | LyondellBasell Industries N.V. Class A | 42,459 | |||||||||
| 554,518 | |||||||||||
| Diversified Financial Services | |||||||||||
| 56,175 | ING Groep N.V. (a) | 600,966 | |||||||||
| Diversified Telecommunication Services | |||||||||||
| 6,736 | Koninklijke KPN N.V. | 96,151 | |||||||||
| Energy Equipment & Services | |||||||||||
| 657 | Fugro N.V. | 50,543 | |||||||||
| Food & Staples Retailing | |||||||||||
| 13,650 | Koninklijke Ahold N.V. | 181,589 | |||||||||
| Food Products | |||||||||||
| 17,682 | Unilever N.V. CVA | 574,953 | |||||||||
| Industrial Conglomerates | |||||||||||
| 13,838 | Koninklijke Philips Electronics N.V. | 344,629 | |||||||||
| Professional Services | |||||||||||
| 1,207 | Randstad Holding N.V. | 54,157 | |||||||||
| Semiconductors & Semiconductor Equipment | |||||||||||
| 3,663 | ASML Holding N.V. | 130,234 | |||||||||
See Notes to Financial Statements
27
Morgan Stanley Global Strategist Fund
Portfolio of Investments n July 31, 2011 continued
| NUMBER OF SHARES | VALUE | ||||||||||
| Transportation Infrastructure | |||||||||||
| 1,006 | Koninklijke Vopak N.V. | $ | 50,081 | ||||||||
| Total Netherlands | 2,958,353 | ||||||||||
| Norway (0.2%) | |||||||||||
| Chemicals | |||||||||||
| 2,032 | Yara International ASA | 115,578 | |||||||||
| Commercial Banks | |||||||||||
| 12,892 | DnB NOR ASA | 187,151 | |||||||||
| Construction & Engineering | |||||||||||
| 1,677 | Kvaerner ASA (a) | 3,563 | |||||||||
| Diversified Telecommunication Services | |||||||||||
| 18,879 | Telenor ASA | 314,787 | |||||||||
| Energy Equipment & Services | |||||||||||
| 1,677 | Aker Solutions ASA | 29,325 | |||||||||
| 2,860 | Subsea 7 SA (a) | 75,218 | |||||||||
| 104,543 | |||||||||||
| Industrial Conglomerates | |||||||||||
| 10,385 | Orkla ASA | 97,680 | |||||||||
| Metals & Mining | |||||||||||
| 12,763 | Norsk Hydro ASA | 90,516 | |||||||||
| Oil, Gas & Consumable Fuels | |||||||||||
| 14,665 | Statoil ASA | 358,948 | |||||||||
| Semiconductors & Semiconductor Equipment | |||||||||||
| 6,482 | Renewable Energy Corp. ASA (a) | 11,996 | |||||||||
| Total Norway | 1,284,762 | ||||||||||
| NUMBER OF SHARES | VALUE | ||||||||||
| Poland (0.0%) | |||||||||||
| Food & Staples Retailing | |||||||||||
| 3,072 | Jeronimo Martins SGPS SA | $ | 59,967 | ||||||||
| Portugal (0.0%) | |||||||||||
| Diversified Telecommunication Services | |||||||||||
| 13,277 | Portugal Telecom SGPS SA | 114,903 | |||||||||
| Oil, Gas & Consumable Fuels | |||||||||||
| 2,866 | Galp Energia SGPS SA Class B | 64,562 | |||||||||
| Total Portugal | 179,465 | ||||||||||
| Russia (0.7%) | |||||||||||
| Commercial Banks | |||||||||||
| 30,225 | Sberbank of Russia ADR | 446,246 | |||||||||
| 20,706 | VTB Bank OJSC GDR | 123,259 | |||||||||
| 569,505 | |||||||||||
| Electric Utilities | |||||||||||
| 24,753 | Federal Hydrogenerating Co. JSC ADR | 122,743 | |||||||||
| Food & Staples Retailing | |||||||||||
| 5,653 | Magnit OJSC GDR | 173,122 | |||||||||
| Metals & Mining | |||||||||||
| 14,442 | MMC Norilsk Nickel OJSC ADR | 383,705 | |||||||||
| Oil, Gas & Consumable Fuels | |||||||||||
| 81,336 | Gazprom OAO ADR | 1,151,000 | |||||||||
| 7,367 | Lukoil OAO ADR | 487,540 | |||||||||
See Notes to Financial Statements
28
Morgan Stanley Global Strategist Fund
Portfolio of Investments n July 31, 2011 continued
| NUMBER OF SHARES | VALUE | ||||||||||
| 1,263 | NovaTek OAO GDR | $ | 194,787 | ||||||||
| 29,988 | Rosneft Oil Co. GDR | 253,260 | |||||||||
| 15,000 | Surgutneftegas OJSC ADR | 152,250 | |||||||||
| 5,085 | Tatneft ADR | 212,176 | |||||||||
| 2,451,013 | |||||||||||
| Wireless Telecommunication Services | |||||||||||
| 9,100 | Mobile Telesystems OJSC ADR | 170,898 | |||||||||
| Total Russia | 3,870,986 | ||||||||||
| Spain (0.5%) | |||||||||||
| Airlines | |||||||||||
| 13,928 | International Consolidated Airlines Group SA (a) | 54,016 | |||||||||
| Commercial Banks | |||||||||||
| 52,762 | Banco Bilbao Vizcaya Argentaria SA | 551,972 | |||||||||
| 17,190 | Banco Popular Espanol SA | 88,603 | |||||||||
| 105,015 | Banco Santander SA | 1,095,848 | |||||||||
| 1,736,423 | |||||||||||
| Construction & Engineering | |||||||||||
| 3,937 | ACS Actividades de Construccion y Servicios SA | 165,921 | |||||||||
| Diversified Consumer Services | |||||||||||
| 6,563 | Distribuidora Internacional de Alimentacion SA (a) | 27,820 | |||||||||
| Diversified Financial Services | |||||||||||
| 11,821 | Criteria Caixacorp SA | 67,958 | |||||||||
| NUMBER OF SHARES | VALUE | ||||||||||
| Electric Utilities | |||||||||||
| 46,854 | Iberdrola SA | $ | 379,927 | ||||||||
| 1,447 | Red Electrica Corp. SA | 78,787 | |||||||||
| 458,714 | |||||||||||
| Oil, Gas & Consumable Fuels | |||||||||||
| 3,423 | Repsol YPF SA | 107,562 | |||||||||
| Specialty Retail | |||||||||||
| 2,715 | Inditex SA | 245,167 | |||||||||
| Transportation Infrastructure | |||||||||||
| 4,362 | Abertis Infraestructuras SA | 80,038 | |||||||||
| Total Spain | 2,943,619 | ||||||||||
| Sweden (0.8%) | |||||||||||
| Building Products | |||||||||||
| 3,778 | Assa Abloy AB Series B | 96,855 | |||||||||
| Commercial Banks | |||||||||||
| 31,561 | Nordea Bank AB | 334,751 | |||||||||
| 16,341 | Skandinaviska Enskilda Banken AB | 124,140 | |||||||||
| 6,492 | Svenska Handelsbanken AB Class A | 203,575 | |||||||||
| 4,898 | Swedbank AB Class A | 85,723 | |||||||||
| 748,189 | |||||||||||
| Communications Equipment | |||||||||||
| 31,295 | Telefonaktiebolaget LM Ericsson Class B | 391,539 | |||||||||
| Construction & Engineering | |||||||||||
| 3,281 | Skanska AB Class B | 53,252 | |||||||||
| Diversified Financial Services | |||||||||||
| 14,284 | Investor AB Class B | 309,590 | |||||||||
See Notes to Financial Statements
29
Morgan Stanley Global Strategist Fund
Portfolio of Investments n July 31, 2011 continued
| NUMBER OF SHARES | VALUE | ||||||||||
| Diversified Telecommunication Services | |||||||||||
| 38,075 | TeliaSonera AB | $ | 290,519 | ||||||||
| Household Durables | |||||||||||
| 2,950 | Electrolux AB | 55,622 | |||||||||
| 5,449 | Husqvarna AB Class B | 31,501 | |||||||||
| 87,123 | |||||||||||
| Machinery | |||||||||||
| 11,760 | Atlas Copco AB Class A | 276,574 | |||||||||
| 8,501 | Atlas Copco AB Class B | 178,100 | |||||||||
| 18,124 | Sandvik AB | 288,008 | |||||||||
| 5,966 | Scania AB Class B | 115,646 | |||||||||
| 7,462 | SKF AB Class B | 195,778 | |||||||||
| 9,802 | Volvo AB Class B | 157,646 | |||||||||
| 1,211,752 | |||||||||||
| Media | |||||||||||
| 443 | Modern Times Group AB Class B | 30,013 | |||||||||
| Paper & Forest Products | |||||||||||
| 10,171 | Svenska Cellulosa AB Class B | 147,841 | |||||||||
| Specialty Retail | |||||||||||
| 12,737 | Hennes & Mauritz AB Class B | 434,157 | |||||||||
| Tobacco | |||||||||||
| 4,977 | Swedish Match AB | 184,833 | |||||||||
| Wireless Telecommunication Services | |||||||||||
| 1,571 | Millicom International Cellular SA SDR | 188,013 | |||||||||
| Total Sweden | 4,173,676 | ||||||||||
| NUMBER OF SHARES | VALUE | ||||||||||
| Switzerland (1.8%) | |||||||||||
| Biotechnology | |||||||||||
| 971 | Actelion Ltd. (a) | $ | 49,341 | ||||||||
| Building Products | |||||||||||
| 913 | Geberit AG (a) | 215,165 | |||||||||
| Capital Markets | |||||||||||
| 16,732 | Credit Suisse Group AG (a) | 602,398 | |||||||||
| 2,315 | Julius Baer Group Ltd. (a) | 97,565 | |||||||||
| 29,606 | UBS AG (a) | 488,956 | |||||||||
| 1,188,919 | |||||||||||
| Chemicals | |||||||||||
| 89 | Givaudan SA (a) | 97,221 | |||||||||
| 887 | Syngenta AG (a) | 282,884 | |||||||||
| 380,105 | |||||||||||
| Diversified Telecommunication Services | |||||||||||
| 792 | Swisscom AG | 379,917 | |||||||||
| Electrical Equipment | |||||||||||
| 39,710 | ABB Ltd. (Registered) (a) | 949,476 | |||||||||
| Energy Equipment & Services | |||||||||||
| 3,128 | Transocean Ltd. | 190,544 | |||||||||
| Food Products | |||||||||||
| 39,510 | Nestle SA (Registered) | 2,513,396 | |||||||||
| Health Care Equipment & Supplies | |||||||||||
| 960 | Sonova Holding AG (a) | 90,163 | |||||||||
| 709 | Synthes, Inc. (e) | 127,626 | |||||||||
| 217,789 | |||||||||||
| Insurance | |||||||||||
| 836 | Swiss Re Ltd. (a) | 46,697 | |||||||||
See Notes to Financial Statements
30
Morgan Stanley Global Strategist Fund
Portfolio of Investments n July 31, 2011 continued
| NUMBER OF SHARES | VALUE | ||||||||||
| 2,686 | Zurich Financial Services AG (a) | $ | 637,446 | ||||||||
| 684,143 | |||||||||||
| Life Sciences Tools & Services | |||||||||||
| 481 | Lonza Group AG (a) | 40,912 | |||||||||
| Marine | |||||||||||
| 734 | Kuehne & Nagel International AG | 101,917 | |||||||||
| Pharmaceuticals | |||||||||||
| 24,123 | Novartis AG (Registered) | 1,478,802 | |||||||||
| 6,493 | Roche Holding AG (Genusschein) | 1,163,852 | |||||||||
| 2,642,654 | |||||||||||
| Professional Services | |||||||||||
| 1,264 | Adecco SA (a) | 75,768 | |||||||||
| 57 | SGS SA | 110,468 | |||||||||
| 186,236 | |||||||||||
| Textiles, Apparel & Luxury Goods | |||||||||||
| 5,217 | Cie Financiere Richemont SA | 335,498 | |||||||||
| 336 | Swatch Group AG (The) Series B | 181,654 | |||||||||
| 517,152 | |||||||||||
| Total Switzerland | 10,257,666 | ||||||||||
| United Kingdom (4.9%) | |||||||||||
| Aerospace & Defense | |||||||||||
| 57,484 | BAE Systems PLC | 285,235 | |||||||||
| 39,556 | Rolls-Royce Holdings PLC (a) | 421,374 | |||||||||
| 706,609 | |||||||||||
| Beverages | |||||||||||
| 28,038 | Diageo PLC | 570,066 | |||||||||
| 10,325 | SABMiller PLC | 385,324 | |||||||||
| 955,390 | |||||||||||
| NUMBER OF SHARES | VALUE | ||||||||||
| Capital Markets | |||||||||||
| 17,668 | 3i Group PLC | $ | 77,527 | ||||||||
| 9,538 | Investec PLC | 74,806 | |||||||||
| 15,236 | Man Group PLC | 55,273 | |||||||||
| 207,606 | |||||||||||
| Chemicals | |||||||||||
| 2,668 | Johnson Matthey PLC | 88,721 | |||||||||
| Commercial Banks | |||||||||||
| 145,356 | Barclays PLC | 529,629 | |||||||||
| 179,960 | HSBC Holdings PLC | 1,757,635 | |||||||||
| 433,628 | Lloyds Banking Group PLC (a) | 307,005 | |||||||||
| 224,859 | Royal Bank of Scotland Group PLC (a) | 130,605 | |||||||||
| 24,231 | Standard Chartered PLC | 616,052 | |||||||||
| 3,340,926 | |||||||||||
| Commercial Services & Supplies | |||||||||||
| 2,786 | Aggreko PLC | 87,907 | |||||||||
| 4,000 | Babcock International Group PLC | 44,091 | |||||||||
| 16,147 | G4S PLC | 72,407 | |||||||||
| 5,878 | Serco Group PLC | 51,891 | |||||||||
| 256,296 | |||||||||||
| Diversified Telecommunication Services | |||||||||||
| 111,554 | BT Group PLC | 365,594 | |||||||||
| 4,106 | Inmarsat PLC | 36,370 | |||||||||
| 401,964 | |||||||||||
| Electric Utilities | |||||||||||
| 20,711 | Scottish & Southern Energy PLC | 442,856 | |||||||||
| Energy Equipment & Services | |||||||||||
| 3,969 | AMEC PLC | 68,314 | |||||||||
See Notes to Financial Statements
31
Morgan Stanley Global Strategist Fund
Portfolio of Investments n July 31, 2011 continued
| NUMBER OF SHARES | VALUE | ||||||||||
| 3,469 | Petrofac Ltd. | $ | 79,232 | ||||||||
| 147,546 | |||||||||||
| Food & Staples Retailing | |||||||||||
| 89,278 | Tesco PLC | 559,723 | |||||||||
| 22,670 | WM Morrison Supermarkets PLC | 107,783 | |||||||||
| 667,506 | |||||||||||
| Food Products | |||||||||||
| 1,859 | Associated British Foods PLC | 32,557 | |||||||||
| 14,968 | Unilever PLC | 478,248 | |||||||||
| 510,805 | |||||||||||
| Health Care Equipment & Supplies | |||||||||||
| 12,145 | Smith & Nephew PLC | 127,400 | |||||||||
| Hotels, Restaurants & Leisure | |||||||||||
| 21,175 | Compass Group PLC | 198,588 | |||||||||
| 15,728 | TUI Travel PLC | 50,063 | |||||||||
| 248,651 | |||||||||||
| Household Products | |||||||||||
| 7,050 | Reckitt Benckiser Group PLC | 398,374 | |||||||||
| Industrial Conglomerates | |||||||||||
| 7,380 | Smiths Group PLC | 136,791 | |||||||||
| Insurance | |||||||||||
| 4,120 | Admiral Group PLC | 104,300 | |||||||||
| 38,114 | Aviva PLC | 247,783 | |||||||||
| 76,559 | Legal & General Group PLC | 139,929 | |||||||||
| 104,199 | Old Mutual PLC | 215,665 | |||||||||
| 34,837 | Prudential PLC | 391,624 | |||||||||
| 94,538 | RSA Insurance Group PLC | 202,931 | |||||||||
| 20,217 | Standard Life PLC | 65,310 | |||||||||
| 1,367,542 | |||||||||||
| NUMBER OF SHARES | VALUE | ||||||||||
| Media | |||||||||||
| 9,766 | British Sky Broadcasting Group PLC | $ | 114,092 | ||||||||
| 32,244 | ITV PLC (a) | 36,781 | |||||||||
| 14,156 | Pearson PLC | 271,445 | |||||||||
| 3,587 | Reed Elsevier PLC | 32,464 | |||||||||
| 32,585 | WPP PLC | 367,842 | |||||||||
| 822,624 | |||||||||||
| Metals & Mining | |||||||||||
| 13,867 | Anglo American PLC | 653,489 | |||||||||
| 23,594 | BHP Billiton PLC | 886,460 | |||||||||
| 1,989 | Lonmin PLC | 41,074 | |||||||||
| 1,094 | Randgold Resources Ltd. | 99,428 | |||||||||
| 15,350 | Rio Tinto PLC | 1,071,558 | |||||||||
| 1,623 | Vedanta Resources PLC | 46,730 | |||||||||
| 22,009 | Xstrata PLC | 462,444 | |||||||||
| 3,261,183 | |||||||||||
| Multi-Utilities | |||||||||||
| 58,907 | Centrica PLC | 294,981 | |||||||||
| 37,254 | National Grid PLC | 365,446 | |||||||||
| 660,427 | |||||||||||
| Multiline Retail | |||||||||||
| 10,082 | Marks & Spencer Group PLC | 57,031 | |||||||||
| 2,325 | Next PLC | 90,252 | |||||||||
| 147,283 | |||||||||||
| Oil, Gas & Consumable Fuels | |||||||||||
| 36,990 | BG Group PLC | 870,075 | |||||||||
| 216,337 | BP PLC | 1,626,275 | |||||||||
| 41,125 | Royal Dutch Shell PLC Class A | 1,498,483 | |||||||||
| 31,145 | Royal Dutch Shell PLC Class B | 1,137,386 | |||||||||
| 9,636 | Tullow Oil PLC | 193,080 | |||||||||
| 5,325,299 | |||||||||||
See Notes to Financial Statements
32
Morgan Stanley Global Strategist Fund
Portfolio of Investments n July 31, 2011 continued
| NUMBER OF SHARES | VALUE | ||||||||||
| Pharmaceuticals | |||||||||||
| 18,733 | AstraZeneca PLC | $ | 910,210 | ||||||||
| 68,041 | GlaxoSmithKline PLC | 1,518,290 | |||||||||
| 6,029 | Shire PLC | 208,796 | |||||||||
| 2,637,296 | |||||||||||
| Professional Services | |||||||||||
| 7,182 | Capita Group PLC (The) | 84,307 | |||||||||
| 11,791 | Experian PLC | 154,586 | |||||||||
| 1,847 | Intertek Group PLC | 57,817 | |||||||||
| 296,710 | |||||||||||
| Real Estate Investment Trusts (REITs) | |||||||||||
| 15,365 | British Land Co., PLC REIT | 146,722 | |||||||||
| 14,737 | Land Securities Group PLC REIT | 205,377 | |||||||||
| 352,099 | |||||||||||
| Semiconductors & Semiconductor Equipment | |||||||||||
| 17,476 | ARM Holdings PLC | 167,570 | |||||||||
| Software | |||||||||||
| 2,989 | Autonomy Corp. PLC (a) | 81,973 | |||||||||
| Textiles, Apparel & Luxury Goods | |||||||||||
| 4,972 | Burberry Group PLC | 121,249 | |||||||||
| Tobacco | |||||||||||
| 22,463 | British American Tobacco PLC | 1,035,282 | |||||||||
| 11,994 | Imperial Tobacco Group PLC | 415,238 | |||||||||
| 1,450,520 | |||||||||||
| Trading Companies & Distributors | |||||||||||
| 4,129 | Wolseley PLC | 122,158 | |||||||||
| NUMBER OF SHARES | VALUE | ||||||||||
| Wireless Telecommunication Services | |||||||||||
| 706,932 | Vodafone Group PLC | $ | 1,992,120 | ||||||||
| Total United Kingdom | 27,443,494 | ||||||||||
| United States (28.2%) | |||||||||||
| Aerospace & Defense | |||||||||||
| 7,597 | Alliant Techsystems, Inc. | 495,552 | |||||||||
| 4,266 | Boeing Co. (The) | 300,625 | |||||||||
| 1,263 | General Dynamics Corp. | 86,061 | |||||||||
| 1,020 | Goodrich Corp. | 97,043 | |||||||||
| 5,610 | Honeywell International, Inc. | 297,891 | |||||||||
| 1,644 | ITT Corp. | 87,691 | |||||||||
| 1,263 | Lockheed Martin Corp. | 95,647 | |||||||||
| 1,263 | Northrop Grumman Corp. | 76,424 | |||||||||
| 1,072 | Precision Castparts Corp. | 172,999 | |||||||||
| 19,369 | Raytheon Co. | 866,375 | |||||||||
| 1,396 | Rockwell Collins, Inc. | 76,906 | |||||||||
| 2,303 | Textron, Inc. | 53,269 | |||||||||
| 3,257 | United Technologies Corp. | 269,810 | |||||||||
| 2,976,293 | |||||||||||
| Air Freight & Logistics | |||||||||||
| 453 | C.H. Robinson Worldwide, Inc. | 32,757 | |||||||||
| 615 | Expeditors International of Washington, Inc. | 29,348 | |||||||||
| 873 | FedEx Corp. | 75,846 | |||||||||
| 2,001 | United Parcel Service, Inc. Class B | 138,509 | |||||||||
| 276,460 | |||||||||||
See Notes to Financial Statements
33
Morgan Stanley Global Strategist Fund
Portfolio of Investments n July 31, 2011 continued
| NUMBER OF SHARES | VALUE | ||||||||||
| Auto Components | |||||||||||
| 10,192 | BorgWarner, Inc. (a) | $ | 811,487 | ||||||||
| 21,416 | Johnson Controls, Inc. | 791,321 | |||||||||
| 1,500 | TRW Automotive Holdings Corp. (a) | 75,705 | |||||||||
| 1,678,513 | |||||||||||
| Automobiles | |||||||||||
| 48,814 | Ford Motor Co. (a) | 596,019 | |||||||||
| Beverages | |||||||||||
| 16,125 | Coca-Cola Co. (The) | 1,096,661 | |||||||||
| 1,713 | Coca-Cola Enterprises, Inc. | 48,152 | |||||||||
| 1,070 | Dr. Pepper Snapple Group, Inc. | 40,403 | |||||||||
| 1,900 | Molson Coors Brewing Co. | 85,595 | |||||||||
| 26,162 | PepsiCo, Inc. | 1,675,415 | |||||||||
| 2,946,226 | |||||||||||
| Biotechnology | |||||||||||
| 1,000 | Alexion Pharmaceuticals, Inc. (a) | 56,800 | |||||||||
| 8,035 | Amgen, Inc. (a) | 439,514 | |||||||||
| 1,200 | Biogen Idec, Inc. (a) | 122,244 | |||||||||
| 2,500 | Celgene Corp. (a) | 148,250 | |||||||||
| 4,100 | Gilead Sciences, Inc. (a) | 173,676 | |||||||||
| 7,054 | Human Genome Sciences, Inc. (a) | 148,205 | |||||||||
| 3,255 | Vertex Pharmaceuticals, Inc. (a) | 168,804 | |||||||||
| 1,257,493 | |||||||||||
| Capital Markets | |||||||||||
| 2,514 | Ameriprise Financial, Inc. | 136,007 | |||||||||
| 10,642 | Bank of New York Mellon Corp. (The) | 267,221 | |||||||||
| 1,032 | BlackRock, Inc. | 184,171 | |||||||||
| 4,017 | Franklin Resources, Inc. | 509,998 | |||||||||
| NUMBER OF SHARES | VALUE | ||||||||||
| 7,033 | Goldman Sachs Group, Inc. (The) | $ | 949,244 | ||||||||
| 2,576 | Invesco Ltd. | 57,136 | |||||||||
| 629 | Legg Mason, Inc. | 18,505 | |||||||||
| 27,216 | State Street Corp. | 1,128,648 | |||||||||
| 3,250,930 | |||||||||||
| Chemicals | |||||||||||
| 658 | Air Products & Chemicals, Inc. | 58,384 | |||||||||
| 382 | Airgas, Inc. | 26,243 | |||||||||
| 699 | Celanese Corp. | 38,536 | |||||||||
| 4,170 | CF Industries Holdings, Inc. | 647,684 | |||||||||
| 2,026 | Dow Chemical Co. (The) | 70,647 | |||||||||
| 130 | Eastman Chemical Co. | 12,557 | |||||||||
| 1,237 | Ecolab, Inc. | 61,850 | |||||||||
| 18,357 | EI du Pont de Nemours & Co. | 943,917 | |||||||||
| 594 | FMC Corp. | 52,017 | |||||||||
| 124 | International Flavors & Fragrances, Inc. | 7,585 | |||||||||
| 323 | Lubrizol Corp. | 43,476 | |||||||||
| 2,527 | Monsanto Co. | 185,684 | |||||||||
| 702 | Mosaic Co. (The) | 49,645 | |||||||||
| 286 | PPG Industries, Inc. | 24,081 | |||||||||
| 1,520 | Praxair, Inc. | 157,533 | |||||||||
| 38 | Sherwin-Williams Co. (The) | 2,933 | |||||||||
| 601 | Sigma-Aldrich Corp. | 40,327 | |||||||||
| 2,423,099 | |||||||||||
| Commercial Banks | |||||||||||
| 4,809 | BB&T Corp. | 123,495 | |||||||||
| 7,675 | CIT Group, Inc. (a) | 305,005 | |||||||||
| 5,119 | Fifth Third Bancorp | 64,755 | |||||||||
| 20,491 | First Republic Bank (a) | 580,305 | |||||||||
| 3,103 | PNC Financial Services Group, Inc. | 168,462 | |||||||||
See Notes to Financial Statements
34
Morgan Stanley Global Strategist Fund
Portfolio of Investments n July 31, 2011 continued
| NUMBER OF SHARES | VALUE | ||||||||||
| 25,968 | Regions Financial Corp. | $ | 158,145 | ||||||||
| 10,708 | SunTrust Banks, Inc. | 262,239 | |||||||||
| 12,411 | US Bancorp | 323,431 | |||||||||
| 29,677 | Wells Fargo & Co. | 829,175 | |||||||||
| 2,815,012 | |||||||||||
| Commercial Services & Supplies | |||||||||||
| 1,225 | Avery Dennison Corp. | 38,649 | |||||||||
| 1,813 | Cintas Corp. | 59,013 | |||||||||
| 3,568 | Iron Mountain, Inc. | 112,856 | |||||||||
| 2,606 | Pitney Bowes, Inc. | 56,159 | |||||||||
| 4,809 | Republic Services, Inc. | 139,605 | |||||||||
| 2,662 | RR Donnelley & Sons Co. | 50,072 | |||||||||
| 1,649 | Stericycle, Inc. (a) | 135,416 | |||||||||
| 5,803 | Waste Management, Inc. | 182,737 | |||||||||
| 774,507 | |||||||||||
| Communications Equipment | |||||||||||
| 56,740 | Cisco Systems, Inc. | 906,138 | |||||||||
| 6,065 | Juniper Networks, Inc. (a) | 141,860 | |||||||||
| 2,650 | Motorola Mobility Holdings, Inc. (a) | 59,307 | |||||||||
| 971 | Motorola Solutions, Inc. (a) | 43,588 | |||||||||
| 15,836 | Qualcomm, Inc. | 867,496 | |||||||||
| 2,018,389 | |||||||||||
| Computers & Peripherals | |||||||||||
| 10,007 | Apple, Inc. (a) | 3,907,533 | |||||||||
| 12,298 | Dell, Inc. (a) | 199,719 | |||||||||
| 20,553 | EMC Corp. (a) | 536,022 | |||||||||
| 12,298 | Hewlett-Packard Co. | 432,398 | |||||||||
| 3,538 | NetApp, Inc. (a) | 168,126 | |||||||||
| 44,190 | SanDisk Corp. (a) | 1,879,401 | |||||||||
| 19,974 | Western Digital Corp. (a) | 688,304 | |||||||||
| 7,811,503 | |||||||||||
| NUMBER OF SHARES | VALUE | ||||||||||
| Construction & Engineering | |||||||||||
| 1,484 | Fluor Corp. | $ | 94,278 | ||||||||
| 21,926 | Foster Wheeler AG (a) | 594,195 | |||||||||
| 1,391 | Jacobs Engineering Group, Inc. (a) | 54,444 | |||||||||
| 1,628 | KBR, Inc. | 58,038 | |||||||||
| 20,535 | URS Corp. (a) | 838,444 | |||||||||
| 1,639,399 | |||||||||||
| Consumer Finance | |||||||||||
| 3,613 | Capital One Financial Corp. | 172,701 | |||||||||
| 4,979 | SLM Corp. | 77,623 | |||||||||
| 250,324 | |||||||||||
| Containers & Packaging | |||||||||||
| 915 | Ball Corp. | 35,502 | |||||||||
| 866 | Crown Holdings, Inc. (a) | 33,263 | |||||||||
| 282 | Owens-Illinois, Inc. (a) | 6,534 | |||||||||
| 34,568 | Sealed Air Corp. | 744,249 | |||||||||
| 819,548 | |||||||||||
| Distributors | |||||||||||
| 17,866 | Genuine Parts Co. | 949,757 | |||||||||
| 40,000 | Li & Fung Ltd. (d) | 66,742 | |||||||||
| 1,016,499 | |||||||||||
| Diversified Consumer Services | |||||||||||
| 815 | Apollo Group, Inc. Class A (a) | 41,427 | |||||||||
| 3,600 | H&R Block, Inc. | 53,856 | |||||||||
| 95,283 | |||||||||||
| Diversified Financial Services | |||||||||||
| 79,109 | Bank of America Corp. | 768,148 | |||||||||
| 11,762 | Citigroup, Inc. (See Note 6) | 450,955 | |||||||||
| 55,691 | JPMorgan Chase & Co. | 2,252,701 | |||||||||
See Notes to Financial Statements
35
Morgan Stanley Global Strategist Fund
Portfolio of Investments n July 31, 2011 continued
| NUMBER OF SHARES | VALUE | ||||||||||
| 1,953 | Leucadia National Corp. | $ | 65,758 | ||||||||
| 392 | Moody's Corp. | 13,959 | |||||||||
| 2,195 | NASDAQ OMX Group, Inc. (The) (a) | 52,834 | |||||||||
| 3,605 | NYSE Euronext | 120,623 | |||||||||
| 3,724,978 | |||||||||||
| Diversified Telecommunication Services | |||||||||||
| 24,176 | Verizon Communications, Inc. | 853,171 | |||||||||
| Electrical Equipment | |||||||||||
| 650 | AMETEK, Inc. | 27,625 | |||||||||
| 1,564 | Cooper Industries PLC | 81,813 | |||||||||
| 20,703 | Emerson Electric Co. | 1,016,310 | |||||||||
| 1,350 | Rockwell Automation, Inc. | 96,876 | |||||||||
| 539 | Roper Industries, Inc. | 43,999 | |||||||||
| 1,266,623 | |||||||||||
| Electronic Equipment, Instruments & Components | |||||||||||
| 20,375 | Arrow Electronics, Inc. (a) | 708,031 | |||||||||
| 45,997 | Corning, Inc. | 731,812 | |||||||||
| 4,380 | TE Connectivity Ltd. | 150,804 | |||||||||
| 1,590,647 | |||||||||||
| Energy Equipment & Services | |||||||||||
| 3,478 | Baker Hughes, Inc. | 269,128 | |||||||||
| 2,026 | Cameron International Corp. (a) | 113,334 | |||||||||
| 2,026 | FMC Technologies, Inc. (a) | 92,385 | |||||||||
| 8,101 | Halliburton Co. | 443,368 | |||||||||
| 741 | Helmerich & Payne, Inc. | 51,166 | |||||||||
| NUMBER OF SHARES | VALUE | ||||||||||
| 4,430 | National Oilwell Varco, Inc. | $ | 356,925 | ||||||||
| 900 | Noble Corp. | 33,183 | |||||||||
| 11,124 | Schlumberger Ltd. | 1,005,276 | |||||||||
| 5,654 | Tenaris SA | 124,688 | |||||||||
| 13,496 | Tidewater, Inc. | 733,373 | |||||||||
| 5,889 | Weatherford International Ltd. (a) | 129,087 | |||||||||
| 3,351,913 | |||||||||||
| Food & Staples Retailing | |||||||||||
| 8,667 | Costco Wholesale Corp. | 678,193 | |||||||||
| 12,113 | Kroger Co. (The) | 301,250 | |||||||||
| 11,597 | Sysco Corp. | 354,752 | |||||||||
| 40,108 | Wal-Mart Stores, Inc. | 2,114,093 | |||||||||
| 18,961 | Walgreen Co. | 740,237 | |||||||||
| 2,867 | Whole Foods Market, Inc. | 191,229 | |||||||||
| 4,379,754 | |||||||||||
| Food Products | |||||||||||
| 7,000 | Archer-Daniels- Midland Co. | 212,660 | |||||||||
| 1,400 | Bunge Ltd. | 96,334 | |||||||||
| 46,983 | ConAgra Foods, Inc. | 1,203,235 | |||||||||
| 2,926 | General Mills, Inc. | 109,286 | |||||||||
| 5,627 | H.J. Heinz Co. | 296,205 | |||||||||
| 714 | Hershey Co. (The) | 40,298 | |||||||||
| 1,400 | JM Smucker Co. (The) | 109,088 | |||||||||
| 1,285 | Kellogg Co. | 71,677 | |||||||||
| 18,930 | Kraft Foods, Inc. Class A | 650,813 | |||||||||
| 856 | Mead Johnson Nutrition Co. | 61,093 | |||||||||
| 3,000 | Sara Lee Corp. | 57,330 | |||||||||
| 39,383 | Smithfield Foods, Inc. (a) | 867,214 | |||||||||
| 3,000 | Tyson Foods, Inc. Class A | 52,680 | |||||||||
| 3,827,913 | |||||||||||
See Notes to Financial Statements
36
Morgan Stanley Global Strategist Fund
Portfolio of Investments n July 31, 2011 continued
| NUMBER OF SHARES | VALUE | ||||||||||
| Health Care Equipment & Supplies | |||||||||||
| 7,765 | Baxter International, Inc. | $ | 451,690 | ||||||||
| 1,939 | Becton Dickinson and Co. | 162,120 | |||||||||
| 42,684 | Boston Scientific Corp. (a) | 305,617 | |||||||||
| 8,335 | Covidien PLC | 423,335 | |||||||||
| 781 | CR Bard, Inc. | 77,069 | |||||||||
| 3,230 | DENTSPLY International, Inc. | 122,385 | |||||||||
| 986 | Edwards Lifesciences Corp. (a) | 70,351 | |||||||||
| 1,510 | Hologic, Inc. (a) | 28,041 | |||||||||
| 380 | Intuitive Surgical, Inc. (a) | 152,209 | |||||||||
| 13,927 | Medtronic, Inc. | 502,068 | |||||||||
| 2,811 | St. Jude Medical, Inc. | 130,711 | |||||||||
| 6,234 | Stryker Corp. | 338,756 | |||||||||
| 1,208 | Varian Medical Systems, Inc. (a) | 75,814 | |||||||||
| 4,227 | Zimmer Holdings, Inc. (a) | 253,705 | |||||||||
| 3,093,871 | |||||||||||
| Health Care Providers & Services | |||||||||||
| 3,478 | Aetna, Inc. | 144,302 | |||||||||
| 5,509 | AmerisourceBergen Corp. | 211,050 | |||||||||
| 6,716 | Cardinal Health, Inc. | 293,892 | |||||||||
| 2,273 | CIGNA Corp. | 113,127 | |||||||||
| 6,808 | Community Health Systems, Inc. (a) | 175,919 | |||||||||
| 34,814 | Coventry Health Care, Inc. (a) | 1,114,048 | |||||||||
| 969 | DaVita, Inc. (a) | 80,950 | |||||||||
| 4,156 | Express Scripts, Inc. (a) | 225,505 | |||||||||
| 1,042 | Henry Schein, Inc. (a) | 69,251 | |||||||||
| NUMBER OF SHARES | VALUE | ||||||||||
| 1,357 | Humana, Inc. | $ | 101,205 | ||||||||
| 826 | Laboratory Corp. of America Holdings (a) | 74,968 | |||||||||
| 4,342 | McKesson Corp. | 352,223 | |||||||||
| 3,431 | Medco Health Solutions, Inc. (a) | 215,741 | |||||||||
| 26,605 | Omnicare, Inc. | 811,452 | |||||||||
| 1,272 | Quest Diagnostics, Inc. | 68,701 | |||||||||
| 13,106 | UnitedHealth Group, Inc. | 650,451 | |||||||||
| 19,523 | Universal Health Services, Inc. Class B | 969,122 | |||||||||
| 4,369 | WellPoint, Inc. | 295,126 | |||||||||
| 5,967,033 | |||||||||||
| Health Care Technology | |||||||||||
| 4,858 | Allscripts Healthcare Solutions, Inc. (a) | 88,173 | |||||||||
| 1,546 | Cerner Corp. (a) | 102,793 | |||||||||
| 190,966 | |||||||||||
| Hotels, Restaurants & Leisure | |||||||||||
| 2,423 | Carnival Corp. | 80,686 | |||||||||
| 151 | Chipotle Mexican Grill, Inc. (a) | 49,012 | |||||||||
| 743 | Darden Restaurants, Inc. | 37,744 | |||||||||
| 1,459 | International Game Technology | 27,123 | |||||||||
| 1,996 | Las Vegas Sands Corp. (a) | 94,171 | |||||||||
| 1,897 | Marriott International, Inc. Class A | 61,652 | |||||||||
| 12,745 | McDonald's Corp. | 1,102,188 | |||||||||
| 1,732 | MGM Resorts International (a) | 26,170 | |||||||||
| 1,600 | Royal Caribbean Cruises Ltd. (a) | 48,992 | |||||||||
See Notes to Financial Statements
37
Morgan Stanley Global Strategist Fund
Portfolio of Investments n July 31, 2011 continued
| NUMBER OF SHARES | VALUE | ||||||||||
| 4,151 | Starbucks Corp. | $ | 166,414 | ||||||||
| 961 | Starwood Hotels & Resorts Worldwide, Inc. | 52,817 | |||||||||
| 410 | Wynn Resorts Ltd. | 63,009 | |||||||||
| 18,388 | Yum! Brands, Inc. | 971,254 | |||||||||
| 2,781,232 | |||||||||||
| Household Durables | |||||||||||
| 36,561 | Toll Brothers, Inc. (a) | 729,758 | |||||||||
| Household Products | |||||||||||
| 800 | Church & Dwight Co., Inc. | 32,272 | |||||||||
| 800 | Clorox Co. | 57,272 | |||||||||
| 2,700 | Colgate-Palmolive Co. | 227,826 | |||||||||
| 400 | Energizer Holdings, Inc. (a) | 32,256 | |||||||||
| 1,108 | Kimberly-Clark Corp. | 72,419 | |||||||||
| 64,053 | Procter & Gamble Co. (The) | 3,938,619 | |||||||||
| 4,360,664 | |||||||||||
| Independent Power Producers & Energy Traders | |||||||||||
| 22,387 | NRG Energy, Inc. (a) | 548,929 | |||||||||
| Industrial Conglomerates | |||||||||||
| 2,625 | 3M Co. | 228,742 | |||||||||
| 87,702 | General Electric Co. | 1,570,743 | |||||||||
| 22,327 | Tyco International Ltd. | 988,863 | |||||||||
| 2,788,348 | |||||||||||
| Information Technology Services | |||||||||||
| 5,302 | Accenture PLC Class A | 313,560 | |||||||||
| 14,368 | Automatic Data Processing, Inc. | 739,808 | |||||||||
| NUMBER OF SHARES | VALUE | ||||||||||
| 3,409 | Cognizant Technology Solutions Corp. Class A (a) | $ | 238,187 | ||||||||
| 1,843 | Fiserv, Inc. (a) | 111,244 | |||||||||
| 15,185 | International Business Machines Corp. | 2,761,392 | |||||||||
| 1,053 | Mastercard, Inc. Class A | 319,322 | |||||||||
| 2,782 | Paychex, Inc. | 78,536 | |||||||||
| 3,409 | Visa, Inc. Class A | 291,606 | |||||||||
| 8,924 | Western Union Co. (The) | 173,215 | |||||||||
| 5,026,870 | |||||||||||
| Insurance | |||||||||||
| 6,992 | Aflac, Inc. | 322,052 | |||||||||
| 14,949 | Assurant, Inc. | 532,483 | |||||||||
| 18,048 | Chubb Corp. | 1,127,639 | |||||||||
| 34,542 | Fidelity National Financial, Inc. | 563,035 | |||||||||
| 19,355 | Lincoln National Corp. | 512,907 | |||||||||
| 7,680 | PartnerRe Ltd. | 513,178 | |||||||||
| 17,910 | Principal Financial Group, Inc. | 494,853 | |||||||||
| 10,050 | Prudential Financial, Inc. | 589,734 | |||||||||
| 29,097 | Unum Group | 709,676 | |||||||||
| 5,365,557 | |||||||||||
| Internet & Catalog Retail | |||||||||||
| 781 | Amazon.com, Inc. (a) | 173,788 | |||||||||
| 612 | Expedia, Inc. | 19,394 | |||||||||
| 106 | NetFlix, Inc. (a) | 28,195 | |||||||||
| 106 | Priceline.com, Inc. (a) | 56,991 | |||||||||
| 278,368 | |||||||||||
| Internet Software & Services | |||||||||||
| 2,420 | Akamai Technologies, Inc. (a) | 58,613 | |||||||||
| 11,031 | eBay, Inc. (a) | 361,265 | |||||||||
See Notes to Financial Statements
38
Morgan Stanley Global Strategist Fund
Portfolio of Investments n July 31, 2011 continued
| NUMBER OF SHARES | VALUE | ||||||||||
| 1,870 | Google, Inc. Class A (a) | $ | 1,128,900 | ||||||||
| 72,262 | Yahoo!, Inc. (a) | 946,632 | |||||||||
| 2,495,410 | |||||||||||
| Leisure Equipment & Products | |||||||||||
| 1,000 | Mattel, Inc. | 26,660 | |||||||||
| Life Sciences Tools & Services | |||||||||||
| 1,800 | Agilent Technologies, Inc. (a) | 75,888 | |||||||||
| 700 | Illumina, Inc. (a) | 43,715 | |||||||||
| 2,475 | Life Technologies Corp. (a) | 111,449 | |||||||||
| 5,224 | Thermo Fisher Scientific, Inc. (a) | 313,910 | |||||||||
| 500 | Waters Corp. (a) | 43,945 | |||||||||
| 588,907 | |||||||||||
| Machinery | |||||||||||
| 13,817 | AGCO Corp. (a) | 655,202 | |||||||||
| 13,511 | Caterpillar, Inc. | 1,334,752 | |||||||||
| 1,471 | Cummins, Inc. | 154,279 | |||||||||
| 3,980 | Danaher Corp. | 195,458 | |||||||||
| 3,377 | Deere & Co. | 265,128 | |||||||||
| 511 | Dover Corp. | 30,900 | |||||||||
| 1,894 | Eaton Corp. | 90,817 | |||||||||
| 587 | Flowserve Corp. | 58,336 | |||||||||
| 18,308 | Illinois Tool Works, Inc. | 911,738 | |||||||||
| 1,471 | Ingersoll-Rand PLC | 55,045 | |||||||||
| 819 | Joy Global, Inc. | 76,921 | |||||||||
| 2,998 | PACCAR, Inc. | 128,344 | |||||||||
| 893 | Pall Corp. | 44,275 | |||||||||
| 600 | Stanley Black & Decker, Inc. | 39,462 | |||||||||
| 4,040,657 | |||||||||||
| Media | |||||||||||
| 737 | AMC Networks, Inc. (a) | 27,409 | |||||||||
| NUMBER OF SHARES | VALUE | ||||||||||
| 2,951 | Cablevision Systems Corp. | $ | 71,886 | ||||||||
| 7,015 | CBS Corp. Class B | 192,001 | |||||||||
| 27,585 | Comcast Corp. Class A | 657,503 | |||||||||
| 9,757 | DIRECTV Class A (a) | 494,485 | |||||||||
| 1,476 | Discovery Communications, Inc. (a) | 58,745 | |||||||||
| 1,529 | Discovery Communications, Inc. Class C (a) | 55,090 | |||||||||
| 5,050 | Interpublic Group of Cos., Inc. (The) | 49,540 | |||||||||
| 1,266 | Liberty Global, Inc. Series A (a) | 52,919 | |||||||||
| 1,240 | Liberty Global, Inc. Series C (a) | 49,563 | |||||||||
| 3,494 | McGraw-Hill Cos., Inc. (The) | 145,350 | |||||||||
| 19,858 | News Corp. Class A | 318,125 | |||||||||
| 4,816 | News Corp. Class B | 79,464 | |||||||||
| 3,494 | Omnicom Group, Inc. | 163,938 | |||||||||
| 732 | Scripps Networks Interactive, Inc. Class A | 33,921 | |||||||||
| 3,458 | Time Warner Cable, Inc. | 253,506 | |||||||||
| 34,654 | Time Warner, Inc. | 1,218,435 | |||||||||
| 5,873 | Viacom, Inc. Class B | 284,371 | |||||||||
| 3,494 | Virgin Media, Inc. | 92,451 | |||||||||
| 17,508 | Walt Disney Co. (The) | 676,159 | |||||||||
| 4,974,861 | |||||||||||
| Metals & Mining | |||||||||||
| 63,149 | Alcoa, Inc. | 930,185 | |||||||||
| 402 | Allegheny Technologies, Inc. | 23,392 | |||||||||
| 660 | Cliffs Natural Resources, Inc. | 59,281 | |||||||||
See Notes to Financial Statements
39
Morgan Stanley Global Strategist Fund
Portfolio of Investments n July 31, 2011 continued
| NUMBER OF SHARES | VALUE | ||||||||||
| 52,595 | Commercial Metals Co. | $ | 763,153 | ||||||||
| 4,363 | Freeport-McMoRan Copper & Gold, Inc. | 231,065 | |||||||||
| 10,684 | Molycorp, Inc. (a) | 679,823 | |||||||||
| 2,310 | Newmont Mining Corp. | 128,459 | |||||||||
| 1,131 | Nucor Corp. | 43,985 | |||||||||
| 34,542 | Steel Dynamics, Inc. | 539,546 | |||||||||
| 708 | United States Steel Corp. | 28,313 | |||||||||
| 3,427,202 | |||||||||||
| Multi-Utilities | |||||||||||
| 28,427 | CenterPoint Energy, Inc. | 556,600 | |||||||||
| 13,970 | Integrys Energy Group, Inc. | 701,434 | |||||||||
| 1,258,034 | |||||||||||
| Multiline Retail | |||||||||||
| 32,223 | Dollar General Corp. (a) | 1,013,736 | |||||||||
| 274 | Dollar Tree, Inc. (a) | 18,147 | |||||||||
| 274 | Family Dollar Stores, Inc. | 14,552 | |||||||||
| 781 | Kohl's Corp. | 42,728 | |||||||||
| 33,279 | Macy's, Inc. | 960,765 | |||||||||
| 612 | Nordstrom, Inc. | 30,698 | |||||||||
| 1,815 | Target Corp. | 93,454 | |||||||||
| 2,174,080 | |||||||||||
| Office Electronics | |||||||||||
| 5,800 | Xerox Corp. | 54,114 | |||||||||
| Oil, Gas & Consumable Fuels | |||||||||||
| 738 | Alpha Natural Resources, Inc. (a) | 31,520 | |||||||||
| 18,115 | Anadarko Petroleum Corp. | 1,495,574 | |||||||||
| 4,851 | Apache Corp. | 600,166 | |||||||||
| 843 | Arch Coal, Inc. | 21,581 | |||||||||
| NUMBER OF SHARES | VALUE | ||||||||||
| 29,386 | Chesapeake Energy Corp. | $ | 1,009,409 | ||||||||
| 34,649 | Chevron Corp. | 3,604,189 | |||||||||
| 848 | Concho Resources Inc/Midland (a) | 79,356 | |||||||||
| 37,134 | ConocoPhillips | 2,673,277 | |||||||||
| 1,894 | Consol Energy, Inc. | 101,518 | |||||||||
| 4,594 | Devon Energy Corp. | 361,548 | |||||||||
| 4,294 | El Paso Corp. | 88,242 | |||||||||
| 2,212 | EOG Resources, Inc. | 225,624 | |||||||||
| 1,308 | EQT Corp. | 83,032 | |||||||||
| 50,107 | Exxon Mobil Corp. | 3,998,037 | |||||||||
| 13,481 | Hess Corp. | 924,257 | |||||||||
| 7,753 | Marathon Oil Corp. | 240,110 | |||||||||
| 3,876 | Marathon Petroleum Corp. (a) | 169,730 | |||||||||
| 1,199 | Murphy Oil Corp. | 77,000 | |||||||||
| 610 | Newfield Exploration Co. (a) | 41,126 | |||||||||
| 2,467 | Noble Energy, Inc. | 245,911 | |||||||||
| 8,842 | Occidental Petroleum Corp. | 868,108 | |||||||||
| 14,342 | Peabody Energy Corp. | 824,235 | |||||||||
| 2,152 | Petrohawk Energy Corp. (a) | 82,185 | |||||||||
| 1,129 | Pioneer Natural Resources Co. | 104,986 | |||||||||
| 1,124 | QEP Resources, Inc. | 49,265 | |||||||||
| 1,271 | Range Resources Corp. | 82,818 | |||||||||
| 3,089 | Southwestern Energy Co. (a) | 137,646 | |||||||||
| 9,358 | Spectra Energy Corp. | 252,853 | |||||||||
| 1,536 | Ultra Petroleum Corp. (a) | 71,915 | |||||||||
| 6,030 | Valero Energy Corp. | 151,474 | |||||||||
| 11,106 | Williams Cos., Inc. (The) | 352,060 | |||||||||
| 19,048,752 | |||||||||||
See Notes to Financial Statements
40
Morgan Stanley Global Strategist Fund
Portfolio of Investments n July 31, 2011 continued
| NUMBER OF SHARES | VALUE | ||||||||||
| Paper & Forest Products | |||||||||||
| 755 | International Paper Co. | $ | 22,424 | ||||||||
| 28,565 | MeadWestvaco Corp. | 889,514 | |||||||||
| 911,938 | |||||||||||
| Personal Products | |||||||||||
| 2,300 | Avon Products, Inc. | 60,329 | |||||||||
| 600 | Estee Lauder Cos., Inc. (The) Class A | 62,946 | |||||||||
| 123,275 | |||||||||||
| Pharmaceuticals | |||||||||||
| 52,090 | Abbott Laboratories | 2,673,259 | |||||||||
| 13,988 | Allergan, Inc. | 1,137,364 | |||||||||
| 62,371 | Bristol-Myers Squibb Co. | 1,787,553 | |||||||||
| 9,758 | Eli Lilly & Co. | 373,731 | |||||||||
| 6,627 | Forest Laboratories, Inc. (a) | 245,597 | |||||||||
| 4,275 | Hospira, Inc. (a) | 218,538 | |||||||||
| 25,899 | Johnson & Johnson | 1,677,996 | |||||||||
| 29,004 | Merck & Co., Inc. | 989,907 | |||||||||
| 2,200 | Mylan, Inc. (a) | 50,116 | |||||||||
| 500 | Perrigo Co. | 45,155 | |||||||||
| 74,591 | Pfizer, Inc. | 1,435,131 | |||||||||
| 20,962 | Watson Pharmaceuticals, Inc. (a) | 1,407,179 | |||||||||
| 12,041,526 | |||||||||||
| Professional Services | |||||||||||
| 965 | Dun & Bradstreet Corp. | 70,011 | |||||||||
| 1,633 | Equifax, Inc. | 56,110 | |||||||||
| 841 | IHS, Inc. Class A (a) | 61,973 | |||||||||
| 1,654 | Manpower, Inc. | 83,560 | |||||||||
| 2,849 | Robert Half International, Inc. | 78,005 | |||||||||
| NUMBER OF SHARES | VALUE | ||||||||||
| 2,489 | Verisk Analytics, Inc. Class A (a) | $ | 82,884 | ||||||||
| 432,543 | |||||||||||
| Real Estate Investment Trusts (REITs) | |||||||||||
| 2,408 | Annaly Capital Management, Inc. REIT | 40,406 | |||||||||
| 1,871 | AvalonBay Communities, Inc. REIT | 251,070 | |||||||||
| 2,074 | Boston Properties, Inc. REIT | 222,665 | |||||||||
| 3,875 | Equity Residential REIT | 239,553 | |||||||||
| 1,323 | General Growth Properties, Inc. REIT | 22,240 | |||||||||
| 1,142 | HCP, Inc. REIT | 41,946 | |||||||||
| 554 | Health Care REIT, Inc. REIT | 29,240 | |||||||||
| 13,161 | Host Hotels & Resorts, Inc. REIT | 208,602 | |||||||||
| 1,278 | Kimco Realty Corp. REIT | 24,320 | |||||||||
| 454 | Liberty Property Trust REIT | 15,418 | |||||||||
| 462 | Macerich Co. (The) REIT | 24,546 | |||||||||
| 29,456 | Plum Creek Timber Co., Inc. REIT | 1,125,808 | |||||||||
| 6,024 | ProLogis, Inc. REIT | 214,635 | |||||||||
| 4,396 | Public Storage REIT | 525,893 | |||||||||
| 298 | Rayonier, Inc. REIT | 19,206 | |||||||||
| 303 | Regency Centers Corp. REIT | 13,611 | |||||||||
| 5,897 | Simon Property Group, Inc. REIT | 710,647 | |||||||||
| 503 | Ventas, Inc. REIT | 27,227 | |||||||||
| 507 | Vornado Realty Trust REIT | 47,430 | |||||||||
See Notes to Financial Statements
41
Morgan Stanley Global Strategist Fund
Portfolio of Investments n July 31, 2011 continued
| NUMBER OF SHARES | VALUE | ||||||||||
| 1,599 | Weyerhaeuser Co. | $ | 31,964 | ||||||||
| 3,836,427 | |||||||||||
| Real Estate Management & Development | |||||||||||
| 8,315 | CB Richard Ellis Group, Inc. Class A (a) | 181,267 | |||||||||
| 9,091 | Lend Lease Group (Stapled Securities) (b)(c) | 88,344 | |||||||||
| 269,611 | |||||||||||
| Road & Rail | |||||||||||
| 3,291 | CSX Corp. | 80,860 | |||||||||
| 312 | JB Hunt Transport Services, Inc. | 14,115 | |||||||||
| 24,502 | Norfolk Southern Corp. | 1,854,801 | |||||||||
| 1,296 | Union Pacific Corp. | 132,814 | |||||||||
| 2,082,590 | |||||||||||
| Semiconductors & Semiconductor Equipment | |||||||||||
| 32,127 | Applied Materials, Inc. | 395,804 | |||||||||
| 22,798 | Broadcom Corp. Class A (a) | 845,122 | |||||||||
| 64,781 | Intel Corp. | 1,446,560 | |||||||||
| 42,243 | NVIDIA Corp. (a) | 584,221 | |||||||||
| 200 | Texas Instruments, Inc. | 5,950 | |||||||||
| 3,277,657 | |||||||||||
| Software | |||||||||||
| 36,180 | Adobe Systems, Inc. (a) | 1,002,910 | |||||||||
| 2,206 | BMC Software, Inc. (a) | 95,343 | |||||||||
| 4,824 | CA, Inc. | 107,575 | |||||||||
| 1,630 | Citrix Systems, Inc. (a) | 117,425 | |||||||||
| NUMBER OF SHARES | VALUE | ||||||||||
| 3,409 | Intuit, Inc. (a) | $ | 159,200 | ||||||||
| 79,063 | Microsoft Corp. | 2,166,326 | |||||||||
| 64,736 | Oracle Corp. | 1,979,627 | |||||||||
| 18,177 | Red Hat, Inc. (a) | 764,888 | |||||||||
| 1,053 | Salesforce.com, Inc. (a) | 152,380 | |||||||||
| 7,722 | Symantec Corp. (a) | 147,182 | |||||||||
| 6,692,856 | |||||||||||
| Specialty Retail | |||||||||||
| 232 | Abercrombie & Fitch Co. Class A | 16,964 | |||||||||
| 232 | Advance Auto Parts, Inc. | 12,753 | |||||||||
| 106 | AutoZone, Inc. (a) | 30,258 | |||||||||
| 675 | Bed Bath & Beyond, Inc. (a) | 39,481 | |||||||||
| 908 | Best Buy Co., Inc. | 25,061 | |||||||||
| 675 | CarMax, Inc. (a) | 21,580 | |||||||||
| 507 | GameStop Corp. Class A (a) | 11,955 | |||||||||
| 55,777 | Gap, Inc. (The) | 1,075,938 | |||||||||
| 25,251 | Home Depot, Inc. | 882,017 | |||||||||
| 3,610 | Lowe's Cos., Inc. | 77,904 | |||||||||
| 781 | Ltd. Brands, Inc. | 29,569 | |||||||||
| 274 | O'Reilly Automotive, Inc. (a) | 16,303 | |||||||||
| 274 | PetSmart, Inc. | 11,787 | |||||||||
| 274 | Ross Stores, Inc. | 20,761 | |||||||||
| 1,921 | Staples, Inc. | 30,851 | |||||||||
| 155,684 | Talbots, Inc. (a) | 538,667 | |||||||||
| 401 | Tiffany & Co. | 31,915 | |||||||||
| 1,140 | TJX Cos., Inc. | 63,042 | |||||||||
| 274 | Urban Outfitters, Inc. (a) | 8,916 | |||||||||
| 2,945,722 | |||||||||||
| Textiles, Apparel & Luxury Goods | |||||||||||
| 9,564 | VF Corp. | 1,117,075 | |||||||||
See Notes to Financial Statements
42
Morgan Stanley Global Strategist Fund
Portfolio of Investments n July 31, 2011 continued
| NUMBER OF SHARES | VALUE | ||||||||||
| Tobacco | |||||||||||
| 22,580 | Altria Group, Inc. | $ | 593,854 | ||||||||
| 1,600 | Lorillard, Inc. | 169,952 | |||||||||
| 38,896 | Philip Morris International, Inc. | 2,768,228 | |||||||||
| 3,700 | Reynolds American, Inc. | 130,240 | |||||||||
| 3,662,274 | |||||||||||
| Trading Companies & Distributors | |||||||||||
| 2,098 | Fastenal Co. | 70,597 | |||||||||
| 556 | WW Grainger, Inc. | 82,494 | |||||||||
| 153,091 | |||||||||||
| Total United States | 158,407,354 | ||||||||||
| Total Common Stocks (Cost $279,125,137) | 309,361,362 | ||||||||||
| Commodity Linked Security (4.0%) | |||||||||||
| United States | |||||||||||
| 20,802,000 | Deutsche Bank AG Series 0005 (Cost $21,466,086) (e)(f) | 22,347,589 | |||||||||
| Investment Companies (1.1%) | |||||||||||
| 71,100 | iShares MSCI Emerging Markets Index Fund | 3,352,365 | |||||||||
| 114,200 | Technology Select Sector SPDR Fund | 2,947,502 | |||||||||
| Total Investment Companies (Cost $6,283,551) | 6,299,867 | ||||||||||
| PRINCIPAL AMOUNT IN THOUSANDS | VALUE | ||||||||||
| Corporate Bonds (10.2%) | |||||||||||
| Australia (0.8%) | |||||||||||
| Basic Materials | |||||||||||
| $ | 250 | FMG Resources August 2006 Pty Ltd. (e) 6.375% 02/01/16 | $ | 255,312 | |||||||
| 95 | FMG Resources August 2006 Pty Ltd. (e) 6.875% 02/01/18 | 99,275 | |||||||||
| 200 | Rio Tinto Finance USA Ltd. 9.00% 05/01/19 | 272,929 | |||||||||
| 627,516 | |||||||||||
| Communications | |||||||||||
| 260 | Telstra Corp. Ltd. (e) 4.80% 10/12/21 | 267,633 | |||||||||
| Consumer, Cyclical | |||||||||||
| 195 | Wesfarmers Ltd. (e) 2.983% 05/18/16 | 198,137 | |||||||||
| Consumer, Non-Cyclical | |||||||||||
| 195 | Woolworths Ltd. (e) 4.00% 09/22/20 | 196,808 | |||||||||
| Finance | |||||||||||
| 65 | Commonwealth Bank of Australia (e) 5.00% 03/19/20 | 69,222 | |||||||||
| 245 | Macquarie Bank Ltd. (e) 6.625% 04/07/21 | 253,402 | |||||||||
| 235 | Macquarie Group Ltd. (e) 6.00% 01/14/20 | 237,969 | |||||||||
| 235 | National Australia Bank Ltd. (e) 3.00% 07/27/16 | 236,158 | |||||||||
| 325 | QBE Capital Funding III Ltd. (e) 7.25% (g) 05/24/41 | 331,801 | |||||||||
See Notes to Financial Statements
43
Morgan Stanley Global Strategist Fund
Portfolio of Investments n July 31, 2011 continued
| PRINCIPAL AMOUNT IN THOUSANDS | VALUE | ||||||||||
| $ | 90 | Westpac Banking Corp. 3.00% 12/09/15 | $ | 91,980 | |||||||
| 1,220,532 | |||||||||||
| Information Technology | |||||||||||
| EUR | 400 | Australia & New Zealand Banking Group Ltd. 5.125% 09/10/19 | 593,541 | ||||||||
| $ | 500 | Commonwealth Bank of Australia (e) 2.90% 09/17/14 | 529,451 | ||||||||
| 355 | Commonwealth Bank of Australia (e) 5.00% 10/15/19 | 378,618 | |||||||||
| 400 | National Australia Bank Ltd. (e) 3.375% 07/08/14 | 427,720 | |||||||||
| 245 | Westpac Banking Corp. 4.20% 02/27/15 | 261,865 | |||||||||
| 2,191,195 | |||||||||||
| Total Australia | 4,701,821 | ||||||||||
| Belgium (0.1%) | |||||||||||
| Consumer Staples | |||||||||||
| 85 | Anheuser-Busch InBev Worldwide, Inc. 5.00% 04/15/20 | 95,587 | |||||||||
| EUR | 200 | Ontex IV SA 7.50% 04/15/18 | 276,603 | ||||||||
| Total Belgium | 372,190 | ||||||||||
| Brazil (0.3%) | |||||||||||
| Basic Materials | |||||||||||
| 185 | Vale Overseas Ltd. 5.625% 09/15/19 | 204,383 | |||||||||
| 50 | Vale Overseas Ltd. 6.875% 11/10/39 | 58,080 | |||||||||
| 262,463 | |||||||||||
| PRINCIPAL AMOUNT IN THOUSANDS | VALUE | ||||||||||
| Energy | |||||||||||
| EUR | 330 | Petrobras International Finance Co. 5.75% 01/20/20 | $ | 363,502 | |||||||
| Finance | |||||||||||
| 465 | Banco Bradesco SA (e) 4.125% 05/16/16 | 474,765 | |||||||||
| 290 | Banco Votorantim SA (e) 5.25% 02/11/16 | 299,425 | |||||||||
| 774,190 | |||||||||||
| Total Brazil | 1,400,155 | ||||||||||
| Canada (0.3%) | |||||||||||
| Basic Materials | |||||||||||
| $ | 255 | Barrick North America Finance LLC (e) 4.40% 05/30/21 | 265,354 | ||||||||
| 220 | Teck Resources Ltd. 10.25% 05/15/16 | 264,257 | |||||||||
| 529,611 | |||||||||||
| Finance | |||||||||||
| 380 | Brookfield Asset Management, Inc. 5.80% 04/25/17 | 418,498 | |||||||||
| Industrials | |||||||||||
| 65 | Bombardier, Inc. (e) 7.50% 03/15/18 | 73,125 | |||||||||
| 135 | Bombardier, Inc. (e) 7.75% 03/15/20 | 152,550 | |||||||||
| 225,675 | |||||||||||
| Information Technology | |||||||||||
| 615 | Bank of Montreal (e) 2.85% 06/09/15 | 643,569 | |||||||||
| Total Canada | 1,817,353 | ||||||||||
See Notes to Financial Statements
44
Morgan Stanley Global Strategist Fund
Portfolio of Investments n July 31, 2011 continued
| PRINCIPAL AMOUNT IN THOUSANDS | VALUE | ||||||||||
| France (0.9%) | |||||||||||
| Communications | |||||||||||
| $ | 145 | Vivendi SA (e) 6.625% 04/04/18 | $ | 166,822 | |||||||
| Consumer Discretionary | |||||||||||
| EUR | 333 | Cie Generale des Etablissements Michelin 0.00% 01/01/17 | 563,987 | ||||||||
| Consumer Staples | |||||||||||
| 250 | Europcar Groupe SA 4.92% (g) 05/15/13 | 348,448 | |||||||||
| Finance | |||||||||||
| 400 | Banque Federative du Credit Mutuel 3.00% 10/29/15 | 567,315 | |||||||||
| $ | 455 | BNP Paribas SA 5.00% 01/15/21 | 468,178 | ||||||||
| EUR | 300 | BNP Paribas SA 5.431% 09/07/17 | 458,373 | ||||||||
| 300 | Credit Agricole SA 3.90% 04/19/21 | 385,687 | |||||||||
| 350 | Credit Agricole SA 5.875% 06/11/19 | 528,550 | |||||||||
| 250 | Societe Generale SA 6.125% 08/20/18 | 385,606 | |||||||||
| 150 | Societe Generale SA (h) 6.999% (g) 12/19/17 | 201,525 | |||||||||
| 2,995,234 | |||||||||||
| Industrials | |||||||||||
| 200 | Lafarge SA 5.50% 12/16/19 | 293,082 | |||||||||
| Utilities | |||||||||||
| 450 | RTE EDF Transport SA 5.125% 09/12/18 | 722,583 | |||||||||
| Total France | 5,090,156 | ||||||||||
| PRINCIPAL AMOUNT IN THOUSANDS | VALUE | ||||||||||
| Germany (0.2%) | |||||||||||
| Communications | |||||||||||
| $ | 150 | Deutsche Telekom International Finance BV 8.75% 06/15/30 | $ | 207,390 | |||||||
| Consumer, Cyclical | |||||||||||
| 45 | Daimler Finance North America LLC 8.50% 01/18/31 | 63,094 | |||||||||
| Finance | |||||||||||
| EUR | 400 | Deutsche Bank AG 5.00% 06/24/20 | 588,559 | ||||||||
| Information Technology | |||||||||||
| 300 | Kreditanstalt fuer Wiederaufbau 1.50% 07/30/14 | 475,039 | |||||||||
| Total Germany | 1,334,082 | ||||||||||
| Ireland (0.2%) | |||||||||||
| Industrials | |||||||||||
| 250 | Ardagh Glass Finance PLC 8.75% 02/01/20 | 353,837 | |||||||||
| Information Technology | |||||||||||
| 200 | Smurfit Kappa Acquisitions 7.75% 11/15/19 | 294,564 | |||||||||
| Utilities | |||||||||||
| $ | 200 | Iberdrola Finance Ireland Ltd. (e) 5.00% 09/11/19 | 200,280 | ||||||||
| Total Ireland | 848,681 | ||||||||||
| Italy (0.7%) | |||||||||||
| Communications | |||||||||||
| 225 | Telecom Italia Capital SA 7.175% 06/18/19 | 238,513 | |||||||||
See Notes to Financial Statements
45
Morgan Stanley Global Strategist Fund
Portfolio of Investments n July 31, 2011 continued
| PRINCIPAL AMOUNT IN THOUSANDS | VALUE | ||||||||||
| EUR | 400 | Telecom Italia Finance SA 7.75% 01/24/33 | $ | 599,921 | |||||||
| 838,434 | |||||||||||
| Finance | |||||||||||
| 500 | Finmeccanica Finance SA 8.125% 12/03/13 | 793,780 | |||||||||
| 400 | Intesa Sanpaolo SpA 4.125% 04/14/20 | 524,777 | |||||||||
| $ | 100 | Intesa Sanpaolo SpA (e) 6.50% 02/24/21 | 103,681 | ||||||||
| EUR | 500 | UniCredit SpA 4.375% 02/10/14 | 712,068 | ||||||||
| 300 | UniCredit SpA 5.75% 09/26/17 | 422,913 | |||||||||
| 2,557,219 | |||||||||||
| Utilities | |||||||||||
| $ | 650 | Enel Finance International N.V. (e) 5.125% 10/07/19 | 649,823 | ||||||||
| Total Italy | 4,045,476 | ||||||||||
| Luxembourg (0.1%) | |||||||||||
| Basic Materials | |||||||||||
| 390 | ArcelorMittal 9.85% 06/01/19 | 508,343 | |||||||||
| Industrials | |||||||||||
| EUR | 200 | Wind Acquisition Finance SA 11.75% 07/15/17 | 318,273 | ||||||||
| Total Luxembourg | 826,616 | ||||||||||
| Mexico (0.1%) | |||||||||||
| Finance | |||||||||||
| $ | 625 | BBVA Bancomer SA (e) 4.50% 03/10/16 | 641,406 | ||||||||
| PRINCIPAL AMOUNT IN THOUSANDS | VALUE | ||||||||||
| Netherlands (0.5%) | |||||||||||
| Finance | |||||||||||
| EUR | 400 | ABN Amro Bank 3.625% 10/06/17 | $ | 560,572 | |||||||
| $ | 335 | Aegon N.V. 4.625% 12/01/15 | 357,026 | ||||||||
| EUR | 300 | Cooperatieve Centrale Raiffeisen- Boerenleenbank BA 3.75% 11/09/20 | 406,369 | ||||||||
| 1,323,967 | |||||||||||
| Industrials | |||||||||||
| 250 | HeidelbergCement Finance BV 7.50% 04/03/20 | 376,288 | |||||||||
| 200 | OI European Group BV 6.75% 09/15/20 | 285,225 | |||||||||
| 661,513 | |||||||||||
| Information Technology | |||||||||||
| $ | 600 | ING Bank N.V. (e) 3.90% 03/19/14 | 645,095 | ||||||||
| Total Netherlands | 2,630,575 | ||||||||||
| Russia (0.0%) | |||||||||||
| Energy | |||||||||||
| 100 | Gazprom OAO Via Gaz Capital SA (e) 6.51% 03/07/22 | 109,500 | |||||||||
| South Africa (0.1%) | |||||||||||
| Communications | |||||||||||
| 330 | Sable International Finance Ltd. (e) 7.75% 02/15/17 | 331,650 | |||||||||
| Spain (0.2%) | |||||||||||
| Communications | |||||||||||
| EUR | 200 | Telefonica Emisiones SAU 3.661% 09/18/17 | 273,055 | ||||||||
See Notes to Financial Statements
46
Morgan Stanley Global Strategist Fund
Portfolio of Investments n July 31, 2011 continued
| PRINCIPAL AMOUNT IN THOUSANDS | VALUE | ||||||||||
| $ | 415 | Telefonica Europe BV 8.25% 09/15/30 | $ | 496,765 | |||||||
| 769,820 | |||||||||||
| Finance | |||||||||||
| EUR | 350 | Gas Natural Capital Markets SA 4.125% 01/26/18 | 473,982 | ||||||||
| Total Spain | 1,243,802 | ||||||||||
| Sweden (0.1%) | |||||||||||
| Finance | |||||||||||
| 480 | Nordea Bank AB 4.00% 03/29/21 | 649,913 | |||||||||
| Switzerland (0.2%) | |||||||||||
| Finance | |||||||||||
| $ | 175 | ABB Treasury Center USA, Inc. (e) 2.50% 06/15/16 | 178,094 | ||||||||
| 90 | Credit Suisse 6.00% 02/15/18 | 97,419 | |||||||||
| 110 | Credit Suisse AG 5.40% 01/14/20 | 113,472 | |||||||||
| 388,985 | |||||||||||
| Information Technology | |||||||||||
| 250 | UBS AG 3.875% 01/15/15 | 262,858 | |||||||||
| 195 | UBS AG 5.875% 12/20/17 | 217,925 | |||||||||
| 480,783 | |||||||||||
| Total Switzerland | 869,768 | ||||||||||
| United Kingdom (1.5%) | |||||||||||
| Basic Materials | |||||||||||
| 390 | Anglo American Capital PLC (e) 9.375% 04/08/19 | 525,011 | |||||||||
| PRINCIPAL AMOUNT IN THOUSANDS | VALUE | ||||||||||
| Communications | |||||||||||
| $ | 100 | WPP Finance 8.00% 09/15/14 | $ | 117,193 | |||||||
| Consumer, Non-Cyclical | |||||||||||
| 155 | BAT International Finance PLC (e) 9.50% 11/15/18 | 209,816 | |||||||||
| EUR | 350 | Imperial Tobacco Finance PLC 8.375% 02/17/16 | 602,404 | ||||||||
| 812,220 | |||||||||||
| Diversified | |||||||||||
| 200 | Mondi Finance PLC 5.75% 04/03/17 | 291,498 | |||||||||
| Finance | |||||||||||
| 650 | Abbey National Treasury Services PLC 3.625% 10/14/16 | 935,577 | |||||||||
| $ | 265 | Abbey National Treasury Services PLC (e) 3.875% 11/10/14 | 270,294 | ||||||||
| EUR | 200 | Barclays Bank PLC 6.00% 01/23/18 | 288,353 | ||||||||
| 250 | Barclays Bank PLC 6.00% 01/14/21 | 349,307 | |||||||||
| $ | 140 | Barclays Bank PLC 6.75% 05/22/19 | 158,281 | ||||||||
| 385 | HBOS PLC (e) 6.75% 05/21/18 | 386,444 | |||||||||
| 150 | Lloyds TSB Bank PLC (e) 5.80% 01/13/20 | 152,515 | |||||||||
| EUR | 300 | Lloyds TSB Bank PLC 6.375% 06/17/16 | 462,241 | ||||||||
| $ | 525 | Nationwide Building Society (e) 6.25% 02/25/20 | 565,383 | ||||||||
See Notes to Financial Statements
47
Morgan Stanley Global Strategist Fund
Portfolio of Investments n July 31, 2011 continued
| PRINCIPAL AMOUNT IN THOUSANDS | VALUE | ||||||||||
| $ | 450 | Royal Bank of Scotland PLC (The) 4.875% 03/16/15 | $ | 467,385 | |||||||
| 4,035,780 | |||||||||||
| Industrials | |||||||||||
| EUR | 300 | BAA Funding Ltd. 4.60% 02/15/18 | 447,641 | ||||||||
| 150 | Rexam PLC 6.75% (g) 06/29/67 | 210,685 | |||||||||
| 658,326 | |||||||||||
| Information Technology | |||||||||||
| 200 | FCE Bank PLC 7.125% 01/15/13 | 297,438 | |||||||||
| 400 | HSBC Holdings PLC 6.00% 06/10/19 | 618,971 | |||||||||
| 250 | Lloyds TSB Bank PLC 6.50% 03/24/20 | 336,589 | |||||||||
| 150 | Royal Bank of Scotland PLC (The) 5.50% 03/23/20 | 213,605 | |||||||||
| $ | 160 | Standard Chartered PLC (e) 3.85% 04/27/15 | 167,865 | ||||||||
| 1,634,468 | |||||||||||
| Utilities | |||||||||||
| 375 | PPL WEM Holdings PLC (e) 3.90% 05/01/16 | 392,801 | |||||||||
| Total United Kingdom | 8,467,297 | ||||||||||
| United States (3.9%) | |||||||||||
| Basic Materials | |||||||||||
| 200 | Georgia-Pacific LLC 7.75% 11/15/29 | 241,227 | |||||||||
| 275 | Georgia-Pacific LLC 8.875% 05/15/31 | 358,452 | |||||||||
| 280 | International Paper Co. 7.50% 08/15/21 | 342,693 | |||||||||
| 942,372 | |||||||||||
| PRINCIPAL AMOUNT IN THOUSANDS | VALUE | ||||||||||
| Communications | |||||||||||
| $ | 210 | AT&T, Inc. 6.30% 01/15/38 | $ | 233,202 | |||||||
| 205 | CBS Corp. 8.875% 05/15/19 | 267,601 | |||||||||
| 40 | CenturyLink, Inc. 6.45% 06/15/21 | 41,328 | |||||||||
| 170 | Comcast Corp. 5.15% 03/01/20 | 189,851 | |||||||||
| 105 | Comcast Corp. 5.70% 05/15/18 | 119,938 | |||||||||
| 50 | Comcast Corp. 6.45% 03/15/37 | 55,727 | |||||||||
| 95 | DirecTV Holdings LLC/DirecTV Financing Co., Inc. 5.875% 10/01/19 | 108,515 | |||||||||
| 90 | DirecTV Holdings LLC/DirecTV Financing Co., Inc. 7.625% 05/15/16 | 97,861 | |||||||||
| 380 | Frontier Communications Corp. 8.50% 04/15/20 | 418,950 | |||||||||
| 225 | NBC Universal Media LLC (e) 4.375% 04/01/21 | 230,462 | |||||||||
| 135 | News America, Inc. (e) 4.50% 02/15/21 | 135,226 | |||||||||
| 145 | Omnicom Group, Inc. 4.45% 08/15/20 | 149,593 | |||||||||
| 125 | Qwest Corp. 6.875% 09/15/33 | 124,375 | |||||||||
| 145 | SBA Telecommunications, Inc. 8.25% 08/15/19 | 157,325 | |||||||||
| 105 | Time Warner Cable, Inc. 6.75% 06/15/39 | 120,747 | |||||||||
See Notes to Financial Statements
48
Morgan Stanley Global Strategist Fund
Portfolio of Investments n July 31, 2011 continued
| PRINCIPAL AMOUNT IN THOUSANDS | VALUE | ||||||||||
| $ | 75 | Verizon Communications, Inc. 4.60% 04/01/21 | $ | 80,766 | |||||||
| 125 | Verizon Communications, Inc. 8.95% 03/01/39 | 185,551 | |||||||||
| 250 | Viacom, Inc. 6.875% 04/30/36 | 293,800 | |||||||||
| 3,010,818 | |||||||||||
| Consumer Staples | |||||||||||
| 200 | Anheuser-Busch InBev Worldwide, Inc. 4.125% 01/15/15 | 217,974 | |||||||||
| 45 | Anheuser-Busch InBev Worldwide, Inc. 5.375% 11/15/14 | 50,836 | |||||||||
| 235 | Philip Morris International, Inc. 5.65% 05/16/18 | 274,098 | |||||||||
| 60 | Quest Diagnostics, Inc. 3.20% 04/01/16 | 62,743 | |||||||||
| 605,651 | |||||||||||
| Consumer, Cyclical | |||||||||||
| 400 | Chrysler Group LLC/CG Co-Issuer, Inc. (e) 8.00% 06/15/19 | 389,000 | |||||||||
| 416 | CVS Pass-Through Trust 6.036% 12/10/28 | 442,436 | |||||||||
| 175 | Home Depot, Inc. 5.40% 09/15/40 | 175,193 | |||||||||
| 400 | Home Depot, Inc. 5.875% 12/16/36 | 435,276 | |||||||||
| 90 | JC Penney Co., Inc. 5.65% 06/01/20 | 89,550 | |||||||||
| 151 | JC Penney Corp., Inc. 6.375% 10/15/36 | 135,523 | |||||||||
| PRINCIPAL AMOUNT IN THOUSANDS | VALUE | ||||||||||
| $ | 265 | QVC, Inc. (e) 7.125% 04/15/17 | $ | 285,537 | |||||||
| 1,952,515 | |||||||||||
| Consumer, Non-Cyclical | |||||||||||
| 85 | Altria Group, Inc. 4.125% 09/11/15 | 91,864 | |||||||||
| 185 | Altria Group, Inc. 9.25% 08/06/19 | 247,262 | |||||||||
| 330 | ARAMARK Corp. 8.50% 02/01/15 | 344,850 | |||||||||
| 395 | Boston Scientific Corp. 6.00% 01/15/20 | 450,919 | |||||||||
| 115 | Bunge Ltd. Finance Corp. 8.50% 06/15/19 | 143,126 | |||||||||
| 304 | Celgene Corp. 3.95% 10/15/20 | 305,666 | |||||||||
| 135 | ConAgra Foods, Inc. 8.25% 09/15/30 | 165,053 | |||||||||
| 75 | Constellation Brands, Inc. 7.25% 09/01/16 | 83,063 | |||||||||
| 484 | Gilead Sciences, Inc. (e) 1.00% 05/01/14 | 544,500 | |||||||||
| 2,376,303 | |||||||||||
| Energy | |||||||||||
| 125 | Kinder Morgan Energy Partners LP 5.95% 02/15/18 | 143,075 | |||||||||
| 190 | Plains All American Pipeline LP/PAA Finance Corp. 6.70% 05/15/36 | 215,253 | |||||||||
| 190 | Plains All American Pipeline LP/PAA Finance Corp. 8.75% 05/01/19 | 245,492 | |||||||||
| 603,820 | |||||||||||
See Notes to Financial Statements
49
Morgan Stanley Global Strategist Fund
Portfolio of Investments n July 31, 2011 continued
| PRINCIPAL AMOUNT IN THOUSANDS | VALUE | ||||||||||
| Finance | |||||||||||
| $ | 160 | American International Group, Inc. 6.40% 12/15/20 | $ | 175,850 | |||||||
| 350 | Bank of America Corp. 5.65% 05/01/18 | 370,909 | |||||||||
| 180 | Bear Stearns Cos. LLC (The) 6.40% 10/02/17 | 208,134 | |||||||||
| 305 | Bear Stearns Cos. LLC (The) 7.25% 02/01/18 | 367,431 | |||||||||
| 455 | Capital One Bank, USA NA 8.80% 07/15/19 | 573,131 | |||||||||
| 245 | Citigroup, Inc. (See Note 6) 6.125% 05/15/18 | 274,133 | |||||||||
| 720 | Citigroup, Inc. (See Note 6) 8.50% 05/22/19 | 906,154 | |||||||||
| 235 | Farmers Exchange Capital (e) 7.05% 07/15/28 | 248,815 | |||||||||
| 275 | General Electric Capital Corp. 5.30% 02/11/21 | 293,684 | |||||||||
| 465 | General Electric Capital Corp. 5.625% 05/01/18 | 519,791 | |||||||||
| 635 | General Electric Capital Corp. 6.00% 08/07/19 | 719,084 | |||||||||
| 275 | Genworth Financial, Inc. 7.20% 02/15/21 | 258,844 | |||||||||
| 775 | Goldman Sachs Group, Inc. (The) 6.15% 04/01/18 | 854,963 | |||||||||
| PRINCIPAL AMOUNT IN THOUSANDS | VALUE | ||||||||||
| $ | 255 | Goldman Sachs Group, Inc. (The) 6.75% 10/01/37 | $ | 255,843 | |||||||
| 135 | Harley-Davidson Funding Corp. (e) 6.80% 06/15/18 | 156,807 | |||||||||
| 240 | Health Care REIT, Inc. 6.125% 04/15/20 | 264,749 | |||||||||
| 250 | Jefferies Group, Inc. 3.875% 11/09/15 | 256,741 | |||||||||
| 75 | JPMorgan Chase & Co. 6.00% 01/15/18 | 85,147 | |||||||||
| 1,280 | Merrill Lynch & Co., Inc., MTN 6.875% 04/25/18 | 1,434,326 | |||||||||
| 85 | NASDAQ OMX Group, Inc. (The) 5.55% 01/15/20 | 86,848 | |||||||||
| 150 | Prudential Financial, Inc., MTN 6.625% 12/01/37 | 168,961 | |||||||||
| 200 | Reinsurance Group of America, Inc. 6.45% 11/15/19 | 226,732 | |||||||||
| 125 | Santander Holdings USA, Inc. 4.625% 04/19/16 | 129,278 | |||||||||
| 435 | SLM Corp., MTN 6.25% 01/25/16 | 455,628 | |||||||||
| 9,291,983 | |||||||||||
| Industrials | |||||||||||
| 155 | Agilent Technologies, Inc. 5.50% 09/14/15 | 174,275 | |||||||||
| 70 | AT&T, Inc. 6.55% 02/15/39 | 80,449 | |||||||||
| 65 | CenturyLink, Inc., Series Q 6.15% 09/15/19 | 66,968 | |||||||||
See Notes to Financial Statements
50
Morgan Stanley Global Strategist Fund
Portfolio of Investments n July 31, 2011 continued
| PRINCIPAL AMOUNT IN THOUSANDS | VALUE | ||||||||||
| $ | 240 | CRH America, Inc. 6.00% 09/30/16 | $ | 269,127 | |||||||
| 230 | DISH DBS Corp. 7.125% 02/01/16 | 246,675 | |||||||||
| 255 | L-3 Communications Corp. 4.75% 07/15/20 | 262,718 | |||||||||
| 255 | Thermo Fisher Scientific, Inc. 4.50% 03/01/21 | 274,990 | |||||||||
| 60 | Verizon Communications, Inc. 5.85% 09/15/35 | 65,391 | |||||||||
| 150 | Verizon Communications, Inc. 6.35% 04/01/19 | 180,874 | |||||||||
| 1,621,467 | |||||||||||
| Information Technology | |||||||||||
| 75 | Boston Properties LP 5.875% 10/15/19 | 84,643 | |||||||||
| 265 | Prudential Financial, Inc. 4.75% 09/17/15 | 288,612 | |||||||||
| 373,255 | |||||||||||
| Technology | |||||||||||
| 145 | KLA-Tencor Corp. 6.90% 05/01/18 | 167,058 | |||||||||
| 670 | Microsoft Corp. (e) 0.00% 06/15/13 | 695,962 | |||||||||
| 863,020 | |||||||||||
| Utilities | |||||||||||
| 135 | NRG Energy, Inc. 8.50% 06/15/19 | 141,075 | |||||||||
| Total United States | 21,782,279 | ||||||||||
| Total Corporate Bonds (Cost $53,727,434) | 57,162,720 | ||||||||||
| PRINCIPAL AMOUNT IN THOUSANDS | VALUE | ||||||||||
| Sovereign (13.7%) | |||||||||||
| Australia (0.3%) | |||||||||||
| AUD | 1,600 | Treasury Corp. of Victoria 5.75% 11/15/16 | $ | 1,817,303 | |||||||
| Bermuda (0.0%) | |||||||||||
| $ | 240 | Bermuda Government International Bond (e) 5.603% 07/20/20 | 267,777 | ||||||||
| Canada (1.1%) | |||||||||||
| EUR | 300 | Canada Government International Bond 3.50% 01/13/20 | 454,947 | ||||||||
| CAD | 3,600 | Canadian Government Bond 4.25% 06/01/18 | 4,212,993 | ||||||||
| $ | 600 | Province of Ontario Canada 4.00% 10/07/19 | 642,162 | ||||||||
| EUR | 600 | Province of Ontario Canada 4.00% 12/03/19 | 907,370 | ||||||||
| Total Canada | 6,217,472 | ||||||||||
| Croatia (0.1%) | |||||||||||
| $ | 300 | Croatia Government International Bond 6.75% 11/05/19 | 317,302 | ||||||||
| Denmark (0.1%) | |||||||||||
| DKK | 3,300 | Denmark Government Bond 4.00% 11/15/17 | 703,264 | ||||||||
| France (0.8%) | |||||||||||
| EUR | 1,900 | French Treasury Note BTAN 4.50% 07/12/12 | 2,812,689 | ||||||||
See Notes to Financial Statements
51
Morgan Stanley Global Strategist Fund
Portfolio of Investments n July 31, 2011 continued
| PRINCIPAL AMOUNT IN THOUSANDS | VALUE | ||||||||||
| EUR | 1,000 | Government of France OAT 4.00% 04/25/18 | $ | 1,551,118 | |||||||
| Total France | 4,363,807 | ||||||||||
| Germany (1.7%) | |||||||||||
| 2,200 | Bundesobligation 2.75% 04/08/16 | 3,306,688 | |||||||||
| 1,150 | Bundesrepublik Deutschland 3.25% 07/04/15 | 1,758,018 | |||||||||
| 50 | Bundesrepublik Deutschland 3.50% 07/04/19 | 78,029 | |||||||||
| 350 | Bundesrepublik Deutschland 4.25% 07/04/39 | 587,808 | |||||||||
| 2,050 | Bundesrepublik Deutschland 4.75% 07/04/34 | 3,618,063 | |||||||||
| Total Germany | 9,348,606 | ||||||||||
| Hungary (0.1%) | |||||||||||
| 600 | Republic of Hungary 5.75% 06/11/18 | 851,363 | |||||||||
| Indonesia (0.1%) | |||||||||||
| $ | 250 | Indonesia Government International Bond 11.625% 03/04/19 | 376,875 | ||||||||
| Italy (1.7%) | |||||||||||
| EUR | 2,400 | Italy Buoni Poliennali Del Tesoro 2.50% 07/01/12 | 3,421,104 | ||||||||
| 850 | Italy Buoni Poliennali Del Tesoro 3.00% 06/15/15 | 1,135,468 | |||||||||
| 1,800 | Italy Buoni Poliennali Del Tesoro 4.00% 02/01/17 | 2,431,541 | |||||||||
| PRINCIPAL AMOUNT IN THOUSANDS | VALUE | ||||||||||
| EUR | 1,100 | Italy Buoni Poliennali Del Tesoro 4.50% 02/01/18 | $ | 1,490,237 | |||||||
| 800 | Italy Buoni Poliennali Del Tesoro 5.00% 08/01/39 | 959,722 | |||||||||
| $ | 330 | Republic of Italy 6.875% 09/27/23 | 359,662 | ||||||||
| Total Italy | 9,797,734 | ||||||||||
| Japan (3.6%) | |||||||||||
| JPY | 345,000 | Government of Japan 1.70% 06/20/33 | 4,317,961 | ||||||||
| 110,000 | Japan Finance Organization for Municipal Enterprises 1.90% 06/22/18 | 1,546,728 | |||||||||
| 140,000 | Japan Government Ten Year Bond 1.30% 12/20/13 | 1,866,965 | |||||||||
| 380,000 | Japan Government Ten Year Bond 1.40% 09/20/15 | 5,156,884 | |||||||||
| 395,000 | Japan Government Ten Year Bond 1.70% 06/20/18 | 5,506,342 | |||||||||
| 120,000 | Japan Government Ten Year Bond 1.90% 06/20/16 | 1,674,206 | |||||||||
| Total Japan | 20,069,086 | ||||||||||
| Korea, Republic of (0.1%) | |||||||||||
| $ | 100 | Export - Import Bank of Korea 4.125% 09/09/15 | 106,041 | ||||||||
| 200 | Korea Development Bank 4.375% 08/10/15 | 212,675 | |||||||||
See Notes to Financial Statements
52
Morgan Stanley Global Strategist Fund
Portfolio of Investments n July 31, 2011 continued
| PRINCIPAL AMOUNT IN THOUSANDS | VALUE | ||||||||||
| $ | 150 | Republic of Korea 7.125% 04/16/19 | $ | 184,866 | |||||||
| Total Korea, Republic of | 503,582 | ||||||||||
| Luxembourg (0.4%) | |||||||||||
| JPY | 145,000 | European Investment Bank 2.15% 01/18/27 | 2,010,860 | ||||||||
| Mexico (0.5%) | |||||||||||
| MXN | 24,400 | Mexican Bonos 10.00% 12/05/24 | 2,646,171 | ||||||||
| Netherlands (0.5%) | |||||||||||
| EUR | 100 | Government of Netherlands 4.00% 01/15/37 | 157,347 | ||||||||
| 1,800 | Netherlands Government Bond 4.00% 07/15/19 | 2,834,891 | |||||||||
| Total Netherlands | 2,992,238 | ||||||||||
| Norway (0.1%) | |||||||||||
| NOK | 3,500 | Kingdom of Norway 6.50% 05/15/13 | 698,119 | ||||||||
| Poland (0.6%) | |||||||||||
| PLN | 5,200 | Poland Government Bond 5.25% 10/25/17 | 1,849,736 | ||||||||
| 3,400 | Poland Government Bond 6.25% 10/24/15 | 1,273,506 | |||||||||
| Total Poland | 3,123,242 | ||||||||||
| South Africa (0.3%) | |||||||||||
| ZAR | 12,500 | South Africa Government Bond 7.25% 01/15/20 | 1,766,048 | ||||||||
| PRINCIPAL AMOUNT IN THOUSANDS | VALUE | ||||||||||
| Sweden (0.3%) | |||||||||||
| SEK | 8,300 | Sweden Government Bond 4.50% 08/12/15 | $ | 1,441,029 | |||||||
| United Kingdom (1.3%) | |||||||||||
| GBP | 500 | United Kingdom Gilt 2.75% 01/22/15 | 863,087 | ||||||||
| 600 | United Kingdom Gilt 4.00% 09/07/16 | 1,093,411 | |||||||||
| 2,450 | United Kingdom Gilt 4.25% 06/07/32 | 4,217,293 | |||||||||
| 750 | United Kingdom Gilt 4.50% 03/07/13 | 1,307,065 | |||||||||
| Total United Kingdom | 7,480,856 | ||||||||||
| Total Sovereign (Cost $69,527,427) | 76,792,734 | ||||||||||
| Municipal Bonds (0.1%) | |||||||||||
| Georgia (0.1%) | |||||||||||
| Municipal Electric Authority of Georgia | |||||||||||
| 160 | 6.637% 04/01/57 | 160,394 | |||||||||
| 295 | 6.655% 04/01/57 | 289,498 | |||||||||
| Total Georgia | 449,892 | ||||||||||
| Illinois (0.0%) | |||||||||||
| $ | 145 | Illinois State Toll Highway Authority, Highway Revenue, Build America Bonds 6.184% 01/01/34 | 155,537 | ||||||||
| Total Municipal Bonds (Cost $603,725) | 605,429 | ||||||||||
See Notes to Financial Statements
53
Morgan Stanley Global Strategist Fund
Portfolio of Investments n July 31, 2011 continued
| PRINCIPAL AMOUNT IN THOUSANDS | VALUE | ||||||||||
| Agency Fixed Rate Mortgages (3.6%) | |||||||||||
| Federal Home Loan Mortgage Corporation, Gold Pools: | |||||||||||
| $ | 1,088 | 6.00% 11/01/37 - 02/01/38 | $ | 1,200,425 | |||||||
| 312 | 6.50% 05/01/32 - 09/01/32 | 355,184 | |||||||||
| Federal National Mortgage Association, August TBA: | |||||||||||
| 700 | 4.00% (i) | 711,156 | |||||||||
| 3,400 | 4.50% (i) | 3,549,813 | |||||||||
| 975 | 5.00% (i) | 1,040,660 | |||||||||
| 1,400 | 5.50% (i) | 1,517,250 | |||||||||
| Conventional Pools: | |||||||||||
| 1,597 | 5.00% 09/01/40 | 1,706,807 | |||||||||
| 1,514 | 5.50% 06/01/38 | 1,643,266 | |||||||||
| 1,847 | 6.00% 03/01/37 - 10/01/38 | 2,041,526 | |||||||||
| 83 | 6.50% 12/01/29 | 94,995 | |||||||||
| 792 | 7.00% 12/01/17 - 02/01/31 | 917,399 | |||||||||
| Government National Mortgage Association, August TBA: | |||||||||||
| 2,065 | 4.00% (i) | 2,135,339 | |||||||||
| Various Pools: | |||||||||||
| 2,907 | 4.50% 04/15/39 - 08/15/39 | 3,109,444 | |||||||||
| 321 | 5.50% 08/15/39 | 357,140 | |||||||||
| Total Agency Fixed Rate Mortgages (Cost $20,058,462) | 20,380,404 | ||||||||||
| PRINCIPAL AMOUNT IN THOUSANDS | VALUE | ||||||||||
| Asset-Backed Securities (0.5%) | |||||||||||
| $ | 101 | ARI Fleet Lease Trust (e) 1.637% (g) 08/15/18 | $ | 101,358 | |||||||
| 120 | Chesapeake Funding LLC (e) 2.187% (g) 12/15/20 | 120,488 | |||||||||
| 825 | CNH Equipment Trust 1.20% 05/16/16 | 829,645 | |||||||||
| 525 | Ford Credit Floorplan Master Owner Trust (e) 1.887% (g) 02/15/17 | 544,660 | |||||||||
| 430 | FUEL Trust (e) 4.207% 04/15/16 | 437,578 | |||||||||
| 325 | GE Dealer Floorplan Master Note Trust (e) 1.737% (g) 10/20/14 | 329,584 | |||||||||
| 425 | SLM Student Loan Trust (e) 4.37% 04/17/28 | 445,514 | |||||||||
| Total Asset-Backed Securities (Cost $2,751,499) | 2,808,827 | ||||||||||
| U.S. Treasury Securities (3.8%) | |||||||||||
| 8,500 | U.S. Treasury Bond Principal STRIPS 0.00% 11/15/24 | 5,238,320 | |||||||||
| U.S. Treasury Bonds | |||||||||||
| 220 | 3.50% 02/15/39 | 197,691 | |||||||||
| 1,120 | 4.375% 11/15/39 | 1,169,175 | |||||||||
| 2,900 | 6.875% 08/15/25 | 4,034,173 | |||||||||
| U.S. Treasury Notes | |||||||||||
| 7,720 | 3.125% 05/15/19 | 8,180,189 | |||||||||
| 2,600 | 3.375% 11/15/19 | 2,784,844 | |||||||||
| Total U.S. Treasury Securities (Cost $20,348,104) | 21,604,392 | ||||||||||
See Notes to Financial Statements
54
Morgan Stanley Global Strategist Fund
Portfolio of Investments n July 31, 2011 continued
| PRINCIPAL AMOUNT IN THOUSANDS | VALUE | ||||||||||
| Commercial Mortgage Backed Securities (1.0%) | |||||||||||
| United States | |||||||||||
| $ | 500 | Banc of America Commercial Mortgage, Inc. 5.657% (g) 04/10/49 | $ | 463,220 | |||||||
| 440 | Bear Stearns Commercial Mortgage Securities 5.363% 02/11/44 | 406,979 | |||||||||
| 820 | Citigroup Commercial Mortgage Trust (See Note 6) 5.698% (g) 12/10/49 | 819,959 | |||||||||
| 230 | DBUBS Mortgage Trust (e) 5.002% 11/10/46 | 239,362 | |||||||||
| Greenwich Capital Commercial Funding Corp. | |||||||||||
| 800 | 5.475% 03/10/39 | 781,007 | |||||||||
| 1,315 | 5.867% (g) 12/10/49 | 1,216,219 | |||||||||
| JP Morgan Chase Commercial Mortgage Securities Corp. | |||||||||||
| 425 | 5.742% (g) 02/12/49 | 415,358 | |||||||||
| 335 | 5.894% (g) 02/12/51 | 335,020 | |||||||||
| 425 | 6.059% (g) 02/15/51 | 414,681 | |||||||||
| 510 | LB-UBS Commercial Mortgage Trust 6.167% (g) 09/15/45 | 501,452 | |||||||||
| Total Commercial Mortgage Backed Securities (Cost $5,776,464) | 5,593,257 | ||||||||||
| PRINCIPAL AMOUNT IN THOUSANDS | VALUE | ||||||||||
| Short-Term Investments (7.6%) | |||||||||||
| U.S. Treasury Security (0.4%) | |||||||||||
| $ | 2,060 | U.S. Treasury Bill (Cost $2,059,866) (j)(k) 0.01% 09/22/11 | $ | 2,059,866 | |||||||
| NUMBER OF SHARES (000) | |||||||||||
| Investment Company (7.2%) | |||||||||||
| 40,758 | Morgan Stanley Institutional Liquidity Funds - Money Market Portfolio - Institutional Class (See Note 6) (Cost $40,758,101) | 40,758,101 | |||||||||
| Total Short-Term Investments (Cost $42,817,967) | 42,817,967 | ||||||||||
| Total Investments (Cost $522,485,856) (l)(m)(n) | 100.6 | % | 565,774,548 | ||||||||
| Liabilities in Excess of Other Assets | (0.6 | ) | (3,540,481 | ) | |||||||
| Net Assets | 100.0 | % | $ | 562,234,067 | |||||||
ADR American Depositary Receipt.
BTAN Bons du Trésor à Intérets Annuels (Treasury Bill Annual Interest)
CVA Certificaten Van Aandelen.
GDR Global Depositary Receipt.
MTN Medium Term Note.
OAT Obligations Assimilables du Trésor (French Treasury Obligation).
PPS Price Protected Shares.
REIT Real Estate Investment Trust.
SDR Swedish Depositary Receipt.
STRIPS Separate Trading of Registered Interest and Principal of Securities.
TBA To Be Announced.
(a) Non-income producing security.
See Notes to Financial Statements
55
Morgan Stanley Global Strategist Fund
Portfolio of Investments n July 31, 2011 continued
(b) Comprised of securities in separate entities that are traded as a single stapled security.
(c) Consists of one or more classes of securities traded together as a unit; stocks with attached warrants.
(d) Security trades on the Hong Kong exchange.
(e) 144A security - Certain conditions for public sale may exist. Unless otherwise noted, these securities are deemed to be liquid.
(f) Security is linked to the Dow Jones UBS Commodities Index Total Return. The index is currently comprised of futures contracts on nineteen physical commodities traded on U.S. exchanges, with the exception of aluminum, nickel, and zinc, which trade on the London Metal Exchange.
(g) Variable/Floating Rate Security - Interest rate changes on these instruments are based on changes in a designated base rate. The rates shown are those in effect on July 31, 2011.
(h) Perpetual - Security does not have a predetermined maturity date. Rate for this security is fixed for a period of time then reverts to a floating rate. The interest shown is the rate in effect at July 31, 2011.
(i) Security is subject to delayed delivery.
(j) Purchased on a discount basis. The interest rates shown have been adjusted to reflect a money market equivalent yield.
(k) A portion of this security has been physically segregated in connection with open futures and swap agreements.
(l) The market value and percentage of net assets, $126,403,630 and 22.5%, respectively, represent the securities that have been fair valued under the fair valuation policy for international investments as described in Note 1A within the Notes to the Financial Statements.
(m) Securities have been designated as collateral in connection with securities purchased on a forward commitment basis, open foreign currency exchange, futures and swap agreements.
(n) The aggregate cost for federal income tax purposes is $529,533,419. The aggregate gross unrealized appreciation is $48,086,689 and the aggregate gross unrealized depreciation is $11,845,560 resulting in net unrealized appreciation of $36,241,129.
See Notes to Financial Statements
56
Morgan Stanley Global Strategist Fund
Portfolio of Investments n July 31, 2011 continued
Foreign Currency Exchange Contracts Open at July 31, 2011:
| COUNTERPARTY | CONTRACTS TO DELIVER | IN EXCHANGE FOR | DELIVERY DATE | UNREALIZED APPRECIATION (DEPRECIATION) | |||||||||||||||
| Bank of America NA | CAD | 5,824,361 | $ | 6,005,580 | 08/18/11 | $ | (88,216 | ) | |||||||||||
| Bank of America NA | MYR | 1,252,307 | $ | 417,784 | 08/18/11 | (3,647 | ) | ||||||||||||
| Deutsche Bank AG London | EUR | 1,314,519 | $ | 1,836,318 | 08/18/11 | (51,863 | ) | ||||||||||||
| Deutsche Bank AG London | KRW | 3,479,106,911 | $ | 3,280,784 | 08/18/11 | (15,346 | ) | ||||||||||||
| JPMorgan Chase Bank | NOK | 3,557,217 | $ | 635,789 | 08/18/11 | (24,244 | ) | ||||||||||||
| JPMorgan Chase Bank | SEK | 10,764,967 | $ | 1,636,818 | 08/18/11 | (72,804 | ) | ||||||||||||
| JPMorgan Chase Bank | $ | 14,759,127 | CNY | 95,321,821 | 08/18/11 | 46,358 | |||||||||||||
| Royal Bank of Scotland | MXN | 20,469,198 | $ | 1,731,003 | 08/18/11 | (10,376 | ) | ||||||||||||
| Royal Bank of Scotland | $ | 395,796 | CZK | 6,866,631 | 08/18/11 | 12,291 | |||||||||||||
| Royal Bank of Scotland | $ | 1,253,418 | ILS | 4,349,046 | 08/18/11 | 16,338 | |||||||||||||
| Royal Bank of Scotland | $ | 649,422 | THB | 19,765,167 | 08/18/11 | 12,352 | |||||||||||||
| State Street Bank and Trust Co. | $ | 121,285 | NOK | 678,539 | 08/18/11 | 4,617 | |||||||||||||
| State Street Bank and Trust Co. | $ | 5,114,339 | TWD | 147,165,113 | 08/18/11 | (10,182 | ) | ||||||||||||
| UBS AG | AUD | 314,208 | $ | 331,546 | 08/18/11 | (12,991 | ) | ||||||||||||
| UBS AG | BRL | 647,459 | $ | 409,758 | 08/18/11 | (6,006 | ) | ||||||||||||
| UBS AG | GBP | 3,699,599 | $ | 5,883,325 | 08/18/11 | (188,394 | ) | ||||||||||||
| UBS AG | JPY | 596,121,250 | $ | 7,726,942 | 08/18/11 | (18,062 | ) | ||||||||||||
| UBS AG | NZD | 3,309,808 | $ | 2,702,872 | 08/18/11 | (203,006 | ) | ||||||||||||
| UBS AG | SGD | 3,966,617 | $ | 3,293,220 | 08/18/11 | (1,152 | ) | ||||||||||||
| UBS AG | $ | 9,748,144 | CAD | 9,454,491 | 08/18/11 | 143,711 | |||||||||||||
| UBS AG | $ | 939,300 | CHF | 782,521 | 08/18/11 | 55,180 | |||||||||||||
| UBS AG | $ | 9,270,949 | HKD | 72,255,082 | 08/18/11 | 842 | |||||||||||||
| UBS AG | $ | 3,305,454 | INR | 147,390,203 | 08/18/11 | 20,210 | |||||||||||||
| UBS AG | $ | 4,276,269 | JPY | 339,857,319 | 08/18/11 | 139,270 | |||||||||||||
| UBS AG | $ | 5,108,741 | KRW | 5,426,248,830 | 08/18/11 | 32,124 | |||||||||||||
| UBS AG | $ | 1,471,731 | MXN | 17,401,376 | 08/18/11 | 8,659 | |||||||||||||
| UBS AG | $ | 2,944,734 | RUB | 82,909,275 | 08/18/11 | 49,984 | |||||||||||||
| UBS AG | $ | 5,109,820 | SGD | 6,267,455 | 08/18/11 | 95,453 | |||||||||||||
| UBS AG | $ | 685,795 | TRY | 1,139,592 | 08/18/11 | (13,339 | ) | ||||||||||||
| UBS AG | $ | 3,742,366 | ZAR | 25,895,301 | 08/18/11 | 123,390 | |||||||||||||
| Bank of America NA | PLN | 1,600,000 | $ | 552,372 | 08/25/11 | (21,279 | ) | ||||||||||||
| Bank of America NA | $ | 1,434,195 | SEK | 9,400,000 | 08/25/11 | 58,103 | |||||||||||||
| Bank of America NA | $ | 574,233 | SGD | 702,000 | 08/25/11 | 8,804 | |||||||||||||
| Bank of America NA | $ | 444,547 | THB | 13,500,000 | 08/25/11 | 7,180 | |||||||||||||
| Goldman Sachs International | $ | 829,014 | CAD | 795,000 | 08/25/11 | 2,634 | |||||||||||||
| UBS AG | EUR | 456,227 | $ | 652,769 | 08/25/11 | (2,458 | ) | ||||||||||||
| UBS AG | EUR | 149,218 | $ | 214,262 | 08/25/11 | (43 | ) | ||||||||||||
| UBS AG | EUR | 1,203,573 | $ | 1,701,214 | 08/25/11 | (27,342 | ) | ||||||||||||
| UBS AG | EUR | 670,000 | $ | 946,576 | 08/25/11 | (15,669 | ) | ||||||||||||
| UBS AG | $ | 1,602,796 | CHF | 1,330,000 | 08/25/11 | 87,642 | |||||||||||||
| UBS AG | $ | 1,797,912 | CLP | 843,850,000 | 08/25/11 | 40,814 | |||||||||||||
| UBS AG | $ | 69,634 | EUR | 49,190 | 08/25/11 | 1,011 | |||||||||||||
| UBS AG | $ | 1,903,635 | EUR | 1,328,000 | 08/25/11 | 3,621 | |||||||||||||
See Notes to Financial Statements
57
Morgan Stanley Global Strategist Fund
Portfolio of Investments n July 31, 2011 continued
| COUNTERPARTY | CONTRACTS TO DELIVER | IN EXCHANGE FOR | DELIVERY DATE | UNREALIZED APPRECIATION (DEPRECIATION) | |||||||||||||||
| UBS AG | $ | 2,229,621 | GBP | 1,396,000 | 08/25/11 | $ | 61,306 | ||||||||||||
| UBS AG | $ | 12,614,099 | JPY | 996,274,124 | 08/25/11 | 331,040 | |||||||||||||
| UBS AG | $ | 948,377 | JPY | 75,000,000 | 08/25/11 | 26,140 | |||||||||||||
| UBS AG | $ | 948,767 | JPY | 75,000,000 | 08/25/11 | 25,750 | |||||||||||||
| UBS AG | $ | 758,701 | JPY | 60,000,000 | 08/25/11 | 20,912 | |||||||||||||
| UBS AG | $ | 138,704 | JPY | 10,943,750 | 08/25/11 | 3,494 | |||||||||||||
| UBS AG | $ | 2,652,259 | KRW | 2,835,000,000 | 08/25/11 | 32,289 | |||||||||||||
| UBS AG | $ | 2,121,122 | MYR | 6,434,000 | 08/25/11 | 42,935 | |||||||||||||
| UBS AG | $ | 1,757,631 | RUB | 50,125,000 | 08/25/11 | 51,562 | |||||||||||||
| UBS AG | $ | 864,699 | TWD | 24,960,000 | 08/25/11 | 1,034 | |||||||||||||
| UBS AG | ZAR | 8,480,000 | $ | 1,237,414 | 08/25/11 | (27,223 | ) | ||||||||||||
| Net Unrealized Appreciation | $ | 753,408 | |||||||||||||||||
Futures Contracts Open at July 31, 2011:
| NUMBER OF CONTRACTS | LONG/SHORT | DESCRIPTION, DELIVERY MONTH AND YEAR | UNDERLYING FACE AMOUNT AT VALUE | UNREALIZED APPRECIATION (DEPRECIATION) | |||||||||||||||
| 99 | Long | Hang Seng China ENT Index, August 2011 | $ | 7,838,069 | $ | (126,809 | ) | ||||||||||||
| 59 | Long | KOSPI 200 Index, September 2011 | 7,782,818 | (74,149 | ) | ||||||||||||||
| 4 | Long | 10 yr. Japan Government Bond, September 2011 | 7,369,228 | 44,684 | |||||||||||||||
| 75 | Long | U.S. Dollar Index, September 2011 | 5,552,700 | 11,100 | |||||||||||||||
| 32 | Long | German Euro Bobl, September 2011 | 5,495,163 | 136,563 | |||||||||||||||
| 170 | Long | MSCI Taiwan Index, August 2011 | 5,093,200 | (45,900 | ) | ||||||||||||||
| 34 | Long | U.S. Treasury 5 yr. Note, September 2011 | 4,129,141 | 80,937 | |||||||||||||||
| 60 | Long | E-mini MSCI Emerging Market Index, September 2011 | 3,442,500 | 32,270 | |||||||||||||||
| 78 | Long | FTSE/JSE top 40, September 2011 | 3,235,197 | (80,416 | ) | ||||||||||||||
| 48 | Long | SGX MSCI Singapore Index, August 2011 | 2,907,665 | 1,595 | |||||||||||||||
| 52 | Long | CAC 40 Index, August 2011 | 2,744,794 | (116,935 | ) | ||||||||||||||
See Notes to Financial Statements
58
Morgan Stanley Global Strategist Fund
Portfolio of Investments n July 31, 2011 continued
| NUMBER OF CONTRACTS | LONG/SHORT | DESCRIPTION, DELIVERY MONTH AND YEAR | UNDERLYING FACE AMOUNT AT VALUE | UNREALIZED APPRECIATION (DEPRECIATION) | |||||||||||||||
| 81 | Long | MEX BOLSA Index, September 2011 | $ | 2,492,047 | $ | 57,003 | |||||||||||||
| 8 | Long | DAX Index, September 2011 | 2,063,675 | 10,489 | |||||||||||||||
| 168 | Long | SGX CNX Nifty Index, August 2011 | 1,844,808 | (32,678 | ) | ||||||||||||||
| 13 | Long | IBEX 35 Index, August 2011 | 1,793,157 | 16,593 | |||||||||||||||
| 15 | Long | FTSE 100 Index, September 2011 | 1,424,246 | 12,680 | |||||||||||||||
| 20 | Long | NIKKEI 225 Index, September 2011 | 1,275,573 | 35,944 | |||||||||||||||
| 8 | Long | Hang Seng Index, August 2011 | 1,145,790 | (9,649 | ) | ||||||||||||||
| 10 | Long | TOPIX Index, September 2011 | 1,092,420 | 43,645 | |||||||||||||||
| 5 | Long | UK Long Gilt Bond, September 2011 | 1,026,646 | 11,901 | �� | ||||||||||||||
| 10 | Long | BOVESPA Index, August 2011 | 381,075 | (33,988 | ) | ||||||||||||||
| 2 | Short | FTSE MIB Index, September 2011 | (264,821 | ) | 26,367 | ||||||||||||||
| 126 | Short | Euro Stoxx 50 Index, September 2011 | (4,841,259 | ) | 90,062 | ||||||||||||||
| 23 | Short | U.S. Treasury 2 yr. Note, September 2011 | (5,058,203 | ) | (13,191 | ) | |||||||||||||
| 38 | Short | German Euro Bund, September 2011 | (7,117,939 | ) | (277,408 | ) | |||||||||||||
| 63 | Short | U.S. Treasury 30 yr. Bond, September 2011 | (8,071,875 | ) | (275,133 | ) | |||||||||||||
| 263 | Short | S&P 500 E-Mini Index, September 2011 | (16,942,460 | ) | (57,471 | ) | |||||||||||||
| 155 | Short | U.S. Treasury 10 yr. Note, September 2011 | (19,481,562 | ) | (584,749 | ) | |||||||||||||
| Net Unrealized Depreciation | $ | (1,116,643 | ) | ||||||||||||||||
See Notes to Financial Statements
59
Morgan Stanley Global Strategist Fund
Portfolio of Investments n July 31, 2011 continued
Interest Rate Swap Agreements Open at July 31, 2011:
| SWAP COUNTERPARTY | NOTIONAL AMOUNT (000) | FLOATING RATE INDEX | PAY/RECEIVE FLOATING RATE | FIXED RATE | TERMINATION DATE | UNREALIZED APPRECIATION (DEPRECIATION) | |||||||||||||||||||||
| Bank of America NA | $ | 16,350 | 3 Month LIBOR | Pay | 0.80 | % | 10/28/13 | $ | (87,316 | ) | |||||||||||||||||
| Bank of America NA | 6,855 | 3 Month LIBOR | Receive | 2.10 | 10/28/17 | 44,576 | |||||||||||||||||||||
| Barclays Bank PLC | SEK | 271,024 | 3 Month STIBOR | Receive | 2.76 | 07/29/12 | 16,164 | ||||||||||||||||||||
| Barclays Bank PLC | 317,510 | 3 Month STIBOR | Pay | 2.89 | 07/29/13 | (62,075 | ) | ||||||||||||||||||||
| Net Unrealized Depreciation | $ | (88,651 | ) | ||||||||||||||||||||||||
Zero Coupon Swap Agreements Open at July 31, 2011:
| SWAP COUNTERPARTY | NOTIONAL AMOUNT (000) | FLOATING RATE INDEX | PAY/RECEIVE FLOATING RATE | TERMINATION DATE | UNREALIZED APPRECIATION (DEPRECIATION) | ||||||||||||||||||
| Barclays Bank PLC | $ | 2,645 | 3 Month LIBOR | Receive | 11/15/19 | $ | (745,662 | ) | |||||||||||||||
| Barclays Bank PLC | 3,134 | 3 Month LIBOR | Pay | 11/15/19 | 289,598 | ||||||||||||||||||
| Goldman Sachs | 2,162 | 3 Month LIBOR | Receive | 11/15/24 | (101,366 | ) | |||||||||||||||||
| JP Morgan Chase Bank | 3,046 | 3 Month LIBOR | Receive | 11/15/24 | (66,782 | ) | |||||||||||||||||
| Net Unrealized Depreciation | $ | (624,212 | ) | ||||||||||||||||||||
LIBOR London Interbank Offered Rate.
STIBOR Stockholm Interbank Offered Rate.
Currency Abbreviations:
AUD Australian Dollar.
BRL Brazilian Real.
CAD Canadian Dollar.
CHF Swiss Franc.
CLP Chilean Peso.
CNY Chinese Yuan Renminbi.
CZK Czech Koruna.
DKK Danish Krone.
EUR Euro.
GBP British Pound.
HKD Hong Kong Dollar.
ILS Israeli Shekel.
INR Indian Rupee.
JPY Japanese Yen.
KRW South Korean Won.
MXN Mexican New Peso.
MYR Malaysian Ringgit.
NOK Norwegian Krone.
NZD New Zealand Dollar.
PLN Polish Zloty.
RUB Russian Ruble.
SEK Swedish Krona.
SGD Singapore Dollar.
THB Thai Baht.
TRY Turkish Lira.
TWD Taiwan Dollar.
USD United States Dollar.
ZAR South African Rand.
See Notes to Financial Statements
60
Morgan Stanley Global Strategist Fund
Financial Statements
Statement of Assets and Liabilities
July 31, 2011
| Assets: | |||||||
| Investments in securities, at value (cost $479,434,271) | $ | 522,565,246 | |||||
| Investments in affiliates, at value (cost $43,051,585) | 43,209,302 | ||||||
| Total investments in securities, at value (cost $522,485,856) | 565,774,548 | ||||||
| Unrealized appreciation on open swap agreements | 350,338 | ||||||
| Unrealized appreciation on open foreign currency exchange contracts | 1,567,050 | ||||||
| Cash (including foreign currency valued at $1,013,161 with a cost of $860,804) | 1,020,984 | ||||||
| Due from broker | 5,043,868 | ||||||
| Receivable for: | |||||||
| Investments sold | 2,755,084 | ||||||
| Interest | 1,987,469 | ||||||
| Dividends | 402,206 | ||||||
| Foreign withholding taxes reclaimed | 183,073 | ||||||
| Shares of beneficial interest sold | 61,460 | ||||||
| Interest and dividends from affiliates | 19,511 | ||||||
| Prepaid expenses and other assets | 52,683 | ||||||
| Total Assets | 579,218,274 | ||||||
| Liabilities: | |||||||
| Unrealized depreciation on open swap agreements | 1,063,201 | ||||||
| Unrealized depreciation on open foreign currency exchange contracts | 813,642 | ||||||
| Payable for: | |||||||
| Investments purchased | 11,141,782 | ||||||
| Shares of beneficial interest redeemed | 2,329,528 | ||||||
| Variation margin | 589,010 | ||||||
| Transfer agent fee | 253,832 | ||||||
| Investment advisory fee | 204,153 | ||||||
| Distribution fee | 166,775 | ||||||
| Administration fee | 38,886 | ||||||
| Accrued expenses and other payables | 383,398 | ||||||
| Total Liabilities | 16,984,207 | ||||||
| Net Assets | $ | 562,234,067 | |||||
| Composition of Net Assets: | |||||||
| Paid-in-capital | $ | 490,885,035 | |||||
| Net unrealized appreciation | 42,372,033 | ||||||
| Accumulated undistributed net investment income | 10,979,960 | ||||||
| Accumulated undistributed net realized gain | 17,997,039 | ||||||
| Net Assets | $ | 562,234,067 | |||||
| Class A Shares: | |||||||
| Net Assets | $ | 457,332,799 | |||||
| Shares Outstanding (unlimited shares authorized, $.01 par value) | 27,374,435 | ||||||
| Net Asset Value Per Share | $ | 16.71 | |||||
| Maximum Offering Price Per Share, (net asset value plus 5.54% of net asset value) | $ | 17.64 | |||||
| Class B Shares: | |||||||
| Net Assets | $ | 34,374,444 | |||||
| Shares Outstanding (unlimited shares authorized, $.01 par value) | 2,051,521 | ||||||
| Net Asset Value Per Share | $ | 16.76 | |||||
| Class C Shares: | |||||||
| Net Assets | $ | 43,410,922 | |||||
| Shares Outstanding (unlimited shares authorized, $.01 par value) | 2,622,688 | ||||||
| Net Asset Value Per Share | $ | 16.55 | |||||
| Class I Shares: | |||||||
| Net Assets | $ | 27,115,902 | |||||
| Shares Outstanding (unlimited shares authorized, $.01 par value) | 1,618,271 | ||||||
| Net Asset Value Per Share | $ | 16.76 | |||||
See Notes to Financial Statements
61
Morgan Stanley Global Strategist Fund
Financial Statements continued
Statement of Operations
For the year ended July 31, 2011
| Net Investment Income: Income | |||||||
| Dividends (net of $467,145 foreign withholding tax) | $ | 7,769,874 | |||||
| Interest (net of $38,813 foreign withholding tax) | 6,383,328 | ||||||
| Interest and dividends from affiliates (Note 6) | 283,250 | ||||||
| Total Income | 14,436,452 | ||||||
| Expenses | |||||||
| Investment advisory fee (Note 4) | 2,490,804 | ||||||
| Distribution fee (Class A shares) (Note 5) | 1,179,621 | ||||||
| Distribution fee (Class B shares) (Note 5) | 478,139 | ||||||
| Distribution fee (Class C shares) (Note 5) | 437,357 | ||||||
| Transfer agent fees and expenses | 608,897 | ||||||
| Administration fee (Note 4) | 474,439 | ||||||
| Custodian fees | 207,800 | ||||||
| Shareholder reports and notices | 180,437 | ||||||
| Professional fees | 153,926 | ||||||
| Trustees' fees and expenses | 27,875 | ||||||
| Other | 200,905 | ||||||
| Total Expenses | 6,440,200 | ||||||
| Less: rebate from Morgan Stanley affiliates (Note 6) | (106,249 | ) | |||||
| Net Expenses | 6,333,951 | ||||||
| Net Investment Income | 8,102,501 | ||||||
| Realized and Unrealized Gain (Loss): Realized Gain (Loss) on: | |||||||
| Investments | 26,443,090 | ||||||
| Investments in affiliates (Note 6) | 28,633 | ||||||
| Futures contracts | 6,745,081 | ||||||
| Swap agreements | (1,606,071 | ) | |||||
| Foreign currency exchange contracts | 11,564,428 | ||||||
| Foreign currency translation | (2,943,600 | ) | |||||
| Net Realized Gain | 40,231,561 | ||||||
| Change in Unrealized Appreciation/Depreciation on: | |||||||
| Investments | 27,850,504 | ||||||
| Investments in affiliates (Note 6) | (137,258 | ) | |||||
| Futures contracts | (2,361,193 | ) | |||||
| Swap agreements | 908,901 | ||||||
| Foreign currency exchange contracts | (1,433,827 | ) | |||||
| Foreign currency translation | 114,371 | ||||||
| Net Change in Unrealized Appreciation/Depreciation | 24,941,498 | ||||||
| Net Gain | 65,173,059 | ||||||
| Net Increase | $ | 73,275,560 | |||||
See Notes to Financial Statements
62
Morgan Stanley Global Strategist Fund
Financial Statements continued
Statements of Changes in Net Assets
| FOR THE YEAR ENDED JULY 31, 2011 | FOR THE YEAR ENDED JULY 31, 2010^ | ||||||||||
| Increase (Decrease) in Net Assets: Operations: | |||||||||||
| Net investment income | $ | 8,102,501 | $ | 6,745,498 | |||||||
| Net realized gain | 40,231,561 | 122,393,285 | |||||||||
| Net change in unrealized appreciation/depreciation | 24,941,498 | (79,569,479 | ) | ||||||||
| Net Increase | 73,275,560 | 49,569,304 | |||||||||
| Dividends and Distributions to Shareholders from: | |||||||||||
| Net investment income | |||||||||||
| Class A shares | (3,087,669 | ) | (7,592,642 | ) | |||||||
| Class B shares | (116,860 | ) | (595,284 | ) | |||||||
| Class C shares | (127,307 | ) | (368,480 | ) | |||||||
| Class I shares | (268,166 | ) | (504,638 | ) | |||||||
| Net realized gain | |||||||||||
| Class A shares | (67,021,038 | ) | — | ||||||||
| Class B shares | (7,180,925 | ) | — | ||||||||
| Class C shares | (6,220,483 | ) | — | ||||||||
| Class I shares | (4,887,059 | ) | — | ||||||||
| Total Dividends and Distributions | (88,909,507 | ) | (9,061,044 | ) | |||||||
| Net decrease from transactions in shares of beneficial interest | (7,101,105 | ) | (70,662,343 | ) | |||||||
| Net Decrease | (22,735,052 | ) | (30,154,083 | ) | |||||||
| Net Assets: | |||||||||||
| Beginning of period | 584,969,119 | 615,123,202 | |||||||||
| End of Period (Including accumulated undistributed net investment income of $10,979,960 and dividends in excess of net investment income of ($2,419,594), respectively) | $ | 562,234,067 | $ | 584,969,119 | |||||||
^ Beginning with the year ended July 31, 2011, the Fund was audited by Ernst & Young LLP. The previous year was audited by another independent registered public accounting firm.
See Notes to Financial Statements
63
Morgan Stanley Global Strategist Fund
Notes to Financial Statements n July 31, 2011
1. Organization and Accounting Policies
Morgan Stanley Global Strategist Fund (the "Fund") is registered under the Investment Company Act of 1940, as amended (the "Act"), as a diversified, open-end management investment company. The Fund's investment objective is to maximize the total return on its investments. The Fund was organized as a Massachusetts business trust on August 5, 1988 and commenced operations on October 31, 1988. On July 28, 1997, the Fund converted to a multiple class share structure.
The Fund offers Class A shares, Class B shares, Class C shares and Class I shares. The four classes are substantially the same except that most Class A shares are subject to a sales charge imposed at the time of purchase and some Class A shares, and most Class B shares and Class C shares are subject to a contingent deferred sales charge imposed on shares redeemed within eighteen months, six years and one year, respectively. Class I shares are not subject to a sales charge. Additionally, Class A shares, Class B shares and Class C shares incur distribution expenses.
The following is a summary of significant accounting policies:
A. Valuation of Investments — (1) An equity portfolio security listed or traded on the New York Stock Exchange ("NYSE") or American Stock Exchange or other domestic exchange is valued at its latest sale price prior to the time when assets are valued; if there were no sales that day, the security is valued at the mean between the last reported bid and ask price; (2) an equity portfolio security listed or traded on the Nasdaq is valued at the Nasdaq Official Closing Price; if there were no sales that day, the security is valued at the mean between the last reported bid and ask price; (3) all other domestic securities for which over-the-counter market quotations are readily available are valued at the mean between the last reported bid and ask price. In cases where a security is traded on more than one domestic exchange, the security is valued on the exchange designated as the primary market; (4) for equity securities traded on foreign exchanges, the last reported sale price or the latest bid price may be used if there were no sales on a particular day; (5) futures are valued at the latest price published by the commodities exchange on which they trade; (6) commodity-linked notes are marked-to-market daily based upon quotations from market makers; (7) when market quotations are not readily available, including circumstances under which Morgan Stanley Investment Management Inc. (the "Adviser"), a wholly owned subsidiary of Morgan Stanley, determines that the latest sale price, the bid price or the mean between the last reported bid and ask price do not reflect a security's market value, portfolio securities are valued at their fair value as determined in good faith under procedures established by and under the general supervision of the Fund's Trustees. Occasionally, developments affecting the closing prices of securities and other assets may occur between the times at which valuations of such securities are determined (that is, close of the foreign market on which the securities trade) and the close of business on the NYSE. If developments occur during such periods that are expected to materially affect the value of such securities, such valuations may be adjusted to reflect the estimated
64
Morgan Stanley Global Strategist Fund
Notes to Financial Statements n July 31, 2011 continued
fair value of such securities as of the close of the NYSE, as determined in good faith by the Fund's Trustees or by the Adviser using a pricing service and/or procedures approved by the Trustees of the Fund; (8) certain portfolio securities may be valued by an outside pricing service approved by the Fund's Trustees. The prices provided by a pricing service take into account broker dealer market price quotations for trading in similar groups of securities, security quality, maturity, coupon and other security characteristics as well as any developments related to the specific securities; (9) investments in mutual funds, including the Morgan Stanley Institutional Liquidity Funds, are valued at the net asset value as of the close of each business day; and (10) short-term debt securities having a maturity date of more than sixty days at time of purchase are valued on a mark-to-market basis until sixty days prior to maturity and thereafter at amortized cost based on their value on the 61st day. Short-term debt securities having a maturity date of sixty days or less at the time of purchase are valued at amortized cost, which approximates fair value.
B. Accounting for Investments — Security transactions are accounted for on the trade date (date the order to buy or sell is executed). Realized gains and losses on security transactions are determined by the identified cost method. Dividend income and other distributions are recorded on the ex-dividend date. Discounts are accreted and premiums are amortized over the life of the respective securities and are included in interest income. Interest income is accrued daily as earned.
C. Multiple Class Allocations — Investment income, expenses (other than distribution fees), and realized and unrealized gains and losses are allocated to each class of shares based upon the relative net asset value on the date such items are recognized. Distribution fees are charged directly to the respective class.
D. Foreign Currency Translation — The books and records of the Fund are maintained in U.S. dollars as follows: (1) the foreign currency market value of investment securities, other assets and liabilities and foreign currency exchange contracts are translated at the exchange rates prevailing at the end of the period; and (2) purchases, sales, income and expenses are translated at the exchange rates prevailing on the respective dates of such transactions. The resultant exchange gains and losses are recorded as realized and unrealized gains/losses on foreign currency exchange contracts and foreign currency translations. Pursuant to U.S. federal income tax regulations, certain foreign exchange gains/losses included in realized and unrealized gains/losses are included in or are a reduction of ordinary income for federal income tax purposes. The Fund does not isolate that portion of the results of operations arising as a result of changes in the foreign exchange rates from the changes in the market prices of the securities held.
E. Federal Income Tax Policy — It is the Fund's policy to comply with the requirements of Subchapter M of the Internal Revenue Code applicable to regulated investment companies and to distribute substantially all of its taxable income to its shareholders. Therefore, no federal income tax provision is required. The
65
Morgan Stanley Global Strategist Fund
Notes to Financial Statements n July 31, 2011 continued
Fund files tax returns with the U.S. Internal Revenue Service, New York State and New York City. The Fund recognizes the tax effects of a tax position taken or expected to be taken in a tax return only if it is more likely than not to be sustained based solely on its technical merits as of the reporting date. The more-likely-than-not threshold must continue to be met in each reporting period to support continued recognition of the benefit. The difference between the tax benefit recognized in the financial statements for a tax position taken and the tax benefit claimed in the income tax return is referred to as an unrecognized tax benefit. There are no unrecognized tax benefits in the accompanying financial statements. If applicable, the Fund recognizes interest accrued related to unrecognized tax benefits in interest expense and penalties in "other expenses" in the Statement of Operations. Each of the tax years in the four-year period ended July 31, 2011 remains subject to examination by taxing authorities.
F. Dividends and Distributions to Shareholders — Dividends and distributions to shareholders are recorded on the ex-dividend date.
G. When-Issued/Delayed Delivery Securities — The Fund may purchase or sell when-issued and delayed delivery securities. Securities purchased on a when-issued or delayed delivery basis are purchased for delivery beyond the normal settlement date at a stated price and yield, and no income accrues to the Fund on such securities prior to delivery. Payment and delivery for when-issued and delayed delivery securities can take place up to 120 days after the date of the transaction. When a Fund enters into a purchase transaction on a when-issued or delayed delivery basis, it establishes either a segregated account in which it maintains liquid assets in an amount at least equal in value to the Fund's commitments to purchase such securities or designates such assets as segregated on a Fund's records. Purchasing securities on a when-issued or delayed delivery basis may involve a risk that the market price at the time of delivery may be lower than the agreed upon purchase price, in which case there could be an unrealized loss at the time of delivery. Purchasing investments on a when-issued or delayed delivery basis may be considered a form of leverage which may increase the impact that gains (losses) may have on the Fund.
H. Structured Investments — The Fund may invest a portion of its assets in structured investments. A structured investment is a derivative security designed to offer a return linked to a particular underlying security, currency or market. Structured investments may come in various forms including notes, warrants and options to purchase securities. The Fund will typically use structured investments to gain exposure to a permitted underlying security, currency or market when direct access to a market is limited or inefficient from a tax or cost standpoint.
I. Use of Estimates — The preparation of financial statements in accordance with generally accepted accounting principles in the United States ("GAAP") requires management to make estimates and assumptions that affect the reported amounts and disclosures. Actual results could differ from those estimates.
66
Morgan Stanley Global Strategist Fund
Notes to Financial Statements n July 31, 2011 continued
J. Indemnifications — The Fund enters into contracts that contain a variety of indemnifications. The Fund's maximum exposure under these arrangements is unknown. However, the Fund has not had prior claims or losses pursuant to these contracts and expects the risk of loss to be remote.
2. Fair Valuation Measurements
Financial Accounting Standards Board ("FASB") Accounting Standards Codification ("ASC") 820, Fair Value Measurements and Disclosures ("ASC 820"), defines fair value as the value that the Fund would receive to sell an investment or pay to transfer a liability in a timely transaction with an independent buyer in the principal market, or in the absence of a principal market the most advantageous market for the investment or liability. ASC 820 establishes a three-tier hierarchy to distinguish between (1) inputs that reflect the assumptions market participants would use in valuing an asset or liability developed based on market data obtained from sources independent of the reporting entity (observable inputs); and (2) inputs that reflect the reporting entity's own assumptions about the assumptions market participants would use in valuing an asset or liability developed based on the best information available in the circumstances (unobservable inputs) and to establish classification of fair value measurements for disclosure purposes. Various inputs are used in determining the value of the Fund's investments. The inputs are summarized in the three broad levels listed below.
• Level 1 — unadjusted quoted prices in active markets for identical investments
• Level 2 — other significant observable inputs (including quoted prices for similar investments, interest rates, prepayment speeds, credit risk, etc.)
• Level 3 — significant unobservable inputs including the Fund's own assumptions in determining the fair value of investments. Factors considered in making this determination may include, but are not limited to, information obtained by contacting the issuer, analysts, or the appropriate stock exchange (for exchange-traded securities), analysis of the issuer's financial statements or other available documents and, if necessary, available information concerning other securities in similar circumstances
The inputs or methodology used for valuing securities are not necessarily an indication of the risk associated with investing in those securities and the determination of the significance of a particular input to the fair value measurement in its entirety requires judgment and considers factors specific to each security.
67
Morgan Stanley Global Strategist Fund
Notes to Financial Statements n July 31, 2011 continued
The following is a summary of the inputs used as of July 31, 2011 in valuing the Fund's investments carried at fair value:
| FAIR VALUE MEASUREMENTS AT JULY 31, 2011 USING | |||||||||||||||||||
| INVESTMENT TYPE | TOTAL | UNADJUSTED QUOTED PRICES IN ACTIVE MARKETS FOR IDENTICAL INVESTMENTS (LEVEL 1) | OTHER SIGNIFICANT OBSERVABLE INPUTS (LEVEL 2) | SIGNIFICANT UNOBSERVABLE INPUTS (LEVEL 3) | |||||||||||||||
| Assets: | |||||||||||||||||||
| Common Stocks | |||||||||||||||||||
| Aerospace & Defense | $ | 3,891,014 | $ | 3,093,653 | $ | 797,361 | — | ||||||||||||
| Air Freight & Logistics | 673,252 | 318,510 | 354,742 | — | |||||||||||||||
| Airlines | 138,113 | — | 138,113 | — | |||||||||||||||
| Auto Components | 2,943,553 | 1,844,341 | 1,099,212 | — | |||||||||||||||
| Automobiles | 5,758,828 | 1,340,473 | 4,418,355 | — | |||||||||||||||
| Beverages | 5,826,674 | 3,315,298 | 2,511,376 | — | |||||||||||||||
| Biotechnology | 1,538,847 | 1,257,493 | 281,354 | — | |||||||||||||||
| Building Products | 895,885 | — | 895,885 | — | |||||||||||||||
| Capital Markets | 6,038,900 | 3,391,890 | 2,647,010 | — | |||||||||||||||
| Chemicals | 8,333,335 | 3,316,221 | 5,017,114 | — | |||||||||||||||
| Commercial Banks | 22,430,622 | 8,509,141 | 13,921,481 | — | |||||||||||||||
| Commercial Services & Supplies | 1,569,147 | 774,507 | 794,640 | — | |||||||||||||||
| Communications Equipment | 2,954,151 | 2,176,178 | 777,973 | — | |||||||||||||||
| Computers & Peripherals | 8,261,093 | 7,811,503 | 449,590 | — | |||||||||||||||
| Construction & Engineering | 2,609,983 | 1,801,241 | 808,742 | — | |||||||||||||||
| Construction Materials | 382,155 | — | 382,155 | — | |||||||||||||||
| Consumer Finance | 250,324 | 250,324 | — | — | |||||||||||||||
| Containers & Packaging | 937,875 | 819,548 | 118,327 | — | |||||||||||||||
| Distributors | 1,016,499 | 949,757 | 66,742 | — | |||||||||||||||
| Diversified Consumer Services | 123,103 | 123,103 | — | — | |||||||||||||||
| Diversified Financial Services | 5,496,551 | 3,830,834 | 1,665,717 | — | |||||||||||||||
| Diversified Telecommunication Services | 5,075,217 | 1,319,466 | 3,755,751 | — | |||||||||||||||
| Electric Utilities | 4,063,892 | 418,756 | 3,645,136 | — | |||||||||||||||
| Electrical Equipment | 3,362,456 | 1,266,623 | 2,095,833 | — | |||||||||||||||
| Electronic Equipment, Instruments & Components | 3,229,392 | 1,590,647 | 1,638,745 | — | |||||||||||||||
| Energy Equipment & Services | 4,245,152 | 3,227,225 | 1,017,927 | — | |||||||||||||||
| Food & Staples Retailing | 7,616,947 | 4,526,721 | 3,090,226 | — | |||||||||||||||
| Food Products | 8,443,281 | 4,004,816 | 4,438,465 | — | |||||||||||||||
| Gas Utilities | 785,152 | — | 785,152 | — | |||||||||||||||
68
Morgan Stanley Global Strategist Fund
Notes to Financial Statements n July 31, 2011 continued
| FAIR VALUE MEASUREMENTS AT JULY 31, 2011 USING | |||||||||||||||||||
| INVESTMENT TYPE | TOTAL | UNADJUSTED QUOTED PRICES IN ACTIVE MARKETS FOR IDENTICAL INVESTMENTS (LEVEL 1) | OTHER SIGNIFICANT OBSERVABLE INPUTS (LEVEL 2) | SIGNIFICANT UNOBSERVABLE INPUTS (LEVEL 3) | |||||||||||||||
| Health Care Equipment & Supplies | $ | 4,091,018 | $ | 3,093,871 | $ | 997,147 | — | ||||||||||||
| Health Care Providers & Services | 6,197,490 | 5,967,033 | 230,457 | — | |||||||||||||||
| Health Care Technology | 190,966 | 190,966 | — | — | |||||||||||||||
| Hotels, Restaurants & Leisure | 3,677,551 | 3,034,696 | 642,855 | — | |||||||||||||||
| Household Durables | 1,804,700 | 1,163,405 | 641,295 | — | |||||||||||||||
| Household Products | 5,167,508 | 4,360,664 | 806,844 | — | |||||||||||||||
| Independent Power Producers & Energy Traders | 695,299 | 624,121 | 71,178 | — | |||||||||||||||
| Industrial Conglomerates | 5,198,623 | 2,788,348 | 2,410,275 | — | |||||||||||||||
| Information Technology Services | 5,474,455 | 5,209,164 | 265,291 | — | |||||||||||||||
| Insurance | 12,298,438 | 6,661,688 | 5,636,750 | — | |||||||||||||||
| Internet & Catalog Retail | 419,953 | 278,368 | 141,585 | — | |||||||||||||||
| Internet Software & Services | 2,593,226 | 2,495,410 | 97,816 | — | |||||||||||||||
| Leisure Equipment & Products | 134,678 | 26,660 | 108,018 | — | |||||||||||||||
| Life Sciences Tools & Services | 684,096 | 588,907 | 95,189 | — | |||||||||||||||
| Machinery | 7,754,644 | 4,119,450 | 3,635,194 | — | |||||||||||||||
| Marine | 442,247 | — | 442,247 | — | |||||||||||||||
| Media | 6,975,575 | 5,274,509 | 1,701,066 | — | |||||||||||||||
| Metals & Mining | 16,165,335 | 7,741,695 | 8,423,640 | — | |||||||||||||||
| Multi-Utilities | 2,975,721 | 1,258,034 | 1,717,687 | — | |||||||||||||||
| Multiline Retail | 2,674,894 | 2,174,080 | 500,814 | — | |||||||||||||||
| Office Electronics | 913,764 | 54,114 | 859,650 | — | |||||||||||||||
| Oil, Gas & Consumable Fuels | 36,081,534 | 24,860,600 | 11,220,934 | — | |||||||||||||||
| Paper & Forest Products | 1,340,440 | 911,938 | 428,502 | — | |||||||||||||||
| Personal Products | 983,786 | 209,647 | 774,139 | — | |||||||||||||||
| Pharmaceuticals | 21,845,405 | 12,731,705 | 9,113,700 | — | |||||||||||||||
| Professional Services | 1,016,981 | 432,543 | 584,438 | — | |||||||||||||||
| Real Estate Investment Trusts (REITs) | 5,516,044 | 3,836,427 | 1,679,617 | — | |||||||||||||||
| Real Estate Management & Development | 2,547,915 | 527,722 | 2,020,193 | — | |||||||||||||||
| Road & Rail | 4,273,103 | 2,726,556 | 1,546,547 | — | |||||||||||||||
| Semiconductors & Semiconductor Equipment | 3,949,772 | 3,277,657 | 672,115 | — | |||||||||||||||
| Software | 7,900,801 | 6,692,856 | 1,207,945 | — | |||||||||||||||
| Specialty Retail | 3,864,420 | 2,945,722 | 918,698 | — | |||||||||||||||
69
Morgan Stanley Global Strategist Fund
Notes to Financial Statements n July 31, 2011 continued
| FAIR VALUE MEASUREMENTS AT JULY 31, 2011 USING | |||||||||||||||||||
| INVESTMENT TYPE | TOTAL | UNADJUSTED QUOTED PRICES IN ACTIVE MARKETS FOR IDENTICAL INVESTMENTS (LEVEL 1) | OTHER SIGNIFICANT OBSERVABLE INPUTS (LEVEL 2) | SIGNIFICANT UNOBSERVABLE INPUTS (LEVEL 3) | |||||||||||||||
| Textiles, Apparel & Luxury Goods | $ | 2,635,397 | $ | 1,117,075 | $ | 1,518,322 | — | ||||||||||||
| Tobacco | 5,727,721 | 3,662,274 | 2,065,447 | — | |||||||||||||||
| Trading Companies & Distributors | 1,968,029 | 153,091 | 1,814,938 | — | |||||||||||||||
| Transportation Infrastructure | 567,826 | 111,392 | 456,434 | — | |||||||||||||||
| Wireless Telecommunication Services | 3,720,614 | 377,075 | 3,343,539 | — | |||||||||||||||
| Total Common Stocks | 309,361,362 | 182,957,732 | 126,403,630 | — | |||||||||||||||
| Commodity Linked Security | 22,347,589 | — | 22,347,589 | — | |||||||||||||||
| Investment Company | 6,299,867 | 6,299,867 | — | — | |||||||||||||||
| Corporate Bonds | 57,162,720 | — | 57,162,720 | — | |||||||||||||||
| Sovereign | 76,792,734 | — | 76,792,734 | — | |||||||||||||||
| Municipal Bonds | 605,429 | — | 605,429 | — | |||||||||||||||
| Agency Fixed Rate Mortgages | 20,380,404 | — | 20,380,404 | — | |||||||||||||||
| Asset-Backed Securities | 2,808,827 | — | 2,808,827 | — | |||||||||||||||
| U.S. Treasury Securities | 21,604,392 | — | 21,604,392 | — | |||||||||||||||
| Commercial Mortgage Backed Securities | 5,593,257 | — | 5,593,257 | — | |||||||||||||||
| Short-Term Investments | |||||||||||||||||||
| U.S. Treasury Security | 2,059,866 | — | 2,059,866 | — | |||||||||||||||
| Investment Company | 40,758,101 | 40,758,101 | — | — | |||||||||||||||
| Total Short-Term Investments | 42,817,967 | 40,758,101 | 2,059,866 | — | |||||||||||||||
| Foreign Currency Exchange Contracts | 1,567,050 | — | 1,567,050 | — | |||||||||||||||
| Futures | 611,833 | 611,833 | — | — | |||||||||||||||
| Interest Rate Swaps | 60,740 | — | 60,740 | — | |||||||||||||||
| Zero Coupon Swaps | 289,598 | — | 289,598 | — | |||||||||||||||
| Total Assets | $ | 568,303,769 | $ | 230,627,533 | $ | 337,676,236 | — | ||||||||||||
| Liabilities: | |||||||||||||||||||
| Foreign Currency Exchange Contracts | (813,642 | ) | — | (813,642 | ) | — | |||||||||||||
| Futures | (1,728,476 | ) | (1,728,476 | ) | — | — | |||||||||||||
| Interest Rate Swaps | (149,391 | ) | — | (149,391 | ) | — | |||||||||||||
| Zero Coupon Swaps | (913,810 | ) | — | (913,810 | ) | — | |||||||||||||
| Total Liabilities | $ | (3,605,319 | ) | $ | (1,728,476 | ) | $ | (1,876,843 | ) | — | |||||||||
| Total | $ | 564,698,450 | $ | 228,899,057 | $ | 335,799,393 | — | ||||||||||||
70
Morgan Stanley Global Strategist Fund
Notes to Financial Statements n July 31, 2011 continued
Transfers between investment levels may occur as the markets fluctuate and/or the availability of data used in an investment's valuation changes. The Fund recognizes transfers between the levels as of the end of the period. As of July 31, 2011, securities with a total value of $125,861,412 transferred from Level 1 to Level 2. At July 31, 2011 the fair market value of certain securities were adjusted due to developments which occurred between the time of the close of the foreign markets on which they trade and the close of business on the NYSE which resulted in their Level 2 classification.
3. Derivatives
The Fund uses derivative instruments for a variety of purposes, including hedging, risk management, portfolio management or to earn income. Derivatives are financial instruments whose value is based on the value of another underlying asset, interest rate, index or financial instrument. A derivative instrument often has risks similar to its underlying instrument and may have additional risks, including imperfect correlation between the value of the derivative and the underlying instrument, risks of default by the other party to certain transactions, magnification of losses incurred due to changes in the market value of the securities, instruments, indices or interest rates to which they relate, and risks that the transactions may not be liquid. The use of derivatives involves risks that are different from, and possibly greater than, the risks associated with other portfolio investments. Derivatives may involve the use of highly specialized instruments that require investment techniques and risk analyses different from those associated with other portfolio investments. All of the Fund's holdings, including derivative instruments, are marked-to-market each day with the change in value reflected in unrealized appreciation (depreciation). Upon disposition, a realized gain or loss is recognized.
Certain derivative transactions may give rise to a form of leverage. Leverage associated with derivative transactions may cause the Fund to liquidate portfolio positions when it may not be advantageous to do so to satisfy its obligations or to meet earmarking or segregation requirements, pursuant to applicable Securities and Exchange Commission rules and regulations, or may cause the Fund to be more volatile than if the Fund had not been leveraged. Although the Adviser seeks to use derivatives to further the Fund's investment objectives, there is no assurance that the use of derivatives will achieve this result.
Following is a description of the derivative instruments and techniques that the Fund used during the period and their associated risks:
Foreign Currency Exchange Contracts In connection with its investments in foreign securities, the Fund entered into contracts with banks, brokers or dealers to purchase or sell foreign currencies at a future date. A foreign currency exchange contract ("currency contracts") is a negotiated agreement between the contracting parties to exchange a specified amount of currency at a specified future time at a specified rate. The rate can be higher or lower than the spot rate between the currencies that are the subject of the currency contract. Currency contracts are used to protect against uncertainty in the level of future foreign currency exchange rates or to gain or modify exposure to a particular currency.
71
Morgan Stanley Global Strategist Fund
Notes to Financial Statements n July 31, 2011 continued
Hedging the Fund's currency risks involves the risk of mismatching the Fund's objectives under a currency contract with the value of securities denominated in a particular currency. Furthermore, such transactions reduce or preclude the opportunity for gain if the value of the currency should move in the direction opposite to the position taken. There is an additional risk to the effect that currency contracts create exposure to currencies in which the Fund's securities are not denominated. Unanticipated changes in currency prices may result in poorer overall performance for the Fund than if it had not entered into such contracts. A currency contract is marked-to-market daily and the change in market value is recorded by the Fund as unrealized gain or (loss). The Fund records realized gains (losses) when the currency contract is closed equal to the difference between the value of the currency contract at the time it was opened and the value at the time it was closed.
Futures A futures contract is a standardized agreement between two parties to buy or sell a specific quantity of an underlying instrument at a specific price at a specific future time. The value of a futures contract tends to increase and decrease in tandem with the value of the underlying instrument. Futures contracts are bilateral agreements, with both the purchaser and the seller equally obligated to complete the transaction. Depending on the terms of the particular contract, futures contracts are settled through either physical delivery of the underlying instrument on the settlement date or by payment of a cash settlement amount on the settlement date. During the period the futures contract is open, payments are received from or made to the broker based upon changes in the value of the contract (the variation margin). A decision as to whether, when and how to use futures involves the exercise of skill and judgment and even a well conceived futures transaction may be unsuccessful because of market behavior or unexpected events. In addition to the derivatives risks discussed above, the prices of futures can be highly volatile, using futures can lower total return, and the potential loss from futures can exceed the Fund's initial investment in such contracts.
Swaps A swap agreement is an agreement between two parties pursuant to which the parties exchange payments at specified dates on the basis of a specified notional amount, with the payments calculated by reference to specified securities, indexes, reference rates, currencies or other instruments. Most swap agreements provide that when the period payment dates for both parties are the same, the payments are made on a net basis (i.e., the two payment streams are netted out, with only the net amount paid by one party to the other). The Fund's obligations or rights under a swap agreement entered into on a net basis will generally be equal only to the net amount to be paid or received under the agreement, based on the relative values of the positions held by each counterparty. Swap agreements are not entered into or traded on exchanges and there is no central clearing or guaranty function for swaps. Therefore, swaps are subject to credit risk or the risk of default or non-performance by the counterparty. Swaps could result in losses if interest rate or foreign currency exchange rates or credit quality changes are not correctly anticipated by the Fund or if the reference index, security or investments do not perform as expected.
72
Morgan Stanley Global Strategist Fund
Notes to Financial Statements n July 31, 2011 continued
The Fund's use of swaps during the period included those based on the credit of an underlying security and commonly referred to as credit default swaps. Where a Fund is the buyer of a credit default swap agreement, it would be entitled to receive the par (or other agreed-upon) value of a referenced debt obligation from the counterparty to the agreement only in the event of a default by a third party on the debt obligation. If no default occurs, a Fund would have paid to the counterparty a periodic stream of payments over the term of the agreement and received no benefit from the agreement. When the Fund is the seller of a credit default swap agreement, it receives the stream of payments but is obligated to pay upon default of the referenced debt obligation. Alternatively, for credit default swaps on an index of credits, the quoted market prices and current values serve as an indicator of the current status of the payment/performance risk of the credit derivative. Generally, lower credit ratings and increasing market values, in absolute terms, represent a deterioration of the credit and a greater likelihood of an adverse credit event of the issuer.
When the Fund has an unrealized loss on a swap agreement, the Fund has instructed the custodian to pledge cash or liquid securities as collateral with a value approximately equal to the amount of the unrealized loss. Collateral pledges are monitored and subsequently adjusted if and when the swap valuations fluctuate. If applicable, cash collateral is included with "Due from (to) broker" on the Statement of Assets and Liabilities.
FASB ASC 815, Derivatives and Hedging: Overall ("ASC 815"), is intended to improve financial reporting about derivative instruments by requiring enhanced disclosures to enable investors to better understand how and why the Fund uses derivative instruments, how these derivative instruments are accounted for and their effects on the Fund's financial position and results of operations.
The following table sets forth the fair value of the Fund's derivative contracts by primary risk exposure as of July 31, 2011.
| PRIMARY RISK EXPOSURE | ASSET DERIVATIVES STATEMENT OF ASSETS AND LIABILITIES LOCATION | FAIR VALUE | LIABILITY DERIVATIVES STATEMENT OF ASSETS AND LIABILITIES LOCATION | FAIR VALUE | |||||||||||||||
| Interest Rate Risk | Variation margin | $ | 274,085 | † | Variation margin | $ | (1,150,481 | )† | |||||||||||
| Unrealized appreciation on open swap agreements | 350,338 | Unrealized depreciation on open swap agreements | (1,063,201 | ) | |||||||||||||||
| Foreign Currency Risk | Unrealized appreciation on open foreign currency exchange contracts | 1,567,050 | Unrealized depreciation on open foreign currency exchange contracts | (813,642 | ) | ||||||||||||||
| Equity Risk | Variation margin | 337,748 | † | Variation margin | (577,995 | )† | |||||||||||||
| $ | 2,529,221 | $ | (3,605,319 | ) | |||||||||||||||
† Includes cumulative appreciation/depreciation of futures contracts as reported in the Portfolio of Investments. Only current day's variation margin is reported within the Statement of Assets and Liabilities.
73
Morgan Stanley Global Strategist Fund
Notes to Financial Statements n July 31, 2011 continued
The following tables set forth by primary risk exposure the Fund's realized gains (losses) and change in unrealized appreciation (depreciation) by type of derivative contract for the year ended July 31, 2011 in accordance with ASC 815.
AMOUNT OF REALIZED GAIN (LOSS) ON DERIVATIVE CONTRACTS
| PRIMARY RISK EXPOSURE | FUTURES | FOREIGN CURRENCY EXCHANGE | SWAPS | ||||||||||||
| Interest Rate Risk | $ | (611,773 | ) | — | $ | (557,190 | ) | ||||||||
| Credit Risk | — | — | (52,790 | ) | |||||||||||
| Foreign Currency Risk | — | $ | 11,564,428 | — | |||||||||||
| Equity Risk | 7,356,854 | — | (996,091 | ) | |||||||||||
| Total | $ | 6,745,081 | $ | 11,564,428 | $ | (1,606,071 | ) | ||||||||
CHANGE IN UNREALIZED APPRECIATION (DEPRECIATION) ON DERIVATIVE CONTRACTS
| PRIMARY RISK EXPOSURE | FUTURES | FOREIGN CURRENCY EXCHANGE | SWAPS | ||||||||||||
| Interest Rate Risk | $ | (542,413 | ) | — | $ | 857,253 | |||||||||
| Credit Risk | — | — | 51,648 | ||||||||||||
| Foreign Currency Risk | — | $ | (1,433,827 | ) | — | ||||||||||
| Equity Risk | (1,818,780 | ) | — | — | |||||||||||
| Total | $ | (2,361,193 | ) | $ | (1,433,827 | ) | $ | 908,901 | |||||||
For year ended July 31, 2011, the Fund's the average monthly original value of futures contracts was $172,441,639, the average monthly notional value of swap agreements was $136,492,866 and the average monthly principal amount of foreign currency exchange contracts was $169,117,294.
4. Investment Advisory/Administration Agreements
Pursuant to an Investment Advisory Agreement with the Adviser, the Fund pays an advisory fee, accrued daily and payable monthly, by applying the following annual rates to the net assets of the Fund determined as of the close of each business day: 0.42% to the portion of the daily net assets not exceeding $1.5 billion and 0.395% to the portion of the daily net assets exceeding $1.5 billion.
Pursuant to an Administration Agreement with Morgan Stanley Services Company Inc. (the "Administrator"), an affiliate of the Adviser, the Fund pays an administration fee, accrued daily and payable monthly, by applying the annual rate of 0.08% to the Fund's daily net assets.
Under a Sub-Administration Agreement between the Administrator and State Street Bank and Trust Company ("State Street"), State Street provides certain administrative services to the Fund. For such services, the Administrator pays State Street a portion of the fee the Administrator receives from the Fund.
74
Morgan Stanley Global Strategist Fund
Notes to Financial Statements n July 31, 2011 continued
5. Plan of Distribution
Shares of the Fund are distributed by Morgan Stanley Distribution, Inc. (the "Distributor"), an affiliate of the Adviser and Administrator. The Fund has adopted a Plan of Distribution (the "Plan") pursuant to Rule 12b-1 under the Act. The Plan provides that the Fund will pay the Distributor a fee which is accrued daily and paid monthly at the following annual rates: (i) Class A — up to 0.25% of the average daily net assets of Class A shares; (ii) Class B — up to 1.00% of the average daily net assets of Class B shares; and (iii) Class C — up to 1.00% of the average daily net assets of Class C shares.
In the case of Class B shares, provided that the Plan continues in effect, any cumulative expenses incurred by the Distributor but not yet recovered may be recovered through the payment of future distribution fees from the Fund pursuant to the Plan and contingent deferred sales charges paid by investors upon redemption of Class B shares. Although there is no legal obligation for the Fund to pay expenses incurred in excess of payments made to the Distributor under the Plan and the proceeds of contingent deferred sales charges paid by investors upon redemption of shares, if for any reason the Plan is terminated, the Trustees will consider at that time the manner in which to treat such expenses. The Distributor has advised the Fund that such excess amounts totaled $11,850,182 at July 31, 2011.
In the case of Class A shares and Class C shares, expenses incurred pursuant to the Plan in any calendar year in excess of 0.25% or 1.00% of the average daily net assets of Class A shares or Class C shares, respectively, will not be reimbursed by the Fund through payments in any subsequent year, except that expenses representing a gross sales credit to Morgan Stanley Smith Barney Financial Advisors and other authorized financial representatives at the time of sale may be reimbursed in the subsequent calendar year. For the year ended July 31, 2011, the distribution fee was accrued for Class A shares and Class C shares at the annual rate of 0.25% and 1.00%, respectively.
The Distributor has informed the Fund that for the year ended July 31, 2011, it received contingent deferred sales charges from certain redemptions of the Fund's Class A shares, Class B shares and Class C shares of $1,092, $25,621 and $4,271, respectively, and received $132,076 in front-end sales charges from sales of the Fund's Class A shares. The respective shareholders pay such charges, which are not an expense of the Fund.
6. Security Transactions and Transactions with Affiliates
The cost of purchases and proceeds from sales/maturities/prepayments of investment securities, excluding short-term investments, for the year ended July 31, 2011 aggregated $619,871,158 and $621,609,056, respectively. Included in the aforementioned are purchases and sales/maturities/prepayments of U.S. Government securities of $147,853,100 and $153,710,295, respectively.
75
Morgan Stanley Global Strategist Fund
Notes to Financial Statements n July 31, 2011 continued
The Fund invests in Morgan Stanley Institutional Fund, Inc. – Emerging Markets Portfolio, an open-end management investment company managed by the Adviser. Investment Advisory fees paid by the Fund are reduced by an amount equal to its pro-rata share of the advisory and administration fees paid by the Morgan Stanley Institutional Fund, Inc. – Emerging Markets Portfolio. For the year ended July 31, 2011, advisory fees paid were reduced by $2,376 relating to the Fund's investment in the Morgan Stanley Institutional Fund, Inc. – Emerging Markets Portfolio.
A summary of the Fund's transactions in shares of the Morgan Stanley Institutional Fund, Inc. – Emerging Markets Portfolio during the year ended July 31, 2011 is as follows:
| VALUE JULY 31, 2010 | PURCHASES AT COST | SALES PROCEEDS | REALIZED LOSS | INCOME | VALUE JULY 31, 2011 | ||||||||||||||||||
| $ | — | $ | 1,300,000 | $ | 1,211,752 | $ | (88,248 | ) | $ | — | $ | — | |||||||||||
The Fund invests in the Institutional Class of the Morgan Stanley Institutional Liquidity Funds Money Market Portfolio (the "Liquidity Funds"), an open-end management investment company managed by the Adviser. Investment advisory fees paid by the Fund are reduced by an amount equal to its pro-rata share of the advisory and administration fees paid by the Fund due to its investment in the Liquidity Funds. For the year ended July 31, 2011, advisory fees paid were reduced by $103,873 relating to the Fund's investment in the Liquidity Funds.
A summary of the Fund's transactions in shares of the Liquidity Funds during the year ended July 31, 2011 is as follows:
| VALUE JULY 31, 2010 | PURCHASES AT COST | SALES PROCEEDS | DIVIDEND INCOME | VALUE JULY 31, 2011 | |||||||||||||||
| $ | 115,269,385 | $ | 242,548,680 | $ | 317,059,964 | $ | 174,294 | $ | 40,758,101 | ||||||||||
The Fund had the following transactions with Citigroup, Inc., and its affiliated broker/dealers which may be deemed to be affiliates of the Adviser, Administrator and Distributor under Section 17 of the Act, for the year ended July 31, 2011:
| PURCHASES | SALES | REALIZED GAIN | DIVIDEND/ INTEREST INCOME | VALUE | |||||||||||||||
| $ | 1,588,668 | $ | 2,187,491 | $ | 116,881 | $ | 108,956 | $ | 2,451,201 | ||||||||||
For the year ended July 31, 2011, the Fund incurred brokerage commissions of $545 with Citigroup, Inc., and its affiliated broker/dealers, which may be deemed affiliates of the Adviser, Administrator and Distributor under Section 17 of the Act, for portfolio transactions executed on behalf of the Fund.
76
Morgan Stanley Global Strategist Fund
Notes to Financial Statements n July 31, 2011 continued
Morgan Stanley Services Company Inc., an affiliate of the Adviser and Distributor, is the Fund's transfer agent.
The Fund has an unfunded noncontributory defined benefit pension plan covering certain independent Trustees of the Fund who will have served as independent Trustees for at least five years at the time of retirement. Benefits under this plan are based on factors which include years of service and compensation. The Trustees voted to close the plan to new participants and eliminate the future benefits growth due to increases to compensation after July 31, 2003. At July 31, 2011, the Fund had an accrued pension liability of $67,531, which is included in "accrued expenses and other payables" in the Statement of Assets and Liabilities.
The Fund has an unfunded Deferred Compensation Plan (the "Compensation Plan"), which allows each independent Trustee to defer payment of all, or a portion, of the fees he or she receives for serving on the Board of Trustees. Each eligible Trustee generally may elect to have the deferred amounts credited with a return equal to the total return on one or more of the Morgan Stanley funds that are offered as investment options under the Compensation Plan. Appreciation/depreciation and distributions received from these investments are recorded with an offsetting increase/decrease in the deferred compensation obligation and do not affect the net asset value of the Fund.
7. Purposes of and Risks Relating to Certain Financial Instruments
The Fund may invest in mortgage securities, including securities issued by Federal National Mortgage Association ("FNMA") and Federal Home Loan Mortgage Corporation ("FHLMC"). These are fixed income securities that derive their value from or represent interests in a pool of mortgages or mortgage securities. An unexpectedly high rate of defaults on the mortgages held by a mortgage pool may adversely affect the value of a mortgage backed security and could result in losses to the Fund. The risk of such defaults is generally higher in the case of mortgage pools that include subprime mortgages. Subprime mortgages refer to loans made to borrowers with weakened credit histories or with a lower capacity to make timely payments on their mortgages. The securities held by the Fund are not backed by subprime mortgages.
Additionally, securities issued by FNMA and FHLMC are not backed by or entitled to the full faith and credit of the United States; rather, they are supported by the right of the issuer to borrow from the U.S. Department of the Treasury.
The Federal Housing Finance Agency ("FHFA") serves as conservator of FNMA and FHLMC and the U.S. Department of the Treasury has agreed to provide capital as needed to ensure FNMA and FHLMC continue to provide liquidity to the housing and mortgage markets.
77
Morgan Stanley Global Strategist Fund
Notes to Financial Statements n July 31, 2011 continued
The Fund may invest in structured investments, which involve risks including counterparty risk and market risk. Holders of structured investments bear risks of the underlying investment and are subject to counterparty risk because the Fund is relying on the creditworthiness of such counterparty and has no rights with respect to the issuer of the underlying investment. Certain structured investments may be thinly traded or have a limited trading market and may have the effect of increasing the Fund's illiquidity to the extent that the Fund, at a particular point in time, may be unable to find qualified buyers for these securities.
8. Shares of Beneficial Interest
Transactions in shares of beneficial interest were as follows:
| FOR THE YEAR ENDED JULY 31, 2011 | FOR THE YEAR ENDED JULY 31, 2010 | ||||||||||||||||||
| SHARES | AMOUNT | SHARES | AMOUNT | ||||||||||||||||
| CLASS A SHARES | |||||||||||||||||||
| Sold | 1,186,337 | $ | 20,370,023 | 2,666,468 | $ | 45,553,257 | |||||||||||||
| Conversion from Class B | 1,064,787 | 17,997,024 | 213,970 | 3,668,628 | |||||||||||||||
| Reinvestment of dividends and distributions | 4,315,526 | 68,314,776 | 433,251 | 7,428,957 | |||||||||||||||
| Redeemed | (5,728,042 | ) | (97,173,000 | ) | (4,994,013 | ) | (85,274,484 | ) | |||||||||||
| Net increase (decrease) — Class A | 838,608 | 9,508,823 | (1,680,324 | ) | (28,623,642 | ) | |||||||||||||
| CLASS B SHARES | |||||||||||||||||||
| Sold | 170,638 | 2,924,036 | 348,022 | 5,974,962 | |||||||||||||||
| Conversion to Class A | (1,059,825 | ) | (17,997,024 | ) | (212,961 | ) | (3,668,628 | ) | |||||||||||
| Reinvestment of dividends and distributions | 439,740 | 7,013,859 | 33,064 | 570,595 | |||||||||||||||
| Redeemed | (804,055 | ) | (13,970,971 | ) | (2,389,608 | ) | (41,014,879 | ) | |||||||||||
| Net decrease — Class B | (1,253,502 | ) | (22,030,100 | ) | (2,221,483 | ) | (38,137,950 | ) | |||||||||||
| CLASS C SHARES | |||||||||||||||||||
| Sold | 272,489 | 4,663,812 | 360,587 | 6,110,412 | |||||||||||||||
| Reinvestment of dividends and distributions | 395,595 | 6,234,588 | 21,119 | 361,046 | |||||||||||||||
| Redeemed | (448,643 | ) | (7,564,471 | ) | (467,106 | ) | (7,919,714 | ) | |||||||||||
| Net increase (decrease) — Class C | 219,441 | 3,333,929 | (85,400 | ) | (1,448,256 | ) | |||||||||||||
| CLASS I SHARES | |||||||||||||||||||
| Sold | 508,455 | 8,796,516 | 99,690 | 1,697,831 | |||||||||||||||
| Reinvestment of dividends and distributions | 273,430 | 4,336,592 | 29,110 | 499,590 | |||||||||||||||
| Redeemed | (675,080 | ) | (11,046,865 | ) | (272,343 | ) | (4,649,916 | ) | |||||||||||
| Net increase (decrease) — Class I | 106,805 | 2,086,243 | (143,543 | ) | (2,452,495 | ) | |||||||||||||
| Net decrease in Fund | (88,648 | ) | $ | (7,101,105 | ) | (4,130,750 | ) | $ | (70,662,343 | ) | |||||||||
78
Morgan Stanley Global Strategist Fund
Notes to Financial Statements n July 31, 2011 continued
9. Federal Income Tax Status
The amount of dividends and distributions from net investment income and net realized capital gains are determined in accordance with federal income tax regulations which may differ from GAAP. These "book/tax" differences are either considered temporary or permanent in nature. To the extent these differences are permanent in nature, such amounts are reclassified within the capital accounts based on their federal tax-basis treatment; temporary differences do not require reclassification. Dividends and distributions which exceed net investment income and net realized capital gains for tax purposes are reported as distributions of paid-in-capital.
The tax character of distributions paid was as follows:
| FOR THE YEAR ENDED JULY 31, 2011 | FOR THE YEAR ENDED JULY 31, 2010 | ||||||||||
| Ordinary income | $ | 9,018,539 | $ | 9,061,044 | |||||||
| Long-term capital gains | 79,890,968 | — | |||||||||
| Total distributions | $ | 88,909,507 | $ | 9,061,044 | |||||||
As of July 31, 2011, the tax-basis components of accumulated earnings were as follows:
| Undistributed ordinary income | $ | 26,409,119 | |||||||||
| Undistributed long-term gains | 9,472,663 | ||||||||||
| Net accumulated earnings | 35,881,782 | ||||||||||
| Temporary differences | (75,267 | ) | |||||||||
| Net unrealized appreciation | 35,542,517 | ||||||||||
| Total accumulated earnings | $ | 71,349,032 | |||||||||
As of July 31, 2011, the Fund had temporary book/tax differences primarily attributable to mark-to-market of open futures and forward foreign currency exchange contracts and passive foreign investment companies ("PFICs"), capital loss deferrals on straddles and wash sales and book amortization of premiums on debt securities.
Permanent differences, primarily due to foreign currency gains, losses on paydowns and swaps and tax adjustments on debt securities and PFICs sold by the Fund, resulted in the following reclassifications among the Fund's components of net assets at July 31, 2011:
| ACCUMULATED UNDISTRIBUTED NET INVESTMENT INCOME | ACCUMULATED UNDISTRIBUTED NET REALIZED GAIN | PAID-IN-CAPITAL | |||||||||
| $ | 8,897,055 | ($ | 8,897,055 | ) | $ | — | |||||
79
Morgan Stanley Global Strategist Fund
Notes to Financial Statements n July 31, 2011 continued
10. Expense Offset
The Fund has entered into an arrangement with State Street ("Custodian"), whereby credits realized on uninvested cash balances were used to offset a portion of the Fund's expenses. If applicable, these custodian credits are shown as "expense offset" in the Statement of Operations.
11. Accounting Pronouncement
In May 2011, FASB issued Accounting Standards Update ("ASU") 2011-04. The amendments in this update are the results of the work of FASB and the International Accounting Standards Board to develop common requirements for measuring fair value and for disclosing information about fair value measurements, which are effective during interim and annual periods beginning after December 15, 2011. Consequently, these amendments improve the comparability of fair value measurements presented and disclosed in the financial statements prepared in accordance with U.S. GAAP and International Financial Reporting Standards. At this time, the Fund's management is evaluating the implications of ASU 2011-04.
80
Morgan Stanley Global Strategist Fund
Financial Highlights
Selected ratios and per share data for a share of beneficial interest outstanding throughout each period:
| FOR THE YEAR ENDED JULY 31, | |||||||||||||||||||||||
| 2011 | 2010^ | 2009^ | 2008^ | 2007^ | |||||||||||||||||||
| Class A Shares | |||||||||||||||||||||||
| Selected Per Share Data: | |||||||||||||||||||||||
| Net asset value, beginning of period | $ | 17.33 | $ | 16.23 | $ | 18.07 | $ | 20.57 | $ | 19.74 | |||||||||||||
| Income (loss) from investment operations: | |||||||||||||||||||||||
| Net investment income(1) | 0.25 | 0.21 | 0.25 | 0.45 | 0.50 | ||||||||||||||||||
| Net realized and unrealized gain (loss) | 1.87 | 1.17 | (1.74 | ) | (1.23 | ) | 2.07 | ||||||||||||||||
| Total income (loss) from investment operations | 2.12 | 1.38 | (1.49 | ) | (0.78 | ) | 2.57 | ||||||||||||||||
| Less dividends and distributions from: | |||||||||||||||||||||||
| Net investment income | (0.12 | ) | (0.28 | ) | (0.30 | ) | (0.49 | ) | (0.51 | ) | |||||||||||||
| Net realized gain | (2.62 | ) | — | (0.05 | ) | (1.23 | ) | (1.23 | ) | ||||||||||||||
| Total dividends and distributions | (2.74 | ) | (0.28 | ) | (0.35 | ) | (1.72 | ) | (1.74 | ) | |||||||||||||
| Net asset value, end of period | $ | 16.71 | $ | 17.33 | $ | 16.23 | $ | 18.07 | $ | 20.57 | |||||||||||||
| Total Return(2) | 13.13 | % | 8.52 | % | (8.06 | )% | (4.27 | )% | 13.30 | % | |||||||||||||
| Ratios to Average Net Assets(3): | |||||||||||||||||||||||
| Total expenses | 0.96 | %(4) | 0.91 | %(4) | 0.95 | %(4) | 0.90 | %(4) | 0.92 | %(4) | |||||||||||||
| Net investment income | 1.47 | %(4) | 1.24 | %(4) | 1.64 | %(4) | 2.30 | %(4) | 2.44 | %(4) | |||||||||||||
| Rebate from Morgan Stanley affiliate | 0.02 | % | 0.03 | % | 0.02 | % | 0.02 | % | 0.00 | %(5) | |||||||||||||
| Supplemental Data: | |||||||||||||||||||||||
| Net assets, end of period, in thousands | $ | 457,333 | $ | 459,742 | $ | 457,914 | $ | 504,350 | $ | 553,395 | |||||||||||||
| Portfolio turnover rate | 123 | % | 173 | % | 83 | % | 42 | % | 42 | % | |||||||||||||
^ Beginning with the year ended July 31, 2011, the Fund was audited by Ernst & Young LLP. The previous years were audited by another independent registered public accounting firm.
(1) The per share amounts were computed using an average number of shares outstanding during the period.
(2) Does not reflect the deduction of sales charge. Calculated based on the net asset value as of the last business day of the period.
(3) Reflects overall Fund ratios for investment income and non-class specific expenses.
(4) The ratios reflect the rebate of certain Fund expenses in connection with investments in a Morgan Stanley affiliate during the period. The effect of the rebate on the ratios is disclosed in the above table as "Rebate from Morgan Stanley affiliate."
(5) Amount is less than 0.005%.
See Notes to Financial Statements
81
Morgan Stanley Global Strategist Fund
Financial Highlights continued
| FOR THE YEAR ENDED JULY 31, | |||||||||||||||||||||||
| 2011 | 2010^ | 2009^ | 2008^ | 2007^ | |||||||||||||||||||
| Class B Shares | |||||||||||||||||||||||
| Selected Per Share Data: | |||||||||||||||||||||||
| Net asset value, beginning of period | $ | 17.42 | $ | 16.30 | $ | 18.14 | $ | 20.63 | $ | 19.79 | |||||||||||||
| Income (loss) from investment operations: | |||||||||||||||||||||||
| Net investment income(1) | 0.12 | 0.08 | 0.14 | 0.30 | 0.35 | ||||||||||||||||||
| Net realized and unrealized gain (loss) | 1.88 | 1.18 | (1.75 | ) | (1.23 | ) | 2.07 | ||||||||||||||||
| Total income (loss) from investment operations | 2.00 | 1.26 | (1.61 | ) | (0.93 | ) | 2.42 | ||||||||||||||||
| Less dividends and distributions from: | |||||||||||||||||||||||
| Net investment income | (0.04 | ) | (0.14 | ) | (0.18 | ) | (0.33 | ) | (0.35 | ) | |||||||||||||
| Net realized gain | (2.62 | ) | — | (0.05 | ) | (1.23 | ) | (1.23 | ) | ||||||||||||||
| Total dividends and distributions | (2.66 | ) | (0.14 | ) | (0.23 | ) | (1.56 | ) | (1.58 | ) | |||||||||||||
| Net asset value, end of period | $ | 16.76 | $ | 17.42 | $ | 16.30 | $ | 18.14 | $ | 20.63 | |||||||||||||
| Total Return(2) | 12.28 | % | 7.74 | % | (8.77 | )% | (5.02 | )% | 12.50 | % | |||||||||||||
| Ratios to Average Net Assets(3): | |||||||||||||||||||||||
| Total expenses | 1.71 | %(4) | 1.66 | %(4) | 1.70 | %(4) | 1.66 | %(4) | 1.67 | %(4) | |||||||||||||
| Net investment income | 0.72 | %(4) | 0.49 | %(4) | 0.89 | %(4) | 1.54 | %(4) | 1.69 | %(4) | |||||||||||||
| Rebate from Morgan Stanley affiliate | 0.02 | % | 0.03 | % | 0.02 | % | 0.02 | % | 0.00 | %(5) | |||||||||||||
| Supplemental Data: | |||||||||||||||||||||||
| Net assets, end of period, in thousands | $ | 34,374 | $ | 57,559 | $ | 90,105 | $ | 175,410 | $ | 276,329 | |||||||||||||
| Portfolio turnover rate | 123 | % | 173 | % | 83 | % | 42 | % | 42 | % | |||||||||||||
^ Beginning with the year ended July 31, 2011, the Fund was audited by Ernst & Young LLP. The previous years were audited by another independent registered public accounting firm.
(1) The per share amounts were computed using an average number of shares outstanding during the period.
(2) Does not reflect the deduction of sales charge. Calculated based on the net asset value as of the last business day of the period.
(3) Reflects overall Fund ratios for investment income and non-class specific expenses.
(4) The ratios reflect the rebate of certain Fund expenses in connection with investments in a Morgan Stanley affiliate during the period. The effect of the rebate on the ratios is disclosed in the above table as "Rebate from Morgan Stanley affiliate."
(5) Amount is less than 0.005%.
See Notes to Financial Statements
82
Morgan Stanley Global Strategist Fund
Financial Highlights continued
| FOR THE YEAR ENDED JULY 31, | |||||||||||||||||||||||
| 2011 | 2010^ | 2009^ | 2008^ | 2007^ | |||||||||||||||||||
| Class C Shares | |||||||||||||||||||||||
| Selected Per Share Data: | |||||||||||||||||||||||
| Net asset value, beginning of period | $ | 17.24 | $ | 16.15 | $ | 17.99 | $ | 20.48 | $ | 19.66 | |||||||||||||
| Income (loss) from investment operations: | |||||||||||||||||||||||
| Net investment income(1) | 0.12 | 0.08 | 0.14 | 0.30 | 0.35 | ||||||||||||||||||
| Net realized and unrealized gain (loss) | 1.86 | 1.16 | (1.74 | ) | (1.22 | ) | 2.06 | ||||||||||||||||
| Total income (loss) from investment operations | 1.98 | 1.24 | (1.60 | ) | (0.92 | ) | 2.41 | ||||||||||||||||
| Less dividends and distributions from: | |||||||||||||||||||||||
| Net investment income | (0.05 | ) | (0.15 | ) | (0.19 | ) | (0.34 | ) | (0.36 | ) | |||||||||||||
| Net realized gain | (2.62 | ) | — | (0.05 | ) | (1.23 | ) | (1.23 | ) | ||||||||||||||
| Total dividends and distributions | (2.67 | ) | (0.15 | ) | (0.24 | ) | (1.57 | ) | (1.59 | ) | |||||||||||||
| Net asset value, end of period | $ | 16.55 | $ | 17.24 | $ | 16.15 | $ | 17.99 | $ | 20.48 | |||||||||||||
| Total Return(2) | 12.23 | % | 7.76 | % | (8.78 | )% | (4.94 | )% | 12.47 | % | |||||||||||||
| Ratios to Average Net Assets(3): | |||||||||||||||||||||||
| Total expenses | 1.71 | %(4) | 1.66 | %(4) | 1.70 | %(4) | 1.64 | %(4)(5) | 1.64 | %(4) | |||||||||||||
| Net investment income | 0.72 | %(4) | 0.49 | %(4) | 0.89 | %(4) | 1.56 | %(4)(5) | 1.72 | %(4) | |||||||||||||
| Rebate from Morgan Stanley affiliate | 0.02 | % | 0.03 | % | 0.02 | % | 0.02 | % | 0.00 | %(6) | |||||||||||||
| Supplemental Data: | |||||||||||||||||||||||
| Net assets, end of period, in thousands | $ | 43,411 | $ | 41,439 | $ | 40,203 | $ | 44,664 | $ | 48,192 | |||||||||||||
| Portfolio turnover rate | 123 | % | 173 | % | 83 | % | 42 | % | 42 | % | |||||||||||||
^ Beginning with the year ended July 31, 2011, the Fund was audited by Ernst & Young LLP. The previous years were audited by another independent registered public accounting firm.
(1) The per share amounts were computed using an average number of shares outstanding during the period.
(2) Does not reflect the deduction of sales charge. Calculated based on the net asset value as of the last business day of the period.
(3) Reflects overall Fund ratios for investment income and non-class specific expenses.
(4) The ratios reflect the rebate of certain Fund expenses in connection with investments in a Morgan Stanley affiliate during the period. The effect of the rebate on the ratios is disclosed in the above table as "Rebate from Morgan Stanley affiliate."
(5) If the Fund had borne all its expenses that were reimbursed or waived by the Investment Adviser and Administrator, the annualized expense and net investment income ratios would have been 1.65% and 1.55%, respectively.
(6) Amount is less than 0.005%.
See Notes to Financial Statements
83
Morgan Stanley Global Strategist Fund
Financial Highlights continued
| FOR THE YEAR ENDED JULY 31, | |||||||||||||||||||||||
| 2011 | 2010^ | 2009^ | 2008^ | 2007^ | |||||||||||||||||||
| Class I Shares | |||||||||||||||||||||||
| Selected Per Share Data: | |||||||||||||||||||||||
| Net asset value, beginning of period | $ | 17.35 | $ | 16.25 | $ | 18.10 | $ | 20.59 | $ | 19.76 | |||||||||||||
| Income (loss) from investment operations: | |||||||||||||||||||||||
| Net investment income(1) | 0.30 | 0.25 | 0.29 | 0.51 | 0.55 | ||||||||||||||||||
| Net realized and unrealized gain (loss) | 1.87 | 1.17 | (1.75 | ) | (1.23 | ) | 2.07 | ||||||||||||||||
| Total income (loss) from investment operations | 2.17 | 1.42 | (1.46 | ) | (0.72 | ) | 2.62 | ||||||||||||||||
| Less dividends and distributions from: | |||||||||||||||||||||||
| Net investment income | (0.14 | ) | (0.32 | ) | (0.34 | ) | (0.54 | ) | (0.56 | ) | |||||||||||||
| Net realized gain | (2.62 | ) | — | (0.05 | ) | (1.23 | ) | (1.23 | ) | ||||||||||||||
| Total dividends and distributions | (2.76 | ) | (0.32 | ) | (0.39 | ) | (1.77 | ) | (1.79 | ) | |||||||||||||
| Net asset value, end of period | $ | 16.76 | $ | 17.35 | $ | 16.25 | $ | 18.10 | $ | 20.59 | |||||||||||||
| Total Return(2) | 13.38 | % | 8.84 | % | (7.86 | )% | (4.02 | )% | 13.62 | % | |||||||||||||
| Ratios to Average Net Assets(3): | |||||||||||||||||||||||
| Total expenses | 0.71 | %(4) | 0.66 | %(4) | 0.70 | %(4) | 0.66 | %(4) | 0.67 | %(4) | |||||||||||||
| Net investment income | 1.72 | %(4) | 1.49 | %(4) | 1.89 | %(4) | 2.54 | %(4) | 2.69 | %(4) | |||||||||||||
| Rebate from Morgan Stanley affiliate | 0.02 | % | 0.03 | % | 0.02 | % | 0.02 | % | 0.00 | %(5) | |||||||||||||
| Supplemental Data: | |||||||||||||||||||||||
| Net assets, end of period, in thousands | $ | 27,116 | $ | 26,228 | $ | 26,901 | $ | 27,823 | $ | 66,753 | |||||||||||||
| Portfolio turnover rate | 123 | % | 173 | % | 83 | % | 42 | % | 42 | % | |||||||||||||
^ Beginning with the year ended July 31, 2011, the Fund was audited by Ernst & Young LLP. The previous years were audited by another independent registered public accounting firm.
(1) The per share amounts were computed using an average number of shares outstanding during the period.
(2) Calculated based on the net asset value as of the last business day of the period.
(3) Reflects overall Fund ratios for investment income and non-class specific expenses.
(4) The ratios reflect the rebate of certain Fund expenses in connection with investments in a Morgan Stanley affiliate during the period. The effect of the rebate on the ratios is disclosed in the above table as "Rebate from Morgan Stanley affiliate."
(5) Amount is less than 0.005%.
See Notes to Financial Statements
84
Morgan Stanley Global Strategist Fund
Report of Independent Registered Public Accounting Firm
To the Shareholders and Board of Trustees of
Morgan Stanley Global Strategist Fund:
We have audited the accompanying statement of assets and liabilities of Morgan Stanley Global Strategist Fund (the "Fund"), including the portfolio of investments, as of July 31, 2011, and the related statements of operations and changes in net assets and the financial highlights for the year then ended. These financial statements and financial highlights are the responsibility of the Fund's management. Our responsibility is to express an opinion on these financial statements and financial highlights based on our audit. The statement of changes in net assets for the year ended July 31, 2010 and the financial highlights four years ended July 31, 2010 were audited by another independent registered public accounting firm whose report, dated September 29, 2010, expressed an unqualified opinion on that statement of changes in net assets and those financial highlights.
We conducted our audit in accordance with the standards of the Public Company Accounting Oversight Board (United States). Those standards require that we plan and perform the audit to obtain reasonable assurance about whether the financial statements and financial highlights are free of material misstatement. The Fund was not required to have, nor were we engaged to perform, an audit of its internal control over financial reporting. Our audit included consideration of internal control over financial reporting as a basis for designing audit procedures that are appropriate in the circumstances, but not for the purpose of expressing an opinion on the effectiveness of the Fund's internal control over financial reporting. Accordingly, we express no such opinion. An audit also includes examining, on a test basis, evidence supporting the amounts and disclosures in the financial statements, assessing the accounting principles used and significant estimates made by management, as well as evaluating the overall financial statement presentation. Our procedures included confirmation of securities owned as of July 31, 2011, by correspondence with the custodian and brokers or by other appropriate auditing procedures where replies from brokers were not received. We believe that our audit provides a reasonable basis for our opinion.
In our opinion, the financial statements and financial highlights referred to above present fairly, in all material respects, the financial position of Morgan Stanley Global Strategist Fund as of July 31, 2011, the results of its operations and changes in net assets and the financial highlights for the year then ended, in conformity with U.S. generally accepted accounting principles.

Boston, Massachusetts
September 22, 2011
85
Morgan Stanley Global Strategist Fund
Change in Independent Registered Public Accounting Firm (unaudited)
On June 7, 2011, Deloitte & Touche LLP were dismissed as Independent Registered Public Accounting Firm of the Fund.
The reports of Deloitte & Touche LLP on the financial statements of the Fund for the past two fiscal years contained no adverse opinion or disclaimer of opinion and were not qualified or modified as to uncertainty, audit scope or accounting principle.
In connection with its audits for the two most recent fiscal years, there have been no disagreements with Deloitte & Touche LLP on any matter of accounting principles or practices, financial statement disclosure, or auditing scope or procedure, which disagreements, if not resolved to the satisfaction of Deloitte & Touche LLP, would have caused them to make reference thereto in their reports on the financial statements for such years.
On June 7, 2011, the Fund, with the approval of its Board of Trustees and its Audit Committee, engaged Ernst & Young LLP as its new Independent Registered Public Accounting Firm.
86
Morgan Stanley Global Strategist Fund
An Important Notice Concerning Our U.S. Privacy Policy (unaudited)
We are required by federal law to provide you with a copy of our privacy policy ("Policy") annually.
This Policy applies to current and former individual clients of Morgan Stanley Distribution, Inc., as well as current and former individual investors in Morgan Stanley mutual funds and related companies.
This Policy is not applicable to partnerships, corporations, trusts or other non-individual clients or account holders, nor is this Policy applicable to individuals who are either beneficiaries of a trust for which we serve as trustee or participants in an employee benefit plan administered or advised by us. This Policy is, however, applicable to individuals who select us to be a custodian of securities or assets in individual retirement accounts, 401(k) accounts, 529 Educational Savings Accounts, accounts subject to the Uniform Gifts to Minors Act, or similar accounts. We may amend this Policy at any time, and will inform you of any changes to this Policy as required by law.
We Respect Your Privacy
We appreciate that you have provided us with your personal financial information and understand your concerns about safeguarding such information. We strive to maintain the privacy of such information while we help you achieve your financial objectives. This Policy describes what nonpublic personal information we collect about you, how we collect it, when we may share it with others, and how others may use it. It discusses the steps you may take to limit our sharing of information about you with affiliated Morgan Stanley companies ("affiliated companies"). It also discloses how you may limit our affiliates' use of shared information for marketing purposes. Throughout this Policy, we refer to the nonpublic information that personally identifies you or your accounts as "personal information."
1. What Personal Information Do We Collect About You?
To better serve you and manage our business, it is important that we collect and maintain accurate information about you. We obtain this information from applications and other forms you submit to us, from your dealings with us, from consumer reporting agencies, from our websites and from third parties and other sources.
For example:
• We collect information such as your name, address, e-mail address, telephone/fax numbers, assets, income and investment objectives through application forms you submit to us.
• We may obtain information about account balances, your use of account(s) and the types of products and services you prefer to receive from us through your dealings and transactions with us and other sources.
• We may obtain information about your creditworthiness and credit history from consumer reporting agencies.
87
Morgan Stanley Global Strategist Fund
An Important Notice Concerning Our U.S. Privacy Policy (unaudited) continued
• We may collect background information from and through third-party vendors to verify representations you have made and to comply with various regulatory requirements.
• If you interact with us through our public and private Web sites, we may collect information that you provide directly through online communications (such as an e-mail address). We may also collect information about your Internet service provider, your domain name, your computer's operating system and Web browser, your use of our Web sites and your product and service preferences, through the use of "cookies." "Cookies" recognize your computer each time you return to one of our sites, and help to improve our sites' content and personalize your experience on our sites by, for example, suggesting offerings that may interest you. Please consult the Terms of Use of these sites for more details on our use of cookies.
2. When Do We Disclose Personal Information We Collect About You?
To provide you with the products and services you request, to better serve you, to manage our business and as otherwise required or permitted by law, we may disclose personal information we collect about you to other affiliated companies and to nonaffiliated third parties.
a. Information We Disclose to Our Affiliated Companies. In order to manage your account(s) effectively, including servicing and processing your transactions, to let you know about products and services offered by us and affiliated companies, to manage our business, and as otherwise required or permitted by law, we may disclose personal information about you to other affiliated companies. Offers for products and services from affiliated companies are developed under conditions designed to safeguard your personal information.
b. Information We Disclose to Third Parties. We do not disclose personal information that we collect about you to nonaffiliated third parties except to enable them to provide marketing services on our behalf, to perform joint marketing agreements with other financial institutions, and as otherwise required or permitted by law. For example, some instances where we may disclose information about you to third parties include: for servicing and processing transactions, to offer our own products and services, to protect against fraud, for institutional risk control, to respond to judicial process or to perform services on our behalf. When we share personal information with a nonaffiliated third party, they are required to limit their use of personal information about you to the particular purpose for which it was shared and they are not allowed to share personal information about you with others except to fulfill that limited purpose or as may be required by law.
88
Morgan Stanley Global Strategist Fund
An Important Notice Concerning Our U.S. Privacy Policy (unaudited) continued
3. How Do We Protect The Security and Confidentiality of Personal Information We Collect About You?
We maintain physical, electronic and procedural security measures to help safeguard the personal information we collect about you. We have internal policies governing the proper handling of client information. Third parties that provide support or marketing services on our behalf may also receive personal information about you, and we require them to adhere to confidentiality standards with respect to such information.
4. How Can You Limit Our Sharing of Certain Personal Information About You With Our Affiliated Companies For Eligibility Determination?
We respect your privacy and offer you choices as to whether we share with our affiliated companies personal information that was collected to determine your eligibility for products and services such as credit reports and other information that you have provided to us or that we may obtain from third parties ("eligibility information"). Please note that, even if you direct us not to share certain eligibility information with our affiliated companies, we may still share your personal information, including eligibility information, with those companies under circumstances that are permitted under applicable law, such as to process transactions or to service your account. We may also share certain other types of personal information with affiliated companies — such as your name, address, telephone number, e-mail address and account number(s), and information about your transactions and experiences with us.
5. How Can You Limit the Use of Certain Personal Information About You by our Affiliated Companies for Marketing?
You may limit our affiliated companies from using certain personal information about you that we may share with them for marketing their products or services to you. This information includes our transactions and other experiences with you such as your assets and account history. Please note that, even if you choose to limit our affiliated companies from using certain personal information about you that we may share with them for marketing their products and services to you, we may still share such personal information about you with them, including our transactions and experiences with you, for other purposes as permitted under applicable law.
89
Morgan Stanley Global Strategist Fund
An Important Notice Concerning Our U.S. Privacy Policy (unaudited) continued
6. How Can You Send Us an Opt-Out Instruction?
If you wish to limit our sharing of certain personal information about you with our affiliated companies for "eligibility purposes" and for our affiliated companies' use in marketing products and services to you as described in this notice, you may do so by:
• Calling us at (800) 869-6397
Monday–Friday between 8a.m. and 6p.m. (EST)
• Writing to us at the following address:
Morgan Stanley Privacy Department
Harborside Financial Center
201 Plaza Two, 3rd Floor
Jersey City, NJ 07311
If you choose to write to us, your written request should include: your name, address, telephone number and account number(s) to which the opt-out applies and should not be sent with any other correspondence. In order to process your request, we require that the request be provided by you directly and not through a third party. Once you have informed us about your privacy preferences, your opt-out preference will remain in effect with respect to this Policy (as it may be amended) until you notify us otherwise. If you are a joint account owner, we will accept instructions from any one of you and apply those instructions to the entire account. Please allow approximately 30 days from our receipt of your opt-out for your instructions to become effective.
Please understand that if you opt-out, you and any joint account holders may not receive certain Morgan Stanley or our affiliated companies' products and services that could help you manage your financial resources and achieve your investment objectives.
If you have more than one account with us or our affiliates, you may receive multiple privacy policies from us, and would need to follow the directions stated in each particular policy for each account you have with us.
7. What if an affiliated company becomes a nonaffiliated third party?
If, at any time in the future, an affiliated company becomes a nonaffiliated third party, further disclosures of personal information made to the former affiliated company will be limited to those described in Section 2(b) above relating to nonaffiliated third parties. If you elected under Section 6 to limit disclosures we make to affiliated companies, or use of personal information by affiliated companies, your election will not apply to use by any former affiliated company of your personal information in their possession once it becomes a nonaffiliated third party.
90
Morgan Stanley Global Strategist Fund
An Important Notice Concerning Our U.S. Privacy Policy (unaudited) continued
Special Notice to Residents of Vermont
This section supplements our Policy with respect to our individual clients who have a Vermont address and supersedes anything to the contrary in the above Policy with respect to those clients only.
The State of Vermont requires financial institutions to obtain your consent prior to sharing personal information that they collect about you with affiliated companies and nonaffiliated third parties other than in certain limited circumstances. Except as permitted by law, we will not share personal information we collect about you with nonaffiliated third parties or other affiliated companies unless you provide us with your written consent to share such information ("opt-in").
If you wish to receive offers for investment products and services offered by or through other affiliated companies, please notify us in writing at the following address:
Morgan Stanley Privacy Department
Harborside Financial Center
201 Plaza Two, 3rd Floor
Jersey City, NJ 07311
Your authorization should include: your name, address, telephone number and account number(s) to which the opt-in applies and should not be sent with any other correspondence. In order to process your authorization, we require that the authorization be provided by you directly and not through a third-party.
Special Notice to Residents of California
The following section supplements our Policy with respect to our individual clients who have a California address and supersedes anything to the contrary in the above Policy with respect to those clients only.
In response to a California law, if your account has a California home address, your personal information will not be disclosed to nonaffiliated third parties except as permitted by applicable California law, and we will limit sharing such personal information with our affiliates to comply with California privacy laws that apply to us.
91
Morgan Stanley Global Strategist Fund
Trustee and Officer Information (unaudited)
Independent Trustees:
| Name, Age and Address of Independent Trustee | Position(s) Held with Registrant | Term of Office and Length of Time Served* | Principal Occupation(s) During Past 5 Years | Number of Portfolios in Fund Complex Overseen by Independent Trustee** | Other Directorships Held by Independent Trustee*** | ||||||||||||||||||
| Frank L. Bowman (66) c/o Kramer Levin Naftalis & Frankel LLP Counsel to the Independent Trustees 1177 Avenue of the Americas New York, NY 10036 | Trustee | Since August 2006 | President, Strategic Decisions, LLC (consulting) (since February 2009); Director or Trustee of various Retail Funds and Institutional Funds (since August 2006); Chairperson of the Insurance Sub-Committee of the Compliance and Insurance Committee (since February 2007); served as President and Chief Executive Officer of the Nuclear Energy Institute (policy organization) February 2005 through November 2008; retired as Admiral, U.S. Navy after serving 38 years on active duty including 8 years as Director of the Naval Nuclear Propulsion Program in the Department of the Navy and the U.S. Department of Energy (1996-2004); served as Chief of Naval Personnel (July 1994-September 1996); and on the joint staff as Director of Political — Military Affairs (June 1992 to July 1994); Knighted as Honorary Knight Commander of the Most Excellent Order of the British Empire; Awarded the Officer de l'Orde National du Mérite by the French Government; elected to the National Academy of Engineering (2009). | 102 | Director of BP p.l.c.; Director of Naval and Nuclear Technologies LLP; Director of the Armed Services YMCA of the USA and the Naval Submarine League; Director of the American Shipbuilding Suppliers Association; member of the National Security Advisory Council of the Center for U.S. Global Engagement and a member of the CNA military Advisory Board. | ||||||||||||||||||
| Michael Bozic (70) c/o Kramer Levin Naftalis & Frankel LLP Counsel to the Independent Trustees 1177 Avenue of the Americas New York, NY 10036 | Trustee | Since April 1994 | Private investor; Chairperson of the Compliance and Insurance Committee (since October 2006); Director or Trustee of the Retail Funds (since April 1994) and Institutional Funds (since July 2003); formerly, Chairperson of the Insurance Committee (July 2006-September 2006); Vice Chairman of Kmart Corporation (December 1998-October 2000), Chairman and Chief Executive Officer of Levitz Furniture Corporation (November 1995-November 1998) and President and Chief Executive Officer of Hills Department Stores (May 1991-July 1995); variously Chairman, Chief Executive Officer, President and Chief Operating Officer (1987-1991) of the Sears Merchandise Group of Sears, Roebuck & Co. | 104 | Director of various business organizations. | ||||||||||||||||||
92
Morgan Stanley Global Strategist Fund
Trustee and Officer Information (unaudited) continued
| Name, Age and Address of Independent Trustee | Position(s) Held with Registrant | Term of Office and Length of Time Served* | Principal Occupation(s) During Past 5 Years | Number of Portfolios in Fund Complex Overseen by Independent Trustee** | Other Directorships Held by Independent Trustee*** | ||||||||||||||||||
| Kathleen A. Dennis (57) c/o Kramer Levin Naftalis & Frankel LLP Counsel to the Independent Trustees 1177 Avenue of the Americas New York, NY 10036 | Trustee | Since August 2006 | President, Cedarwood Associates (mutual fund and investment management consulting) (since July 2006); Chairperson of the Money Market and Alternatives Sub-Committee of the Investment Committee (since October 2006) and Director or Trustee of various Retail Funds and Institutional Funds (since August 2006); formerly, Senior Managing Director of Victory Capital Management (1993-2006). | 102 | Director of various non-profit organizations. | ||||||||||||||||||
| Dr. Manuel H. Johnson (62) c/o Johnson Smick Group, Inc. 888 16th Street, N.W. Suite 740 Washington, D.C. 20006 | Trustee | Since July 1991 | Senior Partner, Johnson Smick International, Inc. (consulting firm); Chairperson of the Investment Committee (since October 2006) and Director or Trustee of the Retail Funds (since July 1991) and Institutional Funds (since July 2003); Co-Chairman and a founder of the Group of Seven Council (G7C) (international economic commission); formerly, Chairperson of the Audit Committee (July 1991-September 2006), Vice Chairman of the Board of Governors of the Federal Reserve System and Assistant Secretary of the U.S. Treasury. | 104 | Director of NVR, Inc. (home construction); Director of Evergreen Energy; Director of Greenwich Capital Holdings. | ||||||||||||||||||
| Joseph J. Kearns (69) c/o Kearns & Associates LLC PMB754 23852 Pacific Coast Highway Malibu, CA 90265 | Trustee | Since August 1994 | President, Kearns & Associates LLC (investment consulting); Chairperson of the Audit Committee (since October 2006) and Director or Trustee of the Retail Funds (since July 2003) and Institutional Funds (since August 1994); formerly, Deputy Chairperson of the Audit Committee (July 2003-September 2006) and Chairperson of the Audit Committee of the Institutional Funds (October 2001-July 2003 and since August 1994 for certain predecessor Funds); CFO of the J. Paul Getty Trust. | 105 | Director of Electro Rent Corporation (equipment leasing) and The Ford Family Foundation. | ||||||||||||||||||
93
Morgan Stanley Global Strategist Fund
Trustee and Officer Information (unaudited) continued
| Name, Age and Address of Independent Trustee | Position(s) Held with Registrant | Term of Office and Length of Time Served* | Principal Occupation(s) During Past 5 Years | Number of Portfolios in Fund Complex Overseen by Independent Trustee** | Other Directorships Held by Independent Trustee*** | ||||||||||||||||||
| Michael F. Klein (52) c/o Kramer Levin Naftalis & Frankel LLP Counsel to the Independent Trustees 1177 Avenue of the Americas New York, NY 10036 | Trustee | Since August 2006 | Managing Director, Aetos Capital, LLC (since March 2000) and Co-President, Aetos Alternatives Management, LLC (since January 2004); Chairperson of the Fixed Income Sub-Committee of the Investment Committee (since October 2006) and Director or Trustee of various Retail Funds and Institutional Funds (since August 2006); formerly, Managing Director, Morgan Stanley & Co. Inc. and Morgan Stanley Dean Witter Investment Management, President, Morgan Stanley Institutional Funds (June 1998-March 2000) and Principal, Morgan Stanley & Co. Inc. and Morgan Stanley Dean Witter Investment Management (August 1997-December 1999). | 102 | Director of certain investment funds managed or sponsored by Aetos Capital, LLC. Director of Sanitized AG and Sanitized Marketing AG (specialty chemicals). | ||||||||||||||||||
| Michael E. Nugent (75) c/o Triumph Capital, L.P. 445 Park Avenue New York, NY 10022 | Chairperson of the Board and Trustee | Chairperson of the Boards since July 2006 and Trustee since July 1991 | General Partner, Triumph Capital, L.P. (private investment partnership); Chairperson of the Boards of the Retail Funds and Institutional Funds (since July 2006); Director or Trustee of the Retail Funds (since July 1991) and Institutional Funds (since July 2001); formerly, Chairperson of the Insurance Committee (until July 2006). | 104 | None. | ||||||||||||||||||
94
Morgan Stanley Global Strategist Fund
Trustee and Officer Information (unaudited) continued
| Name, Age and Address of Independent Trustee | Position(s) Held with Registrant | Term of Office and Length of Time Served* | Principal Occupation(s) During Past 5 Years | Number of Portfolios in Fund Complex Overseen by Independent Trustee** | Other Directorships Held by Independent Trustee*** | ||||||||||||||||||
| W. Allen Reed (64) c/o Kramer Levin Naftalis & Frankel LLP Counsel to the Independent Trustees 1177 Avenue of the Americas New York, NY 10036 | Trustee | Since August 2006 | Chairperson of the Equity Sub-Committee of the Investment Committee (since October 2006) and Director or Trustee of various Retail Funds and Institutional Funds (since August 2006); formerly, President and CEO of General Motors Asset Management; Chairman and Chief Executive Officer of the GM Trust Bank and Corporate Vice President of General Motors Corporation (August 1994-December 2005). | 102 | Director of Temple-Inland Industries (packaging and forest products); Director of Legg Mason, Inc. and Director of the Auburn University Foundation; formerly, Director of iShares, Inc. (2001-2006). | ||||||||||||||||||
| Fergus Reid (79) c/o Joe Pietryka, Inc. 85 Charles Colman Blvd. Pawling, NY 12564 | Trustee | Since June 1992 | Chairman, Joe Pietryka, Inc.; Chairperson of the Governance Committee and Director or Trustee of the Retail Funds (since July 2003) and Institutional Funds (since June 1992). | 105 | Trustee and Director of certain investment companies in the JPMorgan Funds complex managed by JP Morgan Investment Management Inc. | ||||||||||||||||||
Interested Trustee:
| Name, Age and Address of Interested Trustee | Position(s) Held with Registrant | Term of Office and Length of Time Served* | Principal Occupation(s) During Past 5 Years | Number of Portfolios in Fund Complex Overseen by Interested Trustee** | Other Directorships Held by Interested Trustee*** | ||||||||||||||||||
| James F. Higgins (63) c/o Morgan Stanley Services Company Inc. Harborside Financial Center 201 Plaza Two Jersey City, NJ 07311 | Trustee | Since June 2000 | Director or Trustee of the Retail Funds (since June 2000) and Institutional Funds (since July 2003); Senior Advisor of Morgan Stanley (since August 2000). | 103 | Director of AXA Financial, Inc. and The Equitable Life Assurance Society of the United States (financial services). | ||||||||||||||||||
* This is the earliest date the Trustee began serving the funds advised by Morgan Stanley Investment Management Inc. (the "Adviser") (the "Retail Funds") or Morgan Stanley AIP GP LP (the "Institutional Funds").
** The Fund Complex includes all open-end and closed-end funds (including all of their portfolios) advised by the Adviser (as of December 31, 2010) and any funds that have an adviser that is an affiliated person of the Adviser (including, but not limited to, Morgan Stanley Investment Management Inc.).
*** This includes any directorships at public companies and registered investment companies held by the Trustee at any time during the past five years.
95
Morgan Stanley Global Strategist Fund
Trustee and Officer Information (unaudited) continued
Executive Officers:
| Name, Age and Address of Executive Officer | Position(s) Held with Registrant | Term of Office and Length of Time Served* | Principal Occupation(s) During Past 5 Years | ||||||||||||
| Arthur Lev (49) 522 Fifth Avenue New York, NY 10036 | President and Principal Executive Officer – Equity and Fixed Income Funds | Since June 2011 | President and Principal Executive Officer (since June 2011) of the Equity and Fixed Income Funds in the Fund Complex; Head of the Long Only Business of Morgan Stanley Investment Management (since February 2011); Managing Director of the Adviser and various entities affiliated with the Adviser (since December 2006). Formerly, Chief Strategy Officer of Morgan Stanley Investment Management's Traditional Asset Management business (November 2010-February 2011); General Counsel of Morgan Stanley Investment Management (December 2006-October 2010); Partner and General Counsel of FrontPoint Partners LLC (July 2002 to December 2006); Managing Director and General Counsel of Morgan Stanley Investment Management (May 2000 to June 2002). | ||||||||||||
| Mary Ann Picciotto (38) c/o Morgan Stanley Services Company Inc. Harborside Financial Center 201 Plaza Two Jersey City, NJ 07311 | Chief Compliance Officer | Since May 2010 | Executive Director of the Adviser and various entities affiliated with the Adviser; Chief Compliance Officer of the Retail Funds and Institutional Funds (since May 2010); Chief Compliance Officer of the Adviser and Morgan Stanley Investment Management Inc. (since April 2007). | ||||||||||||
| Stefanie V. Chang Yu (44) 522 Fifth Avenue New York, NY 10036 | Vice President | Since December 1997 | Managing Director of the Adviser and various entities affiliated with the Adviser; Vice President of the Retail Funds (since July 2002) and Institutional Funds (since December 1997). Formerly, Secretary of the Adviser and various entities affiliated with the Adviser. | ||||||||||||
| Francis J. Smith (46) c/o Morgan Stanley Services Company Inc. Harborside Financial Center 201 Plaza Two Jersey City, NJ 07311 | Treasurer and Principal Financial Officer | Treasurer since July 2003 and Principal Financial Officer since September 2002 | Executive Director of the Adviser and various entities affiliated with the Adviser; Treasurer and Principal Financial Officer of the Retail Funds (since July 2003) and Institutional Funds (since March 2010). | ||||||||||||
| Mary E. Mullin (44) 522 Fifth Avenue New York, NY 10036 | Secretary | Since June 1999 | Executive Director of the Adviser and various entities affiliated with the Adviser; Secretary of the Retail Funds (since July 2003) and Institutional Funds (since June 1999). | ||||||||||||
* This is the earliest date the Officer began serving the Retail Funds or Institutional Funds.
96
Morgan Stanley Global Strategist Fund
2011 Federal Tax Notice (unaudited)
For Federal income tax purposes, the following information is furnished with respect to the distributions paid by the Fund during its taxable year ended July 31, 2011. For corporate shareholders, 8.18% of the dividends qualified for the dividend received deduction. The Fund designated and paid $79,890,968 as a long-term capital gain distribution.
For Federal income tax purposes, the following information is furnished with respect to the Fund's earnings for its taxable year ended July 31, 2011. When distributed, certain earnings may be subject to a maximum tax rate of 15% as provided for by the Jobs and Growth Tax Relief Reconciliation Act of 2003. The Fund designated up to a maximum of $7,755,372 as taxable at this lower rate.
In January, the Fund provides tax information to shareholders for the preceding calendar year.
97
(This page has been left blank intentionally.)
(This page has been left blank intentionally.)
Trustees
Frank L. Bowman
Michael Bozic
Kathleen A. Dennis
James F. Higgins
Dr. Manuel H. Johnson
Joseph J. Kearns
Michael F. Klein
Michael E. Nugent
W. Allen Reed
Fergus Reid
Officers
Michael E. Nugent
Chairperson of the Board
Arthur Lev
President and Principal Executive Officer
Mary Ann Picciotto
Chief Compliance Officer
Stefanie V. Chang Yu
Vice President
Francis J. Smith
Treasurer and Principal Financial Officer
Mary E. Mullin
Secretary
Transfer Agent
Morgan Stanley Services Company, Inc.
P.O. Box 219886
Kansas City, Missouri 64121
Custodian
State Street Bank and Trust Company
One Lincoln Street
Boston, Massachusetts 02111
Independent Registered Public Accounting Firm
Ernst & Young LLP
200 Clarendon Street
Boston, Massachusetts 02116
Legal Counsel
Dechert LLP
1095 Avenue of the Americas
New York, New York 10036
Counsel to the Independent Trustees
Kramer Levin Naftalis & Frankel LLP
1177 Avenue of the Americas
New York, New York 10036
Investment Adviser
Morgan Stanley Investment Management Inc.
522 Fifth Avenue
New York, New York 10036
This report is submitted for the general information of the shareholders of the Fund. For more detailed information about the Fund, its fees and expenses and other pertinent information, please read its Prospectus. The Fund's Statement of Additional Information contains additional information about the Fund, including its trustees. It is available, without charge, by calling (800) 869-NEWS.
This report is not authorized for distribution to prospective investors in the Fund unless preceded or accompanied by an effective Prospectus. Read the Prospectus carefully before investing.
Morgan Stanley Distribution Inc., member FINRA.
© 2011 Morgan Stanley
SRTANN
IU11-01976P-Y07/11


INVESTMENT MANAGEMENT
Morgan Stanley
Global Strategist Fund

Annual Report
July 31, 2011
Trustees
Frank L. Bowman
Michael Bozic
Kathleen A. Dennis
James F. Higgins
Dr. Manuel H. Johnson
Joseph J. Kearns
Michael F. Klein
Michael E. Nugent
W. Allen Reed
Fergus Reid
Officers
Michael E. Nugent
Chairperson of the Board
Arthur Lev
President and Principal Executive Officer
Mary Ann Picciotto
Chief Compliance Officer
Stefanie V. Chang Yu
Vice President
Francis J. Smith
Treasurer and Principal Financial Officer
Mary E. Mullin
Secretary
Transfer Agent
Morgan Stanley Services Company, Inc.
P.O. Box 219886
Kansas City, Missouri 64121
Custodian
State Street Bank and Trust Company
One Lincoln Street
Boston, Massachusetts 02111
Independent Registered Public Accounting Firm
Ernst & Young LLP
200 Clarendon Street
Boston, Massachusetts 02116
Legal Counsel
Dechert LLP
1095 Avenue of the Americas
New York, New York 10036
Counsel to the Independent Trustees
Kramer Levin Naftalis & Frankel LLP
1177 Avenue of the Americas
New York, New York 10036
Investment Adviser
Morgan Stanley Investment Management Inc.
522 Fifth Avenue
New York, New York 10036

INVESTMENT MANAGEMENT
Morgan Stanley
Global Strategist Fund
The financial statements included herein have been taken from the records of the Fund without examination by the independent auditors and accordingly they do not express an opinion thereon.
This report is submitted for the general information of the shareholders of the Fund. For more detailed information about the Fund, its fees and expenses and other pertinent information, please read its Prospectus. The Fund's Statement of Additional Information contains additional information about the Fund, including its trustees. It is available, without charge, by calling (800) 869-NEWS.
This report is not authorized for distribution to prospective investors in the Fund unless preceded or accompanied by an effective Prospectus. Read the Prospectus carefully before investing.
Morgan Stanley Distribution, Inc., member FINRA.
© 2012 Morgan Stanley

Semiannual Report
January 31, 2012

SRTSAN
IU12-00513P-Y01/12

Morgan Stanley Global Strategist Fund
Table of Contents
| Welcome Shareholder | 3 | ||||||
| Fund Report | 4 | ||||||
| Performance Summary | 7 | ||||||
| Expense Example | 8 | ||||||
| Portfolio of Investments | 9 | ||||||
| Statement of Assets and Liabilities | 61 | ||||||
| Statement of Operations | 62 | ||||||
| Statements of Changes in Net Assets | 63 | ||||||
| Notes to Financial Statements | 64 | ||||||
| Financial Highlights | 80 | ||||||
| U.S. Privacy Policy | 84 | ||||||
2
Welcome Shareholder,
We are pleased to provide this semiannual report, in which you will learn how your investment in Morgan Stanley Global Strategist Fund performed during the latest six-month period. It includes an overview of the market conditions and discusses some of the factors that affected performance during the reporting period. In addition, the report contains financial statements and a list of portfolio holdings.
Morgan Stanley Investment Management is a client-centric, investor-led organization. Our global presence, intellectual capital, and breadth of products and services enable us to partner with investors to meet the evolving challenges of today's financial markets. We aim to deliver superior investment service and to empower our clients to make the informed decisions that help them reach their investment goals.
As always, we thank you for selecting Morgan Stanley Investment Management, and look forward to working with you in the months and years ahead.
This material must be preceded or accompanied by a prospectus for the fund being offered.
Market forecasts provided in this report may not necessarily come to pass. There is no assurance that the Fund will achieve its investment objective. The Fund is subject to market risk, which is the possibility that market values of securities owned by the Fund will decline and, therefore, the value of the Fund's shares may be less than what you paid for them. Accordingly, you can lose money investing in this Fund. Please see the prospectus for more complete information on investment risks.
3
Fund Report (unaudited)
For the six months ended January 31, 2012
| Total Return for the 6 Months Ended January 31, 2012 | |||||||||||||||||||||||||||
| Class A | Class B | Class C | Class I | MSCI All Country World Index1 | Barclays Capital U.S. Government/ Credit Index2 | Lipper Global Flexible Portfolio Funds Index3 | |||||||||||||||||||||
| -2.63 | % | -3.02 | % | -2.92 | % | -2.51 | % | -4.80 | % | 5.05 | % | -3.66 | % | ||||||||||||||
The performance of the Fund's four share classes varies because each has different expenses. The Fund's total returns assume the reinvestment of all distributions but do not reflect the deduction of any applicable sales charges. Such costs would lower performance. See Performance Summary for standardized performance and benchmark information.
Market Conditions
Global equities experienced significant volatility during the period under review, as uncertainty surrounding economic growth contributed to a plunge in equity markets worldwide. In the U.S., Congress passed a last minute bill to raise the debt ceiling, but not before Standard & Poor's downgraded U.S. government debt from AAA to AA+. Fears over the impact of global austerity on growth ultimately prompted a significant de-rating in risk markets. However, the postponement of fiscal consolidation and marked improvement in U.S. economic data subsequently pointed to a better growth outlook than had been feared.
Specifically, as 2011 came to a close, U.S. gross domestic product (GDP) rose to a 2.8 percent rate of growth while the unemployment rate fell to a three-year low of 8.5 percent. On the fiscal policy front, Congress reached a late agreement on a two-month extension of the payroll tax cut, indicating a smaller fiscal drag set for the first half of 2012. In Europe, despite a series of endless summits, no comprehensive solution emerged to address the fundamental solvency problems facing the monetary bloc. Adding to the problems already on the table, Italy found itself the latest victim of market tension, as its 10-year government bond yield climbed past the 7 percent mark. Furthermore, eurozone economic data weakened significantly, implying a technical recession (two consecutive quarters of negative growth) had begun. In response, the European Central Bank (ECB) eased funding conditions, twice cutting interest rates and introducing a longer-term refinancing operation (LTRO). These measures were well received by the markets, although they ultimately addressed only symptoms of the underlying cause (liquidity) rather than the cause itself (solvency).
In the emerging markets, the general theme was further moderation in growth and inflation pressures. Policymakers responded with more accommodative policy stances, with Brazil proactively cutting rates, China lowering its reserve requirement ratio and India refraining from further rate hikes, even in the face of rampant inflation. While global equity markets recouped a portion of their early losses, the MSCI All Country World Index finished a difficult six-month period down 4.80 percent.
Performance Analysis
All share classes of Morgan Stanley Global Strategist Fund outperformed the MSCI All Country World Index (the "Index") and the Lipper Global Flexible Portfolio Funds Index, and underperformed the Barclays Capital U.S. Government/Credit Index for the 6 months ended January 31, 2012, assuming no deduction of applicable sales charges.
The Fund's outperformance versus both the Lipper category and the all-equity Index can be attributed to asset allocation decisions (relative to the peer group) consisting
4
of a slight overweight position to global equities, a slight underweight to fixed income, and an equal weight in commodities. (As a reminder, the Fund's target benchmark weights consist of 55% global equities, 35% global fixed income, and 5% each in commodities and cash.) Within the equity exposure, an underweight position in peripheral Europe and India proved beneficial to returns, as did our underweight to U.S. government-issued debt in the fixed income portion of the Fund. Our currency exposures to the U.S. dollar, at the expense of both the euro and the Mexican peso, also provided positive incremental returns. Within our sector weights, an overweight position in European consumer staples and an underweight to global financials contributed to relative returns.
Detractors from relative performance included lower exposures to U.S. equities, underweights in more defensive sectors such as utilities, and a long position in the Canadian dollar, relative to the U.S. dollar.
The Fund maintained a relatively balanced asset allocation blend throughout the period under review, with global equity exposures averaging 62 percent, global fixed income exposures averaging 28 percent, commodities exposure averaging 5 percent, and cash ranging from 4 to 1 percent.
The Fund's asset allocation on January 31, 2012, based on actual asset class exposures in both cash securities and derivative instruments, stood at 63.5 percent global equities, 28.4 percent global fixed income, 5.1 percent diversified commodities and 3.0 percent cash equivalents.
There is no guarantee that any sectors mentioned will continue to perform as discussed herein or that securities in such sectors will be held by the Fund in the future.
| TOP 10 HOLDINGS as of 01/31/12 | |||||||
| Deutsche Bank AG, Series 0005 | 5.0 | % | |||||
| U.S. Treasury Notes | 1.8 | ||||||
| Japan Government Thirty Year Bond | 1.3 | ||||||
| Japan Government Ten Year Bond | 1.1 | ||||||
| Canadian Government Bond | 1.0 | ||||||
| United Kingdom Gilt | 1.0 | ||||||
| U.S. Treasury Bonds | 0.9 | ||||||
| French Treasury Note BTAN | 0.8 | ||||||
| Japan Government Ten Year Bond | 0.8 | ||||||
| Bundesrepublik Deutschland | 0.8 | ||||||
| PORTFOLIO COMPOSITION as of 01/31/12* | |||||||
| Common Stocks | 53.9 | % | |||||
| Sovereign | 15.3 | ||||||
| Corporate Bonds | 10.8 | ||||||
| Agency Fixed Rate Mortgages | 5.6 | ||||||
| Commodity Linked Security | 5.2 | ||||||
| U.S. Treasury Securities | 3.9 | ||||||
| Short-Term Investments | 2.3 | ||||||
| Investment Companies | 1.3 | ||||||
| Commercial Mortgage Backed Securities | 0.9 | ||||||
| Asset-Backed Securities | 0.7 | ||||||
| Municipal Bonds | 0.1 | ||||||
* Does not include open long/short futures contracts with an underlying face amount of $104,492,518 and net unrealized appreciation of $925,052. Also does not include open swap agreements with net unrealized appreciation of $93,003 and open foreign currency exchange contracts with net unrealized depreciation of $200,463.
Subject to change daily. Provided for informational purposes only and should not be deemed as a recommendation to buy or sell the securities mentioned above. Top 10 holdings are as a percentage of net assets and portfolio composition is as a percentage of total investments. Morgan Stanley is a full-service securities firm engaged in securities trading and brokerage activities, investment banking, research and analysis, financing and financial advisory services.
5
Investment Strategy
The Fund's Adviser, Morgan Stanley Investment Management Inc., seeks to achieve the Fund's investment objective by investing primarily in a blend of equity and fixed-income securities of U.S. and non-U.S. issuers. Equity securities may include common and preferred stocks, depositary receipts, convertible securities, equity-linked securities, real estate investment trusts ("REITs"), and rights and warrants to purchase equity securities. Fixed income securities may include mortgage-related or mortgage-backed securities, floating rate securities, inflation-linked fixed income securities, securities issued or guaranteed by the U.S. Government, its agencies or instrumentalities, securities issued or guaranteed by non-U.S. governments, their agencies, or instrumentalities, corporate bonds and notes issued by U.S. and non-U.S. entities.
For More Information About Portfolio Holdings
Each Morgan Stanley fund provides a complete schedule of portfolio holdings in its semiannual and annual reports within 60 days of the end of the fund's second and fourth fiscal quarters. The semiannual reports and the annual reports are filed electronically with the Securities and Exchange Commission (SEC) on Form N-CSRS and Form N-CSR, respectively. Morgan Stanley also delivers the semiannual and annual reports to fund shareholders and makes these reports available on its public web site, www.morganstanley.com. Each Morgan Stanley fund also files a complete schedule of portfolio holdings with the SEC for the fund's first and third fiscal quarters on Form N-Q. Morgan Stanley does not deliver the reports for the first and third fiscal quarters to shareholders, nor are the reports posted to the Morgan Stanley public web site. You may, however, obtain the Form N-Q filings (as well as the Form N-CSR and N-CSRS filings) by accessing the SEC's web site, http://www.sec.gov. You may also review and copy them at the SEC's public reference room in Washington, DC. Information on the operation of the SEC's public reference room may be obtained by calling the SEC at (800) SEC-0330. You can also request copies of these materials, upon payment of a duplicating fee, by electronic request at the SEC's e-mail address (publicinfo@sec.gov) or by writing the public reference section of the SEC, Washington, DC 20549-1520.
Proxy Voting Policy and Procedures and Proxy Voting Record
You may obtain a copy of the Fund's Proxy Voting Policy and Procedures without charge, upon request, by calling toll free (800) 869-NEWS or by visiting the Mutual Fund Center on our web site at www.morganstanley.com. It is also available on the SEC's web site at http://www.sec.gov.
You may obtain information regarding how the Fund voted proxies relating to portfolio securities during the most recent twelve-month period ended June 30 without charge by visiting the Mutual Fund Center on our web site at www.morganstanley.com. This information is also available on the SEC's web site at http://www.sec.gov.
Householding Notice
To reduce printing and mailing costs, the Fund attempts to eliminate duplicate mailings to the same address. The Fund delivers a single copy of certain shareholder documents, including shareholder reports, prospectuses and proxy materials, to investors with the same last name who reside at the same address. Your participation in this program will continue for an unlimited period of time unless you instruct us otherwise. You can request multiple copies of these documents by calling (800) 869-NEWS, 8:00 a.m. to 8:00 p.m., ET. Once our Customer Service Center has received your instructions, we will begin sending individual copies for each account within 30 days.
6
Performance Summary (unaudited)
| Average Annual Total Returns—Period Ended January 31, 2012 | |||||||||||||||||||
| Symbol | Class A Shares* (since 07/28/97) SRTAX | Class B Shares** (since 10/31/88) SRTBX | Class C Shares† (since 07/28/97) SRTCX | Class I Shares†† (since 07/28/97) SRTDX | |||||||||||||||
| 1 Year | –0.67 –5.90 5 | %4 | –1.43 –6.02 5 | %4 | –1.31 –2.23 5 | %4 | –0.37 — | %4 | |||||||||||
| 5 Years | 1.62 4 0.53 5 | 0.85 4 0.56 5 | 0.88 4 0.88 5 | 1.87 4 — | |||||||||||||||
| 10 Years | 4.75 4 4.19 5 | 4.03 4 4.03 5 | 3.97 4 3.97 5 | 4.99 4 — | |||||||||||||||
| Since Inception | 5.21 4 4.82 5 | 8.18 4 8.18 5 | 4.43 4 4.43 5 | 5.46 4 — | |||||||||||||||
| Gross Expense Ratio | 0.98 | 1.73 | 1.73 | 0.73 | |||||||||||||||
Performance data quoted represents past performance, which is no guarantee of future results and current performance may be lower or higher than the figures shown. For most recent month-end performance figures, please visit www.morganstanley.com/im or speak with your Financial Advisor. Investment returns and principal value will fluctuate and fund shares, when redeemed, may be worth more or less than their original cost. The table does not reflect the deduction of taxes that a shareholder would pay on fund distributions or the redemption of fund shares. Performance for Class A, Class B, Class C, and Class I shares will vary due to differences in sales charges and expenses. See the Fund's current prospectus for complete details on fees and sales charges. Expenses are as of each Fund's fiscal year end as outlined in the Fund's current prospectus.
* The maximum front-end sales charge for Class A is 5.25%.
** The maximum contingent deferred sales charge (CDSC) for Class B is 5.0%. The CDSC declines to 0% after six years. Effective April 2005, Class B shares will generally convert to Class A shares approximately eight years after the end of the calendar month in which the shares were purchased. Performance for periods greater than eight years reflects this conversion (beginning April 2005).
† The maximum contingent deferred sales charge for Class C is 1.0% for shares redeemed within one year of purchase.
†† Class I has no sales charge.
(1) The Morgan Stanley Capital International (MSCI) All Country World Index (ACWI) is a free float-adjusted market capitalization weighted index designed to measure the equity market performance of developed and emerging markets. The term "free float" represents the portion of shares outstanding that are deemed to be available for purchase in the public equity markets by investors. The performance of the Index is listed in U.S. dollars and assumes reinvestment of net dividends. The Index is unmanaged and its returns do not include any sales charges or fees. Such costs would lower performance. It is not possible to invest directly in an index.
(2) The Barclays Capital U.S. Government/Credit Index tracks the performance of government and corporate obligations, including U.S. government agency and Treasury securities and corporate and Yankee bonds. The Index is unmanaged and its returns do not include any sales charges or fees. Such costs would lower performance. It is not possible to invest directly in an index.
(3) The Lipper Global Flexible Funds Index is an equally weighted performance index of the largest qualifying funds (based on net assets) in the Lipper Global Flexible Funds classification. The Index, which is adjusted for capital gains distributions and income dividends, is unmanaged and should not be considered an investment. There are currently 30 funds represented in this Index. The Fund was in the Lipper Global Flexible Funds classification as of the date of this report.
(4) Figure shown assumes reinvestment of all distributions and does not reflect the deduction of any sales charges.
(5) Figure shown assumes reinvestment of all distributions and the deduction of the maximum applicable sales charge. See the Fund's current prospectus for complete details on fees and sales charges.
7
Expense Example (unaudited)
As a shareholder of the Fund, you incur two types of costs: (1) transaction costs, including sales charges (loads) on purchase payments and (2) ongoing costs, including advisory fees; distribution and service (12b-1) fees; and other Fund expenses. This example is intended to help you understand your ongoing costs (in dollars) of investing in the Fund and to compare these costs with the ongoing costs of investing in other mutual funds.
The example is based on an investment of $1,000 invested at the beginning of the period and held for the entire period 08/01/11 – 01/31/12.
Actual Expenses
The first line of the table below provides information about actual account values and actual expenses. You may use the information in this line, together with the amount you invested, to estimate the expenses that you paid over the period. Simply divide your account value by $1,000 (for example, an $8,600 account value divided by $1,000 = 8.6), then multiply the result by the number in the first line under the heading entitled "Expenses Paid During Period" to estimate the expenses you paid on your account during this period.
Hypothetical Example for Comparison Purposes
The second line of the table below provides information about hypothetical expenses based on the Fund's actual expense ratio and an assumed rate of return of 5% per year before expenses, which is not the Fund's actual return. The hypothetical account values and expenses may not be used to estimate the actual ending account balance or expenses you paid for the period. You may use this information to compare the ongoing cost of investing in the Fund and other funds. To do so, compare this 5% hypothetical example with the 5% hypothetical examples that appear in the shareholder reports of the other funds.
Please note that the expenses shown in the table are meant to highlight your ongoing costs only and do not reflect any transactional costs, such as sales charges (loads). Therefore, the second line of the table is useful in comparing ongoing costs, and will not help you determine the relative total cost of owning different funds. In addition, if these transactional costs were included, your costs would have been higher.
| Beginning Account Value | Ending Account Value | Expenses Paid During Period@ | |||||||||||||
| 08/01/11 | 01/31/12 | 08/01/11 – 01/31/12 | |||||||||||||
| Class A | |||||||||||||||
| Actual (–2.63% return) | $ | 1,000.00 | $ | 973.70 | $ | 4.91 | |||||||||
| Hypothetical (5% annual return before expenses) | $ | 1,000.00 | $ | 1,020.16 | $ | 5.03 | |||||||||
| Class B | |||||||||||||||
| Actual (–3.02% return) | $ | 1,000.00 | $ | 969.80 | $ | 8.62 | |||||||||
| Hypothetical (5% annual return before expenses) | $ | 1,000.00 | $ | 1,016.39 | $ | 8.82 | |||||||||
| Class C | |||||||||||||||
| Actual (–2.92% return) | $ | 1,000.00 | $ | 970.80 | $ | 8.62 | |||||||||
| Hypothetical (5% annual return before expenses) | $ | 1,000.00 | $ | 1,016.39 | $ | 8.82 | |||||||||
| Class I | |||||||||||||||
| Actual (–2.51% return) | $ | 1,000.00 | $ | 974.90 | $ | 3.67 | |||||||||
| Hypothetical (5% annual return before expenses) | $ | 1,000.00 | $ | 1,021.42 | $ | 3.76 | |||||||||
@ Expenses are equal to the Fund's annualized expense ratios of 0.99%, 1.74%, 1.74% and 0.74% for Class A, Class B, Class C and Class I shares, respectively, multiplied by the average account value over the period, multiplied by 184/366 (to reflect the one-half year period). If the fund had borne all of its expenses, the annualized expense ratio would have been 1.00%, 1.75%, 1.75% and 0.75% Class A, Class B, Class C and Class I shares, respectively.
8
Morgan Stanley Global Strategist Fund
Portfolio of Investments n January 31, 2012 (unaudited)
| NUMBER OF SHARES | VALUE | ||||||||||
| Common Stocks (52.3%) | |||||||||||
| Australia (2.1%) | |||||||||||
| Air Freight & Logistics | |||||||||||
| 9,328 | Toll Holdings Ltd. | $ | 49,416 | ||||||||
| Beverages | |||||||||||
| 7,069 | Coca-Cola Amatil Ltd. | 86,681 | |||||||||
| 11,468 | Treasury Wine Estates Ltd. | 42,247 | |||||||||
| 128,928 | |||||||||||
| Biotechnology | |||||||||||
| 6,876 | CSL Ltd. | 227,246 | |||||||||
| Capital Markets | |||||||||||
| 4,098 | Macquarie Group Ltd. | 110,941 | |||||||||
| Chemicals | |||||||||||
| 6,321 | DuluxGroup Ltd. | 19,126 | |||||||||
| 20,816 | Incitec Pivot Ltd. | 70,939 | |||||||||
| 5,073 | Orica Ltd. | 133,297 | |||||||||
| 223,362 | |||||||||||
| Commercial Banks | |||||||||||
| 34,810 | Australia & New Zealand Banking Group Ltd. | 791,229 | |||||||||
| 17,491 | Commonwealth Bank of Australia | 940,722 | |||||||||
| 29,142 | National Australia Bank Ltd. | 737,885 | |||||||||
| 34,431 | Westpac Banking Corp. | 773,110 | |||||||||
| 3,242,946 | |||||||||||
| Commercial Services & Supplies | |||||||||||
| 17,604 | Brambles Ltd. | 135,871 | |||||||||
| Construction & Engineering | |||||||||||
| 2,027 | Leighton Holdings Ltd. | 50,421 | |||||||||
| Containers & Packaging | |||||||||||
| 15,296 | Amcor Ltd. | 114,323 | |||||||||
| NUMBER OF SHARES | VALUE | ||||||||||
| Diversified Financial Services | |||||||||||
| 2,386 | ASX Ltd. | $ | 75,968 | ||||||||
| Diversified Telecommunication Services | |||||||||||
| 60,099 | Telstra Corp, Ltd. | 212,468 | |||||||||
| Energy Equipment & Services | |||||||||||
| 2,456 | WorleyParsons Ltd. | 71,156 | |||||||||
| Food & Staples Retailing | |||||||||||
| 12,676 | Wesfarmers Ltd. | 407,762 | |||||||||
| 2,388 | Wesfarmers Ltd. (PPS) | 78,135 | |||||||||
| 15,531 | Woolworths Ltd. | 408,750 | |||||||||
| 894,647 | |||||||||||
| Health Care Equipment & Supplies | |||||||||||
| 773 | Cochlear Ltd. | 48,747 | |||||||||
| Health Care Providers & Services | |||||||||||
| 4,764 | Sonic Healthcare Ltd. | 56,798 | |||||||||
| Hotels, Restaurants & Leisure | |||||||||||
| 8,910 | Crown Ltd. | 76,526 | |||||||||
| 10,695 | Echo Entertainment Group Ltd. (a) | 40,989 | |||||||||
| 9,199 | TABCORP Holdings Ltd. | 28,419 | |||||||||
| 145,934 | |||||||||||
| Information Technology Services | |||||||||||
| 6,506 | Computershare Ltd. | 52,839 | |||||||||
| Insurance | |||||||||||
| 41,893 | AMP Ltd. | 189,911 | |||||||||
| 30,701 | Insurance Australia Group Ltd. | 94,848 | |||||||||
See Notes to Financial Statements
9
Morgan Stanley Global Strategist Fund
Portfolio of Investments n January 31, 2012 (unaudited) continued
| NUMBER OF SHARES | VALUE | ||||||||||
| 17,898 | QBE Insurance Group Ltd. | $ | 217,756 | ||||||||
| 15,816 | Suncorp Group Ltd. | 141,213 | |||||||||
| 643,728 | |||||||||||
| Media | |||||||||||
| 39,248 | Fairfax Media Ltd. | 30,834 | |||||||||
| Metals & Mining | |||||||||||
| 44,558 | Alumina Ltd. | 60,550 | |||||||||
| 40,502 | BHP Billiton Ltd. | 1,611,601 | |||||||||
| 26,754 | BlueScope Steel Ltd. | 11,503 | |||||||||
| 16,804 | Fortescue Metals Group Ltd. | 90,092 | |||||||||
| 5,772 | Newcrest Mining Ltd. | 206,631 | |||||||||
| 17,194 | OneSteel Ltd. | 13,508 | |||||||||
| 5,339 | Rio Tinto Ltd. | 392,009 | |||||||||
| 2,385,894 | |||||||||||
| Multi-Utilities | |||||||||||
| 5,722 | AGL Energy Ltd. | 88,631 | |||||||||
| Oil, Gas & Consumable Fuels | |||||||||||
| 13,338 | Origin Energy Ltd. | 194,846 | |||||||||
| 11,236 | Santos Ltd. | 160,560 | |||||||||
| 7,351 | Woodside Petroleum Ltd. | 266,981 | |||||||||
| 622,387 | |||||||||||
| Real Estate Investment Trusts (REITs) | |||||||||||
| 65,324 | Dexus Property Group REIT (Stapled Securities) (b) | 61,723 | |||||||||
| 80,650 | Goodman Group REIT (Stapled Securities) (b) | 54,798 | |||||||||
| 26,937 | GPT Group REIT (Stapled Securities) (b) | 88,367 | |||||||||
| NUMBER OF SHARES | VALUE | ||||||||||
| 38,679 | Mirvac Group REIT (Stapled Securities) (b)(c) | $ | 50,713 | ||||||||
| 28,561 | Stockland REIT (Stapled Securities) (b)(c) | 101,881 | |||||||||
| 25,964 | Westfield Group REIT (Stapled Securities) (b)(c) | 234,300 | |||||||||
| 25,951 | Westfield Retail Trust REIT | 69,704 | |||||||||
| 661,486 | |||||||||||
| Road & Rail | |||||||||||
| 12,104 | Asciano Ltd. | 60,396 | |||||||||
| Transportation Infrastructure | |||||||||||
| 16,094 | Transurban Group (Stapled Securities) (b) | 93,803 | |||||||||
| Total Australia | 10,429,170 | ||||||||||
| Austria (0.0%) | |||||||||||
| Metals & Mining | |||||||||||
| 1,329 | Voestalpine AG | 43,573 | |||||||||
| Real Estate Management & Development | |||||||||||
| 3,664 | Immofinanz AG (a) | 11,785 | |||||||||
| Total Austria | 55,358 | ||||||||||
| Belgium (0.2%) | |||||||||||
| Beverages | |||||||||||
| 7,130 | Anheuser-Busch InBev N.V. | 432,325 | |||||||||
| Chemicals | |||||||||||
| 1,567 | Umicore SA | 72,857 | |||||||||
| Commercial Banks | |||||||||||
| 3,024 | KBC Groep N.V. | 57,336 | |||||||||
See Notes to Financial Statements
10
Morgan Stanley Global Strategist Fund
Portfolio of Investments n January 31, 2012 (unaudited) continued
| NUMBER OF SHARES | VALUE | ||||||||||
| Diversified Financial Services | |||||||||||
| 1,540 | Groupe Bruxelles Lambert SA | $ | 111,597 | ||||||||
| Food & Staples Retailing | |||||||||||
| 905 | Colruyt SA | 34,217 | |||||||||
| 3,434 | Delhaize Group SA | 187,018 | |||||||||
| 221,235 | |||||||||||
| Insurance | |||||||||||
| 30,051 | Ageas | 62,461 | |||||||||
| Total Belgium | 957,811 | ||||||||||
| Brazil (1.3%) | |||||||||||
| Beverages | |||||||||||
| 12,500 | Cia de Bebidas das Americas | 457,876 | |||||||||
| Commercial Banks | |||||||||||
| 28,291 | Banco Bradesco SA (Preference) | 508,435 | |||||||||
| 7,700 | Banco do Brasil SA | 119,828 | |||||||||
| 7,600 | Banco Santander Brasil SA (Units) (c) | 70,467 | |||||||||
| 28,500 | Itau Unibanco Holding SA (Preference) | 572,871 | |||||||||
| 40,511 | Itausa - Investimentos Itau SA (Preference) | 265,250 | |||||||||
| 1,536,851 | |||||||||||
| Diversified Financial Services | |||||||||||
| 18,100 | BM&F Bovespa SA | 113,850 | |||||||||
| Diversified Telecommunication Services | |||||||||||
| 5,707 | Tele Norte Leste (Preference) | 54,875 | |||||||||
| NUMBER OF SHARES | VALUE | ||||||||||
| 3,574 | Telefonica Brasil SA (Preference) | $ | 99,516 | ||||||||
| 154,391 | |||||||||||
| Electric Utilities | |||||||||||
| 11,628 | Centrais Eletricas Brasileiras SA (Preference) | 170,374 | |||||||||
| 9,201 | Cia Energetica de Minas Gerais (Preference) | 186,263 | |||||||||
| 356,637 | |||||||||||
| Food Products | |||||||||||
| 9,300 | BR | F | - Brasil Foods SA | 184,169 | |||||||
| Household Durables | |||||||||||
| 3,500 | Cyrela Brazil Realty SA Empreendimentos e Participacoes | 32,412 | |||||||||
| 10,800 | PDG Realty SA Empreendimentos e Participacoes | 43,764 | |||||||||
| 76,176 | |||||||||||
| Information Technology Services | |||||||||||
| 3,400 | Cielo SA | 101,288 | |||||||||
| 5,100 | Redecard SA | 91,947 | |||||||||
| 193,235 | |||||||||||
| Metals & Mining | |||||||||||
| 4,591 | Bradespar SA (Preference) | 92,414 | |||||||||
| 13,100 | Cia Siderurgica Nacional SA | 136,833 | |||||||||
| 9,327 | Gerdau SA (Preference) | 88,882 | |||||||||
| 4,467 | Metalurgica Gerdau SA (Preference) | 53,690 | |||||||||
| 4,100 | Usinas Siderurgicas de Minas Gerais SA | 39,751 | |||||||||
See Notes to Financial Statements
11
Morgan Stanley Global Strategist Fund
Portfolio of Investments n January 31, 2012 (unaudited) continued
| NUMBER OF SHARES | VALUE | ||||||||||
| 7,926 | Usinas Siderurgicas de Minas Gerais SA (Preference) | $ | 53,167 | ||||||||
| 18,100 | Vale SA | 463,066 | |||||||||
| 29,313 | Vale SA (Preference) | 716,216 | |||||||||
| 1,644,019 | |||||||||||
| Oil, Gas & Consumable Fuels | |||||||||||
| 17,000 | OGX Petroleo e Gas Participacoes SA (a) | 161,029 | |||||||||
| 31,100 | Petroleo Brasileiro SA | 478,996 | |||||||||
| 43,330 | Petroleo Brasileiro SA (Preference) | 609,328 | |||||||||
| 6,400 | Ultrapar Participacoes SA | 129,487 | |||||||||
| 1,378,840 | |||||||||||
| Personal Products | |||||||||||
| 3,800 | Natura Cosmeticos SA | 81,385 | |||||||||
| Road & Rail | |||||||||||
| 5,500 | All America Latina Logistica SA (Units) (c) | 31,636 | |||||||||
| Transportation Infrastructure | |||||||||||
| 14,800 | CCR SA | 103,004 | |||||||||
| Total Brazil | 6,312,069 | ||||||||||
| Canada (3.1%) | |||||||||||
| Aerospace & Defense | |||||||||||
| 19,400 | Bombardier, Inc. | 89,774 | |||||||||
| Auto Components | |||||||||||
| 3,400 | Magna International, Inc. | 140,449 | |||||||||
| Capital Markets | |||||||||||
| 2,800 | IGM Financial, Inc. | 125,102 | |||||||||
| Chemicals | |||||||||||
| 2,200 | Agrium, Inc. | 177,347 | |||||||||
| NUMBER OF SHARES | VALUE | ||||||||||
| 11,400 | Potash Corp. of Saskatchewan, Inc. | $ | 534,130 | ||||||||
| 711,477 | |||||||||||
| Commercial Banks | |||||||||||
| 7,100 | Bank of Montreal | 412,745 | |||||||||
| 12,400 | Bank of Nova Scotia | 637,251 | |||||||||
| 5,200 | Canadian Imperial Bank of Commerce | 395,432 | |||||||||
| 2,100 | National Bank of Canada | 157,537 | |||||||||
| 17,100 | Royal Bank of Canada | 893,115 | |||||||||
| 11,300 | Toronto-Dominion Bank (The) | 873,843 | |||||||||
| 3,369,923 | |||||||||||
| Communications Equipment | |||||||||||
| 6,300 | Research In Motion Ltd. (a) | 105,052 | |||||||||
| Construction & Engineering | |||||||||||
| 2,800 | SNC-Lavalin Group, Inc. | 144,175 | |||||||||
| Diversified Telecommunication Services | |||||||||||
| 7,200 | BCE, Inc. | 293,544 | |||||||||
| Electric Utilities | |||||||||||
| 2,000 | Fortis, Inc. | 66,600 | |||||||||
| Food & Staples Retailing | |||||||||||
| 3,500 | Shoppers Drug Mart Corp. | 144,859 | |||||||||
| Hotels, Restaurants & Leisure | |||||||||||
| 4,300 | Tim Hortons, Inc. | 209,532 | |||||||||
See Notes to Financial Statements
12
Morgan Stanley Global Strategist Fund
Portfolio of Investments n January 31, 2012 (unaudited) continued
| NUMBER OF SHARES | VALUE | ||||||||||
| Independent Power Producers & Energy Traders | |||||||||||
| 3,400 | TransAlta Corp. | $ | 69,038 | ||||||||
| Insurance | |||||||||||
| 300 | Fairfax Financial Holdings Ltd. | 121,771 | |||||||||
| 6,200 | Great-West Lifeco, Inc. | 136,775 | |||||||||
| 1,900 | Intact Financial Corp. | 112,025 | |||||||||
| 24,700 | Manulife Financial Corp. | 288,458 | |||||||||
| 5,500 | Power Corp. of Canada | 133,729 | |||||||||
| 5,200 | Power Financial Corp. | 138,674 | |||||||||
| 8,000 | Sun Life Financial, Inc. | 160,287 | |||||||||
| 1,091,719 | |||||||||||
| Media | |||||||||||
| 5,200 | Shaw Communications, Inc. | 103,201 | |||||||||
| 5,100 | Thomson Reuters Corp. | 140,076 | |||||||||
| 243,277 | |||||||||||
| Metals & Mining | |||||||||||
| 2,300 | Agnico-Eagle Mines Ltd. | 86,224 | |||||||||
| 2,000 | Agnico-Eagle Mines Ltd. | 74,800 | |||||||||
| 3,241 | AuRico Gold, Inc. (a) | 30,627 | |||||||||
| 8,012 | Barrick Gold Corp. | 394,671 | |||||||||
| 13,100 | Barrick Gold Corp. | 646,181 | |||||||||
| 6,388 | Eldorado Gold Corp. | 96,523 | |||||||||
| 7,400 | Eldorado Gold Corp. | 112,103 | |||||||||
| 1,220 | First Majestic Silver Corp. (a) | 25,217 | |||||||||
| 7,000 | First Quantum Minerals Ltd. | 153,306 | |||||||||
| 9,800 | Goldcorp, Inc. | 474,020 | |||||||||
| 6,521 | Goldcorp, Inc. | 315,551 | |||||||||
| 21,702 | Kinross Gold Corp. | 245,016 | |||||||||
| NUMBER OF SHARES | VALUE | ||||||||||
| 944 | Minefinders Corp. (a) | $ | 13,386 | ||||||||
| 2,286 | Nevsun Resources Ltd. | 14,996 | |||||||||
| 5,176 | New Gold, Inc. (a) | 60,611 | |||||||||
| 1,229 | Pan American Silver Corp. | 28,120 | |||||||||
| 4,800 | Silver Wheaton Corp. | 171,234 | |||||||||
| 3,431 | Silver Wheaton Corp. | 122,178 | |||||||||
| 6,500 | Teck Resources Ltd. | 275,636 | |||||||||
| 818 | Vista Gold Corp. (a) | 3,084 | |||||||||
| 10,100 | Yamana Gold, Inc. | 174,763 | |||||||||
| 7,107 | Yamana Gold, Inc. | 122,738 | |||||||||
| 3,640,985 | |||||||||||
| Oil, Gas & Consumable Fuels | |||||||||||
| 5,600 | Cameco Corp. | 129,905 | |||||||||
| 14,400 | Canadian Natural Resources Ltd. | 570,428 | |||||||||
| 3,500 | Canadian Oil Sands Ltd. | 86,776 | |||||||||
| 10,000 | Cenovus Energy, Inc. | 364,915 | |||||||||
| 2,700 | Crescent Point Energy Corp. | 123,489 | |||||||||
| 11,600 | Enbridge, Inc. | 436,489 | |||||||||
| 10,500 | Encana Corp. | 201,162 | |||||||||
| 3,600 | Husky Energy, Inc. | 87,927 | |||||||||
| 3,500 | Imperial Oil Ltd. | 166,780 | |||||||||
| 8,200 | Nexen, Inc. | 146,957 | |||||||||
| 5,700 | Penn West Petroleum Ltd. | 124,210 | |||||||||
| 1,400 | Petrobank Energy & Resources Ltd. (a) | 19,491 | |||||||||
| 859 | Petrominerales Ltd. | 17,930 | |||||||||
| 19,800 | Suncor Energy, Inc. | 682,050 | |||||||||
| 14,200 | Talisman Energy, Inc. | 169,658 | |||||||||
| 8,800 | TransCanada Corp. | 362,022 | |||||||||
| 3,690,189 | |||||||||||
See Notes to Financial Statements
13
Morgan Stanley Global Strategist Fund
Portfolio of Investments n January 31, 2012 (unaudited) continued
| NUMBER OF SHARES | VALUE | ||||||||||
| Real Estate Management & Development | |||||||||||
| 7,500 | Brookfield Asset Management, Inc., Class A | $ | 227,610 | ||||||||
| 5,800 | Brookfield Office Properties, Inc. | 100,128 | |||||||||
| 327,738 | |||||||||||
| Road & Rail | |||||||||||
| 6,100 | Canadian National Railway Co. | 460,101 | |||||||||
| 2,300 | Canadian Pacific Railway Ltd. | 164,030 | |||||||||
| 624,131 | |||||||||||
| Wireless Telecommunication Services | |||||||||||
| 5,400 | Rogers Communications, Inc. | 207,610 | |||||||||
| Total Canada | 15,295,174 | ||||||||||
| Channel Islands (0.0%) | |||||||||||
| Metals & Mining | |||||||||||
| 1,023 | Randgold Resources Ltd. ADR | 117,041 | |||||||||
| Chile (0.0%) | |||||||||||
| Metals & Mining | |||||||||||
| 2,716 | Antofagasta PLC | 55,339 | |||||||||
| China (0.1%) | |||||||||||
| Insurance | |||||||||||
| 67,200 | AIA Group Ltd. (d) | 224,425 | |||||||||
| Denmark (0.2%) | |||||||||||
| Chemicals | |||||||||||
| 2,530 | Novozymes A/S, Series B | 71,225 | |||||||||
| NUMBER OF SHARES | VALUE | ||||||||||
| Commercial Banks | |||||||||||
| 5,744 | Danske Bank A/S (a) | $ | 83,886 | ||||||||
| Electrical Equipment | |||||||||||
| 3,486 | Vestas Wind Systems A/S (a) | 39,317 | |||||||||
| Marine | |||||||||||
| 5 | AP Moller - Maersk A/S | 35,173 | |||||||||
| 10 | AP Moller - Maersk A/S, Series B | 73,689 | |||||||||
| 108,862 | |||||||||||
| Pharmaceuticals | |||||||||||
| 3,710 | Novo Nordisk A/S, Series B | 438,671 | |||||||||
| Road & Rail | |||||||||||
| 3,265 | DSV A/S | 66,698 | |||||||||
| Total Denmark | 808,659 | ||||||||||
| Finland (0.2%) | |||||||||||
| Auto Components | |||||||||||
| 1,401 | Nokian Renkaat Oyj | 50,048 | |||||||||
| Communications Equipment | |||||||||||
| 36,768 | Nokia Oyj | 183,624 | |||||||||
| Electric Utilities | |||||||||||
| 6,439 | Fortum Oyj | 141,499 | |||||||||
| Insurance | |||||||||||
| 3,785 | Sampo Oyj, Class A | 99,712 | |||||||||
| Machinery | |||||||||||
| 2,681 | Kone Oyj, Class B | 145,956 | |||||||||
| Paper & Forest Products | |||||||||||
| 12,324 | UPM-Kymmene Oyj | 157,980 | |||||||||
| Total Finland | 778,819 | ||||||||||
See Notes to Financial Statements
14
Morgan Stanley Global Strategist Fund
Portfolio of Investments n January 31, 2012 (unaudited) continued
| NUMBER OF SHARES | VALUE | ||||||||||
| France (1.9%) | |||||||||||
| Aerospace & Defense | |||||||||||
| 1,262 | Thales SA | $ | 43,176 | ||||||||
| Auto Components | |||||||||||
| 1,960 | Cie Generale des Etablissements Michelin, Series B | 134,086 | |||||||||
| Automobiles | |||||||||||
| 1,221 | Peugeot SA | 22,512 | |||||||||
| 1,898 | Renault SA | 80,848 | |||||||||
| 103,360 | |||||||||||
| Beverages | |||||||||||
| 1,960 | Pernod-Ricard SA | 188,156 | |||||||||
| Building Products | |||||||||||
| 2,371 | Cie de St-Gobain | 105,509 | |||||||||
| Chemicals | |||||||||||
| 2,681 | Air Liquide SA | 337,432 | |||||||||
| Commercial Banks | |||||||||||
| 10,548 | BNP Paribas SA | 446,619 | |||||||||
| 8,087 | Credit Agricole SA | 49,834 | |||||||||
| 7,308 | Societe Generale SA | 194,673 | |||||||||
| 691,126 | |||||||||||
| Commercial Services & Supplies | |||||||||||
| 1,823 | Edenred | 44,258 | |||||||||
| Communications Equipment | |||||||||||
| 32,733 | Alcatel-Lucent (a) | 58,187 | |||||||||
| Construction & Engineering | |||||||||||
| 2,699 | Bouygues SA | 83,865 | |||||||||
| 5,057 | Vinci SA | 234,561 | |||||||||
| 318,426 | |||||||||||
| Construction Materials | |||||||||||
| 4,727 | Lafarge SA | 192,574 | |||||||||
| NUMBER OF SHARES | VALUE | ||||||||||
| Diversified Telecommunication Services | |||||||||||
| 20,519 | France Telecom SA | $ | 307,719 | ||||||||
| 16,603 | Vivendi SA | 347,481 | |||||||||
| 655,200 | |||||||||||
| Electric Utilities | |||||||||||
| 3,256 | EDF SA | 75,044 | |||||||||
| Electrical Equipment | |||||||||||
| 4,351 | Alstom SA | 165,845 | |||||||||
| Energy Equipment & Services | |||||||||||
| 1,748 | Cie Generale de Geophysique- Veritas (a) | 48,747 | |||||||||
| 986 | Technip SA | 92,500 | |||||||||
| 141,247 | |||||||||||
| Food & Staples Retailing | |||||||||||
| 5,854 | Carrefour SA | 133,620 | |||||||||
| Food Products | |||||||||||
| 7,049 | Danone | 435,067 | |||||||||
| Health Care Equipment & Supplies | |||||||||||
| 1,615 | Cie Generale d'Optique Essilor International SA | 118,300 | |||||||||
| Hotels, Restaurants & Leisure | |||||||||||
| 1,422 | Accor SA | 43,209 | |||||||||
| 1,292 | Sodexo | 95,890 | |||||||||
| 139,099 | |||||||||||
| Information Technology Services | |||||||||||
| 1,918 | Cap Gemini SA | 70,022 | |||||||||
See Notes to Financial Statements
15
Morgan Stanley Global Strategist Fund
Portfolio of Investments n January 31, 2012 (unaudited) continued
| NUMBER OF SHARES | VALUE | ||||||||||
| Insurance | |||||||||||
| 17,841 | AXA SA | $ | 270,825 | ||||||||
| Machinery | |||||||||||
| 2,554 | Vallourec SA | 172,483 | |||||||||
| Media | |||||||||||
| 799 | Eutelsat Communications SA | 29,656 | |||||||||
| 651 | JCDecaux SA (a) | 16,507 | |||||||||
| 1,047 | Publicis Groupe SA | 52,672 | |||||||||
| 2,416 | SES SA | 57,042 | |||||||||
| 1,176 | Societe Television Francaise 1 | 12,937 | |||||||||
| 168,814 | |||||||||||
| Metals & Mining | |||||||||||
| 12,867 | ArcelorMittal | 258,940 | |||||||||
| Multi-Utilities | |||||||||||
| 12,930 | GDF Suez | 350,946 | |||||||||
| 4,193 | Suez Environnement Co. | 53,673 | |||||||||
| 5,613 | Veolia Environnement SA | 63,788 | |||||||||
| 468,407 | |||||||||||
| Multi-line Retail | |||||||||||
| 1,434 | PPR | 225,652 | |||||||||
| Oil, Gas & Consumable Fuels | |||||||||||
| 22,144 | Total SA | 1,170,349 | |||||||||
| Personal Products | |||||||||||
| 2,543 | L'Oreal SA | 270,467 | |||||||||
| Pharmaceuticals | |||||||||||
| 12,246 | Sanofi | 904,558 | |||||||||
| Professional Services | |||||||||||
| 581 | Bureau Veritas SA | 42,612 | |||||||||
| Real Estate Investment Trusts (REITs) | |||||||||||
| 86 | ICADE REIT | 7,004 | |||||||||
| NUMBER OF SHARES | VALUE | ||||||||||
| 1,708 | Unibail-Rodamco SE REIT | $ | 327,973 | ||||||||
| 334,977 | |||||||||||
| Textiles, Apparel & Luxury Goods | |||||||||||
| 750 | Christian Dior SA | 106,148 | |||||||||
| 2,427 | LVMH Moet Hennessy Louis Vuitton SA | 392,385 | |||||||||
| 498,533 | |||||||||||
| Transportation Infrastructure | |||||||||||
| 480 | Aeroports de Paris (ADP) | 35,443 | |||||||||
| 7,563 | Groupe Eurotunnel SA | 62,315 | |||||||||
| 97,758 | |||||||||||
| Total France | 9,034,109 | ||||||||||
| Germany (1.8%) | |||||||||||
| Air Freight & Logistics | |||||||||||
| 6,209 | Deutsche Post AG (Registered) | 103,145 | |||||||||
| Airlines | |||||||||||
| 4,169 | Deutsche Lufthansa AG (Registered) | 57,614 | |||||||||
| Auto Components | |||||||||||
| 611 | Continental AG (a) | 48,808 | |||||||||
| Automobiles | |||||||||||
| 3,519 | Bayerische Motoren Werke AG | 300,992 | |||||||||
| 7,768 | Daimler AG (Registered) | 429,248 | |||||||||
| 898 | Porsche Automobil Holding SE (Preference) | 55,055 | |||||||||
| 372 | Volkswagen AG | 60,094 | |||||||||
| 1,855 | Volkswagen AG (Preference) | 328,418 | |||||||||
| 1,173,807 | |||||||||||
See Notes to Financial Statements
16
Morgan Stanley Global Strategist Fund
Portfolio of Investments n January 31, 2012 (unaudited) continued
| NUMBER OF SHARES | VALUE | ||||||||||
| Capital Markets | |||||||||||
| 11,735 | Deutsche Bank AG (Registered) | $ | 497,108 | ||||||||
| Chemicals | |||||||||||
| 13,289 | BASF SE | 1,021,754 | |||||||||
| 1,526 | K+S AG (Registered) | 72,767 | |||||||||
| 1,060 | Lanxess AG | 69,042 | |||||||||
| 1,655 | Linde AG | 262,593 | |||||||||
| 1,426,156 | |||||||||||
| Commercial Banks | |||||||||||
| 49,404 | Commerzbank AG (a) | 118,195 | |||||||||
| Diversified Financial Services | |||||||||||
| 1,392 | Deutsche Boerse AG (a) | 81,936 | |||||||||
| Diversified Telecommunication Services | |||||||||||
| 33,454 | Deutsche Telekom AG (Registered) | 376,244 | |||||||||
| Electric Utilities | |||||||||||
| 20,521 | E.ON AG | 438,740 | |||||||||
| Food & Staples Retailing | |||||||||||
| 1,362 | Metro AG | 52,396 | |||||||||
| Food Products | |||||||||||
| 526 | Suedzucker AG | 15,543 | |||||||||
| Health Care Providers & Services | |||||||||||
| 1,940 | Fresenius Medical Care AG & Co. KGaA | 138,427 | |||||||||
| 1,321 | Fresenius SE & Co. KGaA | 133,984 | |||||||||
| 272,411 | |||||||||||
| Hotels, Restaurants & Leisure | |||||||||||
| 1,926 | TUI AG (a) | 14,012 | |||||||||
| NUMBER OF SHARES | VALUE | ||||||||||
| Household Products | |||||||||||
| 1,808 | Henkel AG & Co. KGaA | $ | 93,936 | ||||||||
| 2,044 | Henkel AG & Co. KGaA (Preference) | 126,063 | |||||||||
| 219,999 | |||||||||||
| Industrial Conglomerates | |||||||||||
| 9,791 | Siemens AG (Registered) | 923,905 | |||||||||
| Insurance | |||||||||||
| 5,186 | Allianz SE (Registered) | 570,225 | |||||||||
| 2,202 | Muenchener Rueckversicherungs AG (Registered) | 286,880 | |||||||||
| 857,105 | |||||||||||
| Life Sciences Tools & Services | |||||||||||
| 3,223 | QIAGEN N.V. (a) | 52,593 | |||||||||
| Media | |||||||||||
| 300 | Axel Springer AG | 14,066 | |||||||||
| 474 | Kabel Deutschland Holding AG (a) | 24,714 | |||||||||
| 686 | ProSiebenSat.1 Media AG | 16,098 | |||||||||
| 54,878 | |||||||||||
| Metals & Mining | |||||||||||
| 6,637 | ThyssenKrupp AG | 188,129 | |||||||||
| Multi-Utilities | |||||||||||
| 4,297 | RWE AG | 164,349 | |||||||||
| Personal Products | |||||||||||
| 1,091 | Beiersdorf AG | 65,503 | |||||||||
| Pharmaceuticals | |||||||||||
| 8,620 | Bayer AG (Registered) | 603,684 | |||||||||
| 672 | Merck KGaA | 70,110 | |||||||||
| 673,794 | |||||||||||
See Notes to Financial Statements
17
Morgan Stanley Global Strategist Fund
Portfolio of Investments n January 31, 2012 (unaudited) continued
| NUMBER OF SHARES | VALUE | ||||||||||
| Semiconductors & Semiconductor Equipment | |||||||||||
| 12,761 | Infineon Technologies AG | $ | 116,444 | ||||||||
| Software | |||||||||||
| 11,826 | SAP AG | 714,513 | |||||||||
| Specialty Retail | |||||||||||
| 8,106 | Esprit Holdings Ltd. (d) | 11,957 | |||||||||
| Textiles, Apparel & Luxury Goods | |||||||||||
| 2,170 | Adidas AG | 156,343 | |||||||||
| Transportation Infrastructure | |||||||||||
| 344 | Fraport AG Frankfurt Airport Services Worldwide | 20,600 | |||||||||
| Total Germany | 8,896,227 | ||||||||||
| Greece (0.0%) | |||||||||||
| Commercial Banks | |||||||||||
| 14,355 | National Bank of Greece SA (a) | 52,012 | |||||||||
| Hong Kong (0.4%) | |||||||||||
| Commercial Banks | |||||||||||
| 15,690 | Bank of East Asia Ltd. | 64,032 | |||||||||
| 36,500 | BOC Hong Kong Holdings Ltd. | 96,482 | |||||||||
| 11,500 | Hang Seng Bank Ltd. | 148,434 | |||||||||
| 308,948 | |||||||||||
| Diversified Financial Services | |||||||||||
| 9,972 | Hong Kong Exchanges and Clearing Ltd. | 173,073 | |||||||||
| Electric Utilities | |||||||||||
| 19,000 | CLP Holdings Ltd. | 155,571 | |||||||||
| NUMBER OF SHARES | VALUE | ||||||||||
| 14,500 | Power Assets Holdings Ltd. | $ | 104,609 | ||||||||
| 260,180 | |||||||||||
| Gas Utilities | |||||||||||
| 39,600 | Hong Kong & China Gas Co., Ltd. | 93,954 | |||||||||
| Hotels, Restaurants & Leisure | |||||||||||
| 28,400 | Sands China Ltd. (a) | 96,128 | |||||||||
| Industrial Conglomerates | |||||||||||
| 21,000 | Hutchison Whampoa Ltd. | 199,702 | |||||||||
| Real Estate Investment Trusts (REITs) | |||||||||||
| 19,851 | Link REIT (The) | 72,311 | |||||||||
| Real Estate Management & Development | |||||||||||
| 14,000 | Cheung Kong Holdings Ltd. | 188,464 | |||||||||
| 8,000 | Hang Lung Group Ltd. | 50,804 | |||||||||
| 22,000 | Hang Lung Properties Ltd. | 75,600 | |||||||||
| 11,228 | Henderson Land Development Co., Ltd. | 60,952 | |||||||||
| 7,000 | Kerry Properties Ltd. | 26,852 | |||||||||
| 27,324 | New World Development Co., Ltd. | 29,948 | |||||||||
| 20,534 | Sino Land Co., Ltd. | 34,209 | |||||||||
| 13,328 | Sun Hung Kai Properties Ltd. | 184,574 | |||||||||
| 6,500 | Swire Pacific Ltd. | 72,289 | |||||||||
| 4,550 | Swire Properties Ltd. (a) | 11,464 | |||||||||
| 13,200 | Wharf Holdings Ltd. | 75,061 | |||||||||
See Notes to Financial Statements
18
Morgan Stanley Global Strategist Fund
Portfolio of Investments n January 31, 2012 (unaudited) continued
| NUMBER OF SHARES | VALUE | ||||||||||
| 10,000 | Wheelock & Co., Ltd. | $ | 31,914 | ||||||||
| 842,131 | |||||||||||
| Road & Rail | |||||||||||
| 15,242 | MTR Corp. | 50,805 | |||||||||
| Total Hong Kong | 2,097,232 | ||||||||||
| India (0.2%) | |||||||||||
| Commercial Banks | |||||||||||
| 11,087 | HDFC Bank Ltd. ADR | 344,030 | |||||||||
| 11,047 | ICICI Bank Ltd. ADR | 400,012 | |||||||||
| 744,042 | |||||||||||
| Oil, Gas & Consumable Fuels | |||||||||||
| 16,376 | Cairn Energy PLC (a) | 72,719 | |||||||||
| Total India | 816,761 | ||||||||||
| Indonesia (0.3%) | |||||||||||
| Automobiles | |||||||||||
| 29,000 | Astra International Tbk PT | 254,516 | |||||||||
| Commercial Banks | |||||||||||
| 169,000 | Bank Central Asia Tbk PT | 150,389 | |||||||||
| 46,500 | Bank Danamon Indonesia Tbk PT | 23,405 | |||||||||
| 103,500 | Bank Mandiri Tbk PT | 77,136 | |||||||||
| 70,000 | Bank Negara Indonesia Persero Tbk PT | 28,226 | |||||||||
| 161,000 | Bank Rakyat Indonesia Persero Tbk PT | 122,675 | |||||||||
| 401,831 | |||||||||||
| Construction Materials | |||||||||||
| 20,500 | Indocement Tunggal Prakarsa Tbk PT | 38,651 | |||||||||
| 56,000 | Semen Gresik Persero Tbk PT | 70,390 | |||||||||
| 109,041 | |||||||||||
| NUMBER OF SHARES | VALUE | ||||||||||
| Diversified Telecommunication Services | |||||||||||
| 131,000 | Telekomunikasi Indonesia Tbk PT | $ | 99,817 | ||||||||
| Food Products | |||||||||||
| 69,000 | Indofood Sukses Makmur Tbk PT | 36,841 | |||||||||
| Gas Utilities | |||||||||||
| 159,000 | Perusahaan Gas Negara PT | 59,691 | |||||||||
| Household Products | |||||||||||
| 19,000 | Unilever Indonesia Tbk PT | 41,424 | |||||||||
| Machinery | |||||||||||
| 25,787 | United Tractors Tbk PT | 81,319 | |||||||||
| Oil, Gas & Consumable Fuels | |||||||||||
| 153,800 | Adaro Energy Tbk PT | 31,307 | |||||||||
| 257,500 | Bumi Resources Tbk PT | 73,040 | |||||||||
| 6,000 | Indo Tambangraya Megah Tbk PT | 24,494 | |||||||||
| 12,500 | Tambang Batubara Bukit Asam Tbk PT | 28,017 | |||||||||
| 156,858 | |||||||||||
| Tobacco | |||||||||||
| 9,500 | Gudang Garam Tbk PT | 60,234 | |||||||||
| Total Indonesia | 1,301,572 | ||||||||||
| Italy (0.5%) | |||||||||||
| Aerospace & Defense | |||||||||||
| 4,799 | Finmeccanica SpA | 21,594 | |||||||||
| Automobiles | |||||||||||
| 8,670 | Fiat SpA | 52,009 | |||||||||
See Notes to Financial Statements
19
Morgan Stanley Global Strategist Fund
Portfolio of Investments n January 31, 2012 (unaudited) continued
| NUMBER OF SHARES | VALUE | ||||||||||
| Commercial Banks | |||||||||||
| 120,612 | Intesa Sanpaolo SpA | $ | 230,339 | ||||||||
| 17,827 | UniCredit SpA | 88,378 | |||||||||
| 318,717 | |||||||||||
| Diversified Telecommunication Services | |||||||||||
| 127,093 | Telecom Italia SpA | 106,313 | |||||||||
| 142,349 | Telecom Italia SpA | 144,770 | |||||||||
| 251,083 | |||||||||||
| Electric Utilities | |||||||||||
| 82,927 | Enel SpA | 339,086 | |||||||||
| Energy Equipment & Services | |||||||||||
| 2,576 | Saipem SpA | 120,562 | |||||||||
| Gas Utilities | |||||||||||
| 45,529 | Snam Rete Gas SpA | 205,224 | |||||||||
| Insurance | |||||||||||
| 20,105 | Assicurazioni Generali SpA | 313,739 | |||||||||
| Machinery | |||||||||||
| 5,967 | Fiat Industrial SpA (a) | 58,460 | |||||||||
| Oil, Gas & Consumable Fuels | |||||||||||
| 31,745 | ENI SpA | 701,756 | |||||||||
| Textiles, Apparel & Luxury Goods | |||||||||||
| 1,567 | Luxottica Group SpA | 51,632 | |||||||||
| Transportation Infrastructure | |||||||||||
| 4,173 | Atlantia SpA | 64,956 | |||||||||
| Total Italy | 2,498,818 | ||||||||||
| NUMBER OF SHARES | VALUE | ||||||||||
| Japan (5.0%) | |||||||||||
| Air Freight & Logistics | |||||||||||
| 8,600 | Yamato Holdings Co., Ltd. | $ | 142,280 | ||||||||
| Auto Components | |||||||||||
| 3,700 | Aisin Seiki Co., Ltd. | 116,893 | |||||||||
| 8,600 | Bridgestone Corp. | 196,101 | |||||||||
| 8,100 | Denso Corp. | 240,705 | |||||||||
| 3,600 | Toyota Industries Corp. | 103,248 | |||||||||
| 656,947 | |||||||||||
| Automobiles | |||||||||||
| 19,795 | Honda Motor Co., Ltd. ADR | 674,020 | |||||||||
| 24,000 | Mazda Motor Corp. (a) | 39,675 | |||||||||
| 93,000 | Mitsubishi Motors Corp. (a) | 112,254 | |||||||||
| 31,800 | Nissan Motor Co., Ltd. | 299,976 | |||||||||
| 5,600 | Suzuki Motor Corp. | 127,693 | |||||||||
| 36,500 | Toyota Motor Corp. | 1,345,644 | |||||||||
| 2,599,262 | |||||||||||
| Beverages | |||||||||||
| 4,800 | Asahi Group Holdings Ltd. | 106,114 | |||||||||
| 13,000 | Kirin Holdings Co., Ltd. | 159,302 | |||||||||
| 265,416 | |||||||||||
| Building Products | |||||||||||
| 15,000 | Asahi Glass Co., Ltd. | 122,212 | |||||||||
| 3,500 | Daikin Industries Ltd. | 101,482 | |||||||||
| 5,100 | JS Group Corp. | 105,453 | |||||||||
| 329,147 | |||||||||||
| Capital Markets | |||||||||||
| 31,000 | Daiwa Securities Group, Inc. | 111,441 | |||||||||
See Notes to Financial Statements
20
Morgan Stanley Global Strategist Fund
Portfolio of Investments n January 31, 2012 (unaudited) continued
| NUMBER OF SHARES | VALUE | ||||||||||
| 46,800 | Nomura Holdings, Inc. | $ | 171,309 | ||||||||
| 282,750 | |||||||||||
| Chemicals | |||||||||||
| 25,000 | Asahi Kasei Corp. | 158,095 | |||||||||
| 3,000 | JSR Corp. | 61,322 | |||||||||
| 5,000 | Kuraray Co., Ltd. | 72,619 | |||||||||
| 20,000 | Mitsubishi Chemical Holdings Corp. | 112,306 | |||||||||
| 2,200 | Nitto Denko Corp. | 78,048 | |||||||||
| 4,100 | Shin-Etsu Chemical Co., Ltd. | 213,015 | |||||||||
| 22,000 | Sumitomo Chemical Co., Ltd. | 88,612 | |||||||||
| 25,000 | Toray Industries, Inc. | 187,615 | |||||||||
| 971,632 | |||||||||||
| Commercial Banks | |||||||||||
| 22,000 | Bank of Yokohama Ltd. (The) | 101,889 | |||||||||
| 14,000 | Chiba Bank Ltd. (The) | 86,697 | |||||||||
| 184,800 | Mizuho Financial Group, Inc. | 278,825 | |||||||||
| 7,600 | Resona Holdings, Inc. | 33,802 | |||||||||
| 12,000 | Shizuoka Bank Ltd. (The) | 123,117 | |||||||||
| 17,300 | Sumitomo Mitsui Financial Group, Inc. | 550,413 | |||||||||
| 37,000 | Sumitomo Mitsui Trust Holdings, Inc. | 115,534 | |||||||||
| 1,290,277 | |||||||||||
| Commercial Services & Supplies | |||||||||||
| 11,000 | Dai Nippon Printing Co., Ltd. | 118,341 | |||||||||
| 2,800 | Secom Co., Ltd. | 130,963 | |||||||||
| 11,000 | Toppan Printing Co., Ltd. | 88,035 | |||||||||
| 337,339 | |||||||||||
| NUMBER OF SHARES | VALUE | ||||||||||
| Computers & Peripherals | |||||||||||
| 25,000 | Fujitsu Ltd. | $ | 133,495 | ||||||||
| 55,000 | Toshiba Corp. | 233,075 | |||||||||
| 366,570 | |||||||||||
| Construction & Engineering | |||||||||||
| 3,000 | JGC Corp. | 82,616 | |||||||||
| Diversified Financial Services | |||||||||||
| 1,380 | ORIX Corp. | 129,092 | |||||||||
| Diversified Telecommunication Services | |||||||||||
| 7,600 | Nippon Telegraph & Telephone Corp. | 379,900 | |||||||||
| Electric Utilities | |||||||||||
| 7,400 | Chubu Electric Power Co., Inc. | 136,117 | |||||||||
| 3,700 | Chugoku Electric Power Co., Inc. (The) | 67,670 | |||||||||
| 4,200 | Hokkaido Electric Power Co., Inc. | 59,843 | |||||||||
| 3,900 | Hokuriku Electric Power Co. | 75,677 | |||||||||
| 6,200 | Kansai Electric Power Co., Inc. (The) | 99,808 | |||||||||
| 3,900 | Kyushu Electric Power Co., Inc. | 56,029 | |||||||||
| 5,500 | Shikoku Electric Power Co., Inc. | 159,400 | |||||||||
| 6,600 | Tohoku Electric Power Co., Inc. | 62,259 | |||||||||
| 13,700 | Tokyo Electric Power Co., Inc. (The) (a) | 37,566 | |||||||||
| 754,369 | |||||||||||
See Notes to Financial Statements
21
Morgan Stanley Global Strategist Fund
Portfolio of Investments n January 31, 2012 (unaudited) continued
| NUMBER OF SHARES | VALUE | ||||||||||
| Electrical Equipment | |||||||||||
| 26,000 | Mitsubishi Electric Corp. | $ | 233,325 | ||||||||
| 1,400 | Nidec Corp. | 134,085 | |||||||||
| 22,700 | Sumitomo Electric Industries Ltd. | 273,401 | |||||||||
| 640,811 | |||||||||||
| Electronic Equipment, Instruments & Components | |||||||||||
| 7,400 | FUJIFILM Holdings Corp. | 175,437 | |||||||||
| 63,000 | Hitachi Ltd. | 352,112 | |||||||||
| 5,000 | Hoya Corp. | 106,009 | |||||||||
| 2,000 | Ibiden Co., Ltd. | 40,803 | |||||||||
| 600 | Keyence Corp. | 149,488 | |||||||||
| 2,000 | Kyocera Corp. | 170,559 | |||||||||
| 2,800 | Murata Manufacturing Co., Ltd. | 160,352 | |||||||||
| 6,000 | Nippon Electric Glass Co., Ltd. | 52,270 | |||||||||
| 2,800 | Omron Corp. | 56,463 | |||||||||
| 1,400 | TDK Corp. | 66,767 | |||||||||
| 1,330,260 | |||||||||||
| Food & Staples Retailing | |||||||||||
| 11,100 | Aeon Co., Ltd. | 146,359 | |||||||||
| 10,800 | Seven & I Holdings Co., Ltd. | 304,078 | |||||||||
| 450,437 | |||||||||||
| Food Products | |||||||||||
| 15,000 | Ajinomoto Co., Inc. | 181,055 | |||||||||
| Gas Utilities | |||||||||||
| 38,000 | Osaka Gas Co., Ltd. | 152,559 | |||||||||
| 34,000 | Tokyo Gas Co., Ltd. | 157,019 | |||||||||
| 309,578 | |||||||||||
| NUMBER OF SHARES | VALUE | ||||||||||
| Health Care Equipment & Supplies | |||||||||||
| 3,500 | Olympus Corp. | $ | 59,007 | ||||||||
| 2,900 | Terumo Corp. | 139,064 | |||||||||
| 198,071 | |||||||||||
| Household Durables | |||||||||||
| 24,200 | Panasonic Corp. | 195,899 | |||||||||
| 12,000 | Sekisui House Ltd. | 112,726 | |||||||||
| 15,000 | Sharp Corp. | 129,100 | |||||||||
| 13,035 | Sony Corp. ADR | 237,498 | |||||||||
| 675,223 | |||||||||||
| Household Products | |||||||||||
| 2,400 | Unicharm Corp. | 126,109 | |||||||||
| Independent Power Producers & Energy Traders | |||||||||||
| 2,700 | Electric Power Development Co. Ltd. | 71,698 | |||||||||
| Industrial Conglomerates | |||||||||||
| 31,000 | Hankyu Hanshin Holdings, Inc. | 139,097 | |||||||||
| Information Technology Services | |||||||||||
| 30 | NTT Data Corp. | 98,321 | |||||||||
| Insurance | |||||||||||
| 5,000 | MS&AD Insurance Group Holdings | 102,532 | |||||||||
| 8,400 | T&D Holdings, Inc. | 85,410 | |||||||||
| 6,200 | Tokio Marine Holdings, Inc. | 155,285 | |||||||||
| 343,227 | |||||||||||
| Internet & Catalog Retail | |||||||||||
| 133 | Rakuten, Inc. | 134,187 | |||||||||
See Notes to Financial Statements
22
Morgan Stanley Global Strategist Fund
Portfolio of Investments n January 31, 2012 (unaudited) continued
| NUMBER OF SHARES | VALUE | ||||||||||
| Internet Software & Services | |||||||||||
| 276 | Yahoo! Japan Corp. | $ | 84,299 | ||||||||
| Leisure Equipment & Products | |||||||||||
| 4,600 | Nikon Corp. | 112,616 | |||||||||
| Machinery | |||||||||||
| 2,400 | FANUC Corp. | 403,359 | |||||||||
| 5,000 | Japan Steel Works Ltd. (The) | 40,409 | |||||||||
| 38,000 | Kawasaki Heavy Industries Ltd. | 111,677 | |||||||||
| 13,000 | Komatsu Ltd. | 366,531 | |||||||||
| 17,000 | Kubota Corp. | 153,450 | |||||||||
| 1,600 | Makita Corp. | 60,394 | |||||||||
| 47,000 | Mitsubishi Heavy Industries Ltd. | 215,206 | |||||||||
| 5,000 | NGK Insulators Ltd. | 64,156 | |||||||||
| 10,000 | NSK Ltd. | 74,390 | |||||||||
| 800 | SMC Corp. | 138,861 | |||||||||
| 1,628,433 | |||||||||||
| Marine | |||||||||||
| 18,000 | Mitsui OSK Lines Ltd. | 68,013 | |||||||||
| 34,000 | Nippon Yusen KK | 86,093 | |||||||||
| 154,106 | |||||||||||
| Media | |||||||||||
| 3,200 | Dentsu, Inc. | 106,933 | |||||||||
| Metals & Mining | |||||||||||
| 5,800 | JFE Holdings, Inc. | 103,490 | |||||||||
| 70,000 | Kobe Steel Ltd. | 114,799 | |||||||||
| 71,000 | Nippon Steel Corp. | 174,193 | |||||||||
| 49,000 | Sumitomo Metal Industries Ltd. | 87,431 | |||||||||
| 8,000 | Sumitomo Metal Mining Co., Ltd. | 115,351 | |||||||||
| 595,264 | |||||||||||
| NUMBER OF SHARES | VALUE | ||||||||||
| Multi-line Retail | |||||||||||
| 5,400 | Isetan Mitsukoshi Holdings Ltd. | $ | 60,858 | ||||||||
| Office Electronics | |||||||||||
| 13,800 | Canon, Inc. | 595,670 | |||||||||
| 5,000 | Konica Minolta Holdings, Inc. | 36,408 | |||||||||
| 11,000 | Ricoh Co., Ltd. | 92,797 | |||||||||
| 724,875 | |||||||||||
| Oil, Gas & Consumable Fuels | |||||||||||
| 12 | Inpex Corp. | 81,868 | |||||||||
| Paper & Forest Products | |||||||||||
| 13,000 | OJI Paper Co., Ltd. | 66,859 | |||||||||
| Personal Products | |||||||||||
| 7,700 | Kao Corp. | 202,653 | |||||||||
| 6,500 | Shiseido Co., Ltd. | 119,306 | |||||||||
| 321,959 | |||||||||||
| Pharmaceuticals | |||||||||||
| 4,900 | Astellas Pharma, Inc. | 201,220 | |||||||||
| 4,900 | Chugai Pharmaceutical Co., Ltd. | 77,852 | |||||||||
| 9,300 | Daiichi Sankyo Co., Ltd. | 177,044 | |||||||||
| 3,800 | Eisai Co., Ltd. | 157,295 | |||||||||
| 1,500 | Ono Pharmaceutical Co., Ltd. | 84,624 | |||||||||
| 6,400 | Shionogi & Co., Ltd. | 85,395 | |||||||||
| 9,700 | Takeda Pharmaceutical Co., Ltd. | 421,241 | |||||||||
| 1,204,671 | |||||||||||
| Real Estate Investment Trusts (REITs) | |||||||||||
| 8 | Japan Real Estate Investment Corp. REIT | 70,008 | |||||||||
See Notes to Financial Statements
23
Morgan Stanley Global Strategist Fund
Portfolio of Investments n January 31, 2012 (unaudited) continued
| NUMBER OF SHARES | VALUE | ||||||||||
| 8 | Nippon Building Fund, Inc. REIT | $ | 71,792 | ||||||||
| 141,800 | |||||||||||
| Real Estate Management & Development | |||||||||||
| 1,400 | Daito Trust Construction Co., Ltd. | 131,881 | |||||||||
| 11,000 | Daiwa House Industry Co., Ltd. | 138,979 | |||||||||
| 16,000 | Mitsubishi Estate Co., Ltd. | 255,471 | |||||||||
| 12,000 | Mitsui Fudosan Co., Ltd. | 197,271 | |||||||||
| 7,000 | Sumitomo Realty & Development Co., Ltd. | 132,984 | |||||||||
| 856,586 | |||||||||||
| Road & Rail | |||||||||||
| 22 | Central Japan Railway Co. | 189,058 | |||||||||
| 4,600 | East Japan Railway Co. | 297,835 | |||||||||
| 10,000 | Keikyu Corp. | 91,577 | |||||||||
| 10,000 | Keio Corp. | 73,734 | |||||||||
| 39,000 | Kintetsu Corp. | 157,085 | |||||||||
| 22,000 | Nippon Express Co., Ltd. | 88,035 | |||||||||
| 16,000 | Odakyu Electric Railway Co., Ltd. | 158,908 | |||||||||
| 33,000 | Tobu Railway Co., Ltd. | 172,750 | |||||||||
| 18,000 | Tokyu Corp. | 88,559 | |||||||||
| 2,800 | West Japan Railway Co. | 118,657 | |||||||||
| 1,436,198 | |||||||||||
| NUMBER OF SHARES | VALUE | ||||||||||
| Semiconductors & Semiconductor Equipment | |||||||||||
| 2,300 | Advantest Corp. | $ | 26,404 | ||||||||
| 1,200 | Rohm Co., Ltd. | 59,512 | |||||||||
| 2,000 | Tokyo Electron Ltd. | 113,881 | |||||||||
| 199,797 | |||||||||||
| Software | |||||||||||
| 1,300 | Nintendo Co., Ltd. | 176,358 | |||||||||
| 1,800 | Trend Micro, Inc. | 57,197 | |||||||||
| 233,555 | |||||||||||
| Specialty Retail | |||||||||||
| 600 | Fast Retailing Co., Ltd. | 119,260 | |||||||||
| 1,370 | Yamada Denki Co., Ltd. | 87,355 | |||||||||
| 206,615 | |||||||||||
| Tobacco | |||||||||||
| 78 | Japan Tobacco, Inc. | 383,758 | |||||||||
| Trading Companies & Distributors | |||||||||||
| 21,000 | ITOCHU Corp. | 228,405 | |||||||||
| 29,000 | Marubeni Corp. | 200,131 | |||||||||
| 16,900 | Mitsubishi Corp. | 385,583 | |||||||||
| 25,900 | Mitsui & Co., Ltd. | 439,709 | |||||||||
| 15,300 | Sumitomo Corp. | 219,804 | |||||||||
| 1,473,632 | |||||||||||
| Wireless Telecommunication Services | |||||||||||
| 51 | KDDI Corp. | 323,183 | |||||||||
| 193 | NTT DoCoMo, Inc. | 342,852 | |||||||||
| 9,700 | Softbank Corp. | 270,180 | |||||||||
| 936,215 | |||||||||||
| Total Japan | 24,296,568 | ||||||||||
See Notes to Financial Statements
24
Morgan Stanley Global Strategist Fund
Portfolio of Investments n January 31, 2012 (unaudited) continued
| NUMBER OF SHARES | VALUE | ||||||||||
| Kazakhstan (0.0%) | |||||||||||
| Metals & Mining | |||||||||||
| 2,888 | Kazakhmys PLC | $ | 51,698 | ||||||||
| Netherlands (0.5%) | |||||||||||
| Air Freight & Logistics | |||||||||||
| 4,151 | PostNL N.V. | 16,669 | |||||||||
| 4,151 | TNT Express N.V. | 34,739 | |||||||||
| 51,408 | |||||||||||
| Beverages | |||||||||||
| 3,715 | Heineken N.V. | 171,634 | |||||||||
| Chemicals | |||||||||||
| 4,370 | Akzo Nobel N.V. | 227,332 | |||||||||
| 3,367 | Koninklijke DSM N.V. | 172,755 | |||||||||
| 400,087 | |||||||||||
| Diversified Financial Services | |||||||||||
| 48,287 | ING Groep N.V. CVA (a) | 439,480 | |||||||||
| Diversified Telecommunication Services | |||||||||||
| 6,177 | Koninklijke KPN N.V. | 67,709 | |||||||||
| Energy Equipment & Services | |||||||||||
| 657 | Fugro N.V. CVA | 43,184 | |||||||||
| Food & Staples Retailing | |||||||||||
| 12,173 | Koninklijke Ahold N.V. | 161,299 | |||||||||
| Food Products | |||||||||||
| 15,199 | Unilever N.V. CVA | 505,973 | |||||||||
| Industrial Conglomerates | |||||||||||
| 12,069 | Koninklijke Philips Electronics N.V. | 243,907 | |||||||||
| NUMBER OF SHARES | VALUE | ||||||||||
| Professional Services | |||||||||||
| 1,207 | Randstad Holding N.V. | $ | 41,160 | ||||||||
| Semiconductors & Semiconductor Equipment | |||||||||||
| 3,267 | ASML Holding N.V. | 140,317 | |||||||||
| Transportation Infrastructure | |||||||||||
| 1,006 | Koninklijke Vopak N.V. | 54,662 | |||||||||
| Total Netherlands | 2,320,820 | ||||||||||
| Norway (0.2%) | |||||||||||
| Chemicals | |||||||||||
| 1,863 | Yara International ASA | 74,971 | |||||||||
| Commercial Banks | |||||||||||
| 11,497 | DnB NOR ASA | 121,300 | |||||||||
| Diversified Telecommunication Services | |||||||||||
| 16,466 | Telenor ASA | 268,446 | |||||||||
| Energy Equipment & Services | |||||||||||
| 1,677 | Aker Solutions ASA | 20,566 | |||||||||
| 1,677 | Kvaerner ASA (a) | 3,716 | |||||||||
| 2,860 | Subsea 7 SA (a) | 57,912 | |||||||||
| 82,194 | |||||||||||
| Industrial Conglomerates | |||||||||||
| 9,524 | Orkla ASA | 77,189 | |||||||||
| Metals & Mining | |||||||||||
| 12,763 | Norsk Hydro ASA | 67,437 | |||||||||
| Oil, Gas & Consumable Fuels | |||||||||||
| 12,789 | Statoil ASA | 320,651 | |||||||||
See Notes to Financial Statements
25
Morgan Stanley Global Strategist Fund
Portfolio of Investments n January 31, 2012 (unaudited) continued
| NUMBER OF SHARES | VALUE | ||||||||||
| Semiconductors & Semiconductor Equipment | |||||||||||
| 6,482 | Renewable Energy Corp. ASA (a) | $ | 4,821 | ||||||||
| Total Norway | 1,017,009 | ||||||||||
| Peru (0.0%) | |||||||||||
| Metals & Mining | |||||||||||
| 2,843 | Cia de Minas Buenaventura SA ADR | 121,965 | |||||||||
| Poland (0.0%) | |||||||||||
| Food & Staples Retailing | |||||||||||
| 3,072 | Jeronimo Martins SGPS SA (a) | 51,294 | |||||||||
| Portugal (0.0%) | |||||||||||
| Diversified Telecommunication Services | |||||||||||
| 11,841 | Portugal Telecom SGPS SA (Registered) | 58,857 | |||||||||
| Oil, Gas & Consumable Fuels | |||||||||||
| 2,866 | Galp Energia SGPS SA, Class B | 46,242 | |||||||||
| Total Portugal | 105,099 | ||||||||||
| Russia (0.7%) | |||||||||||
| Commercial Banks | |||||||||||
| 30,225 | Sberbank of Russia ADR (a) | 358,234 | |||||||||
| 20,706 | VTB Bank OJSC GDR | 96,862 | |||||||||
| 455,096 | |||||||||||
| NUMBER OF SHARES | VALUE | ||||||||||
| Electric Utilities | |||||||||||
| 24,753 | Federal Hydrogenerating Co. JSC ADR | $ | 96,042 | ||||||||
| Food & Staples Retailing | |||||||||||
| 5,653 | Magnit OJSC GDR | 145,226 | |||||||||
| Metals & Mining | |||||||||||
| 14,442 | MMC Norilsk Nickel OJSC ADR | 277,431 | |||||||||
| Oil, Gas & Consumable Fuels | |||||||||||
| 81,336 | Gazprom OAO ADR | 984,166 | |||||||||
| 7,367 | Lukoil OAO ADR | 431,338 | |||||||||
| 1,263 | NovaTek OAO GDR | 170,126 | |||||||||
| 29,988 | Rosneft Oil Co. GDR | 221,011 | |||||||||
| 15,000 | Surgutneftegas OJSC ADR | 139,350 | |||||||||
| 5,085 | Tatneft ADR | 177,263 | |||||||||
| 2,123,254 | |||||||||||
| Wireless Telecommunication Services | |||||||||||
| 9,100 | Mobile Telesystems OJSC ADR | 152,516 | |||||||||
| Total Russia | 3,249,565 | ||||||||||
| South Africa (0.1%) | |||||||||||
| Beverages | |||||||||||
| 9,819 | SABMiller PLC | 372,585 | |||||||||
| Metals & Mining | |||||||||||
| 3,064 | AngloGold Ashanti Ltd. ADR | 140,331 | |||||||||
| 6,936 | Gold Fields Ltd. ADR | 113,958 | |||||||||
| 4,943 | Harmony Gold Mining Co., Ltd. ADR | 59,613 | |||||||||
| 313,902 | |||||||||||
| Total South Africa | 686,487 | ||||||||||
See Notes to Financial Statements
26
Morgan Stanley Global Strategist Fund
Portfolio of Investments n January 31, 2012 (unaudited) continued
| NUMBER OF SHARES | VALUE | ||||||||||
| Spain (0.4%) | |||||||||||
| Airlines | |||||||||||
| 13,928 | International Consolidated Airlines Group SA (a) | $ | 38,805 | ||||||||
| Commercial Banks | |||||||||||
| 45,352 | Banco Bilbao Vizcaya Argentaria SA | 395,920 | |||||||||
| 15,764 | Banco Popular Espanol SA | 67,840 | |||||||||
| 90,268 | Banco Santander SA | 702,546 | |||||||||
| 11,821 | CaixaBank | 59,407 | |||||||||
| 1,225,713 | |||||||||||
| Construction & Engineering | |||||||||||
| 3,511 | ACS Actividades de Construccion y Servicios SA | 108,292 | |||||||||
| Electric Utilities | |||||||||||
| 40,863 | Iberdrola SA | 240,635 | |||||||||
| 1,327 | Red Electrica Corp. SA | 61,039 | |||||||||
| 301,674 | |||||||||||
| Food & Staples Retailing | |||||||||||
| 6,563 | Distribuidora Internacional de Alimentacion SA (a) | 30,313 | |||||||||
| Oil, Gas & Consumable Fuels | |||||||||||
| 3,053 | Repsol YPF SA | 83,863 | |||||||||
| Specialty Retail | |||||||||||
| 2,368 | Inditex SA | 206,601 | |||||||||
| NUMBER OF SHARES | VALUE | ||||||||||
| Transportation Infrastructure | |||||||||||
| 4,000 | Abertis Infraestructuras SA | $ | 67,391 | ||||||||
| Total Spain | 2,062,652 | ||||||||||
| Sweden (0.7%) | |||||||||||
| Building Products | |||||||||||
| 3,465 | Assa Abloy AB, Class B | 94,030 | |||||||||
| Commercial Banks | |||||||||||
| 27,526 | Nordea Bank AB | 230,445 | |||||||||
| 14,986 | Skandinaviska Enskilda Banken AB | 94,223 | |||||||||
| 5,789 | Svenska Handelsbanken AB, Class A | 173,606 | |||||||||
| 4,898 | Swedbank AB, Class A | 70,347 | |||||||||
| 568,621 | |||||||||||
| Communications Equipment | |||||||||||
| 27,294 | Telefonaktiebolaget LM Ericsson, Class B | 253,781 | |||||||||
| Construction & Engineering | |||||||||||
| 3,281 | Skanska AB, Class B | 57,300 | |||||||||
| Diversified Financial Services | |||||||||||
| 12,458 | Investor AB, Class B | 252,182 | |||||||||
| Diversified Telecommunication Services | |||||||||||
| 33,207 | TeliaSonera AB | 220,892 | |||||||||
| Household Durables | |||||||||||
| 2,950 | Electrolux AB | 54,035 | |||||||||
See Notes to Financial Statements
27
Morgan Stanley Global Strategist Fund
Portfolio of Investments n January 31, 2012 (unaudited) continued
| NUMBER OF SHARES | VALUE | ||||||||||
| 5,449 | Husqvarna AB, Class B | $ | 28,781 | ||||||||
| 82,816 | |||||||||||
| Machinery | |||||||||||
| 10,488 | Atlas Copco AB, Class A | 249,307 | |||||||||
| 7,581 | Atlas Copco AB, Class B | 160,257 | |||||||||
| 16,163 | Sandvik AB | 238,792 | |||||||||
| 5,471 | Scania AB, Class B | 94,259 | |||||||||
| 6,655 | SK | F | AB, Class B | 157,020 | |||||||
| 8,741 | Volvo AB, Class B | 113,013 | |||||||||
| 1,012,648 | |||||||||||
| Media | |||||||||||
| 443 | Modern Times Group AB, Class B | 22,174 | |||||||||
| Paper & Forest Products | |||||||||||
| 9,071 | Svenska Cellulosa AB, Class B | 151,483 | |||||||||
| Specialty Retail | |||||||||||
| 10,949 | Hennes & Mauritz AB, Class B | 358,448 | |||||||||
| Tobacco | |||||||||||
| 4,439 | Swedish Match AB | 154,590 | |||||||||
| Wireless Telecommunication Services | |||||||||||
| 1,401 | Millicom International Cellular SA SDR | 138,504 | |||||||||
| Total Sweden | 3,367,469 | ||||||||||
| Switzerland (1.6%) | |||||||||||
| Biotechnology | |||||||||||
| 971 | Actelion Ltd. (Registered) (a) | 37,184 | |||||||||
| NUMBER OF SHARES | VALUE | ||||||||||
| Building Products | |||||||||||
| 814 | Geberit AG (Registered) (a) | $ | 168,106 | ||||||||
| Capital Markets | |||||||||||
| 14,383 | Credit Suisse Group AG (Registered) (a) | 373,130 | |||||||||
| 2,123 | Julius Baer Group Ltd. (a) | 86,257 | |||||||||
| 25,821 | UBS AG (Registered) (a) | 351,480 | |||||||||
| 810,867 | |||||||||||
| Chemicals | |||||||||||
| 82 | Givaudan SA (Registered) (a) | 76,566 | |||||||||
| 791 | Syngenta AG (Registered) (a) | 239,234 | |||||||||
| 315,800 | |||||||||||
| Diversified Telecommunication Services | |||||||||||
| 691 | Swisscom AG (Registered) | 272,722 | |||||||||
| Electrical Equipment | |||||||||||
| 34,134 | ABB Ltd. (Registered) (a) | 712,716 | |||||||||
| Energy Equipment & Services | |||||||||||
| 2,790 | Transocean Ltd. | 132,271 | |||||||||
| Food Products | |||||||||||
| 33,962 | Nestle SA (Registered) | 1,946,220 | |||||||||
| Health Care Equipment & Supplies | |||||||||||
| 880 | Sonova Holding AG (Registered) (a) | 89,912 | |||||||||
| 633 | Synthes, Inc. (e) | 107,827 | |||||||||
| 197,739 | |||||||||||
See Notes to Financial Statements
28
Morgan Stanley Global Strategist Fund
Portfolio of Investments n January 31, 2012 (unaudited) continued
| NUMBER OF SHARES | VALUE | ||||||||||
| Insurance | |||||||||||
| 836 | Swiss Re AG (a) | $ | 45,346 | ||||||||
| 2,309 | Zurich Financial Services AG (a) | 554,361 | |||||||||
| 599,707 | |||||||||||
| Life Sciences Tools & Services | |||||||||||
| 481 | Lonza Group AG (Registered) (a) | 25,965 | |||||||||
| Marine | |||||||||||
| 673 | Kuehne & Nagel International AG (Registered) | 84,591 | |||||||||
| Pharmaceuticals | |||||||||||
| 20,737 | Novartis AG (Registered) | 1,121,893 | |||||||||
| 5,581 | Roche Holding AG (Genusschein) | 944,617 | |||||||||
| 2,066,510 | |||||||||||
| Professional Services | |||||||||||
| 1,264 | Adecco SA (Registered) (a) | 59,912 | |||||||||
| 52 | SGS SA (Registered) | 93,323 | |||||||||
| 153,235 | |||||||||||
| Textiles, Apparel & Luxury Goods | |||||||||||
| 4,550 | Cie Financiere Richemont SA | 257,528 | |||||||||
| 300 | Swatch Group AG (The) | 126,388 | |||||||||
| 383,916 | |||||||||||
| Total Switzerland | 7,907,549 | ||||||||||
| United Kingdom (4.6%) | |||||||||||
| Aerospace & Defense | |||||||||||
| 50,134 | BAE Systems PLC | 243,166 | |||||||||
| NUMBER OF SHARES | VALUE | ||||||||||
| 34,001 | Rolls-Royce Holdings PLC (a) | $ | 394,072 | ||||||||
| 637,238 | |||||||||||
| Beverages | |||||||||||
| 24,100 | Diageo PLC | 532,435 | |||||||||
| Capital Markets | |||||||||||
| 17,668 | 3 | i Group PLC | 51,395 | ||||||||
| 9,538 | Investec PLC | 56,468 | |||||||||
| 15,236 | Man Group PLC | 27,778 | |||||||||
| 135,641 | |||||||||||
| Chemicals | |||||||||||
| 2,447 | Johnson Matthey PLC | 79,086 | |||||||||
| Commercial Banks | |||||||||||
| 126,770 | Barclays PLC | 424,599 | |||||||||
| 154,689 | HSBC Holdings PLC | 1,291,192 | |||||||||
| 378,183 | Lloyds Banking Group PLC (a) | 182,477 | |||||||||
| 206,210 | Royal Bank of Scotland Group PLC (a) | 86,500 | |||||||||
| 20,828 | Standard Chartered PLC | 503,471 | |||||||||
| 2,488,239 | |||||||||||
| Commercial Services & Supplies | |||||||||||
| 2,555 | Aggreko PLC | 84,348 | |||||||||
| 4,000 | Babcock International Group PLC | 45,982 | |||||||||
| 14,808 | G4S PLC | 62,886 | |||||||||
| 5,878 | Serco Group PLC | 47,054 | |||||||||
| 240,270 | |||||||||||
| Diversified Telecommunication Services | |||||||||||
| 97,290 | BT Group PLC | 311,985 | |||||||||
| 4,106 | Inmarsat PLC | 25,907 | |||||||||
| 337,892 | |||||||||||
See Notes to Financial Statements
29
Morgan Stanley Global Strategist Fund
Portfolio of Investments n January 31, 2012 (unaudited) continued
| NUMBER OF SHARES | VALUE | ||||||||||
| Electric Utilities | |||||||||||
| 17,803 | SSE PLC | $ | 343,100 | ||||||||
| Energy Equipment & Services | |||||||||||
| 3,969 | AMEC PLC | 62,794 | |||||||||
| 3,181 | Petrofac Ltd. | 72,933 | |||||||||
| 135,727 | |||||||||||
| Food & Staples Retailing | |||||||||||
| 76,742 | Tesco PLC | 386,493 | |||||||||
| 20,218 | WM Morrison Supermarkets PLC | 91,118 | |||||||||
| 477,611 | |||||||||||
| Food Products | |||||||||||
| 1,859 | Associated British Foods PLC | 33,776 | |||||||||
| 12,866 | Unilever PLC | 414,811 | |||||||||
| 448,587 | |||||||||||
| Health Care Equipment & Supplies | |||||||||||
| 10,831 | Smith & Nephew PLC | 104,965 | |||||||||
| Hotels, Restaurants & Leisure | |||||||||||
| 18,884 | Compass Group PLC | 175,271 | |||||||||
| 15,728 | TUI Travel PLC | 47,412 | |||||||||
| 222,683 | |||||||||||
| Household Products | |||||||||||
| 6,704 | Reckitt Benckiser Group PLC | 356,646 | |||||||||
| Industrial Conglomerates | |||||||||||
| 6,582 | Smiths Group PLC | 99,570 | |||||||||
| Insurance | |||||||||||
| 3,778 | Admiral Group PLC | 56,021 | |||||||||
| 33,991 | Aviva PLC | 187,150 | |||||||||
| 68,276 | Legal & General Group PLC | 124,158 | |||||||||
| NUMBER OF SHARES | VALUE | ||||||||||
| 92,926 | Old Mutual PLC | $ | 213,792 | ||||||||
| 30,382 | Prudential PLC | 335,371 | |||||||||
| 84,310 | RSA Insurance Group PLC | 140,827 | |||||||||
| 18,540 | Standard Life PLC | 63,631 | |||||||||
| 1,120,950 | |||||||||||
| Media | |||||||||||
| 8,709 | British Sky Broadcasting Group PLC | 94,693 | |||||||||
| 32,244 | ITV PLC | 38,057 | |||||||||
| 12,346 | Pearson PLC | 228,205 | |||||||||
| 3,587 | Reed Elsevier PLC | 29,675 | |||||||||
| 28,419 | WPP PLC | 333,855 | |||||||||
| 724,485 | |||||||||||
| Metals & Mining | |||||||||||
| 11,920 | Anglo American PLC | 492,880 | |||||||||
| 20,282 | BHP Billiton PLC | 678,519 | |||||||||
| 1,989 | Lonmin PLC | 32,346 | |||||||||
| 976 | Randgold Resources Ltd. | 110,196 | |||||||||
| 13,195 | Rio Tinto PLC | 791,162 | |||||||||
| 1,623 | Vedanta Resources PLC | 30,563 | |||||||||
| 19,195 | Xstrata PLC | 325,009 | |||||||||
| 2,460,675 | |||||||||||
| Multi-Utilities | |||||||||||
| 51,376 | Centrica PLC | 237,532 | |||||||||
| 32,023 | National Grid PLC | 318,919 | |||||||||
| 556,451 | |||||||||||
| Multi-line Retail | |||||||||||
| 10,082 | Marks & Spencer Group PLC | 51,920 | |||||||||
| 2,073 | Next PLC | 85,553 | |||||||||
| 137,473 | |||||||||||
See Notes to Financial Statements
30
Morgan Stanley Global Strategist Fund
Portfolio of Investments n January 31, 2012 (unaudited) continued
| NUMBER OF SHARES | VALUE | ||||||||||
| Oil, Gas & Consumable Fuels | |||||||||||
| 31,796 | BG Group PLC | $ | 713,984 | ||||||||
| 185,959 | BP | PL | C | 1,379,752 | |||||||
| 35,351 | Royal Dutch Shell PLC, Class A | 1,248,096 | |||||||||
| 26,772 | Royal Dutch Shell PLC, Class B | 973,895 | |||||||||
| 8,594 | Tullow Oil PLC | 188,240 | |||||||||
| 4,503,967 | |||||||||||
| Pharmaceuticals | |||||||||||
| 16,103 | AstraZeneca PLC | 775,083 | |||||||||
| 58,487 | GlaxoSmithKline PLC | 1,299,511 | |||||||||
| 5,377 | Shire PLC | 178,443 | |||||||||
| 2,253,037 | |||||||||||
| Professional Services | |||||||||||
| 6,586 | Capita Group PLC (The) | 63,826 | |||||||||
| 10,516 | Experian PLC | 142,429 | |||||||||
| 1,847 | Intertek Group PLC | 61,470 | |||||||||
| 267,725 | |||||||||||
| Real Estate Investment Trusts (REITs) | |||||||||||
| 13,703 | British Land Co., PLC REIT | 105,504 | |||||||||
| 13,142 | Land Securities Group PLC REIT | 139,684 | |||||||||
| 245,188 | |||||||||||
| Semiconductors & Semiconductor Equipment | |||||||||||
| 15,586 | ARM Holdings PLC | 149,696 | |||||||||
| Textiles, Apparel & Luxury Goods | |||||||||||
| 4,434 | Burberry Group PLC | 93,767 | |||||||||
| NUMBER OF SHARES | VALUE | ||||||||||
| Tobacco | |||||||||||
| 19,308 | British American Tobacco PLC | $ | 887,513 | ||||||||
| 10,310 | Imperial Tobacco Group PLC | 368,796 | |||||||||
| 1,256,309 | |||||||||||
| Trading Companies & Distributors | |||||||||||
| 3,683 | Wolseley PLC | 127,507 | |||||||||
| Wireless Telecommunication Services | |||||||||||
| 607,663 | Vodafone Group PLC | 1,635,505 | |||||||||
| Total United Kingdom | 22,172,425 | ||||||||||
| United States (26.2%) | |||||||||||
| Aerospace & Defense | |||||||||||
| 7,597 | Alliant Techsystems, Inc. | 451,338 | |||||||||
| 3,700 | Boeing Co. (The) | 274,466 | |||||||||
| 663 | General Dynamics Corp. | 45,853 | |||||||||
| 942 | Goodrich Corp. | 117,515 | |||||||||
| 4,454 | Honeywell International, Inc. | 258,510 | |||||||||
| 663 | Lockheed Martin Corp. | 54,578 | |||||||||
| 663 | Northrop Grumman Corp. | 38,487 | |||||||||
| 997 | Precision Castparts Corp. | 163,189 | |||||||||
| 22,091 | Raytheon Co. | 1,060,147 | |||||||||
| 796 | Rockwell Collins, Inc. | 46,081 | |||||||||
| 1,503 | Textron, Inc. | 38,296 | |||||||||
| 1,654 | United Technologies Corp. | 129,591 | |||||||||
| 2,678,051 | |||||||||||
See Notes to Financial Statements
31
Morgan Stanley Global Strategist Fund
Portfolio of Investments n January 31, 2012 (unaudited) continued
| NUMBER OF SHARES | VALUE | ||||||||||
| Air Freight & Logistics | |||||||||||
| 1,155 | C.H. Robinson Worldwide, Inc. | $ | 79,510 | ||||||||
| 515 | Expeditors International of Washington, Inc. | 22,995 | |||||||||
| 1,607 | FedEx Corp. | 147,025 | |||||||||
| 3,268 | United Parcel Service, Inc., Class B | 247,224 | |||||||||
| 496,754 | |||||||||||
| Auto Components | |||||||||||
| 10,192 | BorgWarner, Inc. (a) | 760,629 | |||||||||
| 29,090 | Johnson Controls, Inc. | 924,189 | |||||||||
| 1,200 | TRW Automotive Holdings Corp. (a) | 45,024 | |||||||||
| 1,729,842 | |||||||||||
| Automobiles | |||||||||||
| 10,545 | Ford Motor Co. | 130,969 | |||||||||
| Beverages | |||||||||||
| 10,862 | Coca-Cola Co. (The) | 733,511 | |||||||||
| 1,313 | Coca-Cola Enterprises, Inc. | 35,175 | |||||||||
| 670 | Dr. Pepper Snapple Group, Inc. | 26,009 | |||||||||
| 1,100 | Molson Coors Brewing Co. | 47,179 | |||||||||
| 7,141 | PepsiCo, Inc. | 468,950 | |||||||||
| 1,310,824 | |||||||||||
| Biotechnology | |||||||||||
| 1,310 | Alexion Pharmaceuticals, Inc. (a) | 100,556 | |||||||||
| 5,918 | Amgen, Inc. | 401,891 | |||||||||
| 1,394 | Biogen Idec, Inc. (a) | 164,380 | |||||||||
| 2,837 | Celgene Corp. (a) | 206,250 | |||||||||
| 4,545 | Gilead Sciences, Inc. (a) | 221,978 | |||||||||
| 700 | Vertex Pharmaceuticals, Inc. (a) | 25,865 | |||||||||
| 1,120,920 | |||||||||||
| NUMBER OF SHARES | VALUE | ||||||||||
| Building Products | |||||||||||
| 14,965 | Masco Corp. | $ | 180,628 | ||||||||
| 5,019 | Owens Corning (a) | 169,391 | |||||||||
| 722 | Universal Forest Products, Inc. | 22,938 | |||||||||
| 372,957 | |||||||||||
| Capital Markets | |||||||||||
| 2,735 | Ameriprise Financial, Inc. | 146,459 | |||||||||
| 11,110 | Bank of New York Mellon Corp. (The) | 223,644 | |||||||||
| 1,063 | BlackRock, Inc. | 193,466 | |||||||||
| 6,993 | Charles Schwab Corp. (The) | 81,468 | |||||||||
| 1,120 | Franklin Resources, Inc. | 118,832 | |||||||||
| 6,223 | Goldman Sachs Group, Inc. (The) | 693,678 | |||||||||
| 3,376 | Invesco Ltd. | 76,196 | |||||||||
| 1,129 | Legg Mason, Inc. | 28,756 | |||||||||
| 2,425 | State Street Corp. | 95,012 | |||||||||
| 3,531 | T. Rowe Price Group, Inc. | 204,233 | |||||||||
| 1,861,744 | |||||||||||
| Chemicals | |||||||||||
| 358 | Air Products & Chemicals, Inc. | 31,515 | |||||||||
| 282 | Airgas, Inc. | 22,258 | |||||||||
| 399 | Celanese Corp. | 19,435 | |||||||||
| 4,361 | CF Industries Holdings, Inc. | 773,554 | |||||||||
| 1,326 | Dow Chemical Co. (The) | 44,434 | |||||||||
| 260 | Eastman Chemical Co. | 13,083 | |||||||||
| 1,587 | Ecolab, Inc. | 95,918 | |||||||||
| 20,119 | EI du Pont de Nemours & Co. | 1,023,856 | |||||||||
| 394 | FMC Corp. | 36,516 | |||||||||
See Notes to Financial Statements
32
Morgan Stanley Global Strategist Fund
Portfolio of Investments n January 31, 2012 (unaudited) continued
| NUMBER OF SHARES | VALUE | ||||||||||
| 1,242 | Georgia Gulf Corp. (a) | $ | 43,532 | ||||||||
| 124 | International Flavors & Fragrances, Inc. | 6,921 | |||||||||
| 576 | LyondellBasell Industries N.V., Class A | 24,826 | |||||||||
| 2,687 | Monsanto Co. | 220,469 | |||||||||
| 1,664 | Mosaic Co. (The) | 93,134 | |||||||||
| 186 | PPG Industries, Inc. | 16,662 | |||||||||
| 1,699 | Praxair, Inc. | 180,434 | |||||||||
| 38 | Sherwin-Williams Co. (The) | 3,706 | |||||||||
| 401 | Sigma-Aldrich Corp. | 27,284 | |||||||||
| 2,677,537 | |||||||||||
| Commercial Banks | |||||||||||
| 11,791 | BB&T Corp. | 320,597 | |||||||||
| 1,975 | CIT Group, Inc. (a) | 75,327 | |||||||||
| 18,322 | Fifth Third Bancorp | 238,369 | |||||||||
| 21,600 | Huntington Bancshares, Inc. | 123,336 | |||||||||
| 25,709 | KeyCorp | 199,759 | |||||||||
| 1,000 | M&T Bank Corp. | 79,740 | |||||||||
| 4,230 | PNC Financial Services Group, Inc. | 249,232 | |||||||||
| 37,868 | Regions Financial Corp. | 197,671 | |||||||||
| 10,990 | SunTrust Banks, Inc. | 226,064 | |||||||||
| 15,024 | US Bancorp | 423,977 | |||||||||
| 51,714 | Wells Fargo & Co. | 1,510,566 | |||||||||
| 5,600 | Zions Bancorporation | 94,304 | |||||||||
| 3,738,942 | |||||||||||
| Commercial Services & Supplies | |||||||||||
| 1,225 | Avery Dennison Corp. | 33,259 | |||||||||
| 1,313 | Cintas Corp. | 48,646 | |||||||||
| 2,068 | Iron Mountain, Inc. | 63,736 | |||||||||
| 2,106 | Pitney Bowes, Inc. | 39,951 | |||||||||
| 3,108 | Republic Services, Inc. | 91,002 | |||||||||
| NUMBER OF SHARES | VALUE | ||||||||||
| 2,662 | RR Donnelley & Sons Co. | $ | 30,240 | ||||||||
| 949 | Stericycle, Inc. (a) | 79,735 | |||||||||
| 3,380 | Waste Management, Inc. | 117,489 | |||||||||
| 504,058 | |||||||||||
| Communications Equipment | |||||||||||
| 88,657 | Ciena Corp. (a) | 1,289,959 | |||||||||
| 38,388 | Cisco Systems, Inc. | 753,557 | |||||||||
| 4,680 | Juniper Networks, Inc. (a) | 97,952 | |||||||||
| 2,334 | Motorola Mobility Holdings, Inc. (a) | 90,162 | |||||||||
| 771 | Motorola Solutions, Inc. | 35,782 | |||||||||
| 11,264 | Qualcomm, Inc. | 662,549 | |||||||||
| 2,929,961 | |||||||||||
| Computers & Peripherals | |||||||||||
| 6,715 | Apple, Inc. (a) | 3,065,263 | |||||||||
| 6,862 | Dell, Inc. (a) | 118,232 | |||||||||
| 14,621 | EMC Corp. (a) | 376,637 | |||||||||
| 25,299 | Hewlett-Packard Co. | 707,866 | |||||||||
| 2,898 | NetApp, Inc. (a) | 109,371 | |||||||||
| 21,485 | SanDisk Corp. (a) | 985,732 | |||||||||
| 5,363,101 | |||||||||||
| Construction & Engineering | |||||||||||
| 884 | Fluor Corp. | 49,716 | |||||||||
| 21,926 | Foster Wheeler AG (a) | 492,458 | |||||||||
| 891 | Jacobs Engineering Group, Inc. (a) | 39,881 | |||||||||
| 1,228 | KBR, Inc. | 39,468 | |||||||||
| 20,535 | URS Corp. (a) | 845,015 | |||||||||
| 1,466,538 | |||||||||||
| Construction Materials | |||||||||||
| 1,858 | Eagle Materials, Inc. | 54,644 | |||||||||
See Notes to Financial Statements
33
Morgan Stanley Global Strategist Fund
Portfolio of Investments n January 31, 2012 (unaudited) continued
| NUMBER OF SHARES | VALUE | ||||||||||
| Consumer Finance | |||||||||||
| 3,458 | American Express Co. | $ | 173,384 | ||||||||
| 3,862 | Capital One Financial Corp. | 176,687 | |||||||||
| 2,669 | Discover Financial Services | 72,543 | |||||||||
| 5,607 | SLM Corp. | 83,825 | |||||||||
| 506,439 | |||||||||||
| Containers & Packaging | |||||||||||
| 515 | Ball Corp. | 20,219 | |||||||||
| 566 | Crown Holdings, Inc. (a) | 20,416 | |||||||||
| 282 | Owens-Illinois, Inc. (a) | 6,782 | |||||||||
| 299 | Sealed Air Corp. | 5,959 | |||||||||
| 53,376 | |||||||||||
| Distributors | |||||||||||
| 40,000 | Li & Fung Ltd. (d) | 87,476 | |||||||||
| Diversified Consumer Services | |||||||||||
| 715 | Apollo Group, Inc., Class A (a) | 37,473 | |||||||||
| 2,900 | H&R Block, Inc. | 47,444 | |||||||||
| 84,917 | |||||||||||
| Diversified Financial Services | |||||||||||
| 120,646 | Bank of America Corp. | 860,206 | |||||||||
| 21,367 | Citigroup, Inc. (See Note 6) | 656,394 | |||||||||
| 73,605 | JPMorgan Chase & Co. | 2,745,467 | |||||||||
| 2,353 | Leucadia National Corp. | 65,320 | |||||||||
| 692 | Moody's Corp. | 25,763 | |||||||||
| 2,695 | NASDAQ OMX Group, Inc. (The) (a) | 66,782 | |||||||||
| 3,854 | NYSE Euronext | 102,362 | |||||||||
| 4,522,294 | |||||||||||
| NUMBER OF SHARES | VALUE | ||||||||||
| Diversified Telecommunication Services | |||||||||||
| 29,366 | AT&T, Inc. | $ | 863,654 | ||||||||
| 19,194 | CenturyLink, Inc. | 710,754 | |||||||||
| 8,200 | Frontier Communications Corp. | 35,096 | |||||||||
| 41,812 | Verizon Communications, Inc. | 1,574,640 | |||||||||
| 3,184,144 | |||||||||||
| �� | Electric Utilities | ||||||||||
| 4,499 | American Electric Power Co., Inc. | 177,980 | |||||||||
| 9,293 | Duke Energy Corp. | 198,034 | |||||||||
| 3,472 | Edison International | 142,491 | |||||||||
| 1,505 | Entergy Corp. | 104,417 | |||||||||
| 5,721 | Exelon Corp. | 227,581 | |||||||||
| 3,566 | FirstEnergy Corp. | 150,557 | |||||||||
| 3,188 | NextEra Energy, Inc. | 190,802 | |||||||||
| 4,505 | PPL Corp. | 125,194 | |||||||||
| 1,877 | Progress Energy, Inc. | 101,977 | |||||||||
| 5,910 | Southern Co. | 269,260 | |||||||||
| 1,688,293 | |||||||||||
| Electrical Equipment | |||||||||||
| 450 | AMETEK, Inc. | 21,150 | |||||||||
| 964 | Cooper Industries PLC | 56,992 | |||||||||
| 5,137 | Emerson Electric Co. | 263,939 | |||||||||
| 1,720 | Rockwell Automation, Inc. | 133,936 | |||||||||
| 339 | Roper Industries, Inc. | 31,659 | |||||||||
| 507,676 | |||||||||||
| Electronic Equipment, Instruments & Components | |||||||||||
| 20,375 | Arrow Electronics, Inc. (a) | 841,284 | |||||||||
See Notes to Financial Statements
34
Morgan Stanley Global Strategist Fund
Portfolio of Investments n January 31, 2012 (unaudited) continued
| NUMBER OF SHARES | VALUE | ||||||||||
| 2,325 | Corning, Inc. | $ | 29,923 | ||||||||
| 2,080 | TE Connectivity Ltd. | 70,928 | |||||||||
| 942,135 | |||||||||||
| Energy Equipment & Services | |||||||||||
| 3,645 | Baker Hughes, Inc. | 179,079 | |||||||||
| 1,619 | Cameron International Corp. (a) | 86,131 | |||||||||
| 1,979 | FMC Technologies, Inc. (a) | 101,147 | |||||||||
| 6,916 | Halliburton Co. | 254,370 | |||||||||
| 641 | Helmerich & Payne, Inc. | 39,556 | |||||||||
| 3,980 | National Oilwell Varco, Inc. | 294,440 | |||||||||
| 800 | Noble Corp. (a) | 27,872 | |||||||||
| 9,851 | Schlumberger Ltd. | 740,500 | |||||||||
| 5,654 | Tenaris SA | 110,714 | |||||||||
| 5,624 | Weatherford International Ltd. (a) | 94,146 | |||||||||
| 1,927,955 | |||||||||||
| Food & Staples Retailing | |||||||||||
| 6,163 | Costco Wholesale Corp. | 507,030 | |||||||||
| 7,139 | Kroger Co. (The) | 169,623 | |||||||||
| 31,593 | Safeway, Inc. | 694,414 | |||||||||
| 7,509 | Sysco Corp. | 226,096 | |||||||||
| 22,794 | Wal-Mart Stores, Inc. | 1,398,640 | |||||||||
| 11,891 | Walgreen Co. | 396,684 | |||||||||
| 1,987 | Whole Foods Market, Inc. | 147,097 | |||||||||
| 3,539,584 | |||||||||||
| Food Products | |||||||||||
| 3,188 | Archer-Daniels- Midland Co. | 91,273 | |||||||||
| 700 | Bunge Ltd. | 40,089 | |||||||||
| 39,999 | ConAgra Foods, Inc. | 1,066,773 | |||||||||
| 4,805 | General Mills, Inc. | 191,383 | |||||||||
| NUMBER OF SHARES | VALUE | ||||||||||
| 2,369 | H.J. Heinz Co. | $ | 122,833 | ||||||||
| 414 | Hershey Co. (The) | 25,287 | |||||||||
| 700 | JM Smucker Co. (The) | 55,146 | |||||||||
| 2,013 | Kellogg Co. | 99,684 | |||||||||
| 7,910 | Kraft Foods, Inc., Class A | 302,953 | |||||||||
| 1,393 | Mead Johnson Nutrition Co. | 103,207 | |||||||||
| 2,000 | Sara Lee Corp. | 38,300 | |||||||||
| 39,383 | Smithfield Foods, Inc. (a) | 879,422 | |||||||||
| 2,000 | Tyson Foods, Inc., Class A | 37,280 | |||||||||
| 3,053,630 | |||||||||||
| Gas Utilities | |||||||||||
| 1,600 | Oneok, Inc. | 133,056 | |||||||||
| Health Care Equipment & Supplies | |||||||||||
| 4,394 | Baxter International, Inc. | 243,779 | |||||||||
| 1,890 | Becton Dickinson and Co. | 148,195 | |||||||||
| 9,574 | Boston Scientific Corp. (a) | 57,061 | |||||||||
| 2,361 | Covidien PLC | 121,592 | |||||||||
| 481 | CR Bard, Inc. | 44,502 | |||||||||
| 586 | Edwards Lifesciences Corp. (a) | 48,445 | |||||||||
| 1,510 | Hologic, Inc. (a) | 30,789 | |||||||||
| 501 | Intuitive Surgical, Inc. (a) | 230,415 | |||||||||
| 8,000 | Medtronic, Inc. | 308,560 | |||||||||
| 2,940 | St. Jude Medical, Inc. | 122,627 | |||||||||
| 2,488 | Stryker Corp. | 137,910 | |||||||||
| 708 | Varian Medical Systems, Inc. (a) | 46,636 | |||||||||
| 1,871 | Zimmer Holdings, Inc. (a) | 113,663 | |||||||||
| 1,654,174 | |||||||||||
See Notes to Financial Statements
35
Morgan Stanley Global Strategist Fund
Portfolio of Investments n January 31, 2012 (unaudited) continued
| NUMBER OF SHARES | VALUE | ||||||||||
| Health Care Providers & Services | |||||||||||
| 1,851 | Aetna, Inc. | $ | 80,889 | ||||||||
| 3,423 | Amerisource Bergen Corp. | 133,394 | |||||||||
| 3,383 | Cardinal Health, Inc. | 145,571 | |||||||||
| 1,673 | CIGNA Corp. | 75,001 | |||||||||
| 30,421 | Coventry Health Care, Inc. (a) | 914,759 | |||||||||
| 569 | DaVita, Inc. (a) | 46,550 | |||||||||
| 4,022 | Express Scripts, Inc. (a) | 205,766 | |||||||||
| 43,400 | HealthSouth Corp. (a) | 837,186 | |||||||||
| 642 | Henry Schein, Inc. (a) | 45,511 | |||||||||
| 757 | Humana, Inc. | 67,388 | |||||||||
| 526 | Laboratory Corp. of America Holdings (a) | 48,071 | |||||||||
| 1,955 | McKesson Corp. | 159,763 | |||||||||
| 3,167 | Medco Health Solutions, Inc. (a) | 196,417 | |||||||||
| 26,605 | Omnicare, Inc. | 873,442 | |||||||||
| 1,072 | Quest Diagnostics, Inc. | 62,262 | |||||||||
| 5,142 | UnitedHealth Group, Inc. | 266,304 | |||||||||
| 18,042 | Universal Health Services, Inc., Class B | 744,954 | |||||||||
| 1,901 | WellPoint, Inc. | 122,272 | |||||||||
| 5,025,500 | |||||||||||
| Health Care Technology | |||||||||||
| 946 | Cerner Corp. (a) | 57,602 | |||||||||
| Hotels, Restaurants & Leisure | |||||||||||
| 1,623 | Carnival Corp. | 49,014 | |||||||||
| 328 | Chipotle Mexican Grill, Inc. (a) | 120,471 | |||||||||
| NUMBER OF SHARES | VALUE | ||||||||||
| 643 | Darden Restaurants, Inc. | $ | 29,494 | ||||||||
| 1,459 | International Game Technology | 23,242 | |||||||||
| 2,353 | Las Vegas Sands Corp. (a) | 115,556 | |||||||||
| 1,497 | Marriott International, Inc., Class A | 51,572 | |||||||||
| 149 | Marriott Vacations Worldwide Corp. (a) | 3,092 | |||||||||
| 17,330 | McDonald's Corp. | 1,716,536 | |||||||||
| 1,732 | MGM Resorts International (a) | 22,603 | |||||||||
| 1,400 | Royal Caribbean Cruises Ltd. | 38,052 | |||||||||
| 4,797 | Starbucks Corp. | 229,920 | |||||||||
| 761 | Starwood Hotels & Resorts Worldwide, Inc. | 41,277 | |||||||||
| 678 | Wynn Resorts Ltd. | 78,126 | |||||||||
| 20,421 | Yum! Brands, Inc. | 1,293,262 | |||||||||
| 3,812,217 | |||||||||||
| Household Durables | |||||||||||
| 43,117 | D.R. Horton, Inc. | 600,189 | |||||||||
| 10,636 | KB Home | 95,937 | |||||||||
| 24,522 | Lennar Corp., Class A | 526,978 | |||||||||
| 2,484 | M/I Homes, Inc. (a) | 28,193 | |||||||||
| 6,491 | MDC Holdings, Inc. | 128,651 | |||||||||
| 4,579 | Meritage Homes Corp. (a) | 110,812 | |||||||||
| 2,879 | Mohawk Industries, Inc. (a) | 176,080 | |||||||||
| 710 | NVR, Inc. (a) | 492,207 | |||||||||
| 51,120 | Pulte Group, Inc. (a) | 380,844 | |||||||||
| 5,880 | Ryland Group, Inc. (The) | 107,016 | |||||||||
| 376 | Skyline Corp. | 2,335 | |||||||||
| 46,694 | Standard Pacific Corp. (a) | 169,966 | |||||||||
See Notes to Financial Statements
36
Morgan Stanley Global Strategist Fund
Portfolio of Investments n January 31, 2012 (unaudited) continued
| NUMBER OF SHARES | VALUE | ||||||||||
| 58,686 | Toll Brothers, Inc. (a) | $ | 1,279,942 | ||||||||
| 4,099,150 | |||||||||||
| Household Products | |||||||||||
| 1,411 | Clorox Co. (The) | 96,879 | |||||||||
| 4,665 | Colgate-Palmolive Co. | 423,209 | |||||||||
| 3,573 | Kimberly-Clark Corp. | 255,684 | |||||||||
| 21,257 | Procter & Gamble Co. (The) | 1,340,041 | |||||||||
| 2,115,813 | |||||||||||
| Independent Power Producers & Energy Traders | |||||||||||
| 2,155 | Constellation Energy Group, Inc. | 78,507 | |||||||||
| 22,387 | NRG Energy, Inc. (a) | 377,892 | |||||||||
| 456,399 | |||||||||||
| Industrial Conglomerates | |||||||||||
| 1,340 | 3M Co. | 116,191 | |||||||||
| 3,385 | Danaher Corp. | 177,746 | |||||||||
| 73,862 | General Electric Co. | 1,381,958 | |||||||||
| 24,169 | Tyco International Ltd. | 1,231,411 | |||||||||
| 2,907,306 | |||||||||||
| Information Technology Services | |||||||||||
| 3,712 | Accenture PLC, Class A | 212,846 | |||||||||
| 1,053 | Automatic Data Processing, Inc. | 57,683 | |||||||||
| 2,632 | Cognizant Technology Solutions Corp., Class A (a) | 188,846 | |||||||||
| 823 | Fiserv, Inc. (a) | 51,758 | |||||||||
| 11,854 | International Business Machines Corp. | 2,283,080 | |||||||||
| 687 | Mastercard, Inc., Class A | 244,277 | |||||||||
| 1,397 | Paychex, Inc. | 44,006 | |||||||||
| NUMBER OF SHARES | VALUE | ||||||||||
| 2,706 | Visa, Inc., Class A | $ | 272,332 | ||||||||
| 4,462 | Western Union Co. (The) | 85,224 | |||||||||
| 3,440,052 | |||||||||||
| Insurance | |||||||||||
| 14,949 | Assurant, Inc. | 591,980 | |||||||||
| 17,909 | Chubb Corp. (The) | 1,207,246 | |||||||||
| 34,542 | Fidelity National Financial, Inc. | 628,319 | |||||||||
| 19,355 | Lincoln National Corp. | 416,907 | |||||||||
| 7,680 | PartnerRe Ltd. | 502,426 | |||||||||
| 17,910 | Principal Financial Group, Inc. | 489,122 | |||||||||
| 29,097 | Unum Group | 664,284 | |||||||||
| 4,500,284 | |||||||||||
| Internet & Catalog Retail | |||||||||||
| 1,406 | Amazon.com, Inc. (a) | 273,383 | |||||||||
| 306 | Expedia, Inc. | 9,905 | |||||||||
| 106 | NetFlix, Inc. (a) | 12,741 | |||||||||
| 323 | Priceline.com, Inc. (a) | 171,022 | |||||||||
| 306 | TripAdvisor, Inc. (a) | 10,071 | |||||||||
| 477,122 | |||||||||||
| Internet Software & Services | |||||||||||
| 1,337 | Akamai Technologies, Inc. (a) | 43,118 | |||||||||
| 6,676 | eBay, Inc. (a) | 210,962 | |||||||||
| 1,420 | Google, Inc., Class A (a) | 823,756 | |||||||||
| 35,077 | Yahoo!, Inc. (a) | 542,641 | |||||||||
| 1,620,477 | |||||||||||
| Leisure Equipment & Products | |||||||||||
| 1,000 | Mattel, Inc. | 31,000 | |||||||||
See Notes to Financial Statements
37
Morgan Stanley Global Strategist Fund
Portfolio of Investments n January 31, 2012 (unaudited) continued
| NUMBER OF SHARES | VALUE | ||||||||||
| Life Sciences Tools & Services | |||||||||||
| 2,439 | Agilent Technologies, Inc. (a) | $ | 103,584 | ||||||||
| 700 | Illumina, Inc. (a) | 36,232 | |||||||||
| 900 | Life Technologies Corp. (a) | 43,587 | |||||||||
| 2,403 | Thermo Fisher Scientific, Inc. (a) | 127,119 | |||||||||
| 400 | Waters Corp. (a) | 34,628 | |||||||||
| 345,150 | |||||||||||
| Machinery | |||||||||||
| 4,392 | Caterpillar, Inc. | 479,255 | |||||||||
| 1,343 | Cummins, Inc. | 139,672 | |||||||||
| 2,796 | Deere & Co. | 240,875 | |||||||||
| 311 | Dover Corp. | 19,721 | |||||||||
| 1,194 | Eaton Corp. | 58,542 | |||||||||
| 287 | Flowserve Corp. | 31,619 | |||||||||
| 19,778 | Illinois Tool Works, Inc. | 1,048,827 | |||||||||
| 971 | Ingersoll-Rand PLC | 33,927 | |||||||||
| 419 | Joy Global, Inc. | 37,999 | |||||||||
| 2,572 | PACCAR, Inc. | 113,682 | |||||||||
| 693 | Pall Corp. | 41,358 | |||||||||
| 300 | Stanley Black & Decker, Inc. | 21,054 | |||||||||
| 1,144 | Xylem, Inc. | 29,641 | |||||||||
| 2,296,172 | |||||||||||
| Media | |||||||||||
| 2,651 | Cablevision Systems Corp. | 38,572 | |||||||||
| 6,670 | CBS Corp., Class B | 189,962 | |||||||||
| 11,543 | Comcast Corp., Class A | 306,928 | |||||||||
| 4,401 | Comcast Corp., Class A | 112,181 | |||||||||
| 8,109 | DIRECTV, Class A (a) | 364,986 | |||||||||
| 1,176 | Discovery Communications, Inc. (a) | 50,427 | |||||||||
| NUMBER OF SHARES | VALUE | ||||||||||
| 1,229 | Discovery Communications, Inc., Class C (a) | $ | 47,747 | ||||||||
| 4,650 | Interpublic Group of Cos., Inc. (The) | 48,035 | |||||||||
| 1,166 | Liberty Global, Inc., Series A (a) | 53,496 | |||||||||
| 1,140 | Liberty Global, Inc., Series C (a) | 50,342 | |||||||||
| 3,249 | McGraw-Hill Cos., Inc. (The) | 149,454 | |||||||||
| 15,513 | News Corp., Class A | 292,110 | |||||||||
| 3,316 | News Corp., Class B | 64,563 | |||||||||
| 1,961 | Omnicom Group, Inc. | 89,441 | |||||||||
| 632 | Scripps Networks Interactive, Inc., Class A | 27,404 | |||||||||
| 3,131 | Time Warner Cable, Inc. | 230,817 | |||||||||
| 36,638 | Time Warner, Inc. | 1,357,804 | |||||||||
| 3,446 | Viacom, Inc., Class B | 162,100 | |||||||||
| 2,494 | Virgin Media, Inc. | 59,457 | |||||||||
| 9,956 | Walt Disney Co. (The) | 387,288 | |||||||||
| 4,083,114 | |||||||||||
| Metals & Mining | |||||||||||
| 3,482 | Alcoa, Inc. | 35,377 | |||||||||
| 402 | Allegheny Technologies, Inc. | 18,247 | |||||||||
| 1,033 | Allied Nevada Gold Corp. (a) | 37,116 | |||||||||
| 1,873 | Aurizon Mines Ltd. (a) | 10,358 | |||||||||
| 986 | Cliffs Natural Resources, Inc. | 71,239 | |||||||||
| 1,040 | Coeur d'Alene Mines Corp. (a) | 28,766 | |||||||||
| 1,863 | Freeport-McMoRan Copper & Gold, Inc. | 86,089 | |||||||||
| 3,057 | Golden Star Resources Ltd. (a) | 6,603 | |||||||||
See Notes to Financial Statements
38
Morgan Stanley Global Strategist Fund
Portfolio of Investments n January 31, 2012 (unaudited) continued
| NUMBER OF SHARES | VALUE | ||||||||||
| 5,461 | Great Basin Gold Ltd. (a) | $ | 6,881 | ||||||||
| 3,252 | Hecla Mining Co. | 17,106 | |||||||||
| 4,366 | IAMGOLD Corp. | 73,087 | |||||||||
| 10,684 | Molycorp, Inc. (a) | 330,990 | |||||||||
| 6,578 | Newmont Mining Corp. | 404,415 | |||||||||
| 631 | Nucor Corp. | 28,073 | |||||||||
| 630 | Royal Gold, Inc. | 47,968 | |||||||||
| 496 | Seabridge Gold, Inc. (a) | 10,004 | |||||||||
| 938 | Silver Standard Resources, Inc. (a) | 16,199 | |||||||||
| 58,542 | Steel Dynamics, Inc. | 933,745 | |||||||||
| 1,137 | Tanzanian Royalty Exploration Corp. (a) | 3,763 | |||||||||
| 408 | United States Steel Corp. | 12,318 | |||||||||
| 2,178,344 | |||||||||||
| Multi-Utilities | |||||||||||
| 2,816 | Ameren Corp. | 89,098 | |||||||||
| 5,254 | CenterPoint Energy, Inc. | 97,041 | |||||||||
| 2,627 | Consolidated Edison, Inc. | 154,888 | |||||||||
| 4,688 | Dominion Resources, Inc. | 234,587 | |||||||||
| 1,783 | DTE Energy Co. | 94,873 | |||||||||
| 17,449 | Integrys Energy Group, Inc. | 905,778 | |||||||||
| 3,283 | PG&E Corp. | 133,487 | |||||||||
| 4,499 | Public Service Enterprise Group, Inc. | 136,500 | |||||||||
| 2,438 | Sempra Energy | 138,722 | |||||||||
| 2,911 | Wisconsin Energy Corp. | 98,974 | |||||||||
| 4,316 | Xcel Energy, Inc. | 114,806 | |||||||||
| 2,198,754 | |||||||||||
| NUMBER OF SHARES | VALUE | ||||||||||
| Multi-line Retail | |||||||||||
| 274 | Dollar General Corp. (a) | $ | 11,675 | ||||||||
| 274 | Dollar Tree, Inc. (a) | 23,238 | |||||||||
| 274 | Family Dollar Stores, Inc. | 15,289 | |||||||||
| 1,790 | Kohl's Corp. | 82,322 | |||||||||
| 512 | Nordstrom, Inc. | 25,283 | |||||||||
| 2,192 | Target Corp. | 111,376 | |||||||||
| 269,183 | |||||||||||
| Office Electronics | |||||||||||
| 4,000 | Xerox Corp. | 31,000 | |||||||||
| Oil, Gas & Consumable Fuels | |||||||||||
| 738 | Alpha Natural Resources, Inc. (a) | 14,849 | |||||||||
| 17,432 | Anadarko Petroleum Corp. | 1,407,111 | |||||||||
| 2,487 | Apache Corp. | 245,914 | |||||||||
| 843 | Arch Coal, Inc. | 12,164 | |||||||||
| 26,045 | Chesapeake Energy Corp. | 550,331 | |||||||||
| 21,043 | Chevron Corp. | 2,169,112 | |||||||||
| 548 | Concho Resources, Inc. (a) | 58,450 | |||||||||
| 23,104 | ConocoPhillips | 1,575,924 | |||||||||
| 1,194 | Consol Energy, Inc. | 42,674 | |||||||||
| 2,338 | Devon Energy Corp. | 149,188 | |||||||||
| 5,087 | El Paso Corp. | 136,688 | |||||||||
| 1,935 | EOG Resources, Inc. | 205,381 | |||||||||
| 908 | EQT Corp. | 45,872 | |||||||||
| 38,585 | Exxon Mobil Corp. | 3,231,108 | |||||||||
| 12,175 | Hess Corp. | 685,452 | |||||||||
| 4,183 | Marathon Oil Corp. | 131,304 | |||||||||
| 1,944 | Marathon Petroleum Corp. | 74,300 | |||||||||
| 899 | Murphy Oil Corp. | 53,580 | |||||||||
| 510 | Newfield Exploration Co. (a) | 19,283 | |||||||||
See Notes to Financial Statements
39
Morgan Stanley Global Strategist Fund
Portfolio of Investments n January 31, 2012 (unaudited) continued
| NUMBER OF SHARES | VALUE | ||||||||||
| 1,285 | Noble Energy, Inc. | $ | 129,361 | ||||||||
| 7,456 | Occidental Petroleum Corp. | 743,885 | |||||||||
| 2,384 | Peabody Energy Corp. | 81,271 | |||||||||
| 729 | Pioneer Natural Resources Co. | 72,390 | |||||||||
| 1,124 | QEP Resources, Inc. | 32,191 | |||||||||
| 1,324 | Range Resources Corp. | 76,156 | |||||||||
| 3,029 | Southwestern Energy Co. (a) | 94,323 | |||||||||
| 4,743 | Spectra Energy Corp. | 149,357 | |||||||||
| 1,336 | Ultra Petroleum Corp. (a) | 32,104 | |||||||||
| 3,311 | Valero Energy Corp. | 79,431 | |||||||||
| 8,602 | Williams Cos., Inc. (The) | 247,910 | |||||||||
| 3,456 | WPX Energy, Inc. (a) | 56,955 | |||||||||
| 12,604,019 | |||||||||||
| Paper & Forest Products | |||||||||||
| 527 | Deltic Timber Corp. | 35,899 | |||||||||
| 455 | International Paper Co. | 14,169 | |||||||||
| 5,748 | Louisiana-Pacific Corp. (a) | 48,973 | |||||||||
| 24,131 | MeadWestvaco Corp. | 710,417 | |||||||||
| 809,458 | |||||||||||
| Personal Products | |||||||||||
| 4,300 | Avon Products, Inc. | 76,411 | |||||||||
| 3,254 | Estee Lauder Cos., Inc. (The), Class A | 188,504 | |||||||||
| 264,915 | |||||||||||
| Pharmaceuticals | |||||||||||
| 28,369 | Abbott Laboratories | 1,536,181 | |||||||||
| 1,817 | Allergan, Inc. | 159,733 | |||||||||
| 53,646 | Bristol-Myers Squibb Co. | 1,729,547 | |||||||||
| NUMBER OF SHARES | VALUE | ||||||||||
| 4,932 | Eli Lilly & Co. | $ | 195,998 | ||||||||
| 972 | Hospira, Inc. (a) | 33,495 | |||||||||
| 13,046 | Johnson & Johnson | 859,862 | |||||||||
| 14,451 | Merck & Co., Inc. | 552,895 | |||||||||
| 1,700 | Mylan, Inc. (a) | 35,275 | |||||||||
| 400 | Perrigo Co. | 38,240 | |||||||||
| 37,151 | Pfizer, Inc. | 795,031 | |||||||||
| 400 | Watson Pharmaceuticals, Inc. (a) | 23,452 | |||||||||
| 5,959,709 | |||||||||||
| Professional Services | |||||||||||
| 665 | Dun & Bradstreet Corp. (The) | 55,068 | |||||||||
| 1,333 | Equifax, Inc. | 51,947 | |||||||||
| 541 | IHS, Inc., Class A (a) | 48,409 | |||||||||
| 1,354 | Manpower, Inc. | 54,309 | |||||||||
| 1,949 | Robert Half International, Inc. | 53,968 | |||||||||
| 1,789 | Verisk Analytics, Inc., Class A (a) | 71,685 | |||||||||
| 335,386 | |||||||||||
| Real Estate Investment Trusts (REITs) | |||||||||||
| 3,590 | American Tower Corp. REIT | 228,001 | |||||||||
| 2,608 | Annaly Capital Management, Inc. REIT | 43,919 | |||||||||
| 1,383 | AvalonBay Communities, Inc. REIT | 188,102 | |||||||||
| 1,481 | Boston Properties, Inc. REIT | 154,098 | |||||||||
| 2,792 | Equity Residential REIT | 166,264 | |||||||||
| 1,323 | General Growth Properties, Inc. REIT | 20,877 | |||||||||
| 1,242 | HCP, Inc. REIT | 52,201 | |||||||||
See Notes to Financial Statements
40
Morgan Stanley Global Strategist Fund
Portfolio of Investments n January 31, 2012 (unaudited) continued
| NUMBER OF SHARES | VALUE | ||||||||||
| 554 | Health Care REIT, Inc. REIT | $ | 31,694 | ||||||||
| 9,350 | Host Hotels & Resorts, Inc. REIT | 153,527 | |||||||||
| 1,278 | Kimco Realty Corp. REIT | 23,323 | |||||||||
| 454 | Liberty Property Trust REIT | 15,114 | |||||||||
| 462 | Macerich Co. (The) REIT | 25,087 | |||||||||
| 487 | Plum Creek Timber Co., Inc. REIT | 18,886 | |||||||||
| 4,344 | ProLogis, Inc. REIT | 137,748 | |||||||||
| 3,611 | Public Storage REIT | 501,423 | |||||||||
| 497 | Rayonier, Inc. REIT | 22,728 | |||||||||
| 303 | Regency Centers Corp. REIT | 12,520 | |||||||||
| 49 | Rouse Properties, Inc. REIT (a) | 606 | |||||||||
| 5,112 | Simon Property Group, Inc. REIT | 694,516 | |||||||||
| 403 | Ventas, Inc. REIT | 23,499 | |||||||||
| 407 | Vornado Realty Trust REIT | 32,918 | |||||||||
| 1,599 | Weyerhaeuser Co. REIT | 32,012 | |||||||||
| 2,579,063 | |||||||||||
| Real Estate Management & Development | |||||||||||
| 5,924 | CBRE Group, Inc. (a) | 114,333 | |||||||||
| 9,091 | Lend Lease Group REIT (Stapled Securities) (b)(c) | 70,938 | |||||||||
| 185,271 | |||||||||||
| Road & Rail | |||||||||||
| 5,709 | CSX Corp. | 128,738 | |||||||||
| 312 | JB Hunt Transport Services, Inc. | 15,934 | |||||||||
| NUMBER OF SHARES | VALUE | ||||||||||
| 17,551 | Norfolk Southern Corp. | $ | 1,267,182 | ||||||||
| 2,210 | Union Pacific Corp. | 252,625 | |||||||||
| 1,664,479 | |||||||||||
| Semiconductors & Semiconductor Equipment | |||||||||||
| 2,800 | Advanced Micro Devices, Inc. (a) | 18,788 | |||||||||
| 4,324 | Altera Corp. | 172,052 | |||||||||
| 4,095 | Analog Devices, Inc. | 160,237 | |||||||||
| 5,700 | Applied Materials, Inc. | 69,996 | |||||||||
| 1,100 | Avago Technologies Ltd. | 37,334 | |||||||||
| 5,143 | Broadcom Corp., Class A (a) | 176,611 | |||||||||
| 200 | First Solar, Inc. (a) | 8,456 | |||||||||
| 46,780 | Intel Corp. | 1,235,928 | |||||||||
| 800 | KLA-Tencor Corp. | 40,904 | |||||||||
| 700 | Lam Research Corp. (a) | 29,813 | |||||||||
| 1,300 | Linear Technology Corp. | 43,316 | |||||||||
| 2,800 | LSI Corp. (a) | 21,196 | |||||||||
| 2,600 | Marvell Technology Group Ltd. (a) | 40,378 | |||||||||
| 1,100 | Maxim Integrated Products, Inc. | 29,524 | |||||||||
| 700 | Microchip Technology, Inc. | 25,837 | |||||||||
| 4,200 | Micron Technology, Inc. (a) | 31,878 | |||||||||
| 2,600 | NVIDIA Corp. (a) | 38,402 | |||||||||
| 10,606 | Texas Instruments, Inc. | 343,422 | |||||||||
| 1,100 | Xilinx, Inc. | 39,435 | |||||||||
| 2,563,507 | |||||||||||
See Notes to Financial Statements
41
Morgan Stanley Global Strategist Fund
Portfolio of Investments n January 31, 2012 (unaudited) continued
| NUMBER OF SHARES | VALUE | ||||||||||
| Software | |||||||||||
| 3,095 | Adobe Systems, Inc. (a) | $ | 95,790 | ||||||||
| 1,084 | BMC Software, Inc. (a) | 39,284 | |||||||||
| 1,963 | CA, Inc. | 50,606 | |||||||||
| 1,350 | Citrix Systems, Inc. (a) | 88,034 | |||||||||
| 2,694 | Intuit, Inc. | 152,049 | |||||||||
| 72,554 | Microsoft Corp. | 2,142,520 | |||||||||
| 20,774 | Oracle Corp. | 585,827 | |||||||||
| 18,177 | Red Hat, Inc. (a) | 842,867 | |||||||||
| 666 | Salesforce.com, Inc. (a) | 77,789 | |||||||||
| 5,573 | Symantec Corp. (a) | 95,800 | |||||||||
| 4,170,566 | |||||||||||
| Specialty Retail | |||||||||||
| 232 | Abercrombie & Fitch Co., Class A | 10,658 | |||||||||
| 232 | Advance Auto Parts, Inc. | 17,780 | |||||||||
| 106 | AutoZone, Inc. (a) | 36,875 | |||||||||
| 1,343 | Bed Bath & Beyond, Inc. (a) | 81,520 | |||||||||
| 908 | Best Buy Co., Inc. | 21,747 | |||||||||
| 575 | CarMax, Inc. (a) | 17,497 | |||||||||
| 507 | GameStop Corp., Class A (a) | 11,844 | |||||||||
| 55,777 | Gap, Inc. (The) | 1,058,647 | |||||||||
| 29,049 | Home Depot, Inc. | 1,289,485 | |||||||||
| 6,485 | Lowe's Cos., Inc. | 173,993 | |||||||||
| 2,004 | Ltd. Brands, Inc. | 83,887 | |||||||||
| 1,042 | O'Reilly Automotive, Inc. (a) | 84,933 | |||||||||
| 274 | PetSmart, Inc. | 14,582 | |||||||||
| 1,630 | Ross Stores, Inc. | 82,837 | |||||||||
| 4,882 | Staples, Inc. | 71,424 | |||||||||
| 401 | Tiffany & Co. | 25,584 | |||||||||
| 1,975 | TJX Cos., Inc. | 134,577 | |||||||||
| 274 | Urban Outfitters, Inc. (a) | 7,261 | |||||||||
| 3,225,131 | |||||||||||
| NUMBER OF SHARES | VALUE | ||||||||||
| Textiles, Apparel & Luxury Goods | |||||||||||
| 1,228 | Coach, Inc. | $ | 86,021 | ||||||||
| 1,502 | NIKE, Inc., Class B | 156,193 | |||||||||
| 7,551 | VF Corp. | 992,881 | |||||||||
| 1,235,095 | |||||||||||
| Thrifts & Mortgage Finance | |||||||||||
| 4,800 | New York Community Bancorp, Inc. | 60,912 | |||||||||
| Tobacco | |||||||||||
| 9,551 | Altria Group, Inc. | 271,249 | |||||||||
| 700 | Lorillard, Inc. | 75,173 | |||||||||
| 22,287 | Philip Morris International, Inc. | 1,666,399 | |||||||||
| 22,832 | Reynolds American, Inc. | 895,699 | |||||||||
| 2,908,520 | |||||||||||
| Trading Companies & Distributors | |||||||||||
| 1,990 | Fastenal Co. | 92,893 | |||||||||
| 1,367 | Watsco, Inc. | 94,282 | |||||||||
| 593 | WW Grainger, Inc. | 113,109 | |||||||||
| 300,284 | |||||||||||
| Wireless Telecommunication Services | |||||||||||
| 3,369 | Crown Castle International Corp. (a) | 163,329 | |||||||||
| 1,500 | NII Holdings, Inc. (a) | 30,165 | |||||||||
| 20,300 | Sprint Nextel Corp. (a) | 43,036 | |||||||||
| 236,530 | |||||||||||
| Total United States | 127,369,475 | ||||||||||
| Total Common Stocks (Cost $243,265,885) | 254,510,671 | ||||||||||
See Notes to Financial Statements
42
Morgan Stanley Global Strategist Fund
Portfolio of Investments n January 31, 2012 (unaudited) continued
| NUMBER OF SHARES | VALUE | ||||||||||
| Commodity Linked Security (5.0%) | |||||||||||
| United States | |||||||||||
| 23,938,000 | Deutsche Bank AG Series 0005 (Cost $23,938,000) (e)(f) | $ | 24,366,490 | ||||||||
| Investment Companies (1.2%) | |||||||||||
| 8,000 | iShares MSCI Emerging Markets Index Fund | 337,040 | |||||||||
| 87,800 | Market Vectors Russia ETF | 2,651,560 | |||||||||
| 110,800 | Technology Select Sector SPDR Fund | 2,997,140 | |||||||||
| Total Investment Companies (Cost $5,619,206) | 5,985,740 | ||||||||||
| PRINCIPAL AMOUNT IN THOUSANDS | |||||||||||
| Corporate Bonds (10.5%) | |||||||||||
| Australia (0.8%) | |||||||||||
| Basic Materials | |||||||||||
| $ | 135 | Rio Tinto Finance USA Ltd. 9.00% 05/01/19 | 188,138 | ||||||||
| Communications | |||||||||||
| 260 | Telstra Corp., Ltd. (e) 4.80% 10/12/21 | 284,677 | |||||||||
| Consumer, Cyclical | |||||||||||
| 195 | Wesfarmers Ltd. (e) 2.983% 05/18/16 | 198,599 | |||||||||
| Consumer, Non-Cyclical | |||||||||||
| 195 | Woolworths Ltd. (e) 4.00% 09/22/20 | 203,998 | |||||||||
| PRINCIPAL AMOUNT IN THOUSANDS | VALUE | ||||||||||
| Finance | |||||||||||
| EUR | 400 | Australia & New Zealand Banking Group Ltd. 5.125% 09/10/19 | $ | 555,045 | |||||||
| $ | 500 | Commonwealth Bank of Australia (e) 2.90% 09/17/14 | 522,084 | ||||||||
| 355 | Commonwealth Bank of Australia (e) 5.00% 10/15/19 | 382,968 | |||||||||
| 245 | Macquarie Bank Ltd. (e) 6.625% 04/07/21 | 233,589 | |||||||||
| 235 | Macquarie Group Ltd. (e) 6.00% 01/14/20 | 226,391 | |||||||||
| 400 | National Australia Bank Ltd. (e) 3.375% 07/08/14 | 423,409 | |||||||||
| 325 | QBE Capital Funding III Ltd. (e) 7.25% (g) 05/24/41 | 287,870 | |||||||||
| 90 | Westpac Banking Corp. 3.00% 12/09/15 | 92,196 | |||||||||
| 2,723,552 | |||||||||||
| Information Technology | |||||||||||
| 245 | Westpac Banking Corp. 4.20% 02/27/15 | 260,028 | |||||||||
| Total Australia | 3,858,992 | ||||||||||
| Belgium (0.1%) | |||||||||||
| Consumer Staples | |||||||||||
| EUR | 200 | Ontex IV SA 7.50% 04/15/18 | 245,913 | ||||||||
See Notes to Financial Statements
43
Morgan Stanley Global Strategist Fund
Portfolio of Investments n January 31, 2012 (unaudited) continued
| PRINCIPAL AMOUNT IN THOUSANDS | VALUE | ||||||||||
| Consumer, Non-Cyclical | |||||||||||
| $ | 200 | Anheuser-Busch InBev Worldwide, Inc. 4.125% 01/15/15 | $ | 218,043 | |||||||
| 85 | Anheuser-Busch InBev Worldwide, Inc. 5.00% 04/15/20 | 98,958 | |||||||||
| 45 | Anheuser-Busch InBev Worldwide, Inc. 5.375% 11/15/14 | 50,359 | |||||||||
| 367,360 | |||||||||||
| Total Belgium | 613,273 | ||||||||||
| Brazil (0.3%) | |||||||||||
| Basic Materials | |||||||||||
| 185 | Vale Overseas Ltd. 5.625% 09/15/19 | 207,494 | |||||||||
| 50 | Vale Overseas Ltd. 6.875% 11/10/39 | 59,491 | |||||||||
| 266,985 | |||||||||||
| Energy | |||||||||||
| 330 | Petrobras International Finance Co. 5.75% 01/20/20 | 355,256 | |||||||||
| Finance | |||||||||||
| 465 | Banco Bradesco SA (e) 4.125% 05/16/16 | 469,650 | |||||||||
| 290 | Banco Votorantim SA (e) 5.25% 02/11/16 | 295,075 | |||||||||
| 764,725 | |||||||||||
| Total Brazil | 1,386,966 | ||||||||||
| Canada (0.3%) | |||||||||||
| Basic Materials | |||||||||||
| 220 | Teck Resources Ltd. 10.25% 05/15/16 | 253,003 | |||||||||
| PRINCIPAL AMOUNT IN THOUSANDS | VALUE | ||||||||||
| Finance | |||||||||||
| $ | 615 | Bank of Montreal (e) 2.85% 06/09/15 | $ | 650,615 | |||||||
| 380 | Brookfield Asset Management, Inc. 5.80% 04/25/17 | 407,581 | |||||||||
| 1,058,196 | |||||||||||
| Industrials | |||||||||||
| 65 | Bombardier, Inc. (e) 7.50% 03/15/18 | 73,125 | |||||||||
| 135 | Bombardier, Inc. (e) 7.75% 03/15/20 | 153,900 | |||||||||
| 227,025 | |||||||||||
| Total Canada | 1,538,224 | ||||||||||
| France (0.8%) | |||||||||||
| Communications | |||||||||||
| 145 | Vivendi SA (e) 6.625% 04/04/18 | 163,205 | |||||||||
| Consumer Staples | |||||||||||
| EUR | 250 | Europcar Groupe SA 4.962% (g) 05/15/13 | 268,150 | ||||||||
| Consumer, Cyclical | |||||||||||
| 333 | Cie Generale des Etablissements Michelin 0.00% 01/01/17 | 503,923 | |||||||||
| Finance | |||||||||||
| 400 | Banque Federative du Credit Mutuel SA 3.00% 10/29/15 | 516,629 | |||||||||
| $ | 455 | BNP Paribas SA 5.00% 01/15/21 | 456,323 | ||||||||
| EUR | 300 | Credit Agricole SA 3.90% 04/19/21 | 318,692 | ||||||||
| 350 | Credit Agricole SA 5.875% 06/11/19 | 445,624 | |||||||||
See Notes to Financial Statements
44
Morgan Stanley Global Strategist Fund
Portfolio of Investments n January 31, 2012 (unaudited) continued
| PRINCIPAL AMOUNT IN THOUSANDS | VALUE | ||||||||||
| $ | 250 | Societe Generale SA 6.125% 08/20/18 | $ | 316,392 | |||||||
| 2,053,660 | |||||||||||
| Utilities | |||||||||||
| 450 | RTE EDF Transport SA 5.125% 09/12/18 | 667,057 | |||||||||
| Total France | 3,655,995 | ||||||||||
| Germany (0.3%) | |||||||||||
| Communications | |||||||||||
| 150 | Deutsche Telekom International Finance BV 8.75% 06/15/30 | 217,414 | |||||||||
| Consumer, Cyclical | |||||||||||
| 45 | Daimler Finance North America LLC 8.50% 01/18/31 | 64,253 | |||||||||
| Finance | |||||||||||
| EUR | 400 | Deutsche Bank AG 5.00% 06/24/20 | 512,751 | ||||||||
| 300 | Kreditanstalt fuer Wiederaufbau 1.50% 07/30/14 | 439,309 | |||||||||
| 952,060 | |||||||||||
| Health Care | |||||||||||
| 100 | Celesio Finance B.V. 3.75% 10/29/14 | 129,987 | |||||||||
| Total Germany | 1,363,714 | ||||||||||
| Israel (0.1%) | |||||||||||
| Consumer, Non-Cyclical | |||||||||||
| $ | 360 | Teva Pharmaceutical Finance IV BV 3.65% 11/10/21 | 381,588 | ||||||||
| PRINCIPAL AMOUNT IN THOUSANDS | VALUE | ||||||||||
| Italy (0.7%) | |||||||||||
| Communications | |||||||||||
| EUR | 400 | Telecom Italia Finance SA 7.75% 01/24/33 | $ | 509,049 | |||||||
| Finance | |||||||||||
| 500 | Finmeccanica Finance SA 8.125% 12/03/13 | 685,661 | |||||||||
| 400 | Intesa Sanpaolo SpA 4.125% 04/14/20 | 473,303 | |||||||||
| $ | 100 | Intesa Sanpaolo SpA (e) 6.50% 02/24/21 | 92,443 | ||||||||
| EUR | 500 | UniCredit SpA 4.375% 02/10/14 | 655,160 | ||||||||
| 300 | UniCredit SpA 5.75% 09/26/17 | 349,676 | |||||||||
| 2,256,243 | |||||||||||
| Industrials | |||||||||||
| 200 | Wind Acquisition Finance SA 11.75% 07/15/17 | 240,053 | |||||||||
| Utilities | |||||||||||
| $ | 650 | Enel Finance International N.V. (e) 5.125% 10/07/19 | 595,513 | ||||||||
| Total Italy | 3,600,858 | ||||||||||
| Japan (0.1%) | |||||||||||
| Finance | |||||||||||
| 470 | Sumitomo Mitsui Banking Corp. (e) 3.95% 01/12/22 | 482,489 | |||||||||
See Notes to Financial Statements
45
Morgan Stanley Global Strategist Fund
Portfolio of Investments n January 31, 2012 (unaudited) continued
| PRINCIPAL AMOUNT IN THOUSANDS | VALUE | ||||||||||
| Luxembourg (0.1%) | |||||||||||
| Basic Materials | |||||||||||
| $ | 390 | ArcelorMittal 9.85% 06/01/19 | $ | 460,431 | |||||||
| Mexico (0.1%) | |||||||||||
| Finance | |||||||||||
| 625 | BBVA Bancomer SA (e) 4.50% 03/10/16 | 631,875 | |||||||||
| Netherlands (0.4%) | |||||||||||
| Basic Materials | |||||||||||
| 40 | LyondellBasell Industries N.V. (e) 6.00% 11/15/21 | 43,700 | |||||||||
| Finance | |||||||||||
| EUR | 200 | ABN Amro Bank N.V. 3.625% 10/06/17 | 262,816 | ||||||||
| $ | 275 | ABN Amro Bank N.V. 4.25% 02/02/17 | 274,730 | ||||||||
| 335 | Aegon N.V. 4.625% 12/01/15 | 350,665 | |||||||||
| EUR | 300 | Cooperatieve Centrale Raiffeisen- Boerenleenbank BA, Series G 3.75% 11/09/20 | 366,477 | ||||||||
| $ | 600 | ING Bank N.V. (e) 3.90% 03/19/14 | 632,328 | ||||||||
| 1,887,016 | |||||||||||
| Total Netherlands | 1,930,716 | ||||||||||
| Russia (0.0%) | |||||||||||
| Energy | |||||||||||
| 100 | Gazprom OAO Via Gaz Capital SA (e) 6.51% 03/07/22 | 106,000 | |||||||||
| PRINCIPAL AMOUNT IN THOUSANDS | VALUE | ||||||||||
| Spain (0.3%) | |||||||||||
| Communications | |||||||||||
| $ | 415 | Telefonica Europe BV 8.25% 09/15/30 | $ | 476,277 | |||||||
| Finance | |||||||||||
| EUR | 350 | Gas Natural Capital Markets SA 4.125% 01/26/18 | 439,367 | ||||||||
| $ | 125 | Santander Holdings USA, Inc. 4.625% 04/19/16 | 122,184 | ||||||||
| 561,551 | |||||||||||
| Utilities | |||||||||||
| 200 | Iberdrola Finance Ireland Ltd. (e) 5.00% 09/11/19 | 196,531 | |||||||||
| Total Spain | 1,234,359 | ||||||||||
| Sweden (0.2%) | |||||||||||
| Diversified | |||||||||||
| EUR | 150 | Industrivarden AB 1.875% 02/27/17 | 189,831 | ||||||||
| Finance | |||||||||||
| 480 | Nordea Bank AB 4.00% 03/29/21 | 593,791 | |||||||||
| Total Sweden | 783,622 | ||||||||||
| Switzerland (0.1%) | |||||||||||
| Finance | |||||||||||
| $ | 175 | ABB Treasury Center USA, Inc. (e) 2.50% 06/15/16 | 174,380 | ||||||||
| 110 | Credit Suisse 5.40% 01/14/20 | 111,421 | |||||||||
| 90 | Credit Suisse 6.00% 02/15/18 | 94,464 | |||||||||
| Total Switzerland | 380,265 | ||||||||||
See Notes to Financial Statements
46
Morgan Stanley Global Strategist Fund
Portfolio of Investments n January 31, 2012 (unaudited) continued
| PRINCIPAL AMOUNT IN THOUSANDS | VALUE | ||||||||||
| United Arab Emirates (0.1%) | |||||||||||
| Finance | |||||||||||
| EUR | 400 | Aabar Investments PJSC 4.00% 05/27/16 | $ | 498,367 | |||||||
| United Kingdom (1.3%) | |||||||||||
| Communications | |||||||||||
| $ | 265 | WPP Finance 2010 (e) 4.75% 11/21/21 | 272,750 | ||||||||
| 100 | WPP Finance UK 8.00% 09/15/14 | 112,773 | |||||||||
| 385,523 | |||||||||||
| Consumer, Non-Cyclical | |||||||||||
| 155 | BAT International Finance PLC (e) 9.50% 11/15/18 | 211,766 | |||||||||
| EUR | 350 | Imperial Tobacco Finance PLC 8.375% 02/17/16 | 556,405 | ||||||||
| 768,171 | |||||||||||
| Finance | |||||||||||
| 650 | Abbey National Treasury Services PLC 3.625% 10/14/16 | 866,275 | |||||||||
| $ | 265 | Abbey National Treasury Services PLC (e) 3.875% 11/10/14 | 259,842 | ||||||||
| EUR | 200 | Barclays Bank PLC 6.00% 01/23/18 | 256,575 | ||||||||
| 250 | Barclays Bank PLC 6.00% 01/14/21 | 307,947 | |||||||||
| 300 | FCE Bank PLC 4.75% 01/19/15 | 402,229 | |||||||||
| $ | 385 | HBOS PLC, Series G (e) 6.75% 05/21/18 | 339,138 | ||||||||
| PRINCIPAL AMOUNT IN THOUSANDS | VALUE | ||||||||||
| EUR | 400 | HSBC Holdings PLC 6.00% 06/10/19 | $ | 572,370 | |||||||
| 300 | Lloyds TSB Bank PLC 6.375% 06/17/16 | 424,762 | |||||||||
| $ | 150 | Lloyds TSB Bank PLC, MTN (e) 5.80% 01/13/20 | 153,062 | ||||||||
| 525 | Nationwide Building Society (e) 6.25% 02/25/20 | 537,730 | |||||||||
| EUR | 150 | Royal Bank of Scotland PLC (The) 5.50% 03/23/20 | 197,417 | ||||||||
| $ | 160 | Standard Chartered PLC (e) 3.85% 04/27/15 | 165,540 | ||||||||
| 4,482,887 | |||||||||||
| Industrials | |||||||||||
| EUR | 300 | BAA Funding Ltd. 4.60% 02/15/18 | 408,770 | ||||||||
| Information Technology | |||||||||||
| 250 | Lloyds TSB Bank PLC 6.50% 03/24/20 | 280,351 | |||||||||
| Total United Kingdom | 6,325,702 | ||||||||||
| United States (4.4%) | |||||||||||
| Basic Materials | |||||||||||
| $ | 255 | Barrick North America Finance LLC 4.40% 05/30/21 | 281,245 | ||||||||
| 200 | Georgia-Pacific LLC 7.75% 11/15/29 | 257,730 | |||||||||
| 275 | Georgia-Pacific LLC 8.875% 05/15/31 | 382,997 | |||||||||
| 921,972 | |||||||||||
See Notes to Financial Statements
47
Morgan Stanley Global Strategist Fund
Portfolio of Investments n January 31, 2012 (unaudited) continued
| PRINCIPAL AMOUNT IN THOUSANDS | VALUE | ||||||||||
| Communications | |||||||||||
| $ | 210 | AT&T, Inc. 6.30% 01/15/38 | $ | 256,991 | |||||||
| 70 | AT&T, Inc. 6.55% 02/15/39 | 88,628 | |||||||||
| 205 | CBS Corp. 8.875% 05/15/19 | 270,187 | |||||||||
| 40 | CenturyLink, Inc. 6.45% 06/15/21 | 42,213 | |||||||||
| 65 | CenturyLink, Inc., Series Q 6.15% 09/15/19 | 66,064 | |||||||||
| 170 | Comcast Corp. 5.15% 03/01/20 | 197,645 | |||||||||
| 105 | Comcast Corp. 5.70% 05/15/18 | 123,313 | |||||||||
| 50 | Comcast Corp. 6.45% 03/15/37 | 61,499 | |||||||||
| 95 | DirecTV Holdings LLC/ DirecTV Financing Co., Inc. 5.875% 10/01/19 | 108,608 | |||||||||
| 90 | DirecTV Holdings LLC/ DirecTV Financing Co., Inc. 7.625% 05/15/16 | 94,924 | |||||||||
| 55 | Frontier Communications Corp. 8.50% 04/15/20 | 54,725 | |||||||||
| 225 | NBC Universal Media LLC 4.375% 04/01/21 | 244,741 | |||||||||
| 135 | News America, Inc. 4.50% 02/15/21 | 147,025 | |||||||||
| 145 | Omnicom Group, Inc. 4.45% 08/15/20 | 153,886 | |||||||||
| 125 | Qwest Corp. 6.875% 09/15/33 | 125,125 | |||||||||
| 105 | Time Warner Cable, Inc. 6.75% 06/15/39 | 126,593 | |||||||||
| PRINCIPAL AMOUNT IN THOUSANDS | VALUE | ||||||||||
| $ | 75 | Verizon Communications, Inc. 4.60% 04/01/21 | $ | 85,326 | |||||||
| 60 | Verizon Communications, Inc. 5.85% 09/15/35 | 71,166 | |||||||||
| 150 | Verizon Communications, Inc. 6.35% 04/01/19 | 186,764 | |||||||||
| 125 | Verizon Communications, Inc. 8.95% 03/01/39 | 202,198 | |||||||||
| 2,707,621 | |||||||||||
| Consumer Staples | |||||||||||
| 235 | Philip Morris International, Inc. 5.65% 05/16/18 | 285,330 | |||||||||
| Consumer, Cyclical | |||||||||||
| 400 | Chrysler Group LLC/ CG Co-Issuer, Inc. (e) 8.00% 06/15/19 | 386,000 | |||||||||
| 175 | Home Depot, Inc. 5.40% 09/15/40 | 209,278 | |||||||||
| 400 | Home Depot, Inc. 5.875% 12/16/36 | 500,247 | |||||||||
| 90 | JC Penney Co., Inc. 5.65% 06/01/20 | 90,675 | |||||||||
| 151 | JC Penney Corp., Inc. 6.375% 10/15/36 | 130,615 | |||||||||
| 1,316,815 | |||||||||||
| Consumer, Non-Cyclical | |||||||||||
| 85 | Altria Group, Inc. 4.125% 09/11/15 | 93,043 | |||||||||
| 185 | Altria Group, Inc. 9.25% 08/06/19 | 252,226 | |||||||||
| 300 | Boston Scientific Corp. 6.00% 01/15/20 | 342,065 | |||||||||
See Notes to Financial Statements
48
Morgan Stanley Global Strategist Fund
Portfolio of Investments n January 31, 2012 (unaudited) continued
| PRINCIPAL AMOUNT IN THOUSANDS | VALUE | ||||||||||
| $ | 115 | Bunge Ltd. Finance Corp. 8.50% 06/15/19 | $ | 142,510 | |||||||
| 135 | ConAgra Foods, Inc. 8.25% 09/15/30 | 179,142 | |||||||||
| 484 | Gilead Sciences, Inc. 1.00% 05/01/14 | 587,455 | |||||||||
| 25 | Gilead Sciences, Inc. 5.65% 12/01/41 | 28,605 | |||||||||
| 230 | Life Technologies Corp. 6.00% 03/01/20 | 260,138 | |||||||||
| 265 | SABMiller Holdings, Inc. (e) 3.75% 01/15/22 | 276,437 | |||||||||
| 185 | UnitedHealth Group, Inc. 3.375% 11/15/21 | 194,971 | |||||||||
| 210 | UnitedHealth Group, Inc. 4.625% 11/15/41 | 223,656 | |||||||||
| 2,580,248 | |||||||||||
| Energy | |||||||||||
| 125 | Kinder Morgan Energy Partners LP 5.95% 02/15/18 | 143,827 | |||||||||
| 275 | Marathon Petroleum Corp. 5.125% 03/01/21 | 292,765 | |||||||||
| 190 | Plains All American Pipeline LP/PAA Finance Corp. 6.70% 05/15/36 | 225,056 | |||||||||
| 190 | Plains All American Pipeline LP/PAA Finance Corp. 8.75% 05/01/19 | 245,162 | |||||||||
| 906,810 | |||||||||||
| PRINCIPAL AMOUNT IN THOUSANDS | VALUE | ||||||||||
| Finance | |||||||||||
| $ | 350 | Bank of America Corp., Series L 5.65% 05/01/18 | $ | 358,538 | |||||||
| 180 | Bear Stearns Cos. LLC (The) 6.40% 10/02/17 | 204,756 | |||||||||
| 305 | Bear Stearns Cos. LLC (The) 7.25% 02/01/18 | 365,162 | |||||||||
| 180 | BNP Paribas/BNP Paribas US Medium- Term Note Program LLC (e) 5.125% 01/15/15 | 174,832 | |||||||||
| 75 | Boston Properties LP 5.875% 10/15/19 | 86,769 | |||||||||
| 455 | Capital One Bank, USA NA 8.80% 07/15/19 | 551,047 | |||||||||
| 245 | Citigroup, Inc. (See Note 6) 6.125% 05/15/18 | 269,570 | |||||||||
| 720 | Citigroup, Inc. (See Note 6) 8.50% 05/22/19 | 880,956 | |||||||||
| 235 | Farmers Exchange Capital (e) 7.05% 07/15/28 | 258,345 | |||||||||
| 275 | General Electric Capital Corp. 5.30% 02/11/21 | 299,697 | |||||||||
| 465 | General Electric Capital Corp. 5.625% 05/01/18 | 533,842 | |||||||||
| 635 | General Electric Capital Corp., Series G 6.00% 08/07/19 | 736,374 | |||||||||
See Notes to Financial Statements
49
Morgan Stanley Global Strategist Fund
Portfolio of Investments n January 31, 2012 (unaudited) continued
| PRINCIPAL AMOUNT IN THOUSANDS | VALUE | ||||||||||
| $ | 275 | Genworth Financial, Inc. 7.20% 02/15/21 | $ | 265,113 | |||||||
| 775 | Goldman Sachs Group, Inc. (The) 6.15% 04/01/18 | 836,772 | |||||||||
| 255 | Goldman Sachs Group, Inc. (The) 6.75% 10/01/37 | 253,277 | |||||||||
| 135 | Harley-Davidson Funding Corp. (e) 6.80% 06/15/18 | 161,190 | |||||||||
| 250 | Jefferies Group, Inc. 3.875% 11/09/15 | 230,625 | |||||||||
| 75 | JPMorgan Chase & Co. 6.00% 01/15/18 | 85,138 | |||||||||
| 1,280 | Merrill Lynch & Co., Inc., MTN 6.875% 04/25/18 | 1,383,081 | |||||||||
| 85 | NASDAQ OMX Group, Inc. (The) 5.55% 01/15/20 | 89,263 | |||||||||
| 265 | Prudential Financial, Inc., MTN 4.75% 09/17/15 | 286,638 | |||||||||
| 150 | Prudential Financial, Inc., MTN 6.625% 12/01/37 | 175,770 | |||||||||
| 435 | SLM Corp., MTN 6.25% 01/25/16 | 444,406 | |||||||||
| 8,931,161 | |||||||||||
| Industrials | |||||||||||
| 155 | Agilent Technologies, Inc. 5.50% 09/14/15 | 173,687 | |||||||||
| 375 | CRH America, Inc. 6.00% 09/30/16 | 410,131 | |||||||||
| 255 | L-3 Communications Corp. 4.75% 07/15/20 | 261,616 | |||||||||
| 845,434 | |||||||||||
| PRINCIPAL AMOUNT IN THOUSANDS | VALUE | ||||||||||
| Technology | |||||||||||
| $ | 410 | Hewlett-Packard Co. 4.65% 12/09/21 | $ | 441,925 | |||||||
| 731 | Intel Corp. 2.95% 12/15/35 | 825,116 | |||||||||
| 145 | KLA-Tencor Corp. 6.90% 05/01/18 | 171,660 | |||||||||
| 607 | Lam Research Corp. (e) 1.25% 05/15/18 | 619,899 | |||||||||
| 670 | Microsoft Corp. (e) 0.00% 06/15/13 | 698,475 | |||||||||
| 2,757,075 | |||||||||||
| Utilities | |||||||||||
| 375 | PPL WEM Holdings PLC (e) 3.90% 05/01/16 | 393,135 | |||||||||
| Total United States | 21,645,601 | ||||||||||
| Total Corporate Bonds (Cost $49,678,015) | 50,879,037 | ||||||||||
| Sovereign (14.8%) | |||||||||||
| Australia (0.6%) | |||||||||||
| AUD | 1,100 | Australia Government Bond 5.25% 03/15/19 | 1,292,879 | ||||||||
| 1,600 | Treasury Corp. of Victoria 5.75% 11/15/16 | 1,800,135 | |||||||||
| Total Australia | 3,093,014 | ||||||||||
| Bermuda (0.1%) | |||||||||||
| $ | 240 | Bermuda Government International Bond (e) 5.603% 07/20/20 | 267,313 | ||||||||
See Notes to Financial Statements
50
Morgan Stanley Global Strategist Fund
Portfolio of Investments n January 31, 2012 (unaudited) continued
| PRINCIPAL AMOUNT IN THOUSANDS | VALUE | ||||||||||
| Canada (1.3%) | |||||||||||
| EUR | 300 | Canada Government International Bond 3.50% 01/13/20 | $ | 449,253 | |||||||
| CAD | 4,150 | Canadian Government Bond 4.25% 06/01/18 | 4,828,271 | ||||||||
| $ | 300 | Province of Ontario Canada 4.00% 10/07/19 | 336,372 | ||||||||
| EUR | 600 | Province of Ontario Canada 4.00% 12/03/19 | 880,164 | ||||||||
| Total Canada | 6,494,060 | ||||||||||
| Denmark (0.1%) | |||||||||||
| DKK | 3,300 | Denmark Government Bond 4.00% 11/15/19 | 690,814 | ||||||||
| France (1.2%) | |||||||||||
| EUR | 200 | France Government Bond OAT 3.25% 10/25/21 | 265,042 | ||||||||
| 1,000 | France Government Bond OAT 4.00% 04/25/18 | 1,434,337 | |||||||||
| 3,000 | French Treasury Note BTAN 3.00% 07/12/14 | 4,110,875 | |||||||||
| Total France | 5,810,254 | ||||||||||
| Germany (1.9%) | |||||||||||
| $ | 2,200 | Bundesobligation 2.75% 04/08/16 | 3,135,255 | ||||||||
| 100 | Bundesrepublik Deutschland 2.25% 09/04/21 | 136,593 | |||||||||
| PRINCIPAL AMOUNT IN THOUSANDS | VALUE | ||||||||||
| $ | 750 | Bundesrepublik Deutschland 3.50% 07/04/19 | $ | 1,129,451 | |||||||
| 75 | Bundesrepublik Deutschland 4.25% 07/04/17 | 115,536 | |||||||||
| 650 | Bundesrepublik Deutschland 4.25% 07/04/39 | 1,134,945 | |||||||||
| 2,050 | Bundesrepublik Deutschland 4.75% 07/04/34 | 3,676,760 | |||||||||
| Total Germany | 9,328,540 | ||||||||||
| Italy (0.8%) | |||||||||||
| EUR | 850 | Italy Buoni Poliennali Del Tesoro 3.00% 06/15/15 | 1,074,704 | ||||||||
| 1,100 | Italy Buoni Poliennali Del Tesoro 4.50% 02/01/18 | 1,399,313 | |||||||||
| 800 | Italy Buoni Poliennali Del Tesoro 5.00% 08/01/39 | 855,444 | |||||||||
| $ | 330 | Republic of Italy 6.875% 09/27/23 | 340,296 | ||||||||
| Total Italy | 3,669,757 | ||||||||||
| Japan (4.3%) | |||||||||||
| JPY | 110,000 | Japan Finance Organization for Municipalities 1.90% 06/22/18 | 1,568,454 | ||||||||
| 140,000 | Japan Government Ten Year Bond 1.30% 12/20/13 | 1,877,045 | |||||||||
| 380,000 | Japan Government Ten Year Bond 1.40% 09/20/15 | 5,192,100 | |||||||||
See Notes to Financial Statements
51
Morgan Stanley Global Strategist Fund
Portfolio of Investments n January 31, 2012 (unaudited) continued
| PRINCIPAL AMOUNT IN THOUSANDS | VALUE | ||||||||||
| JPY | 290,000 | Japan Government Ten Year Bond 1.70% 06/20/18 | $ | 4,095,601 | |||||||
| 120,000 | Japan Government Ten Year Bond 1.90% 06/20/16 | 1,683,402 | |||||||||
| 505,000 | Japan Government Thirty Year Bond 1.70% 06/20/33 | 6,546,873 | |||||||||
| Total Japan | 20,963,475 | ||||||||||
| Korea, Republic of (0.2%) | |||||||||||
| $ | 200 | Korea Development Bank 3.875% 05/04/17 | 202,997 | ||||||||
| 200 | Korea Development Bank 4.375% 08/10/15 | 208,972 | |||||||||
| 630 | Korea Finance Corp. 4.625% 11/16/21 | 629,241 | |||||||||
| 150 | Republic of Korea 7.125% 04/16/19 | 188,852 | |||||||||
| Total Korea, Republic of | 1,230,062 | ||||||||||
| Mexico (0.5%) | |||||||||||
| MXN | 24,400 | Mexican Bonos 10.00% 12/05/24 | 2,507,653 | ||||||||
| Netherlands (0.6%) | |||||||||||
| EUR | 1,800 | Netherlands Government Bond 4.00% 07/15/19 | 2,711,449 | ||||||||
| 100 | Netherlands Government Bond 4.00% 01/15/37 | 164,498 | |||||||||
| Total Netherlands | 2,875,947 | ||||||||||
| PRINCIPAL AMOUNT IN THOUSANDS | VALUE | ||||||||||
| Norway (0.1%) | |||||||||||
| NOK | 3,500 | Norway Government Bond 6.50% 05/15/13 | $ | 634,478 | |||||||
| Poland (0.4%) | |||||||||||
| PLN | 6,000 | Poland Government Bond 5.25% 10/25/17 | 1,866,244 | ||||||||
| South Africa (0.1%) | |||||||||||
| ZAR | 3,000 | South Africa Government Bond 7.25% 01/15/20 | 374,850 | ||||||||
| Supernational (0.4%) | |||||||||||
| JPY | 145,000 | European Investment Bank 2.15% 01/18/27 | 1,905,782 | ||||||||
| Sweden (0.3%) | |||||||||||
| SEK | 7,800 | Sweden Government Bond 4.25% 03/12/19 | 1,360,864 | ||||||||
| United Kingdom (1.9%) | |||||||||||
| GBP | 500 | United Kingdom Gilt 2.75% 01/22/15 | 841,437 | ||||||||
| 1,300 | United Kingdom Gilt 4.00% 09/07/16 | 2,340,505 | |||||||||
| 2,450 | United Kingdom Gilt 4.25% 06/07/32 | 4,726,365 | |||||||||
| 570 | United Kingdom Gilt 4.25% 09/07/39 | 1,108,786 | |||||||||
| Total United Kingdom | 9,017,093 | ||||||||||
| Total Sovereign (Cost $65,796,713) | 72,090,200 | ||||||||||
See Notes to Financial Statements
52
Morgan Stanley Global Strategist Fund
Portfolio of Investments n January 31, 2012 (unaudited) continued
| PRINCIPAL AMOUNT IN THOUSANDS | VALUE | ||||||||||
| Municipal Bonds (0.1%) | |||||||||||
| $ | 145 | Illinois State Toll Highway Authority, Highway Revenue, Build America Bonds 6.184% 01/01/34 | $ | 173,345 | |||||||
| Municipal Electric Authority of Georgia | |||||||||||
| 160 | 6.637% 04/01/57 | 186,539 | |||||||||
| 295 | 6.655% 04/01/57 | 338,344 | |||||||||
| Total Municipal Bonds (Cost $603,725) | 698,228 | ||||||||||
| Agency Fixed Rate Mortgages (5.4%) | |||||||||||
| Federal Home Loan Mortgage Corporation, February TBA: | |||||||||||
| 1,800 | (h) 3.00% 02/25/27 | 1,875,094 | |||||||||
| 1,805 | (h) 3.50% 02/25/42 | 1,872,405 | |||||||||
| Gold Pools: | |||||||||||
| 883 | 4.00% 12/01/41 | 932,842 | |||||||||
| 957 | 6.00% 11/01/37 - 02/01/38 | 1,053,318 | |||||||||
| 308 | 6.50% 05/01/32 - 09/01/32 | 350,531 | |||||||||
| Federal National Mortgage Association, Conventional Pools: | |||||||||||
| 3,013 | 4.00% 11/01/41 - 01/01/42 | 3,190,503 | |||||||||
| 3,257 | 4.50% 08/01/40 - 08/01/41 | 3,493,881 | |||||||||
| 2,599 | 5.00% 01/01/41 - 03/01/41 | 2,830,676 | |||||||||
| 2,528 | 5.50% 02/01/38 - 06/01/38 | 2,755,808 | |||||||||
| PRINCIPAL AMOUNT IN THOUSANDS | VALUE | ||||||||||
| $ | 1,286 | 6.00% 03/01/37 - 10/01/38 | $ | 1,416,630 | |||||||
| 75 | 6.50% 12/01/29 | 86,343 | |||||||||
| 773 | 7.00% 12/01/17 - 02/01/31 | 903,139 | |||||||||
| Government National Mortgage Association, February TBA: | |||||||||||
| 2,065 | (h) 4.00% 02/25/42 | 2,227,296 | |||||||||
| Various Pools: | |||||||||||
| 2,676 | 4.50% 04/15/39 - 08/15/39 | 2,931,840 | |||||||||
| 302 | 5.50% 08/15/39 | 339,035 | |||||||||
| Total Agency Fixed Rate Mortgages (Cost $25,905,207) | 26,259,341 | ||||||||||
| Asset-Backed Securities (0.7%) | |||||||||||
| 59 | ARI Fleet Lease Trust (e) 1.735% (g) 08/15/18 | 59,191 | |||||||||
| 71 | Chesapeake Funding LLC (e) 2.285% (g) 12/15/20 | 71,411 | |||||||||
| 825 | CNH Equipment Trust 1.20% 05/16/16 | 831,817 | |||||||||
| 409 | CVS Pass-Through Trust 6.036% 12/10/28 | 434,799 | |||||||||
| 525 | Ford Credit Floorplan Master Owner Trust (e) 1.985% (g) 02/15/17 | 542,227 | |||||||||
| 430 | FUEL Trust (e) 4.207% 04/15/16 | 441,997 | |||||||||
See Notes to Financial Statements
53
Morgan Stanley Global Strategist Fund
Portfolio of Investments n January 31, 2012 (unaudited) continued
| PRINCIPAL AMOUNT IN THOUSANDS | VALUE | ||||||||||
| $ | 325 | GE Dealer Floorplan Master Note Trust (e) 1.84% (g) 10/20/14 | $ | 327,574 | |||||||
| 425 | SLM Student Loan Trust (e) 4.37% 04/17/28 | 438,689 | |||||||||
| Total Asset-Backed Securities (Cost $3,070,533) | 3,147,705 | ||||||||||
| U.S. Treasury Securities (3.8%) | |||||||||||
| U.S. Treasury Bonds | |||||||||||
| 1,960 | 3.50% 02/15/39 | 2,191,525 | |||||||||
| 2,900 | 6.875% 08/15/25 | 4,478,235 | |||||||||
| U.S. Treasury Notes | |||||||||||
| 7,720 | 3.125% 05/15/19 | 8,715,764 | |||||||||
| 2,700 | 3.625% 02/15/21 | 3,154,572 | |||||||||
| Total U.S. Treasury Securities (Cost $16,216,847) | 18,540,096 | ||||||||||
| Commercial Mortgage Backed Securities (0.9%) | |||||||||||
| United States | |||||||||||
| 500 | Banc of America Merrill Lynch Commercial Mortgage, Inc. 5.817% (g) 04/10/49 | 485,616 | |||||||||
| 440 | Bear Stearns Commercial Mortgage Securities 5.363% 02/11/44 | 353,605 | |||||||||
| Greenwich Capital Commercial Funding Corp. | |||||||||||
| 410 | 5.475% 03/10/39 | 400,281 | |||||||||
| 1,315 | 5.867% (g) 12/10/49 | 1,226,588 | |||||||||
| PRINCIPAL AMOUNT IN THOUSANDS | VALUE | ||||||||||
| JP Morgan Chase Commercial Mortgage Securities Corp. | |||||||||||
| $ | 700 | 4.171% 08/15/46 | $ | 773,049 | |||||||
| 425 | 6.256% (g) 02/15/51 | 409,036 | |||||||||
| 510 | LB-UBS Commercial Mortgage Trust 6.364% (g) 09/15/45 | 512,266 | |||||||||
| Total Commercial Mortgage Backed Securities (Cost $4,279,759) | 4,160,441 | ||||||||||
| Short-Term Investments (2.3%) | |||||||||||
| U.S. Treasury Securities (0.5%) | |||||||||||
| U.S. Treasury Bills | |||||||||||
| 335 | (i)(j) 0.005% 03/22/12 | 334,998 | |||||||||
| 130 | (i)(j) 0.013% 03/22/12 | 129,998 | |||||||||
| 320 | (i)(j) 0.015% 03/22/12 | 319,993 | |||||||||
| 1,325 | (i)(j) 0.018% 03/22/12 | 1,324,968 | |||||||||
| 500 | (i)(j) 0.02% 03/22/12 | 499,986 | |||||||||
| Total U.S. Treasury Securities (Cost $2,609,943) | 2,609,943 | ||||||||||
See Notes to Financial Statements
54
Morgan Stanley Global Strategist Fund
Portfolio of Investments n January 31, 2012 (unaudited) continued
| NUMBER OF SHARES (000) | VALUE | ||||||||||
| Investment Company (1.8%) | |||||||||||
| 8,499 | Morgan Stanley Institutional Liquidity Funds - Money Market Portfolio - Institutional Class (See Note 6) (Cost $8,498,980) | $ | 8,498,980 | ||||||||
| Total Short-Term Investments (Cost $11,108,923) | 11,108,923 | ||||||||||
| Total Investments (Cost $449,482,813) (k) | 97.0 | % | 471,746,872 | ||||||||
| Other Assets in Excess of Liabilities | 3.0 | 14,549,669 | |||||||||
| Net Assets | 100.0 | % | $ | 486,296,541 | |||||||
ADR American Depositary Receipt.
BTAN Bons du Trésor à Intérets Annuels (Treasury Bill Annual Interest).
CVA Certificaten Van Aandelen.
GDR Global Depositary Receipt.
MTN Medium Term Note.
OAT Obligations Assimilables du Trésor (French Treasury Obligation).
PPS Price Protected Shares
SDR Swedish Depositary Receipt.
SPDR Standard & Poor's Depository Receipt.
TBA To Be Announced.
(a) Non-income producing security.
(b) Comprised of securities in separate entities that are traded as a single stapled security.
(c) Consists of one or more classes of securities traded together as a unit; stocks with attached warrants.
(d) Security trades on the Hong Kong exchange.
(e) 144A security - Certain conditions for public sale may exist. Unless otherwise noted, these securities are deemed to be liquid.
(f) Security is linked to the Dow Jones UBS Commodities Index Total Return. The index is currently comprised of futures contracts on nineteen physical commodities traded on U.S. exchanges, with the exception of aluminum, nickel, and zinc, which trade on the London Metal Exchange.
(g) Variable/Floating Rate Security - Interest rate changes on these instruments are based on changes in a designated base rate. The rates shown are those in effect on January 31, 2012.
(h) Security is subject to delayed delivery.
(i) Rate shown is the yield to maturity at January 31, 2012.
(j) A portion of this security has been physically segregated in connection with open swap agreements.
(k) Securities are available for collateral in connection with securities purchased on a forward commitment basis, open foreign currency exchange contracts, futures contracts and swap agreements.
See Notes to Financial Statements
55
Morgan Stanley Global Strategist Fund
Portfolio of Investments n January 31, 2012 (unaudited) continued
Foreign Currency Exchange Contracts Open at January 31, 2012:
| COUNTERPARTY | CONTRACTS TO DELIVER | IN EXCHANGE FOR | DELIVERY DATE | UNREALIZED APPRECIATION (DEPRECIATION) | |||||||||||||||
| Bank of America NA | CAD | 5,824,361 | $ | 5,739,243 | 02/16/12 | $ | (67,428 | ) | |||||||||||
| Bank of America NA | MYR | 1,252,307 | $ | 399,040 | 02/16/12 | (12,258 | ) | ||||||||||||
| Credit Suisse London Branch | HUF | 572,133,553 | $ | 2,338,681 | 02/16/12 | (200,063 | ) | ||||||||||||
| Credit Suisse London Branch | $ | 2,644,433 | HUF | 596,240,342 | 02/16/12 | 1,280 | |||||||||||||
| Deutsche Bank AG London | AUD | 220,523 | $ | 228,475 | 02/16/12 | (5,275 | ) | ||||||||||||
| Deutsche Bank AG London | EUR | 8,801,197 | $ | 11,211,405 | 02/16/12 | (301,295 | ) | ||||||||||||
| Deutsche Bank AG London | EUR | 1,650,663 | $ | 2,156,113 | 02/16/12 | (3,092 | ) | ||||||||||||
| Deutsche Bank AG London | JPY | 332,090,114 | $ | 4,324,557 | 02/16/12 | (33,086 | ) | ||||||||||||
| Deutsche Bank AG London | JPY | 225,299,129 | $ | 2,951,453 | 02/16/12 | (4,893 | ) | ||||||||||||
| Deutsche Bank AG London | $ | 2,604,036 | EUR | 1,999,106 | 02/16/12 | 10,962 | |||||||||||||
| Deutsche Bank AG London | $ | 2,611,824 | EUR | 1,999,406 | 02/16/12 | 3,566 | |||||||||||||
| Deutsche Bank AG London | $ | 2,585,825 | EUR | 2,004,406 | 02/16/12 | 36,106 | |||||||||||||
| Deutsche Bank AG London | $ | 2,617,423 | EUR | 1,999,406 | 02/16/12 | (2,033 | ) | ||||||||||||
| Deutsche Bank AG London | $ | 1,667,987 | INR | 86,785,383 | 02/16/12 | 81,098 | |||||||||||||
| Goldman Sachs International | EUR | 1,833,843 | $ | 2,335,876 | 02/16/12 | (62,944 | ) | ||||||||||||
| JPMorgan Chase Bank | NOK | 3,557,217 | $ | 589,407 | 02/16/12 | (16,567 | ) | ||||||||||||
| JPMorgan Chase Bank | SEK | 10,764,967 | $ | 1,553,476 | 02/16/12 | (27,957 | ) | ||||||||||||
| JPMorgan Chase Bank | $ | 1,700,927 | SEK | 11,595,559 | 02/16/12 | 2,525 | |||||||||||||
| JPMorgan Chase Bank | $ | 197,534 | SGD | 253,744 | 02/16/12 | 4,193 | |||||||||||||
| Royal Bank of Scotland | CAD | 3,965,199 | $ | 3,907,138 | 02/16/12 | (46,016 | ) | ||||||||||||
| Royal Bank of Scotland | CZK | 40,926,796 | $ | 2,029,913 | 02/16/12 | (84,065 | ) | ||||||||||||
| Royal Bank of Scotland | MXN | 20,469,198 | $ | 1,516,518 | 02/16/12 | (52,028 | ) | ||||||||||||
| Royal Bank of Scotland | $ | 2,406,289 | CZK | 46,256,098 | 02/16/12 | (17,039 | ) | ||||||||||||
| Royal Bank of Scotland | $ | 1,130,665 | ILS | 4,349,046 | 02/16/12 | 30,859 | |||||||||||||
| Royal Bank of Scotland | $ | 619,209 | THB | 19,765,167 | 02/16/12 | 19,235 | |||||||||||||
| State Street Bank and Trust Co. | $ | 4,927,678 | TWD | 147,165,113 | 02/16/12 | 47,231 | |||||||||||||
| UBS AG | AUD | 314,208 | $ | 325,581 | 02/16/12 | (7,474 | ) | ||||||||||||
| UBS AG | BRL | 647,459 | $ | 357,614 | 02/16/12 | (11,589 | ) | ||||||||||||
| UBS AG | CAD | 4,131,688 | $ | 4,113,793 | 02/16/12 | (5,346 | ) | ||||||||||||
| UBS AG | EUR | 1,842,270 | $ | 2,346,604 | 02/16/12 | (63,238 | ) | ||||||||||||
| UBS AG | GBP | 4,215,313 | $ | 6,470,776 | 02/16/12 | (170,985 | ) | ||||||||||||
| UBS AG | JPY | 249,335,205 | $ | 3,246,899 | 02/16/12 | (24,845 | ) | ||||||||||||
| UBS AG | $ | 1,432,203 | AUD | 1,353,024 | 02/16/12 | 1,978 | |||||||||||||
| UBS AG | $ | 9,316,321 | CAD | 9,454,491 | 02/16/12 | 109,454 | |||||||||||||
| UBS AG | $ | 563,689 | CHF | 519,231 | 02/16/12 | 492 | |||||||||||||
| UBS AG | $ | 1,584,411 | CHF | 1,503,663 | 02/16/12 | 49,426 | |||||||||||||
| UBS AG | $ | 495,836 | GBP | 314,832 | 02/16/12 | 222 | |||||||||||||
| UBS AG | $ | 2,199,839 | GBP | 1,419,486 | 02/16/12 | 36,742 | |||||||||||||
| UBS AG | $ | 2,213,391 | GBP | 1,419,060 | 02/16/12 | 22,519 | |||||||||||||
| UBS AG | $ | 2,219,666 | GBP | 1,419,060 | 02/16/12 | 16,244 | |||||||||||||
| UBS AG | $ | 9,456,940 | HKD | 73,434,868 | 02/16/12 | 12,110 | |||||||||||||
| UBS AG | $ | 2,074,661 | INR | 104,417,663 | 02/16/12 | 29,788 | |||||||||||||
| UBS AG | $ | 2,787,178 | KRW | 3,225,322,092 | 02/16/12 | 80,720 | |||||||||||||
| UBS AG | $ | 1,289,424 | MXN | 17,401,376 | 02/16/12 | 44,036 | |||||||||||||
See Notes to Financial Statements
56
Morgan Stanley Global Strategist Fund
Portfolio of Investments n January 31, 2012 (unaudited) continued
| COUNTERPARTY | CONTRACTS TO DELIVER | IN EXCHANGE FOR | DELIVERY DATE | UNREALIZED APPRECIATION (DEPRECIATION) | |||||||||||||||
| UBS AG | $ | 315,132 | NZD | 394,565 | 02/16/12 | $ | 10,326 | ||||||||||||
| UBS AG | $ | 2,584,639 | RUB | 82,909,275 | 02/16/12 | 147,769 | |||||||||||||
| UBS AG | $ | 1,388,964 | SGD | 1,784,181 | 02/16/12 | 29,462 | |||||||||||||
| UBS AG | $ | 613,014 | TRY | 1,139,592 | 02/16/12 | 26,005 | |||||||||||||
| UBS AG | $ | 3,196,310 | ZAR | 25,895,301 | 02/16/12 | 107,649 | |||||||||||||
| Goldman Sachs International | $ | 167,121 | CAD | 170,000 | 02/23/12 | 2,336 | |||||||||||||
| Goldman Sachs International | $ | 4,237,782 | EUR | 3,295,000 | 02/23/12 | 72,409 | |||||||||||||
| JPMorgan Chase Bank | AUD | 1,760,000 | $ | 1,820,386 | 02/23/12 | (43,718 | ) | ||||||||||||
| JPMorgan Chase Bank | AUD | 566,301 | $ | 597,482 | 02/23/12 | (2,316 | ) | ||||||||||||
| JPMorgan Chase Bank | MXN | 24,935,000 | $ | 1,848,817 | 02/23/12 | (60,793 | ) | ||||||||||||
| JPMorgan Chase Bank | SEK | 6,400,000 | $ | 933,189 | 02/23/12 | (6,689 | ) | ||||||||||||
| JPMorgan Chase Bank | $ | 1,841,744 | CAD | 1,871,580 | 02/23/12 | 23,851 | |||||||||||||
| JPMorgan Chase Bank | $ | 948,577 | CAD | 950,000 | 02/23/12 | (1,615 | ) | ||||||||||||
| JPMorgan Chase Bank | ZAR | 8,480,000 | $ | 1,046,784 | 02/23/12 | (34,030 | ) | ||||||||||||
| UBS AG | AUD | 469,660 | $ | 484,736 | 02/23/12 | (12,704 | ) | ||||||||||||
| UBS AG | GBP | 440,678 | $ | 690,798 | 02/23/12 | (3,508 | ) | ||||||||||||
| UBS AG | PLN | 7,650,000 | $ | 2,228,177 | 02/23/12 | (137,263 | ) | ||||||||||||
| UBS AG | $ | 1,679,939 | CLP | 843,850,000 | 02/23/12 | 32,362 | |||||||||||||
| UBS AG | $ | 912,127 | GBP | 594,813 | 02/23/12 | 25,024 | |||||||||||||
| UBS AG | $ | 17,416,316 | JPY | 1,337,607,874 | 02/23/12 | 136,906 | |||||||||||||
| UBS AG | $ | 1,561,156 | KRW | 1,790,880,000 | 02/23/12 | 30,357 | |||||||||||||
| UBS AG | $ | 954,575 | MYR | 2,900,000 | 02/23/12 | (2,588 | ) | ||||||||||||
| UBS AG | $ | 522,413 | NOK | 3,142,000 | 02/23/12 | 12,680 | |||||||||||||
| UBS AG | $ | 1,090,041 | SGD | 1,402,000 | 02/23/12 | 24,546 | |||||||||||||
| UBS AG | $ | 423,529 | THB | 13,500,000 | 02/23/12 | 12,306 | |||||||||||||
| UBS AG | ZAR | 2,855,000 | $ | 353,385 | 02/23/12 | (10,497 | ) | ||||||||||||
| Net Unrealized Depreciation | $ | (200,463 | ) | ||||||||||||||||
Futures Contracts Open at January 31, 2012:
| NUMBER OF CONTRACTS | LONG/SHORT | DESCRIPTION, DELIVERY MONTH AND YEAR | UNDERLYING FACE AMOUNT AT VALUE | UNREALIZED APPRECIATION (DEPRECIATION) | |||||||||||||||
| 115 | Long | DAX Index, March 2012 | $ | 24,307,117 | $ | 1,238,806 | |||||||||||||
| 4 | Long | 10 yr. Japan Government Bond, March 2012 | 7,475,720 | 50,331 | |||||||||||||||
| 50 | Long | U.S. Treasury 30 yr. Bond, March 2012 | 7,271,875 | 861 | |||||||||||||||
| 99 | Long | Hang Seng China ENT Index, February 2012 | 7,202,901 | (57,439 | ) | ||||||||||||||
| 59 | Long | KOSPI 200 Index, March 2012 | 6,781,844 | 183,825 | |||||||||||||||
See Notes to Financial Statements
57
Morgan Stanley Global Strategist Fund
Portfolio of Investments n January 31, 2012 (unaudited) continued
| NUMBER OF CONTRACTS | LONG/SHORT | DESCRIPTION, DELIVERY MONTH AND YEAR | UNDERLYING FACE AMOUNT AT VALUE | UNREALIZED APPRECIATION (DEPRECIATION) | |||||||||||||||
| 646 | Long | SGX CNX Nifty Index, February 2012 | $ | 6,757,160 | $ | 113,530 | |||||||||||||
| 75 | Long | U.S. Dollar Index, March 2012 | 5,956,275 | (115,275 | ) | ||||||||||||||
| 34 | Long | German Euro Bobl, March 2012 | 5,582,513 | 109,453 | |||||||||||||||
| 45 | Long | FTSE MIB Index, March 2012 | 4,655,089 | 1,817 | |||||||||||||||
| 170 | Long | MSCI Taiwan Index, February 2012 | 4,559,400 | 137,487 | |||||||||||||||
| 40 | Long | FTSE 100 Index, March 2012 | 3,556,263 | 151,280 | |||||||||||||||
| 78 | Long | FTSE/JSE top 40, March 2012 | 3,013,839 | 107,897 | |||||||||||||||
| 81 | Long | MEX BOLSA Index, March 2012 | 2,339,828 | 32,898 | |||||||||||||||
| 52 | Long | CAC 40 Index, February 2012 | 2,244,596 | 32,418 | |||||||||||||||
| 41 | Long | SGX MSCI Singapore Index, February 2012 | 2,173,015 | (1,957 | ) | ||||||||||||||
| 10 | Long | UK Long Gilt Bond, March 2012 | 1,846,806 | 35,170 | |||||||||||||||
| 13 | Long | IBEX 35 Index, February 2012 | 1,444,035 | (5,692 | ) | ||||||||||||||
| 8 | Long | Hang Seng Index, February 2012 | 1,049,871 | (3,507 | ) | ||||||||||||||
| 5 | Long | German Euro Schatz Futures, March 2012 | 721,687 | 588 | |||||||||||||||
| 14 | Long | E-mini MSCI Emerging Market Index, March 2012 | 713,440 | 68,610 | |||||||||||||||
| 4 | Long | TOPIX Index, March 2012 | 396,618 | 5,881 | |||||||||||||||
| 10 | Long | BOVESPA Index, February 2012 | 362,622 | 30,703 | |||||||||||||||
| 19 | Short | Euro Stoxx 50 Index, March 2012 | (600,981 | ) | (413 | ) | |||||||||||||
| 9 | Short | ASX SPI 200 Index, March 2012 | (1,008,043 | ) | (46,566 | ) | |||||||||||||
| 29 | Short | NIKKEI 225 Index, March 2012 | (1,672,456 | ) | (16,202 | ) | |||||||||||||
See Notes to Financial Statements
58
Morgan Stanley Global Strategist Fund
Portfolio of Investments n January 31, 2012 (unaudited) continued
| NUMBER OF CONTRACTS | LONG/SHORT | DESCRIPTION, DELIVERY MONTH AND YEAR | UNDERLYING FACE AMOUNT AT VALUE | UNREALIZED APPRECIATION (DEPRECIATION) | |||||||||||||||
| 14 | Short | U.S. Treasury Ultra Long Bond, March 2012 | $ | (2,239,562 | ) | $ | 4,229 | ||||||||||||
| 18 | Short | U.S. Treasury 2 yr. Note, March 2012 | (3,973,500 | ) | (1,204 | ) | |||||||||||||
| 33 | Short | U.S. Treasury 30 yr. Bond, March 2012 | (4,799,438 | ) | (49,500 | ) | |||||||||||||
| 280 | Short | S&P 500 E Mini Index, March 2012 | (18,314,800 | ) | (126,808 | ) | |||||||||||||
| 108 | Short | German Euro Bund, March 2012 | (19,723,062 | ) | (222,486 | ) | |||||||||||||
| 206 | Short | U.S. Treasury 5 yr. Note, March 2012 | (25,553,656 | ) | (212,875 | ) | |||||||||||||
| 226 | Short | U.S. Treasury 10 yr. Note, March 2012 | (29,888,500 | ) | (520,808 | ) | |||||||||||||
| Net Unrealized Appreciation | $ | 925,052 | |||||||||||||||||
Interest Rate Swap Agreements Open at January 31, 2012:
| SWAP COUNTERPARTY | NOTIONAL AMOUNT (000) | FLOATING RATE INDEX | PAY/RECEIVE FLOATING RATE | FIXED RATE | TERMINATION DATE | UNREALIZED APPRECIATION (DEPRECIATION) | |||||||||||||||||||||
| Bank of America | EUR | 9,270 | 6 Month EURIBOR | Pay | 4.26 | % | 08/18/26 | $ | 443,585 | ||||||||||||||||||
| Bank of America | $ | 12,415 | 3 Month LIBOR | Receive | 4.35 | 08/18/26 | (465,106 | ) | |||||||||||||||||||
| Bank of America | EUR | 11,705 | 6 Month EURIBOR | Receive | 3.61 | 08/18/31 | (427,918 | ) | |||||||||||||||||||
| Bank of America | $ | 15,400 | 3 Month LIBOR | Pay | 4.15 | 08/18/31 | 480,161 | ||||||||||||||||||||
| Barclays Bank PLC | EUR | 14,220 | 6 Month LIBOR | Receive | 1.52 | 01/27/15 | (44,746 | ) | |||||||||||||||||||
| Barclays Bank PLC | 14,820 | 6 Month LIBOR | Pay | 2.62 | 01/26/17 | 54,536 | |||||||||||||||||||||
| Barclays Capital | SEK | 271,024 | 3 Month STIBOR | Pay | 2.76 | 07/30/12 | 639,605 | ||||||||||||||||||||
| Barclays Capital | 135,530 | 3 Month STIBOR | Pay | 2.30 | 09/12/12 | 114,071 | |||||||||||||||||||||
| Barclays Capital | 317,510 | 3 Month STIBOR | Receive | 2.89 | 07/29/13 | (488,367 | ) | ||||||||||||||||||||
| JPMorgan Chase Bank | EUR | 14,220 | 6 Month LIBOR | Receive | 1.48 | 01/27/15 | (38,234 | ) | |||||||||||||||||||
| JPMorgan Chase Bank | 14,820 | 6 Month LIBOR | Pay | 2.60 | 01/27/17 | 50,520 | |||||||||||||||||||||
| Net Unrealized Appreciation | $ | 318,107 | |||||||||||||||||||||||||
See Notes to Financial Statements
59
Morgan Stanley Global Strategist Fund
Portfolio of Investments n January 31, 2012 (unaudited) continued
Total Return Swaps Contracts Open at January 31, 2012:
| SWAP COUNTERPARTY | INDEX | NOTIONAL AMOUNT (000) | FLOATING RATE | PAY/RECEIVE TOTAL RETURN ON REFERENCED INDEX | MATURITY DATE | UNREALIZED APPRECIATION | |||||||||||||||||||||
| Goldman Sachs International | DEDA Index - Euro Stoxx 50 Index | EUR | 5,677 | Zero Coupon | Receive | 12/26/13 | $ | 237,477 | |||||||||||||||||||
Zero Coupon Swap Agreements Open at January 31, 2012:
| SWAP COUNTERPARTY | NOTIONAL AMOUNT (000) | FLOATING RATE INDEX | PAY/RECEIVE FLOATING RATE | TERMINATION DATE | UNREALIZED APPRECIATION (DEPRECIATION) | ||||||||||||||||||
| Barclays Capital | $ | 2,645 | 3 Month LIBOR | Receive | 11/15/19 | $ | (1,100,698 | ) | |||||||||||||||
| Barclays Capital | 3,134 | 3 Month LIBOR | Pay | 11/15/19 | 638,117 | ||||||||||||||||||
| Net Unrealized Depreciation | $ | (462,581 | ) | ||||||||||||||||||||
EURIBOR Euro Interbank Offered Rate.
LIBOR London Interbank Offered Rate.
STIBOR Stockholm Interbank Offered Rate.
Currency Abbreviations:
AUD Australian Dollar.
BRL Brazilian Real.
CAD Canadian Dollar.
CHF Swiss Franc.
CLP Chilean Peso.
CZK Czech Koruna.
DKK Danish Krone.
EUR Euro.
GBP British Pound.
HKD Hong Kong Dollar.
HUF Hungarian Forint.
ILS Israeli Shekel.
INR Indian Rupee.
JPY Japanese Yen.
KRW South Korean Won.
MXN Mexican New Peso.
MYR Malaysian Ringgit.
NOK Norwegian Krone.
NZD New Zealand Dollar.
PLN Polish Zloty.
RUB Russian Ruble.
SEK Swedish Krona.
SGD Singapore Dollar.
THB Thai Baht.
TRY Turkish Lira.
TWD Taiwan Dollar.
USD United States Dollar.
ZAR South African Rand.
See Notes to Financial Statements
60
Morgan Stanley Global Strategist Fund
Financial Statements
Statement of Assets and Liabilities
January 31, 2012 (unaudited)
| Assets: | |||||||
| Investments in securities, at value (cost $439,411,175) | $ | 461,440,972 | |||||
| Investment in affiliate, at value (cost $10,071,638) | 10,305,900 | ||||||
| Total investments in securities, at value (cost $449,482,813) | 471,746,872 | ||||||
| Unrealized appreciation on open swap agreements | 2,658,072 | ||||||
| Unrealized appreciation on open foreign currency exchange contracts | 1,334,774 | ||||||
| Foreign currency (cost of $4,117,848) | 4,281,867 | ||||||
| Receivable for: | |||||||
| Variation margin | 10,201,579 | ||||||
| Investments sold | 10,166,153 | ||||||
| Interest | 1,864,414 | ||||||
| Dividends | 319,819 | ||||||
| Foreign withholding taxes reclaimed | 133,841 | ||||||
| Shares of beneficial interest sold | 59,897 | ||||||
| Interest and dividends from affiliates | 21,168 | ||||||
| Prepaid expenses and other assets | 57,078 | ||||||
| Total Assets | 502,845,534 | ||||||
| Liabilities: | |||||||
| Unrealized depreciation on open swap agreements | 2,565,069 | ||||||
| Unrealized depreciation on open foreign currency exchange contracts | 1,535,237 | ||||||
| Payable for: | |||||||
| Investments purchased | 9,702,501 | ||||||
| Shares of beneficial interest redeemed | 1,309,393 | ||||||
| Swap agreements termination | 715,249 | ||||||
| Investment advisory fee | 176,674 | ||||||
| Transfer agent fee | 142,783 | ||||||
| Distribution fee | 141,129 | ||||||
| Administration fee | 33,652 | ||||||
| Accrued expenses and other payables | 227,306 | ||||||
| Total Liabilities | 16,548,993 | ||||||
| Net Assets | $ | 486,296,541 | |||||
| Composition of Net Assets: | |||||||
| Paid-in-capital | $ | 468,568,300 | |||||
| Net unrealized appreciation | 23,201,213 | ||||||
| Accumulated undistributed net investment income | 3,017,763 | ||||||
| Accumulated undistributed net realized loss | (8,490,735 | ) | |||||
| Net Assets | $ | 486,296,541 | |||||
| Class A Shares: | |||||||
| Net Assets | $ | 399,440,973 | |||||
| Shares Outstanding (unlimited shares authorized, $0.01 par value) | 26,591,553 | ||||||
| Net Asset Value Per Share | $ | 15.02 | |||||
| Maximum Offering Price Per Share, (net asset value plus 5.54% of net asset value) | $ | 15.85 | |||||
| Class B Shares: | |||||||
| Net Assets | $ | 23,747,318 | |||||
| Shares Outstanding (unlimited shares authorized, $0.01 par value) | 1,568,139 | ||||||
| Net Asset Value Per Share | $ | 15.14 | |||||
| Class C Shares: | |||||||
| Net Assets | $ | 38,747,264 | |||||
| Shares Outstanding (unlimited shares authorized, $0.01 par value) | 2,601,463 | ||||||
| Net Asset Value Per Share | $ | 14.89 | |||||
| Class I Shares: | |||||||
| Net Assets | $ | 24,360,986 | |||||
| Shares Outstanding (unlimited shares authorized, $0.01 par value) | 1,617,531 | ||||||
| Net Asset Value Per Share | $ | 15.06 | |||||
See Notes to Financial Statements
61
Morgan Stanley Global Strategist Fund
Financial Statements continued
Statement of Operations
For the six months ended January 31, 2012 (unaudited)
| Net Investment Income: Income | |||||||
| Interest | $ | 3,281,174 | |||||
| Dividends (net of $121,397 foreign withholding tax) | 3,268,478 | ||||||
| Interest and dividends from affiliates (Note 6) | 79,780 | ||||||
| Total Income | 6,629,432 | ||||||
| Expenses | |||||||
| Investment advisory fee (Note 4) | 1,047,168 | ||||||
| Distribution fee (Class A shares) (Note 5) | 510,469 | ||||||
| Distribution fee (Class B shares) (Note 5) | 138,183 | ||||||
| Distribution fee (Class C shares) (Note 5) | 194,843 | ||||||
| Transfer agent fees and expenses | 301,968 | ||||||
| Administration fee (Note 4) | 199,461 | ||||||
| Custodian fees | 81,916 | ||||||
| Shareholder reports and notices | 77,715 | ||||||
| Professional fees | 50,011 | ||||||
| Registration fees | 29,535 | ||||||
| Trustees' fees and expenses | 8,547 | ||||||
| Other | 65,274 | ||||||
| Total Expenses | 2,705,090 | ||||||
| Less: rebate from Morgan Stanley affiliated cash sweep (Note 6) | (23,004 | ) | |||||
| Net Expenses | 2,682,086 | ||||||
| Net Investment Income | 3,947,346 | ||||||
| Realized and Unrealized Gain (Loss): Realized Gain (Loss) on: | |||||||
| Investments | 5,382,195 | ||||||
| Investments in affiliates (Note 6) | 137,011 | ||||||
| Futures contracts | (3,268,357 | ) | |||||
| Swap agreements | (4,297,918 | ) | |||||
| Foreign currency exchange contracts | (12,480 | ) | |||||
| Foreign currency translation | (455,491 | ) | |||||
| Net Realized Loss | (2,515,040 | ) | |||||
| Change in Unrealized Appreciation/Depreciation on: | |||||||
| Investments | (21,101,178 | ) | |||||
| Investments in affiliates (Note 6) | 76,545 | ||||||
| Futures contracts | 2,041,695 | ||||||
| Swap agreements | 805,866 | ||||||
| Foreign currency exchange contracts | (953,871 | ) | |||||
| Foreign currency translation | (39,877 | ) | |||||
| Net Change in Unrealized Appreciation/Depreciation | (19,170,820 | ) | |||||
| Net Loss | (21,685,860 | ) | |||||
| Net Decrease | $ | (17,738,514 | ) | ||||
See Notes to Financial Statements
62
Morgan Stanley Global Strategist Fund
Financial Statements continued
Statements of Changes in Net Assets
| FOR THE SIX MONTHS ENDED JANUARY 31, 2012 | FOR THE YEAR ENDED JULY 31, 2011 | ||||||||||
| (unaudited) | |||||||||||
| Increase (Decrease) in Net Assets: Operations: | |||||||||||
| Net investment income | $ | 3,947,346 | $ | 8,102,501 | |||||||
| Net realized gain (loss) | (2,515,040 | ) | 40,231,561 | ||||||||
| Net change in unrealized appreciation/depreciation | (19,170,820 | ) | 24,941,498 | ||||||||
| Net Increase (Decrease) | (17,738,514 | ) | 73,275,560 | ||||||||
| Dividends and Distributions to Shareholders from: | |||||||||||
| Net investment income | |||||||||||
| Class A shares | (10,073,583 | ) | (3,087,669 | ) | |||||||
| Class B shares | (442,186 | ) | (116,860 | ) | |||||||
| Class C shares | (787,188 | ) | (127,307 | ) | |||||||
| Class I shares | (606,586 | ) | (268,166 | ) | |||||||
| Net realized gain | |||||||||||
| Class A shares | (19,684,755 | ) | (67,021,038 | ) | |||||||
| Class B shares | (1,265,971 | ) | (7,180,925 | ) | |||||||
| Class C shares | (1,912,103 | ) | (6,220,483 | ) | |||||||
| Class I shares | (1,109,905 | ) | (4,887,059 | ) | |||||||
| Total Dividends and Distributions | (35,882,277 | ) | (88,909,507 | ) | |||||||
| Net decrease from transactions in shares of beneficial interest | (22,316,735 | ) | (7,101,105 | ) | |||||||
| Net Decrease | (75,937,526 | ) | (22,735,052 | ) | |||||||
| Net Assets: | |||||||||||
| Beginning of period | 562,234,067 | 584,969,119 | |||||||||
| End of Period (Including accumulated undistributed net investment income of $3,017,763 and $10,979,960, respectively) | $ | 486,296,541 | $ | 562,234,067 | |||||||
See Notes to Financial Statements
63
Morgan Stanley Global Strategist Fund
Notes to Financial Statements n January 31, 2012 (unaudited)
1. Organization and Accounting Policies
Morgan Stanley Global Strategist Fund (the "Fund") is registered under the Investment Company Act of 1940, as amended (the "Act"), as a diversified, open-end management investment company. The Fund's investment objective is to maximize the total return on its investments. The Fund was organized as a Massachusetts business trust on August 5, 1988 and commenced operations on October 31, 1988. On July 28, 1997, the Fund converted to a multiple class share structure.
The Fund offers Class A shares, Class B shares, Class C shares and Class I shares. The four classes are substantially the same except that most Class A shares are subject to a sales charge imposed at the time of purchase and some Class A shares, and most Class B shares and Class C shares are subject to a contingent deferred sales charge imposed on shares redeemed within eighteen months, six years and one year, respectively. Class I shares are not subject to a sales charge. Additionally, Class A shares, Class B shares and Class C shares incur distribution expenses.
The following is a summary of significant accounting policies:
A. Valuation of Investments — (1) An equity portfolio security listed or traded on the New York Stock Exchange ("NYSE") or American Stock Exchange or other domestic exchange is valued at its last sale price prior to the time when assets are valued; if there were no sales that day, the security is valued at the mean between the last reported bid and ask price; (2) an equity portfolio security listed or traded on the Nasdaq is valued at the Nasdaq Official Closing Price; if there were no sales that day, the security is valued at the mean between the last reported bid and ask price; (3) all other domestic securities for which over-the-counter market quotations are readily available are valued at the mean between the last reported bid and ask price. In cases where a security is traded on more than one domestic exchange, the security is valued on the exchange designated as the primary market; (4) for equity securities traded on foreign exchanges, the last reported sale price or the latest bid price may be used if there were no sales on a particular day; (5) futures are valued at the latest price published by the commodities exchange on which they trade; (6) commodity-linked notes are marked-to-market daily based upon quotations from market makers; (7) when market quotations are not readily available, including circumstances under which Morgan Stanley Investment Management Inc. (the "Adviser"), a wholly owned subsidiary of Morgan Stanley, determines that the latest sale price, the bid price or the mean between the last reported bid and ask price do not reflect a security's fair value, portfolio securities are valued at their fair value as determined in good faith under procedures established by and under the general supervision of the Fund's Trustees. Occasionally, developments affecting the closing prices of securities and other assets may occur between the times at which valuations of such securities are determined (that is, close of the foreign market on which the securities trade) and the close of business on the NYSE. If developments occur during such periods that are expected to materially affect the value of such securities, such valuations may be adjusted to reflect the estimated
64
Morgan Stanley Global Strategist Fund
Notes to Financial Statements n January 31, 2012 (unaudited) continued
fair value of such securities as of the close of the NYSE, as determined in good faith by the Fund's Trustees or by the Adviser using a pricing service and/or procedures approved by the Trustees of the Fund; (8) certain portfolio securities may be valued by an outside pricing service approved by the Fund's Trustees. The prices provided by a pricing service take into account broker dealer market price quotations for trading in similar groups of securities, security quality, maturity, coupon and other security characteristics as well as any developments related to the specific securities; (9) investments in mutual funds, including the Morgan Stanley Institutional Liquidity Funds, are valued at the net asset value as of the close of each business day; and (10) short-term debt securities having a maturity date of more than sixty days at time of purchase are valued on a mark-to-market basis until sixty days prior to maturity and thereafter at amortized cost based on their value on the 61st day. Short-term debt securities having a maturity date of sixty days or less at the time of purchase are valued at amortized cost, which approximates fair value.
B. Accounting for Investments — Security transactions are accounted for on the trade date (date the order to buy or sell is executed). Realized gains and losses on security transactions are determined by the identified cost method. Dividend income and other distributions are recorded on the ex-dividend date. Discounts are accreted and premiums are amortized over the life of the respective securities and are included in interest income. Interest income is accrued daily as earned.
C. Multiple Class Allocations — Investment income, expenses (other than distribution fees), and realized and unrealized gains and losses are allocated to each class of shares based upon the relative net asset value on the date such items are recognized. Distribution fees are charged directly to the respective class.
D. Foreign Currency Translation — The books and records of the Fund are maintained in U.S. dollars as follows: (1) the foreign currency market value of investment securities, other assets and liabilities and foreign currency exchange contracts are translated at the exchange rates prevailing at the end of the period; and (2) purchases, sales, income and expenses are translated at the exchange rates prevailing on the respective dates of such transactions. The resultant exchange gains and losses are recorded as realized and unrealized gains/losses on foreign currency exchange contracts and foreign currency translations. Pursuant to U.S. federal income tax regulations, certain foreign exchange gains/losses included in realized and unrealized gains/losses are included in or are a reduction of ordinary income for federal income tax purposes. The Fund does not isolate that portion of the results of operations arising as a result of changes in the foreign exchange rates from the changes in the market prices of the securities held.
E. Dividends and Distributions to Shareholders — Dividends and distributions to shareholders are recorded on the ex-dividend date.
65
Morgan Stanley Global Strategist Fund
Notes to Financial Statements n January 31, 2012 (unaudited) continued
F. When-Issued/Delayed Delivery Securities — The Fund may purchase or sell when-issued and delayed delivery securities. Securities purchased on a when-issued or delayed delivery basis are purchased for delivery beyond the normal settlement date at a stated price and yield, and no income accrues to the Fund on such securities prior to delivery date. Payment and delivery for when-issued and delayed delivery securities can take place up to 120 days after the date of the transaction. When the Fund enters into a purchase transaction on a when-issued or delayed delivery basis, securities are available for collateral in an amount at least equal in value to the Fund's commitments to purchase such securities. Purchasing securities on a when-issued or delayed delivery basis may involve a risk that the market price at the time of delivery may be lower than the agreed upon purchase price, in which case there could be an unrealized loss at the time of delivery. Purchasing investments on a when-issued or delayed delivery basis may be considered a form of leverage which may increase the impact that gains (losses) may have on the Fund.
G. Structured Investments — The Fund may invest a portion of its assets in structured investments. A structured investment is a derivative security designed to offer a return linked to a particular underlying security, currency or market. Structured investments may come in various forms including notes, warrants and options to purchase securities. The Fund will typically use structured investments to gain exposure to a permitted underlying security, currency or market when direct access to a market is limited or inefficient from a tax or cost standpoint.
H. Use of Estimates — The preparation of financial statements in accordance with generally accepted accounting principles in the United States ("GAAP") requires management to make estimates and assumptions that affect the reported amounts and disclosures. Actual results could differ from those estimates.
I. Indemnifications — The Fund enters into contracts that contain a variety of indemnifications. The Fund's maximum exposure under these arrangements is unknown. However, the Fund has not had prior claims or losses pursuant to these contracts and expects the risk of loss to be remote.
2. Fair Valuation Measurements
Financial Accounting Standards Board ("FASB") Accounting Standards Codification ("ASC") 820, Fair Value Measurements and Disclosures ("ASC 820"), defines fair value as the value that the Fund would receive to sell an investment or pay to transfer a liability in a timely transaction with an independent buyer in the principal market, or in the absence of a principal market the most advantageous market for the investment or liability. ASC 820 establishes a three-tier hierarchy to distinguish between (1) inputs that reflect the assumptions market participants would use in valuing an asset or liability developed based on market data obtained from sources independent of the reporting entity (observable inputs); and (2) inputs that reflect the reporting entity's own assumptions about the assumptions market
66
Morgan Stanley Global Strategist Fund
Notes to Financial Statements n January 31, 2012 (unaudited) continued
participants would use in valuing an asset or liability developed based on the best information available in the circumstances (unobservable inputs) and to establish classification of fair value measurements for disclosure purposes. Various inputs are used in determining the value of the Fund's investments. The inputs are summarized in the three broad levels listed below.
• Level 1 — unadjusted quoted prices in active markets for identical investments
• Level 2 — other significant observable inputs (including quoted prices for similar investments, interest rates, prepayment speeds, credit risk, etc.)
• Level 3 — significant unobservable inputs including the Fund's own assumptions in determining the fair value of investments. Factors considered in making this determination may include, but are not limited to, information obtained by contacting the issuer, analysts, or the appropriate stock exchange (for exchange-traded securities), analysis of the issuer's financial statements or other available documents and, if necessary, available information concerning other securities in similar circumstances
The inputs or methodology used for valuing securities are not necessarily an indication of the risk associated with investing in those securities and the determination of the significance of a particular input to the fair value measurement in its entirety requires judgment and considers factors specific to each security.
The following is a summary of the inputs used to value the Fund's investments as of January 31, 2012.
| INVESTMENT TYPE | LEVEL 1 UNADJUSTED QUOTED PRICES | LEVEL 2 OTHER SIGNIFICANT OBSERVABLE INPUTS | LEVEL 3 SIGNIFICANT UNOBSERVABLE INPUTS | TOTAL | |||||||||||||||
| Assets: | |||||||||||||||||||
| Common Stocks | |||||||||||||||||||
| Aerospace & Defense | $ | 3,469,833 | — | — | $ | 3,469,833 | |||||||||||||
| Air Freight & Logistics | 843,003 | — | — | 843,003 | |||||||||||||||
| Airlines | 96,419 | — | — | 96,419 | |||||||||||||||
| Auto Components | 2,760,180 | — | — | 2,760,180 | |||||||||||||||
| Automobiles | 4,313,923 | — | — | 4,313,923 | |||||||||||||||
| Beverages | 3,860,179 | — | — | 3,860,179 | |||||||||||||||
| Biotechnology | 1,385,350 | — | — | 1,385,350 | |||||||||||||||
| Building Products | 1,069,749 | — | — | 1,069,749 | |||||||||||||||
| Capital Markets | 3,824,153 | — | — | 3,824,153 | |||||||||||||||
| Chemicals | 7,361,622 | — | — | 7,361,622 | |||||||||||||||
| Commercial Banks | 20,814,001 | — | — | 20,814,001 | |||||||||||||||
| Commercial Services & Supplies | 1,261,796 | — | — | 1,261,796 | |||||||||||||||
| Communications Equipment | 3,530,605 | — | — | 3,530,605 | |||||||||||||||
67
Morgan Stanley Global Strategist Fund
Notes to Financial Statements n January 31, 2012 (unaudited) continued
| INVESTMENT TYPE | LEVEL 1 UNADJUSTED QUOTED PRICES | LEVEL 2 OTHER SIGNIFICANT OBSERVABLE INPUTS | LEVEL 3 SIGNIFICANT UNOBSERVABLE INPUTS | TOTAL | |||||||||||||||
| Computers & Peripherals | $ | 5,729,671 | — | — | $ | 5,729,671 | |||||||||||||
| Construction & Engineering | 2,227,768 | — | — | 2,227,768 | |||||||||||||||
| Construction Materials | 356,259 | — | — | 356,259 | |||||||||||||||
| Consumer Finance | 506,439 | — | — | 506,439 | |||||||||||||||
| Containers & Packaging | 167,699 | — | — | 167,699 | |||||||||||||||
| Distributors | 87,476 | — | — | 87,476 | |||||||||||||||
| Diversified Consumer Services | 84,917 | — | — | 84,917 | |||||||||||||||
| Diversified Financial Services | 5,899,472 | — | — | 5,899,472 | |||||||||||||||
| Diversified Telecommunication Services | 6,833,309 | — | — | 6,833,309 | |||||||||||||||
| Electric Utilities | 4,861,264 | — | — | 4,861,264 | |||||||||||||||
| Electrical Equipment | 2,066,365 | — | — | 2,066,365 | |||||||||||||||
| Electronic Equipment, Instruments & Components | 2,272,395 | — | — | 2,272,395 | |||||||||||||||
| Energy Equipment & Services | 2,654,296 | — | — | 2,654,296 | |||||||||||||||
| Food & Staples Retailing | 6,302,521 | — | — | 6,302,521 | |||||||||||||||
| Food Products | 6,807,085 | — | — | 6,807,085 | |||||||||||||||
| Gas Utilities | 801,503 | — | — | 801,503 | |||||||||||||||
| Health Care Equipment & Supplies | 2,321,996 | — | — | 2,321,996 | |||||||||||||||
| Health Care Providers & Services | 5,354,709 | — | — | 5,354,709 | |||||||||||||||
| Health Care Technology | 57,602 | — | — | 57,602 | |||||||||||||||
| Hotels, Restaurants & Leisure | 4,639,605 | — | — | 4,639,605 | |||||||||||||||
| Household Durables | 4,933,365 | — | — | 4,933,365 | |||||||||||||||
| Household Products | 2,859,991 | — | — | 2,859,991 | |||||||||||||||
| Independent Power Producers & Energy Traders | 597,135 | — | — | 597,135 | |||||||||||||||
| Industrial Conglomerates | 4,590,676 | — | — | 4,590,676 | |||||||||||||||
| Information Technology Services | 3,854,469 | — | — | 3,854,469 | |||||||||||||||
| Insurance | 10,127,882 | — | — | 10,127,882 | |||||||||||||||
| Internet & Catalog Retail | 611,309 | — | — | 611,309 | |||||||||||||||
| Internet Software & Services | 1,704,776 | — | — | 1,704,776 | |||||||||||||||
| Leisure Equipment & Products | 143,616 | — | — | 143,616 | |||||||||||||||
| Life Sciences Tools & Services | 423,708 | — | — | 423,708 | |||||||||||||||
| Machinery | 5,395,471 | — | — | 5,395,471 | |||||||||||||||
| Marine | 347,559 | — | — | 347,559 | |||||||||||||||
| Media | 5,434,509 | — | — | 5,434,509 | |||||||||||||||
| Metals & Mining | 14,400,636 | — | — | 14,400,636 | |||||||||||||||
| Multi-Utilities | 3,476,592 | — | — | 3,476,592 | |||||||||||||||
| Multiline Retail | 693,166 | — | — | 693,166 | |||||||||||||||
| Office Electronics | 755,875 | — | — | 755,875 | |||||||||||||||
| Oil, Gas & Consumable Fuels | 27,556,962 | — | — | 27,556,962 | |||||||||||||||
| Paper & Forest Products | 1,185,780 | — | — | 1,185,780 | |||||||||||||||
68
Morgan Stanley Global Strategist Fund
Notes to Financial Statements n January 31, 2012 (unaudited) continued
| INVESTMENT TYPE | LEVEL 1 UNADJUSTED QUOTED PRICES | LEVEL 2 OTHER SIGNIFICANT OBSERVABLE INPUTS | LEVEL 3 SIGNIFICANT UNOBSERVABLE INPUTS | TOTAL | |||||||||||||||
| Personal Products | $ | 1,004,229 | — | — | $ | 1,004,229 | |||||||||||||
| Pharmaceuticals | 13,500,950 | — | — | 13,500,950 | |||||||||||||||
| Professional Services | 840,118 | — | — | 840,118 | |||||||||||||||
| Real Estate Investment Trusts (REITs) | 4,034,825 | — | — | 4,034,825 | |||||||||||||||
| Real Estate Management & Development | 2,223,511 | — | — | 2,223,511 | |||||||||||||||
| Road & Rail | 3,934,343 | — | — | 3,934,343 | |||||||||||||||
| Semiconductors & Semiconductor Equipment | 3,174,582 | — | — | 3,174,582 | |||||||||||||||
| Software | 5,118,634 | — | — | 5,118,634 | |||||||||||||||
| Specialty Retail | 4,008,752 | — | — | 4,008,752 | |||||||||||||||
| Textiles, Apparel & Luxury Goods | 2,419,286 | — | — | 2,419,286 | |||||||||||||||
| Thrifts & Mortgage Finance | 60,912 | — | — | 60,912 | |||||||||||||||
| Tobacco | 4,763,411 | — | — | 4,763,411 | |||||||||||||||
| Trading Companies & Distributors | 1,901,423 | — | — | 1,901,423 | |||||||||||||||
| Transportation Infrastructure | 502,174 | — | — | 502,174 | |||||||||||||||
| Wireless Telecommunication Services | 3,306,880 | — | — | 3,306,880 | |||||||||||||||
| Total Common Stocks | 254,510,671 | — | — | 254,510,671 | |||||||||||||||
| Commodity Linked Security | — | $ | 24,366,490 | — | 24,366,490 | ||||||||||||||
| Investment Companies | 5,985,740 | — | — | 5,985,740 | |||||||||||||||
| Fixed Income Securities | |||||||||||||||||||
| Agency Fixed Rate Mortgages | — | 26,259,341 | — | 26,259,341 | |||||||||||||||
| Asset-Backed Securities | — | 3,147,705 | — | 3,147,705 | |||||||||||||||
| Commercial Mortgage Backed Securities | — | 4,160,441 | — | 4,160,441 | |||||||||||||||
| Corporate Bonds | — | 50,879,037 | — | 50,879,037 | |||||||||||||||
| Municipal Bonds | — | 698,228 | — | 698,228 | |||||||||||||||
| Sovereign | — | 72,090,200 | — | 72,090,200 | |||||||||||||||
| U.S. Treasury Securities | — | 18,540,096 | — | 18,540,096 | |||||||||||||||
| Total Fixed Income Securities | — | 175,775,048 | — | 175,775,048 | |||||||||||||||
| Short-Term Investments | |||||||||||||||||||
| U.S. Treasury Securities | — | 2,609,943 | — | 2,609,943 | |||||||||||||||
| Investment Company | 8,498,980 | — | — | 8,498,980 | |||||||||||||||
| Total Short-Term Investments | 8,498,980 | 2,609,943 | — | 11,108,923 | |||||||||||||||
| Foreign Currency Exchange Contracts | — | 1,334,774 | — | 1,334,774 | |||||||||||||||
| Futures Contracts | 2,305,784 | — | — | 2,305,784 | |||||||||||||||
| Interest Rate Swap Agreements | — | 1,782,478 | — | 1,782,478 | |||||||||||||||
| Total Return Swap Agreements | — | 237,477 | — | 237,477 | |||||||||||||||
| Zero Coupon Swap Agreements | — | 638,117 | — | 638,117 | |||||||||||||||
| Total Assets | 271,301,175 | 206,744,327 | — | 478,045,502 | |||||||||||||||
69
Morgan Stanley Global Strategist Fund
Notes to Financial Statements n January 31, 2012 (unaudited) continued
| INVESTMENT TYPE | LEVEL 1 UNADJUSTED QUOTED PRICES | LEVEL 2 OTHER SIGNIFICANT OBSERVABLE INPUTS | LEVEL 3 SIGNIFICANT UNOBSERVABLE INPUTS | TOTAL | |||||||||||||||
| Liabilities: | |||||||||||||||||||
| Foreign Currency Exchange Contracts | — | $ | (1,535,237 | ) | — | $ | (1,535,237 | ) | |||||||||||
| Futures Contracts | $ | (1,380,732 | ) | — | — | (1,380,732 | ) | ||||||||||||
| Interest Rate Swap Agreements | — | (1,464,371 | ) | — | (1,464,371 | ) | |||||||||||||
| Zero Coupon Swap Agreements | — | (1,100,698 | ) | — | (1,100,698 | ) | |||||||||||||
| Total Liabilities | (1,380,732 | ) | (4,100,306 | ) | — | (5,481,038 | ) | ||||||||||||
| Total | $ | 269,920,443 | $ | 202,644,021 | — | $ | 472,564,464 | ||||||||||||
Transfers between investment levels may occur as the markets fluctuate and/or the availability of data used in an investment's valuation changes. The Fund recognizes transfers between the levels as of the end of the period. As of January 31, 2012, securities with a total value of $99,648,019 transferred from Level 2 to Level 1. At July 31, 2011, the fair market value of certain securities were adjusted due to developments which occurred between the time of the close of the foreign markets on which they trade and the close of business on the NYSE which resulted in their Level 2 classification.
3. Derivatives
The Fund uses derivative instruments for a variety of purposes, including hedging, risk management, portfolio management or to earn income. Derivatives are financial instruments whose value is based on the value of another underlying asset, interest rate, index or financial instrument. A derivative instrument often has risks similar to its underlying instrument and may have additional risks, including imperfect correlation between the value of the derivative and the underlying instrument, risks of default by the other party to certain transactions, magnification of losses incurred due to changes in the market value of the securities, instruments, indices or interest rates to which they relate, and risks that the transactions may not be liquid. The use of derivatives involves risks that are different from, and possibly greater than, the risks associated with other portfolio investments. Derivatives may involve the use of highly specialized instruments that require investment techniques and risk analyses different from those associated with other portfolio investments. All of the Fund's holdings, including derivative instruments, are marked-to-market each day with the change in value reflected in unrealized appreciation (depreciation). Upon disposition, a realized gain or loss is recognized.
Certain derivative transactions may give rise to a form of leverage. Leverage associated with derivative transactions may cause the Fund to liquidate portfolio positions when it may not be advantageous to do so to satisfy its obligations or to meet earmarking or segregation requirements, pursuant to applicable Securities and Exchange Commission rules and regulations, or may cause the Fund to be more volatile
70
Morgan Stanley Global Strategist Fund
Notes to Financial Statements n January 31, 2012 (unaudited) continued
than if the Fund had not been leveraged. Although the Adviser seeks to use derivatives to further the Fund's investment objectives, there is no assurance that the use of derivatives will achieve this result.
Following is a description of the derivative instruments and techniques that the Fund used during the period and their associated risks:
Foreign Currency Exchange Contracts — In connection with its investments in foreign securities, the Fund entered into contracts with banks, brokers or dealers to purchase or sell foreign currencies at a future date. A foreign currency exchange contract ("currency contracts") is a negotiated agreement between the contracting parties to exchange a specified amount of currency at a specified future time at a specified rate. The rate can be higher or lower than the spot rate between the currencies that are the subject of the currency contract. Currency contracts are used to protect against uncertainty in the level of future foreign currency exchange rates or to gain or modify exposure to a particular currency. Hedging the Fund's currency risks involves the risk of mismatching the Fund's objectives under a currency contract with the value of securities denominated in a particular currency. Furthermore, such transactions reduce or preclude the opportunity for gain if the value of the currency should move in the direction opposite to the position taken. There is an additional risk to the effect that currency contracts create exposure to currencies in which the Fund's securities are not denominated. Unanticipated changes in currency prices may result in poorer overall performance for the Fund than if it had not entered into such contracts. A currency contract is marked-to-market daily and the change in market value is recorded by the Fund as unrealized gain or (loss). The Fund records realized gains (losses) when the currency contract is closed equal to the difference between the value of the currency contract at the time it was opened and the value at the time it was closed.
Futures — A futures contract is a standardized agreement between two parties to buy or sell a specific quantity of an underlying instrument at a specific price at a specific future time. The value of a futures contract tends to increase and decrease in tandem with the value of the underlying instrument. Futures contracts are bilateral agreements, with both the purchaser and the seller equally obligated to complete the transaction. Depending on the terms of the particular contract, futures contracts are settled through either physical delivery of the underlying instrument on the settlement date or by payment of a cash settlement amount on the settlement date. During the period the futures contract is open, payments are received from or made to the broker based upon changes in the value of the contract (the variation margin). A decision as to whether, when and how to use futures involves the exercise of skill and judgment and even a well conceived futures transaction may be unsuccessful because of market behavior or unexpected events. In addition to the derivatives risks discussed above, the prices of futures can be highly volatile, using futures can lower total return, and the potential loss from futures can exceed the Fund's initial investment in such contracts.
71
Morgan Stanley Global Strategist Fund
Notes to Financial Statements n January 31, 2012 (unaudited) continued
Swaps — A swap agreement is an agreement between two parties pursuant to which the parties exchange payments at specified dates on the basis of a specified notional amount, with the payments calculated by reference to specified securities, indexes, reference rates, currencies or other instruments. Most swap agreements provide that when the period payment dates for both parties are the same, the payments are made on a net basis (i.e., the two payment streams are netted out, with only the net amount paid by one party to the other). The Fund's obligations or rights under a swap agreement entered into on a net basis will generally be equal only to the net amount to be paid or received under the agreement, based on the relative values of the positions held by each counterparty. Swap agreements are not entered into or traded on exchanges and there is no central clearing or guaranty function for swaps. Therefore, swaps are subject to credit risk or the risk of default or non-performance by the counterparty. Swaps could result in losses if interest rate or foreign currency exchange rates or credit quality changes are not correctly anticipated by the Fund or if the reference index, security or investments do not perform as expected.
When the Fund has an unrealized loss on a swap agreement, the Fund has instructed the custodian to pledge cash or liquid securities as collateral with a value approximately equal to the amount of the unrealized loss. Collateral pledges are monitored and subsequently adjusted if and when the swap valuations fluctuate. If applicable, cash collateral is included with "Due from (to) broker" on the Statement of Assets and Liabilities.
FASB ASC 815, Derivatives and Hedging: Overall ("ASC 815"), is intended to improve financial reporting about derivative instruments by requiring enhanced disclosures to enable investors to better understand how and why the Fund uses derivative instruments, how these derivative instruments are accounted for and their effects on the Fund's financial position and results of operations.
The following table sets forth the fair value of the Fund's derivative contracts by primary risk exposure as of January 31, 2012.
| PRIMARY RISK EXPOSURE | ASSET DERIVATIVES STATEMENT OF ASSETS AND LIABILITIES LOCATION | FAIR VALUE | LIABILITY DERIVATIVES STATEMENT OF ASSETS AND LIABILITIES LOCATION | FAIR VALUE | |||||||||||||||
| Interest Rate Risk | Variation margin | $ | 91,179 | † | Variation margin | $ | (1,122,148 | )† | |||||||||||
| Unrealized appreciation on open swap agreements | 2,420,595 | Unrealized depreciation on open swap agreements | (2,565,069 | ) | |||||||||||||||
| Foreign Currency Risk | Unrealized appreciation on open foreign currency exchange contracts | 1,334,774 | Unrealized depreciation on open foreign currency exchange contracts | (1,535,237 | ) | ||||||||||||||
72
Morgan Stanley Global Strategist Fund
Notes to Financial Statements n January 31, 2012 (unaudited) continued
| PRIMARY RISK EXPOSURE | ASSET DERIVATIVES STATEMENT OF ASSETS AND LIABILITIES LOCATION | FAIR VALUE | LIABILITY DERIVATIVES STATEMENT OF ASSETS AND LIABILITIES LOCATION | FAIR VALUE | |||||||||||||||
| Equity Risk | Variation margin | $ | 2,214,605 | † | Variation margin | $ | (258,584 | )† | |||||||||||
| Unrealized appreciation on open swap agreements | 237,477 | Unrealized depreciation on open swap agreements | — | ||||||||||||||||
| $ | 6,298,630 | $ | (5,481,038 | ) | |||||||||||||||
† Includes cumulative appreciation/depreciation of futures contracts as reported in the Portfolio of Investments. Only current day's net variation margin is reported within the Statement of Assets and Liabilities.
The following tables set forth by primary risk exposure the Fund's realized gains (losses) and change in unrealized appreciation (depreciation) by type of derivative contract for the six months ended January 31, 2012 in accordance with ASC 815.
AMOUNT OF REALIZED GAIN (LOSS) ON DERIVATIVE CONTRACTS
| PRIMARY RISK EXPOSURE | FUTURES | FOREIGN CURRENCY EXCHANGE | SWAPS | ||||||||||||
| Interest Rate Risk | $ | (3,170,336 | ) | — | $ | (1,435,861 | ) | ||||||||
| Foreign Currency Risk | $ | (12,480 | ) | ||||||||||||
| Equity Risk | (98,021 | ) | (2,862,057 | ) | |||||||||||
| Total | $ | (3,268,357 | ) | $ | (12,480 | ) | $ | (4,297,918 | ) | ||||||
CHANGE IN UNREALIZED APPRECIATION (DEPRECIATION) ON DERIVATIVE CONTRACTS
| PRIMARY RISK EXPOSURE | FUTURES | FOREIGN CURRENCY EXCHANGE | SWAPS | ||||||||||||
| Interest Rate Risk | $ | (154,573 | ) | — | $ | 568,389 | |||||||||
| Foreign Currency Risk | — | $ | (953,871 | ) | — | ||||||||||
| Equity Risk | 2,196,268 | — | 237,477 | ||||||||||||
| Total | $ | 2,041,695 | $ | (953,871 | ) | $ | 805,866 | ||||||||
For the six months ended January 31, 2012, the average monthly original value of futures contracts was $155,209,658, the average monthly notional value of swap agreements was $197,478,697 and the average monthly principal amount of foreign currency exchange contracts was $159,976,172.
4. Investment Advisory/Administration Agreements
Pursuant to an Investment Advisory Agreement with the Adviser, the Fund pays an advisory fee, accrued daily and payable monthly, by applying the following annual rates to the net assets of the Fund determined as of the close of each business day: 0.42% to the portion of the daily net assets not exceeding $1.5 billion and 0.395% to the portion of the daily net assets exceeding $1.5 billion.
73
Morgan Stanley Global Strategist Fund
Notes to Financial Statements n January 31, 2012 (unaudited) continued
Pursuant to an Administration Agreement with Morgan Stanley Services Company Inc. (the "Administrator"), an affiliate of the Adviser, the Fund pays an administration fee, accrued daily and payable monthly, by applying the annual rate of 0.08% to the Fund's daily net assets.
Under a Sub-Administration Agreement between the Administrator and State Street Bank and Trust Company ("State Street"), State Street provides certain administrative services to the Fund. For such services, the Administrator pays State Street a portion of the fee the Administrator receives from the Fund.
5. Plan of Distribution
Shares of the Fund are distributed by Morgan Stanley Distribution, Inc. (the "Distributor"), an affiliate of the Adviser and Administrator. The Fund has adopted a Plan of Distribution (the "Plan") pursuant to Rule 12b-1 under the Act. The Plan provides that the Fund will pay the Distributor a fee which is accrued daily and paid monthly at the following annual rates: (i) Class A — up to 0.25% of the average daily net assets of Class A shares; (ii) Class B — up to 1.00% of the average daily net assets of Class B shares; and (iii) Class C — up to 1.00% of the average daily net assets of Class C shares.
In the case of Class B shares, provided that the Plan continues in effect, any cumulative expenses incurred by the Distributor but not yet recovered may be recovered through the payment of future distribution fees from the Fund pursuant to the Plan and contingent deferred sales charges paid by investors upon redemption of Class B shares. Although there is no legal obligation for the Fund to pay expenses incurred in excess of payments made to the Distributor under the Plan and the proceeds of contingent deferred sales charges paid by investors upon redemption of shares, if for any reason the Plan is terminated, the Trustees will consider at that time the manner in which to treat such expenses. The Distributor has advised the Fund that such excess amounts totaled $11,828,435 at January 31, 2012.
In the case of Class A shares and Class C shares, expenses incurred pursuant to the Plan in any calendar year in excess of 0.25% or 1.00% of the average daily net assets of Class A shares or Class C shares, respectively, will not be reimbursed by the Fund through payments in any subsequent year, except that expenses representing a gross sales credit to Morgan Stanley Smith Barney Financial Advisors and other authorized financial representatives at the time of sale may be reimbursed in the subsequent calendar year. For the six months ended January 31, 2012, the distribution fee was accrued for Class A shares and Class C shares at the annual rate of 0.25% and 1.00%, respectively.
The Distributor has informed the Fund that for the six months ended January 31, 2012, it received contingent deferred sales charges from certain redemptions of the Fund's Class A shares, Class B shares and Class C shares of $9,153, $7,934 and $1,637, respectively, and received $32,554 in
74
Morgan Stanley Global Strategist Fund
Notes to Financial Statements n January 31, 2012 (unaudited) continued
front-end sales charges from sales of the Fund's Class A shares. The respective shareholders pay such charges, which are not an expense of the Fund.
6. Security Transactions and Transactions with Affiliates
The cost of purchases and proceeds from sales of investment securities, excluding short-term investments, for the six months ended January 31, 2012 aggregated $184,900,828 and $234,065,907, respectively. Included in the aforementioned are purchases and sales of U.S. Government securities of $63,347,114 and $63,322,969, respectively.
The Fund invests in the Institutional Class of the Morgan Stanley Institutional Liquidity Funds – Money Market Portfolio (the "Liquidity Funds"), an open-end management investment company managed by the Adviser. Investment advisory fees paid by the Fund are reduced by an amount equal to its pro-rata share of the advisory and administration fees paid by the Fund due to its investment in the Liquidity Funds. For the six months ended January 31, 2012, advisory fees paid were reduced by $23,004 relating to the Fund's investment in the Liquidity Funds.
A summary of the Fund's transactions in shares of the Liquidity Funds during the six months ended January 31, 2012 is as follows:
| VALUE JULY, 31, 2011 | PURCHASES AT COST | SALES | DIVIDEND INCOME | VALUE JANUARY, 31 2012 | |||||||||||||||
| $ | 40,758,101 | $ | 71,533,938 | $ | 103,793,059 | $ | 10,766 | $ | 8,498,980 | ||||||||||
The Fund had the following transactions with Citigroup, Inc., and its affiliated broker/dealers, which may be deemed to be affiliates of the Adviser, Administrator and Distributor for the six months ended January 31, 2012:
| VALUE JULY 31, 2011 | PURCHASES AT COST | SALES | REALIZED GAIN | DIVIDEND/ INTEREST INCOME | VALUE JANUARY 31, 2012 | ||||||||||||||||||
| $ | 2,451,201 | $ | 1,796,809 | $ | 2,655,148 | $ | 137,011 | $ | 69,014 | $ | 1,806,920 | ||||||||||||
Morgan Stanley Services Company Inc., an affiliate of the Adviser and Distributor, is the Fund's transfer agent.
The Fund has an unfunded noncontributory defined benefit pension plan covering certain independent Trustees of the Fund who will have served as independent Trustees for at least five years at the time of retirement. Benefits under this plan are based on factors which include years of service and compensation. The Trustees voted to close the plan to new participants and eliminate the future benefits growth due to increases to compensation after July 31, 2003. Aggregate pension costs for the
75
Morgan Stanley Global Strategist Fund
Notes to Financial Statements n January 31, 2012 (unaudited) continued
six months ended January 31, 2012, included in "trustees' fees and expenses" in the Statement of Operations amounted to $2,131. At January 31, 2012, the Fund had an accrued pension liability of $66,291, which is included in "accrued expenses and other payables" in the Statement of Assets and Liabilities.
The Fund has an unfunded Deferred Compensation Plan (the "Compensation Plan"), which allows each independent Trustee to defer payment of all, or a portion, of the fees he or she receives for serving on the Board of Trustees. Each eligible Trustee generally may elect to have the deferred amounts credited with a return equal to the total return on one or more of the Morgan Stanley funds that are offered as investment options under the Compensation Plan. Appreciation/depreciation and distributions received from these investments are recorded with an offsetting increase/decrease in the deferred compensation obligation and do not affect the net asset value of the Fund.
7. Purposes of and Risks Relating to Certain Financial Instruments
The Fund may invest in mortgage securities, including securities issued by Federal National Mortgage Association ("FNMA") and Federal Home Loan Mortgage Corporation ("FHLMC"). These are fixed income securities that derive their value from or represent interests in a pool of mortgages or mortgage securities. An unexpectedly high rate of defaults on the mortgages held by a mortgage pool may adversely affect the value of a mortgage backed security and could result in losses to the Fund. The risk of such defaults is generally higher in the case of mortgage pools that include sub-prime mortgages. Sub-prime mortgages refer to loans made to borrowers with weakened credit histories or with a lower capacity to make timely payments on their mortgages. The securities held by the Fund are not backed by sub-prime mortgages.
Additionally, securities issued by FNMA and FHLMC are not backed by or entitled to the full faith and credit of the United States; rather, they are supported by the right of the issuer to borrow from the U.S. Department of the Treasury.
The Federal Housing Finance Agency ("FHFA") serves as conservator of FNMA and FHLMC and the U.S. Department of the Treasury has agreed to provide capital as needed to ensure FNMA and FHLMC continue to provide liquidity to the housing and mortgage markets.
The Fund may invest in structured investments, which involve risks including counterparty risk and market risk. Holders of structured investments bear risks of the underlying investment and are subject to counterparty risk because the Fund is relying on the creditworthiness of such counterparty and has no rights with respect to the issuer of the underlying investment. Certain structured investments may be thinly traded or have a limited trading market and may have the effect of increasing the Fund's illiquidity to the extent that the Fund, at a particular point in time, may be unable to find qualified buyers for these securities.
76
Morgan Stanley Global Strategist Fund
Notes to Financial Statements n January 31, 2012 (unaudited) continued
8. Shares of Beneficial Interest
Transactions in shares of beneficial interest were as follows:
| FOR THE SIX MONTHS ENDED JANUARY 31, 2012 | FOR THE YEAR ENDED JULY 31, 2011 | ||||||||||||||||||
| (unaudited) | |||||||||||||||||||
| SHARES | AMOUNT | SHARES | AMOUNT | ||||||||||||||||
| CLASS A SHARES | |||||||||||||||||||
| Sold | 281,751 | $ | 4,359,145 | 1,186,337 | $ | 20,370,023 | |||||||||||||
| Conversion from Class B | 399,612 | 6,063,755 | 1,064,787 | 17,997,024 | |||||||||||||||
| Reinvestment of dividends and distributions | 2,062,323 | 28,934,386 | 4,315,526 | 68,314,776 | |||||||||||||||
| Redeemed | (3,526,568 | ) | (53,412,982 | ) | (5,728,042 | ) | (97,173,000 | ) | |||||||||||
| Net increase (decrease) — Class A | (782,882 | ) | (14,055,696 | ) | 838,608 | 9,508,823 | |||||||||||||
| CLASS B SHARES | |||||||||||||||||||
| Sold | 35,690 | 544,080 | 170,638 | 2,924,036 | |||||||||||||||
| Conversion to Class A | (398,077 | ) | (6,063,755 | ) | (1,059,825 | ) | (17,997,024 | ) | |||||||||||
| Reinvestment of dividends and distributions | 115,006 | 1,628,491 | 439,740 | 7,013,859 | |||||||||||||||
| Redeemed | (236,001 | ) | (3,620,056 | ) | (804,055 | ) | (13,970,971 | ) | |||||||||||
| Net decrease — Class B | (483,382 | ) | (7,511,240 | ) | (1,253,502 | ) | (22,030,100 | ) | |||||||||||
| CLASS C SHARES | |||||||||||||||||||
| Sold | 71,795 | 1,087,164 | 272,489 | 4,663,812 | |||||||||||||||
| Reinvestment of dividends and distributions | 190,666 | 2,655,977 | 395,595 | 6,234,588 | |||||||||||||||
| Redeemed | (283,686 | ) | (4,260,422 | ) | (448,643 | ) | (7,564,471 | ) | |||||||||||
| Net increase (decrease) — Class C | (21,225 | ) | (517,281 | ) | 219,441 | 3,333,929 | |||||||||||||
| CLASS I SHARES | |||||||||||||||||||
| Sold | 112,857 | 1,679,929 | 508,455 | 8,796,516 | |||||||||||||||
| Reinvestment of dividends and distributions | 120,611 | 1,695,796 | 273,430 | 4,336,592 | |||||||||||||||
| Redeemed | (234,208 | ) | (3,608,243 | ) | (675,080 | ) | (11,046,865 | ) | |||||||||||
| Net increase (decrease) — Class I | (740 | ) | (232,518 | ) | 106,805 | 2,086,243 | |||||||||||||
| Net decrease in Fund | (1,288,229 | ) | $ | (22,316,735 | ) | (88,648 | ) | $ | (7,101,105 | ) | |||||||||
9. Federal Income Tax Status
It is the Fund's intention to continue to qualify as a regulated investment company and distribute all of its taxable and tax-exempt income. Accordingly, no provision for Federal income taxes is required in the financial statements.
Dividends from net investment income, if any, are declared and paid annually. Net realized capital gains, if any, are distributed at least annually.
77
Morgan Stanley Global Strategist Fund
Notes to Financial Statements n January 31, 2012 (unaudited) continued
The Fund may be subject to taxes imposed by countries in which it invests. Such taxes are generally based on income and/or capital gains earned or repatriated. Taxes are accrued based on net investment income, net realized gains and net unrealized appreciation as such income and/or gains are earned. Taxes may also be based on transactions in foreign currency and are accrued based on the value of investments denominated in such currency.
FASB ASC 740-10, Income Taxes — Overall, sets forth a minimum threshold for financial statement recognition of the benefit of a tax position taken or expected to be taken in a tax return. Management has concluded there are no significant uncertain tax positions that would require recognition in the financial statements. If applicable, the Fund recognizes interest accrued related to unrecognized tax benefits in "Interest Expense" and penalties in "Other Expenses" in the Statement of Operations. The Fund files tax returns with the U.S. Internal Revenue Service, New York and various states. Each of the tax years in the four-year period ended July 31, 2011, remains subject to examination by taxing authorities.
The tax character of distributions paid may differ from the character of distributions shown in the Statements of Changes in Net Assets due to short-term capital gains being treated as ordinary income for tax purposes. The tax character of distributions paid during fiscal 2011 and 2010 was as follows:
| 2011 DISTRIBUTIONS PAID FROM: | 2010 DISTRIBUTIONS PAID FROM: | ||||||||||||||
| ORDINARY INCOME | LONG-TERM CAPITAL GAIN | ORDINARY INCOME | LONG-TERM CAPITAL GAIN | ||||||||||||
| $ | 9,018,539 | $ | 79,890,968 | $ | 9,061,044 | — | |||||||||
The amount and character of income and gains to be distributed are determined in accordance with income tax regulations which may differ from GAAP. These book/tax differences are either considered temporary or permanent in nature.
Temporary differences are primarily due to differing book and tax treatments in the timing of the recognition of gains (losses) on certain investment transactions and the timing of the deductibility of certain expenses.
Permanent differences, primarily due to foreign currency gains, losses on paydowns and swaps and tax adjustments on debt securities and PFICs sold by the Fund, resulted in the following reclassifications among the Fund's components of net assets at July 31, 2011:
| ACCUMULATED UNDISTRIBUTED NET INVESTMENT INCOME | ACCUMULATED UNDISTRIBUTED NET REALIZED GAIN | PAID-IN CAPITAL | |||||||||
| $ | 8,897,055 | $ | (8,897,055 | ) | — | ||||||
78
Morgan Stanley Global Strategist Fund
Notes to Financial Statements n January 31, 2012 (unaudited) continued
At July 31, 2011, the components of distributable earnings for the Fund on a tax basis were as follows:
| UNDISTRIBUTED ORDINARY INCOME | UNDISTRIBUTED LONG-TERM CAPITAL GAIN | ||||||
| $ | 26,409,119 | $ | 9,472,663 | ||||
At January 31, 2012, the aggregate cost for federal income tax purposes approximates the aggregate cost for book purposes. The aggregate gross unrealized appreciation is $43,088,383 and the aggregate gross unrealized depreciation is $20,824,324 resulting in net unrealized appreciation of $22,264,059.
On December 22, 2010, the Regulated Investment Company Modernization Act of 2010 (the "Modernization Act") was signed into law. The Modernization Act modernizes several tax provisions related to Regulated Investment Companies ("RICs") and their shareholders. One key change made by the Modernization Act is the capital losses will generally retain their character as short-term or long-term and may be carried forward indefinitely to offset future gains. These losses are utilized before other capital loss carryforwards that expire. Generally, the Modernization Act is effective for taxable years beginning after December 22, 2010.
10. Expense Offset
The Fund has entered into an arrangement with State Street (the "Custodian"), whereby credits realized on uninvested cash balances were used to offset a portion of the Fund's expenses. If applicable, these custodian credits are shown as "expense offset" in the Statement of Operations.
11. Accounting Pronouncement
In May 2011, FASB issued Accounting Standards Update ("ASU") 2011-04. The amendments in this update are the results of the work of FASB and the International Accounting Standards Board to develop common requirements for measuring fair value and for disclosing information about fair value measurements, which are effective during interim and annual periods beginning after December 15, 2011. Consequently, these amendments improve the comparability of fair value measurements presented and disclosed in the financial statements prepared in accordance with GAAP and International Financial Reporting Standards. At this time, the Fund's management is evaluating the implications of ASU 2011-04.
79
Morgan Stanley Global Strategist Fund
Financial Highlights
Selected ratios and per share data for a share of beneficial interest outstanding throughout each period:
| FOR THE SIX | FOR THE YEAR ENDED JULY 31, | ||||||||||||||||||||||||||
| MONTHS ENDED | |||||||||||||||||||||||||||
| JANUARY 31, 2012 | 2011 | 2010^ | 2009^ | 2008^ | 2007^ | ||||||||||||||||||||||
| (unaudited) | |||||||||||||||||||||||||||
| Class A Shares | |||||||||||||||||||||||||||
| Selected Per Share Data: | |||||||||||||||||||||||||||
| Net asset value, beginning of period | $ | 16.71 | $ | 17.33 | $ | 16.23 | $ | 18.07 | $ | 20.57 | $ | 19.74 | |||||||||||||||
| Income (loss) from investment operations: | |||||||||||||||||||||||||||
| Net investment income(1) | 0.13 | 0.25 | 0.21 | 0.25 | 0.45 | 0.50 | |||||||||||||||||||||
| Net realized and unrealized gain (loss) | (0.65 | ) | 1.87 | 1.17 | (1.74 | ) | (1.23 | ) | 2.07 | ||||||||||||||||||
| Total income (loss) from investment operations | (0.52 | ) | 2.12 | 1.38 | (1.49 | ) | (0.78 | ) | 2.57 | ||||||||||||||||||
| Less dividends and distributions from: | |||||||||||||||||||||||||||
| Net investment income | (0.40 | ) | (0.12 | ) | (0.28 | ) | (0.30 | ) | (0.49 | ) | (0.51 | ) | |||||||||||||||
| Net realized gain | (0.77 | ) | (2.62 | ) | — | (0.05 | ) | (1.23 | ) | (1.23 | ) | ||||||||||||||||
| Total dividends and distributions | (1.17 | ) | (2.74 | ) | (0.28 | ) | (0.35 | ) | (1.72 | ) | (1.74 | ) | |||||||||||||||
| Net asset value, end of period | $ | 15.02 | $ | 16.71 | $ | 17.33 | $ | 16.23 | $ | 18.07 | $ | 20.57 | |||||||||||||||
| Total Return(2) | (2.63 | )%(6) | 13.13 | % | 8.52 | % | (8.06 | )% | (4.27 | )% | 13.30 | % | |||||||||||||||
| Ratios to Average Net Assets(3): | |||||||||||||||||||||||||||
| Total expenses | 0.99 | %(4)(7) | 0.96 | %(4) | 0.91 | %(4) | 0.95 | %(4) | 0.90 | %(4) | 0.92 | %(4) | |||||||||||||||
| Net investment income | 1.67 | %(4)(7) | 1.47 | %(4) | 1.24 | %(4) | 1.64 | %(4) | 2.30 | %(4) | 2.44 | %(4) | |||||||||||||||
| Rebate from Morgan Stanley affiliate | 0.01 | %(7) | 0.02 | % | 0.03 | % | 0.02 | % | 0.02 | % | 0.00 | %(5) | |||||||||||||||
| Supplemental Data: | |||||||||||||||||||||||||||
| Net assets, end of period, in thousands | $ | 399,441 | $ | 457,333 | $ | 459,742 | $ | 457,914 | $ | 504,350 | $ | 553,395 | |||||||||||||||
| Portfolio turnover rate | 39 | %(6) | 123 | % | 173 | % | 83 | % | 42 | % | 42 | % | |||||||||||||||
^ Beginning with the year ended July 31, 2011, the Fund was audited by Ernst & Young LLP. The previous years were audited by another independent registered public accounting firm.
(1) The per share amounts were computed using an average number of shares outstanding during the period.
(2) Does not reflect the deduction of sales charge. Calculated based on the net asset value as of the last business day of the period.
(3) Reflects overall Fund ratios for investment income and non-class specific expenses.
(4) The ratios reflect the rebate of certain Fund expenses in connection with investments in a Morgan Stanley affiliate during the period. The effect of the rebate on the ratios is disclosed in the above table as "Rebate from Morgan Stanley affiliate."
(5) Amount is less than 0.005%.
(6) Not annualized.
(7) Annualized.
See Notes to Financial Statements
80
Morgan Stanley Global Strategist Fund
Financial Highlights continued
| FOR THE SIX | FOR THE YEAR ENDED JULY 31, | ||||||||||||||||||||||||||
| MONTHS ENDED | |||||||||||||||||||||||||||
| JANUARY 31, 2012 | 2011 | 2010^ | 2009^ | 2008^ | 2007^ | ||||||||||||||||||||||
| (unaudited) | |||||||||||||||||||||||||||
| Class B Shares | |||||||||||||||||||||||||||
| Selected Per Share Data: | |||||||||||||||||||||||||||
| Net asset value, beginning of period | $ | 16.76 | $ | 17.42 | $ | 16.30 | $ | 18.14 | $ | 20.63 | $ | 19.79 | |||||||||||||||
| Income (loss) from investment operations: | |||||||||||||||||||||||||||
| Net investment income(1) | 0.07 | 0.12 | 0.08 | 0.14 | 0.30 | 0.35 | |||||||||||||||||||||
| Net realized and unrealized gain (loss) | (0.65 | ) | 1.88 | 1.18 | (1.75 | ) | (1.23 | ) | 2.07 | ||||||||||||||||||
| Total income (loss) from investment operations | (0.58 | ) | 2.00 | 1.26 | (1.61 | ) | (0.93 | ) | 2.42 | ||||||||||||||||||
| Less dividends and distributions from: | |||||||||||||||||||||||||||
| Net investment income | (0.27 | ) | (0.04 | ) | (0.14 | ) | (0.18 | ) | (0.33 | ) | (0.35 | ) | |||||||||||||||
| Net realized gain | (0.77 | ) | (2.62 | ) | — | (0.05 | ) | (1.23 | ) | (1.23 | ) | ||||||||||||||||
| Total dividends and distributions | (1.04 | ) | (2.66 | ) | (0.14 | ) | (0.23 | ) | (1.56 | ) | (1.58 | ) | |||||||||||||||
| Net asset value, end of period | $ | 15.14 | $ | 16.76 | $ | 17.42 | $ | 16.30 | $ | 18.14 | $ | 20.63 | |||||||||||||||
| Total Return(2) | (3.02 | )%(6) | 12.28 | % | 7.74 | % | (8.77 | )% | (5.02 | )% | 12.50 | % | |||||||||||||||
| Ratios to Average Net Assets(3): | |||||||||||||||||||||||||||
| Total expenses | 1.74 | %(4)(7) | 1.71 | %(4) | 1.66 | %(4) | 1.70 | %(4) | 1.66 | %(4) | 1.67 | %(4) | |||||||||||||||
| Net investment income | 0.92 | %(4)(7) | 0.72 | %(4) | 0.49 | %(4) | 0.89 | %(4) | 1.54 | %(4) | 1.69 | %(4) | |||||||||||||||
| Rebate from Morgan Stanley affiliate | 0.01 | %(7) | 0.02 | % | 0.03 | % | 0.02 | % | 0.02 | % | 0.00 | %(5) | |||||||||||||||
| Supplemental Data: | |||||||||||||||||||||||||||
| Net assets, end of period, in thousands | $ | 23,747 | $ | 34,374 | $ | 57,559 | $ | 90,105 | $ | 175,410 | $ | 276,329 | |||||||||||||||
| Portfolio turnover rate | 39 | %(6) | 123 | % | 173 | % | 83 | % | 42 | % | 42 | % | |||||||||||||||
^ Beginning with the year ended July 31, 2011, the Fund was audited by Ernst & Young LLP. The previous years were audited by another independent registered public accounting firm.
(1) The per share amounts were computed using an average number of shares outstanding during the period.
(2) Does not reflect the deduction of sales charge. Calculated based on the net asset value as of the last business day of the period.
(3) Reflects overall Fund ratios for investment income and non-class specific expenses.
(4) The ratios reflect the rebate of certain Fund expenses in connection with investments in a Morgan Stanley affiliate during the period. The effect of the rebate on the ratios is disclosed in the above table as "Rebate from Morgan Stanley affiliate."
(5) Amount is less than 0.005%.
(6) Not annualized.
(7) Annualized.
See Notes to Financial Statements
81
Morgan Stanley Global Strategist Fund
Financial Highlights continued
| FOR THE SIX | FOR THE YEAR ENDED JULY 31, | ||||||||||||||||||||||||||
| MONTHS ENDED | |||||||||||||||||||||||||||
| JANUARY 31, 2012 | 2011 | 2010^ | 2009^ | 2008^ | 2007^ | ||||||||||||||||||||||
| (unaudited) | |||||||||||||||||||||||||||
| Class C Shares | |||||||||||||||||||||||||||
| Selected Per Share Data: | |||||||||||||||||||||||||||
| Net asset value, beginning of period | $ | 16.55 | $ | 17.24 | $ | 16.15 | $ | 17.99 | $ | 20.48 | $ | 19.66 | |||||||||||||||
| Income (loss) from investment operations: | |||||||||||||||||||||||||||
| Net investment income(1) | 0.07 | 0.12 | 0.08 | 0.14 | 0.30 | 0.35 | |||||||||||||||||||||
| Net realized and unrealized gain (loss) | (0.64 | ) | 1.86 | 1.16 | (1.74 | ) | (1.22 | ) | 2.06 | ||||||||||||||||||
| Total income (loss) from investment operations | (0.57 | ) | 1.98 | 1.24 | (1.60 | ) | (0.92 | ) | 2.41 | ||||||||||||||||||
| Less dividends and distributions from: | |||||||||||||||||||||||||||
| Net investment income | (0.32 | ) | (0.05 | ) | (0.15 | ) | (0.19 | ) | (0.34 | ) | (0.36 | ) | |||||||||||||||
| Net realized gain | (0.77 | ) | (2.62 | ) | — | (0.05 | ) | (1.23 | ) | (1.23 | ) | ||||||||||||||||
| Total dividends and distributions | (1.09 | ) | (2.67 | ) | (0.15 | ) | (0.24 | ) | (1.57 | ) | (1.59 | ) | |||||||||||||||
| Net asset value, end of period | $ | 14.89 | $ | 16.55 | $ | 17.24 | $ | 16.15 | $ | 17.99 | $ | 20.48 | |||||||||||||||
| Total Return(2) | (2.92 | )%(7) | 12.23 | % | 7.76 | % | (8.78 | )% | (4.94 | )% | 12.47 | % | |||||||||||||||
| Ratios to Average Net Assets(3): | |||||||||||||||||||||||||||
| Total expenses | 1.74 | %(4)(8) | 1.71 | %(4) | 1.66 | %(4) | 1.70 | %(4) | 1.64 | %(4)(5) | 1.64 | %(4) | |||||||||||||||
| Net investment income | 0.92 | %(4)(8) | 0.72 | %(4) | 0.49 | %(4) | 0.89 | %(4) | 1.56 | %(4)(5) | 1.72 | %(4) | |||||||||||||||
| Rebate from Morgan Stanley affiliate | 0.01 | %(8) | 0.02 | % | 0.03 | % | 0.02 | % | 0.02 | % | 0.00 | %(6) | |||||||||||||||
| Supplemental Data: | |||||||||||||||||||||||||||
| Net assets, end of period, in thousands | $ | 38,747 | $ | 43,411 | $ | 41,439 | $ | 40,203 | $ | 44,664 | $ | 48,192 | |||||||||||||||
| Portfolio turnover rate | 39 | %(7) | 123 | % | 173 | % | 83 | % | 42 | % | 42 | % | |||||||||||||||
^ Beginning with the year ended July 31, 2011, the Fund was audited by Ernst & Young LLP. The previous years were audited by another independent registered public accounting firm.
(1) The per share amounts were computed using an average number of shares outstanding during the period.
(2) Does not reflect the deduction of sales charge. Calculated based on the net asset value as of the last business day of the period.
(3) Reflects overall Fund ratios for investment income and non-class specific expenses.
(4) The ratios reflect the rebate of certain Fund expenses in connection with investments in a Morgan Stanley affiliate during the period. The effect of the rebate on the ratios is disclosed in the above table as "Rebate from Morgan Stanley affiliate."
(5) If the Fund had borne all of its expenses that were waived by the Adviser and Administrator, the annualized expense and net investment income ratios, would have been 1.65% and 1.55%, respectively.
(6) Amount is less than 0.005%.
(7) Not annualized.
(8) Annualized.
See Notes to Financial Statements
82
Morgan Stanley Global Strategist Fund
Financial Highlights continued
| FOR THE SIX | FOR THE YEAR ENDED JULY 31, | ||||||||||||||||||||||||||
| MONTHS ENDED | |||||||||||||||||||||||||||
| JANUARY 31, 2012 | 2011 | 2010^ | 2009^ | 2008^ | 2007^ | ||||||||||||||||||||||
| (unaudited) | |||||||||||||||||||||||||||
| Class I Shares | |||||||||||||||||||||||||||
| Selected Per Share Data: | |||||||||||||||||||||||||||
| Net asset value, beginning of period | $ | 16.76 | $ | 17.35 | $ | 16.25 | $ | 18.10 | $ | 20.59 | $ | 19.76 | |||||||||||||||
| Income (loss) from investment operations: | |||||||||||||||||||||||||||
| Net investment income(1) | 0.15 | 0.30 | 0.25 | 0.29 | 0.51 | 0.55 | |||||||||||||||||||||
| Net realized and unrealized gain (loss) | (0.66 | ) | 1.87 | 1.17 | (1.75 | ) | (1.23 | ) | 2.07 | ||||||||||||||||||
| Total income (loss) from investment operations | (0.51 | ) | 2.17 | 1.42 | (1.46 | ) | (0.72 | ) | 2.62 | ||||||||||||||||||
| Less dividends and distributions from: | |||||||||||||||||||||||||||
| Net investment income | (0.42 | ) | (0.14 | ) | (0.32 | ) | (0.34 | ) | (0.54 | ) | (0.56 | ) | |||||||||||||||
| Net realized gain | (0.77 | ) | (2.62 | ) | — | (0.05 | ) | (1.23 | ) | (1.23 | ) | ||||||||||||||||
| Total dividends and distributions | (1.19 | ) | (2.76 | ) | (0.32 | ) | (0.39 | ) | (1.77 | ) | (1.79 | ) | |||||||||||||||
| Net asset value, end of period | $ | 15.06 | $ | 16.76 | $ | 17.35 | $ | 16.25 | $ | 18.10 | $ | 20.59 | |||||||||||||||
| Total Return(2) | (2.51 | )%(6) | 13.38 | % | 8.84 | % | (7.86 | )% | (4.02 | )% | 13.62 | % | |||||||||||||||
| Ratios to Average Net Assets(3): | |||||||||||||||||||||||||||
| Total expenses | 0.74 | %(4)(7) | 0.71 | %(4) | 0.66 | %(4) | 0.70 | %(4) | 0.66 | %(4) | 0.67 | %(4) | |||||||||||||||
| Net investment income | 1.92 | %(4)(7) | 1.72 | %(4) | 1.49 | %(4) | 1.89 | %(4) | 2.54 | %(4) | 2.69 | %(4) | |||||||||||||||
| Rebate from Morgan Stanley affiliate | 0.01 | %(7) | 0.02 | % | 0.03 | % | 0.02 | % | 0.02 | % | 0.00 | %(5) | |||||||||||||||
| Supplemental Data: | |||||||||||||||||||||||||||
| Net assets, end of period, in thousands | $ | 24,361 | $ | 27,116 | $ | 26,228 | $ | 26,901 | $ | 27,823 | $ | 66,753 | |||||||||||||||
| Portfolio turnover rate | 39 | %(6) | 123 | % | 173 | % | 83 | % | 42 | % | 42 | % | |||||||||||||||
^ Beginning with the year ended July 31, 2011, the Fund was audited by Ernst & Young LLP. The previous years were audited by another independent registered public accounting firm.
(1) The per share amounts were computed using an average number of shares outstanding during the period.
(2) Calculated based on the net asset value as of the last business day of the period.
(3) Reflects overall Fund ratios for investment income and non-class specific expenses.
(4) The ratios reflect the rebate of certain Fund expenses in connection with investments in a Morgan Stanley affiliate during the period. The effect of the rebate on the ratios is disclosed in the above table as "Rebate from Morgan Stanley affiliate."
(5) Amount is less than 0.005%.
(6) Not annualized.
(7) Annualized.
See Notes to Financial Statements
83
Morgan Stanley Global Strategist Fund
U.S. Privacy Policy (unaudited)
An Important Notice Concerning Our U.S. Privacy Policy
This privacy notice describes the U.S. privacy policy of Morgan Stanley Distribution, Inc. and the Morgan Stanley family of mutual funds ("us", "our", "we").
We are required by federal law to provide you with notice of our U.S. privacy policy ("Policy"). This Policy applies to both our current and former clients unless we state otherwise and is intended for individual clients who purchase products or receive services from us for personal, family or household purposes. This Policy is not applicable to partnerships, corporations, trusts or other non-individual clients or account holders, nor is this Policy applicable to individuals who are either beneficiaries of a trust for which we serve as trustee or participants in an employee benefit plan administered or advised by us. This Policy is, however, applicable to individuals who select us to be a custodian of securities or assets in individual retirement accounts, 401(k) accounts, or accounts subject to the Uniform Gifts to Minors Act.
This notice sets out our business practices to protect your privacy; how we collect and share personal information about you; and how you can limit our sharing or certain uses by others of this information. We may amend this Policy at any time, and will inform you of any changes to our Policy as required by law.
We Respect Your Privacy
We appreciate that you have provided us with your personal financial information and understand your concerns about your information. We strive to safeguard the information our clients entrust to us. Protecting the confidentiality and security of client information is an important part of how we conduct our business.
This notice describes what personal information we collect about you, how we collect it, when we may share it with others, and how certain others may use it. It discusses the steps you may take to limit our sharing of certain information about you with our affiliated companies, including, but not limited to our affiliated banking businesses, brokerage firms and credit service affiliates, It also discloses how you may limit our affiliates' use of shared information for marketing purposes.
Throughout this Policy, we refer to the nonpublic information that personally identifies you as "personal information." We also use the term "affiliated company" in this notice. An affiliated company is a company in our family of companies and includes companies with the Morgan Stanley name. These affiliated companies are financial institutions such as broker-dealers, banks, investment advisers and credit card issuers. We refer to any company that is not an affiliated company as a nonaffiliated third party. For purposes of Section 5 of this notice, and your ability to limit certain uses of personal information by our affiliates, this notice applies to the use of personal information by our affiliated companies.
84
Morgan Stanley Global Strategist Fund
U.S. Privacy Policy (unaudited) continued
1. What Personal Information Do We Collect From You?
We may collect the following types of information about you: (i) information provided by you, including information from applications and other forms we receive from you, (ii) information about your transactions with us or our affiliates, (iii) information about your transactions with nonaffiliated third parties, (iv) information from consumer reporting agencies, (v) information obtained from our websites, and (vi) information obtained from other sources. For example:
• We collect information such as your name, address, e-mail address, telephone/fax numbers, assets, income and investment objectives through applications and other forms you submit to us.
• We may obtain information about account balances, your use of account(s) and the types of products and services you prefer to receive from us through your dealings and transactions with us and other sources.
• We may obtain information about your creditworthiness and credit history from consumer reporting agencies.
• We may collect background information from and through third-party vendors to verify representations you have made and to comply with various regulatory requirements.
2. When Do We Disclose Personal Information We Collect About You?
We may disclose personal information we collect about you in each of the categories listed above to affiliated and nonaffiliated third parties.
a. Information We Disclose to Affiliated Companies. We may disclose personal information that we collect about you to our affiliated companies to manage your account(s) effectively, to service and process your transactions, and to let you know about products and services offered by us and affiliated companies, to manage our business, and as otherwise required or permitted by law. Offers for products and services from affiliated companies are developed under conditions designed to safeguard your personal information.
b. Information We Disclose to Third Parties. We may disclose personal information that we collect about you to nonaffiliated third parties to provide marketing services on our behalf or to other financial institutions with whom we have joint marketing agreements. We may also disclose all of the information we collect to other nonaffiliated third parties for our everyday business purposes, such as to process transactions, maintain account(s), respond to court orders and legal investigations, report to credit bureaus, offer our own products and services, protect against fraud, for institutional risk control, to perform services on our behalf, and as otherwise required or permitted by law.
85
Morgan Stanley Global Strategist Fund
U.S. Privacy Policy (unaudited) continued
When we share personal information about you with a nonaffiliated third party, they are required to limit their use of personal information about you to the particular purpose for which it was shared and they are not allowed to share personal information about you with others except to fulfill that limited purpose or as may be permitted or required by law.
3. How Do We Protect The Security and Confidentiality of Personal Information We Collect About You?
We maintain physical, electronic and procedural security measures that comply with applicable law and regulations to help safeguard the personal information we collect about you. We have internal policies governing the proper handling of client information by employees. Third parties that provide support or marketing services on our behalf may also receive personal information about you, and we require them to adhere to appropriate security standards with respect to such information.
4. How Can You Limit Our Sharing Certain Personal Information About You With Our Affiliated Companies For Eligibility Determination?
By following the opt-out procedures in Section 6, below, you may limit the extent to which we share with our affiliated companies, personal information that was collected to determine your eligibility for products and services such as your credit reports and other information that you have provided to us or that we may obtain from third parties ("eligibility information"). Eligibility information does not include your identification information or personal information pertaining to our transactions or experiences with you. Please note that, even if you direct us not to share eligibility information with our affiliated companies, we may still share your personal information, including eligibility information, with our affiliated companies under circumstances that are permitted under applicable law, such as to process transactions or to service your account.
5. How Can You Limit the Use of Certain Personal Information About You by Our Affiliated Companies for Marketing?
By following the opt-out instructions in Section 6, below, you may limit our affiliated companies from marketing their products or services to you based on personal information we disclose to them. This information may include, for example, your income and account history with us. Please note that, even if you choose to limit our affiliated companies from using personal information about you that we may share with them for marketing their products and services to you, our affiliated companies may use your personal information that they obtain from us to market to you in circumstances permitted by law, such as if the affiliated party has its own relationship with you.
86
Morgan Stanley Global Strategist Fund
U.S. Privacy Policy (unaudited) continued
6. How Can You Send Us an Opt-Out Instruction?
If you wish to limit our sharing of eligibility information about you with our affiliated companies, or our affiliated companies' use of personal information for marketing purposes, as described in this notice, you may do so by:
• Calling us at (800) 548-7786
Monday–Friday between 8a.m. and 5p.m. (EST)
• Writing to us at the following address:
Morgan Stanley Services Company Inc.
c/o Privacy Coordinator
201 Plaza Two, 3rd Floor
Jersey City, New Jersey 07311
If you choose to write to us, your request should include: your name, address, telephone number and account number(s) to which the opt-out applies and whether you are opting out with respect to sharing of eligibility information (Section 4 above), or information used for marketing (Section 5 above), or both. Written opt-out requests should not be sent with any other correspondence. In order to process your request, we require that the request be provided by you directly and not through a third party. Once you have informed us about your privacy preferences, your opt-out preference will remain in effect with respect to this Policy (as it may be amended) until you notify us otherwise. If you are a joint account owner, we will accept instructions from any one of you and apply those instructions to the entire account.
Please understand that if you limit our sharing or our affiliated companies' use of personal information, you and any joint account holder(s) may not receive information about our affiliated companies' products and services, including products or services that could help you manage your financial resources and achieve your investment objectives.
If you have more than one account or relationship with us, please specify the accounts to which you would like us to apply your privacy choices. If you have accounts or relationships with our affiliates, you may receive multiple privacy policies from them, and will need to separately notify those companies of your privacy choices for those accounts or relationships.
7. What if an affiliated company becomes a nonaffiliated third party?
If, at any time in the future, an affiliated company becomes a nonaffiliated third party, further disclosures of personal information made to the former affiliated company will be limited to those described in Section 2(b) above relating to nonaffiliated third parties. If you elected under Section 6 to limit disclosures we make to affiliated companies, or use of personal information by affiliated companies, your election will not apply to use by any former affiliated company of your personal information in their possession once it becomes a nonaffiliated third party.
87
Morgan Stanley Global Strategist Fund
U.S. Privacy Policy (unaudited) continued
Special Notice to Residents of Vermont
The following section supplements our Policy with respect to our individual clients who have a Vermont address and supersedes anything to the contrary in the above Policy with respect to those clients only.
The State of Vermont requires financial institutions to obtain your consent prior to sharing personal information that they collect about you with nonaffiliated third parties, or eligibility information with affiliated companies, other than in certain limited circumstances. Except as permitted by law, we will not share personal information we collect about you with nonaffiliated third parties or eligibility information with affiliated companies, unless you provide us with your written consent to share such information.
Special Notice to Residents of California
The following section supplements our Policy with respect to our individual clients who have a California address and supersedes anything to the contrary in the above Policy with respect to those clients only.
In response to a California law, if your account has a California home address, your personal information will not be disclosed to nonaffiliated third parties except as permitted by applicable California law, and we will limit sharing such personal information with our affiliates to comply with California privacy laws that apply to us.
88
(This page has been left blank intentionally.)
(This page has been left blank intentionally.)
(This page has been left blank intentionally.)
MORGAN STANLEY INSTITUTIONAL FUND TRUST
MID CAP GROWTH PORTFOLIO
GLOBAL STRATEGIST PORTFOLIO
PART B
STATEMENT OF ADDITIONAL INFORMATION
This Statement of Additional Information (the “SAI”) relates to the shares of beneficial interest (“shares”) of each of the Mid Cap Growth Portfolio (“MSIFT Mid Cap Growth”) and the Global Strategist Portfolio (formerly the Balanced Portfolio) (“MSIFT Global Strategist”), each a series of Morgan Stanley Institutional Fund Trust (the “Company”), to be issued pursuant to (i) an Agreement and Plan of Reorganization, dated June 28, 2012, between the Company, on behalf of MSIFT Mid Cap Growth, and Morgan Stanley Mid Cap Growth (“Mid Cap Growth”), in connection with the acquisition by MSIFT Mid Cap Growth of substantially all of the assets and liabilities of Mid Cap Growth (the “Mid Cap Growth Reorganization”) and (ii) an Agreement and Plan of Reorganization, dated June 28, 2012, between the Company, on behalf of MSIFT Global Strategist, and Morgan Stanley Global Strategist (“Global Strategist”), in connection with the acquisition by MSIFT Global Strategist of substantially all of the assets and liabilities of Global Strategist (the “Global Strategist Reorganization”).
MSIFT Mid Cap Growth and MSIFT Global Strategist are each referred to herein as an “Acquiring Fund,” and together as the “Acquiring Funds.” Mid Cap Growth and Global Strategist are each referred to herein as an “Acquired Fund,” and together as the “Acquired Funds.” The Mid Cap Growth Reorganization and Global Strategist Reorganization are each referred to herein as a “Reorganization,” and together as the “Reorganizations.”
This SAI does not constitute a prospectus. This SAI does not include all information that a shareholder should consider before voting on the proposals contained in the Joint Proxy Statement and Prospectus, and, therefore, should be read in conjunction with the related Joint Proxy Statement and Prospectus, dated July 24, 2012. A copy of the Joint Proxy Statement and Prospectus may be obtained upon request and without charge by calling (800) 548-7786 (toll-free). Please retain this document for future reference.
The date of this SAI is July 24, 2012.
Table of Contents |
| Page |
|
|
|
Introduction |
| B-2 |
|
|
|
Additional Information About the Acquiring Funds |
| B-2 |
|
|
|
Financial Statements |
| B-4 |
INTRODUCTION
This SAI is intended to supplement the information provided in the Joint Proxy Statement and Prospectus dated July 24, 2012 (the “Joint Proxy Statement and Prospectus”). The Joint Proxy Statement and Prospectus has been sent to the Acquired Funds’ Shareholders in connection with the solicitation of proxies by the Board of Trustees of each of the Acquired Funds to be voted at the Special Meetings of Shareholders of each of the Acquired Funds to be held on September 27, 2012. Each of (i) the Company’s Statements of Additional Information, dated January 31, 2012, with respect to the MSIFT Mid Cap Growth Class I shares of, April 30, 2012, with respect to MSIFT Mid Cap Growth Class H and Class L shares and July 16, 2012, with respect to MSIFT Global Strategist, each as it may be amended and supplemented from time to time (the “Company’s Statement of Additional Information”), (ii) Mid Cap Growth’s Statement of Additional Information, dated January 31, 2012, as it may be amended and supplemented from time to time (the “Mid Cap Growth Statement of Additional Information”); and (iii) Global Strategist’s Statement of Additional Information, dated November 30, 2011, as it may be amended and supplemented from time to time (the “Global Strategist Statement of Additional Information”) accompany, and are incorporated by reference in, this SAI.
ADDITIONAL INFORMATION ABOUT THE ACQUIRING FUNDS
Fund History
For additional information about each Acquiring Fund’s history, see “General Information—Fund History” in the Company’s Statement of Additional Information relating to each Acquiring Fund.
Investment Objectives and Policies
For additional information about each Acquiring Fund’s investment objectives and policies, see “The Portfolios’ Investments and Strategies” in the Company’s Statement of Additional Information relating to each Acquiring Fund.
Fund Holdings
For additional information about each Acquiring Fund’s policies and procedures with respect to the disclosure of their portfolio securities to any person, see “Disclosure of Portfolio Holdings” in the Company’s Statement of Additional Information relating to each Acquiring Fund.
Management
For additional information about the Board of Trustees, officers and management personnel of each Acquiring Fund, see “Management of the Fund” in the Company’s Statement of Additional Information relating to each Acquiring Fund.
Investment Advisory and Other Services
For additional information about each Acquiring Fund’s investment adviser, each Acquiring Fund’s independent registered public accounting firm and other services provided to each Acquiring Fund, see “Adviser” and “Other Service Providers” and in the Company’s Statement of Additional Information relating to each Acquiring Fund.
Codes of Ethics
For additional information about the Codes of Ethics adopted by each Acquiring Fund, each Acquiring Fund’s investment adviser and each Acquiring Fund’s distributor, see “Adviser—Code of Ethics” in the Company’s Statement of Additional Information relating to each Acquiring Fund.
Proxy Voting Policies
For additional information about the voting of proxies held by each Acquiring Fund, see “Adviser—Proxy Voting Policy and Proxy Voting Record” in the Company’s Statement of Additional Information relating to each Acquiring Fund.
Fund Managers
For additional information about the portfolio managers primarily responsible for the day-to-day management of each Acquiring Fund, their compensation structure and their holdings in each Acquiring Fund, see “Adviser—Portfolio Managers” in the Company’s Statement of Additional Information relating to each Acquiring Fund.
Fund Transactions and Brokerage
For additional information about brokerage allocation practices, see “Brokerage Transactions” in the Company’s Statement of Additional Information relating to each Acquiring Fund.
Description of Fund Shares
For additional information about the voting rights and other characteristics of the shares of each Acquiring Fund, see “General Information—Description of Shares and Voting Rights” in the Company’s Statement of Additional Information relating to each Acquiring Fund.
Purchase, Redemption and Pricing of Shares
For additional information about the purchase and redemption of each Acquiring Fund’s shares and the determination of net asset value, see “Purchase of Shares” and “Redemption of Shares” in the Company’s Statement of Additional Information relating to each Acquiring Fund.
Dividends, Distributions and Tax Status
For additional information about each Acquiring Fund’s policies regarding dividends and distributions and tax matters affecting each Acquiring Fund and its Shareholders, see “General Information—Dividends and Distributions” and “Tax Considerations” in the Company’s Statement of Additional Information relating to each Acquiring Fund.
Distribution of Shares
For additional information about each Acquiring Fund’s distributor and the distribution agreement between each Acquiring Fund and its distributor, see “Distribution and Shareholder Services Plans” in the Company’s Statement of Additional Information relating to each Acquiring Fund.
Performance Data
For additional information about each Acquiring Fund’s performance, see “Performance Information” in the Company’s Statement of Additional Information relating to each Acquiring Fund.
FINANCIAL STATEMENTS
1. The most recent audited financial statements of (i) the Acquiring Funds, for the fiscal year ended September 30, 2011, (ii) Mid Cap Growth for the fiscal year ended September 30, 2011 and (iii) Global Strategist for the fiscal year ended July 31, 2011, have been audited by Ernst & Young LLP, an independent registered public accounting firm. Ernst & Young LLP’s reports, along with the Funds’ audited financial statements, are included in each respective Fund’s Annual Report to Shareholders for the most recently completed fiscal year. The Acquiring Funds’, Mid Cap Growth’s and Global Strategist’s most recent financial statements (unaudited) are set forth in each Fund’s Semi-Annual Report for the six-month period ended March 31, 2012 (with respect to the Acquiring Funds and Mid Cap Growth) and January 31, 2012 (with respect to Global Strategist). A copy of each report accompanies and is incorporated by reference in this SAI. In addition, a copy of the Acquiring Funds’ Annual Report for the fiscal year ended September 30, 2011 accompanies the Proxy Statement and Prospectus.
2. Pursuant to Item 14(2) of Form N-14, the pro forma financial statements required by Rule 11-01 of Regulation S-X are not prepared for the Mid Cap Growth Reorganizations because, in that case, the net asset value of the applicable Acquired Fund does not exceed ten percent of the applicable Acquiring Fund’s net asset value, measured at July 23, 2012.
3. Shown below are Financial Statements for Global Strategist and MSIFT Global Strategist and Pro Forma Financial Statements for the applicable Combined Fund as of March 31, 2012, as though the reorganization occurred as of that date. These financial statements set forth the unaudited pro forma condensed Statement of Assets and Liabilities as of March 31, 2012, the unaudited pro forma condensed Statement of Operations for the twelve month period ended March 31, 2012 and the unaudited pro forma condensed Portfolio of Investments as of March 31, 2012. These statements have been derived from the books and records utilized in calculating daily net asset value for each Portfolio.
Pro Forma Combined Condensed Statement of Assets and Liabilities
As of March 31, 2012 (Unaudited)
|
| Morgan Stanley |
| Morgan Stanley |
| Adjustments |
| Pro Forma |
| ||||
|
|
|
|
|
|
|
|
|
| ||||
Assets: |
|
|
|
|
|
|
|
|
| ||||
Investments in Securities of Unaffiliated Issuers, at Cost |
| $ | 417,268 |
| $ | 35,356 |
| $ | — |
| $ | 452,624 |
|
Investments in Securities of Affiliated Issuers, at Cost |
| 35,486 |
| 11,757 |
| — |
| 47,243 |
| ||||
Total Investments in Securities, at Cost |
| 452,754 |
| 47,113 |
| — |
| 499,867 |
| ||||
Foreign Currency, at Cost |
| 3,341 |
| 87 |
| — |
| 3,428 |
| ||||
Investments in Securities of Unaffiliated Issuers, at Value (1) |
| 448,193 |
| 36,966 |
| — |
| 485,159 |
| ||||
Investments in Securities of Affiliated Issuers, at Value |
| 35,776 |
| 11,736 |
| — |
| 47,512 |
| ||||
Total Investments in Securities, at Value (1) |
| 483,969 |
| 48,702 |
| — |
| 532,671 |
| ||||
Cash |
| — |
| 21 |
| — |
| 21 |
| ||||
Foreign Currency, at Value |
| 3,385 |
| 90 |
| — |
| 3,475 |
| ||||
Receivable for Investments Sold |
| 6,620 |
| 80 |
| — |
| 6,700 |
| ||||
Variation Margin |
| 7,629 |
| 794 |
| — |
| 8,423 |
| ||||
Dividends Receivable |
| 702 |
| 25 |
| — |
| 727 |
| ||||
Interest Receivable |
| 1,959 |
| 97 |
| — |
| 2,056 |
| ||||
Unrealized Appreciation on Swap Agreements |
| 1,322 |
| 74 |
| — |
| 1,396 |
| ||||
Receivable for Portfolio Shares Sold |
| 80 |
| 3 |
| — |
| 83 |
| ||||
Unrealized Appreciation on Foreign Currency Exchange Contracts |
| 634 |
| 29 |
| — |
| 663 |
| ||||
Tax Reclaim Receivable |
| 159 |
| 1 |
| — |
| 160 |
| ||||
Receivable from Affiliate |
| 7 |
| 4 |
| — |
| 11 |
| ||||
Other Assets |
| 46 |
| 14 |
| — |
| 60 |
| ||||
Total Assets |
| 506,512 |
| 49,934 |
| — |
| 556,446 |
| ||||
|
|
|
|
|
|
|
|
|
| ||||
Liabilities: |
|
|
|
|
|
|
|
|
| ||||
Collateral on Securities Loaned, at Value |
| — |
| 7,104 |
| — |
| 7,104 |
| ||||
Payable for Investments Purchased |
| 13,357 |
| 1,664 |
| — |
| 15,021 |
| ||||
Payable for Portfolio Shares Redeemed |
| 894 |
| — |
| — |
| 894 |
| ||||
Payable for Investment Advisory Fees |
| 170 |
| 45 |
| — |
| 215 |
| ||||
Payable for Sub Transfer Agency Fees |
| — |
| 8 |
| — |
| 8 |
| ||||
Unrealized Depreciation on Swap Agreements |
| 2,930 |
| 63 |
| — |
| 2,993 |
| ||||
Unrealized Depreciation on Foreign Currency Exchange Contracts |
| 1,181 |
| 14 |
| — |
| 1,195 |
| ||||
Due From Broker |
| 340 |
| — |
| — |
| 340 |
| ||||
Payable for Custodian Fees |
| (2 | ) | 7 |
| — |
| 5 |
| ||||
Payable for Professional Fees |
| 46 |
| 24 |
| — |
| 70 |
| ||||
Payable for Administration Fees |
| 33 |
| 3 |
| — |
| 36 |
| ||||
Payable for Trustees’ Fees and Expenses |
| 143 |
| 7 |
| — |
| 150 |
| ||||
Payable for Transfer Agent Fees |
| 111 |
| 1 |
| — |
| 112 |
| ||||
Payable for Shareholder Servicing Fees — Class P |
| — |
| 4 |
| — |
| 4 |
| ||||
Distribution Fee |
| 149 |
| — |
| — |
| 149 |
| ||||
Payable for Reorganization Expense |
| — |
| — |
| 686 |
| 686 |
| ||||
Other Liabilities |
| 64 |
| 20 |
| — |
| 84 |
| ||||
Total Liabilities |
| $ | 19,416 |
| $ | 8,964 |
| $ | 686 |
| $ | 29,066 |
|
Net Assets |
| $ | 487,096 |
| $ | 40,970 |
| $ | (686 | ) | $ | 527,380 |
|
|
|
|
|
|
|
|
|
|
| ||||
Net Assets Consist Of: |
|
|
|
|
|
|
|
|
| ||||
Paid in Capital |
| $ | 450,827 |
| $ | 43,047 |
| — |
| 493,874 |
| ||
Undistributed Net Investment Income |
| 5,857 |
| 266 |
| (686 | ) | 5,437 |
| ||||
Accumulated Net Realized Gain (Loss) |
| 1,217 |
| (4,035 | ) | — |
| (2,818 | ) | ||||
Unrealized Appreciation (Depreciation) on: |
|
|
|
|
|
|
|
|
| ||||
Investments |
| 30,925 |
| 1,610 |
| — |
| 32,535 |
| ||||
Investments in Affiliates |
| 290 |
| (21 | ) | — |
| 269 |
| ||||
Futures Contracts |
| 99 |
| 74 |
| — |
| 173 |
| ||||
Swap Agreements |
| (1,608 | ) | 11 |
| — |
| (1,597 | ) | ||||
Foreign Currency Exchange Contracts |
| (547 | ) | 15 |
| — |
| (532 | ) | ||||
Foreign Currency Translations |
| 36 |
| 3 |
| — |
| 39 |
| ||||
Net Assets |
| $ | 487,096 |
| $ | 40,970 |
| $ | (686 | ) | $ | 527,380 |
|
|
| Morgan Stanley |
| Morgan Stanley |
| Adjustments |
| Pro Forma |
| ||||
|
|
|
|
|
|
|
|
|
| ||||
Net Assets |
|
|
|
|
|
|
|
|
| ||||
Class A |
| 401,594 |
|
|
| (401,594 | ) | — |
| ||||
Class B |
| 21,541 |
|
|
| (21,541 | ) | — |
| ||||
Class C |
| 39,208 |
|
|
| (39,208 | ) | — |
| ||||
Class I |
| 24,753 |
| 21,196 |
| (60 | ) | 45,889 |
| ||||
Class P |
| — |
| 19,774 |
| (25 | ) | 19,749 |
| ||||
Class H |
| — |
|
|
| $ | 422,585 |
| 422,585 |
| |||
Class L |
| — |
|
|
| $ | 39,157 |
| 39,157 |
| |||
|
| $ | 487,096 |
| $ | 40,970 |
| $ | (686 | ) | $ | 527,380 |
|
|
|
|
|
|
|
|
|
|
| ||||
Shares Outstanding (not in thousands) |
|
|
|
|
|
|
|
|
| ||||
Class A |
| 25,739,926 |
| — |
| (25,739,926 | ) | — |
| ||||
Class B |
| 1,371,162 |
| — |
| (1,371,162 | ) | — |
| ||||
Class C |
| 2,537,579 |
| — |
| (2,537,579 | ) | — |
| ||||
Class I |
| 1,581,717 |
| 1,457,781 |
| 116,543 |
| 3,156,041 |
| ||||
Class P |
| — |
| 1,363,871 |
| (1,724 | ) | 1,362,147 |
| ||||
Class H |
| — |
| — |
| 29,143,793 |
| 29,143,793 |
| ||||
Class L |
| — |
| — |
| 2,700,482 |
| 2,700,482 |
| ||||
Net Asset Value Per Share |
|
|
|
|
|
|
|
|
| ||||
Class A |
| $ | 15.60 |
| $ | — |
|
|
| $ | — |
| |
Class B |
| $ | 15.71 |
| $ | — |
|
|
| $ | — |
| |
Class C |
| $ | 15.45 |
| $ | — |
|
|
| $ | — |
| |
Class I |
| $ | 15.65 |
| $ | 14.54 |
|
|
| $ | 14.54 |
| |
Class P |
| $ | — |
| $ | 14.50 |
|
|
| $ | 14.50 |
| |
Class H |
| $ | — |
| $ | 14.50 |
|
|
| $ | 14.50 |
| |
Class L |
| $ | — |
| $ | 14.50 |
|
|
| $ | 14.50 |
| |
(1) Including: |
|
|
|
|
|
|
|
|
| |||
Securities on Loan, at Value |
| $ | — |
| $ | 7,630 |
|
|
| $ | 7,630 |
|
PRO FORMA COMBINING CONDENSED STATEMENT OF OPERATIONS
FOR THE TWELVE MONTH PERIOD ENDED
MARCH 31, 2012 (UNAUDITED)
|
| Morgan Stanley |
| Morgan Stanley |
| Adjustments |
| Pro Forma |
| ||||
|
|
|
|
|
|
|
|
|
| ||||
Investment Income: |
|
|
|
|
|
|
|
|
| ||||
Dividends from Securities of Unaffiliated Issuers |
| $ | 8,166 |
| $ | 472 |
| $ | — |
| $ | 8,638 |
|
Interest from Securities of Unaffiliated Issuers |
| $ | 6,636 |
| $ | 695 |
| — |
| $ | 7,331 |
| |
Income from Securities Loaned — Net |
| — |
| 12 |
| — |
| 12 |
| ||||
Dividends from Securities of Affiliated Issuers |
| 109 |
| 7 |
| — |
| 116 |
| ||||
Interest from Securities of Affiliated Issuers |
| 110 |
| 14 |
| — |
| 124 |
| ||||
Less: Foreign Taxes Withheld |
| (434 | ) | (—@ | ) | — |
| (434 | ) | ||||
Total Investment Income |
| 14,587 |
| 1,200 |
| — |
| 15,787 |
| ||||
Expenses: |
|
|
|
|
|
|
|
|
| ||||
Investment Advisory Fees |
| 2,203 |
| 201 |
| — |
| 2,404 |
| ||||
Custodian Fees |
| 196 |
| 124 |
| (20 | )(a) | 300 |
| ||||
Sub Transfer Agency Fees |
| — |
| 15 |
| — |
| 15 |
| ||||
Administration Fees |
| 419 |
| 35 |
| — |
| 454 |
| ||||
Professional Fees |
| 127 |
| 81 |
| (40 | )(b) | 168 |
| ||||
Shareholder Reporting Fees |
| 166 |
| 22 |
| (47 | )(c) | 141 |
| ||||
Registration Fees |
| 56 |
| 22 |
| (56 | )(d) | 22 |
| ||||
Pricing Fees |
| 133 |
| 70 |
| — |
| 203 |
| ||||
Transfer Agency Fees |
| 595 |
| 19 |
| (14 | )(e) | 600 |
| ||||
Trustees’ Fees and Expenses |
| 19 |
| 2 |
| — |
| 21 |
| ||||
Shareholder Servicing Fees — Class P |
| — |
| 46 |
| — |
| 46 |
| ||||
Shareholder Servicing Fees — Investment Class |
| — |
| — |
| — |
| — |
| ||||
Distribution and Shareholder Servicing Fees — Class H |
| — |
| — |
| 1,379 | (f) | 1,379 |
| ||||
Distribution and Shareholder Servicing Fees — Class L |
| — |
| — |
| 408 | (f) | 408 |
| ||||
Distribution Fees (Class A Shares) |
| 1,070 |
| — |
| (1,070 | )(f) | — |
| ||||
Distribution Fees (Class B Shares) |
| 309 |
| — |
| (309 | )(f) | — |
| ||||
Distribution Fees (Class C Shares) |
| 408 |
| — |
| (408 | )(f) | — |
| ||||
Reorganization Expense |
| — |
| — |
| 686 | (g) | 686 |
| ||||
Other Expenses |
| 21 |
| 7 |
| (8 | )(h) | 20 |
| ||||
Total Expenses |
| 5,722 |
| 644 |
| 501 |
| 6,867 |
| ||||
Waiver of Investment Advisory Fees |
| — |
| — |
| — |
| — |
| ||||
Rebate from Morgan Stanley Affiliate |
| (53 | ) | (8 | ) | — |
| (61 | ) | ||||
Net Expenses |
| 5,669 |
| 636 |
| 501 |
| 6,806 |
| ||||
Net Investment Income (Loss) |
| $ | 8,918 |
| $ | 564 |
| $ | (501 | ) | $ | 8,981 |
|
|
|
|
|
|
|
|
|
|
| ||||
Realized Gain (Loss): |
|
|
|
|
|
|
|
|
| ||||
Investment Sold |
| (12,799 | ) | 2,164 |
| — |
| (10,635 | ) | ||||
Investments in Affiliates |
| 29 |
| 37 |
| — |
| 66 |
| ||||
Foreign Currency Exchange Contracts |
| 1,572 |
| 155 |
| — |
| 1,727 |
| ||||
Foreign Currency Transactions |
| 458 |
| 8 |
| — |
| 466 |
| ||||
Futures Contracts |
| 1,117 |
| 1,004 |
| — |
| 2,121 |
| ||||
Swap Agreements |
| (1,519 | ) | (305 | ) | — |
| (1,824 | ) | ||||
Net Realized Gain (Loss) |
| (11,142 | ) | 3,063 |
| — |
| (8,079 | ) | ||||
Change in Unrealized Appreciation (Depreciation): |
|
|
|
|
|
|
|
|
| ||||
Investments |
| (19,435 | ) | (45 | ) | — |
| (19,480 | ) | ||||
Investments in Affiliates |
| 99 |
| (68 | ) | — |
| 31 |
| ||||
Foreign Currency Exchange Contracts |
| (701 | ) | 24 |
| — |
| (677 | ) | ||||
Foreign Currency Translations |
| 242 |
| (1 | ) | — |
| 241 |
| ||||
Futures Contracts |
| (758 | ) | (186 | ) | — |
| (944 | ) | ||||
Swap Agreements |
| (1,742 | ) | 29 |
| — |
| (1,713 | ) | ||||
Net Change in Unrealized Appreciation (Depreciation) |
| (22,295 | ) | (247 | ) | — |
| (22,542 | ) | ||||
Total Net Realized Gain (Loss) and Change in Unrealized Appreciation (Depreciation) |
| (33,437 | ) | 2,816 |
| — |
| (30,621 | ) | ||||
Net Increase (Decrease) in Net Assets Resulting from Operations |
| $ | (24,519 | ) | $ | 3,380 |
| $ | (501 | ) | $ | (21,640 | ) |
@ Amount is less than $500.
(a) — Reflects elimination of transaction based fees of approximately $20,000 for MS Global Strategist Custody OOP Fees.
(b) — Reflects elimination of audit fee for MSIFT Global Strategist as MS Global Strategist was more complicated and higher at $47,000.
(c) —Reflects elimination of approximately $47,000 for Annual Mailing, Printing, & Typsetting of MS Global Strategist Shareholder Reports.
(d) — Reflects elimination of blue sky fees for MS Global Strategist.
(e) — Reflects elimination of approximately $14,000 TA OOP Fees for MS Global Strategist Fund.
(f) — Reclass of Class Level Expenses into actual class MS Global Strategist will be processed into.
(g) — Reflects adjustment estimated for Reorganization Expenses.
(h) — Reflects elimination of approximately $8,000 for miscellaneous invoices for NASDAQ, ITG and Lipper for MS Global Strategist.
Security Description |
| Morgan Stanley |
| MSIFT Global |
| Pro Forma |
| Morgan Stanley |
| MSIFT Global |
| Pro Forma |
|
Fixed Income Securities (35.6%) |
|
|
|
|
|
|
|
|
|
|
|
|
|
Agency Adjustable Rate Mortgage (0.0%) |
|
|
|
|
|
|
|
|
|
|
|
|
|
Federal National Mortgage Association, Conventional Pools: 2.39%, 5/1/35 |
| — |
| 59 |
| 59 |
| — |
| 63 |
| 63 |
|
|
|
|
|
|
|
|
|
|
|
|
|
|
|
Agency Fixed Rate Mortgages (4.9%) |
|
|
|
|
|
|
|
|
|
|
|
|
|
Federal Home Loan Mortgage Corporation, April TBA: 3.00%, 4/25/27 (a) |
| 1,800 |
| 150 |
| 1,950 |
| 1,862 |
| 155 |
| 2,017 |
|
Federal Home Loan Mortgage Corporation, April TBA: 3.50%, 4/25/42 (a) |
| 1,805 |
| — |
| 1,805 |
| 1,850 |
| — |
| 1,850 |
|
Federal Home Loan Mortgage Corporation, Gold Pools: 4.00%, 12/1/41 |
| 851 |
| 86 |
| 937 |
| 891 |
| 91 |
| 982 |
|
Federal Home Loan Mortgage Corporation, Gold Pools: 4.50%, 6/1/39 |
| — |
| 504 |
| 504 |
| — |
| 534 |
| 534 |
|
Federal Home Loan Mortgage Corporation, Gold Pools: 5.00%, 10/1/35 |
| — |
| 292 |
| 292 |
| — |
| 315 |
| 315 |
|
Federal Home Loan Mortgage Corporation, Gold Pools: 6.00%, 11/1/37 |
| 454 |
| — |
| 454 |
| 503 |
| — |
| 503 |
|
Federal Home Loan Mortgage Corporation, Gold Pools: 6.50%, 9/1/32 |
| 295 |
| — |
| 295 |
| 335 |
| — |
| 335 |
|
Federal Home Loan Mortgage Corporation, Gold Pools: 7.50%, 5/1/35 |
| — |
| 16 |
| 16 |
| — |
| 19 |
| 19 |
|
Federal National Mortgage Association, April TBA: 2.50%, 4/25/27 (a) |
| — |
| 150 |
| 150 |
| — |
| 152 |
| 152 |
|
Federal National Mortgage Association, Conventional Pools: 4.00%, 1/1/42 |
| 2,997 |
| — |
| 2,997 |
| 3,147 |
| — |
| 3,147 |
|
Federal National Mortgage Association, Conventional Pools: 4.00%, 11/1/41 |
| — |
| 65 |
| 65 |
| — |
| 68 |
| 68 |
|
Federal National Mortgage Association, Conventional Pools: 5.00%, 3/1/41 |
| 2,559 |
| — |
| 2,559 |
| 2,801 |
| — |
| 2,801 |
|
Federal National Mortgage Association, Conventional Pools: 5.00%, 5/1/41 |
| — |
| 315 |
| 315 |
| — |
| 343 |
| 343 |
|
Federal National Mortgage Association, Conventional Pools: 5.50%, 2/1/38 |
| 1,193 |
| — |
| 1,193 |
| 1,311 |
| — |
| 1,311 |
|
Federal National Mortgage Association, Conventional Pools: 5.50%, 8/1/38 |
| — |
| 390 |
| 390 |
| — |
| 429 |
| 429 |
|
Federal National Mortgage Association, Conventional Pools: 6.00%, 1/1/38 |
| — |
| 85 |
| 85 |
| — |
| 94 |
| 94 |
|
Federal National Mortgage Association, Conventional Pools: 6.50%, 12/1/29 |
| 72 |
| — |
| 72 |
| 82 |
| — |
| 82 |
|
Federal National Mortgage Association, Conventional Pools: 7.00%, 2/1/31 |
| 766 |
| — |
| 766 |
| 886 |
| — |
| 886 |
|
Federal National Mortgage Association, Conventional Pools: 7.50%, 8/1/37 |
| — |
| 31 |
| 31 |
| — |
| 37 |
| 37 |
|
Government National Mortgage Association, April TBA: 3.50%, 4/25/42 (a) |
| — |
| 370 |
| 370 |
| — |
| 386 |
| 386 |
|
Government National Mortgage Association, April TBA: 4.00%, 4/25/42 (a) |
| 5,865 |
| 825 |
| 6,690 |
| 6,295 |
| 885 |
| 7,180 |
|
Government National Mortgage Association, Various Pools: 4.50%, 8/15/39 |
| 1,730 |
| 149 |
| 1,879 |
| 1,888 |
| 163 |
| 2,051 |
|
Government National Mortgage Association, Various Pools: 5.50%, 8/15/39 |
| 301 |
| — |
| 301 |
| 339 |
| — |
| 339 |
|
|
|
|
|
|
|
|
| 22,190 |
| 3,671 |
| 25,861 | * |
Asset-Backed Securities (0.7%) |
|
|
|
|
|
|
|
|
|
|
|
|
|
ARI Fleet Lease Trust 1.69%, 8/15/18 (b) |
| 48 |
| — |
| 48 |
| 48 |
| — |
| 48 |
|
Chesapeake Funding LLC 2.24%, 12/15/20 (b) |
| 55 |
| — |
| 55 |
| 55 |
| — |
| 55 |
|
CNH Equipment Trust 1.20%, 5/16/16 |
| 825 |
| — |
| 825 |
| 830 |
| — |
| 830 |
|
CVS Pass-Through Trust 6.04%, 12/10/28 |
| 406 |
| — |
| 406 |
| 447 |
| — |
| 447 |
|
Ford Credit Floorplan Master Owner Trust 1.94%, 2/15/17 (b) |
| 525 |
| — |
| 525 |
| 544 |
| — |
| 544 |
|
FUEL Trust 4.21%, 4/15/16 (b) |
| 430 |
| 200 |
| 630 |
| 442 |
| 205 |
| 647 |
|
GE Dealer Floorplan Master Note Trust 1.79%, 10/20/14 (b) |
| 325 |
| — |
| 325 |
| 328 |
| — |
| 328 |
|
SLM Student Loan Trust 4.37%, 4/17/28 (b) |
| 425 |
| — |
| 425 |
| 441 |
| — |
| 441 |
|
Santander Drive Auto Receivables Trust 3.06%, 11/15/17 |
| — |
| 50 |
| 50 |
| — |
| 50 |
| 50 |
|
U-Haul S Fleet LLC 4.90%, 10/25/23 (b) |
| — |
| 83 |
| 83 |
| — |
| 87 |
| 87 |
|
|
|
|
|
|
|
|
| 3,135 |
| 342 |
| 3,477 | * |
Collateralized Mortgage Obligations - Agency Collateral Series (0.1%) |
|
|
|
|
|
|
|
|
|
|
|
|
|
Federal Home Loan Mortgage Corporation 2.97%, 10/25/21 |
| — |
| 90 |
| 90 |
| — |
| 92 |
| 92 |
|
Federal Home Loan Mortgage Corporation, IO 0.68%, 1/25/21 (c) |
| — |
| 695 |
| 695 |
| — |
| 29 |
| 29 |
|
Federal Home Loan Mortgage Corporation, IO PAC REMIC 6.23%, 6/15/40 (c) |
| — |
| 463 |
| 463 |
| — |
| 89 |
| 89 |
|
Federal National Mortgage Association, IO REMIC 5.00%, 8/25/37 |
| — |
| 84 |
| 84 |
| — |
| 5 |
| 5 |
|
Federal National Mortgage Association, IO REMIC 6.36%, 9/25/38 (c) |
| — |
| 189 |
| 189 |
| — |
| 40 |
| 40 |
|
Government National Mortgage Association, IO REMIC 6.34%, 6/20/40 (c) |
| — |
| 130 |
| 130 |
| — |
| 23 |
| 23 |
|
Government National Mortgage Association, IO REMIC 6.36%, 4/16/41 (c) |
| — |
| 310 |
| 310 |
| — |
| 59 |
| 59 |
|
|
|
|
|
|
|
|
| — |
| 337 |
| 337 | * |
Commercial Mortgage Backed Securities (0.5%) |
|
|
|
|
|
|
|
|
|
|
|
|
|
Banc of America Merrill Lynch Commercial Mortgage, Inc. 5.67%, 4/10/49 |
| 500 |
| — |
| 500 |
| 499 |
| — |
| 499 |
|
Citigroup Commercial Mortgage Trust 6.07%, 12/10/49 (c) (p) |
| — |
| 50 |
| 50 |
| — |
| 58 |
| 58 |
|
Greenwich Capital Commercial Funding Corp. 5.87%, 12/10/49 |
| 575 |
| — |
| 575 |
| 557 |
| — |
| 557 |
|
JP Morgan Chase Commercial Mortgage Securities Corp. 4.17%, 8/15/46 |
| 700 |
| 70 |
| 770 |
| 757 |
| 76 |
| 833 |
|
JP Morgan Chase Commercial Mortgage Securities Corp. 4.39%, 7/15/46 (b) |
| — |
| 100 |
| 100 |
| — |
| 109 |
| 109 |
|
JP Morgan Chase Commercial Mortgage Securities Corp. 6.06%, 2/15/51 |
| 425 |
| — |
| 425 |
| 421 |
| — |
| 421 |
|
|
|
|
|
|
|
|
| 2,234 |
| 243 |
| 2,477 | * |
Corporate Bonds (8.7%) |
|
|
|
|
|
|
|
|
|
|
|
|
|
Finance (5.5%) |
|
|
|
|
|
|
|
|
|
|
|
|
|
ABB Treasury Center USA, Inc. 2.50%, 6/15/16 (b) |
| 175 |
| 55 |
| 230 |
| 179 |
| 56 |
| 235 |
|
Abbey National Treasury Services PLC 3.63%, 10/14/16 |
| 650 |
| — |
| 650 |
| 911 |
| — |
| 911 |
|
Abbey National Treasury Services PLC 3.88%, 11/10/14 (b) |
| 265 |
| 100 |
| 365 |
| 267 |
| 101 |
| 368 |
|
ABN Amro Bank N.V. 3.63%, 10/6/17 |
| 200 |
| — |
| 200 |
| 275 |
| — |
| 275 |
|
ABN Amro Bank N.V. 4.25%, 2/2/17 (b) |
| 275 |
| — |
| 275 |
| 280 |
| — |
| 280 |
|
Aegon N.V. 4.63%, 12/1/15 |
| 335 |
| — |
| 335 |
| 355 |
| — |
| 355 |
|
Australia & New Zealand Banking Group Ltd. 5.13%, 9/10/19 |
| 400 |
| — |
| 400 |
| 564 |
| — |
| 564 |
|
Banco Votorantim SA 5.25%, 2/11/16 (b) |
| 290 |
| — |
| 290 |
| 302 |
| — |
| 302 |
|
Security Description |
| Morgan Stanley |
| MSIFT Global |
| Pro Forma |
| Morgan Stanley |
| MSIFT Global |
| Pro Forma |
|
Bank of America Corp. 5.63%, 7/1/20 |
| — |
| 15 |
| 15 |
| — |
| 16 |
| 16 |
|
Bank of America Corp., Series L 5.65%, 5/1/18 |
| 350 |
| — |
| 350 |
| 374 |
| — |
| 374 |
|
Bank of Montreal 2.85%, 6/9/15 (b) |
| 615 |
| — |
| 615 |
| 649 |
| — |
| 649 |
|
Banque Federative du Credit Mutuel SA 3.00%, 10/29/15 |
| 400 |
| — |
| 400 |
| 545 |
| — |
| 545 |
|
Barclays Bank PLC 6.00%, 1/14/21 |
| 250 |
| — |
| 250 |
| 312 |
| — |
| 312 |
|
Barclays Bank PLC 6.00%, 1/23/18 |
| 200 |
| — |
| 200 |
| 268 |
| — |
| 268 |
|
BBVA Bancomer SA 4.50%, 3/10/16 (b) |
| 625 |
| — |
| 625 |
| 647 |
| — |
| 647 |
|
Bear Stearns Cos. LLC (The) 6.40%, 10/2/17 |
| 180 |
| — |
| 180 |
| 210 |
| — |
| 210 |
|
Bear Stearns Cos. LLC (The) 7.25%, 2/1/18 |
| 305 |
| — |
| 305 |
| 368 |
| — |
| 368 |
|
BNP Paribas SA 5.00%, 1/15/21 |
| 455 |
| 40 |
| 495 |
| 460 |
| 40 |
| 500 |
|
BNP Paribas/BNP Paribas US Medium-Term Note Program LLC 5.13%, 1/15/15 (b) |
| 180 |
| — |
| 180 |
| 181 |
| — |
| 181 |
|
Boston Properties LP 5.88%, 10/15/19 |
| 75 |
| — |
| 75 |
| 86 |
| — |
| 86 |
|
Brandywine Operating Partnership LP 4.95%, 4/15/18 |
| — |
| 50 |
| 50 |
| — |
| 51 |
| 51 |
|
Brookfield Asset Management, Inc. 5.80%, 4/25/17 |
| 380 |
| — |
| 380 |
| 412 |
| — |
| 412 |
|
Capital One Bank, USA NA 8.80%, 7/15/19 |
| 455 |
| — |
| 455 |
| 557 |
| — |
| 557 |
|
Cigna Corp. 2.75%, 11/15/16 |
| — |
| 50 |
| 50 |
| — |
| 51 |
| 51 |
|
Citigroup, Inc. 6.13%, 5/15/18 (p) |
| 245 |
| 100 |
| 345 |
| 275 |
| 112 |
| 387 |
|
Citigroup, Inc. 8.50%, 5/22/19 (p) |
| 720 |
| 5 |
| 725 |
| 889 |
| 6 |
| 895 |
|
CNA Financial Corp. 5.75%, 8/15/21 |
| — |
| 45 |
| 45 |
| — |
| 48 |
| 48 |
|
Commonwealth Bank of Australia 2.90%, 9/17/14 (b) |
| 500 |
| — |
| 500 |
| 525 |
| — |
| 525 |
|
Commonwealth Bank of Australia 5.00%, 10/15/19 (b) |
| 355 |
| — |
| 355 |
| 384 |
| — |
| 384 |
|
Cooperatieve Centrale Raiffeisen-Boerenleenbank BA, Series G 3.75%, 11/9/20 |
| 300 |
| — |
| 300 |
| 386 |
| — |
| 386 |
|
Coventry Health Care, Inc. 5.45%, 6/15/21 |
| — |
| 35 |
| 35 |
| — |
| 38 |
| 38 |
|
Credit Agricole SA 3.90%, 4/19/21 |
| 300 |
| — |
| 300 |
| 327 |
| — |
| 327 |
|
Credit Agricole SA 5.88%, 6/11/19 |
| 350 |
| — |
| 350 |
| 462 |
| — |
| 462 |
|
Credit Suisse 5.40%, 1/14/20 |
| 110 |
| — |
| 110 |
| 113 |
| — |
| 113 |
|
Credit Suisse 6.00%, 2/15/18 |
| 90 |
| — |
| 90 |
| 98 |
| — |
| 98 |
|
Deutsche Bank AG 5.00%, 6/24/20 |
| 400 |
| — |
| 400 |
| 541 |
| — |
| 541 |
|
Farmers Exchange Capital 7.05%, 7/15/28 (b) |
| 235 |
| — |
| 235 |
| 257 |
| — |
| 257 |
|
FCE Bank PLC 4.75%, 1/19/15 |
| 300 |
| — |
| 300 |
| 412 |
| — |
| 412 |
|
Finmeccanica Finance SA 8.13%, 12/3/13 |
| 500 |
| — |
| 500 |
| 718 |
| — |
| 718 |
|
Gas Natural Capital Markets SA 4.13%, 1/26/18 |
| 350 |
| — |
| 350 |
| 465 |
| — |
| 465 |
|
General Electric Capital Corp. 5.30%, 2/11/21 |
| 275 |
| — |
| 275 |
| 298 |
| — |
| 298 |
|
General Electric Capital Corp. 5.63%, 5/1/18 |
| 285 |
| — |
| 285 |
| 331 |
| — |
| 331 |
|
General Electric Capital Corp., MTN 5.88%, 1/1438 |
| — |
| 50 |
| 50 |
| — |
| 55 |
| 55 |
|
General Electric Capital Corp., Series G 6.00%, 8/7/19 |
| 635 |
| — |
| 635 |
| 743 |
| — |
| 743 |
|
Genworth Financial, Inc. 7.20%, 2/15/21 |
| 275 |
| 30 |
| 305 |
| 281 |
| 31 |
| 312 |
|
Goldman Sachs Group, Inc. (The) 5.75%, 1/24/22 |
| — |
| 80 |
| 80 |
| — |
| 82 |
| 82 |
|
Goldman Sachs Group, Inc. (The) 6.15%, 4/1/18 |
| 775 |
| — |
| 775 |
| 837 |
| — |
| 837 |
|
Goldman Sachs Group, Inc. (The) 6.75%, 10/1/37 |
| 255 |
| — |
| 255 |
| 250 |
| — |
| 250 |
|
Hartford Financial Services Group, Inc. 5.5%, 3/30/20 |
| — |
| 25 |
| 25 |
| — |
| 27 |
| 27 |
|
HBOS PLC, Series G 6.75%, 5/21/18 (b) |
| 385 |
| — |
| 385 |
| 362 |
| — |
| 362 |
|
HSBC Holdings PLC 4.00%, 3/30/22 |
| — |
| 45 |
| 45 |
| — |
| 45 |
| 45 |
|
HSBC Holdings PLC 6.00%, 6/10/19 |
| 400 |
| — |
| 400 |
| 589 |
| — |
| 589 |
|
ING Bank N.V. 3.90%, 3/19/14 (b) |
| 600 |
| — |
| 600 |
| 631 |
| — |
| 631 |
|
Intesa Sanpaolo SpA 4.13%, 4/14/20 |
| 400 |
| — |
| 400 |
| 509 |
| — |
| 509 |
|
JPMorgan Chase & Co. 3.15%, 7/05/16 |
| — |
| 60 |
| 60 |
| — |
| 62 |
| 62 |
|
JPMorgan Chase & Co. 4.95%, 3/25/20 |
| — |
| 25 |
| 25 |
| — |
| 27 |
| 27 |
|
JPMorgan Chase & Co. 6.00%, 1/15/18 |
| 75 |
| — |
| 75 |
| 87 |
| — |
| 87 |
|
Lloyds TSB Bank PLC 5.80%, 1/13/20 (b) |
| 150 |
| 100 |
| 250 |
| 154 |
| 103 |
| 257 |
|
Lloyds TSB Bank PLC 6.38%, 6/17/16 |
| 300 |
| — |
| 300 |
| 441 |
| — |
| 441 |
|
Lloyds TSB Bank PLC 6.50%, 3/24/20 |
| 250 |
| — |
| 250 |
| 292 |
| — |
| 292 |
|
Macquarie Bank Ltd. 6.63%, 4/7/21 (b) |
| 245 |
| 25 |
| 270 |
| 246 |
| 25 |
| 271 |
|
Macquarie Group Ltd. 6.00%, 1/14/20 (b) |
| 235 |
| 25 |
| 260 |
| 235 |
| 25 |
| 260 |
|
Merrill Lynch & Co., Inc., MTN 6.88%, 4/25/18 |
| 1,280 |
| 40 |
| 1,320 |
| 1,425 |
| 45 |
| 1,470 |
|
MetLife, Inc. 7.72%, 2/15/19 |
| — |
| 20 |
| 20 |
| — |
| 25 |
| 25 |
|
National Australia Bank Ltd. 3.38%, 7/8/14 (b) |
| 400 |
| — |
| 400 |
| 423 |
| — |
| 423 |
|
Nationwide Building Society 6.25%, 2/25/20 (b) |
| 525 |
| — |
| 525 |
| 545 |
| — |
| 545 |
|
Nationwide Financial Services 5.38%, 3/25/21 (b) |
| — |
| 25 |
| 25 |
| — |
| 26 |
| 26 |
|
Nordea Bank AB 4.00%, 3/29/21 |
| 480 |
| — |
| 480 |
| 605 |
| — |
| 605 |
|
Pacific LifeCorp 6.00%, 2/10/20 (b) |
| — |
| 25 |
| 25 |
| — |
| 27 |
| 27 |
|
Prudential Financial, Inc. 7.38%, 6/15/19 |
| — |
| 50 |
| 50 |
| — |
| 62 |
| 62 |
|
Prudential Financial, Inc., MTN 4.75%, 9/17/15 |
| 265 |
| — |
| 265 |
| 288 |
| — |
| 288 |
|
Prudential Financial, Inc., MTN 6.63%, 12/1/37 |
| 150 |
| — |
| 150 |
| 174 |
| — |
| 174 |
|
QBE Capital Funding III Ltd. 7.25%, 5/24/41 (b) |
| 325 |
| — |
| 325 |
| 307 |
| — |
| 307 |
|
Royal Bank of Scotland PLC (The) 5.50%, 3/23/20 |
| 350 |
| — |
| 350 |
| 480 |
| — |
| 480 |
|
Santander Holdings USA, Inc. 4.63%, 4/19/16 |
| 125 |
| 10 |
| 135 |
| 127 |
| 10 |
| 137 |
|
SLM Corp., MTN 6.25%, 1/25/16 |
| 435 |
| — |
| 435 |
| 453 |
| — |
| 453 |
|
Societe Generale SA 6.13%, 8/20/18 |
| 250 |
| — |
| 250 |
| 345 |
| — |
| 345 |
|
Standard Chartered PLC 3.85%, 4/27/15 (b) |
| 160 |
| 100 |
| 260 |
| 166 |
| 104 |
| 270 |
|
UDR, Inc., Series 0001 MTN 4.63%, 1/10/22 |
| — |
| 30 |
| 30 |
| — |
| 31 |
| 31 |
|
UniCredit SpA 4.38%, 2/10/14 |
| 500 |
| — |
| 500 |
| 681 |
| — |
| 681 |
|
Security Description |
| Morgan Stanley |
| MSIFT Global |
| Pro Forma |
| Morgan Stanley |
| MSIFT Global |
| Pro Forma |
|
UniCredit SpA 5.75%, 9/26/17 |
| 300 |
| — |
| 300 |
| 395 |
| — |
| 395 |
|
UnitedHealth Group, Inc. 3.38%, 11/15/21 |
| 185 |
| — |
| 185 |
| 190 |
| — |
| 190 |
|
UnitedHealth Group, Inc. 4.63%, 11/15/41 |
| 210 |
| — |
| 210 |
| 211 |
| — |
| 211 |
|
UnitedHealth Group, Inc. 6.63%, 11/15/37 |
| — |
| 40 |
| 40 |
| — |
| 51 |
| 51 |
|
Wachovia Corp. 5.63%, 10/15/16 |
| — |
| 25 |
| 25 |
| — |
| 28 |
| 28 |
|
Wells Operating Partnership II LP 5.88%, 4/1/18 |
| — |
| 50 |
| 50 |
| — |
| 51 |
| 51 |
|
Westpac Banking Corp. 3.00%, 12/9/15 |
| 90 |
| — |
| 90 |
| 93 |
| — |
| 93 |
|
Westpac Banking Corp. 4.20%, 2/27/15 |
| 245 |
| — |
| 245 |
| 263 |
| — |
| 263 |
|
|
|
|
|
|
|
|
| 27,511 |
| 1,461 |
| 28,972 |
|
Industrials (2.6%) |
|
|
|
|
|
|
|
|
|
|
|
|
|
Agilent Technologies, Inc. 5.50%, 9/14/15 |
| 155 |
| — |
| 155 |
| 174 |
| — |
| 174 |
|
Altria Group, Inc. 4.13%, 9/11/15 |
| 85 |
| 40 |
| 125 |
| 93 |
| 44 |
| 137 |
|
Altria Group, Inc. 9.25%, 8/6/19 |
| 185 |
| — |
| 185 |
| 249 |
| — |
| 249 |
|
Anheuser-Busch InBev Worldwide, Inc. 4.13%, 1/15/15 |
| 200 |
| — |
| 200 |
| 217 |
| — |
| 217 |
|
Anheuser-Busch InBev Worldwide, Inc. 5.00%, 4/15/20 |
| 85 |
| — |
| 85 |
| 98 |
| — |
| 98 |
|
Anheuser-Busch InBev Worldwide, Inc. 5.38%, 11/15/14 |
| 45 |
| — |
| 45 |
| 50 |
| — |
| 50 |
|
ArcelorMittal 9.85%, 6/1/19 |
| 390 |
| 25 |
| 415 |
| 470 |
| 30 |
| 500 |
|
AT&T, Inc. 6.30%, 1/15/38 |
| 210 |
| 50 |
| 260 |
| 248 |
| 59 |
| 307 |
|
AT&T, Inc. 6.55%, 2/15/39 |
| 70 |
| — |
| 70 |
| 85 |
| — |
| 85 |
|
BAA Funding Ltd. 4.60%, 2/15/18 |
| 300 |
| — |
| 300 |
| 427 |
| — |
| 427 |
|
Barrick Gold Corp. 3.85%, 4/1/22 |
| — |
| 65 |
| 65 |
| — |
| 65 |
| 65 |
|
Barrick North America Finance LLC 4.40%, 5/30/21 |
| 255 |
| — |
| 255 |
| 269 |
| — |
| 269 |
|
BAT International Finance PLC 9.50%, 11/15/18 (b) |
| 155 |
| — |
| 155 |
| 212 |
| — |
| 212 |
|
Bemis Co., Inc. 4.5%, 10/15/21 |
| — |
| 70 |
| 70 |
| — |
| 73 |
| 73 |
|
Boston Scientific Corp. 6.00%, 1/15/20 |
| 300 |
| 30 |
| 330 |
| 345 |
| 35 |
| 380 |
|
Bunge Ltd. Finance Corp. 8.50%, 6/15/19 |
| 115 |
| — |
| 115 |
| 141 |
| — |
| 141 |
|
CBS Corp. 8.88%, 5/15/19 |
| 205 |
| — |
| 205 |
| 270 |
| — |
| 270 |
|
CenturyLink, Inc. 6.45%, 6/15/21 |
| 40 |
| — |
| 40 |
| 41 |
| — |
| 41 |
|
CenturyLink, Inc., Series Q 6.15%, 9/15/19 |
| 65 |
| — |
| 65 |
| 68 |
| — |
| 68 |
|
Comcast Corp. 5.15%, 3/1/20 |
| 170 |
| — |
| 170 |
| 196 |
| — |
| 196 |
|
Comcast Corp. 5.7%, 5/15/18 |
| 105 |
| 30 |
| 135 |
| 124 |
| 36 |
| 160 |
|
Comcast Corp. 6.45%, 3/15/37 |
| 50 |
| — |
| 50 |
| 60 |
| — |
| 60 |
|
ConAgra Foods, Inc. 8.25%, 9/15/30 |
| 85 |
| — |
| 85 |
| 108 |
| — |
| 108 |
|
CRH America, Inc. 6.00%, 9/30/16 |
| 375 |
| 40 |
| 415 |
| 409 |
| 44 |
| 453 |
|
CVS Caremark Corp. 6.60%, 3/15/19 |
| — |
| 80 |
| 80 |
| — |
| 99 |
| 99 |
|
Daimler Finance North America LLC 8.50%, 1/18/31 |
| 45 |
| — |
| 45 |
| 66 |
| — |
| 66 |
|
Darden Restaurants, Inc. 6.20%, 10/15/17 |
| — |
| 50 |
| 50 |
| — |
| 57 |
| 57 |
|
Deutsche Telekom International Finance BV 8.75%, 6/15/30 |
| 150 |
| — |
| 150 |
| 207 |
| — |
| 207 |
|
DirecTV Holdings LLC/DirecTV Financing Co., Inc. 5.88%, 10/1/19 |
| 95 |
| 35 |
| 130 |
| 109 |
| 40 |
| 149 |
|
Ecolab, Inc. 3.00%, 12/8/16 |
| — |
| 30 |
| 30 |
| — |
| 31 |
| 31 |
|
Georgia-Pacific LLC 5.40%, 11/1/20 (b)(d) |
| — |
| 80 |
| 80 |
| — |
| 89 |
| 89 |
|
Georgia-Pacific LLC 7.75%, 11/15/29 |
| 200 |
| — |
| 200 |
| 250 |
| — |
| 250 |
|
Georgia-Pacific LLC 8.88%, 5/15/31 |
| 275 |
| — |
| 275 |
| 372 |
| — |
| 372 |
|
Gilead Sciences, Inc. 4.50%, 4/1/21 |
| — |
| 30 |
| 30 |
| — |
| 32 |
| 32 |
|
Gilead Sciences, Inc. 5.65%, 12/1/41 |
| 25 |
| 20 |
| 45 |
| 27 |
| 21 |
| 48 |
|
Harley-Davidson Funding Corp. 6.80%, 6/15/18 (b) |
| 135 |
| 30 |
| 165 |
| 158 |
| 35 |
| 193 |
|
Hewlett-Packard Co. 4.65%, 12/9/21 |
| 410 |
| 50 |
| 460 |
| 430 |
| 52 |
| 482 |
|
Home Depot, Inc. (The) 5.88%, 12/16/36 |
| 400 |
| — |
| 400 |
| 481 |
| — |
| 481 |
|
Home Depot, Inc. 5.40%, 9/15/40 |
| 175 |
| — |
| 175 |
| 199 |
| — |
| 199 |
|
Imperial Tobacco Finance PLC 8.38%, 2/17/16 |
| 350 |
| — |
| 350 |
| 569 |
| — |
| 569 |
|
KLA-Tencor Corp. 6.90%, 5/1/18 |
| 145 |
| — |
| 145 |
| 173 |
| — |
| 173 |
|
Kohl’s Corp. 6.88%, 12/15/37 |
| — |
| 30 |
| 30 |
| — |
| 36 |
| 36 |
|
Koninklijke Philips Electronics 3.75%, 3/15/22 |
| — |
| 50 |
| 50 |
| — |
| 50 |
| 50 |
|
L-3 Communications Corp. 4.75%, 7/15/20 |
| 255 |
| — |
| 255 |
| 264 |
| — |
| 264 |
|
Life Technologies Corp. 6.00%, 3/1/20 |
| 230 |
| 40 |
| 270 |
| 264 |
| 46 |
| 310 |
|
Macy’s Retail Holdings, Inc. 3.88%, 1/15/22 |
| — |
| 20 |
| 20 |
| — |
| 20 |
| 20 |
|
Marathon Petroleum Corp. 5.13%, 3/1/21 |
| 275 |
| — |
| 275 |
| 300 |
| — |
| 300 |
|
NBC Universal Media LLC 4.38%, 4/1/21 |
| 225 |
| — |
| 225 |
| 241 |
| — |
| 241 |
|
NBC Universal Media LLC 5.15%, 4/30/20 |
| — |
| 55 |
| 55 |
| — |
| 62 |
| 62 |
|
News America, Inc. 4.50%, 2/15/21 |
| 135 |
| — |
| 135 |
| 144 |
| — |
| 144 |
|
Petrobras International Finance Co. 5.75%, 1/20/20 |
| 330 |
| — |
| 330 |
| 367 |
| — |
| 367 |
|
Philip Morris International, Inc. 5.65%, 5/16/18 |
| 235 |
| — |
| 235 |
| 280 |
| — |
| 280 |
|
Phillips 66 4.30%, 4/01/22 (b) |
| — |
| 25 |
| 25 |
| — |
| 25 |
| 25 |
|
Quest Diagnostics, Inc. 6.95%, 7/1/37 |
| — |
| 10 |
| 10 |
| — |
| 12 |
| 12 |
|
Qwest Corp. 6.88%, 9/15/33 |
| 125 |
| — |
| 125 |
| 124 |
| — |
| 124 |
|
SABMiller Holdings, Inc. 3.75%, 1/15/22 (b) |
| 265 |
| — |
| 265 |
| 270 |
| — |
| 270 |
|
Sonoco Products Co. 5.75%, 11/1/40 |
| — |
| 40 |
| 40 |
| — |
| 43 |
| 43 |
|
Telstra Corp., Ltd. 4.80%, 10/12/21 (b) |
| 260 |
| 60 |
| 320 |
| 283 |
| 65 |
| 348 |
|
Teva Pharmaceutical Finance IV BV 3.65%, 11/10/21 |
| 360 |
| 60 |
| 420 |
| 365 |
| 61 |
| 426 |
|
Time Warner Cable, Inc. 6.75%, 6/15/39 |
| 105 |
| — |
| 105 |
| 126 |
| — |
| 126 |
|
Time Warner, Inc. 4.75%, 3/29/21 |
| — |
| 45 |
| 45 |
| — |
| 50 |
| 50 |
|
Vale Overseas Ltd. 5.63%, 9/15/19 |
| 185 |
| — |
| 185 |
| 208 |
| — |
| 208 |
|
Security Description |
| Morgan Stanley |
| MSIFT Global |
| Pro Forma |
| Morgan Stanley |
| MSIFT Global |
| Pro Forma |
|
Vale Overseas Ltd. 6.88%, 11/10/39 |
| 50 |
| — |
| 50 |
| 59 |
| — |
| 59 |
|
Valspar Corp. 4.20%, 1/15/22 |
| — |
| 15 |
| 15 |
| — |
| 15 |
| 15 |
|
Verisk Analytics, Inc. 5.80%, 5/1/21 |
| — |
| 55 |
| 55 |
| — |
| 59 |
| 59 |
|
Verizon Communications, Inc. 4.60%, 4/1/21 |
| 75 |
| — |
| 75 |
| 83 |
| — |
| 83 |
|
Verizon Communications, Inc. 5.85%, 9/15/35 |
| 60 |
| — |
| 60 |
| 69 |
| — |
| 69 |
|
Verizon Communications, Inc. 6.35%, 4/1/19 |
| 150 |
| — |
| 150 |
| 183 |
| — |
| 183 |
|
Verizon Communications, Inc. 8.95%, 3/1/39 |
| 125 |
| 45 |
| 170 |
| 194 |
| 70 |
| 264 |
|
Vivendi SA 6.63%, 4/4/18 (b) |
| 145 |
| — |
| 145 |
| 163 |
| — |
| 163 |
|
Wesfarmers Ltd. 2.98%, 5/18/16 (b) |
| 195 |
| 50 |
| 245 |
| 200 |
| 51 |
| 251 |
|
Woolworths Ltd. 4.00%, 9/22/20 (b) |
| 195 |
| — |
| 195 |
| 201 |
| — |
| 201 |
|
WPP Finance UK 8.00%, 9/15/14 |
| 100 |
| — |
| 100 |
| 115 |
| — |
| 115 |
|
Yum! Brands, Inc. 6.88%, 11/15/37 |
| — |
| 40 |
| 40 |
| — |
| 51 |
| 51 |
|
|
|
|
|
|
|
|
| 11,898 |
| 1,558 |
| 13,456 |
|
Utilities (0.6%) |
|
|
|
|
|
|
|
|
|
|
|
|
|
EDF SA 4.60%, 1/27/20 (b) |
| — |
| 25 |
| 25 |
| — |
| 27 |
| 27 |
|
Enel Finance International N.V. 5.13%, 10/7/19 (b) |
| 650 |
| — |
| 650 |
| 640 |
| — |
| 640 |
|
Energy Transfer Partners LP 9.00%, 4/15/19 |
| — |
| 12 |
| 12 |
| — |
| 15 |
| 15 |
|
Enterprise Products Operating LLC 5.20%, 9/1/20 |
| — |
| 50 |
| 50 |
| — |
| 56 |
| 56 |
|
EQT Corp. 4.88%, 11/15/21 |
| — |
| 25 |
| 25 |
| — |
| 25 |
| 25 |
|
FirstEnergy Solutions Corp. 6.05%, 8/15/21 |
| — |
| 40 |
| 40 |
| — |
| 45 |
| 45 |
|
Iberdrola Finance Ireland Ltd. 5.00%, 9/11/19 (b) |
| 200 |
| — |
| 200 |
| 203 |
| — |
| 203 |
|
Kinder Morgan Energy Partners LP 5.95%, 2/15/18 |
| 125 |
| — |
| 125 |
| 146 |
| — |
| 146 |
|
Plains All American Pipeline LP/PAA Finance Corp. 6.70%, 5/15/36 |
| 190 |
| — |
| 190 |
| 223 |
| — |
| 223 |
|
Plains All American Pipeline LP/PAA Finance Corp. 8.75%, 5/1/19 |
| 190 |
| 30 |
| 220 |
| 248 |
| 39 |
| 287 |
|
PPL WEM Holdings PLC 3.90%, 5/1/16 (b) |
| 375 |
| 40 |
| 415 |
| 391 |
| 42 |
| 433 |
|
RTE EDF Transport SA 5.13%, 9/12/18 |
| 450 |
| — |
| 450 |
| 692 |
| — |
| 692 |
|
Telecom Italia Finance SA 7.75%, 1/24/33 |
| 400 |
| — |
| 400 |
| 563 |
| — |
| 563 |
|
|
|
|
|
|
|
|
| 3,106 |
| 249 |
| 3,355 |
|
Total Corporate Bonds |
|
|
|
|
|
|
| 42,515 |
| 3,268 |
| 45,783 |
|
|
|
|
|
|
|
|
|
|
|
|
|
|
|
Mortgages - Other (0.1%) |
|
|
|
|
|
|
|
|
|
|
|
|
|
Banc of America Alternative Loan Trust 5.86%, 10/25/36 |
| — |
| 66 |
| 66 |
| — |
| 44 |
| 44 |
|
Banc of America Alternative Loan Trust 5.91%, 10/25/36 (c) |
| — |
| 125 |
| 125 |
| — |
| 83 |
| 83 |
|
Banc of America Alternative Loan Trust 6.00%, 4/25/36 |
| — |
| 69 |
| 69 |
| — |
| 69 |
| 69 |
|
Chase Mortgage Finance Corp. 6.00%, 11/25/36 |
| — |
| 72 |
| 72 |
| — |
| 61 |
| 61 |
|
Chaseflex Trust 6.00%, 2/25/37 |
| — |
| 65 |
| 65 |
| — |
| 46 |
| 46 |
|
First Horizon Alternative Mortgage Securities 6.25%, 8/25/36 |
| — |
| 40 |
| 40 |
| — |
| 30 |
| 30 |
|
GSR Mortgage Loan Trust 5.75%, 1/25/37 |
| — |
| 74 |
| 74 |
| — |
| 70 |
| 70 |
|
Lehman Mortgage Trust 5.50%, 11/25/35 |
| — |
| 41 |
| 41 |
| — |
| 39 |
| 39 |
|
Lehman Mortgage Trust 6.50%, 9/25/37 |
| — |
| 86 |
| 86 |
| — |
| 65 |
| 65 |
|
Residential Accredit Loans, Inc. 0.74%, 3/25/35 (c) |
| — |
| 54 |
| 54 |
| — |
| 31 |
| 31 |
|
|
|
|
|
|
|
|
| — |
| 538 |
| 538 |
|
Municipal Bonds (0.1%) |
|
|
|
|
|
|
|
|
|
|
|
|
|
Illinois State Toll Highway Authority, Highway Revenue, Build America Bonds 6.18%, 1/1/34 |
| 145 |
| — |
| 145 |
| 174 |
| — |
| 174 |
|
Municipal Electric Authority of Georgia 6.64%, 4/1/57 |
| 160 |
| — |
| 160 |
| 180 |
| — |
| 180 |
|
Municipal Electric Authority of Georgia 6.66%, 4/1/57 |
| 295 |
| — |
| 295 |
| 331 |
| — |
| 331 |
|
State of California, General Obligation Bonds 5.95%, 4/1/16 |
| — |
| 40 |
| 40 |
| — |
| 45 |
| 45 |
|
|
|
|
|
|
|
|
| 685 |
| 45 |
| 730 |
|
Sovereign (15.0%) |
|
|
|
|
|
|
|
|
|
|
|
|
|
Australia Government Bond 5.25%, 3/15/19 |
| 1,100 |
| — |
| 1,100 |
| 1,241 |
| — |
| 1,241 |
|
Bermuda Government International Bond 5.60%, 7/20/20 (b) |
| 240 |
| — |
| 240 |
| 272 |
| — |
| 272 |
|
Brazilian Government International Bond 4.88%, 1/22/21 |
| — |
| 90 |
| 90 |
| — |
| 102 |
| 102 |
|
Bundesobligation 2.75%, 4/8/16 |
| 2,200 |
| — |
| 2,200 |
| 3,186 |
| — |
| 3,186 |
|
Bundesrepublik Deutschland 2.25%, 9/4/21 |
| 100 |
| — |
| 100 |
| 139 |
| — |
| 139 |
|
Bundesrepublik Deutschland 3.50%, 7/4/19 |
| 650 |
| — |
| 650 |
| 997 |
| — |
| 997 |
|
Bundesrepublik Deutschland 4.25%, 7/4/39 |
| 1,050 |
| — |
| 1,050 |
| 1,891 |
| — |
| 1,891 |
|
Bundesrepublik Deutschland 4.75%, 7/4/34 |
| 2,050 |
| — |
| 2,050 |
| 3,759 |
| — |
| 3,759 |
|
Canada Government International Bond 3.50%, 1/13/20 |
| 300 |
| — |
| 300 |
| 457 |
| — |
| 457 |
|
Canadian Government Bond 4.25%, 6/1/18 |
| 4,750 |
| — |
| 4,750 |
| 5,461 |
| — |
| 5,461 |
|
Chile Government International Bond 5.50%, 8/5/20 |
| 859,000 |
| — |
| 859,000 |
| 1,846 |
| — |
| 1,846 |
|
Denmark Government Bond 4.00%, 11/15/19 |
| 3,300 |
| — |
| 3,300 |
| 702 |
| — |
| 702 |
|
European Investment Bank 2.15%, 1/18/27 |
| 145,000 |
| — |
| 145,000 |
| 1,859 |
| — |
| 1,859 |
|
European Union 3.25%, 4/4/18 |
| 1,300 |
| — |
| 1,300 |
| 1,862 |
| — |
| 1,862 |
|
France Government Bond OAT 3.25%, 10/25/21 |
| 100 |
| — |
| 100 |
| 138 |
| — |
| 138 |
|
France Government Bond OAT 4.00%, 4/25/18 |
| 1,000 |
| — |
| 1,000 |
| 1,483 |
| — |
| 1,483 |
|
French Treasury Note BTAN 3.00%, 7/12/14 |
| 4,500 |
| — |
| 4,500 |
| 6,312 |
| — |
| 6,312 |
|
Italy Buoni Poliennali Del Tesoro 3.00%, 6/15/15 |
| 1,000 |
| — |
| 1,000 |
| 1,319 |
| — |
| 1,319 |
|
Italy Buoni Poliennali Del Tesoro 4.50%, 2/1/18 |
| 1,500 |
| — |
| 1,500 |
| 2,016 |
| — |
| 2,016 |
|
Italy Buoni Poliennali Del Tesoro 5.00%, 3/1/22 |
| 600 |
| — |
| 600 |
| 797 |
| — |
| 797 |
|
Japan Finance Organization for Municipalities 1.90%, 6/22/18 |
| 110,000 |
| — |
| 110,000 |
| 1,445 |
| — |
| 1,445 |
|
Japan Government Ten Year Bond 1.30%, 12/20/13 |
| 140,000 |
| — |
| 140,000 |
| 1,726 |
| — |
| 1,726 |
|
Security Description |
| Morgan Stanley |
| MSIFT Global |
| Pro Forma |
| Morgan Stanley |
| MSIFT Global |
| Pro Forma |
|
Japan Government Ten Year Bond 1.40%, 9/20/15 |
| 380,000 |
| — |
| 380,000 |
| 4,781 |
| — |
| 4,781 |
|
Japan Government Ten Year Bond 1.70%, 6/20/18 |
| 190,000 |
| — |
| 190,000 |
| 2,466 |
| — |
| 2,466 |
|
Japan Government Ten Year Bond 1.90%, 6/20/16 |
| 120,000 |
| — |
| 120,000 |
| 1,549 |
| — |
| 1,549 |
|
Japan Government Thirty Year Bond 1.70%, 6/20/33 |
| 505,000 |
| — |
| 505,000 |
| 6,010 |
| — |
| 6,010 |
|
Korea Development Bank (The) 3.88%, 5/4/17 |
| 200 |
| — |
| 200 |
| 208 |
| — |
| 208 |
|
Korea Development Bank (The) 4.38%, 8/10/15 |
| 200 |
| — |
| 200 |
| 212 |
| — |
| 212 |
|
Korea Finance Corp. 4.63%, 11/16/21 |
| 630 |
| — |
| 630 |
| 646 |
| — |
| 646 |
|
Mexican Bonos 10.00%, 12/5/24 |
| 24,400 |
| — |
| 24,400 |
| 2,498 |
| — |
| 2,498 |
|
Mexico Government International Bond 3.63%, 3/15/22 |
| — |
| 80 |
| 80 |
| — |
| 82 |
| 82 |
|
Netherlands Government Bond 4.00%, 7/15/19 |
| 1,900 |
| — |
| 1,900 |
| 2,905 |
| — |
| 2,905 |
|
Norway Government Bond 6.50%, 5/15/13 |
| 3,500 |
| — |
| 3,500 |
| 648 |
| — |
| 648 |
|
Poland Government Bond 5.25%, 10/25/17 |
| 6,000 |
| — |
| 6,000 |
| 1,955 |
| — |
| 1,955 |
|
Province of Ontario Canada 4.00%, 10/7/19 |
| 300 |
| — |
| 300 |
| 334 |
| — |
| 334 |
|
Province of Ontario Canada 4.00%, 12/3/19 |
| 600 |
| — |
| 600 |
| 897 |
| — |
| 897 |
|
Republic of Korea 7.13%, 4/16/19 |
| 150 |
| — |
| 150 |
| 186 |
| — |
| 186 |
|
Russian Foreign Bond - Eurobond 3.25%, 4/4/17 (b)(m) |
| 800 |
| — |
| 800 |
| 807 |
| — |
| 807 |
|
South Africa Government Bond 7.25%, 1/15/20 |
| 3,000 |
| — |
| 3,000 |
| 379 |
| — |
| 379 |
|
Sweden Government Bond 4.25%, 3/12/19 |
| 7,800 |
| — |
| 7,800 |
| 1,370 |
| — |
| 1,370 |
|
Treasury Corp. of Victoria 5.75%, 11/15/16 |
| 1,600 |
| — |
| 1,600 |
| 1,758 |
| — |
| 1,758 |
|
United Kingdom Gilt 3.75%, 9/7/21 |
| 1,000 |
| — |
| 1,000 |
| 1,825 |
| — |
| 1,825 |
|
United Kingdom Gilt 4.00%, 9/7/16 |
| 1,700 |
| — |
| 1,700 |
| 3,088 |
| — |
| 3,088 |
|
United Kingdom Gilt 4.25%, 6/7/32 |
| 2,450 |
| — |
| 2,450 |
| 4,559 |
| — |
| 4,559 |
|
United Kingdom Gilt 4.25%, 9/7/39 |
| 570 |
| — |
| 570 |
| 1,059 |
| — |
| 1,059 |
|
|
|
|
|
|
|
|
| 79,048 |
| 184 |
| 79,232 |
|
U.S. Agency Securities (0.1%) |
|
|
|
|
|
|
|
|
|
|
|
|
|
Federal National Mortgage Association 1.25%, 9/28/16 |
| — |
| 350 |
| 350 |
| — |
| 352 |
| 352 |
|
Federal National Mortgage Association 5.38%, 6/12/17 |
| — |
| 170 |
| 170 |
| — |
| 205 |
| 205 |
|
|
|
|
|
|
|
|
| — |
| 557 |
| 557 |
|
U.S. Treasury Securities (5.4%) |
|
|
|
|
| — |
|
|
|
|
|
|
|
U.S. Treasury Bonds 6.88%, 8/15/25 |
| 2,900 |
| — |
| 2,900 |
| 4,287 |
| — |
| 4,287 |
|
U.S. Treasury Bonds, 3.50%, 2/15/39 |
| 1,960 |
| 310 |
| 2,270 |
| 2,037 |
| 322 |
| 2,359 |
|
U.S. Treasury Bonds, 3.88%, 8/15/40 (d) |
| — |
| 400 |
| 400 |
| — |
| 443 |
| 443 |
|
U.S. Treasury Bonds, 5.25%, 11/15/28 |
| — |
| 310 |
| 310 |
| — |
| 405 |
| 405 |
|
U.S. Treasury Notes 0.50%, 8/15/14 |
| 2,800 |
| — |
| 2,800 |
| 2,805 |
| — |
| 2,805 |
|
U.S. Treasury Notes 2.75%, 2/28/18 |
| 1,000 |
| — |
| 1,000 |
| 1,083 |
| — |
| 1,083 |
|
U.S. Treasury Notes 3.13%, 5/15/19 |
| 7,720 |
| — |
| 7,720 |
| 8,502 |
| — |
| 8,502 |
|
U.S. Treasury Notes 3.63%, 2/15/21 |
| 3,540 |
| — |
| 3,540 |
| 4,008 |
| — |
| 4,008 |
|
U.S. Treasury Notes, 0.50%, 11/15/13 |
| — |
| 725 |
| 725 |
| — |
| 727 |
| 727 |
|
U.S. Treasury Notes, 0.75%, 6/15/14 |
| — |
| 230 |
| 230 |
| — |
| 232 |
| 232 |
|
U.S. Treasury Notes, 1.25%, 8/31/15 |
| — |
| 1,080 |
| 1,080 |
| — |
| 1,103 |
| 1,103 |
|
U.S. Treasury Notes, 1.75%, 3/31/14 |
| — |
| 745 |
| 745 |
| — |
| 766 |
| 766 |
|
U.S. Treasury Notes, 2.25%, 1/31/15 |
| — |
| 580 |
| 580 |
| — |
| 608 |
| 608 |
|
U.S. Treasury Notes, 3.00%, 8/31/16 - 9/30/16 |
| — |
| 675 |
| 675 |
| — |
| 736 |
| 736 |
|
U.S. Treasury Notes, 3.63%, 8/15/19 |
| — |
| 330 |
| 330 |
| — |
| 375 |
| 375 |
|
|
| 19,920 |
| 5,385 |
| 25,305 |
| 22,722 |
| 5,717 |
| 28,439 |
|
Total Fixed Income Securities |
|
|
|
|
|
|
| 172,529 |
| 14,965 |
| 187,494 |
|
|
| Morgan Stanley |
| MSIFT Global |
| Proforma |
| Morgan Stanley |
| MSIFT Global |
| Pro Forma |
|
Equity Securities (56.1%) |
|
|
|
|
|
|
|
|
|
|
|
|
|
Common Stocks (50.7%) |
|
|
|
|
|
|
|
|
|
|
|
|
|
Aerospace & Defense (0.8%) |
|
|
|
|
|
|
|
|
|
|
|
|
|
Alliant Techsystems, Inc. (d) |
| 7,597 |
| 648 |
| 8,245 |
| 381 |
| 32 |
| 413 |
|
BAE Systems PLC |
| 50,134 |
| — |
| 50,134 |
| 240 |
| — |
| 240 |
|
Boeing Co. (The) |
| 3,281 |
| 601 |
| 3,882 |
| 244 |
| 45 |
| 289 |
|
Bombardier, Inc. |
| 19,400 |
| — |
| 19,400 |
| 81 |
| — |
| 81 |
|
Exelis, Inc. |
| — |
| 594 |
| 594 |
| — |
| 7 |
| 7 |
|
Finmeccanica SpA |
| 4,799 |
| — |
| 4,799 |
| 26 |
| — |
| 26 |
|
General Dynamics Corp. |
| 663 |
| 504 |
| 1,167 |
| 49 |
| 37 |
| 86 |
|
Goodrich Corp. |
| 789 |
| 197 |
| 986 |
| 99 |
| 25 |
| 124 |
|
Honeywell International, Inc. |
| 3,895 |
| 1,602 |
| 5,497 |
| 238 |
| 98 |
| 336 |
|
Huntington Ingalls Industries, Inc. (d)(e) |
| — |
| 53 |
| 53 |
| — |
| 2 |
| 2 |
|
L-3 Communications Holdings, Inc. (d) |
| — |
| 200 |
| 200 |
| — |
| 14 |
| 14 |
|
Lockheed Martin Corp. (d) |
| 663 |
| 262 |
| 925 |
| 60 |
| 23 |
| 83 |
|
Northrop Grumman Corp. |
| 663 |
| 222 |
| 885 |
| 40 |
| 13 |
| 53 |
|
Precision Castparts Corp. |
| 841 |
| 385 |
| 1,226 |
| 145 |
| 67 |
| 212 |
|
Raytheon Co. (d) |
| 22,091 |
| 1,435 |
| 23,526 |
| 1,166 |
| 76 |
| 1,242 |
|
Rockwell Collins, Inc. |
| 796 |
| 375 |
| 1,171 |
| 46 |
| 22 |
| 68 |
|
Rolls-Royce Holdings PLC (e) |
| 34,001 |
| — |
| 34,001 |
| 442 |
| — |
| 442 |
|
Textron, Inc. |
| 1,503 |
| 500 |
| 2,003 |
| 42 |
| 14 |
| 56 |
|
Security Description |
| Morgan Stanley |
| MSIFT Global |
| Pro Forma |
| Morgan Stanley |
| MSIFT Global |
| Pro Forma |
|
Thales SA |
| 1,262 |
| — |
| 1,262 |
| 47 |
| — |
| 47 |
|
United Technologies Corp. |
| 1,457 |
| 1,579 |
| 3,036 |
| 121 |
| 131 |
| 252 |
|
|
|
|
|
|
|
|
| 3,467 |
| 606 |
| 4,073 |
|
Air Freight & Logistics (0.2%) |
|
|
|
|
|
|
|
|
|
|
|
|
|
C.H. Robinson Worldwide, Inc. (d) |
| 1,055 |
| 200 |
| 1,255 |
| 69 |
| 13 |
| 82 |
|
Deutsche Post AG, (Registered) |
| 6,209 |
| — |
| 6,209 |
| 120 |
| — |
| 120 |
|
Expeditors International of Washington, Inc. |
| 515 |
| 200 |
| 715 |
| 24 |
| 9 |
| 33 |
|
FedEx Corp. |
| 1,413 |
| 400 |
| 1,813 |
| 130 |
| 37 |
| 167 |
|
PostNL N.V. |
| 4,151 |
| — |
| 4,151 |
| 26 |
| — |
| 26 |
|
TNT Express N.V. |
| 4,151 |
| — |
| 4,151 |
| 51 |
| — |
| 51 |
|
Toll Holdings Ltd. |
| 9,328 |
| — |
| 9,328 |
| 57 |
| — |
| 57 |
|
United Parcel Service, Inc., Class B (d) |
| 2,876 |
| 1,153 |
| 4,029 |
| 232 |
| 93 |
| 325 |
|
Yamato Holdings Co., Ltd. |
| 8,600 |
| — |
| 8,600 |
| 133 |
| — |
| 133 |
|
|
|
|
|
|
|
|
| 842 |
| 152 |
| 994 |
|
Airlines (0.0%) |
|
|
|
|
|
|
|
|
|
|
|
|
|
Deutsche Lufthansa AG, (Registered) |
| 4,169 |
| — |
| 4,169 |
| 58 |
| — |
| 58 |
|
International Consolidated Airlines Group SA (e) |
| 13,928 |
| — |
| 13,928 |
| 40 |
| — |
| 40 |
|
Southwest Airlines Co. |
| — |
| 1,300 |
| 1,300 |
| — |
| 11 |
| 11 |
|
|
|
|
|
|
|
|
| 98 |
| 11 |
| 109 |
|
Auto Components (0.6%) |
|
|
|
|
|
|
|
|
|
|
|
|
|
Aisin Seiki Co., Ltd. |
| 3,700 |
| — |
| 3,700 |
| 130 |
| — |
| 130 |
|
BorgWarner, Inc. (e) |
| 10,192 |
| 835 |
| 11,027 |
| 860 |
| 70 |
| 930 |
|
Bridgestone Corp. |
| 8,600 |
| — |
| 8,600 |
| 208 |
| — |
| 208 |
|
Cie Generale des Etablissements Michelin, Series B |
| 1,960 |
| — |
| 1,960 |
| 146 |
| — |
| 146 |
|
Continental AG (e) |
| 611 |
| — |
| 611 |
| 58 |
| — |
| 58 |
|
Denso Corp. |
| 8,100 |
| — |
| 8,100 |
| 271 |
| — |
| 271 |
|
Johnson Controls, Inc. (d) |
| 28,742 |
| 1,614 |
| 30,356 |
| 934 |
| 52 |
| 986 |
|
Magna International, Inc. |
| 3,400 |
| — |
| 3,400 |
| 162 |
| — |
| 162 |
|
Nokian Renkaat Oyj |
| 1,401 |
| — |
| 1,401 |
| 68 |
| — |
| 68 |
|
Toyota Industries Corp. |
| 3,600 |
| — |
| 3,600 |
| 109 |
| — |
| 109 |
|
TRW Automotive Holdings Corp. (e) |
| 1,200 |
| — |
| 1,200 |
| 56 |
| — |
| 56 |
|
|
|
|
|
|
|
|
| 3,002 |
| 122 |
| 3,124 |
|
Automobiles (0.9%) |
|
|
|
|
|
|
|
|
|
|
|
|
|
Bayerische Motoren Werke AG |
| 3,519 |
| — |
| 3,519 |
| 316 |
| — |
| 316 |
|
Daimler AG, (Registered) |
| 7,768 |
| — |
| 7,768 |
| 468 |
| — |
| 468 |
|
Fiat SpA |
| 8,670 |
| — |
| 8,670 |
| 51 |
| — |
| 51 |
|
Ford Motor Co. (d) |
| 9,230 |
| 531 |
| 9,761 |
| 115 |
| 7 |
| 122 |
|
Honda Motor Co., Ltd., ADR |
| 19,795 |
| — |
| 19,795 |
| 761 |
| — |
| 761 |
|
Mazda Motor Corp. (e) |
| 24,000 |
| — |
| 24,000 |
| 42 |
| — |
| 42 |
|
Mitsubishi Motors Corp. (e) |
| 93,000 |
| — |
| 93,000 |
| 106 |
| — |
| 106 |
|
Nissan Motor Co., Ltd. |
| 31,800 |
| — |
| 31,800 |
| 338 |
| — |
| 338 |
|
Peugeot SA |
| 1,221 |
| — |
| 1,221 |
| 20 |
| — |
| 20 |
|
Porsche Automobil Holding SE, (Preference) |
| 898 |
| — |
| 898 |
| 53 |
| — |
| 53 |
|
Renault SA |
| 1,898 |
| — |
| 1,898 |
| 100 |
| — |
| 100 |
|
Suzuki Motor Corp. |
| 5,600 |
| — |
| 5,600 |
| 134 |
| — |
| 134 |
|
Toyota Motor Corp. |
| 36,500 |
| — |
| 36,500 |
| 1,574 |
| — |
| 1,574 |
|
Volkswagen AG |
| 372 |
| — |
| 372 |
| 60 |
| — |
| 60 |
|
Volkswagen AG, (Preference) |
| 1,855 |
| — |
| 1,855 |
| 326 |
| — |
| 326 |
|
|
|
|
|
|
|
|
| 4,464 |
| 7 |
| 4,471 |
|
Beverages (0.7%) |
|
|
|
|
|
|
|
|
|
|
|
|
|
Anheuser-Busch InBev N.V. |
| 7,130 |
| — |
| 7,130 |
| 521 |
| — |
| 521 |
|
Asahi Group Holdings Ltd. |
| 4,800 |
| — |
| 4,800 |
| 106 |
| — |
| 106 |
|
Brown-Forman Corp., Class B |
| — |
| 119 |
| 119 |
| — |
| 10 |
| 10 |
|
Coca-Cola Amatil Ltd. |
| 7,069 |
| — |
| 7,069 |
| 91 |
| — |
| 91 |
|
Coca-Cola Co. (The) |
| 9,527 |
| 2,226 |
| 11,753 |
| 705 |
| 165 |
| 870 |
|
Coca-Cola Enterprises, Inc. |
| 1,313 |
| 577 |
| 1,890 |
| 38 |
| 16 |
| 54 |
|
Constellation Brands, Inc., Class A (d)(e) |
| — |
| 500 |
| 500 |
| — |
| 12 |
| 12 |
|
Diageo PLC |
| 24,100 |
| — |
| 24,100 |
| 579 |
| — |
| 579 |
|
Dr. Pepper Snapple Group, Inc. |
| 670 |
| — |
| 670 |
| 27 |
| — |
| 27 |
|
Heineken N.V. |
| 3,715 |
| — |
| 3,715 |
| 206 |
| — |
| 206 |
|
Kirin Holdings Co., Ltd. |
| 13,000 |
| — |
| 13,000 |
| 168 |
| — |
| 168 |
|
Molson Coors Brewing Co. |
| 1,100 |
| 400 |
| 1,500 |
| 50 |
| 18 |
| 68 |
|
PepsiCo, Inc. |
| 6,226 |
| 1,485 |
| 7,711 |
| 413 |
| 99 |
| 512 |
|
Pernod-Ricard SA |
| 1,960 |
| — |
| 1,960 |
| 205 |
| — |
| 205 |
|
SABMiller PLC |
| 9,819 |
| — |
| 9,819 |
| 394 |
| — |
| 394 |
|
Treasury Wine Estates Ltd. |
| 11,468 |
| — |
| 11,468 |
| 49 |
| — |
| 49 |
|
|
|
|
|
|
|
|
| 3,552 |
| 320 |
| 3,872 |
|
Biotechnology (0.3%) |
|
|
|
|
|
|
|
|
|
|
|
|
|
Actelion Ltd., (Registered) (e) |
| 971 |
| — |
| 971 |
| 35 |
| — |
| 35 |
|
Alexion Pharmaceuticals, Inc. (e) |
| 1,134 |
| — |
| 1,134 |
| 105 |
| — |
| 105 |
|
Amgen, Inc. |
| 5,173 |
| 1,071 |
| 6,244 |
| 352 |
| 73 |
| 425 |
|
Biogen Idec, Inc. (e) |
| 1,213 |
| 314 |
| 1,527 |
| 153 |
| 39 |
| 192 |
|
Security Description |
| Morgan Stanley |
| MSIFT Global |
| Pro Forma |
| Morgan Stanley |
| MSIFT Global |
| Pro Forma |
|
Celgene Corp. (e) |
| 2,472 |
| 508 |
| 2,980 |
| 192 |
| 39 |
| 231 |
|
CSL Ltd. |
| 6,876 |
| — |
| 6,876 |
| 256 |
| — |
| 256 |
|
Gilead Sciences, Inc. (e) |
| 3,980 |
| 1,059 |
| 5,039 |
| 194 |
| 52 |
| 246 |
|
Vertex Pharmaceuticals, Inc. (e) |
| 700 |
| — |
| 700 |
| 29 |
| — |
| 29 |
|
|
|
|
|
|
|
|
| 1,316 |
| 203 |
| 1,519 |
|
Building Products (0.1%) |
|
|
|
|
|
|
|
|
|
|
|
|
|
Asahi Glass Co., Ltd. |
| 15,000 |
| — |
| 15,000 |
| 127 |
| — |
| 127 |
|
Assa Abloy AB, Class B |
| 3,465 |
| — |
| 3,465 |
| 109 |
| — |
| 109 |
|
Cie de St-Gobain |
| 2,371 |
| — |
| 2,371 |
| 106 |
| — |
| 106 |
|
Daikin Industries Ltd. |
| 3,500 |
| — |
| 3,500 |
| 95 |
| — |
| 95 |
|
Geberit AG, (Registered) (e) |
| 814 |
| — |
| 814 |
| 170 |
| — |
| 170 |
|
JS Group Corp. |
| 5,100 |
| — |
| 5,100 |
| 107 |
| — |
| 107 |
|
|
|
|
|
|
|
|
| 714 |
| — |
| 714 |
|
Capitàl Markets (0.8%) |
|
|
|
|
|
|
|
|
|
|
|
|
|
3i Group PLC |
| 17,668 |
| — |
| 17,668 |
| 60 |
| — |
| 60 |
|
Ameriprise Financial, Inc. |
| 2,377 |
| 100 |
| 2,477 |
| 136 |
| 6 |
| 142 |
|
Bank of New York Mellon Corp. (The) |
| 9,760 |
| 1,914 |
| 11,674 |
| 236 |
| 46 |
| 282 |
|
BlackRock, Inc. |
| 903 |
| 31 |
| 934 |
| 185 |
| 6 |
| 191 |
|
Charles Schwab Corp. (The) |
| 6,087 |
| 747 |
| 6,834 |
| 87 |
| 11 |
| 98 |
|
Credit Suisse Group AG, (Registered) (e) |
| 14,383 |
| — |
| 14,383 |
| 410 |
| — |
| 410 |
|
Daiwa Securities Group, Inc. |
| 31,000 |
| — |
| 31,000 |
| 122 |
| — |
| 122 |
|
Deutsche Bank AG, (Registered) |
| 11,735 |
| — |
| 11,735 |
| 584 |
| — |
| 584 |
|
Franklin Resources, Inc. (d) |
| 956 |
| 124 |
| 1,080 |
| 119 |
| 15 |
| 134 |
|
Goldman Sachs Group, Inc. (The) |
| 3,959 |
| 990 |
| 4,949 |
| 492 |
| 123 |
| 615 |
|
IGM Financial, Inc. |
| 2,800 |
| — |
| 2,800 |
| 130 |
| — |
| 130 |
|
Invesco Ltd. |
| 3,165 |
| 500 |
| 3,665 |
| 84 |
| 13 |
| 97 |
|
Investec PLC |
| 9,538 |
| — |
| 9,538 |
| 58 |
| — |
| 58 |
|
Janus Capital Group, Inc. |
| — |
| 200 |
| 200 |
| — |
| 2 |
| 2 |
|
Julius Baer Group Ltd. (e) |
| 2,123 |
| — |
| 2,123 |
| 86 |
| — |
| 86 |
|
Legg Mason, Inc. |
| 1,129 |
| 342 |
| 1,471 |
| 32 |
| 10 |
| 42 |
|
Macquarie Group Ltd. |
| 4,098 |
| — |
| 4,098 |
| 123 |
| — |
| 123 |
|
Man Group PLC |
| 15,236 |
| — |
| 15,236 |
| 33 |
| — |
| 33 |
|
Nomura Holdings, Inc. |
| 46,800 |
| — |
| 46,800 |
| 207 |
| — |
| 207 |
|
Northern Trust Corp. |
| — |
| 130 |
| 130 |
| — |
| 6 |
| 6 |
|
State Street Corp. |
| 2,086 |
| 716 |
| 2,802 |
| 95 |
| 33 |
| 128 |
|
T. Rowe Price Group, Inc. |
| 3,123 |
| 165 |
| 3,288 |
| 204 |
| 11 |
| 215 |
|
UBS AG, (Registered) (e) |
| 25,821 |
| — |
| 25,821 |
| 362 |
| — |
| 362 |
|
|
|
|
|
|
|
|
| 3,845 |
| 282 |
| 4,127 |
|
Chemicals (1.5%) |
|
|
|
|
|
|
|
|
|
|
|
|
|
Agrium, Inc. |
| 2,200 |
| — |
| 2,200 |
| 190 |
| — |
| 190 |
|
Air Liquide SA |
| 2,681 |
| — |
| 2,681 |
| 357 |
| — |
| 357 |
|
Air Products & Chemicals, Inc. (d) |
| 358 |
| 191 |
| 549 |
| 33 |
| 18 |
| 51 |
|
Airgas, Inc. |
| 282 |
| — |
| 282 |
| 25 |
| — |
| 25 |
|
Akzo Nobel N.V. |
| 4,370 |
| — |
| 4,370 |
| 258 |
| — |
| 258 |
|
Asahi Kasei Corp. |
| 25,000 |
| — |
| 25,000 |
| 154 |
| — |
| 154 |
|
BASF SE |
| 13,289 |
| — |
| 13,289 |
| 1,162 |
| — |
| 1,162 |
|
Celanese Corp. |
| 399 |
| — |
| 399 |
| 18 |
| — |
| 18 |
|
CF Industries Holdings, Inc. |
| 4,328 |
| 412 |
| 4,740 |
| 791 |
| 75 |
| 866 |
|
Dow Chemical Co. (The) (d) |
| 1,326 |
| 1,113 |
| 2,439 |
| 46 |
| 39 |
| 85 |
|
DuluxGroup Ltd. |
| 6,321 |
| — |
| 6,321 |
| 20 |
| — |
| 20 |
|
Eastman Chemical Co. |
| 260 |
| 200 |
| 460 |
| 13 |
| 10 |
| 23 |
|
Ecolab, Inc. (d) |
| 1,394 |
| 226 |
| 1,620 |
| 86 |
| 14 |
| 100 |
|
EI du Pont de Nemours & Co. |
| 20,119 |
| 2,121 |
| 22,240 |
| 1,064 |
| 112 |
| 1,176 |
|
FMC Corp. (d) |
| 394 |
| 119 |
| 513 |
| 42 |
| 13 |
| 55 |
|
Givaudan SA, (Registered) (e) |
| 82 |
| — |
| 82 |
| 79 |
| — |
| 79 |
|
Incitec Pivot Ltd. |
| 20,816 |
| — |
| 20,816 |
| 68 |
| — |
| 68 |
|
International Flavors & Fragrances, Inc. (d) |
| 124 |
| 119 |
| 243 |
| 7 |
| 7 |
| 14 |
|
Johnson Matthey PLC |
| 2,447 |
| — |
| 2,447 |
| 92 |
| — |
| 92 |
|
JSR Corp. |
| 3,000 |
| — |
| 3,000 |
| 60 |
| — |
| 60 |
|
K&S AG, (Registered) |
| 1,526 |
| — |
| 1,526 |
| 80 |
| — |
| 80 |
|
Koninklijke DSM N.V. |
| 3,367 |
| — |
| 3,367 |
| 195 |
| — |
| 195 |
|
Kuraray Co., Ltd. |
| 5,000 |
| — |
| 5,000 |
| 71 |
| — |
| 71 |
|
Lanxess AG |
| 1,060 |
| — |
| 1,060 |
| 88 |
| — |
| 88 |
|
Linde AG |
| 1,655 |
| — |
| 1,655 |
| 297 |
| — |
| 297 |
|
LyondellBasell Industries N.V., Class A |
| 576 |
| — |
| 576 |
| 25 |
| — |
| 25 |
|
Mitsubishi Chemical Holdings Corp. |
| 20,000 |
| — |
| 20,000 |
| 107 |
| — |
| 107 |
|
Monsanto Co. |
| 2,332 |
| 530 |
| 2,862 |
| 186 |
| 42 |
| 228 |
|
Mosaic Co. (The) |
| 1,466 |
| 52 |
| 1,518 |
| 81 |
| 3 |
| 84 |
|
Nitto Denko Corp. |
| 2,200 |
| — |
| 2,200 |
| 89 |
| — |
| 89 |
|
Novozymes A/S, Series B |
| 2,530 |
| — |
| 2,530 |
| 74 |
| — |
| 74 |
|
Orica Ltd. |
| 5,073 |
| — |
| 5,073 |
| 147 |
| — |
| 147 |
|
Potash Corp. of Saskatchewan, Inc. |
| 11,400 |
| — |
| 11,400 |
| 520 |
| — |
| 520 |
|
Security Description |
| Morgan Stanley |
| MSIFT Global |
| Pro Forma |
| Morgan Stanley |
| MSIFT Global |
| Pro Forma |
|
PPG Industries, Inc. |
| 186 |
| 211 |
| 397 |
| 18 |
| 20 |
| 38 |
|
Praxair, Inc. |
| 1,499 |
| 369 |
| 1,868 |
| 172 |
| 42 |
| 214 |
|
Sherwin-Williams Co. (The) |
| 38 |
| 119 |
| 157 |
| 4 |
| 13 |
| 17 |
|
Shin-Etsu Chemical Co., Ltd. |
| 4,100 |
| — |
| 4,100 |
| 237 |
| — |
| 237 |
|
Sigma-Aldrich Corp. |
| 401 |
| 139 |
| 540 |
| 29 |
| 10 |
| 39 |
|
Sumitomo Chemical Co., Ltd. |
| 22,000 |
| — |
| 22,000 |
| 94 |
| — |
| 94 |
|
Syngenta AG, (Registered) (e) |
| 791 |
| — |
| 791 |
| 273 |
| — |
| 273 |
|
Toray Industries, Inc. |
| 25,000 |
| — |
| 25,000 |
| 185 |
| — |
| 185 |
|
Umicore SA |
| 1,567 |
| — |
| 1,567 |
| 86 |
| — |
| 86 |
|
Yara International ASA |
| 1,863 |
| — |
| 1,863 |
| 89 |
| — |
| 89 |
|
|
|
|
|
|
|
| 7,712 |
| 418 |
| 8,130 |
| |
Commercial Banks (3.4%) |
|
|
|
|
|
|
|
|
|
|
|
|
|
Australia & New Zealand Banking Group Ltd. |
| 34,810 |
| — |
| 34,810 |
| 839 |
| — |
| 839 |
|
Banco Bilbao Vizcaya Argentaria SA |
| 45,352 |
| — |
| 45,352 |
| 361 |
| — |
| 361 |
|
Banco Popular Espanol SA |
| 15,764 |
| — |
| 15,764 |
| 57 |
| — |
| 57 |
|
Banco Santander SA |
| 90,268 |
| — |
| 90,268 |
| 695 |
| — |
| 695 |
|
Bank of East Asia Ltd. |
| 15,965 |
| — |
| 15,965 |
| 60 |
| — |
| 60 |
|
Bank of Montreal |
| 7,100 |
| — |
| 7,100 |
| 422 |
| — |
| 422 |
|
Bank of Nova Scotia |
| 12,400 |
| — |
| 12,400 |
| 695 |
| — |
| 695 |
|
Bank of Yokohama Ltd. (The) |
| 22,000 |
| — |
| 22,000 |
| 110 |
| — |
| 110 |
|
Barclays PLC |
| 126,770 |
| — |
| 126,770 |
| 477 |
| — |
| 477 |
|
BB&T Corp. (d) |
| 5,617 |
| 1,177 |
| 6,794 |
| 176 |
| 37 |
| 213 |
|
BNP Paribas SA |
| 10,548 |
| — |
| 10,548 |
| 500 |
| — |
| 500 |
|
BOC Hong Kong Holdings Ltd. |
| 36,500 |
| — |
| 36,500 |
| 101 |
| — |
| 101 |
|
CaixaBank |
| 11,821 |
| — |
| 11,821 |
| 46 |
| — |
| 46 |
|
Canadian Imperial Bank of Commerce |
| 5,200 |
| — |
| 5,200 |
| 397 |
| — |
| 397 |
|
Chiba Bank Ltd. (The) |
| 14,000 |
| — |
| 14,000 |
| 89 |
| — |
| 89 |
|
CIT Group, Inc. (e) |
| 1,852 |
| — |
| 1,852 |
| 76 |
| — |
| 76 |
|
Comerica, Inc. (d) |
| — |
| 400 |
| 400 |
| — |
| 13 |
| 13 |
|
Commerzbank AG (e) |
| 49,404 |
| — |
| 49,404 |
| 125 |
| — |
| 125 |
|
Commonwealth Bank of Australia |
| 17,491 |
| — |
| 17,491 |
| 908 |
| — |
| 908 |
|
Credit Agricole SA |
| 8,087 |
| — |
| 8,087 |
| 50 |
| — |
| 50 |
|
Danske Bank A/S (e) |
| 5,744 |
| — |
| 5,744 |
| 97 |
| — |
| 97 |
|
DnB NOR ASA |
| 11,497 |
| — |
| 11,497 |
| 148 |
| — |
| 148 |
|
Fifth Third Bancorp (d) |
| 7,990 |
| 1,511 |
| 9,501 |
| 112 |
| 21 |
| 133 |
|
Hang Seng Bank Ltd. |
| 11,500 |
| — |
| 11,500 |
| 153 |
| — |
| 153 |
|
HSBC Holdings PLC |
| 154,689 |
| — |
| 154,689 |
| 1,373 |
| — |
| 1,373 |
|
Huntington Bancshares, Inc. |
| — |
| 1,600 |
| 1,600 |
| — |
| 10 |
| 10 |
|
Intesa Sanpaolo SpA |
| 120,612 |
| — |
| 120,612 |
| 216 |
| — |
| 216 |
|
KBC Groep N.V. |
| 3,024 |
| — |
| 3,024 |
| 76 |
| — |
| 76 |
|
KeyCorp |
| 9,909 |
| 1,356 |
| 11,265 |
| 84 |
| 12 |
| 96 |
|
Lloyds Banking Group PLC (e) |
| 378,183 |
| — |
| 378,183 |
| 203 |
| — |
| 203 |
|
M&T Bank Corp. (d) |
| 900 |
| 174 |
| 1,074 |
| 78 |
| 15 |
| 93 |
|
Mizuho Financial Group, Inc. |
| 184,800 |
| — |
| 184,800 |
| 301 |
| — |
| 301 |
|
National Australia Bank Ltd. |
| 29,142 |
| — |
| 29,142 |
| 743 |
| — |
| 743 |
|
National Bank of Canada |
| 2,100 |
| — |
| 2,100 |
| 167 |
| — |
| 167 |
|
National Bank of Greece SA (e) |
| 14,355 |
| — |
| 14,355 |
| 37 |
| — |
| 37 |
|
Nordea Bank AB |
| 27,526 |
| — |
| 27,526 |
| 250 |
| — |
| 250 |
|
PNC Financial Services Group, Inc. |
| 3,685 |
| 803 |
| 4,488 |
| 238 |
| 52 |
| 290 |
|
Regions Financial Corp. |
| 12,568 |
| 2,532 |
| 15,100 |
| 83 |
| 17 |
| 100 |
|
Resona Holdings, Inc. |
| 7,600 |
| — |
| 7,600 |
| 35 |
| — |
| 35 |
|
Royal Bank of Canada |
| 17,100 |
| — |
| 17,100 |
| 991 |
| — |
| 991 |
|
Royal Bank of Scotland Group PLC (e) |
| 206,210 |
| — |
| 206,210 |
| 91 |
| — |
| 91 |
|
Shizuoka Bank Ltd. (The) |
| 12,000 |
| — |
| 12,000 |
| 124 |
| — |
| 124 |
|
Skandinaviska Enskilda Banken AB |
| 14,986 |
| — |
| 14,986 |
| 106 |
| — |
| 106 |
|
Societe Generale SA |
| 7,308 |
| — |
| 7,308 |
| 214 |
| — |
| 214 |
|
Standard Chartered PLC |
| 20,828 |
| — |
| 20,828 |
| 520 |
| — |
| 520 |
|
Sumitomo Mitsui Financial Group, Inc. |
| 17,300 |
| — |
| 17,300 |
| 569 |
| — |
| 569 |
|
Sumitomo Mitsui Trust Holdings, Inc. |
| 37,000 |
| — |
| 37,000 |
| 118 |
| — |
| 118 |
|
SunTrust Banks, Inc. |
| 4,210 |
| 908 |
| 5,118 |
| 102 |
| 22 |
| 124 |
|
Svenska Handelsbanken AB, Class A |
| 5,789 |
| — |
| 5,789 |
| 185 |
| — |
| 185 |
|
Swedbank AB, Class A |
| 4,898 |
| — |
| 4,898 |
| 76 |
| — |
| 76 |
|
Toronto-Dominion Bank (The) |
| 11,300 |
| — |
| 11,300 |
| 959 |
| — |
| 959 |
|
UniCredit SpA |
| 17,827 |
| — |
| 17,827 |
| 89 |
| — |
| 89 |
|
US Bancorp |
| 13,148 |
| 2,852 |
| 16,000 |
| 417 |
| 90 |
| 507 |
|
Wells Fargo & Co. |
| 36,765 |
| 7,534 |
| 44,299 |
| 1,255 |
| 257 |
| 1,512 |
|
Westpac Banking Corp. |
| 34,431 |
| — |
| 34,431 |
| 781 |
| — |
| 781 |
|
Zions Bancorporation (d) |
| — |
| 400 |
| 400 |
| — |
| 9 |
| 9 |
|
|
|
|
|
|
|
| 17,175 |
| 555 |
| 17,730 |
| |
Commercial Services & Supplies (0.3%) |
|
|
|
|
|
|
|
|
|
|
|
|
|
Aggreko PLC |
| 2,555 |
| — |
| 2,555 |
| 92 |
| — |
| 92 |
|
Avery Dennison Corp. (d) |
| 1,225 |
| 234 |
| 1,459 |
| 37 |
| 7 |
| 44 |
|
Security Description |
| Morgan Stanley |
| MSIFT Global |
| Pro Forma |
| Morgan Stanley |
| MSIFT Global |
| Pro Forma |
|
Babcock International Group PLC |
| 4,000 |
| — |
| 4,000 |
| 51 |
| — |
| 51 |
|
Brambles Ltd. |
| 17,604 |
| — |
| 17,604 |
| 129 |
| — |
| 129 |
|
Cintas Corp. |
| 1,313 |
| 287 |
| 1,600 |
| 51 |
| 11 |
| 62 |
|
Dai Nippon Printing Co., Ltd. |
| 11,000 |
| — |
| 11,000 |
| 112 |
| — |
| 112 |
|
Edenred |
| 1,823 |
| — |
| 1,823 |
| 55 |
| — |
| 55 |
|
G4S PLC |
| 14,808 |
| — |
| 14,808 |
| 65 |
| — |
| 65 |
|
Iron Mountain, Inc. (d) |
| 2,068 |
| 206 |
| 2,274 |
| 60 |
| 6 |
| 66 |
|
Pitney Bowes, Inc. |
| 2,106 |
| 429 |
| 2,535 |
| 37 |
| 7 |
| 44 |
|
Republic Services, Inc. |
| 2,726 |
| 446 |
| 3,172 |
| 83 |
| 14 |
| 97 |
|
RR Donnelley & Sons Co. (d) |
| 2,662 |
| 458 |
| 3,120 |
| 33 |
| 6 |
| 39 |
|
Secom Co., Ltd. |
| 2,800 |
| — |
| 2,800 |
| 137 |
| — |
| 137 |
|
Serco Group PLC |
| 5,878 |
| — |
| 5,878 |
| 51 |
| — |
| 51 |
|
Stericycle, Inc. (d)(e) |
| 849 |
| 119 |
| 968 |
| 71 |
| 10 |
| 81 |
|
Toppan Printing Co., Ltd. |
| 11,000 |
| — |
| 11,000 |
| 86 |
| — |
| 86 |
|
Waste Management, Inc. |
| 2,981 |
| 1,009 |
| 3,990 |
| 104 |
| 35 |
| 139 |
|
|
|
|
|
|
|
| 1,254 |
| 96 |
| 1,350 |
| |
Communications Equipment (0.8%) |
|
|
|
|
|
|
|
|
|
|
|
|
|
Alcatel-Lucent (e) |
| 32,733 |
| — |
| 32,733 |
| 74 |
| — |
| 74 |
|
Ciena Corp. (d)(e) |
| 88,657 |
| 7,434 |
| 96,091 |
| 1,435 |
| 120 |
| 1,555 |
|
Cisco Systems, Inc. |
| 33,647 |
| 6,986 |
| 40,633 |
| 712 |
| 148 |
| 860 |
|
Juniper Networks, Inc. (d)(e) |
| 4,106 |
| 839 |
| 4,945 |
| 94 |
| 19 |
| 113 |
|
Motorola Mobility Holdings, Inc. (e) |
| 2,188 |
| 410 |
| 2,598 |
| 86 |
| 16 |
| 102 |
|
Motorola Solutions, Inc. |
| 771 |
| 368 |
| 1,139 |
| 39 |
| 19 |
| 58 |
|
Nokia Oyj |
| 36,768 |
| — |
| 36,768 |
| 200 |
| — |
| 200 |
|
Qualcomm, Inc. |
| 9,904 |
| 2,239 |
| 12,143 |
| 674 |
| 152 |
| 826 |
|
Research In Motion Ltd. (e) |
| 6,300 |
| — |
| 6,300 |
| 92 |
| — |
| 92 |
|
Telefonaktiebolaget LM Ericsson, Class B |
| 27,294 |
| — |
| 27,294 |
| 283 |
| — |
| 283 |
|
|
|
|
|
|
|
| 3,689 |
| 474 |
| 4,163 |
| |
Computers & Peripherals (1.4%) |
|
|
|
|
|
|
|
|
|
|
|
|
|
Apple, Inc. (e) |
| 5,921 |
| 1,233 |
| 7,154 |
| 3,549 |
| 739 |
| 4,288 |
|
Dell, Inc. (d)(e) |
| 5,965 |
| 1,924 |
| 7,889 |
| 99 |
| 32 |
| 131 |
|
EMC Corp. (e) |
| 12,770 |
| 2,971 |
| 15,741 |
| 382 |
| 89 |
| 471 |
|
Fujitsu Ltd. |
| 25,000 |
| — |
| 25,000 |
| 132 |
| — |
| 132 |
|
Hewlett-Packard Co. |
| 24,195 |
| 3,963 |
| 28,158 |
| 577 |
| 95 |
| 672 |
|
Lexmark International, Inc., Class A (d) |
| — |
| 100 |
| 100 |
| — |
| 3 |
| 3 |
|
NetApp, Inc. (e) |
| 2,529 |
| 607 |
| 3,136 |
| 113 |
| 27 |
| 140 |
|
SanDisk Corp. (e) |
| 21,131 |
| 1,918 |
| 23,049 |
| 1,048 |
| 95 |
| 1,143 |
|
Toshiba Corp. |
| 55,000 |
| — |
| 55,000 |
| 242 |
| — |
| 242 |
|
|
|
|
|
|
|
| 6,142 |
| 1,080 |
| 7,222 |
| |
Construction & Engineering (0.5%) |
|
|
|
|
|
|
|
|
|
|
|
|
|
ACS Actividades de Construccion y Servicios SA |
| 3,511 |
| — |
| 3,511 |
| 90 |
| — |
| 90 |
|
Bouygues SA |
| 2,699 |
| — |
| 2,699 |
| 83 |
| — |
| 83 |
|
Fluor Corp. |
| 784 |
| — |
| 784 |
| 47 |
| — |
| 47 |
|
Foster Wheeler AG (e) |
| 21,926 |
| 1,881 |
| 23,807 |
| 499 |
| 43 |
| 542 |
|
Jacobs Engineering Group, Inc. (e) |
| 891 |
| 200 |
| 1,091 |
| 40 |
| 9 |
| 49 |
|
JGC Corp. |
| 3,000 |
| — |
| 3,000 |
| 93 |
| — |
| 93 |
|
KBR, Inc. |
| 1,228 |
| — |
| 1,228 |
| 44 |
| — |
| 44 |
|
Leighton Holdings Ltd. |
| 2,027 |
| — |
| 2,027 |
| 45 |
| — |
| 45 |
|
Skanska AB, Class B |
| 3,281 |
| — |
| 3,281 |
| 57 |
| — |
| 57 |
|
SNC-Lavalin Group, Inc. |
| 2,800 |
| — |
| 2,800 |
| 112 |
| — |
| 112 |
|
URS Corp. |
| 20,535 |
| 1,683 |
| 22,218 |
| 873 |
| 71 |
| 944 |
|
Vinci SA |
| 5,057 |
| — |
| 5,057 |
| 264 |
| — |
| 264 |
|
|
|
|
|
|
|
| 2,247 |
| 123 |
| 2,370 |
| |
Consumer Materials (0.0%) |
|
|
|
|
|
|
|
|
|
|
|
|
|
Lafarge SA |
| 4,727 |
| — |
| 4,727 |
| 226 |
| — |
| 226 |
|
|
|
|
|
|
|
|
|
|
|
|
|
|
|
Consumer Finance (0.1%) |
|
|
|
|
|
|
|
|
|
|
|
|
|
American Express Co. |
| 3,055 |
| 944 |
| 3,999 |
| 177 |
| 54 |
| 231 |
|
Capital One Financial Corp. |
| 3,340 |
| 783 |
| 4,123 |
| 186 |
| 44 |
| 230 |
|
Discover Financial Services |
| 2,469 |
| 993 |
| 3,462 |
| 82 |
| 33 |
| 115 |
|
SLM Corp. |
| 4,882 |
| 444 |
| 5,326 |
| 77 |
| 7 |
| 84 |
|
|
|
|
|
|
|
| 522 |
| 138 |
| 660 |
| |
Containers & Packaging (0.0%) |
|
|
|
|
|
|
|
|
|
|
|
|
|
Amcor Ltd. |
| 15,296 |
| — |
| 15,296 |
| 118 |
| — |
| 118 |
|
Ball Corp. |
| 515 |
| 239 |
| 754 |
| 22 |
| 10 |
| 32 |
|
Crown Holdings, Inc. (e) |
| 566 |
| — |
| 566 |
| 21 |
| — |
| 21 |
|
Owens-Illinois, Inc. (e) |
| 282 |
| — |
| 282 |
| 7 |
| — |
| 7 |
|
Sealed Air Corp. |
| 299 |
| — |
| 299 |
| 6 |
| — |
| 6 |
|
|
|
|
|
|
|
| 174 |
| 10 |
| 184 |
| |
Distributors (0.0%) |
|
|
|
|
|
|
|
|
|
|
|
|
|
Genuine Parts Co. |
| — |
| 200 |
| 200 |
| — |
| 13 |
| 13 |
|
Li & Fung Ltd. (j) |
| 40,000 |
| — |
| 40,000 |
| 92 |
| — |
| 92 |
|
|
|
|
|
|
|
| 92 |
| 13 |
| 105 |
|
Security Description |
| Morgan Stanley |
| MSIFT Global |
| Pro Forma |
| Morgan Stanley |
| MSIFT Global |
| Pro Forma |
|
Diversified Consumer Services (0.0%) |
|
|
|
|
|
|
|
|
|
|
|
|
|
Apollo Group, Inc., Class A (d)(e) |
| 715 |
| 258 |
| 973 |
| 28 |
| 10 |
| 38 |
|
DeVry, Inc. (d) |
| — |
| 119 |
| 119 |
| — |
| 4 |
| 4 |
|
H&R Block, Inc. (d) |
| 2,900 |
| 916 |
| 3,816 |
| 48 |
| 15 |
| 63 |
|
|
|
|
|
|
|
| 76 |
| 29 |
| 105 |
| |
Diversified Financial Services (1.2%) |
|
|
|
|
|
|
|
|
|
|
|
|
|
ASX Ltd. |
| 2,386 |
| — |
| 2,386 |
| 82 |
| — |
| 82 |
|
Bank of America Corp. |
| 79,453 |
| 18,046 |
| 97,499 |
| 760 |
| 173 |
| 933 |
|
Citigroup, Inc. (d) (p) |
| 11,876 |
| 5,096 |
| 16,972 |
| 434 |
| 186 |
| 620 |
|
CME Group, Inc. |
| — |
| 138 |
| 138 |
| — |
| 40 |
| 40 |
|
Deutsche Boerse AG |
| 1,392 |
| — |
| 1,392 |
| 94 |
| — |
| 94 |
|
Groupe Bruxelles Lambert SA |
| 1,540 |
| — |
| 1,540 |
| 119 |
| — |
| 119 |
|
Hong Kong Exchanges and Clearing Ltd. |
| 9,972 |
| — |
| 9,972 |
| 168 |
| — |
| 168 |
|
ING Groep, CVA (e) |
| 48,287 |
| — |
| 48,287 |
| 402 |
| — |
| 402 |
|
Investor AB, Class B |
| 12,458 |
| — |
| 12,458 |
| 276 |
| — |
| 276 |
|
JPMorgan Chase & Co. |
| 60,607 |
| 8,415 |
| 69,022 |
| 2,787 |
| 387 |
| 3,174 |
|
Leucadia National Corp. (d) |
| 2,353 |
| 123 |
| 2,476 |
| 61 |
| 3 |
| 64 |
|
Moody’s Corp. (d) |
| 692 |
| 109 |
| 801 |
| 29 |
| 5 |
| 34 |
|
NASDAQ OMX Group, Inc. (The) (e) |
| 2,695 |
| 136 |
| 2,831 |
| 70 |
| 3 |
| 73 |
|
NYSE Euronext (d) |
| 3,332 |
| 331 |
| 3,663 |
| 100 |
| 10 |
| 110 |
|
ORIX Corp. |
| 1,380 |
| — |
| 1,380 |
| 132 |
| — |
| 132 |
|
|
|
|
|
|
|
| 5,514 |
| 807 |
| 6,321 |
| |
Diversified Telecommunication Services (1.3%) |
|
|
|
|
|
|
|
|
|
|
|
|
|
AT&T, Inc. |
| 25,751 |
| 7,477 |
| 33,228 |
| 804 |
| 234 |
| 1,038 |
|
BCE, Inc. |
| 7,200 |
| — |
| 7,200 |
| 288 |
| — |
| 288 |
|
BT Group PLC |
| 97,290 |
| — |
| 97,290 |
| 352 |
| — |
| 352 |
|
CenturyLink, Inc. (d) |
| 18,796 |
| 1,957 |
| 20,753 |
| 726 |
| 76 |
| 802 |
|
Deutsche Telekom AG, (Registered) |
| 33,454 |
| — |
| 33,454 |
| 403 |
| — |
| 403 |
|
France Telecom SA |
| 20,519 |
| — |
| 20,519 |
| 304 |
| — |
| 304 |
|
Frontier Communications Corp. |
| 8,200 |
| 2,518 |
| 10,718 |
| 34 |
| 10 |
| 44 |
|
Inmarsat PLC |
| 4,106 |
| — |
| 4,106 |
| 30 |
| — |
| 30 |
|
Koninklijke KPN N.V. |
| 6,177 |
| — |
| 6,177 |
| 68 |
| — |
| 68 |
|
Nippon Telegraph & Telephone Corp. |
| 7,600 |
| — |
| 7,600 |
| 345 |
| — |
| 345 |
|
Portugal Telecom SGPS SA, (Registered) |
| 11,841 |
| — |
| 11,841 |
| 64 |
| — |
| 64 |
|
Swisscom AG, (Registered) |
| 691 |
| — |
| 691 |
| 279 |
| — |
| 279 |
|
Telecom Italia SpA |
| 142,349 |
| — |
| 142,349 |
| 169 |
| — |
| 169 |
|
Telecom Italia SpA |
| 127,093 |
| — |
| 127,093 |
| 125 |
| — |
| 125 |
|
Telenor ASA |
| 16,466 |
| — |
| 16,466 |
| 305 |
| — |
| 305 |
|
TeliaSonera AB |
| 33,207 |
| — |
| 33,207 |
| 232 |
| — |
| 232 |
|
Telstra Corp, Ltd. |
| 60,099 |
| — |
| 60,099 |
| 205 |
| — |
| 205 |
|
Verizon Communications, Inc. |
| 40,089 |
| 4,999 |
| 45,088 |
| 1,533 |
| 191 |
| 1,724 |
|
Vivendi SA |
| 16,603 |
| — |
| 16,603 |
| 305 |
| — |
| 305 |
|
|
|
|
|
|
|
| 6,571 |
| 511 |
| 7,082 |
| |
Electric Utilities (0.9%) |
|
|
|
|
|
|
|
|
|
|
|
|
|
American Electric Power Co., Inc. |
| 3,937 |
| 769 |
| 4,706 |
| 152 |
| 30 |
| 182 |
|
Chubu Electric Power Co., Inc. |
| 7,400 |
| — |
| 7,400 |
| 134 |
| — |
| 134 |
|
Chugoku Electric Power Co., Inc. (The) |
| 3,700 |
| — |
| 3,700 |
| 69 |
| — |
| 69 |
|
CLP Holdings Ltd. |
| 19,000 |
| — |
| 19,000 |
| 164 |
| — |
| 164 |
|
Duke Energy Corp. |
| 8,150 |
| 1,615 |
| 9,765 |
| 171 |
| 34 |
| 205 |
|
E.ON AG |
| 20,521 |
| — |
| 20,521 |
| 492 |
| — |
| 492 |
|
EDF SA |
| 3,256 |
| — |
| 3,256 |
| 74 |
| — |
| 74 |
|
Edison International (d) |
| 3,068 |
| 735 |
| 3,803 |
| 130 |
| 31 |
| 161 |
|
Enel SpA |
| 82,927 |
| — |
| 82,927 |
| 300 |
| — |
| 300 |
|
Entergy Corp. |
| 1,317 |
| — |
| 1,317 |
| 89 |
| — |
| 89 |
|
Exelon Corp. |
| 6,993 |
| 633 |
| 7,626 |
| 274 |
| 25 |
| 299 |
|
FirstEnergy Corp. (d) |
| 3,156 |
| 395 |
| 3,551 |
| 144 |
| 18 |
| 162 |
|
Fortis, Inc. |
| 2,000 |
| — |
| 2,000 |
| 65 |
| — |
| 65 |
|
Fortum Oyj (e) |
| 6,439 |
| — |
| 6,439 |
| 156 |
| — |
| 156 |
|
Hokkaido Electric Power Co., Inc. |
| 4,200 |
| — |
| 4,200 |
| 62 |
| — |
| 62 |
|
Hokuriku Electric Power Co. |
| 3,900 |
| — |
| 3,900 |
| 70 |
| — |
| 70 |
|
Iberdrola SA |
| 40,863 |
| — |
| 40,863 |
| 232 |
| — |
| 232 |
|
Kansai Electric Power Co., Inc. (The) |
| 6,200 |
| — |
| 6,200 |
| 96 |
| — |
| 96 |
|
Kyushu Electric Power Co., Inc. |
| 3,900 |
| — |
| 3,900 |
| 56 |
| — |
| 56 |
|
NextEra Energy, Inc. (d) |
| 2,801 |
| 635 |
| 3,436 |
| 171 |
| 39 |
| 210 |
|
Pepco Holdings, Inc. |
| — |
| 85 |
| 85 |
| — |
| 2 |
| 2 |
|
Power Assets Holdings Ltd. |
| 14,500 |
| — |
| 14,500 |
| 106 |
| — |
| 106 |
|
PPL Corp. |
| 3,942 |
| 735 |
| 4,677 |
| 111 |
| 21 |
| 132 | �� |
Progress Energy, Inc. |
| 1,666 |
| 405 |
| 2,071 |
| 88 |
| 21 |
| 109 |
|
Red Electrica Corp. SA |
| 1,327 |
| — |
| 1,327 |
| 65 |
| — |
| 65 |
|
Shikoku Electric Power Co., Inc. |
| 5,500 |
| — |
| 5,500 |
| 155 |
| — |
| 155 |
|
Southern Co. (The) (d) |
| 5,166 |
| 2,119 |
| 7,285 |
| 232 |
| 95 |
| 327 |
|
Security Description |
| Morgan Stanley |
| MSIFT Global |
| Pro Forma |
| Morgan Stanley |
| MSIFT Global |
| Pro Forma |
|
SSE PLC |
| 17,803 |
| — |
| 17,803 |
| 378 |
| — |
| 378 |
|
Tohoku Electric Power Co., Inc. (e) |
| 6,600 |
| — |
| 6,600 |
| 75 |
| — |
| 75 |
|
Tokyo Electric Power Co., Inc. (The) (e) |
| 13,700 |
| — |
| 13,700 |
| 34 |
| — |
| 34 |
|
|
|
|
|
|
|
|
| 4,345 |
| 316 |
| 4,661 |
|
Electrical Equipment (0.4%) |
|
|
|
|
|
|
|
|
|
|
|
|
|
ABB Ltd., (Registered) (e) |
| 34,134 |
| — |
| 34,134 |
| 700 |
| — |
| 700 |
|
Alstom SA |
| 4,351 |
| — |
| 4,351 |
| 170 |
| — |
| 170 |
|
AMETEK, Inc. |
| 450 |
| — |
| 450 |
| 22 |
| — |
| 22 |
|
Cooper Industries PLC |
| 864 |
| — |
| 864 |
| 55 |
| — |
| 55 |
|
Emerson Electric Co. |
| 4,535 |
| 812 |
| 5,347 |
| 237 |
| 42 |
| 279 |
|
Mitsubishi Electric Corp. |
| 26,000 |
| — |
| 26,000 |
| 230 |
| — |
| 230 |
|
Nidec Corp. |
| 1,400 |
| — |
| 1,400 |
| 128 |
| — |
| 128 |
|
Rockwell Automation, Inc. |
| 1,519 |
| — |
| 1,519 |
| 121 |
| — |
| 121 |
|
Roper Industries, Inc. |
| 339 |
| — |
| 339 |
| 34 |
| — |
| 34 |
|
Sumitomo Electric Industries Ltd. |
| 22,700 |
| — |
| 22,700 |
| 311 |
| — |
| 311 |
|
Vestas Wind Systems A/S (e) |
| 3,486 |
| — |
| 3,486 |
| 35 |
| — |
| 35 |
|
|
|
|
|
|
|
|
| 2,043 |
| 42 |
| 2,085 |
|
Electronic Equipment, Instruments & Components (0.5%) |
|
|
|
|
|
|
|
|
|
|
|
|
|
Amphenol Corp., Class A (d) |
| — |
| 285 |
| 285 |
| — |
| 17 |
| 17 |
|
Arrow Electronics, Inc. (e) |
| 20,375 |
| 1,669 |
| 22,044 |
| 855 |
| 70 |
| 925 |
|
Corning, Inc. |
| 2,325 |
| 2,375 |
| 4,700 |
| 33 |
| 33 |
| 66 |
|
FUJIFILM Holdings Corp. |
| 7,400 |
| — |
| 7,400 |
| 174 |
| — |
| 174 |
|
Hitachi Ltd. |
| 63,000 |
| — |
| 63,000 |
| 404 |
| — |
| 404 |
|
Hoya Corp. |
| 5,000 |
| — |
| 5,000 |
| 112 |
| — |
| 112 |
|
Ibiden Co., Ltd. |
| 2,000 |
| — |
| 2,000 |
| 51 |
| — |
| 51 |
|
Jabil Circuit, Inc. |
| — |
| 300 |
| 300 |
| — |
| 8 |
| 8 |
|
Keyence Corp. |
| 660 |
| — |
| 660 |
| 155 |
| — |
| 155 |
|
Kyocera Corp. |
| 2,000 |
| — |
| 2,000 |
| 183 |
| — |
| 183 |
|
Molex, Inc. |
| — |
| 164 |
| 164 |
| — |
| 5 |
| 5 |
|
Murata Manufacturing Co., Ltd. |
| 2,800 |
| — |
| 2,800 |
| 166 |
| — |
| 166 |
|
Nippon Electric Glass Co., Ltd. |
| 6,000 |
| — |
| 6,000 |
| 52 |
| — |
| 52 |
|
Omron Corp. |
| 2,800 |
| — |
| 2,800 |
| 60 |
| — |
| 60 |
|
TDK Corp. |
| 1,400 |
| — |
| 1,400 |
| 79 |
| — |
| 79 |
|
TE Connectivity Ltd. |
| 2,080 |
| — |
| 2,080 |
| 76 |
| — |
| 76 |
|
|
|
|
|
|
|
|
| 2,400 |
| 133 |
| 2,533 |
|
Energy Equipment & Services (0.6%) |
|
|
|
|
|
|
|
|
|
|
|
|
|
Aker Solutions ASA |
| 1,677 |
| — |
| 1,677 |
| 28 |
| — |
| 28 |
|
AMEC PLC |
| 3,969 |
| — |
| 3,969 |
| 70 |
| — |
| 70 |
|
Baker Hughes, Inc. |
| 3,230 |
| 639 |
| 3,869 |
| 135 |
| 27 |
| 162 |
|
Cameron International Corp. (d)(e) |
| 1,424 |
| 717 |
| 2,141 |
| 75 |
| 38 |
| 113 |
|
Cie Generale de Geophysique-Veritas (e) |
| 1,748 |
| — |
| 1,748 |
| 52 |
| — |
| 52 |
|
Diamond Offshore Drilling, Inc. (d) |
| — |
| 139 |
| 139 |
| — |
| 9 |
| 9 |
|
FMC Technologies, Inc. (e) |
| 1,762 |
| 754 |
| 2,516 |
| 89 |
| 38 |
| 127 |
|
Fugro N.V., CVA |
| 657 |
| — |
| 657 |
| 47 |
| — |
| 47 |
|
Halliburton Co. |
| 6,015 |
| 1,609 |
| 7,624 |
| 200 |
| 54 |
| 254 |
|
Helmerich & Payne, Inc. |
| 641 |
| — |
| 641 |
| 35 |
| — |
| 35 |
|
Kvaerner ASA (e) |
| 1,677 |
| — |
| 1,677 |
| 5 |
| — |
| 5 |
|
National Oilwell Varco, Inc. (d) |
| 3,450 |
| 1,068 |
| 4,518 |
| 274 |
| 85 |
| 359 |
|
Noble Corp. (e) |
| 800 |
| 596 |
| 1,396 |
| 30 |
| 22 |
| 52 |
|
Petrofac Ltd. |
| 3,181 |
| — |
| 3,181 |
| 89 |
| — |
| 89 |
|
Saipem SpA |
| 2,576 |
| — |
| 2,576 |
| 133 |
| — |
| 133 |
|
Schlumberger Ltd. |
| 8,673 |
| 3,137 |
| 11,810 |
| 607 |
| 219 |
| 826 |
|
Subsea 7 SA (e) |
| 2,860 |
| — |
| 2,860 |
| 76 |
| — |
| 76 |
|
Technip SA |
| 986 |
| — |
| 986 |
| 116 |
| — |
| 116 |
|
Tenaris SA |
| 5,654 |
| — |
| 5,654 |
| 108 |
| — |
| 108 |
|
Transocean Ltd. |
| 2,790 |
| — |
| 2,790 |
| 152 |
| — |
| 152 |
|
Weatherford International Ltd. (e) |
| 4,898 |
| — |
| 4,898 |
| 74 |
| — |
| 74 |
|
WorleyParsons Ltd. |
| 2,456 |
| — |
| 2,456 |
| 73 |
| — |
| 73 |
|
|
|
|
|
|
|
|
| 2,468 |
| 492 |
| 2,960 |
|
Food & Staples Retailing (1.2%) |
|
|
|
|
|
|
|
|
|
|
|
|
|
Aeon Co., Ltd. |
| 11,100 |
| — |
| 11,100 |
| 146 |
| — |
| 146 |
|
Carrefour SA |
| 5,854 |
| — |
| 5,854 |
| 140 |
| — |
| 140 |
|
Colruyt SA |
| 905 |
| — |
| 905 |
| 36 |
| — |
| 36 |
|
Costco Wholesale Corp. |
| 5,403 |
| 595 |
| 5,998 |
| 491 |
| 54 |
| 545 |
|
CVS Caremark Corp. |
| — |
| 1,673 |
| 1,673 |
| — |
| 75 |
| 75 |
|
Delhaize Group SA |
| 3,434 |
| — |
| 3,434 |
| 181 |
| — |
| 181 |
|
Distribuidora Internacional de Alimentacion SA (e) |
| 6,563 |
| — |
| 6,563 |
| 33 |
| — |
| 33 |
|
Jeronimo Martins SGPS SA (e) |
| 3,072 |
| — |
| 3,072 |
| 63 |
| — |
| 63 |
|
Koninklijke Ahold N.V. |
| 12,173 |
| — |
| 12,173 |
| 169 |
| — |
| 169 |
|
Kroger Co. (The) |
| 6,224 |
| 772 |
| 6,996 |
| 151 |
| 19 |
| 170 |
|
Metro AG |
| 1,362 |
| — |
| 1,362 |
| 53 |
| — |
| 53 |
|
Safeway, Inc. |
| 31,593 |
| 2,695 |
| 34,288 |
| 638 |
| 55 |
| 693 |
|
Security Description |
| Morgan Stanley |
| MSIFT Global |
| Pro Forma |
| Morgan Stanley |
| MSIFT Global |
| Pro Forma |
|
Seven & I Holdings Co., Ltd. |
| 10,800 |
| — |
| 10,800 |
| 321 |
| — |
| 321 |
|
Shoppers Drug Mart Corp. |
| 3,500 |
| — |
| 3,500 |
| 154 |
| — |
| 154 |
|
Sysco Corp. |
| 6,576 |
| 1,087 |
| 7,663 |
| 196 |
| 32 |
| 228 |
|
Tesco PLC |
| 76,742 |
| — |
| 76,742 |
| 405 |
| — |
| 405 |
|
Walgreen Co. (d) |
| 10,398 |
| 458 |
| 10,856 |
| 348 |
| 15 |
| 363 |
|
Wal-Mart Stores, Inc. (d) |
| 19,964 |
| 2,687 |
| 22,651 |
| 1,222 |
| 164 |
| 1,386 |
|
Wesfarmers Ltd. |
| 12,676 |
| — |
| 12,676 |
| 394 |
| — |
| 394 |
|
Wesfarmers Ltd., (PPS) |
| 2,388 |
| — |
| 2,388 |
| 76 |
| — |
| 76 |
|
Whole Foods Market, Inc. |
| 1,769 |
| 705 |
| 2,474 |
| 147 |
| 59 |
| 206 |
|
WM Morrison Supermarkets PLC |
| 20,218 |
| — |
| 20,218 |
| 96 |
| — |
| 96 |
|
Woolworths Ltd. |
| 15,531 |
| — |
| 15,531 |
| 418 |
| — |
| 418 |
|
|
|
|
|
|
|
|
| 5,878 |
| 473 |
| 6,351 |
|
Food Products (1.4%) |
|
|
|
|
|
|
|
|
|
|
|
|
|
Ajinomoto Co., Inc. |
| 15,000 |
| — |
| 15,000 |
| 188 |
| — |
| 188 |
|
Archer-Daniels-Midland Co. |
| 2,801 |
| 1,016 |
| 3,817 |
| 89 |
| 32 |
| 121 |
|
Associated British Foods PLC |
| 1,859 |
| — |
| 1,859 |
| 36 |
| — |
| 36 |
|
Bunge Ltd. |
| 700 |
| — |
| 700 |
| 48 |
| — |
| 48 |
|
Campbell Soup Co. (d) |
| — |
| 400 |
| 400 |
| — |
| 14 |
| 14 |
|
ConAgra Foods, Inc. |
| 39,999 |
| 3,093 |
| 43,092 |
| 1,050 |
| 81 |
| 1,131 |
|
Danone |
| 7,049 |
| — |
| 7,049 |
| 492 |
| — |
| 492 |
|
General Mills, Inc. |
| 4,224 |
| 1,024 |
| 5,248 |
| 167 |
| 40 |
| 207 |
|
H.J. Heinz Co. (d) |
| 2,034 |
| 543 |
| 2,577 |
| 109 |
| 29 |
| 138 |
|
Hershey Co. (The) |
| 414 |
| 200 |
| 614 |
| 25 |
| 12 |
| 37 |
|
JM Smucker Co. (The) (d) |
| 700 |
| 223 |
| 923 |
| 57 |
| 18 |
| 75 |
|
Kellogg Co. |
| 1,887 |
| 462 |
| 2,349 |
| 101 |
| 25 |
| 126 |
|
Kraft Foods, Inc., Class A |
| 6,947 |
| 2,284 |
| 9,231 |
| 264 |
| 87 |
| 351 |
|
Mead Johnson Nutrition Co. |
| 1,212 |
| 324 |
| 1,536 |
| 100 |
| 27 |
| 127 |
|
Nestle SA, (Registered) |
| 33,962 |
| — |
| 33,962 |
| 2,137 |
| — |
| 2,137 |
|
Sara Lee Corp. |
| 2,000 |
| 878 |
| 2,878 |
| 43 |
| 19 |
| 62 |
|
Smithfield Foods, Inc. (d)(e) |
| 39,383 |
| 3,334 |
| 42,717 |
| 868 |
| 74 |
| 942 |
|
Suedzucker AG |
| 526 |
| — |
| 526 |
| 17 |
| — |
| 17 |
|
Tyson Foods, Inc., Class A |
| 2,000 |
| 700 |
| 2,700 |
| 38 |
| 13 |
| 51 |
|
Unilever N.V., CVA |
| 15,199 |
| — |
| 15,199 |
| 517 |
| — |
| 517 |
|
Unilever PLC |
| 12,866 |
| — |
| 12,866 |
| 425 |
| — |
| 425 |
|
|
|
|
|
|
|
|
| 6,771 |
| 471 |
| 7,242 |
|
Gas Utilities (0.1%) |
|
|
|
|
|
|
|
|
|
|
|
|
|
Hong Kong & China Gas Co., Ltd. |
| 39,600 |
| — |
| 39,600 |
| 101 |
| — |
| 101 |
|
Snam Rete Gas SpA |
| 45,529 |
| — |
| 45,529 |
| 219 |
| — |
| 219 |
|
Osaka Gas Co., Ltd. |
| 38,000 |
| — |
| 38,000 |
| 152 |
| — |
| 152 |
|
Tokyo Gas Co., Ltd. |
| 34,000 |
| — |
| 34,000 |
| 160 |
| — |
| 160 |
|
Oneok, Inc. |
| 1,406 |
| — |
| 1,406 |
| 115 |
| — |
| 115 |
|
|
|
|
|
|
|
|
| 747 |
| — |
| 747 |
|
Health Care Equipment & Supplies (0.5%) |
|
|
|
|
|
|
|
|
|
|
|
|
|
Baxter International, Inc. |
| 3,838 |
| 708 |
| 4,546 |
| 229 |
| 42 |
| 271 |
|
Becton Dickinson and Co. |
| 1,678 |
| 461 |
| 2,139 |
| 130 |
| 36 |
| 166 |
|
Boston Scientific Corp. (d)(e) |
| 9,574 |
| 2,517 |
| 12,091 |
| 57 |
| 15 |
| 72 |
|
Cie Generale d’Optique Essilor International SA |
| 1,615 |
| — |
| 1,615 |
| 144 |
| — |
| 144 |
|
Cochlear Ltd. |
| 773 |
| — |
| 773 |
| 50 |
| — |
| 50 |
|
Covidien PLC |
| 2,026 |
| — |
| 2,026 |
| 111 |
| — |
| 111 |
|
CR Bard, Inc. |
| 481 |
| 139 |
| 620 |
| 47 |
| 14 |
| 61 |
|
Edwards Lifesciences Corp. (e) |
| 586 |
| — |
| 586 |
| 43 |
| — |
| 43 |
|
Hologic, Inc. (e) |
| 1,510 |
| — |
| 1,510 |
| 33 |
| — |
| 33 |
|
Intuitive Surgical, Inc. (d)(e) |
| 470 |
| 135 |
| 605 |
| 255 |
| 73 |
| 328 |
|
Medtronic, Inc. (d) |
| 7,032 |
| 1,071 |
| 8,103 |
| 276 |
| 42 |
| 318 |
|
Olympus Corp. (e) |
| 3,500 |
| — |
| 3,500 |
| 57 |
| — |
| 57 |
|
Smith & Nephew PLC |
| 10,831 |
| — |
| 10,831 |
| 110 |
| — |
| 110 |
|
Sonova Holding AG, (Registered) |
| 880 |
| — |
| 880 |
| 98 |
| — |
| 98 |
|
St. Jude Medical, Inc. |
| 2,569 |
| 569 |
| 3,138 |
| 114 |
| 25 |
| 139 |
|
Stryker Corp. (d) |
| 2,145 |
| 590 |
| 2,735 |
| 119 |
| 33 |
| 152 |
|
Synthes, Inc., (Registered) (b) |
| 633 |
| — |
| 633 |
| 110 |
| — |
| 110 |
|
Terumo Corp. |
| 2,900 |
| — |
| 2,900 |
| 139 |
| — |
| 139 |
|
Varian Medical Systems, Inc. (d)(e) |
| 708 |
| 258 |
| 966 |
| 49 |
| 18 |
| 67 |
|
Zimmer Holdings, Inc. (d) |
| 1,660 |
| 302 |
| 1,962 |
| 107 |
| 19 |
| 126 |
|
|
|
|
|
|
|
|
| 2,278 |
| 317 |
| 2,595 |
|
Health Care Providers & Services (1.2%) |
|
|
|
|
|
|
|
|
|
|
|
|
|
Aetna, Inc. |
| 1,735 |
| 519 |
| 2,254 |
| 87 |
| 26 |
| 113 |
|
AmerisourceBergen Corp. (d) |
| 3,022 |
| 638 |
| 3,660 |
| 120 |
| 25 |
| 145 |
|
Cardinal Health, Inc. |
| 2,984 |
| 439 |
| 3,423 |
| 129 |
| 19 |
| 148 |
|
CIGNA Corp. |
| 1,673 |
| 465 |
| 2,138 |
| 82 |
| 23 |
| 105 |
|
Coventry Health Care, Inc. |
| 30,421 |
| 2,409 |
| 32,830 |
| 1,082 |
| 86 |
| 1,168 |
|
DaVita, Inc. (e) |
| 569 |
| 139 |
| 708 |
| 51 |
| 12 |
| 63 |
|
Express Scripts, Inc. (e) |
| 3,490 |
| 766 |
| 4,256 |
| 189 |
| 42 |
| 231 |
|
Security Description |
| Morgan Stanley |
| MSIFT Global |
| Pro Forma |
| Morgan Stanley |
| MSIFT Global |
| Pro Forma |
|
Fresenius Medical Care AG & Co. KGaA |
| 1,940 |
| — |
| 1,940 |
| 137 |
| — |
| 137 |
|
Fresenius SE & Co. KGaA |
| 1,321 |
| — |
| 1,321 |
| 135 |
| — |
| 135 |
|
HealthSouth Corp. (d)(e) |
| 43,400 |
| 3,600 |
| 47,000 |
| 889 |
| 74 |
| 963 |
|
Henry Schein, Inc. (e) |
| 642 |
| — |
| 642 |
| 49 |
| — |
| 49 |
|
Humana, Inc. |
| 757 |
| — |
| 757 |
| 70 |
| — |
| 70 |
|
Laboratory Corp. of America Holdings (e) |
| 526 |
| 183 |
| 709 |
| 48 |
| 17 |
| 65 |
|
McKesson Corp. |
| 1,739 |
| 319 |
| 2,058 |
| 153 |
| 28 |
| 181 |
|
Medco Health Solutions, Inc. (e) |
| 2,782 |
| 543 |
| 3,325 |
| 196 |
| 38 |
| 234 |
|
Omnicare, Inc. (d) |
| 26,605 |
| 2,218 |
| 28,823 |
| 946 |
| 79 |
| 1,025 |
|
Patterson Cos., Inc. (d) |
| — |
| 358 |
| 358 |
| — |
| 12 |
| 12 |
|
Quest Diagnostics, Inc. |
| 972 |
| 139 |
| 1,111 |
| 59 |
| 8 |
| 67 |
|
Sonic Healthcare Ltd. |
| 4,764 |
| — |
| 4,764 |
| 62 |
| — |
| 62 |
|
Tenet Healthcare Corp. (d)(e) |
| — |
| 1,432 |
| 1,432 |
| — |
| 8 |
| 8 |
|
UnitedHealth Group, Inc. |
| 4,540 |
| 750 |
| 5,290 |
| 268 |
| 44 |
| 312 |
|
Universal Health Services, Inc., Class B (d) |
| 18,042 |
| 1,501 |
| 19,543 |
| 756 |
| 63 |
| 819 |
|
WellPoint, Inc. (d) |
| 1,689 |
| 419 |
| 2,108 |
| 125 |
| 31 |
| 156 |
|
|
|
|
|
|
|
|
| 5,633 |
| 635 |
| 6,268 |
|
Health Care Technology (0.0%) |
|
|
|
|
|
|
|
|
|
|
|
|
|
Cerner Corp. (e) |
| 846 |
| 292 |
| 1,138 |
| 64 |
| 22 |
| 86 |
|
|
|
|
|
|
|
|
|
|
|
|
|
|
|
Hotels, Restaurants & Leisure (1.0%) |
|
|
|
|
|
|
|
|
|
|
|
|
|
Accor SA |
| 1,422 |
| — |
| 1,422 |
| 51 |
| — |
| 51 |
|
Carnival Corp. |
| 1,623 |
| 653 |
| 2,276 |
| 52 |
| 21 |
| 73 |
|
Chipotle Mexican Grill, Inc. (e) |
| 308 |
| — |
| 308 |
| 129 |
| — |
| 129 |
|
Compass Group PLC |
| 18,884 |
| — |
| 18,884 |
| 198 |
| — |
| 198 |
|
Crown Ltd. |
| 8,910 |
| — |
| 8,910 |
| 80 |
| — |
| 80 |
|
Darden Restaurants, Inc. (d) |
| 643 |
| 138 |
| 781 |
| 33 |
| 7 |
| 40 |
|
Echo Entertainment Group Ltd. |
| 10,695 |
| — |
| 10,695 |
| 49 |
| — |
| 49 |
|
International Game Technology (d) |
| 1,459 |
| 996 |
| 2,455 |
| 24 |
| 17 |
| 41 |
|
Las Vegas Sands Corp. |
| 2,019 |
| — |
| 2,019 |
| 116 |
| — |
| 116 |
|
Marriott International, Inc., Class A (d) |
| 1,497 |
| 318 |
| 1,815 |
| 57 |
| 12 |
| 69 |
|
Marriott Vacations Worldwide Corp. (e) |
| 149 |
| 31 |
| 180 |
| 4 |
| 1 |
| 5 |
|
McDonald’s Corp. |
| 16,592 |
| 1,555 |
| 18,147 |
| 1,628 |
| 152 |
| 1,780 |
|
MGM Resorts International (e) |
| 1,732 |
| — |
| 1,732 |
| 24 |
| — |
| 24 |
|
Royal Caribbean Cruises Ltd. |
| 1,400 |
| — |
| 1,400 |
| 41 |
| — |
| 41 |
|
Sands China Ltd. |
| 28,400 |
| — |
| 28,400 |
| 111 |
| — |
| 111 |
|
Sodexo |
| 1,292 |
| — |
| 1,292 |
| 106 |
| — |
| 106 |
|
Starbucks Corp. |
| 4,216 |
| 1,011 |
| 5,227 |
| 236 |
| 56 |
| 292 |
|
Starwood Hotels & Resorts Worldwide, Inc. |
| 761 |
| 175 |
| 936 |
| 43 |
| 10 |
| 53 |
|
TABCORP Holdings Ltd. |
| 9,646 |
| — |
| 9,646 |
| 27 |
| — |
| 27 |
|
Tim Hortons, Inc. |
| 4,300 |
| — |
| 4,300 |
| 230 |
| — |
| 230 |
|
TUI AG (e) |
| 1,926 |
| — |
| 1,926 |
| 14 |
| — |
| 14 |
|
TUI Travel PLC |
| 15,728 |
| — |
| 15,728 |
| 49 |
| — |
| 49 |
|
Wyndham Worldwide Corp. |
| — |
| 477 |
| 477 |
| — |
| 22 |
| 22 |
|
Wynn Resorts Ltd. |
| 678 |
| 119 |
| 797 |
| 85 |
| 15 |
| 100 |
|
Yum! Brands, Inc. |
| 19,999 |
| 1,638 |
| 21,637 |
| 1,424 |
| 117 |
| 1,541 |
|
|
|
|
|
|
|
|
| 4,811 |
| 430 |
| 5,241 |
|
Household Durables (0.3%) |
|
|
|
|
|
|
|
|
|
|
|
|
|
Electrolux AB, Class B |
| 2,950 |
| — |
| 2,950 |
| 62 |
| — |
| 62 |
|
Harman International Industries, Inc. |
| — |
| 139 |
| 139 |
| — |
| 6 |
| 6 |
|
Husqvarna AB, Class B |
| 5,449 |
| — |
| 5,449 |
| 33 |
| — |
| 33 |
|
Panasonic Corp. |
| 24,200 |
| — |
| 24,200 |
| 222 |
| — |
| 222 |
|
Sekisui House Ltd. |
| 12,000 |
| — |
| 12,000 |
| 118 |
| — |
| 118 |
|
Sharp Corp. |
| 15,000 |
| — |
| 15,000 |
| 109 |
| — |
| 109 |
|
Sony Corp., ADR |
| 13,035 |
| — |
| 13,035 |
| 271 |
| — |
| 271 |
|
Toll Brothers, Inc. (d)(e) |
| 36,561 |
| 3,034 |
| 39,595 |
| 877 |
| 73 |
| 950 |
|
|
|
|
|
|
|
|
| 1,692 |
| 79 |
| 1,771 |
|
Household Products (0.6%) |
|
|
|
|
|
|
|
|
|
|
|
|
|
Clorox Co. (The) |
| 1,229 |
| — |
| 1,229 |
| 84 |
| — |
| 84 |
|
Colgate-Palmolive Co. |
| 4,092 |
| 712 |
| 4,804 |
| 400 |
| 69 |
| 469 |
|
Henkel AG & Co. KGaA |
| 1,808 |
| — |
| 1,808 |
| 113 |
| — |
| 113 |
|
Henkel AG & Co. KGaA, (Preference) |
| 2,044 |
| — |
| 2,044 |
| 150 |
| — |
| 150 |
|
Kimberly-Clark Corp. |
| 3,162 |
| 701 |
| 3,863 |
| 234 |
| 52 |
| 286 |
|
Procter & Gamble Co. (The) |
| 18,617 |
| 4,267 |
| 22,884 |
| 1,251 |
| 287 |
| 1,538 |
|
Reckitt Benckiser Group PLC |
| 6,704 |
| — |
| 6,704 |
| 379 |
| — |
| 379 |
|
Unicharm Corp. |
| 2,400 |
| — |
| 2,400 |
| 127 |
| — |
| 127 |
|
|
|
|
|
|
|
|
| 2,738 |
| 408 |
| 3,146 |
|
Independent Power Producers & Energy Traders (0.1%) |
|
|
|
|
|
|
|
|
|
|
|
|
|
AES Corp. (The) (d)(e) |
| — |
| 1,404 |
| 1,404 |
| — |
| 19 |
| 19 |
|
Electric Power Development Co. Ltd. |
| 2,700 |
| — |
| 2,700 |
| 73 |
| — |
| 73 |
|
NRG Energy, Inc. (e) |
| 22,387 |
| 1,611 |
| 23,998 |
| 351 |
| 25 |
| 376 |
|
TransAlta Corp. |
| 3,400 |
| — |
| 3,400 |
| 64 |
| — |
| 64 |
|
|
|
|
|
|
|
|
| 488 |
| 44 |
| 532 |
|
Security Description |
| Morgan Stanley |
| MSIFT Global |
| Pro Forma |
| Morgan Stanley |
| MSIFT Global |
| Pro Forma |
|
Industrial Conglomerates (1.0%) |
|
|
|
|
|
|
|
|
|
|
|
|
|
3M Co. |
| 1,163 |
| 802 |
| 1,965 |
| 104 |
| 72 |
| 176 |
|
Danaher Corp. (d) |
| 2,986 |
| 1,009 |
| 3,995 |
| 167 |
| 56 |
| 223 |
|
General Electric Co. |
| 71,582 |
| 10,833 |
| 82,415 |
| 1,437 |
| 217 |
| 1,654 |
|
Hankyu Hanshin Holdings, Inc. |
| 31,000 |
| — |
| 31,000 |
| 135 |
| — |
| 135 |
|
Hutchison Whampoa Ltd. |
| 21,000 |
| — |
| 21,000 |
| 210 |
| — |
| 210 |
|
Koninklijke Philips Electronics N.V. |
| 12,069 |
| — |
| 12,069 |
| 245 |
| — |
| 245 |
|
Orkla ASA |
| 9,524 |
| — |
| 9,524 |
| 75 |
| — |
| 75 |
|
Siemens AG, (Registered) |
| 9,791 |
| — |
| 9,791 |
| 987 |
| — |
| 987 |
|
Smiths Group PLC |
| 6,582 |
| — |
| 6,582 |
| 111 |
| — |
| 111 |
|
Tyco International Ltd. |
| 24,069 |
| 1,702 |
| 25,771 |
| 1,352 |
| 96 |
| 1,448 |
|
| �� |
|
|
|
|
|
| 4,823 |
| 441 |
| 5,264 |
|
Information Technology Services (0.8%) |
|
|
|
|
|
|
|
|
|
|
|
|
|
Accenture PLC, Class A |
| 3,293 |
| 82 |
| 3,375 |
| 212 |
| 5 |
| 217 |
|
Automatic Data Processing, Inc. |
| 953 |
| 528 |
| 1,481 |
| 53 |
| 29 |
| 82 |
|
Cap Gemini SA |
| 1,918 |
| — |
| 1,918 |
| 86 |
| — |
| 86 |
|
Cognizant Technology Solutions Corp., Class A (e) |
| 2,280 |
| 421 |
| 2,701 |
| 175 |
| 32 |
| 207 |
|
Computershare Ltd. |
| 6,506 |
| — |
| 6,506 |
| 61 |
| — |
| 61 |
|
Fidelity National Information Services, Inc. |
| — |
| 100 |
| 100 |
| — |
| 3 |
| 3 |
|
Fiserv, Inc. (e) |
| 823 |
| — |
| 823 |
| 57 |
| — |
| 57 |
|
International Business Machines Corp. |
| 11,082 |
| 1,940 |
| 13,022 |
| 2,312 |
| 405 |
| 2,717 |
|
Mastercard, Inc., Class A |
| 644 |
| 123 |
| 767 |
| 271 |
| 52 |
| 323 |
|
NTT Data Corp. |
| 30 |
| — |
| 30 |
| 105 |
| — |
| 105 |
|
Paychex, Inc. |
| 1,397 |
| 450 |
| 1,847 |
| 43 |
| 14 |
| 57 |
|
Visa, Inc., Class A (d) |
| 2,349 |
| 555 |
| 2,904 |
| 277 |
| 66 |
| 343 |
|
Western Union Co. (The) |
| 4,162 |
| 1,290 |
| 5,452 |
| 73 |
| 23 |
| 96 |
|
|
|
|
|
|
|
|
| 3,725 |
| 629 |
| 4,354 |
|
Insurance (2.2%) |
|
|
|
|
|
|
|
|
|
|
|
|
|
Admiral Group PLC |
| 3,778 |
| — |
| 3,778 |
| 72 |
| — |
| 72 |
|
Aflac, Inc. |
| — |
| 471 |
| 471 |
| — |
| 22 |
| 22 |
|
Ageas |
| 30,051 |
| — |
| 30,051 |
| 66 |
| — |
| 66 |
|
AIA Group Ltd. (j) |
| 67,200 |
| — |
| 67,200 |
| 246 |
| — |
| 246 |
|
Allianz SE, (Registered) |
| 5,186 |
| — |
| 5,186 |
| 619 |
| — |
| 619 |
|
Allstate Corp. (The) (d) |
| — |
| 889 |
| 889 |
| — |
| 29 |
| 29 |
|
AMP Ltd. |
| 41,893 |
| — |
| 41,893 |
| 187 |
| — |
| 187 |
|
AON Corp. |
| — |
| 380 |
| 380 |
| — |
| 19 |
| 19 |
|
Assicurazioni Generali SpA |
| 20,105 |
| — |
| 20,105 |
| 312 |
| — |
| 312 |
|
Assurant, Inc. (d) |
| 14,949 |
| 1,261 |
| 16,210 |
| 605 |
| 51 |
| 656 |
|
Aviva PLC |
| 33,991 |
| — |
| 33,991 |
| 180 |
| — |
| 180 |
|
AXA SA |
| 17,841 |
| — |
| 17,841 |
| 296 |
| — |
| 296 |
|
Berkshire Hathaway, Inc., Class B (e) |
| — |
| 989 |
| 989 |
| — |
| 80 |
| 80 |
|
Chubb Corp. (The) |
| 17,909 |
| 1,546 |
| 19,455 |
| 1,238 |
| 107 |
| 1,345 |
|
Fairfax Financial Holdings Ltd. |
| 300 |
| — |
| 300 |
| 121 |
| — |
| 121 |
|
Fidelity National Financial, Inc. (d) |
| 34,542 |
| 2,892 |
| 37,434 |
| 623 |
| 52 |
| 675 |
|
Great-West Lifeco, Inc. |
| 6,200 |
| — |
| 6,200 |
| 153 |
| — |
| 153 |
|
Hartford Financial Services Group, Inc. |
| — |
| 685 |
| 685 |
| — |
| 14 |
| 14 |
|
Insurance Australia Group Ltd. |
| 30,701 |
| — |
| 30,701 |
| 108 |
| — |
| 108 |
|
Intact Financial Corp. |
| 1,900 |
| — |
| 1,900 |
| 114 |
| — |
| 114 |
|
Legal & General Group PLC |
| 68,276 |
| — |
| 68,276 |
| 143 |
| — |
| 143 |
|
Lincoln National Corp. (d) |
| 19,355 |
| 1,593 |
| 20,948 |
| 510 |
| 42 |
| 552 |
|
Loews Corp. |
| — |
| 737 |
| 737 |
| — |
| 29 |
| 29 |
|
Manulife Financial Corp. |
| 24,700 |
| — |
| 24,700 |
| 335 |
| — |
| 335 |
|
Marsh & McLennan Cos., Inc. (d) |
| — |
| 737 |
| 737 |
| — |
| 24 |
| 24 |
|
MetLife, Inc. (d) |
| — |
| 1,293 |
| 1,293 |
| — |
| 48 |
| 48 |
|
MS&AD Insurance Group Holdings |
| 5,000 |
| — |
| 5,000 |
| 103 |
| — |
| 103 |
|
Muenchener Rueckversicherungs AG, (Registered) |
| 2,202 |
| — |
| 2,202 |
| 332 |
| — |
| 332 |
|
Old Mutual PLC |
| 92,926 |
| — |
| 92,926 |
| 236 |
| — |
| 236 |
|
PartnerRe Ltd. |
| 7,680 |
| 652 |
| 8,332 |
| 521 |
| 44 |
| 565 |
|
Power Corp. of Canada |
| 5,500 |
| — |
| 5,500 |
| 146 |
| — |
| 146 |
|
Power Financial Corp. |
| 5,200 |
| — |
| 5,200 |
| 153 |
| — |
| 153 |
|
Principal Financial Group, Inc. |
| 17,910 |
| 1,490 |
| 19,400 |
| 529 |
| 44 |
| 573 |
|
Progressive Corp. (The) (d) |
| — |
| 713 |
| 713 |
| — |
| 17 |
| 17 |
|
Prudential Financial, Inc. (d) |
| — |
| 380 |
| 380 |
| — |
| 24 |
| 24 |
|
Prudential PLC |
| 30,382 |
| — |
| 30,382 |
| 363 |
| — |
| 363 |
|
QBE Insurance Group Ltd. |
| 18,269 |
| — |
| 18,269 |
| 268 |
| — |
| 268 |
|
RSA Insurance Group PLC |
| 84,310 |
| — |
| 84,310 |
| 141 |
| — |
| 141 |
|
Sampo Oyj, Class A |
| 3,785 |
| — |
| 3,785 |
| 109 |
| — |
| 109 |
|
Standard Life PLC |
| 18,540 |
| — |
| 18,540 |
| 68 |
| — |
| 68 |
|
Sun Life Financial, Inc. |
| 8,000 |
| — |
| 8,000 |
| 190 |
| — |
| 190 |
|
Suncorp Group Ltd. |
| 15,816 |
| — |
| 15,816 |
| 138 |
| — |
| 138 |
|
Swiss Re AG (e) |
| 836 |
| — |
| 836 |
| 53 |
| — |
| 53 |
|
Security Description |
| Morgan Stanley |
| MSIFT Global |
| Pro Forma |
| Morgan Stanley |
| MSIFT Global |
| Pro Forma |
|
T&D Holdings, Inc. |
| 8,400 |
| — |
| 8,400 |
| 97 |
| — |
| 97 |
|
Tokio Marine Holdings, Inc. |
| 6,200 |
| — |
| 6,200 |
| 170 |
| — |
| 170 |
|
Travelers Cos., Inc. (The) |
| — |
| 685 |
| 685 |
| — |
| 41 |
| 41 |
|
Unum Group (d) |
| 29,097 |
| 2,400 |
| 31,497 |
| 712 |
| 59 |
| 771 |
|
Zurich Financial Services AG (e) |
| 2,309 |
| — |
| 2,309 |
| 621 |
| — |
| 621 |
|
|
|
|
|
|
|
|
| 10,878 |
| 746 |
| 11,624 |
|
Internet & Catalog Retail (0.2%) |
|
|
|
|
|
|
|
|
|
|
|
|
|
Amazon.com, Inc. (e) |
| 1,224 |
| 446 |
| 1,670 |
| 248 |
| 90 |
| 338 |
|
Expedia, Inc. (d) |
| 306 |
| 201 |
| 507 |
| 10 |
| 7 |
| 17 |
|
NetFlix, Inc. (d)(e) |
| 106 |
| 100 |
| 206 |
| 12 |
| 11 |
| 23 |
|
Priceline.com, Inc. (d)(e) |
| 303 |
| 37 |
| 340 |
| 217 |
| 27 |
| 244 |
|
Rakuten, Inc. |
| 133 |
| — |
| 133 |
| 139 |
| — |
| 139 |
|
TripAdvisor, Inc. (d)(e) |
| 306 |
| 201 |
| 507 |
| 11 |
| 7 |
| 18 |
|
|
|
|
|
|
|
|
| 637 |
| 142 |
| 779 |
|
Internet Software & Services (0.4%) |
|
|
|
|
|
|
|
|
|
|
|
|
|
Akamai Technologies, Inc. (e) |
| 1,337 |
| — |
| 1,337 |
| 49 |
|
|
| 49 |
|
eBay, Inc. (e) |
| 5,884 |
| 1,582 |
| 7,466 |
| 217 |
| 58 |
| 275 |
|
Google, Inc., Class A (e) |
| 1,238 |
| 344 |
| 1,582 |
| 794 |
| 221 |
| 1,015 |
|
Yahoo! Japan Corp. |
| 276 |
| — |
| 276 |
| 89 |
| — |
| 89 |
|
Yahoo!, Inc. (e) |
| 35,077 |
| 3,657 |
| 38,734 |
| 534 |
| 56 |
| 590 |
|
|
|
|
|
|
|
|
| 1,683 |
| 335 |
| 2,018 |
|
Leisure Equipment & Products (0.0%) |
|
|
|
|
|
|
|
|
|
|
|
|
|
Hasbro, Inc. (d) |
| — |
| 358 |
| 358 |
| — |
| 13 |
| 13 |
|
Mattel, Inc. |
| 1,000 |
| 477 |
| 1,477 |
| 34 |
| 16 |
| 50 |
|
Nikon Corp. |
| 4,600 |
| — |
| 4,600 |
| 140 |
| — |
| 140 |
|
|
|
|
|
|
|
|
| 174 |
| 29 |
| 203 |
|
Life Sciences Tools & Services (0.1%) |
|
|
|
|
|
|
|
|
|
|
|
|
|
Agilent Technologies, Inc. (d) |
| 2,099 |
| 153 |
| 2,252 |
| 93 |
| 7 |
| 100 |
|
Illumina, Inc. (e) |
| 700 |
| — |
| 700 |
| 37 |
| — |
| 37 |
|
Life Technologies Corp. (e) |
| 900 |
| 265 |
| 1,165 |
| 44 |
| 13 |
| 57 |
|
Lonza Group AG, (Registered) (e) |
| 481 |
| — |
| 481 |
| 25 |
| — |
| 25 |
|
QIAGEN N.V. (e) |
| 3,223 |
| — |
| 3,223 |
| 50 |
| — |
| 50 |
|
Thermo Fisher Scientific, Inc. |
| 2,065 |
| 818 |
| 2,883 |
| 116 |
| 46 |
| 162 |
|
Waters Corp. (e) |
| 400 |
| — |
| 400 |
| 37 |
| — |
| 37 |
|
|
|
|
|
|
|
|
| 402 |
| 66 |
| 468 |
|
Machinery (1.1%) |
|
|
|
|
|
|
|
|
|
|
|
|
|
Atlas Copco AB, Class A |
| 10,488 |
| — |
| 10,488 |
| 254 |
| — |
| 254 |
|
Atlas Copco AB, Class B |
| 7,581 |
| — |
| 7,581 |
| 163 |
| — |
| 163 |
|
Caterpillar, Inc. |
| 3,836 |
| 1,340 |
| 5,176 |
| 409 |
| 143 |
| 552 |
|
Cummins, Inc. (d) |
| 1,165 |
| 458 |
| 1,623 |
| 140 |
| 55 |
| 195 |
|
Deere & Co. |
| 2,434 |
| 551 |
| 2,985 |
| 197 |
| 44 |
| 241 |
|
Dover Corp. |
| 311 |
| — |
| 311 |
| 20 |
| — |
| 20 |
|
Eaton Corp. |
| 1,194 |
| 300 |
| 1,494 |
| 59 |
| 15 |
| 74 |
|
Fanuc Corp. |
| 2,400 |
| — |
| 2,400 |
| 426 |
| — |
| 426 |
|
Fiat Industrial SpA (e) |
| 5,967 |
| — |
| 5,967 |
| 64 |
| — |
| 64 |
|
Flowserve Corp. |
| 287 |
| — |
| 287 |
| 33 |
| — |
| 33 |
|
Illinois Tool Works, Inc. (d) |
| 19,548 |
| 1,867 |
| 21,415 |
| 1,117 |
| 107 |
| 1,224 |
|
Ingersoll-Rand PLC |
| 971 |
| — |
| 971 |
| 40 |
| — |
| 40 |
|
ITT Corp. (d) |
| — |
| 297 |
| 297 |
| — |
| 7 |
| 7 |
|
Japan Steel Works Ltd. (The) |
| 5,000 |
| — |
| 5,000 |
| 34 |
| — |
| 34 |
|
Joy Global, Inc. |
| 419 |
| — |
| 419 |
| 31 |
| — |
| 31 |
|
Kawasaki Heavy Industries Ltd. |
| 38,000 |
| — |
| 38,000 |
| 116 |
| — |
| 116 |
|
Komatsu Ltd. |
| 13,000 |
| — |
| 13,000 |
| 371 |
| — |
| 371 |
|
Kone Oyj, Class B |
| 2,681 |
| — |
| 2,681 |
| 149 |
| — |
| 149 |
|
Kubota Corp. |
| 17,000 |
| — |
| 17,000 |
| 163 |
| — |
| 163 |
|
Makita Corp. |
| 1,600 |
| — |
| 1,600 |
| 64 |
| — |
| 64 |
|
Mitsubishi Heavy Industries Ltd. |
| 47,000 |
| — |
| 47,000 |
| 228 |
| — |
| 228 |
|
NGK Insulators Ltd. |
| 5,000 |
| — |
| 5,000 |
| 71 |
| — |
| 71 |
|
NSK Ltd. |
| 10,000 |
| — |
| 10,000 |
| 77 |
| — |
| 77 |
|
PACCAR, Inc. |
| 2,224 |
| 255 |
| 2,479 |
| 104 |
| 12 |
| 116 |
|
Pall Corp. |
| 693 |
| — |
| 693 |
| 41 |
| — |
| 41 |
|
Sandvik AB |
| 16,163 |
| — |
| 16,163 |
| 233 |
| — |
| 233 |
|
Scania AB, Class B |
| 5,471 |
| — |
| 5,471 |
| 114 |
| — |
| 114 |
|
SKF AB, Class B |
| 6,655 |
| — |
| 6,655 |
| 162 |
| — |
| 162 |
|
SMC Corp. |
| 800 |
| — |
| 800 |
| 127 |
| — |
| 127 |
|
Stanley Black & Decker, Inc. |
| 300 |
| 139 |
| 439 |
| 23 |
| 11 |
| 34 |
|
Vallourec SA |
| 2,554 |
| — |
| 2,554 |
| 162 |
| — |
| 162 |
|
Volvo AB, Class B |
| 8,741 |
| — |
| 8,741 |
| 127 |
| — |
| 127 |
|
Xylem, Inc. |
| 1,144 |
| 594 |
| 1,738 |
| 32 |
| 16 |
| 48 |
|
|
|
|
|
|
|
|
| 5,351 |
| 410 |
| 5,761 |
|
Marine (0.1%) |
|
|
|
|
|
|
|
|
|
|
|
|
|
AP Moller - Maersk A/S |
| 5 |
| — |
| 5 |
| 37 |
| — |
| 37 |
|
Security Description |
| Morgan Stanley |
| MSIFT Global |
| Pro Forma |
| Morgan Stanley |
| MSIFT Global |
| Pro Forma |
|
AP Moller - Maersk A/S, Series B |
| 10 |
| — |
| 10 |
| 77 |
| — |
| 77 |
|
Mitsui OSK Lines Ltd. |
| 18,000 |
| — |
| 18,000 |
| 78 |
| — |
| 78 |
|
Nippon Yusen KK |
| 34,000 |
| — |
| 34,000 |
| 107 |
| — |
| 107 |
|
Kuehne & Nagel International AG, (Registered) |
| 673 |
| — |
| 673 |
| 91 |
| — |
| 91 |
|
|
|
|
|
|
|
|
| 390 |
| — |
| 390 |
|
Media (1.2%) |
|
|
|
|
|
|
|
|
|
|
|
|
|
AMC Networks, Inc., Class A (e) |
| — |
| 119 |
| 119 |
| — |
| 5 |
| 5 |
|
Axel Springer AG |
| 300 |
| — |
| 300 |
| 15 |
| — |
| 15 |
|
British Sky Broadcasting Group PLC |
| 8,709 |
| — |
| 8,709 |
| 94 |
| — |
| 94 |
|
Cablevision Systems Corp. (d) |
| 2,651 |
| 477 |
| 3,128 |
| 39 |
| 7 |
| 46 |
|
CBS Corp., Class B |
| 5,878 |
| 768 |
| 6,646 |
| 199 |
| 26 |
| 225 |
|
Comcast Corp., Class A |
| 10,072 |
| 4,271 |
| 14,343 |
| 302 |
| 128 |
| 430 |
|
Comcast Corp., Special Class A |
| 3,845 |
| — |
| 3,845 |
| 113 |
| — |
| 113 |
|
Dentsu, Inc. |
| 3,200 |
| — |
| 3,200 |
| 102 |
| — |
| 102 |
|
DIRECTV, Class A (e) |
| 7,134 |
| 1,303 |
| 8,437 |
| 352 |
| 64 |
| 416 |
|
Discovery Communications, Inc. (d)(e) |
| 1,176 |
| 377 |
| 1,553 |
| 60 |
| 19 |
| 79 |
|
Discovery Communications, Inc., Class C (e) |
| 1,229 |
| — |
| 1,229 |
| 58 |
| — |
| 58 |
|
Eutelsat Communications SA |
| 799 |
| — |
| 799 |
| 30 |
| — |
| 30 |
|
Fairfax Media Ltd. |
| 39,248 |
| — |
| 39,248 |
| 29 |
| — |
| 29 |
|
Gannett Co., Inc. (d) |
| — |
| 600 |
| 600 |
| — |
| 9 |
| 9 |
|
Interpublic Group of Cos., Inc. (The) |
| 4,650 |
| 835 |
| 5,485 |
| 53 |
| 10 |
| 63 |
|
ITV PLC |
| 32,244 |
| — |
| 32,244 |
| 46 |
| — |
| 46 |
|
JCDecaux SA (e) |
| 651 |
| — |
| 651 |
| 20 |
| — |
| 20 |
|
Kabel Deutschland Holding AG (e) |
| 474 |
| — |
| 474 |
| 29 |
| — |
| 29 |
|
Liberty Global, Inc., Series A (e) |
| 1,166 |
| — |
| 1,166 |
| 58 |
| — |
| 58 |
|
Liberty Global, Inc., Series C (e) |
| 1,140 |
| — |
| 1,140 |
| 55 |
| — |
| 55 |
|
McGraw-Hill Cos., Inc. (The) |
| 2,859 |
| 465 |
| 3,324 |
| 139 |
| 23 |
| 162 |
|
Modern Times Group AB, Class B |
| 443 |
| — |
| 443 |
| 24 |
| — |
| 24 |
|
News Corp., Class A |
| 13,607 |
| 2,959 |
| 16,566 |
| 268 |
| 58 |
| 326 |
|
News Corp., Class B |
| 3,316 |
| — |
| 3,316 |
| 66 |
| — |
| 66 |
|
Omnicom Group, Inc. (d) |
| 1,839 |
| 437 |
| 2,276 |
| 93 |
| 22 |
| 115 |
|
Pearson PLC |
| 12,346 |
| — |
| 12,346 |
| 230 |
| — |
| 230 |
|
ProSiebenSat.1 Media AG |
| 686 |
| — |
| 686 |
| 18 |
| — |
| 18 |
|
Publicis Groupe SA |
| 1,047 |
| — |
| 1,047 |
| 58 |
| — |
| 58 |
|
Reed Elsevier PLC |
| 3,587 |
| — |
| 3,587 |
| 32 |
| — |
| 32 |
|
Scripps Networks Interactive, Inc., Class A (d) |
| 632 |
| 100 |
| 732 |
| 31 |
| 5 |
| 36 |
|
SES SA |
| 2,416 |
| — |
| 2,416 |
| 60 |
| — |
| 60 |
|
Shaw Communications, Inc. |
| 5,200 |
| — |
| 5,200 |
| 110 |
| — |
| 110 |
|
Societe Television Francaise 1 |
| 1,176 |
| — |
| 1,176 |
| 14 |
| — |
| 14 |
|
Thomson Reuters Corp. |
| 5,100 |
| — |
| 5,100 |
| 147 |
| — |
| 147 |
|
Time Warner Cable, Inc. (d) |
| 2,748 |
| 546 |
| 3,294 |
| 224 |
| 45 |
| 269 |
|
Time Warner, Inc. |
| 35,850 |
| 3,039 |
| 38,889 |
| 1,353 |
| 115 |
| 1,468 |
|
Viacom, Inc., Class B |
| 3,043 |
| 1,020 |
| 4,063 |
| 144 |
| 48 |
| 192 |
|
Virgin Media, Inc. |
| 2,494 |
| — |
| 2,494 |
| 62 |
| — |
| 62 |
|
Walt Disney Co. (The) (d) |
| 8,678 |
| 2,516 |
| 11,194 |
| 380 |
| 110 |
| 490 |
|
WPP PLC |
| 28,419 |
| — |
| 28,419 |
| 388 |
| — |
| 388 |
|
|
|
|
|
|
|
|
| 5,495 |
| 694 |
| 6,189 |
|
Metals & Mining (1.8%) |
|
|
|
|
|
|
|
|
|
|
|
|
|
Agnico-Eagle Mines Ltd. |
| 2,300 |
| — |
| 2,300 |
| 77 |
| — |
| 77 |
|
Alcoa, Inc. (d) |
| 3,482 |
| 1,129 |
| 4,611 |
| 35 |
| 11 |
| 46 |
|
Allegheny Technologies, Inc. |
| 402 |
| 200 |
| 602 |
| 17 |
| 8 |
| 25 |
|
Alumina Ltd. |
| 44,558 |
| — |
| 44,558 |
| 57 |
| — |
| 57 |
|
Anglo American PLC |
| 11,920 |
| — |
| 11,920 |
| 446 |
| — |
| 446 |
|
Antofagasta PLC |
| 2,716 |
| — |
| 2,716 |
| 50 |
| — |
| 50 |
|
ArcelorMittal |
| 12,867 |
| — |
| 12,867 |
| 246 |
| — |
| 246 |
|
Barrick Gold Corp. |
| 13,100 |
| — |
| 13,100 |
| 569 |
| — |
| 569 |
|
BHP Billiton Ltd. |
| 40,502 |
| — |
| 40,502 |
| 1,452 |
| — |
| 1,452 |
|
BHP Billiton PLC |
| 20,282 |
| — |
| 20,282 |
| 619 |
| — |
| 619 |
|
BlueScope Steel Ltd. (e) |
| 26,754 |
| — |
| 26,754 |
| 11 |
| — |
| 11 |
|
Cliffs Natural Resources, Inc. |
| 886 |
| 139 |
| 1,025 |
| 61 |
| 10 |
| 71 |
|
Eldorado Gold Corp. |
| 7,400 |
| — |
| 7,400 |
| 102 |
| — |
| 102 |
|
First Quantum Minerals Ltd. |
| 7,000 |
| — |
| 7,000 |
| 133 |
| — |
| 133 |
|
Fortescue Metals Group Ltd. |
| 16,804 |
| — |
| 16,804 |
| 101 |
| — |
| 101 |
|
Freeport-McMoRan Copper & Gold, Inc. |
| 1,747 |
| 1,048 |
| 2,795 |
| 66 |
| 40 |
| 106 |
|
Goldcorp, Inc. |
| 9,800 |
| — |
| 9,800 |
| 442 |
| — |
| 442 |
|
JFE Holdings, Inc. |
| 5,800 |
| — |
| 5,800 |
| 125 |
| — |
| 125 |
|
Kazakhmys PLC |
| 2,888 |
| — |
| 2,888 |
| 42 |
| — |
| 42 |
|
Kinross Gold Corp. |
| 11,900 |
| — |
| 11,900 |
| 117 |
| — |
| 117 |
|
Kobe Steel Ltd. |
| 70,000 |
| — |
| 70,000 |
| 113 |
| — |
| 113 |
|
Lonmin PLC |
| 1,989 |
| — |
| 1,989 |
| 33 |
| — |
| 33 |
|
Molycorp, Inc. (e) |
| 10,684 |
| 867 |
| 11,551 |
| 361 |
| 29 |
| 390 |
|
Newcrest Mining Ltd. |
| 5,772 |
| — |
| 5,772 |
| 177 |
| — |
| 177 |
|
Security Description |
| Morgan Stanley |
| MSIFT Global |
| Pro Forma |
| Morgan Stanley |
| MSIFT Global |
| Pro Forma |
|
Newmont Mining Corp. |
| 2,283 |
| 443 |
| 2,726 |
| 117 |
| 23 |
| 140 |
|
Nippon Steel Corp. |
| 71,000 |
| — |
| 71,000 |
| 195 |
| — |
| 195 |
|
Norsk Hydro ASA |
| 12,763 |
| — |
| 12,763 |
| 69 |
| — |
| 69 |
|
Nucor Corp. |
| 631 |
| 187 |
| 818 |
| 27 |
| 8 |
| 35 |
|
OneSteel Ltd. |
| 17,194 |
| — |
| 17,194 |
| 22 |
| — |
| 22 |
|
Randgold Resources Ltd. |
| 976 |
| — |
| 976 |
| 84 |
| — |
| 84 |
|
Rio Tinto Ltd. |
| 5,339 |
| — |
| 5,339 |
| 362 |
| — |
| 362 |
|
Rio Tinto PLC |
| 13,195 |
| — |
| 13,195 |
| 727 |
| — |
| 727 |
|
Silver Wheaton Corp. |
| 4,800 |
| — |
| 4,800 |
| 159 |
| — |
| 159 |
|
Steel Dynamics, Inc. (d) |
| 58,542 |
| 4,992 |
| 63,534 |
| 851 |
| 73 |
| 924 |
|
Sumitomo Metal Industries Ltd. |
| 49,000 |
| — |
| 49,000 |
| 99 |
| — |
| 99 |
|
Sumitomo Metal Mining Co., Ltd. |
| 8,000 |
| — |
| 8,000 |
| 112 |
| — |
| 112 |
|
Teck Resources Ltd. |
| 6,500 |
| — |
| 6,500 |
| 232 |
| — |
| 232 |
|
ThyssenKrupp AG |
| 6,637 |
| — |
| 6,637 |
| 165 |
| — |
| 165 |
|
United States Steel Corp. (d) |
| 408 |
| 100 |
| 508 |
| 12 |
| 3 |
| 15 |
|
Vedanta Resources PLC |
| 1,623 |
| — |
| 1,623 |
| 32 |
| — |
| 32 |
|
Voestalpine AG |
| 1,329 |
| — |
| 1,329 |
| 45 |
| — |
| 45 |
|
Xstrata PLC |
| 19,195 |
| — |
| 19,195 |
| 328 |
| — |
| 328 |
|
Yamana Gold, Inc. |
| 10,100 |
| — |
| 10,100 |
| 158 |
| — |
| 158 |
|
|
|
|
|
|
|
|
| 9,248 |
| 205 |
| 9,453 |
|
Multi-Utilities (0.7%) |
|
|
|
|
|
|
|
|
|
|
|
|
|
AGL Energy Ltd. |
| 5,722 |
| — |
| 5,722 |
| 87 |
| — |
| 87 |
|
Ameren Corp. |
| 2,453 |
| — |
| 2,453 |
| 80 |
| — |
| 80 |
|
CenterPoint Energy, Inc. (d) |
| 4,645 |
| 58 |
| 4,703 |
| 92 |
| 1 |
| 93 |
|
Centrica PLC |
| 51,376 |
| — |
| 51,376 |
| 260 |
| — |
| 260 |
|
Consolidated Edison, Inc. |
| 2,275 |
| 405 |
| 2,680 |
| 133 |
| 24 |
| 157 |
|
Dominion Resources, Inc. (d) |
| 4,114 |
| 1,934 |
| 6,048 |
| 211 |
| 99 |
| 310 |
|
DTE Energy Co. |
| 1,578 |
| 58 |
| 1,636 |
| 87 |
| 3 |
| 90 |
|
GDF Suez |
| 12,930 |
| — |
| 12,930 |
| 334 |
| — |
| 334 |
|
Integrys Energy Group, Inc. |
| 17,449 |
| 1,062 |
| 18,511 |
| 925 |
| 56 |
| 981 |
|
National Grid PLC |
| 32,023 |
| — |
| 32,023 |
| 323 |
| — |
| 323 |
|
NiSource, Inc. (d) |
| — |
| 58 |
| 58 |
| — |
| 1 |
| 1 |
|
PG&E Corp. (d) |
| 2,890 |
| 735 |
| 3,625 |
| 125 |
| 32 |
| 157 |
|
Public Service Enterprise Group, Inc. |
| 3,937 |
| 769 |
| 4,706 |
| 121 |
| 24 |
| 145 |
|
RWE AG |
| 4,297 |
| — |
| 4,297 |
| 205 |
| — |
| 205 |
|
Sempra Energy |
| 2,098 |
| 405 |
| 2,503 |
| 126 |
| 24 |
| 150 |
|
Suez Environnement Co. |
| 4,193 |
| — |
| 4,193 |
| 64 |
| — |
| 64 |
|
Veolia Environnement SA |
| 5,613 |
| — |
| 5,613 |
| 93 |
| — |
| 93 |
|
Wisconsin Energy Corp. (d) |
| 2,542 |
| 455 |
| 2,997 |
| 89 |
| 16 |
| 105 |
|
Xcel Energy, Inc. |
| 3,765 |
| 769 |
| 4,534 |
| 100 |
| 21 |
| 121 |
|
|
|
|
|
|
|
|
| 3,455 |
| 301 |
| 3,756 |
|
Multiline Retail (0.2%) |
|
|
|
|
|
|
|
|
|
|
|
|
|
Dollar General Corp. (e) |
| 274 |
| — |
| 274 |
| 13 |
| — |
| 13 |
|
Dollar Tree, Inc. (e) |
| 274 |
| — |
| 274 |
| 26 |
| — |
| 26 |
|
Family Dollar Stores, Inc. |
| 274 |
| 200 |
| 474 |
| 17 |
| 12 |
| 29 |
|
Isetan Mitsukoshi Holdings Ltd. |
| 5,400 |
| — |
| 5,400 |
| 63 |
| — |
| 63 |
|
JC Penney Co., Inc. (d) |
| — |
| 400 |
| 400 |
| — |
| 14 |
| 14 |
|
Kohl’s Corp. |
| 1,678 |
| 295 |
| 1,973 |
| 84 |
| 15 |
| 99 |
|
Macy’s, Inc. |
| — |
| 446 |
| 446 |
| — |
| 18 |
| 18 |
|
Marks & Spencer Group PLC |
| 10,082 |
| — |
| 10,082 |
| 61 |
| — |
| 61 |
|
Next PLC |
| 2,073 |
| — |
| 2,073 |
| 99 |
| — |
| 99 |
|
Nordstrom, Inc. |
| 512 |
| 161 |
| 673 |
| 29 |
| 9 |
| 38 |
|
PPR |
| 1,434 |
| — |
| 1,434 |
| 247 |
| — |
| 247 |
|
Target Corp. |
| 1,961 |
| 904 |
| 2,865 |
| 114 |
| 53 |
| 167 |
|
|
| 23,962 |
| 2,406 |
| 26,368 |
| 753 |
| 121 |
| 874 |
|
Office Electronics (0.2%) |
|
|
|
|
|
|
|
|
|
|
|
|
|
Canon, Inc. |
| 13,800 |
| — |
| 13,800 |
| 652 |
| — |
| 652 |
|
Konica Minolta Holdings, Inc. |
| 5,000 |
| — |
| 5,000 |
| 44 |
| — |
| 44 |
|
Ricoh Co., Ltd. |
| 11,000 |
| — |
| 11,000 |
| 107 |
| — |
| 107 |
|
Xerox Corp. |
| 4,000 |
| 1,624 |
| 5,624 |
| 32 |
| 13 |
| 45 |
|
|
|
|
|
|
|
|
| 835 |
| 13 |
| 848 |
|
Oil, Gas & Consumable Fuels (4.7%) |
|
|
|
|
|
|
|
|
|
|
|
|
|
Alpha Natural Resources, Inc. (e) |
| 738 |
| — |
| 738 |
| 11 |
| — |
| 11 |
|
Anadarko Petroleum Corp. |
| 17,041 |
| 1,850 |
| 18,891 |
| 1,335 |
| 145 |
| 1,480 |
|
Apache Corp. |
| 2,144 |
| 704 |
| 2,848 |
| 215 |
| 71 |
| 286 |
|
Arch Coal, Inc. |
| 843 |
| — |
| 843 |
| 9 |
| — |
| 9 |
|
BG Group PLC |
| 31,796 |
| — |
| 31,796 |
| 736 |
| — |
| 736 |
|
BP PLC |
| 185,959 |
| — |
| 185,959 |
| 1,376 |
| — |
| 1,376 |
|
Cairn Energy PLC (e) |
| 6,451 |
| — |
| 6,451 |
| 33 |
| — |
| 33 |
|
Cameco Corp. |
| 5,600 |
| — |
| 5,600 |
| 120 |
| — |
| 120 |
|
Canadian Natural Resources Ltd. |
| 14,400 |
| — |
| 14,400 |
| 477 |
| — |
| 477 |
|
Canadian Oil Sands Ltd. |
| 3,500 |
| — |
| 3,500 |
| 74 |
| — |
| 74 |
|
Security Description |
| Morgan Stanley |
| MSIFT Global |
| Pro Forma |
| Morgan Stanley |
| MSIFT Global |
| Pro Forma |
|
Cenovus Energy, Inc. |
| 10,000 |
| — |
| 10,000 |
| 360 |
| — |
| 360 |
|
Chesapeake Energy Corp. (d) |
| 25,814 |
| 3,206 |
| 29,020 |
| 598 |
| 74 |
| 672 |
|
Chevron Corp. |
| 19,732 |
| 1,993 |
| 21,725 |
| 2,116 |
| 214 |
| 2,330 |
|
Concho Resources, Inc. (e) |
| 548 |
| — |
| 548 |
| 56 |
| — |
| 56 |
|
ConocoPhillips |
| 22,157 |
| 1,969 |
| 24,126 |
| 1,684 |
| 150 |
| 1,834 |
|
Consol Energy, Inc. (d) |
| 1,194 |
| 753 |
| 1,947 |
| 41 |
| 26 |
| 67 |
|
Crescent Point Energy Corp. |
| 2,700 |
| — |
| 2,700 |
| 116 |
| — |
| 116 |
|
Denbury Resources, Inc. (e) |
| — |
| 1,251 |
| 1,251 |
| — |
| 23 |
| 23 |
|
Devon Energy Corp. |
| 2,004 |
| 703 |
| 2,707 |
| 143 |
| 50 |
| 193 |
|
El Paso Corp. |
| 4,488 |
| 1,270 |
| 5,758 |
| 133 |
| 38 |
| 171 |
|
Enbridge, Inc. |
| 11,600 |
| — |
| 11,600 |
| 451 |
| — |
| 451 |
|
Encana Corp. |
| 10,500 |
| — |
| 10,500 |
| 206 |
| — |
| 206 |
|
Eni SpA |
| 31,745 |
| — |
| 31,745 |
| 745 |
| — |
| 745 |
|
EOG Resources, Inc. |
| 1,720 |
| 468 |
| 2,188 |
| 191 |
| 52 |
| 243 |
|
EQT Corp. |
| 908 |
| — |
| 908 |
| 44 |
| — |
| 44 |
|
Exxon Mobil Corp. |
| 35,385 |
| 3,901 |
| 39,286 |
| 3,069 |
| 338 |
| 3,407 |
|
Galp Energia SGPS SA, Class B |
| 2,866 |
| — |
| 2,866 |
| 47 |
| — |
| 47 |
|
Hess Corp. |
| 11,982 |
| 1,010 |
| 12,992 |
| 706 |
| 60 |
| 766 |
|
Husky Energy, Inc. |
| 3,600 |
| — |
| 3,600 |
| 92 |
| — |
| 92 |
|
Imperial Oil Ltd. |
| 3,500 |
| — |
| 3,500 |
| 159 |
| — |
| 159 |
|
Inpex Corp. |
| 12 |
| — |
| 12 |
| 81 |
| — |
| 81 |
|
Marathon Oil Corp. |
| 3,640 |
| 700 |
| 4,340 |
| 115 |
| 22 |
| 137 |
|
Marathon Petroleum Corp. |
| 1,823 |
| 450 |
| 2,273 |
| 79 |
| 19 |
| 98 |
|
Murphy Oil Corp. |
| 799 |
| 255 |
| 1,054 |
| 45 |
| 14 |
| 59 |
|
Newfield Exploration Co. (e) |
| 510 |
| 377 |
| 887 |
| 18 |
| 13 |
| 31 |
|
Nexen, Inc. |
| 8,200 |
| — |
| 8,200 |
| 150 |
| — |
| 150 |
|
Noble Energy, Inc. |
| 1,111 |
| 257 |
| 1,368 |
| 109 |
| 25 |
| 134 |
|
Occidental Petroleum Corp. |
| 6,522 |
| 1,179 |
| 7,701 |
| 621 |
| 112 |
| 733 |
|
Origin Energy Ltd. |
| 13,338 |
| — |
| 13,338 |
| 184 |
| — |
| 184 |
|
Peabody Energy Corp. |
| 2,184 |
| 761 |
| 2,945 |
| 63 |
| 22 |
| 85 |
|
Penn West Petroleum Ltd. |
| 5,700 |
| — |
| 5,700 |
| 111 |
| — |
| 111 |
|
Petrobank Energy & Resources Ltd. (e) |
| 1,400 |
| — |
| 1,400 |
| 22 |
| — |
| 22 |
|
Petrominerales Ltd. |
| 859 |
| — |
| 859 |
| 16 |
| — |
| 16 |
|
Pioneer Natural Resources Co. |
| 683 |
| 377 |
| 1,060 |
| 76 |
| 42 |
| 118 |
|
QEP Resources, Inc. |
| 1,124 |
| — |
| 1,124 |
| 34 |
| — |
| 34 |
|
Range Resources Corp. |
| 1,224 |
| — |
| 1,224 |
| 71 |
| — |
| 71 |
|
Repsol YPF SA |
| 3,053 |
| — |
| 3,053 |
| 77 |
| — |
| 77 |
|
Royal Dutch Shell PLC, Class A |
| 35,351 |
| — |
| 35,351 |
| 1,235 |
| — |
| 1,235 |
|
Royal Dutch Shell PLC, Class B |
| 26,772 |
| — |
| 26,772 |
| 942 |
| — |
| 942 |
|
Santos Ltd. |
| 11,359 |
| — |
| 11,359 |
| 168 |
| — |
| 168 |
|
Southwestern Energy Co. (e) |
| 2,652 |
| 1,090 |
| 3,742 |
| 81 |
| 33 |
| 114 |
|
Spectra Energy Corp. (d) |
| 4,166 |
| 754 |
| 4,920 |
| 131 |
| 24 |
| 155 |
|
Statoil ASA |
| 12,789 |
| — |
| 12,789 |
| 347 |
| — |
| 347 |
|
Suncor Energy, Inc. |
| 19,800 |
| — |
| 19,800 |
| 647 |
| — |
| 647 |
|
Talisman Energy, Inc. |
| 14,200 |
| — |
| 14,200 |
| 179 |
| — |
| 179 |
|
Total SA |
| 22,144 |
| — |
| 22,144 |
| 1,129 |
| — |
| 1,129 |
|
TransCanada Corp. |
| 8,800 |
| — |
| 8,800 |
| 378 |
| — |
| 378 |
|
Tullow Oil PLC |
| 8,594 |
| — |
| 8,594 |
| 210 |
| — |
| 210 |
|
Ultra Petroleum Corp. (e) |
| 1,336 |
| — |
| 1,336 |
| 30 |
| — |
| 30 |
|
Valero Energy Corp. |
| 3,104 |
| 649 |
| 3,753 |
| 80 |
| 17 |
| 97 |
|
Williams Cos., Inc. (The) |
| 7,502 |
| 779 |
| 8,281 |
| 231 |
| 24 |
| 255 |
|
Woodside Petroleum Ltd. |
| 7,351 |
| — |
| 7,351 |
| 265 |
| — |
| 265 |
|
WPX Energy, Inc. (e) |
| 3,456 |
| 326 |
| 3,782 |
| 62 |
| 6 |
| 68 |
|
|
|
|
|
|
|
|
| 23,330 |
| 1,614 |
| 24,944 |
|
Paper & Forest Products (0.2%) |
|
|
|
|
|
|
|
|
|
|
|
|
|
International Paper Co. |
| 455 |
| 425 |
| 880 |
| 16 |
| 15 |
| 31 |
|
MeadWestvaco Corp. |
| 24,131 |
| 1,449 |
| 25,580 |
| 762 |
| 46 |
| 808 |
|
OJI Paper Co., Ltd. |
| 13,000 |
| — |
| 13,000 |
| 63 |
| — |
| 63 |
|
Svenska Cellulosa AB, Class B |
| 9,071 |
| — |
| 9,071 |
| 157 |
| — |
| 157 |
|
UPM-Kymmene Oyj |
| 12,324 |
| — |
| 12,324 |
| 168 |
| — |
| 168 |
|
|
|
|
|
|
|
|
| 1,166 |
| 61 |
| 1,227 |
|
Personal Products (0.2%) |
|
|
|
|
|
|
|
|
|
|
|
|
|
Avon Products, Inc. (d) |
| 4,000 |
| 701 |
| 4,701 |
| 77 |
| 14 |
| 91 |
|
Beiersdorf AG |
| 1,091 |
| — |
| 1,091 |
| 71 |
| — |
| 71 |
|
Estee Lauder Cos., Inc. (The), Class A (d) |
| 2,863 |
| 70 |
| 2,933 |
| 177 |
| 4 |
| 181 |
|
Kao Corp. |
| 7,700 |
| — |
| 7,700 |
| 202 |
| — |
| 202 |
|
L’Oreal SA |
| 2,543 |
| — |
| 2,543 |
| 314 |
| — |
| 314 |
|
Shiseido Co., Ltd. |
| 6,500 |
| — |
| 6,500 |
| 112 |
| — |
| 112 |
|
|
|
|
|
|
|
|
| 953 |
| 18 |
| 971 |
|
Pharmaceuticals (2.8%) |
|
|
|
|
|
|
|
|
|
|
|
|
|
Abbott Laboratories |
| 27,598 |
| 2,333 |
| 29,931 |
| 1,691 |
| 143 |
| 1,834 |
|
Allergan, Inc. |
| 1,610 |
| 559 |
| 2,169 |
| 154 |
| 53 |
| 207 |
|
Security Description |
| Morgan Stanley |
| MSIFT Global |
| Pro Forma |
| Morgan Stanley |
| MSIFT Global |
| Pro Forma |
|
Astellas Pharma, Inc. |
| 4,900 |
| — |
| 4,900 |
| 201 |
| — |
| 201 |
|
AstraZeneca PLC |
| 16,103 |
| — |
| 16,103 |
| 716 |
| — |
| 716 |
|
Bayer AG, (Registered) |
| 8,620 |
| — |
| 8,620 |
| 606 |
| — |
| 606 |
|
Bristol-Myers Squibb Co. |
| 52,550 |
| 4,662 |
| 57,212 |
| 1,774 |
| 157 |
| 1,931 |
|
Chugai Pharmaceutical Co., Ltd. |
| 4,900 |
| — |
| 4,900 |
| 90 |
| — |
| 90 |
|
Daiichi Sankyo Co., Ltd. |
| 9,300 |
| — |
| 9,300 |
| 169 |
| — |
| 169 |
|
Eisai Co., Ltd. |
| 3,800 |
| — |
| 3,800 |
| 151 |
| — |
| 151 |
|
Eli Lilly & Co. |
| 4,343 |
| 879 |
| 5,222 |
| 175 |
| 36 |
| 211 |
|
GlaxoSmithKline PLC |
| 58,487 |
| — |
| 58,487 |
| 1,306 |
| — |
| 1,306 |
|
Hospira, Inc. (e) |
| 972 |
| 820 |
| 1,792 |
| 36 |
| 31 |
| 67 |
|
Johnson & Johnson |
| 11,387 |
| 3,694 |
| 15,081 |
| 751 |
| 244 |
| 995 |
|
Merck & Co., Inc. |
| 12,611 |
| 4,012 |
| 16,623 |
| 484 |
| 154 |
| 638 |
|
Merck KGaA |
| 672 |
| — |
| 672 |
| 74 |
| — |
| 74 |
|
Mylan, Inc. (e) |
| 1,700 |
| — |
| 1,700 |
| 40 |
| — |
| 40 |
|
Novartis AG, (Registered) |
| 20,737 |
| — |
| 20,737 |
| 1,148 |
| — |
| 1,148 |
|
Novo Nordisk A/S, Series B |
| 3,710 |
| — |
| 3,710 |
| 514 |
| — |
| 514 |
|
Ono Pharmaceutical Co., Ltd. |
| 1,500 |
| — |
| 1,500 |
| 84 |
| — |
| 84 |
|
Perrigo Co. |
| 400 |
| — |
| 400 |
| 41 |
| — |
| 41 |
|
Pfizer, Inc. |
| 32,581 |
| 11,439 |
| 44,020 |
| 738 |
| 259 |
| 997 |
|
Roche Holding AG, (Genusschein) |
| 5,581 |
| — |
| 5,581 |
| 971 |
| — |
| 971 |
|
Sanofi |
| 12,246 |
| — |
| 12,246 |
| 951 |
| — |
| 951 |
|
Shionogi & Co., Ltd. |
| 6,400 |
| — |
| 6,400 |
| 88 |
| — |
| 88 |
|
Shire PLC |
| 5,377 |
| — |
| 5,377 |
| 174 |
| — |
| 174 |
|
Takeda Pharmaceutical Co., Ltd. |
| 9,700 |
| — |
| 9,700 |
| 427 |
| — |
| 427 |
|
Watson Pharmaceuticals, Inc. (e) |
| 400 |
| — |
| 400 |
| 27 |
| — |
| 27 |
|
|
|
|
|
|
|
|
| 13,581 |
| 1,077 |
| 14,658 |
|
Professional Services (0.2%) |
|
|
|
|
|
|
|
|
|
|
|
|
|
Adecco SA, (Registered) (e) |
| 1,264 |
| — |
| 1,264 |
| 66 |
| — |
| 66 |
|
Bureau Veritas SA |
| 581 |
| — |
| 581 |
| 51 |
| — |
| 51 |
|
Capita Group PLC (The) |
| 6,586 |
| — |
| 6,586 |
| 77 |
| — |
| 77 |
|
Dun & Bradstreet Corp. (The) |
| 665 |
| 119 |
| 784 |
| 56 |
| 10 |
| 66 |
|
Equifax, Inc. |
| 1,333 |
| 149 |
| 1,482 |
| 59 |
| 7 |
| 66 |
|
Experian PLC |
| 10,516 |
| — |
| 10,516 |
| 164 |
| — |
| 164 |
|
IHS, Inc., Class A (e) |
| 541 |
| — |
| 541 |
| 51 |
| — |
| 51 |
|
Intertek Group PLC |
| 1,847 |
| — |
| 1,847 |
| 74 |
| — |
| 74 |
|
Manpower, Inc. |
| 1,354 |
| — |
| 1,354 |
| 64 |
| — |
| 64 |
|
Randstad Holding N.V. |
| 1,207 |
| — |
| 1,207 |
| 46 |
| — |
| 46 |
|
Robert Half International, Inc. |
| 1,949 |
| — |
| 1,949 |
| 59 |
| — |
| 59 |
|
SGS SA, (Registered) |
| 52 |
| — |
| 52 |
| 101 |
| — |
| 101 |
|
Verisk Analytics, Inc., Class A (e) |
| 1,789 |
| — |
| 1,789 |
| 84 |
| — |
| 84 |
|
|
|
|
|
|
|
|
| 952 |
| 17 |
| 969 |
|
Real Estate Investment Trusts (REITs) (0.8%) |
|
|
|
|
|
|
|
|
|
|
|
|
|
American Tower Corp., Class A |
| 3,178 |
| 698 |
| 3,876 |
| 200 |
| 44 |
| 244 |
|
Annaly Capital Management, Inc., REIT |
| 2,608 |
| — |
| 2,608 |
| 41 |
| — |
| 41 |
|
AvalonBay Communities, Inc., REIT |
| 1,203 |
| 139 |
| 1,342 |
| 170 |
| 20 |
| 190 |
|
Boston Properties, Inc., REIT |
| 1,295 |
| 190 |
| 1,485 |
| 136 |
| 20 |
| 156 |
|
British Land Co., PLC, REIT |
| 13,703 |
| — |
| 13,703 |
| 105 |
| — |
| 105 |
|
Dexus Property Group, REIT (Stapled Securities) (i) |
| 65,324 |
| — |
| 65,324 |
| 59 |
| — |
| 59 |
|
Equity Residential, REIT (d) |
| 2,430 |
| 523 |
| 2,953 |
| 152 |
| 33 |
| 185 |
|
General Growth Properties, Inc., REIT |
| 1,323 |
| — |
| 1,323 |
| 22 |
| — |
| 22 |
|
Goodman Group, REIT (Stapled Securities) (i) |
| 80,650 |
| — |
| 80,650 |
| 58 |
| — |
| 58 |
|
GPT Group, REIT (Stapled Securities) (i) |
| 26,937 |
| — |
| 26,937 |
| 87 |
| — |
| 87 |
|
HCP, Inc., REIT |
| 1,242 |
| 533 |
| 1,775 |
| 49 |
| 21 |
| 70 |
|
Health Care, Inc., REIT |
| 554 |
| 217 |
| 771 |
| 30 |
| 12 |
| 42 |
|
Host Hotels & Resorts, Inc., REIT (d) |
| 8,204 |
| 1,058 |
| 9,262 |
| 135 |
| 17 |
| 152 |
|
ICADE, REIT |
| 86 |
| — |
| 86 |
| 8 |
| — |
| 8 |
|
Japan Real Estate Investment Corp., REIT |
| 8 |
| — |
| 8 |
| 70 |
| — |
| 70 |
|
Kimco Realty Corp., REIT |
| 1,278 |
| 824 |
| 2,102 |
| 25 |
| 16 |
| 41 |
|
Land Securities Group PLC, REIT |
| 13,142 |
| — |
| 13,142 |
| 152 |
| — |
| 152 |
|
Liberty Property Trust, REIT |
| 454 |
| — |
| 454 |
| 16 |
| — |
| 16 |
|
Link REIT (The) |
| 19,851 |
| — |
| 19,851 |
| 74 |
| — |
| 74 |
|
Macerich Co. (The), REIT |
| 462 |
| — |
| 462 |
| 27 |
| — |
| 27 |
|
Mirvac Group, REIT (Stapled Securities) (i) |
| 38,679 |
| — |
| 38,679 |
| 47 |
| — |
| 47 |
|
Nippon Building Fund, Inc., REIT |
| 8 |
| — |
| 8 |
| 76 |
| — |
| 76 |
|
Plum Creek Timber Co., Inc., REIT (d) |
| 487 |
| 374 |
| 861 |
| 20 |
| 16 |
| 36 |
|
ProLogis, Inc., REIT |
| 3,791 |
| 744 |
| 4,535 |
| 137 |
| 27 |
| 164 |
|
Public Storage, REIT |
| 3,198 |
| 213 |
| 3,411 |
| 442 |
| 29 |
| 471 |
|
Rayonier, Inc., REIT |
| 497 |
| — |
| 497 |
| 22 |
| — |
| 22 |
|
Regency Centers Corp., REIT |
| 303 |
| — |
| 303 |
| 13 |
| — |
| 13 |
|
Rouse Properties, Inc., REIT (e) |
| 49 |
| — |
| 49 |
| 1 |
| — |
| 1 |
|
Simon Property Group, Inc., REIT (d) |
| 4,511 |
| 512 |
| 5,023 |
| 657 |
| 75 |
| 732 |
|
Stockland, REIT (Stapled Securities) (i) |
| 28,561 |
| — |
| 28,561 |
| 87 |
| — |
| 87 |
|
Security Description |
| Morgan Stanley |
| MSIFT Global |
| Pro Forma |
| Morgan Stanley |
| MSIFT Global |
| Pro Forma |
|
Unibail-Rodamco SE, REIT |
| 1,708 |
| — |
| 1,708 |
| 342 |
| — |
| 342 |
|
Ventas, Inc., REIT (d) |
| 403 |
| 446 |
| 849 |
| 23 |
| 25 |
| 48 |
|
Vornado Realty Trust, REIT |
| 407 |
| 218 |
| 625 |
| 34 |
| 18 |
| 52 |
|
Westfield Group, REIT (Stapled Securities) (i) |
| 25,964 |
| — |
| 25,964 |
| 237 |
| — |
| 237 |
|
Westfield Retail Trust, REIT |
| 25,951 |
| — |
| 25,951 |
| 69 |
| — |
| 69 |
|
Weyerhaeuser Co., REIT |
| 1,599 |
| 837 |
| 2,436 |
| 35 |
| 18 |
| 53 |
|
|
|
|
|
|
|
|
| 3,858 |
| 391 |
| 4,249 |
|
Real Estate Management & Development (0.4%) |
|
|
|
|
|
|
|
|
|
|
|
|
|
Brookfield Asset Management, Inc., Class A |
| 7,500 |
| — |
| 7,500 |
| 237 |
| — |
| 237 |
|
Brookfield Office Properties, Inc. |
| 5,800 |
| — |
| 5,800 |
| 101 |
| — |
| 101 |
|
CBRE Group, Inc. (e) |
| 5,179 |
| 716 |
| 5,895 |
| 103 |
| 14 |
| 117 |
|
Cheung Kong Holdings Ltd. |
| 14,000 |
| — |
| 14,000 |
| 181 |
| — |
| 181 |
|
Daito Trust Construction Co., Ltd. |
| 1,400 |
| — |
| 1,400 |
| 126 |
| — |
| 126 |
|
Daiwa House Industry Co., Ltd. |
| 11,000 |
| — |
| 11,000 |
| 145 |
| — |
| 145 |
|
Hang Lung Group Ltd. |
| 8,000 |
| — |
| 8,000 |
| 52 |
| — |
| 52 |
|
Hang Lung Properties Ltd. |
| 22,000 |
| — |
| 22,000 |
| 81 |
| — |
| 81 |
|
Henderson Land Development Co., Ltd. |
| 11,228 |
| — |
| 11,228 |
| 62 |
| — |
| 62 |
|
Immofinanz AG (e) |
| 3,664 |
| — |
| 3,664 |
| 13 |
| — |
| 13 |
|
Kerry Properties Ltd. |
| 7,000 |
| — |
| 7,000 |
| 32 |
| — |
| 32 |
|
Lend Lease Group, REIT (Stapled Securities) (i)(k) |
| 9,091 |
| — |
| 9,091 |
| 70 |
| — |
| 70 |
|
Mitsubishi Estate Co., Ltd. |
| 16,000 |
| — |
| 16,000 |
| 285 |
| — |
| 285 |
|
Mitsui Fudosan Co., Ltd. |
| 12,000 |
| — |
| 12,000 |
| 230 |
| — |
| 230 |
|
New World Development Co., Ltd. |
| 27,324 |
| — |
| 27,324 |
| 33 |
| — |
| 33 |
|
Sino Land Co., Ltd. |
| 20,534 |
| — |
| 20,534 |
| 33 |
| — |
| 33 |
|
Sumitomo Realty & Development Co., Ltd. |
| 7,000 |
| — |
| 7,000 |
| 169 |
| — |
| 169 |
|
Sun Hung Kai Properties Ltd. |
| 13,328 |
| — |
| 13,328 |
| 166 |
| — |
| 166 |
|
Swire Pacific Ltd. |
| 6,500 |
| — |
| 6,500 |
| 73 |
| — |
| 73 |
|
Swire Properties Ltd. |
| 4,550 |
| — |
| 4,550 |
| 11 |
| — |
| 11 |
|
Wharf Holdings Ltd. |
| 13,200 |
| — |
| 13,200 |
| 72 |
| — |
| 72 |
|
Wheelock & Co., Ltd. |
| 10,000 |
| — |
| 10,000 |
| 30 |
| — |
| 30 |
|
|
|
|
|
|
|
|
| 2,305 |
| 14 |
| 2,319 |
|
Road & Rail (0.7%) |
|
|
|
|
|
|
|
|
|
|
|
|
|
Asciano Ltd., (Stapled Securities) (i) |
| 12,104 |
| — |
| 12,104 |
| 61 |
| — |
| 61 |
|
Canadian National Railway Co. |
| 6,100 |
| — |
| 6,100 |
| 485 |
| — |
| 485 |
|
Canadian Pacific Railway Ltd. |
| 2,300 |
| — |
| 2,300 |
| 175 |
| — |
| 175 |
|
Central Japan Railway Co. |
| 22 |
| — |
| 22 |
| 181 |
| — |
| 181 |
|
CSX Corp. |
| 4,977 |
| 1,552 |
| 6,529 |
| 107 |
| 33 |
| 140 |
|
DSV A/S |
| 3,265 |
| — |
| 3,265 |
| 74 |
| — |
| 74 |
|
East Japan Railway Co. |
| 4,600 |
| — |
| 4,600 |
| 290 |
| — |
| 290 |
|
JB Hunt Transport Services, Inc. |
| 312 |
| — |
| 312 |
| 17 |
| — |
| 17 |
|
Keikyu Corp. |
| 10,000 |
| — |
| 10,000 |
| 87 |
| — |
| 87 |
|
Keio Corp. |
| 10,000 |
| — |
| 10,000 |
| 72 |
| — |
| 72 |
|
Kintetsu Corp. |
| 39,000 |
| — |
| 39,000 |
| 148 |
| — |
| 148 |
|
MTR Corp. |
| 15,242 |
| — |
| 15,242 |
| 55 |
| — |
| 55 |
|
Nippon Express Co., Ltd. |
| 22,000 |
| — |
| 22,000 |
| 86 |
| — |
| 86 |
|
Norfolk Southern Corp. |
| 16,999 |
| 1,204 |
| 18,203 |
| 1,119 |
| 79 |
| 1,198 |
|
Odakyu Electric Railway Co., Ltd. |
| 16,000 |
| — |
| 16,000 |
| 151 |
| — |
| 151 |
|
Tobu Railway Co., Ltd. |
| 33,000 |
| — |
| 33,000 |
| 175 |
| — |
| 175 |
|
Tokyu Corp. |
| 18,000 |
| — |
| 18,000 |
| 85 |
| — |
| 85 |
|
Union Pacific Corp. |
| 1,978 |
| 694 |
| 2,672 |
| 213 |
| 75 |
| 288 |
|
West Japan Railway Co. |
| 2,800 |
| — |
| 2,800 |
| 112 |
| — |
| 112 |
|
|
|
|
|
|
|
|
| 3,693 |
| 187 |
| 3,880 |
|
Semiconductors & Semiconductor Equipment (2.2%) |
|
|
|
|
|
|
|
|
|
|
|
|
|
Advanced Micro Devices, Inc. (d)(e) |
| 18,082 |
| 2,132 |
| 20,214 |
| 145 |
| 17 |
| 162 |
|
Advantest Corp. |
| 2,300 |
| — |
| 2,300 |
| 36 |
| — |
| 36 |
|
Altera Corp. |
| 11,343 |
| 1,104 |
| 12,447 |
| 452 |
| 44 |
| 496 |
|
Analog Devices, Inc. (d) |
| 9,744 |
| 978 |
| 10,722 |
| 394 |
| 40 |
| 434 |
|
Applied Materials, Inc. |
| 35,689 |
| 4,295 |
| 39,984 |
| 444 |
| 53 |
| 497 |
|
ARM Holdings PLC |
| 15,586 |
| — |
| 15,586 |
| 148 |
| — |
| 148 |
|
ASML Holding N.V. |
| 3,267 |
| — |
| 3,267 |
| 163 |
| — |
| 163 |
|
Avago Technologies Ltd. |
| 6,705 |
| — |
| 6,705 |
| 261 |
| — |
| 261 |
|
Broadcom Corp., Class A (d)(e) |
| 15,960 |
| 1,506 |
| 17,466 |
| 627 |
| 59 |
| 686 |
|
First Solar, Inc. (d)(e) |
| 200 |
| 72 |
| 272 |
| 5 |
| 2 |
| 7 |
|
Infineon Technologies AG |
| 12,761 |
| — |
| 12,761 |
| 130 |
| — |
| 130 |
|
Intel Corp. |
| 161,114 |
| 18,335 |
| 179,449 |
| 4,529 |
| 515 |
| 5,044 |
|
KLA-Tencor Corp. |
| 4,411 |
| 519 |
| 4,930 |
| 240 |
| 28 |
| 268 |
|
Lam Research Corp. (e) |
| 3,852 |
| — |
| 3,852 |
| 172 |
| — |
| 172 |
|
Linear Technology Corp. |
| 7,667 |
| 829 |
| 8,496 |
| 258 |
| 28 |
| 286 |
|
LSI Corp. (e) |
| 18,946 |
| 2,024 |
| 20,970 |
| 164 |
| 18 |
| 182 |
|
Marvell Technology Group Ltd. (e) |
| 14,681 |
| — |
| 14,681 |
| 231 |
| — |
| 231 |
|
Maxim Integrated Products, Inc. |
| 7,329 |
| — |
| 7,329 |
| 210 |
| — |
| 210 |
|
Microchip Technology, Inc. (d) |
| 4,881 |
| 663 |
| 5,544 |
| 182 |
| 25 |
| 207 |
|
Security Description |
| Morgan Stanley |
| MSIFT Global |
| Pro Forma |
| Morgan Stanley |
| MSIFT Global |
| Pro Forma |
|
Micron Technology, Inc. (e) |
| 24,260 |
| 3,283 |
| 27,543 |
| 197 |
| 27 |
| 224 |
|
NVIDIA Corp. (e) |
| 16,264 |
| 2,018 |
| 18,282 |
| 250 |
| 31 |
| 281 |
|
Renewable Energy Corp. ASA (e) |
| 6,482 |
| — |
| 6,482 |
| 4 |
| — |
| 4 |
|
Rohm Co., Ltd. |
| 1,200 |
| — |
| 1,200 |
| 59 |
| — |
| 59 |
|
Texas Instruments, Inc. |
| 35,376 |
| 3,879 |
| 39,255 |
| 1,189 |
| 130 |
| 1,319 |
|
Tokyo Electron Ltd. |
| 2,000 |
| — |
| 2,000 |
| 114 |
| — |
| 114 |
|
Xilinx, Inc. (d) |
| 7,738 |
| 871 |
| 8,609 |
| 282 |
| 32 |
| 314 |
|
|
|
|
|
|
|
|
| 10,886 |
| 1,049 |
| 11,935 |
|
Software (1.2%) |
|
|
|
|
|
|
|
|
|
|
|
|
|
Adobe Systems, Inc. (e) |
| 2,714 |
| 932 |
| 3,646 |
| 93 |
| 32 |
| 125 |
|
BMC Software, Inc. (e) |
| 1,084 |
| — |
| 1,084 |
| 44 |
| — |
| 44 |
|
CA, Inc. |
| 1,963 |
| — |
| 1,963 |
| 54 |
| — |
| 54 |
|
Citrix Systems, Inc. (e) |
| 1,172 |
| 414 |
| 1,586 |
| 92 |
| 33 |
| 125 |
|
Intuit, Inc. (d) |
| 2,338 |
| 466 |
| 2,804 |
| 141 |
| 28 |
| 169 |
|
Microsoft Corp. |
| 68,600 |
| 11,488 |
| 80,088 |
| 2,212 |
| 370 |
| 2,582 |
|
Nintendo Co., Ltd. |
| 1,300 |
| — |
| 1,300 |
| 196 |
| — |
| 196 |
|
Oracle Corp. |
| 18,164 |
| 4,572 |
| 22,736 |
| 530 |
| 133 |
| 663 |
|
Red Hat, Inc. (e) |
| 18,177 |
| 1,513 |
| 19,690 |
| 1,089 |
| 91 |
| 1,180 |
|
Salesforce.com, Inc. (d)(e) |
| 624 |
| 313 |
| 937 |
| 96 |
| 48 |
| 144 |
|
SAP AG |
| 11,826 |
| — |
| 11,826 |
| 826 |
| — |
| 826 |
|
Symantec Corp. (e) |
| 4,850 |
| 1,072 |
| 5,922 |
| 91 |
| 20 |
| 111 |
|
Trend Micro, Inc. |
| 1,800 |
| — |
| 1,800 |
| 55 |
| — |
| 55 |
|
|
|
|
|
|
|
|
| 5,519 |
| 755 |
| 6,274 |
|
Specialty Retail (1.0%) |
|
|
|
|
|
|
|
|
|
|
|
|
|
Abercrombie & Fitch Co., Class A |
| 232 |
| — |
| 232 |
| 12 |
| — |
| 12 |
|
Advance Auto Parts, Inc. |
| 232 |
| — |
| 232 |
| 21 |
| — |
| 21 |
|
AutoZone, Inc. (e) |
| 106 |
| 39 |
| 145 |
| 39 |
| 15 |
| 54 |
|
Bed Bath & Beyond, Inc. (d)(e) |
| 1,243 |
| 386 |
| 1,629 |
| 82 |
| 26 |
| 108 |
|
Best Buy Co., Inc. (d) |
| 908 |
| 368 |
| 1,276 |
| 22 |
| 9 |
| 31 |
|
CarMax, Inc. (e) |
| 575 |
| 442 |
| 1,017 |
| 20 |
| 15 |
| 35 |
|
Esprit Holdings Ltd. (j) |
| 8,106 |
| — |
| 8,106 |
| 16 |
| — |
| 16 |
|
Fast Retailing Co., Ltd. |
| 600 |
| — |
| 600 |
| 137 |
| — |
| 137 |
|
GameStop Corp., Class A |
| 507 |
| — |
| 507 |
| 11 |
| — |
| 11 |
|
Gap, Inc. (The) (d) |
| 55,777 |
| 5,287 |
| 61,064 |
| 1,458 |
| 138 |
| 1,596 |
|
Hennes & Mauritz AB, Class B |
| 10,949 |
| — |
| 10,949 |
| 396 |
| — |
| 396 |
|
Home Depot, Inc. |
| 29,049 |
| 3,305 |
| 32,354 |
| 1,461 |
| 166 |
| 1,627 |
|
Inditex SA |
| 2,368 |
| — |
| 2,368 |
| 227 |
| — |
| 227 |
|
Lowe’s Cos., Inc. |
| 5,705 |
| 1,294 |
| 6,999 |
| 179 |
| 41 |
| 220 |
|
Ltd. Brands, Inc. (d) |
| 1,879 |
| 422 |
| 2,301 |
| 90 |
| 20 |
| 110 |
|
O’Reilly Automotive, Inc. (e) |
| 942 |
| 134 |
| 1,076 |
| 86 |
| 12 |
| 98 |
|
PetSmart, Inc. |
| 274 |
| — |
| 274 |
| 16 |
| — |
| 16 |
|
Ross Stores, Inc. |
| 1,530 |
| 168 |
| 1,698 |
| 89 |
| 10 |
| 99 |
|
Staples, Inc. |
| 4,882 |
| 921 |
| 5,803 |
| 79 |
| 15 |
| 94 |
|
Tiffany & Co. (d) |
| 401 |
| 134 |
| 535 |
| 28 |
| 9 |
| 37 |
|
TJX Cos., Inc. |
| 3,516 |
| 1,140 |
| 4,656 |
| 140 |
| 45 |
| 185 |
|
Urban Outfitters, Inc. (e) |
| 274 |
| — |
| 274 |
| 8 |
| — |
| 8 |
|
Yamada Denki Co., Ltd. |
| 1,370 |
| — |
| 1,370 |
| 86 |
| — |
| 86 |
|
|
|
|
|
|
|
|
| 4,703 |
| 521 |
| 5,224 |
|
Textiles, Apparel & Luxury Goods (0.5%) |
|
|
|
|
|
|
|
|
|
|
|
|
|
Adidas AG |
| 2,170 |
| — |
| 2,170 |
| 169 |
| — |
| 169 |
|
Burberry Group PLC |
| 4,434 |
| — |
| 4,434 |
| 106 |
| — |
| 106 |
|
Christian Dior SA |
| 750 |
| — |
| 750 |
| 115 |
| — |
| 115 |
|
Cie Financiere Richemont SA |
| 4,550 |
| — |
| 4,550 |
| 285 |
| — |
| 285 |
|
Coach, Inc. |
| 1,058 |
| 501 |
| 1,559 |
| 82 |
| 38 |
| 120 |
|
Luxottica Group SpA |
| 1,567 |
| — |
| 1,567 |
| 57 |
| — |
| 57 |
|
LVMH Moet Hennessy Louis Vuitton SA |
| 2,427 |
| — |
| 2,427 |
| 417 |
| — |
| 417 |
|
NIKE, Inc., Class B |
| 1,314 |
| 404 |
| 1,718 |
| 143 |
| 44 |
| 187 |
|
Ralph Lauren Corp. |
| — |
| 142 |
| 142 |
| — |
| 25 |
| 25 |
|
Swatch Group AG (The) |
| 300 |
| — |
| 300 |
| 138 |
| — |
| 138 |
|
VF Corp. |
| 7,551 |
| 546 |
| 8,097 |
| 1,102 |
| 80 |
| 1,182 |
|
|
|
|
|
|
|
|
| 2,614 |
| 187 |
| 2,801 |
|
Thrifts & Mortgage Finance (0.0%) |
|
|
|
|
|
|
|
|
|
|
|
|
|
Hudson City Bancorp, Inc. (d) |
| — |
| 400 |
| 400 |
| — |
| 3 |
| 3 |
|
New York Community Bancorp, Inc. |
| 4,800 |
| — |
| 4,800 |
| 67 |
| — |
| 67 |
|
People’s United Financial, Inc. (d) |
| — |
| 1,100 |
| 1,100 |
| — |
| 14 |
| 14 |
|
|
|
|
|
|
|
|
| 67 |
| 17 |
| 84 |
|
Tobacco (1.1%) |
|
|
|
|
|
|
|
|
|
|
|
|
|
Altria Group, Inc. |
| 8,392 |
| 2,587 |
| 10,979 |
| 259 |
| 80 |
| 339 |
|
British American Tobacco PLC |
| 19,308 |
| — |
| 19,308 |
| 973 |
| — |
| 973 |
|
Imperial Tobacco Group PLC |
| 10,310 |
| — |
| 10,310 |
| 418 |
| — |
| 418 |
|
Japan Tobacco, Inc. |
| 78 |
| — |
| 78 |
| 439 |
| — |
| 439 |
|
Lorillard, Inc. |
| 656 |
| 200 |
| 856 |
| 85 |
| 26 |
| 111 |
|
Security Description |
| Morgan Stanley |
| MSIFT Global |
| Pro Forma |
| Morgan Stanley |
| MSIFT Global |
| Pro Forma |
|
Philip Morris International, Inc. |
| 21,305 |
| 2,584 |
| 23,889 |
| 1,888 |
| 229 |
| 2,117 |
|
Reynolds American, Inc. |
| 22,832 |
| 2,031 |
| 24,863 |
| 946 |
| 84 |
| 1,030 |
|
Swedish Match AB |
| 4,439 |
| — |
| 4,439 |
| 177 |
| — |
| 177 |
|
|
|
|
|
|
|
|
| 5,185 |
| 419 |
| 5,604 |
|
Trading Companies & Distributors (0.3%) |
|
|
|
|
|
|
|
|
|
|
|
|
|
Fastenal Co. |
| 1,866 |
| — |
| 1,866 |
| 101 |
| — |
| 101 |
|
ITOCHU Corp. |
| 21,000 |
| — |
| 21,000 |
| 229 |
| — |
| 229 |
|
Marubeni Corp. |
| 29,000 |
| — |
| 29,000 |
| 209 |
| — |
| 209 |
|
Mitsubishi Corp. |
| 16,900 |
| — |
| 16,900 |
| 392 |
| — |
| 392 |
|
Mitsui & Co., Ltd. |
| 25,900 |
| — |
| 25,900 |
| 425 |
| — |
| 425 |
|
Sumitomo Corp. |
| 15,300 |
| — |
| 15,300 |
| 221 |
| — |
| 221 |
|
Wolseley PLC |
| 3,683 |
| — |
| 3,683 |
| 141 |
| — |
| 141 |
|
WW Grainger, Inc. |
| 556 |
| — |
| 556 |
| 119 |
| — |
| 119 |
|
|
|
|
|
|
|
|
| 1,837 |
| — |
| 1,837 |
|
Transportation Infrastructure (0.1%) |
|
|
|
|
|
|
|
|
|
|
|
|
|
Abertis Infraestructuras SA |
| 4,000 |
| — |
| 4,000 |
| 68 |
| — |
| 68 |
|
Aeroports de Paris |
| 480 |
| — |
| 480 |
| 39 |
| — |
| 39 |
|
Atlantia SpA |
| 4,173 |
| — |
| 4,173 |
| 69 |
| — |
| 69 |
|
Fraport AG Frankfurt Airport Services Worldwide |
| 344 |
| — |
| 344 |
| 22 |
| — |
| 22 |
|
Groupe Eurotunnel SA |
| 7,563 |
| — |
| 7,563 |
| 66 |
| — |
| 66 |
|
Koninklijke Vopak N.V. |
| 1,006 |
| — |
| 1,006 |
| 58 |
| — |
| 58 |
|
Transurban Group, (Stapled Securities) (i) |
| 16,094 |
| — |
| 16,094 |
| 93 |
| — |
| 93 |
|
|
|
|
|
|
|
|
| 415 |
| — |
| 415 |
|
Wireless Telecommunication Services (0.6%) |
|
|
|
|
|
|
|
|
|
|
|
|
|
Crown Castle International Corp. (e) |
| 2,971 |
| — |
| 2,971 |
| 158 |
| — |
| 158 |
|
KDDI Corp. |
| 51 |
| — |
| 51 |
| 330 |
| — |
| 330 |
|
MetroPCS Communications, Inc. (e) |
| — |
| 600 |
| 600 |
| — |
| 5 |
| 5 |
|
Millicom International Cellular SA SDR |
| 1,401 |
| — |
| 1,401 |
| 159 |
| — |
| 159 |
|
NII Holdings, Inc. (e) |
| 1,500 |
| — |
| 1,500 |
| 27 |
| — |
| 27 |
|
NTT DoCoMo, Inc. |
| 193 |
| — |
| 193 |
| 320 |
| — |
| 320 |
|
Rogers Communications, Inc. |
| 5,400 |
| — |
| 5,400 |
| 214 |
| — |
| 214 |
|
Softbank Corp. (e) |
| 9,700 |
| — |
| 9,700 |
| 287 |
| — |
| 287 |
|
Sprint Nextel Corp. (e) |
| 20,300 |
| 2,982 |
| 23,282 |
| 58 |
| 9 |
| 67 |
|
Vodafone Group PLC |
| 607,663 |
| — |
| 607,663 |
| 1,674 |
| — |
| 1,674 |
|
|
|
|
|
|
|
|
| 3,227 |
| 14 |
| 3,241 |
|
Total Common Stocks |
|
|
|
|
|
|
| 247,190 |
| 20,292 | * | 267,482 | * |
|
|
|
|
|
|
|
|
|
|
|
|
|
|
Commodity Linked Security (4.6%) |
|
|
|
|
|
|
|
|
|
|
|
|
|
United States (4.6%) |
|
|
|
|
|
|
|
|
|
|
|
|
|
Deutsche Bank AG Series 0005 (b)(l) |
| 23,938,000 |
| — |
| 23,938,000 |
| 24,637 |
| — |
| 24,637 |
|
|
|
|
|
|
|
|
|
|
|
|
|
|
|
Convertible Preferred Stocks (0.0%) |
|
|
|
|
|
|
|
|
|
|
|
|
|
Alternative Energy (0.0%) |
|
|
|
|
|
|
|
|
|
|
|
|
|
Better Place, Inc. (e)(f)(g) |
| — |
| 33,466 |
| 33,466 |
| — |
| 152 |
| 152 |
|
|
|
|
|
|
|
|
|
|
|
|
|
|
|
Investment Companies (0.8%) |
|
|
|
|
|
|
|
|
|
|
|
|
|
iShares MSCI Emerging Markets Index Fund |
| 8,000 |
| — |
| 8,000 |
| 344 |
| — |
| 344 |
|
iShares MSCI EMU Index Fund (d) |
| — |
| 200 |
| 200 |
| — |
| 6 |
| 6 |
|
Morgan Stanley Institutional Fund, Inc. - Emerging Markets Portfolio (p) |
| — |
| 4,388 |
| 4,388 |
| — |
| 108 |
| 108 |
|
Technology Select Sector SPDR Fund (d) |
| 110,800 |
| 9,300 |
| 120,100 |
| 3,341 |
| 280 |
| 3,621 |
|
Total Investment Companies |
|
|
|
|
|
|
| 3,685 |
| 394 |
| 4,079 |
|
|
|
|
|
|
|
|
|
|
|
|
|
|
|
Rights (0.0%) |
|
|
|
|
|
|
|
|
|
|
|
|
|
Pharmaceuticals (0.0%) |
|
|
|
|
|
|
|
|
|
|
|
|
|
Sanofi (e) |
| — |
| 54 |
| 54 |
| — |
| — | @ | — | @ |
|
|
|
|
|
|
|
|
|
|
|
|
|
|
Total Equity Securities |
|
|
|
|
|
|
| 275,512 |
| 20,838 |
| 296,350 |
|
|
|
|
|
|
|
|
|
|
|
|
|
|
|
Short-Term Investments (9.2%) |
|
|
|
|
|
|
|
|
|
|
|
|
|
Securities held as Collateral on Loaned Securities (1.3%) |
|
|
|
|
|
|
|
|
|
|
|
|
|
Investment Company (1.1%) |
|
|
|
|
|
|
|
|
|
|
|
|
|
Morgan Stanley Institutional Liquidity Funds - Money Market Portfolio - Institutional Class (p) |
| — |
| 5,948,699 |
| 5,948,699 |
| — |
| 5,949 |
| 5,949 |
|
|
| Morgan Stanley |
| MSIFT Global |
| Pro Forma |
| Morgan Stanley |
| MSIFT Global |
| Pro Forma |
|
Repurchase Agreements (0.2%) |
|
|
|
|
|
|
|
|
|
|
|
|
|
Security Description |
| Morgan Stanley |
| MSIFT Global |
| Pro Forma |
| Morgan Stanley |
| MSIFT Global |
| Adjustments |
| Pro Forma |
|
Barclays Capital, Inc., (0.15%, dated 3/30/12, due 4/2/12; proceeds $158; fully collateralized by a U.S. Government Agency; Federal National Mortgage Association 4.00% due 1/1/42; valued at $161) |
| — |
| 158 |
| 158 |
| — |
| 158 |
| — |
| 158 |
|
Merrill Lynch & Co., Inc., (0.25%, dated 3/30/12, due 4/2/12; proceeds $976; fully collateralized by Common Stocks; Alliance Data Systems Corp.; American International Group, Inc.; Boeing Co. (The); Energy Transfer Equity LP; Freeport-McMoRan Copper & Gold, Inc.; GNC Holdings, Inc.; Hershey Co. (The); L-3 Communications Holdings, Inc.; McKesson Corp.; Teva Pharmaceutical Industries Ltd.; Two Harbors Investment Corp.; Vale SA; valued at $1,054) |
| — |
| 976 |
| 976 |
| — |
| 976 |
| — |
| 976 |
|
|
|
|
|
|
|
|
| — |
| 1,134 |
| — |
| 1,134 |
|
Total Securities held as Collateral on Loaned Securities |
|
|
|
|
|
|
| — |
| 7,083 |
| — |
| 7,083 |
|
|
| Morgan Stanley |
| MSIFT Global |
| Proforma |
| Morgan Stanley |
| MSIFT Global |
| Adjustments |
| Pro Forma |
|
Investment Company (7.5%) |
|
|
|
|
|
|
|
|
|
|
|
|
|
|
|
Morgan Stanley Institutional Liquidity Funds - Money Market Portfolio - Institutional Class (p) |
| 34,177,825 |
| 5,316,709 |
| 39,494,534 |
| 34,178 |
| 5,317 |
| — |
| 39,495 |
|
|
| Morgan Stanley |
| MSIFT Global |
| Pro Forma |
| Morgan Stanley |
| MSIFT Global |
| Adjustments |
| Pro Forma |
| ||||
U.S. Treasury Securities (0.4%) |
|
|
|
|
|
|
|
|
|
|
|
|
|
|
| ||||
U.S. Treasury Bill 0.09%, 6/7/12 (h) |
| — |
| 500 |
| 500 |
| — |
| 499 |
| — |
| 499 |
| ||||
U.S. Treasury Bill 0.13%, 8/30/12 (h)(n) |
| 820 |
| — |
| 820 |
| 820 |
| — |
| — |
| 820 |
| ||||
U.S. Treasury Bill 0.14%, 8/30/12 (h)(n) |
| 931 |
| — |
| 931 |
| 930 |
| — |
| — |
| 930 |
| ||||
|
|
|
|
|
|
|
| 1,750 |
| 499 |
| — |
| 2,249 |
| ||||
Total Short-Term Investments |
|
|
|
|
|
|
| 35,928 |
| 12,899 |
| — |
| 48,827 |
| ||||
|
|
|
|
|
|
|
|
|
|
|
|
|
|
|
| ||||
Total Investments (100.9%) (Cost $499,867) including $7,630 of Securities Loaned (o) |
|
|
|
|
|
|
| 483,969 |
| 48,702 |
| — |
| 532,671 |
| ||||
Liabilites in Excess of Other Assets (-0.9%) |
|
|
|
|
|
|
| 3,127 |
| (7,732 | ) | (686 | ) | (5,291 | ) | ||||
Net Assets (100%) |
|
|
|
|
|
|
| $ | 487,096 |
| $ | 40,970 |
| $ | (686 | ) | $ | 527,380 |
|
|
|
|
|
|
|
|
|
|
|
|
|
|
|
|
| ||||
Percentages indicated are based on net assets. |
|
|
|
|
|
|
|
|
|
|
|
|
|
|
| ||||
|
|
|
|
|
|
|
|
|
|
|
|
|
|
|
|
|
|
|
|
|
|
|
|
|
|
|
|
|
|
|
|
|
|
|
|
|
|
|
|
|
| ||
|
| MS Global |
| MSIFT |
| Combined Pro |
| MS Global |
| MSIFT Global |
| Combined Pro |
|
|
| MS Global |
| MSIFT |
| Combined |
| MS Global |
| MSIFT Global |
| Combined |
| MS Global |
| MSIFT Global |
| Combined Pro |
| ||||||||||
Counterparty |
| Currency to |
| Currency to |
| Currency to |
| Value |
| Value |
| Value |
| Settlement Date |
| In Exchange |
| In |
| In Exchange |
| Value |
| Value |
| Value |
| Unrealized |
| Unrealized |
| Unrealized |
| ||||||||||
Goldman Sachs International |
|
|
|
| NOK | 276 |
| NOK | 276 |
|
|
| 48 |
| 48 |
| 4/4/2012 |
|
|
|
| USD | 49 |
| USD | 49 |
|
|
| 49 |
| 49 |
|
|
| $ | 1 |
| $ | 1 |
| ||
JPMorgan Chase Bank |
|
|
|
| USD | 96 |
| USD | 96 |
|
|
| 96 |
| 96 |
| 4/4/2012 |
|
|
|
| NOK | 545 |
| NOK | 545 |
|
|
| 96 |
| 96 |
|
|
| (— | )@ | (— | )@ | ||||
UBS AG |
|
|
|
| NOK | — | @ | NOK | — | @ |
|
| — | @ | — | @ | 4/4/2012 |
|
|
|
| USD | — | @ | USD | — | @ |
|
| — | @ | — | @ |
|
| (— | )@ | (— | )@ | ||||
UBS AG |
|
|
|
| NOK | 269 |
| NOK | 269 |
|
|
| 47 |
| 47 |
| 4/4/2012 |
|
|
|
| USD | 47 |
| USD | 47 |
|
|
| 47 |
| 47 |
|
|
| — | @ | — | @ | ||||
Goldman Sachs International |
|
|
|
| USD | 42 |
| USD | 42 |
|
|
| 42 |
| 42 |
| 4/5/2012 |
|
|
|
| CHF | 38 |
| CHF | 38 |
|
|
| 42 |
| 42 |
|
|
| — | @ | — | @ | ||||
Goldman Sachs International |
|
|
|
| USD | — | @ | USD | — | @ |
|
| — | @ | — | @ | 4/5/2012 |
|
|
|
| SEK | — | @ | SEK | — | @ |
|
| — | @ | — | @ |
|
| (— | )@ | (— | )@ | ||||
JPMorgan Chase Bank |
|
|
|
| CHF | 38 |
| CHF | 38 |
|
|
| 42 |
| 42 |
| 4/5/2012 |
|
|
|
| USD | 42 |
| USD | 42 |
|
|
| 42 |
| 42 |
|
|
| (— | )@ | (— | )@ | ||||
UBS AG |
|
|
|
| SEK | 190 |
| SEK | 190 |
|
|
| 29 |
| 29 |
| 4/5/2012 |
|
|
|
| USD | 29 |
| USD | 29 |
|
|
| 29 |
| 29 |
|
|
| (— | )@ | (— | )@ | ||||
UBS AG |
|
|
|
| USD | — | @ | USD | — | @ |
|
| — | @ | — | @ | 4/5/2012 |
|
|
|
| CHF | — | @ | CHF | — | @ |
|
| — | @ | — | @ |
|
| — | @ | — | @ | ||||
UBS AG |
|
|
|
| USD | 28 |
| USD | 28 |
|
|
| 28 |
| 28 |
| 4/5/2012 |
|
|
|
| SEK | 190 |
| SEK | 190 |
|
|
| 29 |
| 29 |
|
|
| 1 |
| 1 |
| ||||
Deutsche Bank AG London |
|
|
|
| AUD | 418 |
| AUD | 418 |
|
|
| 433 |
| 433 |
| 4/19/2012 |
|
|
|
| USD | 439 |
| USD | 439 |
|
|
| 439 |
| 439 |
|
|
| 6 |
| 6 |
| ||||
Deutsche Bank AG London |
|
|
|
| AUD | 475 |
| AUD | 475 |
|
|
| 492 |
| 492 |
| 4/19/2012 |
|
|
|
| USD | 497 |
| USD | 497 |
|
|
| 497 |
| 497 |
|
|
| 5 |
| 5 |
| ||||
Deutsche Bank AG London |
|
|
|
| USD | 440 |
| USD | 440 |
|
|
| 440 |
| 440 |
| 4/19/2012 |
|
|
|
| EUR | 335 |
| EUR | 335 |
|
|
| 447 |
| 447 |
|
|
| 7 |
| 7 |
| ||||
Goldman Sachs International |
|
|
|
| EUR | 152 |
| EUR | 152 |
|
|
| 202 |
| 202 |
| 4/19/2012 |
|
|
|
| USD | 199 |
| USD | 199 |
|
|
| 199 |
| 199 |
|
|
| (3 | ) | (3 | ) | ||||
JPMorgan Chase Bank |
|
|
|
| NOK | 394 |
| NOK | 394 |
|
|
| 69 |
| 69 |
| 4/19/2012 |
|
|
|
| USD | 69 |
| USD | 69 |
|
|
| 69 |
| 69 |
|
|
| — | @ | — | @ | ||||
JPMorgan Chase Bank |
|
|
|
| USD | 50 |
| USD | 50 |
|
|
| 50 |
| 50 |
| 4/19/2012 |
|
|
|
| SEK | 340 |
| SEK | 340 |
|
|
| 51 |
| 51 |
|
|
| 1 |
| 1 |
| ||||
State Street Bank and Trust Co. |
|
|
|
| CLP | 580,930 |
| CLP | 580,930 |
|
|
| 1,186 |
| 1,186 |
| 4/19/2012 |
|
|
|
| USD | 1,193 |
| USD | 1,193 |
|
|
| 1,193 |
| 1,193 |
|
|
| 7 |
| 7 |
| ||||
UBS AG |
|
|
|
| BRL | 80 |
| BRL | 80 |
|
|
| 43 |
| 43 |
| 4/19/2012 |
|
|
|
| USD | 44 |
| USD | 44 |
|
|
| 44 |
| 44 |
|
|
| 1 |
| 1 |
| ||||
UBS AG |
|
|
|
| EUR | 411 |
| EUR | 411 |
|
|
| 548 |
| 548 |
| 4/19/2012 |
|
|
|
| USD | 539 |
| USD | 539 |
|
|
| 539 |
| 539 |
|
|
| (9 | ) | (9 | ) | ||||
UBS AG |
|
|
|
| GBP | 45 |
| GBP | 45 |
|
|
| 72 |
| 72 |
| 4/19/2012 |
|
|
|
| USD | 70 |
| USD | 70 |
|
|
| 70 |
| 70 |
|
|
| (2 | ) | (2 | ) | ||||
Goldman Sachs International |
| USD | 961 |
|
|
|
| USD | 961 |
| 961 |
| — |
| 961 |
| 4/4/2012 |
| MXN | 12,290 |
|
|
|
| MXN | 12,290 |
| 961 |
|
|
| 961 |
| (— | )@ |
|
| — | @ | ||||
Goldman Sachs International |
| USD | 195 |
|
|
|
| USD | 195 |
| 195 |
| — |
| 195 |
| 4/4/2012 |
| MXN | 2,467 |
|
|
|
| MXN | 2,467 |
| 193 |
|
|
| 193 |
| (2 | ) |
|
| (2 | ) | ||||
Goldman Sachs International |
| MXN | 24,935 |
|
|
|
| MXN | 24,935 |
| 1,949 |
| — |
| 1,949 |
| 4/4/2012 |
| USD | 1,946 |
|
|
|
| USD | 1,946 |
| 1,946 |
|
|
| 1,946 |
| (3 | ) |
|
| (3 | ) | ||||
JPMorgan Chase Bank |
| USD | 552 |
|
|
|
| USD | 552 |
| 552 |
| — |
| 552 |
| 4/4/2012 |
| NOK | 3,142 |
|
|
|
| NOK | 3,142 |
| 552 |
|
|
| 552 |
| (— | )@ |
|
| — | @ | ||||
JPMorgan Chase Bank |
| USD | 798 |
|
|
|
| USD | 798 |
| 798 |
| — |
| 798 |
| 4/4/2012 |
| MXN | 10,178 |
|
|
|
| MXN | 10,178 |
| 795 |
|
|
| 795 |
| (3 | ) |
|
| (3 | ) | ||||
UBS AG |
| USD | 423 |
|
|
|
| USD | 423 |
| 423 |
| — |
| 423 |
| 4/4/2012 |
| NOK | 2,428 |
|
|
|
| NOK | 2,428 |
| 426 |
|
|
| 426 |
| 3 |
|
|
| 3 |
| ||||
WELLS FARGO BANK N.A. |
| NOK | 5,570 |
|
|
|
| NOK | 5,570 |
| 978 |
| — |
| 978 |
| 4/4/2012 |
| USD | 983 |
|
|
|
| USD | 983 |
| 983 |
|
|
| 983 |
| 5 |
|
|
| 5 |
| ||||
Goldman Sachs International |
| USD | 243 |
|
|
|
| USD | 243 |
| 243 |
| — |
| 243 |
| 4/5/2012 |
| GBP | 154 |
|
|
|
| GBP | 154 |
| 247 |
|
|
| 247 |
| 4 |
|
|
| 4 |
| ||||
Goldman Sachs International |
| USD | 1,060 |
|
|
|
| USD | 1,060 |
| 1,060 |
| — |
| 1,060 |
| 4/5/2012 |
| PLN | 3,289 |
|
|
|
| PLN | 3,289 |
| 1,058 |
|
|
| 1,058 |
| (2 | ) |
|
| (2 | ) | ||||
Goldman Sachs International |
| USD | 220 |
|
|
|
| USD | 220 |
| 220 |
| — |
| 220 |
| 4/5/2012 |
| SEK | 1,455 |
|
|
|
| SEK | 1,455 |
| 220 |
|
|
| 220 |
| — | @ |
|
| — | @ | ||||
Goldman Sachs International |
| EUR | 297 |
|
|
|
| EUR | 297 |
| 396 |
| — |
| 396 |
| 4/5/2012 |
| USD | 398 |
|
|
|
| USD | 398 |
| 398 |
|
|
| 398 |
| 2 |
|
|
| 2 |
| ||||
Goldman Sachs International |
| CAD | 701 |
|
|
|
| CAD | 701 |
| 703 |
| — |
| 703 |
| 4/5/2012 |
| USD | 704 |
|
|
|
| USD | 704 |
| 704 |
|
|
| 704 |
| 1 |
|
|
| 1 |
| ||||
Goldman Sachs International |
| ZAR | 11,335 |
|
|
|
| ZAR | 11,335 |
| 1,477 |
| — |
| 1,477 |
| 4/5/2012 |
| USD | 1,460 |
|
|
|
| USD | 1,460 |
| 1,460 |
|
|
| 1,460 |
| (17 | ) |
|
| (17 | ) | ||||
Goldman Sachs International |
| AUD | 2,796 |
|
|
|
| AUD | 2,796 |
| 2,896 |
| — |
| 2,896 |
| 4/5/2012 |
| USD | 2,970 |
|
|
|
| USD | 2,970 |
| 2,970 |
|
|
| 2,970 |
| 74 |
|
|
| 74 |
| ||||
Goldman Sachs International |
| PLN | 7,650 |
|
|
|
| PLN | 7,650 |
| 2,460 |
| — |
| 2,460 |
| 4/5/2012 |
| USD | 2,420 |
|
|
|
| USD | 2,420 |
| 2,420 |
|
|
| 2,420 |
| (40 | ) |
|
| (40 | ) | ||||
Goldman Sachs International |
| EUR | 1,715 |
|
|
|
| EUR | 1,715 |
| 2,287 |
| — |
| 2,287 |
| 4/5/2012 |
| USD | 2,286 |
|
|
|
| USD | 2,286 |
| 2,286 |
|
|
| 2,286 |
| (1 | ) |
|
| (1 | ) | ||||
Goldman Sachs International |
| JPY | 1,293,481 |
|
|
|
| JPY | 1,293,481 |
| 15,628 |
| — |
| 15,628 |
| 4/5/2012 |
| USD | 15,646 |
|
|
|
| USD | 15,646 |
| 15,646 |
|
|
| 15,646 |
| 18 |
|
|
| 18 |
| ||||
JPMorgan Chase Bank |
| USD | 16,233 |
|
|
|
| USD | 16,233 |
| 16,233 |
| — |
| 16,233 |
| 4/5/2012 |
| JPY | 1,293,481 |
|
|
|
| JPY | 1,293,481 |
| 15,628 |
|
|
| 15,628 |
| (605 | ) |
|
| (605 | ) | ||||
JPMorgan Chase Bank |
| USD | 1,482 |
|
|
|
| USD | 1,482 |
| 1,482 |
| — |
| 1,482 |
| 4/5/2012 |
| ZAR | 11,335 |
|
|
|
| ZAR | 11,335 |
| 1,477 |
|
|
| 1,477 |
| (5 | ) |
|
| (5 | ) | ||||
|
|
|
|
|
|
|
|
|
|
|
|
|
|
|
|
|
|
|
|
|
|
|
|
|
|
|
|
|
|
|
|
|
|
|
|
|
|
|
| ||||
|
|
|
|
|
|
|
|
|
|
|
|
|
|
|
|
|
|
|
|
|
|
|
|
|
|
|
|
|
|
|
|
|
|
|
|
|
|
|
|
|
| ||
JPMorgan Chase Bank |
| SGD | 1,402 |
|
|
|
| SGD | 1,402 |
| 1,115 |
| — |
| 1,115 |
| 4/5/2012 |
| USD | 1,115 |
|
|
|
| USD | 1,115 |
| 1,115 |
|
|
| 1,115 |
| — | @ |
|
| — | @ | ||||
UBS AG |
| USD | 439 |
|
|
|
| USD | 439 |
| 439 |
| — |
| 439 |
| 4/5/2012 |
| THB | 13,500 |
|
|
|
| THB | 13,500 |
| 438 |
|
|
| 438 |
| (1 | ) |
|
| (1 | ) | ||||
UBS AG |
| USD | 3,000 |
|
|
|
| USD | 3,000 |
| 3,000 |
| — |
| 3,000 |
| 4/5/2012 |
| CAD | 2,992 |
|
|
|
| CAD | 2,992 |
| 2,999 |
|
|
| 2,999 |
| (1 | ) |
|
| (1 | ) | ||||
UBS AG |
| USD | 6,708 |
|
|
|
| USD | 6,708 |
| 6,708 |
| — |
| 6,708 |
| 4/5/2012 |
| EUR | 5,062 |
|
|
|
| EUR | 5,062 |
| 6,751 |
|
|
| 6,751 |
| 43 |
|
|
| 43 |
| ||||
UBS AG |
| USD | 1,583 |
|
|
|
| USD | 1,583 |
| 1,583 |
| — |
| 1,583 |
| 4/5/2012 |
| KRW | 1,790,880 |
|
|
|
| KRW | 1,790,880 |
| 1,580 |
|
|
| 1,580 |
| (3 | ) |
|
| (3 | ) | ||||
UBS AG |
| USD | 953 |
|
|
|
| USD | 953 |
| 953 |
| — |
| 953 |
| 4/5/2012 |
| MYR | 2,900 |
|
|
|
| MYR | 2,900 |
| 946 |
|
|
| 946 |
| (7 | ) |
|
| (7 | ) | ||||
UBS AG |
| USD | 1,728 |
|
|
|
| USD | 1,728 |
| 1,728 |
| — |
| 1,728 |
| 4/5/2012 |
| CLP | 843,850 |
|
|
|
| CLP | 843,850 |
| 1,727 |
|
|
| 1,727 |
| (1 | ) |
|
| (1 | ) | ||||
UBS AG |
| USD | 1,116 |
|
|
|
| USD | 1,116 |
| 1,116 |
| — |
| 1,116 |
| 4/5/2012 |
| SGD | 1,402 |
|
|
|
| SGD | 1,402 |
| 1,115 |
|
|
| 1,115 |
| (1 | ) |
|
| (1 | ) | ||||
UBS AG |
| USD | 1,396 |
|
|
|
| USD | 1,396 |
| 1,396 |
| — |
| 1,396 |
| 4/5/2012 |
| GBP | 873 |
|
|
|
| GBP | 873 |
| 1,396 |
|
|
| 1,396 |
| (— | )@ |
|
| — | @ | ||||
UBS AG |
| MYR | 2,900 |
|
|
|
| MYR | 2,900 |
| 946 |
| — |
| 946 |
| 4/5/2012 |
| USD | 941 |
|
|
|
| USD | 941 |
| 941 |
|
|
| 941 |
| (5 | ) |
|
| (5 | ) | ||||
UBS AG |
| GBP | 1,027 |
|
|
|
| GBP | 1,027 |
| 1,643 |
| — |
| 1,643 |
| 4/5/2012 |
| USD | 1,606 |
|
|
|
| USD | 1,606 |
| 1,606 |
|
|
| 1,606 |
| (37 | ) |
|
| (37 | ) | ||||
UBS AG |
| EUR | 3,050 |
|
|
|
| EUR | 3,050 |
| 4,068 |
| — |
| 4,068 |
| 4/5/2012 |
| USD | 4,003 |
|
|
|
| USD | 4,003 |
| 4,003 |
|
|
| 4,003 |
| (65 | ) |
|
| (65 | ) | ||||
UBS AG |
| SEK | 6,400 |
|
|
|
| SEK | 6,400 |
| 967 |
| — |
| 967 |
| 4/5/2012 |
| USD | 962 |
|
|
|
| USD | 962 |
| 962 |
|
|
| 962 |
| (5 | ) |
|
| (5 | ) | ||||
UBS AG |
| CAD | 2,290 |
|
|
|
| CAD | 2,290 |
| 2,296 |
| — |
| 2,296 |
| 4/5/2012 |
| USD | 2,295 |
|
|
|
| USD | 2,295 |
| 2,295 |
|
|
| 2,295 |
| (1 | ) |
|
| (1 | ) | ||||
UBS AG |
| KRW | 1,790,880 |
|
|
|
| KRW | 1,790,880 |
| 1,580 |
| — |
| 1,580 |
| 4/5/2012 |
| USD | 1,582 |
|
|
|
| USD | 1,582 |
| 1,582 |
|
|
| 1,582 |
| 2 |
|
|
| 2 |
| ||||
UBS AG |
| THB | 13,500 |
|
|
|
| THB | 13,500 |
| 438 |
| — |
| 438 |
| 4/5/2012 |
| USD | 438 |
|
|
|
| USD | 438 |
| 438 |
|
|
| 438 |
| — | @ |
|
| — | @ | ||||
WELLS FARGO BANK N.A. |
| USD | 727 |
|
|
|
| USD | 727 |
| 727 |
| — |
| 727 |
| 4/5/2012 |
| SEK | 4,945 |
|
|
|
| SEK | 4,945 |
| 747 |
|
|
| 747 |
| 20 |
|
|
| 20 |
| ||||
WELLS FARGO BANK N.A. |
| USD | 2,897 |
|
|
|
| USD | 2,897 |
| 2,897 |
| — |
| 2,897 |
| 4/5/2012 |
| AUD | 2,796 |
|
|
|
| AUD | 2,796 |
| 2,896 |
|
|
| 2,896 |
| (1 | ) |
|
| (1 | ) | ||||
WELLS FARGO BANK N.A. |
| USD | 1,402 |
|
|
|
| USD | 1,402 |
| 1,402 |
| — |
| 1,402 |
| 4/5/2012 |
| PLN | 4,361 |
|
|
|
| PLN | 4,361 |
| 1,403 |
|
|
| 1,403 |
| 1 |
|
|
| 1 |
| ||||
WELLS FARGO BANK N.A. |
| CLP | 843,850 |
|
|
|
| CLP | 843,850 |
| 1,727 |
| — |
| 1,727 |
| 4/5/2012 |
| USD | 1,735 |
|
|
|
| USD | 1,735 |
| 1,735 |
|
|
| 1,735 |
| 8 |
|
|
| 8 |
| ||||
BANK OF AMERICA N.A. |
| MYR | 1,252 |
|
|
|
| MYR | 1,252 |
| 408 |
| — |
| 408 |
| 4/19/2012 |
| USD | 416 |
|
|
|
| USD | 416 |
| 416 |
|
|
| 416 |
| 8 |
|
|
| 8 |
| ||||
BANK OF AMERICA N.A. |
| CAD | 5,824 |
|
|
|
| CAD | 5,824 |
| 5,837 |
| — |
| 5,837 |
| 4/19/2012 |
| USD | 5,876 |
|
|
|
| USD | 5,876 |
| 5,876 |
|
|
| 5,876 |
| 39 |
|
|
| 39 |
| ||||
Deutsche Bank AG London |
| USD | 454 |
|
|
|
| USD | 454 |
| 454 |
| — |
| 454 |
| 4/19/2012 |
| INR | 22,766 |
|
|
|
| INR | 22,766 |
| 445 |
|
|
| 445 |
| (9 | ) |
|
| (9 | ) | ||||
Deutsche Bank AG London |
| JPY | 557,389 |
|
|
|
| JPY | 557,389 |
| 6,735 |
| — |
| 6,735 |
| 4/19/2012 |
| USD | 6,744 |
|
|
|
| USD | 6,744 |
| 6,744 |
|
|
| 6,744 |
| 9 |
|
|
| 9 |
| ||||
Deutsche Bank AG London |
| EUR | 2,450 |
|
|
|
| EUR | 2,450 |
| 3,267 |
| — |
| 3,267 |
| 4/19/2012 |
| USD | 3,212 |
|
|
|
| USD | 3,212 |
| 3,212 |
|
|
| 3,212 |
| (55 | ) |
|
| (55 | ) | ||||
Deutsche Bank AG London |
| AUD | 5,828 |
|
|
|
| AUD | 5,828 |
| 6,026 |
| — |
| 6,026 |
| 4/19/2012 |
| USD | 6,094 |
|
|
|
| USD | 6,094 |
| 6,094 |
|
|
| 6,094 |
| 68 |
|
|
| 68 |
| ||||
Deutsche Bank AG London |
| AUD | 5,630 |
|
|
|
| AUD | 5,630 |
| 5,821 |
| — |
| 5,821 |
| 4/19/2012 |
| USD | 5,908 |
|
|
|
| USD | 5,908 |
| 5,908 |
|
|
| 5,908 |
| 87 |
|
|
| 87 |
| ||||
Goldman Sachs International |
| EUR | 1,834 |
|
|
|
| EUR | 1,834 |
| 2,446 |
| — |
| 2,446 |
| 4/19/2012 |
| USD | 2,404 |
|
|
|
| USD | 2,404 |
| 2,404 |
|
|
| 2,404 |
| (42 | ) |
|
| (42 | ) | ||||
JPMorgan Chase Bank |
| USD | 202 |
|
|
|
| USD | 202 |
| 202 |
| — |
| 202 |
| 4/19/2012 |
| SGD | 254 |
|
|
|
| SGD | 254 |
| 202 |
|
|
| 202 |
| — | @ |
|
| — | @ | ||||
JPMorgan Chase Bank |
| NOK | 3,557 |
|
|
|
| NOK | 3,557 |
| 624 |
| — |
| 624 |
| 4/19/2012 |
| USD | 625 |
|
|
|
| USD | 625 |
| 625 |
|
|
| 625 |
| 1 |
|
|
| 1 |
| ||||
ROYAL BANK OF SCOTLAND PLC |
| USD | 645 |
|
|
|
| USD | 645 |
| 645 |
| — |
| 645 |
| 4/19/2012 |
| THB | 19,765 |
|
|
|
| THB | 19,765 |
| 640 |
|
|
| 640 |
| (5 | ) |
|
| (5 | ) | ||||
ROYAL BANK OF SCOTLAND PLC |
| USD | 1,152 |
|
|
|
| USD | 1,152 |
| 1,152 |
| — |
| 1,152 |
| 4/19/2012 |
| ILS | 4,349 |
|
|
|
| ILS | 4,349 |
| 1,172 |
|
|
| 1,172 |
| 20 |
|
|
| 20 |
| ||||
ROYAL BANK OF SCOTLAND PLC |
| CAD | 3,965 |
|
|
|
| CAD | 3,965 |
| 3,974 |
| — |
| 3,974 |
| 4/19/2012 |
| USD | 4,000 |
|
|
|
| USD | 4,000 |
| 4,000 |
|
|
| 4,000 |
| 26 |
|
|
| 26 |
| ||||
State Street Bank and Trust Co. |
| USD | 4,996 |
|
|
|
| USD | 4,996 |
| 4,996 |
| — |
| 4,996 |
| 4/19/2012 |
| TWD | 147,165 |
|
|
|
| TWD | 147,165 |
| 4,987 |
|
|
| 4,987 |
| (9 | ) |
|
| (9 | ) | ||||
State Street Bank and Trust Co. |
| CLP | 7,579,119 |
|
|
|
| CLP | 7,579,119 |
| 15,480 |
| — |
| 15,480 |
| 4/19/2012 |
| USD | 15,568 |
|
|
|
| USD | 15,568 |
| 15,568 |
|
|
| 15,568 |
| 88 |
|
|
| 88 |
| ||||
State Street Bank and Trust Co. |
| TWD | 112,023 |
|
|
|
| TWD | 112,023 |
| 3,796 |
| — |
| 3,796 |
| 4/19/2012 |
| USD | 3,797 |
|
|
|
| USD | 3,797 |
| 3,797 |
|
|
| 3,797 |
| 1 |
|
|
| 1 |
| ||||
UBS AG |
| USD | 2,200 |
|
|
|
| USD | 2,200 |
| 2,200 |
| — |
| 2,200 |
| 4/19/2012 |
| CHF | 2,023 |
|
|
|
| CHF | 2,023 |
| 2,241 |
|
|
| 2,241 |
| 41 |
|
|
| 41 |
| ||||
UBS AG |
| USD | 1,090 |
|
|
|
| USD | 1,090 |
| 1,090 |
| — |
| 1,090 |
| 4/19/2012 |
| AUD | 1,039 |
|
|
|
| AUD | 1,039 |
| 1,074 |
|
|
| 1,074 |
| (16 | ) |
|
| (16 | ) | ||||
UBS AG |
| USD | 3,423 |
|
|
|
| USD | 3,423 |
| 3,423 |
| — |
| 3,423 |
| 4/19/2012 |
| ZAR | 25,895 |
|
|
|
| ZAR | 25,895 |
| 3,368 |
|
|
| 3,368 |
| (55 | ) |
|
| (55 | ) | ||||
UBS AG |
| USD | 5,370 |
|
|
|
| USD | 5,370 |
| 5,370 |
| — |
| 5,370 |
| 4/19/2012 |
| CAD | 5,323 |
|
|
|
| CAD | 5,323 |
| 5,335 |
|
|
| 5,335 |
| (35 | ) |
|
| (35 | ) | ||||
UBS AG |
| USD | 632 |
|
|
|
| USD | 632 |
| 632 |
| — |
| 632 |
| 4/19/2012 |
| TRY | 1,140 |
|
|
|
| TRY | 1,140 |
| 637 |
|
|
| 637 |
| 5 |
|
|
| 5 |
| ||||
UBS AG |
| USD | 558 |
|
|
|
| USD | 558 |
| 558 |
| — |
| 558 |
| 4/19/2012 |
| GBP | 357 |
|
|
|
| GBP | 357 |
| 571 |
|
|
| 571 |
| 13 |
|
|
| 13 |
| ||||
UBS AG |
| USD | 2,082 |
|
|
|
| USD | 2,082 |
| 2,082 |
| — |
| 2,082 |
| 4/19/2012 |
| INR | 104,418 |
|
|
|
| INR | 104,418 |
| 2,042 |
|
|
| 2,042 |
| (40 | ) |
|
| (40 | ) | ||||
UBS AG |
| USD | 2,878 |
|
|
|
| USD | 2,878 |
| 2,878 |
| — |
| 2,878 |
| 4/19/2012 |
| KRW | 3,225,322 |
|
|
|
| KRW | 3,225,322 |
| 2,843 |
|
|
| 2,843 |
| (35 | ) |
|
| (35 | ) | ||||
UBS AG |
| USD | 2,798 |
|
|
|
| USD | 2,798 |
| 2,798 |
| — |
| 2,798 |
| 4/19/2012 |
| RUB | 82,909 |
|
|
|
| RUB | 82,909 |
| 2,821 |
|
|
| 2,821 |
| 23 |
|
|
| 23 |
| ||||
UBS AG |
| USD | 9,466 |
|
|
|
| USD | 9,466 |
| 9,466 |
| — |
| 9,466 |
| 4/19/2012 |
| HKD | 73,435 |
|
|
|
| HKD | 73,435 |
| 9,457 |
|
|
| 9,457 |
| (9 | ) |
|
| (9 | ) | ||||
UBS AG |
| USD | 1,418 |
|
|
|
| USD | 1,418 |
| 1,418 |
| — |
| 1,418 |
| 4/19/2012 |
| SGD | 1,784 |
|
|
|
| SGD | 1,784 |
| 1,419 |
|
|
| 1,419 |
| 1 |
|
|
| 1 |
| ||||
|
|
|
|
|
|
|
|
|
|
|
|
|
|
|
|
|
|
|
|
|
|
|
|
|
|
|
|
|
|
|
|
|
|
|
|
|
|
|
|
|
| ||
UBS AG |
| USD | 324 |
|
|
|
| USD | 324 |
| 324 |
| — |
| 324 |
| 4/19/2012 |
| NZD | 395 |
|
|
|
| NZD | 395 |
| 323 |
|
|
| 323 |
| (1 | ) |
|
| (1 | ) | ||||
UBS AG |
| USD | 552 |
|
|
|
| USD | 552 |
| 552 |
| — |
| 552 |
| 4/19/2012 |
| EUR | 413 |
|
|
|
| EUR | 413 |
| 551 |
|
|
| 551 |
| (1 | ) |
|
| (1 | ) | ||||
UBS AG |
| BRL | 647 |
|
|
|
| BRL | 647 |
| 353 |
| — |
| 353 |
| 4/19/2012 |
| USD | 360 |
|
|
|
| USD | 360 |
| 360 |
|
|
| 360 |
| 7 |
|
|
| 7 |
| ||||
UBS AG |
| JPY | 249,335 |
|
|
|
| JPY | 249,335 |
| 3,013 |
| — |
| 3,013 |
| 4/19/2012 |
| USD | 3,017 |
|
|
|
| USD | 3,017 |
| 3,017 |
|
|
| 3,017 |
| 4 |
|
|
| 4 |
| ||||
UBS AG |
| EUR | 1,842 |
|
|
|
| EUR | 1,842 |
| 2,457 |
| — |
| 2,457 |
| 4/19/2012 |
| USD | 2,416 |
|
|
|
| USD | 2,416 |
| 2,416 |
|
|
| 2,416 |
| (41 | ) |
|
| (41 | ) | ||||
UBS AG |
| KRW | 1,630,520 |
|
|
|
| KRW | 1,630,520 |
| 1,437 |
| — |
| 1,437 |
| 4/19/2012 |
| USD | 1,439 |
|
|
|
| USD | 1,439 |
| 1,439 |
|
|
| 1,439 |
| 2 |
|
|
| 2 |
| ||||
UBS AG |
| HKD | 53,944 |
|
|
|
| HKD | 53,944 |
| 6,947 |
| — |
| 6,947 |
| 4/19/2012 |
| USD | 6,947 |
|
|
|
| USD | 6,947 |
| 6,947 |
|
|
| 6,947 |
| (— | )@ |
|
| — | @ | ||||
UBS AG |
| INR | 91,156 |
|
|
|
| INR | 91,156 |
| 1,783 |
| — |
| 1,783 |
| 4/19/2012 |
| USD | 1,786 |
|
|
|
| USD | 1,786 |
| 1,786 |
|
|
| 1,786 |
| 3 |
|
|
| 3 |
| ||||
Goldman Sachs International |
| USD | 2,287 |
|
|
|
| USD | 2,287 |
| 2,287 |
| — |
| 2,287 |
| 4/30/2012 |
| EUR | 1,715 |
|
|
|
| EUR | 1,715 |
| 2,287 |
|
|
| 2,287 |
| — | @ |
|
| — | @ | ||||
Goldman Sachs International |
| SEK | 1,455 |
|
|
|
| SEK | 1,455 |
| 220 |
| — |
| 220 |
| 4/30/2012 |
| USD | 220 |
|
|
|
| USD | 220 |
| 220 |
|
|
| 220 |
| — | @ |
|
| — | @ | ||||
JPMorgan Chase Bank |
| USD | 1,115 |
|
|
|
| USD | 1,115 |
| 1,115 |
| — |
| 1,115 |
| 4/30/2012 |
| SGD | 1,402 |
|
|
|
| SGD | 1,402 |
| 1,115 |
|
|
| 1,115 |
| — | @ |
|
| — | @ | ||||
JPMorgan Chase Bank |
| MXN | 10,178 |
|
|
|
| MXN | 10,178 |
| 793 |
| — |
| 793 |
| 4/30/2012 |
| USD | 796 |
|
|
|
| USD | 796 |
| 796 |
|
|
| 796 |
| 3 |
|
|
| 3 |
| ||||
JPMorgan Chase Bank |
| ZAR | 11,335 |
|
|
|
| ZAR | 11,335 |
| 1,472 |
| — |
| 1,472 |
| 4/30/2012 |
| USD | 1,477 |
|
|
|
| USD | 1,477 |
| 1,477 |
|
|
| 1,477 |
| 5 |
|
|
| 5 |
| ||||
UBS AG |
| USD | 2,294 |
|
|
|
| USD | 2,294 |
| 2,294 |
| — |
| 2,294 |
| 4/30/2012 |
| CAD | 2,290 |
|
|
|
| CAD | 2,290 |
| 2,295 |
|
|
| 2,295 |
| 1 |
|
|
| 1 |
| ||||
UBS AG |
| USD | 1,579 |
|
|
|
| USD | 1,579 |
| 1,579 |
| — |
| 1,579 |
| 4/30/2012 |
| KRW | 1,790,880 |
|
|
|
| KRW | 1,790,880 |
| 1,577 |
|
|
| 1,577 |
| (2 | ) |
|
| (2 | ) | ||||
UBS AG |
| USD | 437 |
|
|
|
| USD | 437 |
| 437 |
| — |
| 437 |
| 4/30/2012 |
| THB | 13,500 |
|
|
|
| THB | 13,500 |
| 437 |
|
|
| 437 |
| (— | )@ |
|
| — | @ | ||||
UBS AG |
| NOK | 2,428 |
|
|
|
| NOK | 2,428 |
| 426 |
| — |
| 426 |
| 4/30/2012 |
| USD | 422 |
|
|
|
| USD | 422 |
| 422 |
|
|
| 422 |
| (4 | ) |
|
| (4 | ) | ||||
UBS AG |
| GBP | 873 |
|
|
|
| GBP | 873 |
| 1,396 |
| — |
| 1,396 |
| 4/30/2012 |
| USD | 1,396 |
|
|
|
| USD | 1,396 |
| 1,396 |
|
|
| 1,396 |
| — | @ |
|
| — | @ | ||||
WELLS FARGO BANK N.A. |
| AUD | 2,796 |
|
|
|
| AUD | 2,796 |
| 2,887 |
| — |
| 2,887 |
| 4/30/2012 |
| USD | 2,889 |
|
|
|
| USD | 2,889 |
| 2,889 |
|
|
| 2,889 |
| 2 |
|
|
| 2 |
| ||||
WELLS FARGO BANK N.A. |
| PLN | 4,361 |
|
|
|
| PLN | 4,361 |
| 1,399 |
| — |
| 1,399 |
| 4/30/2012 |
| USD | 1,398 |
|
|
|
| USD | 1,398 |
| 1,398 |
|
|
| 1,398 |
| (1 | ) |
|
| (1 | ) | ||||
Goldman Sachs International |
| USD | 15,650 |
|
|
|
| USD | 15,650 |
| 15,650 |
| — |
| 15,650 |
| 5/1/2012 |
| JPY | 1,293,481 |
|
|
|
| JPY | 1,293,481 |
| 15,631 |
|
|
| 15,631 |
| (19 | ) |
|
| (19 | ) | ||||
|
|
|
|
|
|
|
|
|
|
| 230,269 |
| 3,867 |
| 234,136 |
|
|
|
|
|
|
|
|
|
|
|
| 229,722 |
| 3,882 |
| 233,604 |
| (547 | ) | 15 |
| (532 | ) | ||||
Futures Contracts
The Portfolio had the following futures contracts open at period end:
|
| Global |
| MSIFT Global |
| Global |
| MSIFT Global |
| Combined |
|
|
| Global |
| MSIFT Global |
| Combined Pro |
| ||||
|
| Number of |
| Number of |
| Value (000) |
| Value (000) |
| Value (000) |
| Expiration Date |
| Unrealized |
| Unrealized |
| Unrealized |
| ||||
Long: |
|
|
|
|
|
|
|
|
|
|
|
|
|
|
|
|
|
|
| ||||
DAX Index (Germany) |
| 34 |
| 4 |
| $ | 7,891 |
| 928 |
| $ | 8,819 |
| Jun-12 |
| $ | 99 |
| 12 |
| $ | 111 |
|
Euro Stoxx 50 Index (Germany) |
| 131 |
| 13 |
| 4,209 |
| 418 |
| 4,627 |
| Jun-12 |
| (127 | ) | (11 | ) | (138 | ) | ||||
FTSE 100 Index (United Kingdom) |
| 40 |
| 1 |
| 3,666 |
| 92 |
| 3,758 |
| Jun-12 |
| (46 | ) | (1 | ) | (47 | ) | ||||
FTSE MIB Index (United Kingdom) |
| 44 |
| 4 |
| 4,620 |
| 420 |
| 5,040 |
| Jun-12 |
| (157 | ) | (15 | ) | (172 | ) | ||||
NIKKEI 225 Index (Japan) |
| 50 |
| 6 |
| 3,070 |
| 368 |
| 3,438 |
| Jun-12 |
| 23 |
| 9 |
| 32 |
| ||||
S&P 500 E-Mini Index |
| 361 |
| 83 |
| 25,328 |
| 5,823 |
| 31,151 |
| Jun-12 |
| 171 |
| 57 |
| 228 |
| ||||
U.S. Treasury 10 yr. Note |
| 24 |
| 6 |
| 3,108 |
| 777 |
| 3,885 |
| Jun-12 |
| 28 |
| 8 |
| 36 |
| ||||
U.S. Treasury 30 yr. Bond |
| 53 |
| 1 |
| 7,301 |
| 138 |
| 7,439 |
| Jun-12 |
| (153 | ) | 2 |
| (151 | ) | ||||
10 yr. Japan Government Bond |
| 4 |
|
|
| 6,863 |
|
|
| 6,863 |
| Jun-12 |
| (20 | ) | — |
| (20 | ) | ||||
USD INDEX CURRENCY FUTURES JUN12 ICUS |
| 75 |
|
|
| 5,935 |
|
|
| 5,935 |
| Jun-12 |
| (113 | ) | — |
| (113 | ) | ||||
CAC 40 Index |
| 52 |
|
|
| 2,375 |
|
|
| 2,375 |
| Apr-12 |
| (66 | ) | — |
| (66 | ) | ||||
SGX MSCI Singapore Index |
| 41 |
|
|
| 2,251 |
|
|
| 2,251 |
| Apr-12 |
| 11 |
| — |
| 11 |
| ||||
GERMAN EURO BOBL FUTURES JUN12 XEUR |
| 12 |
|
|
| 1,986 |
|
|
| 1,986 |
| Jun-12 |
| (1 | ) | — |
| (1 | ) | ||||
Hang Seng China ENT Index |
| 8 |
|
|
| 1,056 |
|
|
| 1,056 |
| Apr-12 |
| (26 | ) | — |
| (26 | ) | ||||
|
|
|
|
|
|
|
|
|
|
|
|
|
|
|
|
|
|
|
| ||||
|
|
|
|
|
|
|
|
|
|
|
|
|
|
|
|
|
|
|
| ||||
Short: |
|
|
|
|
|
|
|
|
|
|
|
|
|
|
|
|
|
|
| ||||
ASX Spi 200 Index (Australia) |
| 9 |
| 1 |
| (1,013 | ) | (113 | ) | (1,126 | ) | Jun-12 |
| (10 | ) | (1 | ) | (11 | ) | ||||
Copper High Grade Index |
|
|
| 1 |
|
|
| (96 | ) | (96 | ) | May-12 |
| — |
| 4 |
| 4 |
| ||||
IBEX 35 Index (United Kingdom) |
| 32 |
| 4 |
| (3,381 | ) | (423 | ) | (3,804 | ) | Apr-12 |
| 2 |
| — | @ | 2 |
| ||||
MSCI Emerging Market E-Mini |
| 165 |
| 15 |
| (8,573 | ) | (779 | ) | (9,352 | ) | Jun-12 |
| 120 |
| 11 |
| 131 |
| ||||
S&P TSE 60 Index |
| 102 |
| 8 |
| (14,413 | ) | (1,129 | ) | (15,542 | ) | Jun-12 |
| 37 |
| 2 |
| 39 |
| ||||
U.S. Treasury 2 yr. Note |
| 6 |
| 2 |
| (1,321 | ) | (440 | ) | (1,761 | ) | Jun-12 |
| (2 | ) | (— | )@ | (2 | ) | ||||
U.S. Treasury Ultra Long Bond |
| 18 |
| 4 |
| (2,717 | ) | (604 | ) | (3,321 | ) | Jun-12 |
| (45 | ) | (3 | ) | (48 | ) | ||||
U.S. Treasury 30 yr. Bond |
| 31 |
|
|
| (4,270 | ) |
|
| (4,270 | ) | Jun-12 |
| 121 |
|
|
| 121 |
| ||||
U.S. Treasury 10 yr. Note |
| 156 |
|
|
| (20,200 | ) |
|
| (20,200 | ) | Jun-12 |
| 273 |
|
|
| 273 |
| ||||
German Euro Bund |
| 123 |
|
|
| (22,719 | ) |
|
| (22,719 | ) | Jun-12 |
| (114 | ) |
|
| (114 | ) | ||||
U.S. Treasury 5 yr. Note |
| 201 |
|
|
| (24,630 | ) |
|
| (24,630 | ) | Jun-12 |
| 94 |
|
|
| 94 |
| ||||
|
|
|
|
|
|
|
|
|
|
|
|
|
| 99 |
| 74 |
| 173 |
| ||||
Interest Rate Swap Agreements
The Portfolio had the following interest rate swap agreements open at period end:
|
| Global |
| MSIFT |
| Global |
| MSIFT |
| Global |
| MSIFT |
|
|
| Global |
| MSIFT |
| Global |
| MSIFT |
| Combined Pro |
| |||||||
Swap Counterparty |
| Floating |
| Floating |
| Pay/Receive |
| Pay/Receive |
| Fixed |
| Fixed |
| Termination |
| Notional |
| Notional |
| Unrealized |
| Unrealized |
| Unrealized |
| |||||||
Bank of America |
| 6 Month LIBOR |
| 6 Month EURIBOR |
| Pay |
| Pay |
| 4.26 |
| 4.26 |
| 8/18/2026 |
| EUR | 9,270 |
| EUR | 910 |
| $ | 413 |
| $ | 40 |
| $ | 453 |
| ||
Bank of America |
| 3 Month LIBOR |
| 3 Month LIBOR |
| Receive |
| Receive |
| 4.35 |
| 4.35 |
| 8/18/2026 |
| $ | 12,415 |
| $ | 1,220 |
| (220 | ) | (22 | ) | (242 | ) | |||||
Bank of America |
| 6 Month EURIBOR |
| 6 Month EURIBOR |
| Receive |
| Receive |
| 3.61 |
| 3.61 |
| 8/18/2031 |
| EUR | 11,705 |
| EUR | 1150 |
| (360 | ) | (35 | ) | (395 | ) | |||||
Bank of America |
| 3 Month LIBOR |
| 3 Month LIBOR |
| Pay |
| Pay |
| 4.15 |
| 4.15 |
| 8/18/2031 |
| $ | 15,400 |
| $ | 1,515 |
| 212 |
| 21 |
| 233 |
| |||||
Goldman Sachs International |
| 3 Month LIBOR |
| 3 Month LIBOR |
| Receive |
| Receive |
| 2.42 |
| 2.42 |
| 3/22/2022 |
| $ | 2,138 |
| $ | 173 |
| (29 | ) | (2 | ) | (31 | ) | |||||
JPMorgan Chase Bank |
| 3 Month LIBOR |
| 3 Month LIBOR |
| Receive |
| Receive |
| 2.43 |
| 2.43 |
| 3/22/2022 |
| $ | 1,036 |
| $ | 84 |
| (16 | ) | (1 | ) | (17 | ) | |||||
|
|
|
|
|
|
|
|
|
|
|
|
|
|
|
|
|
|
|
| — |
| 1 |
| 1 |
| |||||||
Total Return Swap Agreements
The Portfolio had the following total return swap agreements open at period end:
|
| Global |
| MSIFT |
| Global |
| MSIFT |
| Global |
| MSIFT |
| Global |
| MSIFT |
|
|
| Global |
| MSIFT |
| Combined |
| ||
Counterparty |
| Index |
| Index |
| Notional |
| Notional |
| Floating |
| Floating |
| Pay/Receive |
| Pay/Receive |
| Maturity |
| Unrealized |
| Unrealized |
| Unrealized |
| ||
Goldman Sachs |
|
|
| Custom Construction Index |
|
|
| 445 |
|
|
| 1-Month USD-LIBOR-minus 0.47% |
|
|
| Pay |
| 3/27/2013 |
|
|
| $ | 9 |
| $ | 9 |
|
Goldman Sachs |
|
|
| Custom Miners Index |
|
|
| 145 |
|
|
| 1-Month USD-LIBOR-minus 0.35% |
|
|
| Pay |
| 2/13/2013 |
|
|
| 1 |
| 1 |
| ||
Goldman Sachs |
|
|
| Custom Miners Index |
|
|
| 268 |
|
|
| 1-Month USD-LIBOR-minus 0.35% |
|
|
| Pay |
| 2/13/2013 |
|
|
| 1 |
| 1 |
| ||
Bank of America NA |
|
|
| Merrill Lynch Custom Luxury Basket Index |
|
|
| 432 |
|
|
| 3-Month USD-LIBOR-minus 0.15% |
|
|
| Pay |
| 3/26/2013 |
|
|
| 2 |
| 2 |
| ||
Bank of America NA |
|
|
| Merrill Lynch Custom Test Index |
|
|
| 431 |
|
|
| 3-Month USD-LIBOR-minus 0.10% |
|
|
| Pay |
| 3/26/2013 |
|
|
| (3 | ) | (3 | ) | ||
Goldman Sachs |
|
|
| Custom Miners Index |
| 1,844 |
|
|
| 1-Month USD-LIBOR-minus 0.35% |
|
|
| Pay |
|
|
| 2/13/2013 |
| 10 |
|
|
| 10 |
| ||
Goldman Sachs |
|
|
| Custom Miners Index |
| 3,334 |
|
|
| 1-Month USD-LIBOR-minus 0.35% |
|
|
| Pay |
|
|
| 2/13/2013 |
| 18 |
|
|
| 18 |
| ||
Barclays Bank PLC |
|
|
| MSCI Emerging Markets E-Mini |
| 36,618 |
|
|
| 3-Month USD-LIBOR-plus 0.43% |
|
|
| Receive |
|
|
| 3/5/2013 |
| (1,261 | ) |
|
| (1,261 | ) | ||
Bank of America NA |
|
|
| Merrill Lynch Custom Luxury Basket Index |
| 4,744 |
|
|
| 3-Month USD-LIBOR-minus 0.15% |
|
|
| Pay |
|
|
| 3/26/2013 |
| 24 |
|
|
| 24 |
| ||
Bank of America NA |
|
|
| Merrill Lynch Custom Test Index |
| 4,744 |
|
|
| 3-Month USD-LIBOR-minus 0.10% |
|
|
| Pay |
|
|
| 3/26/2013 |
| (28 | ) |
|
| (28 | ) | ||
Goldman Sachs |
|
|
| Custom Construction Index |
| 5,524 |
|
|
| 1-Month USD-LIBOR-minus 0.47% |
|
|
| Pay |
|
|
| 3/27/2013 |
| 92 |
|
|
| 92 |
| ||
|
|
|
|
|
|
|
|
|
|
|
|
|
|
|
|
|
|
|
| (1,145 | ) | 10 |
| (1,135 | ) | ||
Zero Coupon Swap Agreements
The Portfolio had the following zero coupon swap agreements open at period end:
|
| Global |
| MSIFT |
| Global Strategist |
| MSIFT Global |
| Global |
| MSIFT |
|
|
| Global |
| MSIFT Global |
| Combined |
| |||
Swap Counterparty |
| Notional |
| Notional |
| Floating Rate Index |
| Floating Rate |
| Pay/Receive |
| Pay/Receive |
| Termination |
| Unrealized |
| Unrealized |
| Unrealized |
| |||
Barclays Capital |
| $ | 2,645 |
|
|
| 3 Month LIBOR |
|
|
| Receive |
|
|
| 11/15/19 |
| $ | (1,016 | ) |
|
| $ | (1,016 | ) |
Barclays Capital |
| $ | 3,134 |
|
|
| 3 Month LIBOR |
|
|
| Pay |
|
|
| 11/16/19 |
| 553 |
|
|
| 553 |
| ||
|
|
|
|
|
|
|
|
|
|
|
|
|
|
|
| (463 | ) |
|
| $ | (463 | ) | ||
@ |
| Value is less than $500. |
EURIBOR |
| Euro Interbank Offered Rate. |
LIBOR |
| London Interbank Offered Rate. |
AUD |
| Australian Dollar |
BRL |
| Brazilian Real |
CHF |
| Swiss Franc |
CLP |
| Chilean Peso |
EUR |
| Euro |
GBP |
| British Pound |
HKD |
| Hong Kong Dollar |
ILS |
| Israeli New Sheqel |
INR |
| Indian Rupee |
JPY |
| Japanese Yen |
KRW |
| South Korean Won |
MYR |
| Malaysian Ringgit |
MXN |
| Mexican Peso |
NOK |
| Norwegian Krone |
NZD |
| New Zealand Dollar |
PLN |
| Polish Zloty |
RUB |
| Russian Ruble |
SEK |
| Swedish Krone |
SGD |
| Singapore Dollar |
THB |
| Thai Baht |
USD |
| United States Dollar |
ZAR |
| South African Rand |
NOTES TO SCHEDULE OF PORTFOLIO INVESTMENTS:
(a) | Security is subject to delayed delivery. |
(b) | 144A security — Certain conditions for public sale may exist. Unless otherwise noted, these securities are deemed to be liquid. |
(c) | Variable/Floating Rate Security — Interest rate changes on these instruments are based on changes in a designated base rate. The rates shown are those in effect on March 31, 2012. |
(d) | All or a portion of this security was on loan at March 31, 2012. |
(e) | Non-income producing security. |
(f) | At March 31, 2012, the Portfolio held a fair valued security valued at approximately $152,000, representing 0.4% of net assets. This security has been fair valued as determined in good faith under procedures established by and under the general supervision of the Fund’s Trustees. |
(g) | Security has been deemed illiquid at March 31, 2012. |
(h) | Rate shown is the yield to maturity at March 31, 2012. |
(i) | Comprised of securities in separate entities that are traded as a single stapled security. |
(j) | Security trades on the Hong Kong exchange. |
(k) | Consists of one or more classes of securities traded together as a unit; stocks with attached warrants. |
(l) | Security is linked to the Dow Jones UBS Commodities Index Total Return. The index is currently comprised of futures contracts on nineteen physical commodities traded on U.S. exchanges, with the exception of aluminum, nickel, and zinc, which trade on the London Metal Exchange. |
(m) | When-issued security. |
(n) | A portion of this security has been physically segregated in connection with open swap agreements. |
(o) | Securities are available for collateral in connection with securities purchased on a forward commitment basis, open foreign currency exchange contracts, futures contracts and swap agreements. |
(p) | Affiliate security. |
ADR | American Depositary Receipt. |
IO | Interest Only. |
MTN | Medium Term Note. |
PAC | Planned Amortization Class. |
REIT | Real Estate Investment Trust. |
REMIC | Real Estate Mortgage Investment Conduit. |
SDR | Swedish Depositary Receipt. |
TBA | To Be Announced. |
BTAN | Bons du Trésor à Intérets Annuels (Treasury Bill Annual Interest) |
OAT | Obligations Assimilables du Trésor (French Treasury Obligation) |
CVA | Certificaten Van Aandelen |
PPS | Price Protected Shares |
SPDR | Standard & Poor’s Depository Receipt |
As of March 31, 2012, the gross unrealized appreciation (depreciation) of investments based on the aggregate cost of investments for federal income tax purposes was as follows:
|
| Global Strategist |
| MSIFT Global |
| Combined Pro |
| |||
Aggregate gross unrealized appreciation |
| $ | 47,487,000 |
| $ | 2,779,000 |
| $ | 50,266,000 |
|
Aggregate gross unrealized depreciation |
| (16,272,000 | ) | (1,190,000 | ) | (17,462,000 | ) | |||
Net unrealized appreciation (depreciation) |
| $ | 31,215,000 |
| $ | 1,589,000 |
| $ | 32,804,000 |
|
|
|
|
|
|
|
|
| |||
Federal income tax cost of investments |
| $ | 452,754,000 |
| $ | 47,113,000 |
| $ | 499,867,000 |
|
Fair Value Measurement: FASB ASC 820, “Fair Value Measurements and Disclosures” (“ASC 820”), defines fair value as the value that the Fund would receive to sell an investment or pay to transfer a liability in a timely transaction with an independent buyer in the principal market, or in the absence of a principal market the most advantageous market for the investment or liability. ASC 820 establishes a three-tier hierarchy to distinguish between (1) inputs that reflect the assumptions market participants would use in valuing an asset or liability developed based on market data obtained from sources independent of the reporting entity (observable inputs) and (2) inputs that reflect the reporting entity’s own assumptions about the assumptions market participants would use in valuing an asset or liability developed based on the best information available in the circumstances (unobservable inputs) and to establish classification of fair value measurements for disclosure purposes. Various inputs are used in determining the value of the Fund’s investments. The inputs are summarized in the three broad levels listed below.
· Level 1 — unadjusted quoted prices in active markets for identical investments
· Level 2 — other significant observable inputs (including quoted prices for similar investments, interest rates, prepayment speeds, credit risk, etc.)
· Level 3 — significant unobservable inputs including the Fund’s own assumptions in determining the fair value of investments. Factors considered in making this determination may include, but are not limited to, information obtained by contactingthe issuer, analysts, or the appropriate stock exchange (for exchange-traded securities), analysis of the issuer’s financial statements or other available documents and, if necessary, available information concerning other securities in similar circumstances
The inputs or methodology used for valuing securities are not necessarily an indication of the risk associated with investing in those securities and the determination of the significance of a particular input to the fair value measurement in its entirety requires judgment and considers factors specific to each security.
In May 2011, FASB issued Accounting Standards Update (“ASU”) 2011-04. The amendments in this update are the results of the work of FASB and the International Accounting Standards Board to develop common requirements for measuring fair value and for disclosing information about fair value measurements, which are effective during interim and annual periods beginning after December 15, 2011. Consequently, these amendments improve the comparability of fair value measurements presented and disclosed in the financial statements prepared in accordance with GAAP and International Financial Reporting Standards. At this time, the Fund’s management is evaluating the implications of ASU 2011-04.
The following is a summary of the inputs used to value the Portfolio’s investments as of March 31, 2012.
Portfolios |
| Global Strategist |
| MSIFT Global Strategist |
| Combined Pro Forma |
| |||
Investments in Securities (Level 1) (000) |
| $ | 309,251,000 |
| $ | 31,952,000 |
| $ | 341,203,000 |
|
Investments in Securities (Level 2) (000) |
| 174,718,000 |
| 16,598,000 |
| 191,316,000 |
| |||
Investments in Securities (Level 3) (000) |
| — |
| 152,000 |
| 152,000 |
| |||
Total for Investments in Securities (000) |
| 483,969,000 |
| 48,702,000 |
| 532,671,000 |
| |||
Other Financial Instruments* (Level 1) (000) |
| 100,000 |
| 74,000 |
| 174,000 |
| |||
Other Financial Instruments* (Level 2) (000) |
| (2,116,000 | ) | 26,000 |
| (2,090,000 | ) | |||
Other Financial Instruments* (Level 3) (000) |
| — |
| — |
| — |
| |||
Total for Other Financial Instruments (000) |
| $ | (2,016,000 | ) | $ | 100,000 |
| $ | (1,916,000 | ) |
* Other financial instruments include futures, forwards and swaps.
Transfers between investment levels may occur as the markets fluctuate and/or the availability of data used in an investment’s valuation changes. The Portfolio recognizes transfers between the levels as of the end of the period. As of March 31, 2012, the Portfolio did not have any significant investment transfers between investment levels.
At March 31, 2012, there were no Level 3 investments in Morgan Stanley Global Strategist for which significant unobservable inputs were used to determine fair value. The following is a reconciliation of MSIFT Global Strategist investments in which significant unobservable inputs (Level 3) were used in determining fair value.
|
| Convertible Preferred Stock (000) |
| |
|
|
|
| |
Beginning Balance |
| $ | 84 |
|
Purchases |
| — |
| |
Sales |
| — |
| |
Amortization of discount |
| — |
| |
Transfers in |
| — |
| |
Transfers out |
| — |
| |
Change in unrealized appreciation (depreciation) |
| 68 |
| |
Realized gains (losses) |
| — |
| |
Ending Balance |
| $ | 152 |
|
|
|
|
| |
Net change in unrealized appreciation/depreciation from investments still held as of March 31, 2012 |
| $ | 68 |
|
Security Valuation: Bonds and other fixed income securities may be valued according to the broadest and most representative market. In addition, bonds and other fixed income securities may be valued on the basis of prices provided by a pricing service. The prices provided by a pricing service take into account broker dealer market price quotations for institutional size trading in similar groups of securities, security quality, maturity, coupon and other security characteristics as well as any developments related to the specific securities. Short-term debt securities purchased with remaining maturities of 60 days or less are valued at amortized cost, unless the Board of Trustees (the “Trustees”) determines such valuation does not reflect the securities’ market value, in which case these securities will be valued at their fair value as determined in good faith under procedures adopted by the Trustees. Equity securities listed on a U.S. exchange are valued at the latest quoted sales price on the valuation date. Equity securities listed or traded on NASDAQ, for which market quotations are available, are valued at the NASDAQ Official Closing Price. Securities listed on a foreign exchange are valued at their closing price, except as noted below. Unlisted and listed equity securities not traded on the valuation date, for which market quotations are readily available, are valued at the mean between the current bid and asked prices obtained from reputable brokers.
All other securities and investments for which market values are not readily available, including restricted securities, and those securities for which it is inappropriate to determine prices in accordance with the aforementioned procedures, are valued at fair value as determined in good faith under procedures adopted by the Trustees, although the actual calculations may be done by others. Factors considered in making this determination may include, but are not limited to, information obtained by contacting the issuer, analysts, or the appropriate stock exchange (for exchange-traded securities), analysis of the issuer’s financial statements or other available documents and, if necessary, available information concerning other securities in similar circumstances.
Most foreign markets close before the New York Stock Exchange (“NYSE”). Occasionally, developments that could affect the closing prices of securities and other assets may occur between the times at which valuations of such securities are determined (that is, close of the foreign market on which the securities trade) and the close of business on the NYSE. If these developments are expected to materially affect the value of the securities, the valuations may be adjusted to reflect the estimated fair value as of the close of the NYSE, as determined in good faith under procedures established by the Trustees.
MORGAN STANLEY INSTITUTIONAL FUND TRUST
STATEMENT OF ADDITIONAL INFORMATION
January 31, 2012
Morgan Stanley Institutional Fund Trust (the "Fund") is a mutual fund consisting of seven portfolios offering a variety of investment alternatives. This Statement of Additional Information (the "SAI") sets forth information about the Fund applicable to all seven portfolios (each a "Portfolio" and collectively, the "Portfolios"). Following is a list of the Portfolios:
| Share Class and Ticker Symbol | |||||||||||||||||||
| Class I | Class P | Class H | Class L | ||||||||||||||||
| U.S. EQUITY PORTFOLIO: | |||||||||||||||||||
| Mid Cap Growth Portfolio* | MPEGX | MACGX | — | — | |||||||||||||||
| FIXED INCOME PORTFOLIOS: | |||||||||||||||||||
| Core Fixed Income Portfolio | MPSFX | MDIAX | — | — | |||||||||||||||
| Core Plus Fixed Income Portfolio | MPFIX | MFXAX | — | — | |||||||||||||||
| Corporate Bond Portfolio (formerly Investment Grade Fixed Income Portfolio) | MPFDX | MIGAX | MSGHX | MGILX | |||||||||||||||
| Limited Duration Portfolio | MPLDX | MLDAX | — | — | |||||||||||||||
| Long Duration Fixed Income Portfolio | MSFIX | MSFVX | — | — | |||||||||||||||
| BALANCED PORTFOLIO: | |||||||||||||||||||
| Balanced Portfolio | MPBAX | MBAAX | — | — | |||||||||||||||
* Portfolio is currently closed to new investors, with certain exceptions.
This SAI is not a prospectus but should be read in conjunction with the Fund's prospectuses, each dated January 31, 2012, as may be supplemented from time to time. To obtain any of these prospectuses, please call Shareholder Services at the number indicated below.
The Fund's most recent Annual Report to Shareholders is a separate document supplied with this SAI and includes the Fund's audited financial statements, including notes thereto, and the report of Ernst & Young LLP, which are incorporated by reference into this SAI.
Each Portfolio is "diversified" and, as such, each Portfolio's investments are required to meet certain diversification requirements under federal securities laws.
SHAREHOLDER SERVICES: 1-800-548-7786
PRICES AND INVESTMENT RESULTS: WWW.MORGANSTANLEY.COM/IM
TABLE OF CONTENTS
| Page | |||||||
| THE PORTFOLIOS' INVESTMENTS AND STRATEGIES | 1 | ||||||
| INVESTMENTS AND RISKS | 7 | ||||||
| INVESTMENT LIMITATIONS | 37 | ||||||
| DISCLOSURE OF PORTFOLIO HOLDINGS | 39 | ||||||
| PURCHASE OF SHARES | 42 | ||||||
| REDEMPTION OF SHARES | 43 | ||||||
| TRANSACTIONS WITH BROKER/DEALERS | 44 | ||||||
| SHAREHOLDER SERVICES | 44 | ||||||
| VALUATION OF SHARES | 44 | ||||||
| MANAGEMENT OF THE FUND | 45 | ||||||
| COMPENSATION | 57 | ||||||
| INVESTMENT ADVISER | 58 | ||||||
| PRINCIPAL UNDERWRITER | 63 | ||||||
| DISTRIBUTION AND SHAREHOLDER SERVICES PLANS | 63 | ||||||
| FUND ADMINISTRATION | 65 | ||||||
| OTHER SERVICE PROVIDERS | 65 | ||||||
| BROKERAGE TRANSACTIONS | 66 | ||||||
| VALUE OF PORTFOLIO HOLDINGS | 69 | ||||||
| GENERAL INFORMATION | 70 | ||||||
| TAX CONSIDERATIONS | 71 | ||||||
| PRINCIPAL HOLDERS OF SECURITIES | 76 | ||||||
| PERFORMANCE INFORMATION | 79 | ||||||
| FINANCIAL STATEMENTS | 81 | ||||||
| APPENDIX A — PROXY VOTING POLICY AND PROCEDURES | A-1 | ||||||
| APPENDIX B — DESCRIPTION OF RATINGS | B-1 | ||||||
-i-
THE PORTFOLIOS' INVESTMENTS AND STRATEGIES
Each prospectus describes the investment objectives, principal investment strategies and principal risks associated with each applicable Portfolio. The Portfolios may engage in a variety of investment strategies and invest in a variety of securities and other instruments. The following tables summarize the permissible investments for each Portfolio. The tables exclude investments that Portfolios may make solely for temporary defensive purposes. More details about each investment and related risks are provided in the discussion following the tables.
EQUITY AND BALANCED PORTFOLIOS
| Mid Cap Growth Portfolio | Balanced Portfolio | ||||||||||
| Investments | |||||||||||
| ADRs | x | x | |||||||||
| Agencies | x | x | |||||||||
| Asset-Backed Securities | x | ||||||||||
| Borrowing | x | x | |||||||||
| Brady Bonds | x | ||||||||||
| Cash Equivalents | x | x | |||||||||
| Commercial Paper | x | x | |||||||||
| Common Stock | x | x | |||||||||
| Contracts for Difference | x | ||||||||||
| Convertibles | x | x | |||||||||
| Corporates | x | x | |||||||||
| Depositary Receipts | x | x | |||||||||
| Derivatives | x | x | |||||||||
| Emerging Market Securities | x | x | |||||||||
| Equity Securities | x | x | |||||||||
| Fixed Income Securities | x | x | |||||||||
| Floaters | x | ||||||||||
| Foreign Currency | x | x | |||||||||
| Foreign Securities | x | x | |||||||||
| Forwards | x | x | |||||||||
1
EQUITY AND BALANCED PORTFOLIOS
| Mid Cap Growth Portfolio | Balanced Portfolio | ||||||||||
| Futures Contracts | x | x | |||||||||
| High Yield Securities | x | ||||||||||
| Inverse Floaters | x | ||||||||||
| Investment Companies | x | x | |||||||||
| Investment Funds | x | ||||||||||
| Investment Grade Securities | x | x | |||||||||
| Limited Partnerships | x | x | |||||||||
| Loan Participations and Assignments | x | ||||||||||
| Mortgage Related Securities | x | ||||||||||
| —Mortgage-Backed Securities | x | ||||||||||
| —Collateralized Mortgage Obligations | x | ||||||||||
| —Stripped Mortgage-Backed Securities | x | ||||||||||
| —Commercial Mortgage-Backed Securities | x | ||||||||||
| Municipals | x | ||||||||||
| Non-Publicly Traded Securities, Private Placements and Restricted Securities | x | x | |||||||||
| Options | x | x | |||||||||
| Private Investments in Public Equity | x | x | |||||||||
| Preferred Stock | x | x | |||||||||
| Public Bank Loans | x | ||||||||||
| Real Estate Investment Trusts | x | x | |||||||||
| Repurchase Agreements | x | x | |||||||||
| Reverse Repurchase Agreements | x | x | |||||||||
| Rights | x | x | |||||||||
| Securities Lending | x | x | |||||||||
| Short Selling | x | x | |||||||||
2
EQUITY AND BALANCED PORTFOLIOS
| Mid Cap Growth Portfolio | Balanced Portfolio | ||||||||||
| Structured Investments | x | x | |||||||||
| Swaps | x | x | |||||||||
| U.S. Government Securities | x | x | |||||||||
| Warrants | x | x | |||||||||
| When-Issued and Delayed Delivery Securities and Forward Commitments | x | x | |||||||||
| When, As and If Issued Securities | x | x | |||||||||
| Yankee and Eurobond Obligations | x | x | |||||||||
| Zero Coupons | x | x | |||||||||
3
FIXED INCOME PORTFOLIOS
| Core Fixed Income Portfolio | Core Plus Fixed Income Portfolio | Corporate Bond Portfolio | Limited Duration Portfolio | Long Duration Fixed Income Portfolio | |||||||||||||||||||
| Investments | |||||||||||||||||||||||
| ADRs | x | x | x | x | x | ||||||||||||||||||
| Agencies | x | x | x | x | x | ||||||||||||||||||
| Asset-Backed Securities | x | x | x | x | x | ||||||||||||||||||
| Borrowing | x | x | x | x | x | ||||||||||||||||||
| Brady Bonds | x | x | x | x | x | ||||||||||||||||||
| Cash Equivalents | x | x | x | x | x | ||||||||||||||||||
| Commercial Paper | x | x | x | x | x | ||||||||||||||||||
| Common Stock | |||||||||||||||||||||||
| Convertibles | x | x | x | x | x | ||||||||||||||||||
| Corporates | x | x | x | x | x | ||||||||||||||||||
| Depositary Receipts | x | x | x | x | x | ||||||||||||||||||
| Derivatives | x | x | x | x | x | ||||||||||||||||||
| Emerging Market Securities | x | x | x | x | x | ||||||||||||||||||
| Equity Securities | |||||||||||||||||||||||
| Fixed Income Securities | x | x | x | x | x | ||||||||||||||||||
| Floaters | x | x | x | x | x | ||||||||||||||||||
| Foreign Currency | x | x | x | ||||||||||||||||||||
| Foreign Securities | x | x | x | x | x | ||||||||||||||||||
| Forwards | x | x | x | ||||||||||||||||||||
| Futures Contracts | x | x | x | x | x | ||||||||||||||||||
| High Yield Securities | x | x | x | ||||||||||||||||||||
4
FIXED INCOME PORTFOLIOS
| Core Fixed Income Portfolio | Core Plus Fixed Income Portfolio | Corporate Bond Portfolio | Limited Duration Portfolio | Long Duration Fixed Income Portfolio | |||||||||||||||||||
| Inverse Floaters | x | x | x | x | x | ||||||||||||||||||
| Investment Companies | x | x | x | x | x | ||||||||||||||||||
| Investment Funds | |||||||||||||||||||||||
| Investment Grade Securities | x | x | x | x | x | ||||||||||||||||||
| Limited Partnerships | |||||||||||||||||||||||
| Loan Participations and Assignments | x | ||||||||||||||||||||||
| Mortgage Related Securities | x | x | x | x | x | ||||||||||||||||||
| —Mortgage-Backed Securities | x | x | x | x | x | ||||||||||||||||||
| —Collateralized Mortgage Obligations | x | x | x | x | x | ||||||||||||||||||
| —Stripped Mortgage-Backed Securities | x | x | x | x | x | ||||||||||||||||||
| —Commercial Mortgage-Backed Securities | x | x | x | x | x | ||||||||||||||||||
| Municipals | x | x | x | x | |||||||||||||||||||
| Non-Publicly Traded Securities, Private Placements and Restricted Securities | x | x | x | x | x | ||||||||||||||||||
| Options | x | x | x | x | x | ||||||||||||||||||
| Private Investments in Public Equity | |||||||||||||||||||||||
| Preferred Stock | x | x | x | x | x | ||||||||||||||||||
| Public Bank Loans | x | ||||||||||||||||||||||
| Repurchase Agreements | x | x | x | x | x | ||||||||||||||||||
| Reverse Repurchase Agreements | x | x | x | x | x | ||||||||||||||||||
| Rights | x | ||||||||||||||||||||||
| Securities Lending | x | x | x | x | x | ||||||||||||||||||
| Short Selling | x | x | x | x | x | ||||||||||||||||||
| Structured Investments | x | x | x | x | x | ||||||||||||||||||
5
FIXED INCOME PORTFOLIOS
| Core Fixed Income Portfolio | Core Plus Fixed Income Portfolio | Corporate Bond Portfolio | Limited Duration Portfolio | Long Duration Fixed Income Portfolio | |||||||||||||||||||
| Swaps | x | x | x | x | x | ||||||||||||||||||
| U.S. Government Securities | x | x | x | x | x | ||||||||||||||||||
| Warrants | x | ||||||||||||||||||||||
| When-Issued and Delayed Delivery Securities and Forward Commitments | x | x | x | x | x | ||||||||||||||||||
| When, As and If Issued Securities | x | x | x | x | x | ||||||||||||||||||
| Yankee and Eurobond Obligations | x | x | x | x | x | ||||||||||||||||||
| Zero Coupons | x | x | x | x | x | ||||||||||||||||||
6
INVESTMENTS AND RISKS
Morgan Stanley Investment Management Inc. is the adviser (the "Adviser") to the Fund.
ADRs: American Depositary Receipts ("ADRs") are dollar-denominated securities which are listed and traded in the United States, but which represent claims to shares of foreign stocks. They are treated as U.S. equity securities for purposes of the Portfolios' investment policies. ADRs may be either sponsored or unsponsored. Sponsored ADRs are established jointly by a depositary and the underlying issuer, whereas unsponsored ADRs may be established by a depositary without participation by the underlying issuer. Holders of unsponsored ADRs generally bear all the costs associated with establishing unsponsored ADRs. In addition, the issuers of the securities underlying unsponsored ADRs are not obligated to disclose material information in the United States and, therefore, there may be less information available regarding such issuers and there may not be a correlation between such information and the market value of the ADRs. ADRs also include American Depositary Shares.
Agencies: Agencies are fixed income securities issued or guaranteed by federal agencies and U.S. Government sponsored instrumentalities. They may or may not be backed by the full faith and credit of the U.S. Government. If they are not backed by the full faith and credit of the United States, the investor must look principally to the agency or instrumentality issuing or guaranteeing the obligation for ultimate repayment, and may not be able to assert a claim against the United States itself in the event the agency or instrumentality does not meet its commitment. Agencies which are backed by the full faith and credit of the United States include the Export-Import Bank, Farmers Home Administration, Federal Financing Bank and others. Certain debt issued by Resolution Funding Corporation has both its principal and interest backed by the full faith and credit of the U.S. Treasury in that its principal is defeased by U.S. Treasury zero coupon issues, while the U.S. Treasury is explicitly required to advance funds sufficient to pay interest on it, if needed. Certain agencies and instrumentalities, such as the Government National Mortgage Association ("Ginnie Mae"), are, in effect, backed by the full faith and credit of the United States through provisions in their charters that they may make "indefinite and unlimited" drawings on the Treasury if needed to service its debt. Debt from certain other agencies and instrumentalities, including the Federal Home Loan Mortgage Corporation ("Freddie Mac") and the Federal National Mortgage Association ("Fannie Mae"), are not guaranteed by the United States, but those institutions are protected by the discretionary authority of the U.S. Treasury to purchase certain amounts of their securities to assist them in meeting their debt obligations. Finally, other agencies and instrumentalities, such as the Farm Credit System, are federally chartered institutions under U.S. Government supervision, but their debt securities are backed only by the credit worthiness of those institutions, not the U.S. Government. Some of the U.S. Government agencies that issue or guarantee securities include the Export-Import Bank of the United States, Farmers Home Administration, Federal Housing Administration, Maritime Administration, Small Business Administration and The Tennessee Valley Authority.
In September 2008, the U.S. Treasury Department announced that the government would be taking over Fannie Mae and Freddie Mac and placing the companies into a conservatorship. In addition, the U.S. Treasury announced additional steps that it intended to take with respect to the debt and mortgage-backed securities issued by Fannie Mae and Freddie Mac in order to support the conservatorship. No assurance can be given that these initiatives will be successful. The maximum potential liability of the issuers of some U.S. government securities held by a Portfolio may greatly exceed their current resources, including their legal right to support from the U.S. Treasury. It is possible that these issuers will not have the funds to meet their payment obligations in the future.
An instrumentality of the U.S. Government is a government agency organized under federal charter with government supervision. Instrumentalities issuing or guaranteeing securities include, among others, Federal Home Loan Banks, the Federal Land Banks, Central Bank for Cooperatives, Federal Intermediate Credit Banks and Fannie Mae.
Asset-Backed Securities: Certain Portfolios may invest in asset-backed securities. Asset-backed securities utilize the securitization techniques used to develop mortgage-backed securities. These techniques are also applied to a broad range of other assets. Various types of assets, primarily automobile and credit card receivables and home equity loans, are being securitized in pass-through structures similar to the mortgage pass-through structures. These types of securities are known as asset-backed securities. A Portfolio may invest in any type of asset-backed security. Asset-backed securities have risk characteristics similar to mortgage-backed securities. Like mortgage-backed
7
securities, they generally decrease in value as a result of interest rate increases, but may benefit less than other fixed-income securities from declining interest rates, principally because of prepayments. Also, as in the case of mortgage-backed securities, prepayments generally increase during a period of declining interest rates although other factors, such as changes in credit use and payment patterns, may also influence prepayment rates. Asset-backed securities also involve the risk that various federal and state consumer laws and other legal, regulatory and economic factors may result in the collateral backing the securities being insufficient to support payment on the securities.
Borrowing: Each Portfolio is permitted to borrow money from banks in accordance with the Investment Company Act of 1940, as amended (the "1940 Act"), or the rules and regulations promulgated by the United States Securities and Exchange Commission ("SEC") thereunder. Currently, the 1940 Act permits a fund to borrow money from banks in an amount up to 331/3% of its total assets (including the amount borrowed) less its liabilities (not including any borrowings but including the fair market value at the time of computation of any other senior securities then outstanding). Each Portfolio may also borrow an additional 5% of its total assets without regard to the foregoing limitation for temporary purposes such as clearance of portfolio transactions. Each Portfolio will only borrow when the Adviser believes that such borrowings will benefit the Portfolio after taking into account considerations such as interest income and possible gains or losses upon liquidation. Each Portfolio will maintain asset coverage in accordance with the 1940 Act.
Borrowing by a Portfolio creates an opportunity for increased net income but, at the same time, creates special risks. For example, leveraging may exaggerate changes in and increase the volatility of the net asset value of Portfolio shares. This is because leverage tends to exaggerate the effect of any increase or decrease in the value of the Portfolio's portfolio securities. The use of leverage also may cause a Portfolio to liquidate portfolio positions when it may not be advantageous to do so to satisfy its obligations or to maintain asset coverage.
In general, each Portfolio may not issue any class of senior security, except that each Portfolio may (i) borrow from banks, provided that immediately following any such borrowing there is an asset coverage of at least 300% for all Portfolio borrowings and in the event such asset coverage falls below 300% the Portfolio will within three days or such longer period as the SEC may prescribe by rules and regulations, reduce the amount of its borrowings to an extent that the asset coverage of such borrowings shall be at least 300%, and (ii) engage in trading practices which could be deemed to involve the issuance of a senior security, including but not limited to options, futures, forward contracts and reverse repurchase agreements, provided that the Portfolio earmarks or segregates liquid assets in accordance with applicable SEC regulations and interpretations.
Brady Bonds: Brady Bonds are both Emerging Market Securities and Foreign Fixed Income Securities. They are created by exchanging existing commercial bank loans to foreign entities for new obligations for the purpose of restructuring the issuers' debts under a plan introduced by former U.S. Secretary of the Treasury, Nicholas F. Brady (the "Brady Plan"). They may be collateralized or uncollateralized and issued in various currencies (although most are dollar-denominated). They are actively traded in the over-the-counter secondary market. A Portfolio will only invest in Brady Bonds consistent with its quality specifications.
Dollar-denominated, collateralized Brady Bonds may be fixed rate par bonds or floating rate discount bonds. These Brady Bonds are generally collateralized in full as to principal due at maturity by U.S. Treasury Zero Coupon Obligations having the same maturity as the Brady Bonds. Interest payments on these Brady Bonds generally are collateralized by cash or securities in an amount that, in the case of fixed rate bonds, is equal to at least one year of rolling interest payments or, in the case of floating rate bonds, initially is equal to at least one year's rolling interest payments based on the applicable interest rate at that time and is adjusted at regular intervals thereafter. Certain Brady Bonds are entitled to "value recovery payments" in certain circumstances, which in effect constitute supplemental interest payments but generally are not collateralized.
Brady Bonds are often viewed as having three or four valuation components: (i) the collateralized repayment of principal at final maturity; (ii) the collateralized interest payments; (iii) the uncollateralized interest payments; and (iv) any uncollateralized repayment of principal at maturity (these uncollateralized amounts constitute the "residual risk"). In the event of a default with respect to collateralized Brady Bonds as a result of which the payment obligations of the issuer are accelerated, the U.S. Treasury Zero Coupon Obligations held as collateral for the payment of principal will not be distributed to investors, nor will such obligations be sold and the proceeds
8
distributed. The collateral will be held by the collateral agent to the scheduled maturity of the defaulted Brady Bonds, which will continue to be outstanding, at which time the face amount of the collateral will equal the principal payments due on the Brady Bonds in the normal course.
Cash Equivalents: Cash equivalents are short-term fixed income securities comprising:
(1) Time deposits, certificates of deposit (including marketable variable rate certificates of deposit) and bankers' acceptances issued by a commercial bank or savings and loan association. Time deposits are non-negotiable deposits maintained in a banking institution for a specified period of time at a stated interest rate. Certificates of deposit are negotiable short-term obligations issued by commercial banks or savings and loan associations against funds deposited in the issuing institution. Variable rate certificates of deposit are certificates of deposit on which the interest rate is periodically adjusted prior to their stated maturity based upon a specified market rate. A bankers' acceptance is a time draft drawn on a commercial bank by a borrower, usually in connection with an international commercial transaction (to finance the import, export, transfer or storage of goods).
Each Portfolio may invest in obligations of U.S. banks, foreign branches of U.S. banks (Eurodollars) and U.S. branches of foreign banks (Yankee dollars). Euro and Yankee dollar investments will involve some of the same risks of investing in international securities that are discussed in various foreign investing sections of this SAI.
A Portfolio will not invest in any security issued by a commercial bank unless (i) the bank has total assets of at least $1 billion, or the equivalent in other currencies, or, in the case of domestic banks which do not have total assets of at least $1 billion, the aggregate investment made in any one such bank is limited to $250,000 principal amount per certificate (a temporary increase from $100,000, which is due to expire on December 31, 2013) and the principal amount of such investment is insured in full by the Federal Deposit Insurance Corporation, (ii) in the case of U.S. banks, it is a member of the Federal Deposit Insurance Corporation and (iii) in the case of foreign branches of U.S. banks, the security is deemed by the Adviser to be of an investment quality comparable with other debt securities which the Portfolio may purchase.
(2) Each Portfolio may invest in commercial paper (see below) rated at time of purchase by one or more nationally recognized statistical rating organizations ("NRSRO") in one of their two highest categories (e.g., A-l or A-2 by Standard & Poor's Ratings Group, a division of The McGraw-Hill Companies, Inc. ("Standard & Poor's") or Prime 1 or Prime 2 by Moody's Investors Service, Inc. ("Moody's")) or, if not rated, issued by a corporation having an outstanding unsecured debt issue rated high-grade by a NRSRO (e.g., A or better by Moody's, Standard & Poor's or Fitch IBCA, Inc. ("Fitch"));
(3) Short-term corporate obligations rated high-grade at the time of purchase by a NRSRO (e.g., A or better by Moody's, Standard & Poor's or Fitch);
(4) U.S. Government obligations including bills, notes, bonds and other debt securities issued by the U.S. Treasury. These are direct obligations of the U.S. Government and differ mainly in interest rates, maturities and dates of issue;
(5) Government Agency securities issued or guaranteed by U.S. Government sponsored instrumentalities and Federal agencies. These include securities issued by the Federal Home Loan Banks, Federal Land Bank, Farmers Home Administration, Farm Credit Banks, Federal Intermediate Credit Bank, Fannie Mae, Federal Financing Bank, the Tennessee Valley Authority and others; and
(6) Repurchase agreements collateralized by the securities listed above.
Commercial Paper. Commercial paper refers to short-term fixed income securities with maturities ranging from 1 to 270 days. They are primarily issued by corporations needing to finance large amounts of receivables, but may be issued by banks and other borrowers. Commercial paper is issued either directly or through broker-dealers, and may be discounted or interest-bearing. Commercial paper is unsecured, but is almost always backed by bank lines of credit. Virtually all commercial paper is rated by Moody's or Standard & Poor's.
9
Commercial paper rated A-1 by Standard & Poor's has the following characteristics: (1) liquidity ratios are adequate to meet cash requirements; (2) long-term senior debt is rated "A" or better; (3) the issuer has access to at least two additional channels of borrowing; (4) basic earnings and cash flow have an upward trend with allowance made for unusual circumstances; (5) typically, the issuer's industry is well established and the issuer has a strong position within the industry; and (6) the reliability and quality of management are unquestioned. Relative strength or weakness of the above factors determine whether the issuer's commercial paper is A-1, A-2 or A-3.
The rating Prime-1 is the highest commercial paper rating assigned by Moody's. Among the factors considered by Moody's in assigning ratings are the following: (1) evaluation of the management of the issuer; (2) economic evaluation of the issuer's industry or industries and the appraisal of speculative-type risks which may be inherent in certain areas; (3) evaluation of the issuer's products in relation to competition and customer acceptance; (4) liquidity; (5) amount and quality of long-term debt; (6) trend of earnings over a period of ten years; (7) financial strength of a parent company and the relationships that exist with the issuer; and (8) recognition by the management of obligations which may be present or may arise as a result of public interest questions and preparations to meet such obligations.
Commercial Paper: See Cash Equivalents.
Common Stock: Common stocks are equity securities representing an ownership interest in a corporation, entitling the shareholder to voting rights and receipt of dividends paid based on proportionate ownership.
Contracts for Difference ("CFDs"): The Mid Cap Growth Portfolio may invest in CFDs. A CFD is a privately negotiated contract between two parties, buyer and seller, stipulating that the seller will pay to or receive from the buyer the difference between the nominal value of the underlying instrument at the opening of the contract and that instrument's value at the end of the contract. The underlying instrument may be a single security, stock basket or index. A CFD can be set up to take either a short or long position on the underlying instrument. The buyer and seller are both required to post margin, which is adjusted daily. The buyer will also pay to the seller a financing rate on the notional amount of the capital employed by the seller less the margin deposit. A CFD is usually terminated at the buyer's initiative. The seller of the CFD will simply match the exposure of the underlying instrument in the open market and the parties will exchange whatever payment is due.
As is the case with owning any financial instrument, there is the risk of loss associated with buying a CFD. For example, if the Portfolio buys a long CFD and the underlying security is worth less at the end of the contract, the Portfolio would be required to make a payment to the seller and would suffer a loss. Also, there may be liquidity risk if the underlying instrument is illiquid because the liquidity of a CFD is based on the liquidity of the underlying instrument. A further risk is that adverse movements in the underlying security will require the buyer to post additional margin. CFDs also carry counterparty risk, i.e., the risk that the counterparty to the CFD transaction may be unable or unwilling to make payments or to otherwise honor its financial obligations under the terms of the contract. If the counterparty were to do so, the value of the contract, and of the Portfolio's shares, may be reduced. The Portfolio will not enter into a CFD transaction that is inconsistent with its investment objective, policies and strategies.
Convertibles: A convertible security is a bond, debenture, note, preferred stock, right, warrant or other security that may be converted into or exchanged for a prescribed amount of common stock or other security of the same or a different issuer or into cash within a particular period of time at a specified price or formula. A convertible security generally entitles the holder to receive interest paid or accrued on debt securities or the dividend paid on preferred stock until the convertible security matures or is redeemed, converted or exchanged. Before conversion, convertible securities generally have characteristics similar to both debt and equity securities. The value of convertible securities tends to decline as interest rates rise and, because of the conversion feature, tends to vary with fluctuations in the market value of the underlying securities. Convertible securities ordinarily provide a stream of income with generally higher yields than those of common stock of the same or similar issuers. Convertible securities generally rank senior to common stock in a corporation's capital structure but are usually subordinated to comparable nonconvertible securities. Convertible securities generally do not participate directly in any dividend increases or decreases of the underlying securities although the market prices of convertible securities may be affected by any dividend changes or other changes in the underlying securities.
10
Corporates: Corporate bonds ("Corporates") are fixed income securities issued by private corporations. Bondholders, as creditors, have a prior legal claim over common and preferred stockholders of the corporation as to both income and assets for the principal and interest due to the bondholder. A Portfolio will buy Corporates subject to any quality constraints. If a Portfolio holds a security that is downgraded, the Portfolio may retain the security if the Adviser deems retention of the security to be in the best interests of the Portfolio.
Depositary Receipts: Depositary receipts are Global Depositary Receipts ("GDRs"), European Depositary Receipts ("EDRs") and other similar types of depositary shares. Depositary receipts are securities that can be traded in U.S. or foreign securities markets but which represent ownership interests in a security or pool of securities by a foreign or U.S. corporation. Depositary receipts may be sponsored or unsponsored. The depositary of unsponsored depositary receipts may provide less information to receipt holders.
Holders of unsponsored GDRs and EDRs generally bear all the costs associated with establishing the unsponsored GDRs and EDRs. The depositary of unsponsored GDRs and EDRs is under no obligation to distribute shareholder communications received from the underlying issuer or to pass through to the holders of the unsponsored GDRs and EDRs voting rights with respect to the deposited securities or pool of securities. GDRs and EDRs are not necessarily denominated in the same currency as the underlying securities to which they may be connected. Generally, GDRs or EDRs in registered form are designed for use in the U.S. securities market and GDRs or EDRs in bearer form are designed for use in securities markets outside the United States. Portfolios may invest in sponsored and unsponsored GDRs and EDRs. For purposes of the Fund's investment policies, a Portfolio's investments in GDRs or EDRs will be deemed to be investments in the underlying securities.
Derivatives: Certain Portfolios may, but are not required to, use various derivatives and related investment strategies as described below. Derivatives may be used for a variety of purposes including hedging, risk management, portfolio management or to earn income. Any or all of the investment techniques described herein may be used at any time and there is no particular strategy that dictates the use of one technique rather than another, as the use of any derivative by a Portfolio is a function of numerous variables, including market conditions. A Portfolio complies with applicable regulatory requirements when using derivatives, including the segregation or earmarking of cash or liquid assets when mandated by SEC rules or SEC staff positions. Although the Adviser seeks to use derivatives to further a Portfolio's investment objective, no assurance can be given that the use of derivatives will achieve this result.
General Risks of Derivatives. Derivatives utilized by a Portfolio may involve the purchase and sale of derivative instruments. A derivative is a financial instrument the value of which depends upon (or derives from) the value of another asset, security, interest rate or index. Derivatives may relate to a wide variety of underlying instruments, including equity and debt securities, indexes, interest rates, currencies and other assets. Certain derivative instruments which a Portfolio may use and the risks of those instruments are described in further detail below. A Portfolio may in the future also utilize derivatives techniques, instruments and strategies that may be newly developed or permitted as a result of regulatory changes, consistent with a Portfolio's investment objective and policies. Such newly developed techniques, instruments and strategies may involve risks different than or in addition to those described herein. No assurance can be given that any derivatives strategy employed by a Portfolio will be successful.
The risks associated with the use of derivatives are different from, and possibly greater than, the risks associated with investing directly in the instruments underlying such derivatives. Derivatives are highly specialized instruments that require investment techniques and risk analyses different from other portfolio investments. The use of derivative instruments requires an understanding not only of the underlying instrument but also of the derivative itself. Certain risk factors generally applicable to derivative transactions are described below.
• Derivatives are subject to the risk that the market value of the derivative itself or the market value of underlying instruments will change in a way adverse to a Portfolio's interests. A Portfolio bears the risk that the Adviser may incorrectly forecast future market trends and other financial or economic factors or the value of the underlying security, index, interest rate or currency when establishing a derivatives position for a Portfolio.
11
• Derivatives may be subject to pricing risk, which exists when a derivative becomes extraordinarily expensive (or inexpensive) relative to historical prices or corresponding instruments. Under such market conditions, it may not be economically feasible to initiate a transaction or liquidate a position at an advantageous time or price.
• Many derivatives are complex and often valued subjectively. Improper valuations can result in increased payment requirements to counterparties or a loss of value to a Portfolio.
• Using derivatives as a hedge against a portfolio investment subjects a Portfolio to the risk that the derivative will have imperfect correlation with the portfolio investment, which could result in a Portfolio incurring substantial losses. This correlation risk may be greater in the case of derivatives based on an index or other basket of securities, as the portfolio securities being hedged may not duplicate the components of the underlying index or the basket may not be of exactly the same type of obligation as those underlying the derivative. The use of derivatives for "cross hedging" purposes (using a derivative based on one instrument as a hedge on a different instrument) may also involve greater correlation risks.
• While using derivatives for hedging purposes can reduce a Portfolio's risk of loss, it may also limit a Portfolio's opportunity for gains or result in losses by offsetting or limiting a Portfolio's ability to participate in favorable price movements in portfolio investments.
• Derivatives transactions for non-hedging purposes involve greater risks and may result in losses which would not be offset by increases in the value of portfolio securities or declines in the cost of securities to be acquired. In the event that a Portfolio enters into a derivatives transaction as an alternative to purchasing or selling the underlying instrument or in order to obtain desired exposure to an index or market, a Portfolio will be exposed to the same risks as are incurred in purchasing or selling the underlying instruments directly.
• The use of certain derivatives transactions involves the risk of loss resulting from the insolvency or bankruptcy of the counterparty to the contract or the failure by the counterparty to make required payments or otherwise comply with the terms of the contract. In the event of default by a counterparty, a Portfolio may have contractual remedies pursuant to the agreements related to the transaction.
• Liquidity risk exists when a particular derivative is difficult to purchase or sell. If a derivative transaction is particularly large or if the relevant market is illiquid, a Portfolio may be unable to initiate a transaction or liquidate a position at an advantageous time or price.
• Certain derivatives transactions are not entered into or traded on exchanges or in markets regulated by the U.S. Commodity Futures Trading Commission ("CFTC") or the SEC. Instead, such over-the-counter ("OTC") derivatives are entered into directly by a Portfolio and a counterparty and may be traded only through financial institutions acting as market makers. OTC derivatives transactions can only be entered into with a willing counterparty that is approved by the Adviser in accordance with guidelines established by the Board. Where no such counterparty is available, a Portfolio will be unable to enter into a desired OTC transaction. There also may be greater risk that no liquid secondary market in the trading of OTC derivatives will exist, in which case a Portfolio may be required to hold such instruments until exercise, expiration or maturity. Many of the protections afforded to exchange participants are not available to participants in OTC derivatives transactions. OTC derivatives transactions are not subject to the guarantee of an exchange or clearinghouse, and as a result a Portfolio would bear greater risk of default by the counterparties to such transactions.
• A Portfolio may be required to make physical delivery of portfolio securities underlying a derivative in order to close out a derivatives position or to sell portfolio securities at a time or price at which it may be disadvantageous to do so in order to obtain cash to close out or to maintain a derivatives position.
• As a result of the structure of certain derivatives, adverse changes in the value of the underlying instrument can result in losses substantially greater than the amount invested in the derivative itself. Certain derivatives have the potential for unlimited loss, regardless of the size of the initial investment.
• Certain derivatives may be considered illiquid and therefore subject to a Portfolio's limitation on investments in illiquid securities.
12
• Derivatives transactions conducted outside the United States may not be conducted in the same manner as those entered into on U.S. exchanges, and may be subject to different margin, exercise, settlement or expiration procedures. Brokerage commissions, clearing costs and other transaction costs may be higher on foreign exchanges. Many of the risks of OTC derivatives transactions are also applicable to derivatives transactions conducted outside the United States. Derivatives transactions conducted outside the United States are subject to the risk of governmental action affecting the trading in, or the prices of, foreign securities, currencies and other instruments. The value of such positions could be adversely affected by foreign political and economic factors; lesser availability of data on which to make trading decisions; delays on a Portfolio's ability to act upon economic events occurring in foreign markets; and less liquidity than U.S. markets.
• Currency derivatives are subject to additional risks. Currency derivatives transactions may be negatively affected by government exchange controls, blockages, and manipulations. Currency exchange rates may be influenced by factors extrinsic to a country's economy. There is no systematic reporting of last sale information with respect to foreign currencies. As a result, the available information on which trading in currency derivatives will be based may not be as complete as comparable data for other transactions. Events could occur in the foreign currency market which will not be reflected in currency derivatives until the following day, making it more difficult for a Portfolio to respond to such events in a timely manner.
Regulatory Matters. As described herein, a Portfolio may be required to cover its potential economic exposure to certain derivatives transactions by holding an offsetting financial position and/or segregating or earmarking cash or liquid assets equal in value to a Portfolio's potential economic exposure under the transaction. A Portfolio will cover such transactions as described herein or in such other manner in accordance with applicable laws and regulations. Assets used to cover derivatives transactions cannot be sold while the derivatives position is open, unless they are replaced by other appropriate assets. Segregated or earmarked cash or liquid assets and assets held in margin accounts are not otherwise available to a Portfolio for investment purposes. If a large portion of a Portfolio's assets are used to cover derivatives transactions or are otherwise segregated or earmarked, it could affect portfolio management or a Portfolio's ability to meet redemption requests or other current obligations. With respect to derivatives which are cash settled (i.e., have no physical delivery requirement), a Portfolio is permitted to set aside liquid assets in an amount equal to a Portfolio's daily marked-to-market net obligations (i.e., a Portfolio's daily net liability) under the derivative, if any, rather than the derivative's full notional value or the market value of the instrument underlying the derivative, as applicable. By setting aside assets equal to only its net obligations under cash-settled derivatives, a Portfolio will have the ability to employ leverage to a greater extent than if a Portfolio were required to segregate assets equal to the full notional amount of the derivative or the market value of the underlying instrument, as applicable.
Regulatory developments affecting the exchange-traded and OTC derivatives markets may impair a Portfolio's ability to manage or hedge its investment portfolio through the use of derivatives. The Dodd-Frank Wall Street Reform and Consumer Protection Act (the "Dodd-Frank Act") and the rules promulgated thereunder may limit the ability of a Portfolio to enter into one or more exchange-traded or OTC derivatives transactions. In particular, pursuant to authority granted under the Dodd-Frank Act, the CFTC in October 2011 promulgated final rules that impose new federal position limits on listed futures and options contracts on, and economically equivalent OTC derivatives referencing, 28 individual agricultural, metal and energy commodities. A Portfolio's futures and options positions in these 28 contracts will be aggregated with its positions, if any, in economically equivalent OTC derivatives referencing these contracts. These new position limits, which will be imposed on a Portfolio and its counterparties, may impact a Portfolio's ability to invest in futures, options and swaps in a manner that efficiently meets its investment objectives. Derivatives positions of all investment companies advised by the Adviser are combined for purposes of these limits. An exchange may order the liquidation of positions found to be in excess of these limits and may impose certain other sanctions or restrictions.
A Portfolio's use of derivatives may be limited by the requirements of the Internal Revenue Code of 1986, as amended (the "Code"), for qualification as a regulated investment company for U.S. federal income tax purposes.
The CFTC eliminated limitations on futures trading by certain regulated entities, including registered investment companies, and consequently registered investment companies may engage in unlimited futures transactions and options thereon provided that the Adviser to the company claims an exclusion from regulation as
13
a commodity pool operator. In connection with its management of a Portfolio, the Adviser has claimed such an exclusion from registration as a commodity pool operator under the Commodity Exchange Act ("CEA"). Therefore, it is not subject to the registration and regulatory requirements of the CEA. Therefore, there are no limitations on the extent to which a Portfolio may engage in non-hedging transactions involving futures and options thereon except as set forth in a Portfolio's Prospectus or SAI. There is no overall limitation on the percentage of a Portfolio's net assets which may be subject to a hedge position.
Emerging Market Securities: An emerging market security is one issued by a foreign government or private issuer that has one or more of the following characteristics: (i) its principal securities trading market is in an emerging market or developing country, (ii) alone or on a consolidated basis it derives 50% or more of its annual revenue from goods produced, sales made or services performed in an emerging market or (iii) it is organized under the laws of, or has a principal office in, an emerging market or developing country. Based on these criteria it is possible for a security to be considered issued by an issuer in more than one country. Therefore, it is possible for the securities of any issuer that has one or more of these characteristics in connection with any emerging market or developing country not to be considered an emerging market security if it has one or more of these characteristics in connection with a developed country.
Emerging market describes any country which is generally considered to be an emerging or developing country by major organizations in the international financial community, such as the International Bank for Reconstruction and Development (more commonly known as the World Bank) and the International Finance Corporation. Emerging markets can include every nation in the world except the United States, Canada, Japan, Australia, New Zealand and most nations located in Western Europe.
The economies of individual emerging market or developing countries may differ favorably or unfavorably from the U.S. economy in such respects as growth of gross domestic product, rate of inflation, currency depreciation, capital reinvestment, resource self-sufficiency and balance of payments position. Further, the economies of developing countries generally are heavily dependent upon international trade and, accordingly, have been, and may continue to be, adversely affected by trade barriers, exchange controls, managed adjustments in relative currency values and other protectionist measures. These economies also have been, and may continue to be, adversely affected by economic conditions in the countries with which they trade.
Prior governmental approval for foreign investments may be required under certain circumstances in some emerging market or developing countries, and the extent of foreign investment in certain fixed income securities and domestic companies may be subject to limitations in other emerging market or developing countries. Foreign ownership limitations also may be imposed by the charters of individual companies in emerging market or developing countries to prevent, among other concerns, violation of foreign investment limitations. Repatriation of investment income, capital and the proceeds of sales by foreign investors may require governmental registration and/or approval in some emerging countries. A Portfolio could be adversely affected by delays in, or a refusal to grant, any required governmental registration or approval for such repatriation. Any investment subject to such repatriation controls will be considered illiquid if it appears reasonably likely that this process will take more than seven days.
Investment in emerging market or developing countries may entail purchasing securities issued by or on behalf of entities that are insolvent, bankrupt, in default or otherwise engaged in an attempt to reorganize or reschedule their obligations, and in entities that have little or no proven credit rating or credit history. In any such case, the issuer's poor or deteriorating financial condition may increase the likelihood that the investing Portfolio will experience losses or diminution in available gains due to bankruptcy, insolvency or fraud. Emerging market or developing countries also pose the risk of nationalization, expropriation or confiscatory taxation, political changes, government regulation, social instability or diplomatic developments (including war) that could adversely affect the economies of such countries or the value of a Portfolio's investments in those countries. In addition, it may be difficult to obtain and enforce a judgment in a court outside the United States.
Portfolios that invest in emerging markets may also be exposed to an extra degree of custodial and/or market risk, especially where the securities purchased are not traded on an official exchange or where ownership records regarding the securities are maintained by an unregulated entity (or even the issuer itself).
14
Equity Securities: Equity securities generally represent an ownership interest in an issuer, or may be convertible into or represent a right to acquire an ownership interest in an issuer. While there are many types of equity securities, prices of all equity securities will fluctuate. Economic, political and other events may affect the prices of broad equity markets. For example, changes in inflation or consumer demand may affect the prices of equity securities generally in the United States. Similar events also may affect the prices of particular equity securities. For example, news about the success or failure of a new product may affect the price of a particular issuer's equity securities. Equity securities include the following types of instruments, each of which is described in this SAI: ADRs, Common Stock, Convertibles, Investment Companies, Preferred Stock, Limited Partnership Interests, Rights and Warrants.
Fixed Income Securities: Fixed income securities generally represent an issuer's obligation to repay to the investor (or lender) the amount borrowed plus interest over a specified time period. A typical fixed income security specifies a fixed date when the amount borrowed (principal) is due in full, known as the maturity date, and specifies dates when periodic interest (coupon) payments will be made over the life of the security.
Fixed income securities come in many varieties and may differ in the way that interest is calculated, the amount and frequency of payments, the type of collateral, if any, and the presence of special features (e.g., conversion rights). Prices of fixed income securities fluctuate and, in particular, are subject to several key risks including, but not limited to, interest rate risk, credit risk, prepayment risk, and spread risk. Fixed income securities include the following types of instruments, each of which is described in this SAI: Agencies, Asset-Backed Securities, Cash Equivalents, Convertibles, Corporates, Floaters, High Yield Securities, Inverse Floaters, Loan Participations and Assignments, Mortgage Related Securities, Municipals, Preferred Stock, Public Bank Loans, Repurchase Agreements, U.S. Government Securities, When, As and If Issued Securities, When-Issued and Delayed Delivery Securities and Forward Commitments, Yankee and Eurobond Obligations and Zero Coupons.
Interest rate risk arises due to general changes in the level of market rates after the purchase of a fixed income security. Generally, the values of fixed income securities vary inversely with changes in interest rates. During periods of falling interest rates, the values of most outstanding fixed income securities generally rise and during periods of rising interest rates, the values of most fixed income securities generally decline. While fixed income securities with longer final maturities often have higher yields than those with shorter maturities, they usually possess greater price sensitivity to changes in interest rates and other factors. Traditionally, the remaining term to maturity has been used as a barometer of a fixed income security's sensitivity to interest rate changes. This measure, however, considers only the time until the final principal payment and takes no account of the pattern or amount of principal or interest payments prior to maturity. Duration combines consideration of yield, coupon, interest and principal payments, final maturity, and call (prepayment) features. Duration measures the likely percentage change in a fixed income security's price for a small parallel shift in the general level of interest rates; it is also an estimate of the weighted average life of the remaining cash flows of a fixed income security. In almost all cases, the duration of a fixed income security is shorter than its term to maturity.
Credit risk, also known as default risk, represents the possibility that an issuer may be unable to meet scheduled interest and principal payment obligations. It is most often associated with corporate bonds, although it can be present in other fixed income securities, as well (note that the market generally assumes that obligations of the U.S. Treasury are free from credit risk). Credit ratings and quantitative models attempt to measure the degree of credit risk in fixed income securities, and provide insight as to whether prevailing yield spreads afford sufficient compensation for such risk. Other things being equal, fixed income securities with high degrees of credit risk should trade in the market at lower prices (and higher yields) than fixed income securities with low degrees of credit risk.
Prepayment risk, also known as call risk, arises due to the issuer's ability to prepay all or most of the fixed income security prior to the stated final maturity date. Prepayments generally rise in response to a decline in interest rates as debtors take advantage of the opportunity to refinance their obligations. This risk is often associated with mortgage securities where the underlying mortgage loans can be refinanced, although it can also be present in corporate or other types of bonds with call provisions. When a prepayment occurs, a Portfolio may be forced to reinvest in lower yielding fixed income securities. Quantitative models are designed to help assess the degree of prepayment risk, and provide insight as to whether prevailing yield spreads afford sufficient compensation for such risk.
15
Spread risk is the potential for the value of a Portfolio's assets to fall due to the widening of spreads. Fixed income securities generally compensate for greater credit risk by paying interest at a higher rate. The difference (or "spread") between the yield of a security and the yield of a benchmark, such as a U.S. Treasury security with a comparable maturity, measures the additional interest paid for credit risk. As the spread on a security widens (or increases), the price (or value) of the security falls. Spread widening may occur, among other reasons, as a result of market concerns over the stability of the market, excess supply, general credit concerns in other markets, security- or market-specific credit concerns or general reductions in risk tolerance.
Economic, political and other events also may affect the prices of broad fixed income markets, although the risks associated with such events are transmitted to the market via changes in the prevailing levels of interest rates, credit risk, prepayment risk or spread risk.
Floaters: Floaters are fixed income securities with a floating or variable rate of interest, i.e., the rate of interest varies with changes in specified market rates or indices, such as the prime rate, or at specified intervals. Certain floating or variable rate obligations may carry a demand feature that permits the holder to tender them back to the issuer of the underlying instrument, or to a third party, at par value prior to maturity. When the demand feature of certain floating or variable rate obligations represents an obligation of a foreign entity, the demand feature will be subject to certain risks discussed under the various foreign investing sections.
Foreign Currency: Certain Portfolios investing in foreign securities will regularly transact security purchases and sales in foreign currencies. These Portfolios may hold foreign currency or purchase or sell currencies on a forward basis. See Forwards, below.
Foreign currency warrants. Portfolios may invest in foreign currency warrants, which entitle the holder to receive from the issuer an amount of cash (generally, for warrants issued in the United States, in U.S. dollars) which is calculated pursuant to a predetermined formula and based on the exchange rate between a specified foreign currency and the U.S. dollar as of the exercise date of the warrant. Foreign currency warrants generally are exercisable upon their issuance and expire as of a specified date and time.
Foreign currency warrants have been issued in connection with U.S. dollar-denominated debt offerings by major corporate issuers in an attempt to reduce the foreign currency exchange risk which, from the point of view of prospective purchasers of the securities, is inherent in the international fixed income marketplace. Foreign currency warrants may attempt to reduce the foreign exchange risk assumed by purchasers of a security by, for example, providing for a supplemental payment in the event that the U.S. dollar depreciates against the value of a major foreign currency such as the Japanese Yen or the Euro. The formula used to determine the amount payable upon exercise of a foreign currency warrant may make the warrant worthless unless the applicable foreign currency exchange rate moves in a particular direction (e.g., unless the U.S. dollar appreciates or depreciates against the particular foreign currency to which the warrant is linked or indexed). Foreign currency warrants are severable from the debt obligations with which they may be offered, and may be listed on exchanges.
Foreign currency warrants may be exercisable only in certain minimum amounts, and an investor wishing to exercise warrants who possesses less than the minimum number required for exercise may be required either to sell the warrants or to purchase additional warrants, thereby incurring additional transaction costs. In the case of any exercise of warrants, there may be a time delay between the time a holder of warrants gives instructions to exercise and the time the exchange rate relating to exercise is determined, during which time the exchange rate could change significantly, thereby affecting both the market and cash settlement values of the warrants being exercised. The expiration date of the warrants may be accelerated if the warrants should be delisted from an exchange or if their trading should be suspended permanently, which would result in the loss of any remaining "time value" of the warrants (i.e., the difference between the current market value and the exercise value of the warrants), and, in the case where the warrants were "out-of-the-money," in a total loss of the purchase price of the warrants.
Foreign currency warrants are generally unsecured obligations of their issuers and are not standardized foreign currency options issued by the Options Clearing Corporation ("OCC"). Unlike foreign currency options issued by the OCC, the terms of foreign exchange warrants generally will not be amended in the event of governmental or regulatory actions affecting exchange rates or in the event of the imposition of other regulatory
16
controls affecting the international currency markets. The initial public offering price of foreign currency warrants is generally considerably in excess of the price that a commercial user of foreign currencies might pay in the interbank market for a comparable option involving significantly larger amounts of foreign currencies. Foreign currency warrants are subject to complex political or economic factors.
Principal exchange rate linked securities. Principal exchange rate linked securities are debt obligations the principal on which is payable at maturity in an amount that may vary based on the exchange rate between the U.S. dollar and a particular foreign currency at or about that time. The return on "standard" principal exchange rate linked securities is enhanced if the foreign currency to which the security is linked appreciates against the U.S. dollar, and is adversely affected by increases in the foreign exchange value of the U.S. dollar; "reverse" principal exchange rate linked securities are like the "standard" securities, except that their return is enhanced by increases in the value of the U.S. dollar and adversely impacted by increases in the value of foreign currency. Interest payments on the securities are generally made in U.S. dollars at rates that reflect the degree of foreign currency risk assumed or given up by the purchaser of the notes (i.e., at relatively higher interest rates if the purchaser has assumed some of the foreign exchange risk, or relatively lower interest rates if the issuer has assumed some of the foreign exchange risk, based on the expectations of the current market). Principal exchange rate linked securities may in limited cases be subject to acceleration of maturity (generally, not without the consent of the holders of the securities), which may have an adverse impact on the value of the principal payment to be made at maturity.
Performance indexed paper. Performance indexed paper is U.S. dollar-denominated commercial paper the yield of which is linked to certain foreign exchange rate movements. The yield to the investor will be within a range stipulated at the time of purchase of the obligation, generally with a guaranteed minimum rate of return that is below, and a potential maximum rate of return that is above, market yields on U.S. dollar-denominated commercial paper, with both the minimum and maximum rates of return on the investment corresponding to the minimum and maximum values of the spot exchange rate two business days prior to maturity.
Foreign Securities: Foreign securities include Brady Bonds, Depositary Receipts, Emerging Market Securities, Foreign Currency, Foreign Equity Securities (defined below), Foreign Fixed Income Securities (defined below) and Investment Funds. Investing in foreign securities involves certain special risks not typically associated with investing in domestic securities. Since the securities of foreign issuers are frequently denominated in foreign currencies, and since the Portfolios may temporarily hold uninvested reserves in bank deposits in foreign currencies, the Portfolios will be affected favorably or unfavorably by changes in currency rates and in exchange control regulations, and may incur costs in connection with conversions between various currencies. Certain Portfolios may enter into forward foreign currency exchange contracts to hedge their respective holdings and commitments against changes in the level of future currency rates. See Forwards, below. Such contracts involve an obligation to purchase or sell a specific currency at a future date at a price set at the time of the contract.
As non-U.S. companies are not generally subject to uniform accounting, auditing and financial reporting standards and practices comparable to those applicable to domestic issuers, there may be less publicly available information about certain foreign securities than about domestic securities. Securities of some foreign issuers are generally less liquid and more volatile than securities of comparable domestic companies. There is generally less government supervision and regulation of stock exchanges, brokers and listed issuers than in the United States. In addition, with respect to certain foreign countries, there is the possibility of expropriation or confiscatory taxation, political or social instability, or diplomatic developments which could affect U.S. investments in those countries.
Although the Portfolios will endeavor to achieve most favorable execution costs in their portfolio transactions, fixed commissions on many foreign exchanges are generally higher than negotiated commissions on U.S. exchanges. In addition, it is expected that the expenses for custodian arrangements of the Portfolio's foreign securities will be somewhat greater than the expenses for the custodian arrangements for handling U.S. securities of equal value.
Certain foreign governments levy withholding taxes against dividend and interest income. Although in some countries a portion of these taxes is recoverable, the non-recovered portion of foreign withholding taxes will reduce the income received from investments in such countries. Certain Portfolios may be able to claim a credit for U.S. tax purposes with respect to any such foreign taxes.
17
The Adviser considers an issuer to be from a particular country or geographic region if (i) its principal securities trading market is in that country or geographic region; (ii) alone or on a consolidated basis it derives 50% or more of its annual revenue from goods produced, sales made or services performed in that country or geographic region; or (iii) it is organized under the laws of, or has a principal office in, that country or geographic region. By applying these tests, it is possible that a particular company could be deemed to be from more than one country or geographic region.
Foreign Equity Securities. Foreign equity securities are equity securities of foreign issuers denominated in foreign currency and traded primarily in non-U.S. markets, including Depositary Receipts.
Foreign Fixed Income Securities. Foreign fixed income securities are fixed income securities which may be U.S. dollar denominated or denominated in a foreign currency, which include: (1) obligations issued or guaranteed by foreign national governments, their agencies, instrumentalities, or political subdivisions; (2) debt securities issued, guaranteed or sponsored by supranational organizations established or supported by several national governments, including the World Bank, the European Community, the Asian Development Bank and others; (3) non-government foreign corporate debt securities; and (4) foreign mortgage securities and various other mortgages and asset-backed securities.
Forwards: A forward foreign currency contract is a negotiated agreement between two parties to exchange specified amounts of two or more currencies at a specified future time at a specified rate. The rate specified by the forward contract can be higher or lower than the spot rate between the currencies that are the subject of the contract. Currency futures are similar to currency forward contracts, except that they are traded on an exchange and standardized as to contract size and delivery date. Most currency futures call for payment or delivery in U.S. dollars. Unanticipated changes in currency prices may result in losses to a Portfolio and poorer overall performance for a Portfolio than if it had not entered into currency forward contracts. Certain Portfolios may enter into forward contracts under various circumstances. The typical use of a forward contract is to "lock in" the price of a security in U.S. dollars or some other foreign currency, which a Portfolio is holding in its portfolio. By entering into a forward contract for the purchase or sale, for a fixed amount of dollars or other currency, of the amount of foreign currency involved in the underlying security transactions, a Portfolio may be able to protect itself against a possible loss resulting from an adverse change in the relationship between the U.S. dollar or other currency which is being used for the security purchase and the foreign currency in which the security is denominated during the period between the date on which the security is purchased or sold and the date on which payment is made or received. The Adviser also may from time to time utilize forward contracts for other purposes. For example, they may be used to hedge a foreign security held in the portfolio or a security which pays out principal tied to an exchange rate between the U.S. dollar and a foreign currency, against a decline in value of the applicable foreign currency. They also may be used to lock in the current exchange rate of the currency in which those securities anticipated to be purchased are denominated. At times, a Portfolio may enter into "cross-currency" hedging transactions involving currencies other than those in which securities are held or proposed to be purchased are denominated.
A Portfolio will not enter into forward or futures contracts or maintain a net exposure to these contracts where the consummation of the contracts would obligate a Portfolio to deliver an amount of foreign currency in excess of the value of a Portfolio's portfolio securities.
When required by law, a Portfolio will segregate or earmark cash, U.S. government securities or other appropriate liquid portfolio securities in an amount equal to the value of a Portfolio's total assets committed to the consummation of forward or futures contracts entered into under the circumstances set forth above. If the value of the securities so earmarked declines, additional cash or securities will be segregated or earmarked on a daily basis so that the value of such securities will equal the amount of a Portfolio's commitments with respect to such contracts.
A Portfolio may be limited in its ability to enter into hedging transactions involving forward or futures contracts by the Code requirements relating to qualification as a regulated investment company.
18
Forward and futures contracts may limit gains on portfolio securities that could otherwise be realized had they not been utilized and could result in losses. The contracts also may increase a Portfolio's volatility and may involve a significant amount of risk relative to the investment of cash.
Futures Contracts: A futures contract is a standardized agreement to buy or sell a specific quantity of a commodity at a specific price at a specific future time (the "settlement date"). Futures contracts may be based on, among other things, a specified equity security (securities futures), a specified debt security or reference rate (interest rate futures), the value of a specified securities index (index futures) or the value of a foreign currency (forward contracts and currency futures). The value of a futures contract tends to increase and decrease in tandem with the value of the underlying instrument. The buyer of a futures contract agrees to purchase the underlying instrument on the settlement date and is said to be "long" the contract. The seller of a futures contract agrees to sell the underlying instrument on the settlement date and is said to be "short" the contract. Futures contracts call for settlement only on the expiration date and cannot be "exercised" at any other time during their term.
Depending on the terms of the particular contract, futures contracts are settled through either physical delivery of the underlying instrument on the settlement date (such as in the case of securities futures based on a specified debt security) or by payment of a cash settlement amount on the settlement date (such as in the case of futures contracts relating to interest rates, foreign currencies and broad-based securities indexes). In the case of cash-settled futures contracts, the settlement amount is equal to the difference between the reference instrument's price on the last trading day of the contract and the reference instrument's price at the time the contract was entered into. Most futures contracts, particularly futures contracts requiring physical delivery, are not held until the settlement date, but instead are offset before the settlement date through the establishment of an opposite and equal futures position (buying a contract that had been sold, or selling a contract that had been purchased). All futures transactions are effected through a clearinghouse associated with the exchange on which the futures are traded.
The buyer and seller of a futures contract are not required to deliver or pay for the underlying commodity unless the contract is held until the settlement date. However, both the buyer and seller are required to deposit "initial margin" with a futures commission merchant when the futures contract is entered into. Initial margin deposits are typically calculated as a percentage of the contract's market value. If the value of either party's position declines, the party will be required to make additional "variation margin" payments to settle the change in value on a daily basis. The process is known as "marking-to-market." Upon the closing of a futures position through the establishment of an offsetting position, a final determination of variation margin will be made and additional cash will be paid by or released to a Portfolio.
In addition, a Portfolio may be required to maintain segregated cash or liquid assets in order to cover futures transactions. A Portfolio will segregate or earmark cash or liquid assets in an amount equal to the difference between the market value of a futures contract entered into by a Portfolio and the aggregate value of the initial and variation margin payments made by a Portfolio with respect to such contract or as otherwise permitted by SEC rules or SEC staff positions. See "Regulatory Matters" below.
Additional Risk of Futures Transactions. The risks associated with futures contract transactions are different from, and possibly greater than, the risks associated with investing directly in the underlying instruments. Futures are highly specialized instruments that require investment techniques and risk analyses different from those associated with other portfolio investments. The use of futures requires an understanding not only of the underlying instrument but also of the futures contract itself. Futures may be subject to the risk factors generally applicable to derivatives transactions described herein, and may also be subject to certain additional risk factors, including:
• The risk of loss in buying and selling futures contracts can be substantial. Small price movements in the commodity underlying a futures position may result in immediate and substantial loss (or gain) to a Portfolio.
• Buying and selling futures contracts may result in losses in excess of the amount invested in the position in the form of initial margin. In the event of adverse price movements in the underlying commodity, security, index, currency or instrument, a Portfolio would be required to make daily cash payments to maintain its required margin. A Portfolio may be required to sell portfolio securities, or make or take delivery of the underlying securities in order to meet daily margin requirements at a time when it may be
19
disadvantageous to do so. A Portfolio could lose margin payments deposited with a futures commission merchant if the futures commission merchant breaches its agreement with a Portfolio, becomes insolvent or declares bankruptcy.
• Most exchanges limit the amount of fluctuation permitted in futures contract prices during any single trading day. Once the daily limit has been reached in a particular futures contract, no trades may be made on that day at prices beyond that limit. If futures contract prices were to move to the daily limit for several trading days with little or no trading, a Portfolio could be prevented from prompt liquidation of a futures position and subject to substantial losses. The daily limit governs only price movements during a single trading day and therefore does not limit a Portfolio's potential losses.
• Index futures based upon a narrower index of securities may present greater risks than futures based on broad market indexes, as narrower indexes are more susceptible to rapid and extreme fluctuations as a result of changes in value of a small number of securities.
High Yield Securities: High yield securities are fixed income securities, generally Corporates, Preferred Stocks and Convertibles, rated Ba through C by Moody's or BB through D by Standard & Poor's, and unrated fixed income securities considered to be of equivalent quality. Securities rated less than Baa by Moody's or BBB by Standard & Poor's are classified as non-investment grade securities and are commonly referred to as "junk bonds" or high yield, high risk securities. Such securities carry a high degree of risk and are considered speculative by the major credit rating agencies. See Appendix B for more information about fixed income security ratings. Investment grade securities that a Portfolio holds may be downgraded to below investment grade by the rating agencies. If a Portfolio holds a security that is downgraded, the Portfolio may choose to retain the security.
While fixed income securities rated below investment grade offer high yields, they also normally carry with them a greater degree of risk than securities with higher ratings. Lower-rated bonds are considered speculative by traditional investment standards. High yield securities may be issued as a consequence of corporate restructuring or similar events. Also, high yield securities are often issued by smaller, less credit worthy companies, or by highly leveraged (indebted) firms, which are generally less able than more established or less leveraged firms to make scheduled payments of interest and principal. High yield securities issued under these circumstances pose substantial risks. The price movement of high yield securities is influenced less by changes in interest rates and more by the financial and business position of the issuing corporation when compared to investment grade bonds. Compared with investment grade securities, the values of high yield securities tend to be more volatile and may react with greater sensitivity to changes in interest rates.
The high yield market is subject to credit risk. Default rates and recoveries fluctuate, driven by numerous factors including the general economy. In addition, the secondary market for high yield securities is generally less liquid than that for investment grade corporate securities. In periods of reduced market liquidity, high yield bond prices may become more volatile, and both the high yield market and a Portfolio may experience sudden and substantial price declines.
A lower level of liquidity might have an effect on a Portfolio's ability to value or dispose of such securities. Also, there may be significant disparities in the prices quoted for high yield securities by various dealers. Under such conditions, a Portfolio may find it difficult to value its securities accurately. A Portfolio may also be forced to sell securities at a significant loss in order to meet shareholder redemptions. These factors add to the risks associated with investing in high yield securities.
High yield bonds may also present risks based on payment expectations. For example, high yield bonds may contain redemption or call provisions. If an issuer exercises these provisions in a declining interest rate market, a Portfolio would have to replace the security with a lower yielding security, resulting in a decreased return for investors.
Certain types of high yield bonds are non-income paying securities. For example, zero coupons pay interest only at maturity and payment-in-kind bonds pay interest in the form of additional securities. Payment in the form of additional securities, or interest income recognized through discount accretion, will, however, be treated as ordinary income which will be distributed to shareholders even though the Portfolio does not receive periodic cash flow from these investments.
20
Inverse Floaters: Inverse floating rate obligations are obligations which pay interest at rates that vary inversely with changes in market rates of interest. Because the interest rate paid to holders of such obligations is generally determined by subtracting a variable or floating rate from a predetermined amount, the interest rate paid to holders of such obligations will decrease as such variable or floating rate increases and increase as such variable or floating rate decreases.
Like most other fixed-income securities, the value of inverse floaters will decrease as interest rates increase. They are more volatile, however, than most other fixed-income securities because the coupon rate on an inverse floater typically changes at a multiple of the change in the relevant index rate. Thus, any rise in the index rate (as a consequence of an increase in interest rates) causes a correspondingly greater drop in the coupon rate of an inverse floater while a drop in the index rate causes a correspondingly greater increase in the coupon of an inverse floater. Some inverse floaters may also increase or decrease substantially because of changes in the rate of prepayments.
Inverse floating rate investments are variable debt instruments that pay interest at rates that move in the opposite direction of prevailing interest rates. Inverse floating rate investments tend to underperform the market for fixed rate bonds in a rising interest rate environment, but tend to outperform the market for fixed rate bonds when interest rates decline or remain relatively stable. Inverse floating rate investments have varying degrees of liquidity.
Investment Companies: Investment company securities are equity securities and include securities of other open-end, closed-end and unregistered investment companies, including exchange-traded funds. The 1940 Act generally prohibits a Portfolio from acquiring more than 3% of the outstanding voting shares of an investment company and limits such investments to no more than 5% of the Portfolio's total assets in any one investment company and no more than 10% in any combination of investment companies. The 1940 Act also prohibits the Portfolios from acquiring in the aggregate more than 10% of the outstanding voting shares of any registered closed-end investment company. A Portfolio may invest in investment company securities of investment companies managed by the Adviser or its affiliates to the extent permitted under the 1940 Act or as otherwise authorized by the SEC. To the extent a Portfolio invests a portion of its assets in investment company securities, those assets will be subject to the risks of the purchased investment company's portfolio securities, and a shareholder in the Portfolio will bear not only his proportionate share of the expenses of the Portfolio, but also, indirectly the expenses of the purchased investment company.
To the extent permitted by applicable law, a Portfolio may invest all or some of its short term cash investments in any money market fund advised or managed by the Adviser or its affiliates. In connection with any such investments, the Portfolio, to the extent permitted by the 1940 Act, will pay its share of all expenses (other than advisory and administrative fees) of a money market fund in which it invests which may result in the Portfolio bearing some additional expenses.
Exchange-Traded Funds ("ETFs"). Certain Portfolios may invest in shares of various ETFs, including exchange-traded index and bond funds. Exchange-traded index funds seek to track the performance of various securities indices. Shares of ETFs have many of the same risks as direct investments in common stocks or bonds. In addition, their market value is expected to rise and fall as the value of the underlying index or bond rises and falls. The market value of their shares may differ from the net asset value of the particular fund. As a shareholder in an ETF (as with other investment companies), a Portfolio would bear its ratable share of that entity's expenses. At the same time, a Portfolio would continue to pay its own investment management fees and other expenses. As a result, a Portfolio and its shareholders, in effect, will be absorbing duplicate levels of fees with respect to investments in ETFs. Further, certain of the ETFs in which the Fund may invest are leveraged. The more the Fund invests in such leveraged ETFs, the more this leverage will magnify any losses on those investments.
Investment Funds: Some emerging market countries have laws and regulations that currently preclude or limit direct foreign investment in the securities of their companies. However, certain emerging market countries through investment funds permit indirect foreign investment in the securities of companies listed and traded on the stock exchanges in these countries. Portfolios that may invest in these Investment Funds will invest in such Investment Funds only where appropriate given that the Portfolio's shareholders will bear indirectly the layer of expenses of the underlying investment funds in addition to their proportionate share of the expenses of the Portfolio.
21
Investment Grade Securities: Investment grade securities are fixed income securities that are (a) rated by one or more NRSROs in one of the four highest rating categories at the time of purchase (e.g., AAA, AA, A or BBB by Standard & Poor's or Fitch or Aaa, Aa, A or Baa by Moody's); (b) guaranteed by the U.S. Government or a private issuer; or (c) considered by the Adviser to be investment grade quality. Securities rated BBB or Baa represent the lowest of four levels of investment grade securities and are regarded as borderline between definitely sound obligations and those in which the speculative element begins to predominate. Any Portfolio is permitted to hold investment grade securities or "high grade" securities, and may hold unrated securities if the Adviser considers the risks involved in owning that security to be equivalent to the risks involved in holding an investment grade security. The Adviser may retain securities if their ratings fall below investment grade if it deems retention of the security to be in the best interests of the Portfolio.
Mortgage securities, including mortgage pass-throughs and CMOs, deemed investment grade by the Adviser, will either carry a guarantee from an agency or instrumentality of the U.S. Government or a private issuer of the timely payment of principal and interest (such guarantees do not extend to the market value of such securities or the net asset value per share of the Portfolio) or, in the case of unrated securities, are considered by the Adviser to be investment grade quality.
Leverage Risks: Certain transactions may give rise to a form of leverage. To mitigate leveraging risk, the Portfolios will earmark or segregate liquid assets or otherwise cover the transactions that may give rise to such risk as required by applicable rules and regulatory pronouncements of the SEC. The use of leverage may cause a Portfolio to liquidate portfolio positions when it may not be advantageous to do so to satisfy its obligations or to meet segregation requirements. Leverage, including borrowing, may cause a Portfolio to be more volatile than if the Portfolio had not been leveraged. This is because leverage tends to exaggerate the effect of any increase or decrease in the value of the Portfolio's portfolio securities.
Limited Partnerships: A limited partnership interest entitles a Portfolio to participate in the investment return of the partnership's assets as defined by the agreement among the partners. As a limited partner, a Portfolio generally is not permitted to participate in the management of the partnership. However, unlike a general partner whose liability is not limited, a limited partner's liability generally is limited to the amount of its commitment to the partnership.
Loan Participations and Assignments: Loan participations and assignments are fixed income securities. A Portfolio may invest in fixed rate and floating rate loans ("Loans") arranged through private negotiations between an issuer and one or more financial institutions ("Lenders"). A Portfolio's investments in Loans are expected in most instances to be in the form of participation in Loans ("Participations") and assignments of all or a portion of Loans ("Assignments") from third parties. In the case of a Participation, a Portfolio will have the right to receive payments of principal, interest and any fees to which it is entitled only from the Lender selling the Participation and only upon receipt by the Lender of the payments from the borrower. If a Lender selling a Participation becomes insolvent, a Portfolio may be treated as a general creditor of the Lender and may not benefit from any set-off between the Lender and the borrower. Certain Participations may be structured in a manner designed to avoid purchasers of Participations being subject to the credit risk of the Lender with respect to the Participation. Even under such a structure, in the event of the Lender's insolvency, the Lender's servicing of the Participation may be delayed and the assignability of the Participation may be impaired. A Portfolio will acquire Participations only if the Lender interpositioned between the Portfolio and the borrower is determined by the Adviser to be creditworthy.
When a Portfolio purchases Assignments from Lenders it will acquire direct rights against the borrower on the Loan. However, because Assignments are arranged through private negotiations between potential assignees and potential assignors, the rights and obligations acquired by the Portfolio as the purchaser of an Assignment may differ from, and be more limited than, those held by the assigning Lender. Because there is no liquid market for such securities, the Portfolio anticipates that such securities could be sold only to a limited number of institutional investors. The lack of a liquid secondary market may have an adverse impact on the value of such securities and the Portfolio's ability to dispose of particular Assignments or Participations when necessary to meet the Portfolio's liquidity needs or in response to a specific economic event, such as a deterioration in the creditworthiness of the borrower. The lack of a liquid secondary market for Assignments and Participations also may make it more difficult for the Portfolio to assign a value to those securities for purposes of valuing the Portfolio's holdings and calculating its net asset value.
22
Participations and Assignments involve a risk of loss in case of default or insolvency of the borrower. In addition, they may offer less legal protection to a Portfolio in the event of fraud or misrepresentation and may involve a risk of insolvency of the Lender. Certain Participations and Assignments may also include standby financing commitments that obligate the investing Portfolio to supply additional cash to the borrower on demand. Participations involving emerging market country issuers may relate to Loans as to which there has been or currently exists an event of default or other failure to make payment when due, and may represent amounts owed to Lenders that are themselves subject to political and economic risks, including the risk of currency devaluation, expropriation, or failure. Those Participations and Assignments present additional risk of default or loss.
Mortgage Related Securities: Mortgage related securities are securities that, directly or indirectly, represent a participation in, or are secured by and payable from, mortgage loans on real property. Mortgage related securities include collateralized mortgage obligations and mortgage-backed securities issued or guaranteed by agencies or instrumentalities of the U.S. Government or by private sector entities.
Mortgage-Backed Securities. Certain Portfolios may invest in mortgage pass-through securities. These securities represent a participation interest in a pool of residential mortgage loans originated by U.S. governmental or private lenders such as banks. They differ from conventional debt securities, which provide for periodic payment of interest in fixed amounts and principal payments at maturity or on specified call dates. Mortgage pass-through securities provide for monthly payments that are a "pass-through" of the monthly interest and principal payments made by the individual borrowers on the pooled mortgage loans. Mortgage pass-through securities may be collateralized by mortgages with fixed rates of interest or adjustable rates. The Portfolios may invest in mortgage pass-through securities that are issued or guaranteed by the U.S. Government. These securities are either direct obligations of the U.S. Government or the issuing agency or instrumentality has the right to borrow from the U.S. Treasury to meet its obligations although the U.S. Treasury is not legally required to extend credit to the agency or instrumentality. Certain of the U.S. government securities purchased by the Portfolios, such as those issued by the Federal National Mortgage Association ("Fannie Mae") and Federal Home Loan Mortgage Corporation ("Freddie Mac"), are not backed by the full faith and credit of the United States and there is a risk that the U.S. Government will not provide financial support to these agencies if it is not obligated to do so by law. In September 2008, the U.S. Treasury Department announced that the U.S. Government would be taking over Freddie Mac and Fannie Mae and placing the companies into a conservatorship. In addition, the U.S. Treasury announced additional steps that it intended to take with respect to the debt and mortgage-backed securities issued by Fannie Mae and Freddie Mac in order to support the conservatorship. No assurance can be given that these initiatives will be successful. The maximum potential liability of the issuers of some U.S. government securities held by the Portfolios may greatly exceed their current resources, including their legal right to support from the U.S. Treasury. It is possible that these issuers will not have the funds to meet their payment obligations in the future.
To the extent the Portfolios invest in mortgage pass-through securities offered by non-governmental issuers, such as commercial banks, savings and loan institutions, private mortgage insurance companies, mortgage bankers and other secondary market issuers, the Portfolios may be subject to additional risks. Timely payment of interest and principal of non-governmental issuers are supported by various forms of private insurance or guarantees, including individual loan, title, pool and hazard insurance purchased by the issuer. There can be no assurance that the private insurers can meet their obligations under the policies. An unexpectedly high rate of defaults on the mortgages held by a mortgage pool may adversely affect the value of a MBS and could result in losses to the Portfolios. The risk of such defaults is generally higher in the case of mortgage pools that include subprime mortgages. Subprime mortgages refer to loans made to borrowers with weakened credit histories or with a lower capacity to make timely payments on their mortgages.
There are two methods of trading MBSs. A specified pool transaction is a trade in which the pool number of the security to be delivered on the settlement date is known at the time the trade is made. This is in contrast with the typical MBS transaction, called a TBA (To Be Announced) transaction, in which the type of MBS to be delivered is specified at the time of trade but the actual pool numbers of the securities that will be delivered are not known at the time of the trade. The pool numbers of the pools to be delivered at settlement are announced shortly before settlement takes place. The terms of the TBA trade may be made more specific if desired. Generally, agency pass-through MBSs are traded on a TBA basis. See also "Leverage Risks."
23
Collateralized Mortgage Obligations. Certain Portfolios may invest in collateralized mortgage obligations ("CMOs"), which are mortgage-backed securities that are collateralized by mortgage loans or mortgage pass-through securities, and multi-class pass-through securities, which are equity interests in a trust composed of mortgage loans or other mortgage backed securities. Unless the context indicates otherwise, the discussion of CMOs below also applies to multi-class pass through securities.
CMOs may be issued by governmental or government-related entities or by private entities, such as banks, savings and loan institutions, private mortgage insurance companies, mortgage bankers and other secondary market traders. CMOs are issued in multiple classes, often referred to as "tranches," with each tranche having a specific fixed or floating coupon rate and stated maturity or final distribution date. Under the traditional CMO structure, the cash flows generated by the mortgages or mortgage pass-through securities in the collateral pool are used to first pay interest and then pay principal to the holders of the CMOs. Subject to the various provisions of individual CMO issues, the cash flow generated by the underlying collateral (to the extent it exceeds the amount required to pay the stated interest) is used to retire the bonds.
The principal and interest on the underlying collateral may be allocated among the several tranches of a CMO in innumerable ways. In a common CMO structure, the tranches are retired sequentially in the order of their respective stated maturities or final distribution dates (as opposed to the pro-rata return of principal found in traditional pass-through obligations). The fastest-pay tranches would initially receive all principal payments. When those tranches are retired, the next tranches in the sequence receive all of the principal payments until they are retired. The sequential retirement of bond groups continues until the last tranche is retired. Accordingly, the CMO structure allows the issuer to use cash flows of long maturity, monthly-pay collateral to formulate securities with short, intermediate, and long final maturities and expected average lives and risk characteristics.
The primary risk of CMOs is the uncertainty of the timing of cash flows that results from the rate of prepayments on the underlying mortgages serving as collateral and from the structure of the particular CMO transaction (that is, the priority of the individual tranches). An increase or decrease in prepayment rates (resulting from a decrease or increase in mortgage interest rates) may cause the CMOs to be retired substantially earlier than their stated maturities or final distribution dates and will affect the yield and price of CMOs. In addition, the collateral securing CMOs or any third-party guarantees are insufficient to make payments, a Portfolio could sustain a loss. The prices of certain CMOs, depending on their structure and the rate of prepayments, can be volatile. Some CMOs may also not be as liquid as other types of mortgage securities. As a result, it may be difficult or impossible to sell the securities at an advantageous time or price.
New types of CMO tranches have evolved. These include floating rate CMOs, inverse floating rate CMOs, planned amortization classes, accrual bonds and CMO residuals. These newer structures affect the amount and timing of principal and interest received by each tranche from the underlying collateral. Under certain of these newer structures, given classes of CMOs have priority over others with respect to the receipt of prepayments on the mortgages. Therefore, depending on the type of CMOs in which a Portfolio invests, the investment may be subject to a greater or lesser risk of prepayment than other types of mortgage-backed securities.
CMOs may include real estate investment conduits ("REMICs"). REMICs, which were authorized under the Tax Reform Act of 1986, are private entities formed for the purpose of holding a fixed pool of mortgages secured by an interest in real property. A REMIC is a CMO that qualifies for special tax treatment under the Internal Revenue Code and invests in certain mortgages principally secured by interests in real property.
A Portfolio may invest in, among others, parallel pay CMOs and Planned Amortization Class CMOs ("PAC Bonds"). Parallel pay CMOs are structured to provide payments of principal on each payment date to more than one tranche. These simultaneous payments are taken into account in calculating the stated maturity date or final distribution date of each tranche which, as with other CMO structures, must be retired by its stated maturity date or final distribution date but may be retired earlier. PAC Bonds are a form of parallel pay CMO, with the required principal payment on such securities having the highest priority after interest has been paid to all classes. PAC Bonds generally require payments of a specified amount of principal on each payment date.
24
Stripped Mortgage-Backed Securities. Certain Portfolios may invest in stripped mortgage-backed securities ("SMBS"). An SMBS is a derivative multi-class mortgage security. SMBS usually are structured with two classes that receive different proportions of the interest and principal distribution on a pool of mortgage assets. In the most extreme case, one class will receive all of the interest (the interest-only or "IO" class), while the other class will receive all of the principal (the principal-only or "PO" class). The yield to maturity on an IO class is extremely sensitive to the rate of principal payments (including prepayments) on the related underlying mortgage assets, and a rapid rate of principal payments may have a material adverse effect on such security's yield to maturity. If the underlying mortgage assets experience greater than anticipated prepayments of principal, a Portfolio may fail to fully recoup its initial investment in these securities. Conversely, if the underlying mortgage assets experience less than anticipated prepayments of principal, the yield of POs could be materially adversely affected. The market values of IOs and POs are subject to greater risk of fluctuation in response to changes in market rates of interest than many other types of government securities. To the extent a Portfolio invests in IOs and POs, it may increase the risk of fluctuations in the net asset value of a Portfolio.
Commercial Mortgage-Backed Securities ("CMBS"). CMBS are generally multi-class or pass-through securities issued by special purpose entities that represent an undivided interest in a portfolio of mortgage loans backed by commercial properties, including, but not limited to, industrial and warehouse properties, office buildings, retail space and shopping malls, hotels, healthcare facilities, multifamily properties and cooperative apartments. Private lenders, such as banks or insurance companies, originate these loans and then sell the loans directly into a CMBS trust or other entity. The commercial mortgage loans that underlie CMBS are generally not amortizing or not fully amortizing. That is, at their maturity date, repayment of the remaining principal balance or "balloon" is due and is repaid through the attainment of an additional loan or sale of this property. An extension of the final payment on commercial mortgages will increase the average life of the CMBS, generally resulting in a lower yield for discount bonds and a higher yield for premium bonds.
CMBS are subject to credit risk and prepayment risk. Although prepayment risk is present, it is of a lesser degree in the CMBS than in the residential mortgage market; commercial real estate property loans often contain provisions which substantially reduce the likelihood that such securities will be prepaid (e.g., significant prepayment penalties on loans and, in some cases, prohibition on principal payments for several years following origination).
Municipals: Municipal securities are fixed income securities issued by local, state and regional governments that provide interest income which is exempt from federal income taxes. Municipals include both municipal bonds (those securities with maturities of five years or more) and municipal notes (those with maturities of less than five years). Municipal bonds are issued for a wide variety of reasons: to construct public facilities, such as airports, highways, bridges, schools, hospitals, mass transportation, streets, water and sewer works; to obtain funds for operating expenses; to refund outstanding municipal obligations; and to loan funds to various public institutions and facilities. Certain industrial development bonds are also considered municipal bonds if their interest is exempt from federal income tax. Industrial development bonds are issued by, or on behalf of, public authorities to obtain funds for various privately-operated manufacturing facilities, housing, sports arenas, convention centers, airports, mass transportation systems and water, gas or sewage works. Industrial development bonds are ordinarily dependent on the credit quality of a private user, not the public issuer.
The two principal classifications of municipal bonds are "general obligation" and "revenue" or "special tax" bonds. General obligation bonds are secured by the issuer's pledge of its full faith, credit and taxing power for the payment of principal and interest. Revenue or special tax bonds are payable only from the revenues derived from a particular facility or class of facilities or, in some cases, from the proceeds of a special excise or other tax, but not from general tax revenues.
Industrial revenue bonds in most cases are revenue bonds and generally do not have the pledge of the credit of the issuer. The payment of the principal and interest on such industrial revenue bonds is dependent solely on the ability of the user of the facilities financed by the bonds to meet its financial obligations and the pledge, if any, of real and personal property so financed as security for such payment. Short-term municipal obligations issued by states, cities, municipalities or municipal agencies, include tax anticipation notes, revenue anticipation notes, bond anticipation notes, construction loan notes and short-term discount notes.
25
Municipal notes are issued to meet the short-term funding requirements of local, regional and state governments. Municipal notes include bond anticipation notes, revenue anticipation notes and tax and revenue anticipation notes. These are short-term debt obligations issued by state and local governments to aid cash flows while waiting for taxes or revenue to be collected, at which time the debt is retired. Other types of municipal notes in which the Portfolio may invest are construction loan notes, short-term discount notes, tax-exempt commercial paper, demand notes, and similar instruments.
Municipal bonds generally include debt obligations issued by states and their political subdivisions, and duly constituted authorities and corporations, to obtain funds to construct, repair or improve various public facilities such as airports, bridges, highways, hospitals, housing, schools, streets and water and sewer works. Municipal bonds may also be issued to refinance outstanding obligations as well as to obtain funds for general operating expenses and for loans to other public institutions and facilities.
Note obligations with demand or put options may have a stated maturity in excess of one year, but permit any holder to demand payment of principal plus accrued interest upon a specified number of days' notice. Frequently, such obligations are secured by letters of credit or other credit support arrangements provided by banks. The issuer of such notes normally has a corresponding right, after a given period, to repay at its discretion the outstanding principal of the note plus accrued interest upon a specific number of days' notice to the bondholders. The interest rate on a demand note may be based upon a known lending rate, such as the prime lending rate, and be adjusted when such rate changes, or the interest rate on a demand note may be a market rate that is adjusted at specified intervals. Each note purchased by the Portfolios will meet the quality criteria set out in the prospectus for the Portfolios.
The yields of municipal bonds depend on, among other things, general money market conditions, conditions in the municipal bond market, the size of a particular offering, the maturity of the obligation, and the rating of the issue. The ratings of Moody's and Standard & Poor's represent their opinions of the quality of the municipal bonds rated by them. It should be emphasized that such ratings are general and are not absolute standards of quality. Consequently, municipal bonds with the same maturity, coupon and rating may have different yields, while municipal bonds of the same maturity and coupon, but with different ratings, may have the same yield. It will be the responsibility of the Adviser to appraise independently the fundamental quality of the bonds held by the Portfolios.
Municipal bonds are sometimes purchased on a "when-issued" or "delayed-delivery" basis, which means the Portfolio has committed to purchase certain specified securities at an agreed upon price when they are issued. The period between commitment date and issuance date can be a month or more. It is possible that the securities will never be issued and the commitment canceled.
From time to time proposals have been introduced before Congress to restrict or eliminate the federal income tax exemption for interest on municipal bonds. Similar proposals may be introduced in the future. If any such proposal were enacted, it might restrict or eliminate the ability of the Portfolios to achieve their investment objectives. In that event, the Fund's Trustees and officers would reevaluate investment objectives and policies and consider recommending to shareholders changes in such objectives and policies.
Similarly, from time to time proposals have been introduced before state and local legislatures to restrict or eliminate the state and local income tax exemption for interest on municipal bonds. Similar proposals may be introduced in the future. If any such proposal were enacted, it might restrict or eliminate the ability of a Portfolio to achieve its investment objective.
The Portfolios eligible to purchase municipal bonds may also purchase bonds the income on which is subject to the AMT ("AMT bonds"). AMT bonds are tax-exempt private activity bonds issued after August 7, 1986, the proceeds of which are directed, at least in part, to private, for-profit organizations. While the income from AMT bonds is exempt from regular federal income tax, it is a tax preference item in the calculation of the alternative minimum tax. The alternative minimum tax is a special separate tax that applies to some taxpayers who have certain adjustments to income or tax preference items.
26
Build America Bonds are taxable municipal securities on which the issuer receives federal support of the interest paid. Assuming certain specified conditions are satisfied, issuers of Build America Bonds may either (i) receive reimbursement from the U.S. Treasury with respect to a portion of its interest payments on the bonds ("direct pay" Build America Bonds) or (ii) provide tax credits to investors in the bonds ("tax credit" Build America Bonds). Unlike most other municipal securities, interest received on Build America Bonds is subject to federal and state income tax. Issuance of Build America Bonds ceased on December 31, 2010. The number of Build America Bonds available in the market will be limited, which may negatively affect the value of the Build America Bonds.
Lease Obligations. Included within the revenue bonds category, as noted above, are participations in lease obligations or installment purchase contracts (hereinafter collectively called "lease obligations") of municipalities. State and local governments, agencies or authorities issue lease obligations to acquire equipment and facilities. Lease obligations may have risks not normally associated with general obligation or other revenue bonds. Leases, and installment purchase or conditional sale contracts (which may provide for title to the leased asset to pass eventually to the issuer), have developed as a means for governmental issuers to acquire property and equipment without the necessity of complying with the constitutional and statutory requirements generally applicable for the issuance of debt. Certain lease obligations contain "non-appropriation" clauses that provide that the governmental issuer has no obligation to make future payments under the lease or contract unless money is appropriated for such purpose by the appropriate legislative body on an annual or other periodic basis. Consequently, continued lease payments on those lease obligations containing "non-appropriation" clauses are dependent on future legislative actions. If such legislative actions do not occur, the holders of the lease obligation may experience difficulty in exercising their rights, including disposition of the property.
In addition, lease obligations represent a relatively new type of financing that has not yet developed the depth of marketability associated with more conventional municipal obligations, and, as a result, certain of such lease obligations may be considered illiquid securities. To determine whether or not a Portfolio will consider such securities to be illiquid (and subject to each Portfolio's limitation on investing in illiquid securities), the Board has established guidelines to be utilized by the Portfolios in determining the liquidity of a lease obligation. The factors to be considered in making the determination include: 1) the frequency of trades and quoted prices for the obligation; 2) the number of dealers willing to purchase or sell the security and the number of other potential purchasers; 3) the willingness of dealers to undertake to make a market in the security; and 4) the nature of the marketplace trades, including the time needed to dispose of the security, the method of soliciting offers, and the mechanics of the transfer.
Non-Publicly Traded Securities, Private Placements and Restricted Securities: The Portfolios may invest in securities that are neither listed on a stock exchange nor traded over-the-counter, including privately placed and restricted securities. Such unlisted securities may involve a higher degree of business and financial risk that can result in substantial losses. As a result of the absence of a public trading market for these securities, they may be less liquid than publicly traded securities. Although these securities may be resold in privately negotiated transactions, the prices realized from these sales could be less than those originally paid by the Portfolio or less than what may be considered the fair value of such securities. Furthermore, companies whose securities are not publicly traded may not be subject to the disclosure and other investor protection requirements which might be applicable if their securities were publicly traded. If such securities are required to be registered under the securities laws of one or more jurisdictions before being sold, a Portfolio may be required to bear the expenses of registration.
Options: An option is a contract that gives the holder of the option the right, but not the obligation, to buy from (in the case of a call option) or sell to (in the case of a put option) the seller of the option (the "option writer") the underlying security at a specified fixed price (the "exercise price") on or prior to a specified date (the "expiration date"). The buyer of the option pays to the option writer the option premium, which is the purchase price of the option.
Exchange-traded options are issued by a regulated intermediary such as the Options Clearing Corporation ("OCC"), which guarantees the performance of the obligations of the parties to such options. OTC options are purchased from or sold to counterparties through direct bilateral agreement between the Portfolios and their counterparties. Certain options, such as options on individual securities, are settled through physical delivery of the underlying security, whereas other options, such as index options, may be settled in cash in an amount based on the value of the underlying instrument multiplied by a specified multiplier.
27
Writing Options. Certain Portfolios may write call and put options. As the writer of a call option, a Portfolio receives the premium from the purchaser of the option and has the obligation, upon exercise of the option, to deliver the underlying security upon payment of the exercise price. If the option expires without being exercised a Portfolio is not required to deliver the underlying security but retains the premium received.
Certain Portfolios may only write call options that are "covered." A call option on a security is covered if (a) a Portfolio owns the security underlying the call or has an absolute and immediate right to acquire that security without additional cash consideration (or, if additional cash consideration is required, such amount is maintained by a Portfolio in segregated or earmarked cash or liquid assets) upon conversion or exchange of other securities held by a Portfolio; or (b) a Portfolio has purchased a call on the underlying security, the exercise price of which is (i) equal to or less than the exercise price of the call written, or (ii) greater than the exercise price of the call written, provided the difference is maintained by a Portfolio in segregated or earmarked cash or liquid assets.
Selling call options involves the risk that a Portfolio may be required to sell the underlying security at a disadvantageous price, below the market price of such security, at the time the option is exercised. As the writer of a covered call option, a Portfolio forgoes, during the option's life, the opportunity to profit from increases in the market value of the underlying security covering the option above the sum of the premium and the exercise price but retains the risk of loss should the price of the underlying security decline.
Certain Portfolios may write put options. As the writer of a put option, a Portfolio receives the premium from the purchaser of the option and has the obligation, upon exercise of the option, to pay the exercise price and receive delivery of the underlying security. If the option expires without being exercised, a Portfolio is not required to receive the underlying security in exchange for the exercise price but retains the option premium.
A Portfolio may only write put options that are "covered." A put option on a security is covered if (a) a Portfolio segregates or earmarks cash or liquid assets equal to the exercise price; or (b) a Portfolio has purchased a put on the same security as the put written, the exercise price of which is (i) equal to or greater than the exercise price of the put written, or (ii) less than the exercise price of the put written, provided the difference is maintained by a Portfolio in segregated or earmarked cash or liquid assets.
Selling put options involves the risk that a Portfolio may be required to buy the underlying security at a disadvantageous price, above the market price of such security, at the time the option is exercised. While a Portfolio's potential gain in writing a covered put option is limited to the premium received plus the interest earned on the liquid assets covering the put option, a Portfolio's risks of loss is equal to the entire value of the underlying security, offset only by the amount of the premium received.
A Portfolio may close out an options position which it has written through a closing purchase transaction. A Portfolio would execute a closing purchase transaction with respect to a call option written by purchasing a call option. A Portfolio would execute a closing purchase transaction with respect to a put option written by purchasing a put option on the same underlying security and having the same exercise price and expiration date as the put option written by a Portfolio. A closing purchase transaction may or may not result in a profit to a Portfolio. A Portfolio could close out its position as an option writer only if a liquid market exists for options on the same underlying security and having the same exercise price and expiration date as the option written by a Portfolio. There is no assurance that such a market will exist with respect to any particular option.
The writer of an option generally has no control over the time when the option is exercised and the option writer is required to deliver or acquire the underlying security. Once an option writer has received an exercise notice, it cannot effect a closing purchase transaction in order to terminate its obligation under the option. Thus, the use of options may require a Portfolio to buy or sell portfolio securities at inopportune times or for prices other than the current market values of such securities, may limit the amount of appreciation a Portfolio can realize on an investment, or may cause a Portfolio to hold a security that it might otherwise sell.
Purchasing Options. Certain Portfolios may purchase call and put options. As the buyer of a call option, a Portfolio pays the premium to the option writer and has the right to purchase the underlying security from the option writer at the exercise price. If the market price of the underlying security rises above the exercise price, a Portfolio could exercise the option and acquire the underlying security at a below-market price, which could result
28
in a gain to a Portfolio, minus the premium paid. As the buyer of a put option, a Portfolio pays the premium to the option writer and has the right to sell the underlying security to the option writer at the exercise price. If the market price of the underlying security declines below the exercise price, a Portfolio could exercise the option and sell the underlying security at an above-market price, which could result in a gain to a Portfolio, minus the premium paid. A Portfolio may buy call and put options whether or not it holds the underlying securities.
As a buyer of a call or put option, a Portfolio may sell put or call options that it has purchased at any time prior to such option's expiration date through a closing sale transaction. The principal factors affecting the market value of a put or a call option include supply and demand, interest rates, the current market price of the underlying security in relation to the exercise price of the option, the volatility of the underlying security, the underlying security's dividend policy, and the time remaining until the expiration date. A closing sale transaction may or may not result in a profit to a Portfolio. A Portfolio's ability to initiate a closing sale transaction is dependent upon the liquidity of the options market and there is no assurance that such a market will exist with respect to any particular option. If a Portfolio does not exercise or sell an option prior to its expiration date, the option expires and becomes worthless.
OTC Options. Unlike exchange-traded options, which are standardized with respect to the underlying instrument, expiration date, contract size and strike price, the terms of OTC options generally are established through negotiation between the parties to the options contract. This type of arrangement allows the purchaser and writer greater flexibility to tailor the option to their needs. OTC options are available for a greater variety of securities or baskets of securities, and in a wider range of expiration dates and exercise prices than exchange-traded options. However, unlike exchange-traded options, which are issued and guaranteed by a regulated intermediary, such as the OCC, OTC options are entered into directly with the counterparty. Unless the counterparties provide for it, there is no central clearing or guaranty function for an OTC option. Therefore, OTC options are subject to the risk of default or non-performance by the counterparty. Accordingly, the Adviser must assess the creditworthiness of the counterparty to determine the likelihood that the terms of the option will be satisfied. There can be no assurance that a continuous liquid secondary market will exist for any particular OTC option at any specific time. As a result, a Portfolio may be unable to enter into closing sale transactions with respect to OTC options.
Index Options. Call and put options on indices operate similarly to options on securities. Rather than the right to buy or sell a single security at a specified price, options on an index give the holder the right to receive, upon exercise of the option, an amount of cash determined by reference to the value of the underlying index. The underlying index may be a broad-based index or a narrower market index. Unlike options on securities, all settlements are in cash. The settlement amount, which the writer of a index option must pay to the holder of the option upon exercise, is generally equal to the difference between the fixed exercise price of the option and the value of the underlying index, multiplied by a specified multiplier. The multiplier determines the size of the investment position the option represents. Gain or loss to a Portfolio on index options transactions will depend on price movements in the underlying securities market generally or in a particular segment of the market rather than price movements of individual securities. As with other options, a Portfolio may close out its position in index options through closing purchase transactions and closing sale transactions provided that a liquid secondary market exists for such options.
Index options written by a Portfolio will generally be covered in a manner similar to the covering of other types of options, by holding an offsetting financial position and/or segregating or earmarking cash or liquid assets. A Portfolio may cover call options written on an index by owning securities whose price changes, in the opinion of the Adviser, are expected to correlate to those of the underlying index.
Foreign Currency Options. Options on foreign currencies operate similarly to options on securities. Rather than the right to buy or sell a single security at a specified price, options on foreign currencies give the holder the right to buy or sell foreign currency for a fixed amount in U.S. dollars or other base currencies. Options on foreign currencies are traded primarily in the OTC market, but may also be traded on U.S. and foreign exchanges. The value of a foreign currency option is dependent upon the value of the underlying foreign currency relative to the U.S. dollar or other base currency. The price of the option may vary with changes in, among other things, the value of either or both currencies and has no relationship to the investment merits of a foreign security. Options on foreign currencies are affected by all of those factors which influence foreign exchange rates and foreign investment generally. As with other options, a Portfolio may close out its position in foreign currency options through closing purchase transactions and closing sale transactions provided that a liquid market exists for such options.
29
Foreign currency options written by a Portfolio will generally be covered in a manner similar to the covering of other types of options, by holding an offsetting financial position and/or segregating or earmarking cash or liquid assets.
Additional Risks of Options Transactions. The risks associated with options transactions are different from, and possibly greater than, the risks associated with investing directly in the underlying instruments. Options are highly specialized instruments that require investment techniques and risk analyses different from those associated with other portfolio investments. The use of options requires an understanding not only of the underlying instrument but also of the option itself. Options may be subject to the risk factors generally applicable to derivatives transactions described herein, and may also be subject to certain additional risk factors, including:
• The exercise of options written or purchased by a Portfolio could cause a Portfolio to sell portfolio securities, thus increasing a Portfolio's portfolio turnover.
• A Portfolio pays brokerage commissions each time it writes or purchases an option or buys or sells an underlying security in connection with the exercise of an option. Such brokerage commissions could be higher relative to the commissions for direct purchases of sales of the underlying securities.
• A Portfolio's options transactions may be limited by limitations on options positions established by the SEC, CFTC or the exchanges on which such options are traded.
• The hours of trading for exchange-listed options may not coincide with the hours during which the underlying securities are traded. To the extent that the options markets close before the markets for the underlying securities, significant price and rate movements can take place in the underlying securities that cannot be reflected in the options markets.
• Index options based upon a narrower index of securities may present greater risks than options based on broad market indexes, as narrower indexes are more susceptible to rapid and extreme fluctuations as a result of changes in the values of a smaller number of securities.
• A Portfolio is subject to the risk of market movements between the time that an option is exercised and the time of performance thereunder, which could increase the extent of any losses suffered by a Portfolio in connection with options transactions.
Options on Futures Contracts. Options on futures contracts are similar to options on securities except that options on futures contracts give the purchasers the right, in return for the premium paid, to assume a position in a futures contract (a long position in the case of a call option and a short position in the case of a put option) at a specified exercise price at any time prior to the expiration of the option. Upon exercise of the option, the parties will be subject to all of the risks associated with futures transactions and subject to margin requirements. As the writer of options on futures contracts, a Portfolio would also be subject to initial and variation margin requirements on the option position.
Options on futures contracts written by a Portfolio will generally be covered in a manner similar to the covering of other types of options, by holding an offsetting financial position and/or segregating or earmarking cash or liquid assets. A Portfolio may cover an option on a futures contract by purchasing or selling the underlying futures contract. In such instances the exercise of the option will serve to close out a Portfolio's futures position.
Combined Transactions. Combined transactions involve entering into multiple derivatives transactions (such as multiple options transactions, including purchasing and writing options in combination with each other; multiple futures transactions; and combinations of options, futures, forward and swap transactions) instead of a single derivatives transaction in order to customize the risk and return characteristics of the overall position. Combined transactions typically contain elements of risk that are present in each of the component transactions. A Portfolio may enter into a combined transaction instead of a single derivatives transaction when, in the opinion of the Adviser, it is in the best interest of the Portfolio to do so. Because combined transactions involve multiple transactions, they may result in higher transaction costs and may be more difficult to close out.
Private Investments in Public Equity: A Portfolio may purchase equity securities in a private placement that are issued by issuers who have outstanding, publicly-traded equity securities of the same class ("private
30
investments in public equity" or "PIPES"). Shares in PIPES generally are not registered with the SEC until after a certain time period from the date the private sale is completed. This restricted period can last many months. Until the public registration process is completed, PIPES are restricted as to resale and the Portfolio cannot freely trade the securities. Generally, such restrictions cause the PIPES to be illiquid during this time. PIPES may contain provisions that the issuer will pay specified financial penalties to the holder if the issuer does not publicly register the restricted equity securities within a specified period of time, but there is no assurance that the restricted equity securities will be publicly registered, or that the registration will remain in effect.
As a general matter, a Portfolio may not invest more than 15% of its net assets in illiquid securities, such as securities for which there is not a readily available secondary market or securities that are restricted from sale to the public without registration. However, certain Restricted Securities can be offered and sold to qualified institutional buyers under Rule 144A ("Rule 144A Securities") under the Securities Act of 1933, as amended (the "1933 Act"), and may be deemed to be liquid under guidelines adopted by the Fund's Board of Trustees. The Portfolios may invest without limit in liquid Rule 144A Securities. Rule 144A Securities may become illiquid if qualified institutional buyers are not interested in acquiring the securities.
Preferred Stock: Preferred stocks are non-voting ownership shares in a corporation which pay a fixed or variable stream of dividends. Preferred stocks have a preference over common stocks in the event of the liquidation of an issuer. Preferred stocks have many of the characteristics of both equity securities and fixed income securities. Therefore, the Fund's Equity, Fixed Income and Balanced Portfolios may all purchase preferred stocks.
Public Bank Loans: Certain Portfolios may invest in public loans made by banks or other financial institutions, which may be rated investment grade (Baa or higher by Moody's, BBB or higher by Standard & Poor's) or below investment grade (below Baa by Moody's or below BBB by Standard & Poor's). Public bank loans are privately negotiated loans for which information about the issuer has been made publicly available. However, public bank loans are not registered under the 1933 Act, and are not publicly traded. They usually are second lien loans normally lower in priority of payment to senior loans, but have seniority in a company's capital structure to other claims, such as subordinated corporate bonds or publicly-issued equity so that in the event of bankruptcy or liquidation, the company is required to pay down these second lien loans prior to such other lower-ranked claims on their assets. Bank loans normally pay floating rates that reset frequently, and as a result, protect investors from increases in interest rates.
Bank loans generally are negotiated between a borrower and several financial institutional lenders represented by one or more lenders acting as agent of all the lenders. The agent is responsible for negotiating the loan agreement that establishes the terms and conditions of the loan and the rights of the borrower and the lenders, monitoring any collateral, and collecting principal and interest on the loan. By investing in a loan, a Portfolio becomes a member of a syndicate of lenders. Certain bank loans are illiquid, meaning the Portfolio may not be able to sell them quickly at a fair price. Illiquid securities are also difficult to value. To the extent a bank loan has been deemed illiquid, it will be subject to a Portfolio's restrictions on investment in illiquid securities. The secondary market for bank loans may be subject to irregular trading activity, wide bid/ask spreads and extended trade settlement periods.
Bank loans are subject to the risk of default. Default in the payment of interest or principal on a loan will result in a reduction of income to a Portfolio, a reduction in the value of the loan, and a potential decrease in the Portfolio's net asset value. The risk of default will increase in the event of an economic downturn or a substantial increase in interest rates. Bank loans are subject to the risk that the cash flow of the borrower and property securing the loan or debt, if any, may be insufficient to meet scheduled payments. As discussed above, however, because bank loans reside higher in the capital structure than high yield bonds, default losses have been historically lower in the bank loan market. Bank loans that are rated below investment grade share the same risks of other below investment grade securities.
Real Estate Investment Trusts: Certain Portfolios may invest in real estate investment trusts ("REITs"). REITs pool investors' funds for investment primarily in real estate properties or real estate-related loans. REITs generally derive their income from rents on the underlying properties or interest on the underlying loans, and their value is impacted by changes in the value of the underlying property or changes in interest rates affecting the
31
underlying loans owned by the REITs. REITs are more susceptible to risks associated with the ownership of real estate and the real estate industry in general. These risks can include fluctuations in the value of underlying properties; defaults by borrowers or tenants; market saturation; changes in general and local economic conditions; decreases in market rates for rents; increases in competition, property taxes, capital expenditures, or operating expenses; and other economic, political or regulatory occurrences affecting the real estate industry. In addition, REITs depend upon specialized management skills, may not be diversified (which may increase the volatility of the REIT's value), may have less trading volume and may be subject to more abrupt or erratic price movements than the overall securities market. Operating REITs requires specialized management skills and the Fund indirectly bears REIT management expenses along with the direct expenses of the Fund. REITs are not taxed on income distributed to shareholders provided they comply with several requirements of the Internal Revenue Code of 1986, as amended (the "Code"). REITs are subject to the risk of failing to qualify for tax-free pass-through of income under the Code.
Repurchase Agreements: The Portfolios may invest in repurchase agreements. When cash may be available for only a few days, it may be invested by a Portfolio in repurchase agreements until such time as it may otherwise be invested or used for payments of obligations of the Portfolio. These agreements typically involve the acquisition by the Portfolio of debt securities from a selling financial institution such as a bank, savings and loan association or broker-dealer. The agreement provides that the Portfolio will sell back to the institution, and that the institution will repurchase, the underlying securities serving as collateral at a specified price and at a fixed time in the future, usually not more than seven days from the date of purchase. The collateral will be marked-to-market daily to determine that the value of the collateral, as specified in the agreement, does not decrease below the purchase price plus accrued interest. If such decrease occurs, additional collateral will be requested and, when received, added to the account to maintain full collateralization. The Portfolio will accrue interest from the institution until the time when the repurchase is to occur. Although this date is deemed by the Portfolio to be the maturity date of a repurchase agreement, the maturities of securities subject to repurchase agreements are not subject to any limits.
While repurchase agreements involve certain risks not associated with direct investments in debt securities, the Portfolios follow procedures approved by the Trustees that are designed to minimize such risks. These procedures include effecting repurchase transactions only with large, well-capitalized and well-established financial institutions whose financial condition will be continually monitored by the Adviser. In addition, as described above, the value of the collateral underlying the repurchase agreement will be at least equal to the repurchase price, including any accrued interest earned on the repurchase agreement. In the event of a default or bankruptcy by a selling financial institution, a Portfolio will seek to liquidate such collateral. However, the exercising of a Portfolio's right to liquidate such collateral could involve certain costs or delays and, to the extent that proceeds from any sale upon a default of the obligation to repurchase were less than the repurchase price, the Portfolio could suffer a loss.
Reverse Repurchase Agreements: Under a Reverse Repurchase Agreement, a Portfolio sells a security and promises to repurchase that security at an agreed upon future date and price. The price paid to repurchase the security reflects interest accrued during the term of the agreement. The Portfolio will establish a separate custodial account holding cash and other liquid assets in an amount not less than the purchase obligations of the agreement. Reverse Repurchase Agreements may be viewed as a speculative form of borrowing called leveraging. A Portfolio may invest in reverse repurchase agreements if (i) interest earned from leveraging exceeds the interest expense of the original reverse repurchase transaction and (ii) proceeds from the transaction are not invested for longer than the term of the Reverse Repurchase Agreement. See "Leverage Risks," above, for a description of leverage risk.
Rights: Rights are equity securities representing a preemptive right of stockholders to purchase additional shares of a stock at the time of a new issuance, before the stock is offered to the general public. A stockholder who purchases rights may be able to retain the same ownership percentage after the new stock offering. A right usually enables the stockholder to purchase common stock at a price below the initial offering price. A Portfolio that purchases a right takes the risk that the right might expire worthless because the market value of the common stock falls below the price fixed by the right.
Securities Lending: Each Portfolio may lend its portfolio securities to brokers, dealers, banks and other institutional investors. By lending its portfolio securities, a Portfolio attempts to increase its net investment income through the receipt of interest on the cash collateral with respect to the loan or fees received from the borrower in
32
connection with the loan. Any gain or loss in the market price of the securities loaned that might occur during the term of the loan would be for the account of the Portfolio. The Fund employs an agent to implement the securities lending program and the agent receives a portion of the fee paid by the Borrower to the Fund for its services.
Each Portfolio may lend its portfolio securities so long as the terms, the structure and the aggregate amount of such loans are not inconsistent with the 1940 Act or the rules and regulations or interpretations of the SEC thereunder, which currently require that (a) the borrower pledge and maintain with the Portfolio collateral consisting of liquid, unencumbered assets having a value at all times not less than 100% of the value of the securities loaned; (ii) the borrower add to such collateral whenever the price of the securities loaned rises (i.e., the borrower "marks to market" on a daily basis); (iii) the loan be made subject to termination by the Portfolio at any time; and (iv) the Portfolio receive a reasonable return on the loan (which may include the Portfolio investing any cash collateral in interest bearing short-term investments), any distributions on the loaned securities and any increase in their market value. In addition, voting rights may pass with the loaned securities, but the Portfolio will retain the right to call any security in anticipation of a vote that the Adviser deems material to the security on loan.
There may be risks of delay and costs involved in recovery of securities or even loss of rights in the collateral should the borrower of the securities fail financially. These delays and costs could be greater for foreign securities. However, loans will be made only to borrowers deemed by the Adviser to be creditworthy and when, in the judgment of the Adviser, the income which can be earned from such securities loans justifies the attendant risk. All relevant facts and circumstances, including the creditworthiness of the broker, dealer, bank or institution, will be considered in making decisions with respect to the lending of securities, subject to review by the Fund's Board. The Portfolio also bears the risk that the reinvestment of collateral will result in a principal loss. Finally, there is the risk that the price of the securities will increase while they are on loan and the collateral will not be adequate to cover their value.
Short Selling: A short sale is a transaction in which a Portfolio sells securities that it does not own, but has borrowed, in anticipation of a decline in the market price of the securities. To deliver the securities to the buyer, the Portfolio arranges through a broker to borrow the securities and, in so doing, the Portfolio becomes obligated to replace the securities borrowed at their market price at the time of replacement. When selling short, the Portfolio intends to replace the securities at a lower price and therefore, profit from the difference between the cost to replace the securities and the proceeds received from the sale of the securities. When the Portfolio makes a short sale, the proceeds it receives from the sale will be held on behalf of a broker until the Portfolio replaces the borrowed securities. The Portfolio may have to pay a premium to borrow the securities and must pay any dividends or interest payable on the securities until they are replaced.
A Portfolio secures its obligation to replace the borrowed securities by depositing collateral with the broker, consisting of cash or other liquid securities. The Portfolio also must place in a segregated account with its custodian cash or other liquid securities equal in value to the difference, if any, between (i) the current market value of the securities sold short and (ii) any cash or other liquid securities deposited as collateral with the broker in connection with the short sale. This amount will be adjusted daily to reflect changes in the value of the securities sold short. A Portfolio also can cover its obligations by owning another security (such as a call option) giving it the right to obtain the same kind and amount of the security it sold short.
Short sales by a Portfolio involve certain risks and special considerations. If the Adviser incorrectly predicts that the price of a borrowed security will decline, the Portfolio will have to replace the securities by purchasing them at a higher price than it received from the sale. Therefore, losses from short sales may be unlimited. By contrast, when a Portfolio purchases a security and holds it, the Portfolio cannot lose more than the amount it paid for the security.
Structured Investments: Certain Portfolios also may invest a portion of their assets in structured investments. A structured investment is a derivative security designed to offer a return linked to a particular underlying security, currency, commodity or market, for which the amount of principal repayment and/or interest payments is based on the change in value of such underlying security, currency, commodity or market, including, among others, currency exchange rates, interest rates (such as the prime lending rate or LIBOR), referenced bonds and stock indices or other financial reference. Structured investments may come in various forms, including notes, warrants and options to purchase securities, and may be listed and traded on an exchange or otherwise traded in the OTC market.
33
A Portfolio will typically use structured investments to gain exposure to a permitted underlying security, currency or market when direct access to such security, currency, commodity or market is limited or inefficient from a tax, cost or regulatory standpoint. Investments in structured investments involve risks including counterparty risk and market risk. Holders of structured investments bear risks of the underlying investment and are subject to counterparty risk because a Portfolio is relying on the creditworthiness of such counterparty and has no rights with respect to the issuer of the underlying investment. Certain structured investments may be thinly traded or have a limited trading market and may have the effect of increasing a Portfolio's illiquidity to the extent that the Portfolio, at a particular point in time, may be unable to find qualified buyers for these investments.
A structured investment may be linked either positively or negatively to its underlying security, currency, commodity or market and a change in interest rate, principal amount or other factor, depending on the structured investment's design, may be a multiple of the factor's movement. Application of a multiplier is comparable to the use of financial leverage, a speculative technique. Leverage magnifies the potential for gain and the risk of loss. As a result, a relatively small decline in the value of the referenced factor could result in a relatively large loss in the value of a structured investment.
Other types of structured investments include interests in entities organized and operated for the purpose of restructuring the investment characteristics of underlying investment interests or securities. This type of securitization or restructuring usually involves the deposit or purchase of an underlying security by a U.S. or foreign entity, such as a corporation or trust of specified instruments, and the issuance by that entity of one or more classes of securities backed by, or representing an interest in, the underlying instruments. The cash flow or rate of return on the underlying investments may be apportioned among the newly issued securities to create different investment characteristics, such as varying maturities, credit quality, payment priorities and interest rate provisions. Structured investments which are subordinated, for example, in payment priority often offer higher returns, but may result in increased risks compared to other investments.
Swaps: A swap contract is an agreement between two parties pursuant to which the parties exchange payments at specified dates on the basis of a specified notional amount, with the payments calculated by reference to specified securities, indexes, reference rates, currencies or other instruments. Most swap agreements provide that when the period payment dates for both parties are the same, the payments are made on a net basis (i.e., the two payment streams are netted out, with only the net amount paid by one party to the other). A Portfolio's obligations or rights under a swap contract entered into on a net basis will generally be equal only to the net amount to be paid or received under the agreement, based on the relative values of the positions held by each counterparty. With limited exceptions swap agreements are generally not entered into or traded on exchanges. For most swaps there is no central clearing or guaranty function. Therefore, swaps are subject to the risk of default or non-performance by the counterparty. Accordingly, the Adviser must assess the creditworthiness of the counterparty to determine the likelihood that the terms of the swap will be satisfied.
Swap agreements allow for a wide variety of transactions. For example, fixed rate payments may be exchanged for floating rate payments, U.S. dollar denominated payments may be exchanged for payments denominated in foreign currencies, and payments tied to the price of one security, index, reference rate, currency or other instrument may be exchanged for payments tied to the price of a different security, index, reference rate, currency or other instrument. Swap contracts are typically individually negotiated and structured to provide exposure to a variety of particular types of investments or market factors. Swap contracts can take many different forms and are known by a variety of names. To the extent consistent with a Portfolio's investment objectives and policies, a Portfolio is not limited to any particular form or variety of swap contract. A Portfolio may utilize swaps to increase or decrease its exposure to the underlying instrument, reference rate, foreign currency, market index or other asset. Certain Portfolios may also enter into related derivative instruments including caps, floors and collars.
A Portfolio may be required to cover swap transactions. Obligations under swap agreements entered into on a net basis are generally accrued daily and any accrued but unpaid amounts owed by a Portfolio to the swap counterparty will be covered by segregating or earmarking cash or liquid assets. If a Portfolio enters into a swap agreement on other than a net basis, a Portfolio will segregate or earmark cash or liquid assets with a value equal to the full amount of a Portfolio's accrued obligations under the agreement.
34
Interest Rate Swaps, Caps, Floors and Collars. Interest rate swaps consist of an agreement between two parties to exchange their respective commitments to pay or receive interest (e.g., an exchange of floating rate payments for fixed rate payments). Interest rate swaps are generally entered into on a net basis. Interest rate swaps do not involved the delivery of securities, other underlying assets, or principal. Accordingly, the risk of loss with respect to interest rate and total rate of return swaps is limited to the net amount of interest payments that a Portfolio is contractually obligated to make.
Certain Portfolios may also buy or sell interest rate caps, floors and collars. The purchase of an interest rate cap entitles the purchaser, to the extent that a specified index exceeds a predetermined interest rate, to receive payments of interest on a specified notional amount from the party selling the interest rate cap. The purchase of an interest rate floor entitles the purchaser, to the extent that a specified index falls below a predetermined interest rate, to receive payments of interest on a specified notional amount from the party selling the interest rate floor. A collar is a combination of a cap and a floor that preserves a certain return within a predetermined range of interest rate of values. Caps, floors and collars may be less liquid than other types of swaps. If a Portfolio sells caps, floors and collars, it will segregate liquid assets with a value equal to the full amount, accrued daily, of a Portfolio's net obligations with respect to the caps, floors or collars.
Index Swaps. An index swap consists of an agreement between two parties in which a party exchanges a cash flow based on a notional amount of a reference index for a cash flow based on a different index or on another specified instrument or reference rate. Index swaps are generally entered into on a net basis.
Inflation Swaps. Inflation swap agreements are contracts in which one party agrees to pay the cumulative percentage increase in a price index, such as the Consumer Price Index, over the term of the swap (with some lag on the referenced inflation index), and the other party pays a compounded fixed rate. Inflation swap agreements may be used to protect the net asset value of a Portfolio against an unexpected change in the rate of inflation measured by an inflation index. The value of inflation swap agreements is expected to change in response to changes in real interest rates. Real interest rates are tied to the relationship between nominal interest rates and the rate of inflation.
Currency Swaps. A currency swap consists of an agreement between two parties to exchange cash flows on a notional amount of two or more currencies based on the relative value differential among them, such as exchanging a right to receive a payment in a foreign currency for the right to receive U.S. dollars. Currency swap agreements may be entered into on a net basis or may involve the delivery of the entire principal value of one designated currency in exchange for the entire principal value of another designated currency. In such cases, the entire principal value of a currency swap is subject to the risk that the counterparty will default on its contractual delivery obligations.
Credit Default Swaps. A credit default swap consists of an agreement between two parties in which the "buyer" agrees to pay to the "seller" a periodic stream of payments over the term of the contract and the seller agrees to pay the buyer the par value (or other agreed-upon value) of a referenced debt obligation upon the occurrence of a credit event with respect to the issuer of the referenced debt obligation. Generally, a credit event means a bankruptcy, failure to pay or a restructuring. A Portfolio may be either the buyer or seller in a credit default swap. As the buyer in a credit default swap, a Portfolio would pay to the counterparty the periodic stream of payments. If no default occurs, a Portfolio would receive no benefit from the contract. As the seller in a credit default swap, a Portfolio would receive the stream of payments but would be subject to exposure on the notional amount of the swap, which it would be required to pay in the event of default. A Portfolio will generally segregate or earmark liquid assets to cover any potential obligation under a credit default swap sold by a Portfolio. The use of credit default swaps could result in losses to a Portfolio if the Adviser fails to correctly evaluate the creditworthiness of the issuer of the referenced debt obligation.
Swaptions. An option on a swap agreement, also called a "swaption," is an option that gives the buyer the right, but not the obligation, to enter into a swap on a future date in exchange for paying a market based "premium." A receiver swaption gives the owner the right to receive the total return of a specified asset, reference rate, or index. A payer swaption gives the owner the right to pay the total return of a specified asset, reference rate, or index. Swaptions also include options that allow an existing swap to be terminated or extended by one of the counterparties.
35
General Risks of Swaps. The risks associated with swap transactions are different from, and possibly greater than, the risks associated with investing directly in the underlying instruments. Swaps are highly specialized instruments that require investment techniques and risk analyses different from those associated with other portfolio investments. The use of swaps requires an understanding not only of the underlying instrument but also of the swap contract itself. Swap transactions may be subject to the risk factors generally applicable to derivatives transactions described above, and may also be subject to certain additional risk factors, including:
• Many swap agreements are not traded on exchanges and not subject to a similar level of government regulation as exchange-traded derivatives. As a result, parties to a swap agreement are not protected by such government regulations to the same extent participants are in transactions in derivatives traded on organized exchanges.
• In addition to the risk of default by the counterparty, if the creditworthiness of a counterparty to a swap agreement declines, the value of the swap agreement would be likely to decline, potentially resulting in losses.
• The swaps market is a relatively new market and currently is largely unregulated. It is possible that further developments in the swaps market, including future governmental regulation, could adversely affect a Portfolio's ability to utilize swaps, terminate existing swap agreements or realize amounts to be received under such agreements.
U.S. Government Securities: The term "U.S. Government securities" refers to a variety of fixed income securities issued or guaranteed by the U.S. Government and various instrumentalities and agencies. The U.S. Government securities that certain Portfolios may purchase include U.S. Treasury bills, notes and bonds, all of which are direct obligations of the U.S. Government. In addition, certain Portfolios may purchase securities issued by agencies and instrumentalities of the U.S. Government which are backed by the full faith and credit of the United States. Among the agencies and instrumentalities issuing these obligations are Ginnie Mae and the Federal Housing Administration.
Certain of the Portfolios may also purchase securities issued by agencies and instrumentalities which are not backed by the full faith and credit of the United States, but whose issuing agency or instrumentality has the right to borrow, to meet its obligations, from the U.S. Treasury. Among these agencies and instrumentalities are Fannie Mae, Freddie Mac and the Federal Home Loan Banks. Further, certain Portfolios may purchase securities issued by agencies and instrumentalities which are backed solely by the credit of the issuing agency or instrumentality. Among these agencies and instrumentalities is the Federal Farm Credit System.
Warrants: Warrants are equity securities in the form of options issued by a corporation which give the holder the right to purchase stock, usually at a price that is higher than the market price at the time the warrant is issued. A purchaser takes the risk that the warrant may expire worthless because the market price of the common stock fails to rise above the price set by the warrant.
When-Issued and Delayed Delivery Securities and Forward Commitments: A Portfolio may purchase securities on a when-issued or delayed delivery basis or may purchase or sell securities on a forward commitment basis. When these transactions are negotiated, the price is fixed at the time of the commitment, but delivery and payment can take place a month or more after the date of commitment. A Portfolio may sell the securities before the settlement date, if it is deemed advisable. The securities so purchased or sold are subject to market fluctuation and no interest or dividends accrue to the purchaser prior to the settlement date.
At the time a Portfolio makes the commitment to purchase or sell securities on a when-issued, delayed delivery or forward commitment basis, it will record the transaction and thereafter reflect the value, each day, of such security purchased, or if a sale, the proceeds to be received, in determining its net asset value. At the time of delivery of the securities, their value may be more or less than the purchase or sale price. An increase in the percentage of a Portfolio's assets committed to the purchase of securities on a when-issued, delayed delivery or forward commitment basis may increase the volatility of its net asset value. A Portfolio will also earmark cash or liquid assets or establish a segregated account on the Portfolio's books in which it will continually maintain cash or cash equivalents or other liquid portfolio securities equal in value to commitments to purchase securities on a when-issued, delayed delivery or forward commitment basis. See "Leverage Risks" above for a description of leverage risk.
36
When, As and If Issued Securities: A Portfolio may purchase securities on a "when, as and if issued" basis under which the issuance of the security depends upon the occurrence of a subsequent event, such as approval of a merger, corporate reorganization or debt restructuring. The commitment for the purchase of any such security will not be recognized in the portfolio of a Portfolio until the Adviser determines that issuance of the security is probable. At that time, the Portfolio will record the transaction and, in determining its net asset value, will reflect the value of the security daily. At that time, the Portfolio will also establish a segregated account on its books in which it will maintain cash, cash equivalents or other liquid portfolio securities equal in value to recognized commitments for such securities.
An increase in the percentage of the Portfolio's assets committed to the purchase of securities on a "when, as and if issued" basis may increase the volatility of its net asset value. The Portfolio may also sell securities on a "when, as and if issued" basis provided that the issuance of the security will result automatically from the exchange or conversion of a security owned by the Portfolio at the time of sale.
Yankee and Eurobond Obligations: Each Portfolio may invest in Eurobond and Yankee obligations, which are fixed income securities. The Eurobonds that the Portfolios will purchase may include bonds issued and denominated in euros. Eurobonds may be issued by government and corporate issuers in Europe. Yankee bank obligations are U.S. dollar-denominated obligations issued in the U.S. capital markets by foreign banks.
Eurobond and Yankee obligations are subject to the same risks that pertain to domestic issues, notably credit risk, market risk and liquidity risk. However, Eurobond (and to a limited extent, Yankee) obligations also are subject to certain sovereign risks. One such risk is the possibility that a sovereign country might prevent capital from flowing across its borders. Other risks include adverse political and economic developments; the extent and quality of government regulation of financial markets and institutions; the imposition of foreign withholding taxes, and the expropriation or nationalization of foreign issuers.
Zero Coupons: Each Portfolio may invest in zero coupon bonds ("Zero Coupons"), which are fixed income securities that do not make regular interest payments. Instead, Zero Coupons are sold at substantial discounts from their face value. The difference between a Zero Coupon's issue or purchase price and its face value represents the imputed interest an investor will earn if the obligation is held until maturity. For tax purposes, a portion of this imputed interest is deemed as income received by zero coupon bondholders each year. Each Portfolio intends to pass along such interest as a component of the Portfolio's distributions of net investment income.
Zero Coupons may offer investors the opportunity to earn higher yields than those available on ordinary interest-paying obligations of similar credit quality and maturity. However, Zero Coupon prices may also exhibit greater price volatility than ordinary fixed income securities because of the manner in which their principal and interest are returned to the investor.
INVESTMENT LIMITATIONS
Fundamental Limitations. Each Portfolio is subject to the following restrictions which are fundamental policies and may not be changed without the approval of the lesser of: (1) at least 67% of the voting securities of the Portfolio present at a meeting if the holders of more than 50% of the outstanding voting securities of the Portfolio are present or represented by proxy, or (2) more than 50% of the outstanding voting securities of the Portfolio.
As a matter of fundamental policy, each Portfolio will not change its objective and will not:
(1) purchase or sell physical commodities unless acquired as a result of ownership of securities or other instruments; provided that this restriction shall not prohibit the Portfolio from purchasing or selling options, futures contracts and related options thereon, forward contracts, swaps, caps, floors, collars and any other financial instruments or from investing in securities or other instruments backed by physical commodities or as otherwise permitted by (i) the 1940 Act, as amended from time to time, (ii) the rules and regulations promulgated by the SEC under the 1940 Act, as amended from time to time, or (iii) an exemption or other relief applicable to the Portfolio from the provisions of the 1940 Act, as amended from time to time;
37
(2) purchase or sell real estate, although it may purchase and sell securities of companies which deal in real estate, other than real estate limited partnerships, and may purchase and sell marketable securities which are secured by interests in real estate;
(3) make loans of money or property to any person, except (a) to the extent that securities or interests in which the Portfolio may invest are considered to be loans, (b) through the loan of portfolio securities, (c) by engaging in repurchase agreements or (d) as may otherwise be permitted by (i) the 1940 Act, as amended from time to time, (ii) the rules and regulations promulgated by the SEC under the 1940 Act, as amended from time to time, or (iii) an exemption or other relief applicable to the Fund from the provisions of the 1940 Act, as amended from time to time;
(4) invest in a manner inconsistent with its classification as a "diversified company" as a provided by (i) the 1940 Act, as amended from time to time, (ii) the rules and regulations promulgated by the SEC under the 1940 Act, as amended from time to time, or (iii) an exemption or other relief applicable to the Portfolio from the provisions of the 1940 Act, as amended from time to time;
(5) borrow money, except the Portfolio may borrow money to the extent permitted by (i) the 1940 Act, as amended from time to time, (ii) the rules and regulations promulgated by the SEC under the 1940 Act, as amended from time to time, or (iii) an exemption or other relief applicable to the Company from the provisions of the 1940 Act, as amended from time to time;
(6) underwrite the securities of other issuers (except to the extent that the Fund may be deemed to be an underwriter within the meaning of the 1933 Act in connection with the disposition of restricted securities);
(7) acquire any securities of companies within one industry, if, as a result of such acquisition, more than 25% of the value of the Portfolio's total assets would be invested in securities of companies within such industry; provided, however that (i) there shall be no limitation on the purchase of obligations issued or guaranteed by the U.S. Government, its agencies or instrumentalities; (ii) utility companies will be divided according to their services, for example, gas, gas transmission, electric and telephone will each be considered a separate industry; (iii) financial service companies will be classified according to the end users of their services, for example, automobile finance, bank finance and diversified finance will each be considered a separate industry; and (iv) asset-backed securities will be classified according to the underlying assets securing such securities; and
(8) issue senior securities, except the Portfolio may issue senior securities to the extent permitted by (i) the 1940 Act, as amended from time to time, (ii) the rules and regulations promulgated by the SEC under the 1940 Act, as amended from time to time, or (iii) an exemption or other relief applicable to the Portfolio from the provisions of the 1940 Act, as amended from time to time.
Non-Fundamental Limitations. Each Portfolio is also subject to the following restrictions which may be changed by the Board without shareholder approval.
As a matter of non-fundamental policy, no Portfolio will:
(1) purchase on margin, except for use of short-term credit as may be necessary for the clearance of purchases and sales of securities, provided that each Portfolio may make margin deposits in connection with transactions in options, futures, and options on futures;
(2) sell short unless the Portfolio (i) by virtue of its ownership of other securities, has the right to obtain securities equivalent in kind and amount to the securities sold and, if the right is conditional, the sale is made upon the same conditions, or (ii) maintains in a segregated account on the books of the Fund's custodian an amount that, when combined with the amount of collateral deposited with the broker in connection with the short sale, equals the current market value of the security sold short or such other amount as the SEC or its staff may permit by rule, regulation, order or interpretation (transactions in futures contracts and options, however, are not deemed to constitute selling securities short);
38
(3) pledge, mortgage or hypothecate assets in an amount greater than 50% of its total assets, provided that each Portfolio may earmark or segregate assets without limit in order to comply with the requirements of Section 18(f) of the 1940 Act and applicable rules, regulations or interpretations of the SEC and its staff;
(4) invest more than an aggregate of 15% of the net assets of the Portfolio determined at the time of investment, in illiquid securities provided that this limitation shall not apply to any investment in securities that are not registered under the 1933 Act but that can be sold to qualified institutional investors in accordance with Rule 144A under the 1933 Act and are determined to be liquid securities under guidelines or procedures adopted by the Board;
(5) invest for the purpose of exercising control over management of any company; and
(6) invest its assets in securities of any investment company, except as permitted by the 1940 Act or the rules, regulations, interpretations or orders of the SEC and its staff thereunder; provided that no Portfolio will invest in other investment companies in reliance on Sections 12(d)(1)(F), 12(d)(1)(G) or 12(d)(1)(J) of the 1940 Act.
Unless otherwise indicated, if a percentage limitation on investment or utilization of assets as set forth above is adhered to at the time an investment is made, a later change in percentage resulting from changes in the value or total cost of the Portfolio's assets will not be considered a violation of the restriction, and the sale of securities will not be required. The foregoing does not apply to borrowings or investments in illiquid securities.
Pursuant to an order from the SEC, the Portfolios may enter into interfund lending arrangements. Interfund loans and borrowings permit each Portfolio to lend money directly to and borrow from other Portfolios of the Fund for temporary purposes. Such loans and borrowings normally extend overnight but may have a maximum duration of seven days. A Portfolio will borrow through the interfund lending facility only when the costs are lower than the costs of bank loans, and will lend through the facility only when the returns are higher than those available from an investment in repurchase agreements. In addition, a Portfolio will borrow and lend money through interfund lending arrangements only if, and to the extent that, such practice is consistent with the Portfolio's investment objectives and other investments. Any delay in repayment to a lending Portfolio could result in a lost investment opportunity or additional borrowing costs.
DISCLOSURE OF PORTFOLIO HOLDINGS
The Fund's Board of Trustees and the Adviser have adopted policies and procedures regarding disclosure of portfolio holdings (the "Policy"). Pursuant to the Policy, the Adviser may disclose information concerning Fund portfolio holdings only if such disclosure is consistent with the antifraud provisions of the federal securities laws and the Fund's and the Adviser's fiduciary duties to Fund shareholders. In no instance may the Adviser or the Fund receive compensation or any other consideration in connection with the disclosure of information about the portfolio securities of the Fund. Consideration includes any agreement to maintain assets in the Fund or in other investment companies or accounts managed by the Adviser or by any affiliated person of the Adviser. Non-public information concerning portfolio holdings may be divulged to third parties only when the Fund has a legitimate business purpose for doing so and the recipients of the information are subject to a duty of confidentiality. Under no circumstances shall current or prospective Fund shareholders receive non-public portfolio holdings information, except as described below.
The Fund makes available on its public website the following portfolio holdings information:
• complete portfolio holdings information monthly, at least 15 calendar days after the end of each month; and
• top 10 holdings monthly, at least 15 calendar days after the end of each month.
The Fund provides a complete schedule of portfolio holdings for the second and fourth fiscal quarters in its semiannual and annual reports, and for the first and third fiscal quarters in its filings with the SEC on Form N-Q.
39
All other portfolio holdings information that has not been disseminated in a manner making it available to investors generally as described above is non-public information for purposes of the Policy.
The Fund may make selective disclosure of non-public portfolio holdings pursuant to certain exemptions set forth in the Policy. Third parties eligible for exemptions under the Policy and therefore eligible to receive such disclosures currently include fund rating agencies, information exchange subscribers, consultants and analysts, portfolio analytics providers and service providers, provided that the third party expressly agrees to maintain the disclosed information in confidence and not to trade portfolio securities or related derivative securities based on the non-public information. Non-public portfolio holdings information may not be disclosed to a third party pursuant to an exemption unless and until the third party recipient has entered into a non-disclosure agreement with the Fund and the arrangement has been reviewed and approved as set forth in the Policy and discussed below. In addition, persons who owe a duty of trust or confidence to the Fund or the Adviser may receive non-public portfolio holdings information without entering into a non-disclosure agreement. Currently, these persons include (i) the Fund's independent registered public accounting firm (as of the Fund's fiscal year end and on an as needed basis), (ii) counsel to the Fund (on an as needed basis), (iii) counsel to the independent Trustees (on an as needed basis) and (iv) members of the Board of Trustees (on an as needed basis). Subject to the terms and conditions of any agreement between the Adviser or the Fund and the third party recipient, if these conditions for disclosure are satisfied, there shall be no restriction on the frequency with which Fund non-public portfolio holdings information is released, and no lag period shall apply (unless otherwise indicated below).
The Adviser may provide interest lists to broker-dealers who execute securities transactions for the Fund without entering into a non-disclosure agreement with the broker-dealers, provided that the interest list satisfies all of the following criteria: (1) the interest list must contain only the CUSIP numbers and/or ticker symbols of securities held in all registered management investment companies advised by the Adviser or any affiliate of the Adviser (the "MSIM Funds") on an aggregate, rather than a fund-by-fund basis; (2) the interest list must not contain information about the number or value of shares owned by a specified MSIM Fund; (3) the interest list may identify the investment strategy, but not the particular MSIM Funds, to which the list relates; and (4) the interest list may not identify the portfolio manager or team members responsible for managing the MSIM Funds.
Fund shareholders may elect in some circumstances to redeem their shares of the Fund in exchange for their pro rata share of the securities held by the Fund. Under such circumstances, Fund shareholders may receive a complete listing of the holdings of the Fund up to seven calendar days prior to making the redemption request provided that they represent in writing that they agree to not to disclose or trade on the basis of the portfolio holdings information.
The Fund may discuss or otherwise disclose performance attribution analyses (i.e., mention the effects of having a particular security in the portfolio(s)) where such discussion is not contemporaneously made public, provided that the particular holding has been disclosed publicly. Additionally, any discussion of the analyses may not be more current than the date the holding was disclosed publicly.
The Fund may disclose portfolio holdings to transition managers, provided that the Fund has entered into a non-disclosure or confidentiality agreement with the party requesting that the information be provided to the transition manager and the party to the non-disclosure agreement has, in turn, entered into a non-disclosure or confidentiality agreement with the transition manager.
The Adviser, the Fund and/or certain Portfolios currently have entered into ongoing arrangements with the following parties:
| Name | Information Disclosed | Frequency(1) | Lag Time | ||||||||||||
| Service Providers | |||||||||||||||
| RiskMetrics Group (proxy voting agent)(*) | Complete portfolio holdings | Daily basis | (2) | ||||||||||||
| FT Interactive Data Pricing Service Provider(*) | Complete portfolio holdings | As needed | (2) | ||||||||||||
| State Street Bank and Trust Company(*) | Complete portfolio holdings | As needed | (2) | ||||||||||||
40
| Name | Information Disclosed | Frequency(1) | Lag Time | ||||||||||||
| Fund Rating Agencies | |||||||||||||||
| Lipper(*) | Top ten and complete portfolio holdings | Quarterly basis | Approximately 15 days after quarter end and approximately 30 days after quarter end | ||||||||||||
| Morningstar(**) | Top ten and complete portfolio holdings | Quarterly basis | Approximately 15 days after quarter end and approximately 30 days after quarter end | ||||||||||||
| Standard & Poor's(*) | Complete portfolio holdings | Quarterly basis | Approximately 15 day lag | ||||||||||||
| Investment Company Institute(**) | Top ten portfolio holdings | Quarterly basis | Approximately 15 days after quarter end | ||||||||||||
| Consultants and Analysts | |||||||||||||||
| Americh Massena & Associates, Inc.(*) | Top ten and complete portfolio holdings | Quarterly basis(5) | Approximately 10-12 days after quarter end | ||||||||||||
| Bloomberg(**) | Complete portfolio holdings | Quarterly basis | Approximately 30 days after quarter end | ||||||||||||
| Callan Associates(*) | Top ten and complete portfolio holdings | Monthly and quarterly basis, respectively(5) | Approximately 10-12 days after month/quarter end | ||||||||||||
| Cambridge Associates(*) | Top ten and complete portfolio holdings | Quarterly basis(5) | Approximately 10-12 days after quarter end | ||||||||||||
| Citigroup(*) | Complete portfolio holdings | Monthly and quarterly basis, respectively(5) | At least one day after month/quarter end | ||||||||||||
| Credit Suisse First Boston(*) | Top ten and complete portfolio holdings | Monthly and quarterly basis, respectively | Approximately 10-12 days after month/quarter end | ||||||||||||
| CTC Consulting, Inc.(*) | Top ten and complete portfolio holdings | Quarterly basis | Approximately 15 days after quarter end and approximately 30 days after quarter end, respectively | ||||||||||||
| Evaluation Associates(*) | Top ten and complete portfolio holdings | Monthly and quarterly basis, respectively(3) | Approximately 10-12 days after month/quarter end | ||||||||||||
| Fund Evaluation Group(**) | Top ten portfolio holdings(3) | Quarterly basis | At least 15 days after quarter end | ||||||||||||
| Jeffrey Slocum & Associates(*) | Complete portfolio holdings(4) | Quarterly basis(5) | Approximately 10-12 days after quarter end | ||||||||||||
| Hammond Associates(**) | Complete portfolio holdings(4) | Quarterly basis | At least 30 days after quarter end | ||||||||||||
| Hartland & Co.(**) | Complete portfolio holdings(4) | Quarterly basis | At least 30 days after quarter end | ||||||||||||
| Hewitt EnnisKnupp(*) | Top ten and complete portfolio holdings | Monthly and quarterly basis, respectively(5) | Approximately 10-12 days after month/quarter end | ||||||||||||
| Merrill Lynch(*) | Top ten and complete portfolio holdings | Monthly and quarterly basis, respectively(5) | Approximately 10-12 days after month/quarter end | ||||||||||||
| Mobius(**) | Top ten portfolio holdings(3) | Monthly basis | At least 15 days after month end | ||||||||||||
| Nelsons(**) | Top ten portfolio holdings(3) | Quarterly basis | At least 15 days after quarter end | ||||||||||||
| Prime, Buchholz & Associates, Inc.(**) | Complete portfolio holdings(4) | Quarterly basis | At least 30 days after quarter end | ||||||||||||
| PSN(**) | Top ten portfolio holdings(3) | Quarterly basis | At least 15 days after quarter end | ||||||||||||
| PFM Asset Management LLC(*) | Top ten and complete portfolio holdings | Quarterly basis(5) | Approximately 10-12 days after quarter end | ||||||||||||
| Russell Investment Group/Russell/ Mellon Analytical Services, Inc.(**) | Top ten and complete portfolio holdings | Monthly and quarterly basis | At least 15 days after month end and at least 30 days after quarter end, respectively | ||||||||||||
| Stratford Advisory Group, Inc.(*) | Top ten portfolio holdings(6) | Quarterly basis(5) | Approximately 10-12 days after quarter end | ||||||||||||
| Thompson Financial(**) | Complete portfolio holdings(4) | Quarterly basis | At least 30 days after quarter end | ||||||||||||
| Watershed Investment Consultants, Inc.(*) | Top ten and complete portfolio holdings | Quarterly basis(5) | Approximately 10-12 days after quarter end | ||||||||||||
| Yanni Partners(**) | Top ten portfolio holdings(3) | Quarterly basis | At least 15 days after quarter end | ||||||||||||
41
| Name | Information Disclosed | Frequency(1) | Lag Time | ||||||||||||
| Portfolio Analytics Providers | |||||||||||||||
| FactSet Research Systems, Inc.(*) | Complete portfolio holdings | Daily basis | One day | ||||||||||||
(*) This entity has agreed to maintain Fund non-public portfolio holdings information in confidence and not to trade portfolio securities based on the non-public portfolio holdings information.
(**) The Fund does not currently have a non-disclosure agreement in place with this entity and therefore the entity can only receive publicly available information.
(1) Dissemination of portfolio holdings information to entities listed above may occur less frequently than indicated (or not at all).
(2) Information will typically be provided on a real time basis or as soon thereafter as possible.
(3) Complete portfolio holdings will also be provided upon request from time to time on a quarterly basis, with at least a 30 day lag.
(4) Top ten portfolio holdings will also be provided upon request from time to time, with at least a 15 day lag.
(5) This information will also be provided upon request from time to time.
(6) Complete portfolio holdings will also be provided upon request from time to time.
All disclosures of non-public portfolio holdings information made to third parties pursuant to the exemptions set forth in the Policy must be reviewed by Morgan Stanley Investment Management's ("MSIM") Legal and Compliance Division and approved by the Head of the Long-Only Business of MSIM. Disclosures made to third parties in connection with (i) broker-dealer interest lists; (ii) shareholder in-kind distributions; (iii) attribution analyses; or (iv) transition managers are pre-approved for purposes of the Policy. In addition, the following categories of third parties that may receive non-public portfolio holdings information are also pre-approved provided that they enter into non-disclosure agreements (as discussed above) (i) fund rating agencies; (ii) information exchange subscribers; (iii) consultants and analysts (including defined benefit and defined contribution plan sponsors, and variable annuity providers); (iv) portfolio analytics providers; and (v) service providers.
The Adviser shall report quarterly to the Board of Trustees (or a designated committee thereof) at the next regularly scheduled meeting (i) any material information concerning all parties receiving non-public portfolio holdings information pursuant to an exemption; and (ii) any new non-disclosure agreements entered into during the reporting period. Procedures to monitor the use of such non-public portfolio holdings information may include requiring annual certifications that the recipients have utilized such information only pursuant to the terms of the agreement between the recipient and the Adviser and, for those recipients receiving information electronically, acceptance of the information will constitute reaffirmation that the third party expressly agrees to maintain the disclosed information in confidence and not to trade portfolio securities based on the non-public information.
PURCHASE OF SHARES
Each Portfolio reserves the right in its sole discretion (i) to suspend the offering of its shares, (ii) to reject purchase orders and (iii) to reduce or waive the minimum for initial and additional investments. The minimum initial or additional investment in Class I shares, Class P shares or Class L shares may be waived for certain investments, including sales through banks, broker-dealers and other financial institutions (including registered investment advisers and financial planners) purchasing shares on behalf of their clients in (i) discretionary and non-discretionary advisory programs, (ii) fund supermarkets, (iii) asset allocation programs or (iv) other programs in which the client pays an asset-based fee for advice or for executing transactions in Portfolio shares or for otherwise participating in the program. In addition, the minimum initial investments will be waived for: (i) certain retirement plans investing directly with the Fund; (ii) retirement plans investing through certain retirement plan platforms; (iii) certain endowments, foundations and other not for profit entities investing directly with the Fund; (iv) other registered investment companies advised by Morgan Stanley Investment Management or any of its affiliates; (v) Morgan Stanley Investment Management and its affiliates with respect to shares held in connection with certain retirement and deferred compensation programs established for their employees; (vi) the Independent Trustees of the Fund; (vii) clients who owned Portfolio shares as of December 31, 2007; and (viii) investments made in connection with certain reorganizations as approved by the Adviser. If the value of your account falls below the minimum initial investment amount for Class I shares, Class P shares or Class L shares as a result of share redemptions or you no longer meet one of the waiver criteria set forth above, your account may be subject to involuntary conversion or involuntary redemption.
Investors purchasing and redeeming shares of the Portfolios through a financial intermediary may be charged a transaction-based fee or other fee for the financial intermediary's services. Each financial intermediary is
42
responsible for sending you a schedule of fees and information regarding any additional or different conditions regarding purchases and redemptions. Customers of financial intermediaries should read this SAI in light of the terms governing accounts with their organization. The Fund does not pay compensation to or receive compensation from financial intermediaries for the sale of Class I shares.
Class H shares are subject to a sales charge equal to a maximum of 3.50% calculated as a percentage of the offering price. Upon notice to selected broker-dealers, the Distributor may reallow up to the full applicable front-end sales charge during periods specified in such notice.
Neither the Distributor nor the Fund will be responsible for any loss, liability, cost, or expense for acting upon facsimile instructions or upon telephone instructions that they reasonably believe to be genuine. In order to confirm that telephone instructions in connection with redemptions are genuine, the Fund and Distributor will provide written confirmation of transactions initiated by telephone.
Conversion To a New Share Class. If the value of an account falls below the investment minimum for the Class of shares held by the account because of shareholder redemption(s) or the failure to meet one of the waiver criteria set forth above, and if the account value remains below such investment minimum, the shares in such account may, at the Adviser's discretion, convert to another class of shares offered by the Portfolio, if an account meets the minimum investment amount for such class, and will be subject to the shareholder services fee and other features applicable to such shares. Conversion to another class of shares will result in holding a share class with higher fees. The Fund will not convert to another class of shares based solely upon changes in the market that reduce the net asset value of shares. Under current tax law, conversion between share classes is not a taxable event to the shareholder. Shareholders will be notified prior to any such conversion.
Involuntary Redemption of Shares. If the value of an account falls below the investment minimum for (i) Class H shares or Class L shares; (ii) Class P shares (where the applicable Portfolio does not offer Class H shares or Class L shares); or (iii) Class I shares (where the applicable Portfolio does not offer Class H shares, Class L shares or Class P shares), because of shareholder redemption(s) or you no longer meet one of the waiver criteria set forth above, and if the account value remains below such investment minimum, the shares in such account may be subject to redemption by the Fund. The Fund will not redeem shares based solely upon changes in the market that reduce the net asset value of shares. If shares are redeemed, redemption proceeds will be promptly paid to the shareholder. Shareholders will be notified prior to any such redemption.
On March 31, 2011, the Fund suspended offering shares of the Mid Cap Growth Portfolio to new investors, except as follows. The Fund will continue to offer shares of the Mid Cap Growth Portfolio (1) through certain retirement plan accounts, (2) to clients of certain registered investment advisers who currently offer shares of the Mid Cap Growth Portfolio in their asset allocation programs, (3) to directors and trustees of the Morgan Stanley Funds, (4) to Morgan Stanley affiliates and their employees and (5) to benefit plans sponsored by Morgan Stanley and its affiliates. The Fund will continue to offer shares of the Mid Cap Growth Portfolio to existing shareholders and, as market conditions permit, may recommence offering shares of the Mid Cap Growth Portfolio to other new investors in the future. Any such offerings of the Mid Cap Growth Portfolio's shares may be limited in amount and may commence and terminate without any prior notice.
REDEMPTION OF SHARES
Each Portfolio may suspend redemption privileges or postpone the date of payment (i) during any period that the New York Stock Exchange ("NYSE") is closed, or trading on the NYSE is restricted as determined by the SEC, (ii) during any period when an emergency exists as defined by the rules of the SEC as a result of which it is not reasonably practicable for a Portfolio to dispose of securities owned by it, or fairly to determine the value of its assets, and (iii) for such other periods as the SEC may permit. The Fund has made an election with the SEC pursuant to Rule 18f-1 under the 1940 Act to pay in cash all redemptions requested by any shareholder of record limited in amount during any 90-day period to the lesser of $250,000 or 1% of the net assets of the Portfolio at the beginning of such period. Such commitment is irrevocable without the prior approval of the SEC. Redemptions in excess of the above limits may be paid in whole or in part in investment securities or in cash, as the Trustees may deem advisable; however, payment will be made wholly in cash unless the Trustees believe that economic or market conditions exist
43
which would make such a practice detrimental to the best interests of the Fund. If redemptions are paid in investment securities, such securities will be valued as set forth in the Fund's prospectuses under "Valuation of Shares" and a redeeming shareholder would normally incur brokerage expenses in converting these securities to cash.
Redemption proceeds may be more or less than the shareholder's cost depending on the market value of the securities held by the Portfolio. See each prospectus for additional information about redeeming shares of a Portfolio.
TRANSACTIONS WITH BROKER/DEALERS
The Fund has authorized certain brokers to accept on its behalf purchase and redemption orders. Some of these brokers are authorized to designate other intermediaries to accept purchase and redemption orders on the Fund's behalf. For purposes of determining the purchase price of shares, the Fund will be deemed to have received a purchase or redemption order when an authorized broker, or if applicable, a broker's authorized designee, accepts the order. In other words, orders will be priced at the net asset value next computed after such orders are accepted by an authorized broker or the broker's authorized designee.
SHAREHOLDER SERVICES
Transfer of Shares
Shareholders may transfer shares of the Fund's Portfolios to another person by written request to Shareholder Services at Morgan Stanley Institutional Fund Trust, c/o Morgan Stanley Services Company Inc., P.O. Box 219804, Kansas City, MO 64121-9804. If shares are being transferred to a new account, requests for transfer must be accompanied by a completed Account Registration Form for the receiving party. If shares are being transferred to an existing account, the request should clearly identify the account and number of shares to be transferred and include the signature of all registered owners and all share certificates, if any, which are subject to the transfer. The signature on the letter of request, the share certificate or any stock power must be guaranteed in the same manner as described under "Redemption of Shares." As in the case of redemptions, the written request must be received in good order before any transfer can be made.
VALUATION OF SHARES
Net asset value per share ("NAV") is determined by dividing the total market value of each Portfolio's investments and other assets, less any liabilities, by the total outstanding shares of that Portfolio. The NAV for each class of shares offered by the Fund may differ due to class-specific expenses paid by each class, including the shareholder servicing fees charged to Investment Class shares, Class P shares, Class H shares and Class L shares.
In the calculation of a Portfolio's NAV: (1) an equity portfolio security listed or traded on the NYSE, or other exchange is valued at its latest sale price, prior to the time when assets are valued; if there were no sales that day, the security is valued at the mean between the last reported bid and asked price; (2) an equity portfolio security listed or traded on the Nasdaq is valued at the Nasdaq Official Closing Price; if there were no sales that day, the security is valued at the mean between the last reported bid and asked price; and (3) all other portfolio securities for which over-the-counter market quotations are readily available are valued at the mean between the last reported bid and asked price. In cases where a security is traded on more than one exchange, the security is valued on the exchange designated as the primary market. For equity securities traded on foreign exchanges, the last reported sale price or the latest bid price may be used if there were no sales on a particular day. When market quotations are not readily available, including circumstances under which it is determined by the Adviser that the sale price, the bid price or the mean between the last reported bid and asked price are not reflective of a security's market value, portfolio securities are valued at their fair value as determined in good faith under procedures established by and under the general supervision of the Board. For valuation purposes, quotations of foreign portfolio securities, other assets and liabilities and forward contracts stated in foreign currency are translated into U.S. dollar equivalents at the prevailing market rates prior to the close of the NYSE.
44
Short-term debt securities with remaining maturities of 60 days or less at the time of purchase are valued at amortized cost, unless the Board determines such valuation does not reflect the securities' market value, in which case these securities will be valued at their fair value as determined by the Board.
Certain of a Portfolio's securities may be valued by an outside pricing service approved by the Board. The pricing service may utilize a matrix system incorporating security quality, maturity and coupon as the evaluation model parameters, and/or research evaluations by its staff, including review of broker-dealer market price quotations in determining what it believes is the fair valuation of the portfolio securities valued by such pricing service.
Listed options on debt securities are valued at the latest sale price on the exchange on which they are listed unless no sales of such options have taken place that day, in which case they will be valued at the mean between their latest bid and asked prices. Unlisted options on debt securities and all options on equity securities are valued at the mean between their latest bid and asked prices. Futures are valued at the latest price published by the commodities exchange on which they trade unless it is determined that such price does not reflect their market value, in which case they will be valued at their fair value as determined in good faith under procedures established by and under the supervision of the Trustees.
Generally, trading in foreign securities, as well as corporate bonds, U.S. Government securities and money market instruments, is substantially completed each day at various times prior to the close of the NYSE. The values of such securities used in computing the net asset value of the Portfolio's shares are determined as of such times. Foreign currency exchange rates are also generally determined prior to the close of the NYSE. Occasionally, events which may affect the values of such securities and such exchange rates may occur between the times at which they are determined and the close of the NYSE and will therefore not be reflected in the computation of a Portfolio's net asset value. If events that may affect the value of such securities occur during such period, then these securities may be valued at their fair value as determined in good faith under procedures established by and under the supervision of the Trustees.
MANAGEMENT OF THE FUND
The Board supervises the Fund's affairs under the laws governing business trusts in the Commonwealth of Pennsylvania. The Board has approved contracts under which certain companies provide essential management, administrative and shareholder services to the Fund.
Trustees and Officers. The Board of the Fund consists of 10 Trustees. These same individuals also serve as directors or trustees for certain of the funds advised by the Adviser and Morgan Stanley AIP GP LP. Nine Trustees have no affiliation or business connection with the Adviser or any of its affiliated persons and do not own any stock or other securities issued by the Adviser's parent company, Morgan Stanley. These are the "non-interested" or "Independent" Trustees. The other Trustee (the "Interested Trustee") is affiliated with the Adviser.
Board Structure and Oversight Function
The Board's leadership structure features an Independent Trustee serving as Chairperson and the Board Committees described below. The Chairperson participates in the preparation of the agenda for meetings of the Board and the preparation of information to be presented to the Board with respect to matters to be acted upon by the Board. The Chairperson also presides at all meetings of the Board and is involved in discussions regarding matters pertaining to the oversight of the management of the Fund between meetings.
The Board of Trustees operates using a system of committees to facilitate the timely and efficient consideration of all matters of importance to the Trustees, the Fund and Fund stockholders, and to facilitate compliance with legal and regulatory requirements and oversight of the Fund's activities and associated risks. The Board of Trustees has established four standing committees: (1) Audit Committee, (2) Governance Committee, (3) Compliance and Insurance Committee and (4) Investment Committee. The Audit Committee and the Governance Committee are comprised exclusively of Independent Trustees. Each committee charter governs the scope of the committee's responsibilities with respect to the oversight of the Fund. The responsibilities of each
45
committee, including their oversight responsibilities, are described further under the caption "Independent Trustees and the Committees."
The Fund is subject to a number of risks, including investment, compliance, operational and valuation risk, among others. The Board of Trustees oversees these risks as part of its broader oversight of the Fund's affairs through various Board and committee activities. The Board has adopted, and periodically reviews, policies and procedures designed to address various risks to the Fund. In addition, appropriate personnel, including but not limited to the Fund's Chief Compliance Officer, members of the Fund's administration and accounting teams, representatives from the Fund's independent registered public accounting firm, the Fund's Treasurer, portfolio management personnel and independent valuation and brokerage evaluation service providers, make regular reports regarding the Fund's activities and related risks to the Board of Trustees and the committees, as appropriate. These reports include, among others, quarterly performance reports, quarterly derivatives activity and risk reports and discussions with members of the risk teams relating to each asset class. The Board's committee structure allows separate committees to focus on different aspects of risk and potential impact on some or all of the funds in the complex and then report back to the full Board. In between regular meetings, Fund officers also communicate with the Directors/Trustees regarding material exceptions and items relevant to the Board's risk oversight function. The Board recognizes that it is not possible to identify all of the risks that may affect the Fund, and that it is not possible to develop processes and controls to eliminate all of the risks that may affect the Fund. Moreover, the Board recognizes that it may be necessary for the Fund to bear certain risks (such as investment risk) to achieve its investment objective.
As needed between meetings of the Board, the Board or a specific committee receives and reviews reports relating to the Fund and engages in discussions with appropriate parties relating to the Fund's operations and related risks.
Independent Trustees. The Fund seeks as Trustee individuals of distinction and experience in business and finance, government service or academia. In determining that a particular Trustee was and continues to be qualified to serve as Trustee, the Board has considered a variety of criteria, none of which, in isolation, was controlling. Based on a review of the experience, qualifications, attributes or skills of each Trustee, including those enumerated in the table below, the Board has determined that each of the Trustee is qualified to serve as a Trustee of the Fund. In addition, the Board believes that, collectively, the Trustees have balanced and diverse experience, qualifications, attributes and skills that allow the Board to operate effectively in governing the Fund and protecting the interests of shareholders. Information about the Fund's Governance Committee and Board of Trustee nomination process is provided below under the caption "Independent Trustee and the Committees."
46
The Independent Trustees of the Fund, their age, address, term of office and length of time served, their principal business occupations during the past five years, the number of portfolios in the Fund Complex (defined below) overseen by each Independent Trustee (as of December 31, 2011) and other directorships, if any, held by the Trustees, are shown below. The Fund Complex includes all open-end and closed-end funds (including all of their portfolios) advised by the Adviser and any funds that have an adviser that is an affiliate of the Adviser (including, but not limited to, Morgan Stanley AIP GP LP) (the "Morgan Stanley Funds").
Independent Trustees:
| Name, Age and Address of Independent Trustee | Position(s) Held with Registrant | Length of Time Served* | Principal Occupation(s) During Past 5 Years | Number of Portfolios in Fund Complex Overseen by Independent Trustee | Other Directorships Held by Independent Trustee** | ||||||||||||||||||
| Frank L. Bowman (66) c/o Kramer Levin Naftalis & Frankel LLP Counsel to the Independent Trustees 1177 Avenue of the Americas New York, NY 10036 | Trustee | Since August 2006 | President, Strategic Decisions, LLC (consulting) (since February 2009); Director or Trustee of various Morgan Stanley Funds (since August 2006); Chairperson of the Insurance Sub-Committee of the Compliance and Insurance Committee (since February 2007); served as President and Chief Executive Officer of the Nuclear Energy Institute (policy organization) (February 2005 through November 2008); retired as Admiral, U.S. Navy after serving over 38 years on active duty including 8 years as Director of the Naval Nuclear Propulsion Program in the Department of the Navy and the U.S. Department of Energy (1996-2004); served as Chief of Naval Personnel (July 1994-September 1996); and on the Joint Staff as Director of Political-Military Affairs (June 1992-July 1994); Knighted as Honorary Knight Commander of the Most Excellent Order of the British Empire; Awarded the Officer de l'Orde National du Mérite by the French Government; elected to the National Academy of Engineering (2009). | 102 | Director of BP p.l.c.; Director of Naval and Nuclear Technologies LLP; Director of the Armed Services YMCA of the USA and the Naval Submarine League. Director of the American Shipbuilding Suppliers Association; Member of the National Security Advisory Council of the Center for U.S. Global Engagement and a member of the CNA Military Advisory Board; Member of the American Lung Association's President's Council. | ||||||||||||||||||
* Each Trustee serves an indefinite term, until his or her successor is elected.
** This includes any directorships at public companies and registered investment companies held by the Trustee at any time during the past five years.
47
| Name, Age and Address of Independent Trustee | Position(s) Held with Registrant | Length of Time Served* | Principal Occupation(s) During Past 5 Years | Number of Portfolios in Fund Complex Overseen by Independent Trustee | Other Directorships Held by Independent Trustee** | ||||||||||||||||||
| Michael Bozic (70) c/o Kramer Levin Naftalis & Frankel LLP Counsel to the Independent Trustees 1177 Avenue of the Americas New York, NY 10036 | Trustee | Since April 1994 | Private investor; Chairperson of the Compliance and Insurance Committee (since October 2006); Director or Trustee of various Morgan Stanley Funds (since April 1994); formerly, Chairperson of the Insurance Committee (July 2006-September 2006), Vice Chairman of Kmart Corporation (December 1998-October 2000), Chairman and Chief Executive Officer of Levitz Furniture Corporation (November 1995-November 1998) and President and Chief Executive Officer of Hills Department Stores (May 1991-July 1995); variously Chairman, Chief Executive Officer, President and Chief Operating Officer (1987-1991) of the Sears Merchandise Group of Sears, Roebuck & Co. | 104 | Director of various business organizations. | ||||||||||||||||||
| Kathleen A. Dennis (58) c/o Kramer Levin Naftalis & Frankel LLP Counsel to the Independent Trustees 1177 Avenue of the Americas New York, NY 10036 | Trustee | Since August 2006 | President, Cedarwood Associates (mutual fund and investment management consulting) (since July 2006); Chairperson of the Money Market and Alternatives Sub-Committee of the Investment Committee (since October 2006) and Director or Trustee of various Morgan Stanley Funds (since August 2006); formerly, Senior Managing Director of Victory Capital Management (1993-2006). | 102 | Director of various non-profit organizations. | ||||||||||||||||||
* Each Trustee serves an indefinite term, until his or her successor is elected.
** This includes any directorships at public companies and registered investment companies held by the Trustee at any time during the past five years.
48
| Name, Age and Address of Independent Trustee | Position(s) Held with Registrant | Length of Time Served* | Principal Occupation(s) During Past 5 Years | Number of Portfolios in Fund Complex Overseen by Independent Trustee | Other Directorships Held by Independent Trustee** | ||||||||||||||||||
| Dr. Manuel H. Johnson (62) c/o Johnson Smick Group, Inc. 888 16th Street, N.W. Suite 740 Washington, D.C. 20006 | Trustee | Since July 1991 | Senior Partner, Johnson Smick International, Inc. (consulting firm); Chairperson of the Investment Committee (since October 2006) and Director or Trustee of various Morgan Stanley Funds (since July 1991); Co-Chairman and a founder of the Group of Seven Council (G7C) (international economic commission); formerly, Chairperson of the Audit Committee (July 1991-September 2006); Vice Chairman of the Board of Governors of the Federal Reserve System and Assistant Secretary of the U.S. Treasury. | 104 | Director of NVR, Inc. (home construction). | ||||||||||||||||||
| Joseph J. Kearns (69) c/o Kearns & Associates LLC PMB754 22631 Pacific Coast Highway Malibu, CA 90265 | Trustee | Since August 1994 | President, Kearns & Associates LLC (investment consulting); Chairperson of the Audit Committee (since October 2006) and Director or Trustee of various Morgan Stanley Funds (since August 1994); formerly, Deputy Chairperson of the Audit Committee (July 2003-September 2006) and Chairperson of the Audit Committee of various Morgan Stanley Funds (since August 1994); CFO of the J. Paul Getty Trust. | 105 | Director of Electro Rent Corporation (equipment leasing) and The Ford Family Foundation. | ||||||||||||||||||
* Each Trustee serves an indefinite term, until his or her successor is elected.
** This includes any directorships at public companies and registered investment companies held by the Trustee at any time during the past five years.
49
| Name, Age and Address of Independent Trustee | Position(s) Held with Registrant | Length of Time Served* | Principal Occupation(s) During Past 5 Years | Number of Portfolios in Fund Complex Overseen by Independent Trustee | Other Directorships Held by Independent Trustee** | ||||||||||||||||||
| Michael F. Klein (53) c/o Kramer Levin Naftalis & Frankel LLP Counsel to the Independent Trustees 1177 Avenue of the Americas New York, NY 10036 | Trustee | Since August 2006 | Managing Director, Aetos Capital, LLC (since March 2000) and Co-President, Aetos Alternatives Management, LLC (since January 2004); Chairperson of the Fixed-Income Sub-Committee of the Investment Committee (since October 2006) and Director or Trustee of various Morgan Stanley Funds (since August 2006); formerly, Managing Director, Morgan Stanley & Co. Inc. and Morgan Stanley Dean Witter Investment Management, President, various Morgan Stanley Funds (June 1998-March 2000) and Principal, Morgan Stanley & Co. Inc. and Morgan Stanley Dean Witter Investment Management (August 1997-December 1999). | 102 | Director of certain investment funds managed or sponsored by Aetos Capital, LLC. Director of Sanitized AG and Sanitized Marketing AG (specialty chemicals). | ||||||||||||||||||
| Michael E. Nugent (75) c/o Triumph Capital, L.P. 445 Park Avenue New York, NY 10022 | Chairperson of the Board and Trustee | Chairpersonof the Boards since July 2006 and Trustee since July 1991 | General Partner, Triumph Capital, L.P. (private investment partnership); Chairperson of the Boards of various Morgan Stanley Funds (since July 2006); Director or Trustee of various Morgan Stanley Funds (since July 1991); formerly, Chairperson of the Insurance Committee (until July 2006). | 104 | None. | ||||||||||||||||||
| W. Allen Reed (64) c/o Kramer Levin Naftalis & Frankel LLP Counsel to the Independent Trustees 1177 Avenue of the Americas New York, NY 10036 | Trustee | Since August 2006 | Chairperson of the Equity Sub-Committee of the Investment Committee (since October 2006) and Director or Trustee of various Morgan Stanley Funds (since August 2006); formerly, President and CEO of General Motors Asset Management; Chairman and Chief Executive Officer of the GM Trust Bank and Corporate Vice President of General Motors Corporation (August 1994-December 2005). | 102 | Director of Temple-Inland Industries (packaging and forest products), Director of Legg Mason, Inc. and Director of the Auburn University Foundation; formerly, Director of iShares, Inc. (2001-2006). | ||||||||||||||||||
* Each Trustee serves an indefinite term, until his or her successor is elected.
** This includes any directorships at public companies and registered investment companies held by the Trustee at any time during the past five years.
50
| Name, Age and Address of Independent Trustee | Position(s) Held with Registrant | Length of Time Served* | Principal Occupation(s) During Past 5 Years | Number of Portfolios in Fund Complex Overseen by Independent Trustee | Other Directorships Held by Independent Trustee** | ||||||||||||||||||
| Fergus Reid (79) c/o Joe Pietryka, Inc. 85 Charles Colman Blvd. Pawling, NY 12564 | Trustee | Since June 1992 | Chairman, Joe Pietryka, Inc.; Chairperson of the Governance Committee and Director or Trustee of various Morgan Stanley Funds (since June 1992). | 105 | Trustee and Director of certain investment companies in the JPMorgan Funds complex managed by JPMorgan Investment Management Inc. | ||||||||||||||||||
The Trustee who is affiliated with the Adviser or affiliates of the Adviser (as set forth below) and executive officers of the Fund, their age, address, term of office and length of time served, their principal business occupations during the past five years, the number of portfolios in the Fund Complex overseen by the Interested Trustee (as of December 31, 2011) and the other directorships, if any, held by the Interested Trustee, are shown below.
Interested Trustee:
| Name, Age and Address of Interested Trustee | Position(s) Held with Registrant | Length of Time Served* | Principal Occupation(s) During Past 5 Years | Number of Portfolios in Fund Complex Overseen by Interested Trustee | Other Directorships Held by Interested Trustee** | ||||||||||||||||||
| James F. Higgins (63) c/o Morgan Stanley Services Company Inc. Harborside Financial Center 201 Plaza Two Jersey City, NJ 07311 | Trustee | Since June 2000 | Director or Trustee of various Morgan Stanley Funds (since June 2000); Senior Advisor of Morgan Stanley (since August 2000). | 103 | Director of AXA Financial, Inc. and The Equitable Life Assurance Society of the United States (financial services). | ||||||||||||||||||
* Each Trustee serves an indefinite term, until his or her successor is elected.
** This includes any directorships at public companies and registered investment companies held by the Trustee at any time during the past five years.
Executive Officers:
| Name, Age and Address of Executive Trustee | Position(s) Held with Registrant | Length of Time Served*** | Principal Occupation(s) During Past 5 Years | ||||||||||||
| Arthur Lev (50) 522 Fifth Avenue New York, NY 10036 | President and Principal Executive Officer—Equity and Fixed Income Funds | Since June 2011 | President and Principal Executive Officer (since June 2011) of the Equity and Fixed Income Funds in the Fund Complex; Head of the Long Only Business of Morgan Stanley Investment Management (since February 2011); Managing Director of the Adviser and various entities affiliated with the Adviser (since December 2006). Formerly, Chief Strategy Officer of Morgan Stanley Investment Management Traditional Asset Management business (November 2010-February 2011); General Counsel of Morgan Stanley Investment Management (December 2006-October 2010); Partner and General Counsel of FrontPoint Partners LLC (July 2002 to December 2006); Managing Director and General Counsel of Morgan Stanley Investment Management (May 2000 to June 2002). | ||||||||||||
*** Each Officer serves an indefinite term, until his or her successor is elected.
51
| Name, Age and Address of Executive Trustee | Position(s) Held with Registrant | Length of Time Served*** | Principal Occupation(s) During Past 5 Years | ||||||||||||
| Mary Ann Picciotto (38) c/o Morgan Stanley Services Company Inc. Harborside Financial Center 201 Plaza Two Jersey City, NJ 07311 | Chief Compliance Officer | Since May 2010 | Managing Director of the Adviser and various entities affiliated with the Adviser; Chief Compliance Officer of the various Morgan Stanley Funds (since May 2010); Chief Compliance Officer of the Adviser (since April 2007). | ||||||||||||
| Stefanie V. Chang Yu (45) 522 Fifth Avenue New York, NY 10036 | Vice President | Since December 1997 | Managing Director of the Adviser and various entities affiliated with the Adviser; Vice President of various Morgan Stanley Funds (since December 1997). Formerly, Secretary of the Adviser and various entities affiliated with the Adviser. | ||||||||||||
| Francis J. Smith (46) c/o Morgan Stanley Services Company Inc. Harborside Financial Center 201 Plaza Two Jersey City, NJ 07311 | Treasurer and Principal Financial Officer | Treasurer since July 2003 and Principal Financial Officer since September 2002 | Executive Director of the Adviser and various entities affiliated with the Adviser; Treasurer and Principal Financial Officer of various Morgan Stanley Funds (since July 2003). | ||||||||||||
| Mary E. Mullin (44) 522 Fifth Avenue New York, NY 10036 | Secretary | Since June 1999 | Executive Director of the Adviser and various entities affiliated with the Adviser; Secretary of various Morgan Stanley Funds (since June 1999). | ||||||||||||
*** Each Officer serves an indefinite term, until his or her successor is elected.
In addition, the following individuals who are officers of the Investment Adviser or who are officers its affiliates serve as assistant secretaries of the Fund: Joanne Antico, Joseph C. Benedetti, Daniel E. Burton, Tara A. Farrelly and Edward J. Meehan.
For each Trustee, the dollar range of equity securities beneficially owned by the Trustee in the Fund and in the Family of Investment Companies (Family of Investment Companies includes all of the registered investment companies advised by the Adviser and Morgan Stanley AIP GP LP) for the calendar year ended December 31, 2011 is set forth in the table below.
| Name of Trustee | Dollar Range of Equity Securities in the Fund (as of December 31, 2011) | Aggregate Dollar Range of Equity Securities in All Registered Investment Companies Overseen by Trustee in Family of Investment Companies (as of December 31, 2011) | |||||||||
| Independent: | |||||||||||
| Frank L. Bowman(1) | * | over $100,000 | |||||||||
| Michael Bozic | None | over $100,000 | |||||||||
| Kathleen A. Dennis | None | over $100,000 | |||||||||
| Manuel H. Johnson | None | over $100,000 | |||||||||
| Joseph J. Kearns(1) | * | over $100,000 | |||||||||
| Michael F. Klein | * | over $100,000 | |||||||||
| Michael E. Nugent | None | over $100,000 | |||||||||
| W. Allen Reed(1) | * | over $100,000 | |||||||||
| Fergus Reid(1) | None | over $100,000 | |||||||||
| Interested: | |||||||||||
| James F. Higgins | None | over $100,000 | |||||||||
* Joseph J. Kearns—Balanced Portfolio ($10,001-$50,000); Corporate Bond Portfolio ($50,001-$100,000). Michael F. Klein—Mid Cap Growth Portfolio ($10,001-$50,000). Frank L. Bowman—Mid Cap Growth Portfolio ($10,001-$50,000). W. Allen Reed—Mid Cap Growth Portfolio ($10,001-$50,000).
(1) Includes the total amount of compensation deferred by the Trustee at his election pursuant to a deferred compensation plan. Such deferred compensation is placed in a deferral account and deemed to be invested in one or more of the Morgan Stanley Funds (or portfolio thereof) that are offered as investment options under the plan.
52
As to each Independent Trustee and his or her immediate family members, no person owned beneficially or of record securities in an investment adviser or principal underwriter of the Fund, or a person (other than a registered investment company) directly or indirectly controlling, controlled by or under common control with an investment adviser or principal underwriter of the Fund.
As of December 31, 2011, the Trustees and Officers of the Fund, as a group, owned less than 1% of the outstanding common stock of each Portfolio of the Fund.
Independent Trustees and the Committees. Law and regulation establish both general guidelines and specific duties for the Independent Trustees. The Board has four committees: (1) Audit Committee, (2) Governance Committee, (3) Compliance and Insurance Committee and (4) Investment Committee. Three of the Independent Trustees serve as members of the Audit Committee, three Independent Trustees serve as members of the Governance Committee, four Trustees, including three Independent Trustees, serve as members of the Compliance and Insurance Committee and all of the Trustees serve as members of the Investment Committee.
The Independent Trustees are charged with recommending to the full Board approval of management, advisory and administration contracts, shareholder service plans and distribution and underwriting agreements; continually reviewing fund performance, checking on the pricing of portfolio securities, brokerage commissions, transfer agent costs and performance and trading among funds in the same complex; and approving fidelity bond and related insurance coverage and allocations, as well as other matters that arise from time to time. The Independent Trustees are required to select and nominate individuals to fill any Independent Trustee vacancy on the board of any fund that has a Rule 12b-1 plan of distribution.
The Board of Trustees has a separately-designated standing Audit Committee established in accordance with Section 3(a)(58)(A) of the Securities Exchange Act of 1934, as amended. The Audit Committee is charged with recommending to the full Board the engagement or discharge of the Fund's independent registered public accounting firm; directing investigations into matters within the scope of the independent registered public accounting firm's duties, including the power to retain outside specialists; reviewing with the independent registered public accounting firm the audit plan and results of the auditing engagement; approving professional services provided by the independent registered public accounting firm and other accounting firms prior to the performance of the services; reviewing the independence of the independent registered public accounting firm; considering the range of audit and non-audit fees; reviewing the adequacy of the Fund's system of internal controls; and reviewing the valuation process. The Fund has adopted a formal, written Audit Committee Charter.
The members of the Audit Committee of the Fund are Joseph J. Kearns, Michael E. Nugent and W. Allen Reed. None of the members of the Fund's Audit Committee is an "interested person," as defined under the Investment Company Act, of the Fund (with such disinterested Trustees being "Independent Trustees" or individually, "Independent Trustee"). Each Independent Trustee is also "independent" from the Fund under the listing standards of the NYSE. The Chairperson of the Audit Committee of the Fund is Joseph J. Kearns.
The Board of Trustees of the Fund also has a Governance Committee. The Governance Committee identifies individuals qualified to serve as Independent Trustees on the Fund's Board and on committees of the Board and recommends such qualified individuals for nomination by the Fund's Independent Trustees as candidates for election as Independent Trustees, advises the Fund's Board with respect to Board composition, procedures and committees, develops and recommends to the Fund's Board a set of corporate governance principles applicable to the Fund, monitors and makes recommendations on corporate governance matters and policies and procedures of the Fund's Board of Trustees and any Board committees and oversees periodic evaluations of the Fund's Board and its committees. The members of the Governance Committee of the Fund are Kathleen A. Dennis, Michael F. Klein and Fergus Reid, each of whom is an Independent Trustee. The Chairperson of the Governance Committee is Fergus Reid.
The Fund does not have a separate nominating committee. While the Fund's Governance Committee recommends qualified candidates for nominations as Independent Trustees, the Board of Trustees of the Fund believes that the task of nominating prospective Independent Trustees is important enough to require the participation of all current Independent Trustees, rather than a separate committee consisting of only certain
53
Independent Trustees. Accordingly, each Independent Trustee (Frank L. Bowman, Michael Bozic, Kathleen A. Dennis, Manuel H. Johnson, Joseph J. Kearns, Michael F. Klein, Michael E. Nugent, W. Allen Reed and Fergus Reid) participates in the election and nomination of candidates for election as Independent Trustees for the Fund. Persons recommended by the Fund's Governance Committee as candidates for nomination as Independent Trustees shall possess such experience, qualifications, attributes, skills and diversity so as to enhance the Board's ability to manage and direct the affairs and business of the Fund, including, when applicable, to enhance the ability of committees of the Board to fulfill their duties and/or to satisfy any independence requirements imposed by law, regulation or any listing requirements of the NYSE. While the Independent Trustees of the Fund expect to be able to continue to identify from their own resources an ample number of qualified candidates for the Fund's Board as they deem appropriate, they will consider nominations from shareholders to the Board. Nominations from shareholders should be in writing and sent to the Independent Trustees as described below under the caption "Shareholder Communications."
The Board formed the Compliance and Insurance Committee to address insurance coverage and oversee the compliance function for the Fund and the Board. The Compliance and Insurance Committee consists of Frank L. Bowman, Michael Bozic, James F. Higgins and Manuel H. Johnson. Frank L. Bowman, Michael Bozic and Manuel H. Johnson are Independent Trustees. The Chairperson of the Compliance and Insurance Committee is Michael Bozic. The Compliance and Insurance Committee has an Insurance Sub-Committee to review and monitor the insurance coverage maintained by the Fund. The Chairperson of the Insurance Sub-Committee is Frank L. Bowman.
The Investment Committee oversees the portfolio investment process for and reviews the performance of the Fund. The Investment Committee also recommends to the Board to approve or renew the Fund's Investment Advisory and Administration Agreements. The members of the Investment Committee are Frank L. Bowman, Michael Bozic, Kathleen A. Dennis, James F. Higgins, Manuel H. Johnson, Joseph J. Kearns, Michael F. Klein, Michael E. Nugent, W. Allen Reed and Fergus Reid. The Chairperson of the Investment Committee is Manuel H. Johnson.
The Investment Committee has three Sub-Committees, each with its own Chairperson. Each Sub-Committee focuses on the funds' primary areas of investment, namely equities, fixed income and alternatives. The Sub-Committees and their members are as follows:
(1) Equity—W. Allen Reed (Chairperson), Frank L. Bowman and Michael E. Nugent.
(2) Fixed Income—Michael F. Klein (Chairperson), Michael Bozic and Fergus Reid.
(3) Money Market and Alternatives—Kathleen A. Dennis (Chairperson), James F. Higgins and Joseph J. Kearns.
During the Fund's fiscal year ended September 30, 2011, the Board of Trustees held the following meetings:
| Board of Trustees | 7 | ||||||
| Committee/Sub-Committee: | Number of Meetings | ||||||
| Audit Committee | 4 | ||||||
| Governance Committee | 4 | ||||||
| Compliance and Insurance Committee | 4 | ||||||
| Insurance Sub-Committee | 1 | ||||||
| Investment Committee | 5 | ||||||
| Equity Sub-Committee | 5 | ||||||
| Fixed Income Sub-Committee | 5 | ||||||
| Money Market and Alternatives Sub-Committee | 7 | ||||||
54
Experience, Qualifications and Attributes
The Board has concluded, based on each Trustee's experience, qualifications and attributes that each Board member should serve as a Trustee. Following is a brief summary of the information that led to and/or supports this conclusion.
Mr. Bowman has experience in a variety of business and financial matters through his prior service as a Director or Trustee for various other funds in the Fund Complex, where he serves as Chairperson of the Insurance Sub-Committee of the Compliance and Insurance Committee, and as a Director of BP p.l.c. and Naval and Nuclear Technologies LLP. Mr. Bowman also serves as a Director for the Armed Services YMCA of the USA and the Naval Submarine League. Mr. Bowman retired as an Admiral in the U.S. Navy, after serving over 38 years on active duty including 8 years as Director of the Naval Nuclear Propulsion Program in the Department of the Navy and the Department of Energy (1996-2004). Additionally, Mr. Bowman served as the U.S. Navy's Chief of Naval Personnel where he was responsible for the planning and programming of all manpower, personnel, training and education resources for the U.S. Navy. In addition, Mr. Bowman served as President and Chief Executive Officer of the Nuclear Energy Institute. Mr. Bowman has received such distinctions as a knighthood as Honorary Knight Commander of the Most Excellent Order of the British Empire and the Officer de l'Orde National du Mérite from the French Government, and was elected to the National Academy of Engineering (2009). He is President of the consulting firm Strategic Decisions, LLC.
With over 20 years of experience on the boards and in senior management of such companies as Kmart Corporation, Levitz Furniture Corporation, Hills Department Stores and Sears Merchandise Group of Sears, Roebuck & Co., where he also served as Chief Financial Officer of the Merchandise Group, and with over 15 years of experience as a Director or Trustee of the certain other funds in the Fund Complex, Mr. Bozic has experience with a variety of financial, management, regulatory and operational issues as well as experience with marketing and distribution. Mr. Bozic has served as the Chairperson of the Compliance and Insurance Committee since 2006.
Ms. Dennis has over 25 years of business experience in the financial services industry and related fields including serving as a Trustee or Trustee of various other funds in the Fund Complex, where she serves as Chairperson of the Money Market and Alternatives Sub-Committee of the Investment Committee Ms. Dennis possesses a strong understanding of the regulatory framework under which investment companies must operate based on her years of service to this Board and her position as Senior Managing Trustee of Victory Capital Management.
In addition to his tenure as a Trustee or Trustee of various other funds in the Fund Complex, where he formerly served as Chairperson of the Audit Committee, Dr. Johnson has also served as an officer or a board member of numerous companies for nearly 20 years. These positions included Co-Chairman and a founder of the Group of Seven Council, Trustee of NVR, Inc., Trustee of Evergreen Energy and Trustee of Greenwich Capital Holdings. He also has served as Vice Chairman of the Board of Governors of the Federal Reserve System and Assistant Secretary of the U.S. Treasury. In addition, Dr. Johnson also served as Chairman of the Financial Accounting Foundation, which oversees the Financial Accounting Standards Board, for seven years.
Mr. Kearns gained extensive experience regarding accounting through his experience on the Audit Committees of the boards of other funds in the Funds Complex, including serving as either Chairperson or Deputy Chairperson of the Audit Committee for fourteen years, and through his position as Chief Financial Officer of the J. Paul Getty Trust. He also has experience in financial, accounting, investment and regulatory matters through his position as President and founder of Kearns & Associates LLC, a financial consulting company. Mr. Kearns also serves as a Trustee of Electro Rent Corporation and The Ford Family Foundation. The Board has determined that Mr. Kearns is an "audit committee financial expert" as defined by the SEC.
Through his prior positions as Managing Trustee of Morgan Stanley & Co. Inc. and Morgan Stanley Dean Witter Investment Management and as President of Morgan Stanley Institutional Funds, Mr. Klein has experience in the management and operation of registered investment companies, enabling him to provide management input and investment guidance to the Board. Mr. Klein also has extensive experience in the investment management industry based on his current positions as Managing Trustee of Aetos Capital, LLC and as Trustee of certain
55
investment funds managed or sponsored by Aetos Capital, LLC. In addition, he also has experience as a member of the board of other funds in the Fund Complex.
Mr. Nugent has extensive experience with financial, accounting, investment and regulatory matters through his almost 20 years of service on the boards of various funds in the Fund Complex, including time as the Chairperson of the Insurance Committee and Chairman of the Morgan Stanley Funds. Mr. Nugent also has experience as a General Partner in Triumph Capital, L.P.
Mr. Reed has experience on investment company boards and is experienced with financial, accounting, investment and regulatory matters through his service as a Trustee of iShares Inc. and other funds in the Fund Complex. Mr. Reed also gained substantial experience in the financial services industry through his positions as Trustee of Legg Mason, Inc. and prior position as President and CEO of General Motors Asset Management.
Mr. Reid has served on a number of mutual fund boards, including as a trustee and Trustee of certain investment companies in the JPMorgan Funds complex and as a Trustee or Trustee of other funds in the Fund Complex. Therefore, Mr. Reid is experienced with financial, accounting, investment and regulatory matters, enabling him to provide management input and investment guidance to the Board.
Mr. Higgins has over 30 years of experience in the financial services industry. Mr. Higgins has substantial mutual fund experience and is experienced with financial, accounting, investment and regulatory matters due to his experience on the boards of other funds in the Fund Complex. Mr. Higgins also serves on the boards of other companies in the financial services industry, including AXA Financial, Inc. and The Equitable Life Assurance Society of the United States.
The Trustees' principal occupations during the past five years or more are shown in the above tables.
Advantages of Having the Same Individuals as Independent Trustees for Morgan Stanley Funds. The Independent Trustees and the Fund's management believe that having the same Independent Trustees for each of the Retail Funds and Institutional Funds avoids the duplication of effort that would arise from having different groups of individuals serving as Independent Trustees for each of the funds or even of sub-groups of funds. They believe that having the same individuals serve as Independent Trustees of all the Morgan Stanley Funds tends to increase their knowledge and expertise regarding matters which affect the Fund Complex generally and enhances their ability to negotiate on behalf of each fund with the fund's service providers. This arrangement also precludes the possibility of separate groups of Independent Trustees arriving at conflicting decisions regarding operations and management of the funds and avoids the cost and confusion that would likely ensue. Finally, having the same Independent Trustees serve on all fund boards of enhances the ability of each fund to obtain, at modest cost to each separate fund, the services of Independent Trustees of the caliber, experience and business acumen of the individuals who serve as Independent Trustees of the Morgan Stanley Funds.
Trustee and Officer Indemnification. The Fund's Declaration of Trust provides that no Trustee, Officer, employee or agent of the Fund is liable to the Fund or to a shareholder, nor is any Trustee, Officer, employee or agent liable to any third persons in connection with the affairs of the Fund, except as such liability may arise from his/her or its own bad faith, willful misfeasance, gross negligence or reckless disregard of his/her or its duties. It also provides that all third persons shall look solely to Fund property for satisfaction of claims arising in connection with the affairs of the Fund. With the exceptions stated, the Declaration of Trust provides that a Trustee, Officer, employee or agent is entitled to be indemnified against all liability in connection with the affairs of the Fund.
Shareholder Communications. Shareholders may send communications to the Board of Trustees. Shareholders should send communications intended for the Board by addressing the communications directly to that Board (or individual Board members) and/or otherwise clearly indicating in the salutation that the communication is for the Board (or individual Board members) and by sending the communication to either the Fund's office or directly to such Board member(s) at the address specified for each Trustee previously noted. Other shareholder communications received by the Fund not directly addressed and sent to the Board will be reviewed and generally responded to by management, and will be forwarded to the Board only at management's discretion based on the matters contained therein.
56
Compensation. Each Trustee (except for the Chairperson of the Boards) receives an annual retainer fee of $210,000 for serving the Morgan Stanley Funds.
The Chairperson of the Audit Committee receives an additional annual retainer fee of $78,750 and the Investment Committee Chairperson receives an additional annual retainer fee of $63,000. Other Committee and, effective January 1, 2012, Sub-Committee Chairpersons receive an additional annual retainer fee of $31,500. Prior to January 1, 2012, each Sub-Committee Chairperson received an annual retainer of $15,750. The aggregate compensation paid to each Trustee is paid by the Morgan Stanley Funds, and is allocated on a pro rata basis among each of the operational funds/portfolios of the Morgan Stanley Funds based on the relative net assets of each of the funds/portfolios. Michael E. Nugent receives a total annual retainer fee of $420,000 for his services as Chairperson of the Boards of the Morgan Stanley Funds and for administrative services provided to each Board.
The Fund also reimburses the Independent Trustees for travel and other out-of-pocket expenses incurred by them in connection with attending such meetings. Trustees of the Fund who are employed by the Adviser receive no compensation or expense reimbursement from the Fund for their services as a Trustee.
Effective April 1, 2004, the Fund began a Deferred Compensation Plan (the "DC Plan"), which allows each Trustee to defer payment of all, or a portion, of the fees he or she receives for serving on the Board of Trustees throughout the year. Each eligible Trustee generally may elect to have the deferred amounts credited with a return equal to the total return on one or more of the Morgan Stanley Funds (or portfolios thereof) that are offered as investment options under the Plan. At the Trustee's election, distributions are either in one lump sum payment, or in the form of equal annual installments over a period of five years. The rights of an eligible Trustee and the beneficiaries to the amounts held under the DC Plan are unsecured and such amounts are subject to the claims of the creditors of the Fund.
Prior to April 1, 2004, the Fund maintained a similar Deferred Compensation Plan (the "Prior DC Plan"), which also allowed each Independent Trustee to defer payment of all, or a portion, of the fees he or she received for serving on the Board of Trustees throughout the year. Generally, the DC Plan amends and supersedes the Prior DC Plan and all amounts payable under the Prior DC Plan are now subject to the terms of the Plan (except for amounts paid during the calendar year 2004 which remain subject to the terms of the Prior DC Plan).
The following table shows aggregate compensation payable to each of the Fund's Trustees from the Fund for the fiscal year ended September 30, 2011 and the aggregate compensation payable to each of the Fund's Trustees by the Fund Complex (which includes all of the Morgan Stanley Funds) for the calendar year ended December 31, 2011.
COMPENSATION(1)
| Name of Independent Trustee | Aggregate Compensation From the Fund(2) | Total Compensation From Fund and Fund Complex Paid to the Trustees(3) | |||||||||
| Frank L. Bowman | $ | 18,799 | $ | 225,750 | |||||||
| Michael Bozic | 19,824 | 241,500 | |||||||||
| Kathleen A. Dennis | 18,799 | 225,750 | |||||||||
| Manuel H. Johnson | 22,409 | 273,000 | |||||||||
| Joseph J. Kearns(2)(3) | 23,699 | 306,750 | |||||||||
| Michael F. Klein | 18,799 | 225,750 | |||||||||
| Michael E. Nugent | 34,472 | 420,000 | |||||||||
| W. Allen Reed(2)(3) | 18,796 | 225,750 | |||||||||
| Fergus Reid(3) | 19,824 | 259,500 | |||||||||
57
| Name of Independent Trustee | Aggregate Compensation From the Fund(2) | Total Compensation From Fund and Fund Complex Paid to the Trustees(3) | |||||||||
| James F. Higgins | $ | 17,249 | $ | 210,000 | |||||||
(1) Includes all amounts paid for serving as director/trustee of the funds, as well as serving as Chairperson of the Boards or a Chairperson of a Committee or Sub-Committee.
(2) The amounts shown in this column represent the aggregate compensation before deferral with respect to the Fund's fiscal year. The following Trustees deferred compensation from the Fund during the fiscal year ended September 30, 2011: Mr. Kearns, $8,769; Mr. Reed, $18,796.
(3) The amounts shown in this column represent the aggregate compensation paid by all of the funds in the Fund Complex as of December 31, 2011 before deferral by the Trustees under the DC Plan. As of December 31, 2011, the value (including interest) of the deferral accounts across the Fund Complex for Messrs. Kearns, Reed and Reid pursuant to the deferred compensation plan was $532,157, $674,903 and $523,935, respectively. Because the funds in the Fund Complex have different fiscal year ends, the amounts shown in this column are presented on a calendar year basis.
Prior to December 31, 2003, 49 of the Morgan Stanley Funds (the "Adopting Funds") had adopted a retirement program under which an Independent Trustee who retired after serving for at least five years as an Independent Trustee of any such fund (an "Eligible Trustee") would have been entitled to retirement payments based on factors such as length of service, upon reaching the eligible retirement age. On December 31, 2003, the amount of accrued retirement benefits for each Eligible Trustee was frozen, and will be payable, together with a return of 8% per annum, at or following each such Eligible Trustee's retirement as shown in the table below.
The following table illustrates the retirement benefits accrued to the Fund's Independent Trustees by the Adopting Funds for the calendar year ended December 31, 2011, and the estimated retirement benefits for the Independent Trustees from the Adopting Funds for each calendar year following retirement. Only the Trustees listed below participated in the retirement program.
| Name of Independent Trustee | Retirement Benefits Accrued as Fund Expenses By All Adopting Funds | Estimated Annual Benefits Upon Retirement(1) From All Adopting Funds | |||||||||
| Michael Bozic | $ | 42,107 | $ | 43,940 | |||||||
| Manuel H. Johnson | 30,210 | 64,338 | |||||||||
| Michael E. Nugent | 6,805 | 57,539 | |||||||||
(1) Total compensation accrued under the retirement plan, together with a return of 8% per annum, will be paid annually commencing upon retirement and continuing for the remainder of the Trustee's life.
INVESTMENT ADVISER
The Adviser to the Fund, Morgan Stanley Investment Management Inc., with principal offices at 522 Fifth Avenue, New York, NY 10036, is a wholly owned subsidiary of Morgan Stanley, a preeminent global financial services firm engaged in securities trading and brokerage activities, as well as providing investment banking, research and analysis, financing and financial advisory services. As of December 31, 2011, the Adviser, together with its affiliated asset management companies, had approximately $287.4 billion in assets under management or supervision.
Under an Investment Advisory Agreement (the "Agreement") with the Fund, the Adviser, subject to the control and supervision of the Fund's Board and in conformance with the stated investment objectives and policies of each Portfolio of the Fund, manages the investment and reinvestment of the assets of each Portfolio of the Fund. In this regard, it is the responsibility of the Adviser to make investment decisions for the Fund's Portfolios and to place each Portfolio's purchase and sales orders for investment securities.
As compensation for the services rendered by the Adviser under the Agreement and the assumption by the Adviser of the expenses related thereto (other than the cost of securities purchased for the Portfolios and the taxes and brokerage commissions, if any, payable in connection with the purchase and/or sale of such securities), each
58
Portfolio pays the Adviser an advisory fee calculated by applying a quarterly rate, based on the following annual percentage rates, to the Portfolio's average daily net assets for the quarter:
| Portfolio | Rate (%) | ||||||
| Mid Cap Growth Portfolio | 0.500 | % | |||||
| Core Fixed Income Portfolio | 0.375 | % | |||||
| Core Plus Fixed Income Portfolio | 0.375% of the portion of the daily net assets not exceeding $1 billion; and 0.300% of the portion of the daily net assets exceeding $1 billion | ||||||
| Corporate Bond Portfolio | 0.375 | % | |||||
| Limited Duration Portfolio | 0.300 | % | |||||
| Long Duration Fixed Income Portfolio | 0.375 | % | |||||
| Balanced Portfolio | 0.450 | % | |||||
The Adviser has agreed to reduce or waive its advisory fees and/or reimburse certain expenses to the extent necessary, if any, to keep total annual operating expenses deducted from Portfolio assets for Class I and Class P from exceeding 0.50% and 0.75%, respectively, of average daily net assets for each of the Core Fixed Income and Long Duration Fixed Income Portfolios. In determining the actual amount of advisory fee waiver and/or expense reimbursement for a Portfolio, if any, the Adviser excludes from annual operating expenses certain investment related expenses, such as interest expense on borrowing. The fee waivers and/or expense reimbursements are expected to continue until such time that the Fund's Board of Trustees acts to discontinue such waivers and/or reimbursements when it deems such action is appropriate.
The following table shows for each Portfolio (i) the advisory fee paid; and (ii) the advisory fee waived and/or rebated from affiliated transactions for each of the past three fiscal years ended September 30, 2009, 2010 and 2011.
| Advisory Fees Paid (After Fee Waivers and/or Rebate from Affiliated Transactions) | Advisory Fees Waived | Rebate from Affiliated Transactions | |||||||||||||||||||||||||||||||||||||
| Portfolio | 2009 (000) | 2010 (000) | 2011 (000) | 2009 (000) | 2010 (000) | 2011 (000) | 2009 (000) | 2010 (000) | 2011 (000) | ||||||||||||||||||||||||||||||
| Mid Cap Growth Portfolio | $ | 12,603 | $ | 21,076 | $ | 34,346 | $ | — | $ | — | $ | — | $ | 147 | $ | 257 | $ | 456 | |||||||||||||||||||||
| Core Fixed IncomePortfolio | 303 | 168 | — | 136 | 140 | 259 | 6 | 4 | 2 | ||||||||||||||||||||||||||||||
| Core Plus Fixed Income Portfolio | 3,897 | 3,065 | 1,360 | — | — | — | 53 | 46 | 18 | ||||||||||||||||||||||||||||||
| Corporate Bond Portfolio | 841 | 359 | 287 | — | — | — | 15 | 5 | 3 | ||||||||||||||||||||||||||||||
| Limited Duration Portfolio | 1,045 | 705 | 561 | — | — | — | 8 | 6 | 3 | ||||||||||||||||||||||||||||||
| Long Duration Fixed Income Portfolio | 22 | 26 | — | 86 | 89 | 94 | 1 | — | 1 | ||||||||||||||||||||||||||||||
| Balanced Portfolio | 251 | 221 | 204 | — | — | — | 26 | 5 | 7 | ||||||||||||||||||||||||||||||
The Agreement continues for successive one year periods, only if each renewal is specifically approved by an in-person vote of the Fund's Board, including the affirmative votes of a majority of the Trustees who are not parties to the agreement or "interested persons" (as defined in the 1940 Act) of any such party at a meeting called for the purpose of considering such approval. In addition, the question of continuance of the Agreement may be presented to the shareholders of the Fund; in such event, continuance shall be effected only if approved by the affirmative vote of a majority of the outstanding voting securities of each Portfolio of the Fund. If the holders of any Portfolio fail to approve the Agreement, the Adviser may continue to serve as investment adviser to each Portfolio which approved the Agreement, and to any Portfolio which did not approve the Agreement until new arrangements have been made. The Agreement is automatically terminated if assigned, and may be terminated by any Portfolio without the payment of any penalty, at any time, (1) by vote of a majority of the entire Board or (2) by vote of a majority
59
of the outstanding voting securities of the Portfolio on 60 days' written notice to the Adviser or (3) by the Adviser without the payment of any penalty, upon 90 days' written notice to the Fund.
The Fund bears all of its own costs and expenses, including but not limited to: services of its independent accountants, its administrator and dividend disbursing and transfer agent, legal counsel, taxes, insurance premiums, costs incidental to meetings of its shareholders and Trustees, the cost of filing its registration statements under federal and state securities laws, reports to shareholders, and custodian fees. These Fund expenses are, in turn, allocated to each Portfolio, based on their relative net assets. Each Portfolio bears its own advisory fees and brokerage commissions and transfer taxes in connection with the acquisition and disposition of its investment securities.
Code of Ethics
The Fund, the Adviser and the Distributor have each adopted a Code of Ethics pursuant to Rule 17j-1 under the 1940 Act. The Codes of Ethics are designed to detect and prevent improper personal trading. The Codes of Ethics permit personnel subject to the Codes to invest in securities, including securities that may be purchased, sold or held by the Fund, subject to a number of restrictions and controls, including prohibitions against purchases of securities in an initial public offering and a preclearance requirement with respect to personal securities transactions.
Proxy Voting Policies and Procedures and Proxy Voting Record
The Board of Trustees believes that the voting of proxies on securities held by the Fund is an important element of the overall investment process. As such, the Trustees have delegated the responsibility to vote such proxies to MSIM.
A copy of MSIM's Proxy Voting Policy ("Proxy Policy") is attached hereto as Appendix A. In addition, a copy of the Proxy Policy, as well as the Fund's most recent proxy voting record for the 12-month period ended June 30, filed with the SEC are available without charge on our web site at www.morganstanley.com/im. The Fund's proxy voting record is also available without charge on the SEC's web site at www.sec.gov.
Portfolio Managers
Because the portfolio managers may manage assets for other investment companies, pooled investment vehicles and/or other accounts (including institutional clients, pension plans and certain high net worth individuals), there may be an incentive to favor one client over another resulting in conflicts of interest. For instance, the Adviser may receive fees from certain accounts that are higher than the fee it receives from the Fund, or it may receive a performance-based fee on certain accounts. In those instances, the portfolio managers may have an incentive to favor the higher and/or performance-based fee accounts over the Fund. In addition, a conflict of interest could exist to the extent the Adviser has proprietary investments in certain accounts, where portfolio managers have personal investments in certain accounts or when certain accounts are investment options in the Adviser's employee benefits and/or deferred compensation plans. The portfolio manager may have an incentive to favor these accounts over others. If the Adviser manages accounts that engage in short sales of securities of the type in which the Fund invests, the Adviser could be seen as harming the performance of the Fund for the benefit of the accounts engaging in short sales if the short sales cause the market value of the securities to fall. The Adviser has adopted trade allocation and other policies and procedures that it believes are reasonably designed to address these and other conflicts of interest.
Portfolio Manager Compensation Structure
Portfolio managers receive a combination of base compensation and discretionary compensation, comprising a cash bonus and several deferred compensation programs described below. The methodology used to determine portfolio manager compensation is applied across all funds/accounts managed by the portfolio manager.
Base salary compensation. Generally, portfolio managers receive base salary compensation based on the level of their position with the Adviser.
60
Discretionary compensation. In addition to base compensation, portfolio managers may receive discretionary compensation. Discretionary compensation can include:
• Cash Bonus.
• Morgan Stanley's Long Term Incentive Compensation awards—a mandatory program that defers a portion of discretionary year-end compensation into restricted stock units or other awards based on Morgan Stanley common stock or other plans that are subject to vesting and other conditions. All long term incentive compensation awards are subject to clawback provisions where awards can be cancelled if an employee takes any action, or omits to take any action which; causes a restatement of Morgan Stanley's consolidated financial results; or constitutes a violation of Morgan Stanley's risk policies and standards.
• Investment Management Alignment Plan (IMAP) awards—a mandatory program that defers a portion of discretionary year-end compensation and notionally invests it in designated funds advised by the Adviser or its affiliates. The award is subject to vesting and other conditions. Portfolio managers must notionally invest a minimum of 25% to a maximum of 100% of their IMAP deferral account into a combination of the designated funds they manage that are included in the IMAP fund menu, which may or may not include one of the Portfolios. In addition to the clawbacks listed above for long term incentive compensation awards, the provision on IMAP awards is further strengthened such that it may also be triggered if an employee's actions cause substantial financial loss on a trading strategy, investment, commitment or other holding provided that previous gains on those positions were relevant to the employees' prior year compensation decisions.
• Voluntary Deferred Compensation Plans—voluntary programs that permit certain employees to elect to defer a portion of their discretionary year-end compensation and notionally invest the deferred amount across a range of designated investment funds, which may include funds advised by the Adviser or its affiliates.
Several factors determine discretionary compensation, which can vary by portfolio management team and circumstances. These factors include:
• Revenues generated by the investment companies, pooled investment vehicles and other accounts managed by the portfolio manager.
• The investment performance of the funds/accounts managed by the portfolio manager.
• Contribution to the business objectives of the Adviser.
• The dollar amount of assets managed by the portfolio manager.
• Market compensation survey research by independent third parties.
• Other qualitative factors, such as contributions to client objectives.
• Performance of Morgan Stanley and Morgan Stanley Investment Management, and the overall performance of the investment team(s) of which the portfolio manager is a member.
Other Accounts Managed by Portfolio Managers at September 30, 2011 (unless otherwise indicated):
| Registered Investment Companies | Other Pooled Investment Vehicles | Other Accounts | |||||||||||||||||||||||||
| Portfolio and Portfolio Managers | Number of Accounts | Total Assets in the Accounts | Number of Accounts | Total Assets in the Accounts | Number of Accounts | Total Assets in the Accounts | |||||||||||||||||||||
| Balanced Portfolio | |||||||||||||||||||||||||||
| Mark A. Bavoso | 3 | $627.2 million | 2 | $610.8 million | 10 | $3.9 billion(1) | |||||||||||||||||||||
| Cyril Moullé-Berteaux | 5 | $780.9 million | 2 | $610.8 million | 9 | $3.9 billion(1) | |||||||||||||||||||||
| Core Fixed Income Portfolio and Core Plus Fixed Income Portfolio | |||||||||||||||||||||||||||
| Jaidip Singh | 10 | $2.0 billion | 0 | $ | 0 | 18 | $6.7 billion(2) | ||||||||||||||||||||
| Neil Stone | 9 | $958.4 million | 0 | $ | 0 | 64 | $12.5 billion(2) | ||||||||||||||||||||
61
| Registered Investment Companies | Other Pooled Investment Vehicles | Other Accounts | |||||||||||||||||||||||||
| Portfolio and Portfolio Managers | Number of Accounts | Total Assets in the Accounts | Number of Accounts | Total Assets in the Accounts | Number of Accounts | Total Assets in the Accounts | |||||||||||||||||||||
| Corporate Bond Portfolio | |||||||||||||||||||||||||||
| Joseph Mehlman | 5 | $613.5 million | 0 | $ | 0 | 53 | $12.6 billion | ||||||||||||||||||||
| Christian G. Roth | 6 | $687.6 million | 12 | $6.3 million | 39 | $14.9 billion(3) | |||||||||||||||||||||
| Limited Duration Portfolio | |||||||||||||||||||||||||||
| Joseph Mehlman | 5 | $613.5 million | 0 | $ | 0 | 53 | $12.6 billion | ||||||||||||||||||||
| Jaidip Singh | 10 | $2.0 billion | 0 | $ | 0 | 18 | $6.7 billion(2) | ||||||||||||||||||||
| Neil Stone | 9 | $958.4 million | 0 | $ | 0 | 64 | $12.5 billion(2) | ||||||||||||||||||||
| Long Duration Fixed Income Portfolio | |||||||||||||||||||||||||||
| Joseph Mehlman | 5 | $613.5 million | 0 | $ | 0 | 53 | $12.6 billion | ||||||||||||||||||||
| Jaidip Singh | 10 | $2.0 billion | 0 | $ | 0 | 18 | $6.7 billion(2) | ||||||||||||||||||||
| Neil Stone | 9 | $958.4 million | 0 | $ | 0 | 64 | $12.5 billion(2) | ||||||||||||||||||||
| Mid Cap Growth Portfolio | |||||||||||||||||||||||||||
| Dennis P. Lynch | 35 | $16.5 billion | 4 | $2.9 billion | 13 | $1.1 billion | |||||||||||||||||||||
| David S. Cohen | 35 | $16.5 billion | 4 | $2.9 billion | 13 | $1.1 billion | |||||||||||||||||||||
| Sam G. Chainani | 35 | $16.5 billion | 4 | $2.9 billion | 13 | $1.1 billion | |||||||||||||||||||||
| Alexander T. Norton | 35 | $16.5 billion | 4 | $2.9 billion | 13 | $1.1 billion | |||||||||||||||||||||
| Jason C. Yeung | 35 | $16.5 billion | 4 | $2.9 billion | 13 | $1.1 billion | |||||||||||||||||||||
| Armistead B. Nash | 35 | $16.5 billion | 4 | $2.9 billion | 13 | $1.1 billion | |||||||||||||||||||||
(1) Of these other accounts, two accounts with a total of approximately $1.1 billion in assets, had performance-based fees.
(2) Of these other accounts, one account with a total of approximately $725.7 million in assets, had performance-based fees.
(3) Of these other accounts, five accounts with a total of approximately $2.2 billion in assets, had performance-based fees.
Securities Ownership of Portfolio Managers (at September 30, 2011, unless otherwise noted)
Balanced Portfolio
Mark Bavoso — None
Cyril Moullé-Berteaux — None
Core Fixed Income Portfolio
Jaidip Singh — None
Neil Stone — None
Core Plus Fixed Income Portfolio
Jaidip Singh — $1-$10,000
Neil Stone — $50,001-$100,000
Corporate Bond Portfolio
Joseph Mehlman — None
Christian G. Roth — None
Limited Duration Portfolio
Joseph Mehlman — $1-$10,000
Jaidip Singh — $1-$10,000
Neil Stone — None
Long Duration Fixed Income Portfolio
Joseph Mehlman — None
Jaidip Singh — None
Neil Stone — None
Mid Cap Growth Portfolio
Dennis P. Lynch — over $1 million
David S. Cohen — $100,001-$500,000
Sam G. Chainani — $100,001-$500,000
Alexander T. Norton — $50,001-$100,000
Jason C. Yeung — $100,001-$500,000
Armistead B. Nash — $10,001-$50,000
62
PRINCIPAL UNDERWRITER
Morgan Stanley Distribution, Inc. (the "Distributor"), a wholly-owned subsidiary of the Adviser, with its principal office at 100 Front Street, Suite 400, West Conshohocken, PA 19428-2881, distributes the shares of the Fund. Under the Distribution Agreement, the Distributor, as agent of the Fund, agrees to use its best efforts as sole distributor of the Fund's shares. The Distribution Agreement continues in effect so long as such continuance is approved at least annually by the Fund's Board, including a majority of those Trustees who are not parties to such Distribution Agreement nor interested persons of any such party. The Distribution Agreement provides that the Fund will bear the costs of the registration of its shares with the SEC and various states and the printing of its prospectuses, statements of additional information and reports to shareholders.
DISTRIBUTION AND SHAREHOLDER SERVICES PLANS
Class P, Class H and Class L
Effective July 1, 2007, the Fund adopted a Shareholder Services Plan for Class P shares (the "Class P Plan"), effective November 29, 2007, the Fund adopted a Shareholder Services Plan for Class H shares (the "Class H Plan") and effective June 9, 2008, the Fund adopted a Distribution and Shareholder Services Plan for Class L shares (the "Class L Plan"), each pursuant to Rule 12b-1 under the 1940 Act (together, the "Plans"). The Plans provide that the Fund, on behalf of each Portfolio, may pay the Distributor and other affiliated and unaffiliated broker-dealers, financial institutions and/or intermediaries an annualized fee of up to 0.25% of the average daily net assets of each Portfolio attributable to Class P shares, Class H shares or Class L shares, as applicable. This service fee is for providing "personal service and/or the maintenance of shareholder accounts" as provided for in Section 2830(b)(9) of the Financial Industry Regulatory Authority ("FINRA") Conduct Rules, including (i) expenditures for overhead and other expenses of the Distributor and other affiliated and unaffiliated broker-dealers, (ii) telephone and other communications expenses relating to the provision of shareholder services and (iii) compensation to and expenses of financial advisors and other employees of the Distributor and other affiliated and unaffiliated broker-dealers for the provision of shareholder services. In addition, the Class L Plan provides that the Fund, on behalf of each Portfolio, may pay the Distributor an annualized distribution fee of up to 0.25% of the average daily net assets of each Portfolio attributable to Class L shares. The Distributor may direct that all or any part of these fees be paid directly to its affiliates or other broker-dealers, financial institutions and/or intermediaries that provide shareholder services.
The following table describes the shareholder servicing fees paid by each Portfolio with respect to its Class P, Class H and Class L shares pursuant to the Plans and the distribution-related expenses for each Portfolio with respect to its Class P, Class H and Class L shares for the fiscal year ended September 30, 2011. To the extent that expenditures on distribution-related activities exceed the fees paid by a Portfolio, the excess amounts were paid by the Adviser or the Distributor out of its own resources.
| Portfolio | Total Shareholder Servicing Fees Paid by Portfolio | Shareholder Servicing Expenses* | Shareholder Servicing Fees Retained by Morgan Stanley Distribution, Inc. (Expenditures in Excess of Shareholder Servicing Fees) | ||||||||||||
| Class P | |||||||||||||||
| Balanced | $ | 44,610 | $ | 44,034 | $ | 576 | |||||||||
| Core Fixed Income | 309 | 308 | 1 | ||||||||||||
| Core Plus Fixed Income | 13,507 | 13,108 | 399 | ||||||||||||
| Corporate Bond | 707 | ** | 669 | 38 | |||||||||||
63
| Portfolio | Total Shareholder Servicing Fees Paid by Portfolio | Shareholder Servicing Expenses* | Shareholder Servicing Fees Retained by Morgan Stanley Distribution, Inc. (Expenditures in Excess of Shareholder Servicing Fees) | ||||||||||||
| Limited Duration | $ | 280 | $ | 281 | $ | (1 | ) | ||||||||
| Long Duration Fixed Income | 1,344 | — | 1,344 | ||||||||||||
| Mid Cap Growth | 7,370,452 | 7,115,688 | 254,764 | ||||||||||||
| Class H | |||||||||||||||
| Corporate Bond | 519 | 299 | 220 | ||||||||||||
| Class L | |||||||||||||||
| Corporate Bond | 23,188 | 21,914 | 1,274 | ||||||||||||
| Total | $ | 7,454,916 | $ | 7,196,301 | $ | 258,615 | |||||||||
* Includes payments for distribution and/or shareholder servicing to third parties and affiliated entities.
** The shareholder servicing fee paid by the Corporate Bond Portfolio pursuant to the Class P Plan reflects a waiver of $471.
The Plans were approved by the Fund's Board of Trustees, including the Independent Trustees, none of whom has a direct or indirect financial interest in the operation of the Plan or in any agreements related thereto.
Revenue Sharing
The Adviser and/or the Distributor may pay compensation, out of their own funds and not as an expense of the Portfolios, to Morgan Stanley Smith Barney LLC, a majority-owned broker-dealer subsidiary of Morgan Stanley ("Morgan Stanley Smith Barney"), Citigroup Global Markets Inc. ("CGM"), certain insurance companies and/or other unaffiliated brokers, dealers and other financial intermediaries, including recordkeepers and administrators of various deferred compensation plans ("Intermediaries"), in connection with the sale, distribution, marketing and retention of shares of the Portfolios and/or shareholder servicing. For example, the Adviser or the Distributor may pay additional compensation to an Intermediary for, among other things, promoting the sale and distribution of Portfolio shares, providing access to various programs, mutual fund platforms or preferred or recommended mutual fund lists that may be offered by an Intermediary, granting the Distributor access to an Intermediary's financial advisors and consultants, providing assistance in the ongoing education and training of an Intermediary's financial personnel, furnishing marketing support, maintaining share balances and/or for sub-accounting, recordkeeping, administrative, shareholder, or transaction processing services. Such payments are in addition to any shareholder servicing fees and/or transfer agency fees that may be payable by the Portfolios. The additional payments are generally based on current assets, but may also be based on other measures as determined from time to time by the Adviser and/or the Distributor (e.g., gross sales or number of accounts). The amount of these payments may be different for different Intermediaries.
With respect to Morgan Stanley Smith Barney and CGM, these payments currently include the following amounts, which are paid in accordance with the applicable compensation structure:
(1) on Class I, Class P, Class H and Class L shares of the Portfolios held in traditional brokerage accounts where Morgan Stanley Smith Barney or CGM is designated by purchasers as broker-dealer of record, an ongoing annual fee in an amount up to 0.13% of the total average monthly net asset value of such shares.
(2) on Class I and Class P shares of the Portfolios held in traditional brokerage accounts in the Morgan Stanley channel of Morgan Stanley Smith Barney, in addition to the amounts referenced in paragraph (1) above, an ongoing annual fee in an amount up to 35% of each Portfolio's advisory fees accrued from the average daily net asset value of such shares.
(3) On Class I and Class P shares of the Portfolios held in taxable accounts through any fee-based advisory program offered by the Morgan Stanley channel of Morgan Stanley Smith Barney, an ongoing annual fee in an amount up to 0.08% of the total average monthly net asset value of such shares.
64
The prospect of receiving, or the receipt of, additional compensation as described above by Morgan Stanley Smith Barney and CGM may provide Morgan Stanley Smith Barney and CGM and their financial advisors and other salespersons with an incentive to favor sales of shares of the Portfolios over other investment options with respect to which Morgan Stanley Smith Barney and CGM do not receive additional compensation (or receive lower levels of additional compensation). These payment arrangements, however, will not change the price that an investor pays for shares of the Portfolios or the amount that the Portfolios receive to invest on behalf of an investor. Investors may wish to take such payment arrangements into account when considering and evaluating any recommendations relating to Portfolio shares and should review carefully any disclosure provided by Morgan Stanley Smith Barney and CGM as to their compensation. Currently, there are no compensation arrangements in place with other Intermediaries.
FUND ADMINISTRATION
The Adviser also serves as Administrator to the Fund pursuant to an Amended and Restated Administration Agreement dated as of November 1, 2004 (the "Administration Agreement"). Under the Administration Agreement, the Adviser receives an annual fee, accrued daily and payable monthly, of 0.08% of the Fund's average daily net assets, and is responsible for all fees payable under any sub-administration agreements.
For the fiscal years ended September 30, 2009, 2010 and 2011, the Fund paid the following administrative fees (no administrative fees were waived):
| Administrative Fees Paid | |||||||||||||||
| Portfolio | 2009 (000) | 2010 (000) | 2011 (000) | ||||||||||||
| Mid Cap Growth Portfolio | $ | 2,039 | $ | 3,413 | $ | 5,568 | |||||||||
| Core Fixed Income Portfolio | 95 | 67 | 55 | ||||||||||||
| Core Plus Fixed Income Portfolio | 855 | 663 | 294 | ||||||||||||
| Corporate Bond Portfolio | 183 | 78 | 62 | ||||||||||||
| Limited Duration Portfolio | 281 | 190 | 150 | ||||||||||||
| Long Duration Fixed Income Portfolio | 23 | 24 | 20 | ||||||||||||
| Balanced Portfolio | 49 | 40 | 37 | ||||||||||||
Sub-Administrator. Under an agreement between the Administrator and State Street Bank and Trust Company ("State Street"), State Street provides certain administrative services to the Fund. For such services, the Administrator pays State Street a portion of the administrative fee the Administrator receives from the Fund. The Administrator supervises and monitors the administrative and accounting services provided by State Street. Their services are also subject to the supervision of the officers and Board of Trustees of the Fund. State Street's business address is One Lincoln Street, Boston, MA 02111-2101.
OTHER SERVICE PROVIDERS
Custodian. State Street, located at One Lincoln Street, Boston, MA 02111-2101, serves as Custodian for the Fund. The Custodian holds cash, securities, and other assets of the Fund as required by the 1940 Act.
Transfer and Dividend Disbursing Agent. Morgan Stanley Services Company Inc., P.O. Box, 219804, Kansas City, MO 64121-9804, serves as the Fund's Transfer Agent and Dividend Disbursing Agent.
Pursuant to a Transfer Agency Agreement, the Fund pays Morgan Stanley Services Company Inc. a fee, which has been approved by the Fund's Board of Trustees, generally based on the number of classes, accounts and transactions relating to the Portfolios of the Fund. The Fund and Morgan Stanley Services Company Inc. may enter into agreements with third party intermediaries, pursuant to which such intermediaries agree to provide recordkeeping and other administrative services for their clients who invest in the Portfolios. In such instances, each Portfolio may pay certain fees to the intermediaries for the services they provide that otherwise would have been performed by Morgan Stanley Services Company Inc., which fees may be calculated and incurred on a class-by-class basis.
65
Independent Registered Public Accounting Firm. Ernst & Young LLP, located at 200 Clarendon Street, Boston, MA 02116-5072, serves as the independent registered public accounting firm for the Fund and audits the annual financial statements of each Portfolio.
Fund Counsel. Dechert LLP, located at 1095 Avenue of the Americas, New York, NY 10036, acts as the Fund's legal counsel.
BROKERAGE TRANSACTIONS
Portfolio Transactions
The Agreement authorizes the Adviser to select the brokers or dealers that will execute the purchases and sales of investment securities for each of the Fund's Portfolios and directs the Adviser to use its best efforts to obtain the best execution with respect to all transactions for the Portfolios. In so doing, the Adviser will consider all matters it deems relevant, including the following: the Adviser's knowledge of negotiated commission rates and spreads currently available; the nature of the security or instrument being traded; the size and type of the transaction; the nature and character of the markets for the security or instrument to be purchased or sold; the desired timing of the transaction; the activity existing and expected in the market for the particular security or instrument; confidentiality; the execution, clearance, and settlement capabilities of the broker or dealer selected and other brokers or dealers considered; the reputation and perceived soundness of the broker or dealer selected and other brokers or dealers considered; the Adviser's knowledge of any actual or apparent operational problems of a broker or dealer; and the reasonableness of the commission or its equivalent for the specific transaction.
In seeking to implement the Fund's policies, the Adviser effects transactions with those brokers and dealers who the Adviser believes provide prompt execution of orders in an effective manner at the most favorable prices. If the Adviser believes the prices and executions are obtainable from more than one broker or dealer, it may give consideration to placing portfolio transactions with those brokers and dealers who also furnish research and other services to the Portfolios or the Adviser. The services may include, but are not limited to, any one or more of the following: information as to the availability of securities for purchase or sale; statistical or factual information or opinions pertaining to investment; wire services; and appraisals or evaluations of portfolio securities. The information and services received by the Adviser from brokers and dealers may be of benefit to them and any of their asset management affiliates in the management of accounts of some of their other clients and may not in all cases benefit the Fund directly.
The Adviser is prohibited from directing brokerage transactions on the basis of the referral of clients or the sale of shares of advised investment companies. However, the Adviser may place Portfolio orders with qualified broker-dealers who recommend the Portfolios or who act as agents in the purchase of shares of the Portfolios for their clients.
The Adviser and its affiliated investment advisers have established commission sharing arrangements under a commission management program (the "Commission Management Program" or "CMP"), pursuant to which execution and research costs or a portion of those costs are decoupled in accordance with applicable laws, rules and regulations. Under the CMP, the Adviser and its affiliated investment advisers select approved equity brokers (which include the Adviser's affiliates) for execution services and after accumulation of commissions at such brokers, the Adviser and/or its affiliates instruct these approved equity brokers to pay for eligible research provided by executing brokers or third-party research providers, which are selected independently by a Research Services Committee of the Adviser and its affiliated investment advisers. Generally, the Adviser and its affiliated investment advisers will direct the approved equity broker to record research credits based upon a previously agreed-upon allocation and will periodically instruct the approved equity broker to direct specified dollar amounts from that pool to pay for eligible research services provided by third-party research providers and executing brokers. The research credits are pooled among the Adviser and its affiliated investment advisers and allocated from this pool. Likewise, the research services obtained under the CMP are shared among the Adviser and its affiliated investment advisers.
Selection of approved equity brokers for execution is based on three main criteria: access to liquidity, provision of capital and quality of execution. Under the CMP, each approved equity broker is responsible for the
66
payment of fees for research services and obtains the research services pursuant to written agreements between the approved equity broker and the third-party research provider.
For those costs not decoupled, but retained by broker-dealers, the Adviser also effects transactions with brokers which directly pay for research services provided by those brokers in accordance with Section 28(e) of the 1934 Act. These include equity transactions and may include fixed-income transactions effected on an agency basis.
Transactions involving client accounts managed by two or more affiliated investment advisers may be aggregated and executed using the services of broker-dealers that provide third party benefits/research so long as: (i) all client accounts involved in the transaction benefit from one or more of the services offered by such broker-dealer; and (ii) each affiliated investment adviser has approved the use of such broker-dealer and the services provided thereby.
The research services received include those of the nature described above and other services which aid the Adviser in fulfilling its investment decision making responsibilities, including (a) furnishing advice as to the value of securities, the advisability of investing in, purchasing or selling securities, and the availability of securities or purchasers or sellers of securities; and (b) furnishing analyses and reports concerning issuers, industries, securities, economic factors and trends, portfolio strategy and the performance of accounts. Where a particular item has both research and non-research related uses (such as proxy services where both research services and services relating to the administration of the proxy itself are provided), the Adviser will make a reasonable allocation of the cost of the item between research and non-research uses and will only pay for the portion of the cost allocated to research uses with client brokerage transactions. Research services furnished or paid for by brokers through whom the Adviser effects transactions for a particular account may be used by the Adviser or its affiliated investment advisers in servicing their other accounts, and not all such services may be used for the benefit of the client which pays the brokerage commission which results in the receipt of such research services. Commissions paid to brokers providing research services may be higher than those charged by brokers not providing services.
The Adviser and its affiliated investment advisers make a good faith determination of the value of research services in accordance with Section 28(e) of the 1934 Act, UK Financial Services Authority Rules and other relevant regulatory requirements.
Certain investment professionals and other employees of the Adviser are also officers of affiliated investment advisers and may provide investment advisory services to clients of such affiliated investment advisers. The Adviser's personnel also provide research and trading support to personnel of certain affiliated investment advisers. Research related costs may be shared by affiliated investment advisers and may benefit the clients of such affiliated investment advisers. Research services that benefit the Adviser may be received in connection with commissions generated by clients of its affiliated investment advisers. Similarly, research services received in connection with commissions generated by the Adviser's clients may benefit affiliated investment advisers and their clients. Moreover, research services provided by broker-dealers through which the Adviser effects transactions for a particular account may be used by the Adviser and/or an affiliated investment adviser in servicing its other accounts and not all such research services may be used for the benefit of the particular client, which pays the brokerage commission giving rise to the receipt of such research services.
The Adviser and certain of its affiliates currently serve as investment adviser to a number of clients, including other investment companies, and may in the future act as investment adviser to others. It is the practice of the Adviser and its affiliates to cause purchase and sale transactions to be allocated among clients whose assets they manage (including the Fund) in such manner they deem equitable. In making such allocations among the Fund and other client accounts, various factors may be considered, including the respective investment objectives, the relative size of portfolio holdings of the same or comparable securities, the availability of cash for investment, the size of investment commitments generally held and the opinions of the persons responsible for managing the Portfolios and other client accounts. The Adviser and its affiliates may operate one or more order placement facilities and each facility will implement order allocation in accordance with the procedures described above. From time to time, each facility may transact in a security at the same time as other facilities are trading in that security.
67
As a wholly-owned subsidiary of Morgan Stanley, the Adviser is affiliated with certain U.S.-registered broker-dealers and foreign broker-dealers (collectively, the "Affiliated Brokers"). The Adviser may, in the exercise of its discretion under the Agreement, effect transactions in securities or other instruments for the Fund through the Affiliated Brokers.
Affiliated Brokers
Subject to the overriding objective of obtaining the best execution of orders, the Fund may use broker-dealer affiliates of the Adviser to effect Portfolio brokerage transactions, including transactions in futures contracts and options on futures contracts, under procedures adopted by the Fund's Board of Trustees. In order to use such affiliates, the commission rates and other remuneration paid to the affiliates must be fair and reasonable in comparison to those of other broker-dealers for comparable transactions involving similar securities being purchased or sold during a comparable time period. This standard would allow the affiliated broker or dealer to receive no more than the remuneration which would be expected to be received by an unaffiliated broker.
Pursuant to an order issued by the SEC, the Fund is permitted to engage in principal transactions involving money market instruments, subject to certain conditions, with Morgan Stanley & Co. LLC, a broker-dealer affiliated with the Fund's Adviser.
During the fiscal years ended September 30, 2009, 2010 and 2011, the Fund did not effect any principal transactions with Morgan Stanley & Co. LLC.
Commissions Paid
During the fiscal years ended September 30, 2009, 2010 and 2011, the Fund paid brokerage commissions of approximately $4,448,600, $3,101,357 and $4,382,245, respectively. During the fiscal years ended September 30, 2009, 2010 and 2011, the Fund paid in the aggregate $57,602, $15,471 and $28,416, respectively, as brokerage commissions to Morgan Stanley & Co. LLC. During the fiscal year ended September 30, 2011, the brokerage commissions paid to Morgan Stanley & Co. LLC represented approximately 0.65% of the total brokerage commissions paid by the Fund during the period and were paid on account of transactions having an aggregate dollar value equal to approximately 0.57% of the aggregate dollar value of all portfolio transactions of the Fund during the period for which commissions were paid.
During the fiscal years ended September 30, 2009, 2010 and 2011, the Fund paid in the aggregate $0, $31,380 and $32,396, respectively, as brokerage commissions to Citigroup, Inc. During the fiscal year ended September 30, 2011, the brokerage commissions paid to Citigroup, Inc. represented approximately 0.74% of the total brokerage commissions paid by the Fund during the period and were paid on account of transactions having an aggregate dollar value equal to approximately 0.36% of the aggregate dollar value of all portfolio transactions of the Fund during the period for which commissions were paid.
During the fiscal year ended September 30, 2011, each Portfolio of the Fund paid brokerage commissions, including brokerage commissions paid to affiliated broker-dealers, as follows:
| Brokerage Commissions Paid During Fiscal Year Ended September 30, 2011 | |||||||||||||||||||||||||||||||
| Commissions Paid to Morgan Stanley & Co. LLC | Commissions Paid to Citigroup, Inc. | ||||||||||||||||||||||||||||||
Total Commissions Paid | Total Commissions | Percent of Total Commissions | Percent of Total Brokered Transactions | Total Commissions | Percent of Total Commissions | Percent of Total Brokered Transactions | |||||||||||||||||||||||||
| Mid Cap Growth | $ | 4,301,540 | $ | 28,416 | 0.66 | % | 0.98 | % | $ | 29,708 | 0.69 | % | 0.52 | % | |||||||||||||||||
| Core Fixed Income | 4,192 | — | �� | — | — | — | — | — | |||||||||||||||||||||||
| Core Plus Fixed Income | 31,688 | — | — | — | — | — | — | ||||||||||||||||||||||||
| Corporate Bond | 5,318 | — | — | — | — | — | — | ||||||||||||||||||||||||
| Limited Duration | 6,964 | — | — | — | — | — | — | ||||||||||||||||||||||||
| Long Duration Fixed Income | 1,283 | — | — | — | — | — | — | ||||||||||||||||||||||||
| Balanced | 31,260 | — | — | — | 2,688 | 8.60 | % | 2.48 | % | ||||||||||||||||||||||
68
During the fiscal years ended September 30, 2010 and September 30, 2009, each Portfolio of the Fund paid brokerage commissions as follows. No brokerage commissions were paid to Citigroup, Inc. by any Portfolio during the period from June 1, 2009 to September 30, 2009.
| Brokerage Commissions Paid During Fiscal Years Ended September 30, 2010 and 2009 | |||||||||||||||||||||||
| Fiscal Year Ended September 30, 2010 | Fiscal Year Ended September 30, 2009 | ||||||||||||||||||||||
| Portfolio | Total | Morgan Stanley & Co. LLC | Citigroup, Inc. | Total | Morgan Stanley & Co. LLC | ||||||||||||||||||
| Mid Cap Growth | $ | 2,915,371 | $ | 15,098 | $ | 31,342 | $ | 2,003,152 | $ | 13,873 | |||||||||||||
| Core Fixed Income | 8,328 | — | — | 21,172 | — | ||||||||||||||||||
| Core Plus Fixed Income | 93,503 | — | — | 172,259 | — | ||||||||||||||||||
| Corporate Bond | 9,223 | — | — | 40,403 | — | ||||||||||||||||||
| Limited Duration | 20,823 | — | — | 46,467 | — | ||||||||||||||||||
| Long Duration Fixed Income | 3,195 | — | — | 3,826 | — | ||||||||||||||||||
| Balanced | 50,914 | 373 | 38 | 24,116 | — | ||||||||||||||||||
Regular Broker-Dealers. The Fund's regular broker-dealers are (i) the ten broker-dealers that received the greatest dollar amount of brokerage commissions from the Fund; (ii) the ten broker-dealers that engaged as principal in the largest dollar amount of portfolio transactions; and (iii) the ten broker-dealers that sold the largest dollar amount of Portfolio shares. During the fiscal year ended September 30, 2011, the following Portfolios purchased securities issued by the Fund's regular broker-dealers:
VALUE OF PORTFOLIO HOLDINGS
| Portfolio | Regular Broker-Dealer | Approximate Value of Portfolio Holdings as of September 30, 2011 | |||||||||
| Balanced Portfolio | Bank of America Securities LLC | $ | 542,000 | ||||||||
| Credit Suisse Group AG | 82,000 | ||||||||||
| State Street Bank and Trust Co. | 72,000 | ||||||||||
| Goldman Sachs & Co. | 291,000 | ||||||||||
| JP Morgan Securities, Inc. | 921,000 | ||||||||||
| UBS Financial Services, Inc. | 41,000 | ||||||||||
| Core Fixed Income Portfolio | JP Morgan Securities Inc. | 1,054,000 | |||||||||
| Barclays Capital Group | 222,000 | ||||||||||
| Core Plus Fixed Income Portfolio | Bank of America Securities LLC | 4,688,000 | |||||||||
| Barclays Capital Group | 551,000 | ||||||||||
| JP Morgan Securities, Inc. | 6,253,000 | ||||||||||
| Corporate Bond Portfolio | JP Morgan Securities Inc. | 1,131,000 | |||||||||
| Barclays Capital Group | 221,000 | ||||||||||
| Limited Duration Portfolio | JP Morgan Securities Inc. | 1,019,000 | |||||||||
| Goldman Sachs & Co. | 1,225,000 | ||||||||||
| Bank of America Securities LLC | 2,647,000 | ||||||||||
| BNP Paribas SA | 906,000 | ||||||||||
| Wells Fargo & Co. | 1,406,000 | ||||||||||
| UBS Financial Services, Inc. | 1,136,000 | ||||||||||
Portfolio Turnover. The Portfolios generally do not invest for short-term trading purposes; however, when circumstances warrant, each Portfolio may sell investment securities without regard to the length of time they have been held. Market conditions in a given year could result in a higher or lower portfolio turnover rate than expected and the Portfolios will not consider portfolio turnover rate a limiting factor in making investment decisions consistent with their investment objectives and policies. Higher portfolio turnover (e.g., over 100%) necessarily will cause the Portfolios to pay correspondingly increased brokerage and trading costs. In addition to transaction costs, higher portfolio turnover may result in the realization of capital gains. As discussed under "Tax
69
Considerations," to the extent net short-term capital gains are realized, any distributions resulting from such gains are considered ordinary income for federal income tax purposes.
GENERAL INFORMATION
Fund History
Morgan Stanley Institutional Fund Trust (formerly MAS Funds) is an open-end, management investment company established under Pennsylvania law as a Pennsylvania business trust under an Amended and Restated Agreement and Declaration of Trust dated November 18, 1993 as further Amended and Restated on August 24, 2006 (the "Declaration of Trust"). The Fund was originally established as The MAS Pooled Trust Fund, a Pennsylvania business trust, in February 1984. Each of the Portfolios are diversified. No portfolio of the Fund is subject to the liabilities of any other portfolio of the Fund.
Description of Shares and Voting Rights
The Declaration of Trust permits the Trustees to issue an unlimited number of shares of beneficial interest, without par value, from an unlimited number of series ("Portfolios") of shares. Currently, the Fund consists of seven Portfolios.
The shares of each Portfolio of the Fund are fully paid and non-assessable, except as set forth below, and have no preference as to conversion, exchange, dividends, retirement or other features. The shares of each Portfolio of the Fund have no preemptive rights. The shares of the Fund have non-cumulative voting rights, which means that the holders of more than 50% of the shares voting for the election of Trustees can elect 100% of the Trustees if they choose to do so. A shareholder of a class is entitled to one vote for each full class share held (and a fractional vote for each fractional class share held) in the shareholder's name on the books of the Fund. Shareholders of a class have exclusive voting rights regarding any matter submitted to shareholders that relates solely to that class of shares (such as a service agreement relating to that class), and separate voting rights on any other matter submitted to shareholders in which the interests of the shareholders of that class differ from the interests of holders of any other class.
Meetings of shareholders will not be held except as required by the 1940 Act and other applicable law. A meeting will be held to vote on the removal of a Trustee or Trustees of the Fund if requested in writing by the holders of not less than 10% of the outstanding shares of the Fund. The Fund will assist in shareholder communication in such matters to the extent required by law.
Dividends and Distributions
The Fund's policy is to distribute substantially all of each Portfolio's net investment income, if any, together with any net realized capital gains in the amount and at the times that will avoid both income (including capital gains) taxes on it and the imposition of the federal excise tax on undistributed income and capital gains. The amounts of any income dividends or capital gains distributions cannot be predicted.
Any dividend or distribution paid shortly after the purchase of shares of a Portfolio by an investor may have the effect of reducing the per share net asset value of that Portfolio by the per share amount of the dividend or distribution. Furthermore, such dividends or distributions, although in effect a return of capital, are subject to income taxes.
As set forth in the Prospectuses, unless the shareholder elects otherwise in writing, all dividends and capital gains distributions for a class of shares are automatically reinvested in additional shares of the same class of the Portfolio at net asset value (as of the business day following the record date). This automatic reinvestment of dividends and distributions will remain in effect until the shareholder notifies the Fund by telephone or in writing that either the Income Option (income dividends in cash and capital gain distributions reinvested in shares at net asset value) or the Cash Option (both income dividends and capital gains distributions in cash) has been elected. It may take up to three business days to effect this change. An account statement is sent to shareholders whenever a dividend or distribution is paid.
Each Portfolio of the Fund is treated as a separate entity (and hence, as a separate "regulated investment company") for federal tax purposes. Any net capital gains recognized by a Portfolio are distributed to its investors without need to offset (for federal income tax purposes) such gains against any net capital losses of another Portfolio.
70
In all Portfolios undistributed net investment income is included in the Portfolio's net assets for the purpose of calculating NAV. Therefore, on the ex-dividend date, the NAV excludes the dividend (i.e., is reduced by the per share amount of the dividend). Dividends paid shortly after the purchase of shares by an investor, although in effect a return of capital, are taxable as ordinary income.
Certain mortgage securities may provide for periodic or unscheduled payments of principal and interest as the mortgages underlying the securities are paid or prepaid. However, such principal payments (not otherwise characterized as original issue discount or bond premium expense) will not normally be considered as income to the Portfolio and therefore will not be distributed as dividends. Rather, these payments on mortgage-backed securities will be reinvested on your behalf by the Portfolio.
Shareholder and Trustee Liability
Under Pennsylvania law, shareholders of a trust such as the Fund may, under certain circumstances, be held personally liable as partners for the obligations of the trust. The Fund's Declaration of Trust contains an express disclaimer of shareholder liability for acts or obligations of the Fund and requires that notice of such disclaimer be given in each agreement, obligation, or instrument entered into or executed by the Fund or the Trustees, but this disclaimer may not be effective in some jurisdictions or as to certain types of claims. The Declaration of Trust further provides for indemnification out of the Fund's property of any shareholder held personally liable for the obligations of the Fund. The Declaration of Trust also provides that the Fund shall, upon request, assume the defense of any claim made against any shareholder for any act or obligation of the Fund and satisfy any judgment thereon. Thus, the risk of a shareholder incurring financial loss on account of shareholder liability is limited to circumstances in which the Fund itself would be unable to meet its obligations.
Pursuant to the Declaration of Trust, the Trustees may also authorize the creation of additional series of shares (the proceeds of which would be invested in separate, independently managed portfolios with distinct investment objectives and policies and share purchase, redemption and net asset valuation procedures) with such preferences, privileges, limitations and voting and dividend rights as the Trustees may determine. All consideration received by the Fund for shares of any additional series or class, and all assets in which such consideration is invested, would belong to that series or class (subject only to the rights of creditors of the Fund) and would be subject to the liabilities related thereto. Pursuant to the 1940 Act shareholders of any additional series or class of shares would normally have to approve the adoption of any advisory contract relating to such series or class and of any changes in the investment policies relating thereto.
The Declaration of Trust further provides that the Trustees will not be liable for errors of judgment or mistakes of fact or law, but nothing in the Declaration of Trust protects a Trustee against any liability to which he would otherwise be subject by reason of willful misfeasance, bad faith, gross negligence, or reckless disregard of the duties involved in the conduct of the office.
TAX CONSIDERATIONS
Each Portfolio generally will make two basic types of distributions: ordinary dividends and long-term capital gain distributions. These two types of distributions are reported differently on a shareholder's income tax return and they may be subject to different rates of tax. The tax treatment of the investment activities of a Portfolio will affect the amount, timing and character of distributions made by such Portfolio. The following discussion is only a summary of certain tax considerations generally affecting the Fund and shareholders of the Fund and is not intended as a substitute for careful tax planning. Tax issues relating to the Portfolios generally are not a consideration for shareholders that are tax-exempt entities and tax-advantaged retirement vehicles such as an IRA or 401(k) plan. Shareholders are urged to consult their own tax professionals regarding specific questions as to federal, state or local taxes.
Investment Company Taxation: Each Portfolio of the Fund is treated as a separate entity for federal income tax purposes and intends to continue to qualify for the special tax treatment afforded regulated investment companies under Subchapter M of the Code. As such, each Portfolio will not be subject to federal income tax to the extent it distributes net investment company taxable income and net capital gains to shareholders. The Fund will notify you annually as to the tax classification of all distributions. If a Portfolio fails to qualify for any taxable year
71
as a regulated investment company, all of its taxable income will be subject to tax at regular corporate income tax rates without any deduction for distributions to shareholders, and such distributions generally will be taxable to shareholders as ordinary dividends to the extent of the Portfolio's current and accumulated earnings and profits.
Each Portfolio intends to declare and pay dividends and capital gain distributions so as to avoid imposition of the federal excise tax. To do so, each Portfolio expects to distribute an amount at least equal to (i) 98% of its calendar year ordinary income, (ii) 98.2% of its capital gains net income for the one-year period ending October 31st, and (iii) 100% of any undistributed ordinary and capital gain net income from the prior year.
In order for a Portfolio to continue to qualify for federal income tax treatment as a regulated investment company, at least 90% of its gross income for a taxable year must be derived from qualifying income; i.e., dividends, interest, income derived from loans of securities, and gains from the sale or other disposition of stocks, securities or foreign currencies, or other income derived with respect to its business of investing in such stocks, securities or currencies. It is anticipated that any net gain realized from the closing out of futures contracts will be considered gain from the sale of securities and therefore be qualifying income for purposes of the 90% requirement. In addition, (i) a Portfolio must distribute annually to its shareholders at least the sum of 90% of its net tax-exempt interest income and 90% of its investment company taxable income; (ii) at the close of each quarter of a Portfolio's taxable year, at least 50% of its total assets must be represented by cash and cash items, U.S. government securities, securities of other regulated investment companies and such other securities with limitations; and (iii) at the close of each quarter of a Portfolio's taxable year, not more than 25% of the value of its assets may be invested in securities of any one issuer, or of two or more issuers engaged in same or similar businesses if the Portfolio owns at least 20% of the voting power of such issuers. Net income derived from an interest in a "qualified publicly traded partnership," as defined in the Code, will also be treated as qualifying income for purposes of the 90% gross income requirement described above. In addition, for the purposes of the diversification requirements in clause (iii) above, the outstanding voting securities of any issuer includes the equity securities of a qualified publicly traded partnership, and no more than 25% of the value of a regulated investment company's total assets may be invested in the securities of one or more qualified publicly traded partnerships. The Code also provides that the separate treatment for publicly traded partnerships under the passive loss rules of the Code applies to a regulated investment company holding an interest in a qualified publicly traded partnership, with respect to items attributable to such interest.
Each Portfolio of the Fund will distribute to shareholders annually any net capital gains which have been recognized for federal income tax purposes including unrealized gains at the end of the Portfolio's fiscal year on certain futures transactions. Such distributions will be combined with distributions of capital gains realized on the Portfolio's other investments and shareholders will be advised of the nature of the payments.
Gains or losses on the sale of securities by a Portfolio will be long-term capital gains or losses if the securities have a tax holding period of more than one year at the time of such sale. Gains or losses on the sale of securities with a tax holding period of one year or less will be short-term capital gains or losses. Special tax rules described below may change the normal treatment of gains and losses recognized by a Portfolio when a Portfolio makes certain types of investments. Those special tax rules can, among other things, affect the treatment of capital gain or loss as long-term or short-term and may result in ordinary income or loss rather than capital gain or loss. The application of these special rules would therefore also affect the character of distributions made by a Portfolio.
Some of the options, futures contracts, forward contracts, and swap contracts entered into by the Portfolios may be "Section 1256 contracts." Section 1256 contracts held by a Portfolio at the end of its taxable year (and, for purposes of the 4% excise tax, on certain other dates as prescribed under the Code) are "marked-to-market" with unrealized gains or losses treated as though they were realized. Any gains or losses, including "marked to market" gains or losses, on Section 1256 contracts other than forward contracts are generally 60% long-term and 40% short-term capital gains or losses ("60/40") although all foreign currency gains and losses from such contracts may be treated as ordinary in character absent a special election.
Generally, hedging transactions and certain other transactions in options, futures, forward contracts and swap contracts undertaken by a Portfolio, may result in "straddles" for U.S. federal income tax purposes. The straddle rules may affect the character of gain or loss realized by a Portfolio. In addition, losses realized by a Portfolio on positions that are part of a straddle may be deferred under the straddle rules, rather than being taken into account
72
in calculating the taxable income for the taxable year in which such losses are realized. Because only a few regulations implementing the straddle rules have been promulgated, the tax consequences of transactions in options, futures, forward contracts, and swap agreements to a Portfolio are not entirely clear. The transactions may increase the amount of short-term capital gain realized by a Portfolio. Short-term capital gain is taxed as ordinary income when distributed to shareholders.
A Portfolio may make one or more of the elections available under the Code which are applicable to straddles. If a Portfolio makes any of the elections, the amount, character, and timing of the recognition of gains or losses from the affected straddle positions will be determined under rules that vary according to the elections made. The rules applicable under certain of the elections operate to accelerate the recognition of gains or losses from the affected straddle positions.
Because application of the straddle rules may affect the character of gains or losses, defer losses and/or accelerate the recognition of gains or losses from the affected straddle positions, the amount which must be distributed to shareholders, and which will be taxed to shareholders as ordinary income or long-term capital gain, may be increased or decreased substantially as compared to a Portfolio that did not engage in such hedging transactions.
The Code provides constructive sales treatment for appreciated financial positions such as stock which has increased in value in the hands of a Portfolio. Under this constructive sales treatment, the Portfolio may be treated as having sold such stock and be required to recognize gain if it enters into a short sale, an offsetting notional principal contract, a futures or forward contract, or a similar transaction with respect to such stock or substantially identical property.
A Portfolio may make investments in which it recognizes income or gain prior to receiving cash with respect to such investment. For example, under certain tax rules, the Portfolio may be required to accrue a portion of any discount at which certain securities are purchased as income each year even though the Portfolio receives no payments in cash on the security during the year. To the extent that a Portfolio makes such investments, it generally would be required to pay out such income or gain as a distribution in each year to avoid taxation at the Portfolio level. Such distributions will be made from the available cash of the Portfolio or by liquidation of portfolio securities if necessary. If a distribution of cash necessitates the liquidation of portfolio securities, the Adviser will select which securities to sell. The Portfolio may realize a gain or loss from such sales. In the event a Portfolio realizes net capital gains from such transactions, its shareholders may receive a larger capital gain distribution, if any, than they would in the absence of such transactions.
Taxation of Dividends and Distributions. Shareholders normally will have to pay federal income taxes, and any state and/or local income taxes, on the dividends and other distributions they receive from a Portfolio. Such dividends and distributions, to the extent of the Portfolio's current and accumulated earnings and profits that are derived from net investment income or short-term capital gains, are taxable to the shareholder as ordinary income regardless of whether the shareholder receives such payments in additional shares or cash. If certain holding period requirements are met with respect to their shares in a Portfolio, a portion of income dividends received by a shareholder before January 1, 2013 may be taxed at the same rates as long-term capital gains. However, even if income received in the form of income dividends is taxed at the same rates as long-term capital gains, such income will not be considered long-term capital gains for other federal income tax purposes. For example, a shareholder generally will not be permitted to offset income dividends with capital losses. Short-term capital gain distributions will continue to be taxed at ordinary income rates.
Distributions by a Portfolio in excess of the Portfolio's current and accumulated earnings and profits will be treated as a return of capital to the extent of (and in reduction of) the shareholder's tax basis in his or her shares. Any such return of capital distributions in excess of the shareholder's tax basis will be treated as gain from the sale or exchange of his or her shares, as discussed below.
Distributions of net long-term capital gains, if any, are taxable to shareholders as long-term capital gains regardless of how long a shareholder has held a Portfolio's shares and regardless of whether the distribution is received in additional shares or in cash. The maximum tax rate on long-term capital gains available to non-corporate shareholders generally is 15%. However, the maximum tax rate on long-term capital gains will return to 20% in 2013, and all dividends will be taxed at ordinary income rates.
73
Shareholders generally are taxed on any ordinary dividend or capital gain distributions from a Portfolio in the year they are actually distributed. However, if any such dividends or distributions are declared in October, November or December to shareholders of record of such month and paid in January, then such amounts will be treated for tax purposes as received by the shareholders on December 31.
After the end of each calendar year, shareholders will be sent information on their dividends and capital gain distributions for tax purposes, including the portion taxable as ordinary income, the portion taxable as long-term capital gains, and the amount of any dividends eligible for the federal dividends received deduction for corporations.
Shareholders who are not citizens or residents of the United States and certain foreign entities may be subject to withholding of United States tax on distributions made by a Portfolio of investment income and short-term capital gains at a rate of 30% (or a lower tax treaty rate, if applicable). Such shareholders may also be subject to United States estate tax with respect to their shares.
The Fund will be required to withhold U.S. federal withholding taxes (at 30%) from certain "withholdable payments" made to a non-U.S. shareholder (other than a individual) after 2014, unless the non-U.S. shareholder complies with certain U.S. tax reporting (and, in some cases, withholding) requirements (generally relating to the entity's U.S. owners or account holders, if any) or otherwise qualifies for an exemption from such withholding. Withholdable payments generally will include interest (including original issue discount), dividends, rents, annuities, and other fixed or determinable annual or periodical gains, profits or income, if such payments are derived from U.S. sources, as well as gross proceeds from dispositions of securities that could produce U.S. source interest or dividends. Income which is effectively connected with the conduct of a U.S. trade or business, is not, however, included in this definition.
For distributions with respect to taxable years of regulated investment companies beginning before January 1, 2012 a Portfolio is not required to withhold any amounts with respect to distributions to foreign shareholders that are properly designated by the Portfolio as "interest-related dividends" or "short-term capital gain dividends," provided that the income would not be subject to federal income tax if earned directly by the foreign shareholder. Unless the provisions discussed above are extended or made permanent by Congress, distributions made by a Portfolio of investment income and short-term capital gains in taxable years beginning on or after January 1, 2012 will be treated like other distributions and may be subject to U.S. tax and withholding like regular distributions. Prospective investors are urged to consult their tax advisors regarding the specific tax consequences of these distributions. Further, even if the provisions are extended, there may be withholding on a portion of distributions by a Portfolio. In addition, a Portfolio may determine to not make designations of interest-related dividends of short-term capital gain dividends which would result in increased withholding on distributions by such a Portfolio.
Although income received on direct U.S. Government obligations is taxable at the federal level, such income may be exempt from state tax, depending on the state, when received by a shareholder. Each Portfolio will inform shareholders annually of the percentage of income and distributions derived from direct U.S. Government obligations. Shareholders should consult their tax advisors to determine whether any portion of dividends received from the Portfolio is considered tax exempt in their particular states.
Purchases, Redemptions and Exchanges of Portfolio Shares. Any dividend or capital gains distributions received by a shareholder from any regulated investment company will have the effect of reducing the net asset value of the shareholder's stock in that company by the exact amount of the dividend or capital gains distribution. Furthermore, such dividends and capital gains distributions are subject to federal income taxes. If the net asset value of the shares should be reduced below a shareholder's cost as a result of the payment of dividends or the distribution of realized long-term capital gains, such payment or distributions would be in part a return of the shareholder's investment but nonetheless would be taxable to the shareholder. Therefore, an investor should consider the tax implications of purchasing Portfolio shares immediately prior to a distribution record date. Any gain or loss recognized on a sale or redemption of shares of a Portfolio by a shareholder who is not a dealer in securities will generally be treated as long-term capital gain or loss if the shares have been held for more than one year and short-term if for one year or less. Generally, for non-corporate shareholders, long-term capital gains are taxed at a maximum rate of 15% and short-term gains are currently taxed at ordinary income tax rates. The maximum rate on long-term capital gains is scheduled to return to 20% for taxable years beginning after
74
December 31, 2012. If shares held for six months or less are sold or redeemed for a loss, two special rules apply: first, if shares on which a net capital gain distribution has been received are subsequently sold or redeemed, and such shares have been held for six months or less, any loss recognized will be treated as long-term capital loss to the extent of the long-term capital gain distributions. Second, any loss recognized by a shareholder upon the sale or redemption of shares of a municipal Portfolio fund held for six months or less will be disallowed to the extent of any exempt-interest dividends received by the Shareholder with respect to such shares.
Gain or loss on the sale or redemption of shares of a Portfolio is measured by the difference between the amount received and the tax basis of the shares. Shareholders should keep records of investments made (including shares acquired through reinvestment of dividends and distributions) so they can compute the tax basis of their shares. Under certain circumstances a shareholder may compute and use an average cost basis in determining the gain or loss on the sale or redemption of shares.
Due to recent legislation, a Portfolio (or its administrative agent) is required to report to the Internal Revenue Service and furnish to Portfolio shareholders the cost basis information for sale transactions of shares purchased on or after January 1, 2012. Shareholders may elect to have one of several cost basis methods applied to their account when calculating the cost basis of shares sold, including average cost, FIFO ("first-in, first-out"), or some other specific identification method. Unless you instruct otherwise, a Portfolio will use average cost as its default cost basis method, and will treat sales as first coming from shares purchased prior to January 1, 2012. If average cost is used for the first sale of Portfolio shares covered by these new rules, the shareholder may only use an alternative cost basis method for shares purchased prospectively. Portfolio shareholders should consult with their tax advisors to determine the best cost basis method for their tax situation.
Exchanges of shares of a Portfolio for shares of another Portfolio are also subject to similar tax treatment. Such an exchange is treated for tax purposes as a sale of the original shares in the first Portfolio, followed by the purchase of shares in the second Portfolio.
If a shareholder realizes a loss on the redemption or exchange of a Portfolio's shares and reinvests in substantially similar shares within 30 days before or after the redemption or exchange, the transactions may be subject to the "wash sale" rules, resulting in a postponement of the recognition of such loss for tax purposes. The ability to otherwise deduct capital losses may be subject to other limitations.
Shareholders who are not citizens or residents of the United States and certain foreign entities that realize gain upon the sale or exchange of shares of a Portfolio will ordinarily be exempt from federal withholding tax unless: (i) in the case of a shareholder that is a nonresident alien individual, the gain is U.S. source income and such stockholder is physically present in the United States for more than 182 days during the taxable year and meets certain other requirements, or (ii) at any time during a testing period described in the Code, the Portfolio was a "U.S. real property holding corporation," as defined in the Code and Treasury Regulations, and the foreign shareholder actually or constructively held more than 5% of the shares of the same class, the gain would be taxed in the same manner as for a U.S. shareholder as discussed above. A 10% federal withholding tax generally would be imposed on the amount realized on the disposition of such shares and credited against the foreign shareholder's federal income tax liability on such disposition. However, for tax years beginning before January 1, 2012 (or a later date if extended by Congress), clause (ii) above will not apply if at all times during the testing period the value of the shares of a Portfolio is owned 50% or more by U.S. persons. Prospective investors are urged to consult their tax advisors regarding the specific tax consequences relating to the legislation. When you open your Fund account, you must certify on your Account Registration Form that your Social Security Number or Taxpayer Identification Number is correct, and that you are not subject to backup withholding. By providing this information, you will avoid being subject to federal backup withholding at a rate of 28% (as of the date of this SAI) on taxable distributions and redemption proceeds. Any withheld amount would be sent to the IRS as an advance of your taxes due on your income for such year.
Foreign Income Taxes: Investment income received by the Portfolios from sources within foreign countries may be subject to foreign income taxes withheld at the source. The United States has entered into tax treaties with many foreign countries which would entitle the Portfolios to a reduced rate of tax or exemption from tax on such income. It is impossible to determine the effective rate of foreign tax in advance since the amount of the Portfolios'
75
assets to be invested within various countries is not known. The Portfolios intend to operate so as to qualify for treaty-reduced rates of tax where applicable.
If at the end of a Portfolio's year, more than 50% of a Portfolio's assets are represented by foreign securities, then such Portfolio may file an election with the IRS to pass through to shareholders the amount of foreign income taxes paid by such Portfolio. A Portfolio will make such an election only if it is deemed to be in the best interests of such shareholders.
If a Portfolio makes the above-described election, the Portfolio will not be allowed a deduction or a credit for foreign taxes it paid and the amount of such taxes will be treated as a dividend paid by the Portfolio. The shareholders of the Portfolios will be required to: (i) include in gross income, even though not actually received, their respective pro rata share of foreign taxes paid by the Portfolio; (ii) treat their pro rata share of foreign taxes as paid by them; (iii) treat as gross income from sources within the respective foreign countries, for purposes of the foreign tax credit, their pro rata share of such foreign taxes and their pro rata share of any dividend paid by the Portfolio which represents income from sources within foreign countries; and (iv) either deduct their pro rata share of foreign taxes in computing their taxable income or use it within the limitations set forth in the Code as a foreign tax credit against U.S. income taxes (but not both). In no event shall a shareholder be allowed a foreign tax credit if the shareholder holds shares in a Portfolio for 15 days or less during the 31-day period beginning on the date which is 15 days before the date on which such shares become ex-dividend with respect to such dividends.
Each shareholder of a Portfolio will be notified if the foreign taxes paid by the Portfolio will pass through for that year, and, if so, the amount of each shareholder's pro rata share (by country) of (i) the foreign taxes paid, and (ii) the Portfolio's gross income from foreign sources. The notice from the Portfolio to shareholders will also include the amount of foreign taxes paid by the Portfolio which are not allowable as a foreign tax credit because the Portfolio did not hold the foreign securities for more than 15 days during the 31-day period beginning on the date which is 15 days before the date on which the security becomes ex-dividend with respect to the foreign source dividend or because, and to the extent that, the recipient of the dividend is under an obligation to make related payments with respect to positions in substantially similar or related property. Shareholders who are not liable for federal income taxes, such as retirement plans qualified under Section 401 of the Code, will not be affected by any such "pass-through" of foreign tax credits.
State and Local Income Taxes: The Fund is not liable for any corporate income or franchise tax in the Commonwealth of Pennsylvania. Shareholders should consult their tax advisors for the state and local income tax consequences of distributions from the Portfolios.
PRINCIPAL HOLDERS OF SECURITIES
As of January 3, 2011, the following persons or entities own, of record or beneficially, more than 5% of the shares of any Class of the following Portfolios' outstanding shares.
CLASS I
| Portfolio | Name and Address | % of Class | |||||||||
| Balanced | Morgan Stanley & Co One Lincoln Plaza New York NY 10023-7129 | 27.62 | |||||||||
| Balanced | Wells Fargo Bank NA PO Box 1533 Minneapolis MN 55480-1533 | 22.16 | |||||||||
| Balanced | Kano Profit Sharing Plan PO Box 110098 Nashville, TN 37222-0098 | 21.38 | |||||||||
| Balanced | People's Light & Theater Co 39 Conestoga Rd. Malvern PA 19355-1737 | 5.57 | |||||||||
76
| Portfolio | Name and Address | % of Class | |||||||||
| Core Fixed Income | Morgan Stanley & Co Harborside Financial Center Plaza II, 3rd Floor Jersey City NJ 07311 | 96.73 | |||||||||
| Core Plus Fixed Income | Morgan Stanley & Co Harborside Financial Center Plaza II, 3rd Floor Jersey City NJ 07311 | 39.57 | |||||||||
| Core Plus Fixed Income | Fidelity Investments Institutional Operations 100 Magellan Way KWIC Covington KY 41015-1999 | 29.31 | |||||||||
| Core Plus Fixed Income | National Financial Services Corp FBO Their Customers Church Street Station New York NY 10008-3908 | 12.10 | |||||||||
| Core Plus Fixed Income | AK Steek Corp Master Pension Trust 9227 Centre Pointe Drive West Chester OH 45069-4822 | 8.09 | |||||||||
| Corporate Bond | Morgan Stanley & Co Harborside Financial Center Plaza II, 3rd Floor Jersey City NJ 07311 | 82.51 | |||||||||
| Corporate Bond | LPL Financial 9785 Towne Centre Dr. San Diego CA 92121-1968 | 5.30 | |||||||||
| Limited Duration | Morgan Stanley & Co Harborside Financial Center Plaza II, 3rd Floor Jersey City NJ 07311 | 95.47 | |||||||||
| Long Duration Fixed Income | Morgan Stanley Investment Management One Tower Bridge 100 Front Street West Conshohocken PA 19428-2800 | 99.75 | |||||||||
| Mid Cap Growth | Fidelity Investments Institutional Operations 100 Magellan Way KWIC Covington KY 41015-1999 | 42.90 | |||||||||
| Mid Cap Growth | Charles Schwab & Co Inc. 101 Montgomery St San Francisco CA 94104-4151 | 7.09 | |||||||||
CLASS P
| Portfolio | Name and Address | % of Class | |||||||||
| Balanced | Fidelity Investments Institutional Operations 100 Magellan Way KWIC Covington KY 41015-1999 | 96.45 | |||||||||
| Core Fixed Income | Morgan Stanley & Co Harborside Financial Center Plaza II, 3rd Floor Jersey City NJ 07311 | 88.26 | |||||||||
| Core Fixed Income | National Financial Services LLC 200 Liberty St. New York, NY 10281-1003 | 11.74 | |||||||||
77
| Portfolio | Name and Address | % of Class | |||||||||
| Core Plus Fixed Income | Morgan Stanley & Co Harborside Financial Center Plaza II, 3rd Floor Jersey City NJ 07311 | 27.65 | |||||||||
| Core Plus Fixed Income | Reliance Trust Company 8515 East Orchard Road 2T2 Greenwood VLG CO 80111-5002 | 25.78 | |||||||||
| Core Plus Fixed Income | Morgan Stanley & Co 1035 Park Ave New York NY 10038-0912 | 14.72 | |||||||||
| Core Plus Fixed Income | Fidelity Investments Institutional Operations 100 Magellan Way KWIC Covington KY 41015-1999 | 13.21 | |||||||||
| Core Plus Fixed Income | Morgan Stanley & Co 3402 Mount Bonnell Rd Austin, TX 78731-5850 | 11.14 | |||||||||
| Corporate Bond | Morgan Stanley & Co Harborside Financial Center Plaza II, 3rd Floor Jersey City NJ 07311 | 75.81 | |||||||||
| Corporate Bond | Morgan Stanley & Co 1270 6th Avenue Suite 1817 New York NY 10020-1702 | 13.16 | |||||||||
| Corporate Bond | Kaye Associates Inc 4 New York Plaza 4th Fl New York NY 10004-2413 | 8.76 | |||||||||
| Limited Duration | Morgan Stanley & Co Harborside Financial Center Plaza II, 3rd Floor Jersey City NJ 07311 | 100.00 | |||||||||
| Long Duration Fixed Income | Morgan Stanley Investment Management Attn Lawrence Markey One Tower Bridge 100 Front Street West Conshohocken PA 19428-2800 | 100.00 | |||||||||
| Mid Cap Growth | Fidelity Investments Institutional Operations 100 Magellan Way KWIC Covington KY 41015-1999 | 45.21 | |||||||||
| Mid Cap Growth | National Financial Services Corp One World Financial Center, 5th Floor New York NY 10281-1003 | 15.55 | |||||||||
| Mid Cap Growth | Charles Schwab & Co Inc 101 Montgomery St San Francisco CA 94104-4151 | 7.90 | |||||||||
| Mid Cap Growth | Wells Fargo Bank NA 1525 West WT Harris Blvd Charlotte NC 28288-1076 | 5.01 | |||||||||
CLASS H
| Portfolio | Name and Address | % of Class | |||||||||
| Corporate Bond | Morgan Stanley Investment Management One Tower Bridge 100 Front Street West Conshohocken PA 19428-2800 | 55.11 | |||||||||
78
| Portfolio | Name and Address | % of Class | |||||||||
| Corporate Bond | Morgan Stanley & Co Harborside Financial Center Plaza II 3rd Floor Jersey City NJ 07311 | 44.89 | |||||||||
CLASS L
| Portfolio | Name and Address | % of Class | |||||||||
| Corporate Bond | Morgan Stanley & Co Harborside Financial Center Plaza II 3rd Floor Jersey City NJ 07311 | 92.70 | |||||||||
| Corporate Bond | Morgan Stanley Smith Barney 700 Red Brook Blvd Owings Mills MD 21117-5184 | 6.45 | |||||||||
The persons listed above as owning 25% or more of the outstanding shares of a Portfolio may be presumed to "control" (as that term is defined in the 1940 Act) such Portfolio. As a result, those persons would have the ability to vote a majority of the shares of the respective Portfolio on any matter requiring the approval of shareholders of such Portfolio.
PERFORMANCE INFORMATION
The average annual total return (cumulative return shown for periods less than one year) of Class I shares of each Portfolio for the periods noted is set forth below:
| Portfolio | 1 Year Return 09/30/11 | 5 Years ended 09/30/11 | 10 Years ended 09/30/11 | Inception to 09/30/11 | Date of inception of Class | ||||||||||||||||||
| Balanced | 1.07 | % | 2.46 | % | 4.37 | % | 6.89 | % | 12/31/1992 | ||||||||||||||
| Core Fixed Income | 4.34 | % | 3.26 | % | 4.13 | % | 7.01 | % | 09/29/1987 | ||||||||||||||
| Core Plus Fixed Income | 3.74 | % | 2.26 | % | 3.75 | % | 7.62 | % | 11/14/1984 | ||||||||||||||
| Corporate Bond | 4.05 | % | 2.91 | % | 3.98 | % | 6.57 | % | 08/31/1990 | ||||||||||||||
| Limited Duration | 0.71 | % | -1.79 | % | 0.53 | % | 3.27 | % | 03/31/1992 | ||||||||||||||
| Long Duration Fixed Income | 11.40 | % | 9.86 | % | N/A | 10.47 | % | 07/21/2006 | |||||||||||||||
| Mid Cap Growth | 0.47 | % | 6.21 | % | 8.69 | % | 12.57 | % | 03/30/1990 | ||||||||||||||
The average annual total return (cumulative return for periods less than one year) of Class P shares of each Portfolio for the periods noted is set forth below:
| Portfolio | 1 Year Return 09/30/11 | 5 Years ended 09/30/11 | 10 Years ended 09/30/11 | Inception to 09/30/11 | Date of inception of Class | ||||||||||||||||||
| Balanced | 0.83 | % | 2.19 | % | 4.11 | % | 5.39 | % | 11/01/1996 | ||||||||||||||
| Core Fixed Income | 4.11 | % | 3.03 | % | 3.89 | % | 4.53 | % | 03/01/1999 | ||||||||||||||
| Core Plus Fixed Income | 3.57 | % | 2.01 | % | 3.49 | % | 4.64 | % | 11/07/1996 | ||||||||||||||
| Corporate Bond | 3.99 | % | 2.76 | % | N/A | 3.74 | % | 05/20/2002 | |||||||||||||||
| Limited Duration | 0.45 | % | N/A | N/A | -3.48 | % | 09/28/2007 | ||||||||||||||||
| Long Duration Fixed Income | 11.13 | % | 9.58 | % | N/A | 10.19 | % | 07/21/2006 | |||||||||||||||
| Mid Cap Growth | 0.22 | % | 5.94 | % | 8.42 | % | 9.28 | % | 01/31/1997 | ||||||||||||||
79
The average annual total return (cumulative return for periods less than one year) of Class H shares of the Corporate Bond Portfolio for the periods noted is set forth below:
| Portfolio | 1 Year Return 09/30/11 | 5 Years ended 09/30/11 | 10 Years ended 09/30/11 | Inception to 09/30/11 | Date of inception of Class | ||||||||||||||||||
| Corporate Bond | 3.89 | % | N/A | N/A | 1.26 | % | 01/02/2008 | ||||||||||||||||
The average annual total return, inclusive of a maximum sales charge of 3.50%, (cumulative return for periods less than one year) of Class H shares of the Corporate Bond Portfolio for the periods noted is set forth below:
| Portfolio | 1 Year Return 09/30/11 | 5 Years ended 09/30/11 | 10 Years ended 09/30/11 | Inception to 09/30/11 | Date of inception of Class | ||||||||||||||||||
| Corporate Bond | 0.24 | % | N/A | N/A | 0.31 | % | 01/02/2008 | ||||||||||||||||
The average annual total return (cumulative return for periods less than one year) of Class L shares of the Corporate Bond Portfolio for the periods noted is set forth below:
| Portfolio | 1 Year Return 09/30/11 | 5 Years ended 09/30/11 | 10 Years ended 09/30/11 | Inception to 09/30/11 | Date of inception of Class | ||||||||||||||||||
| Corporate Bond | 3.51 | % | N/A | N/A | 4.12 | % | 06/16/2008 | ||||||||||||||||
The average annual total return (after taxes on distributions) of Class I shares of each Portfolio for the periods noted is set forth below (cumulative returns for periods less than one year):
| Portfolio | 1 Year Return 09/30/11 | 5 Years ended 09/30/11 | 10 Years ended 09/30/11 | Inception to 09/30/11 | Date of inception of Class | ||||||||||||||||||
| Balanced | 0.60 | % | 1.69 | % | 3.54 | % | 4.94 | % | 12/31/1992 | ||||||||||||||
| Core Fixed Income | 3.23 | % | 1.62 | % | 2.29 | % | 4.54 | % | 09/29/1987 | ||||||||||||||
| Core Plus Fixed Income | 2.27 | % | 0.41 | % | 1.76 | % | 4.78 | % | 11/14/1984 | ||||||||||||||
| Corporate Bond | 2.97 | % | 1.26 | % | 2.20 | % | 4.20 | % | 08/31/1990 | ||||||||||||||
| Limited Duration | 0.10 | % | -3.17 | % | -0.78 | % | 1.53 | % | 03/31/1992 | ||||||||||||||
| Long Duration Fixed Income | 8.44 | % | 7.63 | % | N/A | 8.31 | % | 07/21/2006 | |||||||||||||||
| Mid Cap Growth | 0.43 | % | 6.17 | % | 8.67 | % | 10.65 | % | 03/30/1990 | ||||||||||||||
The average annual total return (after taxes on distributions and redemption) of Class I shares of each Portfolio for the periods noted is set forth below (cumulative return for periods less than one year):
| Portfolio | 1 Year Return 09/30/11 | 5 Years ended 09/30/11 | 10 Years ended 09/30/11 | Inception to 09/30/11 | Date of inception of Class | ||||||||||||||||||
| Balanced | 0.79 | % | 1.71 | % | 3.32 | % | 4.89 | % | 12/31/1992 | ||||||||||||||
| Core Fixed Income | 2.79 | % | 1.80 | % | 2.42 | % | 4.56 | % | 09/29/1987 | ||||||||||||||
| Core Plus Fixed Income | 2.40 | % | 0.82 | % | 2.00 | % | 4.84 | % | 11/14/1984 | ||||||||||||||
| Corporate Bond | 2.61 | % | 1.49 | % | 2.33 | % | 4.21 | % | 08/31/1990 | ||||||||||||||
| Limited Duration | 0.46 | % | -2.28 | % | -0.28 | % | 1.75 | % | 03/31/1992 | ||||||||||||||
| Long Duration Fixed Income | 7.64 | % | 7.21 | % | N/A | 7.80 | % | 07/21/2006 | |||||||||||||||
| Mid Cap Growth | 0.37 | % | 5.37 | % | 7.73 | % | 10.23 | % | 03/30/1990 | ||||||||||||||
The aggregate total return of each Portfolio for the periods noted is set forth below. One year aggregate total return figures are reflected under the average annual total return figures provided above.
80
| Portfolio | 5 Years ended 09/30/11* | 10 Years ended 09/30/11* | Inception to 09/30/11* | Date of inception of Class | |||||||||||||||
| Balanced | 12.93 | % | 53.36 | % | 248.77 | % | 12/31/1992 | ||||||||||||
| Core Fixed Income | 17.39 | % | 49.82 | % | 408.99 | % | 09/29/1987 | ||||||||||||
| Core Plus Fixed Income | 11.81 | % | 44.48 | % | 620.41 | % | 11/14/1984 | ||||||||||||
| Corporate Bond | 15.40 | % | 47.67 | % | 282.56 | % | 08/31/1990 | ||||||||||||
| Limited Duration | -8.63 | % | 5.43 | % | 87.18 | % | 03/31/1992 | ||||||||||||
| Long Duration Fixed Income | 60.02 | % | N/A | 67.71 | % | 07/21/2006 | |||||||||||||
| Mid Cap Growth | 35.17 | % | 130.15 | % | 1175.84 | % | 03/30/1990 | ||||||||||||
* The above performance information relates solely to Class I. Performance for Class P would be lower because of the shareholder servicing fees charged to Class P. Performance for Class H would be lower because of the sales charge and shareholder servicing fees charged to Class H. Performance for Class L would be lower because of the distribution fees and shareholder servicing fees charged to Class L. Prior to June 30, 2009, transfer agency fees with respect to Class H and Class L were allocated on a class-by-class basis. Effective July 1, 2009, transfer agency fees are allocated by asset size across all classes of a Portfolio.
The 30-day yield figures for each of the Fund's Fixed Income Portfolios is set forth below:
| Class I Portfolios | Period Ending 09/30/11 | ||||||
| Core Fixed Income | 4.99 | % | |||||
| Core Plus Fixed Income | 6.52 | % | |||||
| Corporate Bond | 4.83 | % | |||||
| Limited Duration | 1.72 | % | |||||
| Long Duration Fixed Income | 3.99 | % | |||||
| Balanced | 1.96 | % | |||||
| Class P Portfolios | Period Ending 09/30/11 | ||||||
| Core Fixed Income | 4.73 | % | |||||
| Core Plus Fixed Income | 6.26 | % | |||||
| Corporate Bond | 4.68 | % | |||||
| Limited Duration | 1.47 | % | |||||
| Long Duration Fixed Income | 3.75 | % | |||||
| Balanced | 1.71 | % | |||||
| Class H Portfolio | Period Ending 09/30/11 | ||||||
| Corporate Bond | 4.42 | % | |||||
| Class L Portfolio | Period Ending 09/30/11 | ||||||
| Corporate Bond | 4.33 | % | |||||
FINANCIAL STATEMENTS
The Fund's audited financial statements for the fiscal year ended September 30, 2011, including notes thereto, and the report of Ernst & Young LLP, an independent registered public accounting firm, are herein incorporated by reference to the Fund's Annual Report to Shareholders. A copy of the Fund's Annual Report to Shareholders must accompany the delivery of this SAI.
81
APPENDIX A
MORGAN STANLEY INVESTMENT MANAGEMENT
PROXY VOTING POLICY AND PROCEDURES
I. POLICY STATEMENT
Morgan Stanley Investment Management's ("MSIM") policy and procedures for voting proxies ("Policy") with respect to securities held in the accounts of clients applies to those MSIM entities that provide discretionary investment management services and for which an MSIM entity has authority to vote proxies. This Policy is reviewed and updated as necessary to address new and evolving proxy voting issues and standards.
The MSIM entities covered by this Policy currently include the following: Morgan Stanley AIP GP LP, Morgan Stanley Investment Management Inc., Morgan Stanley Investment Management Limited, Morgan Stanley Investment Management Company, Morgan Stanley Asset & Investment Trust Management Co., Limited, Morgan Stanley Investment Management Private Limited and Private Investment Partners Inc. (each an "MSIM Affiliate" and collectively referred to as the "MSIM Affiliates" or as "we" below).
Each MSIM Affiliate will use its best efforts to vote proxies as part of its authority to manage, acquire and dispose of account assets. With respect to the MSIM registered management investment companies (the "MSIM Funds"), each MSIM Affiliate will vote proxies under this Policy pursuant to authority granted under its applicable investment advisory agreement or, in the absence of such authority, as authorized by the Board of Directors/Trustees of the MSIM Funds. A MSIM Affiliate will not vote proxies unless the investment management or investment advisory agreement explicitly authorizes the MSIM Affiliate to vote proxies. MSIM Affiliates will vote proxies in a prudent and diligent manner and in the best interests of clients, including beneficiaries of and participants in a client's benefit plan(s) for which the MSIM Affiliates manage assets, consistent with the objective of maximizing long-term investment returns ("Client Proxy Standard"). In certain situations, a client or its fiduciary may provide an MSIM Affiliate with a proxy voting policy. In these situations, the MSIM Affiliate will comply with the client's policy.
Proxy Research Services—ISS Governance Services ("ISS") and Glass Lewis (together with other proxy research providers as we may retain from time to time, the "Research Providers") are independent advisers that specialize in providing a variety of fiduciary-level proxy-related services to institutional investment managers, plan sponsors, custodians, consultants, and other institutional investors. The services provided include in-depth research, global issuer analysis, and voting recommendations. While we may review and utilize the recommendations of one or more Research Providers in making proxy voting decisions, we are in no way obligated to follow such recommendations. In addition to research, ISS provides vote execution, reporting, and recordkeeping services.
Voting Proxies for Certain Non-U.S. Companies—Voting proxies of companies located in some jurisdictions may involve several problems that can restrict or prevent the ability to vote such proxies or entail significant costs. These problems include, but are not limited to: (i) proxy statements and ballots being written in a language other than English; (ii) untimely and/or inadequate notice of shareholder meetings; (iii) restrictions on the ability of holders outside the issuer's jurisdiction of organization to exercise votes; (iv) requirements to vote proxies in person; (v) the imposition of restrictions on the sale of the securities for a period of time in proximity to the shareholder meeting; and (vi) requirements to provide local agents with power of attorney to facilitate our voting instructions. As a result, we vote clients' non-U.S. proxies on a best efforts basis only, after weighing the costs and benefits of voting such proxies, consistent with the Client Proxy Standard. ISS has been retained to provide assistance in connection with voting non-U.S. proxies.
II. GENERAL PROXY VOTING GUIDELINES
To promotes consistency in voting proxies on behalf of its clients, we follow this Policy (subject to any exception set forth herein). The Policy addresses a broad range of issues, and provides general voting parameters on proposals that arise most frequently. However, details of specific proposals vary, and those details affect particular voting decisions, as do factors specific to a given company. Pursuant to the procedures set forth herein, we may vote in a manner that is not in accordance with the following general guidelines, provided the vote is approved by the Proxy Review Committee (see Section III for description) and is consistent with the Client Proxy Standard. Morgan Stanley AIP GP LP will follow the procedures as described in Appendix A.
A-1
We endeavor to integrate governance and proxy voting policy with investment goals, using the vote to encourage portfolio companies to enhance long-term shareholder value and to provide a high standard of transparency such that equity markets can value corporate assets appropriately.
We seek to follow the Client Proxy Standard for each client. At times, this may result in split votes, for example when different clients have varying economic interests in the outcome of a particular voting matter (such as a case in which varied ownership interests in two companies involved in a merger result in different stakes in the outcome). We also may split votes at times based on differing views of portfolio managers.
We may abstain on matters for which disclosure is inadequate.
A. Routine Matters.
We generally support routine management proposals. The following are examples of routine management proposals:
• Approval of financial statements and auditor reports if delivered with an unqualified auditor's opinion.
• General updating/corrective amendments to the charter, articles of association or bylaws, unless we believe that such amendments would diminish shareholder rights.
• Most proposals related to the conduct of the annual meeting, with the following exceptions. We generally oppose proposals that relate to "the transaction of such other business which may come before the meeting," and open-ended requests for adjournment. However, where management specifically states the reason for requesting an adjournment and the requested adjournment would facilitate passage of a proposal that would otherwise be supported under this Policy (i.e. an uncontested corporate transaction), the adjournment request will be supported.
We generally support shareholder proposals advocating confidential voting procedures and independent tabulation of voting results.
B. Board of Directors.
1. Election of directors: Votes on board nominees can involve balancing a variety of considerations. In vote decisions, we may take into consideration whether the company has a majority voting policy in place that we believe makes the director vote more meaningful. In the absence of a proxy contest, we generally support the board's nominees for director except as follows:
a. We consider withholding support from or voting against a nominee if we believe a direct conflict exists between the interests of the nominee and the public shareholders, including failure to meet fiduciary standards of care and/or loyalty. We may oppose directors where we conclude that actions of directors are unlawful, unethical or negligent. We consider opposing individual board members or an entire slate if we believe the board is entrenched and/or dealing inadequately with performance problems; if we believe the board is acting with insufficient independence between the board and management; or if we believe the board has not been sufficiently forthcoming with information on key governance or other material matters.
b. We consider witholding support from or voting against interested directors if the company's board does not meet market standards for director independence, or if otherwise we believe board independence is insufficient. We refer to prevalent market standards as promulgated by a stock exchange or other authority within a given market (e.g., New York Stock Exchange or Nasdaq rules for most U.S. companies, and The Combined Code on Corporate Governance in the United Kingdom). Thus, for an NYSE company with no controlling shareholder, we would expect that at a minimum a majority of directors should be independent as defined by NYSE. Where we view market standards as inadequate, we may withhold votes based on stronger independence standards. Market standards notwithstanding, we generally do not view long board tenure alone as a basis to classify a director as non-independent.
i. At a company with a shareholder or group that controls the company by virtue of a majority economic interest in the company, we have a reduced expectation for board independence, although we believe the presence of independent directors can be helpful, particularly in staffing the audit committee, and at times we may withhold support from or vote against a nominee on the view the
A-2
board or its committees are not sufficiently independent. In markets where board independence is not the norm (e.g. Japan), however, we consider factors including whether a board of a controlled company includes independent members who can be expected to look out for interests of minority holders.
ii. We consider withholding support from or voting against a nominee if he or she is affiliated with a major shareholder that has representation on a board disproportionate to its economic interest.
c. Depending on market standards, we consider withholding support from or voting against a nominee who is interested and who is standing for election as a member of the company's compensation/renumeration, nominating/governance or audit committee.
d. We consider withholding support or voting against nominees if the term for which they are nominated is excessive. We consider this issue on a market-specific basis.
e. We consider withholding support from or voting against nominees if, in our view, there has been insufficient board renewal (turnover0, particularly in the context of extended poor company performance.
f. We consider withholding support from or voting against a nominee standing for election if the board has not taken action to implement generally accepted governance practices for which there is a "bright line" test. For example, in the context of the U.S. market, failure to eliminate a dead hand or slow hand poison pill would be seen as a basis for opposing one or more incumbent nominees.
g. In markets that encourage designated audit committee financial experts, we consider voting against members of an audit committee if no members are designated as such. We also may not support the audit committee members if the company has faced financial reporting issues and/or does not put the auditor up for ratification by shareholders.
h. We believe investors should have the ability to vote on individual nominees, and may abstain or vote against a slate of nominees where we are not given the opportunity to vote on individual nominees.
i. We consider withholding support from or voting against a nominee who has failed to attend at least 75% of the nominee's board and board committee meetings within a given year without a reasonable excuse. We also consider opposing nominees if the company does not meet market standards for disclosure on attendance.
j. We consider withholding support from or voting against a nominee who appears overcommitted, particularly through service on an excessive number of boards. Market expectations are incorporated into this analysis; for U.S. boards, we generally oppose election of a nominee who serves on more than six public company boards (excluding investment companies), although we may reference National Association of Corporate Directors guidance suggesting that public company CEOs, for example, should serve no more than two outside boards given the level of time commitment required in their primary job.
2. Discharge of directors' duties: In markets where an annual discharge of directors' responsibility is a routine agenda item, we generally support such discharge. However, we may vote against discharge or abstain from voting where there are serious findings of fraud or other unethical behavior for which the individual bears responsibility. The annual discharge of responsibility represents shareholder approval of disclosed actions taken by the board during the year and may make future shareholder action against the board difficult to pursue.
3. Board independence: We generally support U.S. shareholder proposals requiring that a certain percentage (up to 66 2/3%) of the company's board members be independent directors, and promoting all-independent audit, compensation and nominating/governance committees.
4. Board diversity: We consider on a case-by-case basis shareholder proposals urging diversity of board membership with respect to social, religious or ethnic group.
5. Majority voting: We generally support proposals requesting or requiring majority voting policies in election of directors, so long as there is a carve-out for plurality voting in the case of contested elections.
A-3
6. Proxy access: We consider on a case-by-case basis shareholder proposals on particular procedures for inclusion of shareholder nominees in company proxy statements.
7. Reimbursement for dissident nominees: We generally support well-crafted U.S. shareholder proposals that would provide for reimbursement of dissident nominees elected to a board, as the cost to shareholders in electing such nominees can be factored into the voting decision on those nominees.
8. Proposals to elect directors more frequently: In the U.S. public company context, we usually support shareholder and management proposals to elect all directors annually (to "declassify" the board), although we make an exception to this policy where we believe that long-term shareholder value may be harmed by this change given particular circumstances at the company at the time of the vote on such proposal. As indicated above, outside the U.S., we generally support greater accountability to shareholders that comes through more frequent director elections, but recognize that many markets embrace longer term lengths, sometimes for valid reasons given other aspects of the legal context in electing boards.
9. Cumulative voting: We generally support proposals to eliminate cumulative voting in the U.S. market context. (Cumulative voting provides that shareholders may concentrate their votes for one or a handful of candidates, a system that can enable a minority bloc to place representation on a board.) U.S. proposals to establish cumulative voting in the election of directors generally will not be supported.
10. Separation of Chairman and CEO positions: We vote on shareholder proposals to separate the Chairman and CEO positions and/or to appoint an independent Chairman based in part on prevailing practice in particular markets, since the context for such a practice varies. In many non-U.S. markets, we view separation of the roles as a market standard practice, and support division of the roles in that context. In the U.S., we consider such proposals on a case-by-case basis, considering, among other things, the existing board leadership structure, company performance, and any other evidence of entrenchment or perceived risk that power is overly concentrated in a single individual.
11. Director retirement age and term limits: Proposals setting or recommending director retirement ages or director term limits are voted on a case-by-case basis that includes consideration of company performance, the rate of board renewal, evidence of effective individual director evaluation processes, and any indications of entrenchment...
12. Proposals to limit directors' liability and/or broaden indemnification of officers and directors. Generally, we will support such proposals provided that an individual is eligible only if he or she has not acted in bad faith, with gross negligence or with reckless disregard of their duties.
C. Statutory auditor boards
The statutory auditor board, which is separate from the main board of directors, plays a role in corporate governance in several markets. These boards are elected by shareholders to provide assurance on compliance with legal and accounting standards and the company's articles of association. We generally vote for statutory auditor nominees if they meet independence standards. In markets that require disclosure on attendance by internal statutory auditors, however, we consider voting against nominees for these positions who failed to attend at least 75% of meetings in the previous year. We also consider opposing nominees if the company does not meet market standards for disclosure on attendance.
D. Corporate transactions and proxy fights.
We examine proposals relating to mergers, acquisitions and other special corporate transactions (i.e., takeovers, spin-offs, sales of assets, reorganizations, restructurings and recapitalizations) on a case-by-case basis in the interests of each fund or other account. Proposals for mergers or other significant transactions that are friendly and approved by the Research Providers usually are supported if there is no portfolio manager objection. We also analyze proxy contests on a case-by-case basis.
E. Changes in capital structure.
1. We generally support the following:
• Management and shareholder proposals aimed at eliminating unequal voting rights, assuming fair economic treatment of classes of shares we hold.
A-4
• U.S. management proposals to increase the authorization of existing classes of common stock (or securities convertible into common stock) if: (i) a clear business purpose is stated that we can support and the number of shares requested is reasonable in relation to the purpose for which authorization is requested; and/or (ii) the authorization does not exceed 100% of shares currently authorized and at least 30% of the total new authorization will be outstanding. (We consider proposals that do not meet these criteria on a case-by-case basis.)
• U.S. management proposals to create a new class of preferred stock or for issuances of preferred stock up to 50% of issued capital, unless we have concerns about use of the authority for anti-takeover purposes.
• Proposals in non-U.S. markets that in our view appropriately limit potential dilution of existing shareholders. A major consideration is whether existing shareholders would have preemptive rights for any issuance under a proposal for standing share issuance authority. We generally consider market-specific guidance in making these decisions; for example, in the U.K. market, we usually follow Association of British Insurers' ("ABI") guidance, although company-specific factors may be considered and for example, may sometimes lead us to voting against share authorization proposals even if they meet ABI guidance.
• Management proposals to authorize share repurchase plans, except in some cases in which we believe there are insufficient protections against use of an authorization for anti-takeover purposes.
• Management proposals to reduce the number of authorized shares of common or preferred stock, or to eliminate classes of preferred stock.
• Management proposals to effect stock splits.
• Management proposals to effect reverse stock splits if management proportionately reduces the authorized share amount set forth in the corporate charter. Reverse stock splits that do not adjust proportionately to the authorized share amount generally will be approved if the resulting increase in authorized shares coincides with the proxy guidelines set forth above for common stock increases.
• Management dividend payout proposals, except where we perceive company payouts to shareholders as inadequate.
2. We generally oppose the following (notwithstanding management support):
• Proposals to add classes of stock that would substantially dilute the voting interests of existing shareholders.
• Proposals to increase the authorized or issued number of shares of existing classes of stock that are unreasonably dilutive, particularly if there are no preemptive rights for existing shareholders. However, depending on market practices, we consider voting for proposals giving general authorization for issuance of shares not subject to pre-emptive rights if the authority is limited.
• Proposals that authorize share issuance at a discount to market rates, except where authority for such issuance is de minimis, or if there is a special situation that we believe justifies such authorization (as may be the case, for example, at a company under severe stress and risk of bankruptcy).
• Proposals relating to changes in capitalization by 100% or more.
We consider on a case-by-case basis shareholder proposals to increase dividend payout ratios, in light of market practice and perceived market weaknesses, as well as individual company payout history and current circumstances. For example, currently we perceive low payouts to shareholders as a concern at some Japanese companies, but may deem a low payout ratio as appropriate for a growth company making good use of its cash, notwithstanding the broader market concern.
F. Takeover Defenses and Shareholder Rights.
1. Shareholder rights plans: We generally support proposals to require shareholder approval or ratification of shareholder rights plans (poison pills). In voting on rights plans or similar takeover defenses, we consider on a case-by-case basis whether the company has demonstrated a need for the defense in the context of promoting long-term share value; whether provisions of the defense are in line with generally accepted governance principles in the market (and specifically the presence of an adequate qualified offer provision that would
A-5
exempt offers meeting certain conditions from the pill); and the specific context if the proposal is made in the midst of a takeover bid or contest for control.
2. Supermajority voting requirements: We generally oppose requirements for supermajority votes to amend the charter or bylaws, unless the provisions protect minority shareholders where there is a large shareholder. In line with this view, in the absence of a large shareholder we support reasonable shareholder proposals to limit such supermajority voting requirements.
3. Shareholder rights to call meetings: We consider proposals to enhance shareholder rights to call meetings on a case-by-case basis. At large-cap U.S. companies, we generally support efforts to establish the rights of holders of 10% or more of shares to call special meetings, unless the board or state law has a set policy or law establishing such rights at a threshold that we believe to be acceptable.
4. Written consent rights: In the U.S. context, we examine proposals for shareholder written consent rights on a case-by-case basis.
5. Reincorporation: We consider management and shareholder proposals to reincorporate to a different jurisdiction on a case-by-case basis. We oppose such proposals if we believe the main purpose is to take advantage of laws or judicial precedents that reduce shareholder rights.
6. Anti-greenmail provisions: Proposals relating to the adoption of anti-greenmail provisions will be supported, provided that the proposal: (i) defines greenmail; (ii) prohibits buyback offers to large block holders (holders of at least 1% of the outstanding shares and in certain cases, a greater amount) not made to all shareholders or not approved by disinterested shareholders; and (iii) contains no anti-takeover measures or other provisions restricting the rights of shareholders.
7. Bundled proposals: We may consider opposing or abstaining on proposals if disparate issues are "bundled" and presented for a single vote.
G. Auditors.
We generally support management proposals for selection or ratification of independent auditors. However, we may consider opposing such proposals with reference to incumbent audit firms if the company has suffered from serious accounting irregularities and we believe rotation of the audit firm is appropriate, or if fees paid to the auditor for non-audit-related services are excessive. Generally, to determine if non-audit fees are excessive, a 50% test will be applied (i.e., non-audit-related fees should be less than 50% of the total fees paid to the auditor). We generally vote against proposals to indemnify auditors.
H. Executive and Director Remuneration.
1. We generally support the following:
• Proposals for employee equity compensation plans and other employee ownership plans, provided that our research does not indicate that approval of the plan would be against shareholder interest. Such approval may be against shareholder interest if it authorizes excessive dilution and shareholder cost, particularly in the context of high usage ("run rate") of equity compensation in the recent past; or if there are objectionable plan design and provision.
• Proposals relating to fees to outside directors, provided the amounts are not excessive relative to other companies in the country or industry, and provided that the structure is appropriate within the market context. While stock-based compensation to outside directors is positive if moderate and appropriately structured, we are wary of significant stock option awards or other performance-based awards for outside directors, as well as provisions that could result in significant forfeiture of value on a director's decision to resign from a board (such forfeiture can undercut director independence).
• Proposals for employee stock purchase plans that permit discounts, but only for grants that are part of a broad-based employee plan, including all non-executive employees, and only if the discounts are limited to a reasonable market standard or less.
• Proposals for the establishment of employee retirement and severance plans, provided that our research does not indicate that approval of the plan would be against shareholder interest.
A-6
2. We generally oppose retirement plans and bonuses for non-executive directors and independent statutory auditors.
3. In the U.S. context, shareholder proposals requiring shareholder approval of all severance agreements will not be supported, but proposals that require shareholder approval for agreements in excess of three times the annual compensation (salary and bonus) generally will be supported. We generally oppose shareholder proposals that would establish arbitrary caps on pay. We consider on a case-by-case basis shareholder proposals that seek to limit Supplemental Executive Retirement Plans (SERPs), but support such proposals where we consider SERPs to be excessive.
4. Shareholder proposals advocating stronger and/or particular pay-for-performance models will be evaluated on a case-by-case basis, with consideration of the merits of the individual proposal within the context of the particular company and its labor markets, and the company's current and past practices. While we generally support emphasis on long-term components of senior executive pay and strong linkage of pay to performance, we consider factors including whether a proposal may be overly prescriptive, and the impact of the proposal, if implemented as written, on recruitment and retention.
5. We generally support proposals advocating reasonable senior executive and director stock ownership guidelines and holding requirements for shares gained in executive equity compensation programs
6. We generally support shareholder proposals for reasonable "claw-back" provisions that provide for company recovery of senior executive bonuses to the extent they were based on achieving financial benchmarks that were not actually met in light of subsequent restatements.
7. Management proposals effectively to re-price stock options are considered on a case-by-case basis. Considerations include the company's reasons and justifications for a re-pricing, the company's competitive position, whether senior executives and outside directors are excluded, potential cost to shareholders, whether the re-pricing or share exchange is on a value-for-value basis, and whether vesting requirements are extended.
8. Say-on-Pay: We consider proposals relating to an advisory vote on remuneration on a case-by-case basis. Considerations include a review of the relationship between executive remuneration and performance based on operating trends and total shareholder return over multiple performance periods. In addition, we review remuneration structures and potential poor pay practices, including relative magnitude of pay, discretionary bonus awards, tax gross ups, change-in-control features, internal pay equity and peer group construction. As long-term investors, we support remuneration policies that align with long-term shareholder returns.
I. Social, Political and Environmental Issues.
Shareholders in the U.S. and certain other markets submit proposals encouraging changes in company disclosure and practices related to particular corporate, social, political and environmental matters. We consider how to vote on the proposals on a case-by-case basis to determine likely impacts on shareholder value. We seek to balance concerns on reputational and other risks that lie behind a proposal against costs of implementation, while considering appropriate shareholder and management prerogatives. We may abstain from voting on proposals that do not have a readily determinable financial impact on shareholder value. We support proposals that, if implemented, would enhance useful disclosure, but we generally vote against proposals requesting reports that we believe are duplicative, related to matters not material to the business, or that would impose unnecessary or excessive costs. We believe that certain social and environmental shareholder proposals may intrude excessively on management prerogatives, which can lead us to oppose them.
J. Fund of Funds.
Certain Funds advised by an MSIM Affiliate invest only in other MSIM Funds. If an underlying fund has a shareholder meeting, in order to avoid any potential conflict of interest, such proposals will be voted in the same proportion as the votes of the other shareholders of the underlying fund, unless otherwise determined by the Proxy Review Committee.
III. ADMINISTRATION OF POLICY
The MSIM Proxy Review Committee (the "Committee") has overall responsibility for the Policy. The Committee, which is appointed by MSIM's Long-Only Executive Committee, consists of investment professionals who represent the different investment disciplines and geographic locations of the firm, and is chaired by the director
A-7
of the Corporate Governance Team ("CGT"). Because proxy voting is an investment responsibility and impacts shareholder value, and because of their knowledge of companies and markets, portfolio managers and other members of investment staff play a key role in proxy voting, although the Committee has final authority over proxy votes.
The CGT Director is responsible for identifying issues that require Committee deliberation or ratification. The CGT, working with advice of investment teams and the Committee, is responsible for voting on routine items and on matters that can be addressed in line with these Policy guidelines. The CGT has responsibility for voting case-by-case where guidelines and precedent provide adequate guidance.
The Committee will periodically review and have the authority to amend, as necessary, the Policy and establish and direct voting positions consistent with the Client Proxy Standard.
CGT and members of the Committee may take into account Research Providers' recommendations and research as well as any other relevant information they may request or receive, including portfolio manager and/or analyst comments and research, as applicable. Generally, proxies related to securities held in accounts that are managed pursuant to quantitative, index or index-like strategies ("Index Strategies") will be voted in the same manner as those held in actively managed accounts, unless economic interests of the accounts differ. Because accounts managed using Index Strategies are passively managed accounts, research from portfolio managers and/or analysts related to securities held in these accounts may not be available. If the affected securities are held only in accounts that are managed pursuant to Index Strategies, and the proxy relates to a matter that is not described in this Policy, the CGT will consider all available information from the Research Providers, and to the extent that the holdings are significant, from the portfolio managers and/or analysts.
A. Committee Procedures
The Committee meets at least quarterly and reviews and considers changes to the Policy at least annually. Through meetings and/or written communications, the Committee is responsible for monitoring and ratifying "split votes" (i.e., allowing certain shares of the same issuer that are the subject of the same proxy solicitation and held by one or more MSIM portfolios to be voted differently than other shares) and/or "override voting" (i.e., voting all MSIM portfolio shares in a manner contrary to the Policy). The Committee will review developing issues and approve upcoming votes, as appropriate, for matters as requested by CGT.
The Committee reserves the right to review voting decisions at any time and to make voting decisions as necessary to ensure the independence and integrity of the votes.
B. Material Conflicts of Interest
In addition to the procedures discussed above, if the CGT Director determines that an issue raises a material conflict of interest, the CGT Director may request a special committee to review, and recommend a course of action with respect to, the conflict(s) in question ("Special Committee").
A potential material conflict of interest could exist in the following situations, among others:
1. The issuer soliciting the vote is a client of MSIM or an affiliate of MSIM and the vote is on a matter that materially affects the issuer.
2. The proxy relates to Morgan Stanley common stock or any other security issued by Morgan Stanley or its affiliates except if echo voting is used, as with MSIM Funds, as described herein.
3. Morgan Stanley has a material pecuniary interest in the matter submitted for a vote (e.g., acting as a financial advisor to a party to a merger or acquisition for which Morgan Stanley will be paid a success fee if completed).
If the CGT Director determines that an issue raises a potential material conflict of interest, depending on the facts and circumstances, the issue will be addressed as follows:
1. If the matter relates to a topic that is discussed in this Policy, the proposal will be voted as per the Policy.
2. If the matter is not discussed in this Policy or the Policy indicates that the issue is to be decided case-by-case, the proposal will be voted in a manner consistent with the Research Providers, provided that all the Research Providers consulted have the same recommendation, no portfolio manager objects to that vote, and the vote is consistent with MSIM's Client Proxy Standard.
A-8
3. If the Research Providers' recommendations differ, the CGT Director will refer the matter to a Special Committee to vote on the proposal, as appropriate.
Any Special Committee shall be comprised of the CGT Director and at least two portfolio managers (preferably members of the Committee) as approved by the Committee. The CGT Director may request non-voting participation by MSIM's General Counsel or his/her designee and the Chief Compliance Officer or his/her designee. In addition to the research provided by Research Providers, the Special Committee may request analysis from MSIM Affiliate investment professionals and outside sources to the extent it deems appropriate.
C. Proxy Voting Reporting
The CGT will document in writing all Committee and Special Committee decisions and actions, which documentation will be maintained by the CGT for a period of at least six years. To the extent these decisions relate to a security held by an MSIM Fund, the CGT will report the decisions to each applicable Board of Trustees/Directors of those Funds at each Board's next regularly scheduled Board meeting. The report will contain information concerning decisions made during the most recently ended calendar quarter immediately preceding the Board meeting.
MSIM will promptly provide a copy of this Policy to any client requesting it. MSIM will also, upon client request, promptly provide a report indicating how each proxy was voted with respect to securities held in that client's account.
MSIM's Legal Department is responsible for filing an annual Form N-PX on behalf of each MSIM Fund for which such filing is required, indicating how all proxies were voted with respect to such Fund's holdings.
A-9
APPENDIX A
The following procedures apply to accounts managed by Morgan Stanley AIP GP LP and Private Investment Partners Inc. ("AIP").
Generally, AIP will follow the guidelines set forth in Section II of MSIM's Proxy Voting Policy and Procedures. To the extent that such guidelines do not provide specific direction, or AIP determines that consistent with the Client Proxy Standard, the guidelines should not be followed, the Proxy Review Committee has delegated the voting authority to vote securities held by accounts managed by AIP to the Fund of Hedge Funds investment team, the Private Equity Fund of Funds investment team or the Private Equity Real Estate Fund of Funds investment team of AIP. A summary of decisions made by the investment teams will be made available to the Proxy Review Committee for its information at the next scheduled meeting of the Proxy Review Committee.
In certain cases, AIP may determine to abstain from determining (or recommending) how a proxy should be voted (and therefore abstain from voting such proxy or recommending how such proxy should be voted), such as where the expected cost of giving due consideration to the proxy does not justify the potential benefits to the affected account(s) that might result from adopting or rejecting (as the case may be) the measure in question.
Waiver of Voting Rights
For regulatory reasons, AIP may either 1) invest in a class of securities of an underlying fund (the "Fund") that does not provide for voting rights; or 2) waive 100% of its voting rights with respect to the following:
1. Any rights with respect to the removal or replacement of a director, general partner, managing member or other person acting in a similar capacity for or on behalf of the Fund (each individually a "Designated Person," and collectively, the "Designated Persons"), which may include, but are not limited to, voting on the election or removal of a Designated Person in the event of such Designated Person's death, disability, insolvency, bankruptcy, incapacity, or other event requiring a vote of interest holders of the Fund to remove or replace a Designated Person; and
2. Any rights in connection with a determination to renew, dissolve, liquidate, or otherwise terminate or continue the Fund, which may include, but are not limited to, voting on the renewal, dissolution, liquidation, termination or continuance of the Fund upon the occurrence of an event described in the Fund's organizational documents; provided, however, that, if the Fund's organizational documents require the consent of the Fund's general partner or manager, as the case may be, for any such termination or continuation of the Fund to be effective, then AIP may exercise its voting rights with respect to such matter.
Approved by Morgan Stanley Funds Board on September 27-28, 2011
A-10
APPENDIX B — DESCRIPTION OF RATINGS
I. Excerpts from Moody's Investors Service, Inc.'s Corporate Bond Ratings:
Aaa: Judged to be of the best quality; carry the smallest degree of invest risk;
Aa: judged to be of high quality by all standards;
A: possess many favorable investment attributes and are to be considered upper medium grade obligations;
Baa: considered as medium grade obligations; i.e., they are neither highly protected nor poorly secured;
Ba: judged to have speculative elements; their future cannot be considered well-assured;
B: assurance of interest and principal payments or of maintenance of other terms of the contract over any long period of time may be small.
Caa: Bonds which are rated Caa are of poor standing. Such issues may be in default or there may be present elements of danger with respect to principal or interest.
Ca: Bonds which are rated Ca represent obligations which are speculative in a high degree. Such issues are often in default or have other marked shortcomings.
C: Bonds which are rated C are lowest rated class of bonds and issues so rated can be regarded as having extremely poor prospects of ever attaining any real investment standing.
Note: Moody's applies numerical modifiers, 1, 2 and 3 in each generic rating classification from Aa through Caa in its corporate bond rating system. The modifier 1 indicates that the obligation ranks in the higher end of its generic rating category; the modifier 2 indicates a mid-range ranking; and the modifier 3 indicates that the issue ranks in the lower end of its generic rating category.
II. Excerpts from Standard & Poor's Rating Group's Corporate Bond Ratings:
AAA: Highest rating assigned for an obligation; obligor has extremely strong capacity to meet its financial commitments;
AA: obligation differs from the highest-rated obligations only in small degree; obligor's capacity to meet its financial commitment on the obligation is very strong;
A: obligation is somewhat more susceptible to the adverse effects of changes in circumstances and economic conditions than obligations in higher-rated categories; obligor's capacity to meet its financial commitment on the obligation is still strong;
BBB: obligation exhibits adequate protection parameters; adverse economic conditions or changing circumstances are more likely to lead to a weakened capacity of the obligor to meet its financial commitment on the obligation.
BB, B, CCC, CC, C: Obligations rated BB, B, CCC, and CC are regarded as having significant speculative characteristics. BB indicates the least degree of speculation and CC the highest. While such obligations will likely have some quality and protective characteristics, these may be outweighed by large uncertainties or major exposures to adverse conditions. The C rating may be used to cover a situation where a bankruptcy petition has been filed or similar action has been taken, but payments on this obligation are being continued.
D: An obligation rated D is in payment default. The D rating category is used when payments on an obligation are not made on the date due even if the applicable grace period has not expired, unless Standard & Poor's believes that such payments will be made during such grace period. The D rating also will be used upon the filing of a bankruptcy petition or the taking of a similar action if payments on an obligation are jeopardized.
Plus (+) or minus (-): The ratings from AA to CCC may be modified by the addition of a plus or minus sign to show relative standing within the major rating categories.
B-1
III. Excerpts from Fitch, Inc.'s Corporate Bond Ratings:
AAA: Highest credit quality; denotes the lowest expectation of credit risk; assigned only in case of exceptionally strong capacity for payment of financial commitments. This capacity is highly unlikely to be adversely affected by foreseeable events.
AA: Very high credit quality; denote expectations of very low credit risk; indicate very strong capacity for payment of financial commitments. This capacity is not significantly vulnerable to foreseeable events.
A: High credit quality; denote expectations of low credit risk. The capacity for payment of financial commitments is considered strong. This capacity may, nevertheless, be more vulnerable to changes in circumstances or in economic conditions than is the case for higher ratings.
BBB: Good credit quality; indicate that there is currently expectations of low credit risk. The capacity for payment of financial commitments is considered adequate but adverse changes in circumstances and economic conditions are more likely to impair this capacity. This is the lowest investment grade category.
BB: Speculative; indicate that there is a possibility of credit risk developing, particularly as the result of adverse economic change over time; however, business or financial alternatives may be available to allow financial commitments to be met. Securities rated in this category are not investment grade.
B: Highly speculative; indicate that significant credit risk is present, but a limited margin of safety remains. Financial commitments are currently being met; however, capacity for continued payment is contingent upon a sustained, favorable business and economic environment.
CCC: Default is a real possibility. Capacity for meeting financial commitments is solely reliant upon sustained, favorable business or economic conditions.
CC: Default of some kind appears probable.
C: Default is imminent.
RD: Indicates an entity that has failed to make due payments (within the applicable grace period) on some but not all material financial obligations, but continues to honor other classes of obligations.
D: Default. Default is determined by reference to the terms of the obligations' documentation. Fitch will assign default ratings where it has reasonably determined that payment has not been made on a material obligation in accordance with the requirements of the obligation's documentation, or where it believes that default ratings consistent with Fitch's published definition of default are the most appropriate ratings to assign.
The modifiers "+" or "-" may be appended to a rating to denote relative status within major rating categories. Such suffixes are not added to the AAA Long-term rating category or to categories below CCC.
IV. Excerpts from Moody's Investors Service, Inc.'s Preferred Stock Ratings:
aaa: An issue which is rated aaa is considered to be a top-quality preferred stock. This rating indicates good asset protection and the least risk of dividend impairment within the universe of preferred stocks.
aa: An issue which is rated aa is considered a high-grade preferred stock. This rating indicates that there is reasonable assurance that earnings and asset protection will remain relatively well maintained in the foreseeable future.
a: An issue which is rated a is considered to be an upper medium grade preferred stock. While risks are judged to be somewhat greater than in the aaa and aa classifications, earnings and asset protection are, nevertheless expected to be maintained at adequate levels.
baa: An issue which is rated baa is considered to be medium grade, neither highly protected nor poorly secured. Earnings and asset protection appear adequate at present but may be questionable over any great length of time.
ba: an issue which is rated ba is considered to have speculative elements and its future cannot be considered well assured. Earnings and asset protection may be very moderate and not well safeguarded during adverse periods. Uncertainty of position characterizes preferred stocks in this class.
B-2
b: An issue which is rated b generally lacks the characteristics of a desirable investment. Assurance of dividend payments and maintenance of other terms of the issue over any long period of time may be small.
caa: An issue which is rated caa is likely to be in arrears on dividend payments. This rating designation does not purport to indicate the future status of payment.
ca: An issue which is rated ca is speculative in a high degree and is likely to be in arrears on dividends with little likelihood of eventual payment.
c: This is the lowest rated class of preferred of preference stock. Issues so rated can be regarded as having extremely poor prospects of ever attaining any real investment standing.
Note: Moody's may apply numerical modifiers 1, 2 and 3 in each rating classification from "aa" through "b" in its preferred stock rating system. The modifier 1 indicated that the security ranks in the higher end of its generic rating category; the modifier 2 indicates a mid-range ranking; and the modifier 3 indicates that the issue ranks in the lower end of its generic rating category.
V. Excerpts from Standard & Poor's Rating Group's Preferred Stock Ratings:
AAA: This is the highest rating that may be assigned by S&P's to a preferred stock issue and indicates an extremely strong capacity to pay the preferred stock obligations.
AA: A preferred stock issue rated AA also qualifies as a high quality fixed income security. The capacity to pay preferred stock obligations is very strong, although not as overwhelming as for issues rated AAA.
A: An issue rated A is backed by a sound capacity to pay the preferred stock obligations, although it is somewhat more susceptible to the adverse effect of the changes in circumstances and economic conditions.
BBB: An issue rated BBB is regarded as backed by an adequate capacity to pay the preferred stock obligations. Whereas it normally exhibits adequate protection parameter, adverse economic conditions or changing circumstances are more likely to lead to a weakened capacity to make payments for a preferred stock in this category than for issues in the A category.
BB, B, CCC: Preferred stock rated BB, B, and CCC are regarded, on balance, as predominantly speculative with respect to the issuer's capacity to pay preferred stock obligations. Bb indicates the lowest degree of speculation and CCC the highest degree of speculation. While such issues will likely have some quality and protective characteristics, these are outweighed by large uncertainties of major risk exposures to adverse conditions.
CC: The rating CC is reserved for a preferred stock in arrears on dividends or sinking fund payments but that is currently paying.
C: A preferred stock rated C is a non-paying issue.
D: A preferred stock rated D is a non-paying issue with the issuer in default on debt instruments.
Plus (+) or Minus (-): The ratings from AA for CCC may be modified by the addition of a plus or minus sign to show relative standing within the major rating categories.
VI. Excerpts from Fitch, Inc's Preferred Stock Ratings:
AAA: These preferred stocks are considered to be investment grade and of the highest credit quality. The obligor has an exceptionally strong ability to pay, which is unlikely to be affected by reasonably foreseeable events.
AA: These preferred stocks are considered to be investment grade and of very high credit quality. The obligor's ability to pay is very strong, although not quite as strong as preferred stocks rated "AAA".
A: These preferred stocks are considered to be investment grade and of high credit quality. The obligor's ability to pay is considered to be strong, but may be more vulnerable to adverse changes in economic conditions and circumstances than preferred stocks with higher ratings.
BBB: These preferred stocks are considered to be investment grade and of satisfactory credit quality. The obligor's ability to pay interest and repay principal is considered to be adequate. Adverse changes in economic
B-3
conditions and circumstances, however, are more likely to have adverse impact on these preferred stocks, and therefore, impair timely payment. The likelihood that the ratings of these preferred stocks will fall below investment grade is higher than for preferred stocks with higher ratings.
BB: These preferred stocks are considered speculative. The obligor's ability to pay may be affected over time by adverse economic changes. However, business and financial alternatives can be identified that could assist the obligor in satisfying its dividend payment requirements.
B: These preferred stocks are considered highly speculative. While preferred in this class are currently meeting dividend payment requirements, the probability of continued timely payment reflects the obligor's limited margin of safety and the need for reasonable business and economic activity throughout the life of the issue.
CCC: These preferred stocks have certain identifiable characteristics which, if not remedied, may lead to non-payment. The ability to meet obligations requires an advantageous business and economic environment.
CC: These preferred stocks are minimally protected. Non-payment seems probable over time.
C: These preferred stocks are in imminent non-payment.
DDD, DD AND D: These preferred stocks are in non-payment. Such preferred stocks are extremely speculative and should be valued on the basis of their ultimate recovery value in liquidation or reorganization of the obligor. DDD represents the highest potential for recovery and D represents the lowest potential for recovery.
PLUS (+) OR MINUS (-): The ratings from AA to C may be modified by the addition of a plus or minus sign to indicate the relative position of a credit within the rating category.
B-4
Statement of Additional Information Supplement
June 12, 2012
Morgan Stanley Institutional Fund Trust
Supplement dated June 12, 2012 to the Morgan Stanley Institutional Fund Trust (the "Fund") Statement of Additional Information dated April 30, 2012
Effective June 15, 2012, the last paragraph under the section entitled "Purchase of Shares—Involuntary Redemption of Shares" is hereby deleted and replaced with the following:
On June 15, 2012, the Fund suspended offering Class L and Class H shares of the Mid Cap Growth Portfolio to new investors, except as follows. The Fund will continue to offer Class L and Class H shares of the Mid Cap Growth Portfolio (1) through certain retirement plan accounts, (2) to clients of certain registered investment advisers who currently offer Class L and Class H shares of the Mid Cap Growth Portfolio in their asset allocation programs, (3) to directors and trustees of the Morgan Stanley Funds, (4) to Morgan Stanley affiliates and their employees and (5) to benefit plans sponsored by Morgan Stanley and its affiliates. The Fund will continue to offer Class L and Class H shares of the Mid Cap Growth Portfolio to existing shareholders and, as market conditions permit, may recommence offering Class L and Class H shares of the Mid Cap Growth Portfolio to other new investors in the future. Any such offerings of the Mid Cap Growth Portfolio's Class L and Class H shares may be limited in amount and may commence and terminate without any prior notice.
Please retain this supplement for future reference.
MORGAN STANLEY INSTITUTIONAL FUND TRUST
Balanced Portfolio
Core Fixed Income Portfolio
Core Plus Fixed Income Portfolio
Limited Duration Portfolio
Mid Cap Growth Portfolio
STATEMENT OF ADDITIONAL INFORMATION
April 30, 2012
CLASS H SHARES
CLASS L SHARES
Morgan Stanley Institutional Fund Trust (the "Fund") is a mutual fund consisting of eight portfolios offering a variety of investment alternatives, five of which are included in this Statement of Additional Information ("SAI"). This SAI sets forth information about the Fund applicable to Class H and Class L shares of the Balanced, Core Fixed Income, Core Plus Fixed Income, Limited Duration and Mid Cap Growth Portfolios (each a "Portfolio" and collectively, the "Portfolios"). Each Portfolio also offers both Class I and Class P shares. The following table includes the share class and ticker symbol information for Class H and Class L shares of the Portfolios:
| Share Class and Ticker Symbol | |||||||||||
| Class H | Class L | ||||||||||
| U.S. EQUITY PORTFOLIO: | |||||||||||
| Mid Cap Growth Portfolio* | MSKHX | MSKLX | |||||||||
| FIXED INCOME PORTFOLIOS: | |||||||||||
| Core Fixed Income Portfolio | MSXHX | MSXLX | |||||||||
| Core Plus Fixed Income Portfolio | MSDHX | MSIOX | |||||||||
| Limited Duration Portfolio | MSOHX | MSJLX | |||||||||
| BALANCED PORTFOLIO: | |||||||||||
| Balanced Portfolio | MSBHX | MSDLX | |||||||||
* Portfolio is currently closed to new investors, with certain exceptions.
This SAI is not a prospectus but should be read in conjunction with the prospectuses relating to Class H and Class L shares of the Portfolios, each dated April 30, 2012, as may be supplemented from time to time. To obtain any of these prospectuses, please call Shareholder Services at the number indicated below.
The Fund's most recent Annual Report to Shareholders is a separate document supplied with this SAI and includes the Fund's audited financial statements, including notes thereto, and the report of Ernst & Young LLP, which are incorporated by reference into this SAI.
Each Portfolio is "diversified" and, as such, each Portfolio's investments are required to meet certain diversification requirements under federal securities laws.
SHAREHOLDER SERVICES: 1-800-548-7786
PRICES AND INVESTMENT RESULTS: WWW.MORGANSTANLEY.COM/IM
TABLE OF CONTENTS
| Page | |||||||
| THE PORTFOLIOS' INVESTMENTS AND STRATEGIES | 1 | ||||||
| INVESTMENTS AND RISKS | 7 | ||||||
| INVESTMENT LIMITATIONS | 39 | ||||||
| DISCLOSURE OF PORTFOLIO HOLDINGS | 41 | ||||||
| PURCHASE OF SHARES | 44 | ||||||
| REDEMPTION OF SHARES | 45 | ||||||
| TRANSACTIONS WITH BROKER/DEALERS | 45 | ||||||
| SHAREHOLDER SERVICES | 46 | ||||||
| VALUATION OF SHARES | 46 | ||||||
| MANAGEMENT OF THE FUND | 47 | ||||||
| COMPENSATION | 59 | ||||||
| ADVISER | 60 | ||||||
| PRINCIPAL UNDERWRITER | 64 | ||||||
| DISTRIBUTION AND SHAREHOLDER SERVICES PLANS | 64 | ||||||
| FUND ADMINISTRATION | 66 | ||||||
| OTHER SERVICE PROVIDERS | 66 | ||||||
| BROKERAGE TRANSACTIONS | 66 | ||||||
| VALUE OF PORTFOLIO HOLDINGS | 69 | ||||||
| GENERAL INFORMATION | 70 | ||||||
| TAX CONSIDERATIONS | 72 | ||||||
| PRINCIPAL HOLDERS OF SECURITIES | 77 | ||||||
| PERFORMANCE INFORMATION | 79 | ||||||
| FINANCIAL STATEMENTS | 80 | ||||||
| APPENDIX A — MORGAN STANLEY INVESTMENT MANAGEMENT PROXY VOTING POLICY AND PROCEDURES | A-1 | ||||||
| APPENDIX B — DESCRIPTION OF RATINGS | B-1 | ||||||
-i-
THE PORTFOLIOS' INVESTMENTS AND STRATEGIES
Each prospectus describes the investment objectives, principal investment strategies and principal risks associated with each applicable Portfolio. The Portfolios may engage in a variety of investment strategies and invest in a variety of securities and other instruments. The following tables summarize the permissible investments for each Portfolio. The tables exclude investments that Portfolios may make solely for temporary defensive purposes. More details about each investment and related risks are provided in the discussion following the tables.
EQUITY AND BALANCED PORTFOLIOS
| Mid Cap Growth Portfolio | Balanced Portfolio | ||||||||||
| Investments | |||||||||||
| ADRs | x | x | |||||||||
| Agencies | x | x | |||||||||
| Asset-Backed Securities | x | ||||||||||
| Borrowing | x | x | |||||||||
| Brady Bonds | x | ||||||||||
| Cash Equivalents | x | x | |||||||||
| Commercial Paper | x | x | |||||||||
| Common Stock | x | x | |||||||||
| Contracts for Difference | x | ||||||||||
| Convertibles | x | x | |||||||||
| Corporates | x | x | |||||||||
| Depositary Receipts | x | x | |||||||||
| Derivatives | x | x | |||||||||
| Emerging Market Securities | x | x | |||||||||
| Equity Securities | x | x | |||||||||
| Fixed Income Securities | x | x | |||||||||
| Floaters | x | ||||||||||
| Foreign Currency | x | x | |||||||||
| Foreign Securities | x | x | |||||||||
| Forwards | x | x | |||||||||
1
EQUITY AND BALANCED PORTFOLIOS
| Mid Cap Growth Portfolio | Balanced Portfolio | ||||||||||
| Futures Contracts | x | x | |||||||||
| High Yield Securities | x | ||||||||||
| Inverse Floaters | x | ||||||||||
| Investment Companies | x | x | |||||||||
| Investment Funds | x | ||||||||||
| Investment Grade Securities | x | x | |||||||||
| Limited Partnerships | x | x | |||||||||
| Loan Participations and Assignments | x | ||||||||||
| Mortgage Related Securities | x | ||||||||||
| —Mortgage-Backed Securities | x | ||||||||||
| —Collateralized Mortgage Obligations | x | ||||||||||
| —Stripped Mortgage-Backed Securities | x | ||||||||||
| —Commercial Mortgage-Backed Securities | x | ||||||||||
| Municipals | x | ||||||||||
| Non-Publicly Traded Securities, Private Placements and Restricted Securities | x | x | |||||||||
| Options | x | x | |||||||||
| Private Investments in Public Equity | x | x | |||||||||
| Preferred Stock | x | x | |||||||||
| Public Bank Loans | x | ||||||||||
| Real Estate Investment Trusts | x | x | |||||||||
| Repurchase Agreements | x | x | |||||||||
| Reverse Repurchase Agreements | x | x | |||||||||
| Rights | x | x | |||||||||
| Securities Lending | x | x | |||||||||
| Short Selling | x | x | |||||||||
2
EQUITY AND BALANCED PORTFOLIOS
| Mid Cap Growth Portfolio | Balanced Portfolio | ||||||||||
| Structured Investments | x | ||||||||||
| Swaps | x | x | |||||||||
| U.S. Government Securities | x | x | |||||||||
| Warrants | x | x | |||||||||
| When-Issued and Delayed Delivery Securities and Forward Commitments | x | x | |||||||||
| When, As and If Issued Securities | x | x | |||||||||
| Yankee and Eurobond Obligations | x | x | |||||||||
| Zero Coupons | x | x | |||||||||
3
FIXED INCOME PORTFOLIOS
| Core Fixed Income Portfolio | Core Plus Fixed Income Portfolio | Limited Duration Portfolio | |||||||||||||
| Investments | |||||||||||||||
| ADRs | x | x | x | ||||||||||||
| Agencies | x | x | x | ||||||||||||
| Asset-Backed Securities | x | x | x | ||||||||||||
| Borrowing | x | x | x | ||||||||||||
| Brady Bonds | x | x | x | ||||||||||||
| Cash Equivalents | x | x | x | ||||||||||||
| Commercial Paper | x | x | x | ||||||||||||
| Common Stock | |||||||||||||||
| Convertibles | x | x | x | ||||||||||||
| Corporates | x | x | x | ||||||||||||
| Depositary Receipts | x | x | x | ||||||||||||
| Derivatives | x | x | x | ||||||||||||
| Emerging Market Securities | x | x | x | ||||||||||||
| Equity Securities | |||||||||||||||
| Fixed Income Securities | x | x | x | ||||||||||||
| Floaters | x | x | x | ||||||||||||
| Foreign Currency | x | x | |||||||||||||
| Foreign Securities | x | x | x | ||||||||||||
| Forwards | x | x | |||||||||||||
| Futures Contracts | x | x | x | ||||||||||||
| High Yield Securities | x | x | |||||||||||||
4
FIXED INCOME PORTFOLIOS
| Core Fixed Income Portfolio | Core Plus Fixed Income Portfolio | Limited Duration Portfolio | |||||||||||||
| Inverse Floaters | x | x | x | ||||||||||||
| Investment Companies | x | x | x | ||||||||||||
| Investment Funds | |||||||||||||||
| Investment Grade Securities | x | x | x | ||||||||||||
| Limited Partnerships | |||||||||||||||
| Loan Participations and Assignments | x | ||||||||||||||
| Mortgage Related Securities | x | x | x | ||||||||||||
| —Mortgage-Backed Securities | x | x | x | ||||||||||||
| —Collateralized Mortgage Obligations | x | x | x | ||||||||||||
| —Stripped Mortgage-Backed Securities | x | x | x | ||||||||||||
| —Commercial Mortgage-Backed Securities | x | x | x | ||||||||||||
| Municipals | x | x | |||||||||||||
| Non-Publicly Traded Securities, Private Placements and Restricted Securities | x | x | x | ||||||||||||
| Options | x | x | x | ||||||||||||
| Private Investments in Public Equity | |||||||||||||||
| Preferred Stock | x | x | x | ||||||||||||
| Public Bank Loans | x | ||||||||||||||
| Repurchase Agreements | x | x | x | ||||||||||||
| Reverse Repurchase Agreements | x | x | x | ||||||||||||
| Rights | x | ||||||||||||||
| Securities Lending | x | x | x | ||||||||||||
| Short Selling | x | x | x | ||||||||||||
| Structured Investments | x | x | x | ||||||||||||
5
FIXED INCOME PORTFOLIOS
| Core Fixed Income Portfolio | Core Plus Fixed Income Portfolio | Limited Duration Portfolio | |||||||||||||
| Swaps | x | x | x | ||||||||||||
| U.S. Government Securities | x | x | x | ||||||||||||
| Warrants | x | ||||||||||||||
| When-Issued and Delayed Delivery Securities and Forward Commitments | x | x | x | ||||||||||||
| When, As and If Issued Securities | x | x | x | ||||||||||||
| Yankee and Eurobond Obligations | x | x | x | ||||||||||||
| Zero Coupons | x | x | x | ||||||||||||
6
INVESTMENTS AND RISKS
Morgan Stanley Investment Management Inc. is the adviser (the "Adviser") to the Fund.
ADRs: American Depositary Receipts ("ADRs") are dollar-denominated securities which are listed and traded in the United States, but which represent claims to shares of foreign stocks. They are treated as U.S. equity securities for purposes of the Portfolios' investment policies. ADRs may be either sponsored or unsponsored. Sponsored ADRs are established jointly by a depositary and the underlying issuer, whereas unsponsored ADRs may be established by a depositary without participation by the underlying issuer. Holders of unsponsored ADRs generally bear all the costs associated with establishing unsponsored ADRs. In addition, the issuers of the securities underlying unsponsored ADRs are not obligated to disclose material information in the United States and, therefore, there may be less information available regarding such issuers and there may not be a correlation between such information and the market value of the ADRs. ADRs also include American Depositary Shares.
Agencies: Agencies are fixed income securities issued or guaranteed by federal agencies and U.S. Government sponsored instrumentalities. They may or may not be backed by the full faith and credit of the U.S. Government. If they are not backed by the full faith and credit of the United States, the investor must look principally to the agency or instrumentality issuing or guaranteeing the obligation for ultimate repayment, and may not be able to assert a claim against the United States itself in the event the agency or instrumentality does not meet its commitment. Agencies which are backed by the full faith and credit of the United States include the Export-Import Bank, Farmers Home Administration, Federal Financing Bank and others. Certain debt issued by Resolution Funding Corporation has both its principal and interest backed by the full faith and credit of the U.S. Treasury in that its principal is defeased by U.S. Treasury zero coupon issues, while the U.S. Treasury is explicitly required to advance funds sufficient to pay interest on it, if needed. Certain agencies and instrumentalities, such as the Government National Mortgage Association ("Ginnie Mae"), are, in effect, backed by the full faith and credit of the United States through provisions in their charters that they may make "indefinite and unlimited" drawings on the Treasury if needed to service its debt. Debt from certain other agencies and instrumentalities, including the Federal Home Loan Mortgage Corporation ("Freddie Mac") and the Federal National Mortgage Association ("Fannie Mae"), are not guaranteed by the United States, but those institutions are protected by the discretionary authority of the U.S. Treasury to purchase certain amounts of their securities to assist them in meeting their debt obligations. Finally, other agencies and instrumentalities, such as the Farm Credit System, are federally chartered institutions under U.S. Government supervision, but their debt securities are backed only by the credit worthiness of those institutions, not the U.S. Government. Some of the U.S. Government agencies that issue or guarantee securities include the Export-Import Bank of the United States, Farmers Home Administration, Federal Housing Administration, Maritime Administration, Small Business Administration and The Tennessee Valley Authority.
In September 2008, the U.S. Treasury Department announced that the government would be taking over Fannie Mae and Freddie Mac and placing the companies into a conservatorship. In addition, the U.S. Treasury announced additional steps that it intended to take with respect to the debt and mortgage-backed securities issued by Fannie Mae and Freddie Mac in order to support the conservatorship. No assurance can be given that these initiatives will be successful. The maximum potential liability of the issuers of some U.S. government securities held by a Portfolio may greatly exceed their current resources, including their legal right to support from the U.S. Treasury. It is possible that these issuers will not have the funds to meet their payment obligations in the future.
An instrumentality of the U.S. Government is a government agency organized under federal charter with government supervision. Instrumentalities issuing or guaranteeing securities include, among others, Federal Home Loan Banks, the Federal Land Banks, Central Bank for Cooperatives, Federal Intermediate Credit Banks and Fannie Mae.
Asset-Backed Securities: Certain Portfolios may invest in asset-backed securities. Asset-backed securities utilize the securitization techniques used to develop mortgage-backed securities. These techniques are also applied to a broad range of other assets. Various types of assets, primarily automobile and credit card receivables and home equity loans, are being securitized in pass-through structures similar to the mortgage pass-through structures. These types of securities are known as asset-backed securities. A Portfolio may invest in any type of asset-backed security. Asset-backed securities have risk characteristics similar to mortgage-backed securities. Like mortgage-backed
7
securities, they generally decrease in value as a result of interest rate increases, but may benefit less than other fixed-income securities from declining interest rates, principally because of prepayments. Also, as in the case of mortgage-backed securities, prepayments generally increase during a period of declining interest rates although other factors, such as changes in credit use and payment patterns, may also influence prepayment rates. Asset-backed securities also involve the risk that various federal and state consumer laws and other legal, regulatory and economic factors may result in the collateral backing the securities being insufficient to support payment on the securities.
Borrowing: Each Portfolio is permitted to borrow money from banks in accordance with the Investment Company Act of 1940, as amended (the "1940 Act"), or the rules and regulations promulgated by the United States Securities and Exchange Commission ("SEC") thereunder. Currently, the 1940 Act permits a fund to borrow money from banks in an amount up to 331/3% of its total assets (including the amount borrowed) less its liabilities (not including any borrowings but including the fair market value at the time of computation of any other senior securities then outstanding). Each Portfolio may also borrow an additional 5% of its total assets without regard to the foregoing limitation for temporary purposes such as clearance of portfolio transactions. Each Portfolio will only borrow when the Adviser believes that such borrowings will benefit the Portfolio after taking into account considerations such as interest income and possible gains or losses upon liquidation. Each Portfolio will maintain asset coverage in accordance with the 1940 Act.
Borrowing by a Portfolio creates an opportunity for increased net income but, at the same time, creates special risks. For example, leveraging may exaggerate changes in and increase the volatility of the net asset value of Portfolio shares. This is because leverage tends to exaggerate the effect of any increase or decrease in the value of the Portfolio's portfolio securities. The use of leverage also may cause a Portfolio to liquidate portfolio positions when it may not be advantageous to do so to satisfy its obligations or to maintain asset coverage.
In general, each Portfolio may not issue any class of senior security, except that each Portfolio may (i) borrow from banks, provided that immediately following any such borrowing there is an asset coverage of at least 300% for all Portfolio borrowings and in the event such asset coverage falls below 300% the Portfolio will within three days or such longer period as the SEC may prescribe by rules and regulations, reduce the amount of its borrowings to an extent that the asset coverage of such borrowings shall be at least 300%, and (ii) engage in trading practices which could be deemed to involve the issuance of a senior security, including but not limited to options, futures, forward contracts and reverse repurchase agreements, provided that the Portfolio earmarks or segregates liquid assets in accordance with applicable SEC regulations and interpretations.
Brady Bonds: Brady Bonds are both Emerging Market Securities and Foreign Fixed Income Securities. They are created by exchanging existing commercial bank loans to foreign entities for new obligations for the purpose of restructuring the issuers' debts under a plan introduced by former U.S. Secretary of the Treasury, Nicholas F. Brady (the "Brady Plan"). They may be collateralized or uncollateralized and issued in various currencies (although most are dollar-denominated). They are actively traded in the over-the-counter secondary market. A Portfolio will only invest in Brady Bonds consistent with its quality specifications.
Dollar-denominated, collateralized Brady Bonds may be fixed rate par bonds or floating rate discount bonds. These Brady Bonds are generally collateralized in full as to principal due at maturity by U.S. Treasury Zero Coupon Obligations having the same maturity as the Brady Bonds. Interest payments on these Brady Bonds generally are collateralized by cash or securities in an amount that, in the case of fixed rate bonds, is equal to at least one year of rolling interest payments or, in the case of floating rate bonds, initially is equal to at least one year's rolling interest payments based on the applicable interest rate at that time and is adjusted at regular intervals thereafter. Certain Brady Bonds are entitled to "value recovery payments" in certain circumstances, which in effect constitute supplemental interest payments but generally are not collateralized.
Brady Bonds are often viewed as having three or four valuation components: (i) the collateralized repayment of principal at final maturity; (ii) the collateralized interest payments; (iii) the uncollateralized interest payments; and (iv) any uncollateralized repayment of principal at maturity (these uncollateralized amounts constitute the "residual risk"). In the event of a default with respect to collateralized Brady Bonds as a result of which the payment obligations of the issuer are accelerated, the U.S. Treasury Zero Coupon Obligations held as collateral for the payment of principal will not be distributed to investors, nor will such obligations be sold and the proceeds
8
distributed. The collateral will be held by the collateral agent to the scheduled maturity of the defaulted Brady Bonds, which will continue to be outstanding, at which time the face amount of the collateral will equal the principal payments due on the Brady Bonds in the normal course. However, Brady Bonds should be viewed as speculative in light of the history of defaults with respect to commercial bank loans by public and private entities of countries issuing Brady Bonds.
Cash Equivalents: Cash equivalents are short-term fixed income securities comprising:
(1) Time deposits, certificates of deposit (including marketable variable rate certificates of deposit) and bankers' acceptances issued by a commercial bank or savings and loan association. Time deposits are non-negotiable deposits maintained in a banking institution for a specified period of time at a stated interest rate. Certificates of deposit are negotiable short-term obligations issued by commercial banks or savings and loan associations against funds deposited in the issuing institution. Variable rate certificates of deposit are certificates of deposit on which the interest rate is periodically adjusted prior to their stated maturity based upon a specified market rate. A bankers' acceptance is a time draft drawn on a commercial bank by a borrower, usually in connection with an international commercial transaction (to finance the import, export, transfer or storage of goods).
Each Portfolio may invest in obligations of U.S. banks, foreign branches of U.S. banks (Eurodollars) and U.S. branches of foreign banks (Yankee dollars). Euro and Yankee dollar investments will involve some of the same risks of investing in international securities that are discussed in various foreign investing sections of this SAI.
A Portfolio will not invest in any security issued by a commercial bank unless (i) the bank has total assets of at least $1 billion, or the equivalent in other currencies, or, in the case of domestic banks which do not have total assets of at least $1 billion, the aggregate investment made in any one such bank is limited to $250,000 principal amount per certificate (a temporary increase from $100,000, which is due to expire on December 31, 2013) and the principal amount of such investment is insured in full by the Federal Deposit Insurance Corporation ("FDIC"), (ii) in the case of U.S. banks, it is a member of the FDIC and (iii) in the case of foreign branches of U.S. banks, the security is deemed by the Adviser to be of an investment quality comparable with other debt securities which the Portfolio may purchase.
(2) Each Portfolio may invest in commercial paper (see below) rated at time of purchase by one or more nationally recognized statistical rating organizations ("NRSRO") in one of their two highest categories (e.g., A-l or A-2 by Standard & Poor's Ratings Group, a division of The McGraw-Hill Companies, Inc. ("Standard & Poor's") or Prime 1 or Prime 2 by Moody's Investors Service, Inc. ("Moody's")) or, if not rated, issued by a corporation having an outstanding unsecured debt issue rated high-grade by a NRSRO (e.g., A or better by Moody's, Standard & Poor's or Fitch IBCA, Inc. ("Fitch"));
(3) Short-term corporate obligations rated high-grade at the time of purchase by a NRSRO (e.g., A or better by Moody's, Standard & Poor's or Fitch);
(4) U.S. Government obligations including bills, notes, bonds and other debt securities issued by the U.S. Treasury. These are direct obligations of the U.S. Government and differ mainly in interest rates, maturities and dates of issue;
(5) Government Agency securities issued or guaranteed by U.S. Government sponsored instrumentalities and Federal agencies. These include securities issued by the Federal Home Loan Banks, Federal Land Bank, Farmers Home Administration, Farm Credit Banks, Federal Intermediate Credit Bank, Fannie Mae, Federal Financing Bank, the Tennessee Valley Authority and others; and
(6) Repurchase agreements collateralized by the securities listed above.
Commercial Paper. Commercial paper refers to short-term fixed income securities with maturities ranging from 1 to 270 days. They are primarily issued by corporations needing to finance large amounts of receivables, but may be issued by banks and other borrowers. Commercial paper is issued either directly or through broker-dealers,
9
and may be discounted or interest-bearing. Commercial paper is unsecured, but is almost always backed by bank lines of credit. Virtually all commercial paper is rated by Moody's or Standard & Poor's.
Commercial paper rated A-1 by Standard & Poor's has the following characteristics: (1) liquidity ratios are adequate to meet cash requirements; (2) long-term senior debt is rated "A" or better; (3) the issuer has access to at least two additional channels of borrowing; (4) basic earnings and cash flow have an upward trend with allowance made for unusual circumstances; (5) typically, the issuer's industry is well established and the issuer has a strong position within the industry; and (6) the reliability and quality of management are unquestioned. Relative strength or weakness of the above factors determine whether the issuer's commercial paper is A-1, A-2 or A-3.
The rating Prime-1 is the highest commercial paper rating assigned by Moody's. Among the factors considered by Moody's in assigning ratings are the following: (1) evaluation of the management of the issuer; (2) economic evaluation of the issuer's industry or industries and the appraisal of speculative-type risks which may be inherent in certain areas; (3) evaluation of the issuer's products in relation to competition and customer acceptance; (4) liquidity; (5) amount and quality of long-term debt; (6) trend of earnings over a period of ten years; (7) financial strength of a parent company and the relationships that exist with the issuer; and (8) recognition by the management of obligations which may be present or may arise as a result of public interest questions and preparations to meet such obligations.
Commercial Paper: See Cash Equivalents.
Common Stock: Common stocks are equity securities representing an ownership interest in a corporation, entitling the shareholder to voting rights and receipt of dividends paid based on proportionate ownership.
Contracts for Difference ("CFDs"): The Mid Cap Growth Portfolio may purchase CFDs. A CFD is a privately negotiated contract between two parties, buyer and seller, stipulating that the seller will pay to or receive from the buyer the difference between the nominal value of the underlying instrument at the opening of the contract and that instrument's value at the end of the contract. The underlying instrument may be a single security, stock basket or index. A CFD can be set up to take either a short or long position on the underlying instrument. The buyer and seller are typically both required to post margin, which is adjusted daily. The buyer will also pay to the seller a financing rate on the notional amount of the capital employed by the seller less the margin deposit. A CFD is usually terminated at the buyer's initiative. The seller of the CFD will simply match the exposure of the underlying instrument in the open market and the parties will exchange whatever payment is due.
As is the case with owning any financial instrument, there is the risk of loss associated with buying a CFD. For example, if the Portfolio buys a long CFD and the underlying security is worth less at the end of the contract, the Portfolio would be required to make a payment to the seller and would suffer a loss. Also, there may be liquidity risk if the underlying instrument is illiquid because the liquidity of a CFD is based on the liquidity of the underlying instrument. A further risk is that adverse movements in the underlying security will require the buyer to post additional margin. CFDs also carry counterparty risk, i.e., the risk that the counterparty to the CFD transaction may be unable or unwilling to make payments or to otherwise honor its financial obligations under the terms of the contract. If the counterparty were to do so, the value of the contract, and of the Portfolio's shares, may be reduced. The Portfolio will not enter into a CFD transaction that is inconsistent with its investment objective, policies and strategies.
Convertibles: A convertible security is a bond, debenture, note, preferred stock, right, warrant or other security that may be converted into or exchanged for a prescribed amount of common stock or other security of the same or a different issuer or into cash within a particular period of time at a specified price or formula. A convertible security generally entitles the holder to receive interest paid or accrued on debt securities or the dividend paid on preferred stock until the convertible security matures or is redeemed, converted or exchanged. Before conversion, convertible securities generally have characteristics similar to both debt and equity securities. The value of convertible securities tends to decline as interest rates rise and, because of the conversion feature, tends to vary with fluctuations in the market value of the underlying securities. Convertible securities ordinarily provide a stream of income with generally higher yields than those of common stock of the same or similar issuers. Convertible securities generally rank senior to common stock in a corporation's capital structure but are usually
10
subordinated to comparable nonconvertible securities. Convertible securities generally do not participate directly in any dividend increases or decreases of the underlying securities although the market prices of convertible securities may be affected by any dividend changes or other changes in the underlying securities. Certain of the convertible securities in which a Portfolio may invest are rated below investment grade or are unrated. The prices of such securities are likely to be more sensitive to adverse economic changes, resulting in increased volatility of market prices of these securities during periods of economic uncertainty, or adverse individual corporate developments, than higher-rated securities. In addition, during an economic downturn or substantial period of rising interest rates, lower rated issuers may experience financial stress.
Corporates: Corporate bonds ("Corporates") are fixed income securities issued by private corporations. Bondholders, as creditors, have a prior legal claim over common and preferred stockholders of the corporation as to both income and assets for the principal and interest due to the bondholder. A Portfolio will buy Corporates subject to any quality constraints. If a Portfolio holds a security that is downgraded, the Portfolio may retain the security if the Adviser deems retention of the security to be in the best interests of the Portfolio.
Depositary Receipts: Depositary receipts are Global Depositary Receipts ("GDRs"), European Depositary Receipts ("EDRs") and other similar types of depositary shares. Depositary receipts are securities that can be traded in U.S. or foreign securities markets but which represent ownership interests in a security or pool of securities by a foreign or U.S. corporation. Depositary receipts may be sponsored or unsponsored. The depositary of unsponsored depositary receipts may provide less information to receipt holders.
Holders of unsponsored GDRs and EDRs generally bear all the costs associated with establishing the unsponsored GDRs and EDRs. The depositary of unsponsored GDRs and EDRs is under no obligation to distribute shareholder communications received from the underlying issuer or to pass through to the holders of the unsponsored GDRs and EDRs voting rights with respect to the deposited securities or pool of securities. GDRs and EDRs are not necessarily denominated in the same currency as the underlying securities to which they may be connected. Generally, GDRs or EDRs in registered form are designed for use in the U.S. securities market and GDRs or EDRs in bearer form are designed for use in securities markets outside the United States. Portfolios may invest in sponsored and unsponsored GDRs and EDRs. For purposes of the Fund's investment policies, a Portfolio's investments in GDRs or EDRs will be deemed to be investments in the underlying securities.
Derivatives: Certain Portfolios may, but are not required to, use various derivatives and related investment strategies as described below. Derivatives may be used for a variety of purposes including hedging, risk management, portfolio management or to earn income. Any or all of the investment techniques described herein may be used at any time and there is no particular strategy that dictates the use of one technique rather than another, as the use of any derivative by a Portfolio is a function of numerous variables, including market conditions. A Portfolio complies with applicable regulatory requirements when using derivatives, including the segregation or earmarking of cash or liquid assets when mandated by SEC rules or SEC staff positions. Although the Adviser seeks to use derivatives to further a Portfolio's investment objective, no assurance can be given that the use of derivatives will achieve this result.
General Risks of Derivatives. Derivatives utilized by a Portfolio may involve the purchase and sale of derivative instruments. A derivative is a financial instrument the value of which depends upon (or derives from) the value of another asset, security, interest rate or index. Derivatives may relate to a wide variety of underlying instruments, including equity and debt securities, indexes, interest rates, currencies and other assets. Certain derivative instruments which a Portfolio may use and the risks of those instruments are described in further detail below. A Portfolio may in the future also utilize derivatives techniques, instruments and strategies that may be newly developed or permitted as a result of regulatory changes, consistent with a Portfolio's investment objective and policies. Such newly developed techniques, instruments and strategies may involve risks different than or in addition to those described herein. No assurance can be given that any derivatives strategy employed by a Portfolio will be successful.
The risks associated with the use of derivatives are different from, and possibly greater than, the risks associated with investing directly in the instruments underlying such derivatives. Derivatives are highly specialized instruments that require investment techniques and risk analyses different from other portfolio investments. The
11
use of derivative instruments requires an understanding not only of the underlying instrument but also of the derivative itself. Certain risk factors generally applicable to derivative transactions are described below.
• Derivatives are subject to the risk that the market value of the derivative itself or the market value of underlying instruments will change in a way adverse to a Portfolio's interests. A Portfolio bears the risk that the Adviser may incorrectly forecast future market trends and other financial or economic factors or the value of the underlying security, index, interest rate or currency when establishing a derivatives position for a Portfolio.
• Derivatives may be subject to pricing risk, which exists when a derivative becomes extraordinarily expensive (or inexpensive) relative to historical prices or corresponding instruments. Under such market conditions, it may not be economically feasible to initiate a transaction or liquidate a position at an advantageous time or price.
• Many derivatives are complex and often valued subjectively. Improper valuations can result in increased payment requirements to counterparties or a loss of value to a Portfolio.
• Using derivatives as a hedge against a portfolio investment subjects a Portfolio to the risk that the derivative will have imperfect correlation with the portfolio investment, which could result in a Portfolio incurring substantial losses. This correlation risk may be greater in the case of derivatives based on an index or other basket of securities, as the portfolio securities being hedged may not duplicate the components of the underlying index or the basket may not be of exactly the same type of obligation as those underlying the derivative. The use of derivatives for "cross hedging" purposes (using a derivative based on one instrument as a hedge on a different instrument) may also involve greater correlation risks.
• While using derivatives for hedging purposes can reduce a Portfolio's risk of loss, it may also limit a Portfolio's opportunity for gains or result in losses by offsetting or limiting a Portfolio's ability to participate in favorable price movements in portfolio investments.
• Derivatives transactions for non-hedging purposes involve greater risks and may result in losses which would not be offset by increases in the value of portfolio securities or declines in the cost of securities to be acquired. In the event that a Portfolio enters into a derivatives transaction as an alternative to purchasing or selling the underlying instrument or in order to obtain desired exposure to an index or market, a Portfolio will be exposed to the same risks as are incurred in purchasing or selling the underlying instruments directly.
• The use of certain derivatives transactions involves the risk of loss resulting from the insolvency or bankruptcy of the counterparty to the contract or the failure by the counterparty to make required payments or otherwise comply with the terms of the contract. In the event of default by a counterparty, a Portfolio may have contractual remedies pursuant to the agreements related to the transaction.
• Liquidity risk exists when a particular derivative is difficult to purchase or sell. If a derivative transaction is particularly large or if the relevant market is illiquid, a Portfolio may be unable to initiate a transaction or liquidate a position at an advantageous time or price.
• Certain derivatives transactions are not entered into or traded on exchanges or in markets regulated by the U.S. Commodity Futures Trading Commission ("CFTC") or the SEC. Instead, such over-the-counter ("OTC") derivatives are entered into directly by a Portfolio and a counterparty and may be traded only through financial institutions acting as market makers. OTC derivatives transactions can only be entered into with a willing counterparty that is approved by the Adviser in accordance with guidelines established by the Board. Where no such counterparty is available, a Portfolio will be unable to enter into a desired OTC transaction. There also may be greater risk that no liquid secondary market in the trading of OTC derivatives will exist, in which case a Portfolio may be required to hold such instruments until exercise, expiration or maturity. Many of the protections afforded to exchange participants are not available to participants in OTC derivatives transactions. OTC derivatives transactions are not subject to the guarantee of an exchange or clearinghouse and, as a result, a Portfolio would bear greater risk of default by the counterparties to such transactions.
• A Portfolio may be required to make physical delivery of portfolio securities underlying a derivative in order to close out a derivatives position or to sell portfolio securities at a time or price at which it may be
12
disadvantageous to do so in order to obtain cash to close out or to maintain a derivatives position.
• As a result of the structure of certain derivatives, adverse changes in the value of the underlying instrument can result in losses substantially greater than the amount invested in the derivative itself. Certain derivatives have the potential for unlimited loss, regardless of the size of the initial investment.
• Certain derivatives may be considered illiquid and therefore subject to a Portfolio's limitation on investments in illiquid securities.
• Derivatives transactions conducted outside the United States may not be conducted in the same manner as those entered into on U.S. exchanges, and may be subject to different margin, exercise, settlement or expiration procedures. Brokerage commissions, clearing costs and other transaction costs may be higher on foreign exchanges. Many of the risks of OTC derivatives transactions are also applicable to derivatives transactions conducted outside the United States. Derivatives transactions conducted outside the United States are subject to the risk of governmental action affecting the trading in, or the prices of, foreign securities, currencies and other instruments. The value of such positions could be adversely affected by foreign political and economic factors; lesser availability of data on which to make trading decisions; delays on a Portfolio's ability to act upon economic events occurring in foreign markets; and less liquidity than U.S. markets.
• Currency derivatives are subject to additional risks. Currency derivatives transactions may be negatively affected by government exchange controls, blockages and manipulations. Currency exchange rates may be influenced by factors extrinsic to a country's economy. There is no systematic reporting of last sale information with respect to foreign currencies. As a result, the available information on which trading in currency derivatives will be based may not be as complete as comparable data for other transactions. Events could occur in the foreign currency market which will not be reflected in currency derivatives until the following day, making it more difficult for a Portfolio to respond to such events in a timely manner.
Regulatory Matters. As described herein, a Portfolio may be required to cover its potential economic exposure to certain derivatives transactions by holding an offsetting financial position and/or segregating or earmarking cash or liquid assets equal in value to a Portfolio's potential economic exposure under the transaction. A Portfolio will cover such transactions as described herein or in such other manner in accordance with applicable laws and regulations. Assets used to cover derivatives transactions cannot be sold while the derivatives position is open, unless they are replaced by other appropriate assets. Segregated or earmarked cash or liquid assets and assets held in margin accounts are not otherwise available to a Portfolio for investment purposes. If a large portion of a Portfolio's assets are used to cover derivatives transactions or are otherwise segregated or earmarked, it could affect portfolio management or a Portfolio's ability to meet redemption requests or other current obligations. With respect to derivatives which are cash settled (i.e., have no physical delivery requirement), a Portfolio is permitted to set aside liquid assets in an amount equal to a Portfolio's daily marked-to-market net obligations (i.e., a Portfolio's daily net liability) under the derivative, if any, rather than the derivative's full notional value or the market value of the instrument underlying the derivative, as applicable. By setting aside assets equal to only its net obligations under cash-settled derivatives, a Portfolio will have the ability to employ leverage to a greater extent than if a Portfolio were required to segregate assets equal to the full notional amount of the derivative or the market value of the underlying instrument, as applicable.
Regulatory developments affecting the exchange-traded and OTC derivatives markets may impair a Portfolio's ability to manage or hedge its investment portfolio through the use of derivatives. The Dodd-Frank Wall Street Reform and Consumer Protection Act (the "Dodd-Frank Act") and the rules promulgated thereunder may limit the ability of a Portfolio to enter into one or more exchange-traded or OTC derivatives transactions. In particular, pursuant to authority granted under the Dodd-Frank Act, the CFTC in October 2011 promulgated final rules that impose new federal position limits on listed futures and options contracts on, and economically equivalent OTC derivatives referencing, 28 individual agricultural, metal and energy commodities. A Portfolio's futures and options positions in these 28 contracts will be aggregated with its positions, if any, in economically equivalent OTC derivatives referencing these contracts. These new position limits, which will be imposed on a Portfolio and its counterparties, may impact a Portfolio's ability to invest in futures, options and swaps in a manner that efficiently meets its investment objectives. Derivatives positions of all investment companies advised by the
13
Adviser are combined for purposes of these limits. An exchange may order the liquidation of positions found to be in excess of these limits and may impose certain other sanctions or restrictions.
A Portfolio's use of derivatives may be limited by the requirements of the Internal Revenue Code of 1986, as amended (the "Code"), for qualification as a regulated investment company for U.S. federal income tax purposes.
In February 2012, the CFTC adopted certain regulatory changes that may impact the Fund by subjecting the Adviser to registration with the CFTC as the commodity pool operator ("CPO") of a Portfolio, unless the Portfolio is able to comply with certain trading and marketing limitations on its investments in futures and certain other instruments. If the Adviser becomes subject to CFTC registration as a CPO, the disclosure and operations of a Portfolio would need to comply with all applicable CFTC regulations. Compliance with these additional registration and regulatory requirements would increase Portfolio expenses.
Emerging Market Securities: The Portfolios may invest in emerging market securities. An emerging market security is one issued by a foreign government or private issuer that has one or more of the following characteristics: (i) its principal securities trading market is in an emerging market or developing country, (ii) alone or on a consolidated basis it derives 50% or more of its annual revenue from goods produced, sales made or services performed in an emerging market or (iii) it is organized under the laws of, or has a principal office in, an emerging market or developing country. Based on these criteria it is possible for a security to be considered issued by an issuer in more than one country. Therefore, it is possible for the securities of any issuer that has one or more of these characteristics in connection with any emerging market or developing country not to be considered an emerging market security if it has one or more of these characteristics in connection with a developed country.
Emerging market describes any country which is generally considered to be an emerging or developing country by major organizations in the international financial community, such as the International Bank for Reconstruction and Development (more commonly known as the World Bank) and the International Finance Corporation. Emerging markets can include every nation in the world except the United States, Canada, Japan, Australia, New Zealand and most nations located in Western Europe.
The economies of individual emerging market or developing countries may differ favorably or unfavorably from the U.S. economy in such respects as growth of gross domestic product, rate of inflation, currency depreciation, capital reinvestment, resource self-sufficiency and balance of payments position. Further, the economies of developing countries generally are heavily dependent upon international trade and, accordingly, have been, and may continue to be, adversely affected by trade barriers, exchange controls, managed adjustments in relative currency values and other protectionist measures. These economies also have been, and may continue to be, adversely affected by economic conditions in the countries with which they trade.
Prior governmental approval for foreign investments may be required under certain circumstances in some emerging market or developing countries, and the extent of foreign investment in certain fixed income securities and domestic companies may be subject to limitations in other emerging market or developing countries. Foreign ownership limitations also may be imposed by the charters of individual companies in emerging market or developing countries to prevent, among other concerns, violation of foreign investment limitations. Repatriation of investment income, capital and the proceeds of sales by foreign investors may require governmental registration and/or approval in some emerging countries. A Portfolio could be adversely affected by delays in, or a refusal to grant, any required governmental registration or approval for such repatriation. Any investment subject to such repatriation controls will be considered illiquid if it appears reasonably likely that this process will take more than seven days.
Investment in emerging market or developing countries may entail purchasing securities issued by or on behalf of entities that are insolvent, bankrupt, in default or otherwise engaged in an attempt to reorganize or reschedule their obligations, and in entities that have little or no proven credit rating or credit history. In any such case, the issuer's poor or deteriorating financial condition may increase the likelihood that the investing Portfolio will experience losses or diminution in available gains due to bankruptcy, insolvency or fraud. Emerging market or developing countries also pose the risk of nationalization, expropriation or confiscatory taxation, political changes, government regulation, social instability or diplomatic developments (including war) that could adversely
14
affect the economies of such countries or the value of a Portfolio's investments in those countries. In addition, it may be difficult to obtain and enforce a judgment in a court outside the United States.
Portfolios that invest in emerging markets may also be exposed to an extra degree of custodial and/or market risk, especially where the securities purchased are not traded on an official exchange or where ownership records regarding the securities are maintained by an unregulated entity (or even the issuer itself).
Equity Securities: Equity securities generally represent an ownership interest in an issuer, or may be convertible into or represent a right to acquire an ownership interest in an issuer. While there are many types of equity securities, prices of all equity securities will fluctuate. Economic, political and other events may affect the prices of broad equity markets. For example, changes in inflation or consumer demand may affect the prices of equity securities generally in the United States. Similar events also may affect the prices of particular equity securities. For example, news about the success or failure of a new product may affect the price of a particular issuer's equity securities. Equity securities include the following types of instruments, each of which is described in this SAI: ADRs, Common Stock, Convertibles, Investment Companies, Preferred Stock, Limited Partnership Interests, Rights and Warrants.
Fixed Income Securities: Fixed income securities generally represent an issuer's obligation to repay to the investor (or lender) the amount borrowed plus interest over a specified time period. A typical fixed income security specifies a fixed date when the amount borrowed (principal) is due in full, known as the maturity date, and specifies dates when periodic interest (coupon) payments will be made over the life of the security.
Fixed income securities come in many varieties and may differ in the way that interest is calculated, the amount and frequency of payments, the type of collateral, if any, and the presence of special features (e.g., conversion rights). Prices of fixed income securities fluctuate and, in particular, are subject to several key risks including, but not limited to, interest rate risk, credit risk, prepayment risk, and spread risk. Fixed income securities include the following types of instruments, each of which is described in this SAI: Agencies, Asset-Backed Securities, Cash Equivalents, Convertibles, Corporates, Floaters, High Yield Securities, Inverse Floaters, Loan Participations and Assignments, Mortgage Related Securities, Municipals, Preferred Stock, Public Bank Loans, Repurchase Agreements, U.S. Government Securities, When, As and If Issued Securities, When-Issued and Delayed Delivery Securities and Forward Commitments, Yankee and Eurobond Obligations and Zero Coupons.
Interest rate risk arises due to general changes in the level of market rates after the purchase of a fixed income security. Generally, the values of fixed income securities vary inversely with changes in interest rates. During periods of falling interest rates, the values of most outstanding fixed income securities generally rise and during periods of rising interest rates, the values of most fixed income securities generally decline. While fixed income securities with longer final maturities often have higher yields than those with shorter maturities, they usually possess greater price sensitivity to changes in interest rates and other factors. Traditionally, the remaining term to maturity has been used as a barometer of a fixed income security's sensitivity to interest rate changes. This measure, however, considers only the time until the final principal payment and takes no account of the pattern or amount of principal or interest payments prior to maturity. Duration combines consideration of yield, coupon, interest and principal payments, final maturity, and call (prepayment) features. Duration measures the likely percentage change in a fixed income security's price for a small parallel shift in the general level of interest rates; it is also an estimate of the weighted average life of the remaining cash flows of a fixed income security. In almost all cases, the duration of a fixed income security is shorter than its term to maturity.
Credit risk, also known as default risk, represents the possibility that an issuer may be unable to meet scheduled interest and principal payment obligations. It is most often associated with corporate bonds, although it can be present in other fixed income securities, as well (note that the market generally assumes that obligations of the U.S. Treasury are free from credit risk). Credit ratings and quantitative models attempt to measure the degree of credit risk in fixed income securities, and provide insight as to whether prevailing yield spreads afford sufficient compensation for such risk. Other things being equal, fixed income securities with high degrees of credit risk should trade in the market at lower prices (and higher yields) than fixed income securities with low degrees of credit risk.
15
Prepayment risk, also known as call risk, arises due to the issuer's ability to prepay all or most of the fixed income security prior to the stated final maturity date. Prepayments generally rise in response to a decline in interest rates as debtors take advantage of the opportunity to refinance their obligations. This risk is often associated with mortgage securities where the underlying mortgage loans can be refinanced, although it can also be present in corporate or other types of bonds with call provisions. When a prepayment occurs, a Portfolio may be forced to reinvest in lower yielding fixed income securities. Quantitative models are designed to help assess the degree of prepayment risk, and provide insight as to whether prevailing yield spreads afford sufficient compensation for such risk.
Spread risk is the potential for the value of a Portfolio's assets to fall due to the widening of spreads. Fixed income securities generally compensate for greater credit risk by paying interest at a higher rate. The difference (or "spread") between the yield of a security and the yield of a benchmark, such as a U.S. Treasury security with a comparable maturity, measures the additional interest paid for credit risk. As the spread on a security widens (or increases), the price (or value) of the security falls. Spread widening may occur, among other reasons, as a result of market concerns over the stability of the market, excess supply, general credit concerns in other markets, security- or market-specific credit concerns or general reductions in risk tolerance.
Economic, political and other events also may affect the prices of broad fixed income markets, although the risks associated with such events are transmitted to the market via changes in the prevailing levels of interest rates, credit risk, prepayment risk or spread risk.
Floaters: Floaters are fixed income securities with a floating or variable rate of interest, i.e., the rate of interest varies with changes in specified market rates or indices, such as the prime rate, or at specified intervals. Certain floating or variable rate obligations may carry a demand feature that permits the holder to tender them back to the issuer of the underlying instrument, or to a third party, at par value prior to maturity. When the demand feature of certain floating or variable rate obligations represents an obligation of a foreign entity, the demand feature will be subject to certain risks discussed under the various foreign investing sections.
Foreign Currency: Certain Portfolios investing in foreign securities will regularly transact security purchases and sales in foreign currencies. These Portfolios may hold foreign currency or purchase or sell currencies on a forward basis. See Forwards, below.
Foreign currency warrants. Portfolios may invest in foreign currency warrants, which entitle the holder to receive from the issuer an amount of cash (generally, for warrants issued in the United States, in U.S. dollars) which is calculated pursuant to a predetermined formula and based on the exchange rate between a specified foreign currency and the U.S. dollar as of the exercise date of the warrant. Foreign currency warrants generally are exercisable upon their issuance and expire as of a specified date and time.
Foreign currency warrants have been issued in connection with U.S. dollar-denominated debt offerings by major corporate issuers in an attempt to reduce the foreign currency exchange risk which, from the point of view of prospective purchasers of the securities, is inherent in the international fixed income marketplace. Foreign currency warrants may attempt to reduce the foreign exchange risk assumed by purchasers of a security by, for example, providing for a supplemental payment in the event that the U.S. dollar depreciates against the value of a major foreign currency such as the Japanese Yen or the Euro. The formula used to determine the amount payable upon exercise of a foreign currency warrant may make the warrant worthless unless the applicable foreign currency exchange rate moves in a particular direction (e.g., unless the U.S. dollar appreciates or depreciates against the particular foreign currency to which the warrant is linked or indexed). Foreign currency warrants are severable from the debt obligations with which they may be offered, and may be listed on exchanges.
Foreign currency warrants may be exercisable only in certain minimum amounts, and an investor wishing to exercise warrants who possesses less than the minimum number required for exercise may be required either to sell the warrants or to purchase additional warrants, thereby incurring additional transaction costs. In the case of any exercise of warrants, there may be a time delay between the time a holder of warrants gives instructions to exercise and the time the exchange rate relating to exercise is determined, during which time the exchange rate could change significantly, thereby affecting both the market and cash settlement values of the warrants being exercised. The expiration date of the warrants may be accelerated if the warrants should be delisted from an exchange or if their
16
trading should be suspended permanently, which would result in the loss of any remaining "time value" of the warrants (i.e., the difference between the current market value and the exercise value of the warrants), and, in the case where the warrants were "out-of-the-money," in a total loss of the purchase price of the warrants.
Foreign currency warrants are generally unsecured obligations of their issuers and are not standardized foreign currency options issued by the Options Clearing Corporation ("OCC"). Unlike foreign currency options issued by the OCC, the terms of foreign exchange warrants generally will not be amended in the event of governmental or regulatory actions affecting exchange rates or in the event of the imposition of other regulatory controls affecting the international currency markets. The initial public offering price of foreign currency warrants is generally considerably in excess of the price that a commercial user of foreign currencies might pay in the interbank market for a comparable option involving significantly larger amounts of foreign currencies. Foreign currency warrants are subject to complex political or economic factors.
Principal exchange rate linked securities. Principal exchange rate linked securities are debt obligations the principal on which is payable at maturity in an amount that may vary based on the exchange rate between the U.S. dollar and a particular foreign currency at or about that time. The return on "standard" principal exchange rate linked securities is enhanced if the foreign currency to which the security is linked appreciates against the U.S. dollar, and is adversely affected by increases in the foreign exchange value of the U.S. dollar; "reverse" principal exchange rate linked securities are like the "standard" securities, except that their return is enhanced by increases in the value of the U.S. dollar and adversely impacted by increases in the value of foreign currency. Interest payments on the securities are generally made in U.S. dollars at rates that reflect the degree of foreign currency risk assumed or given up by the purchaser of the notes (i.e., at relatively higher interest rates if the purchaser has assumed some of the foreign exchange risk, or relatively lower interest rates if the issuer has assumed some of the foreign exchange risk, based on the expectations of the current market). Principal exchange rate linked securities may in limited cases be subject to acceleration of maturity (generally, not without the consent of the holders of the securities), which may have an adverse impact on the value of the principal payment to be made at maturity.
Performance indexed paper. Performance indexed paper is U.S. dollar-denominated commercial paper the yield of which is linked to certain foreign exchange rate movements. The yield to the investor will be within a range stipulated at the time of purchase of the obligation, generally with a guaranteed minimum rate of return that is below, and a potential maximum rate of return that is above, market yields on U.S. dollar-denominated commercial paper, with both the minimum and maximum rates of return on the investment corresponding to the minimum and maximum values of the spot exchange rate two business days prior to maturity.
Foreign Securities: Foreign securities include Brady Bonds, Depositary Receipts, Emerging Market Securities, Foreign Currency, Foreign Equity Securities (defined below), Foreign Fixed Income Securities (defined below) and Investment Funds. Investing in foreign securities involves certain special risks not typically associated with investing in domestic securities. Since the securities of foreign issuers are frequently denominated in foreign currencies, and since the Portfolios may temporarily hold uninvested reserves in bank deposits in foreign currencies, the Portfolios will be affected favorably or unfavorably by changes in currency rates and in exchange control regulations, and may incur costs in connection with conversions between various currencies. Certain Portfolios may enter into foreign currency forward exchange contracts to hedge their respective holdings and commitments against changes in the level of future currency rates. See Forwards, below. Such contracts involve an obligation to purchase or sell a specific currency at a future date at a price set at the time of the contract.
As non-U.S. companies are not generally subject to uniform accounting, auditing and financial reporting standards and practices comparable to those applicable to domestic issuers, there may be less publicly available information about certain foreign securities than about domestic securities. Securities of some foreign issuers are generally less liquid and more volatile than securities of comparable domestic companies. There is generally less government supervision and regulation of stock exchanges, brokers and listed issuers than in the United States. In addition, with respect to certain foreign countries, there is the possibility of expropriation or confiscatory taxation, political or social instability, or diplomatic developments which could affect U.S. investments in those countries.
Although the Portfolios will endeavor to achieve most favorable execution costs in their portfolio transactions, fixed commissions on many foreign exchanges are generally higher than negotiated commissions on U.S. exchanges. In addition, investments in certain foreign markets which have historically been considered stable may
17
become more volatile and subject to increased risk due to ongoing developments and changing conditions in such markets. Moreover, the growing interconnectivity of global economies and financial markets has increased the probability that adverse developments and conditions in one country or region will affect the stability of economies and financial markets in other countries or regions. In addition, it is expected that the expenses for custodian arrangements of the Portfolio's foreign securities will be somewhat greater than the expenses for the custodian arrangements for handling U.S. securities of equal value.
Certain foreign governments levy withholding taxes against dividend and interest income. Although in some countries a portion of these taxes is recoverable, the non-recovered portion of foreign withholding taxes will reduce the income received from investments in such countries. Certain Portfolios may be able to claim a credit for U.S. tax purposes with respect to any such foreign taxes.
The Adviser considers an issuer to be from a particular country or geographic region if (i) its principal securities trading market is in that country or geographic region; (ii) alone or on a consolidated basis it derives 50% or more of its annual revenue from goods produced, sales made or services performed in that country or geographic region; or (iii) it is organized under the laws of, or has a principal office in, that country or geographic region. By applying these tests, it is possible that a particular company could be deemed to be from more than one country or geographic region.
Foreign Equity Securities. Foreign equity securities are equity securities of foreign issuers denominated in foreign currency and traded primarily in non-U.S. markets, including Depositary Receipts.
Foreign Fixed Income Securities. Foreign fixed income securities are fixed income securities which may be U.S. dollar denominated or denominated in a foreign currency, which include: (1) obligations issued or guaranteed by foreign national governments, their agencies, instrumentalities, or political subdivisions; (2) debt securities issued, guaranteed or sponsored by supranational organizations established or supported by several national governments, including the World Bank, the European Community, the Asian Development Bank and others; (3) non-government foreign corporate debt securities; and (4) foreign mortgage securities and various other mortgages and asset-backed securities.
Forwards: A foreign currency forward exchange contract is a negotiated agreement between two parties to exchange specified amounts of two or more currencies at a specified future time at a specified rate. The rate specified by the foreign currency forward exchange contract can be higher or lower than the spot rate between the currencies that are the subject of the contract. Currency futures are similar to foreign currency forward exchange contracts, except that they are traded on an exchange and standardized as to contract size and delivery date. Most currency futures call for payment or delivery in U.S. dollars. Unanticipated changes in currency prices may result in losses to a Portfolio and poorer overall performance for a Portfolio than if it had not entered into foreign currency forward exchange contracts. Certain Portfolios may enter into foreign currency forward exchange contracts under various circumstances. The typical use of a foreign currency forward exchange contract is to "lock in" the price of a security in U.S. dollars or some other foreign currency, which a Portfolio is holding in its portfolio. By entering into a foreign currency forward exchange contract for the purchase or sale, for a fixed amount of dollars or other currency, of the amount of foreign currency involved in the underlying security transactions, a Portfolio may be able to protect itself against a possible loss resulting from an adverse change in the relationship between the U.S. dollar or other currency which is being used for the security purchase and the foreign currency in which the security is denominated during the period between the date on which the security is purchased or sold and the date on which payment is made or received. The Adviser also may from time to time utilize foreign currency forward exchange contracts for other purposes. For example, they may be used to hedge a foreign security held in the portfolio or a security which pays out principal tied to an exchange rate between the U.S. dollar and a foreign currency, against a decline in value of the applicable foreign currency. They also may be used to lock in the current exchange rate of the currency in which those securities anticipated to be purchased are denominated. At times, a Portfolio may enter into "cross-currency" hedging transactions involving currencies other than those in which securities are held or proposed to be purchased are denominated.
18
A Portfolio will not enter into foreign currency forward exchange contracts or maintain a net exposure to these contracts where the consummation of the contracts would obligate a Portfolio to deliver an amount of foreign currency in excess of the value of a Portfolio's portfolio securities.
When required by law, a Portfolio will segregate or earmark cash, U.S. government securities or other appropriate liquid portfolio securities in an amount equal to the value of a Portfolio's total assets committed to the consummation of foreign currency forward exchange contracts entered into under the circumstances set forth above. If the value of the securities so earmarked declines, additional cash or securities will be segregated or earmarked on a daily basis so that the value of such securities will equal the amount of a Portfolio's commitments with respect to such contracts.
A Portfolio may be limited in its ability to enter into hedging transactions involving foreign currency forward exchange contracts by the Code requirements relating to qualification as a regulated investment company.
Foreign currency forward exchange contracts may limit gains on portfolio securities that could otherwise be realized had they not been utilized and could result in losses. The contracts also may increase a Portfolio's volatility and may involve a significant amount of risk relative to the investment of cash.
Futures Contracts: A futures contract is a standardized agreement to buy or sell a specific quantity of a commodity at a specific price at a specific future time (the "settlement date"). Futures contracts may be based on, among other things, a specified equity security (securities futures), a specified debt security or reference rate (interest rate futures), the value of a specified securities index (index futures) or the value of a foreign currency (forward contracts and currency futures). The value of a futures contract tends to increase and decrease in tandem with the value of the underlying instrument. The buyer of a futures contract agrees to purchase the underlying instrument on the settlement date and is said to be "long" the contract. The seller of a futures contract agrees to sell the underlying instrument on the settlement date and is said to be "short" the contract. Futures contracts call for settlement only on the expiration date and cannot be "exercised" at any other time during their term.
Depending on the terms of the particular contract, futures contracts are settled through either physical delivery of the underlying instrument on the settlement date (such as in the case of securities futures based on a specified debt security) or by payment of a cash settlement amount on the settlement date (such as in the case of futures contracts relating to interest rates, foreign currencies and broad-based securities indexes). In the case of cash-settled futures contracts, the settlement amount is equal to the difference between the reference instrument's price on the last trading day of the contract and the reference instrument's price at the time the contract was entered into. Most futures contracts, particularly futures contracts requiring physical delivery, are not held until the settlement date, but instead are offset before the settlement date through the establishment of an opposite and equal futures position (buying a contract that had been sold, or selling a contract that had been purchased). All futures transactions are effected through a clearinghouse associated with the exchange on which the futures are traded.
The buyer and seller of a futures contract are not required to deliver or pay for the underlying commodity unless the contract is held until the settlement date. However, both the buyer and seller are required to deposit "initial margin" with a futures commission merchant when the futures contract is entered into. Initial margin deposits are typically calculated as a percentage of the contract's market value. If the value of either party's position declines, the party will be required to make additional "variation margin" payments to settle the change in value on a daily basis. The process is known as "marking-to-market." Upon the closing of a futures position through the establishment of an offsetting position, a final determination of variation margin will be made and additional cash will be paid by or released to a Portfolio.
In addition, a Portfolio may be required to maintain segregated cash or liquid assets in order to cover futures transactions. A Portfolio will segregate or earmark cash or liquid assets in an amount equal to the difference between the market value of a futures contract entered into by a Portfolio and the aggregate value of the initial and variation margin payments made by a Portfolio with respect to such contract or as otherwise permitted by SEC rules or SEC staff positions. See "Regulatory Matters" above.
19
Additional Risk of Futures Transactions. The risks associated with futures contract transactions are different from, and possibly greater than, the risks associated with investing directly in the underlying instruments. Futures are highly specialized instruments that require investment techniques and risk analyses different from those associated with other portfolio investments. The use of futures requires an understanding not only of the underlying instrument but also of the futures contract itself. Futures may be subject to the risk factors generally applicable to derivatives transactions described herein, and may also be subject to certain additional risk factors, including:
• The risk of loss in buying and selling futures contracts can be substantial. Small price movements in the commodity underlying a futures position may result in immediate and substantial loss (or gain) to a Portfolio.
• Buying and selling futures contracts may result in losses in excess of the amount invested in the position in the form of initial margin. In the event of adverse price movements in the underlying commodity, security, index, currency or instrument, a Portfolio would be required to make daily cash payments to maintain its required margin. A Portfolio may be required to sell portfolio securities, or make or take delivery of the underlying securities in order to meet daily margin requirements at a time when it may be disadvantageous to do so. A Portfolio could lose margin payments deposited with a futures commission merchant if the futures commission merchant breaches its agreement with a Portfolio, becomes insolvent or declares bankruptcy.
• Most exchanges limit the amount of fluctuation permitted in futures contract prices during any single trading day. Once the daily limit has been reached in a particular futures contract, no trades may be made on that day at prices beyond that limit. If futures contract prices were to move to the daily limit for several trading days with little or no trading, a Portfolio could be prevented from prompt liquidation of a futures position and subject to substantial losses. The daily limit governs only price movements during a single trading day and therefore does not limit a Portfolio's potential losses.
• Index futures based upon a narrower index of securities may present greater risks than futures based on broad market indexes, as narrower indexes are more susceptible to rapid and extreme fluctuations as a result of changes in value of a small number of securities.
High Yield Securities: High yield securities are fixed income securities, generally Corporates, Preferred Stocks and Convertibles, rated Ba through C by Moody's or BB through D by Standard & Poor's, and unrated fixed income securities considered to be of equivalent quality. Securities rated less than Baa by Moody's or BBB by Standard & Poor's are classified as non-investment grade securities and are commonly referred to as "junk bonds" or high yield, high risk securities. Such securities carry a high degree of risk and are considered speculative by the major credit rating agencies. See Appendix B for more information about fixed income security ratings. Investment grade securities that a Portfolio holds may be downgraded to below investment grade by the rating agencies. If a Portfolio holds a security that is downgraded, the Portfolio may choose to retain the security.
While fixed income securities rated below investment grade offer high yields, they also normally carry with them a greater degree of risk than securities with higher ratings. Lower-rated bonds are considered speculative by traditional investment standards. High yield securities may be issued as a consequence of corporate restructuring or similar events. Also, high yield securities are often issued by smaller, less credit worthy companies, or by highly leveraged (indebted) firms, which are generally less able than more established or less leveraged firms to make scheduled payments of interest and principal. High yield securities issued under these circumstances pose substantial risks. The price movement of high yield securities is influenced less by changes in interest rates and more by the financial and business position of the issuing corporation when compared to investment grade bonds. Compared with investment grade securities, the values of high yield securities tend to be more volatile and may react with greater sensitivity to changes in interest rates.
The high yield market is subject to credit risk. Default rates and recoveries fluctuate, driven by numerous factors including the general economy. In addition, the secondary market for high yield securities is generally less liquid than that for investment grade corporate securities. In periods of reduced market liquidity, high yield bond prices may become more volatile, and both the high yield market and a Portfolio may experience sudden and substantial price declines.
20
A lower level of liquidity might have an effect on a Portfolio's ability to value or dispose of such securities. Also, there may be significant disparities in the prices quoted for high yield securities by various dealers. Under such conditions, a Portfolio may find it difficult to value its securities accurately. A Portfolio may also be forced to sell securities at a significant loss in order to meet shareholder redemptions. These factors add to the risks associated with investing in high yield securities.
High yield bonds may also present risks based on payment expectations. For example, high yield bonds may contain redemption or call provisions. If an issuer exercises these provisions in a declining interest rate market, a Portfolio would have to replace the security with a lower yielding security, resulting in a decreased return for investors.
Certain types of high yield bonds are non-income paying securities. For example, zero coupons pay interest only at maturity and payment-in-kind bonds pay interest in the form of additional securities. Payment in the form of additional securities, or interest income recognized through discount accretion, will, however, be treated as ordinary income which will be distributed to shareholders even though the Portfolio does not receive periodic cash flow from these investments.
Inverse Floaters: Inverse floating rate obligations are obligations which pay interest at rates that vary inversely with changes in market rates of interest. Because the interest rate paid to holders of such obligations is generally determined by subtracting a variable or floating rate from a predetermined amount, the interest rate paid to holders of such obligations will decrease as such variable or floating rate increases and increase as such variable or floating rate decreases.
Like most other fixed-income securities, the value of inverse floaters will decrease as interest rates increase. They are more volatile, however, than most other fixed-income securities because the coupon rate on an inverse floater typically changes at a multiple of the change in the relevant index rate. Thus, any rise in the index rate (as a consequence of an increase in interest rates) causes a correspondingly greater drop in the coupon rate of an inverse floater while a drop in the index rate causes a correspondingly greater increase in the coupon of an inverse floater. Some inverse floaters may also increase or decrease substantially because of changes in the rate of prepayments.
Inverse floating rate investments are variable debt instruments that pay interest at rates that move in the opposite direction of prevailing interest rates. Inverse floating rate investments tend to underperform the market for fixed rate bonds in a rising interest rate environment, but tend to outperform the market for fixed rate bonds when interest rates decline or remain relatively stable. Inverse floating rate investments have varying degrees of liquidity.
Investment Companies: Investment company securities are equity securities and include securities of other open-end, closed-end and unregistered investment companies, including exchange-traded funds. The 1940 Act generally prohibits a Portfolio from acquiring more than 3% of the outstanding voting shares of an investment company and limits such investments to no more than 5% of the Portfolio's total assets in any one investment company and no more than 10% in any combination of investment companies. The 1940 Act also prohibits the Portfolios from acquiring in the aggregate more than 10% of the outstanding voting shares of any registered closed-end investment company. A Portfolio may invest in investment company securities of investment companies managed by the Adviser or its affiliates to the extent permitted under the 1940 Act or as otherwise authorized by the SEC. To the extent a Portfolio invests a portion of its assets in investment company securities, those assets will be subject to the risks of the purchased investment company's portfolio securities, and a shareholder in the Portfolio will bear not only his proportionate share of the expenses of the Portfolio, but also, indirectly the expenses of the purchased investment company.
To the extent permitted by applicable law, a Portfolio may invest all or some of its short term cash investments in any money market fund advised or managed by the Adviser or its affiliates. In connection with any such investments, the Portfolio, to the extent permitted by the 1940 Act, will pay its share of all expenses (other than advisory and administrative fees) of a money market fund in which it invests which may result in the Portfolio bearing some additional expenses.
21
Exchange-Traded Funds ("ETFs"). Certain Portfolios may invest in shares of various ETFs. Shares of ETFs have many of the same risks as direct investments in common stocks or bonds. In addition, their market value is expected to rise and fall as the value of the underlying index or bond rises and falls. The market value of their shares may differ from the net asset value of the particular fund. As a shareholder in an ETF (as with other investment companies), a Portfolio would bear its ratable share of that entity's expenses. At the same time, a Portfolio would continue to pay its own investment management fees and other expenses. As a result, a Portfolio and its shareholders, in effect, will be absorbing duplicate levels of fees with respect to investments in ETFs. Further, certain of the ETFs in which the Fund may invest are leveraged. The more the Fund invests in such leveraged ETFs, the more this leverage will magnify any losses on those investments.
Investment Funds: Some emerging market countries have laws and regulations that currently preclude or limit direct foreign investment in the securities of their companies. However, certain emerging market countries through investment funds permit indirect foreign investment in the securities of companies listed and traded on the stock exchanges in these countries. Portfolios that may invest in these Investment Funds will invest in such Investment Funds only where appropriate given that the Portfolio's shareholders will bear indirectly the layer of expenses of the underlying investment funds in addition to their proportionate share of the expenses of the Portfolio.
Investment Grade Securities: Investment grade securities are fixed income securities that are (a) rated by one or more NRSROs in one of the four highest rating categories at the time of purchase (e.g., AAA, AA, A or BBB by Standard & Poor's or Fitch or Aaa, Aa, A or Baa by Moody's); (b) guaranteed by the U.S. Government or a private issuer; or (c) considered by the Adviser to be investment grade quality. Securities rated BBB or Baa represent the lowest of four levels of investment grade securities and are regarded as borderline between definitely sound obligations and those in which the speculative element begins to predominate. Any Portfolio is permitted to hold investment grade securities or "high grade" securities, and may hold unrated securities if the Adviser considers the risks involved in owning that security to be equivalent to the risks involved in holding an investment grade security. The Adviser may retain securities if their ratings fall below investment grade if it deems retention of the security to be in the best interests of the Portfolio.
Mortgage securities, including mortgage pass-throughs and CMOs, deemed investment grade by the Adviser, will either carry a guarantee from an agency or instrumentality of the U.S. Government or a private issuer of the timely payment of principal and interest (such guarantees do not extend to the market value of such securities or the net asset value per share of the Portfolio) or, in the case of unrated securities, are considered by the Adviser to be investment grade quality.
Leverage Risks: Certain transactions may give rise to a form of leverage. To mitigate leveraging risk, the Portfolios will earmark or segregate liquid assets or otherwise cover the transactions that may give rise to such risk as required by applicable rules and regulatory pronouncements of the SEC. The use of leverage may cause a Portfolio to liquidate portfolio positions when it may not be advantageous to do so to satisfy its obligations or to meet segregation requirements. Leverage, including borrowing, may cause a Portfolio to be more volatile than if the Portfolio had not been leveraged. This is because leverage tends to exaggerate the effect of any increase or decrease in the value of the Portfolio's portfolio securities.
Limited Partnerships: A limited partnership interest entitles a Portfolio to participate in the investment return of the partnership's assets as defined by the agreement among the partners. As a limited partner, a Portfolio generally is not permitted to participate in the management of the partnership. However, unlike a general partner whose liability is not limited, a limited partner's liability generally is limited to the amount of its commitment to the partnership. A Portfolio that invests in limited partnership interests may invest to the same extent in limited liability company interests. Limited liability company interests have similar characteristics as limited partnership interests.
Loan Participations and Assignments: Loan participations and assignments are fixed income securities. A Portfolio may invest in fixed rate and floating rate loans ("Loans") arranged through private negotiations between an issuer and one or more financial institutions ("Lenders"). A Portfolio's investments in Loans are expected in most instances to be in the form of participation in Loans ("Participations") and assignments of all or a portion of
22
Loans ("Assignments") from third parties. In the case of a Participation, a Portfolio will have the right to receive payments of principal, interest and any fees to which it is entitled only from the Lender selling the Participation and only upon receipt by the Lender of the payments from the borrower. If a Lender selling a Participation becomes insolvent, a Portfolio may be treated as a general creditor of the Lender and may not benefit from any set-off between the Lender and the borrower. Certain Participations may be structured in a manner designed to avoid purchasers of Participations being subject to the credit risk of the Lender with respect to the Participation. Even under such a structure, in the event of the Lender's insolvency, the Lender's servicing of the Participation may be delayed and the assignability of the Participation may be impaired. A Portfolio will acquire Participations only if the Lender interpositioned between the Portfolio and the borrower is determined by the Adviser to be creditworthy.
When a Portfolio purchases Assignments from Lenders it will acquire direct rights against the borrower on the Loan. However, because Assignments are arranged through private negotiations between potential assignees and potential assignors, the rights and obligations acquired by the Portfolio as the purchaser of an Assignment may differ from, and be more limited than, those held by the assigning Lender. Because there is no liquid market for such securities, the Portfolio anticipates that such securities could be sold only to a limited number of institutional investors. The lack of a liquid secondary market may have an adverse impact on the value of such securities and the Portfolio's ability to dispose of particular Assignments or Participations when necessary to meet the Portfolio's liquidity needs or in response to a specific economic event, such as a deterioration in the creditworthiness of the borrower. The lack of a liquid secondary market for Assignments and Participations also may make it more difficult for the Portfolio to assign a value to those securities for purposes of valuing the Portfolio's holdings and calculating its net asset value.
Participations and Assignments involve a risk of loss in case of default or insolvency of the borrower. In addition, they may offer less legal protection to a Portfolio in the event of fraud or misrepresentation and may involve a risk of insolvency of the Lender. Certain Participations and Assignments may also include standby financing commitments that obligate the investing Portfolio to supply additional cash to the borrower on demand. Participations involving emerging market country issuers may relate to Loans as to which there has been or currently exists an event of default or other failure to make payment when due, and may represent amounts owed to Lenders that are themselves subject to political and economic risks, including the risk of currency devaluation, expropriation, or failure. Those Participations and Assignments present additional risk of default or loss.
Mortgage Related Securities: Mortgage related securities are securities that, directly or indirectly, represent a participation in, or are secured by and payable from, mortgage loans on real property. Mortgage related securities include collateralized mortgage obligations and mortgage-backed securities issued or guaranteed by agencies or instrumentalities of the U.S. Government or by private sector entities.
Mortgage-Backed Securities. With mortgage-backed securities ("MBSs"), many mortgagees' obligations to make monthly payments to their lending institution are pooled together and passed through to investors. The pools are assembled by various governmental, Government-related and private organizations. A Portfolio may invest in securities issued or guaranteed by Government National Mortgage Association ("Ginnie Mae"), the Federal Home Loan Mortgage Corporation ("Freddie Mac") or the Federal National Mortgage Association ("Fannie Mae"), private issuers and other government agencies. MBSs issued by non-agency issuers, whether or not such securities are subject to guarantees, may entail greater risk, since private issuers may not be able to meet their obligations under the policies. If there is no guarantee provided by the issuer, a Portfolio will purchase only MBSs that, at the time of purchase, are rated investment grade by one or more NRSROs or, if unrated, are deemed by the Adviser to be of comparable quality.
MBSs are issued or guaranteed by private sector originators of or investors in mortgage loans and structured similarly to governmental pass-through securities. Because private pass-throughs typically lack a guarantee by an entity having the credit status of a governmental agency or instrumentality, however, they are generally structured with one or more of the types of credit enhancement described below. Fannie Mae and Freddie Mac obligations are not backed by the full faith and credit of the U.S. Government as GNMA certificates are. Freddie Mac securities are supported by Freddie Mac's right to borrow from the U.S. Treasury. Each of GNMA, Fannie Mae and Freddie Mac guarantees timely distributions of interest to certificate holders. Each of GNMA and Fannie Mae also guarantees timely distributions of scheduled principal. Although Freddie Mac has in the past guaranteed only the
23
ultimate collection of principal of the underlying mortgage loan, Freddie Mac now issues MBSs (Freddie Mac Gold PCS) that also guarantee timely payment of monthly principal reductions. Resolution Funding Corporation ("REFCORP") obligations are backed, as to principal payments, by zero coupon U.S. Treasury bonds and, as to interest payments, ultimately by the U.S. Treasury.
There are two methods of trading MBSs. A specified pool transaction is a trade in which the pool number of the security to be delivered on the settlement date is known at the time the trade is made. This is in contrast with the typical MBS transaction, called a TBA (To Be Announced) transaction, in which the type of MBS to be delivered is specified at the time of trade but the actual pool numbers of the securities that will be delivered are not known at the time of the trade. The pool numbers of the pools to be delivered at settlement are announced shortly before settlement takes place. The terms of the TBA trade may be made more specific if desired. Generally, agency pass-through MBSs are traded on a TBA basis. See also "Leverage Risks."
Like fixed income securities in general, MBSs will generally decline in price when interest rates rise. Rising interest rates also tend to discourage refinancings of home mortgages, with the result that the average life of MBSs held by a Portfolio may be lengthened. As average life extends, price volatility generally increases. This extension of average life causes the market price of the MBSs to decrease further when interest rates rise than if their average lives were fixed. However, when interest rates fall, mortgages may not enjoy as large a gain in market value due to prepayment risk because additional mortgage prepayments must be reinvested at lower interest rates. Faster prepayment will shorten the average life and slower prepayments will lengthen it. However, it is possible to determine what the range of the average life movement could be and to calculate the effect that it will have on the price of the MBS. In selecting MBSs, the Adviser looks for those that offer a higher yield to compensate for any variation in average maturity. If the underlying mortgage assets experience greater than anticipated prepayments of principal, a Portfolio may fail to fully recoup its initial investment in these securities, even if the security is in one of the highest rating categories. A Portfolio may invest, without limit, in MBSs issued by private issuers when the Adviser deems that the quality of the investment, the quality of the issuer, and market conditions warrant such investments. The Portfolios will purchase securities issued by private issuers that are rated investment grade at the time of purchase by Moody's, Fitch or S&P or are deemed by the Adviser to be of comparable investment quality.
Fannie Mae Certificates. Fannie Mae is a federally chartered and privately owned corporation organized and existing under the Federal National Mortgage Association Charter Act of 1938. Each Fannie Mae certificate represents a pro rata interest in one or more pools of mortgage loans insured by the FHA under the Housing Act, or Title V of the Housing Act of 1949 ("FHA Loans"), or guaranteed by the Department of Veteran Affairs under the Servicemen's Readjustment Act of 1944, as amended ("VA Loans") or conventional mortgage loans (i.e., mortgage loans that are not insured or guaranteed by any governmental agency) of the following types: (i) fixed rate level payment mortgage loans; (ii) fixed rate growing equity mortgage loans; (iii) fixed rate graduated payment mortgage loans; (iv) variable rate California mortgage loans; (v) other adjustable rate mortgage loans; and (vi) fixed rate and adjustable mortgage loans secured by multi-family projects.
Freddie Mac Certificates. Freddie Mac is a corporate instrumentality of the United States created pursuant to the Emergency Home Finance Act of 1970, as amended (the "FHLMC Act"). Freddie Mac certificates represent a pro rata interest in a group of mortgage loans (a "Freddie Mac Certificate group") purchased by Freddie Mac. The mortgage loans underlying the Freddie Mac Certificates consist of fixed rate or adjustable rate mortgage loans with original terms to maturity of between ten and thirty years, substantially all of which are secured by first liens on one-to-four-family residential properties or multi-family projects. Each mortgage loan must meet the applicable standards set forth in the FHLMC Act. A Freddie Mac Certificate group may include whole loans, participation interests in whole loans and undivided interests in whole loans and participations comprising another Freddie Mac Certificate group.
In September 2008, the U.S. Treasury Department announced that the government would be taking over Fannie Mae and Freddie Mac and placing the companies into a conservatorship. In addition, the U.S. Treasury announced three additional steps that it intended to take with respect to Fannie Mae and Freddie Mac in order to support the conservatorship. First, the U.S. Treasury entered into "Preferred Stock Purchase Agreements" (PSPAs) under which, if the Federal Housing Finance Agency ("FHFA") determines that Fannie Mae's or Freddie Mac's liabilities exceed its assets under generally accepted accounting principles, the U.S. Treasury will contribute cash
24
capital to the company in an amount equal to the difference between liabilities and assets. The PSPAs are designed to provide protection to the senior and subordinated debt and the mortgage-backed securities issued by Fannie Mae and Freddie Mac. Second, the U.S. Treasury established a new secured lending credit facility that was available to Fannie Mae and Freddie Mac until December 2009. Third, the U.S. Treasury initiated a temporary program to purchase Fannie Mae and Freddie Mac mortgage-backed securities, which terminated in December 2009. In addition, the Federal Reserve exercised its separate authority in 2009 to purchase mortgage-backed securities of Fannie Mae and Freddie Mac. While the U.S. Treasury is committed to offset negative equity at Fannie Mae and Freddie Mac through its stock purchases, no assurance can be given that the Federal Reserve, U.S. Treasury, or FHFA initiatives discussed above will ensure that Fannie Mae and Freddie Mac will remain successful in meeting their obligations with respect to the debt and mortgage-backed securities they issue.
Ginnie Mae Certificates. Ginnie Mae is a wholly-owned corporate instrumentality of the United States within the Department of Housing and Urban Development. The National Housing Act of 1934, as amended (the "Housing Act"), authorizes Ginnie Mae to guarantee the timely payment of the principal and interest on certificates that are based on and backed by a pool of FHA Loans, VA Loans or by pools of other eligible mortgage loans. The Housing Act provides that the full faith and credit of the U.S. Government is pledged to the payment of all amounts that may be required to be paid under any guaranty. In order to meet its obligations under such guaranty, Ginnie Mae is authorized to borrow from the U.S. Treasury with no limitations as to amount.
Each Ginnie Mae certificate represents a pro rata interest in one or more of the following types of mortgage loans: (i) fixed rate level payment mortgage loans; (ii) fixed rate graduated payment mortgage loans; (iii) fixed rate growing equity mortgage loans; (iv) fixed rate mortgage loans secured by manufactured (mobile) homes; (v) mortgage loans on multi-family residential properties under construction; (vi) mortgage loans on completed multi-family projects; (vii) fixed rate mortgage loans as to which escrowed funds are used to reduce the borrower's monthly payments during the early years of the mortgage loans ("buydown" mortgage loans); (viii) mortgage loans that provide for adjustments in payments based on periodic changes in interest rates or in other payment terms of the mortgage loans; and (ix) mortgage-backed serial notes. All of these mortgage loans will be FHA Loans or VA loans and, except as otherwise specified above, will be fully-amortizing loans secured by first liens on one to four-family housing units.
Collateralized Mortgage Obligations. Certain Portfolios may invest in collateralized mortgage obligations ("CMOs"), which are mortgage-backed securities that are collateralized by mortgage loans or mortgage pass-through securities, and multi-class pass-through securities, which are equity interests in a trust composed of mortgage loans or other mortgage backed securities. Unless the context indicates otherwise, the discussion of CMOs below also applies to multi-class pass through securities.
CMOs may be issued by governmental or government-related entities or by private entities, such as banks, savings and loan institutions, private mortgage insurance companies, mortgage bankers and other secondary market traders. CMOs are issued in multiple classes, often referred to as "tranches," with each tranche having a specific fixed or floating coupon rate and stated maturity or final distribution date. Under the traditional CMO structure, the cash flows generated by the mortgages or mortgage pass-through securities in the collateral pool are used to first pay interest and then pay principal to the holders of the CMOs. Subject to the various provisions of individual CMO issues, the cash flow generated by the underlying collateral (to the extent it exceeds the amount required to pay the stated interest) is used to retire the bonds.
The principal and interest on the underlying collateral may be allocated among the several tranches of a CMO in innumerable ways. In a common CMO structure, the tranches are retired sequentially in the order of their respective stated maturities or final distribution dates (as opposed to the pro-rata return of principal found in traditional pass-through obligations). The fastest-pay tranches would initially receive all principal payments. When those tranches are retired, the next tranches in the sequence receive all of the principal payments until they are retired. The sequential retirement of bond groups continues until the last tranche is retired. Accordingly, the CMO structure allows the issuer to use cash flows of long maturity, monthly-pay collateral to formulate securities with short, intermediate, and long final maturities and expected average lives and risk characteristics.
25
The primary risk of CMOs is the uncertainty of the timing of cash flows that results from the rate of prepayments on the underlying mortgages serving as collateral and from the structure of the particular CMO transaction (that is, the priority of the individual tranches). An increase or decrease in prepayment rates (resulting from a decrease or increase in mortgage interest rates) may cause the CMOs to be retired substantially earlier than their stated maturities or final distribution dates and will affect the yield and price of CMOs. In addition, the collateral securing CMOs or any third-party guarantees are insufficient to make payments, a Portfolio could sustain a loss. The prices of certain CMOs, depending on their structure and the rate of prepayments, can be volatile. Some CMOs may also not be as liquid as other types of mortgage securities. As a result, it may be difficult or impossible to sell the securities at an advantageous time or price.
New types of CMO tranches have evolved. These include floating rate CMOs, inverse floating rate CMOs, planned amortization classes, accrual bonds and CMO residuals. These newer structures affect the amount and timing of principal and interest received by each tranche from the underlying collateral. Under certain of these newer structures, given classes of CMOs have priority over others with respect to the receipt of prepayments on the mortgages. Therefore, depending on the type of CMOs in which a Portfolio invests, the investment may be subject to a greater or lesser risk of prepayment than other types of mortgage-backed securities.
CMOs may include real estate investment conduits ("REMICs"). REMICs, which were authorized under the Tax Reform Act of 1986, are private entities formed for the purpose of holding a fixed pool of mortgages secured by an interest in real property. A REMIC is a CMO that qualifies for special tax treatment under the Internal Revenue Code and invests in certain mortgages principally secured by interests in real property.
A Portfolio may invest in, among others, parallel pay CMOs and Planned Amortization Class CMOs ("PAC Bonds"). Parallel pay CMOs are structured to provide payments of principal on each payment date to more than one tranche. These simultaneous payments are taken into account in calculating the stated maturity date or final distribution date of each tranche which, as with other CMO structures, must be retired by its stated maturity date or final distribution date but may be retired earlier. PAC Bonds are a form of parallel pay CMO, with the required principal payment on such securities having the highest priority after interest has been paid to all classes. PAC Bonds generally require payments of a specified amount of principal on each payment date.
Stripped Mortgage-Backed Securities. Certain Portfolios may invest in stripped mortgage-backed securities ("SMBS"). An SMBS is a derivative multi-class mortgage security. SMBS usually are structured with two classes that receive different proportions of the interest and principal distribution on a pool of mortgage assets. In the most extreme case, one class will receive all of the interest (the interest-only or "IO" class), while the other class will receive all of the principal (the principal-only or "PO" class). The yield to maturity on an IO class is extremely sensitive to the rate of principal payments (including prepayments) on the related underlying mortgage assets, and a rapid rate of principal payments may have a material adverse effect on such security's yield to maturity. If the underlying mortgage assets experience greater than anticipated prepayments of principal, a Portfolio may fail to fully recoup its initial investment in these securities. Conversely, if the underlying mortgage assets experience less than anticipated prepayments of principal, the yield of POs could be materially adversely affected. The market values of IOs and POs are subject to greater risk of fluctuation in response to changes in market rates of interest than many other types of government securities. To the extent a Portfolio invests in IOs and POs, it may increase the risk of fluctuations in the net asset value of a Portfolio.
Commercial Mortgage-Backed Securities ("CMBS"). CMBS are generally multi-class or pass-through securities issued by special purpose entities that represent an undivided interest in a portfolio of mortgage loans backed by commercial properties, including, but not limited to, industrial and warehouse properties, office buildings, retail space and shopping malls, hotels, healthcare facilities, multifamily properties and cooperative apartments. Private lenders, such as banks or insurance companies, originate these loans and then sell the loans directly into a CMBS trust or other entity. The commercial mortgage loans that underlie CMBS are generally not amortizing or not fully amortizing. That is, at their maturity date, repayment of the remaining principal balance or "balloon" is due and is repaid through the attainment of an additional loan or sale of this property. An extension of the final payment on commercial mortgages will increase the average life of the CMBS, generally resulting in a lower yield for discount bonds and a higher yield for premium bonds.
26
CMBS are subject to credit risk and prepayment risk. Although prepayment risk is present, it is of a lesser degree in the CMBS than in the residential mortgage market; commercial real estate property loans often contain provisions which substantially reduce the likelihood that such securities will be prepaid (e.g., significant prepayment penalties on loans and, in some cases, prohibition on principal payments for several years following origination).
Municipals: Municipal securities are fixed income securities issued by local, state and regional governments that provide interest income which is exempt from federal income taxes. Municipals include both municipal bonds (those securities with maturities of five years or more) and municipal notes (those with maturities of less than five years). Municipal bonds are issued for a wide variety of reasons: to construct public facilities, such as airports, highways, bridges, schools, hospitals, mass transportation, streets, water and sewer works; to obtain funds for operating expenses; to refund outstanding municipal obligations; and to loan funds to various public institutions and facilities. Certain industrial development bonds are also considered municipal bonds if their interest is exempt from federal income tax. Industrial development bonds are issued by, or on behalf of, public authorities to obtain funds for various privately-operated manufacturing facilities, housing, sports arenas, convention centers, airports, mass transportation systems and water, gas or sewage works. Industrial development bonds are ordinarily dependent on the credit quality of a private user, not the public issuer.
The two principal classifications of municipal bonds are "general obligation" and "revenue" or "special tax" bonds. General obligation bonds are secured by the issuer's pledge of its full faith, credit and taxing power for the payment of principal and interest. Revenue or special tax bonds are payable only from the revenues derived from a particular facility or class of facilities or, in some cases, from the proceeds of a special excise or other tax, but not from general tax revenues.
Industrial revenue bonds in most cases are revenue bonds and generally do not have the pledge of the credit of the issuer. The payment of the principal and interest on such industrial revenue bonds is dependent solely on the ability of the user of the facilities financed by the bonds to meet its financial obligations and the pledge, if any, of real and personal property so financed as security for such payment. Short-term municipal obligations issued by states, cities, municipalities or municipal agencies, include tax anticipation notes, revenue anticipation notes, bond anticipation notes, construction loan notes and short-term discount notes.
Municipal notes are issued to meet the short-term funding requirements of local, regional and state governments. Municipal notes include bond anticipation notes, revenue anticipation notes and tax and revenue anticipation notes. These are short-term debt obligations issued by state and local governments to aid cash flows while waiting for taxes or revenue to be collected, at which time the debt is retired. Other types of municipal notes in which the Portfolio may invest are construction loan notes, short-term discount notes, tax-exempt commercial paper, demand notes, and similar instruments.
Municipal bonds generally include debt obligations issued by states and their political subdivisions, and duly constituted authorities and corporations, to obtain funds to construct, repair or improve various public facilities such as airports, bridges, highways, hospitals, housing, schools, streets and water and sewer works. Municipal bonds may also be issued to refinance outstanding obligations as well as to obtain funds for general operating expenses and for loans to other public institutions and facilities.
Note obligations with demand or put options may have a stated maturity in excess of one year, but permit any holder to demand payment of principal plus accrued interest upon a specified number of days' notice. Frequently, such obligations are secured by letters of credit or other credit support arrangements provided by banks. The issuer of such notes normally has a corresponding right, after a given period, to repay at its discretion the outstanding principal of the note plus accrued interest upon a specific number of days' notice to the bondholders. The interest rate on a demand note may be based upon a known lending rate, such as the prime lending rate, and be adjusted when such rate changes, or the interest rate on a demand note may be a market rate that is adjusted at specified intervals. Each note purchased by the Portfolios will meet the quality criteria set out in the prospectus for the Portfolios.
The yields of municipal bonds depend on, among other things, general money market conditions, conditions in the municipal bond market, the size of a particular offering, the maturity of the obligation, and the rating of the
27
issue. The ratings of Moody's and Standard & Poor's represent their opinions of the quality of the municipal bonds rated by them. It should be emphasized that such ratings are general and are not absolute standards of quality. Consequently, municipal bonds with the same maturity, coupon and rating may have different yields, while municipal bonds of the same maturity and coupon, but with different ratings, may have the same yield. It will be the responsibility of the Adviser to appraise independently the fundamental quality of the bonds held by the Portfolios.
Municipal bonds are sometimes purchased on a "when-issued" or "delayed-delivery" basis, which means the Portfolio has committed to purchase certain specified securities at an agreed upon price when they are issued. The period between commitment date and issuance date can be a month or more. It is possible that the securities will never be issued and the commitment canceled.
From time to time proposals have been introduced before Congress to restrict or eliminate the federal income tax exemption for interest on municipal bonds. Similar proposals may be introduced in the future. If any such proposal were enacted, it might restrict or eliminate the ability of the Portfolios to achieve their investment objectives. In that event, the Fund's Trustees and officers would reevaluate investment objectives and policies and consider recommending to shareholders changes in such objectives and policies.
Similarly, from time to time proposals have been introduced before state and local legislatures to restrict or eliminate the state and local income tax exemption for interest on municipal bonds. Similar proposals may be introduced in the future. If any such proposal were enacted, it might restrict or eliminate the ability of a Portfolio to achieve its investment objective.
The Portfolios eligible to purchase municipal bonds may also purchase bonds the income on which is subject to the AMT ("AMT bonds"). AMT bonds are tax-exempt private activity bonds issued after August 7, 1986, the proceeds of which are directed, at least in part, to private, for-profit organizations. While the income from AMT bonds is exempt from regular federal income tax, it is a tax preference item in the calculation of the alternative minimum tax. The alternative minimum tax is a special separate tax that applies to some taxpayers who have certain adjustments to income or tax preference items.
Build America Bonds are taxable municipal securities on which the issuer receives federal support of the interest paid. Assuming certain specified conditions are satisfied, issuers of Build America Bonds may either (i) receive reimbursement from the U.S. Treasury with respect to a portion of its interest payments on the bonds ("direct pay" Build America Bonds) or (ii) provide tax credits to investors in the bonds ("tax credit" Build America Bonds). Unlike most other municipal securities, interest received on Build America Bonds is subject to federal and state income tax. Issuance of Build America Bonds ceased on December 31, 2010. The number of Build America Bonds available in the market will be limited, which may negatively affect the value of the Build America Bonds.
Lease Obligations. Included within the revenue bonds category, as noted above, are participations in lease obligations or installment purchase contracts (hereinafter collectively called "lease obligations") of municipalities. State and local governments, agencies or authorities issue lease obligations to acquire equipment and facilities. Lease obligations may have risks not normally associated with general obligation or other revenue bonds. Leases, and installment purchase or conditional sale contracts (which may provide for title to the leased asset to pass eventually to the issuer), have developed as a means for governmental issuers to acquire property and equipment without the necessity of complying with the constitutional and statutory requirements generally applicable for the issuance of debt. Certain lease obligations contain "non-appropriation" clauses that provide that the governmental issuer has no obligation to make future payments under the lease or contract unless money is appropriated for such purpose by the appropriate legislative body on an annual or other periodic basis. Consequently, continued lease payments on those lease obligations containing "non-appropriation" clauses are dependent on future legislative actions. If such legislative actions do not occur, the holders of the lease obligation may experience difficulty in exercising their rights, including disposition of the property.
In addition, lease obligations represent a relatively new type of financing that has not yet developed the depth of marketability associated with more conventional municipal obligations, and, as a result, certain of such lease obligations may be considered illiquid securities. To determine whether or not a Portfolio will consider such
28
securities to be illiquid (and subject to each Portfolio's limitation on investing in illiquid securities), the Board has established guidelines to be utilized by the Portfolios in determining the liquidity of a lease obligation. The factors to be considered in making the determination include: 1) the frequency of trades and quoted prices for the obligation; 2) the number of dealers willing to purchase or sell the security and the number of other potential purchasers; 3) the willingness of dealers to undertake to make a market in the security; and 4) the nature of the marketplace trades, including the time needed to dispose of the security, the method of soliciting offers, and the mechanics of the transfer.
Non-Publicly Traded Securities, Private Placements and Restricted Securities: The Portfolios may invest in securities that are neither listed on a stock exchange nor traded over-the-counter, including privately placed and restricted securities. Such unlisted securities may involve a higher degree of business and financial risk that can result in substantial losses. As a result of the absence of a public trading market for these securities, they may be less liquid than publicly traded securities. Although these securities may be resold in privately negotiated transactions, the prices realized from these sales could be less than those originally paid by the Portfolio or less than what may be considered the fair value of such securities. Furthermore, companies whose securities are not publicly traded may not be subject to the disclosure and other investor protection requirements which might be applicable if their securities were publicly traded. If such securities are required to be registered under the securities laws of one or more jurisdictions before being sold, a Portfolio may be required to bear the expenses of registration.
Options: An option is a contract that gives the holder of the option the right, but not the obligation, to buy from (in the case of a call option) or sell to (in the case of a put option) the seller of the option (the "option writer") the underlying security at a specified fixed price (the "exercise price") on or prior to a specified date (the "expiration date"). The buyer of the option pays to the option writer the option premium, which is the purchase price of the option.
Exchange-traded options are issued by a regulated intermediary such as the Options Clearing Corporation ("OCC"), which guarantees the performance of the obligations of the parties to such options. OTC options are purchased from or sold to counterparties through direct bilateral agreement between the Portfolios and their counterparties. Certain options, such as options on individual securities, are settled through physical delivery of the underlying security, whereas other options, such as index options, may be settled in cash in an amount based on the value of the underlying instrument multiplied by a specified multiplier.
Writing Options. Certain Portfolios may write call and put options. As the writer of a call option, a Portfolio receives the premium from the purchaser of the option and has the obligation, upon exercise of the option, to deliver the underlying security upon payment of the exercise price. If the option expires without being exercised a Portfolio is not required to deliver the underlying security but retains the premium received.
Certain Portfolios may only write call options that are "covered." A call option on a security is covered if (a) a Portfolio owns the security underlying the call or has an absolute and immediate right to acquire that security without additional cash consideration (or, if additional cash consideration is required, such amount is maintained by a Portfolio in segregated or earmarked cash or liquid assets) upon conversion or exchange of other securities held by a Portfolio; or (b) a Portfolio has purchased a call on the underlying security, the exercise price of which is (i) equal to or less than the exercise price of the call written, or (ii) greater than the exercise price of the call written, provided the difference is maintained by a Portfolio in segregated or earmarked cash or liquid assets.
Selling call options involves the risk that a Portfolio may be required to sell the underlying security at a disadvantageous price, below the market price of such security, at the time the option is exercised. As the writer of a covered call option, a Portfolio forgoes, during the option's life, the opportunity to profit from increases in the market value of the underlying security covering the option above the sum of the premium and the exercise price but retains the risk of loss should the price of the underlying security decline.
Certain Portfolios may write put options. As the writer of a put option, a Portfolio receives the premium from the purchaser of the option and has the obligation, upon exercise of the option, to pay the exercise price and receive delivery of the underlying security. If the option expires without being exercised, a Portfolio is not required to receive the underlying security in exchange for the exercise price but retains the option premium.
29
A Portfolio may only write put options that are "covered." A put option on a security is covered if (a) a Portfolio segregates or earmarks cash or liquid assets equal to the exercise price; or (b) a Portfolio has purchased a put on the same security as the put written, the exercise price of which is (i) equal to or greater than the exercise price of the put written, or (ii) less than the exercise price of the put written, provided the difference is maintained by a Portfolio in segregated or earmarked cash or liquid assets.
Selling put options involves the risk that a Portfolio may be required to buy the underlying security at a disadvantageous price, above the market price of such security, at the time the option is exercised. While a Portfolio's potential gain in writing a covered put option is limited to the premium received plus the interest earned on the liquid assets covering the put option, a Portfolio's risks of loss is equal to the entire value of the underlying security, offset only by the amount of the premium received.
A Portfolio may close out an options position which it has written through a closing purchase transaction. A Portfolio would execute a closing purchase transaction with respect to a call option written by purchasing a call option. A Portfolio would execute a closing purchase transaction with respect to a put option written by purchasing a put option on the same underlying security and having the same exercise price and expiration date as the put option written by a Portfolio. A closing purchase transaction may or may not result in a profit to a Portfolio. A Portfolio could close out its position as an option writer only if a liquid market exists for options on the same underlying security and having the same exercise price and expiration date as the option written by a Portfolio. There is no assurance that such a market will exist with respect to any particular option.
The writer of an option generally has no control over the time when the option is exercised and the option writer is required to deliver or acquire the underlying security. Once an option writer has received an exercise notice, it cannot effect a closing purchase transaction in order to terminate its obligation under the option. Thus, the use of options may require a Portfolio to buy or sell portfolio securities at inopportune times or for prices other than the current market values of such securities, may limit the amount of appreciation a Portfolio can realize on an investment, or may cause a Portfolio to hold a security that it might otherwise sell.
Purchasing Options. Certain Portfolios may purchase call and put options. As the buyer of a call option, a Portfolio pays the premium to the option writer and has the right to purchase the underlying security from the option writer at the exercise price. If the market price of the underlying security rises above the exercise price, a Portfolio could exercise the option and acquire the underlying security at a below-market price, which could result in a gain to a Portfolio, minus the premium paid. As the buyer of a put option, a Portfolio pays the premium to the option writer and has the right to sell the underlying security to the option writer at the exercise price. If the market price of the underlying security declines below the exercise price, a Portfolio could exercise the option and sell the underlying security at an above-market price, which could result in a gain to a Portfolio, minus the premium paid. A Portfolio may buy call and put options whether or not it holds the underlying securities.
As a buyer of a call or put option, a Portfolio may sell put or call options that it has purchased at any time prior to such option's expiration date through a closing sale transaction. The principal factors affecting the market value of a put or a call option include supply and demand, interest rates, the current market price of the underlying security in relation to the exercise price of the option, the volatility of the underlying security, the underlying security's dividend policy, and the time remaining until the expiration date. A closing sale transaction may or may not result in a profit to a Portfolio. A Portfolio's ability to initiate a closing sale transaction is dependent upon the liquidity of the options market and there is no assurance that such a market will exist with respect to any particular option. If a Portfolio does not exercise or sell an option prior to its expiration date, the option expires and becomes worthless.
OTC Options. Unlike exchange-traded options, which are standardized with respect to the underlying instrument, expiration date, contract size and strike price, the terms of OTC options generally are established through negotiation between the parties to the options contract. This type of arrangement allows the purchaser and writer greater flexibility to tailor the option to their needs. OTC options are available for a greater variety of securities or baskets of securities, and in a wider range of expiration dates and exercise prices than exchange-traded options. However, unlike exchange-traded options, which are issued and guaranteed by a regulated intermediary, such as the OCC, OTC options are entered into directly with the counterparty. Unless the counterparties provide for it, there is no central clearing or guaranty function for an OTC option. Therefore, OTC options are subject to the risk
30
of default or non-performance by the counterparty. Accordingly, the Adviser must assess the creditworthiness of the counterparty to determine the likelihood that the terms of the option will be satisfied. There can be no assurance that a continuous liquid secondary market will exist for any particular OTC option at any specific time. As a result, a Portfolio may be unable to enter into closing sale transactions with respect to OTC options.
Index Options. Call and put options on indices operate similarly to options on securities. Rather than the right to buy or sell a single security at a specified price, options on an index give the holder the right to receive, upon exercise of the option, an amount of cash determined by reference to the value of the underlying index. The underlying index may be a broad-based index or a narrower market index. Unlike many options on securities, all settlements are in cash. The settlement amount, which the writer of an index option must pay to the holder of the option upon exercise, is generally equal to the difference between the fixed exercise price of the option and the value of the underlying index, multiplied by a specified multiplier. The multiplier determines the size of the investment position the option represents. Gain or loss to a Portfolio on index options transactions will depend, in part, on price movements of the underlying index generally or in a particular segment of the index rather than price movements of individual components of the index. As with other options, a Portfolio may close out its position in index options through closing purchase transactions and closing sale transactions provided that a liquid secondary market exists for such options.
Index options written by a Portfolio will generally be covered in a manner similar to the covering of other types of options, by holding an offsetting financial position and/or segregating or earmarking cash or liquid assets. A Portfolio may cover call options written on an index by owning securities whose price changes, in the opinion of the Adviser, are expected to correlate to those of the underlying index.
Foreign Currency Options. Options on foreign currencies operate similarly to options on securities. Rather than the right to buy or sell a single security at a specified price, options on foreign currencies give the holder the right to buy or sell foreign currency for a fixed amount in U.S. dollars or other base currencies. Options on foreign currencies are traded primarily in the OTC market, but may also be traded on U.S. and foreign exchanges. The value of a foreign currency option is dependent upon the value of the underlying foreign currency relative to the U.S. dollar or other base currency. The price of the option may vary with changes in, among other things, the value of either or both currencies and has no relationship to the investment merits of a foreign security. Options on foreign currencies are affected by all of those factors which influence foreign exchange rates and foreign investment generally. As with other options, a Portfolio may close out its position in foreign currency options through closing purchase transactions and closing sale transactions provided that a liquid market exists for such options.
Foreign currency options written by a Portfolio will generally be covered in a manner similar to the covering of other types of options, by holding an offsetting financial position and/or segregating or earmarking cash or liquid assets.
Additional Risks of Options Transactions. The risks associated with options transactions are different from, and possibly greater than, the risks associated with investing directly in the underlying instruments. Options are highly specialized instruments that require investment techniques and risk analyses different from those associated with other portfolio investments. The use of options requires an understanding not only of the underlying instrument but also of the option itself. Options may be subject to the risk factors generally applicable to derivatives transactions described herein, and may also be subject to certain additional risk factors, including:
• The exercise of options written or purchased by a Portfolio could cause a Portfolio to sell portfolio securities, thus increasing a Portfolio's portfolio turnover.
• A Portfolio pays brokerage commissions each time it writes or purchases an option or buys or sells an underlying security in connection with the exercise of an option. Such brokerage commissions could be higher relative to the commissions for direct purchases of sales of the underlying securities.
• A Portfolio's options transactions may be limited by limitations on options positions established by the SEC, the CFTC or the exchanges on which such options are traded.
31
• The hours of trading for exchange-listed options may not coincide with the hours during which the underlying securities are traded. To the extent that the options markets close before the markets for the underlying securities, significant price and rate movements can take place in the underlying securities that cannot be reflected in the options markets.
• Index options based upon a narrow index of securities or other assets may present greater risks than options based on broad market indexes, as narrower indexes are more susceptible to rapid and extreme fluctuations as a result of changes in the values of a smaller number of securities or other assets.
• A Portfolio is subject to the risk of market movements between the time that an option is exercised and the time of performance thereunder, which could increase the extent of any losses suffered by a Portfolio in connection with options transactions.
Options on Futures Contracts. Options on futures contracts are similar to options on securities except that options on futures contracts give the purchasers the right, in return for the premium paid, to assume a position in a futures contract (a long position in the case of a call option and a short position in the case of a put option) at a specified exercise price at any time prior to the expiration of the option. Upon exercise of the option, the parties will be subject to all of the risks associated with futures transactions and subject to margin requirements. As the writer of options on futures contracts, a Portfolio would also be subject to initial and variation margin requirements on the option position.
Options on futures contracts written by a Portfolio will generally be covered in a manner similar to the covering of other types of options, by holding an offsetting financial position and/or segregating or earmarking cash or liquid assets. A Portfolio may cover an option on a futures contract by purchasing or selling the underlying futures contract. In such instances the exercise of the option will serve to close out a Portfolio's futures position.
Combined Transactions. Combined transactions involve entering into multiple derivatives transactions (such as multiple options transactions, including purchasing and writing options in combination with each other; multiple futures transactions; and combinations of options, futures, forward and swap transactions) instead of a single derivatives transaction in order to customize the risk and return characteristics of the overall position. Combined transactions typically contain elements of risk that are present in each of the component transactions. A Portfolio may enter into a combined transaction instead of a single derivatives transaction when, in the opinion of the Adviser, it is in the best interest of the Portfolio to do so. Because combined transactions involve multiple transactions, they may result in higher transaction costs and may be more difficult to close out.
Private Investments in Public Equity: A Portfolio may purchase equity securities in a private placement that are issued by issuers who have outstanding, publicly-traded equity securities of the same class ("private investments in public equity" or "PIPES"). Shares in PIPES generally are not registered with the SEC until after a certain time period from the date the private sale is completed. This restricted period can last many months. Until the public registration process is completed, PIPES are restricted as to resale and the Portfolio cannot freely trade the securities. Generally, such restrictions cause the PIPES to be illiquid during this time. PIPES may contain provisions that the issuer will pay specified financial penalties to the holder if the issuer does not publicly register the restricted equity securities within a specified period of time, but there is no assurance that the restricted equity securities will be publicly registered, or that the registration will remain in effect.
As a general matter, a Portfolio may not invest more than 15% of its net assets in illiquid securities, such as securities for which there is not a readily available secondary market or securities that are restricted from sale to the public without registration. However, certain Restricted Securities can be offered and sold to qualified institutional buyers under Rule 144A ("Rule 144A Securities") under the Securities Act of 1933, as amended (the "1933 Act"), and may be deemed to be liquid under guidelines adopted by the Fund's Board of Trustees. The Portfolios may invest without limit in liquid Rule 144A Securities. Rule 144A Securities may become illiquid if qualified institutional buyers are not interested in acquiring the securities.
Preferred Stock: Preferred stocks are non-voting ownership shares in a corporation which pay a fixed or variable stream of dividends. Preferred stocks have a preference over common stocks in the event of the liquidation
32
of an issuer. Preferred stocks have many of the characteristics of both equity securities and fixed income securities. Therefore, the Fund's Equity, Fixed Income and Balanced Portfolios may all purchase preferred stocks.
Public Bank Loans: Certain Portfolios may invest in public loans made by banks or other financial institutions, which may be rated investment grade (Baa or higher by Moody's, BBB or higher by Standard & Poor's) or below investment grade (below Baa by Moody's or below BBB by Standard & Poor's). Public bank loans are privately negotiated loans for which information about the issuer has been made publicly available. However, public bank loans are not registered under the 1933 Act, and are not publicly traded. They usually are second lien loans normally lower in priority of payment to senior loans, but have seniority in a company's capital structure to other claims, such as subordinated corporate bonds or publicly-issued equity so that in the event of bankruptcy or liquidation, the company is required to pay down these second lien loans prior to such other lower-ranked claims on their assets. Bank loans normally pay floating rates that reset frequently, and as a result, protect investors from increases in interest rates.
Bank loans generally are negotiated between a borrower and several financial institutional lenders represented by one or more lenders acting as agent of all the lenders. The agent is responsible for negotiating the loan agreement that establishes the terms and conditions of the loan and the rights of the borrower and the lenders, monitoring any collateral, and collecting principal and interest on the loan. By investing in a loan, a Portfolio becomes a member of a syndicate of lenders. Certain bank loans are illiquid, meaning the Portfolio may not be able to sell them quickly at a fair price. Illiquid securities are also difficult to value. To the extent a bank loan has been deemed illiquid, it will be subject to a Portfolio's restrictions on investment in illiquid securities. The secondary market for bank loans may be subject to irregular trading activity, wide bid/ask spreads and extended trade settlement periods.
Bank loans are subject to the risk of default. Default in the payment of interest or principal on a loan will result in a reduction of income to a Portfolio, a reduction in the value of the loan, and a potential decrease in the Portfolio's net asset value. The risk of default will increase in the event of an economic downturn or a substantial increase in interest rates. Bank loans are subject to the risk that the cash flow of the borrower and property securing the loan or debt, if any, may be insufficient to meet scheduled payments. As discussed above, however, because bank loans reside higher in the capital structure than high yield bonds, default losses have been historically lower in the bank loan market. Bank loans that are rated below investment grade share the same risks of other below investment grade securities.
Real Estate Investment Trusts: Certain Portfolios may invest in real estate investment trusts ("REITs"). REITs pool investors' funds for investment primarily in real estate properties or real estate-related loans. REITs generally derive their income from rents on the underlying properties or interest on the underlying loans, and their value is impacted by changes in the value of the underlying property or changes in interest rates affecting the underlying loans owned by the REITs. REITs are more susceptible to risks associated with the ownership of real estate and the real estate industry in general. These risks can include fluctuations in the value of underlying properties; defaults by borrowers or tenants; market saturation; changes in general and local economic conditions; decreases in market rates for rents; increases in competition, property taxes, capital expenditures, or operating expenses; and other economic, political or regulatory occurrences affecting the real estate industry. In addition, REITs depend upon specialized management skills, may not be diversified (which may increase the volatility of the REIT's value), may have less trading volume and may be subject to more abrupt or erratic price movements than the overall securities market. Operating REITs requires specialized management skills and the Fund indirectly bears REIT management expenses along with the direct expenses of the Fund. REITs are not taxed on income distributed to shareholders provided they comply with several requirements of the Internal Revenue Code of 1986, as amended (the "Code"). REITs are subject to the risk of failing to qualify for tax-free pass-through of income under the Code.
Repurchase Agreements: The Portfolios may invest in repurchase agreements. When cash may be available for only a few days, it may be invested by a Portfolio in repurchase agreements until such time as it may otherwise be invested or used for payments of obligations of the Portfolio. These agreements typically involve the acquisition by the Portfolio of debt securities from a selling financial institution such as a bank, savings and loan association or broker-dealer. The agreement provides that the Portfolio will sell back to the institution, and that the institution
33
will repurchase, the underlying securities serving as collateral at a specified price and at a fixed time in the future, usually not more than seven days from the date of purchase. The collateral will be marked-to-market daily to determine that the value of the collateral, as specified in the agreement, does not decrease below the purchase price plus accrued interest. If such decrease occurs, additional collateral will be requested and, when received, added to the account to maintain full collateralization. The Portfolio will accrue interest from the institution until the time when the repurchase is to occur. Although this date is deemed by the Portfolio to be the maturity date of a repurchase agreement, the maturities of securities subject to repurchase agreements are not subject to any limits.
While repurchase agreements involve certain risks not associated with direct investments in debt securities, the Portfolios follow procedures approved by the Trustees that are designed to minimize such risks. These procedures include effecting repurchase transactions only with large, well-capitalized and well-established financial institutions whose financial condition will be continually monitored by the Adviser. In addition, as described above, the value of the collateral underlying the repurchase agreement will be at least equal to the repurchase price, including any accrued interest earned on the repurchase agreement. In the event of a default or bankruptcy by a selling financial institution, a Portfolio will seek to liquidate such collateral. However, the exercising of a Portfolio's right to liquidate such collateral could involve certain costs or delays and, to the extent that proceeds from any sale upon a default of the obligation to repurchase were less than the repurchase price, the Portfolio could suffer a loss.
Reverse Repurchase Agreements: Under a Reverse Repurchase Agreement, a Portfolio sells a security and promises to repurchase that security at an agreed upon future date and price. The price paid to repurchase the security reflects interest accrued during the term of the agreement. The Portfolio will establish a separate custodial account holding cash and other liquid assets in an amount not less than the purchase obligations of the agreement. Reverse Repurchase Agreements may be viewed as a speculative form of borrowing called leveraging. A Portfolio may invest in reverse repurchase agreements if (i) interest earned from leveraging exceeds the interest expense of the original reverse repurchase transaction and (ii) proceeds from the transaction are not invested for longer than the term of the Reverse Repurchase Agreement. See "Leverage Risks," above, for a description of leverage risk.
Rights: Rights are equity securities representing a preemptive right of stockholders to purchase additional shares of a stock at the time of a new issuance, before the stock is offered to the general public. A stockholder who purchases rights may be able to retain the same ownership percentage after the new stock offering. A right usually enables the stockholder to purchase common stock at a price below the initial offering price. A Portfolio that purchases a right takes the risk that the right might expire worthless because the market value of the common stock falls below the price fixed by the right.
Securities Lending: Each Portfolio may lend its portfolio securities to brokers, dealers, banks and other institutional investors. By lending its portfolio securities, a Portfolio attempts to increase its net investment income through the receipt of interest on the cash collateral with respect to the loan or fees received from the borrower in connection with the loan. Any gain or loss in the market price of the securities loaned that might occur during the term of the loan would be for the account of the Portfolio. The Fund employs an agent to implement the securities lending program and the agent receives a portion of the fee paid by the Borrower to the Fund for its services.
Each Portfolio may lend its portfolio securities so long as the terms, the structure and the aggregate amount of such loans are not inconsistent with the 1940 Act or the rules and regulations or interpretations of the SEC thereunder, which currently require that (a) the borrower pledge and maintain with the Portfolio collateral consisting of liquid, unencumbered assets having a value at all times not less than 100% of the value of the securities loaned; (ii) the borrower add to such collateral whenever the price of the securities loaned rises (i.e., the borrower "marks to market" on a daily basis); (iii) the loan be made subject to termination by the Portfolio at any time; and (iv) the Portfolio receive a reasonable return on the loan (which may include the Portfolio investing any cash collateral in interest bearing short-term investments), any distributions on the loaned securities and any increase in their market value. In addition, voting rights may pass with the loaned securities, but the Portfolio will retain the right to call any security in anticipation of a vote that the Adviser deems material to the security on loan.
There may be risks of delay and costs involved in recovery of securities or even loss of rights in the collateral should the borrower of the securities fail financially. These delays and costs could be greater for foreign securities.
34
However, loans will be made only to borrowers deemed by the Adviser to be creditworthy and when, in the judgment of the Adviser, the income which can be earned from such securities loans justifies the attendant risk. All relevant facts and circumstances, including the creditworthiness of the broker, dealer, bank or institution, will be considered in making decisions with respect to the lending of securities, subject to review by the Fund's Board. The Portfolio also bears the risk that the reinvestment of collateral will result in a principal loss. Finally, there is the risk that the price of the securities will increase while they are on loan and the collateral will not be adequate to cover their value.
Short Selling: A short sale is a transaction in which a Portfolio sells securities that it does not own, but has borrowed, in anticipation of a decline in the market price of the securities. To deliver the securities to the buyer, the Portfolio arranges through a broker to borrow the securities and, in so doing, the Portfolio becomes obligated to replace the securities borrowed at their market price at the time of replacement. When selling short, the Portfolio intends to replace the securities at a lower price and therefore, profit from the difference between the cost to replace the securities and the proceeds received from the sale of the securities. When the Portfolio makes a short sale, the proceeds it receives from the sale will be held on behalf of a broker until the Portfolio replaces the borrowed securities. The Portfolio may have to pay a premium to borrow the securities and must pay any dividends or interest payable on the securities until they are replaced.
A Portfolio secures its obligation to replace the borrowed securities by depositing collateral with the broker, consisting of cash or other liquid securities. The Portfolio also must place in a segregated account with its custodian cash or other liquid securities equal in value to the difference, if any, between (i) the current market value of the securities sold short and (ii) any cash or other liquid securities deposited as collateral with the broker in connection with the short sale. This amount will be adjusted daily to reflect changes in the value of the securities sold short. A Portfolio also can cover its obligations by owning another security (such as a call option) giving it the right to obtain the same kind and amount of the security it sold short.
Short sales by a Portfolio involve certain risks and special considerations. If the Adviser incorrectly predicts that the price of a borrowed security will decline, the Portfolio will have to replace the securities by purchasing them at a higher price than it received from the sale. Therefore, losses from short sales may be unlimited. By contrast, when a Portfolio purchases a security and holds it, the Portfolio cannot lose more than the amount it paid for the security.
Structured Investments: Certain Portfolios also may invest a portion of their assets in structured investments. A structured investment is a derivative security designed to offer a return linked to a particular underlying security, currency, commodity or market, for which the amount of principal repayment and/or interest payments is based on the change in value of such underlying security, currency, commodity or market, including, among others, currency exchange rates, interest rates (such as the prime lending rate or LIBOR), referenced bonds and stock indices or other financial reference. Structured investments may come in various forms, including notes, warrants and options to purchase securities, and may be listed and traded on an exchange or otherwise traded in the OTC market.
A Portfolio will typically use structured investments to gain exposure to a permitted underlying security, currency or market when direct access to such security, currency, commodity or market is limited or inefficient from a tax, cost or regulatory standpoint. Investments in structured investments involve risks including counterparty risk and market risk. Holders of structured investments bear risks of the underlying investment and are subject to counterparty risk because a Portfolio is relying on the creditworthiness of such counterparty and has no rights with respect to the issuer of the underlying investment. Certain structured investments may be thinly traded or have a limited trading market and may have the effect of increasing a Portfolio's illiquidity to the extent that the Portfolio, at a particular point in time, may be unable to find qualified buyers for these investments.
A structured investment may be linked either positively or negatively to its underlying security, currency, commodity or market and a change in interest rate, principal amount or other factor, depending on the structured investment's design, may be a multiple of the factor's movement. Application of a multiplier is comparable to the use of financial leverage, a speculative technique. Leverage magnifies the potential for gain and the risk of loss. As a result, a relatively small decline in the value of the referenced factor could result in a relatively large loss in the value of a structured investment.
35
Other types of structured investments include interests in entities organized and operated for the purpose of restructuring the investment characteristics of underlying investment interests or securities. This type of securitization or restructuring usually involves the deposit or purchase of an underlying security by a U.S. or foreign entity, such as a corporation or trust of specified instruments, and the issuance by that entity of one or more classes of securities backed by, or representing an interest in, the underlying instruments. The cash flow or rate of return on the underlying investments may be apportioned among the newly issued securities to create different investment characteristics, such as varying maturities, credit quality, payment priorities and interest rate provisions. Structured investments which are subordinated, for example, in payment priority often offer higher returns, but may result in increased risks compared to other investments.
Swaps: An OTC swap contract is an agreement between two parties pursuant to which the parties exchange payments at specified dates on the basis of a specified notional amount, with the payments calculated by reference to specified securities, indexes, reference rates, currencies or other instruments. A small percentage of swap contracts are cleared through a central clearinghouse. Most swap agreements provide that when the period payment dates for both parties are the same, the payments are made on a net basis (i.e., the two payment streams are netted out, with only the net amount paid by one party to the other). A Portfolio's obligations or rights under a swap contract entered into on a net basis will generally be equal only to the net amount to be paid or received under the agreement, based on the relative values of the positions held by each counterparty. Most swap agreements are not entered into or traded on exchanges and often there is no central clearing or guaranty function for swaps. These OTC swaps are often subject to the risk of default or non-performance by the counterparty. Accordingly, the Adviser must assess the creditworthiness of the counterparty to determine the likelihood that the terms of the swap will be satisfied.
Swap agreements allow for a wide variety of transactions. For example, fixed rate payments may be exchanged for floating rate payments, U.S. dollar denominated payments may be exchanged for payments denominated in foreign currencies, and payments tied to the price of one security, index, reference rate, currency or other instrument may be exchanged for payments tied to the price of a different security, index, reference rate, currency or other instrument. Swap contracts are typically individually negotiated and structured to provide exposure to a variety of particular types of investments or market factors. Swap contracts can take many different forms and are known by a variety of names. To the extent consistent with a Portfolio's investment objectives and policies, a Portfolio is not limited to any particular form or variety of swap contract. A Portfolio may utilize swaps to increase or decrease its exposure to the underlying instrument, reference rate, foreign currency, market index or other asset. Certain Portfolios may also enter into related derivative instruments including caps, floors and collars.
A Portfolio may be required to cover swap transactions. Obligations under swap agreements entered into on a net basis are generally accrued daily and any accrued but unpaid amounts owed by a Portfolio to the swap counterparty will be covered by segregating or earmarking cash or liquid assets. If a Portfolio enters into a swap agreement on other than a net basis, a Portfolio will segregate or earmark cash or liquid assets with a value equal to the full amount of a Portfolio's accrued obligations under the agreement.
Interest Rate Swaps, Caps, Floors and Collars. Interest rate swaps consist of an agreement between two parties to exchange their respective commitments to pay or receive interest (e.g., an exchange of floating rate payments for fixed rate payments). Interest rate swaps are generally entered into on a net basis. Interest rate swaps do not involved the delivery of securities, other underlying assets, or principal. Accordingly, the risk of loss with respect to interest rate and total rate of return swaps is limited to the net amount of interest payments that a Portfolio is contractually obligated to make.
Certain Portfolios may also buy or sell interest rate caps, floors and collars. The purchase of an interest rate cap entitles the purchaser, to the extent that a specified index exceeds a predetermined interest rate, to receive payments of interest on a specified notional amount from the party selling the interest rate cap. The purchase of an interest rate floor entitles the purchaser, to the extent that a specified index falls below a predetermined interest rate, to receive payments of interest on a specified notional amount from the party selling the interest rate floor. A collar is a combination of a cap and a floor that preserves a certain return within a predetermined range of interest rate of values. Caps, floors and collars may be less liquid than other types of swaps. If a Portfolio sells caps, floors
36
and collars, it will segregate liquid assets with a value equal to the full amount, accrued daily, of a Portfolio's net obligations with respect to the caps, floors or collars.
Index Swaps. An index swap consists of an agreement between two parties in which a party exchanges a cash flow based on a notional amount of a reference index for a cash flow based on a different index or on another specified instrument or reference rate. Index swaps are generally entered into on a net basis.
Inflation Swaps. Inflation swap agreements are contracts in which one party agrees to pay the cumulative percentage increase in a price index, such as the Consumer Price Index, over the term of the swap (with some lag on the referenced inflation index), and the other party pays a compounded fixed rate. Inflation swap agreements may be used to protect the net asset value of a Portfolio against an unexpected change in the rate of inflation measured by an inflation index. The value of inflation swap agreements is expected to change in response to changes in real interest rates. Real interest rates are tied to the relationship between nominal interest rates and the rate of inflation.
Currency Swaps. A currency swap consists of an agreement between two parties to exchange cash flows on a notional amount of two or more currencies based on the relative value differential among them, such as exchanging a right to receive a payment in a foreign currency for the right to receive U.S. dollars. Currency swap agreements may be entered into on a net basis or may involve the delivery of the entire principal value of one designated currency in exchange for the entire principal value of another designated currency. In such cases, the entire principal value of a currency swap is subject to the risk that the counterparty will default on its contractual delivery obligations.
Credit Default Swaps. A credit default swap consists of an agreement between two parties in which the "buyer" agrees to pay to the "seller" a periodic stream of payments over the term of the contract and the seller agrees to pay the buyer the par value (or other agreed-upon value) of a referenced debt obligation upon the occurrence of a credit event with respect to the issuer of the referenced debt obligation. Generally, a credit event means a bankruptcy, failure to pay or a restructuring. A Portfolio may be either the buyer or seller in a credit default swap. As the buyer in a credit default swap, a Portfolio would pay to the counterparty the periodic stream of payments. If no default occurs, a Portfolio would receive no benefit from the contract. As the seller in a credit default swap, a Portfolio would receive the stream of payments but would be subject to exposure on the notional amount of the swap, which it would be required to pay in the event of default. A Portfolio will generally segregate or earmark liquid assets to cover any potential obligation under a credit default swap sold by a Portfolio. The use of credit default swaps could result in losses to a Portfolio if the Adviser fails to correctly evaluate the creditworthiness of the issuer of the referenced debt obligation.
Swaptions. An option on a swap agreement, also called a "swaption," is an option that gives the buyer the right, but not the obligation, to enter into a swap on a future date in exchange for paying a market based "premium." A receiver swaption gives the owner the right to receive the total return of a specified asset, reference rate, or index. A payer swaption gives the owner the right to pay the total return of a specified asset, reference rate, or index. Swaptions also include options that allow an existing swap to be terminated or extended by one of the counterparties.
General Risks of Swaps. The risks associated with swap transactions are different from, and possibly greater than, the risks associated with investing directly in the underlying instruments. Swaps are highly specialized instruments that require investment techniques and risk analyses different from those associated with other portfolio investments. The use of swaps requires an understanding not only of the underlying instrument but also of the swap contract itself. Swap transactions may be subject to the risk factors generally applicable to derivatives transactions described above, and may also be subject to certain additional risk factors, including:
• Many swap agreements are not traded on exchanges and not subject to a similar level of government regulation as exchange-traded derivatives. As a result, parties to a swap agreement are not protected by such government regulations to the same extent participants are in transactions in derivatives traded on organized exchanges.
• In addition to the risk of default by the counterparty, if the creditworthiness of a counterparty to a swap agreement declines, the value of the swap agreement would be likely to decline, potentially resulting in losses.
37
• The swaps market is a relatively new market and currently is largely unregulated. It is possible that further developments in the swaps market, including future governmental regulation, could adversely affect a Portfolio's ability to utilize swaps, terminate existing swap agreements or realize amounts to be received under such agreements.
U.S. Government Securities: The term "U.S. Government securities" refers to a variety of fixed income securities issued or guaranteed by the U.S. Government and various instrumentalities and agencies. The U.S. Government securities that certain Portfolios may purchase include U.S. Treasury bills, notes and bonds, all of which are direct obligations of the U.S. Government. In addition, certain Portfolios may purchase securities issued by agencies and instrumentalities of the U.S. Government which are backed by the full faith and credit of the United States. Among the agencies and instrumentalities issuing these obligations are Ginnie Mae and the Federal Housing Administration.
Certain of the Portfolios may also purchase securities issued by agencies and instrumentalities which are not backed by the full faith and credit of the United States, but whose issuing agency or instrumentality has the right to borrow, to meet its obligations, from the U.S. Treasury. Among these agencies and instrumentalities are Fannie Mae, Freddie Mac and the Federal Home Loan Banks. Further, certain Portfolios may purchase securities issued by agencies and instrumentalities which are backed solely by the credit of the issuing agency or instrumentality. Among these agencies and instrumentalities is the Federal Farm Credit System.
Warrants: Warrants are equity securities in the form of options issued by a corporation which give the holder the right to purchase stock, usually at a price that is higher than the market price at the time the warrant is issued. A purchaser takes the risk that the warrant may expire worthless because the market price of the common stock fails to rise above the price set by the warrant.
When-Issued and Delayed Delivery Securities and Forward Commitments: A Portfolio may purchase securities on a when-issued or delayed delivery basis or may purchase or sell securities on a forward commitment basis. When these transactions are negotiated, the price is fixed at the time of the commitment, but delivery and payment can take place a month or more after the date of commitment. A Portfolio may sell the securities before the settlement date, if it is deemed advisable. The securities so purchased or sold are subject to market fluctuation and no interest or dividends accrue to the purchaser prior to the settlement date.
At the time a Portfolio makes the commitment to purchase or sell securities on a when-issued, delayed delivery or forward commitment basis, it will record the transaction and thereafter reflect the value, each day, of such security purchased, or if a sale, the proceeds to be received, in determining its net asset value. At the time of delivery of the securities, their value may be more or less than the purchase or sale price. An increase in the percentage of a Portfolio's assets committed to the purchase of securities on a when-issued, delayed delivery or forward commitment basis may increase the volatility of its net asset value. A Portfolio will also earmark cash or liquid assets or establish a segregated account on the Portfolio's books in which it will continually maintain cash or cash equivalents or other liquid portfolio securities equal in value to commitments to purchase securities on a when-issued, delayed delivery or forward commitment basis. See "Leverage Risks" above for a description of leverage risk.
When, As and If Issued Securities: A Portfolio may purchase securities on a "when, as and if issued" basis under which the issuance of the security depends upon the occurrence of a subsequent event, such as approval of a merger, corporate reorganization or debt restructuring. The commitment for the purchase of any such security will not be recognized in the portfolio of a Portfolio until the Adviser determines that issuance of the security is probable. At that time, the Portfolio will record the transaction and, in determining its net asset value, will reflect the value of the security daily. At that time, the Portfolio will also establish a segregated account on its books in which it will maintain cash, cash equivalents or other liquid portfolio securities equal in value to recognized commitments for such securities.
An increase in the percentage of the Portfolio's assets committed to the purchase of securities on a "when, as and if issued" basis may increase the volatility of its net asset value. The Portfolio may also sell securities on a "when, as and if issued" basis provided that the issuance of the security will result automatically from the exchange or conversion of a security owned by the Portfolio at the time of sale.
38
Yankee and Eurobond Obligations: Each Portfolio may invest in Eurobond and Yankee obligations, which are fixed income securities. The Eurobonds that the Portfolios will purchase may include bonds issued and denominated in euros. Eurobonds may be issued by government and corporate issuers in Europe. Yankee bank obligations are U.S. dollar-denominated obligations issued in the U.S. capital markets by foreign banks.
Eurobond and Yankee obligations are subject to the same risks that pertain to domestic issues, notably credit risk, market risk and liquidity risk. However, Eurobond (and to a limited extent, Yankee) obligations also are subject to certain sovereign risks. One such risk is the possibility that a sovereign country might prevent capital from flowing across its borders. Other risks include adverse political and economic developments; the extent and quality of government regulation of financial markets and institutions; the imposition of foreign withholding taxes, and the expropriation or nationalization of foreign issuers.
Zero Coupons: Each Portfolio may invest in zero coupon bonds ("Zero Coupons"), which are fixed income securities that do not make regular interest payments. Instead, Zero Coupons are sold at substantial discounts from their face value. The difference between a Zero Coupon's issue or purchase price and its face value represents the imputed interest an investor will earn if the obligation is held until maturity. For tax purposes, a portion of this imputed interest is deemed as income received by zero coupon bondholders each year. Each Portfolio intends to pass along such interest as a component of the Portfolio's distributions of net investment income.
Zero Coupons may offer investors the opportunity to earn higher yields than those available on ordinary interest-paying obligations of similar credit quality and maturity. However, Zero Coupon prices may also exhibit greater price volatility than ordinary fixed income securities because of the manner in which their principal and interest are returned to the investor.
INVESTMENT LIMITATIONS
Fundamental Limitations. Each Portfolio is subject to the following restrictions which are fundamental policies and may not be changed without the approval of the lesser of: (1) at least 67% of the voting securities of the Portfolio present at a meeting if the holders of more than 50% of the outstanding voting securities of the Portfolio are present or represented by proxy, or (2) more than 50% of the outstanding voting securities of the Portfolio.
As a matter of fundamental policy, each Portfolio will not change its objective and will not:
(1) purchase or sell physical commodities unless acquired as a result of ownership of securities or other instruments; provided that this restriction shall not prohibit the Portfolio from purchasing or selling options, futures contracts and related options thereon, forward contracts, swaps, caps, floors, collars and any other financial instruments or from investing in securities or other instruments backed by physical commodities or as otherwise permitted by (i) the 1940 Act, as amended from time to time, (ii) the rules and regulations promulgated by the SEC under the 1940 Act, as amended from time to time, or (iii) an exemption or other relief applicable to the Portfolio from the provisions of the 1940 Act, as amended from time to time;
(2) purchase or sell real estate, although it may purchase and sell securities of companies which deal in real estate, other than real estate limited partnerships, and may purchase and sell marketable securities which are secured by interests in real estate;
(3) make loans of money or property to any person, except (a) to the extent that securities or interests in which the Portfolio may invest are considered to be loans, (b) through the loan of portfolio securities, (c) by engaging in repurchase agreements or (d) as may otherwise be permitted by (i) the 1940 Act, as amended from time to time, (ii) the rules and regulations promulgated by the SEC under the 1940 Act, as amended from time to time, or (iii) an exemption or other relief applicable to the Fund from the provisions of the 1940 Act, as amended from time to time;
39
(4) invest in a manner inconsistent with its classification as a "diversified company" as a provided by (i) the 1940 Act, as amended from time to time, (ii) the rules and regulations promulgated by the SEC under the 1940 Act, as amended from time to time, or (iii) an exemption or other relief applicable to the Portfolio from the provisions of the 1940 Act, as amended from time to time;
(5) borrow money, except the Portfolio may borrow money to the extent permitted by (i) the 1940 Act, as amended from time to time, (ii) the rules and regulations promulgated by the SEC under the 1940 Act, as amended from time to time, or (iii) an exemption or other relief applicable to the Company from the provisions of the 1940 Act, as amended from time to time;
(6) underwrite the securities of other issuers (except to the extent that the Fund may be deemed to be an underwriter within the meaning of the 1933 Act in connection with the disposition of restricted securities);
(7) acquire any securities of companies within one industry, if, as a result of such acquisition, more than 25% of the value of the Portfolio's total assets would be invested in securities of companies within such industry; provided, however that (i) there shall be no limitation on the purchase of obligations issued or guaranteed by the U.S. Government, its agencies or instrumentalities; (ii) utility companies will be divided according to their services, for example, gas, gas transmission, electric and telephone will each be considered a separate industry; (iii) financial service companies will be classified according to the end users of their services, for example, automobile finance, bank finance and diversified finance will each be considered a separate industry; and (iv) asset-backed securities will be classified according to the underlying assets securing such securities; and
(8) issue senior securities, except the Portfolio may issue senior securities to the extent permitted by (i) the 1940 Act, as amended from time to time, (ii) the rules and regulations promulgated by the SEC under the 1940 Act, as amended from time to time, or (iii) an exemption or other relief applicable to the Portfolio from the provisions of the 1940 Act, as amended from time to time.
Non-Fundamental Limitations. Each Portfolio is also subject to the following restrictions which may be changed by the Board without shareholder approval.
As a matter of non-fundamental policy, no Portfolio will:
(1) purchase on margin, except for use of short-term credit as may be necessary for the clearance of purchases and sales of securities, provided that each Portfolio may make margin deposits in connection with transactions in options, futures, and options on futures;
(2) sell short unless the Portfolio (i) by virtue of its ownership of other securities, has the right to obtain securities equivalent in kind and amount to the securities sold and, if the right is conditional, the sale is made upon the same conditions, or (ii) maintains in a segregated account on the books of the Fund's custodian an amount that, when combined with the amount of collateral deposited with the broker in connection with the short sale, equals the current market value of the security sold short or such other amount as the SEC or its staff may permit by rule, regulation, order or interpretation (transactions in futures contracts and options, however, are not deemed to constitute selling securities short);
(3) pledge, mortgage or hypothecate assets in an amount greater than 50% of its total assets, provided that each Portfolio may earmark or segregate assets without limit in order to comply with the requirements of Section 18(f) of the 1940 Act and applicable rules, regulations or interpretations of the SEC and its staff;
(4) invest more than an aggregate of 15% of the net assets of the Portfolio determined at the time of investment, in illiquid securities provided that this limitation shall not apply to any investment in securities that are not registered under the 1933 Act but that can be sold to qualified institutional investors in accordance with Rule 144A under the 1933 Act and are determined to be liquid securities under guidelines or procedures adopted by the Board;
40
(5) invest for the purpose of exercising control over management of any company; and
(6) invest its assets in securities of any investment company, except as permitted by the 1940 Act or the rules, regulations, interpretations or orders of the SEC and its staff thereunder; provided that no Portfolio will invest in other investment companies in reliance on Sections 12(d)(1)(F), 12(d)(1)(G) or 12(d)(1)(J) of the 1940 Act.
Unless otherwise indicated, if a percentage limitation on investment or utilization of assets as set forth above is adhered to at the time an investment is made, a later change in percentage resulting from changes in the value or total cost of the Portfolio's assets will not be considered a violation of the restriction, and the sale of securities will not be required. The foregoing does not apply to borrowings or investments in illiquid securities.
Pursuant to an order from the SEC, the Portfolios may enter into interfund lending arrangements. Interfund loans and borrowings permit each Portfolio to lend money directly to and borrow from other Portfolios of the Fund for temporary purposes. Such loans and borrowings normally extend overnight but may have a maximum duration of seven days. A Portfolio will borrow through the interfund lending facility only when the costs are lower than the costs of bank loans, and will lend through the facility only when the returns are higher than those available from an investment in repurchase agreements. In addition, a Portfolio will borrow and lend money through interfund lending arrangements only if, and to the extent that, such practice is consistent with the Portfolio's investment objectives and other investments. Any delay in repayment to a lending Portfolio could result in a lost investment opportunity or additional borrowing costs.
DISCLOSURE OF PORTFOLIO HOLDINGS
The Fund's Board of Trustees and the Adviser have adopted policies and procedures regarding disclosure of portfolio holdings (the "Policy"). Pursuant to the Policy, the Adviser may disclose information concerning Fund portfolio holdings only if such disclosure is consistent with the antifraud provisions of the federal securities laws and the Fund's and the Adviser's fiduciary duties to Fund shareholders. In no instance may the Adviser or the Fund receive compensation or any other consideration in connection with the disclosure of information about the portfolio securities of the Fund. Consideration includes any agreement to maintain assets in the Fund or in other investment companies or accounts managed by the Adviser or by any affiliated person of the Adviser. Non-public information concerning portfolio holdings may be divulged to third parties only when the Fund has a legitimate business purpose for doing so and the recipients of the information are subject to a duty of confidentiality. Under no circumstances shall current or prospective Fund shareholders receive non-public portfolio holdings information, except as described below.
The Fund makes available on its public website the following portfolio holdings information:
• complete portfolio holdings information monthly, at least 15 calendar days after the end of each month; and
• top 10 holdings monthly, at least 15 calendar days after the end of each month.
The Fund provides a complete schedule of portfolio holdings for the second and fourth fiscal quarters in its semiannual and annual reports, and for the first and third fiscal quarters in its filings with the SEC on Form N-Q.
All other portfolio holdings information that has not been disseminated in a manner making it available to investors generally as described above is non-public information for purposes of the Policy.
The Fund may make selective disclosure of non-public portfolio holdings information pursuant to certain exemptions set forth in the Policy. Third parties eligible for exemptions under the Policy and therefore eligible to receive such disclosures currently include fund rating agencies, information exchange subscribers, consultants and analysts, portfolio analytics providers and service providers, provided that the third party expressly agrees to maintain the disclosed information in confidence and not to trade portfolio securities or related derivative securities based on the non-public information. Non-public portfolio holdings information may not be disclosed to a third
41
party pursuant to an exemption unless and until the third party recipient has entered into a non-disclosure agreement with the Fund and the arrangement has been reviewed and approved as set forth in the Policy and discussed below. In addition, persons who owe a duty of trust or confidence to the Fund or the Adviser may receive non-public portfolio holdings information without entering into a non-disclosure agreement. Currently, these persons include (i) the Fund's independent registered public accounting firm (as of the Fund's fiscal year end and on an as needed basis), (ii) counsel to the Fund (on an as needed basis), (iii) counsel to the independent Trustees (on an as needed basis) and (iv) members of the Board of Trustees (on an as needed basis). Subject to the terms and conditions of any agreement between the Adviser or the Fund and the third party recipient, if these conditions for disclosure are satisfied, there shall be no restriction on the frequency with which Fund non-public portfolio holdings information is released, and no lag period shall apply (unless otherwise indicated below).
The Adviser may provide interest lists to broker-dealers who execute securities transactions for the Fund without entering into a non-disclosure agreement with the broker-dealers, provided that the interest list satisfies all of the following criteria: (1) the interest list must contain only the CUSIP numbers and/or ticker symbols of securities held in all registered management investment companies advised by the Adviser or any affiliate of the Adviser (the "MSIM Funds") on an aggregate, rather than a fund-by-fund basis; (2) the interest list must not contain information about the number or value of shares owned by a specified MSIM Fund; (3) the interest list may identify the investment strategy, but not the particular MSIM Funds, to which the list relates; and (4) the interest list may not identify the portfolio manager or team members responsible for managing the MSIM Funds.
Fund shareholders may elect in some circumstances to redeem their shares of the Fund in exchange for their pro rata share of the securities held by the Fund. Under such circumstances, Fund shareholders may receive a complete listing of the holdings of the Fund up to seven calendar days prior to making the redemption request provided that they represent in writing that they agree to not to disclose or trade on the basis of the portfolio holdings information.
The Fund may discuss or otherwise disclose performance attribution analyses (i.e., mention the effects of having a particular security in the portfolio(s)) where such discussion is not contemporaneously made public, provided that the particular holding has been disclosed publicly. Additionally, any discussion of the analyses may not be more current than the date the holding was disclosed publicly.
The Fund may disclose portfolio holdings to transition managers, provided that the Fund has entered into a non-disclosure or confidentiality agreement with the party requesting that the information be provided to the transition manager and the party to the non-disclosure agreement has, in turn, entered into a non-disclosure or confidentiality agreement with the transition manager.
The Adviser, the Fund and/or certain Portfolios currently have entered into ongoing arrangements with the following parties:
| Name | Information Disclosed | Frequency(1) | Lag Time | ||||||||||||
| Service Providers | |||||||||||||||
| RiskMetrics Group (proxy voting agent)(*) | Complete portfolio holdings | Daily basis | (2) | ||||||||||||
| FT Interactive Data Pricing Service Provider(*) | Complete portfolio holdings | As needed | (2) | ||||||||||||
| State Street Bank and Trust Company(*) | Complete portfolio holdings | As needed | (2) | ||||||||||||
| Fund Rating Agencies | |||||||||||||||
| Lipper(*) | Top ten and complete portfolio holdings | Monthly basis | Six business days after month end | ||||||||||||
| Morningstar(**) | Top ten and complete portfolio holdings | Quarterly basis | Approximately 38 days after quarter end | ||||||||||||
| Standard & Poor's(*) | Complete portfolio holdings | Quarterly basis | Approximately 15 day lag | ||||||||||||
| Investment Company Institute(**) | Top ten portfolio holdings | Quarterly basis | Approximately 15 days after quarter end | ||||||||||||
42
| Name | Information Disclosed | Frequency(1) | Lag Time | ||||||||||||
| Consultants and Analysts | |||||||||||||||
| Americh Massena & Associates, Inc.(*) | Top ten and complete portfolio holdings | Quarterly basis(5) | Approximately 10-12 days after quarter end | ||||||||||||
| Bloomberg(**) | Complete portfolio holdings | Quarterly basis | Approximately 38 days after quarter end | ||||||||||||
| Callan Associates(*) | Top ten and complete portfolio holdings | Monthly and quarterly basis, respectively(5) | Approximately 10-12 days after month/quarter end | ||||||||||||
| Cambridge Associates(*) | Top ten and complete portfolio holdings | Quarterly basis(5) | Approximately 10-12 days after quarter end | ||||||||||||
| Citigroup(*) | Complete portfolio holdings | Monthly and quarterly basis, respectively(5) | At least one day after month/quarter end | ||||||||||||
| Credit Suisse First Boston(*) | Top ten and complete portfolio holdings | Monthly and quarterly basis, respectively | Approximately 10-12 days after month/quarter end | ||||||||||||
| CTC Consulting, Inc.(*) | Top ten and complete portfolio holdings | Quarterly basis | Approximately 15 days after quarter end and approximately 30 days after quarter end, respectively | ||||||||||||
| Fund Evaluation Group(**) | Top ten portfolio holdings(3) | Quarterly basis | At least 15 days after quarter end | ||||||||||||
| Jeffrey Slocum & Associates(*) | Complete portfolio holdings(4) | Quarterly basis(5) | Approximately 10-12 days after quarter end | ||||||||||||
| Hartland & Co.(**) | Complete portfolio holdings(4) | Quarterly basis | At least 30 days after quarter end | ||||||||||||
| Hewitt EnnisKnupp(*) | Top ten and complete portfolio holdings | Monthly and quarterly basis, respectively(5) | Approximately 10-12 days after month/quarter end | ||||||||||||
| Merrill Lynch(*) | Top ten and complete portfolio holdings | Monthly and quarterly basis, respectively(5) | Approximately 10-12 days after month/quarter end | ||||||||||||
| Mobius(**) | Top ten portfolio holdings(3) | Monthly basis | At least 15 days after month end | ||||||||||||
| Nelsons(**) | Top ten portfolio holdings(3) | Quarterly basis | At least 15 days after quarter end | ||||||||||||
| Prime, Buchholz & Associates, Inc.(**) | Complete portfolio holdings(4) | Quarterly basis | At least 30 days after quarter end | ||||||||||||
| PSN(**) | Top ten portfolio holdings(3) | Quarterly basis | At least 15 days after quarter end | ||||||||||||
| PFM Asset Management LLC(*) | Top ten and complete portfolio holdings | Quarterly basis(5) | Approximately 10-12 days after quarter end | ||||||||||||
| Russell Investment Group/Russell/ Mellon Analytical Services, Inc.(**) | Top ten and complete portfolio holdings | Monthly and quarterly basis | At least 15 days after month end and at least 30 days after quarter end, respectively | ||||||||||||
| Stratford Advisory Group, Inc.(*) | Top ten portfolio holdings(6) | Quarterly basis(5) | Approximately 10-12 days after quarter end | ||||||||||||
| Thompson Financial(**) | Complete portfolio holdings(4) | Quarterly basis | At least 30 days after quarter end | ||||||||||||
| Watershed Investment Consultants, Inc.(*) | Top ten and complete portfolio holdings | Quarterly basis(5) | Approximately 10-12 days after quarter end | ||||||||||||
| Gallagher Fiduciary Partners(**) | Top ten portfolio holdings(3) | Quarterly basis | At least 15 days after quarter end | ||||||||||||
| Portfolio Analytics Providers | |||||||||||||||
| FactSet Research Systems, Inc.(*) | Complete portfolio holdings | Daily basis | One day | ||||||||||||
(*) This entity has agreed to maintain Fund non-public portfolio holdings information in confidence and not to trade portfolio securities based on the non-public portfolio holdings information.
(**) The Fund does not currently have a non-disclosure agreement in place with this entity and therefore the entity can only receive publicly available information.
(1) Dissemination of portfolio holdings information to entities listed above may occur less frequently than indicated (or not at all).
(2) Information will typically be provided on a real time basis or as soon thereafter as possible.
(3) Complete portfolio holdings will also be provided upon request from time to time on a quarterly basis, with at least a 30 day lag.
(4) Top ten portfolio holdings will also be provided upon request from time to time, with at least a 15 day lag.
(5) This information will also be provided upon request from time to time.
(6) Complete portfolio holdings will also be provided upon request from time to time.
All disclosures of non-public portfolio holdings information made to third parties pursuant to the exemptions set forth in the Policy must be reviewed by Morgan Stanley Investment Management's ("MSIM") Legal and
43
Compliance Division and approved by the Head of the Long-Only Business of MSIM. Disclosures made to third parties in connection with (i) broker-dealer interest lists; (ii) shareholder in-kind distributions; (iii) attribution analyses; or (iv) transition managers are pre-approved for purposes of the Policy. In addition, the following categories of third parties that may receive non-public portfolio holdings information are also pre-approved provided that they enter into non-disclosure agreements (as discussed above) (i) fund rating agencies; (ii) information exchange subscribers; (iii) consultants and analysts (including defined benefit and defined contribution plan sponsors, and variable annuity providers); (iv) portfolio analytics providers; and (v) service providers.
The Adviser shall report quarterly to the Board of Trustees (or a designated committee thereof) at the next regularly scheduled meeting (i) any material information concerning all parties receiving non-public portfolio holdings information pursuant to an exemption; and (ii) any new non-disclosure agreements entered into during the reporting period. Procedures to monitor the use of such non-public portfolio holdings information may include requiring annual certifications that the recipients have utilized such information only pursuant to the terms of the agreement between the recipient and the Adviser and, for those recipients receiving information electronically, acceptance of the information will constitute reaffirmation that the third party expressly agrees to maintain the disclosed information in confidence and not to trade portfolio securities based on the non-public information.
PURCHASE OF SHARES
Each Portfolio reserves the right in its sole discretion (i) to suspend the offering of its shares, (ii) to reject purchase orders and (iii) to reduce or waive the minimum for initial and additional investments. The minimum initial or additional investment in Class L shares may be waived for certain investments, including sales through banks, broker-dealers and other financial institutions (including registered investment advisers and financial planners) purchasing shares on behalf of their clients in (i) discretionary and non-discretionary advisory programs, (ii) fund supermarkets, (iii) asset allocation programs or (iv) other programs in which the client pays an asset-based fee for advice or for executing transactions in Portfolio shares or for otherwise participating in the program. In addition, the minimum initial investments will be waived for: (i) certain retirement plans investing directly with the Fund; (ii) retirement plans investing through certain retirement plan platforms; (iii) certain endowments, foundations and other not for profit entities investing directly with the Fund; (iv) other registered investment companies advised by Morgan Stanley Investment Management or any of its affiliates; (v) Morgan Stanley Investment Management and its affiliates with respect to shares held in connection with certain retirement and deferred compensation programs established for their employees; (vi) the Independent Trustees of the Fund; and (vii) investments made in connection with certain reorganizations as approved by the Adviser. If the value of your account falls below the minimum initial investment amount for Class L shares as a result of share redemptions or you no longer meet one of the waiver criteria set forth above, your account may be subject to involuntary conversion or involuntary redemption.
Investors purchasing and redeeming shares of the Portfolios through a financial intermediary may be charged a transaction-based fee or other fee for the financial intermediary's services. Each financial intermediary is responsible for sending you a schedule of fees and information regarding any additional or different conditions regarding purchases and redemptions. Customers of financial intermediaries should read this SAI in light of the terms governing accounts with their organization.
Class H shares are subject to a sales charge equal to a maximum of 3.50% (4.75% with respect to the Balanced and Mid Cap Growth Portfolios) calculated as a percentage of the offering price. Upon notice to selected broker-dealers, the Distributor may reallow up to the full applicable front-end sales charge during periods specified in such notice.
Neither the Distributor nor the Fund will be responsible for any loss, liability, cost, or expense for acting upon facsimile instructions or upon telephone instructions that they reasonably believe to be genuine. In order to confirm that telephone instructions in connection with redemptions are genuine, the Fund and Distributor will provide written confirmation of transactions initiated by telephone.
44
Conversion To a New Share Class. If the value of an account falls below the investment minimum for the Class of shares held by the account because of shareholder redemption(s) or the failure to meet one of the waiver criteria set forth above, and if the account value remains below such investment minimum, the shares in such account may, at the Adviser's discretion, convert to another class of shares offered by the Portfolio, if an account meets the minimum investment amount for such class, and will be subject to the shareholder services fee and other features applicable to such shares. Conversion to another class of shares will result in holding a share class with higher fees. The Fund will not convert to another class of shares based solely upon changes in the market that reduce the net asset value of shares. Under current tax law, conversion between share classes is not a taxable event to the shareholder. Shareholders will be notified prior to any such conversion.
Involuntary Redemption of Shares. If the value of an account falls below the investment minimum for Class H shares or Class L shares because of shareholder redemption(s) or you no longer meet one of the waiver criteria set forth above, and if the account value remains below such investment minimum, the shares in such account may be subject to redemption by the Fund. The Fund will not redeem shares based solely upon changes in the market that reduce the net asset value of shares. If shares are redeemed, redemption proceeds will be promptly paid to the shareholder. Shareholders will be notified prior to any such redemption.
The Fund is not currently offering Class H and Class L shares of the Mid Cap Growth Portfolio. The Fund may commence offering Class H and Class L shares of the Mid Cap Growth Portfolio in the future. Any such offerings of the Mid Cap Growth Portfolio's Class H and Class L shares may commence and terminate without any prior notice.
REDEMPTION OF SHARES
Each Portfolio may suspend redemption privileges or postpone the date of payment (i) during any period that the New York Stock Exchange ("NYSE") is closed, or trading on the NYSE is restricted as determined by the SEC, (ii) during any period when an emergency exists as defined by the rules of the SEC as a result of which it is not reasonably practicable for a Portfolio to dispose of securities owned by it, or fairly to determine the value of its assets, and (iii) for such other periods as the SEC may permit. The Fund has made an election with the SEC pursuant to Rule 18f-1 under the 1940 Act to pay in cash all redemptions requested by any shareholder of record limited in amount during any 90-day period to the lesser of $250,000 or 1% of the net assets of the Portfolio at the beginning of such period. Such commitment is irrevocable without the prior approval of the SEC. Redemptions in excess of the above limits may be paid in whole or in part in investment securities or in cash, as the Trustees may deem advisable; however, payment will be made wholly in cash unless the Trustees believe that economic or market conditions exist which would make such a practice detrimental to the best interests of the Fund. If redemptions are paid in investment securities, such securities will be valued as set forth in the Fund's prospectuses under "Valuation of Shares" and a redeeming shareholder would normally incur brokerage expenses in converting these securities to cash.
Redemption proceeds may be more or less than the shareholder's cost depending on the market value of the securities held by the Portfolio. See each prospectus for additional information about redeeming shares of a Portfolio.
TRANSACTIONS WITH BROKER/DEALERS
The Fund has authorized certain brokers to accept on its behalf purchase and redemption orders. Some of these brokers are authorized to designate other intermediaries to accept purchase and redemption orders on the Fund's behalf. For purposes of determining the purchase price of shares, the Fund will be deemed to have received a purchase or redemption order when an authorized broker, or if applicable, a broker's authorized designee, accepts the order. In other words, orders will be priced at the net asset value next computed after such orders are accepted by an authorized broker or the broker's authorized designee.
45
SHAREHOLDER SERVICES
Transfer of Shares
Shareholders may transfer shares of the Fund's Portfolios to another person by written request to Shareholder Services at Morgan Stanley Institutional Fund Trust, c/o Morgan Stanley Services Company Inc., P.O. Box 219804, Kansas City, MO 64121-9804. If shares are being transferred to a new account, requests for transfer must be accompanied by a completed Account Registration Form for the receiving party. If shares are being transferred to an existing account, the request should clearly identify the account and number of shares to be transferred and include the signature of all registered owners and all share certificates, if any, which are subject to the transfer. The signature on the letter of request, the share certificate or any stock power must be guaranteed in the same manner as described under "Redemption of Shares." As in the case of redemptions, the written request must be received in good order before any transfer can be made.
VALUATION OF SHARES
Net asset value per share ("NAV") is determined by dividing the total market value of each Portfolio's investments and other assets, less any liabilities, by the total outstanding shares of that Portfolio. The NAV for each class of shares offered by the Fund may differ due to class-specific expenses paid by each class, including the shareholder servicing fees charged to Class P shares, Class H shares and Class L shares.
In the calculation of a Portfolio's NAV: (1) an equity portfolio security listed or traded on the NYSE, or other exchange is valued at its latest sale price, prior to the time when assets are valued; if there were no sales that day, the security is valued at the mean between the last reported bid and asked price; (2) an equity portfolio security listed or traded on the Nasdaq is valued at the Nasdaq Official Closing Price; if there were no sales that day, the security is valued at the mean between the last reported bid and asked price; and (3) all other portfolio securities for which over-the-counter market quotations are readily available are valued at the mean between the last reported bid and asked price. In cases where a security is traded on more than one exchange, the security is valued on the exchange designated as the primary market. For equity securities traded on foreign exchanges, the last reported sale price or the latest bid price may be used if there were no sales on a particular day. When market quotations are not readily available, including circumstances under which it is determined by the Adviser that the sale price, the bid price or the mean between the last reported bid and asked price are not reflective of a security's market value, portfolio securities are valued at their fair value as determined in good faith under procedures established by and under the general supervision of the Board. For valuation purposes, quotations of foreign portfolio securities, other assets and liabilities and forward contracts stated in foreign currency are translated into U.S. dollar equivalents at the prevailing market rates prior to the close of the NYSE.
Short-term debt securities with remaining maturities of 60 days or less at the time of purchase are valued at amortized cost, unless the Board determines such valuation does not reflect the securities' market value, in which case these securities will be valued at their fair value as determined by the Board.
Certain of a Portfolio's securities may be valued by an outside pricing service approved by the Board. The pricing service may utilize a matrix system incorporating security quality, maturity and coupon as the evaluation model parameters, and/or research evaluations by its staff, including review of broker-dealer market price quotations in determining what it believes is the fair valuation of the portfolio securities valued by such pricing service.
Listed options on debt securities are valued at the latest sale price on the exchange on which they are listed unless no sales of such options have taken place that day, in which case they will be valued at the mean between their latest bid and asked prices. Unlisted options on debt securities and all options on equity securities are valued at the mean between their latest bid and asked prices. Futures are valued at the latest price published by the commodities exchange on which they trade unless it is determined that such price does not reflect their market value, in which case they will be valued at their fair value as determined in good faith under procedures established by and under the supervision of the Trustees.
46
Generally, trading in foreign securities, as well as corporate bonds, U.S. Government securities and money market instruments, is substantially completed each day at various times prior to the close of the NYSE. The values of such securities used in computing the net asset value of the Portfolio's shares are determined as of such times. Foreign currency exchange rates are also generally determined prior to the close of the NYSE. Occasionally, events which may affect the values of such securities and such exchange rates may occur between the times at which they are determined and the close of the NYSE and will therefore not be reflected in the computation of a Portfolio's net asset value. If events that may affect the value of such securities occur during such period, then these securities may be valued at their fair value as determined in good faith under procedures established by and under the supervision of the Trustees.
MANAGEMENT OF THE FUND
The Board supervises the Fund's affairs under the laws governing business trusts in the Commonwealth of Pennsylvania. The Board has approved contracts under which certain companies provide essential management, administrative and shareholder services to the Fund.
Trustees and Officers. The Board of the Fund consists of 10 Trustees. These same individuals also serve as directors or trustees for certain of the funds advised by the Adviser and Morgan Stanley AIP GP LP. Nine Trustees have no affiliation or business connection with the Adviser or any of its affiliated persons and do not own any stock or other securities issued by the Adviser's parent company, Morgan Stanley. These are the "non-interested" or "Independent" Trustees. The other Trustee (the "Interested Trustee") is affiliated with the Adviser.
Board Structure and Oversight Function
The Board's leadership structure features an Independent Trustee serving as Chairperson and the Board Committees described below. The Chairperson participates in the preparation of the agenda for meetings of the Board and the preparation of information to be presented to the Board with respect to matters to be acted upon by the Board. The Chairperson also presides at all meetings of the Board and is involved in discussions regarding matters pertaining to the oversight of the management of the Fund between meetings.
The Board of Trustees operates using a system of committees to facilitate the timely and efficient consideration of all matters of importance to the Trustees, the Fund and Fund stockholders, and to facilitate compliance with legal and regulatory requirements and oversight of the Fund's activities and associated risks. The Board of Trustees has established four standing committees: (1) Audit Committee, (2) Governance Committee, (3) Compliance and Insurance Committee and (4) Investment Committee. The Audit Committee and the Governance Committee are comprised exclusively of Independent Trustees. Each committee charter governs the scope of the committee's responsibilities with respect to the oversight of the Fund. The responsibilities of each committee, including their oversight responsibilities, are described further under the caption "Independent Trustees and the Committees."
The Fund is subject to a number of risks, including investment, compliance, operational and valuation risk, among others. The Board of Trustees oversees these risks as part of its broader oversight of the Fund's affairs through various Board and committee activities. The Board has adopted, and periodically reviews, policies and procedures designed to address various risks to the Fund. In addition, appropriate personnel, including but not limited to the Fund's Chief Compliance Officer, members of the Fund's administration and accounting teams, representatives from the Fund's independent registered public accounting firm, the Fund's Treasurer, portfolio management personnel and independent valuation and brokerage evaluation service providers, make regular reports regarding the Fund's activities and related risks to the Board of Trustees and the committees, as appropriate. These reports include, among others, quarterly performance reports, quarterly derivatives activity and risk reports and discussions with members of the risk teams relating to each asset class. The Board's committee structure allows separate committees to focus on different aspects of risk and potential impact on some or all of the funds in the complex and then report back to the full Board. In between regular meetings, Fund officers also communicate with the Directors/Trustees regarding material exceptions and items relevant to the Board's risk oversight function. The Board recognizes that it is not possible to identify all of the risks that may affect the Fund, and that it is not possible to develop processes and controls to eliminate all of the risks that may affect the Fund.
47
Moreover, the Board recognizes that it may be necessary for the Fund to bear certain risks (such as investment risk) to achieve its investment objective.
As needed between meetings of the Board, the Board or a specific committee receives and reviews reports relating to the Fund and engages in discussions with appropriate parties relating to the Fund's operations and related risks.
Independent Trustees. The Fund seeks as Trustee individuals of distinction and experience in business and finance, government service or academia. In determining that a particular Trustee was and continues to be qualified to serve as Trustee, the Board has considered a variety of criteria, none of which, in isolation, was controlling. Based on a review of the experience, qualifications, attributes or skills of each Trustee, including those enumerated in the table below, the Board has determined that each of the Trustee is qualified to serve as a Trustee of the Fund. In addition, the Board believes that, collectively, the Trustees have balanced and diverse experience, qualifications, attributes and skills that allow the Board to operate effectively in governing the Fund and protecting the interests of shareholders. Information about the Fund's Governance Committee and Board of Trustee nomination process is provided below under the caption "Independent Trustee and the Committees."
The Independent Trustees of the Fund, their age, address, term of office and length of time served, their principal business occupations during the past five years, the number of portfolios in the Fund Complex (defined below) overseen by each Independent Trustee (as of December 31, 2011) and other directorships, if any, held by the Trustees, are shown below. The Fund Complex includes all open-end and closed-end funds (including all of
48
their portfolios) advised by the Adviser and any funds that have an adviser that is an affiliate of the Adviser (including, but not limited to, Morgan Stanley AIP GP LP) (the "Morgan Stanley Funds").
Independent Trustees:
| Name, Age and Address of Independent Trustee | Position(s) Held with Registrant | Length of Time Served* | Principal Occupation(s) During Past 5 Years | Number of Portfolios in Fund Complex Overseen by Independent Trustee | Other Directorships Held by Independent Trustee** | ||||||||||||||||||
| Frank L. Bowman (67) c/o Kramer Levin Naftalis & Frankel LLP Counsel to the Independent Trustees 1177 Avenue of the Americas New York, NY 10036 | Trustee | Since August 2006 | President, Strategic Decisions, LLC (consulting) (since February 2009); Director or Trustee of various Morgan Stanley Funds (since August 2006); Chairperson of the Insurance Sub-Committee of the Compliance and Insurance Committee (since February 2007); served as President and Chief Executive Officer of the Nuclear Energy Institute (policy organization) (February 2005-November 2008); retired as Admiral, U.S. Navy after serving over 38 years on active duty including 8 years as Director of the Naval Nuclear Propulsion Program in the Department of the Navy and the U.S. Department of Energy (1996-2004); served as Chief of Naval Personnel (July 1994-September 1996); and on the Joint Staff as Director of Political Military Affairs (June 1992-July 1994); Knighted as Honorary Knight Commander of the Most Excellent Order of the British Empire; Awarded the Officer de l'Orde National du Mérite by the French Government; elected to the National Academy of Engineering (2009). | 102 | Director of BP p.l.c.; Director of Naval and Nuclear Technologies LLP; Director of the Armed Services YMCA of the USA and the Naval Submarine League; Director of the American Shipbuilding Suppliers Association; Member of the National Security Advisory Council of the Center for U.S. Global Engagement and a member of the CNA Military Advisory Board; Member of the American Lung Association's President's Council. | ||||||||||||||||||
* Each Trustee serves an indefinite term, until his or her successor is elected.
** This includes any directorships at public companies and registered investment companies held by the Trustee at any time during the past five years.
49
| Name, Age and Address of Independent Trustee | Position(s) Held with Registrant | Length of Time Served* | Principal Occupation(s) During Past 5 Years | Number of Portfolios in Fund Complex Overseen by Independent Trustee | Other Directorships Held by Independent Trustee** | ||||||||||||||||||
| Michael Bozic (71) c/o Kramer Levin Naftalis & Frankel LLP Counsel to the Independent Trustees 1177 Avenue of the Americas New York, NY 10036 | Trustee | Since April 1994 | Private investor; Chairperson of the Compliance and Insurance Committee (since October 2006); Director or Trustee of various Morgan Stanley Funds (since April 1994); formerly, Chairperson of the Insurance Committee (July 2006-September 2006), Vice Chairman of Kmart Corporation (December 1998-October 2000), Chairman and Chief Executive Officer of Levitz Furniture Corporation (November 1995-November 1998) and President and Chief Executive Officer of Hills Department Stores (May 1991-July 1995); variously Chairman, Chief Executive Officer, President and Chief Operating Officer (1987-1991) of the Sears Merchandise Group of Sears, Roebuck & Co. | 104 | Director of various business organizations. | ||||||||||||||||||
| Kathleen A. Dennis (58) c/o Kramer Levin Naftalis & Frankel LLP Counsel to the Independent Trustees 1177 Avenue of the Americas New York, NY 10036 | Trustee | Since August 2006 | President, Cedarwood Associates (mutual fund and investment management consulting) (since July 2006); Chairperson of the Money Market and Alternatives Sub-Committee of the Investment Committee (since October 2006) and Director or Trustee of various Morgan Stanley Funds (since August 2006); formerly, Senior Managing Director of Victory Capital Management (1993-2006). | 102 | Director of various non-profit organizations. | ||||||||||||||||||
* Each Trustee serves an indefinite term, until his or her successor is elected.
** This includes any directorships at public companies and registered investment companies held by the Trustee at any time during the past five years.
50
| Name, Age and Address of Independent Trustee | Position(s) Held with Registrant | Length of Time Served* | Principal Occupation(s) During Past 5 Years | Number of Portfolios in Fund Complex Overseen by Independent Trustee | Other Directorships Held by Independent Trustee** | ||||||||||||||||||
| Dr. Manuel H. Johnson (63) c/o Johnson Smick Group, Inc. 888 16th Street, N.W. Suite 740 Washington, D.C. 20006 | Trustee | Since July 1991 | Senior Partner, Johnson Smick International, Inc. (consulting firm); Chairperson of the Investment Committee (since October 2006) and Director or Trustee of various Morgan Stanley Funds (since July 1991); Co-Chairman and a founder of the Group of Seven Council (G7C) (international economic commission); formerly, Chairperson of the Audit Committee (July 1991-September 2006); Vice Chairman of the Board of Governors of the Federal Reserve System and Assistant Secretary of the U.S. Treasury. | 104 | Director of NVR, Inc. (home construction). | ||||||||||||||||||
| Joseph J. Kearns (69) c/o Kearns & Associates LLC PMB754 22631 Pacific Coast Highway Malibu, CA 90265 | Trustee | Since August 1994 | President, Kearns & Associates LLC (investment consulting); Chairperson of the Audit Committee (since October 2006) and Director or Trustee of various Morgan Stanley Funds (since August 1994); formerly, Deputy Chairperson of the Audit Committee (July 2003-September 2006) and Chairperson of the Audit Committee of various Morgan Stanley Funds (since August 1994); CFO of the J. Paul Getty Trust. | 105 | Director of Electro Rent Corporation (equipment leasing) and The Ford Family Foundation. | ||||||||||||||||||
* Each Trustee serves an indefinite term, until his or her successor is elected.
** This includes any directorships at public companies and registered investment companies held by the Trustee at any time during the past five years.
51
| Name, Age and Address of Independent Trustee | Position(s) Held with Registrant | Length of Time Served* | Principal Occupation(s) During Past 5 Years | Number of Portfolios in Fund Complex Overseen by Independent Trustee | Other Directorships Held by Independent Trustee** | ||||||||||||||||||
| Michael F. Klein (53) c/o Kramer Levin Naftalis & Frankel LLP Counsel to the Independent Trustees 1177 Avenue of the Americas New York, NY 10036 | Trustee | Since August 2006 | Managing Director, Aetos Capital, LLC (since March 2000) and Co-President, Aetos Alternatives Management, LLC (since January 2004); Chairperson of the Fixed-Income Sub-Committee of the Investment Committee (since October 2006) and Director or Trustee of various Morgan Stanley Funds (since August 2006); formerly, Managing Director, Morgan Stanley & Co. Inc. and Morgan Stanley Dean Witter Investment Management, President, various Morgan Stanley Funds (June 1998-March 2000) and Principal, Morgan Stanley & Co. Inc. and Morgan Stanley Dean Witter Investment Management (August 1997-December 1999). | 102 | Director of certain investment funds managed or sponsored by Aetos Capital, LLC. Director of Sanitized AG and Sanitized Marketing AG (specialty chemicals). | ||||||||||||||||||
| Michael E. Nugent (75) c/o Triumph Capital, L.P. 445 Park Avenue New York, NY 10022 | Chairperson of the Board and Trustee | Chairpersonof the Boards since July 2006 and Trustee since July 1991 | General Partner, Triumph Capital, L.P. (private investment partnership); Chairperson of the Boards of various Morgan Stanley Funds (since July 2006); Director or Trustee of various Morgan Stanley Funds (since July 1991); formerly, Chairperson of the Insurance Committee (until July 2006). | 104 | None. | ||||||||||||||||||
| W. Allen Reed (65) c/o Kramer Levin Naftalis & Frankel LLP Counsel to the Independent Trustees 1177 Avenue of the Americas New York, NY 10036 | Trustee | Since August 2006 | Chairperson of the Equity Sub-Committee of the Investment Committee (since October 2006) and Director or Trustee of various Morgan Stanley Funds (since August 2006); formerly, President and CEO of General Motors Asset Management; Chairman and Chief Executive Officer of the GM Trust Bank and Corporate Vice President of General Motors Corporation (August 1994-December 2005). | 102 | Director of Temple-Inland Industries (packaging and forest products), Director of Legg Mason, Inc. and Director of the Auburn University Foundation. | ||||||||||||||||||
* Each Trustee serves an indefinite term, until his or her successor is elected.
** This includes any directorships at public companies and registered investment companies held by the Trustee at any time during the past five years.
52
| Name, Age and Address of Independent Trustee | Position(s) Held with Registrant | Length of Time Served* | Principal Occupation(s) During Past 5 Years | Number of Portfolios in Fund Complex Overseen by Independent Trustee | Other Directorships Held by Independent Trustee** | ||||||||||||||||||
| Fergus Reid (79) c/o Joe Pietryka, Inc. 85 Charles Colman Blvd. Pawling, NY 12564 | Trustee | Since June 1992 | Chairman, Joe Pietryka, Inc.; Chairperson of the Governance Committee and Director or Trustee of various Morgan Stanley Funds (since June 1992). | 105 | Trustee and Director of certain investment companies in the JPMorgan Funds complex managed by JPMorgan Investment Management Inc. | ||||||||||||||||||
The Trustee who is affiliated with the Adviser or affiliates of the Adviser (as set forth below) and executive officers of the Fund, their age, address, term of office and length of time served, their principal business occupations during the past five years, the number of portfolios in the Fund Complex overseen by the Interested Trustee (as of December 31, 2011) and the other directorships, if any, held by the Interested Trustee, are shown below.
Interested Trustee:
| Name, Age and Address of Interested Trustee | Position(s) Held with Registrant | Length of Time Served* | Principal Occupation(s) During Past 5 Years | Number of Portfolios in Fund Complex Overseen by Interested Trustee | Other Directorships Held by Interested Trustee** | ||||||||||||||||||
| James F. Higgins (64) c/o Morgan Stanley Services Company Inc. Harborside Financial Center 201 Plaza Two Jersey City, NJ 07311 | Trustee | Since June 2000 | Director or Trustee of various Morgan Stanley Funds (since June 2000); Senior Advisor of Morgan Stanley (since August 2000). | 103 | Director of AXA Financial, Inc. and The Equitable Life Assurance Society of the United States (financial services). | ||||||||||||||||||
* Each Trustee serves an indefinite term, until his or her successor is elected.
** This includes any directorships at public companies and registered investment companies held by the Trustee at any time during the past five years.
Executive Officers:
| Name, Age and Address of Executive Trustee | Position(s) Held with Registrant | Length of Time Served*** | Principal Occupation(s) During Past 5 Years | ||||||||||||
| Arthur Lev (50) 522 Fifth Avenue New York, NY 10036 | President and Principal Executive Officer—Equity and Fixed Income Funds | Since June 2011 | President and Principal Executive Officer (since June 2011) of the Equity and Fixed Income Funds in the Fund Complex; Head of the Long Only Business of Morgan Stanley Investment Management (since February 2011); Managing Director of the Adviser and various entities affiliated with the Adviser (since December 2006). Formerly, Chief Strategy Officer of Morgan Stanley Investment Management Traditional Asset Management business (November 2010-February 2011); General Counsel of Morgan Stanley Investment Management (December 2006-October 2010); Partner and General Counsel of FrontPoint Partners LLC (July 2002-December 2006); Managing Director and General Counsel of Morgan Stanley Investment Management (May 2000-June 2002). | ||||||||||||
*** Each Officer serves an indefinite term, until his or her successor is elected.
53
| Name, Age and Address of Executive Trustee | Position(s) Held with Registrant | Length of Time Served*** | Principal Occupation(s) During Past 5 Years | ||||||||||||
| Mary Ann Picciotto (39) c/o Morgan Stanley Services Company Inc. Harborside Financial Center 201 Plaza Two Jersey City, NJ 07311 | Chief Compliance Officer | Since May 2010 | Managing Director of the Adviser and various entities affiliated with the Adviser; Chief Compliance Officer of the various Morgan Stanley Funds (since May 2010); Chief Compliance Officer of the Adviser (since April 2007). | ||||||||||||
| Stefanie V. Chang Yu (45) 522 Fifth Avenue New York, NY 10036 | Vice President | Since December 1997 | Managing Director of the Adviser and various entities affiliated with the Adviser; Vice President of various Morgan Stanley Funds (since December 1997). | ||||||||||||
| Francis J. Smith (46) c/o Morgan Stanley Services Company Inc. Harborside Financial Center 201 Plaza Two Jersey City, NJ 07311 | Treasurer and Principal Financial Officer | Treasurer since July 2003 and Principal Financial Officer since September 2002 | Executive Director of the Adviser and various entities affiliated with the Adviser; Treasurer and Principal Financial Officer of various Morgan Stanley Funds (since July 2003). | ||||||||||||
| Mary E. Mullin (45) 522 Fifth Avenue New York, NY 10036 | Secretary | Since June 1999 | Executive Director of the Adviser and various entities affiliated with the Adviser; Secretary of various Morgan Stanley Funds (since June 1999). | ||||||||||||
*** Each Officer serves an indefinite term, until his or her successor is elected.
In addition, the following individuals who are officers of the Investment Adviser or who are officers its affiliates serve as assistant secretaries of the Fund: Joanne Antico, Joseph C. Benedetti, Daniel E. Burton, Tara A. Farrelly and Edward J. Meehan.
For each Trustee, the dollar range of equity securities beneficially owned by the Trustee in the Fund and in the Family of Investment Companies (Family of Investment Companies includes all of the registered investment companies advised by the Adviser and Morgan Stanley AIP GP LP) for the calendar year ended December 31, 2011 is set forth in the table below.
| Name of Trustee | Dollar Range of Equity Securities in the Fund (as of December 31, 2011) | Aggregate Dollar Range of Equity Securities in All Registered Investment Companies Overseen by Trustee in Family of Investment Companies (as of December 31, 2011) | |||||||||
| Independent: | |||||||||||
| Frank L. Bowman(1) | * | over $100,000 | |||||||||
| Michael Bozic | None | over $100,000 | |||||||||
| Kathleen A. Dennis | None | over $100,000 | |||||||||
| Manuel H. Johnson | None | over $100,000 | |||||||||
| Joseph J. Kearns(1) | * | over $100,000 | |||||||||
| Michael F. Klein | * | over $100,000 | |||||||||
| Michael E. Nugent | None | over $100,000 | |||||||||
| W. Allen Reed(1) | * | over $100,000 | |||||||||
| Fergus Reid(1) | None | over $100,000 | |||||||||
| Interested: | |||||||||||
| James F. Higgins | None | over $100,000 | |||||||||
* Joseph J. Kearns—Balanced Portfolio ($10,001-$50,000); Corporate Bond Portfolio ($50,001-$100,000). Michael F. Klein—Mid Cap Growth Portfolio ($10,001-$50,000). Frank L. Bowman—Mid Cap Growth Portfolio ($10,001-$50,000). W. Allen Reed—Mid Cap Growth Portfolio ($10,001-$50,000).
(1) Includes the total amount of compensation deferred by the Trustee at his election pursuant to a deferred compensation plan. Such deferred compensation is placed in a deferral account and deemed to be invested in one or more of the Morgan Stanley Funds (or portfolio thereof) that are offered as investment options under the plan.
54
As to each Independent Trustee and his or her immediate family members, no person owned beneficially or of record securities in an investment adviser or principal underwriter of the Fund, or a person (other than a registered investment company) directly or indirectly controlling, controlled by or under common control with an investment adviser or principal underwriter of the Fund.
As of December 31, 2011, the Trustees and Officers of the Fund, as a group, owned less than 1% of the outstanding common stock of each Portfolio of the Fund.
Independent Trustees and the Committees. Law and regulation establish both general guidelines and specific duties for the Independent Trustees. The Board has four committees: (1) Audit Committee, (2) Governance Committee, (3) Compliance and Insurance Committee and (4) Investment Committee. Three of the Independent Trustees serve as members of the Audit Committee, three Independent Trustees serve as members of the Governance Committee, four Trustees, including three Independent Trustees, serve as members of the Compliance and Insurance Committee and all of the Trustees serve as members of the Investment Committee.
The Independent Trustees are charged with recommending to the full Board approval of management, advisory and administration contracts, shareholder service plans and distribution and underwriting agreements; continually reviewing fund performance, checking on the pricing of portfolio securities, brokerage commissions, transfer agent costs and performance and trading among funds in the same complex; and approving fidelity bond and related insurance coverage and allocations, as well as other matters that arise from time to time. The Independent Trustees are required to select and nominate individuals to fill any Independent Trustee vacancy on the board of any fund that has a Rule 12b-1 plan of distribution.
The Board of Trustees has a separately-designated standing Audit Committee established in accordance with Section 3(a)(58)(A) of the Securities Exchange Act of 1934, as amended. The Audit Committee is charged with recommending to the full Board the engagement or discharge of the Fund's independent registered public accounting firm; directing investigations into matters within the scope of the independent registered public accounting firm's duties, including the power to retain outside specialists; reviewing with the independent registered public accounting firm the audit plan and results of the auditing engagement; approving professional services provided by the independent registered public accounting firm and other accounting firms prior to the performance of the services; reviewing the independence of the independent registered public accounting firm; considering the range of audit and non-audit fees; reviewing the adequacy of the Fund's system of internal controls; and reviewing the valuation process. The Fund has adopted a formal, written Audit Committee Charter.
The members of the Audit Committee of the Fund are Joseph J. Kearns, Michael E. Nugent and W. Allen Reed. None of the members of the Fund's Audit Committee is an "interested person," as defined under the 1940 Act, of the Fund (with such disinterested Trustees being "Independent Trustees" or individually, "Independent Trustee"). Each Independent Trustee is also "independent" from the Fund under the listing standards of the NYSE. The Chairperson of the Audit Committee of the Fund is Joseph J. Kearns.
The Board of Trustees of the Fund also has a Governance Committee. The Governance Committee identifies individuals qualified to serve as Independent Trustees on the Fund's Board and on committees of the Board and recommends such qualified individuals for nomination by the Fund's Independent Trustees as candidates for election as Independent Trustees, advises the Fund's Board with respect to Board composition, procedures and committees, develops and recommends to the Fund's Board a set of corporate governance principles applicable to the Fund, monitors and makes recommendations on corporate governance matters and policies and procedures of the Fund's Board of Trustees and any Board committees and oversees periodic evaluations of the Fund's Board and its committees. The members of the Governance Committee of the Fund are Kathleen A. Dennis, Michael F. Klein and Fergus Reid, each of whom is an Independent Trustee. The Chairperson of the Governance Committee is Fergus Reid.
The Fund does not have a separate nominating committee. While the Fund's Governance Committee recommends qualified candidates for nominations as Independent Trustees, the Board of Trustees of the Fund believes that the task of nominating prospective Independent Trustees is important enough to require the participation of all current Independent Trustees, rather than a separate committee consisting of only certain
55
Independent Trustees. Accordingly, each Independent Trustee (Frank L. Bowman, Michael Bozic, Kathleen A. Dennis, Manuel H. Johnson, Joseph J. Kearns, Michael F. Klein, Michael E. Nugent, W. Allen Reed and Fergus Reid) participates in the election and nomination of candidates for election as Independent Trustees for the Fund. Persons recommended by the Fund's Governance Committee as candidates for nomination as Independent Trustees shall possess such experience, qualifications, attributes, skills and diversity so as to enhance the Board's ability to manage and direct the affairs and business of the Fund, including, when applicable, to enhance the ability of committees of the Board to fulfill their duties and/or to satisfy any independence requirements imposed by law, regulation or any listing requirements of the NYSE. While the Independent Trustees of the Fund expect to be able to continue to identify from their own resources an ample number of qualified candidates for the Fund's Board as they deem appropriate, they will consider nominations from shareholders to the Board. Nominations from shareholders should be in writing and sent to the Independent Trustees as described below under the caption "Shareholder Communications."
The Board formed the Compliance and Insurance Committee to address insurance coverage and oversee the compliance function for the Fund and the Board. The Compliance and Insurance Committee consists of Frank L. Bowman, Michael Bozic, James F. Higgins and Manuel H. Johnson. Frank L. Bowman, Michael Bozic and Manuel H. Johnson are Independent Trustees. The Chairperson of the Compliance and Insurance Committee is Michael Bozic. The Compliance and Insurance Committee has an Insurance Sub-Committee to review and monitor the insurance coverage maintained by the Fund. The Chairperson of the Insurance Sub-Committee is Frank L. Bowman.
The Investment Committee oversees the portfolio investment process for and reviews the performance of the Fund. The Investment Committee also recommends to the Board to approve or renew the Fund's Investment Advisory and Administration Agreements. The members of the Investment Committee are Frank L. Bowman, Michael Bozic, Kathleen A. Dennis, James F. Higgins, Manuel H. Johnson, Joseph J. Kearns, Michael F. Klein, Michael E. Nugent, W. Allen Reed and Fergus Reid. The Chairperson of the Investment Committee is Manuel H. Johnson.
The Investment Committee has three Sub-Committees, each with its own Chairperson. Each Sub-Committee focuses on the funds' primary areas of investment, namely equities, fixed income and alternatives. The Sub-Committees and their members are as follows:
(1) Equity—W. Allen Reed (Chairperson), Frank L. Bowman and Michael E. Nugent.
(2) Fixed Income—Michael F. Klein (Chairperson), Michael Bozic and Fergus Reid.
(3) Money Market and Alternatives—Kathleen A. Dennis (Chairperson), James F. Higgins and Joseph J. Kearns.
During the Fund's fiscal year ended September 30, 2011, the Board of Trustees held the following meetings:
| Board of Trustees | 7 | ||||||
| Committee/Sub-Committee: | Number of Meetings | ||||||
| Audit Committee | 4 | ||||||
| Governance Committee | 4 | ||||||
| Compliance and Insurance Committee | 4 | ||||||
| Insurance Sub-Committee | 1 | ||||||
| Investment Committee | 5 | ||||||
| Equity Sub-Committee | 5 | ||||||
| Fixed Income Sub-Committee | 5 | ||||||
| Money Market and Alternatives Sub-Committee | 7 | ||||||
56
Experience, Qualifications and Attributes
The Board has concluded, based on each Trustee's experience, qualifications and attributes that each Board member should serve as a Trustee. Following is a brief summary of the information that led to and/or supports this conclusion.
Mr. Bowman has experience in a variety of business and financial matters through his prior service as a Director or Trustee for various other funds in the Fund Complex, where he serves as Chairperson of the Insurance Sub-Committee of the Compliance and Insurance Committee, and as a Director of BP p.l.c. and Naval and Nuclear Technologies LLP. Mr. Bowman also serves as a Director for the Armed Services YMCA of the USA, the Naval Submarine League and the American Shipbuilding Suppliers Association. Mr. Bowman is also a member of the National Security Advisory Council of the Center for U.S. Global Engagement and a member of the CNA Military Advisory Board. Mr. Bowman retired as an Admiral in the U.S. Navy, after serving over 38 years on active duty including 8 years as Director of the Naval Nuclear Propulsion Program in the Department of the Navy and the Department of Energy (1996-2004). Additionally, Mr. Bowman served as the U.S. Navy's Chief of Naval Personnel where he was responsible for the planning and programming of all manpower, personnel, training and education resources for the U.S. Navy, and on the Joint Staff as Director of Political Military Affairs (1992-1994). In addition, Mr. Bowman served as President and Chief Executive Officer of the Nuclear Energy Institute. Mr. Bowman has received such distinctions as a knighthood as Honorary Knight Commander of the Most Excellent Order of the British Empire and the Officer de l'Orde National du Mérite from the French Government, and was elected to the National Academy of Engineering (2009). He is President of the consulting firm Strategic Decisions, LLC.
With over 20 years of experience on the boards and in senior management of such companies as Kmart Corporation, Levitz Furniture Corporation, Hills Department Stores and Sears Merchandise Group of Sears, Roebuck & Co., where Mr. Bozic also served as Chief Financial Officer of the Merchandise Group, and with over 15 years of experience as a Director or Trustee of certain other funds in the Fund Complex, Mr. Bozic has experience with a variety of financial, management, regulatory and operational issues as well as experience with marketing and distribution. Mr. Bozic has served as the Chairperson of the Compliance and Insurance Committee since 2006.
Ms. Dennis has over 25 years of business experience in the financial services industry and related fields including serving as a Director or Trustee of various other funds in the Fund Complex, where she serves as Chairperson of the Money Market and Alternatives Sub-Committee of the Investment Committee Ms. Dennis possesses a strong understanding of the regulatory framework under which investment companies must operate based on her years of service to this Board and her position as Senior Managing Trustee of Victory Capital Management.
In addition to his tenure as a Trustee or Trustee of various other funds in the Fund Complex, where he formerly served as Chairperson of the Audit Committee, Dr. Johnson has also served as an officer or a board member of numerous companies for nearly 20 years. These positions included Co-Chairman and a founder of the Group of Seven Council, Trustee of NVR, Inc., Trustee of Evergreen Energy and Trustee of Greenwich Capital Holdings. He also has served as Vice Chairman of the Board of Governors of the Federal Reserve System and Assistant Secretary of the U.S. Treasury. In addition, Dr. Johnson also served as Chairman of the Financial Accounting Foundation, which oversees the Financial Accounting Standards Board, for seven years.
Mr. Kearns gained extensive experience regarding accounting through his experience on the Audit Committees of the boards of other funds in the Funds Complex, including serving as either Chairperson or Deputy Chairperson of the Audit Committee for fourteen years, and through his position as Chief Financial Officer of the J. Paul Getty Trust. He also has experience in financial, accounting, investment and regulatory matters through his position as President and founder of Kearns & Associates LLC, a financial consulting company. Mr. Kearns also serves as a Trustee of Electro Rent Corporation and The Ford Family Foundation. The Board has determined that Mr. Kearns is an "audit committee financial expert" as defined by the SEC.
Through his prior positions as Managing Trustee of Morgan Stanley & Co. Inc. and Morgan Stanley Dean Witter Investment Management and as President of Morgan Stanley Institutional Funds, Mr. Klein has experience in the management and operation of registered investment companies, enabling him to provide management input and investment guidance to the Board. Mr. Klein also has extensive experience in the investment management
57
industry based on his current positions as Managing Trustee of Aetos Capital, LLC and as Director of certain investment funds managed or sponsored by Aetos Capital, LLC. In addition, he also has experience as a member of the board of other funds in the Fund Complex.
Mr. Nugent has extensive experience with financial, accounting, investment and regulatory matters through his almost 20 years of service on the boards of various funds in the Fund Complex, including time as the Chairperson of the Insurance Committee and Chairman of the Morgan Stanley Funds. Mr. Nugent also has experience as a General Partner in Triumph Capital, L.P.
Mr. Reed has experience on investment company boards and is experienced with financial, accounting, investment and regulatory matters through his prior service as a Trustee of iShares Inc. and his service as Trustee and Director of other funds in the Fund Complex. Mr. Reed also gained substantial experience in the financial services industry through his positions as Trustee of Legg Mason, Inc. and prior position as President and CEO of General Motors Asset Management.
Mr. Reid has served on a number of mutual fund boards, including as a Trustee and Director of certain investment companies in the JPMorgan Funds complex and as a Director or Trustee of other funds in the Fund Complex. Therefore, Mr. Reid is experienced with financial, accounting, investment and regulatory matters, enabling him to provide management input and investment guidance to the Board.
Mr. Higgins has over 30 years of experience in the financial services industry. Mr. Higgins has substantial mutual fund experience and is experienced with financial, accounting, investment and regulatory matters due to his experience on the boards of other funds in the Fund Complex. Mr. Higgins also serves on the boards of other companies in the financial services industry, including AXA Financial, Inc. and The Equitable Life Assurance Society of the United States.
The Trustees' principal occupations during the past five years or more are shown in the above tables.
Advantages of Having the Same Individuals as Independent Trustees for Morgan Stanley Funds. The Independent Trustees and the Fund's management believe that having the same Independent Trustees for each of the Retail Funds and Institutional Funds avoids the duplication of effort that would arise from having different groups of individuals serving as Independent Trustees for each of the funds or even of sub-groups of funds. They believe that having the same individuals serve as Independent Trustees of all the Morgan Stanley Funds tends to increase their knowledge and expertise regarding matters which affect the Fund Complex generally and enhances their ability to negotiate on behalf of each fund with the fund's service providers. This arrangement also precludes the possibility of separate groups of Independent Trustees arriving at conflicting decisions regarding operations and management of the funds and avoids the cost and confusion that would likely ensue. Finally, having the same Independent Trustees serve on all fund boards of enhances the ability of each fund to obtain, at modest cost to each separate fund, the services of Independent Trustees of the caliber, experience and business acumen of the individuals who serve as Independent Trustees of the Morgan Stanley Funds.
Trustee and Officer Indemnification. The Fund's Declaration of Trust provides that no Trustee, Officer, employee or agent of the Fund is liable to the Fund or to a shareholder, nor is any Trustee, Officer, employee or agent liable to any third persons in connection with the affairs of the Fund, except as such liability may arise from his/her or its own bad faith, willful misfeasance, gross negligence or reckless disregard of his/her or its duties. It also provides that all third persons shall look solely to Fund property for satisfaction of claims arising in connection with the affairs of the Fund. With the exceptions stated, the Declaration of Trust provides that a Trustee, Officer, employee or agent is entitled to be indemnified against all liability in connection with the affairs of the Fund.
Shareholder Communications. Shareholders may send communications to the Board of Trustees. Shareholders should send communications intended for the Board by addressing the communications directly to that Board (or individual Board members) and/or otherwise clearly indicating in the salutation that the communication is for the Board (or individual Board members) and by sending the communication to either the Fund's office or directly to such Board member(s) at the address specified for each Trustee previously noted. Other shareholder communications received by the Fund not directly addressed and sent to the Board will be reviewed
58
and generally responded to by management, and will be forwarded to the Board only at management's discretion based on the matters contained therein.
Compensation. Each Trustee (except for the Chairperson of the Boards) receives an annual retainer fee of $210,000 for serving the Morgan Stanley Funds.
The Chairperson of the Audit Committee receives an additional annual retainer fee of $78,750 and the Investment Committee Chairperson receives an additional annual retainer fee of $63,000. Other Committee and, effective January 1, 2012, Sub-Committee Chairpersons receive an additional annual retainer fee of $31,500. Prior to January 1, 2012, each Sub-Committee Chairperson received an annual retainer of $15,750. The aggregate compensation paid to each Trustee is paid by the Morgan Stanley Funds, and is allocated on a pro rata basis among each of the operational funds/portfolios of the Morgan Stanley Funds based on the relative net assets of each of the funds/portfolios. Michael E. Nugent receives a total annual retainer fee of $420,000 for his services as Chairperson of the Boards of the Morgan Stanley Funds and for administrative services provided to each Board.
The Fund also reimburses the Independent Trustees for travel and other out-of-pocket expenses incurred by them in connection with attending such meetings. Trustees of the Fund who are employed by the Adviser receive no compensation or expense reimbursement from the Fund for their services as a Trustee.
Effective April 1, 2004, the Fund began a Deferred Compensation Plan (the "DC Plan"), which allows each Trustee to defer payment of all, or a portion, of the fees he or she receives for serving on the Board of Trustees throughout the year. Each eligible Trustee generally may elect to have the deferred amounts credited with a return equal to the total return on one or more of the Morgan Stanley Funds (or portfolios thereof) that are offered as investment options under the Plan. At the Trustee's election, distributions are either in one lump sum payment, or in the form of equal annual installments over a period of five years. The rights of an eligible Trustee and the beneficiaries to the amounts held under the DC Plan are unsecured and such amounts are subject to the claims of the creditors of the Fund.
Prior to April 1, 2004, the Fund maintained a similar Deferred Compensation Plan (the "Prior DC Plan"), which also allowed each Independent Trustee to defer payment of all, or a portion, of the fees he or she received for serving on the Board of Trustees throughout the year. Generally, the DC Plan amends and supersedes the Prior DC Plan and all amounts payable under the Prior DC Plan are now subject to the terms of the Plan (except for amounts paid during the calendar year 2004 which remain subject to the terms of the Prior DC Plan).
The following table shows aggregate compensation payable to each of the Fund's Trustees from the Fund for the fiscal year ended September 30, 2011 and the aggregate compensation payable to each of the Fund's Trustees by the Fund Complex (which includes all of the Morgan Stanley Funds) for the calendar year ended December 31, 2011.
COMPENSATION(1)
| Name of Independent Trustee | Aggregate Compensation From the Fund(2) | Total Compensation From Fund and Fund Complex Paid to the Trustees(3) | |||||||||
| Frank L. Bowman | $ | 18,799 | $ | 225,750 | |||||||
| Michael Bozic | 19,824 | 241,500 | |||||||||
| Kathleen A. Dennis | 18,799 | 225,750 | |||||||||
| Manuel H. Johnson | 22,409 | 273,000 | |||||||||
| Joseph J. Kearns(2)(3) | 23,699 | 306,750 | |||||||||
| Michael F. Klein | 18,799 | 225,750 | |||||||||
| Michael E. Nugent | 34,472 | 420,000 | |||||||||
| W. Allen Reed(2)(3) | 18,796 | 225,750 | |||||||||
| Fergus Reid(3) | 19,824 | 259,500 | |||||||||
59
| Name of Independent Trustee | Aggregate Compensation From the Fund(2) | Total Compensation From Fund and Fund Complex Paid to the Trustees(3) | |||||||||
| James F. Higgins | $ | 17,249 | $ | 210,000 | |||||||
(1) Includes all amounts paid for serving as director/trustee of the funds, as well as serving as Chairperson of the Boards or a Chairperson of a Committee or Sub-Committee.
(2) The amounts shown in this column represent the aggregate compensation before deferral with respect to the Fund's fiscal year. The following Trustees deferred compensation from the Fund during the fiscal year ended September 30, 2011: Mr. Kearns, $8,769; Mr. Reed, $18,796.
(3) The amounts shown in this column represent the aggregate compensation paid by all of the funds in the Fund Complex as of December 31, 2011 before deferral by the Trustees under the DC Plan. As of December 31, 2011, the value (including interest) of the deferral accounts across the Fund Complex for Messrs. Kearns, Reed and Reid pursuant to the deferred compensation plan was $532,157, $674,903 and $523,935, respectively. Because the funds in the Fund Complex have different fiscal year ends, the amounts shown in this column are presented on a calendar year basis.
Prior to December 31, 2003, 49 of the Morgan Stanley Funds (the "Adopting Funds") had adopted a retirement program under which an Independent Trustee who retired after serving for at least five years as an Independent Trustee of any such fund (an "Eligible Trustee") would have been entitled to retirement payments based on factors such as length of service, upon reaching the eligible retirement age. On December 31, 2003, the amount of accrued retirement benefits for each Eligible Trustee was frozen, and will be payable, together with a return of 8% per annum, at or following each such Eligible Trustee's retirement as shown in the table below.
The following table illustrates the retirement benefits accrued to the Fund's Independent Trustees by the Adopting Funds for the calendar year ended December 31, 2011, and the estimated retirement benefits for the Independent Trustees from the Adopting Funds for each calendar year following retirement. Only the Trustees listed below participated in the retirement program.
| Name of Independent Trustee | Retirement Benefits Accrued as Fund Expenses By All Adopting Funds | Estimated Annual Benefits Upon Retirement(1) From All Adopting Funds | |||||||||
| Michael Bozic | $ | 42,107 | $ | 43,940 | |||||||
| Manuel H. Johnson | 30,210 | 64,338 | |||||||||
| Michael E. Nugent | 6,805 | 57,539 | |||||||||
(1) Total compensation accrued under the retirement plan, together with a return of 8% per annum, will be paid annually commencing upon retirement and continuing for the remainder of the Trustee's life.
ADVISER
The Adviser to the Fund, Morgan Stanley Investment Management Inc., with principal offices at 522 Fifth Avenue, New York, NY 10036, is a wholly owned subsidiary of Morgan Stanley, a preeminent global financial services firm engaged in securities trading and brokerage activities, as well as providing investment banking, research and analysis, financing and financial advisory services. As of March 31, 2012, the Adviser, together with its affiliated asset management companies, had approximately $303.8 billion in assets under management or supervision.
Under an Investment Advisory Agreement (the "Agreement") with the Fund, the Adviser, subject to the control and supervision of the Fund's Board and in conformance with the stated investment objectives and policies of each Portfolio of the Fund, manages the investment and reinvestment of the assets of each Portfolio of the Fund. In this regard, it is the responsibility of the Adviser to make investment decisions for the Fund's Portfolios and to place each Portfolio's purchase and sales orders for investment securities.
As compensation for the services rendered by the Adviser under the Agreement and the assumption by the Adviser of the expenses related thereto (other than the cost of securities purchased for the Portfolios and the taxes and brokerage commissions, if any, payable in connection with the purchase and/or sale of such securities), each
60
Portfolio pays the Adviser an advisory fee calculated by applying a quarterly rate, based on the following annual percentage rates, to the Portfolio's average daily net assets for the quarter:
| Portfolio | Rate (%) | ||||||
| Mid Cap Growth | 0.500% | ||||||
| Core Fixed Income | 0.375% | ||||||
| Core Plus Fixed Income | 0.375% of the portion of the daily net assets not exceeding $1 billion; and 0.300% of the portion of the daily net assets exceeding $1 billion | ||||||
| Limited Duration | 0.300% | ||||||
| Balanced | 0.450% | ||||||
The Adviser has agreed to reduce or waive its advisory fees and/or reimburse certain expenses to the extent necessary, if any, to keep total annual operating expenses deducted from Portfolio assets for Class H and Class L from exceeding 0.75% and 1.00%, respectively, of average daily net assets for the Core Fixed Income Portfolio. In determining the actual amount of advisory fee waiver and/or expense reimbursement for a Portfolio, if any, the Adviser excludes from annual operating expenses certain investment related expenses. The fee waivers and/or expense reimbursements will continue for at least one year or until such time as the Fund's Board of Trustees acts to discontinue all or a portion of such waivers and/or reimbursements when it deems such action is appropriate.
The following table reflects for each Portfolio (i) the advisory fee paid; and (ii) the advisory fee waived and/or affiliated rebates for each of the past three fiscal years ended September 30, 2009, 2010 and 2011.
| Advisory Fees Paid (After Fee Waivers and/or Affiliated Rebates) | Advisory Fees Waived | Affiliated Rebates | |||||||||||||||||||||||||||||||||||||
| Portfolio | 2009 (000) | 2010 (000) | 2011 (000) | 2009 (000) | 2010 (000) | 2011 (000) | 2009 (000) | 2010 (000) | 2011 (000) | ||||||||||||||||||||||||||||||
| Mid Cap Growth | $ | 12,603 | $ | 21,076 | $ | 34,346 | $ | — | $ | — | $ | — | $ | 147 | $ | 257 | $ | 456 | |||||||||||||||||||||
| Core Fixed Income | 303 | 168 | — | 136 | 140 | 259 | 6 | 4 | 2 | ||||||||||||||||||||||||||||||
| Core Plus Fixed Income | 3,897 | 3,065 | 1,360 | — | — | — | 53 | 46 | 18 | ||||||||||||||||||||||||||||||
| Limited Duration | 1,045 | 705 | 561 | — | — | — | 8 | 6 | 3 | ||||||||||||||||||||||||||||||
| Balanced | 251 | 221 | 204 | — | — | — | 26 | 5 | 7 | ||||||||||||||||||||||||||||||
The Agreement continues for successive one year periods, only if each renewal is specifically approved by an in-person vote of the Fund's Board, including the affirmative votes of a majority of the Trustees who are not parties to the agreement or "interested persons" (as defined in the 1940 Act) of any such party at a meeting called for the purpose of considering such approval. In addition, the question of continuance of the Agreement may be presented to the shareholders of the Fund; in such event, continuance shall be effected only if approved by the affirmative vote of a majority of the outstanding voting securities of each Portfolio of the Fund. If the holders of any Portfolio fail to approve the Agreement, the Adviser may continue to serve as investment adviser to each Portfolio which approved the Agreement, and to any Portfolio which did not approve the Agreement until new arrangements have been made. The Agreement is automatically terminated if assigned, and may be terminated by any Portfolio without the payment of any penalty, at any time, (1) by vote of a majority of the entire Board or (2) by vote of a majority of the outstanding voting securities of the Portfolio on 60 days' written notice to the Adviser or (3) by the Adviser without the payment of any penalty, upon 90 days' written notice to the Fund.
The Fund bears all of its own costs and expenses, including but not limited to: services of its independent accountants, its administrator and dividend disbursing and transfer agent, legal counsel, taxes, insurance premiums, costs incidental to meetings of its shareholders and Trustees, the cost of filing its registration statements under federal and state securities laws, reports to shareholders, and custodian fees. These Fund expenses are, in turn, allocated to each Portfolio, based on their relative net assets. Each Portfolio bears its own advisory fees and brokerage commissions and transfer taxes in connection with the acquisition and disposition of its investment securities.
61
Code of Ethics
The Fund, the Adviser and the Distributor have each adopted a Code of Ethics pursuant to Rule 17j-1 under the 1940 Act. The Codes of Ethics are designed to detect and prevent improper personal trading. The Codes of Ethics permit personnel subject to the Codes to invest in securities, including securities that may be purchased, sold or held by the Fund, subject to a number of restrictions and controls, including prohibitions against purchases of securities in an initial public offering and a preclearance requirement with respect to personal securities transactions.
Proxy Voting Policies and Procedures and Proxy Voting Record
The Board of Trustees believes that the voting of proxies on securities held by the Fund is an important element of the overall investment process. As such, the Trustees have delegated the responsibility to vote such proxies to MSIM.
A copy of MSIM's Proxy Voting Policy ("Proxy Policy") is attached hereto as Appendix A. In addition, a copy of the Proxy Policy, as well as the Fund's most recent proxy voting record for the 12-month period ended June 30, filed with the SEC are available without charge on our web site at www.morganstanley.com/im. The Fund's proxy voting record is also available without charge on the SEC's web site at www.sec.gov.
Portfolio Managers
Because the portfolio managers may manage assets for other investment companies, pooled investment vehicles and/or other accounts (including institutional clients, pension plans and certain high net worth individuals), there may be an incentive to favor one client over another resulting in conflicts of interest. For instance, the Adviser may receive fees from certain accounts that are higher than the fee it receives from the Fund, or it may receive a performance-based fee on certain accounts. In those instances, the portfolio managers may have an incentive to favor the higher and/or performance-based fee accounts over the Fund. In addition, a conflict of interest could exist to the extent the Adviser has proprietary investments in certain accounts, where portfolio managers have personal investments in certain accounts or when certain accounts are investment options in the Adviser's employee benefits and/or deferred compensation plans. The portfolio manager may have an incentive to favor these accounts over others. If the Adviser manages accounts that engage in short sales of securities of the type in which the Fund invests, the Adviser could be seen as harming the performance of the Fund for the benefit of the accounts engaging in short sales if the short sales cause the market value of the securities to fall. The Adviser has adopted trade allocation and other policies and procedures that it believes are reasonably designed to address these and other conflicts of interest.
Portfolio Manager Compensation Structure
Portfolio managers receive a combination of base compensation and discretionary compensation, comprising a cash bonus and several deferred compensation programs described below. The methodology used to determine portfolio manager compensation is applied across all funds/accounts managed by the portfolio manager.
Base salary compensation. Generally, portfolio managers receive base salary compensation based on the level of their position with the Adviser.
Discretionary compensation. In addition to base compensation, portfolio managers may receive discretionary compensation. Discretionary compensation can include:
• Cash Bonus.
• Morgan Stanley's Long Term Incentive Compensation awards—a mandatory program that defers a portion of discretionary year-end compensation into restricted stock units or other awards based on Morgan Stanley common stock or other plans that are subject to vesting and other conditions. All long term incentive compensation awards are subject to clawback provisions where awards can be cancelled if an employee takes any action, or omits to take any action which; causes a restatement of Morgan Stanley's consolidated financial results; or constitutes a violation of Morgan Stanley's risk policies and standards.
62
• Investment Management Alignment Plan (IMAP) awards—a mandatory program that defers a portion of discretionary year-end compensation and notionally invests it in designated funds advised by the Adviser or its affiliates. The award is subject to vesting and other conditions. Portfolio managers must notionally invest a minimum of 25% to a maximum of 100% of their IMAP deferral account into a combination of the designated funds they manage that are included in the IMAP fund menu, which may or may not include one of the Portfolios. In addition to the clawbacks listed above for long term incentive compensation awards, the provision on IMAP awards is further strengthened such that it may also be triggered if an employee's actions cause substantial financial loss on a trading strategy, investment, commitment or other holding provided that previous gains on those positions were relevant to the employees' prior year compensation decisions.
• Voluntary Deferred Compensation Plans—voluntary programs that permit certain employees to elect to defer a portion of their discretionary year-end compensation and notionally invest the deferred amount across a range of designated investment funds, which may include funds advised by the Adviser or its affiliates.
Several factors determine discretionary compensation, which can vary by portfolio management team and circumstances. These factors may include:
• Revenues generated by the investment companies, pooled investment vehicles and other accounts managed by the portfolio manager.
• The investment performance of the funds/accounts managed by the portfolio manager.
• Contribution to the business objectives of the Adviser.
• The dollar amount of assets managed by the portfolio manager.
• Market compensation survey research by independent third parties.
• Other qualitative factors, such as contributions to client objectives.
• Performance of Morgan Stanley and Morgan Stanley Investment Management, and the overall performance of the investment team(s) of which the portfolio manager is a member.
Other Accounts Managed by Portfolio Managers at September 30, 2011 (unless otherwise indicated):
| Registered Investment Companies | Other Pooled Investment Vehicles | Other Accounts | |||||||||||||||||||||||||
| Portfolio and Portfolio Managers | Number of Accounts | Total Assets in the Accounts | Number of Accounts | Total Assets in the Accounts | Number of Accounts | Total Assets in the Accounts | |||||||||||||||||||||
| Balanced Portfolio | |||||||||||||||||||||||||||
| Mark A. Bavoso | 3 | $627.2 million | 2 | $610.8 million | 10 | $3.9 billion(1) | |||||||||||||||||||||
| Cyril Moullé-Berteaux | 5 | $780.9 million | 2 | $610.8 million | 9 | $3.9 billion(1) | |||||||||||||||||||||
| Core Fixed Income Portfolio and Core Plus Fixed Income Portfolio | |||||||||||||||||||||||||||
| Jaidip Singh | 10 | $2.0 billion | 0 | $ | 0 | 18 | $6.7 billion(2) | ||||||||||||||||||||
| Neil Stone | 9 | $958.4 million | 0 | $ | 0 | 64 | $12.5 billion(2) | ||||||||||||||||||||
| Limited Duration Portfolio | |||||||||||||||||||||||||||
| Joseph Mehlman | 5 | $613.5 million | 0 | $ | 0 | 53 | $12.6 billion | ||||||||||||||||||||
| Jaidip Singh | 10 | $2.0 billion | 0 | $ | 0 | 18 | $6.7 billion(2) | ||||||||||||||||||||
| Neil Stone | 9 | $958.4 million | 0 | $ | 0 | 64 | $12.5 billion(2) | ||||||||||||||||||||
63
| Registered Investment Companies | Other Pooled Investment Vehicles | Other Accounts | |||||||||||||||||||||||||
| Portfolio and Portfolio Managers | Number of Accounts | Total Assets in the Accounts | Number of Accounts | Total Assets in the Accounts | Number of Accounts | Total Assets in the Accounts | |||||||||||||||||||||
| Mid Cap Growth Portfolio | |||||||||||||||||||||||||||
| Dennis P. Lynch | 35 | $16.5 billion | 4 | $2.9 billion | 13 | $1.1 billion | |||||||||||||||||||||
| David S. Cohen | 35 | $16.5 billion | 4 | $2.9 billion | 13 | $1.1 billion | |||||||||||||||||||||
| Sam G. Chainani | 35 | $16.5 billion | 4 | $2.9 billion | 13 | $1.1 billion | |||||||||||||||||||||
| Alexander T. Norton | 35 | $16.5 billion | 4 | $2.9 billion | 13 | $1.1 billion | |||||||||||||||||||||
| Jason C. Yeung | 35 | $16.5 billion | 4 | $2.9 billion | 13 | $1.1 billion | |||||||||||||||||||||
| Armistead B. Nash | 35 | $16.5 billion | 4 | $2.9 billion | 13 | $1.1 billion | |||||||||||||||||||||
(1) Of these other accounts, two accounts with a total of approximately $1.1 billion in assets, had performance-based fees.
(2) Of these other accounts, one account with a total of approximately $725.7 million in assets, had performance-based fees.
(3) Of these other accounts, five accounts with a total of approximately $2.2 billion in assets, had performance-based fees.
Securities Ownership of Portfolio Managers (at September 30, 2011, unless otherwise noted)
Balanced Portfolio
Mark Bavoso — None
Cyril Moullé-Berteaux — None
Core Fixed Income Portfolio
Jaidip Singh — None
Neil Stone — None
Core Plus Fixed Income Portfolio
Jaidip Singh — $1-$10,000
Neil Stone — $50,001-$100,000
Limited Duration Portfolio
Joseph Mehlman — $1-$10,000
Jaidip Singh — $1-$10,000
Neil Stone — None
Mid Cap Growth Portfolio
Dennis P. Lynch — over $1 million
David S. Cohen — $100,001-$500,000
Sam G. Chainani — $100,001-$500,000
Alexander T. Norton — $50,001-$100,000
Jason C. Yeung — $100,001-$500,000
Armistead B. Nash — $10,001-$50,000
PRINCIPAL UNDERWRITER
Morgan Stanley Distribution, Inc. (the "Distributor"), a wholly-owned subsidiary of the Adviser, with its principal office at 522 Fifth Avenue, New York, NY 10036, distributes the shares of the Fund. Under the Distribution Agreement, the Distributor, as agent of the Fund, agrees to use its best efforts as sole distributor of the Fund's shares. The Distribution Agreement continues in effect so long as such continuance is approved at least annually by the Fund's Board, including a majority of those Trustees who are not parties to such Distribution Agreement nor interested persons of any such party. The Distribution Agreement provides that the Fund will bear the costs of the registration of its shares with the SEC and various states and the printing of its prospectuses, statements of additional information and reports to shareholders.
DISTRIBUTION AND SHAREHOLDER SERVICES PLANS
Class H and Class L
Effective November 29, 2007, the Fund adopted a Shareholder Services Plan for Class H shares (the "Class H Plan") and effective June 9, 2008, the Fund adopted a Distribution and Shareholder Services Plan for Class L shares (the "Class L Plan"), each pursuant to Rule 12b-1 under the 1940 Act (together, the "Plans"). The Plans provide that the Fund, on behalf of each Portfolio, may pay the Distributor and other affiliated and unaffiliated broker-dealers, financial institutions and/or intermediaries an annualized fee of up to 0.25% of the average daily net assets of each
64
Portfolio attributable to Class H shares or Class L shares. This service fee is for providing "personal service and/or the maintenance of shareholder accounts" as provided for in Section 2830(b)(9) of the Financial Industry Regulatory Authority ("FINRA") Conduct Rules, including (i) expenditures for overhead and other expenses of the Distributor and other affiliated and unaffiliated broker-dealers, (ii) telephone and other communications expenses relating to the provision of shareholder services and (iii) compensation to and expenses of financial advisors and other employees of the Distributor and other affiliated and unaffiliated broker-dealers for the provision of shareholder services. In addition, the Class L Plan provides that the Fund, on behalf of each Portfolio, may pay the Distributor an annualized distribution fee of up to 0.25% of the average daily net assets of each Portfolio (except the Balanced and Mid Cap Growth Portfolios) and up to 0.50% of the average daily net assets of the Balanced and Mid Cap Growth Portfolios attributable to Class L shares. The Distributor may direct that all or any part of these fees be paid directly to its affiliates or other broker-dealers, financial institutions and/or intermediaries that provide shareholder services.
The Plans were approved by the Fund's Board of Trustees, including the Independent Trustees, none of whom has a direct or indirect financial interest in the operation of the Plan or in any agreements related thereto.
Revenue Sharing
The Adviser and/or the Distributor may pay compensation, out of their own funds and not as an expense of the Portfolios, to Morgan Stanley Smith Barney LLC, a majority-owned broker-dealer subsidiary of Morgan Stanley ("Morgan Stanley Smith Barney"), Citigroup Global Markets Inc. ("CGM"), certain insurance companies and/or other unaffiliated brokers, dealers and other financial intermediaries, including recordkeepers and administrators of various deferred compensation plans ("Intermediaries"), in connection with the sale, distribution, marketing and retention of shares of the Portfolios and/or shareholder servicing. For example, the Adviser or the Distributor may pay additional compensation to an Intermediary for, among other things, promoting the sale and distribution of Portfolio shares, providing access to various programs, mutual fund platforms or preferred or recommended mutual fund lists that may be offered by an Intermediary, granting the Distributor access to an Intermediary's financial advisors and consultants, providing assistance in the ongoing education and training of an Intermediary's financial personnel, furnishing marketing support, maintaining share balances and/or for sub-accounting, recordkeeping, administrative, shareholder, or transaction processing services. Such payments are in addition to any shareholder servicing fees and/or transfer agency fees that may be payable by the Portfolios. The additional payments are generally based on current assets, but may also be based on other measures as determined from time to time by the Adviser and/or the Distributor (e.g., gross sales or number of accounts). The amount of these payments may be different for different Intermediaries.
With respect to Morgan Stanley Smith Barney and CGM, these payments currently include the following amounts, which are paid in accordance with the applicable compensation structure:
(1) on Class I, Class P, Class H and Class L shares of the Portfolios held in traditional brokerage accounts where Morgan Stanley Smith Barney or CGM is designated by purchasers as broker-dealer of record, an ongoing annual fee in an amount up to 0.13% of the total average monthly net asset value of such shares.
(2) on Class I and Class P shares of the Portfolios held in traditional brokerage accounts in the Morgan Stanley channel of Morgan Stanley Smith Barney, in addition to the amounts referenced in paragraph (1) above, an ongoing annual fee in an amount up to 35% of each Portfolio's advisory fees accrued from the average daily net asset value of such shares.
(3) On Class I and Class P shares of the Portfolios held in taxable accounts through any fee-based advisory program offered by Morgan Stanley Smith Barney, an ongoing annual fee in an amount up to 0.08% of the total average monthly net asset value of such shares.
The prospect of receiving, or the receipt of, additional compensation as described above by Morgan Stanley Smith Barney and CGM may provide Morgan Stanley Smith Barney and CGM and their financial advisors and other salespersons with an incentive to favor sales of shares of the Portfolios over other investment options with respect to which Morgan Stanley Smith Barney and CGM do not receive additional compensation (or receive lower levels of additional compensation). These payment arrangements, however, will not change the price that an investor pays for shares of the Portfolios or the amount that the Portfolios receive to invest on behalf of an investor. Investors may wish to take such payment arrangements into account when considering and evaluating any recommendations relating to Portfolio shares and should review carefully any disclosure provided by Morgan Stanley Smith Barney and CGM as to their compensation. Currently, there are no compensation arrangements in place with other Intermediaries.
65
FUND ADMINISTRATION
The Adviser also serves as Administrator to the Fund pursuant to an Amended and Restated Administration Agreement dated as of November 1, 2004 (the "Administration Agreement"). Under the Administration Agreement, the Adviser receives an annual fee, accrued daily and payable monthly, of 0.08% of the Fund's average daily net assets, and is responsible for all fees payable under any sub-administration agreements.
For the fiscal years ended September 30, 2009, 2010 and 2011, the Fund paid the following administrative fees (no administrative fees were waived):
| Administrative Fees Paid | |||||||||||||||
| Portfolio | 2009 (000) | 2010 (000) | 2011 (000) | ||||||||||||
| Mid Cap Growth | $ | 2,039 | $ | 3,413 | $ | 5,568 | |||||||||
| Core Fixed Income | 95 | 67 | 55 | ||||||||||||
| Core Plus Fixed Income | 855 | 663 | 294 | ||||||||||||
| Limited Duration | 281 | 190 | 150 | ||||||||||||
| Balanced | 49 | 40 | 37 | ||||||||||||
Sub-Administrator. Under an agreement between the Administrator and State Street Bank and Trust Company ("State Street"), State Street provides certain administrative services to the Fund. For such services, the Administrator pays State Street a portion of the administrative fee the Administrator receives from the Fund. The Administrator supervises and monitors the administrative and accounting services provided by State Street. Their services are also subject to the supervision of the officers and Board of Trustees of the Fund. State Street's business address is One Lincoln Street, Boston, MA 02111-2101.
OTHER SERVICE PROVIDERS
Custodian. State Street, located at One Lincoln Street, Boston, MA 02111-2101, serves as Custodian for the Fund. The Custodian holds cash, securities, and other assets of the Fund as required by the 1940 Act.
Transfer and Dividend Disbursing Agent. Morgan Stanley Services Company Inc., P.O. Box, 219804, Kansas City, MO 64121-9804, serves as the Fund's Transfer Agent and Dividend Disbursing Agent.
Pursuant to a Transfer Agency Agreement, the Fund pays Morgan Stanley Services Company Inc. a fee, which has been approved by the Fund's Board of Trustees, generally based on the number of classes, accounts and transactions relating to the Portfolios of the Fund. The Fund and Morgan Stanley Services Company Inc. may enter into agreements with third party intermediaries, pursuant to which such intermediaries agree to provide recordkeeping and other administrative services for their clients who invest in the Portfolios. In such instances, each Portfolio may pay certain fees to the intermediaries for the services they provide that otherwise would have been performed by Morgan Stanley Services Company Inc., which fees may be calculated and incurred on a class-by-class basis.
Independent Registered Public Accounting Firm. Ernst & Young LLP, located at 200 Clarendon Street, Boston, MA 02116-5021, serves as the independent registered public accounting firm for the Fund and audits the annual financial statements of each Portfolio.
Fund Counsel. Dechert LLP, located at 1095 Avenue of the Americas, New York, NY 10036, acts as the Fund's legal counsel.
BROKERAGE TRANSACTIONS
Portfolio Transactions
The Agreement authorizes the Adviser to select the brokers or dealers that will execute the purchases and sales of investment securities for each of the Fund's Portfolios and directs the Adviser to use its best efforts to obtain the best execution with respect to all transactions for the Portfolios. In so doing, the Adviser will consider
66
all matters it deems relevant, including the following: the Adviser's knowledge of negotiated commission rates and spreads currently available; the nature of the security or instrument being traded; the size and type of the transaction; the nature and character of the markets for the security or instrument to be purchased or sold; the desired timing of the transaction; the activity existing and expected in the market for the particular security or instrument; confidentiality; the execution, clearance, and settlement capabilities of the broker or dealer selected and other brokers or dealers considered; the reputation and perceived soundness of the broker or dealer selected and other brokers or dealers considered; the Adviser's knowledge of any actual or apparent operational problems of a broker or dealer; and the reasonableness of the commission or its equivalent for the specific transaction.
In seeking to implement the Fund's policies, the Adviser effects transactions with those brokers and dealers who the Adviser believes provide prompt execution of orders in an effective manner at the most favorable prices. If the Adviser believes the prices and executions are obtainable from more than one broker or dealer, it may give consideration to placing portfolio transactions with those brokers and dealers who also furnish research and other services to the Portfolios or the Adviser. The services may include, but are not limited to, any one or more of the following: information as to the availability of securities for purchase or sale; statistical or factual information or opinions pertaining to investment; wire services; and appraisals or evaluations of portfolio securities. The information and services received by the Adviser from brokers and dealers may be of benefit to them and any of their asset management affiliates in the management of accounts of some of their other clients and may not in all cases benefit the Fund directly.
The Adviser is prohibited from directing brokerage transactions on the basis of the referral of clients or the sale of shares of advised investment companies. However, the Adviser may place Portfolio orders with qualified broker-dealers who recommend the Portfolios or who act as agents in the purchase of shares of the Portfolios for their clients.
The Adviser and its affiliated investment advisers have established commission sharing arrangements under a commission management program (the "Commission Management Program" or "CMP"), pursuant to which execution and research costs or a portion of those costs are decoupled in accordance with applicable laws, rules and regulations. Under the CMP, the Adviser and its affiliated investment advisers select approved equity brokers (which include the Adviser's affiliates) for execution services and after accumulation of commissions at such brokers, the Adviser and/or its affiliates instruct these approved equity brokers to pay for eligible research provided by executing brokers or third-party research providers, which are selected independently by a Research Services Committee of the Adviser and its affiliated investment advisers. Generally, the Adviser and its affiliated investment advisers will direct the approved equity broker to record research credits based upon a previously agreed-upon allocation and will periodically instruct the approved equity broker to direct specified dollar amounts from that pool to pay for eligible research services provided by third-party research providers and executing brokers. The research credits are pooled among the Adviser and its affiliated investment advisers and allocated from this pool. Likewise, the research services obtained under the CMP are shared among the Adviser and its affiliated investment advisers.
Selection of approved equity brokers for execution is based on three main criteria: access to liquidity, provision of capital and quality of execution. Under the CMP, each approved equity broker is responsible for the payment of fees for research services and obtains the research services pursuant to written agreements between the approved equity broker and the third-party research provider.
For those costs not decoupled, but retained by broker-dealers, the Adviser also effects transactions with brokers which directly pay for research services provided by those brokers in accordance with Section 28(e) of the 1934 Act. These include equity transactions and may include fixed-income transactions effected on an agency basis.
Transactions involving client accounts managed by two or more affiliated investment advisers may be aggregated and executed using the services of broker-dealers that provide third party benefits/research so long as: (i) all client accounts involved in the transaction benefit from one or more of the services offered by such broker-dealer; and (ii) each affiliated investment adviser has approved the use of such broker-dealer and the services provided thereby.
The research services received include those of the nature described above and other services which aid the Adviser in fulfilling its investment decision making responsibilities, including (a) furnishing advice as to the value
67
of securities, the advisability of investing in, purchasing or selling securities, and the availability of securities or purchasers or sellers of securities; and (b) furnishing analyses and reports concerning issuers, industries, securities, economic factors and trends, portfolio strategy and the performance of accounts. Where a particular item has both research and non-research related uses (such as proxy services where both research services and services relating to the administration of the proxy itself are provided), the Adviser will make a reasonable allocation of the cost of the item between research and non-research uses and will only pay for the portion of the cost allocated to research uses with client brokerage transactions. Research services furnished or paid for by brokers through whom the Adviser effects transactions for a particular account may be used by the Adviser or its affiliated investment advisers in servicing their other accounts, and not all such services may be used for the benefit of the client which pays the brokerage commission which results in the receipt of such research services. Commissions paid to brokers providing research services may be higher than those charged by brokers not providing services.
The Adviser and its affiliated investment advisers make a good faith determination of the value of research services in accordance with Section 28(e) of the 1934 Act, UK Financial Services Authority Rules and other relevant regulatory requirements.
Certain investment professionals and other employees of the Adviser are also officers of affiliated investment advisers and may provide investment advisory services to clients of such affiliated investment advisers. The Adviser's personnel also provide research and trading support to personnel of certain affiliated investment advisers. Research related costs may be shared by affiliated investment advisers and may benefit the clients of such affiliated investment advisers. Research services that benefit the Adviser may be received in connection with commissions generated by clients of its affiliated investment advisers. Similarly, research services received in connection with commissions generated by the Adviser's clients may benefit affiliated investment advisers and their clients. Moreover, research services provided by broker-dealers through which the Adviser effects transactions for a particular account may be used by the Adviser and/or an affiliated investment adviser in servicing its other accounts and not all such research services may be used for the benefit of the particular client, which pays the brokerage commission giving rise to the receipt of such research services.
Affiliated Brokers
Subject to the overriding objective of obtaining the best execution of orders, the Fund may use broker-dealer affiliates of the Adviser to effect Portfolio brokerage transactions, including transactions in futures contracts and options on futures contracts, under procedures adopted by the Fund's Board of Trustees. In order to use such affiliates, the commission rates and other remuneration paid to the affiliates must be fair and reasonable in comparison to those of other broker-dealers for comparable transactions involving similar securities being purchased or sold during a comparable time period. This standard would allow the affiliated broker or dealer to receive no more than the remuneration which would be expected to be received by an unaffiliated broker.
Pursuant to an order issued by the SEC, the Fund is permitted to engage in principal transactions involving money market instruments, subject to certain conditions, with Morgan Stanley & Co. LLC, a broker-dealer affiliated with the Fund's Adviser.
During the fiscal years ended September 30, 2009, 2010 and 2011, the Fund did not effect any principal transactions with an affiliated broker or dealer.
Commissions Paid
During the fiscal years ended September 30, 2009, 2010 and 2011, the Fund paid brokerage commissions of approximately $4,448,600, $3,101,357 and $4,382,245, respectively. During the fiscal years ended September 30, 2009, 2010 and 2011, the Fund paid in the aggregate $57,602, $15,471 and $28,416, respectively, as brokerage commissions to Morgan Stanley & Co. LLC and/or its affiliated broker-dealers. During the fiscal year ended September 30, 2011, the brokerage commissions paid to Morgan Stanley & Co. LLC and/or its affiliated broker-dealers represented approximately 0.65% of the total brokerage commissions paid by the Fund during the period and were paid on account of transactions having an aggregate dollar value equal to approximately 0.57% of the aggregate dollar value of all portfolio transactions of the Fund during the period for which commissions were paid.
During the fiscal years ended September 30, 2009, 2010 and 2011, the Fund paid in the aggregate $0, $31,380 and $32,396, respectively, as brokerage commissions to Citigroup, Inc. and/or its affiliated broker-dealers. During the fiscal year ended September 30, 2011, the brokerage commissions paid to Citigroup, Inc. and/or its affiliated
68
broker-dealers represented approximately 0.74% of the total brokerage commissions paid by the Fund during the period and were paid on account of transactions having an aggregate dollar value equal to approximately 0.36% of the aggregate dollar value of all portfolio transactions of the Fund during the period for which commissions were paid.
For the fiscal year ended September 30, 2011, each Portfolio paid brokerage commissions, including brokerage commissions paid to affiliated broker-dealers, as follows:
| Brokerage Commissions Paid During Fiscal Year Ended September 30, 2011 | |||||||||||||||||||||||||||||||
| Commissions Paid to Morgan Stanley & Co. LLC and/or its affiliated broker-dealers | Commissions Paid to Citigroup, Inc. and/or its affiliated broker-dealers | ||||||||||||||||||||||||||||||
| Portfolio | Total Commissions Paid | Total Commissions | Percent of Total Commissions | Percent of Total Brokered Transactions | Total Commissions | Percent of Total Commissions | Percent of Total Brokered Transactions | ||||||||||||||||||||||||
| Mid Cap Growth | $ | 4,301,540 | $ | 28,416 | 0.66 | % | 0.98 | % | $ | 29,708 | 0.69 | % | 0.52 | % | |||||||||||||||||
| Core Fixed Income | 4,192 | — | — | — | — | — | — | ||||||||||||||||||||||||
| Core Plus Fixed Income | 31,688 | — | — | — | — | — | — | ||||||||||||||||||||||||
| Limited Duration | 6,964 | — | — | — | — | — | — | ||||||||||||||||||||||||
| Balanced | 31,260 | — | — | — | 2,688 | 8.60 | % | 2.48 | % | ||||||||||||||||||||||
For the fiscal years ended September 30, 2009 and September 30, 2010, each Portfolio paid brokerage commissions, including brokerage commissions paid to affiliated broker-dealers, as follows. No brokerage commissions were paid to Citigroup, Inc. and/or affiliated broker-dealers by any Portfolio during the period from June 1, 2009 to September 30, 2009.
| Brokerage Commissions Paid During Fiscal Years Ended September 30, 2009 and 2010 | |||||||||||||||||||||||
| Fiscal Year Ended September 30, 2009 | Fiscal Year Ended September 30, 2010 | ||||||||||||||||||||||
| Portfolio | Total | Morgan Stanley & Co. LLC and/or its affiliated broker- dealers | Total | Morgan Stanley & Co. LLC and/or its affiliated broker- dealers | Citigroup, Inc. and/or its affiliated broker- dealers | ||||||||||||||||||
| Mid Cap Growth | $ | 2,003,152 | $ | 13,873 | $ | 2,915,371 | $ | 15,098 | $ | 31,342 | |||||||||||||
| Core Fixed Income | 21,172 | — | 8,328 | — | — | ||||||||||||||||||
| Core Plus Fixed Income | 172,259 | — | 93,503 | — | — | ||||||||||||||||||
| Limited Duration | 46,467 | — | 20,823 | — | — | ||||||||||||||||||
| Balanced | 24,116 | — | 50,914 | 373 | 38 | ||||||||||||||||||
Regular Broker-Dealers. The Fund's regular broker-dealers are (i) the ten broker-dealers that received the greatest dollar amount of brokerage commissions from the Fund; (ii) the ten broker-dealers that engaged as principal in the largest dollar amount of portfolio transactions; and (iii) the ten broker-dealers that sold the largest dollar amount of Portfolio shares. During the fiscal year ended September 30, 2011, the following Portfolios purchased securities issued by the Fund's regular broker-dealers:
VALUE OF PORTFOLIO HOLDINGS
| Portfolio | Regular Broker-Dealer | Approximate Value of Portfolio Holdings as of September 30, 2011 | |||||||||
| Balanced | Bank of America Securities LLC | $ | 542,000 | ||||||||
| Credit Suisse Group AG | 82,000 | ||||||||||
| State Street Bank and Trust Co. | 72,000 | ||||||||||
| Goldman Sachs & Co. | 291,000 | ||||||||||
| JP Morgan Securities, Inc. | 921,000 | ||||||||||
| UBS Financial Services, Inc. | 41,000 | ||||||||||
69
| Portfolio | Regular Broker-Dealer | Approximate Value of Portfolio Holdings as of September 30, 2011 | |||||||||
| Core Fixed Income | JP Morgan Securities Inc. | $ | 1,054,000 | ||||||||
| Barclays Capital Group | 222,000 | ||||||||||
| Core Plus Fixed Income | Bank of America Securities LLC | 4,688,000 | |||||||||
| Barclays Capital Group | 551,000 | ||||||||||
| JP Morgan Securities, Inc. | 6,253,000 | ||||||||||
| Limited Duration | JP Morgan Securities Inc. | 1,019,000 | |||||||||
| Goldman Sachs & Co. | 1,225,000 | ||||||||||
| Bank of America Securities LLC | 2,647,000 | ||||||||||
| BNP Paribas SA | 906,000 | ||||||||||
| Wells Fargo & Co. | 1,406,000 | ||||||||||
| UBS Financial Services, Inc. | 1,136,000 | ||||||||||
Portfolio Turnover. The Portfolios generally do not invest for short-term trading purposes; however, when circumstances warrant, each Portfolio may sell investment securities without regard to the length of time they have been held. Market conditions in a given year could result in a higher or lower portfolio turnover rate than expected and the Portfolios will not consider portfolio turnover rate a limiting factor in making investment decisions consistent with their investment objectives and policies. Higher portfolio turnover (e.g., over 100%) necessarily will cause the Portfolios to pay correspondingly increased brokerage and trading costs. In addition to transaction costs, higher portfolio turnover may result in the realization of capital gains. As discussed under "Tax Considerations," to the extent net short-term capital gains are realized, any distributions resulting from such gains are considered ordinary income for federal income tax purposes.
GENERAL INFORMATION
Fund History
Morgan Stanley Institutional Fund Trust (formerly MAS Funds) is an open-end, management investment company established under Pennsylvania law as a Pennsylvania business trust under an Amended and Restated Agreement and Declaration of Trust dated November 18, 1993 as further Amended and Restated on August 24, 2006 (the "Declaration of Trust"). The Fund was originally established as The MAS Pooled Trust Fund, a Pennsylvania business trust, in February 1984. Each of the Portfolios are diversified. No portfolio of the Fund is subject to the liabilities of any other portfolio of the Fund.
Description of Shares and Voting Rights
The Declaration of Trust permits the Trustees to issue an unlimited number of shares of beneficial interest, without par value, from an unlimited number of series ("Portfolios") of shares. Currently, the Fund consists of eight Portfolios.
The shares of each Portfolio of the Fund are fully paid and non-assessable, except as set forth below, and have no preference as to conversion, exchange, dividends, retirement or other features. The shares of each Portfolio of the Fund have no preemptive rights. The shares of the Fund have non-cumulative voting rights, which means that the holders of more than 50% of the shares voting for the election of Trustees can elect 100% of the Trustees if they choose to do so. A shareholder of a class is entitled to one vote for each full class share held (and a fractional vote for each fractional class share held) in the shareholder's name on the books of the Fund. Shareholders of a class have exclusive voting rights regarding any matter submitted to shareholders that relates solely to that class of shares (such as a service agreement relating to that class), and separate voting rights on any other matter submitted to shareholders in which the interests of the shareholders of that class differ from the interests of holders of any other class.
Meetings of shareholders will not be held except as required by the 1940 Act and other applicable law. A meeting will be held to vote on the removal of a Trustee or Trustees of the Fund if requested in writing by the holders of not less than 10% of the outstanding shares of the Fund. The Fund will assist in shareholder communication in such matters to the extent required by law.
70
Dividends and Distributions
The Fund's policy is to distribute substantially all of each Portfolio's net investment income, if any, together with any net realized capital gains in the amount and at the times that will avoid both income (including capital gains) taxes on it and the imposition of the federal excise tax on undistributed income and capital gains. The amounts of any income dividends or capital gains distributions cannot be predicted.
Any dividend or distribution paid shortly after the purchase of shares of a Portfolio by an investor may have the effect of reducing the per share net asset value of that Portfolio by the per share amount of the dividend or distribution. Furthermore, such dividends or distributions, although in effect a return of capital, are subject to income taxes.
As set forth in the Prospectuses, unless the shareholder elects otherwise in writing, all dividends and capital gains distributions for a class of shares are automatically reinvested in additional shares of the same class of the Portfolio at net asset value (as of the business day following the record date). This automatic reinvestment of dividends and distributions will remain in effect until the shareholder notifies the Fund by telephone or in writing that either the Income Option (income dividends in cash and capital gain distributions reinvested in shares at net asset value) or the Cash Option (both income dividends and capital gains distributions in cash) has been elected. It may take up to three business days to effect this change. An account statement is sent to shareholders whenever a dividend or distribution is paid.
Each Portfolio of the Fund is treated as a separate entity (and hence, as a separate "regulated investment company") for federal tax purposes. Any net capital gains recognized by a Portfolio are distributed to its investors without need to offset (for federal income tax purposes) such gains against any net capital losses of another Portfolio.
In all Portfolios undistributed net investment income is included in the Portfolio's net assets for the purpose of calculating NAV. Therefore, on the ex-dividend date, the NAV excludes the dividend (i.e., is reduced by the per share amount of the dividend). Dividends paid shortly after the purchase of shares by an investor, although in effect a return of capital, are taxable as ordinary income.
Certain mortgage securities may provide for periodic or unscheduled payments of principal and interest as the mortgages underlying the securities are paid or prepaid. However, such principal payments (not otherwise characterized as original issue discount or bond premium expense) will not normally be considered as income to the Portfolio and therefore will not be distributed as dividends. Rather, these payments on mortgage-backed securities will be reinvested on your behalf by the Portfolio.
Shareholder and Trustee Liability
Under Pennsylvania law, shareholders of a trust such as the Fund may, under certain circumstances, be held personally liable as partners for the obligations of the trust. The Fund's Declaration of Trust contains an express disclaimer of shareholder liability for acts or obligations of the Fund and requires that notice of such disclaimer be given in each agreement, obligation, or instrument entered into or executed by the Fund or the Trustees, but this disclaimer may not be effective in some jurisdictions or as to certain types of claims. The Declaration of Trust further provides for indemnification out of the Fund's property of any shareholder held personally liable for the obligations of the Fund. The Declaration of Trust also provides that the Fund shall, upon request, assume the defense of any claim made against any shareholder for any act or obligation of the Fund and satisfy any judgment thereon. Thus, the risk of a shareholder incurring financial loss on account of shareholder liability is limited to circumstances in which the Fund itself would be unable to meet its obligations.
Pursuant to the Declaration of Trust, the Trustees may also authorize the creation of additional series of shares (the proceeds of which would be invested in separate, independently managed portfolios with distinct investment objectives and policies and share purchase, redemption and net asset valuation procedures) with such preferences, privileges, limitations and voting and dividend rights as the Trustees may determine. All consideration received by the Fund for shares of any additional series or class, and all assets in which such consideration is invested, would belong to that series or class (subject only to the rights of creditors of the Fund) and would be subject to the liabilities related thereto. Pursuant to the 1940 Act shareholders of any additional series or class of shares would normally have to approve the adoption of any advisory contract relating to such series or class and of any changes in the investment policies relating thereto.
71
The Declaration of Trust further provides that the Trustees will not be liable for errors of judgment or mistakes of fact or law, but nothing in the Declaration of Trust protects a Trustee against any liability to which he would otherwise be subject by reason of willful misfeasance, bad faith, gross negligence, or reckless disregard of the duties involved in the conduct of the office.
TAX CONSIDERATIONS
Each Portfolio generally will make two basic types of distributions: ordinary dividends and long-term capital gain distributions. These two types of distributions are reported differently on a shareholder's income tax return and they may be subject to different rates of tax. The tax treatment of the investment activities of a Portfolio will affect the amount, timing and character of distributions made by such Portfolio. The following discussion is only a summary of certain tax considerations generally affecting the Fund and shareholders of the Fund and is not intended as a substitute for careful tax planning. Tax issues relating to the Portfolios generally are not a consideration for shareholders that are tax-exempt entities and tax-advantaged retirement vehicles such as an IRA or 401(k) plan. Shareholders are urged to consult their own tax professionals regarding specific questions as to federal, state or local taxes.
Investment Company Taxation: Each Portfolio of the Fund is treated as a separate entity for federal income tax purposes and intends to continue to qualify for the special tax treatment afforded regulated investment companies under Subchapter M of the Code. As such, each Portfolio will not be subject to federal income tax to the extent it distributes net investment company taxable income and net capital gains to shareholders. The Fund will notify you annually as to the tax classification of all distributions. If a Portfolio fails to qualify for any taxable year as a regulated investment company, all of its taxable income will be subject to tax at regular corporate income tax rates without any deduction for distributions to shareholders, and such distributions generally will be taxable to shareholders as ordinary dividends to the extent of the Portfolio's current and accumulated earnings and profits.
Each Portfolio intends to declare and pay dividends and capital gain distributions so as to avoid imposition of the federal excise tax. To do so, each Portfolio expects to distribute an amount at least equal to (i) 98% of its calendar year ordinary income, (ii) 98.2% of its capital gains net income for the one-year period ending October 31st, and (iii) 100% of any undistributed ordinary and capital gain net income from the prior year.
In order for a Portfolio to continue to qualify for federal income tax treatment as a regulated investment company, at least 90% of its gross income for a taxable year must be derived from qualifying income; i.e., dividends, interest, income derived from loans of securities, and gains from the sale or other disposition of stocks, securities or foreign currencies, or other income derived with respect to its business of investing in such stocks, securities or currencies. It is anticipated that any net gain realized from the closing out of futures contracts will be considered gain from the sale of securities and therefore be qualifying income for purposes of the 90% requirement. In addition, (i) a Portfolio must distribute annually to its shareholders at least the sum of 90% of its net tax-exempt interest income and 90% of its investment company taxable income; (ii) at the close of each quarter of a Portfolio's taxable year, at least 50% of its total assets must be represented by cash and cash items, U.S. government securities, securities of other regulated investment companies and such other securities with limitations; and (iii) at the close of each quarter of a Portfolio's taxable year, not more than 25% of the value of its assets may be invested in securities of any one issuer, or of two or more issuers engaged in same or similar businesses if the Portfolio owns at least 20% of the voting power of such issuers. Net income derived from an interest in a "qualified publicly traded partnership," as defined in the Code, will also be treated as qualifying income for purposes of the 90% gross income requirement described above. In addition, for the purposes of the diversification requirements in clause (iii) above, the outstanding voting securities of any issuer includes the equity securities of a qualified publicly traded partnership, and no more than 25% of the value of a regulated investment company's total assets may be invested in the securities of one or more qualified publicly traded partnerships. The Code also provides that the separate treatment for publicly traded partnerships under the passive loss rules of the Code applies to a regulated investment company holding an interest in a qualified publicly traded partnership, with respect to items attributable to such interest.
Each Portfolio of the Fund will distribute to shareholders annually any net capital gains which have been recognized for federal income tax purposes including unrealized gains at the end of the Portfolio's fiscal year on certain futures transactions. Such distributions will be combined with distributions of capital gains realized on the Portfolio's other investments and shareholders will be advised of the nature of the payments.
72
Gains or losses on the sale of securities by a Portfolio will be long-term capital gains or losses if the securities have a tax holding period of more than one year at the time of such sale. Gains or losses on the sale of securities with a tax holding period of one year or less will be short-term capital gains or losses. Special tax rules described below may change the normal treatment of gains and losses recognized by a Portfolio when a Portfolio makes certain types of investments. Those special tax rules can, among other things, affect the treatment of capital gain or loss as long-term or short-term and may result in ordinary income or loss rather than capital gain or loss. The application of these special rules would therefore also affect the character of distributions made by a Portfolio.
Some of the options, futures contracts, forward contracts, and swap contracts entered into by the Portfolios may be "Section 1256 contracts." Section 1256 contracts held by a Portfolio at the end of its taxable year (and, for purposes of the 4% excise tax, on certain other dates as prescribed under the Code) are "marked-to-market" with unrealized gains or losses treated as though they were realized. Any gains or losses, including "marked to market" gains or losses, on Section 1256 contracts other than forward contracts are generally 60% long-term and 40% short-term capital gains or losses ("60/40") although all foreign currency gains and losses from such contracts may be treated as ordinary in character absent a special election.
Generally, hedging transactions and certain other transactions in options, futures, forward contracts and swap contracts undertaken by a Portfolio, may result in "straddles" for U.S. federal income tax purposes. The straddle rules may affect the character of gain or loss realized by a Portfolio. In addition, losses realized by a Portfolio on positions that are part of a straddle may be deferred under the straddle rules, rather than being taken into account in calculating the taxable income for the taxable year in which such losses are realized. Because only a few regulations implementing the straddle rules have been promulgated, the tax consequences of transactions in options, futures, forward contracts, and swap agreements to a Portfolio are not entirely clear. The transactions may increase the amount of short-term capital gain realized by a Portfolio. Short-term capital gain is taxed as ordinary income when distributed to shareholders.
A Portfolio may make one or more of the elections available under the Code which are applicable to straddles. If a Portfolio makes any of the elections, the amount, character, and timing of the recognition of gains or losses from the affected straddle positions will be determined under rules that vary according to the elections made. The rules applicable under certain of the elections operate to accelerate the recognition of gains or losses from the affected straddle positions.
Because application of the straddle rules may affect the character of gains or losses, defer losses and/or accelerate the recognition of gains or losses from the affected straddle positions, the amount which must be distributed to shareholders, and which will be taxed to shareholders as ordinary income or long-term capital gain, may be increased or decreased substantially as compared to a Portfolio that did not engage in such hedging transactions.
The Code provides constructive sales treatment for appreciated financial positions such as stock which has increased in value in the hands of a Portfolio. Under this constructive sales treatment, the Portfolio may be treated as having sold such stock and be required to recognize gain if it enters into a short sale, an offsetting notional principal contract, a futures or forward contract, or a similar transaction with respect to such stock or substantially identical property.
A Portfolio may make investments in which it recognizes income or gain prior to receiving cash with respect to such investment. For example, under certain tax rules, the Portfolio may be required to accrue a portion of any discount at which certain securities are purchased as income each year even though the Portfolio receives no payments in cash on the security during the year. To the extent that a Portfolio makes such investments, it generally would be required to pay out such income or gain as a distribution in each year to avoid taxation at the Portfolio level. Such distributions will be made from the available cash of the Portfolio or by liquidation of portfolio securities if necessary. If a distribution of cash necessitates the liquidation of portfolio securities, the Adviser will select which securities to sell. The Portfolio may realize a gain or loss from such sales. In the event a Portfolio realizes net capital gains from such transactions, its shareholders may receive a larger capital gain distribution, if any, than they would in the absence of such transactions.
Taxation of Dividends and Distributions. Shareholders normally will have to pay federal income taxes, and any state and/or local income taxes, on the dividends and other distributions they receive from a Portfolio. Such dividends
73
and distributions, to the extent of the Portfolio's current and accumulated earnings and profits that are derived from net investment income or short-term capital gains, are taxable to the shareholder as ordinary income regardless of whether the shareholder receives such payments in additional shares or cash. If certain holding period requirements are met with respect to their shares in a Portfolio, a portion of income dividends received by a shareholder before January 1, 2013 may be taxed at the same rates as long-term capital gains. However, even if income received in the form of income dividends is taxed at the same rates as long-term capital gains, such income will not be considered long-term capital gains for other federal income tax purposes. For example, a shareholder generally will not be permitted to offset income dividends with capital losses. Short-term capital gain distributions will continue to be taxed at ordinary income rates.
Distributions by a Portfolio in excess of the Portfolio's current and accumulated earnings and profits will be treated as a return of capital to the extent of (and in reduction of) the shareholder's tax basis in his or her shares. Any such return of capital distributions in excess of the shareholder's tax basis will be treated as gain from the sale or exchange of his or her shares, as discussed below.
Distributions of net long-term capital gains, if any, are taxable to shareholders as long-term capital gains regardless of how long a shareholder has held a Portfolio's shares and regardless of whether the distribution is received in additional shares or in cash. The maximum tax rate on long-term capital gains available to non-corporate shareholders generally is 15%. However, the maximum tax rate on long-term capital gains will return to 20% in 2013, and all dividends will be taxed at ordinary income rates.
Shareholders generally are taxed on any ordinary dividend or capital gain distributions from a Portfolio in the year they are actually distributed. However, if any such dividends or distributions are declared in October, November or December to shareholders of record of such month and paid in January, then such amounts will be treated for tax purposes as received by the shareholders on December 31.
After the end of each calendar year, shareholders will be sent information on their dividends and capital gain distributions for tax purposes, including the portion taxable as ordinary income, the portion taxable as long-term capital gains, and the amount of any dividends eligible for the federal dividends received deduction for corporations.
Shareholders who are not citizens or residents of the United States and certain foreign entities may be subject to withholding of United States tax on distributions made by a Portfolio of investment income and short-term capital gains at a rate of 30% (or a lower tax treaty rate, if applicable). Such shareholders may also be subject to United States estate tax with respect to their shares.
The Fund will be required to withhold U.S. federal withholding taxes (at 30%) from certain "withholdable payments" made to a non-U.S. shareholder (other than a individual) after 2014, unless the non-U.S. shareholder complies with certain U.S. tax reporting (and, in some cases, withholding) requirements (generally relating to the entity's U.S. owners or account holders, if any) or otherwise qualifies for an exemption from such withholding. Withholdable payments generally will include interest (including original issue discount), dividends, rents, annuities, and other fixed or determinable annual or periodical gains, profits or income, if such payments are derived from U.S. sources, as well as gross proceeds from dispositions of securities that could produce U.S. source interest or dividends. Income which is effectively connected with the conduct of a U.S. trade or business, is not, however, included in this definition.
For distributions with respect to taxable years of regulated investment companies beginning before January 1, 2012 a Portfolio is not required to withhold any amounts with respect to distributions to foreign shareholders that are properly designated by the Portfolio as "interest-related dividends" or "short-term capital gain dividends," provided that the income would not be subject to federal income tax if earned directly by the foreign shareholder. Unless the provisions discussed above are extended or made permanent by Congress, distributions made by a Portfolio of investment income and short-term capital gains in taxable years beginning on or after January 1, 2012 will be treated like other distributions and may be subject to U.S. tax and withholding like regular distributions. Prospective investors are urged to consult their tax advisors regarding the specific tax consequences of these distributions. Further, even if the provisions are extended, there may be withholding on a portion of distributions by a Portfolio. In addition, a Portfolio may determine to not make designations of interest-related dividends of short-term capital gain dividends which would result in increased withholding on distributions by such a Portfolio.
74
Although income received on direct U.S. Government obligations is taxable at the federal level, such income may be exempt from state tax, depending on the state, when received by a shareholder. Each Portfolio will inform shareholders annually of the percentage of income and distributions derived from direct U.S. Government obligations. Shareholders should consult their tax advisors to determine whether any portion of dividends received from the Portfolio is considered tax exempt in their particular states.
Purchases, Redemptions and Exchanges of Portfolio Shares. Any dividend or capital gains distributions received by a shareholder from any regulated investment company will have the effect of reducing the net asset value of the shareholder's stock in that company by the exact amount of the dividend or capital gains distribution. Furthermore, such dividends and capital gains distributions are subject to federal income taxes. If the net asset value of the shares should be reduced below a shareholder's cost as a result of the payment of dividends or the distribution of realized long-term capital gains, such payment or distributions would be in part a return of the shareholder's investment but nonetheless would be taxable to the shareholder. Therefore, an investor should consider the tax implications of purchasing Portfolio shares immediately prior to a distribution record date. Any gain or loss recognized on a sale or redemption of shares of a Portfolio by a shareholder who is not a dealer in securities will generally be treated as long-term capital gain or loss if the shares have been held for more than one year and short-term if for one year or less. Generally, for non-corporate shareholders, long-term capital gains are taxed at a maximum rate of 15% and short-term gains are currently taxed at ordinary income tax rates. The maximum rate on long-term capital gains is scheduled to return to 20% for taxable years beginning after December 31, 2012. If shares held for six months or less are sold or redeemed for a loss, two special rules apply: first, if shares on which a net capital gain distribution has been received are subsequently sold or redeemed, and such shares have been held for six months or less, any loss recognized will be treated as long-term capital loss to the extent of the long-term capital gain distributions. Second, any loss recognized by a shareholder upon the sale or redemption of shares of a municipal Portfolio fund held for six months or less will be disallowed to the extent of any exempt-interest dividends received by the Shareholder with respect to such shares.
Gain or loss on the sale or redemption of shares of a Portfolio is measured by the difference between the amount received and the tax basis of the shares. Shareholders should keep records of investments made (including shares acquired through reinvestment of dividends and distributions) so they can compute the tax basis of their shares. Under certain circumstances a shareholder may compute and use an average cost basis in determining the gain or loss on the sale or redemption of shares.
Due to recent legislation, the Portfolios (or their administrative agent) are required to report to the Internal Revenue Service ("IRS") and furnish to Portfolio shareholders the cost basis information for sale transactions of shares purchased on or after January 1, 2012. Shareholders may elect to have one of several cost basis methods applied to their account when calculating the cost basis of shares sold, including average cost, FIFO ("first-in, first-out") or some other specific identification method. Unless you instruct otherwise, each Portfolio will use average cost as its default cost basis method, and will treat sales as first coming from shares purchased prior to January 1, 2012. If average cost is used for the first sale of Portfolio shares covered by these new rules, the shareholder may only use an alternative cost basis method for shares purchased prospectively. Portfolio shareholders should consult with their tax advisors to determine the best cost basis method for their tax situation.
Exchanges of shares of a Portfolio for shares of another Portfolio are also subject to similar tax treatment. Such an exchange is treated for tax purposes as a sale of the original shares in the first Portfolio, followed by the purchase of shares in the second Portfolio.
If a shareholder realizes a loss on the redemption or exchange of a Portfolio's shares and reinvests in substantially similar shares within 30 days before or after the redemption or exchange, the transactions may be subject to the "wash sale" rules, resulting in a postponement of the recognition of such loss for tax purposes. The ability to otherwise deduct capital losses may be subject to other limitations.
Shareholders who are not citizens or residents of the United States and certain foreign entities that realize gain upon the sale or exchange of shares of a Portfolio will ordinarily be exempt from federal withholding tax unless: (i) in the case of a shareholder that is a nonresident alien individual, the gain is U.S. source income and such stockholder is physically present in the United States for more than 182 days during the taxable year and meets certain other requirements, or (ii) at any time during a testing period described in the Code, the Portfolio was a "U.S. real property
75
holding corporation," as defined in the Code and Treasury Regulations, and the foreign shareholder actually or constructively held more than 5% of the shares of the same class, the gain would be taxed in the same manner as for a U.S. shareholder as discussed above. A 10% federal withholding tax generally would be imposed on the amount realized on the disposition of such shares and credited against the foreign shareholder's federal income tax liability on such disposition. However, for tax years beginning before January 1, 2012 (or a later date if extended by Congress), clause (ii) above will not apply if at all times during the testing period the value of the shares of a Portfolio is owned 50% or more by U.S. persons. Prospective investors are urged to consult their tax advisors regarding the specific tax consequences relating to the legislation. When you open your Fund account, you must certify on your Account Registration Form that your Social Security Number or Taxpayer Identification Number is correct, and that you are not subject to backup withholding. By providing this information, you will avoid being subject to federal backup withholding at a rate of 28% (as of the date of this SAI) on taxable distributions and redemption proceeds. Any withheld amount would be sent to the IRS as an advance of your taxes due on your income for such year.
Foreign Income Taxes: Investment income received by the Portfolios from sources within foreign countries may be subject to foreign income taxes withheld at the source. The United States has entered into tax treaties with many foreign countries which would entitle the Portfolios to a reduced rate of tax or exemption from tax on such income. It is impossible to determine the effective rate of foreign tax in advance since the amount of the Portfolios' assets to be invested within various countries is not known. The Portfolios intend to operate so as to qualify for treaty-reduced rates of tax where applicable.
If at the end of a Portfolio's year, more than 50% of a Portfolio's assets are represented by foreign securities, then such Portfolio may file an election with the IRS to pass through to shareholders the amount of foreign income taxes paid by such Portfolio. A Portfolio will make such an election only if it is deemed to be in the best interests of such shareholders.
If a Portfolio makes the above-described election, the Portfolio will not be allowed a deduction or a credit for foreign taxes it paid and the amount of such taxes will be treated as a dividend paid by the Portfolio. The shareholders of the Portfolios will be required to: (i) include in gross income, even though not actually received, their respective pro rata share of foreign taxes paid by the Portfolio; (ii) treat their pro rata share of foreign taxes as paid by them; (iii) treat as gross income from sources within the respective foreign countries, for purposes of the foreign tax credit, their pro rata share of such foreign taxes and their pro rata share of any dividend paid by the Portfolio which represents income from sources within foreign countries; and (iv) either deduct their pro rata share of foreign taxes in computing their taxable income or use it within the limitations set forth in the Code as a foreign tax credit against U.S. income taxes (but not both). In no event shall a shareholder be allowed a foreign tax credit if the shareholder holds shares in a Portfolio for 15 days or less during the 31-day period beginning on the date which is 15 days before the date on which such shares become ex-dividend with respect to such dividends.
Each shareholder of a Portfolio will be notified if the foreign taxes paid by the Portfolio will pass through for that year, and, if so, the amount of each shareholder's pro rata share (by country) of (i) the foreign taxes paid, and (ii) the Portfolio's gross income from foreign sources. The notice from the Portfolio to shareholders will also include the amount of foreign taxes paid by the Portfolio which are not allowable as a foreign tax credit because the Portfolio did not hold the foreign securities for more than 15 days during the 31-day period beginning on the date which is 15 days before the date on which the security becomes ex-dividend with respect to the foreign source dividend or because, and to the extent that, the recipient of the dividend is under an obligation to make related payments with respect to positions in substantially similar or related property. Shareholders who are not liable for federal income taxes, such as retirement plans qualified under Section 401 of the Code, will not be affected by any such "pass-through" of foreign tax credits.
State and Local Income Taxes: The Fund is not liable for any corporate income or franchise tax in the Commonwealth of Pennsylvania. Shareholders should consult their tax advisors for the state and local income tax consequences of distributions from the Portfolios.
76
PRINCIPAL HOLDERS OF SECURITIES
As of April 18, 2012, the following persons or entities own, of record or beneficially, more than 5% of the shares of any Class of the following Portfolios' outstanding shares.
CLASS I
| Portfolio | Name and Address | % of Class | |||||||||
| Balanced | Wells Fargo Bank NA PO Box 1533 Minneapolis MN 55480-1533 | 30.44 | % | ||||||||
| Balanced | Kano Profit Sharing Plan PO Box 110098 Nashville, TN 37222-0098 | 30.04 | % | ||||||||
| Balanced | People's Light & Theater Co 39 Conestoga Rd. Malvern PA 19355-1737 | 7.70 | % | ||||||||
| Balanced | State Street Bk & Tr Co 616 Hanover PA 17331-7828Morning Glory Dr | 5.68 | % | ||||||||
| Core Fixed Income | Morgan Stanley & Co Harborside Financial Center Plaza II, 3rd Floor Jersey City NJ 07311 | 96.38 | % | ||||||||
| Core Plus Fixed Income | Fidelity Investments Institutional Operations 100 Magellan Way KWIC Covington KY 41015-1999 | 35.86 | % | ||||||||
| Core Plus Fixed Income | Morgan Stanley & Co Harborside Financial Center Plaza II, 3rd Floor Jersey City NJ 07311 | 33.36 | % | ||||||||
| Core Plus Fixed Income | National Financial Services Corp FBO Their Customers Church Street Station New York NY 10008-3908 | 11.99 | % | ||||||||
| Core Plus Fixed Income | AK Steel Corp Master Pension Trust 9227 Centre Pointe Drive West Chester OH 45069-4822 | 5.32 | % | ||||||||
| Limited Duration | Morgan Stanley & Co Harborside Financial Center Plaza II, 3rd Floor Jersey City NJ 07311 | 94.23 | % | ||||||||
| Mid Cap Growth | Fidelity Investments Institutional Operations 100 Magellan Way KWIC Covington KY 41015-1999 | 44.08 | % | ||||||||
| Mid Cap Growth | Charles Schwab & Co Inc. 101 Montgomery St San Francisco CA 94104-4151 | 7.51 | % | ||||||||
77
CLASS P
| Portfolio | Name and Address | % of Class | |||||||||
| Balanced | Fidelity Investments Institutional Operations 100 Magellan Way KWIC Covington KY 41015-1999 | 96.46 | % | ||||||||
| Core Fixed Income | Morgan Stanley & Co Harborside Financial Center Plaza II, 3rd Floor Jersey City NJ 07311 | 94.91 | % | ||||||||
| Core Fixed Income | National Financial Services LLC 200 Liberty St. New York, NY 10281-1003 | 5.09 | % | ||||||||
| Core Plus Fixed Income | Reliance Trust Company 8515 East Orchard Road 2T2 Greenwood VLG CO 80111-5002 | 30.01 | % | ||||||||
| Core Plus Fixed Income | Morgan Stanley & Co Harborside Financial Center Plaza II, 3rd Floor Jersey City NJ 07311 | 23.07 | % | ||||||||
| Core Plus Fixed Income | Fidelity Investments Institutional Operations 100 Magellan Way KWIC Covington KY 41015-1999 | 16.37 | % | ||||||||
| Core Plus Fixed Income | Morgan Stanley & Co 1035 Park Ave New York NY 10028-0912 | 11.03 | % | ||||||||
| Core Plus Fixed Income | Morgan Stanley & Co 3402 Mount Bonnell Rd Austin, TX 78731-5850 | 10.62 | % | ||||||||
| Limited Duration | Morgan Stanley & Co Harborside Financial Center Plaza II, 3rd Floor Jersey City NJ 07311 | 100.00 | % | ||||||||
| Mid Cap Growth | Fidelity Investments Institutional Operations 100 Magellan Way KWIC Covington KY 41015-1999 | 44.10 | % | ||||||||
| Mid Cap Growth | National Financial Services Corp One World Financial Center, 5th Floor New York NY 10281-1003 | 15.30 | % | ||||||||
| Mid Cap Growth | Charles Schwab & Co Inc 101 Montgomery St San Francisco CA 94104-4151 | 8.26 | % | ||||||||
| Mid Cap Growth | Wells Fargo Bank NA 1525 West WT Harris Blvd Charlotte NC 28288-1076 | 5.34 | % | ||||||||
The persons listed above as owning 25% or more of the outstanding shares of a Portfolio may be presumed to "control" (as that term is defined in the 1940 Act) such Portfolio. As a result, those persons would have the ability to vote a majority of the shares of the respective Portfolio on any matter requiring the approval of shareholders of such Portfolio.
78
PERFORMANCE INFORMATION
The average annual total return (cumulative return shown for periods less than one year) of Class I shares of each Portfolio for the periods noted is set forth below:
| Portfolio | 1 Year Return 09/30/11 | 5 Years ended 09/30/11 | 10 Years ended 09/30/11 | Inception to 09/30/11 | Date of inception of Class | ||||||||||||||||||
| Balanced | 1.07 | % | 2.46 | % | 4.37 | % | 6.89 | % | 12/31/1992 | ||||||||||||||
| Core Fixed Income | 4.34 | % | 3.26 | % | 4.13 | % | 7.01 | % | 09/29/1987 | ||||||||||||||
| Core Plus Fixed Income | 3.74 | % | 2.26 | % | 3.75 | % | 7.62 | % | 11/14/1984 | ||||||||||||||
| Limited Duration | 0.71 | % | -1.79 | % | 0.53 | % | 3.27 | % | 03/31/1992 | ||||||||||||||
| Mid Cap Growth | 0.47 | % | 6.21 | % | 8.69 | % | 12.57 | % | 03/30/1990 | ||||||||||||||
The average annual total return (cumulative return for periods less than one year) of Class P shares of each Portfolio for the periods noted is set forth below:
| Portfolio | 1 Year Return 09/30/11 | 5 Years ended 09/30/11 | 10 Years ended 09/30/11 | Inception to 09/30/11 | Date of inception of Class | ||||||||||||||||||
| Balanced | 0.83 | % | 2.19 | % | 4.11 | % | 5.39 | % | 11/01/1996 | ||||||||||||||
| Core Fixed Income | 4.11 | % | 3.03 | % | 3.89 | % | 4.53 | % | 03/01/1999 | ||||||||||||||
| Core Plus Fixed Income | 3.57 | % | 2.01 | % | 3.49 | % | 4.64 | % | 11/07/1996 | ||||||||||||||
| Limited Duration | 0.45 | % | N/A | N/A | -3.48 | % | 09/28/2007 | ||||||||||||||||
| Mid Cap Growth | 0.22 | % | 5.94 | % | 8.42 | % | 9.28 | % | 01/31/1997 | ||||||||||||||
The average annual total return (after taxes on distributions) of Class I shares of each Portfolio for the periods noted is set forth below (cumulative returns for periods less than one year):
| Portfolio | 1 Year Return 09/30/11 | 5 Years ended 09/30/11 | 10 Years ended 09/30/11 | Inception to 09/30/11 | Date of inception of Class | ||||||||||||||||||
| Balanced | 0.60 | % | 1.69 | % | 3.54 | % | 4.94 | % | 12/31/1992 | ||||||||||||||
| Core Fixed Income | 3.23 | % | 1.62 | % | 2.29 | % | 4.54 | % | 09/29/1987 | ||||||||||||||
| Core Plus Fixed Income | 2.27 | % | 0.41 | % | 1.76 | % | 4.78 | % | 11/14/1984 | ||||||||||||||
| Limited Duration | 0.10 | % | -3.17 | % | -0.78 | % | 1.53 | % | 03/31/1992 | ||||||||||||||
| Mid Cap Growth | 0.43 | % | 6.17 | % | 8.67 | % | 10.65 | % | 03/30/1990 | ||||||||||||||
The average annual total return (after taxes on distributions and redemption) of Class I shares of each Portfolio for the periods noted is set forth below (cumulative return for periods less than one year):
| Portfolio | 1 Year Return 09/30/11 | 5 Years ended 09/30/11 | 10 Years ended 09/30/11 | Inception to 09/30/11 | Date of inception of Class | ||||||||||||||||||
| Balanced | 0.79 | % | 1.71 | % | 3.32 | % | 4.89 | % | 12/31/1992 | ||||||||||||||
| Core Fixed Income | 2.79 | % | 1.80 | % | 2.42 | % | 4.56 | % | 09/29/1987 | ||||||||||||||
| Core Plus Fixed Income | 2.40 | % | 0.82 | % | 2.00 | % | 4.84 | % | 11/14/1984 | ||||||||||||||
| Limited Duration | 0.46 | % | -2.28 | % | -0.28 | % | 1.75 | % | 03/31/1992 | ||||||||||||||
| Mid Cap Growth | 0.37 | % | 5.37 | % | 7.73 | % | 10.23 | % | 03/30/1990 | ||||||||||||||
79
The aggregate total return of each Portfolio for the periods noted is set forth below. One year aggregate total return figures are reflected under the average annual total return figures provided above.
| Portfolio† | 5 Years ended 09/30/11* | 10 Years ended 09/30/11* | Inception to 09/30/11* | Date of inception of Class | |||||||||||||||
| Balanced | 12.93 | % | 53.36 | % | 248.77 | % | 12/31/1992 | ||||||||||||
| Core Fixed Income | 17.39 | % | 49.82 | % | 408.99 | % | 09/29/1987 | ||||||||||||
| Core Plus Fixed Income | 11.81 | % | 44.48 | % | 620.41 | % | 11/14/1984 | ||||||||||||
| Limited Duration | -8.63 | % | 5.43 | % | 87.18 | % | 03/31/1992 | ||||||||||||
| Mid Cap Growth | 35.17 | % | 130.15 | % | 1175.84 | % | 03/30/1990 | ||||||||||||
† Performance information for the Class H and Class L shares of the Portfolios will be provided once the Class H and Class L shares of the Portfolios have completed a full calendar year of operations.
* The above performance information relates solely to Class I. Performance for Class P would be lower because of the shareholder servicing fees charged to Class P. Performance for Class H would be lower because of the sales charge and shareholder servicing fees charged to Class H. Performance for Class L would be lower because of the distribution fees and shareholder servicing fees charged to Class L.
The 30-day yield figures for each of the Fund's Fixed Income Portfolios is set forth below:
| Class I Portfolios† | Period Ending 09/30/11 | ||||||
| Core Fixed Income | 4.99 | % | |||||
| Core Plus Fixed Income | 6.52 | % | |||||
| Limited Duration | 1.72 | % | |||||
| Balanced | 1.96 | % | |||||
| Class P Portfolios† | Period Ending 09/30/11 | ||||||
| Core Fixed Income | 4.73 | % | |||||
| Core Plus Fixed Income | 6.26 | % | |||||
| Limited Duration | 1.47 | % | |||||
| Balanced | 1.71 | % | |||||
† The 30-day yield figures for the Class H and Class L shares of the Portfolios will be provided once the Class H and Class L shares of the Portfolios have completed a full calendar year of operations.
FINANCIAL STATEMENTS
The Fund's audited financial statements for the fiscal year ended September 30, 2011, including notes thereto, and the report of Ernst & Young LLP, an independent registered public accounting firm, are herein incorporated by reference to the Fund's Annual Report to Shareholders. A copy of the Fund's Annual Report to Shareholders must accompany the delivery of this SAI.
80
APPENDIX A
MORGAN STANLEY INVESTMENT MANAGEMENT
PROXY VOTING POLICY AND PROCEDURES
I. POLICY STATEMENT
Morgan Stanley Investment Management's ("MSIM") policy and procedures for voting proxies ("Policy") with respect to securities held in the accounts of clients applies to those MSIM entities that provide discretionary investment management services and for which an MSIM entity has authority to vote proxies. This Policy is reviewed and updated as necessary to address new and evolving proxy voting issues and standards.
The MSIM entities covered by this Policy currently include the following: Morgan Stanley AIP GP LP, Morgan Stanley Investment Management Inc., Morgan Stanley Investment Management Limited, Morgan Stanley Investment Management Company, Morgan Stanley Asset & Investment Trust Management Co., Limited, Morgan Stanley Investment Management Private Limited and Private Investment Partners Inc. (each an "MSIM Affiliate" and collectively referred to as the "MSIM Affiliates" or as "we" below).
Each MSIM Affiliate will use its best efforts to vote proxies as part of its authority to manage, acquire and dispose of account assets. With respect to the MSIM registered management investment companies (the "MSIM Funds"), each MSIM Affiliate will vote proxies under this Policy pursuant to authority granted under its applicable investment advisory agreement or, in the absence of such authority, as authorized by the Board of Directors/Trustees of the MSIM Funds. A MSIM Affiliate will not vote proxies unless the investment management or investment advisory agreement explicitly authorizes the MSIM Affiliate to vote proxies. MSIM Affiliates will vote proxies in a prudent and diligent manner and in the best interests of clients, including beneficiaries of and participants in a client's benefit plan(s) for which the MSIM Affiliates manage assets, consistent with the objective of maximizing long-term investment returns ("Client Proxy Standard"). In certain situations, a client or its fiduciary may provide an MSIM Affiliate with a proxy voting policy. In these situations, the MSIM Affiliate will comply with the client's policy.
Proxy Research Services—ISS Governance Services ("ISS") and Glass Lewis (together with other proxy research providers as we may retain from time to time, the "Research Providers") are independent advisers that specialize in providing a variety of fiduciary-level proxy-related services to institutional investment managers, plan sponsors, custodians, consultants, and other institutional investors. The services provided include in-depth research, global issuer analysis, and voting recommendations. While we may review and utilize the recommendations of one or more Research Providers in making proxy voting decisions, we are in no way obligated to follow such recommendations. In addition to research, ISS provides vote execution, reporting, and recordkeeping services.
Voting Proxies for Certain Non-U.S. Companies—Voting proxies of companies located in some jurisdictions may involve several problems that can restrict or prevent the ability to vote such proxies or entail significant costs. These problems include, but are not limited to: (i) proxy statements and ballots being written in a language other than English; (ii) untimely and/or inadequate notice of shareholder meetings; (iii) restrictions on the ability of holders outside the issuer's jurisdiction of organization to exercise votes; (iv) requirements to vote proxies in person; (v) the imposition of restrictions on the sale of the securities for a period of time in proximity to the shareholder meeting; and (vi) requirements to provide local agents with power of attorney to facilitate our voting instructions. As a result, we vote clients' non-U.S. proxies on a best efforts basis only, after weighing the costs and benefits of voting such proxies, consistent with the Client Proxy Standard. ISS has been retained to provide assistance in connection with voting non-U.S. proxies.
II. GENERAL PROXY VOTING GUIDELINES
To promotes consistency in voting proxies on behalf of its clients, we follow this Policy (subject to any exception set forth herein). The Policy addresses a broad range of issues, and provides general voting parameters on proposals that arise most frequently. However, details of specific proposals vary, and those details affect particular voting decisions, as do factors specific to a given company. Pursuant to the procedures set forth herein, we may vote in a manner that is not in accordance with the following general guidelines, provided the vote is approved by the Proxy Review Committee (see Section III for description) and is consistent with the Client Proxy Standard. Morgan Stanley AIP GP LP will follow the procedures as described in Appendix A.
A-1
We endeavor to integrate governance and proxy voting policy with investment goals, using the vote to encourage portfolio companies to enhance long-term shareholder value and to provide a high standard of transparency such that equity markets can value corporate assets appropriately.
We seek to follow the Client Proxy Standard for each client. At times, this may result in split votes, for example when different clients have varying economic interests in the outcome of a particular voting matter (such as a case in which varied ownership interests in two companies involved in a merger result in different stakes in the outcome). We also may split votes at times based on differing views of portfolio managers.
We may abstain on matters for which disclosure is inadequate.
A. Routine Matters.
We generally support routine management proposals. The following are examples of routine management proposals:
• Approval of financial statements and auditor reports if delivered with an unqualified auditor's opinion.
• General updating/corrective amendments to the charter, articles of association or bylaws, unless we believe that such amendments would diminish shareholder rights.
• Most proposals related to the conduct of the annual meeting, with the following exceptions. We generally oppose proposals that relate to "the transaction of such other business which may come before the meeting," and open-ended requests for adjournment. However, where management specifically states the reason for requesting an adjournment and the requested adjournment would facilitate passage of a proposal that would otherwise be supported under this Policy (i.e. an uncontested corporate transaction), the adjournment request will be supported.
We generally support shareholder proposals advocating confidential voting procedures and independent tabulation of voting results.
B. Board of Directors.
1. Election of directors: Votes on board nominees can involve balancing a variety of considerations. In vote decisions, we may take into consideration whether the company has a majority voting policy in place that we believe makes the director vote more meaningful. In the absence of a proxy contest, we generally support the board's nominees for director except as follows:
a. We consider withholding support from or voting against a nominee if we believe a direct conflict exists between the interests of the nominee and the public shareholders, including failure to meet fiduciary standards of care and/or loyalty. We may oppose directors where we conclude that actions of directors are unlawful, unethical or negligent. We consider opposing individual board members or an entire slate if we believe the board is entrenched and/or dealing inadequately with performance problems; if we believe the board is acting with insufficient independence between the board and management; or if we believe the board has not been sufficiently forthcoming with information on key governance or other material matters.
b. We consider witholding support from or voting against interested directors if the company's board does not meet market standards for director independence, or if otherwise we believe board independence is insufficient. We refer to prevalent market standards as promulgated by a stock exchange or other authority within a given market (e.g., New York Stock Exchange or Nasdaq rules for most U.S. companies, and The Combined Code on Corporate Governance in the United Kingdom). Thus, for an NYSE company with no controlling shareholder, we would expect that at a minimum a majority of directors should be independent as defined by NYSE. Where we view market standards as inadequate, we may withhold votes based on stronger independence standards. Market standards notwithstanding, we generally do not view long board tenure alone as a basis to classify a director as non-independent.
i. At a company with a shareholder or group that controls the company by virtue of a majority economic interest in the company, we have a reduced expectation for board independence, although we believe the presence of independent directors can be helpful, particularly in staffing the audit committee, and at times we may withhold support from or vote against a nominee on the view the
A-2
board or its committees are not sufficiently independent. In markets where board independence is not the norm (e.g. Japan), however, we consider factors including whether a board of a controlled company includes independent members who can be expected to look out for interests of minority holders.
ii. We consider withholding support from or voting against a nominee if he or she is affiliated with a major shareholder that has representation on a board disproportionate to its economic interest.
c. Depending on market standards, we consider withholding support from or voting against a nominee who is interested and who is standing for election as a member of the company's compensation/renumeration, nominating/governance or audit committee.
d. We consider withholding support or voting against nominees if the term for which they are nominated is excessive. We consider this issue on a market-specific basis.
e. We consider withholding support from or voting against nominees if, in our view, there has been insufficient board renewal (turnover), particularly in the context of extended poor company performance.
f. We consider withholding support from or voting against a nominee standing for election if the board has not taken action to implement generally accepted governance practices for which there is a "bright line" test. For example, in the context of the U.S. market, failure to eliminate a dead hand or slow hand poison pill would be seen as a basis for opposing one or more incumbent nominees.
g. In markets that encourage designated audit committee financial experts, we consider voting against members of an audit committee if no members are designated as such. We also may not support the audit committee members if the company has faced financial reporting issues and/or does not put the auditor up for ratification by shareholders.
h. We believe investors should have the ability to vote on individual nominees, and may abstain or vote against a slate of nominees where we are not given the opportunity to vote on individual nominees.
i. We consider withholding support from or voting against a nominee who has failed to attend at least 75% of the nominee's board and board committee meetings within a given year without a reasonable excuse. We also consider opposing nominees if the company does not meet market standards for disclosure on attendance.
j. We consider withholding support from or voting against a nominee who appears overcommitted, particularly through service on an excessive number of boards. Market expectations are incorporated into this analysis; for U.S. boards, we generally oppose election of a nominee who serves on more than six public company boards (excluding investment companies), although we may reference National Association of Corporate Directors guidance suggesting that public company CEOs, for example, should serve no more than two outside boards given the level of time commitment required in their primary job.
2. Discharge of directors' duties: In markets where an annual discharge of directors' responsibility is a routine agenda item, we generally support such discharge. However, we may vote against discharge or abstain from voting where there are serious findings of fraud or other unethical behavior for which the individual bears responsibility. The annual discharge of responsibility represents shareholder approval of disclosed actions taken by the board during the year and may make future shareholder action against the board difficult to pursue.
3. Board independence: We generally support U.S. shareholder proposals requiring that a certain percentage (up to 66 2/3%) of the company's board members be independent directors, and promoting all-independent audit, compensation and nominating/governance committees.
4. Board diversity: We consider on a case-by-case basis shareholder proposals urging diversity of board membership with respect to social, religious or ethnic group.
5. Majority voting: We generally support proposals requesting or requiring majority voting policies in election of directors, so long as there is a carve-out for plurality voting in the case of contested elections.
A-3
6. Proxy access: We consider on a case-by-case basis shareholder proposals on particular procedures for inclusion of shareholder nominees in company proxy statements.
7. Reimbursement for dissident nominees: We generally support well-crafted U.S. shareholder proposals that would provide for reimbursement of dissident nominees elected to a board, as the cost to shareholders in electing such nominees can be factored into the voting decision on those nominees.
8. Proposals to elect directors more frequently: In the U.S. public company context, we usually support shareholder and management proposals to elect all directors annually (to "declassify" the board), although we make an exception to this policy where we believe that long-term shareholder value may be harmed by this change given particular circumstances at the company at the time of the vote on such proposal. As indicated above, outside the U.S., we generally support greater accountability to shareholders that comes through more frequent director elections, but recognize that many markets embrace longer term lengths, sometimes for valid reasons given other aspects of the legal context in electing boards.
9. Cumulative voting: We generally support proposals to eliminate cumulative voting in the U.S. market context. (Cumulative voting provides that shareholders may concentrate their votes for one or a handful of candidates, a system that can enable a minority bloc to place representation on a board.) U.S. proposals to establish cumulative voting in the election of directors generally will not be supported.
10. Separation of Chairman and CEO positions: We vote on shareholder proposals to separate the Chairman and CEO positions and/or to appoint an independent Chairman based in part on prevailing practice in particular markets, since the context for such a practice varies. In many non-U.S. markets, we view separation of the roles as a market standard practice, and support division of the roles in that context. In the U.S., we consider such proposals on a case-by-case basis, considering, among other things, the existing board leadership structure, company performance, and any other evidence of entrenchment or perceived risk that power is overly concentrated in a single individual.
11. Director retirement age and term limits: Proposals setting or recommending director retirement ages or director term limits are voted on a case-by-case basis that includes consideration of company performance, the rate of board renewal, evidence of effective individual director evaluation processes, and any indications of entrenchment.
12. Proposals to limit directors' liability and/or broaden indemnification of officers and directors. Generally, we will support such proposals provided that an individual is eligible only if he or she has not acted in bad faith, with gross negligence or with reckless disregard of their duties.
C. Statutory auditor boards
The statutory auditor board, which is separate from the main board of directors, plays a role in corporate governance in several markets. These boards are elected by shareholders to provide assurance on compliance with legal and accounting standards and the company's articles of association. We generally vote for statutory auditor nominees if they meet independence standards. In markets that require disclosure on attendance by internal statutory auditors, however, we consider voting against nominees for these positions who failed to attend at least 75% of meetings in the previous year. We also consider opposing nominees if the company does not meet market standards for disclosure on attendance.
D. Corporate transactions and proxy fights.
We examine proposals relating to mergers, acquisitions and other special corporate transactions (i.e., takeovers, spin-offs, sales of assets, reorganizations, restructurings and recapitalizations) on a case-by-case basis in the interests of each fund or other account. Proposals for mergers or other significant transactions that are friendly and approved by the Research Providers usually are supported if there is no portfolio manager objection. We also analyze proxy contests on a case-by-case basis.
E. Changes in capital structure.
1. We generally support the following:
• Management and shareholder proposals aimed at eliminating unequal voting rights, assuming fair economic treatment of classes of shares we hold.
A-4
• U.S. management proposals to increase the authorization of existing classes of common stock (or securities convertible into common stock) if: (i) a clear business purpose is stated that we can support and the number of shares requested is reasonable in relation to the purpose for which authorization is requested; and/or (ii) the authorization does not exceed 100% of shares currently authorized and at least 30% of the total new authorization will be outstanding. (We consider proposals that do not meet these criteria on a case-by-case basis.)
• U.S. management proposals to create a new class of preferred stock or for issuances of preferred stock up to 50% of issued capital, unless we have concerns about use of the authority for anti-takeover purposes.
• Proposals in non-U.S. markets that in our view appropriately limit potential dilution of existing shareholders. A major consideration is whether existing shareholders would have preemptive rights for any issuance under a proposal for standing share issuance authority. We generally consider market-specific guidance in making these decisions; for example, in the U.K. market, we usually follow Association of British Insurers' ("ABI") guidance, although company-specific factors may be considered and for example, may sometimes lead us to voting against share authorization proposals even if they meet ABI guidance.
• Management proposals to authorize share repurchase plans, except in some cases in which we believe there are insufficient protections against use of an authorization for anti-takeover purposes.
• Management proposals to reduce the number of authorized shares of common or preferred stock, or to eliminate classes of preferred stock.
• Management proposals to effect stock splits.
• Management proposals to effect reverse stock splits if management proportionately reduces the authorized share amount set forth in the corporate charter. Reverse stock splits that do not adjust proportionately to the authorized share amount generally will be approved if the resulting increase in authorized shares coincides with the proxy guidelines set forth above for common stock increases.
• Management dividend payout proposals, except where we perceive company payouts to shareholders as inadequate.
2. We generally oppose the following (notwithstanding management support):
• Proposals to add classes of stock that would substantially dilute the voting interests of existing shareholders.
• Proposals to increase the authorized or issued number of shares of existing classes of stock that are unreasonably dilutive, particularly if there are no preemptive rights for existing shareholders. However, depending on market practices, we consider voting for proposals giving general authorization for issuance of shares not subject to pre-emptive rights if the authority is limited.
• Proposals that authorize share issuance at a discount to market rates, except where authority for such issuance is de minimis, or if there is a special situation that we believe justifies such authorization (as may be the case, for example, at a company under severe stress and risk of bankruptcy).
• Proposals relating to changes in capitalization by 100% or more.
We consider on a case-by-case basis shareholder proposals to increase dividend payout ratios, in light of market practice and perceived market weaknesses, as well as individual company payout history and current circumstances. For example, currently we perceive low payouts to shareholders as a concern at some Japanese companies, but may deem a low payout ratio as appropriate for a growth company making good use of its cash, notwithstanding the broader market concern.
F. Takeover Defenses and Shareholder Rights.
1. Shareholder rights plans: We generally support proposals to require shareholder approval or ratification of shareholder rights plans (poison pills). In voting on rights plans or similar takeover defenses, we consider on a case-by-case basis whether the company has demonstrated a need for the defense in the context of promoting long-term share value; whether provisions of the defense are in line with generally accepted governance principles in the market (and specifically the presence of an adequate qualified offer provision that would
A-5
exempt offers meeting certain conditions from the pill); and the specific context if the proposal is made in the midst of a takeover bid or contest for control.
2. Supermajority voting requirements: We generally oppose requirements for supermajority votes to amend the charter or bylaws, unless the provisions protect minority shareholders where there is a large shareholder. In line with this view, in the absence of a large shareholder we support reasonable shareholder proposals to limit such supermajority voting requirements.
3. Shareholder rights to call meetings: We consider proposals to enhance shareholder rights to call meetings on a case-by-case basis. At large-cap U.S. companies, we generally support efforts to establish the rights of holders of 10% or more of shares to call special meetings, unless the board or state law has a set policy or law establishing such rights at a threshold that we believe to be acceptable.
4. Written consent rights: In the U.S. context, we examine proposals for shareholder written consent rights on a case-by-case basis.
5. Reincorporation: We consider management and shareholder proposals to reincorporate to a different jurisdiction on a case-by-case basis. We oppose such proposals if we believe the main purpose is to take advantage of laws or judicial precedents that reduce shareholder rights.
6. Anti-greenmail provisions: Proposals relating to the adoption of anti-greenmail provisions will be supported, provided that the proposal: (i) defines greenmail; (ii) prohibits buyback offers to large block holders (holders of at least 1% of the outstanding shares and in certain cases, a greater amount) not made to all shareholders or not approved by disinterested shareholders; and (iii) contains no anti-takeover measures or other provisions restricting the rights of shareholders.
7. Bundled proposals: We may consider opposing or abstaining on proposals if disparate issues are "bundled" and presented for a single vote.
G. Auditors.
We generally support management proposals for selection or ratification of independent auditors. However, we may consider opposing such proposals with reference to incumbent audit firms if the company has suffered from serious accounting irregularities and we believe rotation of the audit firm is appropriate, or if fees paid to the auditor for non-audit-related services are excessive. Generally, to determine if non-audit fees are excessive, a 50% test will be applied (i.e., non-audit-related fees should be less than 50% of the total fees paid to the auditor). We generally vote against proposals to indemnify auditors.
H. Executive and Director Remuneration.
1. We generally support the following:
• Proposals for employee equity compensation plans and other employee ownership plans, provided that our research does not indicate that approval of the plan would be against shareholder interest. Such approval may be against shareholder interest if it authorizes excessive dilution and shareholder cost, particularly in the context of high usage ("run rate") of equity compensation in the recent past; or if there are objectionable plan design and provision.
• Proposals relating to fees to outside directors, provided the amounts are not excessive relative to other companies in the country or industry, and provided that the structure is appropriate within the market context. While stock-based compensation to outside directors is positive if moderate and appropriately structured, we are wary of significant stock option awards or other performance-based awards for outside directors, as well as provisions that could result in significant forfeiture of value on a director's decision to resign from a board (such forfeiture can undercut director independence).
• Proposals for employee stock purchase plans that permit discounts, but only for grants that are part of a broad-based employee plan, including all non-executive employees, and only if the discounts are limited to a reasonable market standard or less.
• Proposals for the establishment of employee retirement and severance plans, provided that our research does not indicate that approval of the plan would be against shareholder interest.
A-6
2. We generally oppose retirement plans and bonuses for non-executive directors and independent statutory auditors.
3. In the U.S. context, shareholder proposals requiring shareholder approval of all severance agreements will not be supported, but proposals that require shareholder approval for agreements in excess of three times the annual compensation (salary and bonus) generally will be supported. We generally oppose shareholder proposals that would establish arbitrary caps on pay. We consider on a case-by-case basis shareholder proposals that seek to limit Supplemental Executive Retirement Plans (SERPs), but support such proposals where we consider SERPs to be excessive.
4. Shareholder proposals advocating stronger and/or particular pay-for-performance models will be evaluated on a case-by-case basis, with consideration of the merits of the individual proposal within the context of the particular company and its labor markets, and the company's current and past practices. While we generally support emphasis on long-term components of senior executive pay and strong linkage of pay to performance, we consider factors including whether a proposal may be overly prescriptive, and the impact of the proposal, if implemented as written, on recruitment and retention.
5. We generally support proposals advocating reasonable senior executive and director stock ownership guidelines and holding requirements for shares gained in executive equity compensation programs
6. We generally support shareholder proposals for reasonable "claw-back" provisions that provide for company recovery of senior executive bonuses to the extent they were based on achieving financial benchmarks that were not actually met in light of subsequent restatements.
7. Management proposals effectively to re-price stock options are considered on a case-by-case basis. Considerations include the company's reasons and justifications for a re-pricing, the company's competitive position, whether senior executives and outside directors are excluded, potential cost to shareholders, whether the re-pricing or share exchange is on a value-for-value basis, and whether vesting requirements are extended.
8. Say-on-Pay: We consider proposals relating to an advisory vote on remuneration on a case-by-case basis. Considerations include a review of the relationship between executive remuneration and performance based on operating trends and total shareholder return over multiple performance periods. In addition, we review remuneration structures and potential poor pay practices, including relative magnitude of pay, discretionary bonus awards, tax gross ups, change-in-control features, internal pay equity and peer group construction. As long-term investors, we support remuneration policies that align with long-term shareholder returns.
I. Social, Political and Environmental Issues.
Shareholders in the U.S. and certain other markets submit proposals encouraging changes in company disclosure and practices related to particular corporate, social, political and environmental matters. We consider how to vote on the proposals on a case-by-case basis to determine likely impacts on shareholder value. We seek to balance concerns on reputational and other risks that lie behind a proposal against costs of implementation, while considering appropriate shareholder and management prerogatives. We may abstain from voting on proposals that do not have a readily determinable financial impact on shareholder value. We support proposals that, if implemented, would enhance useful disclosure, but we generally vote against proposals requesting reports that we believe are duplicative, related to matters not material to the business, or that would impose unnecessary or excessive costs. We believe that certain social and environmental shareholder proposals may intrude excessively on management prerogatives, which can lead us to oppose them.
J. Fund of Funds.
Certain Funds advised by an MSIM Affiliate invest only in other MSIM Funds. If an underlying fund has a shareholder meeting, in order to avoid any potential conflict of interest, such proposals will be voted in the same proportion as the votes of the other shareholders of the underlying fund, unless otherwise determined by the Proxy Review Committee.
III. ADMINISTRATION OF POLICY
The MSIM Proxy Review Committee (the "Committee") has overall responsibility for the Policy. The Committee, which is appointed by MSIM's Long-Only Executive Committee, consists of investment professionals who represent the different investment disciplines and geographic locations of the firm, and is chaired by the director
A-7
of the Corporate Governance Team ("CGT"). Because proxy voting is an investment responsibility and impacts shareholder value, and because of their knowledge of companies and markets, portfolio managers and other members of investment staff play a key role in proxy voting, although the Committee has final authority over proxy votes.
The CGT Director is responsible for identifying issues that require Committee deliberation or ratification. The CGT, working with advice of investment teams and the Committee, is responsible for voting on routine items and on matters that can be addressed in line with these Policy guidelines. The CGT has responsibility for voting case-by-case where guidelines and precedent provide adequate guidance.
The Committee will periodically review and have the authority to amend, as necessary, the Policy and establish and direct voting positions consistent with the Client Proxy Standard.
CGT and members of the Committee may take into account Research Providers' recommendations and research as well as any other relevant information they may request or receive, including portfolio manager and/or analyst comments and research, as applicable. Generally, proxies related to securities held in accounts that are managed pursuant to quantitative, index or index-like strategies ("Index Strategies") will be voted in the same manner as those held in actively managed accounts, unless economic interests of the accounts differ. Because accounts managed using Index Strategies are passively managed accounts, research from portfolio managers and/or analysts related to securities held in these accounts may not be available. If the affected securities are held only in accounts that are managed pursuant to Index Strategies, and the proxy relates to a matter that is not described in this Policy, the CGT will consider all available information from the Research Providers, and to the extent that the holdings are significant, from the portfolio managers and/or analysts.
A. Committee Procedures
The Committee meets at least quarterly and reviews and considers changes to the Policy at least annually. Through meetings and/or written communications, the Committee is responsible for monitoring and ratifying "split votes" (i.e., allowing certain shares of the same issuer that are the subject of the same proxy solicitation and held by one or more MSIM portfolios to be voted differently than other shares) and/or "override voting" (i.e., voting all MSIM portfolio shares in a manner contrary to the Policy). The Committee will review developing issues and approve upcoming votes, as appropriate, for matters as requested by CGT.
The Committee reserves the right to review voting decisions at any time and to make voting decisions as necessary to ensure the independence and integrity of the votes.
B. Material Conflicts of Interest
In addition to the procedures discussed above, if the CGT Director determines that an issue raises a material conflict of interest, the CGT Director may request a special committee to review, and recommend a course of action with respect to, the conflict(s) in question ("Special Committee").
A potential material conflict of interest could exist in the following situations, among others:
1. The issuer soliciting the vote is a client of MSIM or an affiliate of MSIM and the vote is on a matter that materially affects the issuer.
2. The proxy relates to Morgan Stanley common stock or any other security issued by Morgan Stanley or its affiliates except if echo voting is used, as with MSIM Funds, as described herein.
3. Morgan Stanley has a material pecuniary interest in the matter submitted for a vote (e.g., acting as a financial advisor to a party to a merger or acquisition for which Morgan Stanley will be paid a success fee if completed).
If the CGT Director determines that an issue raises a potential material conflict of interest, depending on the facts and circumstances, the issue will be addressed as follows:
1. If the matter relates to a topic that is discussed in this Policy, the proposal will be voted as per the Policy.
2. If the matter is not discussed in this Policy or the Policy indicates that the issue is to be decided case-by-case, the proposal will be voted in a manner consistent with the Research Providers, provided that all the Research Providers consulted have the same recommendation, no portfolio manager objects to that vote, and the vote is consistent with MSIM's Client Proxy Standard.
A-8
3. If the Research Providers' recommendations differ, the CGT Director will refer the matter to a Special Committee to vote on the proposal, as appropriate.
Any Special Committee shall be comprised of the CGT Director and at least two portfolio managers (preferably members of the Committee) as approved by the Committee. The CGT Director may request non-voting participation by MSIM's General Counsel or his/her designee and the Chief Compliance Officer or his/her designee. In addition to the research provided by Research Providers, the Special Committee may request analysis from MSIM Affiliate investment professionals and outside sources to the extent it deems appropriate.
C. Proxy Voting Reporting
The CGT will document in writing all Committee and Special Committee decisions and actions, which documentation will be maintained by the CGT for a period of at least six years. To the extent these decisions relate to a security held by an MSIM Fund, the CGT will report the decisions to each applicable Board of Trustees/Directors of those Funds at each Board's next regularly scheduled Board meeting. The report will contain information concerning decisions made during the most recently ended calendar quarter immediately preceding the Board meeting.
MSIM will promptly provide a copy of this Policy to any client requesting it. MSIM will also, upon client request, promptly provide a report indicating how each proxy was voted with respect to securities held in that client's account.
MSIM's Legal Department is responsible for filing an annual Form N-PX on behalf of each MSIM Fund for which such filing is required, indicating how all proxies were voted with respect to such Fund's holdings.
A-9
APPENDIX A
The following procedures apply to accounts managed by Morgan Stanley AIP GP LP and Private Investment Partners Inc. ("AIP").
Generally, AIP will follow the guidelines set forth in Section II of MSIM's Proxy Voting Policy and Procedures. To the extent that such guidelines do not provide specific direction, or AIP determines that consistent with the Client Proxy Standard, the guidelines should not be followed, the Proxy Review Committee has delegated the voting authority to vote securities held by accounts managed by AIP to the Fund of Hedge Funds investment team, the Private Equity Fund of Funds investment team or the Private Equity Real Estate Fund of Funds investment team of AIP. A summary of decisions made by the investment teams will be made available to the Proxy Review Committee for its information at the next scheduled meeting of the Proxy Review Committee.
In certain cases, AIP may determine to abstain from determining (or recommending) how a proxy should be voted (and therefore abstain from voting such proxy or recommending how such proxy should be voted), such as where the expected cost of giving due consideration to the proxy does not justify the potential benefits to the affected account(s) that might result from adopting or rejecting (as the case may be) the measure in question.
Waiver of Voting Rights
For regulatory reasons, AIP may either 1) invest in a class of securities of an underlying fund (the "Fund") that does not provide for voting rights; or 2) waive 100% of its voting rights with respect to the following:
1. Any rights with respect to the removal or replacement of a director, general partner, managing member or other person acting in a similar capacity for or on behalf of the Fund (each individually a "Designated Person," and collectively, the "Designated Persons"), which may include, but are not limited to, voting on the election or removal of a Designated Person in the event of such Designated Person's death, disability, insolvency, bankruptcy, incapacity, or other event requiring a vote of interest holders of the Fund to remove or replace a Designated Person; and
2. Any rights in connection with a determination to renew, dissolve, liquidate, or otherwise terminate or continue the Fund, which may include, but are not limited to, voting on the renewal, dissolution, liquidation, termination or continuance of the Fund upon the occurrence of an event described in the Fund's organizational documents; provided, however, that, if the Fund's organizational documents require the consent of the Fund's general partner or manager, as the case may be, for any such termination or continuation of the Fund to be effective, then AIP may exercise its voting rights with respect to such matter.
Approved by Morgan Stanley Funds Board on September 27-28, 2011
A-10
APPENDIX B — DESCRIPTION OF RATINGS
I. Excerpts from Moody's Investors Service, Inc.'s Corporate Bond Ratings:
Aaa: Judged to be of the best quality; carry the smallest degree of invest risk;
Aa: judged to be of high quality by all standards;
A: possess many favorable investment attributes and are to be considered upper medium grade obligations;
Baa: considered as medium grade obligations; i.e., they are neither highly protected nor poorly secured;
Ba: judged to have speculative elements; their future cannot be considered well-assured;
B: assurance of interest and principal payments or of maintenance of other terms of the contract over any long period of time may be small.
Caa: Bonds which are rated Caa are of poor standing. Such issues may be in default or there may be present elements of danger with respect to principal or interest.
Ca: Bonds which are rated Ca represent obligations which are speculative in a high degree. Such issues are often in default or have other marked shortcomings.
C: Bonds which are rated C are lowest rated class of bonds and issues so rated can be regarded as having extremely poor prospects of ever attaining any real investment standing.
Note: Moody's applies numerical modifiers, 1, 2 and 3 in each generic rating classification from Aa through Caa in its corporate bond rating system. The modifier 1 indicates that the obligation ranks in the higher end of its generic rating category; the modifier 2 indicates a mid-range ranking; and the modifier 3 indicates that the issue ranks in the lower end of its generic rating category.
II. Excerpts from Standard & Poor's Rating Group's Corporate Bond Ratings:
AAA: Highest rating assigned for an obligation; obligor has extremely strong capacity to meet its financial commitments;
AA: obligation differs from the highest-rated obligations only in small degree; obligor's capacity to meet its financial commitment on the obligation is very strong;
A: obligation is somewhat more susceptible to the adverse effects of changes in circumstances and economic conditions than obligations in higher-rated categories; obligor's capacity to meet its financial commitment on the obligation is still strong;
BBB: obligation exhibits adequate protection parameters; adverse economic conditions or changing circumstances are more likely to lead to a weakened capacity of the obligor to meet its financial commitment on the obligation.
BB, B, CCC, CC, C: Obligations rated BB, B, CCC, and CC are regarded as having significant speculative characteristics. BB indicates the least degree of speculation and CC the highest. While such obligations will likely have some quality and protective characteristics, these may be outweighed by large uncertainties or major exposures to adverse conditions. The C rating may be used to cover a situation where a bankruptcy petition has been filed or similar action has been taken, but payments on this obligation are being continued.
D: An obligation rated D is in payment default. The D rating category is used when payments on an obligation are not made on the date due even if the applicable grace period has not expired, unless Standard & Poor's believes that such payments will be made during such grace period. The D rating also will be used upon the filing of a bankruptcy petition or the taking of a similar action if payments on an obligation are jeopardized.
Plus (+) or minus (-): The ratings from AA to CCC may be modified by the addition of a plus or minus sign to show relative standing within the major rating categories.
B-1
III. Excerpts from Fitch, Inc.'s Corporate Bond Ratings:
AAA: Highest credit quality; denotes the lowest expectation of credit risk; assigned only in case of exceptionally strong capacity for payment of financial commitments. This capacity is highly unlikely to be adversely affected by foreseeable events.
AA: Very high credit quality; denote expectations of very low credit risk; indicate very strong capacity for payment of financial commitments. This capacity is not significantly vulnerable to foreseeable events.
A: High credit quality; denote expectations of low credit risk. The capacity for payment of financial commitments is considered strong. This capacity may, nevertheless, be more vulnerable to changes in circumstances or in economic conditions than is the case for higher ratings.
BBB: Good credit quality; indicate that there is currently expectations of low credit risk. The capacity for payment of financial commitments is considered adequate but adverse changes in circumstances and economic conditions are more likely to impair this capacity. This is the lowest investment grade category.
BB: Speculative; indicate that there is a possibility of credit risk developing, particularly as the result of adverse economic change over time; however, business or financial alternatives may be available to allow financial commitments to be met. Securities rated in this category are not investment grade.
B: Highly speculative; indicate that significant credit risk is present, but a limited margin of safety remains. Financial commitments are currently being met; however, capacity for continued payment is contingent upon a sustained, favorable business and economic environment.
CCC: Default is a real possibility. Capacity for meeting financial commitments is solely reliant upon sustained, favorable business or economic conditions.
CC: Default of some kind appears probable.
C: Default is imminent.
RD: Indicates an entity that has failed to make due payments (within the applicable grace period) on some but not all material financial obligations, but continues to honor other classes of obligations.
D: Default. Default is determined by reference to the terms of the obligations' documentation. Fitch will assign default ratings where it has reasonably determined that payment has not been made on a material obligation in accordance with the requirements of the obligation's documentation, or where it believes that default ratings consistent with Fitch's published definition of default are the most appropriate ratings to assign.
The modifiers "+" or "-" may be appended to a rating to denote relative status within major rating categories. Such suffixes are not added to the AAA Long-term rating category or to categories below CCC.
IV. Excerpts from Moody's Investors Service, Inc.'s Preferred Stock Ratings:
aaa: An issue which is rated aaa is considered to be a top-quality preferred stock. This rating indicates good asset protection and the least risk of dividend impairment within the universe of preferred stocks.
aa: An issue which is rated aa is considered a high-grade preferred stock. This rating indicates that there is reasonable assurance that earnings and asset protection will remain relatively well maintained in the foreseeable future.
a: An issue which is rated a is considered to be an upper medium grade preferred stock. While risks are judged to be somewhat greater than in the aaa and aa classifications, earnings and asset protection are, nevertheless expected to be maintained at adequate levels.
baa: An issue which is rated baa is considered to be medium grade, neither highly protected nor poorly secured. Earnings and asset protection appear adequate at present but may be questionable over any great length of time.
ba: an issue which is rated ba is considered to have speculative elements and its future cannot be considered well assured. Earnings and asset protection may be very moderate and not well safeguarded during adverse periods. Uncertainty of position characterizes preferred stocks in this class.
B-2
b: An issue which is rated b generally lacks the characteristics of a desirable investment. Assurance of dividend payments and maintenance of other terms of the issue over any long period of time may be small.
caa: An issue which is rated caa is likely to be in arrears on dividend payments. This rating designation does not purport to indicate the future status of payment.
ca: An issue which is rated ca is speculative in a high degree and is likely to be in arrears on dividends with little likelihood of eventual payment.
c: This is the lowest rated class of preferred of preference stock. Issues so rated can be regarded as having extremely poor prospects of ever attaining any real investment standing.
Note: Moody's may apply numerical modifiers 1, 2 and 3 in each rating classification from "aa" through "b" in its preferred stock rating system. The modifier 1 indicated that the security ranks in the higher end of its generic rating category; the modifier 2 indicates a mid-range ranking; and the modifier 3 indicates that the issue ranks in the lower end of its generic rating category.
V. Excerpts from Standard & Poor's Rating Group's Preferred Stock Ratings:
AAA: This is the highest rating that may be assigned by S&P's to a preferred stock issue and indicates an extremely strong capacity to pay the preferred stock obligations.
AA: A preferred stock issue rated AA also qualifies as a high quality fixed income security. The capacity to pay preferred stock obligations is very strong, although not as overwhelming as for issues rated AAA.
A: An issue rated A is backed by a sound capacity to pay the preferred stock obligations, although it is somewhat more susceptible to the adverse effect of the changes in circumstances and economic conditions.
BBB: An issue rated BBB is regarded as backed by an adequate capacity to pay the preferred stock obligations. Whereas it normally exhibits adequate protection parameter, adverse economic conditions or changing circumstances are more likely to lead to a weakened capacity to make payments for a preferred stock in this category than for issues in the A category.
BB, B, CCC: Preferred stock rated BB, B, and CCC are regarded, on balance, as predominantly speculative with respect to the issuer's capacity to pay preferred stock obligations. Bb indicates the lowest degree of speculation and CCC the highest degree of speculation. While such issues will likely have some quality and protective characteristics, these are outweighed by large uncertainties of major risk exposures to adverse conditions.
CC: The rating CC is reserved for a preferred stock in arrears on dividends or sinking fund payments but that is currently paying.
C: A preferred stock rated C is a non-paying issue.
D: A preferred stock rated D is a non-paying issue with the issuer in default on debt instruments.
Plus (+) or Minus (-): The ratings from AA for CCC may be modified by the addition of a plus or minus sign to show relative standing within the major rating categories.
VI. Excerpts from Fitch, Inc's Preferred Stock Ratings:
AAA: These preferred stocks are considered to be investment grade and of the highest credit quality. The obligor has an exceptionally strong ability to pay, which is unlikely to be affected by reasonably foreseeable events.
AA: These preferred stocks are considered to be investment grade and of very high credit quality. The obligor's ability to pay is very strong, although not quite as strong as preferred stocks rated "AAA".
A: These preferred stocks are considered to be investment grade and of high credit quality. The obligor's ability to pay is considered to be strong, but may be more vulnerable to adverse changes in economic conditions and circumstances than preferred stocks with higher ratings.
BBB: These preferred stocks are considered to be investment grade and of satisfactory credit quality. The obligor's ability to pay interest and repay principal is considered to be adequate. Adverse changes in economic
B-3
conditions and circumstances, however, are more likely to have adverse impact on these preferred stocks, and therefore, impair timely payment. The likelihood that the ratings of these preferred stocks will fall below investment grade is higher than for preferred stocks with higher ratings.
BB: These preferred stocks are considered speculative. The obligor's ability to pay may be affected over time by adverse economic changes. However, business and financial alternatives can be identified that could assist the obligor in satisfying its dividend payment requirements.
B: These preferred stocks are considered highly speculative. While preferred in this class are currently meeting dividend payment requirements, the probability of continued timely payment reflects the obligor's limited margin of safety and the need for reasonable business and economic activity throughout the life of the issue.
CCC: These preferred stocks have certain identifiable characteristics which, if not remedied, may lead to non-payment. The ability to meet obligations requires an advantageous business and economic environment.
CC: These preferred stocks are minimally protected. Non-payment seems probable over time.
C: These preferred stocks are in imminent non-payment.
DDD, DD AND D: These preferred stocks are in non-payment. Such preferred stocks are extremely speculative and should be valued on the basis of their ultimate recovery value in liquidation or reorganization of the obligor. DDD represents the highest potential for recovery and D represents the lowest potential for recovery.
PLUS (+) OR MINUS (-): The ratings from AA to C may be modified by the addition of a plus or minus sign to indicate the relative position of a credit within the rating category.
B-4
MORGAN STANLEY INSTITUTIONAL FUND TRUST
Global Strategist Portfolio
522 Fifth Avenue
New York, NY 10036
STATEMENT OF ADDITIONAL INFORMATION
July 16, 2012
Morgan Stanley Institutional Fund Trust (the "Fund") is a mutual fund consisting of seven portfolios offering a variety of investment alternatives, one of which is included in this Statement of Additional Information ("SAI") (the "Portfolio"). The Portfolio offers Class I, Class P, Class H and Class L shares.
| Share Class and Ticker Symbol | |||||||||||||||||||
| Class I | Class P | Class H | Class L | ||||||||||||||||
| Global Strategist Portfolio (formerly Balanced Portfolio) | MPBAX | MBAAX | MSBHX | MSDLX | |||||||||||||||
This SAI is not a prospectus but should be read in conjunction with the Portfolio's prospectus, dated July 16, 2012, as may be supplemented from time to time. To obtain the prospectus, please call Shareholder Services at the number indicated below.
The Fund's most recent Annual Report to Shareholders is a separate document supplied with this SAI and includes the Fund's audited financial statements, including notes thereto, and the report of Ernst & Young LLP, which are incorporated by reference into this SAI. The Fund's financial statements for the six months ended March 31, 2012, which are unaudited, are incorporated herein by reference from the Fund's Semi-Annual Report to Shareholders.
The Portfolio is "diversified" and, as such, the Portfolio's investments are required to meet certain diversification requirements under federal securities laws.
SHAREHOLDER SERVICES: 1-800-548-7786
PRICES AND INVESTMENT RESULTS: WWW.MORGANSTANLEY.COM/IM
TABLE OF CONTENTS
| Page | |||||||
| THE PORTFOLIO'S INVESTMENTS AND STRATEGIES | 1 | ||||||
| INVESTMENTS AND RISKS | 4 | ||||||
| INVESTMENT LIMITATIONS | 33 | ||||||
| DISCLOSURE OF PORTFOLIO HOLDINGS | 35 | ||||||
| PURCHASE OF SHARES | 37 | ||||||
| REDEMPTION OF SHARES | 38 | ||||||
| TRANSACTIONS WITH BROKER/DEALERS | 39 | ||||||
| SHAREHOLDER SERVICES | 39 | ||||||
| VALUATION OF SHARES | 39 | ||||||
| MANAGEMENT OF THE FUND | 40 | ||||||
| COMPENSATION | 52 | ||||||
| ADVISER | 53 | ||||||
| PRINCIPAL UNDERWRITER | 56 | ||||||
| DISTRIBUTION AND SHAREHOLDER SERVICES PLANS | 56 | ||||||
| FUND ADMINISTRATION | 58 | ||||||
| OTHER SERVICE PROVIDERS | 58 | ||||||
| BROKERAGE TRANSACTIONS | 58 | ||||||
| VALUE OF PORTFOLIO HOLDINGS | 61 | ||||||
| GENERAL INFORMATION | 62 | ||||||
| TAX CONSIDERATIONS | 63 | ||||||
| PRINCIPAL HOLDERS OF SECURITIES | 68 | ||||||
| PERFORMANCE INFORMATION | 69 | ||||||
| FINANCIAL STATEMENTS | 70 | ||||||
| APPENDIX A — MORGAN STANLEY INVESTMENT MANAGEMENT PROXY VOTING POLICY AND PROCEDURES | A-1 | ||||||
| APPENDIX B — DESCRIPTION OF RATINGS | B-1 | ||||||
-i-
THE PORTFOLIO'S INVESTMENTS AND STRATEGIES
The Portfolio's prospectus describes the investment objective, principal investment strategies and principal risks associated with the Portfolio. The Portfolio may engage in a variety of investment strategies and invest in a variety of securities and other instruments. The following table summarizes the permissible investments for the Portfolio. The table excludes investments that the Portfolio may make solely for temporary defensive purposes. More details about each investment and related risks are provided in the discussion following the table.
| Global Strategist Portfolio | |||||||
| Investments | |||||||
| ADRs | x | ||||||
| Agencies | x | ||||||
| Asset-Backed Securities | x | ||||||
| Borrowing | x | ||||||
| Brady Bonds | x | ||||||
| Cash Equivalents | x | ||||||
| Commercial Paper | x | ||||||
| Common Stock | x | ||||||
| Convertibles | x | ||||||
| Corporates | x | ||||||
| Depositary Receipts | x | ||||||
| Derivatives | x | ||||||
| Emerging Market Securities | x | ||||||
| Equity Securities | x | ||||||
| Fixed Income Securities | x | ||||||
| Floaters | x | ||||||
| Foreign Currency | x | ||||||
| Foreign Securities | x | ||||||
| Forwards | x | ||||||
| Futures Contracts | x | ||||||
| High Yield Securities | x | ||||||
1
| Global Strategist Portfolio | |||||||
| Inverse Floaters | x | ||||||
| Investment Companies | x | ||||||
| Investment Funds | x | ||||||
| Investment Grade Securities | x | ||||||
| Limited Partnership Interests | x | ||||||
| Loan Participations and Assignments | x | ||||||
| Mortgage Related Securities | x | ||||||
| —Mortgage-Backed Securities | x | ||||||
| —Collateralized Mortgage Obligations | x | ||||||
| —Stripped Mortgage-Backed Securities | x | ||||||
| —Commercial Mortgage-Backed Securities | x | ||||||
| Non-Publicly Traded Securities, Private Placements and Restricted Securities | x | ||||||
| Options | x | ||||||
| Private Investments in Public Equity | x | ||||||
| Preferred Stock | x | ||||||
| Real Estate Investment Trusts | x | ||||||
| Repurchase Agreements | x | ||||||
| Reverse Repurchase Agreements | x | ||||||
| Rights | x | ||||||
| Securities Lending | x | ||||||
| Short Selling | x | ||||||
| Structured Investments | x | ||||||
| Swaps | x | ||||||
| U.S. Government Securities | x | ||||||
| Warrants | x | ||||||
2
| Global Strategist Portfolio | |||||||
| When-Issued and Delayed Delivery Securities and Forward Commitments | x | ||||||
| When, As and If Issued Securities | x | ||||||
| Yankee and Eurobond Obligations | x | ||||||
| Zero Coupons | x | ||||||
3
INVESTMENTS AND RISKS
Morgan Stanley Investment Management Inc. is the adviser (the "Adviser") to the Fund.
ADRs: American Depositary Receipts ("ADRs") are dollar-denominated securities which are listed and traded in the United States, but which represent claims to shares of foreign stocks. They are treated as U.S. equity securities for purposes of the Portfolio's investment policies. ADRs may be either sponsored or unsponsored. Sponsored ADRs are established jointly by a depositary and the underlying issuer, whereas unsponsored ADRs may be established by a depositary without participation by the underlying issuer. Holders of unsponsored ADRs generally bear all the costs associated with establishing unsponsored ADRs. In addition, the issuers of the securities underlying unsponsored ADRs are not obligated to disclose material information in the United States and, therefore, there may be less information available regarding such issuers and there may not be a correlation between such information and the market value of the ADRs. ADRs also include American Depositary Shares.
Agencies: Agencies are fixed income securities issued or guaranteed by federal agencies and U.S. Government sponsored instrumentalities. They may or may not be backed by the full faith and credit of the U.S. Government. If they are not backed by the full faith and credit of the United States, the investor must look principally to the agency or instrumentality issuing or guaranteeing the obligation for ultimate repayment, and may not be able to assert a claim against the United States itself in the event the agency or instrumentality does not meet its commitment. Agencies which are backed by the full faith and credit of the United States include the Export-Import Bank, Farmers Home Administration, Federal Financing Bank and others. Certain debt issued by Resolution Funding Corporation has both its principal and interest backed by the full faith and credit of the U.S. Treasury in that its principal is defeased by U.S. Treasury zero coupon issues, while the U.S. Treasury is explicitly required to advance funds sufficient to pay interest on it, if needed. Certain agencies and instrumentalities, such as the Government National Mortgage Association ("Ginnie Mae"), are, in effect, backed by the full faith and credit of the United States through provisions in their charters that they may make "indefinite and unlimited" drawings on the Treasury if needed to service its debt. Debt from certain other agencies and instrumentalities, including the Federal Home Loan Mortgage Corporation ("Freddie Mac") and the Federal National Mortgage Association ("Fannie Mae"), are not guaranteed by the United States, but those institutions are protected by the discretionary authority of the U.S. Treasury to purchase certain amounts of their securities to assist them in meeting their debt obligations. Finally, other agencies and instrumentalities, such as the Farm Credit System, are federally chartered institutions under U.S. Government supervision, but their debt securities are backed only by the credit worthiness of those institutions, not the U.S. Government. Some of the U.S. Government agencies that issue or guarantee securities include the Export-Import Bank of the United States, Farmers Home Administration, Federal Housing Administration, Maritime Administration, Small Business Administration and The Tennessee Valley Authority.
In September 2008, the U.S. Treasury Department announced that the government would be taking over Fannie Mae and Freddie Mac and placing the companies into a conservatorship. In addition, the U.S. Treasury announced additional steps that it intended to take with respect to the debt and mortgage-backed securities issued by Fannie Mae and Freddie Mac in order to support the conservatorship. No assurance can be given that these initiatives will be successful. The maximum potential liability of the issuers of some U.S. government securities held by the Portfolio may greatly exceed their current resources, including their legal right to support from the U.S. Treasury. It is possible that these issuers will not have the funds to meet their payment obligations in the future.
An instrumentality of the U.S. Government is a government agency organized under federal charter with government supervision. Instrumentalities issuing or guaranteeing securities include, among others, Federal Home Loan Banks, the Federal Land Banks, Central Bank for Cooperatives, Federal Intermediate Credit Banks and Fannie Mae.
Asset-Backed Securities: The Portfolio may invest in asset-backed securities. Asset-backed securities utilize the securitization techniques used to develop mortgage-backed securities. These techniques are also applied to a broad range of other assets. Various types of assets, primarily automobile and credit card receivables and home equity loans, are being securitized in pass-through structures similar to the mortgage pass-through structures. These types of securities are known as asset-backed securities. The Portfolio may invest in any type of asset-backed security. Asset-backed securities have risk characteristics similar to mortgage-backed securities.
4
Like mortgage-backed securities, they generally decrease in value as a result of interest rate increases, but may benefit less than other fixed-income securities from declining interest rates, principally because of prepayments. Also, as in the case of mortgage-backed securities, prepayments generally increase during a period of declining interest rates although other factors, such as changes in credit use and payment patterns, may also influence prepayment rates. Asset-backed securities also involve the risk that various federal and state consumer laws and other legal, regulatory and economic factors may result in the collateral backing the securities being insufficient to support payment on the securities.
Borrowing: The Portfolio is permitted to borrow money from banks in accordance with the Investment Company Act of 1940, as amended (the "1940 Act"), or the rules and regulations promulgated by the United States Securities and Exchange Commission ("SEC") thereunder. Currently, the 1940 Act permits a fund to borrow money from banks in an amount up to 331/3% of its total assets (including the amount borrowed) less its liabilities (not including any borrowings but including the fair market value at the time of computation of any other senior securities then outstanding). The Portfolio may also borrow an additional 5% of its total assets without regard to the foregoing limitation for temporary purposes such as clearance of portfolio transactions. The Portfolio will only borrow when the Adviser believes that such borrowings will benefit the Portfolio after taking into account considerations such as interest income and possible gains or losses upon liquidation. The Portfolio will maintain asset coverage in accordance with the 1940 Act.
Borrowing by the Portfolio creates an opportunity for increased net income but, at the same time, creates special risks. For example, leveraging may exaggerate changes in and increase the volatility of the net asset value of Portfolio shares. This is because leverage tends to exaggerate the effect of any increase or decrease in the value of the Portfolio's portfolio securities. The use of leverage also may cause the Portfolio to liquidate portfolio positions when it may not be advantageous to do so to satisfy its obligations or to maintain asset coverage.
In general, the Portfolio may not issue any class of senior security, except that the Portfolio may (i) borrow from banks, provided that immediately following any such borrowing there is an asset coverage of at least 300% for all Portfolio borrowings and in the event such asset coverage falls below 300% the Portfolio will within three days or such longer period as the SEC may prescribe by rules and regulations, reduce the amount of its borrowings to an extent that the asset coverage of such borrowings shall be at least 300%, and (ii) engage in trading practices which could be deemed to involve the issuance of a senior security, including but not limited to options, futures, forward contracts and reverse repurchase agreements, provided that the Portfolio earmarks or segregates liquid assets in accordance with applicable SEC regulations and interpretations.
Brady Bonds: Brady Bonds are both Emerging Market Securities and Foreign Fixed Income Securities. They are created by exchanging existing commercial bank loans to foreign entities for new obligations for the purpose of restructuring the issuers' debts under a plan introduced by former U.S. Secretary of the Treasury, Nicholas F. Brady (the "Brady Plan"). They may be collateralized or uncollateralized and issued in various currencies (although most are dollar-denominated). They are actively traded in the over-the-counter secondary market. The Portfolio will only invest in Brady Bonds consistent with its quality specifications.
Dollar-denominated, collateralized Brady Bonds may be fixed rate par bonds or floating rate discount bonds. These Brady Bonds are generally collateralized in full as to principal due at maturity by U.S. Treasury Zero Coupon Obligations having the same maturity as the Brady Bonds. Interest payments on these Brady Bonds generally are collateralized by cash or securities in an amount that, in the case of fixed rate bonds, is equal to at least one year of rolling interest payments or, in the case of floating rate bonds, initially is equal to at least one year's rolling interest payments based on the applicable interest rate at that time and is adjusted at regular intervals thereafter. Certain Brady Bonds are entitled to "value recovery payments" in certain circumstances, which in effect constitute supplemental interest payments but generally are not collateralized.
Brady Bonds are often viewed as having three or four valuation components: (i) the collateralized repayment of principal at final maturity; (ii) the collateralized interest payments; (iii) the uncollateralized interest payments; and (iv) any uncollateralized repayment of principal at maturity (these uncollateralized amounts constitute the "residual risk"). In the event of a default with respect to collateralized Brady Bonds as a result of which the payment obligations of the issuer are accelerated, the U.S. Treasury Zero Coupon Obligations held as collateral for
5
the payment of principal will not be distributed to investors, nor will such obligations be sold and the proceeds distributed. The collateral will be held by the collateral agent to the scheduled maturity of the defaulted Brady Bonds, which will continue to be outstanding, at which time the face amount of the collateral will equal the principal payments due on the Brady Bonds in the normal course. However, Brady Bonds should be viewed as speculative in light of the history of defaults with respect to commercial bank loans by public and private entities of countries issuing Brady Bonds.
Cash Equivalents: Cash equivalents are short-term fixed income securities comprising:
(1) Time deposits, certificates of deposit (including marketable variable rate certificates of deposit) and bankers' acceptances issued by a commercial bank or savings and loan association. Time deposits are non-negotiable deposits maintained in a banking institution for a specified period of time at a stated interest rate. Certificates of deposit are negotiable short-term obligations issued by commercial banks or savings and loan associations against funds deposited in the issuing institution. Variable rate certificates of deposit are certificates of deposit on which the interest rate is periodically adjusted prior to their stated maturity based upon a specified market rate. A bankers' acceptance is a time draft drawn on a commercial bank by a borrower, usually in connection with an international commercial transaction (to finance the import, export, transfer or storage of goods).
The Portfolio may invest in obligations of U.S. banks, foreign branches of U.S. banks (Eurodollars) and U.S. branches of foreign banks (Yankee dollars). Euro and Yankee dollar investments will involve some of the same risks of investing in international securities that are discussed in various foreign investing sections of this SAI.
The Portfolio will not invest in any security issued by a commercial bank unless (i) the bank has total assets of at least $1 billion, or the equivalent in other currencies, or, in the case of domestic banks which do not have total assets of at least $1 billion, the aggregate investment made in any one such bank is limited to $250,000 principal amount per certificate (a temporary increase from $100,000, which is due to expire on December 31, 2013) and the principal amount of such investment is insured in full by the Federal Deposit Insurance Corporation ("FDIC"), (ii) in the case of U.S. banks, it is a member of the FDIC and (iii) in the case of foreign branches of U.S. banks, the security is deemed by the Adviser to be of an investment quality comparable with other debt securities which the Portfolio may purchase.
(2) The Portfolio may invest in commercial paper (see below) rated at time of purchase by one or more nationally recognized statistical rating organizations ("NRSRO") in one of their two highest categories (e.g., A-l or A-2 by Standard & Poor's Ratings Group, a division of The McGraw-Hill Companies, Inc. ("Standard & Poor's") or Prime 1 or Prime 2 by Moody's Investors Service, Inc. ("Moody's")) or, if not rated, issued by a corporation having an outstanding unsecured debt issue rated high-grade by a NRSRO (e.g., A or better by Moody's, Standard & Poor's or Fitch IBCA, Inc. ("Fitch"));
(3) Short-term corporate obligations rated high-grade at the time of purchase by a NRSRO (e.g., A or better by Moody's, Standard & Poor's or Fitch);
(4) U.S. Government obligations including bills, notes, bonds and other debt securities issued by the U.S. Treasury. These are direct obligations of the U.S. Government and differ mainly in interest rates, maturities and dates of issue;
(5) Government Agency securities issued or guaranteed by U.S. Government sponsored instrumentalities and Federal agencies. These include securities issued by the Federal Home Loan Banks, Federal Land Bank, Farmers Home Administration, Farm Credit Banks, Federal Intermediate Credit Bank, Fannie Mae, Federal Financing Bank, the Tennessee Valley Authority and others; and
(6) Repurchase agreements collateralized by the securities listed above.
Commercial Paper. Commercial paper refers to short-term fixed income securities with maturities ranging from 1 to 270 days. They are primarily issued by corporations needing to finance large amounts of receivables, but may be issued by banks and other borrowers. Commercial paper is issued either directly or through broker-dealers,
6
and may be discounted or interest-bearing. Commercial paper is unsecured, but is almost always backed by bank lines of credit. Virtually all commercial paper is rated by Moody's or Standard & Poor's.
Commercial paper rated A-1 by Standard & Poor's has the following characteristics: (1) liquidity ratios are adequate to meet cash requirements; (2) long-term senior debt is rated "A" or better; (3) the issuer has access to at least two additional channels of borrowing; (4) basic earnings and cash flow have an upward trend with allowance made for unusual circumstances; (5) typically, the issuer's industry is well established and the issuer has a strong position within the industry; and (6) the reliability and quality of management are unquestioned. Relative strength or weakness of the above factors determine whether the issuer's commercial paper is A-1, A-2 or A-3.
The rating Prime-1 is the highest commercial paper rating assigned by Moody's. Among the factors considered by Moody's in assigning ratings are the following: (1) evaluation of the management of the issuer; (2) economic evaluation of the issuer's industry or industries and the appraisal of speculative-type risks which may be inherent in certain areas; (3) evaluation of the issuer's products in relation to competition and customer acceptance; (4) liquidity; (5) amount and quality of long-term debt; (6) trend of earnings over a period of ten years; (7) financial strength of a parent company and the relationships that exist with the issuer; and (8) recognition by the management of obligations which may be present or may arise as a result of public interest questions and preparations to meet such obligations.
Commercial Paper: See Cash Equivalents.
Common Stock: Common stocks are equity securities representing an ownership interest in a corporation, entitling the shareholder to voting rights and receipt of dividends paid based on proportionate ownership.
Convertibles: A convertible security is a bond, debenture, note, preferred stock, right, warrant or other security that may be converted into or exchanged for a prescribed amount of common stock or other security of the same or a different issuer or into cash within a particular period of time at a specified price or formula. A convertible security generally entitles the holder to receive interest paid or accrued on debt securities or the dividend paid on preferred stock until the convertible security matures or is redeemed, converted or exchanged. Before conversion, convertible securities generally have characteristics similar to both debt and equity securities. The value of convertible securities tends to decline as interest rates rise and, because of the conversion feature, tends to vary with fluctuations in the market value of the underlying securities. Convertible securities ordinarily provide a stream of income with generally higher yields than those of common stock of the same or similar issuers. Convertible securities generally rank senior to common stock in a corporation's capital structure but are usually subordinated to comparable nonconvertible securities. Convertible securities generally do not participate directly in any dividend increases or decreases of the underlying securities although the market prices of convertible securities may be affected by any dividend changes or other changes in the underlying securities. Certain of the convertible securities in which the Portfolio may invest are rated below investment grade or are unrated. The prices of such securities are likely to be more sensitive to adverse economic changes, resulting in increased volatility of market prices of these securities during periods of economic uncertainty, or adverse individual corporate developments, than higher-rated securities. In addition, during an economic downturn or substantial period of rising interest rates, lower rated issuers may experience financial stress.
Corporates: Corporate bonds ("Corporates") are fixed income securities issued by private corporations. Bondholders, as creditors, have a prior legal claim over common and preferred stockholders of the corporation as to both income and assets for the principal and interest due to the bondholder. The Portfolio will buy Corporates subject to any quality constraints. If the Portfolio holds a security that is downgraded, the Portfolio may retain the security if the Adviser deems retention of the security to be in the best interests of the Portfolio.
Depositary Receipts: Depositary receipts are Global Depositary Receipts ("GDRs"), European Depositary Receipts ("EDRs") and other similar types of depositary shares. Depositary receipts are securities that can be traded in U.S. or foreign securities markets but which represent ownership interests in a security or pool of securities by a foreign or U.S. corporation. Depositary receipts may be sponsored or unsponsored. The depositary of unsponsored depositary receipts may provide less information to receipt holders.
7
Holders of unsponsored GDRs and EDRs generally bear all the costs associated with establishing the unsponsored GDRs and EDRs. The depositary of unsponsored GDRs and EDRs is under no obligation to distribute shareholder communications received from the underlying issuer or to pass through to the holders of the unsponsored GDRs and EDRs voting rights with respect to the deposited securities or pool of securities. GDRs and EDRs are not necessarily denominated in the same currency as the underlying securities to which they may be connected. Generally, GDRs or EDRs in registered form are designed for use in the U.S. securities market and GDRs or EDRs in bearer form are designed for use in securities markets outside the United States. The Portfolio may invest in sponsored and unsponsored GDRs and EDRs. For purposes of the Fund's investment policies, the Portfolio's investments in GDRs or EDRs will be deemed to be investments in the underlying securities.
Derivatives: The Portfolio may, but is not required to, use various derivatives and related investment strategies as described below. Derivatives may be used for a variety of purposes including hedging, risk management, portfolio management or to earn income. Any or all of the investment techniques described herein may be used at any time and there is no particular strategy that dictates the use of one technique rather than another, as the use of any derivative by the Portfolio is a function of numerous variables, including market conditions. The Portfolio complies with applicable regulatory requirements when using derivatives, including the segregation or earmarking of cash or liquid assets when mandated by SEC rules or SEC staff positions. Although the Adviser seeks to use derivatives to further the Portfolio's investment objective, no assurance can be given that the use of derivatives will achieve this result.
General Risks of Derivatives. Derivatives utilized by the Portfolio may involve the purchase and sale of derivative instruments. A derivative is a financial instrument the value of which depends upon (or derives from) the value of another asset, security, interest rate or index. Derivatives may relate to a wide variety of underlying instruments, including equity and debt securities, indexes, interest rates, currencies and other assets. Certain derivative instruments which the Portfolio may use and the risks of those instruments are described in further detail below. The Portfolio may in the future also utilize derivatives techniques, instruments and strategies that may be newly developed or permitted as a result of regulatory changes, consistent with the Portfolio's investment objective and policies. Such newly developed techniques, instruments and strategies may involve risks different than or in addition to those described herein. No assurance can be given that any derivatives strategy employed by the Portfolio will be successful.
The risks associated with the use of derivatives are different from, and possibly greater than, the risks associated with investing directly in the instruments underlying such derivatives. Derivatives are highly specialized instruments that require investment techniques and risk analyses different from other portfolio investments. The use of derivative instruments requires an understanding not only of the underlying instrument but also of the derivative itself. Certain risk factors generally applicable to derivative transactions are described below.
• Derivatives are subject to the risk that the market value of the derivative itself or the market value of underlying instruments will change in a way adverse to the Portfolio's interests. The Portfolio bears the risk that the Adviser may incorrectly forecast future market trends and other financial or economic factors or the value of the underlying security, index, interest rate or currency when establishing a derivatives position for the Portfolio.
• Derivatives may be subject to pricing risk, which exists when a derivative becomes extraordinarily expensive (or inexpensive) relative to historical prices or corresponding instruments. Under such market conditions, it may not be economically feasible to initiate a transaction or liquidate a position at an advantageous time or price.
• Many derivatives are complex and often valued subjectively. Improper valuations can result in increased payment requirements to counterparties or a loss of value to the Portfolio.
• Using derivatives as a hedge against a portfolio investment subjects the Portfolio to the risk that the derivative will have imperfect correlation with the portfolio investment, which could result in the Portfolio incurring substantial losses. This correlation risk may be greater in the case of derivatives based on an index or other basket of securities, as the portfolio securities being hedged may not duplicate the components of the underlying index or the basket may not be of exactly the same type of obligation as
8
those underlying the derivative. The use of derivatives for "cross hedging" purposes (using a derivative based on one instrument as a hedge on a different instrument) may also involve greater correlation risks.
• While using derivatives for hedging purposes can reduce the Portfolio's risk of loss, it may also limit the Portfolio's opportunity for gains or result in losses by offsetting or limiting the Portfolio's ability to participate in favorable price movements in portfolio investments.
• Derivatives transactions for non-hedging purposes involve greater risks and may result in losses which would not be offset by increases in the value of portfolio securities or declines in the cost of securities to be acquired. In the event that the Portfolio enters into a derivatives transaction as an alternative to purchasing or selling the underlying instrument or in order to obtain desired exposure to an index or market, the Portfolio will be exposed to the same risks as are incurred in purchasing or selling the underlying instruments directly.
• The use of certain derivatives transactions involves the risk of loss resulting from the insolvency or bankruptcy of the counterparty to the contract or the failure by the counterparty to make required payments or otherwise comply with the terms of the contract. In the event of default by a counterparty, the Portfolio may have contractual remedies pursuant to the agreements related to the transaction.
• Liquidity risk exists when a particular derivative is difficult to purchase or sell. If a derivative transaction is particularly large or if the relevant market is illiquid, the Portfolio may be unable to initiate a transaction or liquidate a position at an advantageous time or price.
• Certain derivatives transactions are not entered into or traded on exchanges or in markets regulated by the U.S. Commodity Futures Trading Commission ("CFTC") or the SEC. Instead, such over-the-counter ("OTC") derivatives are entered into directly by the Portfolio and a counterparty and may be traded only through financial institutions acting as market makers. OTC derivatives transactions can only be entered into with a willing counterparty that is approved by the Adviser in accordance with guidelines established by the Board. Where no such counterparty is available, the Portfolio will be unable to enter into a desired OTC transaction. There also may be greater risk that no liquid secondary market in the trading of OTC derivatives will exist, in which case the Portfolio may be required to hold such instruments until exercise, expiration or maturity. Many of the protections afforded to exchange participants are not available to participants in OTC derivatives transactions. OTC derivatives transactions are not subject to the guarantee of an exchange or clearinghouse and, as a result, the Portfolio would bear greater risk of default by the counterparties to such transactions.
• The Portfolio may be required to make physical delivery of portfolio securities underlying a derivative in order to close out a derivatives position or to sell portfolio securities at a time or price at which it may be disadvantageous to do so in order to obtain cash to close out or to maintain a derivatives position.
• As a result of the structure of certain derivatives, adverse changes in the value of the underlying instrument can result in losses substantially greater than the amount invested in the derivative itself. Certain derivatives have the potential for unlimited loss, regardless of the size of the initial investment.
• Certain derivatives may be considered illiquid and therefore subject to the Portfolio's limitation on investments in illiquid securities.
• Derivatives transactions conducted outside the United States may not be conducted in the same manner as those entered into on U.S. exchanges, and may be subject to different margin, exercise, settlement or expiration procedures. Brokerage commissions, clearing costs and other transaction costs may be higher on foreign exchanges. Many of the risks of OTC derivatives transactions are also applicable to derivatives transactions conducted outside the United States. Derivatives transactions conducted outside the United States are subject to the risk of governmental action affecting the trading in, or the prices of, foreign securities, currencies and other instruments. The value of such positions could be adversely affected by foreign political and economic factors; lesser availability of data on which to make trading decisions; delays on the Portfolio's ability to act upon economic events occurring in foreign markets; and less liquidity than U.S. markets.
• Currency derivatives are subject to additional risks. Currency derivatives transactions may be negatively affected by government exchange controls, blockages and manipulations. Currency exchange rates may be influenced by factors extrinsic to a country's economy. There is no systematic reporting of last sale
9
information with respect to foreign currencies. As a result, the available information on which trading in currency derivatives will be based may not be as complete as comparable data for other transactions. Events could occur in the foreign currency market which will not be reflected in currency derivatives until the following day, making it more difficult for the Portfolio to respond to such events in a timely manner.
Regulatory Matters. As described herein, the Portfolio may be required to cover its potential economic exposure to certain derivatives transactions by holding an offsetting financial position and/or segregating or earmarking cash or liquid assets equal in value to the Portfolio's potential economic exposure under the transaction. The Portfolio will cover such transactions as described herein or in such other manner in accordance with applicable laws and regulations. Assets used to cover derivatives transactions cannot be sold while the derivatives position is open, unless they are replaced by other appropriate assets. Segregated or earmarked cash or liquid assets and assets held in margin accounts are not otherwise available to the Portfolio for investment purposes. If a large portion of the Portfolio's assets are used to cover derivatives transactions or are otherwise segregated or earmarked, it could affect portfolio management or the Portfolio's ability to meet redemption requests or other current obligations. With respect to derivatives which are cash settled (i.e., have no physical delivery requirement), the Portfolio is permitted to set aside liquid assets in an amount equal to the Portfolio's daily marked-to-market net obligations (i.e., the Portfolio's daily net liability) under the derivative, if any, rather than the derivative's full notional value or the market value of the instrument underlying the derivative, as applicable. By setting aside assets equal to only its net obligations under cash-settled derivatives, the Portfolio will have the ability to employ leverage to a greater extent than if the Portfolio were required to segregate assets equal to the full notional amount of the derivative or the market value of the underlying instrument, as applicable.
Regulatory developments affecting the exchange-traded and OTC derivatives markets may impair the Portfolio's ability to manage or hedge its investment portfolio through the use of derivatives. The Dodd-Frank Wall Street Reform and Consumer Protection Act (the "Dodd-Frank Act") and the rules promulgated thereunder may limit the ability of the Portfolio to enter into one or more exchange-traded or OTC derivatives transactions. In particular, pursuant to authority granted under the Dodd-Frank Act, the CFTC in October 2011 promulgated final rules that impose new federal position limits on listed futures and options contracts on, and economically equivalent OTC derivatives referencing, 28 individual agricultural, metal and energy commodities. The Portfolio's futures and options positions in these 28 contracts will be aggregated with its positions, if any, in economically equivalent OTC derivatives referencing these contracts. These new position limits, which will be imposed on the Portfolio and its counterparties, may impact the Portfolio's ability to invest in futures, options and swaps in a manner that efficiently meets its investment objective. Derivatives positions of all investment companies advised by the Adviser are combined for purposes of these limits. An exchange may order the liquidation of positions found to be in excess of these limits and may impose certain other sanctions or restrictions.
The Portfolio's use of derivatives may be limited by the requirements of the Internal Revenue Code of 1986, as amended (the "Code"), for qualification as a regulated investment company for U.S. federal income tax purposes.
In February 2012, the CFTC adopted certain regulatory changes that may impact the Fund by subjecting the Adviser to registration with the CFTC as the commodity pool operator ("CPO") of the Portfolio, unless the Portfolio is able to comply with certain trading and marketing limitations on its investments in futures and certain other instruments. If the Adviser becomes subject to CFTC registration as a CPO, the disclosure and operations of the Portfolio would need to comply with all applicable CFTC regulations. Compliance with these additional registration and regulatory requirements would increase Portfolio expenses.
Emerging Market Securities: The Portfolio may invest in emerging market securities. An emerging market security is one issued by a foreign government or private issuer that has one or more of the following characteristics: (i) its principal securities trading market is in an emerging market or developing country, (ii) alone or on a consolidated basis it derives 50% or more of its annual revenue from goods produced, sales made or services performed in an emerging market or (iii) it is organized under the laws of, or has a principal office in, an emerging market or developing country. Based on these criteria it is possible for a security to be considered issued by an issuer in more than one country. Therefore, it is possible for the securities of any issuer that has one or more
10
of these characteristics in connection with any emerging market or developing country not to be considered an emerging market security if it has one or more of these characteristics in connection with a developed country.
Emerging market describes any country which is generally considered to be an emerging or developing country by major organizations in the international financial community, such as the International Bank for Reconstruction and Development (more commonly known as the World Bank) and the International Finance Corporation. Emerging markets can include every nation in the world except the United States, Canada, Japan, Australia, New Zealand and most nations located in Western Europe.
The economies of individual emerging market or developing countries may differ favorably or unfavorably from the U.S. economy in such respects as growth of gross domestic product, rate of inflation, currency depreciation, capital reinvestment, resource self-sufficiency and balance of payments position. Further, the economies of developing countries generally are heavily dependent upon international trade and, accordingly, have been, and may continue to be, adversely affected by trade barriers, exchange controls, managed adjustments in relative currency values and other protectionist measures. These economies also have been, and may continue to be, adversely affected by economic conditions in the countries with which they trade.
Prior governmental approval for foreign investments may be required under certain circumstances in some emerging market or developing countries, and the extent of foreign investment in certain fixed income securities and domestic companies may be subject to limitations in other emerging market or developing countries. Foreign ownership limitations also may be imposed by the charters of individual companies in emerging market or developing countries to prevent, among other concerns, violation of foreign investment limitations. Repatriation of investment income, capital and the proceeds of sales by foreign investors may require governmental registration and/or approval in some emerging countries. The Portfolio could be adversely affected by delays in, or a refusal to grant, any required governmental registration or approval for such repatriation. Any investment subject to such repatriation controls will be considered illiquid if it appears reasonably likely that this process will take more than seven days.
Investment in emerging market or developing countries may entail purchasing securities issued by or on behalf of entities that are insolvent, bankrupt, in default or otherwise engaged in an attempt to reorganize or reschedule their obligations, and in entities that have little or no proven credit rating or credit history. In any such case, the issuer's poor or deteriorating financial condition may increase the likelihood that the investing Portfolio will experience losses or diminution in available gains due to bankruptcy, insolvency or fraud. Emerging market or developing countries also pose the risk of nationalization, expropriation or confiscatory taxation, political changes, government regulation, social instability or diplomatic developments (including war) that could adversely affect the economies of such countries or the value of the Portfolio's investments in those countries. In addition, it may be difficult to obtain and enforce a judgment in a court outside the United States.
The Portfolio may also be exposed to an extra degree of custodial and/or market risk, especially where the securities purchased are not traded on an official exchange or where ownership records regarding the securities are maintained by an unregulated entity (or even the issuer itself).
Equity Securities: Equity securities generally represent an ownership interest in an issuer, or may be convertible into or represent a right to acquire an ownership interest in an issuer. While there are many types of equity securities, prices of all equity securities will fluctuate. Economic, political and other events may affect the prices of broad equity markets. For example, changes in inflation or consumer demand may affect the prices of equity securities generally in the United States. Similar events also may affect the prices of particular equity securities. For example, news about the success or failure of a new product may affect the price of a particular issuer's equity securities. Equity securities include the following types of instruments, each of which is described in this SAI: ADRs, Common Stock, Convertibles, Investment Companies, Preferred Stock, Limited Partnership Interests, Rights and Warrants.
Fixed Income Securities: Fixed income securities generally represent an issuer's obligation to repay to the investor (or lender) the amount borrowed plus interest over a specified time period. A typical fixed income security
11
specifies a fixed date when the amount borrowed (principal) is due in full, known as the maturity date, and specifies dates when periodic interest (coupon) payments will be made over the life of the security.
Fixed income securities come in many varieties and may differ in the way that interest is calculated, the amount and frequency of payments, the type of collateral, if any, and the presence of special features (e.g., conversion rights). Prices of fixed income securities fluctuate and, in particular, are subject to several key risks including, but not limited to, interest rate risk, credit risk, prepayment risk, and spread risk. Fixed income securities include the following types of instruments, each of which is described in this SAI: Agencies, Asset-Backed Securities, Cash Equivalents, Convertibles, Corporates, Floaters, High Yield Securities, Inverse Floaters, Loan Participations and Assignments, Mortgage Related Securities, Preferred Stock, Repurchase Agreements, U.S. Government Securities, When, As and If Issued Securities, When-Issued and Delayed Delivery Securities and Forward Commitments, Yankee and Eurobond Obligations and Zero Coupons.
Interest rate risk arises due to general changes in the level of market rates after the purchase of a fixed income security. Generally, the values of fixed income securities vary inversely with changes in interest rates. During periods of falling interest rates, the values of most outstanding fixed income securities generally rise and during periods of rising interest rates, the values of most fixed income securities generally decline. While fixed income securities with longer final maturities often have higher yields than those with shorter maturities, they usually possess greater price sensitivity to changes in interest rates and other factors. Traditionally, the remaining term to maturity has been used as a barometer of a fixed income security's sensitivity to interest rate changes. This measure, however, considers only the time until the final principal payment and takes no account of the pattern or amount of principal or interest payments prior to maturity. Duration combines consideration of yield, coupon, interest and principal payments, final maturity, and call (prepayment) features. Duration measures the likely percentage change in a fixed income security's price for a small parallel shift in the general level of interest rates; it is also an estimate of the weighted average life of the remaining cash flows of a fixed income security. In almost all cases, the duration of a fixed income security is shorter than its term to maturity.
Credit risk, also known as default risk, represents the possibility that an issuer may be unable to meet scheduled interest and principal payment obligations. It is most often associated with corporate bonds, although it can be present in other fixed income securities, as well (note that the market generally assumes that obligations of the U.S. Treasury are free from credit risk). Credit ratings and quantitative models attempt to measure the degree of credit risk in fixed income securities, and provide insight as to whether prevailing yield spreads afford sufficient compensation for such risk. Other things being equal, fixed income securities with high degrees of credit risk should trade in the market at lower prices (and higher yields) than fixed income securities with low degrees of credit risk.
Prepayment risk, also known as call risk, arises due to the issuer's ability to prepay all or most of the fixed income security prior to the stated final maturity date. Prepayments generally rise in response to a decline in interest rates as debtors take advantage of the opportunity to refinance their obligations. This risk is often associated with mortgage securities where the underlying mortgage loans can be refinanced, although it can also be present in corporate or other types of bonds with call provisions. When a prepayment occurs, the Portfolio may be forced to reinvest in lower yielding fixed income securities. Quantitative models are designed to help assess the degree of prepayment risk, and provide insight as to whether prevailing yield spreads afford sufficient compensation for such risk.
Spread risk is the potential for the value of the Portfolio's assets to fall due to the widening of spreads. Fixed income securities generally compensate for greater credit risk by paying interest at a higher rate. The difference (or "spread") between the yield of a security and the yield of a benchmark, such as a U.S. Treasury security with a comparable maturity, measures the additional interest paid for credit risk. As the spread on a security widens (or increases), the price (or value) of the security falls. Spread widening may occur, among other reasons, as a result of market concerns over the stability of the market, excess supply, general credit concerns in other markets, security- or market-specific credit concerns or general reductions in risk tolerance.
Economic, political and other events also may affect the prices of broad fixed income markets, although the risks associated with such events are transmitted to the market via changes in the prevailing levels of interest rates, credit risk, prepayment risk or spread risk.
12
Floaters: Floaters are fixed income securities with a floating or variable rate of interest, i.e., the rate of interest varies with changes in specified market rates or indices, such as the prime rate, or at specified intervals. Certain floating or variable rate obligations may carry a demand feature that permits the holder to tender them back to the issuer of the underlying instrument, or to a third party, at par value prior to maturity. When the demand feature of certain floating or variable rate obligations represents an obligation of a foreign entity, the demand feature will be subject to certain risks discussed under the various foreign investing sections.
Foreign Currency: The Portfolio may transact security purchases and sales in foreign currencies. The Portfolio may hold foreign currency or purchase or sell currencies on a forward basis. See Forwards, below.
Foreign currency warrants. The Portfolio may invest in foreign currency warrants, which entitle the holder to receive from the issuer an amount of cash (generally, for warrants issued in the United States, in U.S. dollars) which is calculated pursuant to a predetermined formula and based on the exchange rate between a specified foreign currency and the U.S. dollar as of the exercise date of the warrant. Foreign currency warrants generally are exercisable upon their issuance and expire as of a specified date and time.
Foreign currency warrants have been issued in connection with U.S. dollar-denominated debt offerings by major corporate issuers in an attempt to reduce the foreign currency exchange risk which, from the point of view of prospective purchasers of the securities, is inherent in the international fixed income marketplace. Foreign currency warrants may attempt to reduce the foreign exchange risk assumed by purchasers of a security by, for example, providing for a supplemental payment in the event that the U.S. dollar depreciates against the value of a major foreign currency such as the Japanese Yen or the Euro. The formula used to determine the amount payable upon exercise of a foreign currency warrant may make the warrant worthless unless the applicable foreign currency exchange rate moves in a particular direction (e.g., unless the U.S. dollar appreciates or depreciates against the particular foreign currency to which the warrant is linked or indexed). Foreign currency warrants are severable from the debt obligations with which they may be offered, and may be listed on exchanges.
Foreign currency warrants may be exercisable only in certain minimum amounts, and an investor wishing to exercise warrants who possesses less than the minimum number required for exercise may be required either to sell the warrants or to purchase additional warrants, thereby incurring additional transaction costs. In the case of any exercise of warrants, there may be a time delay between the time a holder of warrants gives instructions to exercise and the time the exchange rate relating to exercise is determined, during which time the exchange rate could change significantly, thereby affecting both the market and cash settlement values of the warrants being exercised. The expiration date of the warrants may be accelerated if the warrants should be delisted from an exchange or if their trading should be suspended permanently, which would result in the loss of any remaining "time value" of the warrants (i.e., the difference between the current market value and the exercise value of the warrants), and, in the case where the warrants were "out-of-the-money," in a total loss of the purchase price of the warrants.
Foreign currency warrants are generally unsecured obligations of their issuers and are not standardized foreign currency options issued by the Options Clearing Corporation ("OCC"). Unlike foreign currency options issued by the OCC, the terms of foreign exchange warrants generally will not be amended in the event of governmental or regulatory actions affecting exchange rates or in the event of the imposition of other regulatory controls affecting the international currency markets. The initial public offering price of foreign currency warrants is generally considerably in excess of the price that a commercial user of foreign currencies might pay in the interbank market for a comparable option involving significantly larger amounts of foreign currencies. Foreign currency warrants are subject to complex political or economic factors.
Principal exchange rate linked securities. Principal exchange rate linked securities are debt obligations the principal on which is payable at maturity in an amount that may vary based on the exchange rate between the U.S. dollar and a particular foreign currency at or about that time. The return on "standard" principal exchange rate linked securities is enhanced if the foreign currency to which the security is linked appreciates against the U.S. dollar, and is adversely affected by increases in the foreign exchange value of the U.S. dollar; "reverse" principal exchange rate linked securities are like the "standard" securities, except that their return is enhanced by increases in the value of the U.S. dollar and adversely impacted by increases in the value of foreign currency. Interest payments on the securities are generally made in U.S. dollars at rates that reflect the degree of foreign currency
13
risk assumed or given up by the purchaser of the notes (i.e., at relatively higher interest rates if the purchaser has assumed some of the foreign exchange risk, or relatively lower interest rates if the issuer has assumed some of the foreign exchange risk, based on the expectations of the current market). Principal exchange rate linked securities may in limited cases be subject to acceleration of maturity (generally, not without the consent of the holders of the securities), which may have an adverse impact on the value of the principal payment to be made at maturity.
Performance indexed paper. Performance indexed paper is U.S. dollar-denominated commercial paper the yield of which is linked to certain foreign exchange rate movements. The yield to the investor will be within a range stipulated at the time of purchase of the obligation, generally with a guaranteed minimum rate of return that is below, and a potential maximum rate of return that is above, market yields on U.S. dollar-denominated commercial paper, with both the minimum and maximum rates of return on the investment corresponding to the minimum and maximum values of the spot exchange rate two business days prior to maturity.
Foreign Securities: Foreign securities include Brady Bonds, Depositary Receipts, Emerging Market Securities, Foreign Currency, Foreign Equity Securities (defined below), Foreign Fixed Income Securities (defined below) and Investment Funds. Investing in foreign securities involves certain special risks not typically associated with investing in domestic securities. Since the securities of foreign issuers are frequently denominated in foreign currencies, and since the Portfolio may temporarily hold uninvested reserves in bank deposits in foreign currencies, the Portfolio will be affected favorably or unfavorably by changes in currency rates and in exchange control regulations, and may incur costs in connection with conversions between various currencies. The Portfolio may enter into foreign currency forward exchange contracts to hedge its holdings and commitments against changes in the level of future currency rates. See Forwards, below. Such contracts involve an obligation to purchase or sell a specific currency at a future date at a price set at the time of the contract.
As non-U.S. companies are not generally subject to uniform accounting, auditing and financial reporting standards and practices comparable to those applicable to domestic issuers, there may be less publicly available information about certain foreign securities than about domestic securities. Securities of some foreign issuers are generally less liquid and more volatile than securities of comparable domestic companies. There is generally less government supervision and regulation of stock exchanges, brokers and listed issuers than in the United States. In addition, with respect to certain foreign countries, there is the possibility of expropriation or confiscatory taxation, political or social instability, or diplomatic developments which could affect U.S. investments in those countries.
Although the Portfolio will endeavor to achieve most favorable execution costs in its portfolio transactions, fixed commissions on many foreign exchanges are generally higher than negotiated commissions on U.S. exchanges. In addition, investments in certain foreign markets which have historically been considered stable may become more volatile and subject to increased risk due to ongoing developments and changing conditions in such markets. Moreover, the growing interconnectivity of global economies and financial markets has increased the probability that adverse developments and conditions in one country or region will affect the stability of economies and financial markets in other countries or regions. In addition, it is expected that the expenses for custodian arrangements of the Portfolio's foreign securities will be somewhat greater than the expenses for the custodian arrangements for handling U.S. securities of equal value.
Certain foreign governments levy withholding taxes against dividend and interest income. Although in some countries a portion of these taxes is recoverable, the non-recovered portion of foreign withholding taxes will reduce the income received from investments in such countries. The Portfolio may be able to claim a credit for U.S. tax purposes with respect to any such foreign taxes.
The Adviser considers an issuer to be from a particular country or geographic region if (i) its principal securities trading market is in that country or geographic region; (ii) alone or on a consolidated basis it derives 50% or more of its annual revenue from goods produced, sales made or services performed in that country or geographic region; or (iii) it is organized under the laws of, or has a principal office in, that country or geographic region. By applying these tests, it is possible that a particular company could be deemed to be from more than one country or geographic region.
14
Foreign Equity Securities. Foreign equity securities are equity securities of foreign issuers denominated in foreign currency and traded primarily in non-U.S. markets, including Depositary Receipts.
Foreign Fixed Income Securities. Foreign fixed income securities are fixed income securities which may be U.S. dollar denominated or denominated in a foreign currency, which include: (1) obligations issued or guaranteed by foreign national governments, their agencies, instrumentalities, or political subdivisions; (2) debt securities issued, guaranteed or sponsored by supranational organizations established or supported by several national governments, including the World Bank, the European Community, the Asian Development Bank and others; (3) non-government foreign corporate debt securities; and (4) foreign mortgage securities and various other mortgages and asset-backed securities.
Forwards: A foreign currency forward exchange contract is a negotiated agreement between two parties to exchange specified amounts of two or more currencies at a specified future time at a specified rate. The rate specified by the foreign currency forward exchange contract can be higher or lower than the spot rate between the currencies that are the subject of the contract. Currency futures are similar to foreign currency forward exchange contracts, except that they are traded on an exchange and standardized as to contract size and delivery date. Most currency futures call for payment or delivery in U.S. dollars. Unanticipated changes in currency prices may result in losses to the Portfolio and poorer overall performance for the Portfolio than if it had not entered into foreign currency forward exchange contracts. The Portfolio may enter into foreign currency forward exchange contracts under various circumstances. The typical use of a foreign currency forward exchange contract is to "lock in" the price of a security in U.S. dollars or some other foreign currency, which the Portfolio is holding in its portfolio. By entering into a foreign currency forward exchange contract for the purchase or sale, for a fixed amount of dollars or other currency, of the amount of foreign currency involved in the underlying security transactions, the Portfolio may be able to protect itself against a possible loss resulting from an adverse change in the relationship between the U.S. dollar or other currency which is being used for the security purchase and the foreign currency in which the security is denominated during the period between the date on which the security is purchased or sold and the date on which payment is made or received. The Adviser also may from time to time utilize foreign currency forward exchange contracts for other purposes. For example, they may be used to hedge a foreign security held in the portfolio or a security which pays out principal tied to an exchange rate between the U.S. dollar and a foreign currency, against a decline in value of the applicable foreign currency. They also may be used to lock in the current exchange rate of the currency in which those securities anticipated to be purchased are denominated. At times, the Portfolio may enter into "cross-currency" hedging transactions involving currencies other than those in which securities are held or proposed to be purchased are denominated.
The Portfolio will not enter into foreign currency forward exchange contracts or maintain a net exposure to these contracts where the consummation of the contracts would obligate the Portfolio to deliver an amount of foreign currency in excess of the value of the Portfolio's portfolio securities.
When required by law, the Portfolio will segregate or earmark cash, U.S. government securities or other appropriate liquid portfolio securities in an amount equal to the value of the Portfolio's total assets committed to the consummation of foreign currency forward exchange contracts entered into under the circumstances set forth above. If the value of the securities so earmarked declines, additional cash or securities will be segregated or earmarked on a daily basis so that the value of such securities will equal the amount of the Portfolio's commitments with respect to such contracts.
The Portfolio may be limited in its ability to enter into hedging transactions involving foreign currency forward exchange contracts by the Code requirements relating to qualification as a regulated investment company.
Foreign currency forward exchange contracts may limit gains on portfolio securities that could otherwise be realized had they not been utilized and could result in losses. The contracts also may increase the Portfolio's volatility and may involve a significant amount of risk relative to the investment of cash.
Futures Contracts: A futures contract is a standardized agreement to buy or sell a specific quantity of a commodity at a specific price at a specific future time (the "settlement date"). Futures contracts may be based on, among other things, a specified equity security (securities futures), a specified debt security or reference rate
15
(interest rate futures), the value of a specified securities index (index futures) or the value of a foreign currency (forward contracts and currency futures). The value of a futures contract tends to increase and decrease in tandem with the value of the underlying instrument. The buyer of a futures contract agrees to purchase the underlying instrument on the settlement date and is said to be "long" the contract. The seller of a futures contract agrees to sell the underlying instrument on the settlement date and is said to be "short" the contract. Futures contracts call for settlement only on the expiration date and cannot be "exercised" at any other time during their term.
Depending on the terms of the particular contract, futures contracts are settled through either physical delivery of the underlying instrument on the settlement date (such as in the case of securities futures based on a specified debt security) or by payment of a cash settlement amount on the settlement date (such as in the case of futures contracts relating to interest rates, foreign currencies and broad-based securities indexes). In the case of cash-settled futures contracts, the settlement amount is equal to the difference between the reference instrument's price on the last trading day of the contract and the reference instrument's price at the time the contract was entered into. Most futures contracts, particularly futures contracts requiring physical delivery, are not held until the settlement date, but instead are offset before the settlement date through the establishment of an opposite and equal futures position (buying a contract that had been sold, or selling a contract that had been purchased). All futures transactions are effected through a clearinghouse associated with the exchange on which the futures are traded.
The buyer and seller of a futures contract are not required to deliver or pay for the underlying commodity unless the contract is held until the settlement date. However, both the buyer and seller are required to deposit "initial margin" with a futures commission merchant when the futures contract is entered into. Initial margin deposits are typically calculated as a percentage of the contract's market value. If the value of either party's position declines, the party will be required to make additional "variation margin" payments to settle the change in value on a daily basis. The process is known as "marking-to-market." Upon the closing of a futures position through the establishment of an offsetting position, a final determination of variation margin will be made and additional cash will be paid by or released to the Portfolio.
In addition, the Portfolio may be required to maintain segregated cash or liquid assets in order to cover futures transactions. The Portfolio will segregate or earmark cash or liquid assets in an amount equal to the difference between the market value of a futures contract entered into by the Portfolio and the aggregate value of the initial and variation margin payments made by the Portfolio with respect to such contract or as otherwise permitted by SEC rules or SEC staff positions. See "Regulatory Matters" above.
Additional Risks of Futures Transactions. The risks associated with futures contract transactions are different from, and possibly greater than, the risks associated with investing directly in the underlying instruments. Futures are highly specialized instruments that require investment techniques and risk analyses different from those associated with other portfolio investments. The use of futures requires an understanding not only of the underlying instrument but also of the futures contract itself. Futures may be subject to the risk factors generally applicable to derivatives transactions described herein, and may also be subject to certain additional risk factors, including:
• The risk of loss in buying and selling futures contracts can be substantial. Small price movements in the commodity underlying a futures position may result in immediate and substantial loss (or gain) to the Portfolio.
• Buying and selling futures contracts may result in losses in excess of the amount invested in the position in the form of initial margin. In the event of adverse price movements in the underlying commodity, security, index, currency or instrument, the Portfolio would be required to make daily cash payments to maintain its required margin. The Portfolio may be required to sell portfolio securities, or make or take delivery of the underlying securities in order to meet daily margin requirements at a time when it may be disadvantageous to do so. The Portfolio could lose margin payments deposited with a futures commission merchant if the futures commission merchant breaches its agreement with the Portfolio, becomes insolvent or declares bankruptcy.
• Most exchanges limit the amount of fluctuation permitted in futures contract prices during any single trading day. Once the daily limit has been reached in a particular futures contract, no trades may be made on that day at prices beyond that limit. If futures contract prices were to move to the daily limit for several
16
trading days with little or no trading, the Portfolio could be prevented from prompt liquidation of a futures position and subject to substantial losses. The daily limit governs only price movements during a single trading day and therefore does not limit the Portfolio's potential losses.
• Index futures based upon a narrower index of securities may present greater risks than futures based on broad market indexes, as narrower indexes are more susceptible to rapid and extreme fluctuations as a result of changes in value of a small number of securities.
High Yield Securities: High yield securities are fixed income securities, generally Corporates, Preferred Stocks and Convertibles, rated Ba through C by Moody's or BB through D by Standard & Poor's, and unrated fixed income securities considered to be of equivalent quality. Securities rated less than Baa by Moody's or BBB by Standard & Poor's are classified as non-investment grade securities and are commonly referred to as "junk bonds" or high yield, high risk securities. Such securities carry a high degree of risk and are considered speculative by the major credit rating agencies. See Appendix B for more information about fixed income security ratings. Investment grade securities that the Portfolio holds may be downgraded to below investment grade by the rating agencies. If the Portfolio holds a security that is downgraded, the Portfolio may choose to retain the security.
While fixed income securities rated below investment grade offer high yields, they also normally carry with them a greater degree of risk than securities with higher ratings. Lower-rated bonds are considered speculative by traditional investment standards. High yield securities may be issued as a consequence of corporate restructuring or similar events. Also, high yield securities are often issued by smaller, less credit worthy companies, or by highly leveraged (indebted) firms, which are generally less able than more established or less leveraged firms to make scheduled payments of interest and principal. High yield securities issued under these circumstances pose substantial risks. The price movement of high yield securities is influenced less by changes in interest rates and more by the financial and business position of the issuing corporation when compared to investment grade bonds. Compared with investment grade securities, the values of high yield securities tend to be more volatile and may react with greater sensitivity to changes in interest rates.
The high yield market is subject to credit risk. Default rates and recoveries fluctuate, driven by numerous factors including the general economy. In addition, the secondary market for high yield securities is generally less liquid than that for investment grade corporate securities. In periods of reduced market liquidity, high yield bond prices may become more volatile, and both the high yield market and the Portfolio may experience sudden and substantial price declines.
A lower level of liquidity might have an effect on the Portfolio's ability to value or dispose of such securities. Also, there may be significant disparities in the prices quoted for high yield securities by various dealers. Under such conditions, the Portfolio may find it difficult to value its securities accurately. The Portfolio may also be forced to sell securities at a significant loss in order to meet shareholder redemptions. These factors add to the risks associated with investing in high yield securities.
High yield bonds may also present risks based on payment expectations. For example, high yield bonds may contain redemption or call provisions. If an issuer exercises these provisions in a declining interest rate market, the Portfolio would have to replace the security with a lower yielding security, resulting in a decreased return for investors.
Certain types of high yield bonds are non-income paying securities. For example, zero coupons pay interest only at maturity and payment-in-kind bonds pay interest in the form of additional securities. Payment in the form of additional securities, or interest income recognized through discount accretion, will, however, be treated as ordinary income which will be distributed to shareholders even though the Portfolio does not receive periodic cash flow from these investments.
Inverse Floaters: Inverse floating rate obligations are obligations which pay interest at rates that vary inversely with changes in market rates of interest. Because the interest rate paid to holders of such obligations is generally determined by subtracting a variable or floating rate from a predetermined amount, the interest rate paid
17
to holders of such obligations will decrease as such variable or floating rate increases and increase as such variable or floating rate decreases.
Like most other fixed-income securities, the value of inverse floaters will decrease as interest rates increase. They are more volatile, however, than most other fixed-income securities because the coupon rate on an inverse floater typically changes at a multiple of the change in the relevant index rate. Thus, any rise in the index rate (as a consequence of an increase in interest rates) causes a correspondingly greater drop in the coupon rate of an inverse floater while a drop in the index rate causes a correspondingly greater increase in the coupon of an inverse floater. Some inverse floaters may also increase or decrease substantially because of changes in the rate of prepayments.
Inverse floating rate investments are variable debt instruments that pay interest at rates that move in the opposite direction of prevailing interest rates. Inverse floating rate investments tend to underperform the market for fixed rate bonds in a rising interest rate environment, but tend to outperform the market for fixed rate bonds when interest rates decline or remain relatively stable. Inverse floating rate investments have varying degrees of liquidity.
Investment Companies: Investment company securities are equity securities and include securities of other open-end, closed-end and unregistered investment companies, including exchange-traded funds. The 1940 Act generally prohibits the Portfolio from acquiring more than 3% of the outstanding voting shares of an investment company and limits such investments to no more than 5% of the Portfolio's total assets in any one investment company and no more than 10% in any combination of investment companies. The 1940 Act also prohibits the Portfolio from acquiring in the aggregate more than 10% of the outstanding voting shares of any registered closed-end investment company. The Portfolio may invest in investment company securities of investment companies managed by the Adviser or its affiliates to the extent permitted under the 1940 Act or as otherwise authorized by the SEC. To the extent the Portfolio invests a portion of its assets in investment company securities, those assets will be subject to the risks of the purchased investment company's portfolio securities, and a shareholder in the Portfolio will bear not only his proportionate share of the expenses of the Portfolio, but also, indirectly the expenses of the purchased investment company.
To the extent permitted by applicable law, the Portfolio may invest all or some of its short term cash investments in any money market fund advised or managed by the Adviser or its affiliates. In connection with any such investments, the Portfolio, to the extent permitted by the 1940 Act, will pay its share of all expenses (other than advisory and administrative fees) of a money market fund in which it invests which may result in the Portfolio bearing some additional expenses.
Exchange-Traded Funds ("ETFs"). The Portfolio may invest in shares of various ETFs. Shares of ETFs have many of the same risks as direct investments in common stocks or bonds. In addition, their market value is expected to rise and fall as the value of the underlying index or bond rises and falls. The market value of their shares may differ from the net asset value of the particular fund. As a shareholder in an ETF (as with other investment companies), the Portfolio would bear its ratable share of that entity's expenses. At the same time, the Portfolio would continue to pay its own investment management fees and other expenses. As a result, the Portfolio and its shareholders, in effect, will be absorbing duplicate levels of fees with respect to investments in ETFs. Further, certain of the ETFs in which the Portfolio may invest are leveraged. The more the Portfolio invests in such leveraged ETFs, the more this leverage will magnify any losses on those investments.
Investment Funds: Some emerging market countries have laws and regulations that currently preclude or limit direct foreign investment in the securities of their companies. However, certain emerging market countries through investment funds permit indirect foreign investment in the securities of companies listed and traded on the stock exchanges in these countries. The Portfolio will invest in such Investment Funds only where appropriate given that the Portfolio's shareholders will bear indirectly the layer of expenses of the underlying investment funds in addition to their proportionate share of the expenses of the Portfolio.
Investment Grade Securities: Investment grade securities are fixed income securities that are (a) rated by one or more NRSROs in one of the four highest rating categories at the time of purchase (e.g., AAA, AA, A or BBB by Standard & Poor's or Fitch or Aaa, Aa, A or Baa by Moody's); (b) guaranteed by the U.S. Government or a private issuer; or (c) considered by the Adviser to be investment grade quality. Securities rated BBB or Baa
18
represent the lowest of four levels of investment grade securities and are regarded as borderline between definitely sound obligations and those in which the speculative element begins to predominate. Any Portfolio is permitted to hold investment grade securities or "high grade" securities, and may hold unrated securities if the Adviser considers the risks involved in owning that security to be equivalent to the risks involved in holding an investment grade security. The Adviser may retain securities if their ratings fall below investment grade if it deems retention of the security to be in the best interests of the Portfolio.
Mortgage securities, including mortgage pass-throughs and CMOs, deemed investment grade by the Adviser, will either carry a guarantee from an agency or instrumentality of the U.S. Government or a private issuer of the timely payment of principal and interest (such guarantees do not extend to the market value of such securities or the net asset value per share of the Portfolio) or, in the case of unrated securities, are considered by the Adviser to be investment grade quality.
Leverage Risks: Certain transactions may give rise to a form of leverage. To mitigate leveraging risk, the Portfolio will earmark or segregate liquid assets or otherwise cover the transactions that may give rise to such risk as required by applicable rules and regulatory pronouncements of the SEC. The use of leverage may cause the Portfolio to liquidate portfolio positions when it may not be advantageous to do so to satisfy its obligations or to meet segregation requirements. Leverage, including borrowing, may cause the Portfolio to be more volatile than if the Portfolio had not been leveraged. This is because leverage tends to exaggerate the effect of any increase or decrease in the value of the Portfolio's portfolio securities.
Limited Partnership Interests: A limited partnership interest entitles the Portfolio to participate in the investment return of the partnership's assets as defined by the agreement among the partners. As a limited partner, the Portfolio generally is not permitted to participate in the management of the partnership. However, unlike a general partner whose liability is not limited, a limited partner's liability generally is limited to the amount of its commitment to the partnership. The Portfolio may invest in limited liability company interests to the same extent it invests in limited partnership interests. Limited liability company interests have similar characteristics as limited partnership interests.
Loan Participations and Assignments: Loan participations and assignments are fixed income securities. The Portfolio may invest in fixed rate and floating rate loans ("Loans") arranged through private negotiations between an issuer and one or more financial institutions ("Lenders"). The Portfolio's investments in Loans are expected in most instances to be in the form of participation in Loans ("Participations") and assignments of all or a portion of Loans ("Assignments") from third parties. In the case of a Participation, the Portfolio will have the right to receive payments of principal, interest and any fees to which it is entitled only from the Lender selling the Participation and only upon receipt by the Lender of the payments from the borrower. If a Lender selling a Participation becomes insolvent, the Portfolio may be treated as a general creditor of the Lender and may not benefit from any set-off between the Lender and the borrower. Certain Participations may be structured in a manner designed to avoid purchasers of Participations being subject to the credit risk of the Lender with respect to the Participation. Even under such a structure, in the event of the Lender's insolvency, the Lender's servicing of the Participation may be delayed and the assignability of the Participation may be impaired. The Portfolio will acquire Participations only if the Lender interpositioned between the Portfolio and the borrower is determined by the Adviser to be creditworthy.
When the Portfolio purchases Assignments from Lenders it will acquire direct rights against the borrower on the Loan. However, because Assignments are arranged through private negotiations between potential assignees and potential assignors, the rights and obligations acquired by the Portfolio as the purchaser of an Assignment may differ from, and be more limited than, those held by the assigning Lender. Because there is no liquid market for such securities, the Portfolio anticipates that such securities could be sold only to a limited number of institutional investors. The lack of a liquid secondary market may have an adverse impact on the value of such securities and the Portfolio's ability to dispose of particular Assignments or Participations when necessary to meet the Portfolio's liquidity needs or in response to a specific economic event, such as a deterioration in the creditworthiness of the borrower. The lack of a liquid secondary market for Assignments and Participations also may make it more difficult for the Portfolio to assign a value to those securities for purposes of valuing the Portfolio's holdings and calculating its net asset value.
19
Participations and Assignments involve a risk of loss in case of default or insolvency of the borrower. In addition, they may offer less legal protection to the Portfolio in the event of fraud or misrepresentation and may involve a risk of insolvency of the Lender. Certain Participations and Assignments may also include standby financing commitments that obligate the investing Portfolio to supply additional cash to the borrower on demand. Participations involving emerging market country issuers may relate to Loans as to which there has been or currently exists an event of default or other failure to make payment when due, and may represent amounts owed to Lenders that are themselves subject to political and economic risks, including the risk of currency devaluation, expropriation, or failure. Those Participations and Assignments present additional risk of default or loss.
Mortgage Related Securities: Mortgage related securities are securities that, directly or indirectly, represent a participation in, or are secured by and payable from, mortgage loans on real property. Mortgage related securities include collateralized mortgage obligations and mortgage-backed securities issued or guaranteed by agencies or instrumentalities of the U.S. Government or by private sector entities.
Mortgage-Backed Securities. With mortgage-backed securities ("MBSs"), many mortgagees' obligations to make monthly payments to their lending institution are pooled together and passed through to investors. The pools are assembled by various governmental, Government-related and private organizations. The Portfolio may invest in securities issued or guaranteed by Government National Mortgage Association ("Ginnie Mae"), the Federal Home Loan Mortgage Corporation ("Freddie Mac") or the Federal National Mortgage Association ("Fannie Mae"), private issuers and other government agencies. MBSs issued by non-agency issuers, whether or not such securities are subject to guarantees, may entail greater risk, since private issuers may not be able to meet their obligations under the policies. If there is no guarantee provided by the issuer, The Portfolio will purchase only MBSs that, at the time of purchase, are rated investment grade by one or more NRSROs or, if unrated, are deemed by the Adviser to be of comparable quality.
MBSs are issued or guaranteed by private sector originators of or investors in mortgage loans and structured similarly to governmental pass-through securities. Because private pass-throughs typically lack a guarantee by an entity having the credit status of a governmental agency or instrumentality, however, they are generally structured with one or more of the types of credit enhancement described below. Fannie Mae and Freddie Mac obligations are not backed by the full faith and credit of the U.S. Government as GNMA certificates are. Freddie Mac securities are supported by Freddie Mac's right to borrow from the U.S. Treasury. Each of GNMA, Fannie Mae and Freddie Mac guarantees timely distributions of interest to certificate holders. Each of GNMA and Fannie Mae also guarantees timely distributions of scheduled principal. Although Freddie Mac has in the past guaranteed only the ultimate collection of principal of the underlying mortgage loan, Freddie Mac now issues MBSs (Freddie Mac Gold PCS) that also guarantee timely payment of monthly principal reductions. Resolution Funding Corporation ("REFCORP") obligations are backed, as to principal payments, by zero coupon U.S. Treasury bonds and, as to interest payments, ultimately by the U.S. Treasury.
There are two methods of trading MBSs. A specified pool transaction is a trade in which the pool number of the security to be delivered on the settlement date is known at the time the trade is made. This is in contrast with the typical MBS transaction, called a TBA (To Be Announced) transaction, in which the type of MBS to be delivered is specified at the time of trade but the actual pool numbers of the securities that will be delivered are not known at the time of the trade. The pool numbers of the pools to be delivered at settlement are announced shortly before settlement takes place. The terms of the TBA trade may be made more specific if desired. Generally, agency pass-through MBSs are traded on a TBA basis. See also "Leverage Risks."
Like fixed income securities in general, MBSs will generally decline in price when interest rates rise. Rising interest rates also tend to discourage refinancings of home mortgages, with the result that the average life of MBSs held by the Portfolio may be lengthened. As average life extends, price volatility generally increases. This extension of average life causes the market price of the MBSs to decrease further when interest rates rise than if their average lives were fixed. However, when interest rates fall, mortgages may not enjoy as large a gain in market value due to prepayment risk because additional mortgage prepayments must be reinvested at lower interest rates. Faster prepayment will shorten the average life and slower prepayments will lengthen it. However, it is possible to determine what the range of the average life movement could be and to calculate the effect that it will have on the price of the MBS. In selecting MBSs, the Adviser looks for those that offer a higher yield to compensate for any
20
variation in average maturity. If the underlying mortgage assets experience greater than anticipated prepayments of principal, the Portfolio may fail to fully recoup its initial investment in these securities, even if the security is in one of the highest rating categories. The Portfolio may invest, without limit, in MBSs issued by private issuers when the Adviser deems that the quality of the investment, the quality of the issuer, and market conditions warrant such investments. The Portfolio will purchase securities issued by private issuers that are rated investment grade at the time of purchase by Moody's, Fitch or S&P or are deemed by the Adviser to be of comparable investment quality.
Fannie Mae Certificates. Fannie Mae is a federally chartered and privately owned corporation organized and existing under the Federal National Mortgage Association Charter Act of 1938. Each Fannie Mae certificate represents a pro rata interest in one or more pools of mortgage loans insured by the FHA under the Housing Act, or Title V of the Housing Act of 1949 ("FHA Loans"), or guaranteed by the Department of Veteran Affairs under the Servicemen's Readjustment Act of 1944, as amended ("VA Loans") or conventional mortgage loans (i.e., mortgage loans that are not insured or guaranteed by any governmental agency) of the following types: (i) fixed rate level payment mortgage loans; (ii) fixed rate growing equity mortgage loans; (iii) fixed rate graduated payment mortgage loans; (iv) variable rate California mortgage loans; (v) other adjustable rate mortgage loans; and (vi) fixed rate and adjustable mortgage loans secured by multi-family projects.
Freddie Mac Certificates. Freddie Mac is a corporate instrumentality of the United States created pursuant to the Emergency Home Finance Act of 1970, as amended (the "FHLMC Act"). Freddie Mac certificates represent a pro rata interest in a group of mortgage loans (a "Freddie Mac Certificate group") purchased by Freddie Mac. The mortgage loans underlying the Freddie Mac Certificates consist of fixed rate or adjustable rate mortgage loans with original terms to maturity of between ten and thirty years, substantially all of which are secured by first liens on one-to-four-family residential properties or multi-family projects. Each mortgage loan must meet the applicable standards set forth in the FHLMC Act. A Freddie Mac Certificate group may include whole loans, participation interests in whole loans and undivided interests in whole loans and participations comprising another Freddie Mac Certificate group.
In September 2008, the U.S. Treasury Department announced that the government would be taking over Fannie Mae and Freddie Mac and placing the companies into a conservatorship. In addition, the U.S. Treasury announced three additional steps that it intended to take with respect to Fannie Mae and Freddie Mac in order to support the conservatorship. First, the U.S. Treasury entered into "Preferred Stock Purchase Agreements" (PSPAs) under which, if the Federal Housing Finance Agency ("FHFA") determines that Fannie Mae's or Freddie Mac's liabilities exceed its assets under generally accepted accounting principles, the U.S. Treasury will contribute cash capital to the company in an amount equal to the difference between liabilities and assets. The PSPAs are designed to provide protection to the senior and subordinated debt and the mortgage-backed securities issued by Fannie Mae and Freddie Mac. Second, the U.S. Treasury established a new secured lending credit facility that was available to Fannie Mae and Freddie Mac until December 2009. Third, the U.S. Treasury initiated a temporary program to purchase Fannie Mae and Freddie Mac mortgage-backed securities, which terminated in December 2009. In addition, the Federal Reserve exercised its separate authority in 2009 to purchase mortgage-backed securities of Fannie Mae and Freddie Mac. While the U.S. Treasury is committed to offset negative equity at Fannie Mae and Freddie Mac through its stock purchases, no assurance can be given that the Federal Reserve, U.S. Treasury, or FHFA initiatives discussed above will ensure that Fannie Mae and Freddie Mac will remain successful in meeting their obligations with respect to the debt and mortgage-backed securities they issue.
Ginnie Mae Certificates. Ginnie Mae is a wholly-owned corporate instrumentality of the United States within the Department of Housing and Urban Development. The National Housing Act of 1934, as amended (the "Housing Act"), authorizes Ginnie Mae to guarantee the timely payment of the principal and interest on certificates that are based on and backed by a pool of FHA Loans, VA Loans or by pools of other eligible mortgage loans. The Housing Act provides that the full faith and credit of the U.S. Government is pledged to the payment of all amounts that may be required to be paid under any guaranty. In order to meet its obligations under such guaranty, Ginnie Mae is authorized to borrow from the U.S. Treasury with no limitations as to amount.
Each Ginnie Mae certificate represents a pro rata interest in one or more of the following types of mortgage loans: (i) fixed rate level payment mortgage loans; (ii) fixed rate graduated payment mortgage loans; (iii) fixed
21
rate growing equity mortgage loans; (iv) fixed rate mortgage loans secured by manufactured (mobile) homes; (v) mortgage loans on multi-family residential properties under construction; (vi) mortgage loans on completed multi-family projects; (vii) fixed rate mortgage loans as to which escrowed funds are used to reduce the borrower's monthly payments during the early years of the mortgage loans ("buydown" mortgage loans); (viii) mortgage loans that provide for adjustments in payments based on periodic changes in interest rates or in other payment terms of the mortgage loans; and (ix) mortgage-backed serial notes. All of these mortgage loans will be FHA Loans or VA loans and, except as otherwise specified above, will be fully-amortizing loans secured by first liens on one to four-family housing units.
Collateralized Mortgage Obligations. The Portfolio may invest in collateralized mortgage obligations ("CMOs"), which are mortgage-backed securities that are collateralized by mortgage loans or mortgage pass-through securities, and multi-class pass-through securities, which are equity interests in a trust composed of mortgage loans or other mortgage backed securities. Unless the context indicates otherwise, the discussion of CMOs below also applies to multi-class pass through securities.
CMOs may be issued by governmental or government-related entities or by private entities, such as banks, savings and loan institutions, private mortgage insurance companies, mortgage bankers and other secondary market traders. CMOs are issued in multiple classes, often referred to as "tranches," with each tranche having a specific fixed or floating coupon rate and stated maturity or final distribution date. Under the traditional CMO structure, the cash flows generated by the mortgages or mortgage pass-through securities in the collateral pool are used to first pay interest and then pay principal to the holders of the CMOs. Subject to the various provisions of individual CMO issues, the cash flow generated by the underlying collateral (to the extent it exceeds the amount required to pay the stated interest) is used to retire the bonds.
The principal and interest on the underlying collateral may be allocated among the several tranches of a CMO in innumerable ways. In a common CMO structure, the tranches are retired sequentially in the order of their respective stated maturities or final distribution dates (as opposed to the pro-rata return of principal found in traditional pass-through obligations). The fastest-pay tranches would initially receive all principal payments. When those tranches are retired, the next tranches in the sequence receive all of the principal payments until they are retired. The sequential retirement of bond groups continues until the last tranche is retired. Accordingly, the CMO structure allows the issuer to use cash flows of long maturity, monthly-pay collateral to formulate securities with short, intermediate, and long final maturities and expected average lives and risk characteristics.
The primary risk of CMOs is the uncertainty of the timing of cash flows that results from the rate of prepayments on the underlying mortgages serving as collateral and from the structure of the particular CMO transaction (that is, the priority of the individual tranches). An increase or decrease in prepayment rates (resulting from a decrease or increase in mortgage interest rates) may cause the CMOs to be retired substantially earlier than their stated maturities or final distribution dates and will affect the yield and price of CMOs. In addition, the collateral securing CMOs or any third-party guarantees are insufficient to make payments, the Portfolio could sustain a loss. The prices of certain CMOs, depending on their structure and the rate of prepayments, can be volatile. Some CMOs may also not be as liquid as other types of mortgage securities. As a result, it may be difficult or impossible to sell the securities at an advantageous time or price.
New types of CMO tranches have evolved. These include floating rate CMOs, inverse floating rate CMOs, planned amortization classes, accrual bonds and CMO residuals. These newer structures affect the amount and timing of principal and interest received by each tranche from the underlying collateral. Under certain of these newer structures, given classes of CMOs have priority over others with respect to the receipt of prepayments on the mortgages. Therefore, depending on the type of CMOs in which the Portfolio invests, the investment may be subject to a greater or lesser risk of prepayment than other types of mortgage-backed securities.
CMOs may include real estate investment conduits ("REMICs"). REMICs, which were authorized under the Tax Reform Act of 1986, are private entities formed for the purpose of holding a fixed pool of mortgages secured by an interest in real property. A REMIC is a CMO that qualifies for special tax treatment under the Internal Revenue Code and invests in certain mortgages principally secured by interests in real property.
22
The Portfolio may invest in, among others, parallel pay CMOs and Planned Amortization Class CMOs ("PAC Bonds"). Parallel pay CMOs are structured to provide payments of principal on each payment date to more than one tranche. These simultaneous payments are taken into account in calculating the stated maturity date or final distribution date of each tranche which, as with other CMO structures, must be retired by its stated maturity date or final distribution date but may be retired earlier. PAC Bonds are a form of parallel pay CMO, with the required principal payment on such securities having the highest priority after interest has been paid to all classes. PAC Bonds generally require payments of a specified amount of principal on each payment date.
Stripped Mortgage-Backed Securities. The Portfolio may invest in stripped mortgage-backed securities ("SMBS"). An SMBS is a derivative multi-class mortgage security. SMBS usually are structured with two classes that receive different proportions of the interest and principal distribution on a pool of mortgage assets. In the most extreme case, one class will receive all of the interest (the interest-only or "IO" class), while the other class will receive all of the principal (the principal-only or "PO" class). The yield to maturity on an IO class is extremely sensitive to the rate of principal payments (including prepayments) on the related underlying mortgage assets, and a rapid rate of principal payments may have a material adverse effect on such security's yield to maturity. If the underlying mortgage assets experience greater than anticipated prepayments of principal, the Portfolio may fail to fully recoup its initial investment in these securities. Conversely, if the underlying mortgage assets experience less than anticipated prepayments of principal, the yield of POs could be materially adversely affected. The market values of IOs and POs are subject to greater risk of fluctuation in response to changes in market rates of interest than many other types of government securities. To the extent the Portfolio invests in IOs and POs, it may increase the risk of fluctuations in the net asset value of the Portfolio.
Commercial Mortgage-Backed Securities ("CMBS"). CMBS are generally multi-class or pass-through securities issued by special purpose entities that represent an undivided interest in a portfolio of mortgage loans backed by commercial properties, including, but not limited to, industrial and warehouse properties, office buildings, retail space and shopping malls, hotels, healthcare facilities, multifamily properties and cooperative apartments. Private lenders, such as banks or insurance companies, originate these loans and then sell the loans directly into a CMBS trust or other entity. The commercial mortgage loans that underlie CMBS are generally not amortizing or not fully amortizing. That is, at their maturity date, repayment of the remaining principal balance or "balloon" is due and is repaid through the attainment of an additional loan or sale of this property. An extension of the final payment on commercial mortgages will increase the average life of the CMBS, generally resulting in a lower yield for discount bonds and a higher yield for premium bonds.
CMBS are subject to credit risk and prepayment risk. Although prepayment risk is present, it is of a lesser degree in the CMBS than in the residential mortgage market; commercial real estate property loans often contain provisions which substantially reduce the likelihood that such securities will be prepaid (e.g., significant prepayment penalties on loans and, in some cases, prohibition on principal payments for several years following origination).
Non-Publicly Traded Securities, Private Placements and Restricted Securities: The Portfolio may invest in securities that are neither listed on a stock exchange nor traded over-the-counter, including privately placed and restricted securities. Such unlisted securities may involve a higher degree of business and financial risk that can result in substantial losses. As a result of the absence of a public trading market for these securities, they may be less liquid than publicly traded securities. Although these securities may be resold in privately negotiated transactions, the prices realized from these sales could be less than those originally paid by the Portfolio or less than what may be considered the fair value of such securities. Furthermore, companies whose securities are not publicly traded may not be subject to the disclosure and other investor protection requirements which might be applicable if their securities were publicly traded. If such securities are required to be registered under the securities laws of one or more jurisdictions before being sold, the Portfolio may be required to bear the expenses of registration.
Options: An option is a contract that gives the holder of the option the right, but not the obligation, to buy from (in the case of a call option) or sell to (in the case of a put option) the seller of the option (the "option writer") the underlying security at a specified fixed price (the "exercise price") on or prior to a specified date (the "expiration date"). The buyer of the option pays to the option writer the option premium, which is the purchase price of the option.
23
Exchange-traded options are issued by a regulated intermediary such as the Options Clearing Corporation ("OCC"), which guarantees the performance of the obligations of the parties to such options. OTC options are purchased from or sold to counterparties through direct bilateral agreement between the Portfolio and its counterparties. Certain options, such as options on individual securities, are settled through physical delivery of the underlying security, whereas other options, such as index options, may be settled in cash in an amount based on the value of the underlying instrument multiplied by a specified multiplier.
Writing Options. The Portfolio may write call and put options. As the writer of a call option, the Portfolio receives the premium from the purchaser of the option and has the obligation, upon exercise of the option, to deliver the underlying security upon payment of the exercise price. If the option expires without being exercised the Portfolio is not required to deliver the underlying security but retains the premium received.
The Portfolio may only write call options that are "covered." A call option on a security is covered if (a) the Portfolio owns the security underlying the call or has an absolute and immediate right to acquire that security without additional cash consideration (or, if additional cash consideration is required, such amount is maintained by the Portfolio in segregated or earmarked cash or liquid assets) upon conversion or exchange of other securities held by the Portfolio; or (b) the Portfolio has purchased a call on the underlying security, the exercise price of which is (i) equal to or less than the exercise price of the call written, or (ii) greater than the exercise price of the call written, provided the difference is maintained by the Portfolio in segregated or earmarked cash or liquid assets.
Selling call options involves the risk that the Portfolio may be required to sell the underlying security at a disadvantageous price, below the market price of such security, at the time the option is exercised. As the writer of a covered call option, the Portfolio forgoes, during the option's life, the opportunity to profit from increases in the market value of the underlying security covering the option above the sum of the premium and the exercise price but retains the risk of loss should the price of the underlying security decline.
The Portfolio may write put options. As the writer of a put option, the Portfolio receives the premium from the purchaser of the option and has the obligation, upon exercise of the option, to pay the exercise price and receive delivery of the underlying security. If the option expires without being exercised, the Portfolio is not required to receive the underlying security in exchange for the exercise price but retains the option premium.
The Portfolio may only write put options that are "covered." A put option on a security is covered if (a) the Portfolio segregates or earmarks cash or liquid assets equal to the exercise price; or (b) the Portfolio has purchased a put on the same security as the put written, the exercise price of which is (i) equal to or greater than the exercise price of the put written, or (ii) less than the exercise price of the put written, provided the difference is maintained by the Portfolio in segregated or earmarked cash or liquid assets.
Selling put options involves the risk that the Portfolio may be required to buy the underlying security at a disadvantageous price, above the market price of such security, at the time the option is exercised. While the Portfolio's potential gain in writing a covered put option is limited to the premium received plus the interest earned on the liquid assets covering the put option, the Portfolio's risks of loss is equal to the entire value of the underlying security, offset only by the amount of the premium received.
The Portfolio may close out an options position which it has written through a closing purchase transaction. The Portfolio would execute a closing purchase transaction with respect to a call option written by purchasing a call option. The Portfolio would execute a closing purchase transaction with respect to a put option written by purchasing a put option on the same underlying security and having the same exercise price and expiration date as the put option written by the Portfolio. A closing purchase transaction may or may not result in a profit to the Portfolio. The Portfolio could close out its position as an option writer only if a liquid market exists for options on the same underlying security and having the same exercise price and expiration date as the option written by the Portfolio. There is no assurance that such a market will exist with respect to any particular option.
The writer of an option generally has no control over the time when the option is exercised and the option writer is required to deliver or acquire the underlying security. Once an option writer has received an exercise notice, it cannot effect a closing purchase transaction in order to terminate its obligation under the option. Thus,
24
the use of options may require the Portfolio to buy or sell portfolio securities at inopportune times or for prices other than the current market values of such securities, may limit the amount of appreciation the Portfolio can realize on an investment, or may cause the Portfolio to hold a security that it might otherwise sell.
Purchasing Options. The Portfolio may purchase call and put options. As the buyer of a call option, the Portfolio pays the premium to the option writer and has the right to purchase the underlying security from the option writer at the exercise price. If the market price of the underlying security rises above the exercise price, the Portfolio could exercise the option and acquire the underlying security at a below-market price, which could result in a gain to the Portfolio, minus the premium paid. As the buyer of a put option, the Portfolio pays the premium to the option writer and has the right to sell the underlying security to the option writer at the exercise price. If the market price of the underlying security declines below the exercise price, the Portfolio could exercise the option and sell the underlying security at an above-market price, which could result in a gain to the Portfolio, minus the premium paid. The Portfolio may buy call and put options whether or not it holds the underlying securities.
As a buyer of a call or put option, the Portfolio may sell put or call options that it has purchased at any time prior to such option's expiration date through a closing sale transaction. The principal factors affecting the market value of a put or a call option include supply and demand, interest rates, the current market price of the underlying security in relation to the exercise price of the option, the volatility of the underlying security, the underlying security's dividend policy, and the time remaining until the expiration date. A closing sale transaction may or may not result in a profit to the Portfolio. The Portfolio's ability to initiate a closing sale transaction is dependent upon the liquidity of the options market and there is no assurance that such a market will exist with respect to any particular option. If the Portfolio does not exercise or sell an option prior to its expiration date, the option expires and becomes worthless.
OTC Options. Unlike exchange-traded options, which are standardized with respect to the underlying instrument, expiration date, contract size and strike price, the terms of OTC options generally are established through negotiation between the parties to the options contract. This type of arrangement allows the purchaser and writer greater flexibility to tailor the option to their needs. OTC options are available for a greater variety of securities or baskets of securities, and in a wider range of expiration dates and exercise prices than exchange-traded options. However, unlike exchange-traded options, which are issued and guaranteed by a regulated intermediary, such as the OCC, OTC options are entered into directly with the counterparty. Unless the counterparties provide for it, there is no central clearing or guaranty function for an OTC option. Therefore, OTC options are subject to the risk of default or non-performance by the counterparty. Accordingly, the Adviser must assess the creditworthiness of the counterparty to determine the likelihood that the terms of the option will be satisfied. There can be no assurance that a continuous liquid secondary market will exist for any particular OTC option at any specific time. As a result, the Portfolio may be unable to enter into closing sale transactions with respect to OTC options.
Index Options. Call and put options on indices operate similarly to options on securities. Rather than the right to buy or sell a single security at a specified price, options on an index give the holder the right to receive, upon exercise of the option, an amount of cash determined by reference to the value of the underlying index. The underlying index may be a broad-based index or a narrower market index. Unlike many options on securities, all settlements are in cash. The settlement amount, which the writer of an index option must pay to the holder of the option upon exercise, is generally equal to the difference between the fixed exercise price of the option and the value of the underlying index, multiplied by a specified multiplier. The multiplier determines the size of the investment position the option represents. Gain or loss to the Portfolio on index options transactions will depend, in part, on price movements of the underlying index generally or in a particular segment of the index rather than price movements of individual components of the index. As with other options, the Portfolio may close out its position in index options through closing purchase transactions and closing sale transactions provided that a liquid secondary market exists for such options.
Index options written by the Portfolio will generally be covered in a manner similar to the covering of other types of options, by holding an offsetting financial position and/or segregating or earmarking cash or liquid assets. The Portfolio may cover call options written on an index by owning securities whose price changes, in the opinion of the Adviser, are expected to correlate to those of the underlying index.
25
Foreign Currency Options. Options on foreign currencies operate similarly to options on securities. Rather than the right to buy or sell a single security at a specified price, options on foreign currencies give the holder the right to buy or sell foreign currency for a fixed amount in U.S. dollars or other base currencies. Options on foreign currencies are traded primarily in the OTC market, but may also be traded on U.S. and foreign exchanges. The value of a foreign currency option is dependent upon the value of the underlying foreign currency relative to the U.S. dollar or other base currency. The price of the option may vary with changes in, among other things, the value of either or both currencies and has no relationship to the investment merits of a foreign security. Options on foreign currencies are affected by all of those factors which influence foreign exchange rates and foreign investment generally. As with other options, the Portfolio may close out its position in foreign currency options through closing purchase transactions and closing sale transactions provided that a liquid market exists for such options.
Foreign currency options written by the Portfolio will generally be covered in a manner similar to the covering of other types of options, by holding an offsetting financial position and/or segregating or earmarking cash or liquid assets.
Additional Risks of Options Transactions. The risks associated with options transactions are different from, and possibly greater than, the risks associated with investing directly in the underlying instruments. Options are highly specialized instruments that require investment techniques and risk analyses different from those associated with other portfolio investments. The use of options requires an understanding not only of the underlying instrument but also of the option itself. Options may be subject to the risk factors generally applicable to derivatives transactions described herein, and may also be subject to certain additional risk factors, including:
• The exercise of options written or purchased by the Portfolio could cause the Portfolio to sell portfolio securities, thus increasing the Portfolio's portfolio turnover.
• The Portfolio pays brokerage commissions each time it writes or purchases an option or buys or sells an underlying security in connection with the exercise of an option. Such brokerage commissions could be higher relative to the commissions for direct purchases of sales of the underlying securities.
• The Portfolio's options transactions may be limited by limitations on options positions established by the SEC, the CFTC or the exchanges on which such options are traded.
• The hours of trading for exchange-listed options may not coincide with the hours during which the underlying securities are traded. To the extent that the options markets close before the markets for the underlying securities, significant price and rate movements can take place in the underlying securities that cannot be reflected in the options markets.
• Index options based upon a narrow index of securities or other assets may present greater risks than options based on broad market indexes, as narrower indexes are more susceptible to rapid and extreme fluctuations as a result of changes in the values of a smaller number of securities or other assets.
• The Portfolio is subject to the risk of market movements between the time that an option is exercised and the time of performance thereunder, which could increase the extent of any losses suffered by the Portfolio in connection with options transactions.
Options on Futures Contracts. Options on futures contracts are similar to options on securities except that options on futures contracts give the purchasers the right, in return for the premium paid, to assume a position in a futures contract (a long position in the case of a call option and a short position in the case of a put option) at a specified exercise price at any time prior to the expiration of the option. Upon exercise of the option, the parties will be subject to all of the risks associated with futures transactions and subject to margin requirements. As the writer of options on futures contracts, the Portfolio would also be subject to initial and variation margin requirements on the option position.
Options on futures contracts written by the Portfolio will generally be covered in a manner similar to the covering of other types of options, by holding an offsetting financial position and/or segregating or earmarking cash or liquid assets. The Portfolio may cover an option on a futures contract by purchasing or selling the
26
underlying futures contract. In such instances the exercise of the option will serve to close out the Portfolio's futures position.
Combined Transactions. Combined transactions involve entering into multiple derivatives transactions (such as multiple options transactions, including purchasing and writing options in combination with each other; multiple futures transactions; and combinations of options, futures, forward and swap transactions) instead of a single derivatives transaction in order to customize the risk and return characteristics of the overall position. Combined transactions typically contain elements of risk that are present in each of the component transactions. The Portfolio may enter into a combined transaction instead of a single derivatives transaction when, in the opinion of the Adviser, it is in the best interest of the Portfolio to do so. Because combined transactions involve multiple transactions, they may result in higher transaction costs and may be more difficult to close out.
Private Investments in Public Equity: The Portfolio may purchase equity securities in a private placement that are issued by issuers who have outstanding, publicly-traded equity securities of the same class ("private investments in public equity" or "PIPES"). Shares in PIPES generally are not registered with the SEC until after a certain time period from the date the private sale is completed. This restricted period can last many months. Until the public registration process is completed, PIPES are restricted as to resale and the Portfolio cannot freely trade the securities. Generally, such restrictions cause the PIPES to be illiquid during this time. PIPES may contain provisions that the issuer will pay specified financial penalties to the holder if the issuer does not publicly register the restricted equity securities within a specified period of time, but there is no assurance that the restricted equity securities will be publicly registered, or that the registration will remain in effect.
As a general matter, the Portfolio may not invest more than 15% of its net assets in illiquid securities, such as securities for which there is not a readily available secondary market or securities that are restricted from sale to the public without registration. However, certain Restricted Securities can be offered and sold to qualified institutional buyers under Rule 144A ("Rule 144A Securities") under the Securities Act of 1933, as amended (the "1933 Act"), and may be deemed to be liquid under guidelines adopted by the Fund's Board of Trustees. The Portfolio may invest without limit in liquid Rule 144A Securities. Rule 144A Securities may become illiquid if qualified institutional buyers are not interested in acquiring the securities.
Preferred Stock: Preferred stocks are non-voting ownership shares in a corporation which pay a fixed or variable stream of dividends. Preferred stocks have a preference over common stocks in the event of the liquidation of an issuer. Preferred stocks have many of the characteristics of both equity securities and fixed income securities.
Real Estate Investment Trusts: The Portfolio may invest in real estate investment trusts ("REITs"). REITs pool investors' funds for investment primarily in real estate properties or real estate-related loans. REITs generally derive their income from rents on the underlying properties or interest on the underlying loans, and their value is impacted by changes in the value of the underlying property or changes in interest rates affecting the underlying loans owned by the REITs. REITs are more susceptible to risks associated with the ownership of real estate and the real estate industry in general. These risks can include fluctuations in the value of underlying properties; defaults by borrowers or tenants; market saturation; changes in general and local economic conditions; decreases in market rates for rents; increases in competition, property taxes, capital expenditures, or operating expenses; and other economic, political or regulatory occurrences affecting the real estate industry. In addition, REITs depend upon specialized management skills, may not be diversified (which may increase the volatility of the REIT's value), may have less trading volume and may be subject to more abrupt or erratic price movements than the overall securities market. Operating REITs requires specialized management skills and the Portfolio indirectly bears REIT management expenses along with the direct expenses of the Portfolio. REITs are not taxed on income distributed to shareholders provided they comply with several requirements of the Internal Revenue Code of 1986, as amended (the "Code"). REITs are subject to the risk of failing to qualify for tax-free pass-through of income under the Code.
Repurchase Agreements: The Portfolio may invest in repurchase agreements. When cash may be available for only a few days, it may be invested by the Portfolio in repurchase agreements until such time as it may otherwise be invested or used for payments of obligations of the Portfolio. These agreements typically involve the acquisition by the Portfolio of debt securities from a selling financial institution such as a bank, savings and loan association or broker-dealer. The agreement provides that the Portfolio will sell back to the institution, and that the
27
institution will repurchase, the underlying securities serving as collateral at a specified price and at a fixed time in the future, usually not more than seven days from the date of purchase. The collateral will be marked-to-market daily to determine that the value of the collateral, as specified in the agreement, does not decrease below the purchase price plus accrued interest. If such decrease occurs, additional collateral will be requested and, when received, added to the account to maintain full collateralization. The Portfolio will accrue interest from the institution until the time when the repurchase is to occur. Although this date is deemed by the Portfolio to be the maturity date of a repurchase agreement, the maturities of securities subject to repurchase agreements are not subject to any limits.
While repurchase agreements involve certain risks not associated with direct investments in debt securities, the Portfolio follows procedures approved by the Trustees that are designed to minimize such risks. These procedures include effecting repurchase transactions only with large, well-capitalized and well-established financial institutions whose financial condition will be continually monitored by the Adviser. In addition, as described above, the value of the collateral underlying the repurchase agreement will be at least equal to the repurchase price, including any accrued interest earned on the repurchase agreement. In the event of a default or bankruptcy by a selling financial institution, the Portfolio will seek to liquidate such collateral. However, the exercising of the Portfolio's right to liquidate such collateral could involve certain costs or delays and, to the extent that proceeds from any sale upon a default of the obligation to repurchase were less than the repurchase price, the Portfolio could suffer a loss.
Reverse Repurchase Agreements: Under a Reverse Repurchase Agreement, the Portfolio sells a security and promises to repurchase that security at an agreed upon future date and price. The price paid to repurchase the security reflects interest accrued during the term of the agreement. The Portfolio will establish a separate custodial account holding cash and other liquid assets in an amount not less than the purchase obligations of the agreement. Reverse Repurchase Agreements may be viewed as a speculative form of borrowing called leveraging. The Portfolio may invest in reverse repurchase agreements if (i) interest earned from leveraging exceeds the interest expense of the original reverse repurchase transaction and (ii) proceeds from the transaction are not invested for longer than the term of the Reverse Repurchase Agreement. See "Leverage Risks," above, for a description of leverage risk.
Rights: Rights are equity securities representing a preemptive right of stockholders to purchase additional shares of a stock at the time of a new issuance, before the stock is offered to the general public. A stockholder who purchases rights may be able to retain the same ownership percentage after the new stock offering. A right usually enables the stockholder to purchase common stock at a price below the initial offering price. The Portfolio that purchases a right takes the risk that the right might expire worthless because the market value of the common stock falls below the price fixed by the right.
Securities Lending: The Portfolio may lend its portfolio securities to brokers, dealers, banks and other institutional investors. By lending its portfolio securities, the Portfolio attempts to increase its net investment income through the receipt of interest on the cash collateral with respect to the loan or fees received from the borrower in connection with the loan. Any gain or loss in the market price of the securities loaned that might occur during the term of the loan would be for the account of the Portfolio. The Fund employs an agent to implement the securities lending program and the agent receives a portion of the fee paid by the Borrower to the Fund for its services.
The Portfolio may lend its portfolio securities so long as the terms, the structure and the aggregate amount of such loans are not inconsistent with the 1940 Act or the rules and regulations or interpretations of the SEC thereunder, which currently require that (a) the borrower pledge and maintain with the Portfolio collateral consisting of liquid, unencumbered assets having a value at all times not less than 100% of the value of the securities loaned; (ii) the borrower add to such collateral whenever the price of the securities loaned rises (i.e., the borrower "marks to market" on a daily basis); (iii) the loan be made subject to termination by the Portfolio at any time; and (iv) the Portfolio receive a reasonable return on the loan (which may include the Portfolio investing any cash collateral in interest bearing short-term investments), any distributions on the loaned securities and any increase in their market value. In addition, voting rights may pass with the loaned securities, but the Portfolio will retain the right to call any security in anticipation of a vote that the Adviser deems material to the security on loan.
28
There may be risks of delay and costs involved in recovery of securities or even loss of rights in the collateral should the borrower of the securities fail financially. These delays and costs could be greater for foreign securities. However, loans will be made only to borrowers deemed by the Adviser to be creditworthy and when, in the judgment of the Adviser, the income which can be earned from such securities loans justifies the attendant risk. All relevant facts and circumstances, including the creditworthiness of the broker, dealer, bank or institution, will be considered in making decisions with respect to the lending of securities, subject to review by the Fund's Board. The Portfolio also bears the risk that the reinvestment of collateral will result in a principal loss. Finally, there is the risk that the price of the securities will increase while they are on loan and the collateral will not be adequate to cover their value.
Short Selling: A short sale is a transaction in which the Portfolio sells securities that it does not own, but has borrowed, in anticipation of a decline in the market price of the securities. To deliver the securities to the buyer, the Portfolio arranges through a broker to borrow the securities and, in so doing, the Portfolio becomes obligated to replace the securities borrowed at their market price at the time of replacement. When selling short, the Portfolio intends to replace the securities at a lower price and therefore, profit from the difference between the cost to replace the securities and the proceeds received from the sale of the securities. When the Portfolio makes a short sale, the proceeds it receives from the sale will be held on behalf of a broker until the Portfolio replaces the borrowed securities. The Portfolio may have to pay a premium to borrow the securities and must pay any dividends or interest payable on the securities until they are replaced.
The Portfolio secures its obligation to replace the borrowed securities by depositing collateral with the broker, consisting of cash or other liquid securities. The Portfolio also must place in a segregated account with its custodian cash or other liquid securities equal in value to the difference, if any, between (i) the current market value of the securities sold short and (ii) any cash or other liquid securities deposited as collateral with the broker in connection with the short sale. This amount will be adjusted daily to reflect changes in the value of the securities sold short. The Portfolio also can cover its obligations by owning another security (such as a call option) giving it the right to obtain the same kind and amount of the security it sold short.
Short sales by the Portfolio involve certain risks and special considerations. If the Adviser incorrectly predicts that the price of a borrowed security will decline, the Portfolio will have to replace the securities by purchasing them at a higher price than it received from the sale. Therefore, losses from short sales may be unlimited. By contrast, when the Portfolio purchases a security and holds it, the Portfolio cannot lose more than the amount it paid for the security.
Structured Investments: The Portfolio also may invest a portion of its assets in structured investments. A structured investment is a derivative security designed to offer a return linked to a particular underlying security, currency, commodity or market, for which the amount of principal repayment and/or interest payments is based on the change in value of such underlying security, currency, commodity or market, including, among others, currency exchange rates, interest rates (such as the prime lending rate or LIBOR), referenced bonds and stock indices or other financial reference. Structured investments may come in various forms, including notes, warrants and options to purchase securities, and may be listed and traded on an exchange or otherwise traded in the OTC market.
The Portfolio will typically use structured investments to gain exposure to a permitted underlying security, currency or market when direct access to such security, currency, commodity or market is limited or inefficient from a tax, cost or regulatory standpoint. Investments in structured investments involve risks including issuer risk, counterparty risk and market risk. Holders of structured investments bear risks of the underlying investment and are subject to issuer or counterparty risk because the Portfolio is relying on the creditworthiness of such issuer or counterparty and has no rights with respect to the underlying investment. Certain structured investments may be thinly traded or have a limited trading market and may have the effect of increasing the Portfolio's illiquidity to the extent that the Portfolio, at a particular point in time, may be unable to find qualified buyers for these investments.
A structured investment may be linked either positively or negatively to its underlying security, currency, commodity or market and a change in interest rate, principal amount or other factor, depending on the structured investment's design, may be a multiple of the factor's movement. Application of a multiplier is comparable to the use of financial leverage, a speculative technique. Leverage magnifies the potential for gain and the risk of loss.
29
As a result, a relatively small decline in the value of the referenced factor could result in a relatively large loss in the value of a structured investment.
Other types of structured investments include interests in entities organized and operated for the purpose of restructuring the investment characteristics of underlying investment interests or securities. This type of securitization or restructuring usually involves the deposit or purchase of an underlying security by a U.S. or foreign entity, such as a corporation or trust of specified instruments, and the issuance by that entity of one or more classes of securities backed by, or representing an interest in, the underlying instruments. The cash flow or rate of return on the underlying investments may be apportioned among the newly issued securities to create different investment characteristics, such as varying maturities, credit quality, payment priorities and interest rate provisions. Structured investments which are subordinated, for example, in payment priority often offer higher returns, but may result in increased risks compared to other investments.
Swaps: An OTC swap contract is an agreement between two parties pursuant to which the parties exchange payments at specified dates on the basis of a specified notional amount, with the payments calculated by reference to specified securities, indexes, reference rates, currencies or other instruments. A small percentage of swap contracts are cleared through a central clearinghouse. Most swap agreements provide that when the period payment dates for both parties are the same, the payments are made on a net basis (i.e., the two payment streams are netted out, with only the net amount paid by one party to the other). The Portfolio's obligations or rights under a swap contract entered into on a net basis will generally be equal only to the net amount to be paid or received under the agreement, based on the relative values of the positions held by each counterparty. Most swap agreements are not entered into or traded on exchanges and often there is no central clearing or guaranty function for swaps. These OTC swaps are often subject to the risk of default or non-performance by the counterparty. Accordingly, the Adviser must assess the creditworthiness of the counterparty to determine the likelihood that the terms of the swap will be satisfied.
Swap agreements allow for a wide variety of transactions. For example, fixed rate payments may be exchanged for floating rate payments, U.S. dollar denominated payments may be exchanged for payments denominated in foreign currencies, and payments tied to the price of one security, index, reference rate, currency or other instrument may be exchanged for payments tied to the price of a different security, index, reference rate, currency or other instrument. Swap contracts are typically individually negotiated and structured to provide exposure to a variety of particular types of investments or market factors. Swap contracts can take many different forms and are known by a variety of names. To the extent consistent with the Portfolio's investment objectives and policies, the Portfolio is not limited to any particular form or variety of swap contract. The Portfolio may utilize swaps to increase or decrease its exposure to the underlying instrument, reference rate, foreign currency, market index or other asset. The Portfolio may also enter into related derivative instruments including caps, floors and collars.
The Portfolio may be required to cover swap transactions. Obligations under swap agreements entered into on a net basis are generally accrued daily and any accrued but unpaid amounts owed by the Portfolio to the swap counterparty will be covered by segregating or earmarking cash or liquid assets. If the Portfolio enters into a swap agreement on other than a net basis, the Portfolio will segregate or earmark cash or liquid assets with a value equal to the full amount of the Portfolio's accrued obligations under the agreement.
Interest Rate Swaps, Caps, Floors and Collars. Interest rate swaps consist of an agreement between two parties to exchange their respective commitments to pay or receive interest (e.g., an exchange of floating rate payments for fixed rate payments). Interest rate swaps are generally entered into on a net basis. Interest rate swaps do not involved the delivery of securities, other underlying assets, or principal. Accordingly, the risk of loss with respect to interest rate and total rate of return swaps is limited to the net amount of interest payments that the Portfolio is contractually obligated to make.
The Portfolio may also buy or sell interest rate caps, floors and collars. The purchase of an interest rate cap entitles the purchaser, to the extent that a specified index exceeds a predetermined interest rate, to receive payments of interest on a specified notional amount from the party selling the interest rate cap. The purchase of an interest rate floor entitles the purchaser, to the extent that a specified index falls below a predetermined interest rate, to
30
receive payments of interest on a specified notional amount from the party selling the interest rate floor. A collar is a combination of a cap and a floor that preserves a certain return within a predetermined range of interest rate of values. Caps, floors and collars may be less liquid than other types of swaps. If the Portfolio sells caps, floors and collars, it will segregate liquid assets with a value equal to the full amount, accrued daily, of the Portfolio's net obligations with respect to the caps, floors or collars.
Index Swaps. An index swap consists of an agreement between two parties in which a party exchanges a cash flow based on a notional amount of a reference index for a cash flow based on a different index or on another specified instrument or reference rate. Index swaps are generally entered into on a net basis.
Inflation Swaps. Inflation swap agreements are contracts in which one party agrees to pay the cumulative percentage increase in a price index, such as the Consumer Price Index, over the term of the swap (with some lag on the referenced inflation index), and the other party pays a compounded fixed rate. Inflation swap agreements may be used to protect the net asset value of the Portfolio against an unexpected change in the rate of inflation measured by an inflation index. The value of inflation swap agreements is expected to change in response to changes in real interest rates. Real interest rates are tied to the relationship between nominal interest rates and the rate of inflation.
Currency Swaps. A currency swap consists of an agreement between two parties to exchange cash flows on a notional amount of two or more currencies based on the relative value differential among them, such as exchanging a right to receive a payment in a foreign currency for the right to receive U.S. dollars. Currency swap agreements may be entered into on a net basis or may involve the delivery of the entire principal value of one designated currency in exchange for the entire principal value of another designated currency. In such cases, the entire principal value of a currency swap is subject to the risk that the counterparty will default on its contractual delivery obligations.
Credit Default Swaps. A credit default swap consists of an agreement between two parties in which the "buyer" agrees to pay to the "seller" a periodic stream of payments over the term of the contract and the seller agrees to pay the buyer the par value (or other agreed-upon value) of a referenced debt obligation upon the occurrence of a credit event with respect to the issuer of the referenced debt obligation. Generally, a credit event means a bankruptcy, failure to pay or a restructuring. The Portfolio may be either the buyer or seller in a credit default swap. As the buyer in a credit default swap, the Portfolio would pay to the counterparty the periodic stream of payments. If no default occurs, the Portfolio would receive no benefit from the contract. As the seller in a credit default swap, the Portfolio would receive the stream of payments but would be subject to exposure on the notional amount of the swap, which it would be required to pay in the event of default. The Portfolio will generally segregate or earmark liquid assets to cover any potential obligation under a credit default swap sold by the Portfolio. The use of credit default swaps could result in losses to the Portfolio if the Adviser fails to correctly evaluate the creditworthiness of the issuer of the referenced debt obligation.
Swaptions. An option on a swap agreement, also called a "swaption," is an option that gives the buyer the right, but not the obligation, to enter into a swap on a future date in exchange for paying a market based "premium." A receiver swaption gives the owner the right to receive the total return of a specified asset, reference rate, or index. A payer swaption gives the owner the right to pay the total return of a specified asset, reference rate, or index. Swaptions also include options that allow an existing swap to be terminated or extended by one of the counterparties.
General Risks of Swaps. The risks associated with swap transactions are different from, and possibly greater than, the risks associated with investing directly in the underlying instruments. Swaps are highly specialized instruments that require investment techniques and risk analyses different from those associated with other portfolio investments. The use of swaps requires an understanding not only of the underlying instrument but also of the swap contract itself. Swap transactions may be subject to the risk factors generally applicable to derivatives transactions described above, and may also be subject to certain additional risk factors, including:
• Many swap agreements are not traded on exchanges and not subject to a similar level of government regulation as exchange-traded derivatives. As a result, parties to a swap agreement are not protected by such government regulations to the same extent participants are in transactions in derivatives traded on organized exchanges.
31
• In addition to the risk of default by the counterparty, if the creditworthiness of a counterparty to a swap agreement declines, the value of the swap agreement would be likely to decline, potentially resulting in losses.
• The swaps market is a relatively new market and currently is largely unregulated. It is possible that further developments in the swaps market, including future governmental regulation, could adversely affect the Portfolio's ability to utilize swaps, terminate existing swap agreements or realize amounts to be received under such agreements.
U.S. Government Securities: The term "U.S. Government securities" refers to a variety of fixed income securities issued or guaranteed by the U.S. Government and various instrumentalities and agencies. The U.S. Government securities that the Portfolio may purchase include U.S. Treasury bills, notes and bonds, all of which are direct obligations of the U.S. Government. In addition, the Portfolio may purchase securities issued by agencies and instrumentalities of the U.S. Government which are backed by the full faith and credit of the United States. Among the agencies and instrumentalities issuing these obligations are Ginnie Mae and the Federal Housing Administration.
The Portfolio may also purchase securities issued by agencies and instrumentalities which are not backed by the full faith and credit of the United States, but whose issuing agency or instrumentality has the right to borrow, to meet its obligations, from the U.S. Treasury. Among these agencies and instrumentalities are Fannie Mae, Freddie Mac and the Federal Home Loan Banks. Further, the Portfolio may purchase securities issued by agencies and instrumentalities which are backed solely by the credit of the issuing agency or instrumentality. Among these agencies and instrumentalities is the Federal Farm Credit System.
Warrants: Warrants are equity securities in the form of options issued by a corporation which give the holder the right to purchase stock, usually at a price that is higher than the market price at the time the warrant is issued. A purchaser takes the risk that the warrant may expire worthless because the market price of the common stock fails to rise above the price set by the warrant.
When-Issued and Delayed Delivery Securities and Forward Commitments: The Portfolio may purchase securities on a when-issued or delayed delivery basis or may purchase or sell securities on a forward commitment basis. When these transactions are negotiated, the price is fixed at the time of the commitment, but delivery and payment can take place a month or more after the date of commitment. The Portfolio may sell the securities before the settlement date, if it is deemed advisable. The securities so purchased or sold are subject to market fluctuation and no interest or dividends accrue to the purchaser prior to the settlement date.
At the time the Portfolio makes the commitment to purchase or sell securities on a when-issued, delayed delivery or forward commitment basis, it will record the transaction and thereafter reflect the value, each day, of such security purchased, or if a sale, the proceeds to be received, in determining its net asset value. At the time of delivery of the securities, their value may be more or less than the purchase or sale price. An increase in the percentage of the Portfolio's assets committed to the purchase of securities on a when-issued, delayed delivery or forward commitment basis may increase the volatility of its net asset value. The Portfolio will also earmark cash or liquid assets or establish a segregated account on the Portfolio's books in which it will continually maintain cash or cash equivalents or other liquid portfolio securities equal in value to commitments to purchase securities on a when-issued, delayed delivery or forward commitment basis. See "Leverage Risks" above for a description of leverage risk.
When, As and If Issued Securities: The Portfolio may purchase securities on a "when, as and if issued" basis under which the issuance of the security depends upon the occurrence of a subsequent event, such as approval of a merger, corporate reorganization or debt restructuring. The commitment for the purchase of any such security will not be recognized in the portfolio of the Portfolio until the Adviser determines that issuance of the security is probable. At that time, the Portfolio will record the transaction and, in determining its net asset value, will reflect the value of the security daily. At that time, the Portfolio will also establish a segregated account on its books in which it will maintain cash, cash equivalents or other liquid portfolio securities equal in value to recognized commitments for such securities.
32
An increase in the percentage of the Portfolio's assets committed to the purchase of securities on a "when, as and if issued" basis may increase the volatility of its net asset value. The Portfolio may also sell securities on a "when, as and if issued" basis provided that the issuance of the security will result automatically from the exchange or conversion of a security owned by the Portfolio at the time of sale.
Yankee and Eurobond Obligations: The Portfolio may invest in Eurobond and Yankee obligations, which are fixed income securities. The Eurobonds that the Portfolio will purchase may include bonds issued and denominated in euros. Eurobonds may be issued by government and corporate issuers in Europe. Yankee bank obligations are U.S. dollar-denominated obligations issued in the U.S. capital markets by foreign banks.
Eurobond and Yankee obligations are subject to the same risks that pertain to domestic issues, notably credit risk, market risk and liquidity risk. However, Eurobond (and to a limited extent, Yankee) obligations also are subject to certain sovereign risks. One such risk is the possibility that a sovereign country might prevent capital from flowing across its borders. Other risks include adverse political and economic developments; the extent and quality of government regulation of financial markets and institutions; the imposition of foreign withholding taxes, and the expropriation or nationalization of foreign issuers.
Zero Coupons: The Portfolio may invest in zero coupon bonds ("Zero Coupons"), which are fixed income securities that do not make regular interest payments. Instead, Zero Coupons are sold at substantial discounts from their face value. The difference between a Zero Coupon's issue or purchase price and its face value represents the imputed interest an investor will earn if the obligation is held until maturity. For tax purposes, a portion of this imputed interest is deemed as income received by zero coupon bondholders each year. The Portfolio intends to pass along such interest as a component of the Portfolio's distributions of net investment income.
Zero Coupons may offer investors the opportunity to earn higher yields than those available on ordinary interest-paying obligations of similar credit quality and maturity. However, Zero Coupon prices may also exhibit greater price volatility than ordinary fixed income securities because of the manner in which their principal and interest are returned to the investor.
INVESTMENT LIMITATIONS
Fundamental Limitations. The Portfolio is subject to the following restrictions which are fundamental policies and may not be changed without the approval of the lesser of: (1) at least 67% of the voting securities of the Portfolio present at a meeting if the holders of more than 50% of the outstanding voting securities of the Portfolio are present or represented by proxy, or (2) more than 50% of the outstanding voting securities of the Portfolio.
As a matter of fundamental policy, the Portfolio will not change its objective and will not:
(1) purchase or sell physical commodities unless acquired as a result of ownership of securities or other instruments; provided that this restriction shall not prohibit the Portfolio from purchasing or selling options, futures contracts and related options thereon, forward contracts, swaps, caps, floors, collars and any other financial instruments or from investing in securities or other instruments backed by physical commodities or as otherwise permitted by (i) the 1940 Act, as amended from time to time, (ii) the rules and regulations promulgated by the SEC under the 1940 Act, as amended from time to time, or (iii) an exemption or other relief applicable to the Portfolio from the provisions of the 1940 Act, as amended from time to time;
(2) purchase or sell real estate, although it may purchase and sell securities of companies which deal in real estate, other than real estate limited partnerships, and may purchase and sell marketable securities which are secured by interests in real estate;
(3) make loans of money or property to any person, except (a) to the extent that securities or interests in which the Portfolio may invest are considered to be loans, (b) through the loan of portfolio securities, (c) by engaging in repurchase agreements or (d) as may otherwise be permitted by (i) the 1940 Act, as amended from time to time, (ii) the rules and regulations promulgated by the SEC under the 1940 Act, as amended from time to time, or
33
(iii) an exemption or other relief applicable to the Fund from the provisions of the 1940 Act, as amended from time to time;
(4) invest in a manner inconsistent with its classification as a "diversified company" as a provided by (i) the 1940 Act, as amended from time to time, (ii) the rules and regulations promulgated by the SEC under the 1940 Act, as amended from time to time, or (iii) an exemption or other relief applicable to the Portfolio from the provisions of the 1940 Act, as amended from time to time;
(5) borrow money, except the Portfolio may borrow money to the extent permitted by (i) the 1940 Act, as amended from time to time, (ii) the rules and regulations promulgated by the SEC under the 1940 Act, as amended from time to time, or (iii) an exemption or other relief applicable to the Company from the provisions of the 1940 Act, as amended from time to time;
(6) underwrite the securities of other issuers (except to the extent that the Fund may be deemed to be an underwriter within the meaning of the 1933 Act in connection with the disposition of restricted securities);
(7) acquire any securities of companies within one industry, if, as a result of such acquisition, more than 25% of the value of the Portfolio's total assets would be invested in securities of companies within such industry; provided, however that (i) there shall be no limitation on the purchase of obligations issued or guaranteed by the U.S. Government, its agencies or instrumentalities; (ii) utility companies will be divided according to their services, for example, gas, gas transmission, electric and telephone will each be considered a separate industry; (iii) financial service companies will be classified according to the end users of their services, for example, automobile finance, bank finance and diversified finance will each be considered a separate industry; and (iv) asset-backed securities will be classified according to the underlying assets securing such securities; and
(8) issue senior securities, except the Portfolio may issue senior securities to the extent permitted by (i) the 1940 Act, as amended from time to time, (ii) the rules and regulations promulgated by the SEC under the 1940 Act, as amended from time to time, or (iii) an exemption or other relief applicable to the Portfolio from the provisions of the 1940 Act, as amended from time to time.
Non-Fundamental Limitations. The Portfolio is also subject to the following restrictions which may be changed by the Board without shareholder approval.
As a matter of non-fundamental policy, the Portfolio will not:
(1) purchase on margin, except for use of short-term credit as may be necessary for the clearance of purchases and sales of securities, provided that the Portfolio may make margin deposits in connection with transactions in options, futures, and options on futures;
(2) sell short unless the Portfolio (i) by virtue of its ownership of other securities, has the right to obtain securities equivalent in kind and amount to the securities sold and, if the right is conditional, the sale is made upon the same conditions, or (ii) maintains in a segregated account on the books of the Fund's custodian an amount that, when combined with the amount of collateral deposited with the broker in connection with the short sale, equals the current market value of the security sold short or such other amount as the SEC or its staff may permit by rule, regulation, order or interpretation (transactions in futures contracts and options, however, are not deemed to constitute selling securities short);
(3) pledge, mortgage or hypothecate assets in an amount greater than 50% of its total assets, provided that the Portfolio may earmark or segregate assets without limit in order to comply with the requirements of Section 18(f) of the 1940 Act and applicable rules, regulations or interpretations of the SEC and its staff;
(4) invest more than an aggregate of 15% of the net assets of the Portfolio determined at the time of investment, in illiquid securities provided that this limitation shall not apply to any investment in securities that are not registered under the 1933 Act but that can be sold to qualified institutional investors in accordance with
34
Rule 144A under the 1933 Act and are determined to be liquid securities under guidelines or procedures adopted by the Board;
(5) invest for the purpose of exercising control over management of any company; and
(6) invest its assets in securities of any investment company, except as permitted by the 1940 Act or the rules, regulations, interpretations or orders of the SEC and its staff thereunder; provided that the Portfolio will not invest in other investment companies in reliance on Sections 12(d)(1)(F), 12(d)(1)(G) or 12(d)(1)(J) of the 1940 Act.
Unless otherwise indicated, if a percentage limitation on investment or utilization of assets as set forth above is adhered to at the time an investment is made, a later change in percentage resulting from changes in the value or total cost of the Portfolio's assets will not be considered a violation of the restriction, and the sale of securities will not be required. The foregoing does not apply to borrowings or investments in illiquid securities.
Pursuant to an order from the SEC, the Portfolio may enter into interfund lending arrangements. Interfund loans and borrowings permit the Portfolio to lend money directly to and borrow from other portfolios of the Fund for temporary purposes. Such loans and borrowings normally extend overnight but may have a maximum duration of seven days. The Portfolio will borrow through the interfund lending facility only when the costs are lower than the costs of bank loans, and will lend through the facility only when the returns are higher than those available from an investment in repurchase agreements. In addition, the Portfolio will borrow and lend money through interfund lending arrangements only if, and to the extent that, such practice is consistent with the Portfolio's investment objective and other investments. Any delay in repayment to a lending portfolio could result in a lost investment opportunity or additional borrowing costs.
DISCLOSURE OF PORTFOLIO HOLDINGS
The Fund's Board of Trustees and the Adviser have adopted policies and procedures regarding disclosure of portfolio holdings (the "Policy"). Pursuant to the Policy, the Adviser may disclose information concerning Fund portfolio holdings only if such disclosure is consistent with the antifraud provisions of the federal securities laws and the Fund's and the Adviser's fiduciary duties to Fund shareholders. In no instance may the Adviser or the Fund receive compensation or any other consideration in connection with the disclosure of information about the portfolio securities of the Fund. Consideration includes any agreement to maintain assets in the Fund or in other investment companies or accounts managed by the Adviser or by any affiliated person of the Adviser. Non-public information concerning portfolio holdings may be divulged to third parties only when the Fund has a legitimate business purpose for doing so and the recipients of the information are subject to a duty of confidentiality. Under no circumstances shall current or prospective Fund shareholders receive non-public portfolio holdings information, except as described below.
The Fund makes available on its public website the following portfolio holdings information:
• complete portfolio holdings information monthly, at least 15 calendar days after the end of each month; and
• top 10 holdings monthly, at least 15 calendar days after the end of each month.
The Fund provides a complete schedule of portfolio holdings for the second and fourth fiscal quarters in its semiannual and annual reports, and for the first and third fiscal quarters in its filings with the SEC on Form N-Q.
All other portfolio holdings information that has not been disseminated in a manner making it available to investors generally as described above is non-public information for purposes of the Policy.
The Fund may make selective disclosure of non-public portfolio holdings information pursuant to certain exemptions set forth in the Policy. Third parties eligible for exemptions under the Policy and therefore eligible to receive such disclosures currently include fund rating agencies, information exchange subscribers, consultants and
35
analysts, portfolio analytics providers and service providers, provided that the third party expressly agrees to maintain the disclosed information in confidence and not to trade portfolio securities or related derivative securities based on the non-public information. Non-public portfolio holdings information may not be disclosed to a third party pursuant to an exemption unless and until the third party recipient has entered into a non-disclosure agreement with the Fund and the arrangement has been reviewed and approved as set forth in the Policy and discussed below. In addition, persons who owe a duty of trust or confidence to the Fund or the Adviser may receive non-public portfolio holdings information without entering into a non-disclosure agreement. Currently, these persons include (i) the Fund's independent registered public accounting firm (as of the Fund's fiscal year end and on an as needed basis), (ii) counsel to the Fund (on an as needed basis), (iii) counsel to the independent Trustees (on an as needed basis) and (iv) members of the Board of Trustees (on an as needed basis). Subject to the terms and conditions of any agreement between the Adviser or the Fund and the third party recipient, if these conditions for disclosure are satisfied, there shall be no restriction on the frequency with which Fund non-public portfolio holdings information is released, and no lag period shall apply (unless otherwise indicated below).
The Adviser may provide interest lists to broker-dealers who execute securities transactions for the Fund without entering into a non-disclosure agreement with the broker-dealers, provided that the interest list satisfies all of the following criteria: (1) the interest list must contain only the CUSIP numbers and/or ticker symbols of securities held in all registered management investment companies advised by the Adviser or any affiliate of the Adviser (the "MSIM Funds") on an aggregate, rather than a fund-by-fund basis; (2) the interest list must not contain information about the number or value of shares owned by a specified MSIM Fund; (3) the interest list may identify the investment strategy, but not the particular MSIM Funds, to which the list relates; and (4) the interest list may not identify the portfolio manager or team members responsible for managing the MSIM Funds.
Fund shareholders may elect in some circumstances to redeem their shares of the Fund in exchange for their pro rata share of the securities held by the Fund. Under such circumstances, Fund shareholders may receive a complete listing of the holdings of the Fund up to seven calendar days prior to making the redemption request provided that they represent in writing that they agree to not to disclose or trade on the basis of the portfolio holdings information.
The Fund may discuss or otherwise disclose performance attribution analyses (i.e., mention the effects of having a particular security in the portfolio(s)) where such discussion is not contemporaneously made public, provided that the particular holding has been disclosed publicly. Additionally, any discussion of the analyses may not be more current than the date the holding was disclosed publicly.
The Fund may disclose portfolio holdings to transition managers, provided that the Fund has entered into a non-disclosure or confidentiality agreement with the party requesting that the information be provided to the transition manager and the party to the non-disclosure agreement has, in turn, entered into a non-disclosure or confidentiality agreement with the transition manager.
The Adviser, the Fund and/or the Portfolio currently have entered into ongoing arrangements with the following parties:
| Name | Information Disclosed | Frequency(1) | Lag Time | ||||||||||||
| Service Providers | |||||||||||||||
| RiskMetrics Group (proxy voting agent)(*) | Complete portfolio holdings | Daily basis | (2) | ||||||||||||
| State Street Bank and Trust Company(*) | Complete portfolio holdings | As needed | (2) | ||||||||||||
| BlackRock Financial Management Inc(*) | Complete portfolio holdings | Daily basis | (2) | ||||||||||||
| Fund Rating Agencies | |||||||||||||||
| Lipper(*) | Top ten and complete portfolio holdings | Monthly basis | Approximately six business days after month end | ||||||||||||
| Investment Company Institute(**) | Top ten portfolio holdings | Quarterly basis | Approximately 15 days after quarter end | ||||||||||||
| Consultants and Analysts | |||||||||||||||
| Citigroup(*) | Complete portfolio holdings | Monthly and quarterly basis, respectively(5) | At least one day after month/quarter end | ||||||||||||
| Credit Suisse First Boston(*) | Top ten and complete portfolio holdings | Monthly and quarterly basis, respectively | Approximately 10-12 days after month/quarter end | ||||||||||||
36
| Name | Information Disclosed | Frequency(1) | Lag Time | ||||||||||||
| Merrill Lynch(*) | Top ten and complete portfolio holdings | Monthly and quarterly basis, respectively(5) | Approximately 10-12 days after month/quarter end | ||||||||||||
| Gallagher Fiduciary Partners(**) | Top ten portfolio holdings(3) | Quarterly basis | At least 15 days after quarter end | ||||||||||||
| Portfolio Analytics Providers | |||||||||||||||
| FactSet Research Systems, Inc.(*) | Complete portfolio holdings | Daily basis | One day | ||||||||||||
(*) This entity has agreed to maintain Fund non-public portfolio holdings information in confidence and not to trade portfolio securities based on the non-public portfolio holdings information.
(1) Dissemination of portfolio holdings information to entities listed above may occur less frequently than indicated (or not at all).
(2) Information will typically be provided on a real time basis or as soon thereafter as possible.
(3) Complete portfolio holdings will also be provided upon request from time to time on a quarterly basis, with at least a 30 day lag.
(4) Top ten portfolio holdings will also be provided upon request from time to time, with at least a 15 day lag.
(5) This information will also be provided upon request from time to time.
(6) Complete portfolio holdings will also be provided upon request from time to time.
All disclosures of non-public portfolio holdings information made to third parties pursuant to the exemptions set forth in the Policy must be reviewed by Morgan Stanley Investment Management's ("MSIM") Legal and Compliance Division and approved by the Head of the Long-Only Business of MSIM. Disclosures made to third parties in connection with (i) broker-dealer interest lists; (ii) shareholder in-kind distributions; (iii) attribution analyses; or (iv) transition managers are pre-approved for purposes of the Policy. In addition, the following categories of third parties that may receive non-public portfolio holdings information are also pre-approved provided that they enter into non-disclosure agreements (as discussed above) (i) fund rating agencies; (ii) information exchange subscribers; (iii) consultants and analysts (including defined benefit and defined contribution plan sponsors, and variable annuity providers); (iv) portfolio analytics providers; and (v) service providers.
The Adviser shall report quarterly to the Board of Trustees (or a designated committee thereof) at the next regularly scheduled meeting (i) any material information concerning all parties receiving non-public portfolio holdings information pursuant to an exemption; and (ii) any new non-disclosure agreements entered into during the reporting period. Procedures to monitor the use of such non-public portfolio holdings information may include requiring annual certifications that the recipients have utilized such information only pursuant to the terms of the agreement between the recipient and the Adviser and, for those recipients receiving information electronically, acceptance of the information will constitute reaffirmation that the third party expressly agrees to maintain the disclosed information in confidence and not to trade portfolio securities based on the non-public information.
PURCHASE OF SHARES
The Portfolio reserves the right in its sole discretion (i) to suspend the offering of its shares, (ii) to reject purchase orders and (iii) to reduce or waive the minimum for initial and additional investments. The minimum initial or additional investment in Class I shares, Class P shares or Class L shares may be waived for certain investments, including sales through banks, broker-dealers and other financial institutions (including registered investment advisers and financial planners) purchasing shares on behalf of their clients in (i) discretionary and non-discretionary advisory programs, (ii) fund supermarkets, (iii) asset allocation programs or (iv) other programs in which the client pays an asset-based fee for advice or for executing transactions in Portfolio shares or for otherwise participating in the program. In addition, the minimum initial investments will be waived for: (i) certain retirement plans investing directly with the Fund; (ii) retirement plans investing through certain retirement plan platforms; (iii) certain endowments, foundations and other not for profit entities investing directly with the Fund; (iv) other registered investment companies advised by Morgan Stanley Investment Management or any of its affiliates; (v) Morgan Stanley Investment Management and its affiliates with respect to shares held in connection with certain retirement and deferred compensation programs established for their employees; (vi) the Independent Trustees of the Fund; (vii) clients who owned Portfolio shares as of December 31, 2007; and (viii) investments made in connection with certain reorganizations as approved by the Adviser. If the value of your account falls below the minimum initial investment amount for Class I shares, Class P shares or Class L shares as a result of share redemptions or you no longer meet one of the waiver criteria set forth above, your account may be subject to involuntary conversion or involuntary redemption.
37
Investors purchasing and redeeming shares of the Portfolio through a financial intermediary may be charged a transaction-based fee or other fee for the financial intermediary's services. Each financial intermediary is responsible for sending you a schedule of fees and information regarding any additional or different conditions regarding purchases and redemptions. Customers of financial intermediaries should read this SAI in light of the terms governing accounts with their organization. The Fund does not pay compensation to or receive compensation from financial intermediaries for the sale of Class I shares.
Class H shares are subject to a sales charge equal to a maximum of 4.75% calculated as a percentage of the offering price. Upon notice to selected broker-dealers, the Distributor may reallow up to the full applicable front-end sales charge during periods specified in such notice.
Neither the Distributor nor the Fund will be responsible for any loss, liability, cost, or expense for acting upon facsimile instructions or upon telephone instructions that they reasonably believe to be genuine. In order to confirm that telephone instructions in connection with redemptions are genuine, the Fund and Distributor will provide written confirmation of transactions initiated by telephone.
Conversion To a New Share Class. If the value of an account falls below the investment minimum for the Class of shares held by the account because of shareholder redemption(s) or the failure to meet one of the waiver criteria set forth above, and if the account value remains below such investment minimum, the shares in such account may, at the Adviser's discretion, convert to another class of shares offered by the Portfolio, if an account meets the minimum investment amount for such class, and will be subject to the shareholder services fee and other features applicable to such shares. Conversion to another class of shares will result in holding a share class with higher fees. The Fund will not convert to another class of shares based solely upon changes in the market that reduce the net asset value of shares. Under current tax law, conversion between share classes is not a taxable event to the shareholder. Shareholders will be notified prior to any such conversion.
Involuntary Redemption of Shares. If the value of an account falls below the investment minimum for Class I shares, Class P shares, Class H shares or Class L shares because of shareholder redemption(s) or you no longer meet one of the waiver criteria set forth above, and if the account value remains below such investment minimum, the shares in such account may be subject to redemption by the Fund. The Fund will not redeem shares based solely upon changes in the market that reduce the net asset value of shares. If shares are redeemed, redemption proceeds will be promptly paid to the shareholder. Shareholders will be notified prior to any such redemption.
REDEMPTION OF SHARES
The Portfolio may suspend redemption privileges or postpone the date of payment (i) during any period that the New York Stock Exchange ("NYSE") is closed, or trading on the NYSE is restricted as determined by the SEC, (ii) during any period when an emergency exists as defined by the rules of the SEC as a result of which it is not reasonably practicable for the Portfolio to dispose of securities owned by it, or fairly to determine the value of its assets, and (iii) for such other periods as the SEC may permit. The Fund has made an election with the SEC pursuant to Rule 18f-1 under the 1940 Act to pay in cash all redemptions requested by any shareholder of record limited in amount during any 90-day period to the lesser of $250,000 or 1% of the net assets of the Portfolio at the beginning of such period. Such commitment is irrevocable without the prior approval of the SEC. Redemptions in excess of the above limits may be paid in whole or in part in investment securities or in cash, as the Trustees may deem advisable; however, payment will be made wholly in cash unless the Trustees believe that economic or market conditions exist which would make such a practice detrimental to the best interests of the Fund. If redemptions are paid in investment securities, such securities will be valued as set forth in the Fund's prospectuses under "Valuation of Shares" and a redeeming shareholder would normally incur brokerage expenses in converting these securities to cash.
Redemption proceeds may be more or less than the shareholder's cost depending on the market value of the securities held by the Portfolio. See the prospectus for additional information about redeeming shares of the Portfolio.
38
TRANSACTIONS WITH BROKER/DEALERS
The Fund has authorized certain brokers to accept on its behalf purchase and redemption orders. Some of these brokers are authorized to designate other intermediaries to accept purchase and redemption orders on the Fund's behalf. For purposes of determining the purchase price of shares, the Fund will be deemed to have received a purchase or redemption order when an authorized broker, or if applicable, a broker's authorized designee, accepts the order. In other words, orders will be priced at the net asset value next computed after such orders are accepted by an authorized broker or the broker's authorized designee.
SHAREHOLDER SERVICES
Transfer of Shares
Shareholders may transfer shares of the Portfolio to another person by written request to Shareholder Services at Morgan Stanley Institutional Fund Trust, c/o Morgan Stanley Services Company Inc., P.O. Box 219804, Kansas City, MO 64121-9804. If shares are being transferred to a new account, requests for transfer must be accompanied by a completed Account Registration Form for the receiving party. If shares are being transferred to an existing account, the request should clearly identify the account and number of shares to be transferred and include the signature of all registered owners and all share certificates, if any, which are subject to the transfer. The signature on the letter of request, the share certificate or any stock power must be guaranteed in the same manner as described under "Redemption of Shares." As in the case of redemptions, the written request must be received in good order before any transfer can be made.
VALUATION OF SHARES
Net asset value per share ("NAV") is determined by dividing the total market value of the Portfolio's investments and other assets, less any liabilities, by the total outstanding shares of the Portfolio. The NAV for each class of shares offered by the Fund may differ due to class-specific expenses paid by each class, including the shareholder servicing fees charged to Class P shares, Class H shares and Class L shares.
In the calculation of the Portfolio's NAV: (1) an equity portfolio security listed or traded on the NYSE, or other exchange is valued at its latest sale price, prior to the time when assets are valued; if there were no sales that day, the security is valued at the mean between the last reported bid and asked price; (2) an equity portfolio security listed or traded on the Nasdaq is valued at the Nasdaq Official Closing Price; if there were no sales that day, the security is valued at the mean between the last reported bid and asked price; and (3) all other portfolio securities for which over-the-counter market quotations are readily available are valued at the mean between the last reported bid and asked price. In cases where a security is traded on more than one exchange, the security is valued on the exchange designated as the primary market. For equity securities traded on foreign exchanges, the last reported sale price or the latest bid price may be used if there were no sales on a particular day. When market quotations are not readily available, including circumstances under which it is determined by the Adviser that the sale price, the bid price or the mean between the last reported bid and asked price are not reflective of a security's market value, portfolio securities are valued at their fair value as determined in good faith under procedures established by and under the general supervision of the Board. For valuation purposes, quotations of foreign portfolio securities, other assets and liabilities and forward contracts stated in foreign currency are translated into U.S. dollar equivalents at the prevailing market rates prior to the close of the NYSE.
Short-term debt securities with remaining maturities of 60 days or less at the time of purchase are valued at amortized cost, unless the Board determines such valuation does not reflect the securities' market value, in which case these securities will be valued at their fair value as determined by the Board.
Certain of the Portfolio's securities may be valued by an outside pricing service approved by the Board. The pricing service may utilize a matrix system incorporating security quality, maturity and coupon as the evaluation model parameters, and/or research evaluations by its staff, including review of broker-dealer market price quotations in determining what it believes is the fair valuation of the portfolio securities valued by such pricing service.
39
Listed options on debt securities are valued at the latest sale price on the exchange on which they are listed unless no sales of such options have taken place that day, in which case they will be valued at the mean between their latest bid and asked prices. Unlisted options on debt securities and all options on equity securities are valued at the mean between their latest bid and asked prices. Futures are valued at the latest price published by the commodities exchange on which they trade unless it is determined that such price does not reflect their market value, in which case they will be valued at their fair value as determined in good faith under procedures established by and under the supervision of the Trustees.
Generally, trading in foreign securities, as well as corporate bonds, U.S. Government securities and money market instruments, is substantially completed each day at various times prior to the close of the NYSE. The values of such securities used in computing the net asset value of the Portfolio's shares are determined as of such times. Foreign currency exchange rates are also generally determined prior to the close of the NYSE. Occasionally, events which may affect the values of such securities and such exchange rates may occur between the times at which they are determined and the close of the NYSE and will therefore not be reflected in the computation of the Portfolio's net asset value. If events that may affect the value of such securities occur during such period, then these securities may be valued at their fair value as determined in good faith under procedures established by and under the supervision of the Trustees.
MANAGEMENT OF THE FUND
The Board supervises the Fund's affairs under the laws governing business trusts in the Commonwealth of Pennsylvania. The Board has approved contracts under which certain companies provide essential management, administrative and shareholder services to the Fund.
Trustees and Officers. The Board of the Fund consists of 10 Trustees. These same individuals also serve as directors or trustees for certain of the funds advised by the Adviser and Morgan Stanley AIP GP LP. Nine Trustees have no affiliation or business connection with the Adviser or any of its affiliated persons and do not own any stock or other securities issued by the Adviser's parent company, Morgan Stanley. These are the "non-interested" or "Independent" Trustees. The other Trustee (the "Interested Trustee") is affiliated with the Adviser.
Board Structure and Oversight Function
The Board's leadership structure features an Independent Trustee serving as Chairperson and the Board Committees described below. The Chairperson participates in the preparation of the agenda for meetings of the Board and the preparation of information to be presented to the Board with respect to matters to be acted upon by the Board. The Chairperson also presides at all meetings of the Board and is involved in discussions regarding matters pertaining to the oversight of the management of the Fund between meetings.
The Board of Trustees operates using a system of committees to facilitate the timely and efficient consideration of all matters of importance to the Trustees, the Fund and Fund stockholders, and to facilitate compliance with legal and regulatory requirements and oversight of the Fund's activities and associated risks. The Board of Trustees has established four standing committees: (1) Audit Committee, (2) Governance Committee, (3) Compliance and Insurance Committee and (4) Investment Committee. The Audit Committee and the Governance Committee are comprised exclusively of Independent Trustees. Each committee charter governs the scope of the committee's responsibilities with respect to the oversight of the Fund. The responsibilities of each committee, including their oversight responsibilities, are described further under the caption "Independent Trustees and the Committees."
The Fund is subject to a number of risks, including investment, compliance, operational and valuation risk, among others. The Board of Trustees oversees these risks as part of its broader oversight of the Fund's affairs through various Board and committee activities. The Board has adopted, and periodically reviews, policies and procedures designed to address various risks to the Fund. In addition, appropriate personnel, including but not limited to the Fund's Chief Compliance Officer, members of the Fund's administration and accounting teams, representatives from the Fund's independent registered public accounting firm, the Fund's Treasurer, portfolio management personnel and independent valuation and brokerage evaluation service providers, make regular
40
reports regarding the Fund's activities and related risks to the Board of Trustees and the committees, as appropriate. These reports include, among others, quarterly performance reports, quarterly derivatives activity and risk reports and discussions with members of the risk teams relating to each asset class. The Board's committee structure allows separate committees to focus on different aspects of risk and potential impact on some or all of the funds in the complex and then report back to the full Board. In between regular meetings, Fund officers also communicate with the Directors/Trustees regarding material exceptions and items relevant to the Board's risk oversight function. The Board recognizes that it is not possible to identify all of the risks that may affect the Fund, and that it is not possible to develop processes and controls to eliminate all of the risks that may affect the Fund. Moreover, the Board recognizes that it may be necessary for the Fund to bear certain risks (such as investment risk) to achieve its investment objective.
As needed between meetings of the Board, the Board or a specific committee receives and reviews reports relating to the Fund and engages in discussions with appropriate parties relating to the Fund's operations and related risks.
Independent Trustees. The Fund seeks as Trustee individuals of distinction and experience in business and finance, government service or academia. In determining that a particular Trustee was and continues to be qualified to serve as Trustee, the Board has considered a variety of criteria, none of which, in isolation, was controlling. Based on a review of the experience, qualifications, attributes or skills of each Trustee, including those enumerated in the table below, the Board has determined that each of the Trustee is qualified to serve as a Trustee of the Fund. In addition, the Board believes that, collectively, the Trustees have balanced and diverse experience, qualifications, attributes and skills that allow the Board to operate effectively in governing the Fund and protecting the interests of shareholders. Information about the Fund's Governance Committee and Board of Trustee nomination process is provided below under the caption "Independent Trustee and the Committees."
The Independent Trustees of the Fund, their age, address, term of office and length of time served, their principal business occupations during the past five years, the number of portfolios in the Fund Complex (defined below) overseen by each Independent Trustee (as of December 31, 2011) and other directorships, if any, held by the Trustees, are shown below. The Fund Complex includes all open-end and closed-end funds (including all of their portfolios) advised by the Adviser and any funds that have an adviser that is an affiliate of the Adviser (including, but not limited to, Morgan Stanley AIP GP LP) (the "Morgan Stanley Funds").
41
Independent Trustees:
| Name, Age and Address of Independent Trustee | Position(s) Held with Registrant | Length of Time Served* | Principal Occupation(s) During Past 5 Years | Number of Portfolios in Fund Complex Overseen by Independent Trustee | Other Directorships Held by Independent Trustee** | ||||||||||||||||||
| Frank L. Bowman (67) c/o Kramer Levin Naftalis & Frankel LLP Counsel to the Independent Trustees 1177 Avenue of the Americas New York, NY 10036 | Trustee | Since August 2006 | President, Strategic Decisions, LLC (consulting) (since February 2009); Director or Trustee of various Morgan Stanley Funds (since August 2006); Chairperson of the Insurance Sub-Committee of the Compliance and Insurance Committee (since February 2007); served as President and Chief Executive Officer of the Nuclear Energy Institute (policy organization) (February 2005-November 2008); retired as Admiral, U.S. Navy after serving over 38 years on active duty including 8 years as Director of the Naval Nuclear Propulsion Program in the Department of the Navy and the U.S. Department of Energy (1996-2004); served as Chief of Naval Personnel (July 1994-September 1996); and on the Joint Staff as Director of Political Military Affairs (June 1992-July 1994); Knighted as Honorary Knight Commander of the Most Excellent Order of the British Empire; Awarded the Officer de l'Orde National du Mérite by the French Government; elected to the National Academy of Engineering (2009). | 102 | Director of BP p.l.c.; Director of Naval and Nuclear Technologies LLP; Director of the Armed Services YMCA of the USA and the Naval Submarine League; Director of the American Shipbuilding Suppliers Association; Member of the National Security Advisory Council of the Center for U.S. Global Engagement and a member of the CNA Military Advisory Board; Member of the American Lung Association's President's Council. | ||||||||||||||||||
* Each Trustee serves an indefinite term, until his or her successor is elected.
** This includes any directorships at public companies and registered investment companies held by the Trustee at any time during the past five years.
42
| Name, Age and Address of Independent Trustee | Position(s) Held with Registrant | Length of Time Served* | Principal Occupation(s) During Past 5 Years | Number of Portfolios in Fund Complex Overseen by Independent Trustee | Other Directorships Held by Independent Trustee** | ||||||||||||||||||
| Michael Bozic (71) c/o Kramer Levin Naftalis & Frankel LLP Counsel to the Independent Trustees 1177 Avenue of the Americas New York, NY 10036 | Trustee | Since April 1994 | Private investor; Chairperson of the Compliance and Insurance Committee (since October 2006); Director or Trustee of various Morgan Stanley Funds (since April 1994); formerly, Chairperson of the Insurance Committee (July 2006-September 2006), Vice Chairman of Kmart Corporation (December 1998-October 2000), Chairman and Chief Executive Officer of Levitz Furniture Corporation (November 1995-November 1998) and President and Chief Executive Officer of Hills Department Stores (May 1991-July 1995); variously Chairman, Chief Executive Officer, President and Chief Operating Officer (1987-1991) of the Sears Merchandise Group of Sears, Roebuck & Co. | 104 | Director of various business organizations. | ||||||||||||||||||
| Kathleen A. Dennis (58) c/o Kramer Levin Naftalis & Frankel LLP Counsel to the Independent Trustees 1177 Avenue of the Americas New York, NY 10036 | Trustee | Since August 2006 | President, Cedarwood Associates (mutual fund and investment management consulting) (since July 2006); Chairperson of the Money Market and Alternatives Sub-Committee of the Investment Committee (since October 2006) and Director or Trustee of various Morgan Stanley Funds (since August 2006); formerly, Senior Managing Director of Victory Capital Management (1993-2006). | 102 | Director of various non-profit organizations. | ||||||||||||||||||
* Each Trustee serves an indefinite term, until his or her successor is elected.
** This includes any directorships at public companies and registered investment companies held by the Trustee at any time during the past five years.
43
| Name, Age and Address of Independent Trustee | Position(s) Held with Registrant | Length of Time Served* | Principal Occupation(s) During Past 5 Years | Number of Portfolios in Fund Complex Overseen by Independent Trustee | Other Directorships Held by Independent Trustee** | ||||||||||||||||||
| Dr. Manuel H. Johnson (63) c/o Johnson Smick Group, Inc. 888 16th Street, N.W. Suite 740 Washington, D.C. 20006 | Trustee | Since July 1991 | Senior Partner, Johnson Smick International, Inc. (consulting firm); Chairperson of the Investment Committee (since October 2006) and Director or Trustee of various Morgan Stanley Funds (since July 1991); Co-Chairman and a founder of the Group of Seven Council (G7C) (international economic commission); formerly, Chairperson of the Audit Committee (July 1991-September 2006); Vice Chairman of the Board of Governors of the Federal Reserve System and Assistant Secretary of the U.S. Treasury. | 104 | Director of NVR, Inc. (home construction). | ||||||||||||||||||
| Joseph J. Kearns (69) c/o Kearns & Associates LLC PMB754 22631 Pacific Coast Highway Malibu, CA 90265 | Trustee | Since August 1994 | President, Kearns & Associates LLC (investment consulting); Chairperson of the Audit Committee (since October 2006) and Director or Trustee of various Morgan Stanley Funds (since August 1994); formerly, Deputy Chairperson of the Audit Committee (July 2003-September 2006) and Chairperson of the Audit Committee of various Morgan Stanley Funds (since August 1994); CFO of the J. Paul Getty Trust. | 105 | Director of Electro Rent Corporation (equipment leasing) and The Ford Family Foundation. | ||||||||||||||||||
* Each Trustee serves an indefinite term, until his or her successor is elected.
** This includes any directorships at public companies and registered investment companies held by the Trustee at any time during the past five years.
44
| Name, Age and Address of Independent Trustee | Position(s) Held with Registrant | Length of Time Served* | Principal Occupation(s) During Past 5 Years | Number of Portfolios in Fund Complex Overseen by Independent Trustee | Other Directorships Held by Independent Trustee** | ||||||||||||||||||
| Michael F. Klein (53) c/o Kramer Levin Naftalis & Frankel LLP Counsel to the Independent Trustees 1177 Avenue of the Americas New York, NY 10036 | Trustee | Since August 2006 | Managing Director, Aetos Capital, LLC (since March 2000) and Co-President, Aetos Alternatives Management, LLC (since January 2004); Chairperson of the Fixed-Income Sub-Committee of the Investment Committee (since October 2006) and Director or Trustee of various Morgan Stanley Funds (since August 2006); formerly, Managing Director, Morgan Stanley & Co. Inc. and Morgan Stanley Dean Witter Investment Management, President, various Morgan Stanley Funds (June 1998-March 2000) and Principal, Morgan Stanley & Co. Inc. and Morgan Stanley Dean Witter Investment Management (August 1997-December 1999). | 102 | Director of certain investment funds managed or sponsored by Aetos Capital, LLC. Director of Sanitized AG and Sanitized Marketing AG (specialty chemicals). | ||||||||||||||||||
| Michael E. Nugent (76) c/o Triumph Capital, L.P. 445 Park Avenue New York, NY 10022 | Chairperson of the Board and Trustee | Chairpersonof the Boards since July 2006 and Trustee since July 1991 | General Partner, Triumph Capital, L.P. (private investment partnership); Chairperson of the Boards of various Morgan Stanley Funds (since July 2006); Director or Trustee of various Morgan Stanley Funds (since July 1991); formerly, Chairperson of the Insurance Committee (until July 2006). | 104 | None. | ||||||||||||||||||
| W. Allen Reed (65) c/o Kramer Levin Naftalis & Frankel LLP Counsel to the Independent Trustees 1177 Avenue of the Americas New York, NY 10036 | Trustee | Since August 2006 | Chairperson of the Equity Sub-Committee of the Investment Committee (since October 2006) and Director or Trustee of various Morgan Stanley Funds (since August 2006); formerly, President and CEO of General Motors Asset Management; Chairman and Chief Executive Officer of the GM Trust Bank and Corporate Vice President of General Motors Corporation (August 1994-December 2005). | 102 | Director of Temple-Inland Industries (packaging and forest products), Director of Legg Mason, Inc. and Director of the Auburn University Foundation. | ||||||||||||||||||
| Fergus Reid (79) c/o Joe Pietryka, Inc. 85 Charles Colman Blvd. Pawling, NY 12564 | Trustee | Since June 1992 | Chairman, Joe Pietryka, Inc.; Chairperson of the Governance Committee and Director or Trustee of various Morgan Stanley Funds (since June 1992). | 105 | Trustee and Director of certain investment companies in the JPMorgan Funds complex managed by JPMorgan Investment Management Inc. | ||||||||||||||||||
* Each Trustee serves an indefinite term, until his or her successor is elected.
** This includes any directorships at public companies and registered investment companies held by the Trustee at any time during the past five years.
45
The Trustee who is affiliated with the Adviser or affiliates of the Adviser (as set forth below) and executive officers of the Fund, their age, address, term of office and length of time served, their principal business occupations during the past five years, the number of portfolios in the Fund Complex overseen by the Interested Trustee (as of December 31, 2011) and the other directorships, if any, held by the Interested Trustee, are shown below.
Interested Trustee:
| Name, Age and Address of Interested Trustee | Position(s) Held with Registrant | Length of Time Served* | Principal Occupation(s) During Past 5 Years | Number of Portfolios in Fund Complex Overseen by Interested Trustee | Other Directorships Held by Interested Trustee** | ||||||||||||||||||
| James F. Higgins (64) c/o Morgan Stanley Services Company Inc. Harborside Financial Center 201 Plaza Two Jersey City, NJ 07311 | Trustee | Since June 2000 | Director or Trustee of various Morgan Stanley Funds (since June 2000); Senior Advisor of Morgan Stanley (since August 2000). | 103 | Director of AXA Financial, Inc. and The Equitable Life Assurance Society of the United States (financial services). | ||||||||||||||||||
* Each Trustee serves an indefinite term, until his or her successor is elected.
** This includes any directorships at public companies and registered investment companies held by the Trustee at any time during the past five years.
Executive Officers:
| Name, Age and Address of Executive Trustee | Position(s) Held with Registrant | Length of Time Served*** | Principal Occupation(s) During Past 5 Years | ||||||||||||
| Arthur Lev (50) 522 Fifth Avenue New York, NY 10036 | President and Principal Executive Officer—Equity and Fixed Income Funds | Since June 2011 | President and Principal Executive Officer (since June 2011) of the Equity and Fixed Income Funds in the Fund Complex; Head of the Long Only Business of Morgan Stanley Investment Management (since February 2011); Managing Director of the Adviser and various entities affiliated with the Adviser (since December 2006). Formerly, Chief Strategy Officer of Morgan Stanley Investment Management Traditional Asset Management business (November 2010-February 2011); General Counsel of Morgan Stanley Investment Management (December 2006-October 2010); Partner and General Counsel of FrontPoint Partners LLC (July 2002-December 2006); Managing Director and General Counsel of Morgan Stanley Investment Management (May 2000-June 2002). | ||||||||||||
| Mary Ann Picciotto (39) c/o Morgan Stanley Services Company Inc. Harborside Financial Center 201 Plaza Two Jersey City, NJ 07311 | Chief Compliance Officer | Since May 2010 | Managing Director of the Adviser and various entities affiliated with the Adviser; Chief Compliance Officer of the various Morgan Stanley Funds (since May 2010); Chief Compliance Officer of the Adviser (since April 2007). | ||||||||||||
| Stefanie V. Chang Yu (45) 522 Fifth Avenue New York, NY 10036 | Vice President | Since December 1997 | Managing Director of the Adviser and various entities affiliated with the Adviser; Vice President of various Morgan Stanley Funds (since December 1997). | ||||||||||||
| Francis J. Smith (46) c/o Morgan Stanley Services Company Inc. Harborside Financial Center 201 Plaza Two Jersey City, NJ 07311 | Treasurer and Principal Financial Officer | Treasurer since July 2003 and Principal Financial Officer since September 2002 | Executive Director of the Adviser and various entities affiliated with the Adviser; Treasurer and Principal Financial Officer of various Morgan Stanley Funds (since July 2003). | ||||||||||||
*** Each Officer serves an indefinite term, until his or her successor is elected.
46
| Name, Age and Address of Executive Trustee | Position(s) Held with Registrant | Length of Time Served*** | Principal Occupation(s) During Past 5 Years | ||||||||||||
| Mary E. Mullin (45) 522 Fifth Avenue New York, NY 10036 | Secretary | Since June 1999 | Executive Director of the Adviser and various entities affiliated with the Adviser; Secretary of various Morgan Stanley Funds (since June 1999). | ||||||||||||
*** Each Officer serves an indefinite term, until his or her successor is elected.
In addition, the following individuals who are officers of the Adviser or who are officers its affiliates serve as assistant secretaries of the Fund: Joanne Antico, Joseph C. Benedetti, Daniel E. Burton, Tara A. Farrelly and Edward J. Meehan.
For each Trustee, the dollar range of equity securities beneficially owned by the Trustee in the Fund and in the Family of Investment Companies (Family of Investment Companies includes all of the registered investment companies advised by the Adviser and Morgan Stanley AIP GP LP) for the calendar year ended December 31, 2011 is set forth in the table below.
| Name of Trustee | Dollar Range of Equity Securities in the Fund (as of December 31, 2011) | Aggregate Dollar Range of Equity Securities in All Registered Investment Companies Overseen by Trustee in Family of Investment Companies (as of December 31, 2011) | |||||||||
| Independent: | |||||||||||
| Frank L. Bowman(1) | * | over $100,000 | |||||||||
| Michael Bozic | None | over $100,000 | |||||||||
| Kathleen A. Dennis | None | over $100,000 | |||||||||
| Manuel H. Johnson | None | over $100,000 | |||||||||
| Joseph J. Kearns(1) | * | over $100,000 | |||||||||
| Michael F. Klein | * | over $100,000 | |||||||||
| Michael E. Nugent | None | over $100,000 | |||||||||
| W. Allen Reed(1) | * | over $100,000 | |||||||||
| Fergus Reid(1) | None | over $100,000 | |||||||||
| Interested: | |||||||||||
| James F. Higgins | None | over $100,000 | |||||||||
* Joseph J. Kearns—Global Strategist Portfolio ($10,001-$50,000); Corporate Bond Portfolio ($50,001-$100,000). Michael F. Klein—Mid Cap Growth Portfolio ($10,001-$50,000). Frank L. Bowman—Mid Cap Growth Portfolio ($10,001-$50,000). W. Allen Reed—Mid Cap Growth Portfolio ($10,001-$50,000).
(1) Includes the total amount of compensation deferred by the Trustee at his election pursuant to a deferred compensation plan. Such deferred compensation is placed in a deferral account and deemed to be invested in one or more of the Morgan Stanley Funds (or portfolio thereof) that are offered as investment options under the plan.
As to each Independent Trustee and his or her immediate family members, no person owned beneficially or of record securities in an investment adviser or principal underwriter of the Fund, or a person (other than a registered investment company) directly or indirectly controlling, controlled by or under common control with an investment adviser or principal underwriter of the Fund.
As of December 31, 2011, the Trustees and Officers of the Fund, as a group, owned less than 1% of the outstanding common stock of each Portfolio of the Fund.
Independent Trustees and the Committees. Law and regulation establish both general guidelines and specific duties for the Independent Trustees. The Board has four committees: (1) Audit Committee, (2) Governance Committee, (3) Compliance and Insurance Committee and (4) Investment Committee. Three of the Independent Trustees serve as members of the Audit Committee, three Independent Trustees serve as members of the Governance Committee, four Trustees, including three Independent Trustees, serve as members of the Compliance and Insurance Committee and all of the Trustees serve as members of the Investment Committee.
47
The Independent Trustees are charged with recommending to the full Board approval of management, advisory and administration contracts, shareholder service plans and distribution and underwriting agreements; continually reviewing fund performance, checking on the pricing of portfolio securities, brokerage commissions, transfer agent costs and performance and trading among funds in the same complex; and approving fidelity bond and related insurance coverage and allocations, as well as other matters that arise from time to time. The Independent Trustees are required to select and nominate individuals to fill any Independent Trustee vacancy on the board of any fund that has a Rule 12b-1 plan of distribution.
The Board of Trustees has a separately-designated standing Audit Committee established in accordance with Section 3(a)(58)(A) of the Securities Exchange Act of 1934, as amended. The Audit Committee is charged with recommending to the full Board the engagement or discharge of the Fund's independent registered public accounting firm; directing investigations into matters within the scope of the independent registered public accounting firm's duties, including the power to retain outside specialists; reviewing with the independent registered public accounting firm the audit plan and results of the auditing engagement; approving professional services provided by the independent registered public accounting firm and other accounting firms prior to the performance of the services; reviewing the independence of the independent registered public accounting firm; considering the range of audit and non-audit fees; reviewing the adequacy of the Fund's system of internal controls; and reviewing the valuation process. The Fund has adopted a formal, written Audit Committee Charter.
The members of the Audit Committee of the Fund are Joseph J. Kearns, Michael E. Nugent and W. Allen Reed. None of the members of the Fund's Audit Committee is an "interested person," as defined under the 1940 Act, of the Fund (with such disinterested Trustees being "Independent Trustees" or individually, "Independent Trustee"). Each Independent Trustee is also "independent" from the Fund under the listing standards of the NYSE. The Chairperson of the Audit Committee of the Fund is Joseph J. Kearns.
The Board of Trustees of the Fund also has a Governance Committee. The Governance Committee identifies individuals qualified to serve as Independent Trustees on the Fund's Board and on committees of the Board and recommends such qualified individuals for nomination by the Fund's Independent Trustees as candidates for election as Independent Trustees, advises the Fund's Board with respect to Board composition, procedures and committees, develops and recommends to the Fund's Board a set of corporate governance principles applicable to the Fund, monitors and makes recommendations on corporate governance matters and policies and procedures of the Fund's Board of Trustees and any Board committees and oversees periodic evaluations of the Fund's Board and its committees. The members of the Governance Committee of the Fund are Kathleen A. Dennis, Michael F. Klein and Fergus Reid, each of whom is an Independent Trustee. The Chairperson of the Governance Committee is Fergus Reid.
The Fund does not have a separate nominating committee. While the Fund's Governance Committee recommends qualified candidates for nominations as Independent Trustees, the Board of Trustees of the Fund believes that the task of nominating prospective Independent Trustees is important enough to require the participation of all current Independent Trustees, rather than a separate committee consisting of only certain Independent Trustees. Accordingly, each Independent Trustee (Frank L. Bowman, Michael Bozic, Kathleen A. Dennis, Manuel H. Johnson, Joseph J. Kearns, Michael F. Klein, Michael E. Nugent, W. Allen Reed and Fergus Reid) participates in the election and nomination of candidates for election as Independent Trustees for the Fund. Persons recommended by the Fund's Governance Committee as candidates for nomination as Independent Trustees shall possess such experience, qualifications, attributes, skills and diversity so as to enhance the Board's ability to manage and direct the affairs and business of the Fund, including, when applicable, to enhance the ability of committees of the Board to fulfill their duties and/or to satisfy any independence requirements imposed by law, regulation or any listing requirements of the NYSE. While the Independent Trustees of the Fund expect to be able to continue to identify from their own resources an ample number of qualified candidates for the Fund's Board as they deem appropriate, they will consider nominations from shareholders to the Board. Nominations from shareholders should be in writing and sent to the Independent Trustees as described below under the caption "Shareholder Communications."
The Board formed the Compliance and Insurance Committee to address insurance coverage and oversee the compliance function for the Fund and the Board. The Compliance and Insurance Committee consists of Frank L.
48
Bowman, Michael Bozic, James F. Higgins and Manuel H. Johnson. Frank L. Bowman, Michael Bozic and Manuel H. Johnson are Independent Trustees. The Chairperson of the Compliance and Insurance Committee is Michael Bozic. The Compliance and Insurance Committee has an Insurance Sub-Committee to review and monitor the insurance coverage maintained by the Fund. The Chairperson of the Insurance Sub-Committee is Frank L. Bowman.
The Investment Committee oversees the portfolio investment process for and reviews the performance of the Fund. The Investment Committee also recommends to the Board to approve or renew the Fund's Investment Advisory and Administration Agreements. The members of the Investment Committee are Frank L. Bowman, Michael Bozic, Kathleen A. Dennis, James F. Higgins, Manuel H. Johnson, Joseph J. Kearns, Michael F. Klein, Michael E. Nugent, W. Allen Reed and Fergus Reid. The Chairperson of the Investment Committee is Manuel H. Johnson.
The Investment Committee has three Sub-Committees, each with its own Chairperson. Each Sub-Committee focuses on the funds' primary areas of investment, namely equities, fixed income and alternatives. The Sub-Committees and their members are as follows:
(1) Equity—W. Allen Reed (Chairperson), Frank L. Bowman and Michael E. Nugent.
(2) Fixed Income—Michael F. Klein (Chairperson), Michael Bozic and Fergus Reid.
(3) Money Market and Alternatives—Kathleen A. Dennis (Chairperson), James F. Higgins and Joseph J. Kearns.
During the Fund's fiscal year ended September 30, 2011, the Board of Trustees held the following meetings:
| Board of Trustees | 7 | ||||||
| Committee/Sub-Committee: | Number of Meetings | ||||||
| Audit Committee | 4 | ||||||
| Governance Committee | 4 | ||||||
| Compliance and Insurance Committee | 4 | ||||||
| Insurance Sub-Committee | 1 | ||||||
| Investment Committee | 5 | ||||||
| Equity Sub-Committee | 5 | ||||||
| Fixed Income Sub-Committee | 5 | ||||||
| Money Market and Alternatives Sub-Committee | 7 | ||||||
Experience, Qualifications and Attributes
The Board has concluded, based on each Trustee's experience, qualifications and attributes that each Board member should serve as a Trustee. Following is a brief summary of the information that led to and/or supports this conclusion.
Mr. Bowman has experience in a variety of business and financial matters through his prior service as a Director or Trustee for various other funds in the Fund Complex, where he serves as Chairperson of the Insurance Sub-Committee of the Compliance and Insurance Committee, and as a Director of BP p.l.c. and Naval and Nuclear Technologies LLP. Mr. Bowman also serves as a Director for the Armed Services YMCA of the USA, the Naval Submarine League and the American Shipbuilding Suppliers Association. Mr. Bowman is also a member of the National Security Advisory Council of the Center for U.S. Global Engagement and a member of the CNA Military Advisory Board. Mr. Bowman retired as an Admiral in the U.S. Navy, after serving over 38 years on active duty including 8 years as Director of the Naval Nuclear Propulsion Program in the Department of the Navy and the Department of Energy (1996-2004). Additionally, Mr. Bowman served as the U.S. Navy's Chief of Naval Personnel where he was responsible for the planning and programming of all manpower, personnel, training and education resources for the U.S. Navy, and on the Joint Staff as Director of Political Military Affairs (1992-1994). In addition,
49
Mr. Bowman served as President and Chief Executive Officer of the Nuclear Energy Institute. Mr. Bowman has received such distinctions as a knighthood as Honorary Knight Commander of the Most Excellent Order of the British Empire and the Officer de l'Orde National du Mérite from the French Government, and was elected to the National Academy of Engineering (2009). He is President of the consulting firm Strategic Decisions, LLC.
With over 20 years of experience on the boards and in senior management of such companies as Kmart Corporation, Levitz Furniture Corporation, Hills Department Stores and Sears Merchandise Group of Sears, Roebuck & Co., where Mr. Bozic also served as Chief Financial Officer of the Merchandise Group, and with over 15 years of experience as a Director or Trustee of certain other funds in the Fund Complex, Mr. Bozic has experience with a variety of financial, management, regulatory and operational issues as well as experience with marketing and distribution. Mr. Bozic has served as the Chairperson of the Compliance and Insurance Committee since 2006.
Ms. Dennis has over 25 years of business experience in the financial services industry and related fields including serving as a Director or Trustee of various other funds in the Fund Complex, where she serves as Chairperson of the Money Market and Alternatives Sub-Committee of the Investment Committee Ms. Dennis possesses a strong understanding of the regulatory framework under which investment companies must operate based on her years of service to this Board and her position as Senior Managing Trustee of Victory Capital Management.
In addition to his tenure as a Trustee or Trustee of various other funds in the Fund Complex, where he formerly served as Chairperson of the Audit Committee, Dr. Johnson has also served as an officer or a board member of numerous companies for nearly 20 years. These positions included Co-Chairman and a founder of the Group of Seven Council, Trustee of NVR, Inc., Trustee of Evergreen Energy and Trustee of Greenwich Capital Holdings. He also has served as Vice Chairman of the Board of Governors of the Federal Reserve System and Assistant Secretary of the U.S. Treasury. In addition, Dr. Johnson also served as Chairman of the Financial Accounting Foundation, which oversees the Financial Accounting Standards Board, for seven years.
Mr. Kearns gained extensive experience regarding accounting through his experience on the Audit Committees of the boards of other funds in the Funds Complex, including serving as either Chairperson or Deputy Chairperson of the Audit Committee for fourteen years, and through his position as Chief Financial Officer of the J. Paul Getty Trust. He also has experience in financial, accounting, investment and regulatory matters through his position as President and founder of Kearns & Associates LLC, a financial consulting company. Mr. Kearns also serves as a Trustee of Electro Rent Corporation and The Ford Family Foundation. The Board has determined that Mr. Kearns is an "audit committee financial expert" as defined by the SEC.
Through his prior positions as Managing Trustee of Morgan Stanley & Co. Inc. and Morgan Stanley Dean Witter Investment Management and as President of Morgan Stanley Institutional Funds, Mr. Klein has experience in the management and operation of registered investment companies, enabling him to provide management input and investment guidance to the Board. Mr. Klein also has extensive experience in the investment management industry based on his current positions as Managing Trustee of Aetos Capital, LLC and as Director of certain investment funds managed or sponsored by Aetos Capital, LLC. In addition, he also has experience as a member of the board of other funds in the Fund Complex.
Mr. Nugent has extensive experience with financial, accounting, investment and regulatory matters through his almost 20 years of service on the boards of various funds in the Fund Complex, including time as the Chairperson of the Insurance Committee and Chairman of the Morgan Stanley Funds. Mr. Nugent also has experience as a General Partner in Triumph Capital, L.P.
Mr. Reed has experience on investment company boards and is experienced with financial, accounting, investment and regulatory matters through his prior service as a Trustee of iShares Inc. and his service as Trustee and Director of other funds in the Fund Complex. Mr. Reed also gained substantial experience in the financial services industry through his positions as Trustee of Legg Mason, Inc. and prior position as President and CEO of General Motors Asset Management.
50
Mr. Reid has served on a number of mutual fund boards, including as a Trustee and Director of certain investment companies in the JPMorgan Funds complex and as a Director or Trustee of other funds in the Fund Complex. Therefore, Mr. Reid is experienced with financial, accounting, investment and regulatory matters, enabling him to provide management input and investment guidance to the Board.
Mr. Higgins has over 30 years of experience in the financial services industry. Mr. Higgins has substantial mutual fund experience and is experienced with financial, accounting, investment and regulatory matters due to his experience on the boards of other funds in the Fund Complex. Mr. Higgins also serves on the boards of other companies in the financial services industry, including AXA Financial, Inc. and The Equitable Life Assurance Society of the United States.
The Trustees' principal occupations during the past five years or more are shown in the above tables.
Advantages of Having the Same Individuals as Independent Trustees for Morgan Stanley Funds. The Independent Trustees and the Fund's management believe that having the same Independent Trustees for each of the Retail Funds and Institutional Funds avoids the duplication of effort that would arise from having different groups of individuals serving as Independent Trustees for each of the funds or even of sub-groups of funds. They believe that having the same individuals serve as Independent Trustees of all the Morgan Stanley Funds tends to increase their knowledge and expertise regarding matters which affect the Fund Complex generally and enhances their ability to negotiate on behalf of each fund with the fund's service providers. This arrangement also precludes the possibility of separate groups of Independent Trustees arriving at conflicting decisions regarding operations and management of the funds and avoids the cost and confusion that would likely ensue. Finally, having the same Independent Trustees serve on all fund boards of enhances the ability of each fund to obtain, at modest cost to each separate fund, the services of Independent Trustees of the caliber, experience and business acumen of the individuals who serve as Independent Trustees of the Morgan Stanley Funds.
Trustee and Officer Indemnification. The Fund's Declaration of Trust provides that no Trustee, Officer, employee or agent of the Fund is liable to the Fund or to a shareholder, nor is any Trustee, Officer, employee or agent liable to any third persons in connection with the affairs of the Fund, except as such liability may arise from his/her or its own bad faith, willful misfeasance, gross negligence or reckless disregard of his/her or its duties. It also provides that all third persons shall look solely to Fund property for satisfaction of claims arising in connection with the affairs of the Fund. With the exceptions stated, the Declaration of Trust provides that a Trustee, Officer, employee or agent is entitled to be indemnified against all liability in connection with the affairs of the Fund.
Shareholder Communications. Shareholders may send communications to the Board of Trustees. Shareholders should send communications intended for the Board by addressing the communications directly to that Board (or individual Board members) and/or otherwise clearly indicating in the salutation that the communication is for the Board (or individual Board members) and by sending the communication to either the Fund's office or directly to such Board member(s) at the address specified for each Trustee previously noted. Other shareholder communications received by the Fund not directly addressed and sent to the Board will be reviewed and generally responded to by management, and will be forwarded to the Board only at management's discretion based on the matters contained therein.
Compensation. Each Trustee (except for the Chairperson of the Boards) receives an annual retainer fee of $210,000 for serving as a Trustee of the Morgan Stanley Funds.
The Chairperson of the Audit Committee receives an additional annual retainer fee of $78,750 and the Investment Committee Chairperson receives an additional annual retainer fee of $63,000. Other Committee and, effective January 1, 2012, Sub-Committee Chairpersons receive an additional annual retainer fee of $31,500. Prior to January 1, 2012, each Sub-Committee Chairperson received an annual retainer of $15,750. The aggregate compensation paid to each Trustee is paid by the Morgan Stanley Funds, and is allocated on a pro rata basis among each of the operational funds/portfolios of the Morgan Stanley Funds based on the relative net assets of each of the funds/portfolios. Michael E. Nugent receives a total annual retainer fee of $420,000 for his services as Chairperson of the Boards of the Morgan Stanley Funds and for administrative services provided to each Board.
51
The Fund also reimburses the Independent Trustees for travel and other out-of-pocket expenses incurred by them in connection with attending such meetings. Trustees of the Fund who are employed by the Adviser receive no compensation or expense reimbursement from the Fund for their services as a Trustee.
Effective April 1, 2004, the Fund began a Deferred Compensation Plan (the "DC Plan"), which allows each Trustee to defer payment of all, or a portion, of the fees he or she receives for serving on the Board of Trustees throughout the year. Each eligible Trustee generally may elect to have the deferred amounts credited with a return equal to the total return on one or more of the Morgan Stanley Funds (or portfolios thereof) that are offered as investment options under the Plan. At the Trustee's election, distributions are either in one lump sum payment, or in the form of equal annual installments over a period of five years. The rights of an eligible Trustee and the beneficiaries to the amounts held under the DC Plan are unsecured and such amounts are subject to the claims of the creditors of the Fund.
Prior to April 1, 2004, the Fund maintained a similar Deferred Compensation Plan (the "Prior DC Plan"), which also allowed each Independent Trustee to defer payment of all, or a portion, of the fees he or she received for serving on the Board of Trustees throughout the year. Generally, the DC Plan amends and supersedes the Prior DC Plan and all amounts payable under the Prior DC Plan are now subject to the terms of the Plan (except for amounts paid during the calendar year 2004 which remain subject to the terms of the Prior DC Plan).
The following table shows aggregate compensation payable to each of the Fund's Trustees from the Fund for the fiscal year ended September 30, 2011 and the aggregate compensation payable to each of the Fund's Trustees by the Fund Complex (which includes all of the Morgan Stanley Funds) for the calendar year ended December 31, 2011.
COMPENSATION(1)
| Name of Independent Trustee | Aggregate Compensation From the Fund(2) | Total Compensation From Fund and Fund Complex Paid to the Trustees(3) | |||||||||
| Frank L. Bowman | $ | 18,799 | $ | 225,750 | |||||||
| Michael Bozic | 19,824 | 241,500 | |||||||||
| Kathleen A. Dennis | 18,799 | 225,750 | |||||||||
| Manuel H. Johnson | 22,409 | 273,000 | |||||||||
| Joseph J. Kearns(2)(3) | 23,699 | 306,750 | |||||||||
| Michael F. Klein | 18,799 | 225,750 | |||||||||
| Michael E. Nugent | 34,472 | 420,000 | |||||||||
| W. Allen Reed(2)(3) | 18,796 | 225,750 | |||||||||
| Fergus Reid(3) | 19,824 | 259,500 | |||||||||
| James F. Higgins | 17,249 | 210,000 | |||||||||
(1) Includes all amounts paid for serving as director/trustee of the funds, as well as serving as Chairperson of the Boards or a Chairperson of a Committee or Sub-Committee.
(2) The amounts shown in this column represent the aggregate compensation before deferral with respect to the Fund's fiscal year. The following Trustees deferred compensation from the Fund during the fiscal year ended September 30, 2011: Mr. Kearns, $8,769; Mr. Reed, $18,796.
(3) The amounts shown in this column represent the aggregate compensation paid by all of the funds in the Fund Complex as of December 31, 2011 before deferral by the Trustees under the DC Plan. As of December 31, 2011, the value (including interest) of the deferral accounts across the Fund Complex for Messrs. Kearns, Reed and Reid pursuant to the deferred compensation plan was $532,157, $674,903 and $523,935, respectively. Because the funds in the Fund Complex have different fiscal year ends, the amounts shown in this column are presented on a calendar year basis.
Prior to December 31, 2003, 49 of the Morgan Stanley Funds (the "Adopting Funds") had adopted a retirement program under which an Independent Trustee who retired after serving for at least five years as an Independent Trustee of any such fund (an "Eligible Trustee") would have been entitled to retirement payments based on factors such as length of service, upon reaching the eligible retirement age. On December 31, 2003, the
52
amount of accrued retirement benefits for each Eligible Trustee was frozen, and will be payable, together with a return of 8% per annum, at or following each such Eligible Trustee's retirement as shown in the table below.
The following table illustrates the retirement benefits accrued to the Fund's Independent Trustees by the Adopting Funds for the calendar year ended December 31, 2011, and the estimated retirement benefits for the Independent Trustees from the Adopting Funds for each calendar year following retirement. Only the Trustees listed below participated in the retirement program.
| Name of Independent Trustee | Retirement Benefits Accrued as Fund Expenses By All Adopting Funds | Estimated Annual Benefits Upon Retirement(1) From All Adopting Funds | |||||||||
| Michael Bozic | $ | 42,107 | $ | 43,940 | |||||||
| Manuel H. Johnson | 30,210 | 64,338 | |||||||||
| Michael E. Nugent | 6,805 | 57,539 | |||||||||
(1) Total compensation accrued under the retirement plan, together with a return of 8% per annum, will be paid annually commencing upon retirement and continuing for the remainder of the Trustee's life.
ADVISER
The Adviser to the Fund, Morgan Stanley Investment Management Inc., with principal offices at 522 Fifth Avenue, New York, NY 10036, is a wholly owned subsidiary of Morgan Stanley, a preeminent global financial services firm engaged in securities trading and brokerage activities, as well as providing investment banking, research and analysis, financing and financial advisory services. As of March 31, 2012, the Adviser, together with its affiliated asset management companies, had approximately $303.8 billion in assets under management or supervision.
Under an Investment Advisory Agreement (the "Agreement") with the Fund, the Adviser, subject to the control and supervision of the Fund's Board and in conformance with the stated investment objective and policies of the Portfolio, manages the investment and reinvestment of the assets of the Portfolio. In this regard, it is the responsibility of the Adviser to make investment decisions for the Portfolio and to place the Portfolio's purchase and sales orders for investment securities.
As compensation for the services rendered by the Adviser under the Agreement and the assumption by the Adviser of the expenses related thereto (other than the cost of securities purchased for the Portfolio and the taxes and brokerage commissions, if any, payable in connection with the purchase and/or sale of such securities), the Portfolio pays the Adviser an advisory fee calculated by applying a quarterly rate, based on the following annual percentage rate, to the Portfolio's average daily net assets for the quarter:
| Portfolio | Rate (%) | ||||||
| Global Strategist | 0.450 | % | |||||
The following table reflects for the Portfolio (i) the advisory fee paid; and (ii) the advisory fee waived and/or affiliated rebates for each of the past three fiscal years ended September 30, 2009, 2010 and 2011.
| Advisory Fees Paid (After Fee Waivers and/or Affiliated Rebates) | Advisory Fees Waived | Affiliated Rebates | |||||||||||||||||||||||||||||||||||||
| Portfolio | 2009 (000) | 2010 (000) | 2011 (000) | 2009 (000) | 2010 (000) | 2011 (000) | 2009 (000) | 2010 (000) | 2011 (000) | ||||||||||||||||||||||||||||||
| Global Strategist | $ | 251 | $ | 221 | $ | 204 | $ | — | $ | — | $ | — | $ | 26 | $ | 5 | $ | 7 | |||||||||||||||||||||
The Agreement continues for successive one year periods, only if each renewal is specifically approved by an in-person vote of the Fund's Board, including the affirmative votes of a majority of the Trustees who are not parties to the agreement or "interested persons" (as defined in the 1940 Act) of any such party at a meeting called for the purpose of considering such approval. In addition, the question of continuance of the Agreement may be presented
53
to the shareholders of the Fund; in such event, continuance shall be effected only if approved by the affirmative vote of a majority of the outstanding voting securities of each Portfolio of the Fund. If the holders of any portfolio fail to approve the Agreement, the Adviser may continue to serve as investment adviser to each portfolio which approved the Agreement, and to any portfolio which did not approve the Agreement until new arrangements have been made. The Agreement is automatically terminated if assigned, and may be terminated by any portfolio without the payment of any penalty, at any time, (1) by vote of a majority of the entire Board or (2) by vote of a majority of the outstanding voting securities of the Portfolio on 60 days' written notice to the Adviser or (3) by the Adviser without the payment of any penalty, upon 90 days' written notice to the Fund.
The Fund bears all of its own costs and expenses, including but not limited to: services of its independent accountants, its administrator and dividend disbursing and transfer agent, legal counsel, taxes, insurance premiums, costs incidental to meetings of its shareholders and Trustees, the cost of filing its registration statements under federal and state securities laws, reports to shareholders, and custodian fees. These Fund expenses are, in turn, allocated to the Portfolio, based on its relative net assets. The Portfolio bears its own advisory fees and brokerage commissions and transfer taxes in connection with the acquisition and disposition of its investment securities.
Code of Ethics
The Fund, the Adviser and the Distributor have each adopted a Code of Ethics pursuant to Rule 17j-1 under the 1940 Act. The Codes of Ethics are designed to detect and prevent improper personal trading. The Codes of Ethics permit personnel subject to the Codes to invest in securities, including securities that may be purchased, sold or held by the Fund, subject to a number of restrictions and controls, including prohibitions against purchases of securities in an initial public offering and a preclearance requirement with respect to personal securities transactions.
Proxy Voting Policies and Procedures and Proxy Voting Record
The Board of Trustees believes that the voting of proxies on securities held by the Fund is an important element of the overall investment process. As such, the Trustees have delegated the responsibility to vote such proxies to MSIM.
A copy of MSIM's Proxy Voting Policy ("Proxy Policy") is attached hereto as Appendix A. In addition, a copy of the Proxy Policy, as well as the Fund's most recent proxy voting record for the 12-month period ended June 30, filed with the SEC are available without charge on our web site at www.morganstanley.com/im. The Fund's proxy voting record is also available without charge on the SEC's web site at www.sec.gov.
Portfolio Managers
Because the portfolio managers may manage assets for other investment companies, pooled investment vehicles and/or other accounts (including institutional clients, pension plans and certain high net worth individuals), there may be an incentive to favor one client over another resulting in conflicts of interest. For instance, the Adviser may receive fees from certain accounts that are higher than the fee it receives from the Fund, or it may receive a performance-based fee on certain accounts. In those instances, the portfolio managers may have an incentive to favor the higher and/or performance-based fee accounts over the Fund. In addition, a conflict of interest could exist to the extent the Adviser has proprietary investments in certain accounts, where portfolio managers have personal investments in certain accounts or when certain accounts are investment options in the Adviser's employee benefits and/or deferred compensation plans. The portfolio manager may have an incentive to favor these accounts over others. If the Adviser manages accounts that engage in short sales of securities of the type in which the Fund invests, the Adviser could be seen as harming the performance of the Fund for the benefit of the accounts engaging in short sales if the short sales cause the market value of the securities to fall. The Adviser has adopted trade allocation and other policies and procedures that it believes are reasonably designed to address these and other conflicts of interest.
54
Portfolio Manager Compensation Structure
Portfolio managers receive a combination of base compensation and discretionary compensation, comprising a cash bonus and several deferred compensation programs described below. The methodology used to determine portfolio manager compensation is applied across all funds/accounts managed by the portfolio manager.
Base salary compensation. Generally, portfolio managers receive base salary compensation based on the level of their position with the Adviser.
Discretionary compensation. In addition to base compensation, portfolio managers may receive discretionary compensation. Discretionary compensation can include:
• Cash Bonus.
• Morgan Stanley's Long Term Incentive Compensation awards—a mandatory program that defers a portion of discretionary year-end compensation into restricted stock units or other awards based on Morgan Stanley common stock or other plans that are subject to vesting and other conditions. All long term incentive compensation awards are subject to clawback provisions where awards can be cancelled if an employee takes any action, or omits to take any action which; causes a restatement of Morgan Stanley's consolidated financial results; or constitutes a violation of Morgan Stanley's risk policies and standards.
• Investment Management Alignment Plan (IMAP) awards—a mandatory program that defers a portion of discretionary year-end compensation and notionally invests it in designated funds advised by the Adviser or its affiliates. The award is subject to vesting and other conditions. Portfolio managers must notionally invest a minimum of 25% to a maximum of 100% of their IMAP deferral account into a combination of the designated funds they manage that are included in the IMAP fund menu, which may or may not include the Portfolio. In addition to the clawbacks listed above for long term incentive compensation awards, the provision on IMAP awards is further strengthened such that it may also be triggered if an employee's actions cause substantial financial loss on a trading strategy, investment, commitment or other holding provided that previous gains on those positions were relevant to the employees' prior year compensation decisions.
• Voluntary Deferred Compensation Plans—voluntary programs that permit certain employees to elect to defer a portion of their discretionary year-end compensation and notionally invest the deferred amount across a range of designated investment funds, which may include funds advised by the Adviser or its affiliates.
Several factors determine discretionary compensation, which can vary by portfolio management team and circumstances. These factors may include:
• Revenues generated by the investment companies, pooled investment vehicles and other accounts managed by the portfolio manager.
• The investment performance of the funds/accounts managed by the portfolio manager.
• Contribution to the business objectives of the Adviser.
• The dollar amount of assets managed by the portfolio manager.
• Market compensation survey research by independent third parties.
• Other qualitative factors, such as contributions to client objectives.
• Performance of Morgan Stanley and Morgan Stanley Investment Management, and the overall performance of the investment team(s) of which the portfolio manager is a member.
55
Other Accounts Managed by Portfolio Managers at September 30, 2011:
| Registered Investment Companies | Other Pooled Investment Vehicles | Other Accounts | |||||||||||||||||||||||||
| Portfolio and Portfolio Managers | Number of Accounts | Total Assets in the Accounts | Number of Accounts | Total Assets in the Accounts | Number of Accounts | Total Assets in the Accounts | |||||||||||||||||||||
| Global Strategist Portfolio | |||||||||||||||||||||||||||
| Mark A. Bavoso | 3 | $627.2 million | 2 | $610.8 million | 10 | $3.9 billion(1) | |||||||||||||||||||||
| Cyril Moullé-Berteaux | 5 | $780.9 million | 2 | $610.8 million | 9 | $3.9 billion(1) | |||||||||||||||||||||
(1) Of these other accounts, two accounts with a total of approximately $1.1 billion in assets, had performance-based fees.
Securities Ownership of Portfolio Managers (at September 30, 2011)
Global Strategist Portfolio
Mark Bavoso — None
Cyril Moullé-Berteaux — None
PRINCIPAL UNDERWRITER
Morgan Stanley Distribution, Inc. (the "Distributor"), a wholly-owned subsidiary of the Adviser, with its principal office at 522 Fifth Avenue, New York, NY 10036, distributes the shares of the Fund. Under the Distribution Agreement, the Distributor, as agent of the Fund, agrees to use its best efforts as sole distributor of the Fund's shares. The Distribution Agreement continues in effect so long as such continuance is approved at least annually by the Fund's Board, including a majority of those Trustees who are not parties to such Distribution Agreement nor interested persons of any such party. The Distribution Agreement provides that the Fund will bear the costs of the registration of its shares with the SEC and various states and the printing of its prospectuses, statements of additional information and reports to shareholders.
DISTRIBUTION AND SHAREHOLDER SERVICES PLANS
Class P, Class H and Class L
Effective July 1, 2007, the Fund adopted a Shareholder Services Plan for Class P shares (the "Class P Plan"). Effective November 29, 2007, the Fund adopted a Shareholder Services Plan for Class H shares (the "Class H Plan") and effective June 9, 2008, as amended and restated on March 1, 2012, the Fund adopted a Distribution and Shareholder Services Plan for Class L shares (the "Class L Plan"), each pursuant to Rule 12b-1 under the 1940 Act (together, the "Plans"). The Plans provide that the Fund, on behalf of the Portfolio, may pay the Distributor and other affiliated and unaffiliated broker-dealers, financial institutions and/or intermediaries an annualized fee of up to 0.25% of the average daily net assets of the Portfolio attributable to Class P shares, Class H shares or Class L shares, as applicable. This service fee is for providing "personal service and/or the maintenance of shareholder accounts" as provided for in Section 2830(b)(9) of the Financial Industry Regulatory Authority ("FINRA") Conduct Rules, including (i) expenditures for overhead and other expenses of the Distributor and other affiliated and unaffiliated broker-dealers, (ii) telephone and other communications expenses relating to the provision of shareholder services and (iii) compensation to and expenses of financial advisors and other employees of the Distributor and other affiliated and unaffiliated broker-dealers for the provision of shareholder services. In addition, the Class L Plan provides that the Fund, on behalf of the Portfolio, may pay the Distributor an annualized distribution fee of up to 0.50% of the average daily net assets of the Portfolio attributable to Class L shares. The Distributor may direct that all or any part of these fees be paid directly to its affiliates or other broker-dealers, financial institutions and/or intermediaries that provide shareholder services.
The following table describes the shareholder servicing fees paid by the Portfolio with respect to its Class P shares pursuant to the Class P Plan and the distribution-related expenses for the Portfolio with respect to its Class P shares for the fiscal year ended September 30, 2011. Class H and Class L shares of the Portfolio had not commenced operations as of September 30, 2011. To the extent that expenditures on distribution-related activities exceed the fees paid by the Portfolio, the excess amounts were paid by the Adviser or the Distributor out of its own resources.
56
| Portfolio | Total Shareholder Servicing Fees Paid by Portfolio | Shareholder Servicing Expenses* | Shareholder Servicing Fees Retained by Morgan Stanley Distribution, Inc. (Expenditures in Excess of Shareholder Servicing Fees) | ||||||||||||
| Class P | |||||||||||||||
| Global Strategist | $ | 44,610 | $ | 44,034 | $ | 576 | |||||||||
* Includes payments for distribution and/or shareholder servicing to third parties and affiliated entities.
The Plans were approved by the Fund's Board of Trustees, including the Independent Trustees, none of whom has a direct or indirect financial interest in the operation of the Plan or in any agreements related thereto.
Revenue Sharing
The Adviser and/or the Distributor may pay compensation, out of their own funds and not as an expense of the Portfolio, to Morgan Stanley Smith Barney LLC, a majority-owned broker-dealer subsidiary of Morgan Stanley ("Morgan Stanley Smith Barney"), Citigroup Global Markets Inc. ("CGM"), certain insurance companies and/or other unaffiliated brokers, dealers and other financial intermediaries, including recordkeepers and administrators of various deferred compensation plans ("Intermediaries"), in connection with the sale, distribution, marketing and retention of shares of the Portfolio and/or shareholder servicing. For example, the Adviser or the Distributor may pay additional compensation to an Intermediary for, among other things, promoting the sale and distribution of Portfolio shares, providing access to various programs, mutual fund platforms or preferred or recommended mutual fund lists that may be offered by an Intermediary, granting the Distributor access to an Intermediary's financial advisors and consultants, providing assistance in the ongoing education and training of an Intermediary's financial personnel, furnishing marketing support, maintaining share balances and/or for sub-accounting, recordkeeping, administrative, shareholder, or transaction processing services. Such payments are in addition to any shareholder servicing fees and/or transfer agency fees that may be payable by the Portfolio. The additional payments are generally based on current assets, but may also be based on other measures as determined from time to time by the Adviser and/or the Distributor (e.g., gross sales or number of accounts). The amount of these payments may be different for different Intermediaries.
With respect to Morgan Stanley Smith Barney and CGM, these payments currently include the following amounts, which are paid in accordance with the applicable compensation structure:
(1) on Class I, Class P, Class H and Class L shares of the Portfolio held in traditional brokerage accounts where Morgan Stanley Smith Barney or CGM is designated by purchasers as broker-dealer of record, an ongoing annual fee in an amount up to 0.13% of the total average monthly net asset value of such shares.
(2) on Class I and Class P shares of the Portfolio held in traditional brokerage accounts in the Morgan Stanley channel of Morgan Stanley Smith Barney, in addition to the amounts referenced in paragraph (1) above, an ongoing annual fee in an amount up to 35% of the Portfolio's advisory fees accrued from the average daily net asset value of such shares.
(3) On Class I and Class P shares of the Portfolio held in taxable accounts through any fee-based advisory program offered by Morgan Stanley Smith Barney, an ongoing annual fee in an amount up to 0.08% of the total average monthly net asset value of such shares.
The prospect of receiving, or the receipt of, additional compensation as described above by Morgan Stanley Smith Barney and CGM may provide Morgan Stanley Smith Barney and CGM and their financial advisors and other salespersons with an incentive to favor sales of shares of the Portfolio over other investment options with respect to which Morgan Stanley Smith Barney and CGM do not receive additional compensation (or receive lower levels of additional compensation). These payment arrangements, however, will not change the price that an investor pays for shares of the Portfolio or the amount that the Portfolio receives to invest on behalf of an investor. Investors may wish to take such payment arrangements into account when considering and evaluating any
57
recommendations relating to Portfolio shares and should review carefully any disclosure provided by Morgan Stanley Smith Barney and CGM as to their compensation. Currently, there are no compensation arrangements in place with other Intermediaries.
FUND ADMINISTRATION
The Adviser also serves as Administrator to the Fund pursuant to an Amended and Restated Administration Agreement dated as of November 1, 2004 (the "Administration Agreement"). Under the Administration Agreement, the Adviser receives an annual fee, accrued daily and payable monthly, of 0.08% of the Fund's average daily net assets, and is responsible for all fees payable under any sub-administration agreements.
For the fiscal years ended September 30, 2009, 2010 and 2011, the Portfolio paid the following administrative fees (no administrative fees were waived):
| Administrative Fees Paid | |||||||||||||||
| Portfolio | 2009 (000) | 2010 (000) | 2011 (000) | ||||||||||||
| Global Strategist | $ | 49 | $ | 40 | $ | 37 | |||||||||
Sub-Administrator. Under an agreement between the Administrator and State Street Bank and Trust Company ("State Street"), State Street provides certain administrative services to the Fund. For such services, the Administrator pays State Street a portion of the administrative fee the Administrator receives from the Fund. The Administrator supervises and monitors the administrative and accounting services provided by State Street. Their services are also subject to the supervision of the officers and Board of Trustees of the Fund. State Street's business address is One Lincoln Street, Boston, MA 02111-2101.
OTHER SERVICE PROVIDERS
Custodian. State Street, located at One Lincoln Street, Boston, MA 02111-2101, serves as Custodian for the Fund. The Custodian holds cash, securities, and other assets of the Fund as required by the 1940 Act.
Transfer and Dividend Disbursing Agent. Morgan Stanley Services Company Inc., P.O. Box, 219804, Kansas City, MO 64121-9804, serves as the Fund's Transfer Agent and Dividend Disbursing Agent.
Pursuant to a Transfer Agency Agreement, the Fund pays Morgan Stanley Services Company Inc. a fee, which has been approved by the Fund's Board of Trustees, generally based on the number of classes, accounts and transactions relating to the Portfolio. The Fund and Morgan Stanley Services Company Inc. may enter into agreements with third party intermediaries, pursuant to which such intermediaries agree to provide recordkeeping and other administrative services for their clients who invest in the Portfolio. In such instances, the Portfolio may pay certain fees to the intermediaries for the services they provide that otherwise would have been performed by Morgan Stanley Services Company Inc., which fees may be calculated and incurred on a class-by-class basis.
Independent Registered Public Accounting Firm. Ernst & Young LLP, located at 200 Clarendon Street, Boston, MA 02116-5021, serves as the independent registered public accounting firm for the Fund and audits the annual financial statements of the Portfolio.
Fund Counsel. Dechert LLP, located at 1095 Avenue of the Americas, New York, NY 10036, acts as the Fund's legal counsel.
BROKERAGE TRANSACTIONS
Portfolio Transactions
The Agreement authorizes the Adviser to select the brokers or dealers that will execute the purchases and sales of investment securities for the Portfolio and directs the Adviser to use its best efforts to obtain the best
58
execution with respect to all transactions for the Portfolio. In so doing, the Adviser will consider all matters it deems relevant, including the following: the Adviser's knowledge of negotiated commission rates and spreads currently available; the nature of the security or instrument being traded; the size and type of the transaction; the nature and character of the markets for the security or instrument to be purchased or sold; the desired timing of the transaction; the activity existing and expected in the market for the particular security or instrument; confidentiality; the execution, clearance, and settlement capabilities of the broker or dealer selected and other brokers or dealers considered; the reputation and perceived soundness of the broker or dealer selected and other brokers or dealers considered; the Adviser's knowledge of any actual or apparent operational problems of a broker or dealer; and the reasonableness of the commission or its equivalent for the specific transaction.
In seeking to implement the Fund's policies, the Adviser effects transactions with those brokers and dealers who the Adviser believes provide prompt execution of orders in an effective manner at the most favorable prices. If the Adviser believes the prices and executions are obtainable from more than one broker or dealer, it may give consideration to placing portfolio transactions with those brokers and dealers who also furnish research and other services to the Portfolio or the Adviser. The services may include, but are not limited to, any one or more of the following: information as to the availability of securities for purchase or sale; statistical or factual information or opinions pertaining to investment; wire services; and appraisals or evaluations of portfolio securities. The information and services received by the Adviser from brokers and dealers may be of benefit to them and any of their asset management affiliates in the management of accounts of some of their other clients and may not in all cases benefit the Fund directly.
The Adviser is prohibited from directing brokerage transactions on the basis of the referral of clients or the sale of shares of advised investment companies. However, the Adviser may place Portfolio orders with qualified broker-dealers who recommend the Portfolio or who act as agents in the purchase of shares of the Portfolio for their clients.
The Adviser and its affiliated investment advisers have established commission sharing arrangements under a commission management program (the "Commission Management Program" or "CMP"), pursuant to which execution and research costs or a portion of those costs are decoupled in accordance with applicable laws, rules and regulations. Under the CMP, the Adviser and its affiliated investment advisers select approved equity brokers (which include the Adviser's affiliates) for execution services and after accumulation of commissions at such brokers, the Adviser and/or its affiliates instruct these approved equity brokers to pay for eligible research provided by executing brokers or third-party research providers, which are selected independently by a Research Services Committee of the Adviser and its affiliated investment advisers. Generally, the Adviser and its affiliated investment advisers will direct the approved equity broker to record research credits based upon a previously agreed-upon allocation and will periodically instruct the approved equity broker to direct specified dollar amounts from that pool to pay for eligible research services provided by third-party research providers and executing brokers. The research credits are pooled among the Adviser and its affiliated investment advisers and allocated from this pool. Likewise, the research services obtained under the CMP are shared among the Adviser and its affiliated investment advisers.
Selection of approved equity brokers for execution is based on three main criteria: access to liquidity, provision of capital and quality of execution. Under the CMP, each approved equity broker is responsible for the payment of fees for research services and obtains the research services pursuant to written agreements between the approved equity broker and the third-party research provider.
For those costs not decoupled, but retained by broker-dealers, the Adviser also effects transactions with brokers which directly pay for research services provided by those brokers in accordance with Section 28(e) of the 1934 Act. These include equity transactions and may include fixed-income transactions effected on an agency basis.
Transactions involving client accounts managed by two or more affiliated investment advisers may be aggregated and executed using the services of broker-dealers that provide third party benefits/research so long as: (i) all client accounts involved in the transaction benefit from one or more of the services offered by such broker-dealer; and (ii) each affiliated investment adviser has approved the use of such broker-dealer and the services provided thereby.
59
The research services received include those of the nature described above and other services which aid the Adviser in fulfilling its investment decision making responsibilities, including (a) furnishing advice as to the value of securities, the advisability of investing in, purchasing or selling securities, and the availability of securities or purchasers or sellers of securities; and (b) furnishing analyses and reports concerning issuers, industries, securities, economic factors and trends, portfolio strategy and the performance of accounts. Where a particular item has both research and non-research related uses (such as proxy services where both research services and services relating to the administration of the proxy itself are provided), the Adviser will make a reasonable allocation of the cost of the item between research and non-research uses and will only pay for the portion of the cost allocated to research uses with client brokerage transactions. Research services furnished or paid for by brokers through whom the Adviser effects transactions for a particular account may be used by the Adviser or its affiliated investment advisers in servicing their other accounts, and not all such services may be used for the benefit of the client which pays the brokerage commission which results in the receipt of such research services. Commissions paid to brokers providing research services may be higher than those charged by brokers not providing services.
The Adviser and its affiliated investment advisers make a good faith determination of the value of research services in accordance with Section 28(e) of the 1934 Act, UK Financial Services Authority Rules and other relevant regulatory requirements.
Certain investment professionals and other employees of the Adviser are also officers of affiliated investment advisers and may provide investment advisory services to clients of such affiliated investment advisers. The Adviser's personnel also provide research and trading support to personnel of certain affiliated investment advisers. Research related costs may be shared by affiliated investment advisers and may benefit the clients of such affiliated investment advisers. Research services that benefit the Adviser may be received in connection with commissions generated by clients of its affiliated investment advisers. Similarly, research services received in connection with commissions generated by the Adviser's clients may benefit affiliated investment advisers and their clients. Moreover, research services provided by broker-dealers through which the Adviser effects transactions for a particular account may be used by the Adviser and/or an affiliated investment adviser in servicing its other accounts and not all such research services may be used for the benefit of the particular client, which pays the brokerage commission giving rise to the receipt of such research services.
Affiliated Brokers
Subject to the overriding objective of obtaining the best execution of orders, the Fund may use broker-dealer affiliates of the Adviser to effect Portfolio brokerage transactions, including transactions in futures contracts and options on futures contracts, under procedures adopted by the Fund's Board of Trustees. In order to use such affiliates, the commission rates and other remuneration paid to the affiliates must be fair and reasonable in comparison to those of other broker-dealers for comparable transactions involving similar securities being purchased or sold during a comparable time period. This standard would allow the affiliated broker or dealer to receive no more than the remuneration which would be expected to be received by an unaffiliated broker.
Pursuant to an order issued by the SEC, the Fund is permitted to engage in principal transactions involving money market instruments, subject to certain conditions, with Morgan Stanley & Co. LLC, a broker-dealer affiliated with the Fund's Adviser.
During the fiscal years ended September 30, 2009, 2010 and 2011, the Fund did not effect any principal transactions with an affiliated broker or dealer.
Commissions Paid
During the fiscal years ended September 30, 2009, 2010 and 2011, the Fund paid brokerage commissions of approximately $4,448,600, $3,101,357 and $4,382,245, respectively. During the fiscal years ended September 30, 2009, 2010 and 2011, the Fund paid in the aggregate $57,602, $15,471 and $28,416, respectively, as brokerage commissions to Morgan Stanley & Co. LLC and/or its affiliated broker-dealers. During the fiscal year ended September 30, 2011, the brokerage commissions paid to Morgan Stanley & Co. LLC and/or its affiliated broker-dealers represented approximately 0.65% of the total brokerage commissions paid by the Fund during the period and were paid on account of transactions having an aggregate dollar value equal to approximately 0.57% of the aggregate dollar value of all portfolio transactions of the Fund during the period for which commissions were paid.
60
During the fiscal years ended September 30, 2009, 2010 and 2011, the Fund paid in the aggregate $0, $31,380 and $32,396, respectively, as brokerage commissions to Citigroup, Inc. and/or its affiliated broker-dealers. During the fiscal year ended September 30, 2011, the brokerage commissions paid to Citigroup, Inc. and/or its affiliated broker-dealers represented approximately 0.74% of the total brokerage commissions paid by the Fund during the period and were paid on account of transactions having an aggregate dollar value equal to approximately 0.36% of the aggregate dollar value of all portfolio transactions of the Fund during the period for which commissions were paid.
For the fiscal year ended September 30, 2011, the Portfolio paid brokerage commissions, including brokerage commissions paid to affiliated broker-dealers, as follows:
| Brokerage Commissions Paid During Fiscal Year Ended September 30, 2011 | |||||||||||||||||||||||||||||||
| Commissions Paid to Morgan Stanley & Co. LLC and/or its affiliated broker-dealers | Commissions Paid to Citigroup, Inc. and/or its affiliated broker-dealers | ||||||||||||||||||||||||||||||
| Portfolio | Total Commissions Paid | Total Commissions | Percent of Total Commissions | Percent of Total Brokered Transactions | Total Commissions | Percent of Total Commissions | Percent of Total Brokered Transactions | ||||||||||||||||||||||||
| Global Strategist | $ | 31,260 | $ | — | — | — | $ | 2,688 | 8.60 | % | 2.48 | % | |||||||||||||||||||
For the fiscal years ended September 30, 2009 and September 30, 2010, the Portfolio paid brokerage commissions, including brokerage commissions paid to affiliated broker-dealers, as follows. No brokerage commissions were paid by the Portfolio to Citigroup, Inc. and/or affiliated broker-dealers during the period from June 1, 2009 to September 30, 2009 or to Morgan Stanley & Co. LLC and/or affiliated broker-dealers for the fiscal year ended September 30, 2009.
| Brokerage Commissions Paid During Fiscal Years Ended September 30, 2009 and 2010 | |||||||||||||||||||||||||||
| Fiscal Year Ended September 30, 2009 | For the Period 06/01/09- 09/30/09 | Fiscal Year Ended September 30, 2010 | |||||||||||||||||||||||||
| Portfolio | Total | Morgan Stanley & Co. LLC and/or its affiliated broker- dealers | Citigroup, Inc. and/or its affiliated broker- dealers | Total | Morgan Stanley & Co. LLC and/or its affiliated broker- dealers | Citigroup, Inc. and/or its affiliated broker- dealers | |||||||||||||||||||||
| Global Strategist | $ | 24,116 | $ | — | $ | — | $ | 50,914 | $ | 373 | $ | 38 | |||||||||||||||
Regular Broker-Dealers. The Fund's regular broker-dealers are (i) the ten broker-dealers that received the greatest dollar amount of brokerage commissions from the Fund; (ii) the ten broker-dealers that engaged as principal in the largest dollar amount of portfolio transactions; and (iii) the ten broker-dealers that sold the largest dollar amount of Portfolio shares. During the fiscal year ended September 30, 2011, the Portfolio purchased securities issued by the Fund's regular broker-dealers:
VALUE OF PORTFOLIO HOLDINGS
| Portfolio | Regular Broker-Dealer | Approximate Value of Portfolio Holdings as of September 30, 2011 | |||||||||
| Global Strategist | Bank of America Securities LLC | $ | 542,000 | ||||||||
| Credit Suisse Group AG | 82,000 | ||||||||||
| State Street Bank and Trust Co. | 72,000 | ||||||||||
| Goldman Sachs & Co. | 291,000 | ||||||||||
| JP Morgan Securities, Inc. | 921,000 | ||||||||||
| UBS Financial Services, Inc. | 41,000 | ||||||||||
Portfolio Turnover. The Portfolio generally does not invest for short-term trading purposes; however, when circumstances warrant, the Portfolio may sell investment securities without regard to the length of time they have
61
been held. Market conditions in a given year could result in a higher or lower portfolio turnover rate than expected and the Portfolio will not consider portfolio turnover rate a limiting factor in making investment decisions consistent with its investment objective and policies. Higher portfolio turnover (e.g., over 100%) necessarily will cause the Portfolio to pay correspondingly increased brokerage and trading costs. In addition to transaction costs, higher portfolio turnover may result in the realization of capital gains. As discussed under "Tax Considerations," to the extent net short-term capital gains are realized, any distributions resulting from such gains are considered ordinary income for federal income tax purposes.
GENERAL INFORMATION
Fund History
Morgan Stanley Institutional Fund Trust (formerly MAS Funds) is an open-end, management investment company established under Pennsylvania law as a Pennsylvania business trust under an Amended and Restated Agreement and Declaration of Trust dated November 18, 1993 as further Amended and Restated on August 24, 2006 (the "Declaration of Trust"). The Fund was originally established as The MAS Pooled Trust Fund, a Pennsylvania business trust, in February 1984. The Portfolio is diversified. No portfolio of the Fund is subject to the liabilities of any other portfolio of the Fund.
Description of Shares and Voting Rights
The Declaration of Trust permits the Trustees to issue an unlimited number of shares of beneficial interest, without par value, from an unlimited number of series ("Portfolios") of shares. Currently, the Fund consists of seven Portfolios.
The shares of the Portfolio are fully paid and non-assessable, except as set forth below, and have no preference as to conversion, exchange, dividends, retirement or other features. The shares of the Portfolio of the Fund have no preemptive rights. The shares of the Fund have non-cumulative voting rights, which means that the holders of more than 50% of the shares voting for the election of Trustees can elect 100% of the Trustees if they choose to do so. A shareholder of a class is entitled to one vote for each full class share held (and a fractional vote for each fractional class share held) in the shareholder's name on the books of the Fund. Shareholders of a class have exclusive voting rights regarding any matter submitted to shareholders that relates solely to that class of shares (such as a service agreement relating to that class), and separate voting rights on any other matter submitted to shareholders in which the interests of the shareholders of that class differ from the interests of holders of any other class.
Meetings of shareholders will not be held except as required by the 1940 Act and other applicable law. A meeting will be held to vote on the removal of a Trustee or Trustees of the Fund if requested in writing by the holders of not less than 10% of the outstanding shares of the Fund. The Fund will assist in shareholder communication in such matters to the extent required by law.
Dividends and Distributions
The Fund's policy is to distribute substantially all of the Portfolio's net investment income, if any, together with any net realized capital gains in the amount and at the times that will avoid both income (including capital gains) taxes on it and the imposition of the federal excise tax on undistributed income and capital gains. The amounts of any income dividends or capital gains distributions cannot be predicted.
Any dividend or distribution paid shortly after the purchase of shares of the Portfolio by an investor may have the effect of reducing the per share net asset value of the Portfolio by the per share amount of the dividend or distribution. Furthermore, such dividends or distributions, although in effect a return of capital, are subject to income taxes.
As set forth in the Prospectus, unless the shareholder elects otherwise in writing, all dividends and capital gains distributions for a class of shares are automatically reinvested in additional shares of the same class of the Portfolio at net asset value (as of the business day following the record date). This automatic reinvestment of dividends and distributions will remain in effect until the shareholder notifies the Fund by telephone or in writing that either the Income Option (income dividends in cash and capital gain distributions reinvested in shares at net asset value) or the Cash Option (both income dividends and capital gains distributions in cash) has been elected. It may take up to three business days to effect this change. An account statement is sent to shareholders whenever a dividend or distribution is paid.
62
The Portfolio is treated as a separate entity (and hence, as a separate "regulated investment company") for federal tax purposes. Any net capital gains recognized by the Portfolio are distributed to its investors without need to offset (for federal income tax purposes) such gains against any net capital losses of another Portfolio.
Undistributed net investment income is included in the Portfolio's net assets for the purpose of calculating NAV. Therefore, on the ex-dividend date, the NAV excludes the dividend (i.e., is reduced by the per share amount of the dividend). Dividends paid shortly after the purchase of shares by an investor, although in effect a return of capital, are taxable as ordinary income.
Certain mortgage securities may provide for periodic or unscheduled payments of principal and interest as the mortgages underlying the securities are paid or prepaid. However, such principal payments (not otherwise characterized as original issue discount or bond premium expense) will not normally be considered as income to the Portfolio and therefore will not be distributed as dividends. Rather, these payments on mortgage-backed securities will be reinvested on your behalf by the Portfolio.
Shareholder and Trustee Liability
Under Pennsylvania law, shareholders of a trust such as the Fund may, under certain circumstances, be held personally liable as partners for the obligations of the trust. The Fund's Declaration of Trust contains an express disclaimer of shareholder liability for acts or obligations of the Fund and requires that notice of such disclaimer be given in each agreement, obligation, or instrument entered into or executed by the Fund or the Trustees, but this disclaimer may not be effective in some jurisdictions or as to certain types of claims. The Declaration of Trust further provides for indemnification out of the Fund's property of any shareholder held personally liable for the obligations of the Fund. The Declaration of Trust also provides that the Fund shall, upon request, assume the defense of any claim made against any shareholder for any act or obligation of the Fund and satisfy any judgment thereon. Thus, the risk of a shareholder incurring financial loss on account of shareholder liability is limited to circumstances in which the Fund itself would be unable to meet its obligations.
Pursuant to the Declaration of Trust, the Trustees may also authorize the creation of additional series of shares (the proceeds of which would be invested in separate, independently managed portfolios with distinct investment objectives and policies and share purchase, redemption and net asset valuation procedures) with such preferences, privileges, limitations and voting and dividend rights as the Trustees may determine. All consideration received by the Fund for shares of any additional series or class, and all assets in which such consideration is invested, would belong to that series or class (subject only to the rights of creditors of the Fund) and would be subject to the liabilities related thereto. Pursuant to the 1940 Act shareholders of any additional series or class of shares would normally have to approve the adoption of any advisory contract relating to such series or class and of any changes in the investment policies relating thereto.
The Declaration of Trust further provides that the Trustees will not be liable for errors of judgment or mistakes of fact or law, but nothing in the Declaration of Trust protects a Trustee against any liability to which he would otherwise be subject by reason of willful misfeasance, bad faith, gross negligence, or reckless disregard of the duties involved in the conduct of the office.
TAX CONSIDERATIONS
The Portfolio generally will make two basic types of distributions: ordinary dividends and long-term capital gain distributions. These two types of distributions are reported differently on a shareholder's income tax return and they may be subject to different rates of tax. The tax treatment of the investment activities of the Portfolio will affect the amount, timing and character of distributions made by the Portfolio. The following discussion is only a summary of certain tax considerations generally affecting the Fund and shareholders of the Fund and is not intended as a substitute for careful tax planning. Tax issues relating to the Portfolio generally are not a consideration for shareholders that are tax-exempt entities and tax-advantaged retirement vehicles such as an IRA or 401(k) plan. Shareholders are urged to consult their own tax professionals regarding specific questions as to federal, state or local taxes.
63
Investment Company Taxation: The Portfolio is treated as a separate entity for federal income tax purposes and intends to continue to qualify for the special tax treatment afforded regulated investment companies under Subchapter M of the Code. As such, the Portfolio will not be subject to federal income tax to the extent it distributes net investment company taxable income and net capital gains to shareholders. The Fund will notify you annually as to the tax classification of all distributions. If the Portfolio fails to qualify for any taxable year as a regulated investment company, all of its taxable income will be subject to tax at regular corporate income tax rates without any deduction for distributions to shareholders, and such distributions generally will be taxable to shareholders as ordinary dividends to the extent of the Portfolio's current and accumulated earnings and profits.
The Portfolio intends to declare and pay dividends and capital gain distributions so as to avoid imposition of the federal excise tax. To do so, the Portfolio expects to distribute an amount at least equal to (i) 98% of its calendar year ordinary income, (ii) 98.2% of its capital gains net income for the one-year period ending October 31st, and (iii) 100% of any undistributed ordinary and capital gain net income from the prior year.
In order for the Portfolio to continue to qualify for federal income tax treatment as a regulated investment company, at least 90% of its gross income for a taxable year must be derived from qualifying income; i.e., dividends, interest, income derived from loans of securities, and gains from the sale or other disposition of stocks, securities or foreign currencies, or other income derived with respect to its business of investing in such stocks, securities or currencies. It is anticipated that any net gain realized from the closing out of futures contracts will be considered gain from the sale of securities and therefore be qualifying income for purposes of the 90% requirement. In addition, (i) the Portfolio must distribute annually to its shareholders at least the sum of 90% of its net tax-exempt interest income and 90% of its investment company taxable income; (ii) at the close of each quarter of the Portfolio's taxable year, at least 50% of its total assets must be represented by cash and cash items, U.S. government securities, securities of other regulated investment companies and such other securities with limitations; and (iii) at the close of each quarter of the Portfolio's taxable year, not more than 25% of the value of its assets may be invested in securities of any one issuer, or of two or more issuers engaged in same or similar businesses if the Portfolio owns at least 20% of the voting power of such issuers. Net income derived from an interest in a "qualified publicly traded partnership," as defined in the Code, will also be treated as qualifying income for purposes of the 90% gross income requirement described above. In addition, for the purposes of the diversification requirements in clause (iii) above, the outstanding voting securities of any issuer includes the equity securities of a qualified publicly traded partnership, and no more than 25% of the value of a regulated investment company's total assets may be invested in the securities of one or more qualified publicly traded partnerships. The Code also provides that the separate treatment for publicly traded partnerships under the passive loss rules of the Code applies to a regulated investment company holding an interest in a qualified publicly traded partnership, with respect to items attributable to such interest.
The Portfolio will distribute to shareholders annually any net capital gains which have been recognized for federal income tax purposes including unrealized gains at the end of the Portfolio's fiscal year on certain futures transactions. Such distributions will be combined with distributions of capital gains realized on the Portfolio's other investments and shareholders will be advised of the nature of the payments.
Gains or losses on the sale of securities by the Portfolio will be long-term capital gains or losses if the securities have a tax holding period of more than one year at the time of such sale. Gains or losses on the sale of securities with a tax holding period of one year or less will be short-term capital gains or losses. Special tax rules described below may change the normal treatment of gains and losses recognized by the Portfolio when the Portfolio makes certain types of investments. Those special tax rules can, among other things, affect the treatment of capital gain or loss as long-term or short-term and may result in ordinary income or loss rather than capital gain or loss. The application of these special rules would therefore also affect the character of distributions made by the Portfolio.
Some of the options, futures contracts, forward contracts, and swap agreements entered into by the Portfolio may be "Section 1256 contracts." Section 1256 contracts held by the Portfolio at the end of its taxable year (and, for purposes of the 4% excise tax, on certain other dates as prescribed under the Code) are "marked-to-market" with unrealized gains or losses treated as though they were realized. Any gains or losses, including "marked to market" gains or losses, on Section 1256 contracts other than forward contracts are generally 60% long-term and
64
40% short-term capital gains or losses ("60/40") although all foreign currency gains and losses from such contracts may be treated as ordinary in character absent a special election.
Generally, hedging transactions and certain other transactions in options, futures, forward contracts and swap agreements undertaken by the Portfolio, may result in "straddles" for U.S. federal income tax purposes. The straddle rules may affect the character of gain or loss realized by the Portfolio. In addition, losses realized by the Portfolio on positions that are part of a straddle may be deferred under the straddle rules, rather than being taken into account in calculating the taxable income for the taxable year in which such losses are realized. Because only a few regulations implementing the straddle rules have been promulgated, the tax consequences of transactions in options, futures, forward contracts, and swap agreements to the Portfolio are not entirely clear. The transactions may increase the amount of short-term capital gain realized by the Portfolio. Short-term capital gain is taxed as ordinary income when distributed to shareholders.
The Portfolio may make one or more of the elections available under the Code which are applicable to straddles. If the Portfolio makes any of the elections, the amount, character, and timing of the recognition of gains or losses from the affected straddle positions will be determined under rules that vary according to the elections made. The rules applicable under certain of the elections operate to accelerate the recognition of gains or losses from the affected straddle positions.
Because application of the straddle rules may affect the character of gains or losses, defer losses and/or accelerate the recognition of gains or losses from the affected straddle positions, the amount which must be distributed to shareholders, and which will be taxed to shareholders as ordinary income or long-term capital gain, may be increased or decreased substantially as compared to the Portfolio that did not engage in such hedging transactions.
The Code provides constructive sales treatment for appreciated financial positions such as stock which has increased in value in the hands of the Portfolio. Under this constructive sales treatment, the Portfolio may be treated as having sold such stock and be required to recognize gain if it enters into a short sale, an offsetting notional principal contract, a futures or forward contract, or a similar transaction with respect to such stock or substantially identical property.
The Portfolio may make investments in which it recognizes income or gain prior to receiving cash with respect to such investment. For example, under certain tax rules, the Portfolio may be required to accrue a portion of any discount at which certain securities are purchased as income each year even though the Portfolio receives no payments in cash on the security during the year. To the extent that the Portfolio makes such investments, it generally would be required to pay out such income or gain as a distribution in each year to avoid taxation at the Portfolio level. Such distributions will be made from the available cash of the Portfolio or by liquidation of portfolio securities if necessary. If a distribution of cash necessitates the liquidation of portfolio securities, the Adviser will select which securities to sell. The Portfolio may realize a gain or loss from such sales. In the event a Portfolio realizes net capital gains from such transactions, its shareholders may receive a larger capital gain distribution, if any, than they would in the absence of such transactions.
Taxation of Dividends and Distributions. Shareholders normally will have to pay federal income taxes, and any state and/or local income taxes, on the dividends and other distributions they receive from the Portfolio. Such dividends and distributions, to the extent of the Portfolio's current and accumulated earnings and profits that are derived from net investment income or short-term capital gains, are taxable to the shareholder as ordinary income regardless of whether the shareholder receives such payments in additional shares or cash. If certain holding period requirements are met with respect to their shares in the Portfolio, a portion of income dividends received by a shareholder before January 1, 2013 may be taxed at the same rates as long-term capital gains. However, even if income received in the form of income dividends is taxed at the same rates as long-term capital gains, such income will not be considered long-term capital gains for other federal income tax purposes. For example, a shareholder generally will not be permitted to offset income dividends with capital losses. Short-term capital gain distributions will continue to be taxed at ordinary income rates.
Distributions by the Portfolio in excess of the Portfolio's current and accumulated earnings and profits will be treated as a return of capital to the extent of (and in reduction of) the shareholder's tax basis in his or her shares. Any
65
such return of capital distributions in excess of the shareholder's tax basis will be treated as gain from the sale or exchange of his or her shares, as discussed below.
Distributions of net long-term capital gains, if any, are taxable to shareholders as long-term capital gains regardless of how long a shareholder has held the Portfolio's shares and regardless of whether the distribution is received in additional shares or in cash. The maximum tax rate on long-term capital gains available to non-corporate shareholders generally is 15%. However, the maximum tax rate on long-term capital gains will return to 20% in 2013, and all dividends will be taxed at ordinary income rates.
Shareholders generally are taxed on any ordinary dividend or capital gain distributions from the Portfolio in the year they are actually distributed. However, if any such dividends or distributions are declared in October, November or December to shareholders of record of such month and paid in January, then such amounts will be treated for tax purposes as received by the shareholders on December 31.
After the end of each calendar year, shareholders will be sent information on their dividends and capital gain distributions for tax purposes, including the portion taxable as ordinary income, the portion taxable as long-term capital gains, and the amount of any dividends eligible for the federal dividends received deduction for corporations.
Shareholders who are not citizens or residents of the United States and certain foreign entities may be subject to withholding of United States tax on distributions made by the Portfolio of investment income and short-term capital gains at a rate of 30% (or a lower tax treaty rate, if applicable). Such shareholders may also be subject to United States estate tax with respect to their shares.
The Fund will be required to withhold U.S. federal withholding taxes (at 30%) from certain "withholdable payments" made to a non-U.S. shareholder (other than a individual) after 2014, unless the non-U.S. shareholder complies with certain U.S. tax reporting (and, in some cases, withholding) requirements (generally relating to the entity's U.S. owners or account holders, if any) or otherwise qualifies for an exemption from such withholding. Withholdable payments generally will include interest (including original issue discount), dividends, rents, annuities, and other fixed or determinable annual or periodical gains, profits or income, if such payments are derived from U.S. sources, as well as gross proceeds from dispositions of securities that could produce U.S. source interest or dividends. Income which is effectively connected with the conduct of a U.S. trade or business, is not, however, included in this definition.
For distributions with respect to taxable years of regulated investment companies beginning before January 1, 2012 the Portfolio is not required to withhold any amounts with respect to distributions to foreign shareholders that are properly designated by the Portfolio as "interest-related dividends" or "short-term capital gain dividends," provided that the income would not be subject to federal income tax if earned directly by the foreign shareholder. Unless the provisions discussed above are extended or made permanent by Congress, distributions made by the Portfolio of investment income and short-term capital gains in taxable years beginning on or after January 1, 2012 will be treated like other distributions and may be subject to U.S. tax and withholding like regular distributions. Prospective investors are urged to consult their tax advisors regarding the specific tax consequences of these distributions. Further, even if the provisions are extended, there may be withholding on a portion of distributions by the Portfolio. In addition, the Portfolio may determine to not make designations of interest-related dividends of short-term capital gain dividends which would result in increased withholding on distributions by the Portfolio. The Portfolio has not made such designations in the past and does not expect to make such designations in the future.
Although income received on direct U.S. Government obligations is taxable at the federal level, such income may be exempt from state tax, depending on the state, when received by a shareholder. The Portfolio will inform shareholders annually of the percentage of income and distributions derived from direct U.S. Government obligations. Shareholders should consult their tax advisors to determine whether any portion of dividends received from the Portfolio is considered tax exempt in their particular states.
Purchases, Redemptions and Exchanges of Portfolio Shares. Any dividend or capital gains distributions received by a shareholder from any regulated investment company will have the effect of reducing the net asset
66
value of the shareholder's stock in that company by the exact amount of the dividend or capital gains distribution. Furthermore, such dividends and capital gains distributions are subject to federal income taxes. If the net asset value of the shares should be reduced below a shareholder's cost as a result of the payment of dividends or the distribution of realized long-term capital gains, such payment or distributions would be in part a return of the shareholder's investment but nonetheless would be taxable to the shareholder. Therefore, an investor should consider the tax implications of purchasing Portfolio shares immediately prior to a distribution record date. Any gain or loss recognized on a sale or redemption of shares of the Portfolio by a shareholder who is not a dealer in securities will generally be treated as long-term capital gain or loss if the shares have been held for more than one year and short-term if for one year or less. Generally, for non-corporate shareholders, long-term capital gains are taxed at a maximum rate of 15% and short-term gains are currently taxed at ordinary income tax rates. The maximum rate on long-term capital gains is scheduled to return to 20% for taxable years beginning after December 31, 2012. If shares held for six months or less are sold or redeemed for a loss, two special rules apply: first, if shares on which a net capital gain distribution has been received are subsequently sold or redeemed, and such shares have been held for six months or less, any loss recognized will be treated as long-term capital loss to the extent of the long-term capital gain distributions. Second, any loss recognized by a shareholder upon the sale or redemption of shares of a municipal Portfolio fund held for six months or less will be disallowed to the extent of any exempt-interest dividends received by the Shareholder with respect to such shares.
Gain or loss on the sale or redemption of shares of the Portfolio is measured by the difference between the amount received and the tax basis of the shares. Shareholders should keep records of investments made (including shares acquired through reinvestment of dividends and distributions) so they can compute the tax basis of their shares. Under certain circumstances a shareholder may compute and use an average cost basis in determining the gain or loss on the sale or redemption of shares.
Due to recent legislation, the Portfolio (or its administrative agent) is required to report to the Internal Revenue Service ("IRS") and furnish to Portfolio shareholders the cost basis information for sale transactions of shares purchased on or after January 1, 2012. Shareholders may elect to have one of several cost basis methods applied to their account when calculating the cost basis of shares sold, including average cost, FIFO ("first-in, first-out") or some other specific identification method. Unless you instruct otherwise, the Portfolio will use average cost as its default cost basis method, and will treat sales as first coming from shares purchased prior to January 1, 2012. If average cost is used for the first sale of Portfolio shares covered by these new rules, the shareholder may only use an alternative cost basis method for shares purchased prospectively. Portfolio shareholders should consult with their tax advisors to determine the best cost basis method for their tax situation.
Exchanges of shares of the Portfolio for shares of another Portfolio are also subject to similar tax treatment. Such an exchange is treated for tax purposes as a sale of the original shares in the first Portfolio, followed by the purchase of shares in the second Portfolio.
If a shareholder realizes a loss on the redemption or exchange of the Portfolio's shares and reinvests in substantially similar shares within 30 days before or after the redemption or exchange, the transactions may be subject to the "wash sale" rules, resulting in a postponement of the recognition of such loss for tax purposes. The ability to otherwise deduct capital losses may be subject to other limitations.
Shareholders who are not citizens or residents of the United States and certain foreign entities that realize gain upon the sale or exchange of shares of the Portfolio will ordinarily be exempt from federal withholding tax unless: (i) in the case of a shareholder that is a nonresident alien individual, the gain is U.S. source income and such stockholder is physically present in the United States for more than 182 days during the taxable year and meets certain other requirements, or (ii) at any time during a testing period described in the Code, the Portfolio was a "U.S. real property holding corporation," as defined in the Code and Treasury Regulations, and the foreign shareholder actually or constructively held more than 5% of the shares of the same class, the gain would be taxed in the same manner as for a U.S. shareholder as discussed above. A 10% federal withholding tax generally would be imposed on the amount realized on the disposition of such shares and credited against the foreign shareholder's federal income tax liability on such disposition. However, for tax years beginning before January 1, 2012 (or a later date if extended by Congress), clause (ii) above will not apply if at all times during the testing period the value of the shares of the Portfolio is owned 50% or more by U.S. persons. Prospective investors are urged to consult their tax advisors regarding the specific tax consequences relating to the legislation. When you open your Fund account, you must certify on your Account
67
Registration Form that your Social Security Number or Taxpayer Identification Number is correct, and that you are not subject to backup withholding. By providing this information, you will avoid being subject to federal backup withholding at a rate of 28% (as of the date of this SAI) on taxable distributions and redemption proceeds. Any withheld amount would be sent to the IRS as an advance of your taxes due on your income for such year.
Foreign Income Taxes: Investment income received by the Portfolio from sources within foreign countries may be subject to foreign income taxes withheld at the source. The United States has entered into tax treaties with many foreign countries which would entitle the Portfolio to a reduced rate of tax or exemption from tax on such income. It is impossible to determine the effective rate of foreign tax in advance since the amount of the Portfolios' assets to be invested within various countries is not known. The Portfolio intends to operate so as to qualify for treaty-reduced rates of tax where applicable.
If at the end of the Portfolio's year, more than 50% of the Portfolio's assets are represented by foreign securities, then such Portfolio may file an election with the IRS to pass through to shareholders the amount of foreign income taxes paid by such Portfolio. A Portfolio will make such an election only if it is deemed to be in the best interests of such shareholders.
If the Portfolio makes the above-described election, the Portfolio will not be allowed a deduction or a credit for foreign taxes it paid and the amount of such taxes will be treated as a dividend paid by the Portfolio. The shareholders of the Portfolio will be required to: (i) include in gross income, even though not actually received, their respective pro rata share of foreign taxes paid by the Portfolio; (ii) treat their pro rata share of foreign taxes as paid by them; (iii) treat as gross income from sources within the respective foreign countries, for purposes of the foreign tax credit, their pro rata share of such foreign taxes and their pro rata share of any dividend paid by the Portfolio which represents income from sources within foreign countries; and (iv) either deduct their pro rata share of foreign taxes in computing their taxable income or use it within the limitations set forth in the Code as a foreign tax credit against U.S. income taxes (but not both). In no event shall a shareholder be allowed a foreign tax credit if the shareholder holds shares in the Portfolio for 15 days or less during the 31-day period beginning on the date which is 15 days before the date on which such shares become ex-dividend with respect to such dividends.
Each shareholder of the Portfolio will be notified if the foreign taxes paid by the Portfolio will pass through for that year, and, if so, the amount of each shareholder's pro rata share of (i) the foreign taxes paid, and (ii) the Portfolio's gross income from foreign sources. Shareholders who are not liable for federal income taxes, such as retirement plans qualified under Section 401 of the Code, will not be affected by any such "pass-through" of foreign tax credits.
State and Local Income Taxes: The Fund is not liable for any corporate income or franchise tax in the Commonwealth of Pennsylvania. Shareholders should consult their tax advisors for the state and local income tax consequences of distributions from the Portfolio.
PRINCIPAL HOLDERS OF SECURITIES
As of July 2, 2012, the following persons or entities own, of record or beneficially, more than 5% of the shares of any Class of the Portfolio's outstanding shares.
CLASS I
| Portfolio | Name and Address | % of Class | |||||||||
| Global Strategist | Kano Profit Sharing Plan PO Box 110098 Nashville, TN 37222-0098 | 29.85 | % | ||||||||
| Global Strategist | Wells Fargo Bank NA PO Box 1533 Minneapolis MN 55480-1533 | 29.75 | % | ||||||||
68
| Portfolio | Name and Address | % of Class | |||||||||
| Global Strategist | People's Light & Theater Co 39 Conestoga Rd. Malvern PA 19355-1737 | 7.57 | % | ||||||||
| Global Strategist | State Street Bk & Tr Co 616 Morning Glory Dr Hanover PA 17331-7828 | 5.56 | % | ||||||||
CLASS P
| Portfolio | Name and Address | % of Class | |||||||||
| Global Strategist | Fidelity Investments Institutional Operations 100 Magellan Way KWIC Covington KY 41015-1999 | 96.70 | % | ||||||||
CLASS H
| Portfolio | Name and Address | % of Class | |||||||||
| Global Strategist | Morgan Stanley Investment Management 100 Front Street One Tower Bridge West Conshohocken, PA 19428-2800 | 100.00 | % | ||||||||
CLASS L
| Portfolio | Name and Address | % of Class | |||||||||
| Global Strategist | Morgan Stanley Investment Management 100 Front Street One Tower Bridge West Conshohocken, PA 19428-2800 | 100.00 | % | ||||||||
The persons listed above as owning 25% or more of the outstanding shares of the Portfolio may be presumed to "control" (as that term is defined in the 1940 Act) the Portfolio. As a result, those persons would have the ability to vote a majority of the shares of the respective Portfolio on any matter requiring the approval of shareholders of the Portfolio.
PERFORMANCE INFORMATION
The average annual total return (cumulative return shown for periods less than one year) of Class I shares of the Portfolio for the periods noted is set forth below:
| Portfolio | 1 Year Return 09/30/11 | 5 Years ended 09/30/11 | 10 Years ended 09/30/11 | Inception to 09/30/11 | Date of inception of Class | ||||||||||||||||||
| Global Strategist | 1.07 | % | 2.46 | % | 4.37 | % | 6.89 | % | 12/31/1992 | ||||||||||||||
The average annual total return (cumulative return for periods less than one year) of Class P shares of the Portfolio for the periods noted is set forth below:
| Portfolio | 1 Year Return 09/30/11 | 5 Years ended 09/30/11 | 10 Years ended 09/30/11 | Inception to 09/30/11 | Date of inception of Class | ||||||||||||||||||
| Global Strategist | 0.83 | % | 2.19 | % | 4.11 | % | 5.39 | % | 11/01/1996 | ||||||||||||||
69
The average annual total return (after taxes on distributions) of Class I shares of the Portfolio for the periods noted is set forth below (cumulative returns for periods less than one year):
| Portfolio | 1 Year Return 09/30/11 | 5 Years ended 09/30/11 | 10 Years ended 09/30/11 | Inception to 09/30/11 | Date of inception of Class | ||||||||||||||||||
| Global Strategist | 0.60 | % | 1.69 | % | 3.54 | % | 4.94 | % | 12/31/1992 | ||||||||||||||
The average annual total return (after taxes on distributions and redemption) of Class I shares of the Portfolio for the periods noted is set forth below (cumulative return for periods less than one year):
| Portfolio | 1 Year Return 09/30/11 | 5 Years ended 09/30/11 | 10 Years ended 09/30/11 | Inception to 09/30/11 | Date of inception of Class | ||||||||||||||||||
| Global Strategist | 0.79 | % | 1.71 | % | 3.32 | % | 4.89 | % | 12/31/1992 | ||||||||||||||
The aggregate total return of the Portfolio for the periods noted is set forth below. One year aggregate total return figures are reflected under the average annual total return figures provided above.
| Portfolio | 5 Years ended 09/30/11* | 10 Years ended 09/30/11* | Inception to 09/30/11* | Date of inception of Class | |||||||||||||||
| Global Strategist | 12.93 | % | 53.36 | % | 248.77 | % | 12/31/1992 | ||||||||||||
* The above performance information relates solely to Class I. Performance for Class P would be lower because of the shareholder servicing fees charged to Class P. Performance for Class H would be lower because of the sales charge and shareholder servicing fees charged to Class H. Performance for Class L would be lower because of the distribution fees and shareholder servicing fees charged to Class L. Performance information for the Class H and Class L shares of the Portfolio will be provided once the Class H and Class L shares of the Portfolio have completed a full calendar year of operations.
The 30-day yield figures for the Portfolio are set forth below:
| Class I† | Period Ending 09/30/11 | ||||||
| Global Strategist | 1.96 | % | |||||
| Class P† | Period Ending 09/30/11 | ||||||
| Global Strategist | 1.71 | % | |||||
† The 30-day yield figures for the Class H and Class L shares of the Portfolio will be provided once the Class H and Class L shares of the Portfolio have completed a full calendar year of operations.
FINANCIAL STATEMENTS
The Fund's audited financial statements for the fiscal year ended September 30, 2011, including notes thereto, and the report of Ernst & Young LLP, an independent registered public accounting firm, and for the six month period ended March 31, 2012, which are unaudited, are herein incorporated by reference to the Fund's Annual and Semi-Annual Reports to Shareholders, respectively. A copy of the Fund's Annual Report to Shareholders must accompany the delivery of this SAI.
70
APPENDIX A
MORGAN STANLEY INVESTMENT MANAGEMENT
PROXY VOTING POLICY AND PROCEDURES
I. POLICY STATEMENT
Morgan Stanley Investment Management's ("MSIM") policy and procedures for voting proxies ("Policy") with respect to securities held in the accounts of clients applies to those MSIM entities that provide discretionary investment management services and for which an MSIM entity has authority to vote proxies. This Policy is reviewed and updated as necessary to address new and evolving proxy voting issues and standards.
The MSIM entities covered by this Policy currently include the following: Morgan Stanley AIP GP LP, Morgan Stanley Investment Management Inc., Morgan Stanley Investment Management Limited, Morgan Stanley Investment Management Company, Morgan Stanley Asset & Investment Trust Management Co., Limited, Morgan Stanley Investment Management Private Limited and Private Investment Partners Inc. (each an "MSIM Affiliate" and collectively referred to as the "MSIM Affiliates" or as "we" below).
Each MSIM Affiliate will use its best efforts to vote proxies as part of its authority to manage, acquire and dispose of account assets. With respect to the MSIM registered management investment companies (the "MSIM Funds"), each MSIM Affiliate will vote proxies under this Policy pursuant to authority granted under its applicable investment advisory agreement or, in the absence of such authority, as authorized by the Board of Directors/Trustees of the MSIM Funds. A MSIM Affiliate will not vote proxies unless the investment management or investment advisory agreement explicitly authorizes the MSIM Affiliate to vote proxies. MSIM Affiliates will vote proxies in a prudent and diligent manner and in the best interests of clients, including beneficiaries of and participants in a client's benefit plan(s) for which the MSIM Affiliates manage assets, consistent with the objective of maximizing long-term investment returns ("Client Proxy Standard"). In certain situations, a client or its fiduciary may provide an MSIM Affiliate with a proxy voting policy. In these situations, the MSIM Affiliate will comply with the client's policy.
Proxy Research Services—ISS Governance Services ("ISS") and Glass Lewis (together with other proxy research providers as we may retain from time to time, the "Research Providers") are independent advisers that specialize in providing a variety of fiduciary-level proxy-related services to institutional investment managers, plan sponsors, custodians, consultants, and other institutional investors. The services provided include in-depth research, global issuer analysis, and voting recommendations. While we may review and utilize the recommendations of one or more Research Providers in making proxy voting decisions, we are in no way obligated to follow such recommendations. In addition to research, ISS provides vote execution, reporting, and recordkeeping services.
Voting Proxies for Certain Non-U.S. Companies—Voting proxies of companies located in some jurisdictions may involve several problems that can restrict or prevent the ability to vote such proxies or entail significant costs. These problems include, but are not limited to: (i) proxy statements and ballots being written in a language other than English; (ii) untimely and/or inadequate notice of shareholder meetings; (iii) restrictions on the ability of holders outside the issuer's jurisdiction of organization to exercise votes; (iv) requirements to vote proxies in person; (v) the imposition of restrictions on the sale of the securities for a period of time in proximity to the shareholder meeting; and (vi) requirements to provide local agents with power of attorney to facilitate our voting instructions. As a result, we vote clients' non-U.S. proxies on a best efforts basis only, after weighing the costs and benefits of voting such proxies, consistent with the Client Proxy Standard. ISS has been retained to provide assistance in connection with voting non-U.S. proxies.
II. GENERAL PROXY VOTING GUIDELINES
To promotes consistency in voting proxies on behalf of its clients, we follow this Policy (subject to any exception set forth herein). The Policy addresses a broad range of issues, and provides general voting parameters on proposals that arise most frequently. However, details of specific proposals vary, and those details affect particular voting decisions, as do factors specific to a given company. Pursuant to the procedures set forth herein, we may vote in a manner that is not in accordance with the following general guidelines, provided the vote is approved by the Proxy Review Committee (see Section III for description) and is consistent with the Client Proxy Standard. Morgan Stanley AIP GP LP will follow the procedures as described in Appendix A.
A-1
We endeavor to integrate governance and proxy voting policy with investment goals, using the vote to encourage portfolio companies to enhance long-term shareholder value and to provide a high standard of transparency such that equity markets can value corporate assets appropriately.
We seek to follow the Client Proxy Standard for each client. At times, this may result in split votes, for example when different clients have varying economic interests in the outcome of a particular voting matter (such as a case in which varied ownership interests in two companies involved in a merger result in different stakes in the outcome). We also may split votes at times based on differing views of portfolio managers.
We may abstain on matters for which disclosure is inadequate.
A. Routine Matters.
We generally support routine management proposals. The following are examples of routine management proposals:
• Approval of financial statements and auditor reports if delivered with an unqualified auditor's opinion.
• General updating/corrective amendments to the charter, articles of association or bylaws, unless we believe that such amendments would diminish shareholder rights.
• Most proposals related to the conduct of the annual meeting, with the following exceptions. We generally oppose proposals that relate to "the transaction of such other business which may come before the meeting," and open-ended requests for adjournment. However, where management specifically states the reason for requesting an adjournment and the requested adjournment would facilitate passage of a proposal that would otherwise be supported under this Policy (i.e. an uncontested corporate transaction), the adjournment request will be supported.
We generally support shareholder proposals advocating confidential voting procedures and independent tabulation of voting results.
B. Board of Directors.
1. Election of directors: Votes on board nominees can involve balancing a variety of considerations. In vote decisions, we may take into consideration whether the company has a majority voting policy in place that we believe makes the director vote more meaningful. In the absence of a proxy contest, we generally support the board's nominees for director except as follows:
a. We consider withholding support from or voting against a nominee if we believe a direct conflict exists between the interests of the nominee and the public shareholders, including failure to meet fiduciary standards of care and/or loyalty. We may oppose directors where we conclude that actions of directors are unlawful, unethical or negligent. We consider opposing individual board members or an entire slate if we believe the board is entrenched and/or dealing inadequately with performance problems; if we believe the board is acting with insufficient independence between the board and management; or if we believe the board has not been sufficiently forthcoming with information on key governance or other material matters.
b. We consider witholding support from or voting against interested directors if the company's board does not meet market standards for director independence, or if otherwise we believe board independence is insufficient. We refer to prevalent market standards as promulgated by a stock exchange or other authority within a given market (e.g., New York Stock Exchange or Nasdaq rules for most U.S. companies, and The Combined Code on Corporate Governance in the United Kingdom). Thus, for an NYSE company with no controlling shareholder, we would expect that at a minimum a majority of directors should be independent as defined by NYSE. Where we view market standards as inadequate, we may withhold votes based on stronger independence standards. Market standards notwithstanding, we generally do not view long board tenure alone as a basis to classify a director as non-independent.
i. At a company with a shareholder or group that controls the company by virtue of a majority economic interest in the company, we have a reduced expectation for board independence, although we believe the presence of independent directors can be helpful, particularly in staffing the audit committee, and at times we may withhold support from or vote against a nominee on the view the
A-2
board or its committees are not sufficiently independent. In markets where board independence is not the norm (e.g. Japan), however, we consider factors including whether a board of a controlled company includes independent members who can be expected to look out for interests of minority holders.
ii. We consider withholding support from or voting against a nominee if he or she is affiliated with a major shareholder that has representation on a board disproportionate to its economic interest.
c. Depending on market standards, we consider withholding support from or voting against a nominee who is interested and who is standing for election as a member of the company's compensation/renumeration, nominating/governance or audit committee.
d. We consider withholding support or voting against nominees if the term for which they are nominated is excessive. We consider this issue on a market-specific basis.
e. We consider withholding support from or voting against nominees if, in our view, there has been insufficient board renewal (turnover), particularly in the context of extended poor company performance.
f. We consider withholding support from or voting against a nominee standing for election if the board has not taken action to implement generally accepted governance practices for which there is a "bright line" test. For example, in the context of the U.S. market, failure to eliminate a dead hand or slow hand poison pill would be seen as a basis for opposing one or more incumbent nominees.
g. In markets that encourage designated audit committee financial experts, we consider voting against members of an audit committee if no members are designated as such. We also may not support the audit committee members if the company has faced financial reporting issues and/or does not put the auditor up for ratification by shareholders.
h. We believe investors should have the ability to vote on individual nominees, and may abstain or vote against a slate of nominees where we are not given the opportunity to vote on individual nominees.
i. We consider withholding support from or voting against a nominee who has failed to attend at least 75% of the nominee's board and board committee meetings within a given year without a reasonable excuse. We also consider opposing nominees if the company does not meet market standards for disclosure on attendance.
j. We consider withholding support from or voting against a nominee who appears overcommitted, particularly through service on an excessive number of boards. Market expectations are incorporated into this analysis; for U.S. boards, we generally oppose election of a nominee who serves on more than six public company boards (excluding investment companies), although we may reference National Association of Corporate Directors guidance suggesting that public company CEOs, for example, should serve no more than two outside boards given the level of time commitment required in their primary job.
2. Discharge of directors' duties: In markets where an annual discharge of directors' responsibility is a routine agenda item, we generally support such discharge. However, we may vote against discharge or abstain from voting where there are serious findings of fraud or other unethical behavior for which the individual bears responsibility. The annual discharge of responsibility represents shareholder approval of disclosed actions taken by the board during the year and may make future shareholder action against the board difficult to pursue.
3. Board independence: We generally support U.S. shareholder proposals requiring that a certain percentage (up to 66 2/3%) of the company's board members be independent directors, and promoting all-independent audit, compensation and nominating/governance committees.
4. Board diversity: We consider on a case-by-case basis shareholder proposals urging diversity of board membership with respect to social, religious or ethnic group.
5. Majority voting: We generally support proposals requesting or requiring majority voting policies in election of directors, so long as there is a carve-out for plurality voting in the case of contested elections.
A-3
6. Proxy access: We consider on a case-by-case basis shareholder proposals on particular procedures for inclusion of shareholder nominees in company proxy statements.
7. Reimbursement for dissident nominees: We generally support well-crafted U.S. shareholder proposals that would provide for reimbursement of dissident nominees elected to a board, as the cost to shareholders in electing such nominees can be factored into the voting decision on those nominees.
8. Proposals to elect directors more frequently: In the U.S. public company context, we usually support shareholder and management proposals to elect all directors annually (to "declassify" the board), although we make an exception to this policy where we believe that long-term shareholder value may be harmed by this change given particular circumstances at the company at the time of the vote on such proposal. As indicated above, outside the U.S., we generally support greater accountability to shareholders that comes through more frequent director elections, but recognize that many markets embrace longer term lengths, sometimes for valid reasons given other aspects of the legal context in electing boards.
9. Cumulative voting: We generally support proposals to eliminate cumulative voting in the U.S. market context. (Cumulative voting provides that shareholders may concentrate their votes for one or a handful of candidates, a system that can enable a minority bloc to place representation on a board.) U.S. proposals to establish cumulative voting in the election of directors generally will not be supported.
10. Separation of Chairman and CEO positions: We vote on shareholder proposals to separate the Chairman and CEO positions and/or to appoint an independent Chairman based in part on prevailing practice in particular markets, since the context for such a practice varies. In many non-U.S. markets, we view separation of the roles as a market standard practice, and support division of the roles in that context. In the U.S., we consider such proposals on a case-by-case basis, considering, among other things, the existing board leadership structure, company performance, and any other evidence of entrenchment or perceived risk that power is overly concentrated in a single individual.
11. Director retirement age and term limits: Proposals setting or recommending director retirement ages or director term limits are voted on a case-by-case basis that includes consideration of company performance, the rate of board renewal, evidence of effective individual director evaluation processes, and any indications of entrenchment.
12. Proposals to limit directors' liability and/or broaden indemnification of officers and directors. Generally, we will support such proposals provided that an individual is eligible only if he or she has not acted in bad faith, with gross negligence or with reckless disregard of their duties.
C. Statutory auditor boards
The statutory auditor board, which is separate from the main board of directors, plays a role in corporate governance in several markets. These boards are elected by shareholders to provide assurance on compliance with legal and accounting standards and the company's articles of association. We generally vote for statutory auditor nominees if they meet independence standards. In markets that require disclosure on attendance by internal statutory auditors, however, we consider voting against nominees for these positions who failed to attend at least 75% of meetings in the previous year. We also consider opposing nominees if the company does not meet market standards for disclosure on attendance.
D. Corporate transactions and proxy fights.
We examine proposals relating to mergers, acquisitions and other special corporate transactions (i.e., takeovers, spin-offs, sales of assets, reorganizations, restructurings and recapitalizations) on a case-by-case basis in the interests of each fund or other account. Proposals for mergers or other significant transactions that are friendly and approved by the Research Providers usually are supported if there is no portfolio manager objection. We also analyze proxy contests on a case-by-case basis.
E. Changes in capital structure.
1. We generally support the following:
• Management and shareholder proposals aimed at eliminating unequal voting rights, assuming fair economic treatment of classes of shares we hold.
A-4
• U.S. management proposals to increase the authorization of existing classes of common stock (or securities convertible into common stock) if: (i) a clear business purpose is stated that we can support and the number of shares requested is reasonable in relation to the purpose for which authorization is requested; and/or (ii) the authorization does not exceed 100% of shares currently authorized and at least 30% of the total new authorization will be outstanding. (We consider proposals that do not meet these criteria on a case-by-case basis.)
• U.S. management proposals to create a new class of preferred stock or for issuances of preferred stock up to 50% of issued capital, unless we have concerns about use of the authority for anti-takeover purposes.
• Proposals in non-U.S. markets that in our view appropriately limit potential dilution of existing shareholders. A major consideration is whether existing shareholders would have preemptive rights for any issuance under a proposal for standing share issuance authority. We generally consider market-specific guidance in making these decisions; for example, in the U.K. market, we usually follow Association of British Insurers' ("ABI") guidance, although company-specific factors may be considered and for example, may sometimes lead us to voting against share authorization proposals even if they meet ABI guidance.
• Management proposals to authorize share repurchase plans, except in some cases in which we believe there are insufficient protections against use of an authorization for anti-takeover purposes.
• Management proposals to reduce the number of authorized shares of common or preferred stock, or to eliminate classes of preferred stock.
• Management proposals to effect stock splits.
• Management proposals to effect reverse stock splits if management proportionately reduces the authorized share amount set forth in the corporate charter. Reverse stock splits that do not adjust proportionately to the authorized share amount generally will be approved if the resulting increase in authorized shares coincides with the proxy guidelines set forth above for common stock increases.
• Management dividend payout proposals, except where we perceive company payouts to shareholders as inadequate.
2. We generally oppose the following (notwithstanding management support):
• Proposals to add classes of stock that would substantially dilute the voting interests of existing shareholders.
• Proposals to increase the authorized or issued number of shares of existing classes of stock that are unreasonably dilutive, particularly if there are no preemptive rights for existing shareholders. However, depending on market practices, we consider voting for proposals giving general authorization for issuance of shares not subject to pre-emptive rights if the authority is limited.
• Proposals that authorize share issuance at a discount to market rates, except where authority for such issuance is de minimis, or if there is a special situation that we believe justifies such authorization (as may be the case, for example, at a company under severe stress and risk of bankruptcy).
• Proposals relating to changes in capitalization by 100% or more.
We consider on a case-by-case basis shareholder proposals to increase dividend payout ratios, in light of market practice and perceived market weaknesses, as well as individual company payout history and current circumstances. For example, currently we perceive low payouts to shareholders as a concern at some Japanese companies, but may deem a low payout ratio as appropriate for a growth company making good use of its cash, notwithstanding the broader market concern.
F. Takeover Defenses and Shareholder Rights.
1. Shareholder rights plans: We generally support proposals to require shareholder approval or ratification of shareholder rights plans (poison pills). In voting on rights plans or similar takeover defenses, we consider on a case-by-case basis whether the company has demonstrated a need for the defense in the context of promoting long-term share value; whether provisions of the defense are in line with generally accepted governance principles in the market (and specifically the presence of an adequate qualified offer provision that would
A-5
exempt offers meeting certain conditions from the pill); and the specific context if the proposal is made in the midst of a takeover bid or contest for control.
2. Supermajority voting requirements: We generally oppose requirements for supermajority votes to amend the charter or bylaws, unless the provisions protect minority shareholders where there is a large shareholder. In line with this view, in the absence of a large shareholder we support reasonable shareholder proposals to limit such supermajority voting requirements.
3. Shareholder rights to call meetings: We consider proposals to enhance shareholder rights to call meetings on a case-by-case basis. At large-cap U.S. companies, we generally support efforts to establish the rights of holders of 10% or more of shares to call special meetings, unless the board or state law has a set policy or law establishing such rights at a threshold that we believe to be acceptable.
4. Written consent rights: In the U.S. context, we examine proposals for shareholder written consent rights on a case-by-case basis.
5. Reincorporation: We consider management and shareholder proposals to reincorporate to a different jurisdiction on a case-by-case basis. We oppose such proposals if we believe the main purpose is to take advantage of laws or judicial precedents that reduce shareholder rights.
6. Anti-greenmail provisions: Proposals relating to the adoption of anti-greenmail provisions will be supported, provided that the proposal: (i) defines greenmail; (ii) prohibits buyback offers to large block holders (holders of at least 1% of the outstanding shares and in certain cases, a greater amount) not made to all shareholders or not approved by disinterested shareholders; and (iii) contains no anti-takeover measures or other provisions restricting the rights of shareholders.
7. Bundled proposals: We may consider opposing or abstaining on proposals if disparate issues are "bundled" and presented for a single vote.
G. Auditors.
We generally support management proposals for selection or ratification of independent auditors. However, we may consider opposing such proposals with reference to incumbent audit firms if the company has suffered from serious accounting irregularities and we believe rotation of the audit firm is appropriate, or if fees paid to the auditor for non-audit-related services are excessive. Generally, to determine if non-audit fees are excessive, a 50% test will be applied (i.e., non-audit-related fees should be less than 50% of the total fees paid to the auditor). We generally vote against proposals to indemnify auditors.
H. Executive and Director Remuneration.
1. We generally support the following:
• Proposals for employee equity compensation plans and other employee ownership plans, provided that our research does not indicate that approval of the plan would be against shareholder interest. Such approval may be against shareholder interest if it authorizes excessive dilution and shareholder cost, particularly in the context of high usage ("run rate") of equity compensation in the recent past; or if there are objectionable plan design and provision.
• Proposals relating to fees to outside directors, provided the amounts are not excessive relative to other companies in the country or industry, and provided that the structure is appropriate within the market context. While stock-based compensation to outside directors is positive if moderate and appropriately structured, we are wary of significant stock option awards or other performance-based awards for outside directors, as well as provisions that could result in significant forfeiture of value on a director's decision to resign from a board (such forfeiture can undercut director independence).
• Proposals for employee stock purchase plans that permit discounts, but only for grants that are part of a broad-based employee plan, including all non-executive employees, and only if the discounts are limited to a reasonable market standard or less.
• Proposals for the establishment of employee retirement and severance plans, provided that our research does not indicate that approval of the plan would be against shareholder interest.
A-6
2. We generally oppose retirement plans and bonuses for non-executive directors and independent statutory auditors.
3. In the U.S. context, shareholder proposals requiring shareholder approval of all severance agreements will not be supported, but proposals that require shareholder approval for agreements in excess of three times the annual compensation (salary and bonus) generally will be supported. We generally oppose shareholder proposals that would establish arbitrary caps on pay. We consider on a case-by-case basis shareholder proposals that seek to limit Supplemental Executive Retirement Plans (SERPs), but support such proposals where we consider SERPs to be excessive.
4. Shareholder proposals advocating stronger and/or particular pay-for-performance models will be evaluated on a case-by-case basis, with consideration of the merits of the individual proposal within the context of the particular company and its labor markets, and the company's current and past practices. While we generally support emphasis on long-term components of senior executive pay and strong linkage of pay to performance, we consider factors including whether a proposal may be overly prescriptive, and the impact of the proposal, if implemented as written, on recruitment and retention.
5. We generally support proposals advocating reasonable senior executive and director stock ownership guidelines and holding requirements for shares gained in executive equity compensation programs
6. We generally support shareholder proposals for reasonable "claw-back" provisions that provide for company recovery of senior executive bonuses to the extent they were based on achieving financial benchmarks that were not actually met in light of subsequent restatements.
7. Management proposals effectively to re-price stock options are considered on a case-by-case basis. Considerations include the company's reasons and justifications for a re-pricing, the company's competitive position, whether senior executives and outside directors are excluded, potential cost to shareholders, whether the re-pricing or share exchange is on a value-for-value basis, and whether vesting requirements are extended.
8. Say-on-Pay: We consider proposals relating to an advisory vote on remuneration on a case-by-case basis. Considerations include a review of the relationship between executive remuneration and performance based on operating trends and total shareholder return over multiple performance periods. In addition, we review remuneration structures and potential poor pay practices, including relative magnitude of pay, discretionary bonus awards, tax gross ups, change-in-control features, internal pay equity and peer group construction. As long-term investors, we support remuneration policies that align with long-term shareholder returns.
I. Social, Political and Environmental Issues.
Shareholders in the U.S. and certain other markets submit proposals encouraging changes in company disclosure and practices related to particular corporate, social, political and environmental matters. We consider how to vote on the proposals on a case-by-case basis to determine likely impacts on shareholder value. We seek to balance concerns on reputational and other risks that lie behind a proposal against costs of implementation, while considering appropriate shareholder and management prerogatives. We may abstain from voting on proposals that do not have a readily determinable financial impact on shareholder value. We support proposals that, if implemented, would enhance useful disclosure, but we generally vote against proposals requesting reports that we believe are duplicative, related to matters not material to the business, or that would impose unnecessary or excessive costs. We believe that certain social and environmental shareholder proposals may intrude excessively on management prerogatives, which can lead us to oppose them.
J. Fund of Funds.
Certain Funds advised by an MSIM Affiliate invest only in other MSIM Funds. If an underlying fund has a shareholder meeting, in order to avoid any potential conflict of interest, such proposals will be voted in the same proportion as the votes of the other shareholders of the underlying fund, unless otherwise determined by the Proxy Review Committee.
III. ADMINISTRATION OF POLICY
The MSIM Proxy Review Committee (the "Committee") has overall responsibility for the Policy. The Committee, which is appointed by MSIM's Long-Only Executive Committee, consists of investment professionals who represent the different investment disciplines and geographic locations of the firm, and is chaired by the
A-7
director of the Corporate Governance Team ("CGT"). Because proxy voting is an investment responsibility and impacts shareholder value, and because of their knowledge of companies and markets, portfolio managers and other members of investment staff play a key role in proxy voting, although the Committee has final authority over proxy votes.
The CGT Director is responsible for identifying issues that require Committee deliberation or ratification. The CGT, working with advice of investment teams and the Committee, is responsible for voting on routine items and on matters that can be addressed in line with these Policy guidelines. The CGT has responsibility for voting case-by-case where guidelines and precedent provide adequate guidance.
The Committee will periodically review and have the authority to amend, as necessary, the Policy and establish and direct voting positions consistent with the Client Proxy Standard.
CGT and members of the Committee may take into account Research Providers' recommendations and research as well as any other relevant information they may request or receive, including portfolio manager and/or analyst comments and research, as applicable. Generally, proxies related to securities held in accounts that are managed pursuant to quantitative, index or index-like strategies ("Index Strategies") will be voted in the same manner as those held in actively managed accounts, unless economic interests of the accounts differ. Because accounts managed using Index Strategies are passively managed accounts, research from portfolio managers and/or analysts related to securities held in these accounts may not be available. If the affected securities are held only in accounts that are managed pursuant to Index Strategies, and the proxy relates to a matter that is not described in this Policy, the CGT will consider all available information from the Research Providers, and to the extent that the holdings are significant, from the portfolio managers and/or analysts.
A. Committee Procedures
The Committee meets at least quarterly and reviews and considers changes to the Policy at least annually. Through meetings and/or written communications, the Committee is responsible for monitoring and ratifying "split votes" (i.e., allowing certain shares of the same issuer that are the subject of the same proxy solicitation and held by one or more MSIM portfolios to be voted differently than other shares) and/or "override voting" (i.e., voting all MSIM portfolio shares in a manner contrary to the Policy). The Committee will review developing issues and approve upcoming votes, as appropriate, for matters as requested by CGT.
The Committee reserves the right to review voting decisions at any time and to make voting decisions as necessary to ensure the independence and integrity of the votes.
B. Material Conflicts of Interest
In addition to the procedures discussed above, if the CGT Director determines that an issue raises a material conflict of interest, the CGT Director may request a special committee to review, and recommend a course of action with respect to, the conflict(s) in question ("Special Committee").
A potential material conflict of interest could exist in the following situations, among others:
1. The issuer soliciting the vote is a client of MSIM or an affiliate of MSIM and the vote is on a matter that materially affects the issuer.
2. The proxy relates to Morgan Stanley common stock or any other security issued by Morgan Stanley or its affiliates except if echo voting is used, as with MSIM Funds, as described herein.
3. Morgan Stanley has a material pecuniary interest in the matter submitted for a vote (e.g., acting as a financial advisor to a party to a merger or acquisition for which Morgan Stanley will be paid a success fee if completed).
If the CGT Director determines that an issue raises a potential material conflict of interest, depending on the facts and circumstances, the issue will be addressed as follows:
1. If the matter relates to a topic that is discussed in this Policy, the proposal will be voted as per the Policy.
2. If the matter is not discussed in this Policy or the Policy indicates that the issue is to be decided case-by-case, the proposal will be voted in a manner consistent with the Research Providers, provided that all the
A-8
Research Providers consulted have the same recommendation, no portfolio manager objects to that vote, and the vote is consistent with MSIM's Client Proxy Standard.
3. If the Research Providers' recommendations differ, the CGT Director will refer the matter to a Special Committee to vote on the proposal, as appropriate.
Any Special Committee shall be comprised of the CGT Director and at least two portfolio managers (preferably members of the Committee) as approved by the Committee. The CGT Director may request non-voting participation by MSIM's General Counsel or his/her designee and the Chief Compliance Officer or his/her designee. In addition to the research provided by Research Providers, the Special Committee may request analysis from MSIM Affiliate investment professionals and outside sources to the extent it deems appropriate.
C. Proxy Voting Reporting
The CGT will document in writing all Committee and Special Committee decisions and actions, which documentation will be maintained by the CGT for a period of at least six years. To the extent these decisions relate to a security held by an MSIM Fund, the CGT will report the decisions to each applicable Board of Trustees/Directors of those Funds at each Board's next regularly scheduled Board meeting. The report will contain information concerning decisions made during the most recently ended calendar quarter immediately preceding the Board meeting.
MSIM will promptly provide a copy of this Policy to any client requesting it. MSIM will also, upon client request, promptly provide a report indicating how each proxy was voted with respect to securities held in that client's account.
MSIM's Legal Department is responsible for filing an annual Form N-PX on behalf of each MSIM Fund for which such filing is required, indicating how all proxies were voted with respect to such Fund's holdings.
A-9
APPENDIX A
The following procedures apply to accounts managed by Morgan Stanley AIP GP LP and Private Investment Partners Inc. ("AIP").
Generally, AIP will follow the guidelines set forth in Section II of MSIM's Proxy Voting Policy and Procedures. To the extent that such guidelines do not provide specific direction, or AIP determines that consistent with the Client Proxy Standard, the guidelines should not be followed, the Proxy Review Committee has delegated the voting authority to vote securities held by accounts managed by AIP to the Fund of Hedge Funds investment team, the Private Equity Fund of Funds investment team or the Private Equity Real Estate Fund of Funds investment team of AIP. A summary of decisions made by the investment teams will be made available to the Proxy Review Committee for its information at the next scheduled meeting of the Proxy Review Committee.
In certain cases, AIP may determine to abstain from determining (or recommending) how a proxy should be voted (and therefore abstain from voting such proxy or recommending how such proxy should be voted), such as where the expected cost of giving due consideration to the proxy does not justify the potential benefits to the affected account(s) that might result from adopting or rejecting (as the case may be) the measure in question.
Waiver of Voting Rights
For regulatory reasons, AIP may either 1) invest in a class of securities of an underlying fund (the "Fund") that does not provide for voting rights; or 2) waive 100% of its voting rights with respect to the following:
1. Any rights with respect to the removal or replacement of a director, general partner, managing member or other person acting in a similar capacity for or on behalf of the Fund (each individually a "Designated Person," and collectively, the "Designated Persons"), which may include, but are not limited to, voting on the election or removal of a Designated Person in the event of such Designated Person's death, disability, insolvency, bankruptcy, incapacity, or other event requiring a vote of interest holders of the Fund to remove or replace a Designated Person; and
2. Any rights in connection with a determination to renew, dissolve, liquidate, or otherwise terminate or continue the Fund, which may include, but are not limited to, voting on the renewal, dissolution, liquidation, termination or continuance of the Fund upon the occurrence of an event described in the Fund's organizational documents; provided, however, that, if the Fund's organizational documents require the consent of the Fund's general partner or manager, as the case may be, for any such termination or continuation of the Fund to be effective, then AIP may exercise its voting rights with respect to such matter.
Approved by Morgan Stanley Funds Board on September 27-28, 2011
A-10
APPENDIX B — DESCRIPTION OF RATINGS
I. Excerpts from Moody's Investors Service, Inc.'s Corporate Bond Ratings:
Aaa: Judged to be of the best quality; carry the smallest degree of invest risk;
Aa: judged to be of high quality by all standards;
A: possess many favorable investment attributes and are to be considered upper medium grade obligations;
Baa: considered as medium grade obligations; i.e., they are neither highly protected nor poorly secured;
Ba: judged to have speculative elements; their future cannot be considered well-assured;
B: assurance of interest and principal payments or of maintenance of other terms of the contract over any long period of time may be small.
Caa: Bonds which are rated Caa are of poor standing. Such issues may be in default or there may be present elements of danger with respect to principal or interest.
Ca: Bonds which are rated Ca represent obligations which are speculative in a high degree. Such issues are often in default or have other marked shortcomings.
C: Bonds which are rated C are lowest rated class of bonds and issues so rated can be regarded as having extremely poor prospects of ever attaining any real investment standing.
Note: Moody's applies numerical modifiers, 1, 2 and 3 in each generic rating classification from Aa through Caa in its corporate bond rating system. The modifier 1 indicates that the obligation ranks in the higher end of its generic rating category; the modifier 2 indicates a mid-range ranking; and the modifier 3 indicates that the issue ranks in the lower end of its generic rating category.
II. Excerpts from Standard & Poor's Rating Group's Corporate Bond Ratings:
AAA: Highest rating assigned for an obligation; obligor has extremely strong capacity to meet its financial commitments;
AA: obligation differs from the highest-rated obligations only in small degree; obligor's capacity to meet its financial commitment on the obligation is very strong;
A: obligation is somewhat more susceptible to the adverse effects of changes in circumstances and economic conditions than obligations in higher-rated categories; obligor's capacity to meet its financial commitment on the obligation is still strong;
BBB: obligation exhibits adequate protection parameters; adverse economic conditions or changing circumstances are more likely to lead to a weakened capacity of the obligor to meet its financial commitment on the obligation.
BB, B, CCC, CC, C: Obligations rated BB, B, CCC, and CC are regarded as having significant speculative characteristics. BB indicates the least degree of speculation and CC the highest. While such obligations will likely have some quality and protective characteristics, these may be outweighed by large uncertainties or major exposures to adverse conditions. The C rating may be used to cover a situation where a bankruptcy petition has been filed or similar action has been taken, but payments on this obligation are being continued.
D: An obligation rated D is in payment default. The D rating category is used when payments on an obligation are not made on the date due even if the applicable grace period has not expired, unless Standard & Poor's believes that such payments will be made during such grace period. The D rating also will be used upon the filing of a bankruptcy petition or the taking of a similar action if payments on an obligation are jeopardized.
Plus (+) or minus (-): The ratings from AA to CCC may be modified by the addition of a plus or minus sign to show relative standing within the major rating categories.
B-1
III. Excerpts from Fitch, Inc.'s Corporate Bond Ratings:
AAA: Highest credit quality; denotes the lowest expectation of credit risk; assigned only in case of exceptionally strong capacity for payment of financial commitments. This capacity is highly unlikely to be adversely affected by foreseeable events.
AA: Very high credit quality; denote expectations of very low credit risk; indicate very strong capacity for payment of financial commitments. This capacity is not significantly vulnerable to foreseeable events.
A: High credit quality; denote expectations of low credit risk. The capacity for payment of financial commitments is considered strong. This capacity may, nevertheless, be more vulnerable to changes in circumstances or in economic conditions than is the case for higher ratings.
BBB: Good credit quality; indicate that there is currently expectations of low credit risk. The capacity for payment of financial commitments is considered adequate but adverse changes in circumstances and economic conditions are more likely to impair this capacity. This is the lowest investment grade category.
BB: Speculative; indicate that there is a possibility of credit risk developing, particularly as the result of adverse economic change over time; however, business or financial alternatives may be available to allow financial commitments to be met. Securities rated in this category are not investment grade.
B: Highly speculative; indicate that significant credit risk is present, but a limited margin of safety remains. Financial commitments are currently being met; however, capacity for continued payment is contingent upon a sustained, favorable business and economic environment.
CCC: Default is a real possibility. Capacity for meeting financial commitments is solely reliant upon sustained, favorable business or economic conditions.
CC: Default of some kind appears probable.
C: Default is imminent.
RD: Indicates an entity that has failed to make due payments (within the applicable grace period) on some but not all material financial obligations, but continues to honor other classes of obligations.
D: Default. Default is determined by reference to the terms of the obligations' documentation. Fitch will assign default ratings where it has reasonably determined that payment has not been made on a material obligation in accordance with the requirements of the obligation's documentation, or where it believes that default ratings consistent with Fitch's published definition of default are the most appropriate ratings to assign.
The modifiers "+" or "-" may be appended to a rating to denote relative status within major rating categories. Such suffixes are not added to the AAA Long-term rating category or to categories below CCC.
IV. Excerpts from Moody's Investors Service, Inc.'s Preferred Stock Ratings:
aaa: An issue which is rated aaa is considered to be a top-quality preferred stock. This rating indicates good asset protection and the least risk of dividend impairment within the universe of preferred stocks.
aa: An issue which is rated aa is considered a high-grade preferred stock. This rating indicates that there is reasonable assurance that earnings and asset protection will remain relatively well maintained in the foreseeable future.
a: An issue which is rated a is considered to be an upper medium grade preferred stock. While risks are judged to be somewhat greater than in the aaa and aa classifications, earnings and asset protection are, nevertheless expected to be maintained at adequate levels.
baa: An issue which is rated baa is considered to be medium grade, neither highly protected nor poorly secured. Earnings and asset protection appear adequate at present but may be questionable over any great length of time.
ba: an issue which is rated ba is considered to have speculative elements and its future cannot be considered well assured. Earnings and asset protection may be very moderate and not well safeguarded during adverse periods. Uncertainty of position characterizes preferred stocks in this class.
B-2
b: An issue which is rated b generally lacks the characteristics of a desirable investment. Assurance of dividend payments and maintenance of other terms of the issue over any long period of time may be small.
caa: An issue which is rated caa is likely to be in arrears on dividend payments. This rating designation does not purport to indicate the future status of payment.
ca: An issue which is rated ca is speculative in a high degree and is likely to be in arrears on dividends with little likelihood of eventual payment.
c: This is the lowest rated class of preferred of preference stock. Issues so rated can be regarded as having extremely poor prospects of ever attaining any real investment standing.
Note: Moody's may apply numerical modifiers 1, 2 and 3 in each rating classification from "aa" through "b" in its preferred stock rating system. The modifier 1 indicated that the security ranks in the higher end of its generic rating category; the modifier 2 indicates a mid-range ranking; and the modifier 3 indicates that the issue ranks in the lower end of its generic rating category.
V. Excerpts from Standard & Poor's Rating Group's Preferred Stock Ratings:
AAA: This is the highest rating that may be assigned by S&P's to a preferred stock issue and indicates an extremely strong capacity to pay the preferred stock obligations.
AA: A preferred stock issue rated AA also qualifies as a high quality fixed income security. The capacity to pay preferred stock obligations is very strong, although not as overwhelming as for issues rated AAA.
A: An issue rated A is backed by a sound capacity to pay the preferred stock obligations, although it is somewhat more susceptible to the adverse effect of the changes in circumstances and economic conditions.
BBB: An issue rated BBB is regarded as backed by an adequate capacity to pay the preferred stock obligations. Whereas it normally exhibits adequate protection parameter, adverse economic conditions or changing circumstances are more likely to lead to a weakened capacity to make payments for a preferred stock in this category than for issues in the A category.
BB, B, CCC: Preferred stock rated BB, B, and CCC are regarded, on balance, as predominantly speculative with respect to the issuer's capacity to pay preferred stock obligations. Bb indicates the lowest degree of speculation and CCC the highest degree of speculation. While such issues will likely have some quality and protective characteristics, these are outweighed by large uncertainties of major risk exposures to adverse conditions.
CC: The rating CC is reserved for a preferred stock in arrears on dividends or sinking fund payments but that is currently paying.
C: A preferred stock rated C is a non-paying issue.
D: A preferred stock rated D is a non-paying issue with the issuer in default on debt instruments.
Plus (+) or Minus (-): The ratings from AA for CCC may be modified by the addition of a plus or minus sign to show relative standing within the major rating categories.
VI. Excerpts from Fitch, Inc's Preferred Stock Ratings:
AAA: These preferred stocks are considered to be investment grade and of the highest credit quality. The obligor has an exceptionally strong ability to pay, which is unlikely to be affected by reasonably foreseeable events.
AA: These preferred stocks are considered to be investment grade and of very high credit quality. The obligor's ability to pay is very strong, although not quite as strong as preferred stocks rated "AAA".
A: These preferred stocks are considered to be investment grade and of high credit quality. The obligor's ability to pay is considered to be strong, but may be more vulnerable to adverse changes in economic conditions and circumstances than preferred stocks with higher ratings.
BBB: These preferred stocks are considered to be investment grade and of satisfactory credit quality. The obligor's ability to pay interest and repay principal is considered to be adequate. Adverse changes in economic
B-3
conditions and circumstances, however, are more likely to have adverse impact on these preferred stocks, and therefore, impair timely payment. The likelihood that the ratings of these preferred stocks will fall below investment grade is higher than for preferred stocks with higher ratings.
BB: These preferred stocks are considered speculative. The obligor's ability to pay may be affected over time by adverse economic changes. However, business and financial alternatives can be identified that could assist the obligor in satisfying its dividend payment requirements.
B: These preferred stocks are considered highly speculative. While preferred in this class are currently meeting dividend payment requirements, the probability of continued timely payment reflects the obligor's limited margin of safety and the need for reasonable business and economic activity throughout the life of the issue.
CCC: These preferred stocks have certain identifiable characteristics which, if not remedied, may lead to non-payment. The ability to meet obligations requires an advantageous business and economic environment.
CC: These preferred stocks are minimally protected. Non-payment seems probable over time.
C: These preferred stocks are in imminent non-payment.
DDD, DD AND D: These preferred stocks are in non-payment. Such preferred stocks are extremely speculative and should be valued on the basis of their ultimate recovery value in liquidation or reorganization of the obligor. DDD represents the highest potential for recovery and D represents the lowest potential for recovery.
PLUS (+) OR MINUS (-): The ratings from AA to C may be modified by the addition of a plus or minus sign to indicate the relative position of a credit within the rating category.
B-4
STATEMENT OF ADDITIONAL INFORMATION
Morgan Stanley
Mid Cap Growth Fund
| Share Class | Ticker Symbol | ||||||
| Class A | DGRAX | ||||||
| Class B | DGRBX | ||||||
| Class C | DGRCX | ||||||
| Class I | DGRDX | ||||||
January 31, 2012
This Statement of Additional Information ("SAI") is not a prospectus. The Prospectus (dated January 31, 2012) for Morgan Stanley Mid Cap Growth Fund may be obtained without charge from the Fund at its address or telephone number listed below.
The Fund's audited financial statements for the fiscal year ended September 30, 2011, including notes thereto, and the report of Ernst & Young LLP, are herein incorporated by reference to the Fund's Annual Report to Shareholders. A copy of the Fund's Annual Report to Shareholders must accompany the delivery of this SAI.
Morgan Stanley
Mid Cap Growth Fund
522 Fifth Avenue
New York, NY 10036
(800) 869-NEWS
TABLE OF CONTENTS
| I. | Fund History | 4 | |||||||||
| II. | Description of the Fund and Its Investments and Risks | 4 | |||||||||
| A. Classification | 4 | ||||||||||
| B. Investment Strategies and Risks | 4 | ||||||||||
| C. Fund Policies/Investment Restrictions | 21 | ||||||||||
| D. Disclosure of Portfolio Holdings | 23 | ||||||||||
| III. | Management of the Fund | 26 | |||||||||
| A. Board of Trustees | 26 | ||||||||||
| B. Management Information | 27 | ||||||||||
| C. Compensation | 36 | ||||||||||
| IV. | Control Persons and Principal Holders of Securities | 38 | |||||||||
| V. | Investment Advisory and Other Services | 38 | |||||||||
| A. Adviser and Administrator | 38 | ||||||||||
| B. Principal Underwriter | 39 | ||||||||||
| C. Services Provided by the Adviser and Administrator | 40 | ||||||||||
| D. Dealer Reallowances | 41 | ||||||||||
| E. Rule 12b-1 Plan | 41 | ||||||||||
| F. Other Service Providers | 43 | ||||||||||
| G. Fund Management | 44 | ||||||||||
| H. Codes of Ethics | 46 | ||||||||||
| I. Proxy Voting Policy and Proxy Voting Record | 46 | ||||||||||
| J. Revenue Sharing | 46 | ||||||||||
| VI. | Brokerage Allocation and Other Practices | 48 | |||||||||
| A. Brokerage Transactions | 48 | ||||||||||
| B. Commissions | 48 | ||||||||||
| C. Brokerage Selection | 48 | ||||||||||
| D. Regular Broker-Dealers | 50 | ||||||||||
| VII. | Capital Stock and Other Securities | 50 | |||||||||
| VIII. | Purchase, Redemption and Pricing of Shares | 51 | |||||||||
| A. Purchase/Redemption of Shares | 51 | ||||||||||
| B. Offering Price | 52 | ||||||||||
| IX. | Taxation of the Fund and Shareholders | 53 | |||||||||
| X. | Underwriters | 56 | |||||||||
| XI. | Performance Data | 56 | |||||||||
| XII. | Financial Statements | 57 | |||||||||
| XIII. | Fund Counsel | 57 | |||||||||
| Appendix A — Proxy Voting Policy and Procedures | A-1 | ||||||||||
2
Glossary of Selected Defined Terms
The terms defined in this glossary are frequently used in this SAI (other terms used occasionally are defined in the text of the document).
"Administrator" or "Morgan Stanley Services" — Morgan Stanley Services Company Inc., a wholly-owned fund services subsidiary of the Adviser.
"Adviser" — Morgan Stanley Investment Management Inc., a wholly-owned investment adviser subsidiary of Morgan Stanley.
"Custodian" — State Street Bank and Trust Company.
"Distributor" — Morgan Stanley Distribution, Inc., a wholly-owned broker-dealer subsidiary of Morgan Stanley.
"Financial Advisors" — Morgan Stanley authorized financial services representatives.
"Fund" — Morgan Stanley Mid Cap Growth Fund, a registered open-end investment company.
"Independent Trustees" — Trustees who are not "interested persons" (as defined by the Investment Company Act of 1940, as amended ("Investment Company Act")) of the Fund.
"Morgan Stanley & Co." — Morgan Stanley & Co. LLC, a wholly-owned broker-dealer subsidiary of Morgan Stanley.
"Morgan Stanley Funds" — Registered investment companies for which the Adviser serves as the investment adviser and that hold themselves out to investors as related companies for investment and investor services.
"Morgan Stanley Smith Barney" — Morgan Stanley Smith Barney LLC, a majority-owned broker-dealer subsidiary of Morgan Stanley.
"Transfer Agent" — Morgan Stanley Services Company Inc., a wholly-owned transfer agent subsidiary of Morgan Stanley.
"Trustees" — The Board of Trustees of the Fund.
3
I. FUND HISTORY
The Fund was organized as a Massachusetts business trust, under a Declaration of Trust, on December 28, 1982, with the name Dean Witter Developing Growth Securities Trust. Effective June 22, 1998, the Fund's name was changed to Morgan Stanley Dean Witter Developing Growth Securities Trust. Effective June 18, 2001, the Fund's name was changed to Morgan Stanley Developing Growth Securities Trust. Effective January 31, 2008, the Fund's name was changed to Morgan Stanley Mid Cap Growth Fund.
II. DESCRIPTION OF THE FUND AND ITS INVESTMENTS AND RISKS
A. Classification
The Fund is an open-end, diversified management investment company whose investment objective is to seek long-term capital growth.
B. Investment Strategies and Risks
The following discussion of the Fund's investment strategies and risks should be read with the sections of the Fund's Prospectus titled "Principal Investment Strategies," "Principal Risks" and "Additional Information about the Fund's Investment Objective, Strategies and Risks."
Derivatives. The Fund may, but is not required to, use various derivatives and related investment strategies as described below. Derivatives may be used for a variety of purposes including hedging, risk management, portfolio management or to earn income. Any or all of the investment techniques described herein may be used at any time and there is no particular strategy that dictates the use of one technique rather than another, as the use of any derivative by the Fund is a function of numerous variables, including market conditions. The Fund complies with applicable regulatory requirements when using derivatives, including the segregation or earmarking of cash or liquid assets when mandated by U.S. Securities and Exchange Commission ("SEC") rules or SEC staff positions. Although the Adviser seeks to use derivatives to further the Fund's investment objective, no assurance can be given that the use of derivatives will achieve this result.
General Risks of Derivatives.
Derivatives utilized by the Fund may involve the purchase and sale of derivative instruments. A derivative is a financial instrument the value of which depends upon (or derives from) the value of another asset, security, interest rate or index. Derivatives may relate to a wide variety of underlying instruments, including equity and debt securities, indexes, interest rates, currencies and other assets. Certain derivative instruments which the Fund may use and the risks of those instruments are described in further detail below. The Fund may in the future also utilize derivatives techniques, instruments and strategies that may be newly developed or permitted as a result of regulatory changes, consistent with the Fund's investment objective and policies. Such newly developed techniques, instruments and strategies may involve risks different than or in addition to those described herein. No assurance can be given that any derivatives strategy employed by the Fund will be successful.
The risks associated with the use of derivatives are different from, and possibly greater than, the risks associated with investing directly in the instruments underlying such derivatives. Derivatives are highly specialized instruments that require investment techniques and risk analyses different from other portfolio investments. The use of derivative instruments requires an understanding not only of the underlying instrument but also of the derivative itself. Certain risk factors generally applicable to derivative transactions are described below.
• Derivatives are subject to the risk that the market value of the derivative itself or the market value of underlying instruments will change in a way adverse to the Fund's interests. The Fund bears the risk that the Adviser may incorrectly forecast future market trends and other financial or economic factors or the value of the underlying security, index, interest rate or currency when establishing a derivatives position for the Fund.
4
• Derivatives may be subject to pricing risk, which exists when a derivative becomes extraordinarily expensive (or inexpensive) relative to historical prices or corresponding instruments. Under such market conditions, it may not be economically feasible to initiate a transaction or liquidate a position at an advantageous time or price.
• Many derivatives are complex and often valued subjectively. Improper valuations can result in increased payment requirements to counterparties or a loss of value to the Fund.
• Using derivatives as a hedge against a portfolio investment subjects the Fund to the risk that the derivative will have imperfect correlation with the portfolio investment, which could result in the Fund incurring substantial losses. This correlation risk may be greater in the case of derivatives based on an index or other basket of securities, as the portfolio securities being hedged may not duplicate the components of the underlying index or the basket may not be of exactly the same type of obligation as those underlying the derivative. The use of derivatives for "cross hedging" purposes (using a derivative based on one instrument as a hedge for a different instrument) may also involve greater correlation risks.
• While using derivatives for hedging purposes can reduce the Fund's risk of loss, it may also limit the Fund's opportunity for gains or result in losses by offsetting or limiting the Fund's ability to participate in favorable price movements in portfolio investments.
• Derivatives transactions for non-hedging purposes involve greater risks and may result in losses which would not be offset by increases in the value of portfolio securities or declines in the cost of securities to be acquired. In the event that the Fund enters into a derivatives transaction as an alternative to purchasing or selling the underlying instrument or in order to obtain desired exposure to an index or market, the Fund will be exposed to the same risks as are incurred in purchasing or selling the underlying instruments directly.
• The use of certain derivatives transactions involves the risk of loss resulting from the insolvency or bankruptcy of the counterparty to the contract or the failure by the counterparty to make required payments or otherwise comply with the terms of the contract. In the event of default by a counterparty, the Fund may have contractual remedies pursuant to the agreements related to the transaction.
• Liquidity risk exists when a particular derivative is difficult to purchase or sell. If a derivative transaction is particularly large or if the relevant market is illiquid, the Fund may be unable to initiate a transaction or liquidate a position at an advantageous time or price.
• Certain derivatives transactions are not entered into or traded on exchanges or in markets regulated by the U.S. Commodity Futures Trading Commission ("CFTC") or the SEC. Instead, such over-the-counter ("OTC") derivatives are entered into directly by the Fund and a counterparty and may be traded only through financial institutions acting as market makers. OTC derivatives transactions can only be entered into with a willing counterparty that is approved by the Adviser in accordance with guidelines established by the Board. Where no such counterparty is available, the Fund will be unable to enter into a desired OTC transaction. There also may be greater risk that no liquid secondary market in the trading of OTC derivatives will exist, in which case the Fund may be required to hold such instruments until exercise, expiration or maturity. Many of the protections afforded to exchange participants are not available to participants in OTC derivatives transactions. OTC derivatives transactions are not subject to the guarantee of an exchange or clearinghouse, and as a result the Fund would bear greater risk of default by the counterparties to such transactions.
• The Fund may be required to make physical delivery of portfolio securities underlying a derivative in order to close out a derivatives position or to sell portfolio securities at a time or price at which it may be disadvantageous to do so in order to obtain cash to close out or to maintain a derivatives position.
5
• As a result of the structure of certain derivatives, adverse changes in the value of the underlying instrument can result in losses substantially greater than the amount invested in the derivative itself. Certain derivatives have the potential for unlimited loss, regardless of the size of the initial investment.
• Certain derivatives may be considered illiquid and therefore subject to the Fund's limitation on investments in illiquid securities.
• Derivatives transactions conducted outside the United States may not be conducted in the same manner as those entered into on U.S. exchanges, and may be subject to different margin, exercise, settlement or expiration procedures. Brokerage commissions, clearing costs and other transaction costs may be higher on foreign exchanges. Many of the risks of OTC derivatives transactions are also applicable to derivatives transactions conducted outside the United States. Derivatives transactions conducted outside the United States are subject to the risk of governmental action affecting the trading in, or the prices of, foreign securities, currencies and other instruments. The value of such positions could be adversely affected by foreign political and economic factors; lesser availability of data on which to make trading decisions; delays on the Fund's ability to act upon economic events occurring in foreign markets; and less liquidity than U.S. markets.
• Currency derivatives are subject to additional risks. Currency derivatives transactions may be negatively affected by government exchange controls, blockages, and manipulations. Currency exchange rates may be influenced by factors extrinsic to a country's economy. There is no systematic reporting of last sale information with respect to foreign currencies. As a result, the available information on which trading in currency derivatives will be based may not be as complete as comparable data for other transactions. Events could occur in the foreign currency market which will not be reflected in currency derivatives until the following day, making it more difficult for the Fund to respond to such events in a timely manner.
Options
An option is a contract that gives the holder of the option the right, but not the obligation, to buy from (in the case of a call option) or sell to (in the case of a put option) the seller of the option (the "option writer") the underlying security at a specified fixed price (the "exercise price") on or prior to a specified date (the "expiration date"). The buyer of the option pays to the option writer the option premium, which is the purchase price of the option.
Exchange-traded options are issued by a regulated intermediary such as the Options Clearing Corporation ("OCC"), which guarantees the performance of the obligations of the parties to such options. OTC options are purchased from or sold to counterparties through direct bilateral agreement between the Fund and its counterparties. Certain options, such as options on individual securities, may be settled through physical delivery of the underlying security, whereas other options, such as index options, are settled in cash in an amount based on the value of the underlying instrument multiplied by a specified multiplier.
Writing Options. The Fund may write call and put options. As the writer of a call option, the Fund receives the premium from the purchaser of the option and has the obligation, upon exercise of the option, to deliver the underlying security upon payment of the exercise price. If the option expires without being exercised the Fund is not required to deliver the underlying security but retains the premium received.
The Fund may only write call options that are "covered." A call option on a security is covered if (a) the Fund owns the security underlying the call or has an absolute and immediate right to acquire that security without additional cash consideration (or, if additional cash consideration is required, such amount is maintained by the Fund in segregated or earmarked cash or liquid assets) upon conversion or exchange of other securities held by the Fund; or (b) the Fund has purchased a call on the underlying security, the exercise price of which is (i) equal to or less than the exercise price of the call written, or (ii) greater than the exercise price of the call written, provided the difference is maintained by the Fund in segregated or earmarked cash or liquid assets.
6
Selling call options involves the risk that the Fund may be required to sell the underlying security at a disadvantageous price, below the market price of such security, at the time the option is exercised. As the writer of a covered call option, the Fund forgoes, during the option's life, the opportunity to profit from increases in the market value of the underlying security covering the option above the sum of the premium and the exercise price but retains the risk of loss should the price of the underlying security decline.
The Fund may write put options. As the writer of a put option, the Fund receives the premium from the purchaser of the option and has the obligation, upon exercise of the option, to pay the exercise price and receive delivery of the underlying security. If the option expires without being exercised, the Fund is not required to receive the underlying security in exchange for the exercise price but retains the option premium.
The Fund may only write put options that are "covered." A put option on a security is covered if (a) the Fund segregates or earmarks cash or liquid assets equal to the exercise price; or (b) the Fund has purchased a put on the same security as the put written, the exercise price of which is (i) equal to or greater than the exercise price of the put written, or (ii) less than the exercise price of the put written, provided the difference is maintained by the Fund in segregated or earmarked cash or liquid assets.
Selling put options involves the risk that the Fund may be required to buy the underlying security at a disadvantageous price, above the market price of such security, at the time the option is exercised. While the Fund's potential gain in writing a covered put option is limited to the premium received plus the interest earned on the liquid assets covering the put option, the Fund's risks of loss is equal to the entire value of the underlying security, offset only by the amount of the premium received.
The Fund may close out an options position which it has written through a closing purchase transaction. The Fund would execute a closing purchase transaction with respect to a call option written by purchasing a call option on the same underlying security and having the same exercise price and expiration date as the call option written by the Fund. The Fund would execute a closing purchase transaction with respect to a put option written by purchasing a put option on the same underlying security and having the same exercise price and expiration date as the put option written by the Fund. A closing purchase transaction may or may not result in a profit to a Fund. The Fund could close out its position as an option writer only if a liquid market exists for options on the same underlying security and having the same exercise date as the option written by the Fund. There is no assurance that such a market will exist with respect to any particular option.
The writer of an option generally has no control over the time when the option is exercised, and the option writer is required to deliver or acquire the underlying security. Once an option writer has received an exercise notice, it cannot effect a closing purchase transaction in order to terminate its obligation under the option. Thus, the use of options may require the Fund to buy or sell portfolio securities at inopportune times or for prices other than the current market values of such securities, may limit the amount of appreciation the Fund can realize on an investment, or may cause the Fund to hold a security that it might otherwise sell.
Purchasing Options. The Fund may purchase call and put options. As the buyer of a call option, the Fund pays the premium to the option writer and has the right to purchase the underlying security from the option writer at the exercise price. If the market price of the underlying security rises above the exercise price, the Fund could exercise the option and acquire the underlying security at a below-market price, which could result in a gain to the Fund, minus the premium paid. As the buyer of a put option, the Fund pays the premium to the option writer and has the right to sell the underlying security to the option writer at the exercise price. If the market price of the underlying security declines below the exercise price, the Fund could exercise the option and sell the underlying security at an above-market price, which could result in a gain to the Fund, minus the premium paid. The Fund may buy call and put options whether or not it holds the underlying securities.
As a buyer of a call or put option, the Fund may sell put or call options that it has purchased at any time prior to such option's expiration date through a closing sale transaction. The principal factors affecting the market value of a put or a call option include supply and demand, interest rates, the current market price of the underlying security in relation to the exercise price of the option, the volatility of the underlying security, the underlying security's dividend policy, and the time remaining until the expiration date. A closing
7
sale transaction may or may not result in a profit to the Fund. The Fund's ability to initiate a closing sale transaction is dependent upon the liquidity of the options market and there is no assurance that such a market will exist with respect to any particular option. If the Fund does not exercise or sell an option prior to its expiration date, the option expires and becomes worthless.
OTC Options. Unlike exchange-traded options, which are standardized with respect to the underlying instrument, expiration date, contract size and strike price, the terms of OTC options generally are established through negotiation between the parties to the options contract. This type of arrangement allows the purchaser and writer greater flexibility to tailor the option to their needs. OTC options are available for a greater variety of securities or baskets of securities, and in a wider range of expiration dates and exercise prices than exchange-traded options. However, unlike exchange-traded options, which are issued and guaranteed by a regulated intermediary, such as the OCC, OTC options are entered into directly with the counterparty. Unless the counterparties provide for it, there is no central clearing or guaranty function for an OTC option. Therefore, OTC options are subject to the risk of default or non-performance by the counterparty. Accordingly, the Adviser must assess the creditworthiness of the counterparty to determine the likelihood that the terms of the option will be satisfied. There can be no assurance that a continuous liquid secondary market will exist for any particular OTC option at any specific time. As a result, the Fund may be unable to enter into closing sale transactions with respect to OTC options.
Index Options. Call and put options on indices operate similarly to options on securities. Rather than the right to buy or sell a single security at a specified price, options on an index give the holder the right to receive, upon exercise of the option, an amount of cash determined by reference to the value of the underlying index. The underlying index may be a broad-based index or a narrower market index. Unlike options on securities, all settlements are in cash. The settlement amount, which the writer of a index option must pay to the holder of the option upon exercise, is generally equal to the difference between the fixed exercise price of the option and the value of the underlying index, multiplied by a specified multiplier. The multiplier determines the size of the investment position the option represents. Gain or loss to the Fund on index options transactions will depend on price movements in the underlying securities market generally or in a particular segment of the market rather than price movements of individual securities. As with other options, the Fund may close out its position in index options through closing purchase transactions and closing sale transactions provided that a liquid secondary market exists for such options.
Index options written by the Fund will generally be covered in a manner similar to the covering of other types of options, by holding an offsetting financial position and/or segregating or earmarking cash or liquid assets. The Fund may cover call options written on an index by owning securities whose price changes, in the opinion of the Adviser, are expected to correlate to those of the underlying index.
Foreign Currency Options. Options on foreign currencies operate similarly to options on securities. Rather than the right to buy or sell a single security at a specified price, options on foreign currencies give the holder the right to buy or sell foreign currency for a fixed amount in U.S. dollars or other base currencies. Options on foreign currencies are traded primarily in the OTC market, but may also be traded on U.S. and foreign exchanges. The value of a foreign currency option is dependent upon the value of the underlying foreign currency relative to the U.S. dollar or other base currency. The price of the option may vary with changes in, among other things, the value of either or both currencies and has no relationship to the investment merits of a foreign security. Options on foreign currencies are affected by all of those factors which influence foreign exchange rates and foreign investment generally. As with other options, the Fund may close out its position in foreign currency options through closing purchase transactions and closing sale transactions provided that a liquid market exists for such options.
Foreign currency options written by the Fund will generally be covered in a manner similar to the covering of other types of options, by holding an offsetting financial position and/or segregating or earmarking cash or liquid assets.
Additional Risks of Options Transactions. The risks associated with options transactions are different from, and possibly greater than, the risks associated with investing directly in the underlying instruments. Options are highly specialized instruments that require investment techniques and risk analyses
8
different from those associated with other portfolio investments. The use of options requires an understanding not only of the underlying instrument but also of the option itself. Options may be subject to the risk factors generally applicable to derivatives transactions described herein, and may also be subject to certain additional risk factors, including:
• The exercise of options written or purchased by the Fund could cause the Fund to sell portfolio securities, thus increasing the Fund's portfolio turnover.
• The Fund pays brokerage commissions each time it writes or purchases an option or buys or sells an underlying security in connection with the exercise of an option. Such brokerage commissions could be higher relative to the commissions for direct purchases of sales of the underlying securities.
• The Fund's options transactions may be limited by limitations on options positions established by the SEC, CFTC or the exchanges on which such options are traded.
• The hours of trading for exchange-listed options may not coincide with the hours during which the underlying securities are traded. To the extent that the options markets close before the markets for the underlying securities, significant price and rate movements can take place in the underlying securities that cannot be reflected in the options markets.
• Index options based upon a narrower index of securities may present greater risks than options based on broad market indexes, as narrower indexes are more susceptible to rapid and extreme fluctuations as a result of changes in the values of a smaller number of securities.
• The Fund is subject to the risk of market movements between the time that an option is exercised and the time of performance thereunder, which could increase the extent of any losses suffered by the Fund in connection with options transactions.
Futures Contracts
A futures contract is a standardized agreement to buy or sell a specific quantity of a commodity at a specific price at a specific future time (the "settlement date"). Futures contracts may be based on, among other things, a specified equity security (securities futures), a specified debt security or reference rate (interest rate futures), the value of a specified securities index (index futures) or the value of a foreign currency (forward contracts and currency futures). The value of a futures contract tends to increase and decrease in tandem with the value of the underlying instrument. The buyer of a futures contract agrees to purchase the underlying instrument on the settlement date and is said to be "long" the contract. The seller of a futures contract agrees to sell the underlying instrument on the settlement date and is said to be "short" the contract. Futures contracts call for settlement only on the expiration date and cannot be "exercised" at any other time during their term.
Depending on the terms of the particular contract, futures contracts are settled through either physical delivery of the underlying instrument on the settlement date (such as in the case of securities futures based on a specified debt security) or by payment of a cash settlement amount on the settlement date (such as in the case of futures contracts relating to interest rates, foreign currencies and broad-based securities indexes). In the case of cash settled futures contracts, the settlement amount is equal to the difference between the reference instrument's price on the last trading day of the contract and the reference instrument's price at the time the contract was entered into. Most futures contracts, particularly futures contracts requiring physical delivery, are not held until the settlement date, but instead are offset before the settlement date through the establishment of an opposite and equal futures position (buying a contract that had been sold, or selling a contract that had been purchased). All futures transactions are effected through a clearinghouse associated with the exchange on which the futures are traded.
The buyer and seller of a futures contract are not required to deliver or pay for the underlying commodity unless the contract is held until the settlement date. However, both the buyer and seller are required to deposit "initial margin" with a futures commodities merchant when the futures contract is entered into. Initial margin deposits are typically calculated as a percentage of the contract's market value. If the value of either party's position declines, the party will be required to make additional "variation margin"
9
payments to settle the change in value on a daily basis. The process is known as "marking-to-market." Upon the closing of a futures position through the establishment of an offsetting position, a final determination of variation margin will be made and additional cash will be paid by or released to the Fund.
In addition, the Fund may be required to maintain segregated cash or liquid assets in order to cover futures transactions. The Fund will segregate or earmark cash or liquid assets in an amount equal to the difference between the market value of a futures contract entered into by the Fund and the aggregate value of the initial and variation margin payments made by the Fund with respect to such contract or as otherwise permitted by SEC rules or SEC staff positions. See "Regulatory Matters" below.
Currency Forward Contracts and Currency Futures. A forward foreign currency contract is a negotiated agreement between two parties to exchange specified amounts of two or more currencies at a specified future time at a specified rate. The rate specified by the forward contract can be higher or lower than the spot rate between the currencies that are the subject of the contract. Currency futures are similar to currency forward contracts, except that they are traded on an exchange and standardized as to contract size and delivery date. Most currency futures call for payment or delivery in U.S. dollars. Unanticipated changes in currency prices may result in losses to the Fund and poorer overall performance for the Fund than if it had not entered into currency forward or futures contracts. The Fund may enter into forward or futures contracts under various circumstances. The typical use of a forward or futures contract is to "lock in" the price of a security in U.S. dollars or some other foreign currency, which the Fund is holding in its portfolio. By entering into a forward or futures contract for the purchase or sale, for a fixed amount of dollars or other currency, of the amount of foreign currency involved in the underlying security transactions, the Fund may be able to protect itself against a possible loss resulting from an adverse change in the relationship between the U.S. dollar or other currency which is being used for the security purchase and the foreign currency in which the security is denominated during the period between the date on which the security is purchased or sold and the date on which payment is made or received. The Adviser also may from time to time utilize forward or futures contracts for other purposes. For example, they may be used to hedge a foreign security held in the portfolio or a security which pays out principal tied to an exchange rate between the U.S. dollar and a foreign currency, against a decline in value of the applicable foreign currency. They also may be used to lock in the current exchange rate of the currency in which those securities anticipated to be purchased are denominated. At times, the Fund may enter into "cross-currency" hedging transactions involving currencies other than those in which securities are held or proposed to be purchased are denominated.
The Fund will not enter into forward or futures contracts or maintain a net exposure to these contracts where the consummation of the contracts would obligate the Fund to deliver an amount of foreign currency in excess of the value of the Fund's portfolio securities.
When required by law, the Fund will segregate or earmark cash, U.S. government securities or other appropriate liquid portfolio securities in an amount equal to the value of the Fund's total assets committed to the consummation of forward or futures contracts entered into under the circumstances set forth above. If the value of the securities so earmarked declines, additional cash or securities will be segregated or earmarked on a daily basis so that the value of such securities will equal the amount of the Fund's commitments with respect to such contracts.
The Fund may be limited in its ability to enter into hedging transactions involving forward or futures contracts by the Internal Revenue Code of 1986, as amended (the "Code"), requirements relating to qualification as a regulated investment company.
Forward and futures contracts may limit gains on portfolio securities that could otherwise be realized had they not been utilized and could result in losses. The contracts also may increase the Fund's volatility and may involve a significant amount of risk relative to the investment of cash.
Options on Futures Contracts. Options on futures contracts are similar to options on securities except that options on futures contracts give the purchasers the right, in return for the premium paid, to assume a position in a futures contract (a long position in the case of a call option and a short position in the case of a put option) at a specified exercise price at any time prior to the expiration of the option. Upon exercise of the option, the parties will be subject to all of the risks associated with futures transactions and subject to margin requirements. As the writer of options on futures contracts, the Fund would also be subject to initial and variation margin requirements on the option position.
10
Options on futures contracts written by the Fund will generally be covered in a manner similar to the covering of other types of options, by holding an offsetting financial position and/or segregating or earmarking cash or liquid assets. The Fund may cover an option on a futures contract by purchasing or selling the underlying futures contract. In such instances the exercise of the option will serve to close out the Fund's futures position.
Additional Risk of Futures Transactions. The risks associated with futures contract transactions are different from, and possibly greater than, the risks associated with investing directly in the underlying instruments. Futures are highly specialized instruments that require investment techniques and risk analyses different from those associated with other portfolio investments. The use of futures requires an understanding not only of the underlying instrument but also of the futures contract itself. Futures may be subject to the risk factors generally applicable to derivatives transactions described herein, and may also be subject to certain additional risk factors, including:
• The risk of loss in buying and selling futures contracts can be substantial. Small price movements in the commodity underlying a futures position may result in immediate and substantial loss (or gain) to the Fund.
• Buying and selling futures contracts may result in losses in excess of the amount invested in the position in the form of initial margin. In the event of adverse price movements in the underlying commodity, security, index, currency or instrument, the Fund would be required to make daily cash payments to maintain its required margin. The Fund may be required to sell portfolio securities, or make or take delivery of the underlying securities in order to meet daily margin requirements at a time when it may be disadvantageous to do so. The Fund could lose margin payments deposited with a futures commission merchant if the futures commission merchant breaches its agreement with the Fund, becomes insolvent or declares bankruptcy.
• Most exchanges limit the amount of fluctuation permitted in futures contract prices during any single trading day. Once the daily limit has been reached in a particular futures contract, no trades may be made on that day at prices beyond that limit. If futures contract prices were to move to the daily limit for several trading days with little or no trading, the Fund could be prevented from prompt liquidation of a futures position and subject to substantial losses. The daily limit governs only price movements during a single trading day and therefore does not limit the Fund's potential losses.
• Index futures based upon a narrower index of securities may present greater risks than futures based on broad market indexes, as narrower indexes are more susceptible to rapid and extreme fluctuations as a result of changes in value of a small number of securities.
Swap Contracts and Related Derivative Instruments
A swap contract is an agreement between two parties pursuant to which the parties exchange payments at specified dates on the basis of a specified notional amount, with the payments calculated by reference to specified securities, indexes, reference rates, currencies or other instruments. Most swap agreements provide that when the period payment dates for both parties are the same, the payments are made on a net basis (i.e., the two payment streams are netted out, with only the net amount paid by one party to the other). The Fund's obligations or rights under a swap contract entered into on a net basis will generally be equal only to the net amount to be paid or received under the agreement, based on the relative values of the positions held by each counterparty. With limited exceptions swap agreements are not generally entered into or traded on exchanges. For most swaps, is no central clearing or guaranty function. Therefore, swaps are generally subject to the risk of default or non-performance by the counterparty. Accordingly, the Adviser must assess the creditworthiness of the counterparty to determine the likelihood that the terms of the swap will be satisfied.
Swap agreements allow for a wide variety of transactions. For example, fixed rate payments may be exchanged for floating rate payments, U.S. dollar denominated payments may be exchanged for payments denominated in foreign currencies, and payments tied to the price of one security, index, reference rate, currency or other instrument may be exchanged for payments tied to the price of a different security, index, reference rate, currency or other instrument. Swap contracts are typically individually negotiated and structured to provide exposure to a variety of particular types of investments or market factors. Swap contracts can take many different forms and are known by a variety of names. To the extent consistent with a Fund's
11
investment objectives and policies, the Fund is not limited to any particular form or variety of swap contract. The Fund may utilize swaps to increase or decrease its exposure to the underlying instrument, reference rate, foreign currency, market index or other asset. The Fund may also enter into related derivative instruments including caps, floors and collars.
The Fund may be required to cover swap transactions. Obligations under swap agreements entered into on a net basis are generally accrued daily and any accrued but unpaid amounts owed by the Fund to the swap counterparty will be covered by segregating or earmarking cash or liquid assets. If the Fund enters into a swap agreement on other than a net basis, the Fund will segregate or earmark cash or liquid assets with a value equal to the full amount of the Fund's accrued obligations under the agreement.
Index Swaps. An index swap consists of an agreement between two parties in which a party exchanges a cash flow based on a notional amount of a reference index for a cash flow based on a different index or on another specified instrument or reference rate. Index swaps are generally entered into on a net basis.
Inflation Swaps. Inflation swap agreements are contracts in which one party agrees to pay the cumulative percentage increase in a price index, such as the Consumer Price Index, over the term of the swap (with some lag on the referenced inflation index), and the other party pays a compounded fixed rate. Inflation swap agreements may be used to protect the net asset value of the Fund against an unexpected change in the rate of inflation measured by an inflation index. The value of inflation swap agreements is expected to change in response to changes in real interest rates. Real interest rates are tied to the relationship between nominal interest rates and the rate of inflation.
Currency Swaps. A currency swap consists of an agreement between two parties to exchange cash flows on a notional amount of two or more currencies based on the relative value differential among them, such as exchanging a right to receive a payment in a foreign currency for the right to receive U.S. dollars. Currency swap agreements may be entered into on a net basis or may involve the delivery of the entire principal value of one designated currency in exchange for the entire principal value of another designated currency. In such cases, the entire principal value of a currency swap is subject to the risk that the counterparty will default on its contractual delivery obligations.
Swaptions. An option on a swap agreement, also called a "swaption," is an option that gives the buyer the right, but not the obligation, to enter into a swap on a future date in exchange for paying a market based "premium." A receiver swaption gives the owner the right to receive the total return of a specified asset, reference rate, or index. A payer swaption gives the owner the right to pay the total return of a specified asset, reference rate, or index. Swaptions also include options that allow an existing swap to be terminated or extended by one of the counterparties.
General Risks of Swaps. The risks associated with swap transactions are different from, and possibly greater than, the risks associated with investing directly in the underlying instruments. Swaps are highly specialized instruments that require investment techniques and risk analyses different from those associated with other portfolio investments. The use of swaps requires an understanding not only of the underlying instrument but also of the swap contract itself. Swap transactions may be subject to the risk factors generally applicable to derivatives transactions described above, and may also be subject to certain additional risk factors, including:
• Many swap agreements are not traded on exchanges and not subject to a similar level of government regulation like exchange traded derivatives. As a result, parties to a swap agreement are not protected by such government regulations to the same extent participants in transactions in derivatives traded on organized exchanges.
• In addition to the risk of default by the counterparty, if the creditworthiness of a counterparty to a swap agreement declines, the value of the swap agreement would be likely to decline, potentially resulting in losses.
• The swaps market is a relatively new market and currently is largely unregulated. It is possible that further developments in the swaps market, including future governmental regulation, could adversely affect the Fund's ability to utilize swaps, terminate existing swap agreements or realize amounts to be received under such agreements.
12
Structured Investments
The Fund also may invest a portion of its assets in structured investments. A structured investment is a derivative security designed to offer a return linked to a particular underlying security, currency, commodity or market, for which the amount of principal repayment and/or interest payments is based on the change in value of such underlying security, currency, commodity or market, including, among others, currency exchange rates, interest rates (such as the prime lending rate or LIBOR), referenced bonds and stock indices or other financial reference. Structured investments may come in various forms, including notes, warrants and options to purchase securities and may be listed and traded on an exchange or otherwise traded in the OTC Market.
The Fund will typically use structured investments to gain exposure to a permitted underlying security, currency or market when direct access to such security, currency, commodity or market is limited or inefficient from a tax, cost or regulatory standpoint. Investments in structured investments involve risks including counterparty risk and market risk. Holders of structured investments bear risks of the underlying investment and are subject to counterparty risk because the Fund is relying on the creditworthiness of such counterparty and has no rights with respect to the issuer of the underlying investment. Certain structured investments may be thinly traded or have a limited trading market and may have the effect of increasing the Fund's illiquidity to the extent that the Fund, at a particular point in time, may be unable to find qualified buyers for these investments.
A structured investment may be linked either positively or negatively to its underlying security, currency, commodity or market and a change in interest rate, principal amount or other factor, depending on the structured investment's design, may be a multiple of the factor's movement. Application of a multiplier is comparable to the use of financial leverage, a speculative technique. Leverage magnifies the potential for gain and the risk of loss. As a result, a relatively small decline in the value of the referenced factor could result in a relatively large loss in the value of a structured investment.
Other types of structured investments include interests in entities organized and operated for the purpose of restructuring the investment characteristics of underlying investment interests or securities. This type of securitization or restructuring usually involves the deposit or purchase of an underlying security by a U.S. or foreign entity, such as a corporation or trust of specified instruments, and the issuance by that entity of one or more classes of securities backed by, or representing an interest in, the underlying instruments. The cash flow or rate of return on the underlying investments may be apportioned among the newly issued securities to create different investment characteristics, such as varying maturities, credit quality, payment priorities and interest rate provisions. Structured investments which are subordinated, for example, in payment priority often offer higher returns, but may result in increased risks compared to other investments.
Combined Transactions
Combined transactions involve entering into multiple derivatives transactions (such as multiple options transactions, including purchasing and writing options in combination with each other; multiple futures transactions; and combinations of options, futures, forward and swap transactions) instead of a single derivatives transaction in order to customize the risk and return characteristics of the overall position. Combined transactions typically contain elements of risk that are present in each of the component transactions. The Fund may enter into a combined transaction instead of a single derivatives transaction when, in the opinion of the Adviser, it is in the best interest of the Fund to do so. Because combined transactions involve multiple transactions, they may result in higher transaction costs and may be more difficult to close out.
Regulatory Matters
As described herein, the Fund may be required to cover its potential economic exposure to certain derivatives transactions by holding an offsetting financial position and/or segregating or earmarking cash or liquid assets equal in value to the Fund's potential economic exposure under the transaction. The Fund will cover such transactions as described herein or in such other manner in accordance with applicable laws and regulations. Assets used to cover derivatives transactions cannot be sold while the derivatives position is open, unless they are replaced by other appropriate assets. Segregated or earmarked cash or liquid assets and assets held in margin accounts are not otherwise available to the Fund for investment
13
purposes. If a large portion of the Fund's assets are used to cover derivatives transactions or are otherwise segregated or earmarked, it could affect portfolio management or the Fund's ability to meet redemption requests or other current obligations. With respect to derivatives which are cash settled (i.e., have no physical delivery requirement), the Fund is permitted to set aside liquid assets in an amount equal to the Fund's daily marked-to-market net obligations ( i.e., the Fund's daily net liability) under the derivative, if any, rather than the derivative's full notional value or the market value of the instrument underlying the derivative, as applicable. By setting aside assets equal to only its net obligations under cash-settled derivatives, the Fund will have the ability to employ leverage to a greater extent than if the Fund were required to earmark or segregate assets equal to the full notional amount of the derivative or the market value of the underlying instrument, as applicable.
Regulatory developments affecting the exchange-traded and OTC derivatives markets may impair the Fund's ability to manage or hedge its investment portfolio through the use of derivatives. The Dodd-Frank Wall Street Reform and Consumer Protection Act (the "Dodd-Frank Act") and the rules promulgated thereunder may limit the ability of the Fund to enter into one or more exchange-traded or OTC derivatives transactions. In particular, pursuant to authority granted under the Dodd-Frank Act, the CFTC in October 2011 promulgated final rules that impose new federal position limits on listed futures and options contracts on, and economically equivalent OTC derivatives referencing, 28 individual agricultural, metal and energy commodities. The Fund's futures and options positions in these 28 contracts will be aggregated with its positions, if any, in economically equivalent OTC derivatives referencing these contracts. These new position limits, which will be imposed on the Fund and its counterparties, may impact the Fund's ability to invest in futures, options and swaps in a manner that efficiently meets its investment objective. Derivatives positions of all investment companies advised by the Adviser are combined for purposes of these limits. An exchange may order the liquidation of positions found to be in excess of these limits and may impose certain other sanctions or restrictions.
The Fund's use of derivatives may be limited by the requirements of the Code, for qualification as a regulated investment company for U.S. federal income tax purposes.
The CFTC eliminated limitations on futures trading by certain regulated entities, including registered investment companies, and consequently registered investment companies may engage in unlimited futures transactions and options thereon provided that the investment adviser to the company claims an exclusion from regulation as a commodity pool operator. In connection with its management of the Fund, the Adviser has claimed such an exclusion from registration as a commodity pool operator under the Commodity Exchange Act ("CEA"). Therefore, it is not subject to the registration and regulatory requirements of the CEA. Therefore, there are no limitations on the extent to which the Fund may engage in non-hedging transactions involving futures and options thereon except as set forth in the Fund's Prospectus or SAI. There is no overall limitation on the percentage of the Fund's net assets which may be subject to a hedge position.
Contracts for Difference ("CFDs"). The Fund may purchase CFDs. A CFD is a privately negotiated contract between two parties, buyer and seller, stipulating that the seller will pay to or receive from the buyer the difference between the nominal value of the underlying instrument at the opening of the contract and that instrument's value at the end of the contract. The underlying instrument may be a single security, stock basket or index. A CFD can be set up to take either a short or long position on the underlying instrument. The buyer and seller are both required to post margin, which is adjusted daily. The buyer will also pay to the seller a financing rate on the notional amount of the capital employed by the seller less the margin deposit. A CFD is usually terminated at the buyer's initiative. The seller of the CFD will simply match the exposure of the underlying instrument in the open market and the parties will exchange whatever payment is due.
As is the case with owning any financial instrument, there is the risk of loss associated with buying a CFD. For example, if the Fund buys a long CFD and the underlying security is worth less at the end of the contract, the Fund would be required to make a payment to the seller and would suffer a loss. Also, there may be liquidity risk if the underlying instrument is illiquid because the liquidity of a CFD is based on the liquidity of the underlying instrument. A further risk is that adverse movements in the underlying security will require the buyer to post additional margin. CFDs also carry counterparty risk, i.e., the risk that the counterparty to the CFD transaction may be unable or unwilling to make payments or to otherwise honor
14
its financial obligations under the terms of the contract. If the counterparty were to do so, the value of the contract, and of the Fund's shares, may be reduced.
To the extent that there is an imperfect correlation between the return on the Fund's obligation to its counterparty under the CFDs and the return on related assets in its portfolio, the CFD transaction may increase the Fund's financial risk. The Fund will not enter into a CFD transaction that is inconsistent with its investment objective, policies and strategies.
Money Market Securities. The Fund may invest in various money market securities for cash management purposes or when assuming a temporary defensive position, which among others may include commercial paper, bankers' acceptances, bank obligations, corporate debt securities, certificates of deposit, U.S. government securities, obligations of savings institutions and repurchase agreements. Such securities are limited to:
U.S. Government Securities. Obligations issued or guaranteed as to principal and interest by the United States or its agencies (such as the Export-Import Bank of the United States, Federal Housing Administration and Government National Mortgage Association), or instrumentalities (such as the Federal Home Loan Bank), including Treasury bills, notes and bonds;
Bank Obligations. Obligations (including certificates of deposit, time deposits and bankers' acceptances) of banks subject to regulation by the U.S. Government and having total assets of $1 billion or more, and instruments secured by such obligations, not including obligations of foreign branches of domestic banks except to the extent below;
Eurodollar Certificates of Deposit. Eurodollar certificates of deposit issued by foreign branches of domestic banks having total assets of $1 billion or more;
Obligations of Savings Institutions. Certificates of deposit of savings banks and savings and loan associations, having total assets of $1 billion or more;
Fully Insured Certificates of Deposit. Certificates of deposit of banks and savings institutions, having total assets of less than $1 billion, if the principal amount of the obligation is federally insured by the Bank Insurance Fund or the Savings Association Insurance Fund (each of which is administered by the FDIC), limited to $250,000 principal amount per certificate (a temporary increase from $100,000, which is due to expire on December 31, 2013) and to 10% or less of the Fund's total assets in all such obligations and in all illiquid assets, in the aggregate;
Commercial Paper. Commercial paper rated within the two highest grades by Standard & Poor's Rating Group, a division of The McGraw-Hill Companies, Inc. ("S&P"), or by Moody's Investors Service, Inc. ("Moody's") or, if not rated, issued by a company having an outstanding debt issue rated at least AA by S&P or Aa by Moody's; and
Repurchase Agreements. The Fund may invest in repurchase agreements. When cash may be available for only a few days, it may be invested by the Fund in repurchase agreements until such time as it may otherwise be invested or used for payments of obligations of the Fund. These agreements typically involve the acquisition by the Fund of debt securities from a selling financial institution such as a bank, savings and loan association or broker-dealer. The agreement provides that the Fund will sell back to the institution, and that the institution will repurchase, the underlying securities serving as collateral at a specified price and at a fixed time in the future, usually not more than seven days from the date of purchase. The collateral will be marked-to-market daily to determine that the value of the collateral, as specified in the agreement, does not decrease below the purchase price plus accrued interest. If such decrease occurs, additional collateral will be requested and, when received, added to the account to maintain full collateralization. The Fund will accrue interest from the institution until the time when the repurchase is to occur. Although this date is deemed by the Fund to be the maturity date of a repurchase agreement, the maturities of securities subject to repurchase agreements are not subject to any limits.
While repurchase agreements involve certain risks not associated with direct investments in debt securities, the Fund follows procedures approved by the Trustees that are designed to minimize such risks. These procedures include effecting repurchase transactions only with large, well-capitalized and well-established financial institutions whose financial condition will be continually monitored by the Adviser. In addition, as described above, the value of the collateral underlying the repurchase agreement will be at least equal to the repurchase price, including any accrued interest earned on the repurchase agreement.
15
In the event of a default or bankruptcy by a selling financial institution, the Fund will seek to liquidate such collateral. However, the exercising of the Fund's right to liquidate such collateral could involve certain costs or delays and, to the extent that proceeds from any sale upon a default of the obligation to repurchase were less than the repurchase price, the Fund could suffer a loss. It is current policy of the Fund not to invest in repurchase agreements that do not mature within seven days if any such investment, together with any other illiquid assets held by the Fund, amounts to more than 15% of its net assets.
Loans of Portfolio Securities. The Fund may lend its portfolio securities to brokers, dealers, banks and other institutional investors. By lending its portfolio securities, the Fund attempts to increase its net investment income through the receipt of interest on the cash collateral with respect to the loan or fees received from the borrower in connection with the loan. Any gain or loss in the market price of the securities loaned that might occur during the term of the loan would be for the account of the Fund. The Fund employs an agent to implement the securities lending program and the agent receives a fee from the Fund for its services. The Fund will not lend more than 331/3% of the value of its total assets.
The Fund may lend its portfolio securities so long as the terms, structure and the aggregate amount of such loans are not inconsistent with the Investment Company Act or the rules and regulations or interpretations of the SEC thereunder, which currently require that (i) the borrower pledge and maintain with the Fund collateral consisting of liquid, unencumbered assets having a value at all times not less than 100% of the value of the securities loaned; (ii) the borrower add to such collateral whenever the price of the securities loaned rises (i.e., the borrower "marks to market" on a daily basis); (iii) the loan be made subject to termination by the Fund at any time; and (iv) the Fund receives a reasonable return on the loan (which may include the Fund investing any cash collateral in interest bearing short-term investments), any distributions on the loaned securities and any increase in their market value. In addition, voting rights may pass with the loaned securities, but the Fund will retain the right to call any security in anticipation of a vote that the Adviser deems material to the security on loan.
There may be risks of delay and costs involved in recovery of securities or even loss of rights in the collateral should the borrower of the securities fail financially. These delays and costs could be greater for foreign securities. However, loans will be made only to borrowers deemed by the Adviser to be creditworthy and when, in the judgment of the Adviser, the income which can be earned from such securities loans justifies the attendant risk. All relevant facts and circumstances, including the creditworthiness of the broker, dealer, bank or institution, will be considered in making decisions with respect to the lending of securities, subject to review by the Fund's Board of Trustees. The Fund also bears the risk that the reinvestment of collateral will result in a principal loss. Finally, there is the risk that the price of the securities will increase while they are on loan and the collateral will not be adequate to cover their value.
When-Issued and Delayed Delivery Securities and Forward Commitments. From time to time, the Fund may purchase securities on a when-issued or delayed delivery basis or may purchase or sell securities on a forward commitment basis. When these transactions are negotiated, the price is fixed at the time of the commitment, but delivery and payment can take place a month or more after the date of commitment. While the Fund will only purchase securities on a when-issued, delayed delivery or forward commitment basis with the intention of acquiring the securities, the Fund may sell the securities before the settlement date, if it is deemed advisable. The securities so purchased or sold are subject to market fluctuation and no interest or dividends accrue to the purchaser prior to the settlement date.
At the time the Fund makes the commitment to purchase or sell securities on a when-issued, delayed delivery or forward commitment basis, it will record the transaction and thereafter reflect the value, each day, of such security purchased, or if a sale, the proceeds to be received, in determining its net asset value. At the time of delivery of the securities, their value may be more or less than the purchase or sale price. An increase in the percentage of the Fund's assets committed to the purchase of securities on a when-issued, delayed delivery or forward commitment basis may increase the volatility of its net asset value. The Fund will also earmark cash or liquid assets or establish a segregated account on the Fund's books in which it will continually maintain cash or cash equivalents or other liquid portfolio securities equal in value to commitments to purchase securities on a when-issued, delayed delivery or forward commitment basis.
When, As and If Issued Securities. The Fund may purchase securities on a "when, as and if issued" basis, under which the issuance of the security depends upon the occurrence of a subsequent
16
event, such as approval of a merger, corporate reorganization or debt restructuring. The commitment for the purchase of any such security will not be recognized in the portfolio of the Fund until the Adviser determines that issuance of the security is probable. At that time, the Fund will record the transaction and, in determining its net asset value, will reflect the value of the security daily. At that time, the Fund will also earmark cash or liquid assets or establish a segregated account on the Fund's books in which it will maintain cash, cash equivalents or other liquid portfolio securities equal in value to recognized commitments for such securities.
An increase in the percentage of the Fund's assets committed to the purchase of securities on a "when, as and if issued" basis may increase the volatility of its net asset value. The Fund may also sell securities on a "when, as and if issued" basis provided that the issuance of the security will result automatically from the exchange or conversion of a security owned by the Fund at the time of sale.
Private Placements and Restricted Securities. The Fund may invest up to 15% of its net assets in securities which are subject to restrictions on resale because they have not been registered under the Securities Act of 1933, as amended (the "Securities Act"), or which are otherwise not readily marketable. (Securities eligible for resale pursuant to Rule 144A under the Securities Act, and determined to be liquid pursuant to the procedures discussed in the following paragraph, are not subject to the foregoing restriction.) These securities are generally referred to as private placements or restricted securities. Such securities may involve a higher degree of business and financial risk that can result in substantial losses. As a result of the absence of a public trading market for these securities, they may be less liquid than publicly traded securities. To the extent these securities may be resold in privately negotiated transactions, the prices realized from these sales could be less than those originally paid by the Fund or less than what may be considered the fair value of such securities. Furthermore, companies whose securities are not publicly traded may not be subject to the disclosure and other investor protection requirements which might be applicable if their securities were publicly traded. The illiquidity of the market, as well as the lack of publicly available information regarding these securities, may also adversely affect the ability of the Fund's Trustees to arrive at a fair value for certain securities at certain times and could make it difficult for the Fund to sell certain securities. If such securities are required to be registered under the securities laws of one or more jurisdictions before being sold, the Fund may be required to bear the expenses of registration.
Rule 144A permits the Fund to sell restricted securities to qualified institutional buyers without limitation. The Adviser, pursuant to procedures adopted by the Trustees, will make a determination as to the liquidity of each restricted security purchased by the Fund. If a restricted security is determined to be "liquid," the security will not be included within the category "illiquid securities," which may not exceed 15% of the Fund's net assets. However, investing in Rule 144A securities could have the effect of increasing the level of Fund illiquidity to the extent the Fund, at a particular point in time, may be unable to find qualified institutional buyers interested in purchasing such securities.
Private Investments in Public Equity. The Fund may purchase equity securities in a private placement that are issued by issuers who have outstanding, publicly-traded equity securities of the same class ("private investments in public equity" or "PIPES"). Shares in PIPES generally are not registered with the SEC until after a certain time period from the date the private sale is completed. This restricted period can last many months. Until the public registration process is completed, PIPES are restricted as to resale and the Fund cannot freely trade the securities. Generally, such restrictions cause the PIPES to be illiquid during this time. PIPES may contain provisions that the issuer will pay specified financial penalties to the holder if the issuer does not publicly register the restricted equity securities within a specified period of time, but there is no assurance that the restricted equity securities will be publicly registered, or that the registration will remain in effect.
Limited Partnerships. A limited partnership interest entitles the Fund to participate in the investment return of the partnership's assets as defined by the agreement among the partners. As a limited partner, the Fund generally is not permitted to participate in the management of the partnership. However, unlike a general partner whose liability is not limited, a limited partner's liability generally is limited to the amount of its commitment to the partnership.
Convertible Securities. The Fund may invest in securities which are convertible into common stock or other securities of the same or a different issuer or into cash within a particular period of time at a specified price or formula. Convertible securities are generally fixed-income securities (but may include
17
preferred stock) and generally rank senior to common stocks in a corporation's capital structure and, therefore, entail less risk than the corporation's common stock. The value of a convertible security is a function of its "investment value" (its value as if it did not have a conversion privilege), and its "conversion value" (the security's worth if it were to be exchanged for the underlying security, at market value, pursuant to its conversion privilege).
To the extent that a convertible security's investment value is greater than its conversion value, its price will be primarily a reflection of such investment value and its price will be likely to increase when interest rates fall and decrease when interest rates rise, as with a fixed-income security (the credit standing of the issuer and other factors may also have an effect on the convertible security's value). If the conversion value exceeds the investment value, the price of the convertible security will rise above its investment value and, in addition, will sell at some premium over its conversion value. (This premium represents the price investors are willing to pay for the privilege of purchasing a fixed-income security with a possibility of capital appreciation due to the conversion privilege.) At such times the price of the convertible security will tend to fluctuate directly with the price of the underlying equity security. Convertible securities may be purchased by the Fund at varying price levels above their investment values and/or their conversion values in keeping with the Fund's objective.
Up to 5% of the Fund's net assets may be invested in convertible securities that are below investment grade. Debt securities rated below investment grade are commonly known as "junk bonds." Although the Fund selects these securities primarily on the basis of their equity characteristics, investors should be aware that convertible securities rated in these categories are considered high risk securities; the rating agencies consider them speculative with respect to the issuer's continuing ability to make timely payments of interest and principal. Thus, to the extent that such convertible securities are acquired by the Fund, there is a greater risk as to the timely repayment of the principal of, and timely payment of interest or dividends on, such securities than in the case of higher-rated convertible securities.
Warrants. The Fund may acquire warrants. A warrant is, in effect, an option to purchase equity securities at a specific price, generally valid for a specific period of time, and has no voting rights, pays no dividends and has no rights with respect to the corporation issuing it.
Real Estate Investment Trusts ("REITs"). REITs pool investors' funds for investment primarily in real estate properties or real estate-related loans. REITs generally derive their income from rents on the underlying properties or interest on the underlying loans, and their value is impacted by changes in the value of the underlying property or changes in interest rates affecting the underlying loans owned by the REITs. REITs are more susceptible to risks associated with the ownership of real estate and the real estate industry in general. These risks can include fluctuations in the value of underlying properties; defaults by borrowers or tenants; market saturation; changes in general and local economic conditions; decreases in market rates for rents; increases in competition, property taxes, capital expenditures or operating expenses; and other economic, political or regulatory occurrences affecting the real estate industry. In addition, REITs depend upon specialized management skills, may not be diversified (which may increase the volatility of a REIT's value), may have less trading volume and may be subject to more abrupt or erratic price movements than the overall securities market. Operating REITs requires specialized managements skills and the Fund indirectly bears REIT management expenses along with the direct expenses of the Fund. REITs are not taxed on income distributed to shareholders provided they comply with several requirements of the Internal Revenue Code of 1986, as amended (the "Code"). REITs are subject to the risk of failing to qualify for tax-free pass-through of income under the Code.
Zero Coupon Securities. A portion of the fixed-income securities purchased by the Fund may be zero coupon securities. Such securities are purchased at a discount from their face amount, giving the purchaser the right to receive their full value at maturity. The interest earned on such securities is, implicitly, automatically compounded and paid out at maturity. While such compounding at a constant rate eliminates the risk of receiving lower yields upon reinvestment of interest if prevailing interest rates decline, the owner of a zero coupon security will be unable to participate in higher yields upon reinvestment of interest received on interest-paying securities if prevailing interest rates rise.
A zero coupon security pays no interest to its holder during its life. Therefore, to the extent the Fund invests in zero coupon securities, it will not receive current cash available for distribution to shareholders. In addition, zero coupon securities are subject to substantially greater market price fluctuations during
18
periods of changing prevailing interest rates than are comparable debt securities which make current distributions of interest. Current federal tax law requires that a holder (such as the Fund) of a zero coupon security accrue a portion of the discount at which the security was purchased as income each year even though the Fund receives no interest payments in cash on the security during the year.
Borrowing. The Fund may borrow money from a bank in an amount up to 25% of the Fund's total assets (including the amount borrowed) less its liabilities (not including any borrowings but including the fair market value at the time of computation of any other senior securities then outstanding). The Fund may borrow to seek to enhance capital appreciation by leveraging its investments through purchasing securities with borrowed funds. The Fund will maintain asset coverage with respect to any borrowings in accordance with the Investment Company Act. Leveraging Fund investments has speculative characteristics.
Borrowing by the Fund creates an opportunity for increased net income but, at the same time, creates special risks. For example, leveraging may exaggerate changes in and increase the volatility of the net asset value of Fund shares. This is because leverage tends to exaggerate the effect of any increase or decrease in the value of the Fund's portfolio securities. The use of leverage also may cause the Fund to liquidate portfolio positions when it may not be advantageous to do so to satisfy its obligations or to maintain asset coverage.
In general, the Fund may not issue any class of senior security, except that the Fund may (i) borrow from banks, provided that immediately following any such borrowing there is an asset coverage of at least 300% for all Fund borrowings and in the event such asset coverage falls below 300% the Fund will within three days or such longer period as the SEC may prescribe by rules and regulations, reduce the amount of its borrowings to an extent that the asset coverage of such borrowings shall be at least 300%, and (ii) engage in trading practices which could be deemed to involve the issuance of a senior security, including but not limited to options, futures, forward contracts and reverse repurchase agreements, provided that the Fund earmarks or segregates liquid assets in accordance with applicable SEC regulations and interpretations.
Foreign Investment. Investing in foreign securities involves certain special considerations which are not typically associated with investments in the securities of U.S. issuers. Foreign issuers are not generally subject to uniform accounting, auditing and financial reporting standards and may have policies that are not comparable to those of domestic issuers. As a result, there may be less information available about foreign issuers than about domestic issuers. Securities of some foreign issuers may be less liquid and more volatile than securities of comparable domestic issuers. There is generally less government supervision and regulation of stock exchanges, brokers and listed issuers than in the United States. In addition, with respect to certain foreign countries, there is a possibility of expropriation or confiscatory taxation, political and social instability, or diplomatic development which could affect U.S. investments in those countries. The costs of investing in foreign countries frequently are higher than the costs of investing in the United States. Although the Adviser endeavors to achieve the most favorable execution costs in portfolio transactions, fixed commissions on many foreign stock exchanges are generally higher than negotiated commissions on U.S. exchanges.
Investments in securities of foreign issuers may be denominated in foreign currencies. Accordingly, the value of the Fund's assets, as measured in U.S. dollars may be affected favorably or unfavorably by changes in currency exchange rates and in exchange control regulations. The Fund may incur costs in connection with conversions between various currencies.
Certain foreign governments levy withholding or other taxes on dividend and interest income. Although in some countries a portion of these taxes are recoverable, the non-recovered portion of foreign withholding taxes will reduce the income received from investments in such countries.
The Adviser may consider an issuer to be from a particular country (including the United States) or geographic region if (i) its principal securities trading market is in that country or geographic region; (ii) alone or on a consolidated basis it derives 50% or more of its annual revenue from goods produced, sales made or services performed in that country or geographic region; or (iii) it is organized under the laws of, or has a principal office in, that country or geographic region. By applying these tests, it is possible that a particular issuer could be deemed to be from more than one country or geographic region.
19
Emerging Market Securities. An emerging market security is one issued by a foreign government or private issuer that has one or more of the following characteristics: (i) its principal securities trading market is in an emerging market or developing country, (ii) alone or on a consolidated basis it derives 50% or more of its annual revenue from goods produced, sales made or services performed in emerging markets or (iii) it is organized under the laws of, or has a principal office in, an emerging market or developing country. Based on these criteria it is possible for a security to be considered issued by an issuer in more than one country. Therefore, it is possible for the securities of any issuer that has one or more of these characteristics in connection with any emerging market or developing country not to be considered an emerging market security if it has one or more of these characteristics in connection with a developed country.
Emerging market describes any country which is generally considered to be an emerging or developing country by major organizations in the international financial community, such as the International Bank for Reconstruction and Development (more commonly known as the World Bank) and the International Finance Corporation. Emerging markets can include every nation in the world except the United States, Canada, Japan, Australia, New Zealand and most nations located in Western Europe.
The economies of individual emerging market or developing countries may differ favorably or unfavorably from the U.S. economy in such respects as growth of gross domestic product, rate of inflation, currency depreciation, capital reinvestment, resource self-sufficiency and balance of payments position. Further, the economies of developing countries generally are heavily dependent upon international trade and, accordingly, have been, and may continue to be, adversely affected by trade barriers, exchange controls, managed adjustments in relative currency values and other protectionist measures. These economies also have been, and may continue to be, adversely affected by economic conditions in the countries with which they trade.
Prior governmental approval for foreign investments may be required under certain circumstances in some emerging market or developing countries, and the extent of foreign investment in certain fixed-income securities and domestic companies may be subject to limitation in other emerging market or developing countries. Foreign ownership limitations also may be imposed by the charters of individual companies in emerging market or developing countries to prevent, among other concerns, violation of foreign investment limitations. Repatriation of investment income, capital and the proceeds of sales by foreign investors may require governmental registration and/or approval in some emerging countries. The Fund could be adversely affected by delays in, or a refusal to grant, any required governmental registration or approval for such repatriation. Any investment subject to such repatriation controls will be considered illiquid if it appears reasonably likely that this process will take more than seven days.
Investment in emerging market or developing countries may entail purchasing securities issued by or on behalf of entities that are insolvent, bankrupt, in default or otherwise engaged in an attempt to reorganize or reschedule their obligations and in entities that have little or no proven credit rating or credit history. In any such case, the issuer's poor or deteriorating financial condition may increase the likelihood that the Fund will experience losses or diminution in available gains due to bankruptcy, insolvency or fraud. Emerging market or developing countries also pose the risk of nationalization, expropriation or confiscatory taxation, political changes, government regulation, social instability or diplomatic development (including war) that could affect adversely the economies of such countries or the value of a fund's investments in those countries. In addition, it may be difficult to obtain and enforce a judgment in a court outside the United States.
Investments in emerging markets may also be exposed to an extra degree of custodial and/or market risk, especially where the securities purchased are not traded on an official exchange or where ownership records regarding the securities are maintained by an unregulated entity (or even the issuer itself).
Depositary Receipts. Depositary Receipts represent an ownership interest in securities of foreign companies (an "underlying issuer") that are deposited with a depositary. Depositary Receipts are not necessarily denominated in the same currency as the underlying securities. Depositary Receipts include American Depositary Receipts ("ADRs"), Global Depositary Receipts ("GDRs") and other types of Depositary Receipts (which, together with ADRs and GDRs, are hereinafter collectively referred to as "Depositary Receipts"). ADRs are dollar-denominated Depositary Receipts typically issued by a U.S. financial institution which evidence an ownership interest in a security or pool of securities issued by a foreign issuer. ADRs are listed and traded in the United States. GDRs and other types of Depositary Receipts are typically issued by foreign banks or trust companies, although they also may be issued by U.S. financial
20
institutions, and evidence ownership interests in a security or pool of securities issued by either a foreign or a U.S. corporation. Generally, Depositary Receipts in registered form are designed for use in the U.S. securities market and Depositary Receipts in bearer form are designed for use in securities markets outside the United States.
Depositary Receipts may be "sponsored" or "unsponsored." Sponsored Depositary Receipts are established jointly by a depositary and the underlying issuer, whereas unsponsored Depositary Receipts may be established by a depositary without participation by the underlying issuer. Holders of unsponsored Depositary Receipts generally bear all the costs associated with establishing unsponsored Depositary Receipts. In addition, the issuers of the securities underlying unsponsored Depositary Receipts are not obligated to disclose material information in the United States and, therefore, there may be less information available regarding such issuers and there may not be a correlation between such information and the market value of the Depositary Receipts. For purposes of the Fund's investment policies, the Fund's investments in Depositary Receipts will be deemed to be an investment in the underlying securities, except that ADRs may be deemed to be issued by a U.S. issuer.
Investment Company Securities. Investment company securities are securities of other open-end, closed-end and unregistered investment companies, including foreign investment companies and exchange-traded funds. The Fund may invest in investment company securities as may be permitted by (i) the Investment Company Act, as amended from time to time; (ii) the rules and regulations promulgated by the SEC under the Investment Company Act, as amended from time to time; or (iii) an exemption or other relief applicable to the Fund from provisions of the Investment Company Act, as amended from time to time. The Investment Company Act generally prohibits an investment company from acquiring more than 3% of the outstanding voting shares of an investment company and limits such investments to no more than 5% of a portfolio's total assets in any one investment company, and no more than 10% in any combination of investment companies. The Fund may invest in investment company securities of investment companies managed by the Adviser or its affiliates to the extent permitted under the Investment Company Act or as otherwise authorized by the SEC. To the extent the Fund invests a portion of its assets in investment company securities, those assets will be subject to the risks of the purchased investment company's portfolio securities, and a shareholder in the Fund will bear not only his proportionate share of the expenses of the Fund, but also, indirectly the expenses of the purchased investment company.
To the extent permitted by applicable law, the Fund may invest all or some of its short term cash investments in any money market fund advised or managed by the Adviser or its affiliates. In connection with any such investments, the Fund, to the extent permitted by the Investment Company Act, will pay its share of all expenses (other than advisory and administrative fees) of a money market fund in which it invests which may result in the Fund bearing some additional expenses.
Exchange-Traded Funds ("ETFs"). The Fund may invest in shares of various ETFs, including exchange-traded index and bond funds. Exchange-traded index funds seek to track the performance of various securities indices. Shares of ETFs have many of the same risks as direct investments in common stocks or bonds. In addition, their market value is expected to rise and fall as the value of the underlying index or bond rises and falls. The market value of their shares may differ from the net asset value of the particular fund. As a shareholder in an ETF (as with other investment companies), the Fund would bear its ratable share of that entity's expenses. At the same time, the Fund would continue to pay its own investment management fees and other expenses. As a result, the Fund and its shareholders, in effect, will be absorbing duplicate levels of fees with respect to investments in ETFs.
C. Fund Policies/Investment Restrictions
The investment objective, policies and restrictions listed below have been adopted by the Fund as fundamental policies. Under the Investment Company Act, a fundamental policy may not be changed without the vote of a majority of the outstanding voting securities of the Fund. The Investment Company Act defines a majority as the lesser of (a) 67% or more of the shares present at a meeting of shareholders, if the holders of 50% of the outstanding shares of the Fund are present or represented by proxy; or (b) more than 50% of the outstanding shares of the Fund. For purposes of the following restrictions: (i) all percentage limitations apply immediately after a purchase or initial investment (unless otherwise noted), and (ii) any subsequent change in any applicable percentage resulting from market fluctuations or other changes in total or net assets does not require elimination of any security from the portfolio, except in the case of borrowing and investments in illiquid securities.
21
The Fund will:
1. Seek long-term capital growth.
The Fund will not:
1. Invest in a manner inconsistent with its classification as a "diversified company" as provided by (i) the Investment Company Act, as amended from time to time, (ii) the rules and regulations promulgated by the SEC under the Investment Company Act, as amended from time to time, or (iii) an exemption or other relief applicable to the Fund from the provisions of the Investment Company Act, as amended from time to time.
2. Concentrate its investments in any particular industry, but if deemed appropriate for attainment of its investment objective, up to 25% of its total assets (valued at the time of investment) may be invested in any one industry classification used by the Fund for investment purposes. This restriction does not apply to obligations issued or guaranteed by the U.S. government or its agencies or instrumentalities.
3. Borrow money, except the Fund may borrow money to the extent permitted by (i) the Investment Company Act, as amended from time to time, (ii) the rules and regulations promulgated by the SEC under the Investment Company Act, as amended from time to time, or (iii) an exemption or other relief applicable to the Fund from the provisions of the Investment Company Act, as amended from time to time.
4. Purchase or sell real estate or interests therein, although the Fund may purchase securities of issuers which engage in real estate operations and securities which are secured by real estate or interests therein.
5. Purchase or sell physical commodities unless acquired as a result of ownership of securities or other instruments; provided that this restriction shall not prohibit the Fund from purchasing or selling options, futures contracts and related options thereon, forward contracts, swaps, caps, floors, collars and any other financial instruments or from investing in securities or other instruments backed by physical commodities or as otherwise permitted by (i) the Investment Company Act, as amended from time to time, (ii) the rules and regulations promulgated by the SEC under the Investment Company Act, as amended from time to time, or (iii) an exemption or other relief applicable to the Fund from the provisions of the Investment Company Act, as amended from time to time.
6. Issue senior securities, except the Fund may issue senior securities to the extent permitted by (i) the Investment Company Act, as amended from time to time, (ii) the rules and regulations promulgated by the SEC under the Investment Company Act, as amended from time to time, or (iii) an exemption or other relief applicable to the Fund from the provisions of the Investment Company Act, as amended from time to time.
7. Make loans of money or property to any person except (a) to the extent that securities or interests in which the Fund may invest are considered to be loans, (b) through the loan of portfolio securities, (c) by engaging in repurchase agreements or (d) as may otherwise be permitted by (i) the Investment Company Act, as amended from time to time, (ii) the rules and regulations promulgated by the SEC under the Investment Company Act, as amended from time to time, or (iii) an exemption or other relief applicable to the Fund from the provisions of the Investment Company Act, as amended from time to time.
8. Engage in the underwriting of securities, except insofar as the Fund may be deemed an underwriter under the Securities Act in disposing of a portfolio security.
In addition, as non-fundamental policies, which can be changed with Board approval and without shareholder vote, the Fund will not:
1. Make short sales of securities, except short sales against the box.
2. Invest its assets in the securities of any investment company except as may be permitted by (i) the Investment Company Act, as amended from time to time; (ii) the rules and regulations promulgated by the SEC under the Investment Company Act, as amended from time to time; or (iii) an exemption or other relief applicable to the Fund from the provisions of the Investment Company Act, as amended from time to time.
3. Write, purchase or sell puts, calls or combinations thereof.
22
4. Invest in other investment companies in reliance on Sections 12(d)(1)(F), 12(d)(1)(G) or 12(d)(1)(J) of the Investment Company Act.
Notwithstanding any other investment policy or restriction, the Fund may seek to achieve its investment objective by investing all or substantially all of its assets in another investment company having substantially the same investment objective and policies as the Fund.
D. Disclosure of Portfolio Holdings
The Fund's Board of Trustees and the Adviser have adopted policies and procedures regarding disclosure of portfolio holdings (the "Policy"). Pursuant to the Policy, the Adviser may disclose information concerning Fund portfolio holdings only if such disclosure is consistent with the antifraud provisions of the federal securities laws and the Fund's and the Adviser's fiduciary duties to Fund shareholders. In no instance may the Adviser of the Fund receive compensation or any other consideration in connection with the disclosure of information about the portfolio securities of the Fund. Consideration includes any agreement to maintain assets in the Fund or in other investment companies or accounts managed by the Adviser or by any affiliated person of the Adviser. Non-public information concerning portfolio holdings may be divulged to third parties only when the Fund has a legitimate business purpose for doing so and the recipients of the information are subject to a duty of confidentiality. Under no circumstances shall current or prospective Fund shareholders receive non-public portfolio holdings information, except as described below.
The Fund makes available on its public website the following portfolio holdings information:
• complete portfolio holdings information monthly, at least 15 calendar days after the end of each month; and
• top 10 holdings monthly, at least 15 calendar days after the end of each month.
The Fund provides a complete schedule of portfolio holdings for the second and fourth fiscal quarters in its semiannual and annual reports, and for the first and third fiscal quarters in its filings with the SEC on Form N-Q.
All other portfolio holdings information that has not been disseminated in a manner making it available to investors generally as described above is non-public information for purposes of the Policy.
The Fund may make selective disclosure of non-public portfolio holdings pursuant to certain exemptions set forth in the Policy. Third parties eligible for exemptions under the Policy and therefore eligible to receive such disclosures currently include fund rating agencies, information exchange subscribers, consultants and analysts, portfolio analytics providers and service providers, provided that the third party expressly agrees to maintain the disclosed information in confidence and not to trade portfolio securities or related derivative securities based on the non-public information. Non-public portfolio holdings information may not be disclosed to a third party pursuant to an exemption unless and until the third party recipient has entered into a non-disclosure agreement with the Fund and the arrangement has been reviewed and approved, as set forth in the Policy and discussed below. In addition, persons who owe a duty of trust or confidence to the Fund or the Adviser may receive non-public portfolio holdings information without entering into a non-disclosure agreement. Currently, these persons include (i) the Fund's independent registered public accounting firm (as of the Fund's fiscal year-end and on an as needed basis), (ii) counsel to the Fund (on an as needed basis), (iii) counsel to the independent Directors (on an as needed basis) and (iv) members of the Board of Directors (on an as needed basis). Subject to the terms and conditions of any agreement between the Adviser or the Fund and the third party recipient, if these conditions for disclosure are satisfied, there shall be no restriction on the frequency with which Fund non-public portfolio holdings information is released, and no lag period shall apply (unless otherwise indicated below).
The Adviser may provide interest lists to broker-dealers who execute securities transactions for the Fund without entering into a non-disclosure agreement with the broker-dealers, provided that the interest list satisfies all of the following criteria: (1) the interest list must contain only the CUSIP numbers and/or ticker symbols of securities held in all registered management investment companies advised by the Adviser or any affiliate of the Adviser (the "MSIM Funds") on an aggregate, rather than a fund-by-fund basis; (2) the interest list must not contain information about the number or value of shares owned by a specified MSIM Fund; (3) the interest list may identify the investment strategy, but not the particular MSIM Funds, to which the list relates; and (4) the interest list may not identify the portfolio manager or team members responsible for managing the MSIM Funds.
23
Fund shareholders may elect in some circumstances to redeem their shares of the Fund in exchange for their pro rata share of the securities held by the Fund. Under such circumstances, Fund shareholders may receive a complete listing of the holdings of the Fund up to seven calendar days prior to making the redemption request provided that they represent in writing that they agree not to disclose or trade on the basis of the portfolio holdings information.
The Fund may discuss or otherwise disclose performance attribution analyses (i.e., mention the effects of having a particular security in the portfolio(s)) where such discussion is not contemporaneously made public, provided that the particular holding has been disclosed publicly. Additionally, any discussion of the analyses may not be more current than the date the holding was disclosed publicly.
The Fund may disclose portfolio holdings to transition managers, provided that the Fund has entered into a non-disclosure or confidentiality agreement with the party requesting that the information be provided to the transition manager and the party to the non-disclosure agreement has, in turn, entered into a non-disclosure or confidentiality agreement with the transition manager.
The Adviser and/or the Fund currently have entered into ongoing arrangements with the following parties:
| Name | Information Disclosed | Frequency(1) | Lag Time | ||||||||||||
| Service Providers | |||||||||||||||
| RiskMetrics Group (proxy voting agent)(*) | Complete portfolio holdings | Daily basis | (2) | ||||||||||||
| FT Interactive Data Pricing Service Provider(*) | Complete portfolio holdings | As needed | (2) | ||||||||||||
| State Street Bank and Trust Company(*) | Complete portfolio holdings | As needed | (2 | ) | |||||||||||
| Fund Rating Agencies | |||||||||||||||
| Lipper(*) | Top ten and complete portfolio holdings | Quarterly basis | Approximately 15 days after quarter end and approximately 30 days after quarter end | ||||||||||||
| Morningstar(**) | Top ten and complete portfolio holdings | Quarterly basis | Approximately 15 days after quarter end and approximately 30 days after quarter end | ||||||||||||
| Standard & Poor's(*) | Complete portfolio holdings | Quarterly basis | Approximately 15 day lag | ||||||||||||
| Investment Company Institute(**) | Top ten portfolio holdings | Quarterly basis | Approximately 15 days after quarter end | ||||||||||||
| Consultants and Analysts | |||||||||||||||
| Americh Massena & Associates, Inc.(*) | Top ten and complete portfolio holdings | Quarterly basis(5) | Approximately 10-12 days after quarter end | ||||||||||||
| Bloomberg(**) | Complete portfolio holdings | Quarterly basis | Approximately 30 days after quarter end | ||||||||||||
| Callan Associates(*) | Top ten and complete portfolio holdings | Monthly and quarterly basis, respectively(5) | Approximately 10-12 days after month/quarter end | ||||||||||||
| Cambridge Associates(*) | Top ten and complete portfolio holdings | Quarterly basis(5) | Approximately 10-12 days after quarter end | ||||||||||||
| Citigroup(*) | Complete portfolio holdings | Quarterly basis(5) | At least one day after quarter end | ||||||||||||
| Credit Suisse First Boston(*) | Top ten and complete portfolio holdings | Monthly and quarterly basis, respectively | Approximately 10-12 days after month/quarter end | ||||||||||||
| CTC Consulting, Inc.(*) | Top ten and complete portfolio holdings | Quarterly basis | Approximately 15 days after quarter end and approximately 30 days after quarter end, respectively | ||||||||||||
24
| Name | Information Disclosed | Frequency(1) | Lag Time | ||||||||||||
| Evaluation Associates(*) | Top ten and complete portfolio holdings | Monthly and quarterly basis, respectively(5) | Approximately 10-12 days after month/quarter end | ||||||||||||
| Fund Evaluation Group(**) | Top ten portfolio holdings(3) | Quarterly basis | At least 15 days after quarter end | ||||||||||||
| Jeffrey Slocum & Associates(*) | Complete portfolio holdings(4) | Quarterly basis(5) | Approximately 10-12 days after quarter end | ||||||||||||
| Hammond Associates(**) | Complete portfolio holdings(4) | Quarterly basis | At least 30 days after quarter end | ||||||||||||
| Hartland & Co.(**) | Complete portfolio holdings(4) | Quarterly basis | At least 30 days after quarter end | ||||||||||||
| Hewitt EnnisKnupp(*) | Top ten and complete portfolio holdings | Monthly and quarterly basis, respectively(5) | Approximately 10-12 days after month/quarter end | ||||||||||||
| Merrill Lynch(*) | Top ten and complete portfolio holdings | Monthly and quarterly basis, respectively(5) | Approximately 10-12 days after month/quarter end | ||||||||||||
| Mobius(**) | Top ten portfolio holdings(3) | Monthly basis | At least 15 days after month end | ||||||||||||
| Nelsons(**) | Top ten portfolio holdings(3) | Quarterly basis | At least 15 days after quarter end | ||||||||||||
| Prime, Buchholz & Associates, Inc.(**) | Complete portfolio holdings(4) | Quarterly basis | At least 30 days after quarter end | ||||||||||||
| PSN(**) | Top ten portfolio holdings(3) | Quarterly basis | At least 15 days after quarter end | ||||||||||||
| PFM Asset Management LLC(*) | Top ten and complete portfolio holdings | Quarterly basis(5) | Approximately 10-12 days after quarter end | ||||||||||||
| Russell Investment Group/Russell/Mellon Analytical Services, Inc.(**) | Top ten and complete portfolio holdings | Monthly and quarterly basis | At least 15 days after month end and at least 30 days after quarter end, respectively | ||||||||||||
| Stratford Advisory Group, Inc.(*) | Top ten portfolio holdings(6) | Quarterly basis(5) | Approximately 10-12 days after quarter end | ||||||||||||
| Thompson Financial(**) | Complete portfolio holdings(4) | Quarterly basis | At least 30 days after quarter end | ||||||||||||
| Watershed Investment Consultants, Inc.(*) | Top ten and complete portfolio holdings | Quarterly basis(5) | Approximately 10-12 days after quarter end | ||||||||||||
| Yanni Partners(**) | Top ten portfolio holdings(3) | Quarterly basis | At least 15 days after quarter end | ||||||||||||
| Portfolio Analytics Providers | |||||||||||||||
| FactSet Research Systems, Inc.(*) | Complete portfolio holdings | Daily basis | One day | ||||||||||||
(*) This entity has agreed to maintain Fund non-public portfolio holdings information in confidence and not to trade portfolio securities based on the non-public portfolio holdings information.
(**) The Fund does not currently have a non-disclosure agreement in place with this entity and therefore the entity can only receive publicly available information.
(1) Dissemination of portfolio holdings information to entities listed above may occur less frequently than indicated (or not at all).
(2) Information will typically be provided on a real time basis or as soon thereafter as possible.
(3) Complete portfolio holdings will also be provided upon request from time to time on a quarterly basis, with at least a 30 day lag.
(4) Top ten portfolio holdings will also be provided upon request from time to time, with at least a 15 day lag.
(5) This information will also be provided upon request from time to time.
(6) Complete portfolio holdings will also be provided upon request from time to time.
All disclosures of non-public portfolio holdings information made to third parties pursuant to the exemptions set forth in the Policy must be reviewed by Morgan Stanley Investment Management's ("MSIM") Legal and Compliance Division and approved by the Head of the Long-Only Business of MSIM. Disclosures made to third parties in connection with (i) broker-dealer interest lists; (ii) shareholder in-kind distributions;
25
(iii) attribution analyses; or (iv) transition managers are pre-approved for purposes of the Policy. In addition, the following categories of third parties that may receive non-public portfolio holdings information are also pre-approved provided that they enter into non-disclosure agreements (as discussed above) (i) fund rating agencies; (ii) information exchange subscribers; (iii) consultants and analysts (including defined benefit and defined contribution plan sponsors, and variable annuity providers); (iv) portfolio analytics providers; and (v) service providers.
The Adviser shall report quarterly to the Board of Trustees (or a designated committee thereof) at the next regularly scheduled meeting (i) any material information concerning all parties receiving non-public portfolio holdings information pursuant to an exemption; and (ii) any new non-disclosure agreements entered into during the reporting period. Procedures to monitor the use of such non-public portfolio holdings information may include requiring annual certifications that the recipients have utilized such information only pursuant to the terms of the agreement between the recipient and the Adviser and, for those recipients receiving information electronically, acceptance of the information will constitute reaffirmation that the third party expressly agrees to maintain the disclosed information in confidence and not to trade portfolio securities based on the non-public information.
III. MANAGEMENT OF THE FUND
A. Board of Trustees
General. The Board of Trustees of the Fund oversees the management of the Fund, but does not itself manage the Fund. The Trustees review various services provided by or under the direction of the Adviser to ensure that the Fund's general investment policies and programs are properly carried out. The Trustees also conduct their review to ensure that administrative services are provided to the Fund in a satisfactory manner.
Under state law, the duties of the Trustees are generally characterized as a duty of loyalty and a duty of care. The duty of loyalty requires a Trustee to exercise his or her powers in the interest of the Fund and not the Trustee's own interest or the interest of another person or organization. A Trustee satisfies his or her duty of care by acting in good faith with the care of an ordinarily prudent person and in a manner the Trustee reasonably believes to be in the best interest of the Fund and its shareholders.
Trustees and Officers. The Board of the Fund consists of 10 Trustees. These same individuals also serve as directors or trustees for certain of the funds advised by the Adviser and Morgan Stanley AIP GP LP. Nine Trustees have no affiliation or business connection with the Adviser or any of its affiliated persons and do not own any stock or other securities issued by the Adviser's parent company, Morgan Stanley. These are the "non-interested" or "Independent" Trustees. The other Trustee (the "Interested Trustee") is affiliated with the Adviser.
Board Structure and Oversight Function. The Board's leadership structure features an Independent Trustee serving as Chairperson and the Board Committees described below. The Chairperson participates in the preparation of the agenda for meetings of the Board and the preparation of information to be presented to the Board with respect to matters to be acted upon by the Board. The Chairperson also presides at all meetings of the Board and is involved in discussions regarding matters pertaining to the oversight of the management of the Fund between meetings.
The Board of Trustees operates using a system of committees to facilitate the timely and efficient consideration of all matters of importance to the Trustees, the Fund and Fund shareholders, and to facilitate compliance with legal and regulatory requirements and oversight of the Fund's activities and associated risks. The Board of Trustees has established four standing committees: (1) Audit Committee, (2) Governance Committee, (3) Compliance and Insurance Committee and (4) Investment Committee. The Audit Committee and the Governance Committee are comprised exclusively of Independent Trustees. Each committee charter governs the scope of the committee's responsibilities with respect to the oversight of the Fund. The responsibilities of each committee, including their oversight responsibilities, are described further under the caption "Independent Trustees and the Committees."
26
The Fund is subject to a number of risks, including investment, compliance, operational and valuation risk, among others. The Board of Trustees oversees these risks as part of its broader oversight of the Fund's affairs through various Board and committee activities. The Board has adopted, and periodically reviews, policies and procedures designed to address various risks to the Fund. In addition, appropriate personnel, including but not limited to the Fund's Chief Compliance Officer, members of the Fund's administration and accounting teams, representatives from the Fund's independent registered public accounting firm, the Fund's Treasurer, portfolio management personnel and independent valuation and brokerage evaluation service providers, make regular reports regarding the Fund's activities and related risks to the Board of Trustees and the committees, as appropriate. These reports include, among others, quarterly performance reports, quarterly derivatives activity and risk reports and discussions with members of the risk teams relating to each asset class. The Board's committee structure allows separate committees to focus on different aspects of risk and potential impact on some or all of the funds in the complex and then report back to the full Board. In between regular meetings, Fund officers also communicate with the Trustees regarding material exceptions and items relevant to the Board's risk oversight function. The Board recognizes that it is not possible to identify all of the risks that may affect the Fund, and that it is not possible to develop processes and controls to eliminate all of the risks that may affect the Fund. Moreover, the Board recognizes that it may be necessary for the Fund to bear certain risks (such as investment risk) to achieve its investment objective.
As needed between meetings of the Board, the Board or a specific committee receives and reviews reports relating to the Fund and engages in discussions with appropriate parties relating to the Fund's operations and related risks.
B. Management Information
Independent Trustees. The Fund seeks as Trustees individuals of distinction and experience in business and finance, government service or academia. In determining that a particular Trustee was and continues to be qualified to serve as Trustee, the Board has considered a variety of criteria, none of which, in isolation, was controlling. Based on a review of the experience, qualifications, attributes or skills of each Trustee, including those enumerated in the table below, the Board has determined that each of the Trustees is qualified to serve as a Trustee of the Fund. In addition, the Board believes that, collectively, the Trustees have balanced and diverse experience, qualifications, attributes and skills that allow the Board to operate effectively in governing the Fund and protecting the interests of shareholders. Information about the Fund's Governance Committee and Board of Trustees nomination process is provided below under the caption "Independent Trustees and the Committees."
The Independent Trustees of the Fund, their age, address, term of office and length of time served, their principal business occupations during the past five years, the number of portfolios in the Fund Complex (defined below) overseen by each Independent Trustee (as of December 31, 2011) and other directorships, if any, held by the Trustees, are shown below. The Fund Complex includes all open-end and closed-end funds (including all of their portfolios) advised by the Adviser and any funds that have an investment adviser that is an affiliate of the Adviser (including, but not limited to, Morgan Stanley AIP GP LP) (the "Morgan Stanley Funds").
27
Independent Trustees:
| Name, Age and Address of Independent Trustee | Position(s) Held with Registrant | Length of Time Served* | Principal Occupation(s) During Past 5 Years | Number of Portfolios in Fund Complex Overseen by Independent Trustee | Other Directorships Held by Independent Trustee** | ||||||||||||||||||
| Frank L. Bowman (67) c/o Kramer Levin Naftalis & Frankel LLP Counsel to the Independent Trustees 1177 Avenue of the Americas New York, NY 10036 | Trustee | Since August 2006 | President, Strategic Decisions, LLC (consulting) (since February 2009); Director or Trustee of various Morgan Stanley Funds (since August 2006); Chairperson of the Insurance Sub-Committee of the Compliance and Insurance Committee (since February 2007); served as President and Chief Executive Officer of the Nuclear Energy Institute (policy organization) (February 2005 through November 2008); retired as Admiral, U.S. Navy after serving over 38 years on active duty including 8 years as Director of the Naval Nuclear Propulsion Program in the Department of the Navy and the U.S. Department of Energy (1996-2004); Served as Chief of Naval Personnel (July 1994-September 1996) and on the Joint Staff as Director of Politicial Military Affairs (June 1992 to July 1994); Knighted as Honorary Knight Commander of the Most Excellent Order of the British Empire; Awarded the Officer de l'Orde National du Mérite by the French Government; elected to the National Academy of Engineering (2009). | 102 | Director of BP p.l.c.; Director of Naval and Nuclear Technologies LLP; Director of the Armed Services YMCA of the USA and the Naval Submarine League; Director of the American Shipbuilding Suppliers Association; Member of the National Security Advisory Counsil of the Center for U.S. Global Engagement and a member of the CNA Military Advisory Board; Member of the American Lung Association's President's Council. | ||||||||||||||||||
| Michael Bozic (71) c/o Kramer Levin Naftalis & Frankel LLP Counsel to the Independent Trustees 1177 Avenue of the Americas New York, NY 10036 | Trustee | Since April 1994 | Private investor; Chairperson of the Compliance and Insurance Committee (since October 2006); Director or Trustee of various Morgan Stanley Funds (since April 1994); formerly, Chairperson of the Insurance Committee (July 2006-September 2006); Vice Chairman of Kmart Corporation (December 1998-October 2000), Chairman and Chief Executive Officer of Levitz Furniture Corporation (November 1995-November 1998) and President and Chief Executive Officer of Hills Department Stores (May 1991-July 1995); variously Chairman, Chief Executive Officer, President and Chief Operating Officer (1987-1991) of the Sears Merchandise Group of Sears, Roebuck & Co. | 104 | Director of various business organizations. | ||||||||||||||||||
* Each Trustee serves an indefinite term, until his or her successor is elected.
** This includes and directorships at public companies and registered investment companies held by the Trustee at any time during the past five years.
28
| Name, Age and Address of Independent Trustee | Position(s) Held with Registrant | Length of Time Served* | Principal Occupation(s) During Past 5 Years | Number of Portfolios in Fund Complex Overseen by Independent Trustee | Other Directorships Held by Independent Trustee** | ||||||||||||||||||
| Kathleen A. Dennis (58) c/o Kramer Levin Naftalis & Frankel LLP Counsel to the Independent Trustees 1177 Avenue of the Americas New York, NY 10036 | Trustee | Since August 2006 | President, Cedarwood Associates (mutual fund and investment management consulting) (since July 2006); Chairperson of the Money Market and Alternatives Sub-Committee of the Investment Committee (since October 2006) and Director or Trustee of various Morgan Stanley (since August 2006); formerly, Senior Managing Director of Victory Capital Management (1993-2006). | 102 | Director of various non-profit organizations. | ||||||||||||||||||
| Dr. Manuel H. Johnson (62) c/o Johnson Smick Group, Inc. 888 16th Street, N.W. Suite 740 Washington, D.C. 20006 | Trustee | Since July 1991 | Senior Partner, Johnson Smick International, Inc. (consulting firm); Chairperson of the Investment Committee (since October 2006) and Director or Trustee of various Morgan Stanley Funds (since July 1991); Co-Chairman and a founder of the Group of Seven Council (G7C) (international economic commission); formerly, Chairperson of the Audit Committee (July 1991-September 2006); Vice Chairman of the Board of Governors of the Federal Reserve System and Assistant Secretary of the U.S. Treasury. | 104 | Director of NVR, Inc. (home construction). | ||||||||||||||||||
| Joseph J. Kearns (69) c/o Kearns & Associates LLC PMB754 22631 Pacific Coast Highway Malibu, CA 90265 | Trustee | Since August 1994 | President, Kearns & Associates LLC (investment consulting); Chairperson of the Audit Committee (since October 2006) and Director or Trustee of various Morgan Stanley Funds (since August 1994); formerly, Deputy Chairperson of the Audit Committee (July 2003-September 2006) and Chairperson of the Audit Committee of various Morgan Stanley Funds (since August 1994); CFO of the J. Paul Getty Trust. | 105 | Director of Electro Rent Corporation (equipment leasing) and The Ford Family Foundation. | ||||||||||||||||||
* Each Trustee serves an indefinite term, until his or her successor is elected.
** This includes and directorships at public companies and registered investment companies held by the Trustee at any time during the past five years.
29
| Name, Age and Address of Independent Trustee | Position(s) Held with Registrant | Length of Time Served* | Principal Occupation(s) During Past 5 Years | Number of Portfolios in Fund Complex Overseen by Independent Trustee | Other Directorships Held by Independent Trustee** | ||||||||||||||||||
| Michael F. Klein (53) c/o Kramer Levin Naftalis & Frankel LLP Counsel to the Independent Trustees 1177 Avenue of the Americas New York, NY 10036 | Trustee | Since August 2006 | Managing Director, Aetos Capital, LLC (since March 2000) and Co-President, Aetos Alternatives Management, LLC (since January 2004); Chairperson of the Fixed-Income Sub-Committee of the Investment Committee (since October 2006) and Director or Trustee of various Morgan Stanley Funds (since August 2006); formerly, Managing Director, Morgan Stanley & Co. Inc. and Morgan Stanley Dean Witter Investment Management, President, various Morgan Stanley Funds (June 1998-March 2000) and Principal, Morgan Stanley & Co. Inc. and Morgan Stanley Dean Witter Investment Management (August 1997-December 1999). | 102 | Director of certain investment funds managed or sponsored by Aetos Capital, LLC. Director of Sanitized AG and Sanitized Marketing AG (specialty chemicals). | ||||||||||||||||||
| Michael E. Nugent (75) c/o Triumph Capital, L.P. 445 Park Avenue New York, NY 10022 | Chairperson of the Board and Trustee | Chairperson of the Boards since July 2006 and Trustee since July 1991 | General Partner, Triumph Capital, L.P. (private investment partnership); Chairperson of the Boards of various Morgan Stanley Funds (since July 2006); Director or Trustee of various Morgan Stanley Funds (since July 1991); formerly, Chairperson of the Insurance Committee (until July 2006). | 104 | None. | ||||||||||||||||||
| W. Allen Reed (64) c/o Kramer Levin Naftalis & Frankel LLP Counsel to the Independent Trustees 1177 Avenue of the Americas New York, NY 10036 | Trustee | Since August 2006 | Chairperson of the Equity Sub-Committee of the Investment Committee (since October 2006) and Director or Trustee various Morgan Stanley Funds (since August 2006); formerly, President and CEO of General Motors Asset Management; Chairman and Chief Executive Officer of the GM Trust Bank and Corporate Vice President of General Motors Corporation (August 1994-December 2005). | 102 | Director of Temple-Inland Industries (packaging and forest products), Director of Legg Mason, Inc. and Director of the Auburn University Foundation; formerly, Director of iShares, Inc. (2001-2006). | ||||||||||||||||||
| Fergus Reid (79) c/o Joe Pietryka, Inc. 85 Charles Colman Blvd. Pawling, NY 12564 | Trustee | Since June 1992 | Chairman, Joe Pietryka, Inc.; Chairperson of the Governance Committee and Director or Trustee of various Morgan Stanley Funds (since June 1992). | 105 | Trustee and Director of certain investment companies in the JP Morgan Funds complex managed by JP Morgan Investment Management Inc. | ||||||||||||||||||
* Each Trustee serves an indefinite term, until his or her successor is elected.
** This includes and directorships at public companies and registered investment companies held by the Trustee at any time during the past five years.
30
The Trustee who is affiliated with the Adviser or affiliates of the Adviser (as set forth below) and executive officers of the Fund, their age, address, term of office and length of time served, their principal business occupations during the past five years, the number of portfolios in the Fund Complex overseen by the Interested Trustee (as of December 31, 2011) and the other directorships, if any, held by the Interested Trustee, are shown below.
Interested Trustee:
| Name, Age and Address of Interested Trustee | Position(s) Held with Registrant | Length of Time Served* | Principal Occupation(s) During Past 5 Years | Number of Portfolios in Fund Complex Overseen by Interested Trustee | Other Directorships Held by Interested Trustee** | ||||||||||||||||||
| James F. Higgins (63) c/o Morgan Stanley Services Company Inc. Harborside Financial Center 201 Plaza Two Jersey City, NJ 07311 | Trustee | Since June 2000 | Director or Trustee of various Morgan Stanley Funds (since June 2000); Senior Advisor of Morgan Stanley (since August 2000). | 103 | Director of AXA Financial, Inc. and The Equitable Life Assurance Society of the United States (financial services). | ||||||||||||||||||
* Each Trustee serves an indefinite term, until his or her successor is elected.
** This includes and directorships at public companies and registered investment companies held by the Trustee at any time during the past five years.
Executive Officers:
| Name, Age and Address of Executive Officer | Position(s) Held with Registrant | Length of Time Served* | Principal Occupation(s) During Past 5 Years | ||||||||||||
| Arthur Lev (50) 522 Fifth Avenue New York, NY 10036 | President and Principal Executive Officer — Equity and Fixed Income Funds | Since June 2011 | President and Principal Executive Officer (since June 2011) of the Equity and Fixed Income Funds in the Fund Complex; Head of the Long Only Business of Morgan Stanley Investment Management (since February 2011); Managing Director of the Adviser and various entities affiliated with the Adviser (since December 2006). Formerly, Chief Strategy Officer of Morgan Stanley Investment Management's Traditional Asset Management business (November 2010-February 2011); General Counsel of Morgan Stanley Investment Management (December 2006-October 2010); Partner and General Counsel of FrontPoint Partners LLC (July 2002 to December 2006); Managing Director and General Counsel of Morgan Stanley Investment Management (May 2000 to June 2002). | ||||||||||||
| Mary Ann Picciotto (38) c/o Morgan Stanley Services Company Inc. Harborside Financial Center 201 Plaza Two Jersey City, NJ 07311 | Chief Compliance Officer | Since May 2010 | Managing Director of the Adviser and various entities affiliated with the Adviser; Chief Compliance Officer of various Morgan Stanley Funds (since May 2010); Chief Compliance Officer of the Adviser (since April 2007). | ||||||||||||
| Stefanie V. Chang Yu (45) 522 Fifth Avenue New York, NY 10036 | Vice President | Since December 1997 | Managing Director of the Adviser and various entities affiliated with the Adviser; Vice President of various Morgan Stanley Funds (since December 1997). Formerly Secretary of the Adviser and various entities affiliated with the Adviser. | ||||||||||||
* Each Officer serves an indefinite term, until his or her successor is elected.
31
| Name, Age and Address of Executive Officer | Position(s) Held with Registrant | Length of Time Served* | Principal Occupation(s) During Past 5 Years | ||||||||||||
| Francis J. Smith (46) c/o Morgan Stanley Services Company Inc. Harborside Financial Center 201 Plaza Two Jersey City, NJ 07311 | Treasurer and Principal Financial Officer | Treasurer since July 2003 and Principal Financial Officer since September 2002 | Executive Director of the Adviser and various entities affiliated with the Adviser; Treasurer and Principal Financial Officer of various Morgan Stanley Funds (since July 2003). | ||||||||||||
| Mary E. Mullin (44) 522 Fifth Avenue New York, NY 10036 | Secretary | Since June 1999 | Executive Director of the Adviser and various entities affiliated with the Adviser; Secretary of various Morgan Stanley Funds (since June 1999). | ||||||||||||
* Each Officer serves an indefinite term, until his or her successor is elected.
In addition, the following individuals who are officers of the Adviser or its affiliates serve as assistant secretaries of the Fund: Joanne Antico, Joseph C. Benedetti, Daniel E. Burton, Tara A. Farrelly and Edward J. Meehan.
For each Trustee, the dollar range of equity securities beneficially owned by the Trustee in the Fund and in the Family of Investment Companies (Family of Investment Companies includes all of the registered investment companies advised by the Adviser and Morgan Stanley AIP GP LP) for the calendar year ended December 31, 2011 is set forth in the table below.
| Name of Trustee | Dollar Range of Equity Securities in the Fund (As of December 31, 2011) | Aggregate Dollar Range of Equity Securities in All Registered Investment Companies Overseen by Trustee in Family of Investment Companies (As of December 31, 2011) | |||||||||
| Independent: | |||||||||||
| Frank L. Bowman(1) | None | over $100,000 | |||||||||
| Michael Bozic | None | over $100,000 | |||||||||
| Kathleen A. Dennis | $ | 50,001 - $100,000 | over $100,000 | ||||||||
| Manuel H. Johnson | None | over $100,000 | |||||||||
| Joseph J. Kearns(1) | None | over $100,000 | |||||||||
| Michael F. Klein | None | over $100,000 | |||||||||
| Michael E. Nugent | None | over $100,000 | |||||||||
| W. Allen Reed(1) | None | over $100,000 | |||||||||
| Fergus Reid(1) | None | over $100,000 | |||||||||
| Interested: | |||||||||||
| James F. Higgins | None | over $100,000 | |||||||||
(1) Includes the total amount of compensation deferred by the Trustee at his election pursuant to a deferred compensation plan. Such deferred compensation is placed in a deferral account and deemed to be invested in one or more of the Morgan Stanley Funds (or portfolio thereof) that are offered as investment options under the plan.
As to each Independent Trustee and his or her immediate family members, no person owned beneficially or of record securities in an investment adviser or principal underwriter of the Fund, or a person (other than a registered investment company) directly or indirectly controlling, controlled by or under common control with an investment adviser or principal underwriter of the Fund.
Independent Trustees and the Committees. Law and regulation establish both general guidelines and specific duties for the Independent Trustees. The Board has four committees: (1) Audit Committee, (2) Governance Committee, (3) Compliance and Insurance Committee and (4) Investment Committee. Three of the Independent Trustees serve as members of the Audit Committee, three Independent Trustees serve as members of the Governance Committee, four Trustees, including three Independent Trustees, serve as members of the Compliance and Insurance Committee and all of the Trustees serve as members of the Investment Committee.
The Independent Trustees are charged with recommending to the full Board approval of management, advisory and administration contracts, Rule 12b-1 plans and distribution and underwriting agreements; continually reviewing fund performance; checking on the pricing of portfolio securities, brokerage commissions, transfer agent costs and performance and trading among funds in the same complex; and approving
32
fidelity bond and related insurance coverage and allocations, as well as other matters that arise from time to time. The Independent Trustees are required to select and nominate individuals to fill any Independent Trustee vacancy on the board of any fund that has a Rule 12b-1 plan of distribution. Most of the retail Morgan Stanley Funds have a Rule 12b-1 plan.
The Board of Trustees has a separately-designated standing Audit Committee established in accordance with Section 3(a)(58)(A) of the Securities Exchange Act of 1934, as amended (the "Exchange Act"). The Audit Committee is charged with recommending to the full Board the engagement or discharge of the Fund's independent registered public accounting firm; directing investigations into matters within the scope of the independent registered public accounting firm's duties, including the power to retain outside specialists; reviewing with the independent registered public accounting firm the audit plan and results of the auditing engagement; approving professional services provided by the independent registered public accounting firm and other accounting firms prior to the performance of the services; reviewing the independence of the independent registered public accounting firm; considering the range of audit and non-audit fees; reviewing the adequacy of the Fund's system of internal controls; and reviewing the valuation process. The Fund has adopted a formal, written Audit Committee Charter.
The members of the Audit Committee of the Fund are Joseph J. Kearns, Michael E. Nugent and W. Allen Reed. None of the members of the Fund's Audit Committee is an "interested person," as defined under the Investment Company Act, of the Fund (with such disinterested Trustees being "Independent Trustees" or individually, "Independent Trustee"). Each Independent Trustee is also "independent" from the Fund under the listing standards of the New York Stock Exchange, Inc. ("NYSE"). The Chairperson of the Audit Committee of the Fund is Joseph J. Kearns.
The Board of Trustees of the Fund also has a Governance Committee. The Governance Committee identifies individuals qualified to serve as Independent Trustees on the Fund's Board and on committees of such Board and recommends such qualified individuals for nomination by the Fund's Independent Trustees as candidates for election as Independent Trustees, advises the Fund's Board with respect to Board composition, procedures and committees, develops and recommends to the Fund's Board a set of corporate governance principles applicable to the Fund, monitors and makes recommendations on corporate governance matters and policies and procedures of the Fund's Board of Trustees and any Board committees and oversees periodic evaluations of the Fund's Board and its committees. The members of the Governance Committee of the Fund are Kathleen A. Dennis, Michael F. Klein and Fergus Reid, each of whom is an Independent Trustee. The Chairperson of the Governance Committee is Fergus Reid.
The Fund does not have a separate nominating committee. While the Fund's Governance Committee recommends qualified candidates for nominations as Independent Trustees, the Board of Trustees of the Fund believes that the task of nominating prospective Independent Trustees is important enough to require the participation of all current Independent Trustees, rather than a separate committee consisting of only certain Independent Trustees. Accordingly, each Independent Trustee (Frank L. Bowman, Michael Bozic, Kathleen A. Dennis, Manuel H. Johnson, Joseph J. Kearns, Michael F. Klein, Michael E. Nugent, W. Allen Reed and Fergus Reid) participates in the election and nomination of candidates for election as Independent Trustees for the Fund. Persons recommended by the Fund's Governance Committee as candidates for nomination as Independent Trustees shall possess such experience, qualifications, attributes, skills and expertise and diversity so as to enhance the Board's ability to manage and direct the affairs and business of the Fund, including, when applicable, to enhance the ability of committees of the Board to fulfill their duties and/or to satisfy any independence requirements imposed by law, regulation or any listing requirements of the NYSE. While the Independent Trustees of the Fund expect to be able to continue to identify from their own resources an ample number of qualified candidates for the Fund's Board as they deem appropriate, they will consider nominations from shareholders to the Board. Nominations from shareholders should be in writing and sent to the Independent Trustees as described below under the caption "Shareholder Communications."
The Board formed the Compliance and Insurance Committee to address insurance coverage and oversee the compliance function for the Fund and the Board. The Compliance and Insurance Committee consists of Frank L. Bowman, Michael Bozic, James F. Higgins and Manuel H. Johnson. Frank L. Bowman, Michael Bozic and Manuel H. Johnson are Independent Trustees. The Chairperson of the Compliance and
33
Insurance Committee is Michael Bozic. The Compliance and Insurance Committee has an Insurance Sub-Committee to review and monitor the insurance coverage maintained by the Fund. The Chairperson of the Insurance Sub-Committee is Frank L. Bowman.
The Investment Committee oversees the portfolio investment process for and reviews the performance of the Fund. The Investment Committee also recommends to the Board to approve or renew the Fund's Advisory and Administration Agreements. The members of the Investment Committee are Frank L. Bowman, Michael Bozic, Kathleen A. Dennis, James F. Higgins, Manuel H. Johnson, Joseph J. Kearns, Michael F. Klein, Michael E. Nugent, W. Allen Reed and Fergus Reid. The Chairperson of the Investment Committee is Manuel H. Johnson.
The Investment Committee has three Sub-Committees, each with its own Chairperson. Each Sub-Committee focuses on the funds' primary areas of investment, namely equities, fixed income and alternatives. The Sub-Committees and their members are as follows:
(1) Equity — W. Allen Reed (Chairperson), Frank L. Bowman and Michael E. Nugent.
(2) Fixed Income — Michael F. Klein (Chairperson), Michael Bozic and Fergus Reid.
(3) Money Market and Alternatives — Kathleen A. Dennis (Chairperson), James F. Higgins and Joseph J. Kearns.
During the Fund's fiscal year ended September 30, 2011, the Board of Trustees held the following meetings:
| Board of Trustees | 7 | ||||||
| Committee/Sub-Committee: | Number of meetings: | ||||||
| Audit Committee | 4 | ||||||
| Governance Committee | 4 | ||||||
| Compliance and Insurance Committee | 4 | ||||||
| Insurance Sub-Committee | 1 | ||||||
| Investment Committee | 5 | ||||||
| Equity Sub-Committee | 5 | ||||||
| Fixed Income Sub-Committee | 5 | ||||||
| Money Market and Alternatives Sub-Committee | 7 | ||||||
Experience, Qualifications and Attributes
The Board has concluded, based on each Trustee's experience, qualifications and attributes that each Board member should serve as a Trustee. Following is a brief summary of the information that led to and/or supports this conclusion.
Mr. Bowman has experience in a variety of business and financial matters through his prior service as a Director or Trustee for various other funds in the Fund Complex, where he serves as Chairperson of the Insurance Sub-Committee of the Compliance and Insurance Committee, and as a Director of BP p.l.c. and Naval and Nuclear Technologies LLP. Mr. Bowman also serves as a Director for the Armed Services YMCA of the USA, the Naval Submarine League and the American Shipbuilding Suppliers Association. Mr. Bowman is also a member of the National Security Advisory Council of the Center for U.S. Global Engagement and a member of the CNA Military Advisory Board. Mr. Bowman retired as an Admiral in the U.S. Navy after serving over 38 years on active duty including eight years as Director of the Naval Nuclear Propulsion Program in the Department of the Navy and the Department of Energy (1996-2004). Additionally, Mr. Bowman served as the U.S. Navy's Chief of Naval Personnel (1994-1996), where he was responsible for the planning and programming of all manpower, personnel, training and education resources for the U.S. Navy and on the Joint Staff as Director of Political Military Affairs (1992-1994). In addition, Mr. Bowman served as President and Chief Executive Officer of the Nuclear Energy Institute. Mr. Bowman has received such distinctions as a knighthood as Honorary Knight Commander of the Most
34
Excellent Order of the British Empire and the Officer de l'Orde National du Mérite from the French Government and was elected to the National Academy of Engineering (2009). He is President of the consulting firm Strategic Decisions, LLC.
With over 20 years of experience on the boards and in senior management of such companies as Kmart Corporation, Levitz Furniture Corporation, Hills Department Stores and Sears Merchandise Group of Sears, Roebuck & Co., where Mr. Bozic also served as Chief Financial Officer of the Merchandise Group, and with over 15 years of experience as a Director or Trustee of certain other funds in the Fund Complex, Mr. Bozic has experience with a variety of financial, management, regulatory and operational issues as well as experience with marketing and distribution. Mr. Bozic has served as the Chairperson of the Compliance and Insurance Committee since 2006.
Ms. Dennis has over 25 years of business experience in the financial services industry and related fields including serving as a Director or Trustee of various other funds in the Fund Complex, where she serves as Chairperson of the Money Market and Alternatives Sub-Committee of the Investment Committee. Ms. Dennis possesses a strong understanding of the regulatory framework under which investment companies must operate based on her years of service to this Board and her position as Senior Managing Trustee of Victory Capital Management.
In addition to his tenure as a Director or Trustee of various other funds in the Fund Complex, where he formerly served as Chairperson of the Audit Committee, Dr. Johnson has also served as an officer or a board member of numerous companies for nearly 20 years. These positions included Co-Chairman and a founder of the Group of Seven Council, Director of NVR, Inc., Director of Evergreen Energy and Director of Greenwich Capital Holdings. He also has served as Vice Chairman of the Board of Governors of the Federal Reserve System and Assistant Secretary of the U.S. Treasury. In addition, Dr. Johnson also served as Chairman of the Financial Accounting Foundation, which oversees the Financial Accounting Standards Board, for seven years.
Mr. Kearns gained extensive experience regarding accounting through his experience on the Audit Committees of the boards of other funds in the Funds Complex, including serving as either Chairperson or Deputy Chairperson of the Audit Committee for fourteen years, and through his position as Chief Financial Officer of the J. Paul Getty Trust. He also has experience in financial, accounting, investment and regulatory matters through his position as President and founder of Kearns & Associates LLC, a financial consulting company. Mr. Kearns also serves as a director of Electro Rent Corporation and The Ford Family Foundation. The Board has determined that Mr. Kearns is an "audit committee financial expert" as defined by the SEC.
Through his prior positions as Managing Director of Morgan Stanley & Co. Inc. and Morgan Stanley Dean Witter Investment Management and as President of Morgan Stanley Institutional Funds, Mr. Klein has experience in the management and operation of registered investment companies, enabling him to provide management input and investment guidance to the Board. Mr. Klein also has extensive experience in the investment management industry based on his current positions as Managing Director of Aetos Capital, LLC and as director of certain investment funds managed or sponsored by Aetos Capital, LLC. In addition, he also has experience as a member of the board of other funds in the Fund Complex.
Mr. Nugent has extensive experience with financial, accounting, investment and regulatory matters through his almost 20 years of service on the boards of various funds in the Fund Complex, including time as the Chairperson of the Insurance Committee and Chairman of the Morgan Stanley Funds. Mr. Nugent also has experience as a General Partner in Triumph Capital, L.P.
Mr. Reed has experience on investment company boards and is experienced with financial, accounting, investment and regulatory matters through his service as a director of iShares Inc. and other funds in the Fund Complex. Mr. Reed also gained substantial experience in the financial services industry through his positions as Director of Legg Mason, Inc. and prior position as President and CEO of General Motors Asset Management.
Mr. Reid has served on a number of mutual fund boards, including as a trustee and director of certain investment companies in the JPMorgan Funds complex and as a Director or Trustee of other funds in the
35
Fund Complex. Therefore, Mr. Reid is experienced with financial, accounting, investment and regulatory matters, enabling him to provide management input and investment guidance to the Board.
Mr. Higgins has over 30 years of experience in the financial services industry. Mr. Higgins has substantial mutual fund experience and is experienced with financial, accounting, investment and regulatory matters due to his experience on the boards of other funds in the Fund Complex. Mr. Higgins also serves on the boards of other companies in the financial services industry, including AXA Financial, Inc. and The Equitable Life Assurance Society of the United States.
The Trustees' principal occupations during the past five years or more are shown in the above tables.
Advantages of Having Same Individuals as Trustees for the Morgan Stanley Funds. The Independent Trustees and the Fund's management believe that having the same Independent Trustees for each of the Morgan Stanley Funds avoids the duplication of effort that would arise from having different groups of individuals serving as Independent Trustees for each of the funds or even of sub-groups of funds. They believe that having the same individuals serve as Independent Trustees of all the Morgan Stanley Funds tends to increase their knowledge and expertise regarding matters which affect the Fund Complex generally and enhances their ability to negotiate on behalf of each fund with the fund's service providers. This arrangement also precludes the possibility of separate groups of Independent Trustees arriving at conflicting decisions regarding operations and management of the funds and avoids the cost and confusion that would likely ensue. Finally, having the same Independent Trustees serve on all fund boards enhances the ability of each fund to obtain, at modest cost to each separate fund, the services of Independent Trustees of the caliber, experience and business acumen of the individuals who serve as Independent Trustees of the Morgan Stanley Funds.
Trustee and Officer Indemnification. The Fund's Declaration of Trust provides that no Trustee, Officer, employee or agent of the Fund is liable to the Fund or to a shareholder, nor is any Trustee, Officer, employee or agent liable to any third persons in connection with the affairs of the Fund, except as such liability may arise from his/her or its own bad faith, willful misfeasance, gross negligence or reckless disregard of his/her or its duties. It also provides that all third persons shall look solely to Fund property for satisfaction of claims arising in connection with the affairs of the Fund. With the exceptions stated, the Declaration of Trust provides that a Trustee, Officer, employee or agent is entitled to be indemnified against all liability in connection with the affairs of the Fund.
Shareholder Communications. Shareholders may send communications to the Fund's Board of Trustees. Shareholders should send communications intended for the Fund's Board by addressing the communications directly to the Board (or individual Board members) and/or otherwise clearly indicating in the salutation that the communication is for the Board (or individual Board members) and by sending the communication to either the Fund's office or directly to such Board member(s) at the address specified for each Trustee previously noted. Other shareholder communications received by the Fund not directly addressed and sent to the Board will be reviewed and generally responded to by management, and will be forwarded to the Board only at management's discretion based on the matters contained therein.
C. Compensation
Each Trustee (except for the Chairperson of the Boards) receives an annual retainer fee of $210,000 for serving the Morgan Stanley Funds.
The Chairperson of the Audit Committee receives an additional annual retainer fee of $78,750 and the Investment Committee Chairperson receives an additional annual retainer fee of $63,000. Other Committee and, effective January 1, 2012, Sub-Committee Chairpersons receive an additional annual retainer fee of $31,500. Prior to January 1, 2012, each Sub-Committee Chairperson received an annual retainer fee of $15,750. The aggregate compensation paid to each Trustee is paid by the Morgan Stanley Funds, and is allocated on a pro rata basis among each of the operational funds/portfolios of the Morgan Stanley Funds based on the relative net assets of each of the funds/portfolios. Michael E. Nugent receives a total annual retainer fee of $420,000 for his services as Chairperson of the Boards of the Morgan Stanley Funds and for administrative services provided to each Board.
36
The Fund also reimburses such Trustees for travel and other out-of-pocket expenses incurred by them in connection with attending such meetings. Trustees of the Fund who are employed by the Adviser receive no compensation or expense reimbursement from the Fund for their services as Trustee.
Effective April 1, 2004, the Fund began a Deferred Compensation Plan (the "DC Plan"), which allows each Trustee to defer payment of all, or a portion, of the fees he or she receives for serving on the Board of Trustees throughout the year. Each eligible Trustee generally may elect to have the deferred amounts credited with a return equal to the total return on one or more of the Morgan Stanley Funds (or portfolios thereof) that are offered as investment options under the DC Plan. At the Trustee's election, distributions are either in one lump sum payment, or in the form of equal annual installments over a period of five years. The rights of an eligible Trustee and the beneficiaries to the amounts held under the DC Plan are unsecured and such amounts are subject to the claims of the creditors of the Fund.
Prior to April 1, 2004, certain Morgan Stanley Funds maintained a similar Deferred Compensation Plan (the "Prior DC Plan"), which also allowed each Independent Trustee to defer payment of all, or a portion, of the fees he or she received for serving on the Board of Trustees throughout the year. Generally, the DC Plan amends and supersedes the Prior DC Plan and all amounts payable under the Prior DC Plan are now subject to the terms of the DC Plan (except for amounts paid during the calendar year 2004, which remain subject to the terms of the Prior DC Plan).
The following table shows aggregate compensation payable to each of the Fund's Trustees from the Fund for the fiscal year ended September 30, 2011 and the aggregate compensation payable to each of the funds' Trustees by the Fund Complex (which includes all of the Retail Funds and Institutional Funds) for the calendar year ended December 31, 2011.
Compensation(1)
| Name of Independent Trustee: | Aggregate Compensation From the Fund(2) | Total Compensation From Fund and Fund Complex Paid to Trustee(3) | |||||||||
| Frank L. Bowman | $ | 402 | $ | 225,750 | |||||||
| Michael Bozic | 424 | 241,500 | |||||||||
| Kathleen A. Dennis | 402 | 225,750 | |||||||||
| Manuel H. Johnson | 480 | 273,000 | |||||||||
| Joseph J. Kearns(2) | 507 | 306,750 | |||||||||
| Michael F. Klein | 402 | 225,750 | |||||||||
| Michael E. Nugent | 738 | 420,000 | |||||||||
| W. Allen Reed(2) | 402 | 225,750 | |||||||||
| Fergus Reid | 424 | 259,500 | |||||||||
| Name of Interested Trustee: | |||||||||||
| James F. Higgins | 369 | 210,000 | |||||||||
(1) Includes all amounts paid for serving as director/trustee of the funds, as well as serving as Chairperson of the Boards or a Chairperson of a Committee or Sub-Committee.
(2) The amounts shown in this column represent the aggregate compensation before deferral with respect to the Fund's fiscal year. The following Trustees deferred compensation from the Fund during the fiscal year ended September 30, 2011: Mr. Kearns, $444 and Mr. Reed, $952.
(3) The amounts shown in this column represent the aggregate compensation paid by all of the funds in the Fund Complex as of December 31, 2011 before deferral by the Trustees under the DC Plan. As of December 31, 2011, the value (including interest) of the deferral accounts across the Fund Complex for Messrs. Kearns, Reed and Reid, pursuant to the deferred compensation plan was $532,157, $674,903 and $523,935, respectively. Because the funds in the Fund Complex have different fiscal year ends, the amounts shown in this column are presented on a calendar year basis.
Prior to December 31, 2003, 49 of the Morgan Stanley Funds (the "Adopting Funds"), including the Fund, had adopted a retirement program under which an Independent Trustee who retired after serving for at least five years as an Independent Trustee of any such fund (an "Eligible Trustee") would have been entitled to retirement payments, based on factors such as length of service, upon reaching the eligible retirement age. On December 31, 2003, the amount of accrued retirement benefits for each Eligible Trustee was frozen, and will be payable, together with a return of 8% per annum, at or following each such Eligible Trustee's retirement as shown in the table below.
37
The following table illustrates the retirement benefits accrued to the Fund's Independent Trustees by the Fund for the fiscal year ended September 30, 2011 and by the Adopting Funds for the calendar year ended December 31, 2011, and the estimated retirement benefits for the Independent Trustees from the Fund as of the fiscal year ended September 30, 2011 and from the Adopting Funds for each calendar year following retirement. Only the Trustees listed below participated in the retirement program.
| Name of Independent Trustee: | Retirement benefits accrued as fund expenses | Estimated annual benefits upon retirement(1) | |||||||||||||||||
| By the Fund | By all Adopting Funds | From the Fund | From all Adopting Funds | ||||||||||||||||
| Michael Bozic | $ | 911 | $ | 42,107 | $ | 967 | $ | 43,940 | |||||||||||
| Manuel H. Johnson | 676 | 30,210 | 1,420 | 64,338 | |||||||||||||||
| Michael E. Nugent | 151 | 6,805 | 1,269 | 57,539 | |||||||||||||||
(1) Total compensation accrued under the retirement plan, together with a return of 8% per annum, will be paid annually commencing upon retirement and continuing for the remainder of the Trustee's life.
IV. CONTROL PERSONS AND PRINCIPAL HOLDERS OF SECURITIES
The following owned beneficially or of record 5% or more of the outstanding Class A shares of the Fund as of December 30, 2011: Morgan Stanley & Co., Harborside Financial Center, 201 Plaza Two, 3rd Floor, Jersey City, NJ 07311 — 47.82%; Charles Scwab & Co Inc., Special Custody Account for Exclusive Benefit of Customers, 101 Montgomery St., San Francisco, CA 94104 — 12.21%; State Street Bank & Trust Company, FBO ADP/Morgan Stanley Alliance, 105 Rosemont Avenue, Westwood, MA 02090 — 9.99%. The following owned beneficially or of record 5% or more of the outstanding Class B shares of the Fund as of December 30, 2011: Morgan Stanley & Co., Harborside Financial Center, 201 Plaza Two, 3rd Floor, Jersey City, NJ 07311 — 56.13%; Merrill Lynch Pierce Fenner & Smith Inc., For the Sole Benefit of its Customers, 4800 Deer Lake Drive East, Jacksonville, FL 32246 — 7.04%. First Clearing, LLC, A/C 1699-0135, Special Custody Account for the Exclusive Benefit Customer, 2801 Market St., Saint Louis, MO 63103 — 8.80%. The following owned beneficially or of record 5% or more of the outstanding Class C shares of the Fund as of December 30, 2011: Morgan Stanley & Co., Harborside Financial Center, 201 Plaza Two, 3rd Floor, Jersey City, NJ 07311 — 57.89%; Citigroup Global Markets, Attn: Mutual Funds Department, Reconciliation & Accounts Control, 333 West 34th Street, 7th Floor, New York, NY 10001 — 10.99%; First Clearing, LLC, A/C 1699-0135, Special Custody Account for the Exclusive Benefit of Customer, 2801 Market St., Saint Louis, MO 63103 — 10.06%. The following owned beneficially or of record 5% or more of the outstanding Class I shares of the Fund as of December 30, 2011: Morgan Stanley & Co., Harborside Financial Center, 201 Plaza Two, 3rd Floor, Jersey City, NJ 07311 — 42.80%; State Street Bank & Trust Company, FBO ADP/Morgan Stanley Alliance, 105 Rosemont Avenue, Westwood, MA 02090 — 11.52%; First Clearing, LLC, A/C 1699-0135, Special Custody Account for the Exclusive Benefit of Customer, 2801 Market St., Saint Louis, MO 63103 — 10.50%; Pershing LLC, 1 Pershing Plaza, Jersey City, NJ 07399 — 6.86%; Citigroup Omnibus Account, FBO its Customers, 333 West 34th Street, New York, NY 10001-2402 — 7.28%. The percentage ownership of shares of the Fund changes from time to time depending on purchases and redemptions by shareholders and the total number of shares outstanding.
As of the date of this SAI, the aggregate number of shares of beneficial interest of the Fund owned by the Fund's officers and Trustees as a group was less than 1% of the Fund's shares of beneficial interest outstanding.
V. INVESTMENT ADVISORY AND OTHER SERVICES
A. Adviser and Administrator
The Adviser to the Fund is Morgan Stanley Investment Management Inc., a Delaware corporation, whose address is 522 Fifth Avenue, New York, NY 10036. The Adviser is a wholly-owned subsidiary of Morgan Stanley, a Delaware corporation. Morgan Stanley is a preeminent global financial services firm engaged in securities trading and brokerage activities, as well as providing investment banking, research and analysis, financing and financial advisory services.
38
Pursuant to an Investment Advisory Agreement (the "Investment Advisory Agreement") with the Adviser, the Fund has retained the Adviser to manage the investment of the Fund's assets, including the placing of orders for the purchase and sale of portfolio securities. The Fund pays the Adviser monthly compensation calculated daily by applying the following annual rates to the average daily net assets of the Fund determined as of the close of each business day: 0.42% to the portion of daily net assets not exceeding $500 million; and 0.395% to the portion of daily net assets exceeding $500 million. The investment advisory fee is allocated among the Classes pro rata based on the net assets of the Fund attributable to each Class.
Administration services are provided to the Fund by Morgan Stanley Services Company Inc. ("Administrator"), a wholly-owned subsidiary of the Adviser, pursuant to a separate administration agreement ("Administration Agreement") entered into by the Fund with the Administrator. The Fund pays the Administrator monthly compensation of 0.08% of daily net assets.
The following table shows for the Fund (i) the advisory fee paid; and (ii) the advisory fee waived and/or rebated from affiliated transactions for each of the past three fiscal years ended September 30, 2009, 2010 and 2011:
| Advisory Fees Paid (After Fee Waivers and/or Rebate from Affiliated Transactions) | Advisory Fees Waived | Rebate from Affiliated Transactions | |||||||||||||||||||||||||||||||||
| 2009 | 2010 | 2011 | 2009 | 2010 | 2011 | 2009 | 2010 | 2011 | |||||||||||||||||||||||||||
| $ | 875,810 | $ | 1,162,555 | $ | 1,634,945 | — | — | — | $ | 7,782 | $ | 10,438 | $ | 17,411 | |||||||||||||||||||||
For the fiscal years ended September 30, 2009, 2010 and 2011, the Fund paid compensation under its Administration Agreement as follows:
| Compensation Paid for the Fiscal Year Ended September 30, | |||||||||||||||
| 2009 | 2010 | 2011 | |||||||||||||
| $ | 168,303 | $ | 223,427 | $ | 314,734 | ||||||||||
Under a Sub-Administration Agreement between the Administrator and State Street Bank and Trust Company ("State Street"), State Street provides certain administrative services to the Fund. For such services, the Administrator pays State Street a portion of the fee the Administrator receives from the Fund.
B. Principal Underwriter
The Fund's principal underwriter is the Distributor (which has the same address as the Adviser). In this capacity, the Fund's shares are distributed by the Distributor. The Distributor has entered into a selected dealer agreement with Morgan Stanley Smith Barney and Morgan Stanley & Co, which through their own sales organizations sell shares of the Fund. In addition, the Distributor may enter into similar agreements with other selected broker-dealers. The Distributor, a Delaware corporation, is a wholly-owned subsidiary of Morgan Stanley.
The Distributor bears all expenses it may incur in providing services under the Distribution Agreement. These expenses include the payment of commissions for sales of the Fund's shares and incentive compensation to Financial Advisors, the cost of educational and/or business-related trips, and educational and/or promotional and business-related expenses. The Distributor also pays certain expenses in connection with the distribution of the Fund's shares, including the costs of preparing, printing and distributing advertising or promotional materials, and the costs of printing and distributing prospectuses and supplements thereto used in connection with the offering and sale of the Fund's shares. The Fund bears the costs of initial typesetting, printing and distribution of prospectuses and supplements thereto to shareholders. The Fund also bears the costs of registering the Fund and its shares under federal and state securities laws and pays filing fees in accordance with state securities laws.
The Fund and the Distributor have agreed to indemnify each other against certain liabilities, including liabilities under the Securities Act. Under the Distribution Agreement, the Distributor uses its best efforts in rendering services to the Fund, but in the absence of willful misfeasance, bad faith, gross negligence or reckless disregard of its obligations, the Distributor is not liable to the Fund or any of its shareholders for any error of judgment or mistake of law or for any act or omission or for any losses sustained by the Fund or its shareholders.
39
C. Services Provided by the Adviser and Administrator
The Adviser manages the investment of the Fund's assets, including the placing of orders for the purchase and sale of portfolio securities. The Adviser obtains and evaluates the information and advice relating to the economy, securities markets and specific securities as it considers necessary or useful to continuously manage the assets of the Fund in a manner consistent with its investment objective.
Under the terms of the Administration Agreement, the Administrator maintains certain of the Fund's books and records and furnishes, at its own expense, the office space, facilities, equipment, clerical help and bookkeeping as the Fund may reasonably require in the conduct of its business. The Administrator also assists in the preparation of prospectuses, proxy statements and reports required to be filed with federal and state securities commissions (except insofar as the participation or assistance of the independent registered public accounting firm and attorneys is, in the opinion of the Administrator, necessary or desirable). The Administrator also bears the cost of telephone service, heat, light, power and other utilities provided to the Fund.
Expenses not expressly assumed by the Adviser under the Investment Advisory Agreement or by the Administrator under the Administration Agreement or by the Distributor will be paid by the Fund. These expenses will be allocated among the four Classes of shares pro rata based on the net assets of the Fund attributable to each Class, except as described below. Such expenses include, but are not limited to: expenses of the Plan of Distribution and Shareholder Services Plan pursuant to Rule 12b-1; charges and expenses of any registrar, custodian, stock transfer and dividend disbursing agent; brokerage commissions; taxes; engraving and printing share certificates; registration costs of the Fund and its shares under federal and state securities laws; the cost and expense of printing, including typesetting, and distributing prospectuses of the Fund and supplements thereto to the Fund's shareholders; all expenses of shareholders' and Trustees' meetings and of preparing, printing and mailing of proxy statements and reports to shareholders; fees and travel expenses of Trustees or members of any advisory board or committee who are not employees of the Adviser or any corporate affiliate of the Adviser; all expenses incident to any dividend, withdrawal or redemption options; charges and expenses of any outside service used for pricing of the Fund's shares; fees and expenses of legal counsel, including counsel to the Trustees who are not interested persons of the Fund or of the Adviser (not including compensation or expenses of attorneys who are employees of the Adviser); fees and expenses of the Fund's independent registered public accounting firm; membership dues of industry associations; interest on Fund borrowings; postage; insurance premiums on property or personnel (including officers and Trustees) of the Fund which inure to its benefit; extraordinary expenses (including, but not limited to, legal claims and liabilities and litigation costs and any indemnification relating thereto); and all other costs of the Fund's operation. The 12b-1 fees relating to a particular Class will be allocated directly to that Class. In addition, other expenses associated with a particular Class (except advisory or custodial fees) may be allocated directly to that Class, provided that such expenses are reasonably identified as specifically attributable to that Class and the direct allocation to that Class is approved by the Trustees.
The Investment Advisory Agreement provides that in the absence of willful misfeasance, bad faith, gross negligence or reckless disregard of its obligations thereunder, the Adviser is not liable to the Fund or any of its investors for any act or omission by the Adviser or for any losses sustained by the Fund or its investors.
The Investment Advisory Agreement will remain in effect from year to year, provided continuance of the Investment Advisory Agreement is approved at least annually by the vote of the holders of a majority, as defined in the Investment Company Act, of the outstanding shares of the Fund, or by the Trustees; provided that in either event such continuance is approved annually by the vote of a majority of the Independent Trustees.
The Administration Agreement provides that in the absence of willful misfeasance, bad faith, gross negligence or reckless disregard of its obligations thereunder, the Administrator is not liable to the Fund or any of its investors for any act or omission by the Administrator or for any losses sustained by the Fund or its investors. The Administration Agreement will continue unless terminated by either party by written notice delivered to the other party within 30 days.
40
D. Dealer Reallowances
Upon notice to selected broker-dealers, the Distributor may reallow up to the full applicable front-end sales charge during periods specified in such notice. During periods when 90% or more of the sales charge is reallowed, such selected broker-dealers may be deemed to be underwriters as that term is defined in the Securities Act.
E. Rule 12b-1 Plan
The Fund has adopted a Plan of Distribution, effective July 31, 2011, in accordance with Rule 12b-1 under the Investment Company Act (the "Plan") pursuant to which each Class, other than Class I, pays the Distributor compensation accrued daily and payable monthly at the following maximum annual rates: 0.25%, 1.00% and 1.00% of the average daily net assets of Class A, Class B and Class C shares, respectively. Prior to July 31, 2011, in accordance with Rule 12b-1 under the Investment Company Act, the Fund had adopted a Plan of Distribution with respect to the Class A, Class B and Class C shares between the Fund and Morgan Stanley Distributors Inc. (the "Prior Distributor"), pursuant to which the Prior Distributor provided certain services in connection with the promotion and sale of the Fund's shares (the "Prior Plan").
The Distributor also receives the proceeds of front-end sales charges ("FSCs") and of contingent deferred sales charges ("CDSCs") imposed on certain redemptions of shares, which are separate and apart from payments made pursuant to the Plan. The Distributor and the Prior Distributor have informed the Fund that each of them and/or Morgan Stanley & Co. received the proceeds of CDSCs and FSCs, for the last three fiscal years ended September 30, as applicable, in approximate amounts as provided in the table below.
| 2011 | 2010 | 2009 | |||||||||||||||||||||||||
| Class A | FSCs:(1) | $ | 181,210 | FSCs:(1) | $ | 84,089 | FSCs:(1) | $ | 30,415 | ||||||||||||||||||
| CDSCs: | $ | 500 | CDSCs: | $ | 1,478 | CDSCs: | $ | 6,584 | |||||||||||||||||||
| Class B | CDSCs: | $ | 6,971 | CDSCs: | $ | 16,243 | CDSCs: | $ | 26,427 | ||||||||||||||||||
| Class C | CDSCs: | $ | 4,021 | CDSCs: | $ | 728 | CDSCs: | $ | 939 | ||||||||||||||||||
(1) FSCs apply to Class A only.
The entire fee payable by Class A and a portion of the fees payable by each of Class B and Class C each year pursuant to the Plan equal to 0.25% of such Class' average daily net assets are currently each characterized as a "service fee" under the Rules of the Financial Industry Regulatory Authority ("FINRA") (of which the Distributor is a member). The "service fee" is a payment made for personal service and/or the maintenance of shareholder accounts. The remaining portion of the Plan fees payable by a Class, if any, is characterized as an "asset-based sales charge" as such is defined by the Rules of FINRA.
Under the Plan and as required by Rule 12b-1, the Trustees receive and review promptly after the end of each calendar quarter a written report provided by the Distributor of the amounts expended under the Plan and the purpose for which such expenditures were made. For the fiscal year ended September 30, 2011, Class A, Class B and Class C shares of the Fund made payments under the Plan and the Prior Plan amounting to $877,075, $157,401 and $236,105, respectively, which amounts are equal to 0.25%, 1.00% and 1.00% of the average daily net assets of Class A, Class B and Class C, respectively, for the fiscal year.
The Plan was adopted in order to permit the implementation of the Fund's method of distribution. Under this distribution method the Fund offers four Classes, each with a different distribution arrangement.
With respect to Class A shares, the Distributor generally compensates authorized dealers, from proceeds of the FSC, commissions for the sale of Class A shares, currently a gross sales credit of up to 5.00% of the amount sold and an annual residual commission, currently a residual of up to 0.25% of the current value of the respective accounts for which they are dealers of record in all cases.
With respect to sales of Class B and Class C shares of the Fund, a commission or transaction fee generally will be compensated by the Distributor at the time of purchase directly out of the Distributor's assets (and not out of the Fund's assets) to authorized dealers who initiate and are responsible for such purchases computed based on a percentage of the dollar value of such shares sold of up to 4.00% on Class B shares and up to 1.00% on Class C shares.
41
Proceeds from any CDSC and any distribution fees on Class B and Class C shares of the Fund are paid to the Distributor and are used by the Distributor to defray its distribution related expenses in connection with the sale of the Fund's shares, such as the payment to authorized dealers for selling such shares. With respect to Class C shares, the authorized dealers generally receive from the Distributor ongoing distribution fees of up to 1.00% of the average daily net assets of the Fund's Class C shares annually commencing in the second year after purchase.
The distribution fee that the Distributor receives from the Fund under the Plan, in effect, offsets distribution expenses incurred under the Plan on behalf of the Fund and, in the case of Class B shares, opportunity costs, such as the gross sales credit and an assumed interest charge thereon ("carrying charge"). These expenses may include the cost of Fund-related educational and/or business-related trips or payment of Fund-related educational and/or promotional expenses of Financial Advisors. In the Distributor's reporting of the distribution expenses to the Fund, in the case of Class B shares, such assumed interest (computed at the "broker's call rate") has been calculated on the gross credit as it is reduced by amounts received by the Distributor under the Plan and any CDSCs received by the Distributor upon redemption of shares of the Fund. No other interest charge is included as a distribution expense in the Distributor's calculation of its distribution costs for this purpose. The broker's call rate is the interest rate charged to securities brokers on loans secured by exchange-listed securities.
The Fund may reimburse expenses incurred or to be incurred in promoting the distribution of the Fund's Class A, Class B and Class C shares and in servicing shareholder accounts. Reimbursement will be made through payments at the end of each month. The amount of each monthly payment may in no event exceed an amount equal to a payment at the annual rate of 0.25% in the case of Class A, and 1.00% in the case of Class B and Class C, of the average net assets of the respective Class during the month. No interest or other financing charges, if any, incurred on any distribution expenses on behalf of Class A, Class B and Class C will be reimbursable under the Plan.
Each Class paid 100% of the amounts accrued under the Plan and the Prior Plan with respect to that Class for the fiscal year ended September 30, 2011 to the Distributor and the Prior Distributor, respectively. It is estimated that the Distributor and the Prior Distributor spent this amount in approximately the following ways: (i) 0% ($0) — advertising and promotional expenses; (ii) 0% ($0) — printing and mailing of prospectuses for distribution to other than current shareholders; and (iii) 100% ($451,304) — other expenses, including the gross sales credit and the carrying charge, of which 84.99% ($383,541) represents carrying charges, 6.21% ($28,054) represents commission credits to Morgan Stanley Smith Barney and Morgan Stanley & Co. branch offices and other selected broker-dealers for payments of commissions to Financial Advisors and other authorized financial representatives, and 8.80% ($39,709) represents overhead and other branch office distribution-related expenses. The amounts accrued by Class A and a portion of the amounts accrued by Class C under the Plan and the Prior Plan during the fiscal year ended September 30, 2011 were service fees. The remainder of the amounts accrued by Class C were for expenses, which relate to compensation of sales personnel and associated overhead expenses.
In the case of Class B shares, at any given time, the expenses of distributing shares of the Fund may be more or less than the total of (i) the payments made by the Fund pursuant to the Plan; and (ii) the proceeds of CDSCs paid by investors upon redemption of shares. For example, if $1 million in expenses in distributing Class B shares of the Fund had been incurred and $750,000 had been received as described in (i) and (ii) above, the excess expense would amount to $250,000. The Distributor and the Prior Distributor have advised the Fund that in the case of Class B shares the excess distribution expenses, including the carrying charge designed to approximate the opportunity costs incurred by Morgan Stanley Smith Barney and Morgan Stanley & Co. which arise from their having advanced monies without having received the amount of any sales charges imposed at the time of sale of the Fund's Class B shares, totaled $31,190,249 as of September 30, 2011 (the end of the Fund's fiscal year), which was equal to approximately 301.70% of the net assets of Class B on such date. Because there is no requirement under the Plan or the Prior Plan that the Distributor or the Prior Distributor, respectively, be reimbursed for all distribution expenses with respect to Class B shares or any requirement that the Plan be continued from year to year, this excess amount does not constitute a liability of the Fund. Although there is no legal obligation for the Fund to pay expenses incurred in excess of payments made to the Distributor under the Plan and the proceeds of CDSCs paid by investors upon redemption of shares, if for any reason the
42
Plan is terminated, the Trustees will consider at that time the manner in which to treat such expenses. Any cumulative expenses incurred, but not yet recovered through distribution fees or CDSCs, may or may not be recovered through future distribution fees or CDSCs.
In the case of Class A and Class C shares, expenses incurred pursuant to the Plan in any calendar year in excess of 0.25% or 1.00% of the average daily net assets of Class A or Class C shares, respectively, will not be reimbursed by the Fund through payments in any subsequent year, except that expenses representing a gross sales commission credited to Morgan Stanley Smith Barney Financial Advisors and other authorized financial representatives at the time of sale may be reimbursed in the subsequent calendar year. The Distributor and the Prior Distributor have advised the Fund that there were no unreimbursed expenses representing a gross sales commission credited to Morgan Stanley Smith Barney Financial Advisors and other authorized financial representatives in the case of Class A and Class C at December 31, 2011 (the end of the calendar year). No interest or other financing charges will be incurred on any Class A or Class C distribution expenses incurred by the Distributor under the Plan or on any unreimbursed expenses due to the Distributor or the Prior Distributor, respectively, pursuant to the Plan or the Prior Plan, respectively.
No interested person of the Fund nor any Independent Trustee has any direct financial interest in the operation of the Plan except to the extent that the Distributor, the Adviser, Morgan Stanley & Co., Morgan Stanley Smith Barney, Morgan Stanley Services or certain of their employees may be deemed to have such an interest as a result of benefits derived from the successful operation of the Plan or as a result of receiving a portion of the amounts expended thereunder by the Fund.
On an annual basis, the Trustees, including a majority of the Independent Trustees, consider whether the Plan should be continued. Prior to approving the last continuation of the Plan, the Trustees requested and received from the Distributor and reviewed all the information which they deemed necessary to arrive at an informed determination. In making their determination to continue the Plan, the Trustees considered: (1) the Fund's experience under the Plan and whether such experience indicates that the Plan is operating as anticipated; (2) the benefits the Fund had obtained, was obtaining and would be likely to obtain under the Plan, including that: (a) the Plan is essential in order to give Fund investors a choice of alternatives for payment of distribution and service charges and to enable the Fund to continue to grow and avoid a pattern of net redemptions which, in turn, are essential for effective investment management; and (b) without the compensation to individual brokers and the reimbursement of distribution and account maintenance expenses of Morgan Stanley & Co. and Morgan Stanley Smith Barney branch offices made possible by the 12b-1 fees, Morgan Stanley & Co. and Morgan Stanley Smith Barney could not establish and maintain an effective system for distribution, servicing of Fund shareholders and maintenance of shareholder accounts; and (3) what services had been provided and were continuing to be provided under the Plan to the Fund and its shareholders. Based upon their review, the Trustees, including each of the Independent Trustees, determined that continuation of the Plan would be in the best interest of the Fund and would have a reasonable likelihood of continuing to benefit the Fund and its shareholders.
The Plan may not be amended to increase materially the amount to be spent for the services described therein without approval by the shareholders of the affected Class or Classes of the Fund, and all material amendments to the Plan must also be approved by the Trustees. The Plan may be terminated at any time, without payment of any penalty, by vote of a majority of the Independent Trustees or by a vote of a majority of the outstanding voting securities of the Fund (as defined in the Investment Company Act) on not more than 30 days' written notice to any other party to the Plan. So long as the Plan is in effect, the election and nomination of Independent Trustees shall be committed to the discretion of the Independent Trustees.
F. Other Service Providers
(1) Transfer Agent/Dividend Disbursing Agent
Morgan Stanley Services Company Inc., P.O. Box 219886, Kansas City, MO 64121-9804, is the Transfer Agent for the Fund's shares and the Dividend Disbursing Agent for payment of dividends and distributions on Fund shares and Agent for shareholders under various investment plans.
(2) Custodian and Independent Registered Public Accounting Firm
State Street Bank and Trust Company, One Lincoln Street, Boston, MA 02111, is the Custodian of the Fund's assets. Any of the Fund's cash balances with the Custodian in excess of $250,000 (a temporary
43
increase from $100,000, which is due to expire on December 31, 2013) are unprotected by federal deposit insurance. These balances may, at times, be substantial.
As of June 7, 2011, Ernst & Young LLP, located at 200 Clarendon Street, Boston, MA 02116-5072, is the independent registered public accounting firm of the Fund. Prior to June 7, 2011, Deloitte & Touche LLP, located at Two World Financial Center, New York, NY 10281, was the independent registered public accounting firm of the Fund. The Fund's independent registered public accounting firm is responsible for auditing the annual financial statements.
(3) Affiliated Persons
The Transfer Agent is an affiliate of the Adviser and the Distributor. As Transfer Agent and Dividend Disbursing Agent, the Transfer Agent's responsibilities include maintaining shareholder accounts, disbursing cash dividends and reinvesting dividends, processing account registration changes, handling purchase and redemption transactions, mailing prospectuses and reports, mailing and tabulating proxies, processing share certificate transactions, and maintaining shareholder records and lists. Pursuant to a Transfer Agency and Service Agreement, as consideration for the services it provides, the Transfer Agent receives certain fees from the Fund, which are approved by the Trustees, generally based on the number of shareholder accounts and is reimbursed for its out-of-pocket expenses in connection with such services. The Fund and the Transfer Agent may enter into agreements with unaffiliated third party intermediaries, pursuant to which such intermediaries agree to provide recordkeeping and other administrative services for their clients who invest in the Fund. In such instances, the Fund will pay certain fees to the intermediaries for the services they provide that otherwise would have been performed by the Transfer Agent.
G. Fund Management
Other Accounts Managed by the Portfolio Managers
Other Accounts Managed by Portfolio Managers at September 30, 2011 (unless otherwise indicated):
| Registered Investment Companies | Other Pooled Investment Vehicles | Other Accounts | |||||||||||||||||||||||||
| Portfolio Managers | Number of Accounts | Total Assets in the Accounts | Number of Accounts | Total Assets in the Accounts | Number of Accounts | Total Assets in the Accounts | |||||||||||||||||||||
| Dennis P. Lynch | 35 | $16.5 billion | 4 | $2.9 billion | 13 | $1.1 billion | |||||||||||||||||||||
| David S. Cohen | 35 | $16.5 billion | 4 | $2.9 billion | 13 | $1.1 billion | |||||||||||||||||||||
| Sam G. Chainani | 35 | $16.5 billion | 4 | $2.9 billion | 13 | $1.1 billion | |||||||||||||||||||||
| Alexander T. Norton | 35 | $16.5 billion | 4 | $2.9 billion | 13 | $1.1 billion | |||||||||||||||||||||
| Jason C. Yeung | 35 | $16.5 billion | 4 | $2.9 billion | 13 | $1.1 billion | |||||||||||||||||||||
| Armistead B. Nash | 35 | $16.5 billion | 4 | $2.9 billion | 13 | $1.1 billion | |||||||||||||||||||||
Because the portfolio managers may manage assets for other investment companies, pooled investment vehicles, and/or other accounts (including institutional clients, pension plans and certain high net worth individuals), there may be an incentive to favor one client over another resulting in conflicts of interest. For instance, the Adviser may receive fees from certain accounts that are higher than the fee it receives from the Fund, or it may receive a performance-based fee on certain accounts. In those instances, the portfolio managers may have an incentive to favor the higher and/or performance-based fee accounts over the Fund. In addition, a conflict of interest could exist to the extent the Adviser has proprietary investments in certain accounts, where portfolio managers have personal investments in certain accounts or when certain accounts are investment options in the Adviser's employee benefits and/or deferred compensation plans. The portfolio managers may have an incentive to favor these accounts over others. If the Adviser manages accounts that engage in short sales of securities of the type in which the Fund invests, the Adviser could be seen as harming the performance of the Fund for the benefit of the accounts engaging in short sales if the short sales cause the market value of the securities to fall. The Adviser has adopted trade allocation and other policies and procedures that it believes are reasonably designed to address these and other conflicts of interest.
Portfolio Manager Compensation Structure
Portfolio managers receive a combination of base compensation and discretionary compensation, comprising a cash bonus and several deferred compensation programs described below. The methodology used to determine portfolio manager compensation is applied across all funds/accounts managed by the portfolio manager.
44
Base salary compensation. Generally, portfolio managers receive base salary compensation based on the level of their position with the Adviser.
Discretionary compensation. In addition to base compensation, portfolio managers may receive discretionary compensation.
Discretionary compensation can include:
• Cash Bonus.
• Morgan Stanley's Long Term Incentive Compensation awards — a mandatory program that defers a portion of discretionary year-end compensation into restricted stock units or other awards based on Morgan Stanley common stock or other plans that are subject to vesting and other conditions. All long term incentive compensation awards are subject to clawback provisions where awards can be cancelled if an employee takes any action, or omits to take any action which; causes a restatement of Morgan Stanley's consolidated financial results; or constitutes a violation of Morgan Stanley's risk policies and standards.
• Investment Management Alignment Plan (IMAP) awards — a mandatory program that defers a portion of discretionary year-end compensation and notionally invests it in designated funds advised by the Adviser or its affiliates. The award is subject to vesting and other conditions. Portfolio managers must notionally invest a minimum of 25% to a maximum of 100% of their IMAP deferral account into a combination of the designated funds they manage that are included in the IMAP fund menu, which may or may not include the Fund. In addition to the clawbacks listed above for long term incentive compensation awards, the provision on IMAP awards is further strengthened such that it may also be triggered if an employee's actions cause substantial financial loss on a trading strategy, investment, commitment or other holding provided that previous gains on those positions were relevant to the employees' prior year compensation decisions.
• Voluntary Deferred Compensation Plans — voluntary programs that permit certain employees to elect to defer a portion of their discretionary year-end compensation and notionally invest the deferred amount across a range of designated investment funds, which may include funds advised by the Adviser or its affiliates.
Several factors determine discretionary compensation, which can vary by portfolio management team and circumstances. These factors include:
• Revenues generated by the investment companies, pooled investment vehicles and other accounts managed by the portfolio manager.
• The investment performance of the funds/accounts managed by the portfolio manager.
• Contribution to the business objectives of the Adviser.
• The dollar amount of assets managed by the portfolio manager.
• Market compensation survey research by independent third parties.
• Other qualitative factors, such as contributions to client objectives.
• Performance of Morgan Stanley and Morgan Stanley Investment Management, and the overall performance of the investment team(s) of which the portfolio manager is a member.
Securities Ownership of Portfolio Managers
As of September 30, 2011, the dollar range of securities beneficially owned by each portfolio manager in the Fund is shown below:
| Dennis P. Lynch: | None(1) | ||||||
| David S. Cohen: | None(1) | ||||||
| Sam G. Chainani: | None(1) | ||||||
| Alexander T. Norton: | None(1) | ||||||
| Jason C. Yeung: | None(1) | ||||||
| Armistead B. Nash: | None(1) | ||||||
(1) Not included in the table above, the portfolio manager has made investments in one or more mutual funds managed by the same portfolio management team pursuant to a similar strategy.
45
H. Codes of Ethics
The Fund, the Adviser and the Distributor have each adopted a Code of Ethics pursuant to Rule 17j-1 under the Investment Company Act. The Codes of Ethics are designed to detect and prevent improper personal trading. The Codes of Ethics permit personnel subject to the Codes to invest in securities, including securities that may be purchased, sold or held by the Fund, subject to a number of restrictions and controls, including prohibitions against purchases of securities in an initial public offering and a preclearance requirement with respect to personal securities transactions.
I. Proxy Voting Policy and Proxy Voting Record
The Board of Trustees believes that the voting of proxies on securities held by the Fund is an important element of the overall investment process. As such, the Trustees have delegated the responsibility to vote such proxies to MSIM.
A copy of MSIM's Proxy Voting Policy ("Proxy Policy") is attached hereto as Appendix A. In addition, a copy of the Proxy Policy, as well as the Fund's most recent proxy voting record for the 12-month period ended June 30, as filed with the SEC, are available without charge on our web site at www.morganstanley.com/im. The Fund's proxy voting record is also available without charge on the SEC's web site at www.sec.gov.
J. Revenue Sharing
The Adviser and/or Distributor may pay compensation, out of their own funds and not as an expense of the Fund, to Morgan Stanley Smith Barney, Citigroup Global Markets Inc. ("CGM") and certain unaffiliated brokers, dealers or other financial intermediaries, including recordkeepers and administrators of various deferred compensation plans ("Intermediaries"), in connection with the sale, distribution, marketing and retention of Fund shares and/or shareholder servicing. For example, the Adviser or the Distributor may pay additional compensation to Intermediaries for, among other things, promoting the sale and distribution of Fund shares, providing access to various programs, mutual fund platforms or preferred or recommended mutual fund lists that may be offered by an Intermediary, granting the Distributor access to the Intermediary's financial advisors and consultants, providing assistance in the ongoing education and training of an Intermediary's financial personnel, furnishing marketing support, maintaining share balances and/or for sub-accounting, recordkeeping, administrative, shareholder or transaction processing services. Such payments are in addition to any distribution fees, shareholder service fees and/or transfer agency fees that may be payable by the Fund. The additional payments may be based on various factors, including level of sales (based on gross or net sales or some specified minimum sales or some other similar criteria related to sales of the Fund and/or some or all other Morgan Stanley Funds), amount of assets invested by the Intermediary's customers (which could include current or aged assets of the Fund and/or some or all other Morgan Stanley Funds), a Fund's advisory fees, some other agreed upon amount, or other measures as determined from time to time by the Adviser and/or Distributor. The amount of these payments may be different for different Intermediaries.
With respect to Morgan Stanley Smith Barney and CGM, these payments currently include the following amounts, which are paid in accordance with the applicable compensation structure:
(1) On $1 million or more of Class A shares (for which no sales charge was paid) or net asset value purchases by certain employee benefit plans, Morgan Stanley Smith Barney and CGM, as applicable, receive a gross sales credit of up to 1.00% of the amount sold.*
(2) On Class A, Class B, Class C and Class I shares of the Fund held in traditional brokerage accounts where Morgan Stanley Smith Barney or CGM is designated by purchasers as broker-dealer of record an ongoing annual fee in an amount up to 0.13% of the total average quarterly net asset value of such shares.
* Commissions or transaction fees paid when Morgan Stanley Smith Barney, CGM or other Intermediaries initiate and are responsible for purchases of $1 million or more are computed on a percentage of the dollar value of such shares sold as follows: 1.00% on sales of $1 million to $2 million, plus 0.75% on the next $1 million, plus 0.50% on the next $2 million, plus 0.25% on the excess over $5 million.
46
(3) On Class I shares of the Fund held in traditional brokerage accounts where Morgan Stanley Smith Barney is designated by purchasers as broker-dealer of record, in addition to the amounts referenced in paragraph (2) above:
• A gross sales credit of 0.25% of the amount sold and an ongoing annual fee in an amount up to 0.10% of the total average quarterly net asset value of such shares; or
• An ongoing annual fee in an amount up to 35% of the advisory fee the Adviser receives based on the average daily net assets of such shares.
There is a chargeback of 100% of the gross sales credit amount paid if the Class I shares are redeemed in the first year and a chargeback of 50% of the gross sales credit amount paid if the shares are redeemed in the second year.
(4) On Class A and Class I shares of the Fund held in taxable accounts through any fee-based advisory program offered by the Morgan Stanley channel of Morgan Stanley Smith Barney, an ongoing annual fee in an amount up to 0.08% of the total average monthly net asset value of such shares.
(5) On any shares of the Fund held in an account through certain 401(k) platforms in the Morgan Stanley channel of Morgan Stanley Smith Barney's Corporate Retirement Solutions, an ongoing annual fee in an amount up to 0.20% of the total average monthly net asset value of such shares.
With respect to other Intermediaries, these payments currently include the following amounts, which are paid in accordance with the applicable compensation structure for each Intermediary:
(1) On $1 million or more of Class A shares (for which no sales charge was paid) or net asset value purchases by certain employee benefit plans, Intermediaries receive a gross sales credit of up to 1.00% of the amount sold.*
(2) On Class A, Class B and Class C shares of the Fund held in Intermediary accounts other than those held through Intermediary 401(k) platforms, an ongoing annual fee in an amount up to 0.10% of the total average monthly net asset value of such shares.
(3) On Class I shares of the Fund held in Intermediary accounts other than those held through Intermediary 401(k) platforms:
• A gross sales credit of 0.25% of the amount sold; and
• An ongoing annual fee in an amount up to 0.10% of the total average monthly net asset value of such shares.
There is a chargeback of 100% of the gross sales credit amount paid if the Class I shares are redeemed in the first year and a chargeback of 50% of the gross sales credit amount paid if the shares are redeemed in the second year.
The prospect of receiving, or the receipt of, additional compensation, as described above, by Intermediaries may provide such Intermediaries, and/or their financial advisors or other salespersons, with an incentive to favor sales of shares of the Fund over other investment options with respect to which an Intermediary does not receive additional compensation (or receives lower levels of additional compensation). These payment arrangements, however, will not change the price that an investor pays for shares of the Fund or the amount that the Fund receives to invest on behalf of an investor. Investors may wish to take such payment arrangements into account when considering and evaluating any recommendations relating to Fund shares and should review carefully any disclosure provided by Intermediaries as to their compensation.
* Commissions or transaction fees paid when Morgan Stanley Smith Barney, CGM or other Intermediaries initiate and are responsible for purchases of $1 million or more are computed on a percentage of the dollar value of such shares sold as follows: 1.00% on sales of $1 million to $2 million, plus 0.75% on the next $1 million, plus 0.50% on the next $2 million, plus 0.25% on the excess over $5 million.
47
VI. BROKERAGE ALLOCATION AND OTHER PRACTICES
A. Brokerage Transactions
Subject to the general supervision of the Trustees, the Adviser is responsible for decisions to buy and sell securities for the Fund, the selection of brokers and dealers to effect the transactions, and the negotiation of brokerage commissions, if any. Purchases and sales of securities on a stock exchange are effected through brokers who charge a commission for their services. In the over-the-counter ("OTC") market, securities are generally traded on a "net" basis with dealers acting as principal for their own accounts without a stated commission, although the price of the security usually includes a profit to the dealer. The Fund also expects that securities will be purchased at times in underwritten offerings where the price includes a fixed amount of compensation, generally referred to as the underwriter's concession or discount. Options and futures transactions will usually be effected through a broker and a commission will be charged. On occasion, the Fund may also purchase certain money market instruments directly from an issuer, in which case no commissions or discounts are paid.
During the fiscal years ended September 30, 2009, 2010 and 2011, the Fund paid a total of $181,712, $224,058 and $258,431, respectively, in brokerage commissions.
B. Commissions
Pursuant to an order issued by the SEC, the Fund is permitted to engage in principal transactions involving money market instruments, subject to certain conditions, with Morgan Stanley & Co., a broker-dealer affiliated with the Fund's Adviser.
During the fiscal years ended September 30, 2009, 2010 and 2011, the Fund did not effect any principal transactions with Morgan Stanley & Co.
Brokerage transactions in securities listed on exchanges or admitted to unlisted trading privileges may be effected through Morgan Stanley & Co., Citigroup, Inc. and other affiliated brokers and dealers. In order for an affiliated broker or dealer to effect any portfolio transactions on an exchange for the Fund, the commissions, fees or other remuneration received by the affiliated broker or dealer must be reasonable and fair compared to the commissions, fees or other remuneration paid to other brokers in connection with comparable transactions involving similar securities being purchased or sold on an exchange during a comparable period of time. This standard would allow the affiliated broker or dealer to receive no more than the remuneration which would be expected to be received by an unaffiliated broker in a commensurate arm's-length transaction. Furthermore, the Trustees, including the Independent Trustees, have adopted procedures which are reasonably designed to provide that any commissions, fees or other remuneration paid to an affiliated broker or dealer are consistent with the foregoing standard. The Fund does not reduce the management fee it pays to the Adviser by any amount of the brokerage commissions it may pay to an affiliated broker or dealer.
During the fiscal years ended September 30, 2009, 2010 and 2011, the Fund paid a total of $8,342, $1,175 and $1,704, respectively, in brokerage commissions to Morgan Stanley & Co. During the fiscal year ended September 30, 2011, the brokerage commissions paid to Morgan Stanley & Co. represented approximately 0.66% of the total brokerage commissions paid by the Fund during the year and were paid on account of transactions having an aggregate dollar value equal to approximately 1.40% of the aggregate dollar value of all portfolio transactions of the Fund during the year for which commissions were paid.
For the period June 1, 2009 to September 30, 2009 and during the fiscal years ended September 30, 2010 and 2011, the Fund paid a total of $3,062, $2,432 and $2,026, respectively, in brokerage commissions to Citigroup, Inc. During the fiscal year ended September 30, 2011, the brokerage commissions paid to Citigroup, Inc. represented approximately 0.78% of the total brokerage commissions paid by the Fund during the period and were paid on account of transactions having an aggregate dollar value equal to approximately 0.51% of the aggregate dollar value of all portfolio transactions of the Fund during the period for which commissions were paid.
C. Brokerage Selection
The policy of the Fund regarding purchases and sales of securities for its portfolio is that primary consideration will be given to obtaining the most favorable prices and efficient executions of transactions.
48
The Adviser is prohibited from directing brokerage transactions on the basis of the referral of clients or the sale of shares of investment companies for which it acts as investment adviser. Consistent with this policy, when securities transactions are effected on a stock exchange, the Fund's policy is to pay commissions which are considered fair and reasonable without necessarily determining that the lowest possible commissions are paid in all circumstances. The Fund believes that a requirement always to seek the lowest possible commission cost could impede effective portfolio management and preclude the Fund and the Adviser from obtaining a high quality of brokerage and research services. The Fund anticipates that certain of its transactions involving foreign securities will be effected on foreign securities exchanges. Fixed commissions on such transactions are generally higher than negotiated commissions on domestic transactions. There is also generally less government supervision and regulation of foreign securities exchanges and brokers than in the United States.
In seeking to implement the Fund's policies, the Adviser effects transactions with those broker-dealers that the Adviser believes provide prompt execution of orders in an effective manner at the most favorable prices. The Adviser may place portfolio transactions with those broker-dealers that also furnish research and other services to the Fund or the Adviser. Services provided may include certain research services (as described below) as well as effecting securities transactions and performing functions incidental thereto (such as clearance settlement and custody).
The Adviser and its affiliated investment advisers have established commission sharing arrangements under a commission management program (the "Commission Management Program" or "CMP"), pursuant to which execution and research costs or a portion of those costs are decoupled in accordance with applicable laws, rules and regulations. Under the CMP, the Adviser and its affiliated investment advisers select approved equity brokers (which include the Adviser's affiliates) for execution services, and after accumulation of commissions at such brokers, the Adviser and/or its affiliates instruct these approved equity brokers to pay for eligible research provided by executing brokers or third-party research providers, which are selected independently by a Research Services Committee of the Adviser and its affiliated investment advisers. Generally, the Adviser and its affiliated investment advisers will direct the approved equity broker to record research credits based upon a previously agreed-upon allocation and will periodically instruct the approved equity broker to direct specified dollar amounts from that pool to pay for eligible research services provided by third-party research providers and executing brokers. The research credits are pooled among the Adviser and its affiliated investment advisers and allocated from this pool. Likewise, the research services obtained under the CMP are shared among the Adviser and its affiliated investment advisers.
Selection of approved equity brokers for execution is based on three main criteria: access to liquidity, provision of capital and quality of execution. Under the CMP, each approved equity broker is responsible for the payment of fees for research services and obtains the research services pursuant to written agreements between the approved equity broker and the third-party research provider.
For those costs not decoupled, but retained by broker-dealers, the Adviser also effects transactions with brokers which directly pay for research services provided by those brokers in accordance with Section 28(e) of the Exchange Act. Such transactions include equity transactions and may include fixed-income transactions effected on an agency basis.
Transactions involving client accounts managed by two or more affiliated investment advisers may be aggregated and executed using the services of broker-dealers that provide third party benefits/research so long as: (i) all client accounts involved in the transaction benefit from one or more of the services offered by such broker-dealer; and (ii) each affiliated investment adviser has approved the use of such broker-dealer and the services provided thereby.
The research services received include those of the nature described above and other services which aid the Adviser in fulfilling its investment decision-making responsibilities, including (a) furnishing advice as to the value of securities, the advisability of investing in, purchasing or selling securities, and the availability of securities or purchasers or sellers of securities; and (b) furnishing analyses and reports concerning issuers, industries, securities, economic factors and trends, portfolio strategy, and the performance of accounts. Where a particular item has both research and non-research related uses (such as proxy services where both research services and services relating to the administration of the proxy itself are provided), the Adviser will make a reasonable allocation of the cost of the item between research and non-research uses and will only pay for the portion of the cost allocated to research uses with client brokerage
49
transactions. Research services furnished or paid for by brokers through whom the Adviser effects transactions for a particular account may be used by the Adviser or its affiliated investment advisers in servicing their other accounts, and not all such services may be used for the benefit of the client which pays the brokerage commission that results in the receipt of such research services. Commissions paid to brokers providing research services may be higher than those charged by brokers not providing services.
The Adviser and its affiliated investment advisers make a good faith determination of the value of research services in accordance with Section 28(e) of the Exchange Act, UK Financial Services Authority Rules and other relevant regulatory requirements.
Certain investment professionals and other employees of the Adviser are also officers of affiliated investment advisers and may provide investment advisory services to clients of such affiliated investment advisers. The Adviser's personnel also provide research and trading support to personnel of certain affiliated investment advisers. Research related costs may be shared by affiliated investment advisers and may benefit the clients of such affiliated investment advisers. Research services that benefit the Adviser may be received in connection with commissions generated by clients of its affiliated investment advisers. Similarly, research services received in connection with commissions generated by the Adviser's clients may benefit affiliated investment advisers and their clients. Moreover, research services provided by broker-dealers through which the Adviser effects transactions for a particular account may be used by the Adviser and/or an affiliated investment adviser in servicing its other accounts and not all such research services may be used for the benefit of the particular client, which pays the brokerage commission giving rise to the receipt of such research services.
The Adviser and certain of its affiliates currently serve as investment adviser to a number of clients, including other investment companies, and may in the future act as investment adviser to others. It is the practice of the Adviser and its affiliates to cause purchase and sale transactions to be allocated among clients whose assets they manage (including the Fund) in such manner as it deems equitable. In making such allocations among the Fund and other client accounts, various factors may be considered, including the respective investment objectives, the relative size of portfolio holdings of the same or comparable securities, the availability of cash for investment, the size of investment commitments generally held and the opinions of the persons responsible for managing the portfolios of the Fund and other client accounts. The Adviser and its affiliates may operate one or more order placement facilities and each facility will implement order allocation in accordance with the procedures described above. From time to time, each facility may transact in a security at the same time as other facilities are trading in that security.
D. Regular Broker-Dealers
During the fiscal year ended September 30, 2011, the Fund did not purchase any securities issued by issuers who were among the ten brokers or ten dealers which executed transactions for or with the Fund in the largest dollar amounts during the period. At September 30, 2011, the Fund did not own any securities issued by any of such issuers.
VII. CAPITAL STOCK AND OTHER SECURITIES
The shareholders of the Fund are entitled to a full vote for each full share of beneficial interest held. The Fund is authorized to issue an unlimited number of shares of beneficial interest. All shares of beneficial interest of the Fund are of $0.01 par value and are equal as to earnings, assets and voting privileges except that each Class will have exclusive voting privileges with respect to matters relating to distribution expenses borne solely by such Class or any other matter in which the interests of one Class differ from the interests of any other Class. In addition, Class B shareholders will have the right to vote on any proposed material increase in Class A's expenses, if such proposal is submitted separately to Class A shareholders. Also, Class A, Class B and Class C bear expenses related to the distribution of their respective shares.
The Fund's Declaration of Trust permits the Trustees to authorize the creation of additional series of shares (the proceeds of which would be invested in separate, independently managed portfolios) and additional Classes of shares within any series. The Trustees have not presently authorized any such additional series or Classes of shares other than as set forth in the Prospectus.
The Fund is not required to hold annual meetings of shareholders and in ordinary circumstances the Fund does not intend to hold such meetings. The Trustees may call special meetings of shareholders for
50
action by shareholder vote as may be required by the Investment Company Act or the Declaration of Trust. Under certain circumstances, the Trustees may be removed by the actions of the Trustees. In addition, under certain circumstances, the shareholders may call a meeting to remove the Trustees and the Fund is required to provide assistance in communicating with shareholders about such a meeting. The voting rights of shareholders are not cumulative, so that holders of more than 50% of the shares voting can, if they choose, elect all Trustees being selected, while the holders of the remaining shares would be unable to elect any Trustees.
Under Massachusetts law, shareholders of a business trust may, under certain limited circumstances, be held personally liable as partners for the obligations of the Fund. However, the Declaration of Trust contains an express disclaimer of shareholder liability for acts or obligations of the Fund, requires that notice of such Fund obligations include such disclaimer, and provides for indemnification out of the Fund's property for any shareholder held personally liable for the obligations of the Fund. Thus, the risk of a shareholder incurring financial loss on account of shareholder liability is limited to circumstances in which the Fund itself would be unable to meet its obligations. Given the above limitations on shareholder personal liability, and the nature of the Fund's assets and operations, the possibility of the Fund being unable to meet its obligations is remote and thus, in the opinion of Massachusetts counsel to the Fund, the risk to Fund shareholders of personal liability is remote.
The Trustees themselves have the power to alter the number and the terms of office of the Trustees (as provided for in the Declaration of Trust), and they may at any time lengthen or shorten their own terms or make their terms of unlimited duration and appoint their own successors, provided that always at least a majority of the Trustees has been elected by the shareholders of the Fund.
VIII. PURCHASE, REDEMPTION AND PRICING OF SHARES
A. Purchase/Redemption of Shares
Effective at the close of business on March 31, 2011, the Fund suspended offering its shares to new investors, except as follows. The Fund continues to offer its shares (1) through certain retirement plan accounts, (2) to clients of certain registered investment advisers who currently offer shares of the Fund in their asset allocation programs, (3) to directors and trustees of the Morgan Stanley Funds, (4) to Morgan Stanley affiliates and their employees and (5) to benefit plans sponsored by Morgan Stanley and its affiliates. The Fund continues to offer its shares to existing shareholders and, as market conditions permit, may recommence offering its shares to other new investors in the future. Any such offerings of the Fund's shares may be limited in amount and may commence and terminate without any prior notice.
Information concerning how Fund shares are offered to the public (and how they are redeemed and exchanged) is provided in the Fund's Prospectus.
Suspension of Redemptions. Redemptions are not made on days during which the NYSE is closed. The right of redemption may be suspended and the payment therefore may be postponed for more than seven days during any period when (a) the NYSE is closed for other than customary weekends or holidays; (b) the SEC determines trading on the NYSE is restricted; (c) the SEC determines an emergency exists as a result of which disposal by the Fund of securities owned by it is not reasonably practicable or it is not reasonably practicable for the Fund to fairly determine the value of its net assets; or (d) the SEC, by order, so permits.
Transfer Agent as Agent. With respect to the redemption or repurchase of Fund shares, the application of proceeds to the purchase of new shares in the Fund or any other Morgan Stanley Funds and the general administration of the exchange privilege, the Transfer Agent acts as agent for the Distributor and for the shareholder's authorized broker-dealer, if any, in the performance of such functions. With respect to exchanges, redemptions or repurchases, the Transfer Agent is liable for its own negligence and not for the default or negligence of its correspondents or for losses in transit. The Fund is not liable for any default or negligence of the Transfer Agent, the Distributor or any authorized broker-dealer.
The Distributor and any authorized broker-dealer have appointed the Transfer Agent to act as their agent in connection with the application of proceeds of any redemption of Fund shares to the purchase of shares of any other Morgan Stanley Fund and the general administration of the exchange privilege. No
51
commission or discounts will be paid to the Distributor or any authorized broker-dealer for any transaction pursuant to the exchange privilege.
Transfers of Shares. In the event a shareholder requests a transfer of Fund shares to a new registration, the shares will be transferred without sales charge at the time of transfer. With regard to the status of shares which are either subject to the CDSC or free of such charge (and with regard to the length of time shares subject to the charge have been held), any transfer involving less than all of the shares in an account will be made on a pro rata basis (that is, by transferring shares in the same proportion that the transferred shares bear to the total shares in the account immediately prior to the transfer). The transferred shares will continue to be subject to any applicable CDSC as if they had not been so transferred.
Outside Brokerage Accounts/Limited Portability. Most Fund shareholders hold their shares with Morgan Stanley Smith Barney. Please note that your ability to transfer your Fund shares to a brokerage account at another securities dealer may be limited. Fund shares may only be transferred to accounts held at securities dealers or financial intermediaries that have entered into agreements with the Distributor. After a transfer, you may purchase additional shares of the Morgan Stanley Fund(s) you owned before the transfer and, in most instances, you will also be able to purchase shares of most other Morgan Stanley Funds. If you transfer shares of a fund that is not a Multi-Class Fund (for example, a Money Market Fund) you will not be able to exchange shares of that fund for any other Morgan Stanley Fund after the transfer.
If you wish to transfer Fund shares to a securities dealer or other financial intermediary that has not entered into an agreement with the Distributor, you may request that the securities dealer or financial intermediary maintain the shares in an account at the Transfer Agent registered in the name of such securities dealer or financial intermediary for your benefit. You may also hold your Fund shares in your own name directly with the Transfer Agent. In either case, you will continue to have the ability to purchase additional Morgan Stanley Funds and will have full exchange privileges. Other options may also be available; please check with the respective securities dealer or financial intermediary. If you choose not to hold your shares with the Transfer Agent, either directly or through a securities dealer or other financial intermediary, you must redeem your shares and pay any applicable CDSC.
B. Offering Price
The Fund's Class B, Class C and Class I shares are offered at net asset value per share and the Class A shares are offered at net asset value per share plus any applicable FSC which is distributed among the Fund's Distributor, Morgan Stanley Smith Barney and other authorized dealers as described in Section "V. Investment Advisory and Other Services — E. Rule 12b-1 Plan." The price of Fund shares, called "net asset value," is based on the value of the Fund's portfolio securities. Net asset value per share of each Class is calculated by dividing the value of the portion of the Fund's securities and other assets attributable to that Class, less the liabilities attributable to that Class, by the number of shares of that Class outstanding. The assets of each Class of shares are invested in a single portfolio. The net asset value of each Class, however, will differ because the Classes have different ongoing fees.
In the calculation of the Fund's net asset value: (1) an equity portfolio security listed or traded on the NYSE or other exchange is valued at its latest sale price, prior to the time when assets are valued; if there were no sales that day, the security is valued at the mean between the last reported bid and asked price; (2) an equity portfolio security listed or traded on the Nasdaq is valued at the Nasdaq Official Closing Price; if there were no sales that day, the security is valued at the mean between the last reported bid and asked price; and (3) all other portfolio securities for which OTC market quotations are readily available are valued at the mean between the last reported bid and asked price. In cases where a security is traded on more than one exchange, the security is valued on the exchange designated as the primary market. For equity securities traded on foreign exchanges, the closing price or the latest bid price may be used if there were no sales on a particular day. When market quotations are not readily available, including circumstances under which it is determined by the Adviser that the sale price, the bid price or the mean between the last reported bid and asked price are not reflective of a security's market value, portfolio securities are valued at their fair value as determined in good faith under procedures established by and under the general supervision of the Fund's Trustees. For valuation purposes, quotations of foreign portfolio securities, other assets and liabilities and forward contracts stated in foreign currency are translated into U.S. dollar equivalents at the prevailing market rates prior to the close of the NYSE.
52
Short-term debt securities with remaining maturities of 60 days or less at the time of purchase are valued at amortized cost, unless the Trustees determine such price does not reflect the securities' market value, in which case these securities will be valued at their fair value as determined by the Trustees.
Certain of the Fund's portfolio securities may be valued by an outside pricing service approved by the Fund's Trustees. The pricing service may utilize a matrix system incorporating security quality, maturity and coupon as the evaluation model parameters, and/or research evaluations by its staff, including review of broker-dealer market price quotations in determining what it believes is the fair valuation of the portfolio securities valued by such pricing service.
Generally, trading in foreign securities, as well as corporate bonds, U.S. government securities and money market instruments, is substantially completed each day at various times prior to the close of the NYSE. The values of such securities used in computing the net asset value of the Fund's shares are determined as of such times. Foreign currency exchange rates are also generally determined prior to the close of the NYSE. Occasionally, events which may affect the values of such securities and such exchange rates may occur between the times at which they are determined and the close of the NYSE and will therefore not be reflected in the computation of the Fund's net asset value. If events that may affect the value of such securities occur during such period, then these securities may be valued at their fair value as determined in good faith under procedures established by and under the supervision of the Trustees.
IX. TAXATION OF THE FUND AND SHAREHOLDERS
The Fund generally will make two basic types of distributions: ordinary dividends and long-term capital gain distributions. These two types of distributions are reported differently on a shareholder's income tax return. The tax treatment of the investment activities of the Fund will affect the amount, timing and character of the distributions made by the Fund. The following discussion is only a summary of certain tax considerations generally affecting the Fund and shareholders of the Fund and is not intended as a substitute for careful tax planning. Tax issues relating to the Fund are not generally a consideration for shareholders such as tax-exempt entities and tax-advantaged retirement vehicles such as an IRA or 401(k) plan. Shareholders are urged to consult their own tax professionals regarding specific questions as to federal, state or local taxes.
Investment Company Taxation. The Fund intends to continue to qualify as a regulated investment company under Subchapter M of the Code. As such, the Fund will not be subject to federal income tax on its net investment income and capital gains, if any, to the extent that it timely distributes such income and capital gains to its shareholders. If the Fund fails to qualify for any taxable year as a regulated investment company, all of its taxable income will be subject to tax at regular corporate income tax rates without any deduction for distributions to shareholders, and such distributions generally will be taxable to shareholders as ordinary dividends to the extent of the Fund's current and accumulated earnings and profits.
The Fund generally intends to distribute sufficient income and gains so that the Fund will not pay corporate income tax on its earnings. The Fund also generally intends to distribute to its shareholders in each calendar year a sufficient amount of ordinary income and capital gains to avoid the imposition of a 4% excise tax. However, the Fund may instead determine to retain all or part of any income or net long-term capital gains in any year for reinvestment. In such event, the Fund will pay federal income tax (and possibly excise tax) on such retained income or gains.
Gains or losses on sales of securities by the Fund will generally be long-term capital gains or losses if the securities have a tax holding period of more than one year at the time of such sale. Gains or losses on the sale of securities with a tax holding period of one year or less will be short-term capital gains or losses. Special tax rules may change the normal treatment of gains and losses recognized by the Fund when the Fund invests in forward foreign currency exchange contracts, options, futures transactions and non-U.S. corporations classified as "passive foreign investment companies." Those special tax rules can, among other things, affect the treatment of capital gain or loss as long-term or short-term and may result in ordinary income or loss rather than capital gain or loss. The application of these special rules would therefore also affect the character of distributions made by the Fund.
53
The Fund may make investments in which it recognizes income or gain prior to receiving cash with respect to such investment. For example, under certain tax rules, the Fund may be required to accrue a portion of any discount at which certain securities are purchased as income each year even though the Fund receives no payments in cash on the security during the year. To the extent that the Fund makes such investments, it generally would be required to pay out such income or gain as a distribution in each year to avoid taxation at the Fund level. Such distributions will be made from the available cash of the Fund or by liquidation of portfolio securities if necessary. If a distribution of cash necessitates the liquidation of portfolio securities, the Adviser will select which securities to sell. The Fund may realize a gain or loss from such sales. In the event the Fund realizes net capital gains from such transactions, its shareholders may receive a larger capital gain distribution, if any, than they would in the absence of such transactions.
Taxation of Dividends and Distributions. Shareholders normally will be subject to federal income taxes, and any state and/or local income taxes, on the dividends and other distributions they receive from the Fund. Such dividends and distributions, to the extent that they are derived from net investment income or short-term capital gains, are generally taxable to the shareholder as ordinary income regardless of whether the shareholder receives such payments in additional shares or in cash. Under current law (through 2012), if certain holding period requirements are met with respect to your shares, a portion of the income dividends received by a shareholder may be taxed at the same rate as long-term capital gains. However, even if income received in the form of income dividends is taxed at the same rates as long-term capital gains, such income will not be considered long-term capital gains for other federal income tax purposes. For example, you generally will not be permitted to offset income dividends with capital losses. Short-term capital gain distributions will continue to be taxed at ordinary income rates.
Distributions of net long-term capital gains, if any, are taxable to shareholders as long-term capital gains regardless of how long a shareholder has held the Fund's shares and regardless of whether the distribution is received in additional shares or in cash. Under current law, the maximum tax rate on long-term capital gains available to non-corporate shareholders generally is 15%. Without future congressional action, the maximum tax rate on long-term capital gains will return to 20% in 2013, and all dividends will be taxed at ordinary income rates.
Shareholders are generally taxed on any income dividend or capital gain distributions from the Fund in the year they are actually distributed. However, if any such dividends or distributions are declared in October, November or December and paid to shareholders of record of such month in January then such amounts will be treated for tax purposes as received by the shareholders on December 31.
Subject to certain exceptions, a corporate shareholder may be eligible for a 70% dividends received deduction to the extent that the Fund earns and distributes qualifying dividends from its investments. Distributions of net capital gains by the Fund will not be eligible for the dividends received deduction.
Shareholders who are not citizens or residents of the United States and certain foreign entities may be subject to withholding of U.S. tax on distributions made by the Fund of investment income and short-term capital gains. The Fund is not required to withhold any amounts with respect to distributions to foreign shareholders that are properly designated by the Fund as "interest-related dividends" or "short-term capital gain dividends," provided that the income would not be subject to federal income tax if earned directly by the foreign shareholder. However, the Fund may withhold on some of these amounts regardless of the fact that it is not required to do so. Any amounts withheld from payments made to a shareholder may be refunded or credited against the shareholder's U.S. federal income tax liability, if any, provided that the required information is furnished to the U.S. Internal Revenue Service ("IRS"). The provisions discussed above relating to distributions to foreign persons generally would apply to distributions with respect to taxable years of regulated investment companies beginning before January 1, 2012 (or a later date if extended by the U.S. Congress). Prospective investors are urged to consult their tax advisors regarding the specific tax consequences discussed above.
The Fund will be required to withhold U.S. federal withholding taxes (at 30%) from certain "withholdable payments" made to a non-U.S. shareholder (other than a individual) after 2013, unless the Non-U.S. shareholder complies with certain U.S. tax reporting (and, in some cases, withholding) requirements (generally relating to the entity's U.S. owners or account holders, if any) or otherwise qualifies for an exemption from
54
such withholding. Withholdable payments generally will include interest (including original issue discount), dividends, rents, annuities, and other fixed or determinable annual or periodical gains, profits or income, if such payments are derived from U.S. sources, as well as gross proceeds from dispositions of securities that could produce U.S. source interest or dividends. Income which is effectively connected with the conduct of a U.S. trade or business is not, however, included in this definition.
After the end of each calendar year, shareholders will be sent information on their dividends and capital gain distributions for tax purposes, including the portion taxable as ordinary income, the portion taxable as long-term capital gains, and the amount of any dividends eligible for the federal dividends received deduction for corporations.
Purchases and Redemptions and Exchanges of Fund Shares. Any dividend or capital gains distribution received by a shareholder from any investment company will have the effect of reducing the net asset value of the shareholder's stock in that company by the exact amount of the dividend or capital gains distribution. Furthermore, such dividends and capital gains distributions are subject to federal income taxes. If the net asset value of the shares should be reduced below a shareholder's cost as a result of the payment of dividends or the distribution of realized long-term capital gains, such payment or distribution would be in part a return of the shareholder's investment but nonetheless would be taxable to the shareholder. Therefore, an investor should consider the tax implications of purchasing Fund shares immediately prior to a distribution record date.
Shareholders normally will be subject to federal income taxes, and state and/or local income taxes, on the sale or disposition of Fund shares. In general, a sale of shares results in capital gain or loss, and for individual shareholders, is taxable at a federal rate dependent upon the length of time the shares were held. A redemption of a shareholder's Fund shares is normally treated as a sale for tax purposes. Fund shares held for a period of one year or less at the time of such sale or redemption will, for tax purposes, generally result in short-term capital gains or losses and those held for more than one year will generally result in long-term capital gains or losses. Under current law, the maximum tax rate on long-term capital gains available to non-corporate shareholders generally is 15%. Without future congressional action, the maximum tax rate on long-term capital gains will return to 20% in 2013. Any loss realized by shareholders upon a sale or redemption of shares within six months of the date of their purchase will be treated as a long-term capital loss to the extent of any distributions of net long-term capital gains with respect to such shares during the six-month period.
Gain or loss on the sale or redemption of shares in the Fund is measured by the difference between the amount of cash received (or the fair market value of any property received) and the adjusted tax basis of the shares. Shareholders should keep records of investments made (including shares acquired through reinvestment of dividends and distributions) so they can compute the tax basis of their shares. Under certain circumstances, a shareholder may compute and use an average cost basis in determining the gain or loss on the sale or redemption of shares.
Due to recent legislation, the Fund (or its administrative agent) is required to report to the IRS and furnish to Fund shareholders the cost basis information for sale transactions of shares purchased on or after January 1, 2012. Shareholders may elect to have one of several cost basis methods applied to their account when calculating the cost basis of shares sold, including average cost, FIFO ("first-in, first-out"), or some other specific identification method. Unless you instruct otherwise, the Fund will use average cost as its default cost basis method, and will treat sales as first coming from shares purchased prior to January 1, 2012. If average cost is used for the first sale of Fund shares covered by these new rules, the shareholder may only use an alternative cost basis method for shares purchased prospectively. Fund shareholders should consult with their tax advisors to determine the best cost basis method for their tax situation.
Exchanges of Fund shares for shares of another fund, including shares of other Morgan Stanley Funds, are also subject to similar tax treatment. Such an exchange is treated for tax purposes as a sale of the original shares in the Fund, followed by the purchase of shares in the other fund.
The ability to deduct capital losses may be limited. In addition, if a shareholder realizes a loss on the redemption or exchange of a fund's shares and receives securities that are considered substantially
55
identical to that fund's shares or reinvests in that fund's shares or substantially identical shares within 30 days before or after the redemption or exchange, the transactions may be subject to the "wash sale" rules, resulting in a postponement of the recognition of such loss for tax purposes.
X. UNDERWRITERS
The Fund's shares are offered to the public on a continuous basis. The Distributor, as the principal underwriter of the shares, has certain obligations under the Distribution Agreement concerning the distribution of the shares. These obligations and the compensation the Distributor receives are described above in the sections titled "Principal Underwriter" and "Rule 12b-1 Plan."
XI. PERFORMANCE DATA
Average annual returns assuming deduction of maximum sales charge
Period Ended September 30, 2011
| Class | Inception Date | 1 Year | 5 Years | 10 Years | Life of Fund | ||||||||||||||||||
| Class A | 07/28/97 | –4.43 | % | 4.65 | % | 8.35 | % | 6.43 | % | ||||||||||||||
| Class B | 04/29/83 | –4.89 | % | 4.67 | % | 8.27 | %* | 7.83 | %* | ||||||||||||||
| Class C | 07/28/97 | –0.89 | % | 5.00 | % | 8.12 | % | 6.04 | % | ||||||||||||||
| Class I | 07/28/97 | 1.12 | % | 6.05 | % | 9.18 | % | 7.08 | % | ||||||||||||||
Average annual returns assuming NO deduction of sales charge
Period Ended September 30, 2011
| Class | Inception Date | 1 Year | 5 Years | 10 Years | Life of Fund | ||||||||||||||||||
| Class A | 07/28/97 | 0.86 | % | 5.79 | % | 8.94 | % | 6.84 | % | ||||||||||||||
| Class B | 04/29/83 | 0.11 | % | 5.00 | % | 8.27 | %* | 7.83 | %* | ||||||||||||||
| Class C | 07/28/97 | 0.11 | % | 5.00 | % | 8.12 | % | 6.04 | % | ||||||||||||||
| Class I | 07/28/97 | 1.12 | % | 6.05 | % | 9.18 | % | 7.08 | % | ||||||||||||||
Aggregate total returns assuming NO deduction of sales charge
Period Ended September 30, 2011
| Class | Inception Date | 1 Year | 5 Years | 10 Years | Life of Fund | ||||||||||||||||||
| Class A | 07/28/97 | 0.86 | % | 32.50 | % | 135.37 | % | 155.40 | % | ||||||||||||||
| Class B | 04/29/83 | 0.11 | % | 27.61 | % | 121.29 | %* | 751.20 | %* | ||||||||||||||
| Class C | 07/28/97 | 0.11 | % | 27.64 | % | 118.32 | % | 129.62 | % | ||||||||||||||
| Class I | 07/28/97 | 1.12 | % | 34.12 | % | 140.74 | % | 163.70 | % | ||||||||||||||
Average annual after-tax returns assuming deduction of maximum sales charge
Class B
Period Ended September 30, 2011
| Calculation Methodology | Inception Date | 1 Year | 5 Years | 10 Years | Life of Fund | ||||||||||||||||||
| After taxes on distributions | 04/29/83 | –4.89 | % | 4.11 | % | 7.98 | %* | 6.81 | %* | ||||||||||||||
| After taxes on distributions and redemptions | 04/29/83 | –3.18 | % | 3.90 | % | 7.28 | %* | 6.60 | %* | ||||||||||||||
* Effective April 2005, Class B shares will generally convert to Class A shares approximately eight years after the end of the calendar month in which the shares were purchased. Performance for periods greater than eight years reflect this conversion (beginning April 2005).
56
XII. FINANCIAL STATEMENTS
The Fund's audited financial statements for the fiscal year ended September 30, 2011, including notes thereto, and the report of Ernst & Young LLP, an independent registered public accounting firm, are herein incorporated by reference to the Fund's Annual Report to Shareholders. A copy of the Fund's Annual Report to Shareholders must accompany the delivery of this SAI.
On June 7, 2011, Deloitte & Touche LLP was dismissed as the independent registered public accounting firm of the Fund. The Fund, with the approval of its Board of Trustees and its Audit Committee, engaged Ernst & Young LLP as its new independent registered public accounting firm as of June 7, 2011.
XIII. FUND COUNSEL
Dechert LLP, located at 1095 Avenue of the Americas, New York, NY 10036, acts as the Fund's legal counsel.
*****
This SAI and the Prospectus do not contain all of the information set forth in the Registration Statement the Fund has filed with the SEC. The complete Registration Statement may be obtained from the SEC.
57
MORGAN STANLEY INVESTMENT MANAGEMENT
PROXY VOTING POLICY AND PROCEDURES
I. POLICY STATEMENT
Morgan Stanley Investment Management's ("MSIM") policy and procedures for voting proxies ("Policy") with respect to securities held in the accounts of clients applies to those MSIM entities that provide discretionary investment management services and for which an MSIM entity has authority to vote proxies. This Policy is reviewed and updated as necessary to address new and evolving proxy voting issues and standards.
The MSIM entities covered by this Policy currently include the following: Morgan Stanley AIP GP LP, Morgan Stanley Investment Management Inc., Morgan Stanley Investment Management Limited, Morgan Stanley Investment Management Company, Morgan Stanley Asset & Investment Trust Management Co., Limited, Morgan Stanley Investment Management Private Limited and Private Investment Partners Inc. (each an "MSIM Affiliate" and collectively referred to as the "MSIM Affiliates" or as "we" below).
Each MSIM Affiliate will use its best efforts to vote proxies as part of its authority to manage, acquire and dispose of account assets. With respect to the MSIM registered management investment companies (the "MSIM Funds"), each MSIM Affiliate will vote proxies under this Policy pursuant to authority granted under its applicable investment advisory agreement or, in the absence of such authority, as authorized by the Board of Directors/Trustees of the MSIM Funds. A MSIM Affiliate will not vote proxies unless the investment management or investment advisory agreement explicitly authorizes the MSIM Affiliate to vote proxies. MSIM Affiliates will vote proxies in a prudent and diligent manner and in the best interests of clients, including beneficiaries of and participants in a client's benefit plan(s) for which the MSIM Affiliates manage assets, consistent with the objective of maximizing long-term investment returns ("Client Proxy Standard"). In certain situations, a client or its fiduciary may provide an MSIM Affiliate with a proxy voting policy. In these situations, the MSIM Affiliate will comply with the client's policy.
Proxy Research Services — ISS Governance Services ("ISS") and Glass Lewis (together with other proxy research providers as we may retain from time to time, the "Research Providers") are independent advisers that specialize in providing a variety of fiduciary-level proxy-related services to institutional investment managers, plan sponsors, custodians, consultants, and other institutional investors. The services provided include in-depth research, global issuer analysis, and voting recommendations. While we may review and utilize the recommendations of one or more Research Providers in making proxy voting decisions, we are in no way obligated to follow such recommendations. In addition to research, ISS provides vote execution, reporting, and recordkeeping services.
Voting Proxies for Certain Non-U.S. Companies — Voting proxies of companies located in some jurisdictions may involve several problems that can restrict or prevent the ability to vote such proxies or entail significant costs. These problems include, but are not limited to: (i) proxy statements and ballots being written in a language other than English; (ii) untimely and/or inadequate notice of shareholder meetings; (iii) restrictions on the ability of holders outside the issuer's jurisdiction of organization to exercise votes; (iv) requirements to vote proxies in person; (v) the imposition of restrictions on the sale of the securities for a period of time in proximity to the shareholder meeting; and (vi) requirements to provide local agents with power of attorney to facilitate our voting instructions. As a result, we vote clients' non-U.S. proxies on a best efforts basis only, after weighing the costs and benefits of voting such proxies, consistent with the Client Proxy Standard. ISS has been retained to provide assistance in connection with voting non-U.S. proxies.
II. GENERAL PROXY VOTING GUIDELINES
To promotes consistency in voting proxies on behalf of its clients, we follow this Policy (subject to any exception set forth herein). The Policy addresses a broad range of issues, and provides general voting parameters on proposals that arise most frequently. However, details of specific proposals vary, and those details affect particular voting decisions, as do factors specific to a given company. Pursuant to the procedures set forth herein, we may vote in a manner that is not in accordance with the following
A-1
general guidelines, provided the vote is approved by the Proxy Review Committee (see Section III for description) and is consistent with the Client Proxy Standard. Morgan Stanley AIP GP LP will follow the procedures as described in Appendix A.
We endeavor to integrate governance and proxy voting policy with investment goals, using the vote to encourage portfolio companies to enhance long-term shareholder value and to provide a high standard of transparency such that equity markets can value corporate assets appropriately.
We seek to follow the Client Proxy Standard for each client. At times, this may result in split votes, for example when different clients have varying economic interests in the outcome of a particular voting matter (such as a case in which varied ownership interests in two companies involved in a merger result in different stakes in the outcome). We also may split votes at times based on differing views of portfolio managers.
We may abstain on matters for which disclosure is inadequate.
A. Routine Matters.
We generally support routine management proposals. The following are examples of routine management proposals:
• Approval of financial statements and auditor reports if delivered with an unqualified auditor's opinion.
• General updating/corrective amendments to the charter, articles of association or bylaws, unless we believe that such amendments would diminish shareholder rights.
• Most proposals related to the conduct of the annual meeting, with the following exceptions. We generally oppose proposals that relate to "the transaction of such other business which may come before the meeting," and open-ended requests for adjournment. However, where management specifically states the reason for requesting an adjournment and the requested adjournment would facilitate passage of a proposal that would otherwise be supported under this Policy (i.e. an uncontested corporate transaction), the adjournment request will be supported.
We generally support shareholder proposals advocating confidential voting procedures and independent tabulation of voting results.
B. Board of Directors.
1. Election of directors: Votes on board nominees can involve balancing a variety of considerations. In vote decisions, we may take into consideration whether the company has a majority voting policy in place that we believe makes the director vote more meaningful. In the absence of a proxy contest, we generally support the board's nominees for director except as follows:
a. We consider withholding support from or voting against a nominee if we believe a direct conflict exists between the interests of the nominee and the public shareholders, including failure to meet fiduciary standards of care and/or loyalty. We may oppose directors where we conclude that actions of directors are unlawful, unethical or negligent. We consider opposing individual board members or an entire slate if we believe the board is entrenched and/or dealing inadequately with performance problems; if we believe the board is acting with insufficient independence between the board and management; or if we believe the board has not been sufficiently forthcoming with information on key governance or other material matters.
b. We consider witholding support from or voting against interested directors if the company's board does not meet market standards for director independence, or if otherwise we believe board independence is insufficient. We refer to prevalent market standards as promulgated by a stock exchange or other authority within a given market (e.g., New York Stock Exchange or Nasdaq rules for most U.S. companies, and The Combined Code on Corporate Governance in the United Kingdom). Thus, for an NYSE company with no controlling shareholder, we would expect that at a minimum a majority of directors should be independent as defined by NYSE. Where we view market standards as inadequate, we may withhold votes based on
A-2
stronger independence standards. Market standards notwithstanding, we generally do not view long board tenure alone as a basis to classify a director as non-independent.
i. At a company with a shareholder or group that controls the company by virtue of a majority economic interest in the company, we have a reduced expectation for board independence, although we believe the presence of independent directors can be helpful, particularly in staffing the audit committee, and at times we may withhold support from or vote against a nominee on the view the board or its committees are not sufficiently independent. In markets where board independence is not the norm (e.g. Japan), however, we consider factors including whether a board of a controlled company includes independent members who can be expected to look out for interests of minority holders.
ii. We consider withholding support from or voting against a nominee if he or she is affiliated with a major shareholder that has representation on a board disproportionate to its economic interest.
c. Depending on market standards, we consider withholding support from or voting against a nominee who is interested and who is standing for election as a member of the company's compensation/renumeration, nominating/governance or audit committee.
d. We consider withholding support or voting against nominees if the term for which they are nominated is excessive. We consider this issue on a market-specific basis.
e. We consider withholding support from or voting against nominees if, in our view, there has been insufficient board renewal (turnover0, particularly in the context of extended poor company performance.
f. We consider withholding support from or voting against a nominee standing for election if the board has not taken action to implement generally accepted governance practices for which there is a "bright line" test. For example, in the context of the U.S. market, failure to eliminate a dead hand or slow hand poison pill would be seen as a basis for opposing one or more incumbent nominees.
g. In markets that encourage designated audit committee financial experts, we consider voting against members of an audit committee if no members are designated as such. We also may not support the audit committee members if the company has faced financial reporting issues and/or does not put the auditor up for ratification by shareholders.
h. We believe investors should have the ability to vote on individual nominees, and may abstain or vote against a slate of nominees where we are not given the opportunity to vote on individual nominees.
i. We consider withholding support from or voting against a nominee who has failed to attend at least 75% of the nominee's board and board committee meetings within a given year without a reasonable excuse. We also consider opposing nominees if the company does not meet market standards for disclosure on attendance.
j. We consider withholding support from or voting against a nominee who appears overcommitted, particularly through service on an excessive number of boards. Market expectations are incorporated into this analysis; for U.S. boards, we generally oppose election of a nominee who serves on more than six public company boards (excluding investment companies), although we may reference National Association of Corporate Directors guidance suggesting that public company CEOs, for example, should serve no more than two outside boards given the level of time commitment required in their primary job.
2. Discharge of directors' duties: In markets where an annual discharge of directors' responsibility is a routine agenda item, we generally support such discharge. However, we may vote against discharge or abstain from voting where there are serious findings of fraud or other unethical behavior for which the individual bears responsibility. The annual discharge of responsibility represents shareholder approval of disclosed actions taken by the board during the year and may make future shareholder action against the board difficult to pursue.
A-3
3. Board independence: We generally support U.S. shareholder proposals requiring that a certain percentage (up to 66 2/3%) of the company's board members be independent directors, and promoting all-independent audit, compensation and nominating/governance committees.
4. Board diversity: We consider on a case-by-case basis shareholder proposals urging diversity of board membership with respect to social, religious or ethnic group.
5. Majority voting: We generally support proposals requesting or requiring majority voting policies in election of directors, so long as there is a carve-out for plurality voting in the case of contested elections.
6. Proxy access: We consider on a case-by-case basis shareholder proposals on particular procedures for inclusion of shareholder nominees in company proxy statements.
7. Reimbursement for dissident nominees: We generally support well-crafted U.S. shareholder proposals that would provide for reimbursement of dissident nominees elected to a board, as the cost to shareholders in electing such nominees can be factored into the voting decision on those nominees.
8. Proposals to elect directors more frequently: In the U.S. public company context, we usually support shareholder and management proposals to elect all directors annually (to "declassify" the board), although we make an exception to this policy where we believe that long-term shareholder value may be harmed by this change given particular circumstances at the company at the time of the vote on such proposal. As indicated above, outside the U.S., we generally support greater accountability to shareholders that comes through more frequent director elections, but recognize that many markets embrace longer term lengths, sometimes for valid reasons given other aspects of the legal context in electing boards.
9. Cumulative voting: We generally support proposals to eliminate cumulative voting in the U.S. market context. (Cumulative voting provides that shareholders may concentrate their votes for one or a handful of candidates, a system that can enable a minority bloc to place representation on a board.) U.S. proposals to establish cumulative voting in the election of directors generally will not be supported.
10. Separation of Chairman and CEO positions: We vote on shareholder proposals to separate the Chairman and CEO positions and/or to appoint an independent Chairman based in part on prevailing practice in particular markets, since the context for such a practice varies. In many non-U.S. markets, we view separation of the roles as a market standard practice, and support division of the roles in that context. In the U.S., we consider such proposals on a case-by-case basis, considering, among other things, the existing board leadership structure, company performance, and any other evidence of entrenchment or perceived risk that power is overly concentrated in a single individual.
11. Director retirement age and term limits: Proposals setting or recommending director retirement ages or director term limits are voted on a case-by-case basis that includes consideration of company performance, the rate of board renewal, evidence of effective individual director evaluation processes, and any indications of entrenchment.
12. Proposals to limit directors' liability and/or broaden indemnification of officers and directors. Generally, we will support such proposals provided that an individual is eligible only if he or she has not acted in bad faith, with gross negligence or with reckless disregard of their duties.
C. Statutory auditor boards.
The statutory auditor board, which is separate from the main board of directors, plays a role in corporate governance in several markets. These boards are elected by shareholders to provide assurance on compliance with legal and accounting standards and the company's articles of association. We generally vote for statutory auditor nominees if they meet independence standards. In markets that require disclosure on attendance by internal statutory auditors, however, we consider voting against nominees for these
A-4
positions who failed to attend at least 75% of meetings in the previous year. We also consider opposing nominees if the company does not meet market standards for disclosure on attendance.
D. Corporate transactions and proxy fights.
We examine proposals relating to mergers, acquisitions and other special corporate transactions (i.e., takeovers, spin-offs, sales of assets, reorganizations, restructurings and recapitalizations) on a case-by-case basis in the interests of each fund or other account. Proposals for mergers or other significant transactions that are friendly and approved by the Research Providers usually are supported if there is no portfolio manager objection. We also analyze proxy contests on a case-by-case basis.
E. Changes in capital structure.
1. We generally support the following:
• Management and shareholder proposals aimed at eliminating unequal voting rights, assuming fair economic treatment of classes of shares we hold.
• U.S. management proposals to increase the authorization of existing classes of common stock (or securities convertible into common stock) if: (i) a clear business purpose is stated that we can support and the number of shares requested is reasonable in relation to the purpose for which authorization is requested; and/or (ii) the authorization does not exceed 100% of shares currently authorized and at least 30% of the total new authorization will be outstanding. (We consider proposals that do not meet these criteria on a case-by-case basis.)
• U.S. management proposals to create a new class of preferred stock or for issuances of preferred stock up to 50% of issued capital, unless we have concerns about use of the authority for anti-takeover purposes.
• Proposals in non-U.S. markets that in our view appropriately limit potential dilution of existing shareholders. A major consideration is whether existing shareholders would have preemptive rights for any issuance under a proposal for standing share issuance authority. We generally consider market-specific guidance in making these decisions; for example, in the U.K. market, we usually follow Association of British Insurers' ("ABI") guidance, although company-specific factors may be considered and for example, may sometimes lead us to voting against share authorization proposals even if they meet ABI guidance.
• Management proposals to authorize share repurchase plans, except in some cases in which we believe there are insufficient protections against use of an authorization for anti-takeover purposes.
• Management proposals to reduce the number of authorized shares of common or preferred stock, or to eliminate classes of preferred stock.
• Management proposals to effect stock splits.
• Management proposals to effect reverse stock splits if management proportionately reduces the authorized share amount set forth in the corporate charter. Reverse stock splits that do not adjust proportionately to the authorized share amount generally will be approved if the resulting increase in authorized shares coincides with the proxy guidelines set forth above for common stock increases.
• Management dividend payout proposals, except where we perceive company payouts to shareholders as inadequate.
2. We generally oppose the following (notwithstanding management support):
• Proposals to add classes of stock that would substantially dilute the voting interests of existing shareholders.
• Proposals to increase the authorized or issued number of shares of existing classes of stock that are unreasonably dilutive, particularly if there are no preemptive rights for existing shareholders.
A-5
However, depending on market practices, we consider voting for proposals giving general authorization for issuance of shares not subject to pre-emptive rights if the authority is limited.
• Proposals that authorize share issuance at a discount to market rates, except where authority for such issuance is de minimis, or if there is a special situation that we believe justifies such authorization (as may be the case, for example, at a company under severe stress and risk of bankruptcy).
• Proposals relating to changes in capitalization by 100% or more.
We consider on a case-by-case basis shareholder proposals to increase dividend payout ratios, in light of market practice and perceived market weaknesses, as well as individual company payout history and current circumstances. For example, currently we perceive low payouts to shareholders as a concern at some Japanese companies, but may deem a low payout ratio as appropriate for a growth company making good use of its cash, notwithstanding the broader market concern.
F. Takeover Defenses and Shareholder Rights.
1. Shareholder rights plans: We generally support proposals to require shareholder approval or ratification of shareholder rights plans (poison pills). In voting on rights plans or similar takeover defenses, we consider on a case-by-case basis whether the company has demonstrated a need for the defense in the context of promoting long-term share value; whether provisions of the defense are in line with generally accepted governance principles in the market (and specifically the presence of an adequate qualified offer provision that would exempt offers meeting certain conditions from the pill); and the specific context if the proposal is made in the midst of a takeover bid or contest for control.
2. Supermajority voting requirements: We generally oppose requirements for supermajority votes to amend the charter or bylaws, unless the provisions protect minority shareholders where there is a large shareholder. In line with this view, in the absence of a large shareholder we support reasonable shareholder proposals to limit such supermajority voting requirements.
3. Shareholder rights to call meetings: We consider proposals to enhance shareholder rights to call meetings on a case-by-case basis. At large-cap U.S. companies, we generally support efforts to establish the rights of holders of 10% or more of shares to call special meetings, unless the board or state law has a set policy or law establishing such rights at a threshold that we believe to be acceptable.
4. Written consent rights: In the U.S. context, we examine proposals for shareholder written consent rights on a case-by-case basis.
5. Reincorporation: We consider management and shareholder proposals to reincorporate to a different jurisdiction on a case-by-case basis. We oppose such proposals if we believe the main purpose is to take advantage of laws or judicial precedents that reduce shareholder rights.
6. Anti-greenmail provisions: Proposals relating to the adoption of anti-greenmail provisions will be supported, provided that the proposal: (i) defines greenmail; (ii) prohibits buyback offers to large block holders (holders of at least 1% of the outstanding shares and in certain cases, a greater amount) not made to all shareholders or not approved by disinterested shareholders; and (iii) contains no anti-takeover measures or other provisions restricting the rights of shareholders.
7. Bundled proposals: We may consider opposing or abstaining on proposals if disparate issues are "bundled" and presented for a single vote.
G. Auditors.
We generally support management proposals for selection or ratification of independent auditors. However, we may consider opposing such proposals with reference to incumbent audit firms if the company has suffered from serious accounting irregularities and we believe rotation of the audit firm is appropriate, or if fees paid to the auditor for non-audit-related services are excessive. Generally, to determine if non-audit fees are excessive, a 50% test will be applied (i.e., non-audit-related fees should be
A-6
less than 50% of the total fees paid to the auditor). We generally vote against proposals to indemnify auditors.
H. Executive and Director Remuneration.
1. We generally support the following:
• Proposals for employee equity compensation plans and other employee ownership plans, provided that our research does not indicate that approval of the plan would be against shareholder interest. Such approval may be against shareholder interest if it authorizes excessive dilution and shareholder cost, particularly in the context of high usage ("run rate") of equity compensation in the recent past; or if there are objectionable plan design and provision.
• Proposals relating to fees to outside directors, provided the amounts are not excessive relative to other companies in the country or industry, and provided that the structure is appropriate within the market context. While stock-based compensation to outside directors is positive if moderate and appropriately structured, we are wary of significant stock option awards or other performance-based awards for outside directors, as well as provisions that could result in significant forfeiture of value on a director's decision to resign from a board (such forfeiture can undercut director independence).
• Proposals for employee stock purchase plans that permit discounts, but only for grants that are part of a broad-based employee plan, including all non-executive employees, and only if the discounts are limited to a reasonable market standard or less.
• Proposals for the establishment of employee retirement and severance plans, provided that our research does not indicate that approval of the plan would be against shareholder interest.
2. We generally oppose retirement plans and bonuses for non-executive directors and independent statutory auditors.
3. In the U.S. context, shareholder proposals requiring shareholder approval of all severance agreements will not be supported, but proposals that require shareholder approval for agreements in excess of three times the annual compensation (salary and bonus) generally will be supported. We generally oppose shareholder proposals that would establish arbitrary caps on pay. We consider on a case-by-case basis shareholder proposals that seek to limit Supplemental Executive Retirement Plans (SERPs), but support such proposals where we consider SERPs to be excessive.
4. Shareholder proposals advocating stronger and/or particular pay-for-performance models will be evaluated on a case-by-case basis, with consideration of the merits of the individual proposal within the context of the particular company and its labor markets, and the company's current and past practices. While we generally support emphasis on long-term components of senior executive pay and strong linkage of pay to performance, we consider factors including whether a proposal may be overly prescriptive, and the impact of the proposal, if implemented as written, on recruitment and retention.
5. We generally support proposals advocating reasonable senior executive and director stock ownership guidelines and holding requirements for shares gained in executive equity compensation programs
6. We generally support shareholder proposals for reasonable "claw-back" provisions that provide for company recovery of senior executive bonuses to the extent they were based on achieving financial benchmarks that were not actually met in light of subsequent restatements.
7. Management proposals effectively to re-price stock options are considered on a case-by-case basis. Considerations include the company's reasons and justifications for a re-pricing, the company's competitive position, whether senior executives and outside directors are excluded, potential cost to shareholders, whether the re-pricing or share exchange is on a value-for-value basis, and whether vesting requirements are extended.
A-7
8. Say-on-Pay: We consider proposals relating to an advisory vote on remuneration on a case-by-case basis. Considerations include a review of the relationship between executive remuneration and performance based on operating trends and total shareholder return over multiple performance periods. In addition, we review remuneration structures and potential poor pay practices, including relative magnitude of pay, discretionary bonus awards, tax gross ups, change-in-control features, internal pay equity and peer group construction. As long-term investors, we support remuneration policies that align with long-term shareholder returns.
I. Social, Political and Environmental Issues.
Shareholders in the U.S. and certain other markets submit proposals encouraging changes in company disclosure and practices related to particular corporate, social, political and environmental matters. We consider how to vote on the proposals on a case-by-case basis to determine likely impacts on shareholder value. We seek to balance concerns on reputational and other risks that lie behind a proposal against costs of implementation, while considering appropriate shareholder and management prerogatives. We may abstain from voting on proposals that do not have a readily determinable financial impact on shareholder value. We support proposals that, if implemented, would enhance useful disclosure, but we generally vote against proposals requesting reports that we believe are duplicative, related to matters not material to the business, or that would impose unnecessary or excessive costs. We believe that certain social and environmental shareholder proposals may intrude excessively on management prerogatives, which can lead us to oppose them.
J. Fund of Funds.
Certain Funds advised by an MSIM Affiliate invest only in other MSIM Funds. If an underlying fund has a shareholder meeting, in order to avoid any potential conflict of interest, such proposals will be voted in the same proportion as the votes of the other shareholders of the underlying fund, unless otherwise determined by the Proxy Review Committee.
III. ADMINISTRATION OF POLICY
The MSIM Proxy Review Committee (the "Committee") has overall responsibility for the Policy. The Committee, which is appointed by MSIM's Long-Only Executive Committee, consists of investment professionals who represent the different investment disciplines and geographic locations of the firm, and is chaired by the director of the Corporate Governance Team ("CGT"). Because proxy voting is an investment responsibility and impacts shareholder value, and because of their knowledge of companies and markets, portfolio managers and other members of investment staff play a key role in proxy voting, although the Committee has final authority over proxy votes.
The CGT Director is responsible for identifying issues that require Committee deliberation or ratification. The CGT, working with advice of investment teams and the Committee, is responsible for voting on routine items and on matters that can be addressed in line with these Policy guidelines. The CGT has responsibility for voting case-by-case where guidelines and precedent provide adequate guidance.
The Committee will periodically review and have the authority to amend, as necessary, the Policy and establish and direct voting positions consistent with the Client Proxy Standard.
CGT and members of the Committee may take into account Research Providers' recommendations and research as well as any other relevant information they may request or receive, including portfolio manager and/or analyst comments and research, as applicable. Generally, proxies related to securities held in accounts that are managed pursuant to quantitative, index or index-like strategies ("Index Strategies") will be voted in the same manner as those held in actively managed accounts, unless economic interests of the accounts differ. Because accounts managed using Index Strategies are passively managed accounts, research from portfolio managers and/or analysts related to securities held in these accounts may not be available. If the affected securities are held only in accounts that are managed pursuant to Index Strategies, and the proxy relates to a matter that is not described in this Policy, the CGT will consider all available information from the Research Providers, and to the extent that the holdings are significant, from the portfolio managers and/or analysts.
A-8
A. Committee Procedures
The Committee meets at least quarterly and reviews and considers changes to the Policy at least annually. Through meetings and/or written communications, the Committee is responsible for monitoring and ratifying "split votes" (i.e., allowing certain shares of the same issuer that are the subject of the same proxy solicitation and held by one or more MSIM portfolios to be voted differently than other shares) and/or "override voting" (i.e., voting all MSIM portfolio shares in a manner contrary to the Policy). The Committee will review developing issues and approve upcoming votes, as appropriate, for matters as requested by CGT.
The Committee reserves the right to review voting decisions at any time and to make voting decisions as necessary to ensure the independence and integrity of the votes.
B. Material Conflicts of Interest
In addition to the procedures discussed above, if the CGT Director determines that an issue raises a material conflict of interest, the CGT Director may request a special committee to review, and recommend a course of action with respect to, the conflict(s) in question ("Special Committee").
A potential material conflict of interest could exist in the following situations, among others:
1. The issuer soliciting the vote is a client of MSIM or an affiliate of MSIM and the vote is on a matter that materially affects the issuer.
2. The proxy relates to Morgan Stanley common stock or any other security issued by Morgan Stanley or its affiliates except if echo voting is used, as with MSIM Funds, as described herein.
3. Morgan Stanley has a material pecuniary interest in the matter submitted for a vote (e.g., acting as a financial advisor to a party to a merger or acquisition for which Morgan Stanley will be paid a success fee if completed).
If the CGT Director determines that an issue raises a potential material conflict of interest, depending on the facts and circumstances, the issue will be addressed as follows:
1. If the matter relates to a topic that is discussed in this Policy, the proposal will be voted as per the Policy.
2. If the matter is not discussed in this Policy or the Policy indicates that the issue is to be decided case-by-case, the proposal will be voted in a manner consistent with the Research Providers, provided that all the Research Providers consulted have the same recommendation, no portfolio manager objects to that vote, and the vote is consistent with MSIM's Client Proxy Standard.
3. If the Research Providers' recommendations differ, the CGT Director will refer the matter to a Special Committee to vote on the proposal, as appropriate.
Any Special Committee shall be comprised of the CGT Director and at least two portfolio managers (preferably members of the Committee) as approved by the Committee. The CGT Director may request non-voting participation by MSIM's General Counsel or his/her designee and the Chief Compliance Officer or his/her designee. In addition to the research provided by Research Providers, the Special Committee may request analysis from MSIM Affiliate investment professionals and outside sources to the extent it deems appropriate.
C. Proxy Voting Reporting
The CGT will document in writing all Committee and Special Committee decisions and actions, which documentation will be maintained by the CGT for a period of at least six years. To the extent these decisions relate to a security held by an MSIM Fund, the CGT will report the decisions to each applicable Board of Trustees/Directors of those Funds at each Board's next regularly scheduled Board meeting. The report will contain information concerning decisions made during the most recently ended calendar quarter immediately preceding the Board meeting.
A-9
MSIM will promptly provide a copy of this Policy to any client requesting it. MSIM will also, upon client request, promptly provide a report indicating how each proxy was voted with respect to securities held in that client's account.
MSIM's Legal Department is responsible for filing an annual Form N-PX on behalf of each MSIM Fund for which such filing is required, indicating how all proxies were voted with respect to such Fund's holdings.
APPENDIX A
The following procedures apply to accounts managed by Morgan Stanley AIP GP LP and Private Investment Partners Inc. ("AIP").
Generally, AIP will follow the guidelines set forth in Section II of MSIM's Proxy Voting Policy and Procedures. To the extent that such guidelines do not provide specific direction, or AIP determines that consistent with the Client Proxy Standard, the guidelines should not be followed, the Proxy Review Committee has delegated the voting authority to vote securities held by accounts managed by AIP to the Fund of Hedge Funds investment team, the Private Equity Fund of Funds investment team or the Private Equity Real Estate Fund of Funds investment team of AIP. A summary of decisions made by the investment teams will be made available to the Proxy Review Committee for its information at the next scheduled meeting of the Proxy Review Committee.
In certain cases, AIP may determine to abstain from determining (or recommending) how a proxy should be voted (and therefore abstain from voting such proxy or recommending how such proxy should be voted), such as where the expected cost of giving due consideration to the proxy does not justify the potential benefits to the affected account(s) that might result from adopting or rejecting (as the case may be) the measure in question.
Waiver of Voting Rights
For regulatory reasons, AIP may either 1) invest in a class of securities of an underlying fund (the "Fund") that does not provide for voting rights; or 2) waive 100% of its voting rights with respect to the following:
1. Any rights with respect to the removal or replacement of a director, general partner, managing member or other person acting in a similar capacity for or on behalf of the Fund (each individually a "Designated Person," and collectively, the "Designated Persons"), which may include, but are not limited to, voting on the election or removal of a Designated Person in the event of such Designated Person's death, disability, insolvency, bankruptcy, incapacity, or other event requiring a vote of interest holders of the Fund to remove or replace a Designated Person; and
2. Any rights in connection with a determination to renew, dissolve, liquidate, or otherwise terminate or continue the Fund, which may include, but are not limited to, voting on the renewal, dissolution, liquidation, termination or continuance of the Fund upon the occurrence of an event described in the Fund's organizational documents; provided, however, that, if the Fund's organizational documents require the consent of the Fund's general partner or manager, as the case may be, for any such termination or continuation of the Fund to be effective, then AIP may exercise its voting rights with respect to such matter.
Approved by Morgan Stanley Funds Board on September 27-28, 2011
A-10
STATEMENT OF ADDITIONAL INFORMATION
Morgan Stanley
Global Strategist Fund
Share Class | Ticker Symbol | ||||||
| Class A | SRTAX | ||||||
| Class B | SRTBX | ||||||
| Class C | SRTCX | ||||||
| Class I | SRTDX | ||||||
| Class R | SRTRX | ||||||
| Class W | SRTWX | ||||||
November 30, 2011
This Statement of Additional Information ("SAI") is not a prospectus. The Prospectus (dated November 30, 2011) for Morgan Stanley Global Strategist Fund may be obtained without charge from the Fund at its address or telephone number listed below.
The Fund's audited financial statements for the fiscal year ended July 31, 2011, including notes thereto, and the report of Ernst & Young LLP, are herein incorporated by reference from the Fund's Annual Report to Shareholders. A copy of the Fund's Annual Report to Shareholders must accompany the delivery of this SAI.
Morgan Stanley
Global Strategist Fund
522 Fifth Avenue
New York, NY 10036
(800) 869-NEWS
TABLE OF CONTENTS
| I. | Fund History | 4 | |||||||||
| II. | Description of the Fund and Its Investments and Risks | 4 | |||||||||
| A. Classification | 4 | ||||||||||
| B. Investment Strategies and Risks | 4 | ||||||||||
| C. Fund Policies/Investment Restrictions | 24 | ||||||||||
| D. Disclosure of Portfolio Holdings | 25 | ||||||||||
| III. | Management of the Fund | 29 | |||||||||
| A. Board of Trustees | 29 | ||||||||||
| B. Management Information | 30 | ||||||||||
| C. Compensation | 39 | ||||||||||
| IV. | Control Persons and Principal Holders of Securities | 40 | |||||||||
| V. | Investment Advisory and Other Services | 41 | |||||||||
| A. Adviser and Administrator | 41 | ||||||||||
| B. Principal Underwriter | 41 | ||||||||||
| C. Services Provided by the Adviser and Administrator | 42 | ||||||||||
| D. Dealer Reallowances | 43 | ||||||||||
| E. Rule 12b-1 Plans | 43 | ||||||||||
| F. Other Service Providers | 46 | ||||||||||
| G. Fund Management | 46 | ||||||||||
| H. Codes of Ethics | 48 | ||||||||||
| I. Proxy Voting Policy and Proxy Voting Record | 48 | ||||||||||
| J. Revenue Sharing | 48 | ||||||||||
| VI. | Brokerage Allocation and Other Practices | 50 | |||||||||
| A. Brokerage Transactions | 50 | ||||||||||
| B. Commissions | 50 | ||||||||||
| C. Brokerage Selection | 51 | ||||||||||
| D. Regular Broker-Dealers | 52 | ||||||||||
| VII. | Capital Stock and Other Securities | 53 | |||||||||
| VIII. | Purchase, Redemption and Pricing of Shares | 53 | |||||||||
| A. Purchase/Redemption of Shares | 53 | ||||||||||
| B. Offering Price | 54 | ||||||||||
| IX. | Taxation of the Fund and Shareholders | 55 | |||||||||
| X. | Underwriters | 58 | |||||||||
| XI. | Performance Data | 58 | |||||||||
| XII. | Financial Statements | 59 | |||||||||
| XIII. | Fund Counsel | 59 | |||||||||
| Appendix A. | Proxy Voting Policy and Procedures | A-1 | |||||||||
| Appendix B. | Ratings of Investments | B-1 | |||||||||
2
Glossary of Selected Defined Terms
The terms defined in this glossary are frequently used in this SAI (other terms used occasionally are defined in the text of the document).
"Administrator" or "Morgan Stanley Services" — Morgan Stanley Services Company Inc., a wholly-owned fund services subsidiary of the Adviser.
"Custodian" — State Street Bank and Trust Company.
"Distributor" — Morgan Stanley Distribution, Inc., a wholly-owned broker-dealer subsidiary of Morgan Stanley.
"Financial Advisors" — Morgan Stanley authorized financial services representatives.
"Fund" — Morgan Stanley Global Strategist Fund, a registered open-end investment company.
"Independent Trustees" — Trustees who are not "interested persons" (as defined by the Investment Company Act of 1940, as amended ("Investment Company Act")) of the Fund.
"Adviser" — Morgan Stanley Investment Management Inc., a wholly-owned investment adviser subsidiary of Morgan Stanley.
"Morgan Stanley & Co." — Morgan Stanley & Co. LLC, a wholly-owned broker-dealer subsidiary of Morgan Stanley.
"Morgan Stanley Funds" — Registered investment companies for which the Adviser serves as the investment adviser and that hold themselves out to investors as related companies for investment and investor services.
"Morgan Stanley Smith Barney" — Morgan Stanley Smith Barney LLC, a majority-owned broker-dealer subsidiary of Morgan Stanley.
"Transfer Agent" — Morgan Stanley Services Company Inc., a wholly-owned transfer agent subsidiary of Morgan Stanley.
"Trustees" — The Board of Trustees of the Fund.
3
I. FUND HISTORY
The Fund was organized as a Massachusetts business trust under the laws of the Commonwealth of Massachusetts on August 5, 1988 under the name Dean Witter Strategist Fund. Effective June 22, 1998, the Fund's name was changed to Morgan Stanley Dean Witter Strategist Fund. Effective June 18, 2001, the Fund's name was changed to Morgan Stanley Strategist Fund. Effective March 31, 2010, the Fund's name was changed to Morgan Stanley Global Strategist Fund.
II. DESCRIPTION OF THE FUND AND ITS INVESTMENTS AND RISKS
A. Classification
The Fund is an open-end, diversified management investment company whose investment objective is to maximize the total return on its investments.
B. Investment Strategies and Risks
The following discussion of the Fund's investment strategies and risks should be read with the sections of the Fund's Prospectus titled "Principal Investment Strategies," "Principal Risks," and "Additional Information about the Fund's Investment Objective, Strategies and Risks."
Derivatives. The Fund may, but is not required to, use various derivatives and related investment strategies as described below. Derivatives may be used for a variety of purposes including hedging, risk management, portfolio management or to earn income. Any or all of the investment techniques described herein may be used at any time and there is no particular strategy that dictates the use of one technique rather than another, as the use of any derivative by the Fund is a function of numerous variables, including market conditions. The Fund complies with applicable regulatory requirements when using derivatives, including the segregation or earmarking of cash or liquid assets when mandated by U.S. Securities and Exchange Commission ("SEC") rules or SEC staff positions. Although the Adviser seeks to use derivatives to further the Fund's investment objective, no assurance can be given that the use of derivatives will achieve this result.
General Risks of Derivatives
Derivatives utilized by the Fund may involve the purchase and sale of derivative instruments. A derivative is a financial instrument the value of which depends upon (or derives from) the value of another asset, security, interest rate or index. Derivatives may relate to a wide variety of underlying instruments, including equity and debt securities, indexes, interest rates, currencies and other assets. Certain derivative instruments which the Fund may use and the risks of those instruments are described in further detail below. The Fund may in the future also utilize derivatives techniques, instruments and strategies that may be newly developed or permitted as a result of regulatory changes, consistent with the Fund's investment objective and policies. Such newly developed techniques, instruments and strategies may involve risks different than or in addition to those described herein. No assurance can be given that any derivatives strategy employed by the Fund will be successful.
The risks associated with the use of derivatives are different from, and possibly greater than, the risks associated with investing directly in the instruments underlying such derivatives. Derivatives are highly specialized instruments that require investment techniques and risk analyses different from other portfolio investments. The use of derivative instruments requires an understanding not only of the underlying instrument but also of the derivative itself. Certain risk factors generally applicable to derivative transactions are described below.
• Derivatives are subject to the risk that the market value of the derivative itself or the market value of underlying instruments will change in a way adverse to the Fund's interests. The Fund bears the risk that the Adviser may incorrectly forecast future market trends and other financial or economic factors or the value of the underlying security, index, interest rate or currency when establishing a derivatives position for the Fund.
• Derivatives may be subject to pricing risk, which exists when a derivative becomes extraordinarily expensive (or inexpensive) relative to historical prices or corresponding instruments. Under such market conditions, it may not be economically feasible to initiate a transaction or liquidate a position at an advantageous time or price.
4
• Many derivatives are complex and often valued subjectively. Improper valuations can result in increased payment requirements to counterparties or a loss of value to the Fund.
• Using derivatives as a hedge against a portfolio investment subjects the Fund to the risk that the derivative will have imperfect correlation with the portfolio investment, which could result in the Fund incurring substantial losses. This correlation risk may be greater in the case of derivatives based on an index or other basket of securities, as the portfolio securities being hedged may not duplicate the components of the underlying index or the basket may not be of exactly the same type of obligation as those underlying the derivative. The use of derivatives for "cross hedging" purposes (using a derivative based on one instrument as a hedge for a different instrument) may also involve greater correlation risks.
• While using derivatives for hedging purposes can reduce the Fund's risk of loss, it may also limit the Fund's opportunity for gains or result in losses by offsetting or limiting the Fund's ability to participate in favorable price movements in portfolio investments.
• Derivatives transactions for non-hedging purposes involve greater risks and may result in losses which would not be offset by increases in the value of portfolio securities or declines in the cost of securities to be acquired. In the event that the Fund enters into a derivatives transaction as an alternative to purchasing or selling the underlying instrument or in order to obtain desired exposure to an index or market, the Fund will be exposed to the same risks as are incurred in purchasing or selling the underlying instruments directly.
• The use of certain derivatives transactions involves the risk of loss resulting from the insolvency or bankruptcy of the counterparty to the contract or the failure by the counterparty to make required payments or otherwise comply with the terms of the contract. In the event of default by a counterparty, the Fund may have contractual remedies pursuant to the agreements related to the transaction.
• Liquidity risk exists when a particular derivative is difficult to purchase or sell. If a derivative transaction is particularly large or if the relevant market is illiquid, the Fund may be unable to initiate a transaction or liquidate a position at an advantageous time or price.
• Certain derivatives transactions are not entered into or traded on exchanges or in markets regulated by the U.S. Commodity Futures Trading Commission ("CFTC") or the SEC. Instead, such over-the-counter ("OTC") derivatives are entered into directly by the Fund and a counterparty and may be traded only through financial institutions acting as market makers. OTC derivatives transactions can only be entered into with a willing counterparty that is approved by the Adviser in accordance with guidelines established by the Board. Where no such counterparty is available, the Fund will be unable to enter into a desired OTC transaction. There also may be greater risk that no liquid secondary market in the trading of OTC derivatives will exist, in which case the Fund may be required to hold such instruments until exercise, expiration or maturity. Many of the protections afforded to exchange participants are not available to participants in OTC derivatives transactions. OTC derivatives transactions are not subject to the guarantee of an exchange or clearinghouse, and as a result the Fund would bear greater risk of default by the counterparties to such transactions.
• The Fund may be required to make physical delivery of portfolio securities underlying a derivative in order to close out a derivatives position or to sell portfolio securities at a time or price at which it may be disadvantageous to do so in order to obtain cash to close out or to maintain a derivatives position.
• As a result of the structure of certain derivatives, adverse changes in the value of the underlying instrument can result in losses substantially greater than the amount invested in the derivative itself. Certain derivatives have the potential for unlimited loss, regardless of the size of the initial investment.
• Certain derivatives may be considered illiquid and therefore subject to the Fund's limitation on investments in illiquid securities.
• Derivatives transactions conducted outside the United States may not be conducted in the same manner as those entered into on U.S. exchanges, and may be subject to different margin, exercise,
5
settlement or expiration procedures. Brokerage commissions, clearing costs and other transaction costs may be higher on foreign exchanges. Many of the risks of OTC derivatives transactions are also applicable to derivatives transactions conducted outside the United States. Derivatives transactions conducted outside the United States are subject to the risk of governmental action affecting the trading in, or the prices of, foreign securities, currencies and other instruments. The value of such positions could be adversely affected by foreign political and economic factors; lesser availability of data on which to make trading decisions; delays on the Fund's ability to act upon economic events occurring in foreign markets; and less liquidity than U.S. markets.
• Currency derivatives are subject to additional risks. Currency derivatives transactions may be negatively affected by government exchange controls, blockages, and manipulations. Currency exchange rates may be influenced by factors extrinsic to a country's economy. There is no systematic reporting of last sale information with respect to foreign currencies. As a result, the available information on which trading in currency derivatives will be based may not be as complete as comparable data for other transactions. Events could occur in the foreign currency market which will not be reflected in currency derivatives until the following day, making it more difficult for the Fund to respond to such events in a timely manner.
Options
An option is a contract that gives the holder of the option the right, but not the obligation, to buy from (in the case of a call option) or sell to (in the case of a put option) the seller of the option (the "option writer") the underlying security at a specified fixed price (the "exercise price") on or prior to a specified date (the "expiration date"). The buyer of the option pays to the option writer the option premium, which is the purchase price of the option.
Exchange-traded options are issued by a regulated intermediary such as the Options Clearing Corporation ("OCC"), which guarantees the performance of the obligations of the parties to such options. OTC options are purchased from or sold to counterparties through direct bilateral agreement between the Fund and its counterparties. Certain options, such as options on individual securities, may be settled through physical delivery of the underlying security, whereas other options, such as index options, are settled in cash in an amount based on the value of the underlying instrument multiplied by a specified multiplier.
Writing Options. The Fund may write call and put options. As the writer of a call option, the Fund receives the premium from the purchaser of the option and has the obligation, upon exercise of the option, to deliver the underlying security upon payment of the exercise price. If the option expires without being exercised the Fund is not required to deliver the underlying security but retains the premium received.
The Fund may only write call options that are "covered." A call option on a security is covered if (a) the Fund owns the security underlying the call or has an absolute and immediate right to acquire that security without additional cash consideration (or, if additional cash consideration is required, such amount is maintained by the Fund in segregated or earmarked cash or liquid assets) upon conversion or exchange of other securities held by the Fund; or (b) the Fund has purchased a call on the underlying security, the exercise price of which is (i) equal to or less than the exercise price of the call written, or (ii) greater than the exercise price of the call written, provided the difference is maintained by the Fund in segregated or earmarked cash or liquid assets.
Selling call options involves the risk that the Fund may be required to sell the underlying security at a disadvantageous price, below the market price of such security, at the time the option is exercised. As the writer of a covered call option, the Fund forgoes, during the option's life, the opportunity to profit from increases in the market value of the underlying security covering the option above the sum of the premium and the exercise price but retains the risk of loss should the price of the underlying security decline.
The Fund may write put options. As the writer of a put option, the Fund receives the premium from the purchaser of the option and has the obligation, upon exercise of the option, to pay the exercise price and receive delivery of the underlying security. If the option expires without being exercised, the Fund is not required to receive the underlying security in exchange for the exercise price but retains the option premium.
The Fund may only write put options that are "covered." A put option on a security is covered if (a) the Fund segregates or earmarks cash or liquid assets equal to the exercise price; or (b) the Fund has purchased a put on the same security as the put written, the exercise price of which is (i) equal to or
6
greater than the exercise price of the put written, or (ii) less than the exercise price of the put written, provided the difference is maintained by the Fund in segregated or earmarked cash or liquid assets.
Selling put options involves the risk that the Fund may be required to buy the underlying security at a disadvantageous price, above the market price of such security, at the time the option is exercised. While the Fund's potential gain in writing a covered put option is limited to the premium received plus the interest earned on the liquid assets covering the put option, the Fund's risks of loss is equal to the entire value of the underlying security, offset only by the amount of the premium received.
The Fund may close out an options position which it has written through a closing purchase transaction. The Fund would execute a closing purchase transaction with respect to a call option written by purchasing a call option on the same underlying security and having the same exercise price and expiration date as the call option written by the Fund. The Fund would execute a closing purchase transaction with respect to a put option written by purchasing a put option on the same underlying security and having the same exercise price and expiration date as the put option written by the Fund. A closing purchase transaction may or may not result in a profit to a Fund. The Fund could close out its position as an option writer only if a liquid market exists for options on the same underlying security and having the same exercise price and expiration date as the option written by the Fund. There is no assurance that such a market will exist with respect to any particular option.
The writer of an option generally has no control over the time when the option is exercised, and the option writer is required to deliver or acquire the underlying security. Once an option writer has received an exercise notice, it cannot effect a closing purchase transaction in order to terminate its obligation under the option. Thus, the use of options may require the Fund to buy or sell portfolio securities at inopportune times or for prices other than the current market values of such securities, may limit the amount of appreciation the Fund can realize on an investment, or may cause the Fund to hold a security that it might otherwise sell.
Purchasing Options. The Fund may purchase call and put options. As the buyer of a call option, the Fund pays the premium to the option writer and has the right to purchase the underlying security from the option writer at the exercise price. If the market price of the underlying security rises above the exercise price, the Fund could exercise the option and acquire the underlying security at a below market price, which could result in a gain to the Fund, minus the premium paid. As the buyer of a put option, the Fund pays the premium to the option writer and has the right to sell the underlying security to the option writer at the exercise price. If the market price of the underlying security declines below the exercise price, the Fund could exercise the option and sell the underlying security at an above-market price, which could result in a gain to the Fund, minus the premium paid. The Fund may buy call and put options whether or not it holds the underlying securities.
As a buyer of a call or put option, the Fund may sell put or call options that it has purchased at any time prior to such option's expiration date through a closing sale transaction. The principal factors affecting the market value of a put or a call option include supply and demand, interest rates, the current market price of the underlying security in relation to the exercise price of the option, the volatility of the underlying security, the underlying security's dividend policy, and the time remaining until the expiration date. A closing sale transaction may or may not result in a profit to the Fund. The Fund's ability to initiate a closing sale transaction is dependent upon the liquidity of the options market and there is no assurance that such a market will exist with respect to any particular option. If the Fund does not exercise or sell an option prior to its expiration date, the option expires and becomes worthless.
OTC Options. Unlike exchange-traded options, which are standardized with respect to the underlying instrument, expiration date, contract size and strike price, the terms of OTC options generally are established through negotiation between the parties to the options contract. This type of arrangement allows the purchaser and writer greater flexibility to tailor the option to their needs. OTC options are available for a greater variety of securities or baskets of securities, and in a wider range of expiration dates and exercise prices than exchange-traded options. However, unlike exchange traded options, which are issued and guaranteed by a regulated intermediary, such as the OCC, OTC options are entered into directly with the counterparty. Unless the counterparties provide for it, there is no central clearing or guaranty function for an OTC option. Therefore, OTC options are subject to the risk of default or non-performance by the counterparty. Accordingly, the Adviser must assess the creditworthiness of the counterparty to determine the likelihood that the terms of the option will be satisfied. There can be no
7
assurance that a continuous liquid secondary market will exist for any particular OTC option at any specific time. As a result, the Fund may be unable to enter into closing sale transactions with respect to OTC options.
Index Options. Call and put options on indices operate similarly to options on securities. Rather than the right to buy or sell a single security at a specified price, options on an index give the holder the right to receive, upon exercise of the option, an amount of cash determined by reference to the value of the underlying index. The underlying index may be a broad-based index or a narrower market index. Unlike options on securities, all settlements are in cash. The settlement amount, which the writer of a index option must pay to the holder of the option upon exercise, is generally equal to the difference between the fixed exercise price of the option and the value of the underlying index, multiplied by a specified multiplier. The multiplier determines the size of the investment position the option represents. Gain or loss to the Fund on index options transactions will depend on price movements in the underlying securities market generally or in a particular segment of the market rather than price movements of individual securities. As with other options, the Fund may close out its position in index options through closing purchase transactions and closing sale transactions provided that a liquid secondary market exists for such options.
Index options written by the Fund will generally be covered in a manner similar to the covering of other types of options, by holding an offsetting financial position and/or segregating or earmarking cash or liquid assets. The Fund may cover call options written on an index by owning securities whose price changes, in the opinion of the Adviser, are expected to correlate to those of the underlying index.
Foreign Currency Options. Options on foreign currencies operate similarly to options on securities. Rather than the right to buy or sell a single security at a specified price, options on foreign currencies give the holder the right to buy or sell foreign currency for a fixed amount in U.S. dollars or other base currencies. Options on foreign currencies are traded primarily in the OTC market, but may also be traded on U.S. and foreign exchanges. The value of a foreign currency option is dependent upon the value of the underlying foreign currency relative to the U.S. dollar or other base currency. The price of the option may vary with changes in, among other things, the value of either or both currencies and has no relationship to the investment merits of a foreign security. Options on foreign currencies are affected by all of those factors which influence foreign exchange rates and foreign investment generally. As with other options, the Fund may close out its position in foreign currency options through closing purchase transactions and closing sale transactions provided that a liquid market exists for such options.
Foreign currency options written by the Fund will generally be covered in a manner similar to the covering of other types of options, by holding an offsetting financial position and/or segregating or earmarking cash or liquid assets.
Additional Risks of Options Transactions. The risks associated with options transactions are different from, and possibly greater than, the risks associated with investing directly in the underlying instruments. Options are highly specialized instruments that require investment techniques and risk analyses different from those associated with other portfolio investments. The use of options requires an understanding not only of the underlying instrument but also of the option itself. Options may be subject to the risk factors generally applicable to derivatives transactions described herein, and may also be subject to certain additional risk factors, including:
• The exercise of options written or purchased by the Fund could cause the Fund to sell portfolio securities, thus increasing the Fund's portfolio turnover.
• The Fund pays brokerage commissions each time it writes or purchases an option or buys or sells an underlying security in connection with the exercise of an option. Such brokerage commissions could be higher relative to the commissions for direct purchases of sales of the underlying securities.
• The Fund's options transactions may be limited by limitations on options positions established by the SEC, CFTC or the exchanges on which such options are traded.
• The hours of trading for exchange-listed options may not coincide with the hours during which the underlying securities are traded. To the extent that the options markets close before the markets for the underlying securities, significant price and rate movements can take place in the underlying securities that cannot be reflected in the options markets.
8
• Index options based upon a narrower index of securities may present greater risks than options based on broad market indexes, as narrower indexes are more susceptible to rapid and extreme fluctuations as a result of changes in the values of a smaller number of securities.
• The Fund is subject to the risk of market movements between the time that an option is exercised and the time of performance thereunder, which could increase the extent of any losses suffered by the Fund in connection with options transactions.
Futures Contracts
A futures contract is a standardized agreement to buy or sell a specific quantity of a commodity at a specific price at a specific future time (the "settlement date"). Futures contracts may be based on, among other things, a specified equity security (securities futures), a specified debt security or reference rate (interest rate futures), the value of a specified securities index (index futures) or the value of a foreign currency (forward contracts and currency futures). The value of a futures contract tends to increase and decrease in tandem with the value of the underlying instrument. The buyer of a futures contract agrees to purchase the underlying instrument on the settlement date and is said to be "long" the contract. The seller of a futures contract agrees to sell the underlying instrument on the settlement date and is said to be "short" the contract. Futures contracts call for settlement only on the expiration date and cannot be "exercised" at any other time during their term.
Depending on the terms of the particular contract, futures contracts are settled through either physical delivery of the underlying instrument on the settlement date (such as in the case of securities futures based on a specified debt security) or by payment of a cash settlement amount on the settlement date (such as in the case of futures contracts relating to interest rates, foreign currencies and broad-based securities indexes). In the case of cash-settled futures contracts, the settlement amount is equal to the difference between the reference instrument's price on the last trading day of the contract and the reference instrument's price at the time the contract was entered into. Most futures contracts, particularly futures contracts requiring physical delivery, are not held until the settlement date, but instead are offset before the settlement date through the establishment of an opposite and equal futures position (buying a contract that had been sold, or selling a contract that had been purchased). All futures transactions are effected through a clearinghouse associated with the exchange on which the futures are traded.
The buyer and seller of a futures contract are not required to deliver or pay for the underlying commodity unless the contract is held until the settlement date. However, both the buyer and seller are required to deposit "initial margin" with a futures commission merchant when the futures contract is entered into. Initial margin deposits are typically calculated as a percentage of the contract's market value. If the value of either party's position declines, the party will be required to make additional "variation margin" payments to settle the change in value on a daily basis. The process is known as "marking-to-market." Upon the closing of a futures position through the establishment of an offsetting position, a final determination of variation margin will be made and additional cash will be paid by or released to the Fund.
In addition, the Fund may be required to maintain segregated cash or liquid assets in order to cover futures transactions. The Fund will segregate or earmark cash or liquid assets in an amount equal to the difference between the market value of a futures contract entered into by the Fund and the aggregate value of the initial and variation margin payments made by the Fund with respect to such contract or as otherwise permitted by SEC rules or SEC staff positions. See "Regulatory Matters" below.
Currency Forward Contracts and Currency Futures. A forward foreign currency contract is a negotiated agreement between two parties to exchange specified amounts of two or more currencies at a specified future time at a specified rate. The rate specified by the forward contract can be higher or lower than the spot rate between the currencies that are the subject of the contract. Currency futures are similar to currency forward contracts, except that they are traded on an exchange and standardized as to contract size and delivery date. Most currency futures call for payment or delivery in U.S. dollars. Unanticipated changes in currency prices may result in losses to the Fund and poorer overall performance for the Fund than if it had not entered into currency forward or futures contracts. The Fund may enter into forward or futures contracts under various circumstances. The typical use of a forward or futures contract is to "lock in" the price of a security in U.S. dollars or some other foreign currency, which the Fund is holding in its portfolio. By entering into a forward or futures contract for the purchase or sale, for a fixed amount of dollars
9
or other currency, of the amount of foreign currency involved in the underlying security transactions, the Fund may be able to protect itself against a possible loss resulting from an adverse change in the relationship between the U.S. dollar or other currency which is being used for the security purchase and the foreign currency in which the security is denominated during the period between the date on which the security is purchased or sold and the date on which payment is made or received. The Adviser also may from time to time utilize forward or futures contracts for other purposes. For example, they may be used to hedge a foreign security held in the portfolio or a security which pays out principal tied to an exchange rate between the U.S. dollar and a foreign currency, against a decline in value of the applicable foreign currency. They also may be used to lock in the current exchange rate of the currency in which those securities anticipated to be purchased are denominated. At times, the Fund may enter into "cross-currency" hedging transactions involving currencies other than those in which securities are held or proposed to be purchased are denominated.
The Fund will not enter into forward or futures contracts or maintain a net exposure to these contracts where the consummation of the contracts would obligate the Fund to deliver an amount of foreign currency in excess of the value of the Fund's portfolio securities.
When required by law, the Fund will segregate or earmark cash, U.S. government securities or other appropriate liquid portfolio securities in an amount equal to the value of the Fund's total assets committed to the consummation of forward or futures contracts entered into under the circumstances set forth above. If the value of the securities so earmarked declines, additional cash or securities will be segregated or earmarked on a daily basis so that the value of such securities will equal the amount of the Fund's commitments with respect to such contracts.
The Fund may be limited in its ability to enter into hedging transactions involving forward or futures contracts by the Internal Revenue Code of 1986, as amended (the "Code"), requirements relating to qualification as a regulated investment company.
Forward or futures contracts may limit gains on portfolio securities that could otherwise be realized had they not been utilized and could result in losses. The contracts also may increase the Fund's volatility and may involve a significant amount of risk relative to the investment of cash.
Options on Futures Contracts. Options on futures contracts are similar to options on securities except that options on futures contracts give the purchasers the right, in return for the premium paid, to assume a position in a futures contract (a long position in the case of a call option and a short position in the case of a put option) at a specified exercise price at any time prior to the expiration of the option. Upon exercise of the option, the parties will be subject to all of the risks associated with futures transactions and subject to margin requirements. As the writer of options on futures contracts, the Fund would also be subject to initial and variation margin requirements on the option position.
Options on futures contracts written by the Fund will generally be covered in a manner similar to the covering of other types of options, by holding an offsetting financial position and/or segregating or earmarking cash or liquid assets. The Fund may cover an option on a futures contract by purchasing or selling the underlying futures contract. In such instances the exercise of the option will serve to close out the Fund's futures position.
Additional Risk of Futures Transactions. The risks associated with futures contract transactions are different from, and possibly greater than, the risks associated with investing directly in the underlying instruments. Futures are highly specialized instruments that require investment techniques and risk analyses different from those associated with other portfolio investments. The use of futures requires an understanding not only of the underlying instrument but also of the futures contract itself. Futures may be subject to the risk factors generally applicable to derivatives transactions described herein, and may also be subject to certain additional risk factors, including:
• The risk of loss in buying and selling futures contracts can be substantial. Small price movements in the commodity underlying a futures position may result in immediate and substantial loss (or gain) to the Fund.
• Buying and selling futures contracts may result in losses in excess of the amount invested in the position in the form of initial margin. In the event of adverse price movements in the underlying commodity, security, index, currency or instrument, the Fund would be required to make daily cash
10
payments to maintain its required margin. The Fund may be required to sell portfolio securities, or make or take delivery of the underlying securities in order to meet daily margin requirements at a time when it may be disadvantageous to do so. The Fund could lose margin payments deposited with a futures commission merchant if the futures commission merchant breaches its agreement with the Fund, becomes insolvent or declares bankruptcy.
• Most exchanges limit the amount of fluctuation permitted in futures contract prices during any single trading day. Once the daily limit has been reached in a particular futures contract, no trades may be made on that day at prices beyond that limit. If futures contract prices were to move to the daily limit for several trading days with little or no trading, the Fund could be prevented from prompt liquidation of a futures position and subject to substantial losses. The daily limit governs only price movements during a single trading day and therefore does not limit the Fund's potential losses.
• Index futures based upon a narrower index of securities may present greater risks than futures based on broad market indexes, as narrower indexes are more susceptible to rapid and extreme fluctuations as a result of changes in value of a small number of securities.
Swap Contracts and Related Derivative Instruments
A swap contract is an agreement between two parties pursuant to which the parties exchange payments at specified dates on the basis of a specified notional amount, with the payments calculated by reference to specified securities, indexes, reference rates, currencies or other instruments. Most swap agreements provide that when the period payment dates for both parties are the same, the payments are made on a net basis (i.e., the two payment streams are netted out, with only the net amount paid by one party to the other). The Fund's obligations or rights under a swap contract entered into on a net basis will generally be equal only to the net amount to be paid or received under the agreement, based on the relative values of the positions held by each counterparty. With limited exceptions swap agreements are generally not entered into or traded on exchanges. For most swaps there is no central clearing or guaranty function. Therefore, swaps are generally subject to the risk of default or non-performance by the counterparty. Accordingly, the Adviser must assess the creditworthiness of the counterparty to determine the likelihood that the terms of the swap will be satisfied.
Swap agreements allow for a wide variety of transactions. For example, fixed rate payments may be exchanged for floating rate payments, U.S. dollar denominated payments may be exchanged for payments denominated in foreign currencies, and payments tied to the price of one security, index, reference rate, currency or other instrument may be exchanged for payments tied to the price of a different security, index, reference rate, currency or other instrument. Swap contracts are typically individually negotiated and structured to provide exposure to a variety of particular types of investments or market factors. Swap contracts can take many different forms and are known by a variety of names. To the extent consistent with a Fund's investment objectives and policies, the Fund is not limited to any particular form or variety of swap contract. the Fund may utilize swaps to increase or decrease its exposure to the underlying instrument, reference rate, foreign currency, market index or other asset. The Fund may also enter into related derivative instruments including caps, floors and collars.
The Fund may be required to cover swap transactions. Obligations under swap agreements entered into on a net basis are generally accrued daily and any accrued but unpaid amounts owed by the Fund to the swap counterparty will be covered by segregating or earmarking cash or liquid assets. If the Fund enters into a swap agreement on other than a net basis, the Fund will segregate or earmark cash or liquid assets with a value equal to the full amount of the Fund's accrued obligations under the agreement.
Interest Rate Swaps, Caps, Floors and Collars. Interest rate swaps consist of an agreement between two parties to exchange their respective commitments to pay or receive interest (e.g., an exchange of floating rate payments for fixed rate payments). Interest rate swaps are generally entered into on a net basis. Interest rate swaps do not involved the delivery of securities, other underlying assets, or principal. Accordingly, the risk of loss with respect to interest rate and total rate of return swaps is limited to the net amount of interest payments that the Fund is contractually obligated to make.
The Fund may also buy or sell interest rate caps, floors and collars. The purchase of an interest rate cap entitles the purchaser, to the extent that a specified index exceeds a predetermined interest rate, to receive payments of interest on a specified notional amount from the party selling the interest rate cap. The
11
purchase of an interest rate floor entitles the purchaser, to the extent that a specified index falls below a predetermined interest rate, to receive payments of interest on a specified notional amount from the party selling the interest rate floor. A collar is a combination of a cap and a floor that preserves a certain return within a predetermined range of interest rate of values. Caps, floors and collars may be less liquid than other types of swaps. If a Fund sells caps, floors and collars, it will segregate liquid assets with a value equal to the full amount, accrued daily, of the Fund's net obligations with respect to the caps, floors or collars.
Index Swaps. An index swap consists of an agreement between two parties in which a party exchanges a cash flow based on a notional amount of a reference index for a cash flow based on a different index or on another specified instrument or reference rate. Index swaps are generally entered into on a net basis.
Inflation Swaps. Inflation swap agreements are contracts in which one party agrees to pay the cumulative percentage increase in a price index, such as the Consumer Price Index, over the term of the swap (with some lag on the referenced inflation index), and the other party pays a compounded fixed rate. Inflation swap agreements may be used to protect the net asset value of the Fund against an unexpected change in the rate of inflation measured by an inflation index. The value of inflation swap agreements is expected to change in response to changes in real interest rates. Real interest rates are tied to the relationship between nominal interest rates and the rate of inflation.
Currency Swaps. A currency swap consists of an agreement between two parties to exchange cash flows on a notional amount of two or more currencies based on the relative value differential among them, such as exchanging a right to receive a payment in a foreign currency for the right to receive U.S. dollars. Currency swap agreements may be entered into on a net basis or may involve the delivery of the entire principal value of one designated currency in exchange for the entire principal value of another designated currency. In such cases, the entire principal value of a currency swap is subject to the risk that the counterparty will default on its contractual delivery obligations.
Credit Default Swaps. A credit default swap consists of an agreement between two parties in which the "buyer" agrees to pay to the "seller" a periodic stream of payments over the term of the contract and the seller agrees to pay the buyer the par value (or other agreed-upon value) of a referenced debt obligation upon the occurrence of a credit event with respect to the issuer of the referenced debt obligation. Generally, a credit event means a bankruptcy, failure to pay, or a restructuring. The Fund may be either the buyer or seller in a credit default swap. As the buyer in a credit default swap, the Fund would pay to the counterparty the periodic stream of payments. If no default occurs, the Fund would receive no benefit from the contract. As the seller in a credit default swap, the Fund would receive the stream of payments but would be subject to exposure on the notional amount of the swap, which it would be required to pay in the event of default. The Fund will generally segregate or earmark liquid assets to cover any potential obligation under a credit default swap sold by the Fund. The use of credit default swaps could result in losses to the Fund if the Adviser fails to correctly evaluate the creditworthiness of the issuer of the referenced debt obligation.
Swaptions. An option on a swap agreement, also called a "swaption," is an option that gives the buyer the right, but not the obligation, to enter into a swap on a future date in exchange for paying a market based "premium." A receiver swaption gives the owner the right to receive the total return of a specified asset, reference rate, or index. A payer swaption gives the owner the right to pay the total return of a specified asset, reference rate, or index. Swaptions also include options that allow an existing swap to be terminated or extended by one of the counterparties.
General Risks of Swaps. The risks associated with swap transactions are different from, and possibly greater than, the risks associated with investing directly in the underlying instruments. Swaps are highly specialized instruments that require investment techniques and risk analyses different from those associated with other portfolio investments. The use of swaps requires an understanding not only of the underlying instrument but also of the swap contract itself. Swap transactions may be subject to the risk factors generally applicable to derivatives transactions described above, and may also be subject to certain additional risk factors, including:
• Many swap agreements are not traded on exchanges and not subject to a similar level of government regulation like exchange-traded derivatives. As a result, parties to a swap agreement are not protected by such government regulations to the same extent participants in transactions in derivatives traded on organized exchanges.
12
• In addition to the risk of default by the counterparty, if the creditworthiness of a counterparty to a swap agreement declines, the value of the swap agreement would be likely to decline, potentially resulting in losses.
• The swaps market is a relatively new market and currently is largely unregulated. It is possible that further developments in the swaps market, including future governmental regulation, could adversely affect the Fund's ability to utilize swaps, terminate existing swap agreements or realize amounts to be received under such agreements.
Structured Investments
The Fund also may invest a portion of its assets in structured investments. A structured investment is a derivative security designed to offer a return linked to a particular underlying security, currency, commodity or market, for which the amount of principal repayment and/or interest payments is based on the change in value of such underlying security, currency, commodity or market, including, among others, currency exchange rates, interest rates (such as the prime lending rate or LIBOR), referenced bonds and stock indices or other financial reference. Structured investments may come in various forms, including notes, warrants and options to purchase securities, and may be listed and traded on an exchange or otherwise traded in the OTC market.
The Fund will typically use structured investments to gain exposure to a permitted underlying security, currency, commodity or market when direct access to such security, currency, commodity or market is limited or inefficient from a tax, cost or regulatory standpoint. Investments in structured investments involve risks including counterparty risk and market risk. Holders of structured investments bear risks of the underlying investment and are subject to counterparty risk because the Fund is relying on the creditworthiness of such counterparty and has no rights with respect to the issuer of the underlying investment. Certain structured investments may be thinly traded or have a limited trading market and may have the effect of increasing the Fund's illiquidity to the extent that the Fund, at a particular point in time, may be unable to find qualified buyers for these investments.
A structured investment may be linked either positively or negatively to its underlying security, currency, commodity or market and a change in interest rate, principal amount or other factor, depending on the structured investment's design, may be a multiple of the factor's movement. Application of a multiplier is comparable to the use of financial leverage, a speculative technique. Leverage magnifies the potential for gain and the risk of loss. As a result, a relatively small decline in the value of the referenced factor could result in a relatively large loss in the value of a structured investment.
Other types of structured investments include interests in entities organized and operated for the purpose of restructuring the investment characteristics of underlying investment interests or securities. This type of securitization or restructuring usually involves the deposit or purchase of an underlying security by a U.S. or foreign entity, such as a corporation or trust of specified instruments, and the issuance by that entity of one or more classes of securities backed by, or representing an interest in, the underlying instruments. The cash flow or rate of return on the underlying investments may be apportioned among the newly issued securities to create different investment characteristics, such as varying maturities, credit quality, payment priorities and interest rate provisions. Structured investments which are subordinated, for example, in payment priority often offer higher returns, but may result in increased risks compared to other investments.
Combined Transactions
Combined transactions involve entering into multiple derivatives transactions (such as multiple options transactions, including purchasing and writing options in combination with each other; multiple futures transactions; and combinations of options, futures, forward and swap transactions) instead of a single derivatives transaction in order to customize the risk and return characteristics of the overall position. Combined transactions typically contain elements of risk that are present in each of the component transactions. The Fund may enter into a combined transaction instead of a single derivatives transaction when, in the opinion of the Adviser, it is in the best interest of the Fund to do so. Because combined transactions involve multiple transactions, they may result in higher transaction costs and may be more difficult to close out.
13
Regulatory Matters
As described herein, the Fund may be required to cover its potential economic exposure to certain derivatives transactions by holding an offsetting financial position and/or segregating or earmarking cash or liquid assets equal in value to the Fund's potential economic exposure under the transaction. The Fund will cover such transactions as described herein or in such other manner in accordance with applicable laws and regulations. Assets used to cover derivatives transactions cannot be sold while the derivatives position is open, unless they are replaced by other appropriate assets. Segregated or earmarked cash or liquid assets and assets held in margin accounts are not otherwise available to the Fund for investment purposes. If a large portion of the Fund's assets are used to cover derivatives transactions or are otherwise segregated or earmarked, it could affect portfolio management or the Fund's ability to meet redemption requests or other current obligations. With respect to derivatives which are cash settled (i.e., have no physical delivery requirement), the Fund is permitted to set aside liquid assets in an amount equal to the Fund's daily marked-to-market net obligations (i.e., the Fund's daily net liability) under the derivative, if any, rather than the derivative's full notional value or the market value of the instrument underlying the derivative, as applicable. By setting aside assets equal to only its net obligations under cash settled derivatives, the Fund will have the ability to employ leverage to a greater extent than if the Fund were required to segregate assets equal to the full notional amount of the derivative or the market value of the underlying instrument, as applicable.
Regulatory developments affecting the exchange-traded and OTC derivatives markets may impair the Fund's ability to manage or hedge its investment portfolio through the use of derivatives. The Dodd-Frank Wall Street Reform and Consumer Protection Act (the "Dodd-Frank Act") and the rules promulgated thereunder may limit the ability of the Fund to enter into one or more exchange-traded or OTC derivatives transactions. In particular, pursuant to authority granted under the Dodd-Frank Act, the CFTC in October 2011 promulgated final rules that impose new federal position limits on listed futures and options contracts on, and economically equivalent OTC derivatives referencing, 28 individual agricultural, metal and energy commodities. A fund's futures and options positions in these 28 contracts will be aggregated with its positions, if any, in economically equivalent OTC derivatives referencing these contracts. These new position limits, which will be imposed on the Fund and its counterparties, may impact the Fund's ability to invest in futures, options and swaps in a manner that efficiently meets its investment objective. Derivatives positions of all investment companies advised by the Adviser are combined for purposes of these limits. An exchange may order the liquidation of positions found to be in excess of these limits and may impose certain other sanctions or restrictions.
The Fund's use of derivatives may be limited by the requirements of the Code, for qualification as a regulated investment company for U.S. federal income tax purposes.
The CFTC eliminated limitations on futures trading by certain regulated entities, including registered investment companies, and consequently registered investment companies may engage in unlimited futures transactions and options thereon provided that the investment adviser to the company claims an exclusion from regulation as a commodity pool operator. In connection with its management of the Fund, the Adviser has claimed such an exclusion from registration as a commodity pool operator under the Commodity Exchange Act ("CEA"). Therefore, it is not subject to the registration and regulatory requirements of the CEA. Therefore, there are no limitations on the extent to which the Fund may engage in non-hedging transactions involving futures and options thereon except as set forth in the Fund's Prospectus or SAI. There is no overall limitation on the percentage of the Fund's net assets which may be subject to a hedge position.
Money Market Securities. In addition to the short-term fixed-income securities in which the Fund may otherwise invest, the Fund may invest in various money market securities, which among others may include commercial paper, bankers' acceptances, bank obligations, corporate debt securities, certificates of deposit, U.S. government securities, obligations of savings institutions and repurchase agreements. Such securities are limited to:
U.S. Government Securities. Obligations issued or guaranteed as to principal and interest by the United States or its agencies (such as the Export-Import Bank of the United States, Federal Housing Administration and Government National Mortgage Association) or its instrumentalities (such as the Federal Home Loan Bank), including Treasury bills, notes and bonds;
14
Bank Obligations. Obligations (including certificates of deposit, time deposits and bankers' acceptances) of banks subject to regulation by the U.S. Government and having total assets of $1 billion or more, and instruments secured by such obligations, not including obligations of foreign branches of domestic banks except to the extent below;
Eurodollar Certificates of Deposit. Eurodollar certificates of deposit issued by foreign branches of domestic banks having total assets of $1 billion or more;
Obligations of Savings Institutions. Certificates of deposit of savings banks and savings and loan associations, having total assets of $1 billion or more;
Fully Insured Certificates of Deposit. Certificates of deposit of banks and savings institutions, having total assets of less than $1 billion, if the principal amount of the obligation is federally insured by the Bank Insurance Fund or the Savings Association Insurance Fund (each of which is administered by the FDIC), limited to $250,000 principal amount per certificate (a temporary increase from $100,000, which is due to expire on December 31, 2013) and to 10% or less of the Fund's total assets in all such obligations and in all illiquid assets, in the aggregate;
Commercial Paper. Commercial paper rated within the two highest grades by Standard & Poor's Rating Group, a division of The McGraw-Hill Companies, Inc. ("S&P"), or by Moody's Investors Service, Inc. ("Moody's") or, if not rated, issued by a company having an outstanding debt issue rated at least AA by S&P or Aa by Moody's; and
Repurchase Agreements. The Fund may invest in repurchase agreements. When cash may be available for only a few days, it may be invested by the Fund in repurchase agreements until such time as it may otherwise be invested or used for payments of obligations of the Fund. These agreements typically involve the acquisition by the Fund of debt securities from a selling financial institution such as a bank, savings and loan association or broker-dealer. The agreement provides that the Fund will sell back to the institution, and that the institution will repurchase, the underlying securities serving as collateral at a specified price and at a fixed time in the future, usually not more than seven days from the date of purchase. The collateral will be marked-to-market daily to determine that the value of the collateral, as specified in the agreement, does not decrease below the purchase price plus accrued interest. If such decrease occurs, additional collateral will be requested and, when received, added to the account to maintain full collateralization. The Fund will accrue interest from the institution until the time when the repurchase is to occur. Although this date is deemed by the Fund to be the maturity date of a repurchase agreement, the maturities of securities subject to repurchase agreements are not subject to any limits.
While repurchase agreements involve certain risks not associated with direct investments in debt securities, the Fund follows procedures approved by the Trustees that are designed to minimize such risks. These procedures include effecting repurchase transactions only with large, well-capitalized and well-established financial institutions whose financial condition will be continually monitored by the Adviser. In addition, as described above, the value of the collateral underlying the repurchase agreement will be at least equal to the repurchase price, including any accrued interest earned on the repurchase agreement. In the event of a default or bankruptcy by a selling financial institution, the Fund will seek to liquidate such collateral. However, the exercising of the Fund's right to liquidate such collateral could involve certain costs or delays and, to the extent that proceeds from any sale upon a default of the obligation to repurchase were less than the repurchase price, the Fund could suffer a loss.
Loans of Portfolio Securities. The Fund may lend its portfolio securities to brokers, dealers, banks and other institutional investors. By lending its portfolio securities, the Fund attempts to increase its net investment income through the receipt of interest on the cash collateral with respect to the loan or fees received from the borrower in connection with the loan. Any gain or loss in the market price of the securities loaned that might occur during the term of the loan would be for the account of the Fund. The Fund employs an agent to implement the securities lending program and the agent receives a fee from the Fund for its services. The Fund will not lend more than 331/3% of the value of its total assets.
The Fund may lend its portfolio securities so long as the terms, structure and the aggregate amount of such loans are not inconsistent with the Investment Company Act or the rules and regulations or interpretations of the SEC thereunder, which currently require that (i) the borrower pledge and maintain with the Fund collateral consisting of liquid, unencumbered assets having a value at all times not less than 100% of the value of the securities loaned; (ii) the borrower add to such collateral whenever the price of the securities loaned rises (i.e., the borrower "marks to market" on a daily basis); (iii) the loan be made
15
subject to termination by the Fund at any time; and (iv) the Fund receives a reasonable return on the loan (which may include the Fund investing any cash collateral in interest bearing short-term investments), any distributions on the loaned securities and any increase in their market value. In addition, voting rights may pass with the loaned securities, but the Fund will retain the right to call any security in anticipation of a vote that the Adviser deems material to the security on loan.
There may be risks of delay and costs involved in recovery of securities or even loss of rights in the collateral should the borrower of the securities fail financially. These delays and costs could be greater for foreign securities. However, loans will be made only to borrowers deemed by the Adviser to be creditworthy and when, in the judgment of the Adviser, the income which can be earned from such securities loans justifies the attendant risk. All relevant facts and circumstances, including the creditworthiness of the broker, dealer, bank or institution, will be considered in making decisions with respect to the lending of securities, subject to review by the Fund's Board of Trustees. The Fund also bears the risk that the reinvestment of collateral will result in a principal loss. Finally, there is the risk that the price of the securities will increase while they are on loan and the collateral will not be adequate to cover their value.
Borrowing. The Fund has an operating policy, which may be changed by the Fund's Board of Trustees, not to borrow except from a bank for temporary or emergency purposes in amounts not exceeding 5% (taken at the lower of cost or current value) of its total assets (not including the amount borrowed). Should the Board of Trustees remove this operating policy, the Fund would be permitted to borrow money from banks in accordance with the Investment Company Act, or the rules and regulations promulgated by the SEC thereunder. Currently, the Investment Company Act permits a fund to borrow money from banks in an amount up to 331/3% of its total assets (including the amount borrowed) less its liabilities (not including any borrowings but including the fair market value at the time of computation of any other senior securities then outstanding). The Fund may also borrow an additional 5% of its total assets without regard to the foregoing limitation for temporary purposes such as clearance of portfolio transactions. The Fund will only borrow when the Adviser believes that such borrowings will benefit the Fund after taking into account considerations such as interest income and possible gains or losses upon liquidation. The Fund will maintain asset coverage in accordance with the Investment Company Act.
Borrowing by the Fund creates an opportunity for increased net income but, at the same time, creates special risks. For example, leveraging may exaggerate changes in and increase the volatility of the net asset value of Fund shares. This is because leverage tends to exaggerate the effect of any increase or decrease in the value of the Fund's portfolio securities. The use of leverage also may cause the Fund to liquidate portfolio positions when it may not be advantageous to do so to satisfy its obligations or to maintain asset coverage.
In general, the Fund may not issue any class of senior security, except that the Fund may (i) borrow from banks, provided that immediately following any such borrowing there is an asset coverage of at least 300% for all Fund borrowings and in the event such asset coverage falls below 300% the Fund will within three days or such longer period as the SEC may prescribe by rules and regulations, reduce the amount of its borrowings to an extent that the asset coverage of such borrowings shall be at least 300%, and (ii) engage in trading practices which could be deemed to involve the issuance of a senior security, including but not limited to options, futures, forward contracts and reverse repurchase agreements, provided that the Fund earmarks or segregates liquid assets in accordance with applicable SEC regulations and interpretations.
When-Issued and Delayed Delivery Securities and Forward Commitments. From time to time, the Fund may purchase securities on a when-issued or delayed delivery basis or may purchase or sell securities on a forward commitment basis. When these transactions are negotiated, the price is fixed at the time of the commitment, but delivery and payment can take place a month or more after the date of commitment. While the Fund will only purchase securities on a when-issued, delayed delivery or forward commitment basis with the intention of acquiring the securities, the Fund may sell the securities before the settlement date, if it is deemed advisable. The securities so purchased or sold are subject to market fluctuation and no interest or dividends accrue to the purchaser prior to the settlement date.
At the time the Fund makes the commitment to purchase or sell securities on a when-issued, delayed delivery or forward commitment basis, it will record the transaction and thereafter reflect the value, each day, of such security purchased, or if a sale, the proceeds to be received, in determining its net asset value. At the time of delivery of the securities, their value may be more or less than the purchase or sale price. An increase in the percentage of the Fund's assets committed to the purchase of securities on a when-issued, delayed delivery or forward commitment basis may increase the volatility of its net asset value. The
16
Fund will also earmark cash or liquid assets or establish a segregated account on the Fund's books in which it will continually maintain cash or cash equivalents or other liquid portfolio securities equal in value to commitments to purchase securities on a when-issued, delayed delivery or forward commitment basis.
When, As and If Issued Securities. The Fund may purchase securities on a "when, as and if issued" basis, under which the issuance of the security depends upon the occurrence of a subsequent event, such as approval of a merger, corporate reorganization or debt restructuring. The commitment for the purchase of any such security will not be recognized in the portfolio of the Fund until the Adviser determines that issuance of the security is probable. At that time, the Fund will record the transaction and, in determining its net asset value, will reflect the value of the security daily. At that time, the Fund will also establish a segregated account on the Fund's books in which it will maintain cash, cash equivalents or other liquid portfolio securities equal in value to recognized commitments for such securities.
An increase in the percentage of the Fund's assets committed to the purchase of securities on a "when, as and if issued" basis may increase the volatility of its net asset value. The Fund may also sell securities on a "when, as and if issued" basis provided that the issuance of the security will result automatically from the exchange or conversion of a security owned by the Fund at the time of sale.
Private Placements and Restricted Securities. The Fund may invest up to 10% of its net assets in securities which are subject to restrictions on resale because they have not been registered under the Securities Act of 1933, as amended (the "Securities Act"), or which are otherwise not readily marketable. (Securities eligible for resale pursuant to Rule 144A under the Securities Act, and determined to be liquid pursuant to the procedures discussed in the following paragraph, are not subject to the foregoing restriction.) These securities are generally referred to as private placements or restricted securities. Limitations on the resale of these securities may have an adverse effect on their marketability, and may prevent the Fund from disposing of them promptly at reasonable prices. The Fund may have to bear the expense of registering the securities for resale and the risk of substantial delays in effecting the registration.
Rule 144A permits the Fund to sell restricted securities to qualified institutional buyers without limitation. The Adviser, pursuant to procedures adopted by the Trustees, will make a determination as to the liquidity of each restricted security purchased by the Fund. If a restricted security is determined to be "liquid," the security will not be included within the category "illiquid securities," which may not exceed 15% of the Fund's net assets. However, investing in Rule 144A securities could have the effect of increasing the level of Fund illiquidity to the extent the Fund, at a particular point in time, may be unable to find qualified institutional buyers interested in purchasing such securities.
Private Investments in Public Equity. The Fund may purchase equity securities in a private placement that are issued by issuers who have outstanding, publicly-traded equity securities of the same class ("private investments in public equity" or "PIPES"). Shares in PIPES generally are not registered with the SEC until after a certain time period from the date the private sale is completed. This restricted period can last many months. Until the public registration process is completed, PIPES are restricted as to resale and the Fund cannot freely trade the securities. Generally, such restrictions cause the PIPES to be illiquid during this time. PIPES may contain provisions that the issuer will pay specified financial penalties to the holder if the issuer does not publicly register the restricted equity securities within a specified period of time, but there is no assurance that the restricted equity securities will be publicly registered, or that the registration will remain in effect.
Limited Partnerships. A limited partnership interest entitles the Fund to participate in the investment return of the partnership's assets as defined by the agreement among the partners. As a limited partner, the Fund generally is not permitted to participate in the management of the partnership. However, unlike a general partner whose liability is not limited, a limited partner's liability generally is limited to the amount of its commitment to the partnership.
Warrants and Subscription Rights. The Fund may acquire warrants and subscription rights attached to other securities. A warrant is, in effect, an option to purchase equity securities at a specific price, generally valid for a specific period of time, and has no voting rights, pays no dividends and has no rights with respect to the corporation issuing it. Warrants attached to portfolio securities are not subject to the foregoing limitations.
A subscription right is a privilege granted to existing shareholders of a corporation to subscribe to shares of a new issue of common stock before it is offered to the public. A subscription right normally has a life of two to four weeks and a subscription price lower than the current market value of the common stock.
17
Foreign Investment. Investing in foreign securities involves certain special considerations which are not typically associated with investments in the securities of U.S. issuers. Foreign issuers are not generally subject to uniform accounting, auditing and financial reporting standards and may have policies that are not comparable to those of domestic issuers. As a result, there may be less information available about foreign issuers than about domestic issuers. Securities of some foreign issuers may be less liquid and more volatile than securities of comparable domestic issuers. There is generally less government supervision and regulation of stock exchanges, brokers and listed issuers than in the United States. In addition, with respect to certain foreign countries, there is a possibility of expropriation or confiscatory taxation, political and social instability, or diplomatic development which could affect U.S. investments in those countries. The costs of investing in foreign countries frequently are higher than the costs of investing in the United States. Although the Adviser endeavors to achieve the most favorable execution costs in portfolio transactions, fixed commissions on many foreign stock exchanges are generally higher than negotiated commissions on U.S. exchanges.
Investments in securities of foreign issuers may be denominated in foreign currencies. Accordingly, the value of the Fund's assets, as measured in U.S. dollars, may be affected favorably or unfavorably by changes in currency exchange rates and in exchange control regulations. The Fund may incur costs in connection with conversions between various currencies.
Certain foreign governments levy withholding or other taxes on dividend and interest income. Although in some countries a portion of these taxes are recoverable, the non-recovered portion of foreign withholding taxes will reduce the income received from investments in such countries.
The Adviser may consider an issuer to be from a particular country or geographic region if (i) its principal securities trading market is in that country or geographic region; (ii) alone or on a consolidated basis it derives 50% or more of its annual revenue from goods produced, sales made or services performed in that country or geographic region; or (iii) it is organized under the laws of, or has a principal office in, that country or geographic region. By applying these tests, it is possible that a particular issuer could be deemed to be from more than one country or geographic region.
Emerging Market Securities. An emerging market security is one issued by a foreign government or private issuer that has one or more of the following characteristics: (i) its principal securities trading market is in an emerging market or developing country, (ii) alone or on a consolidated basis it derives 50% or more of its annual revenue from goods produced, sales made or services performed in emerging markets or (iii) it is organized under the laws of, or has a principal office in, an emerging market or developing country. Based on these criteria it is possible for a security to be considered issued by an issuer in more than one country. Therefore, it is possible for the securities of any issuer that has one or more of these characteristics in connection with any emerging market or developing country not to be considered an emerging market security if it also has one or more of these characteristics in connection with a developed country.
Emerging market describes any country which is generally considered to be an emerging or developing country by major organizations in the international financial community, such as the International Bank for Reconstruction and Development (more commonly known as the World Bank) and the International Finance Corporation. Emerging markets can include every nation in the world except the United States, Canada, Japan, Australia, New Zealand and most nations located in Western Europe.
The economies of individual emerging market or developing countries may differ favorably or unfavorably from the U.S. economy in such respects as growth of gross domestic product, rate of inflation, currency depreciation, capital reinvestment, resource self-sufficiency and balance of payments position. Further, the economies of developing countries generally are heavily dependent upon international trade and, accordingly, have been, and may continue to be, adversely affected by trade barriers, exchange controls, managed adjustments in relative currency values and other protectionist measures. These economies also have been, and may continue to be, adversely effected by economic conditions in the countries with which they trade.
Prior governmental approval for foreign investments may be required under certain circumstances in some emerging market or developing countries, and the extent of foreign investment in certain fixed-income securities and domestic companies may be subject to limitation in other emerging market or developing countries. Foreign ownership limitations also may be imposed by the charters of individual companies in emerging market or developing countries to prevent, among other concerns, violation of foreign investment limitations. Repatriation of investment income, capital and the proceeds of sales by
18
foreign investors may require governmental registration and/or approval in some emerging countries. The Fund could be adversely affected by delays in, or a refusal to grant, any required governmental registration or approval for such repatriation. Any investment subject to such repatriation controls will be considered illiquid if it appears reasonably likely that this process will take more than seven days.
Investment in emerging market or developing countries may entail purchasing securities issued by or on behalf of entities that are insolvent, bankrupt, in default or otherwise engaged in an attempt to reorganize or reschedule their obligations and in entities that have little or no proven credit rating or credit history. In any such case, the issuer's poor or deteriorating financial condition may increase the likelihood that the Fund will experience losses or diminution in available gains due to bankruptcy, insolvency or fraud. Emerging market or developing countries also pose the risk of nationalization, expropriation or confiscatory taxation, political changes, government regulation, social instability or diplomatic development (including war) that could affect adversely the economies of such countries or the value of a fund's investments in those countries. In addition, it may be difficult to obtain and enforce a judgment in a court outside the United States.
Investments in emerging markets may also be exposed to an extra degree of custodial and/or market risk, especially where the securities purchased are not traded on an official exchange or where ownership records regarding the securities are maintained by an unregulated entity (or even the issuer itself).
Depositary Receipts. Depositary Receipts represent an ownership interest in securities of foreign companies (an "underlying issuer") that are deposited with a depositary. Depositary Receipts are not necessarily denominated in the same currency as the underlying securities. Depositary Receipts include American Depositary Receipts ("ADRs"), Global Depositary Receipts ("GDRs") and other types of Depositary Receipts (which, together with ADRs and GDRs, are hereinafter collectively referred to as "Depositary Receipts"). ADRs are dollar-denominated Depositary Receipts typically issued by a U.S. financial institution which evidence an ownership interest in a security or pool of securities issued by a foreign issuer. ADRs are listed and traded in the United States. GDRs and other types of Depositary Receipts are typically issued by foreign banks or trust companies, although they also may be issued by U.S. financial institutions, and evidence ownership interests in a security or pool of securities issued by either a foreign or a U.S. corporation. Generally, Depositary Receipts in registered form are designed for use in the U.S. securities market and Depositary Receipts in bearer form are designed for use in securities markets outside the United States.
Depositary Receipts may be "sponsored" or "unsponsored." Sponsored Depositary Receipts are established jointly by a depositary and the underlying issuer, whereas unsponsored Depositary Receipts may be established by a depositary without participation by the underlying issuer. Holders of unsponsored Depositary Receipts generally bear all the costs associated with establishing unsponsored Depositary Receipts. In addition, the issuers of the securities underlying unsponsored Depositary Receipts are not obligated to disclose material information in the United States and, therefore, there may be less information available regarding such issuers and there may not be a correlation between such information and the market value of the Depositary Receipts. For purposes of the Fund's investment policies, the Fund's investments in Depositary Receipts will be deemed to be an investment in the underlying securities, except that ADRs may be deemed to be issued by a U.S. issuer.
Brady Bonds. Brady Bonds are emerging market securities. They are created by exchanging existing commercial bank loans to foreign entities for new obligations for the purpose of restructuring the issuers' debts under a plan introduced by former U.S. Secretary of the Treasury, Nicholas F. Brady (the Brady Plan). Brady Bonds have been issued fairly recently, and, accordingly, do not have a long payment history. They may be collateralized or uncollateralized and issued in various currencies (although most are dollar-denominated). They are actively traded in the over-the-counter secondary market. The Fund will only invest in Brady Bonds consistent with quality specifications.
Dollar-denominated, collateralized Brady Bonds may be fixed rate par bonds or floating rate discount bonds. These Brady Bonds are generally collateralized in full as to principal due at maturity by U.S. Treasury Zero Coupon Obligations having the same maturity as the Brady Bonds. Interest payments on these Brady Bonds generally are collateralized by cash or securities in an amount that, in the case of fixed rate bonds, is equal to at least one year of rolling interest payments or, in the case of floating rate bonds, initially is equal to at least one year's rolling interest payments based on the applicable interest rate at that time and is adjusted at regular intervals thereafter. Certain Brady Bonds are entitled
19
to "value recovery payments" in certain circumstances, which in effect constitute supplemental interest payments but generally are not collateralized.
Brady Bonds are often viewed as having three or four valuation components: (i) the collateralized repayment of principal at final maturity; (ii) the collateralized interest payments; (iii) the uncollateralized interest payments; and (iv) any uncollateralized repayment of principal at maturity (these uncollateralized amounts constitute the "residual risk"). In the event of a default with respect to collateralized Brady Bonds as a result of which the payment obligations of the issuer are accelerated, the U.S. Treasury Zero Coupon Obligations held as collateral for the payment of principal will not be distributed to investors, nor will such obligations be sold and the proceeds distributed. The collateral will be held by the collateral agent to the scheduled maturity of the defaulted Brady Bonds, which will continue to be outstanding, at which time the face amount of the collateral will equal the principal payments due on the Brady Bonds in the normal course. In light of the residual risk of the Brady Bonds and, among other factors, the history of default with respect to commercial bank loans by public and private entities of countries issuing Brady Bonds, investments in Brady Bonds generally are viewed as speculative.
Sovereign Debt. Debt obligations known as "sovereign debt" are obligations of governmental issuers in emerging market countries and industrialized countries. Certain emerging market countries are among the largest debtors to commercial banks and foreign governments. The issuer or governmental authority that controls the repayment of sovereign debt may not be willing or able to repay the principal and/or pay interest when due in accordance with the terms of such obligations.
A governmental entity's willingness or ability to repay principal and pay interest due in a timely manner may be affected by, among other factors, its cash flow situation, the extent of its foreign reserves, the availability of sufficient foreign exchange on the date a payment is due, the relative size of the debt service burden to the economy as a whole, the government's dependence on expected disbursements from third parties, the government's policy toward the International Monetary Fund and the political constraints to which a government may be subject. Governmental entities may also be dependent on expected disbursements from foreign governments, multilateral agencies and others abroad to reduce principal and interest arrearages on their debt. The commitment on the part of these governments, agencies and others to make such disbursements may be conditioned on a debtor's implementation of economic reforms or economic performance and the timely service of such debtor's obligations. Failure to implement such reforms, achieve such levels of economic performance or repay principal or interest when due may result in the cancellation of such third parties' commitments to lend funds to the government debtor, which may further impair such debtor's ability or willingness to timely service its debts. Holders of sovereign debt may be requested to participate in the rescheduling of such debt and to extend further loans to governmental entities. In addition, no assurance can be given that the holders of commercial bank debt will not contest payments to the holders of other foreign government debt obligations in the event of default under their commercial bank loan agreements. The issuers of the government debt securities in which the Fund may invest have in the past experienced substantial difficulties in servicing their external debt obligations, which led to defaults on certain obligations and the restructuring of certain indebtedness. Restructuring arrangements have included, among other things, reducing and rescheduling interest and principal payments by negotiating new or amended credit agreements or converting outstanding principal and unpaid interest to Brady Bonds, and obtaining new credit to finance interest payments. There can be no assurance that the Brady Bonds and other foreign government debt securities in which the Fund may invest will not be subject to similar restructuring arrangements or to requests for new credit, which may adversely affect the Fund's holdings. Furthermore, certain participants in the secondary market for such debt may be directly involved in negotiating the terms of these arrangements and may therefore have access to information not available to other market participants.
Below Investment Grade Securities. Below investment grade securities are generally rated less than Baa by Moody's or BBB by Standard & Poor's and are commonly referred to as "junk bonds" or high yield, high risk securities. Such securities carry a high degree of risk and are considered speculative by the major credit rating agencies. See Appendix B for more information about fixed income security ratings.
While fixed income securities rated below investment grade offer high yields, they also normally carry with them a greater degree of risk than securities with higher ratings. Lower-rated bonds are considered speculative. Compared with investment grade securities, the values of below investment grade securities tend to be more volatile and may react with greater sensitivity to changes in interest rates.
20
Below investment grade securities are subject to credit risk. Default rates and recoveries fluctuate, driven by numerous factors including the general economy. In addition, the secondary market for these securities is generally less liquid than that for investment grade securities. In periods of reduced market liquidity, below investment grade bond prices may become more volatile, and both the market and the Fund may experience sudden and substantial price declines.
A lower level of liquidity might have an effect on the Fund's ability to value or dispose of such securities. Also, there may be significant disparities in the prices quoted for such securities by various dealers. Under such conditions, the Fund may find it difficult to value its securities accurately. The Fund may also be forced to sell securities at a significant loss in order to meet shareholder redemptions. These factors add to the risks associated with investing in below investment grade securities.
Real Estate Investment Trusts ("REITs"). REITs pool investors' funds for investment primarily in real estate properties or real estate-related loans. REITs generally derive their income from rents on the underlying properties or interest on the underlying loans, and their value is impacted by changes in the value of the underlying property or changes in interest rates affecting the underlying loans owned by the REITs. REITs are more susceptible to risks associated with the ownership of real estate and the real estate industry in general. These risks can include fluctuations in the value of underlying properties; defaults by borrowers of tenants; market saturation; changes in general and local economic conditions; decreases in market rates for rents; increases in competition, property taxes, capital expenditures or operating expenses; and other economic, political or regulatory occurrences affecting the real estate industry. In addition, REITs depend upon specialized management skills, may not be diversified (which may increase the volatility of a REIT's value), may have less trading volume and may be subject to more abrupt or erratic price movements than the overall securities market. Operating REITs requires specialized management skills and the Fund indirectly bears REIT management expenses along with the direct expenses of the Fund. REITs are not taxed on income distributed to shareholders provided they comply with several requirements of the Internal Revenue Code of 1986, as amended (the "Code"). REITs are subject to the risk of failing to qualify for tax-free pass-through of income under the Code.
Investment Company Securities. Investment company securities are securities of other open-end, closed-end and unregistered investment companies, including foreign investment companies and exchange-traded funds. The Fund may invest in investment company securities as may be permitted by (i) the Investment Company Act, as amended from time to time; (ii) the rules and regulations promulgated by the SEC under the Investment Company Act, as amended from time to time; or (iii) an exemption or other relief applicable to the Fund from provisions of the Investment Company Act, as amended from time to time. The Investment Company Act generally prohibits an investment company from acquiring more than 3% of the outstanding voting shares of an investment company and limits such investments to no more than 5% of a portfolio's total assets in any one investment company, and no more than 10% in any combination of investment companies. The Fund may invest in investment company securities of investment companies managed by the Adviser or its affiliates to the extent permitted under the Investment Company Act or as otherwise authorized by the SEC. To the extent the Fund invests a portion of its assets in investment company securities, those assets will be subject to the risks of the purchased investment company's portfolio securities, and a shareholder in the Fund will bear not only his proportionate share of the expenses of the Fund, but also, indirectly the expenses of the purchased investment company.
To the extent permitted by applicable law, the Fund may invest all or some of its short term cash investments in any money market fund advised or managed by the Adviser or its affiliates. In connection with any such investments, the Fund, to the extent permitted by the Investment Company Act, will pay its share of all expenses (other than advisory and administrative fees) of a money market fund in which it invests which may result in the Fund bearing some additional expenses.
Exchange-Traded Funds ("ETFs"). The Fund may invest in shares of various ETFs, including exchange-traded index and bond funds. Exchange-traded index funds seek to track the performance of various securities indices. Shares of ETFs have many of the same risks as direct investments in common stocks or bonds. In addition, their market value is expected to rise and fall as the value of the underlying index or bond rises and falls. The market value of their shares may differ from the net asset value of the particular fund. As a shareholder in an ETF (as with other investment companies), the Fund would bear its ratable share of that entity's expenses. At the same time, the Fund would continue to pay its own investment management fees and other expenses. As a result, the Fund and its shareholders, in effect, will be absorbing duplicate levels of fees with respect to
21
investments in ETFs. Further, certain of the ETFs in which the Fund may invest are leveraged. The more the Fund invests in such leveraged ETFs, the more this leverage will magnify any losses on those investments.
Reverse Repurchase Agreements. The Fund may also use reverse repurchase agreements as part of its investment strategy. Reverse repurchase agreements involve sales by the Fund of portfolio assets concurrently with an agreement by the Fund to repurchase the same assets at a later date at a fixed price. Generally, the effect of such a transaction is that the Fund can recover all or most of the cash invested in the portfolio securities involved during the term of the reverse repurchase agreement, while it will be able to keep the interest income associated with those portfolio securities. Such transactions are only advantageous if the interest cost to the Fund of the reverse repurchase transaction is less than the cost of obtaining the cash otherwise. Opportunities to achieve this advantage may not always be available, and the Fund intends to use the reverse repurchase technique only when it will be to its advantage to do so. The Fund will earmark cash or liquid assets or establish a segregated account with its custodian bank in which it will maintain cash or cash equivalents or other portfolio securities equal in value to its obligations in respect of reverse repurchase agreements. Reverse repurchase agreements are considered borrowings by the Fund and for purposes other than meeting redemptions may not exceed 5% of the Fund's total assets.
Commercial Mortgage Backed Securities ("CMBS"). The Fund may invest in CMBSs. CMBS are generally multi-class or pass-through securities issued by special purpose entities that represent an undivided interest in a portfolio of mortgage loans backed by commercial properties, including, but not limited to, industrial and warehouse properties, office buildings, retail space and shopping malls, hotels, healthcare facilities, multifamily properties and cooperative apartments. Private lenders, such as banks or insurance companies, originate these loans and then sell the loans directly into a CMBS trust or other entity. The commercial mortgage loans that underlie CMBS are generally not amortizing or not fully amortizing. That is, at their maturity date, repayment of the remaining principal balance or "balloon" is due and is repaid through the attainment of an additional loan or sale of this property. An extension of the final payment on commercial mortgages will increase the average life of the CMBS, generally resulting in lower yield for discount bonds and a higher yield for premium bonds.
CMBS are subject to credit risk and prepayment risk. Although prepayment risk is present, it is of a lesser degree in the CMBS than in the residential mortgage market; commercial real estate property loans often contain provisions which substantially reduce the likelihood that such securities will be prepaid (e.g., significant prepayment penalties on loans and, in some cases, prohibition on principal payments for several years following origination).
Collateralized Mortgage Obligations ("CMOs"). The Fund may invest in CMOs, which are mortgage-backed securities that are collateralized by mortgage loans or mortgage pass-through securities, and multi-class pass-through securities, which are equity interests in a trust composed of mortgage loans or other mortgage backed securities. Unless the context indicates otherwise, the discussion of CMOs below also applies to multi-class pass through securities.
CMOs may be issued by governmental or government-related entities or by private entities, such as banks, savings and loan institutions, private mortgage insurance companies, mortgage bankers and other secondary market traders. CMOs are issued in multiple classes, often referred to as "tranches," with each tranche having a specific fixed or floating coupon rate and stated maturity or final distribution date. Under the traditional CMO structure, the cash flows generated by the mortgages or mortgage pass-through securities in the collateral pool are used to first pay interest and then pay principal to the holders of the CMOs. Subject to the various provisions of individual CMO issues, the cash flow generated by the underlying collateral (to the extent it exceeds the amount required to pay the stated interest) is used to retire the bonds.
The principal and interest on the underlying collateral may be allocated among the several tranches of a CMO in innumerable ways. In a common CMO structure, the tranches are retired sequentially in the order of their respective stated maturities or final distribution dates (as opposed to the pro-rata return of principal found in traditional pass-through obligations). The fastest-pay tranches would initially receive all principal payments. When those tranches are retired, the next tranches in the sequence receive all of the principal payments until they are retired. The sequential retirement of bond groups continues until the last tranche is retired. Accordingly, the CMO structure allows the issuer to use cash flows of long maturity,
22
monthly-pay collateral to formulate securities with short, intermediate, and long final maturities and expected average lives and risk characteristics.
The primary risk of CMOs is the uncertainty of the timing of cash flows that results from the rate of prepayments on the underlying mortgages serving as collateral and from the structure of the particular CMO transaction (that is, the priority of the individual tranches). An increase or decrease in prepayment rates (resulting from a decrease or increase in mortgage interest rates) may cause the CMOs to be retired substantially earlier than their stated maturities or final distribution dates and will affect the yield and price of CMOs. In addition, the collateral securing CMOs or any third party guarantees are insufficient to make payments, the Fund could sustain a loss. The prices of certain CMOs, depending on their structure and the rate of prepayments, can be volatile. Some CMOs may also not be as liquid as other types of mortgage securities. As a result, it may be difficult or impossible to sell the securities at an advantageous time or price.
New types of CMO tranches have evolved. These include floating rate CMOs, planned amortization classes, accrual bonds and CMO residuals. These newer structures affect the amount and timing of principal and interest received by each tranche from the underlying collateral. Under certain of these newer structures, given classes of CMOs have priority over others with respect to the receipt of prepayments on the mortgages. Therefore, depending on the type of CMOs in which a fund invests, the investment may be subject to a greater or lesser risk of prepayment than other types of mortgage-backed securities.
CMOs may include real estate investment conduits ("REMICs"). REMICs, which were authorized under the Tax Reform Act of 1986, are private entities formed for the purpose of holding a fixed pool of mortgages secured by an interest in real property. A REMIC is a CMO that qualifies for special tax treatment under the Internal Revenue Code and invests in certain mortgages principally secured by interests in real property.
The Fund may invest in, among others, parallel pay CMOs and Planned Amortization Class CMOs ("PAC Bonds"). Parallel pay CMOs are structured to provide payments of principal on each payment date to more than one tranche. These simultaneous payments are taken into account in calculating the stated maturity date or final distribution date of each tranche which, as with other CMO structures, must be retired by its stated maturity date or final distribution date but may be retired earlier. PAC Bonds are a form of parallel pay CMO, with the required principal payment on such securities having the highest priority after interest has been paid to all classes. PAC Bonds generally require payments of a specified amount of principal on each payment date.
Stripped Mortgage-Backed Securities ("SMBS"). The Fund may invest in SMBS. An SMBS is a derivative multi-class mortgage security. SMBS usually are structured with two classes that receive different proportions of the interest and principal distribution on a pool of mortgage assets. In the most extreme case, one class will receive all of the interest (the interest-only or "IO" class), while the other class will receive all of the principal (the principal-only or "PO" class). The yield to maturity on an IO class is extremely sensitive to the rate of principal payments (including prepayments) on the related underlying mortgage assets, and a rapid rate of principal payments may have a material adverse effect on such security's yield to maturity. If the underlying mortgage assets experience greater than anticipated prepayments of principal, the Fund may fail to fully recoup its initial investment in these securities. Conversely, if the underlying mortgage assets experience less than anticipated prepayments of principal, the yield of POs could be materially adversely affected. The market values of IOs and POs are subject to greater risk of fluctuation in response to changes in market rates of interest than many other types of government securities. To the extent the Fund invests in IOs and POs, this increases the risk of fluctuations in the net asset value of the Fund.
Asset-Backed Securities. The Fund may invest in asset-backed securities. Asset-backed securities utilize the securitization techniques used to develop mortgage-backed securities. These techniques are also applied to a broad range of other assets. Various types of assets, primarily automobile and credit card receivables and home equity loans, are being securitized in pass-through structures similar to the mortgage pass-through structures. These types of securities are known as asset-backed securities. The Fund may invest in any type of asset-backed security. Asset-backed securities have risk characteristics similar to mortgage-backed securities. Like mortgage-backed securities, they generally decrease in value as a result of interest rate increases, but may benefit less than other fixed-income securities from declining interest rates, principally because of prepayments. Also, as in the case of mortgage-backed securities, prepayments generally increase during a period of declining interest rates although other factors, such as changes in credit use and payment patterns, may also influence prepayment rates. Asset-backed securities also involve the risk
23
that various federal and state consumer laws and other legal, regulatory and economic factors may result in the collateral backing the securities being insufficient to support payment on the securities.
Inverse Floaters. Inverse floating rate obligations are obligations which pay interest at rates that vary inversely with changes in market rates of interest. Because the interest rate paid to holders of such obligations is generally determined by subtracting a variable or floating rate from a predetermined amount, the interest rate paid to holders of such obligations will decrease as such variable or floating rate increases and increase as such variable or floating rate decreases. Like most other fixed-income securities, the value of inverse floaters will decrease as interest rates increase. They are more volatile, however, than most other fixed-income securities because the coupon rate on an inverse floater typically changes at a multiple of the change in the relevant index rate. Thus, any rise in the index rate (as a consequence of an increase in interest rates) causes a correspondingly greater drop in the coupon rate of an inverse floater while a drop in the index rate causes a correspondingly greater increase in the coupon of an inverse floater. Some inverse floaters may also increase or decrease substantially because of changes in the rate of prepayments.
C. Fund Policies/Investment Restrictions
The investment objective, policies and restrictions listed below have been adopted by the Fund as fundamental policies. Under the Investment Company Act, a fundamental policy may not be changed without the vote of a majority of the outstanding voting securities of the Fund. The Investment Company Act defines a majority as the lesser of (a) 67% or more of the shares present at a meeting of shareholders, if the holders of 50% of the outstanding shares of the Fund are present or represented by proxy; or (b) more than 50% of the outstanding shares of the Fund. For purposes of the following restrictions: (i) all percentage limitations apply immediately after a purchase or initial investment, and (ii) any subsequent change in any applicable percentage resulting from market fluctuations or other changes in total or net assets does not require elimination of any security from the portfolio, except in the case of borrowing and investments in illiquid securities.
The Fund will:
1. Seek to maximize the total return on its investments.
The Fund will not:
1. Invest 25% or more of the value of its total assets in securities of issuers in any one industry. This restriction does not apply to obligations issued or guaranteed by the U.S. Government or its agencies or instrumentalities.
2. Purchase or sell physical commodities unless acquired as a result of ownership of securities or other instruments; provided that this restriction shall not prohibit the Fund from purchasing or selling options, futures contracts and related options thereon, forward contracts, swaps, caps, floors, collars and any other financial instruments or from investing in securities or other instruments backed by physical commodities or as otherwise permitted by (i) the Investment Company Act, as amended from time to time, (ii) the rules and regulations promulgated by the SEC under the Investment Company Act, as amended from time to time, or (iii) an exemption or other relief applicable to the Fund from the provisions of the Investment Company Act, as amended from time to time.
3. Purchase or sell real estate or interests therein, although the Fund may purchase securities of issuers which engage in real estate operations and securities secured by real estate or interests therein.
4. Borrow money, except the Fund may borrow money to the extent permitted by (i) the Investment Company Act, as amended from time to time, (ii) the rules and regulations promulgated by the SEC under the Investment Company Act, as amended from time to time, or (iii) an exemption or other relief applicable to the Fund from the provisions of the Investment Company Act, as amended from time to time.
5. Issue senior securities, except the Fund may issue senior securities to the extent permitted by (i) the Investment Company Act, as amended from time to time, (ii) the rules and regulations promulgated by the SEC under the Investment Company Act, as amended from time to time, or (iii) an exemption or other relief applicable to the Fund from the provisions of the Investment Company Act, as amended from time to time.
6. Make loans of money or property to any person, except (a) to the extent that securities or interests in which the Fund may invest are considered to be loans, (b) through the loan of portfolio securities, (c) by engaging in repurchase agreements or (d) as may otherwise be permitted by (i) the Investment Company
24
Act, as amended from time to time, (ii) the rules and regulations promulgated by the SEC under the Investment Company Act, as amended from time to time, or (iii) an exemption or other relief applicable to the Fund from the provisions of the Investment Company Act, as amended from time to time.
7. Engage in the underwriting of securities, except insofar as the Fund may be deemed an underwriter under the Securities Act in disposing of a portfolio security.
8. Invest in a manner inconsistent with its classification as a "diversified company" as provided by (i) the Investment Company Act, as amended from time to time, (ii) the rules and regulations promulgated by the SEC under the Investment Company Act, as amended from time to time, or (iii) an exemption or other relief applicable to the Fund from the provisions of the Investment Company Act, as amended from time to time.
In addition, as a non-fundamental policy, which can be changed with Board approval and without shareholder vote, the Fund will not:
1. Make short sales of securities, except short sales against the box.
2. Invest its assets in the securities of any investment company except as may permitted by (i) the Investment Company Act, as amended from time to time; (ii) the rules and regulations promulgated by the SEC under the Investment Company Act, as amended from time to time; or (iii) an exemption or other relief applicable to the Fund from the provisions of the Investment Company Act, as amended from time to time.
3. Invest more than 15% of its net assets or such other amount as may be permitted by SEC guidelines in illiquid securities, including restricted securities.
4. Invest in other investment companies in reliance on Sections 12(d)(1)(F), 12(d)(1)(G) or 12(d)(1)(J) of the Investment Company Act.
The Fund has an operating policy, which may be changed by the Fund's Board of Trustees, not to borrow except from a bank for temporary or emergency purposes in amounts not exceeding 5% (taken at the lower of cost or current value) of its total assets (not including the amount borrowed).
Notwithstanding any other investment policy or restriction, the Fund may seek to achieve its investment objective by investing all or substantially all of its assets in another investment company having substantially the same investment objective and policies as the Fund.
D. Disclosure of Portfolio Holdings
The Fund's Board of Trustees and the Adviser have adopted policies and procedures regarding disclosure of portfolio holdings (the "Policy"). Pursuant to the Policy, the Adviser may disclose information concerning Fund portfolio holdings only if such disclosure is consistent with the antifraud provisions of the federal securities laws and the Fund's and the Adviser's fiduciary duties to Fund shareholders. The Adviser may not receive compensation or any other consideration in connection with the disclosure of information about the portfolio securities of the Fund. Consideration includes any agreement to maintain assets in the Fund or in other investment companies or accounts managed by the Adviser or by any affiliated person of the Adviser. Non-public information concerning portfolio holdings may be divulged to third parties only when the Fund has a legitimate business purpose for doing so and the recipients of the information are subject to a duty of confidentiality. Under no circumstances shall current or prospective Fund shareholders receive non-public portfolio holdings information, except as described below.
The Fund makes available on its public website the following portfolio holdings information:
• complete portfolio holdings information monthly, at least 15 calendar days after the end of each month; and
• top 10 holdings monthly, at least 15 calendar days after the end of each month.
The Fund provides a complete schedule of portfolio holdings for the second and fourth fiscal quarters in its semiannual and annual reports, and for the first and third fiscal quarters in its filings with the SEC on Form N-Q.
All other portfolio holdings information that has not been disseminated in a manner making it available to investors generally as described above is non-public information for purposes of the Policy.
25
The Fund may make selective disclosure of non-public portfolio holdings. Third parties eligible to receive such disclosures currently include fund rating agencies, information exchange subscribers, consultants and analysts, portfolio analytics providers and service providers, provided that the third party expressly agrees to maintain the disclosed information in confidence and not to trade portfolio securities based on the non-public information. Non-public portfolio holdings information may not be disclosed to a third party unless and until the arrangement has been reviewed and approved pursuant to the requirements set forth in the Policy. Subject to the terms and conditions of any agreement between the Adviser or the Fund and the third party recipient, if these conditions for disclosure are satisfied, there shall be no restriction on the frequency with which Fund non-public portfolio holdings information is released, and no lag period shall apply (unless otherwise indicated below).
The Adviser may provide interest lists to broker-dealers who execute securities transactions for the Fund without entering into a non-disclosure agreement with the broker-dealers, provided that the interest list satisfies all of the following criteria: (1) the interest list must contain only the CUSIP numbers and/or ticker symbols of securities held in all registered management investment companies advised by the Adviser or any affiliate of the Adviser (the "MSIM Funds") on an aggregate, rather than a fund-by-fund basis; (2) the interest list must not contain information about the number or value of shares owned by a specified MSIM Fund; (3) the interest list may identify the investment strategy, but not the particular MSIM Funds, to which the list relates; and (4) the interest list may not identify the portfolio manager or team members responsible for managing the MSIM Funds.
Fund shareholders may elect in some circumstances to redeem their shares of the Fund in exchange for their pro rata share of the securities held by the Fund. Under such circumstances, Fund shareholders may receive a complete listing of the holdings of the Fund up to seven calendar days prior to making the redemption request provided that they represent orally or in writing that they agree not to disclose or trade on the basis of the portfolio holdings information.
The Fund may discuss or otherwise disclose performance attribution analyses (i.e., mention the effects of having a particular security in the portfolio(s)) where such discussion is not contemporaneously made public, provided that the particular holding has been disclosed publicly. Additionally, any discussion of the analyses may not be more current than the date the holding was disclosed publicly.
The Fund may disclose portfolio holdings to transition managers, provided that the Fund has entered into a non-disclosure or confidentiality agreement with the party requesting that the information be provided to the transition manager and the party to the non-disclosure agreement has, in turn, entered into a non-disclosure or confidentiality agreement with the transition manager.
The Adviser and/or the Fund have entered into ongoing arrangements to make available public and/or non-public information about the Fund's portfolio securities, provided that the recipient of the information falls into one or more of the categories listed below, and the recipient has entered into a non-disclosure agreement with the Fund, or owes a duty of trust or confidence to the Adviser or the Fund, the recipient may receive portfolio holdings information pursuant to such agreement without obtaining pre-approval from either the Portfolio Holdings Review Committee ("PHRC") or the Fund's Board of Trustees. In all such instances, however, the PHRC will be responsible for reporting to the Fund's Board of Trustees, or designated committee thereof, material information concerning the ongoing arrangements at each Board's next regularly scheduled Board meeting. Categories of parties eligible to receive information pursuant to such ongoing arrangements include fund rating agencies, information exchange subscribers, consultants and analysts, portfolio analytics providers and service providers.
The Adviser and/or the Fund currently have entered into ongoing arrangements with the following parties:
| Name | Information Disclosed | Frequency(1) | Lag Time | ||||||||||||
| Service Providers | |||||||||||||||
| RiskMetrics Group (proxy voting agent)(*) | Complete portfolio holdings | Daily basis | (2) | ||||||||||||
| FT Interactive Data Pricing Service Provider(*) | Complete portfolio holdings | As needed | (2) | ||||||||||||
| State Street Bank and Trust Company(*) | Complete portfolio holdings | As needed | (2) | ||||||||||||
26
| Name | Information Disclosed | Frequency(1) | Lag Time | ||||||||||||
| Fund Rating Agencies | |||||||||||||||
| Lipper(*) | Top ten and complete portfolio holdings | Quarterly basis | Approximately 15 days after quarter end and approximately 30 days after quarter end | ||||||||||||
| Morningstar(**) | Top ten and complete portfolio holdings | Quarterly basis | Approximately 15 days after quarter end and approximately 30 days after quarter end | ||||||||||||
| Standard & Poor's(*) | Complete portfolio holdings | Quarterly basis | Approximately 15 day lag | ||||||||||||
| Investment Company Institute(**) | Top ten portfolio holdings | Quarterly basis | Approximately 15 days after quarter end | ||||||||||||
| Consultants and Analysts | |||||||||||||||
| Americh Massena & Associates, Inc.(*) | Top ten and complete portfolio holdings | Quarterly basis(5) | Approximately 10-12 days after quarter end | ||||||||||||
| Bloomberg(**) | Complete portfolio holdings | Quarterly basis | Approximately 30 days after quarter end | ||||||||||||
| Callan Associates(*) | Top ten and complete portfolio holdings | Monthly and quarterly basis, respectively(5) | Approximately 10-12 days after month/quarter end | ||||||||||||
| Cambridge Associates(*) | Top ten and complete portfolio holdings | Quarterly basis(5) | Approximately 10-12 days after quarter end | ||||||||||||
| Citigroup(*) | Complete portfolio holdings | Quarterly basis(5) | At least one day after quarter end | ||||||||||||
| Credit Suisse First Boston(*) | Top ten and complete portfolio holdings | Monthly and quarterly basis, respectively | Approximately 10-12 days after month/quarter end | ||||||||||||
| CTC Consulting, Inc.(*) | Top ten and complete portfolio holdings | Quarterly basis | Approximately 15 days after quarter end and approximately 30 days after quarter end, respectively | ||||||||||||
| Evaluation Associates(*) | Top ten and complete portfolio holdings | Monthly and quarterly basis, respectively(5) | Approximately 10-12 days after month/quarter end | ||||||||||||
| Fund Evaluation Group(**) | Top ten portfolio holdings(3) | Quarterly basis | At least 15 days after quarter end | ||||||||||||
| Jeffrey Slocum & Associates(*) | Complete portfolio holdings(4) | Quarterly basis(5) | Approximately 10-12 days after quarter end | ||||||||||||
| Hammond Associates(**) | Complete portfolio holdings(4) | Quarterly basis | At least 30 days after quarter end | ||||||||||||
| Hartland & Co.(**) | Complete portfolio holdings(4) | Quarterly basis | At least 30 days after quarter end | ||||||||||||
| Hewitt EnnisKnupp(*) | Top ten and complete portfolio holdings | Monthly and quarterly basis, respectively(5) | Approximately 10-12 days after month/quarter end | ||||||||||||
| Merrill Lynch(*) | Top ten and complete portfolio holdings | Monthly and quarterly basis, respectively(5) | Approximately 10-12 days after month/quarter end | ||||||||||||
| Mobius(**) | Top ten portfolio holdings(3) | Monthly basis | At least 15 days after month end | ||||||||||||
| Nelsons(**) | Top ten portfolio holdings(3) | Quarterly basis | At least 15 days after quarter end | ||||||||||||
| Prime, Buchholz & Associates, Inc.(**) | Complete portfolio holdings(4) | Quarterly basis | At least 30 days after quarter end | ||||||||||||
| PSN(**) | Top ten portfolio holdings(3) | Quarterly basis | At least 15 days after quarter end | ||||||||||||
| PFM Asset Management LLC(*) | Top ten and complete portfolio holdings | Quarterly basis(5) | Approximately 10-12 days after quarter end | ||||||||||||
27
| Name | Information Disclosed | Frequency(1) | Lag Time | ||||||||||||
| Russell Investment Group/Russell/ Mellon Analytical Services, Inc.(**) | Top ten and complete portfolio holdings | Monthly and quarterly basis | At least 15 days after month end and at least 30 days after quarter end, repectively | ||||||||||||
| Stratford Advisory Group, Inc.(*) | Top ten portfolio holdings(6) | Quarterly basis(5) | Approximately 10-12 days after quarter end | ||||||||||||
| Thompson Financial(**) | Complete portfolio holdings(4) | Quarterly basis | At least 30 days after quarter end | ||||||||||||
| Watershed Investment Consultants, Inc.(*) | Top ten and complete portfolio holdings | Quarterly basis(5) | Approximately 10-12 days after quarter end | ||||||||||||
| Yanni Partners(**) | Top ten portfolio holdings(3) | Quarterly basis | At least 15 days after quarter end | ||||||||||||
| Portfolio Analytics Providers | |||||||||||||||
| FactSet Research Systems, Inc.(*) | Complete portfolio holdings | Daily basis | One day | ||||||||||||
(*) This entity has agreed to maintain Fund non-public portfolio holdings information in confidence and not to trade portfolio securities based on the non-public portfolio holdings information.
(**) The Fund does not currently have a non-disclosure agreement in place with this entity and therefore the entity can only receive publicly available information.
(1) Dissemination of portfolio holdings information to entities listed above may occur less frequently than indicated (or not at all).
(2) Information will typically be provided on a real time basis or as soon thereafter as possible.
(3) Complete portfolio holdings will also be provided upon request from time to time on a quarterly basis, with at least a 30 day lag.
(4) Top ten portfolio holdings will also be provided upon request from time to time, with at least a 15 day lag.
(5) This information will also be provided upon request from time to time.
(6) Complete portfolio holdings will also be provided upon request from time to time.
In addition, persons who owe a duty of trust or confidence to the Adviser or the Fund may receive non-public portfolio holdings information without entering into a non-disclosure agreement. Currently, these persons include (i) the Fund's independent registered public accounting firm (as of the Fund's fiscal year end and on an as needed basis), (ii) counsel to the Fund (on an as needed basis), (iii) counsel to the Independent Trustees (on an as needed basis) and (iv) members of the Board of Trustees (on an as needed basis).
All selective disclosures of non-public portfolio holdings information made to third parties pursuant to the exemptions set forth in the Policy must be pre-approved by both the PHRC and the Fund's Board of Trustees (or a designated committee thereof), except for (i) disclosures made to third parties pursuant to ongoing arrangements (discussed above); (ii) disclosures made to third parties pursuant to Special Meetings of the PHRC; (iii) broker-dealer interest lists; (iv) shareholder in-kind distributions; (v) attribution analyses; or (vi) in connection with transition managers. The Adviser shall report quarterly to the Board of Trustees (or a designated committee thereof) information concerning all parties receiving non-public portfolio holdings information pursuant to an exemption. Procedures to monitor the use of such non-public portfolio holdings information may include requiring annual certifications that the recipients have utilized such information only pursuant to the terms of the agreement between the recipient and the Adviser and, for those recipients receiving information electronically, acceptance of the information will constitute reaffirmation that the third party expressly agrees to maintain the disclosed information in confidence and not to trade portfolio securities based on the non-public information.
In no instance may the Adviser or the Fund receive any compensation or consideration in exchange for the portfolio holdings information.
The PHRC is responsible for creating and implementing the Policy and, in this regard, has expressly adopted it. The following are some of the functions and responsibilities of the PHRC:
(a) The PHRC, which consists of members designated by Morgan Stanley Investment Management's and its affiliates ("MSIM") Long-Only Management Committee or its designees, is responsible for establishing portfolio holdings disclosure policies and guidelines and determining how portfolio holdings information will be disclosed on an ongoing basis.
(b) The PHRC periodically reviews and has the authority to amend as necessary MSIM's portfolio holdings disclosure policies and guidelines (as expressed by the Policy).
(c) The PHRC meets at least quarterly to (among other matters): (1) address any outstanding issues relating to the Policy, including matters relating to (i) disclosures made to third parties pursuant to ongoing
28
arrangements (described above); (ii) broker-dealer interest lists; (iii) shareholder in-kind distributions; (iv) attribution analyses; or (v) transition managers; (2) review non-disclosure agreements that have been executed with third parties and determine whether the third parties will receive portfolio holdings information; and (3) generally review the procedures that the Adviser employs to ensure that disclosure of information about portfolio securities is in the best interests of Fund shareholders, including procedures to address conflicts between the interests of Fund shareholders, on the one hand, and those of the Adviser, the Distributor or any affiliated person of the Fund, the Adviser or the Distributor, on the other.
(d) Any member of the PHRC may call a Special Meeting of the PHRC to consider whether a third party that is not listed in (c) above may receive non-public portfolio holdings information pursuant to a validly executed non-disclosure agreement. At least three members of the PHRC shall be present at the Special Meeting in order to constitute a quorum. At any Special Meeting at which a quorum is present, the decision of a majority of the PHRC members present and voting shall be determinative as to any matter submitted to a vote.
(e) The PHRC, or its designee(s), documents in writing all of their decisions and actions, which documentation will be maintained by the PHRC, or its designee(s) in accordance with the recordkeeping policy of MSIM. The PHRC, or its designee(s), will report their decisions to the Board of Trustees at each Board's next regularly scheduled Board meeting. The report will contain information concerning decisions made by the PHRC during the most recently ended calendar quarter immediately preceding the Board meeting.
III. MANAGEMENT OF THE FUND
A. Board of Trustees
General. The Board of Trustees of the Fund oversees the management of the Fund, but does not itself manage the Fund. The Trustees review various services provided by or under the direction of the Adviser to ensure that the Fund's general investment policies and programs are properly carried out. The Trustees also conduct their review to ensure that administrative services are provided to the Fund in a satisfactory manner.
Under state law, the duties of the Trustees are generally characterized as a duty of loyalty and a duty of care. The duty of loyalty requires a Trustee to exercise his or her powers in the interest of the Fund and not the Trustee's own interest or the interest of another person or organization. A Trustee satisfies his or her duty of care by acting in good faith with the care of an ordinarily prudent person and in a manner the Trustee reasonably believes to be in the best interest of the Fund and its shareholders.
Trustees and Officers. The Board of the Fund consists of 10 Trustees. These same individuals also serve as directors or trustees for certain of the funds advised by the Adviser and Morgan Stanley AIP GP LP. Nine Trustees have no affiliation or business connection with the Adviser or any of its affiliated persons and do not own any stock or other securities issued by the Adviser's parent company, Morgan Stanley. These are the "non-interested" or "Independent" Trustees. The other Trustee (the "Interested Trustee") is affiliated with the Adviser.
Board Structure and Oversight Function. The Board's leadership structure features an Independent Trustee serving as Chairperson and the Board Committees described below. The Chairperson participates in the preparation of the agenda for meetings of the Board and the preparation of information to be presented to the Board with respect to matters to be acted upon by the Board. The Chairperson also presides at all meetings of the Board and is involved in discussions regarding matters pertaining to the oversight of the management of the Fund between meetings.
The Board of Trustees operates using a system of committees to facilitate the timely and efficient consideration of all matters of importance to the Trustees, the Fund and Fund shareholders, and to facilitate compliance with legal and regulatory requirements and oversight of the Fund's activities and associated risks. The Board of Trustees has established four standing committees: (1) Audit Committee, (2) Governance Committee, (3) Compliance and Insurance Committee and (4) Investment Committee. The Audit Committee and the Governance Committee are comprised exclusively of Independent Trustees. Each committee charter governs the scope of the committee's responsibilities with respect to the oversight of the Fund. The responsibilities of each committee, including their oversight responsibilities, are described further under the caption "Independent Trustees and the Committees."
29
The Fund is subject to a number of risks, including investment, compliance, operational and valuation risk, among others. The Board of Trustees oversees these risks as part of its broader oversight of the Fund's affairs through various Board and committee activities. The Board has adopted, and periodically reviews, policies and procedures designed to address various risks to the Fund. In addition, appropriate personnel, including but not limited to the Fund's Chief Compliance Officer, members of the Fund's administration and accounting teams, representatives from the Fund's independent registered public accounting firm, the Fund's Treasurer, portfolio management personnel and independent valuation and brokerage evaluation service providers, make regular reports regarding the Fund's activities and related risks to the Board of Trustees and the committees, as appropriate. These reports include, among others, quarterly performance reports, quarterly derivatives activity and risk reports and discussions with members of the risk teams relating to each asset class. The Board's committee structure allows separate committees to focus on different aspects of risk and potential impact on some or all of the funds in the complex and then report back to the full Board. In between regular meetings, Fund officers also communicate with the Trustees regarding material exceptions and items relevant to the Board's risk oversight function. The Board recognizes that it is not possible to identify all of the risks that may affect the Fund, and that it is not possible to develop processes and controls to eliminate all of the risks that may affect the Fund. Moreover, the Board recognizes that it may be necessary for the Fund to bear certain risks (such as investment risk) to achieve its investment objective.
As needed between meetings of the Board, the Board or a specific committee receives and reviews reports relating to the Fund and engages in discussions with appropriate parties relating to the Fund's operations and related risks.
B. Management Information
Independent Trustees. The Fund seeks as Trustees individuals of distinction and experience in business and finance, government service or academia. In determining that a particular Trustee was and continues to be qualified to serve as Trustee, the Board has considered a variety of criteria, none of which, in isolation, was controlling. Based on a review of the experience, qualifications, attributes or skills of each Trustee, including those enumerated in the table below, the Board has determined that each of the Trustees is qualified to serve as a Trustee of the Fund. In addition, the Board believes that, collectively, the Trustees have balanced and diverse experience, qualifications, attributes and skills that allow the Board to operate effectively in governing the Fund and protecting the interests of shareholders. Information about the Fund's Governance Committee and Board of Trustees nomination process is provided below under the caption "Independent Trustees and the Committees."
The Independent Trustees of the Fund, their age, address, term of office and length of time served, their principal business occupations during the past five years, the number of portfolios in the Fund Complex (defined below) overseen by each Independent Trustee (as of December 31, 2010) and other directorships, if any, held by the Trustees, are shown below. The Fund Complex includes all open-end and closed-end funds (including all of their portfolios) advised by the Adviser and any funds that have an investment adviser that is an affiliated person of the Adviser (including, but not limited to, Morgan Stanley AIP GP LP) (the "Morgan Stanley Funds").
30
Independent Trustees:
| Name, Age and Address of Independent Trustee | Position(s) Held with Registrant | Length of Time Served* | Principal Occupation(s) During Past 5 Years | Number of Portfolios in Fund Complex Overseen by Independent Trustee | Other Directorships Held by Independent Trustee** | ||||||||||||||||||
| Frank L. Bowman (66) c/o Kramer Levin Naftalis & Frankel LLP Counsel to the Independent Trustees 1177 Avenue of the Americas New York, NY 10036 | Trustee | Since August 2006 | President, Strategic Decisions, LLC (consulting) (since February 2009); Director or Trustee of various Morgan Stanley Funds (since August 2006); Chairperson of the Insurance Sub-Committee of the Compliance and Insurance Committee (since February 2007); served as President and Chief Executive Officer of the Nuclear Energy Institute (policy organization) (February 2005 through November 2008); retired as Admiral, U.S. Navy after serving over 38 years on active duty including 8 years as Director of the Naval Nuclear Propulsion Program in the Department of the Navy and the U.S. Department of Energy (1996-2004); Served as Chief of Naval Personnel (July 1994-September 1996) and on the Joint Staff as Director of Political Military Affairs (June 1992 to July 1994); Knighted as Honorary Knight Commander of the Most Excellent Order of the British Empire; Awarded the Officer de l'Orde National du Mérite by the French Government; elected to the National Academy of Engineering (2009). | 102 | Director of BP p.l.c.; Director of Naval and Nuclear Technologies LLP; Director of the Armed Services YMCA of the USA and the Naval Submarine League; Director of the American Shipbuilding Suppliers Association; Member of the National Security Advisory Council of the Center for U.S. Global Engagement and a member of the CNA Military Advisory Board. | ||||||||||||||||||
| Michael Bozic (70) c/o Kramer Levin Naftalis & Frankel LLP Counsel to the Independent Trustees 1177 Avenue of the Americas New York, NY 10036 | Trustee | Since April 1994 | Private investor; Chairperson of the Compliance and Insurance Committee (since October 2006); Director or Trustee of various Morgan Stanley Funds (since April 1994); formerly, Chairperson of the Insurance Committee (July 2006-September 2006); Vice Chairman of Kmart Corporation (December 1998-October 2000), Chairman and Chief Executive Officer of Levitz Furniture Corporation (November 1995-November 1998) and President and Chief Executive Officer of Hills Department Stores (May 1991-July 1995); variously, Chairman, Chief Executive Officer, President and Chief Operating Officer (1987-1991) of the Sears Merchandise Group of Sears, Roebuck & Co. | 104 | Director of various business organizations. | ||||||||||||||||||
* Each Trustee serves an indefinite term, until his or her successor is elected.
** This includes any directorships at public companies and registered investment companies held by the Trustee at any time during the past five years.
31
| Name, Age and Address of Independent Trustee | Position(s) Held with Registrant | Length of Time Served* | Principal Occupation(s) During Past 5 Years | Number of Portfolios in Fund Complex Overseen by Independent Trustee | Other Directorships Held by Independent Trustee** | ||||||||||||||||||
| Kathleen A. Dennis (58) c/o Kramer Levin Naftalis & Frankel LLP Counsel to the Independent Trustees 1177 Avenue of the Americas New York, NY 10036 | Trustee | Since August 2006 | President, Cedarwood Associates (mutual fund and investment management consulting) (since July 2006); Chairperson of the Money Market and Alternatives Sub-Committee of the Investment Committee (since October 2006) and Director or Trustee of various Morgan Stanley Funds (since August 2006); formerly, Senior Managing Director of Victory Capital Management (1993-2006). | 102 | Director of various non-profit organizations. | ||||||||||||||||||
| Dr. Manuel H. Johnson (62) c/o Johnson Smick Group, Inc. 888 16th Street, N.W. Suite 740 Washington, D.C. 20006 | Trustee | Since July 1991 | Senior Partner, Johnson Smick International, Inc. (consulting firm); Chairperson of the Investment Committee (since October 2006) and Director or Trustee of the various Morgan Stanley Funds (since July 1991); Co-Chairman and a founder of the Group of Seven Council (G7C), (international economic commission); formerly, Chairperson of the Audit Committee (July 1991-September 2006); Vice Chairman of the Board of Governors of the Federal Reserve System and Assistant Secretary of the U.S. Treasury. | 104 | Director of NVR, Inc. (home construction); Director of Evergreen Energy; Director of Greenwich Capital Holdings. | ||||||||||||||||||
| Joseph J. Kearns (69) c/o Kearns & Associates LLC PMB754 22631 Pacific Coast Highway Malibu, CA 90265 | Trustee | Since August 1994 | President, Kearns & Associates LLC (investment consulting); Chairperson of the Audit Committee (since October 2006) and Director or Trustee of various Morgan Stanley Funds (since August 1994); formerly, Deputy Chairperson of the Audit Committee (July 2003-September 2006) and Chairperson of the Audit Committee of various Morgan Stanley Funds (since August 1994); CFO of the J. Paul Getty Trust. | 105 | Director of Electro Rent Corporation (equipment leasing) and The Ford Family Foundation. | ||||||||||||||||||
* Each Trustee serves an indefinite term, until his or her successor is elected.
** This includes any directorships at public companies and registered investment companies held by the Trustee at any time during the past five years.
32
| Name, Age and Address of Independent Trustee | Position(s) Held with Registrant | Length of Time Served* | Principal Occupation(s) During Past 5 Years | Number of Portfolios in Fund Complex Overseen by Independent Trustee | Other Directorships Held by Independent Trustee** | ||||||||||||||||||
| Michael F. Klein (52) c/o Kramer Levin Naftalis & Frankel LLP Counsel to the Independent Trustees 1177 Avenue of the Americas New York, NY 10036 | Trustee | Since August 2006 | Managing Director, Aetos Capital, LLC (since March 2000) and Co-President, Aetos Alternatives Management, LLC (since January 2004); Chairperson of the Fixed-Income Sub-Committee of the Investment Committee (since October 2006) and Director or Trustee of various Morgan Stanley Funds (since August 2006); formerly, Managing Director, Morgan Stanley & Co. Inc. and Morgan Stanley Dean Witter Investment Management, President, various Morgan Stanley Funds (June 1998-March 2000) and Principal, Morgan Stanley & Co. Inc. and Morgan Stanley Dean Witter Investment Management (August 1997-December 1999). | 102 | Director of certain investment funds managed or sponsored by Aetos Capital, LLC. Director of Sanitized AG and Sanitized Marketing AG (specialty chemicals). | ||||||||||||||||||
| Michael E. Nugent (75) c/o Triumph Capital, L.P. 445 Park Avenue New York, NY 10022 | Chairperson of the Board and Trustee | Chairperson of the Boards since July 2006 and Trustee since July 1991 | General Partner, Triumph Capital, L.P. (private investment partnership); Chairperson of the Boards of various Morgan Stanley Funds (since July 2006); Director or Trustee of the Morgan Stanley Funds (since July 1991); formerly, Chairperson of the Insurance Committee (until July 2006). | 104 | None. | ||||||||||||||||||
| W. Allen Reed (64) c/o Kramer Levin Naftalis & Frankel LLP Counsel to the Independent Trustees 1177 Avenue of the Americas New York, NY 10036 | Trustee | Since August 2006 | Chairperson of the Equity Sub-Committee of the Investment Committee (since October 2006) and Director or Trustee of various Morgan Stanley Funds (since August 2006); formerly, President and CEO of General Motors Asset Management; Chairman and Chief Executive Officer of the GM Trust Bank and Corporate Vice President of General Motors Corporation (August 1994-December 2005). | 102 | Director of Temple-Inland Industries (packaging and forest products); Director of Legg Mason, Inc. and Director of the Auburn University Foundation; formerly, Director of iShares, Inc. (2001-2006). | ||||||||||||||||||
| Fergus Reid (79) c/o Joe Pietryka, Inc. 85 Charles Colman Blvd. Pawling, NY 12564 | Trustee | Since June 1992 | Chairman, Joe Pietryka, Inc.; Chairperson of the Governance Committee and Director or Trustee of various Morgan Stanley Funds (since June 1992). | 105 | Trustee and Director of certain investment companies in the JPMorgan Funds complex managed by JP Morgan Investment Management Inc. | ||||||||||||||||||
* Each Trustee serves an indefinite term, until his or her successor is elected.
** This includes and directorship at public companies and registered investment companies held by the Trustee at any time during the past five years.
33
The Trustee who is affiliated with the Adviser or affiliates of the Adviser (as set forth below) and executive officers of the Fund, their age, address, term of office and length of time served, their principal business occupations during the past five years, the number of portfolios in the Fund Complex overseen by the Interested Trustee (as of December 31, 2010) and the other directorships, if any, held by the Interested Trustee, are shown below.
Interested Trustee:
Name, Age and Address of Interested Trustee | Position(s) Held with Registrant | Length of Time Served* | Principal Occupation(s) During Past 5 Years | Number of Portfolios in Fund Complex Overseen by Interested Trustee | Other Directorships Held by Interested Trustee** | ||||||||||||||||||
| James F. Higgins (63) c/o Morgan Stanley Services Company Inc. Harborside Financial Center, 201 Plaza Two, Jersey City, NJ 07311 | Trustee | Since June 2000 | Director or Trustee of various Morgan Stanley Funds (since June 2000); Senior Advisor of Morgan Stanley (since August 2000). | 103 | Director of AXA Financial, Inc. and The Equitable Life Assurance Society of the United States (financial services). | ||||||||||||||||||
* Each Trustee serves an indefinite term, until his or her successor is elected.
** This includes any directorships at public companies and registered investment companies held by the Trustee at any time during the past five years.
Executive Officers:
| Name, Age and Address of Executive Officer | Position(s) Held with Registrant | Length of Time Served* | Principal Occupation(s) During Past 5 Years | ||||||||||||
| Arthur Lev (50) 522 Fifth Avenue New York, NY 10036 | President and Principal Executive Officer — Equity and Fixed Income Funds | Since June 2011 | President and Principal Executive Officer (since June 2011) of the Equity and Fixed Income Funds in the Fund Complex; Head of the Long Only Business of Morgan Stanley Investment Management (since February 2011); Managing Director of the Adviser and various entities affiliated with the Adviser (since December 2006). Formerly, Chief Strategy Officer of Morgan Stanley Investment Management's Traditional Asset Management business (November 2010-February 2011); General Counsel of Morgan Stanley Investment Management (December 2006-October 2010); Partner and General Counsel of FrontPoint Partners LLC (July 2002 to December 2006); Managing Director and General Counsel of Morgan Stanley Investment Management (May 2000 to June 2002). | ||||||||||||
| Mary Ann Picciotto (38) c/o Morgan Stanley Services Company Inc. Harborside Financial Center 201 Plaza Two Jersey City, NJ 07311 | Chief Compliance Officer | Since May 2010 | Executive Director of the Adviser and various entities affiliated with the Adviser; Chief Compliance Officer of various Morgan Stanley Funds (since May 2010); Chief Compliance Officer of the Adviser (since April 2007). | ||||||||||||
| Stefanie V. Chang Yu (44) 522 Fifth Avenue New York, NY 10036 | Vice President | Since December 1997 | Managing Director of the Adviser and various entities affiliated with the Adviser; Vice President of various Morgan Stanley Funds (since December 1997). Formerly Secretary of the Adviser and various entities affiliated with the Adviser. | ||||||||||||
* Each Officer serves an indefinite term, until his or her successor is elected.
34
| Name, Age and Address of Executive Officer | Position(s) Held with Registrant | Length of Time Served* | Principal Occupation(s) During Past 5 Years | ||||||||||||
| Francis J. Smith (46) c/o Morgan Stanley Services Company Inc. Harborside Financial Center 201 Plaza Two Jersey City, NJ 07311 | Treasurer and Principal Financial Officer | Treasurer since July 2003 and Principal Financial Officer since September 2002 | Executive Director of the Adviser and various entities affiliated with the Adviser; Treasurer and Principal Financial Officer of various Morgan Stanley Funds (since July 2003). | ||||||||||||
| Mary E. Mullin (44) 522 Fifth Avenue New York, NY 10036 | Secretary | Since June 1999 | Executive Director of the Adviser and various entities affiliated with the Adviser; Secretary of various Morgan Stanley Funds (since June 1999). | ||||||||||||
* Each Officer serves an indefinite term, until his or her successor is elected.
In addition, the following individuals who are officers of the Adviser or its affiliates serve as assistant secretaries of the Fund: Joanne Antico, Joseph C. Benedetti, Daniel E. Burton, Tara A. Farrelly and Edward J. Meehan.
For each Trustee, the dollar range of equity securities beneficially owned by the Trustee in the Fund and in the Family of Investment Companies (Family of Investment Companies includes all of the registered investment companies advised by the Adviser, Morgan Stanley Investment Management Inc. and Morgan Stanley AIP GP LP) for the calendar year ended December 31, 2010, is set forth in the table below.
Name of Trustee | Dollar Range of Equity Securities in the Fund (As of December 31, 2010) | Aggregate Dollar Range of Equity Securities in All Registered Investment Companies Overseen by Trustee in Family of Investment Companies (As of December 31, 2010) | |||||||||
| Independent: | |||||||||||
| Frank L. Bowman(1) | None | over $100,000 | |||||||||
| Michael Bozic | over $100,000 | over $100,000 | |||||||||
| Kathleen A. Dennis | None | over $100,000 | |||||||||
| Manuel H. Johnson | None | over $100,000 | |||||||||
| Joseph J. Kearns(1) | $50,001 - $100,000 | over $100,000 | |||||||||
| Michael F. Klein | None | over $100,000 | |||||||||
| Michael E. Nugent | $50,001 - $100,000 | over $100,000 | |||||||||
| W. Allen Reed(1) | over $100,000 | over $100,000 | |||||||||
| Fergus Reid(1) | None | over $100,000 | |||||||||
| Interested: | |||||||||||
| James F. Higgins | None | $ | 1 - $10,000 | ||||||||
(1) Includes the total amount of compensation deferred by the Trustee at his election pursuant to a deferred compensation plan. Such deferred compensation is placed in a deferral account and deemed to be invested in one or more of the Morgan Stanley Funds (or portfolio thereof) that are offered as investment options under the plan.
As to each Independent Trustee and his or her immediate family members, no person owned beneficially or of record securities in an investment adviser or principal underwriter of the Fund, or a person (other than a registered investment company) directly or indirectly controlling, controlled by or under common control with an investment adviser or principal underwriter of the Fund.
Independent Trustees and the Committees. Law and regulation establish both general guidelines and specific duties for the Independent Trustees. The Board has four committees: (1) Audit Committee, (2) Governance Committee, (3) Compliance and Insurance Committee and (4) Investment Committee. Three of the Independent Trustees serve as members of the Audit Committee, three Independent Trustees serve as members of the Governance Committee, four Trustees, including three Independent Trustees, serve as members of the Compliance and Insurance Committee and all of the Trustees serve as members of the Investment Committee.
The Independent Trustees are charged with recommending to the full Board approval of management, advisory and administration contracts, Rule 12b-1 plans and distribution and underwriting agreements; continually reviewing fund performance; checking on the pricing of portfolio securities, brokerage commissions, transfer agent costs and performance and trading among funds in the same
35
complex; and approving fidelity bond and related insurance coverage and allocations, as well as other matters that arise from time to time. The Independent Trustees are required to select and nominate individuals to fill any Independent Trustee vacancy on the board of any fund that has a Rule 12b-1 plan of distribution. Most of the retail Morgan Stanley Funds have a Rule 12b-1 plan.
The Board of Trustees has a separately-designated standing Audit Committee established in accordance with Section 3(a)(58)(A) of the Securities Exchange Act of 1934, as amended (the "Exchange Act"). The Audit Committee is charged with recommending to the full Board the engagement or discharge of the Fund's independent registered public accounting firm; directing investigations into matters within the scope of the independent registered public accounting firm's duties, including the power to retain outside specialists; reviewing with the independent registered public accounting firm the audit plan and results of the auditing engagement; approving professional services provided by the independent registered public accounting firm and other accounting firms prior to the performance of the services; reviewing the independence of the independent registered public accounting firm; considering the range of audit and non-audit fees; reviewing the adequacy of the Fund's system of internal controls; and reviewing the valuation process. The Fund has adopted a formal, written Audit Committee Charter.
The members of the Audit Committee of the Fund are Joseph J. Kearns, Michael E. Nugent and W. Allen Reed. None of the members of the Fund's Audit Committee is an "interested person," as defined under the Investment Company Act, of the Fund (with such disinterested Trustees being "Independent Trustees" or individually, "Independent Trustee"). Each Independent Trustee is also "independent" from the Fund under the listing standards of the New York Stock Exchange, Inc. ("NYSE"). The Chairperson of the Audit Committee of the Fund is Joseph J. Kearns.
The Board of Trustees of the Fund also has a Governance Committee. The Governance Committee identifies individuals qualified to serve as Independent Trustees on the Fund's Board and on committees of the Board and recommends such qualified individuals for nomination by the Fund's Independent Trustees as candidates for election as Independent Trustees, advises the Fund's Board with respect to Board composition, procedures and committees, develops and recommends to the Fund's Board a set of corporate governance principles applicable to the Fund, monitors and makes recommendations on corporate governance matters and policies and procedures of the Fund's Board of Trustees and any Board committees and oversees periodic evaluations of the Fund's Board and its committees. The members of the Governance Committee of the Fund are Kathleen A. Dennis, Michael F. Klein and Fergus Reid, each of whom is an Independent Trustee. The Chairperson of the Governance Committee is Fergus Reid.
The Fund does not have a separate nominating committee. While the Fund's Governance Committee recommends qualified candidates for nominations as Independent Trustees, the Board of Trustees of the Fund believes that the task of nominating prospective Independent Trustees is important enough to require the participation of all current Independent Trustees, rather than a separate committee consisting of only certain Independent Trustees. Accordingly, each Independent Trustee (Frank L. Bowman, Michael Bozic, Kathleen A. Dennis, Manuel H. Johnson, Joseph J. Kearns, Michael F. Klein, Michael E. Nugent, W. Allen Reed and Fergus Reid) participates in the election and nomination of candidates for election as Independent Trustees for the Fund. Persons recommended by the Fund's Governance Committee as candidates for nomination as Independent Trustees shall possess such experience, qualifications, attributes, skills and diversity so as to enhance the Board's ability to manage and direct the affairs and business of the Fund, including, when applicable, to enhance the ability of committees of the Board to fulfill their duties and/or to satisfy any independence requirements imposed by law, regulation or any listing requirements of the NYSE. While the Independent Trustees of the Fund expect to be able to continue to identify from their own resources an ample number of qualified candidates for the Fund's Board as they deem appropriate, they will consider nominations from shareholders to the Board. Nominations from shareholders should be in writing and sent to the Independent Trustees as described below under the caption "Shareholder Communications."
The Board formed a Compliance and Insurance Committee to address insurance coverage and oversee the compliance function for the Fund and the Board. The Compliance and Insurance Committee consists of Frank L. Bowman, Michael Bozic, James F. Higgins and Manuel H. Johnson. Frank L. Bowman, Michael Bozic and Manuel H. Johnson are Independent Trustees. The Chairperson of the Compliance and Insurance Committee is Michael Bozic. The Compliance and Insurance Committee has an Insurance Sub-Committee to review and monitor the insurance coverage maintained by the Fund. The Chairperson of the Insurance Sub-Committee is Frank L. Bowman.
36
The Investment Committee oversees the portfolio investment process for and reviews the performance of the Fund. The Investment Committee also recommends to the Board to approve or renew the Fund's Investment Advisory and Administration Agreements. The members of the Investment Committee are Frank L. Bowman, Michael Bozic, Kathleen A. Dennis, James F. Higgins, Manuel H. Johnson, Joseph J. Kearns, Michael F. Klein, Michael E. Nugent, W. Allen Reed and Fergus Reid. The Chairperson of the Investment Committee is Manuel H. Johnson.
The Investment Committee has three Sub-Committees, each with its own Chairperson. Each Sub-Committee focuses on the funds' primary areas of investment, namely equities, fixed income and alternatives. The Sub-Committees and their members are as follows:
(1) Equity—W. Allen Reed (Chairperson), Frank L. Bowman and Michael E. Nugent.
(2) Fixed Income—Michael F. Klein (Chairperson), Michael Bozic and Fergus Reid.
(3) Money Market and Alternatives—Kathleen A. Dennis (Chairperson), James F. Higgins and Joseph J. Kearns.
During the Fund's fiscal year ended July 31, 2011, the Board of Trustees held the following meetings:
| Board of Trustees | 8 | ||||||
| Committee/Sub-Committee: | Number of meetings: | ||||||
| Audit Committee | 4 | ||||||
| Governance Committee | 4 | ||||||
| Compliance and Insurance Committee | 4 | ||||||
| Insurance Sub-Committee | 1 | ||||||
| Investment Committee | 5 | ||||||
| Equity Sub-Committee | 5 | ||||||
| Fixed Income Sub-Committee | 5 | ||||||
| Money Market and Alternatives Sub-Committee | 7 | ||||||
Experience, Qualifications and Attributes
The Board has concluded, based on each Trustee's experience, qualifications and attributes that each Board member should serve as a Trustee. Following is a brief summary of the information that led to and/or supports this conclusion.
Mr. Bowman has experience in a variety of business and financial matters through his prior service as a Director or Trustee for various other funds in the Fund Complex, where he serves as Chairperson of the Insurance Sub-Committee of the Compliance and Insurance Committee, and as a Director of BP p.l.c. and Naval and Nuclear Technologies LLP. Mr. Bowman also serves as a Director for the Armed Services YMCA of the USA, the Naval Submarine League and the American Shipbuilding Suppliers Association. Mr. Bowman is also a Member of the National Security Advisory Council of the Center for U.S. Global Engagement and a member of the CNA Military Advisory Board. Mr. Bowman retired as an Admiral in the U.S. Navy, after serving over 38 years on active duty including eight years as Director of the Naval Nuclear Propulsion Program in the Department of the Navy and the U.S. Department of Energy (1996-2004). Additionally, Mr. Bowman served as the U.S. Navy's Chief of Naval Personnel (1994-1996), where he was responsible for the planning and programming of all manpower, personnel, training and education resources for the U.S. Navy, and on the Joint Staff as Director of Political Military Affairs (1992-1994). In addition, Mr. Bowman served as President and Chief Executive Officer of the Nuclear Energy Institute. Mr. Bowman has received such distinctions as a knighthood as Honorary Knight Commander of the Most Excellent Order of the British Empire and the Officer de l'Orde National du Mérite from the French Government, and was elected to the National Academy of Engineering (2009). He is President of the consulting firm Strategic Decisions, LLC.
With over 20 years of experience on the boards and in senior management of such companies as Kmart Corporation, Levitz Furniture Corporation, Hills Department Stores and Sears Merchandise Group of Sears, Roebuck & Co., where he also served as Chief Financial Officer of the Merchandise Group, and with over 15 years of experience as a Director or Trustee of the certain other funds in the Fund Complex, Mr. Bozic has experience with a variety of financial, management, regulatory and operational issues as well as experience with marketing and distribution. Mr. Bozic has served as the Chairperson of the Compliance and Insurance Committee since 2006.
37
Ms. Dennis has over 25 years of business experience in the financial services industry and related fields including serving as a Trustee or Trustee of various other funds in the Fund Complex, where she serves as Chairperson of the Money Market and Alternatives Sub-Committee of the Investment Committee. Ms. Dennis possesses a strong understanding of the regulatory framework under which investment companies must operate based on her years of service to this Board and her position as Senior Managing Trustee of Victory Capital Management.
In addition to his tenure as a Director or Trustee of various other funds in the Fund Complex, where he formerly served as Chairperson of the Audit Committee, Dr. Johnson has also served as an officer or a board member of numerous companies for nearly 20 years. These positions included Co-Chairman and a founder of the Group of Seven Council, Director of NVR, Inc., Director of Evergreen Energy and Director of Greenwich Capital Holdings. He also has served as Vice Chairman of the Board of Governors of the Federal Reserve System and Assistant Secretary of the U.S. Treasury. In addition, Dr. Johnson also served as Chairman of the Financial Accounting Foundation, which oversees the Financial Accounting Standards Board, for seven years.
Mr. Kearns gained extensive experience regarding accounting through his experience on the Audit Committees of the boards of other funds in the Funds Complex, including serving as either Chairperson or Deputy Chairperson of the Audit Committee for fourteen years, and through his position as Chief Financial Officer of the J. Paul Getty Trust. He also has experience in financial, accounting, investment and regulatory matters through his position as President and founder of Kearns & Associates LLC, a financial consulting company. Mr. Kearns also serves as a director of Electro Rent Corporation and The Ford Family Foundation. The Board has determined that Mr. Kearns is an "audit committee financial expert" as defined by the SEC.
Through his prior positions as Managing Director of Morgan Stanley & Co. LLC and Morgan Stanley Dean Witter Investment Management and as President of Morgan Stanley Institutional Funds, Mr. Klein has experience in the management and operation of registered investment companies, enabling him to provide management input and investment guidance to the Board. Mr. Klein also has extensive experience in the investment management industry based on his current positions as Managing Director of Aetos Capital, LLC and as Director of certain investment funds managed or sponsored by Aetos Capital, LLC. In addition, he also has experience as a member of the board of other funds in the Fund Complex.
Mr. Nugent has extensive experience with financial, accounting, investment and regulatory matters through his almost 20 years of service on the boards of various funds in the Fund Complex, including time as the Chairperson of the Insurance Committee and Chairman of the Morgan Stanley Funds. Mr. Nugent also has experience as a General Partner in Triumph Capital, L.P.
Mr. Reed has experience on investment company boards and is experienced with financial, accounting, investment and regulatory matters through his service as a director of iShares Inc. and other funds in the Fund Complex. Mr. Reed also gained substantial experience in the financial services industry through his positions as Director of Legg Mason, Inc. and prior position as President and CEO of General Motors Asset Management.
Mr. Reid has served on a number of mutual fund boards, including as a trustee and director of certain investment companies in the JPMorgan Funds complex and as a Director or Trustee of other funds in the Fund Complex. Therefore, Mr. Reid is experienced with financial, accounting, investment and regulatory matters, enabling him to provide management input and investment guidance to the Board.
Mr. Higgins has over 30 years of experience in the financial services industry. Mr. Higgins has substantial mutual fund experience and is experienced with financial, accounting, investment and regulatory matters due to his experience on the boards of other funds in the Fund Complex. Mr. Higgins also serves on the boards of other companies in the financial services industry, including AXA Financial, Inc. and The Equitable Life Assurance Society of the United States.
The Trustees' principal occupations during the past five years or more are shown in the above tables.
Advantages of Having Same Individuals as Trustees for the Morgan Stanley Funds. The Independent Trustees and the Fund's management believe that having the same Independent Trustees for each of the Morgan Stanley Funds avoids the duplication of effort that would arise from having different groups of individuals serving as Independent Trustees for each of the funds or even of sub-groups of funds. They believe that having the same individuals serve as Independent Trustees of all the Morgan Stanley Funds tends to increase their knowledge and expertise regarding matters which affect the Fund Complex generally and enhances their ability to negotiate on behalf of each fund with the fund's service providers. This arrangement also precludes the possibility of separate groups of Independent Trustees
38
arriving at conflicting decisions regarding operations and management of the funds and avoids the cost and confusion that would likely ensue. Finally, having the same Independent Trustees serve on all fund boards enhances the ability of each fund to obtain, at modest cost to each separate fund, the services of Independent Trustees of the caliber, experience and business acumen of the individuals who serve as Independent Trustees of the Morgan Stanley Funds.
Trustee and Officer Indemnification. The Fund's Declaration of Trust provides that no Trustee, Officer, employee or agent of the Fund is liable to the Fund or to a shareholder, nor is any Trustee, Officer, employee or agent liable to any third persons in connection with the affairs of the Fund, except as such liability may arise from his/her or its own bad faith, willful misfeasance, gross negligence or reckless disregard of his/her or its duties. It also provides that all third persons shall look solely to Fund property for satisfaction of claims arising in connection with the affairs of the Fund. With the exceptions stated, the Declaration of Trust provides that a Trustee, Officer, employee or agent is entitled to be indemnified against all liability in connection with the affairs of the Fund.
Shareholder Communications. Shareholders may send communications to the Fund's Board of Trustees. Shareholders should send communications intended for the Fund's Board by addressing the communications directly to the Board (or individual Board members) and/or otherwise clearly indicating in the salutation that the communication is for the Board (or individual Board members) and by sending the communication to either the Fund's office or directly to such Board member(s) at the address specified for each Trustee previously noted. Other shareholder communications received by the Fund not directly addressed and sent to the Board will be reviewed and generally responded to by management, and will be forwarded to the Board only at management's discretion based on the matters contained therein.
C. Compensation
Each Trustee (except for the Chairperson of the Boards) receives an annual retainer fee of $210,000 for serving the Morgan Stanley Funds. Prior to January 1, 2011, each Trustee (except for the Chairperson of the Boards) received and annual retainer fee of $200,000 for serving the Morgan Stanley Funds.
The Chairperson of the Audit Committee receives an additional annual retainer fee of $78,750 ($75,000 prior to January 1, 2011) and the Investment Committee Chairperson receives an additional annual retainer fee of $63,000 ($60,000 prior to January 1, 2011). Other Committee Chairpersons receive an additional annual retainer fee of $31,500 ($30,000 prior to January 1, 2011) and the Sub-Committee Chairpersons receive an additional annual retainer fee of $15,750 ($15,000 prior to January 1, 2011). The aggregate compensation paid to each Trustee is paid by the Morgan Stanley Funds, and is allocated on a pro rata basis among each of the operational funds/portfolios of the Morgan Stanley Funds based on the relative net assets of each of the funds/portfolios. Michael E. Nugent receives a total annual retainer fee of $420,000 ($400,000 prior to January 1, 2011) for his services as Chairperson of the Boards of the Morgan Stanley Funds and for administrative services provided to each Board.
The Fund also reimburses such Trustees for travel and other out-of-pocket expenses incurred by them in connection with attending such meetings. Trustees of the Fund who are employed by the Adviser receive no compensation or expense reimbursement from the Fund for their services as Trustee.
Effective April 1, 2004, the Fund began a Deferred Compensation Plan (the "DC Plan"), which allows each Trustee to defer payment of all, or a portion, of the fees he or she receives for serving on the Board of Trustees throughout the year. Each eligible Trustee generally may elect to have the deferred amounts credited with a return equal to the total return on one or more of the Morgan Stanley Funds (or portfolios thereof) that are offered as investment options under the DC Plan. At the Trustee's election, distributions are either in one lump sum payment, or in the form of equal annual installments over a period of five years. The rights of an eligible Trustee and the beneficiaries to the amounts held under the DC Plan are unsecured and such amounts are subject to the claims of the creditors of the Fund.
Prior to April 1, 2004, the Institutional Funds maintained a similar Deferred Compensation Plan (the "Prior DC Plan"), which also allowed each Independent Trustee to defer payment of all, or a portion, of the fees he or she received for serving on the Board of Trustees throughout the year. Generally, the DC Plan amends and supersedes the Prior DC Plan and all amounts payable under the Prior DC Plan are now subject to the terms of the DC Plan (except for amounts paid during the calendar year 2004, which remain subject to the terms of the Prior DC Plan).
39
The following table shows aggregate compensation payable to each of the Fund's Trustees from the Fund for the fiscal year ended July 31, 2011 and the aggregate compensation payable to each of the funds' Trustees by the Fund Complex (which includes all of the Morgan Stanley Funds) for the calendar year ended December 31, 2010.
Compensation(1)
| Name of Independent Trustee | Aggregate Compensation From the Fund(2) | Total Compensation From Fund and Fund Complex Paid to Trustee(3) | |||||||||
| Frank L. Bowman | $ | 1,504 | $ | 215,000 | |||||||
| Michael Bozic | 1,586 | 230,000 | |||||||||
| Kathleen A. Dennis | 1,504 | 215,000 | |||||||||
| Manuel H. Johnson | 1,793 | 260,000 | |||||||||
| Joseph J. Kearns(2) | 1,896 | 290,000 | |||||||||
| Michael F. Klein | 1,504 | 215,000 | |||||||||
| Michael E. Nugent | 2,758 | 400,000 | |||||||||
| W. Allen Reed(2) | 1,504 | 215,000 | |||||||||
| Fergus Reid | 1,586 | 245,000 | |||||||||
| Name of Interested Trustee | |||||||||||
| James F. Higgins | 1,379 | 200,000 | |||||||||
(1) Includes all amounts paid for serving as director/trustee of the funds, as well as serving as Chairperson of the Boards or a Chairperson of a Committee or Sub-Committee.
(2) The amounts shown in this column represent the aggregate compensation before deferral with respect to the Fund's fiscal year. The following Trustees deferred compensation from the Fund during the fiscal year ended July 31, 2011: Mr. Kearns, $702; Mr. Reed, $1,504.
(3) The amounts shown in this column represent the aggregate compensation paid by all of the funds in the Fund Complex as of December 31, 2010 before deferral by the Trustees under the DC Plan. As of December 31, 2010, the value (including interest) of the deferral accounts across the Fund Complex for Messrs. Kearns, Reed and Reid pursuant to the deferred compensation plan was $438,616, $478,362 and $594,829, respectively. Because the funds in the Fund Complex have different fiscal year ends, the amounts shown in this column are presented on a calendar year basis.
Prior to December 31, 2003, 49 of the retail Morgan Stanley Funds (the "Adopting Funds"), including the Fund, had adopted a retirement program under which an Independent Trustee who retired after serving for at least five years as an Independent Trustee of any such fund (an "Eligible Trustee") would have been entitled to retirement payments, based on factors such as length of service, upon reaching the eligible retirement age. On December 31, 2003, the amount of accrued retirement benefits for each Eligible Trustee was frozen, and will be payable, together with a return of 8% per annum, at or following each such Eligible Trustee's retirement as shown in the table below.
The following table illustrates the retirement benefits accrued to the Fund's Independent Trustees by the Fund for the fiscal year ended July 31, 2011 and by the Adopting Funds for the calendar year ended December 31, 2010, and the estimated retirement benefits for the Independent Trustees, from the Fund as of the fiscal year ended July 31, 2011 and from the Adopting Funds for each calendar year following retirement. Only the Trustees listed below participated in the retirement program.
Name of Independent Trustee | Retirement benefits accrued as fund expenses | Estimated annual benefits upon retirement(1) | |||||||||||||||||
| By the Fund | By all Adopting Funds | From the Fund | From all Adopting Funds | ||||||||||||||||
| Michael Bozic | $ | 911 | $ | 42,107 | $ | 967 | $ | 43,940 | |||||||||||
| Manuel H. Johnson | 651 | 30,210 | 1,420 | 64,338 | |||||||||||||||
| Michael E. Nugent | 145 | 6,805 | 1,269 | 57,539 | |||||||||||||||
(1) Total compensation accrued under the retirement plan, together with a return of 8% per annum, will be paid annually commencing upon retirement and continuing for the remainder of the Trustee's life.
IV. CONTROL PERSONS AND PRINCIPAL HOLDERS OF SECURITIES
The following owned beneficially or of record 5% or more of the outstanding Class A shares of the Fund as of November 1, 2011: Morgan Stanley & Co., Harborside Financial Center, 201 Plaza Two, 3rd Floor, Jersey City, NJ 07311 — 77.37%. The following owned beneficially or of record 5% or more of the outstanding Class B shares of the Fund as of November 1, 2011: Morgan Stanley & Co., Harborside
40
Financial Center, 201 Plaza Two, 3rd Floor, Jersey City, NJ 07311 — 72.33%. The following owned beneficially or of record 5% or more of the outstanding Class C shares of the Fund as of November 1, 2011: Morgan Stanley & Co., Harborside Financial Center, 201 Plaza Two, 3rd floor, Jersey City, NJ 07311 — 85.08%. The following owned beneficially or of record 5% or more of the outstanding Class I shares of the Fund as of November 1, 2011: Morgan Stanley & Co., Harborside Financial Center, 201 Plaza Two, 3rd floor, Jersey City, NJ 07311 — 50.59%; State Street Bank and Trust Co., FBO ADP/Morgan Stanley Alliance, 105 Rosemont Avenue, Westwood, MA 02090-2318 — 7.83%; Morgan Stanley & Co. FBO, The ASCAP Foundation, ASCAP Building, One Lincoln Place, New York, NY 10023 — 30.06%. The percentage ownership of shares of the Fund changes from time to time depending on purchases and redemptions by shareholders and the total number of shares outstanding.
As of the date of this SAI, the aggregate number of shares of beneficial interest of the Fund owned by the Fund's officers and Trustees as a group was less than 1% of the Fund's shares of beneficial interest outstanding.
V. INVESTMENT ADVISORY AND OTHER SERVICES
A. Adviser and Administrator
The Adviser to the Fund is Morgan Stanley Investment Management Inc., a Delaware corporation, whose address is 522 Fifth Avenue, New York, NY 10036. The Adviser is a wholly-owned subsidiary of Morgan Stanley, a Delaware corporation. Morgan Stanley is a preeminent global financial services firm engaged in securities trading and brokerage activities, as well as providing investment banking, research and analysis, financing and financial advisory services.
Pursuant to an Investment Advisory Agreement (the "Investment Advisory Agreement") with the Adviser, the Fund has retained the Adviser to manage the investment of the Fund's assets, including the placing of orders for the purchase and sale of portfolio securities. The Fund pays the Adviser monthly compensation calculated daily by applying the following annual rates to the average daily net assets of the Fund determined as of the close of each business day: 0.42% to the portion of the daily net assets not exceeding $1.5 billion; and 0.395% to the portion of the daily net assets exceeding $1.5 billion. The investment advisory fee is allocated among the Classes pro rata based on the net assets of the Fund attributable to each Class.
Administration services are provided to the Fund by Morgan Stanley Services Company Inc. ("Administrator"), a wholly-owned subsidiary of the Adviser, pursuant to a separate administration agreement ("Administration Agreement") entered into by the Fund with the Administrator. The Fund pays the Administrator monthly compensation of 0.08% of daily net assets.
For the fiscal years ended July 31, 2009, 2010 and 2011, the Fund paid total investment advisory compensation in the amounts of $2,365,345, $2,402,992 and $2,384,555, respectively. For the fiscal years ended July 31, 2009, 2010 and 2011, advisory fees paid reflect the reduction of $159,708, $167,133 and $103,873, respectively, relating to the Fund's short-term cash investments in Morgan Stanley Institutional Liquidity Funds — Money Market Portfolio — Institutional Class. Additionally, for the fiscal year ended July 31, 2011, advisory fees paid reflect the reduction of $2,376 relating to the Fund's investments in Morgan Stanley Institutional Fund, Inc. — Emerging Markets Portfolio — Institutional Class.
For the fiscal years ended July 31, 2009, 2010 and 2011, the Fund paid compensation under the Administration Agreement in the amounts of $480,963, $489,548 and $474,439, respectively.
Under a Sub-Administration Agreement between the Administrator and State Street Bank and Trust Company ("State Street"), State Street provides certain administrative services to the Fund. For such services, the Administrator pays State Street a portion of the fee the Administrator receives from the Fund.
B. Principal Underwriter
The Fund's principal underwriter is the Distributor (which has the same address as the Investment Adviser). In this capacity, the Fund's shares are distributed by the Distributor. The Distributor has entered into a selected dealer agreement with Morgan Stanley Smith Barney and Morgan Stanley & Co., which through their own sales organizations sell shares of the Fund. In addition, the Distributor may enter into similar agreements with other selected broker-dealers. The Distributor, a Delaware corporation, is a wholly-owned subsidiary of Morgan Stanley.
41
The Distributor bears all expenses it may incur in providing services under the Distribution Agreement. These expenses include the payment of commissions for sales of the Fund's shares and incentive compensation to Financial Advisors, the cost of educational and/or business-related trips, and educational and/or promotional and business-related expenses. The Distributor also pays certain expenses in connection with the distribution of the Fund's shares, including the costs of preparing, printing and distributing advertising or promotional materials, and the costs of printing and distributing prospectuses and supplements thereto used in connection with the offering and sale of the Fund's shares. The Fund bears the costs of initial typesetting, printing and distribution of prospectuses and supplements thereto to shareholders. The Fund also bears the costs of registering the Fund and its shares under federal and state securities laws and pays filing fees in accordance with state securities laws.
The Fund and the Distributor have agreed to indemnify each other against certain liabilities, including liabilities under the Securities Act. Under the Distribution Agreement, the Distributor uses its best efforts in rendering services to the Fund, but in the absence of willful misfeasance, bad faith, gross negligence or reckless disregard of its obligations, the Distributor is not liable to the Fund or any of its shareholders for any error of judgment or mistake of law or for any act or omission or for any losses sustained by the Fund or its shareholders.
C. Services Provided by the Adviser and Administrator
The Adviser manages the investment of the Fund's assets, including the placing of orders for the purchase and sale of portfolio securities. The Adviser obtains and evaluates the information and advice relating to the economy, securities markets and specific securities as it considers necessary or useful to continuously manage the assets of the Fund in a manner consistent with its investment objective.
Under the terms of the Administration Agreement, the Administrator maintains certain of the Fund's books and records and furnishes, at its own expense, the office space, facilities, equipment, clerical help and bookkeeping as the Fund may reasonably require in the conduct of its business. The Administrator also assists in the preparation of prospectuses, proxy statements and reports required to be filed with federal and state securities commissions (except insofar as the participation or assistance of the independent registered public accounting firm and attorneys is, in the opinion of the Administrator, necessary or desirable). The Administrator also bears the cost of telephone service, heat, light, power and other utilities provided to the Fund.
Expenses not expressly assumed by the Adviser under the Investment Advisory Agreement or by the Administrator under the Administration Agreement or by the Distributor will be paid by the Fund. These expenses will be allocated among the six Classes of shares pro rata based on the net assets of the Fund attributable to each Class, except as described below. Such expenses include, but are not limited to: expenses of the Plans of Distribution and Shareholder Service Plan pursuant to Rule 12b-1; charges and expenses of any registrar, custodian, stock transfer and dividend disbursing agent; brokerage commissions; taxes; engraving and printing share certificates; registration costs of the Fund and its shares under federal and state securities laws; the cost and expense of printing, including typesetting, and distributing prospectuses of the Fund and supplements thereto to the Fund's shareholders; all expenses of shareholders' and Trustees' meetings and of preparing, printing and mailing of proxy statements and reports to shareholders; fees and travel expenses of Trustees or members of any advisory board or committee who are not employees of the Adviser or any corporate affiliate of the Adviser; all expenses incident to any dividend, withdrawal or redemption options; charges and expenses of any outside service used for pricing of the Fund's shares; fees and expenses of legal counsel, including counsel to the Trustees who are not interested persons of the Fund or of the Adviser (not including compensation or expenses of attorneys who are employees of the Adviser); fees and expenses of the Fund's independent registered public accounting firm; membership dues of industry associations; interest on Fund borrowings; postage; insurance premiums on property or personnel (including officers and Trustees) of the Fund which inure to its benefit; extraordinary expenses (including, but not limited to, legal claims and liabilities and litigation costs and any indemnification relating thereto); and all other costs of the Fund's operation. The 12b-1 fees relating to a particular Class will be allocated directly to that Class. In addition, other expenses associated with a particular Class (except advisory or custodial fees) may be allocated directly to that Class, provided that such expenses are reasonably identified as specifically attributable to that Class and the direct allocation to that Class is approved by the Trustees.
42
The Advisory Agreement provides that in the absence of willful misfeasance, bad faith, gross negligence or reckless disregard of its obligations thereunder, the Adviser is not liable to the Fund or any of its investors for any act or omission by the Adviser or for any losses sustained by the Fund or its investors.
The Advisory Agreement will remain in effect from year to year, provided continuance of the Advisory Agreement is approved at least annually by the vote of the holders of a majority, as defined in the Investment Company Act, of the outstanding shares of the Fund, or by the Trustees; provided that in either event such continuance is approved annually by the vote of a majority of the Independent Trustees.
The Administration Agreement provides that in the absence of willful misfeasance, bad faith, gross negligence or reckless disregard of its obligations thereunder, the Administrator is not liable to the Fund or any of its investors for any act or omission by the Administrator or for any losses sustained by the Fund or its investors. The Administration Agreement will continue unless terminated by either party by written notice delivered to the other party within 30 days.
D. Dealer Reallowances
Upon notice to selected broker-dealers, the Distributor may reallow up to the full applicable front-end sales charge during periods specified in such notice. During periods when 90% or more of the sales charge is reallowed, such selected broker-dealers may be deemed to be underwriters as that term is defined in the Securities Act.
E. Rule 12b-1 Plans
The Fund has adopted a Plan of Distribution, effective July 31, 2011, in accordance with Rule 12b-1 under the Investment Company Act with respect to the Class A, Class B and Class C shares and has adopted a Plan of Distribution and a Shareholder Services Plan, each effective July 31, 2011, in accordance with Rule 12b-1 under the Investment Company Act with respect to its Class R and Class W shares (each, a "Plan" and together, the "Plans"). Pursuant to the Plans, each Class, other than Class I, pays the Distributor compensation accrued daily and payable monthly at the following maximum annual rates: 0.25%, 1.00%, 1.00%, 0.50% and 0.35% of the average daily net assets of Class A, Class B, Class C, Class R and Class W shares, respectively. As of the date of this SAI, Class R and Class W shares have not commenced operations. Prior to July 31, 2011, in accordance with Rule 12b-1 under the Investment Company Act, the Fund had adopted (i) a Plan of Distribution with respect to the Class A, Class B and Class C shares, and (ii) and a Plan of Distribution and a Shareholder Services Plan, each with respect to the Class R and Class W shares, each between the Fund and Morgan Stanley Distributors Inc. (the "Prior Distributor"), pursuant to which the Prior Distributor provided certain services in connection with the promotion and sale of the Fund's shares (each, a "Prior Plan" and together, the "Prior Plans").
The Distributor also receives the proceeds of front-end sales charges ("FSCs") and of contingent deferred sales charges ("CDSCs") imposed on certain redemptions of shares, which are separate and apart from payments made pursuant to the Plan. The Prior Distributor has informed the Fund that it and/or Morgan Stanley & Co. received the proceeds of CDSCs and FSCs, for the last three fiscal years ended July 31, in approximate amounts as provided in the table below.
| 2011 | 2010 | 2009 | |||||||||||||||||||||||||
| Class A | FSCs:(1) | $ | 132,076 | FSCs:(1) | $ | 159,869 | FSCs:(1) | $ | 112,720 | ||||||||||||||||||
| CDSCs: | $ | 1,092 | CDSCs: | $ | 401 | CDSCs: | $ | 752 | |||||||||||||||||||
| Class B | CDSCs: | $ | 25,621 | CDSCs: | $ | 61,098 | CDSCs: | $ | 154,105 | ||||||||||||||||||
| Class C | CDSCs: | $ | 4,271 | CDSCs: | $ | 5,527 | CDSCs: | $ | 5,554 | ||||||||||||||||||
(1) FSCs apply to Class A only.
The entire fee payable by Class A and a portion of the fees payable by each of Class B, Class C, Class R and Class W each year pursuant to the Plans up to 0.25% of such Class' average daily net assets are currently each characterized as a "service fee" under the Rules of the Financial Industry Regulatory Authority ("FINRA") (of which the Distributor is a member). The "service fee" is a payment made for personal service and/or the maintenance of shareholder accounts. The remaining portion of the Plan fees payable by a Class, if any, is characterized as an "asset-based sales charge" as such is defined by the Rules of FINRA.
Under the Plans and as required by Rule 12b-1, the Trustees receive and review promptly after the end of each calendar quarter a written report provided by the Distributor of the amounts expended under
43
the Plans and the purpose for which such expenditures were made. For the fiscal year ended July 31, 2011, Class A, Class B and Class C shares of the Fund made payments under the Prior Plans amounting to $1,179,621, $478,139 and $437,357, respectively, which amounts are equal to 0.25%, 1.00% and 1.00% of the average daily net assets of Class A, Class B and Class C, respectively, for the fiscal year. There were no Class R or Class W shares outstanding during the fiscal year ended July 31, 2011. As of the date of this SAI, Class R and Class W shares have not commenced operations.
The Plans were adopted in order to permit the implementation of the Fund's method of distribution. Under this distribution method the Fund offers six Classes, each with a different distribution arrangement.
With respect to Class A shares, the Distributor generally compensates authorized dealers, from proceeds of the FSC, commissions for the sale of Class A shares, currently a gross sales credit of up to 5.00% of the amount sold and an annual residual commission, currently a residual of up to 0.25% of the current value of the respective accounts for which they are dealers of record in all cases.
With respect to sales of Class B and Class C shares of the Fund, a commission or transaction fee generally will be compensated by the Distributor at the time of purchase directly out of the Distributor's assets (and not out of the Fund's assets) to authorized dealers who initiate and are responsible for such purchases computed based on a percentage of the dollar value of such shares sold of up to 4.00% on Class B shares and up to 1.00% on Class C shares.
Proceeds from any CDSC and any distribution fees on Class B and Class C shares of the Fund are paid to the Distributor and are used by the Distributor to defray its distribution related expenses in connection with the sale of the Fund's shares, such as the payment to authorized dealers for selling such shares. With respect to Class C shares, the authorized dealers generally receive from the Distributor ongoing distribution fees of up to 1.00% of the average daily net assets of the Fund's Class C shares annually commencing in the second year after purchase.
The distribution fee that the Distributor receives from the Fund under the Plans, in effect, offsets distribution expenses incurred under the Plans on behalf of the Fund and, in the case of Class B shares, opportunity costs, such as the gross sales credit and an assumed interest charge thereon ("carrying charge"). These expenses may include the cost of Fund-related educational and/or business-related trips or payment of Fund-related educational and/or promotional expenses of Financial Advisors. In the Distributor's reporting of the distribution expenses to the Fund, in the case of Class B shares, such assumed interest (computed at the "broker's call rate") has been calculated on the gross credit as it is reduced by amounts received by the Distributor under the Plans and any CDSCs received by the Distributor upon redemption of shares of the Fund. No other interest charge is included as a distribution expense in the Distributor's calculation of its distribution costs for this purpose. The broker's call rate is the interest rate charged to securities brokers on loans secured by exchange-listed securities.
The Fund may reimburse expenses incurred or to be incurred in promoting the distribution of the Fund's Class A, Class B, Class C, Class R and Class W shares and in servicing shareholder accounts. Reimbursement will be made through payments at the end of each month. The amount of each monthly payment may in no event exceed an amount equal to a payment at the annual rate of 0.25% in the case of Class A shares, 1.00% in the case of Class B shares, 1.00% in the case of Class C, 0.50% in the case of Class R and 0.35% in the case of Class W, of the average daily net assets of the respective Class during the month. No interest or other financing charges, if any, incurred on any distribution expenses on behalf of Class A, Class B, Class C, Class R and Class W will be reimbursable under the Plans.
Each Class paid 100% of the amounts accrued under the Prior Plans with respect to that Class for the fiscal year ended July 31, 2011 to the Prior Distributor. It is estimated that the Prior Distributor spent this amount in approximately the following ways: (i) 0.00% ($0) — advertising and promotional expenses; (ii) 0.00% ($0) — printing and mailing of prospectuses for distribution to other than current shareholders; and (iii) 100.00% ($306,629) — other expenses, including the gross sales credit and the carrying charge, of which 56.06% ($171,899) represents carrying charges, 18.19% ($55,778) represents commission credits to Morgan Stanley Smith Barney and Morgan Stanley & Co. branch offices and other selected broker-dealers for payments of commissions to Financial Advisors and other authorized financial representatives, and 25.75% ($78,952) represents overhead and other branch office distribution-related expenses. The amounts accrued by Class A and a portion of the amounts accrued by Class C under the Prior Plan relating to Class A and Class C during the fiscal year ended July 31, 2011 were service fees. The remainder of the amounts accrued by Class C were for expenses which relate to compensation of
44
sales personnel and associated overhead expenses. Class R and Class W were not operational during the fiscal year ended July 31, 2011. As of the date of this SAI, Class R and Class W shares have not commenced operations.
In the case of Class B shares, at any given time, the expenses of distributing shares of the Fund may be more or less than the total of (i) the payments made by the Fund pursuant to the Plan relating to Class B; and (ii) the proceeds of CDSCs paid by investors upon redemption of shares. For example, if $1 million in expenses in distributing Class B shares of the Fund had been incurred and $750,000 had been received as described in (i) and (ii) above, the excess expense would amount to $250,000. The Prior Distributor has advised the Fund that in the case of Class B shares the excess distribution expenses, including the carrying charge designed to approximate the opportunity costs incurred by Morgan Stanley Smith Barney and Morgan Stanley & Co. which arise from their having advanced monies without having received the amount of any sales charges imposed at the time of sale of the Fund's Class B shares, totaled $11,850,182 as of July 31, 2011 (the end of the Fund's fiscal year), which was equal to approximately 34.47% of the net assets of Class B on such date. Because there is no requirement under the Plan or the Prior Plan relating to Class B that the Distributor or the Prior Distributor, respectively, be reimbursed for all distribution expenses with respect to Class B shares or any requirement that the Plan be continued from year to year, this excess amount does not constitute a liability of the Fund. Although there is no legal obligation for the Fund to pay expenses incurred in excess of payments made to the Distributor under the Plan and the proceeds of CDSCs paid by investors upon redemption of shares, if for any reason the Plan is terminated, the Trustees will consider at that time the manner in which to treat such expenses. Any cumulative expenses incurred, but not yet recovered through distribution fees or CDSCs, may or may not be recovered through future distribution fees or CDSCs.
In the case of Class A, Class C, Class R and Class W shares, expenses incurred pursuant to the Plans in any calendar year in excess of 0.25%,1.00%, 0.50% or 0.35% of the average daily net assets of Class A, Class C, Class R or Class W, respectively, will not be reimbursed by the Fund through payments in any subsequent year, except that expenses representing a gross sales commission credited to Morgan Stanley Smith Barney Financial Advisors and other authorized financial representatives at the time of sale may be reimbursed in the subsequent calendar year. The Prior Distributor has advised the Fund that there were no unreimbursed expenses representing a gross sales commission credited to Morgan Stanley Smith Barney Financial Advisors and other authorized financial representatives at the time of sale in the case of Class A or Class C at December 31, 2010 (the end of the calendar year). No interest or other financing charges will be incurred on any Class A, Class C, Class R and Class W distribution expenses incurred by the Distributor under the Plans relating to these classes or on any unreimbursed expenses due to the Distributor or the Prior Distributor pursuant to the Plans or the Prior Plans, respectively. As of the date of this SAI, Class R and Class W shares have not commenced operations.
No interested person of the Fund nor any Independent Trustee has any direct financial interest in the operation of the Plans except to the extent that the Distributor, the Adviser, Morgan Stanley & Co., Morgan Stanley Smith Barney, Morgan Stanley Services or certain of their employees may be deemed to have such an interest as a result of benefits derived from the successful operation of the Plans or as a result of receiving a portion of the amounts expended thereunder by the Fund.
On an annual basis, the Trustees, including a majority of the Independent Trustees, consider whether each Plan should be continued. Prior to approving the last continuation of each Plan, the Trustees requested and received from the Distributor and reviewed all the information which they deemed necessary to arrive at an informed determination. In making their determination to continue the Plan, the Trustees considered: (1) the Fund's experience under the Plan and whether such experience indicates that the Plan is operating as anticipated; (2) the benefits the Fund had obtained, was obtaining and would be likely to obtain under the Plan, including that: (a) the Plan is essential in order to give Fund investors a choice of alternatives for payment of distribution and service charges and to enable the Fund to continue to grow and avoid a pattern of net redemptions which, in turn, are essential for effective investment management; and (b) without the compensation to individual brokers and the reimbursement of distribution and account maintenance expenses of Morgan Stanley & Co. and Morgan Stanley Smith Barney branch offices made possible by the 12b-1 fees, Morgan Stanley & Co. and Morgan Stanley Smith Barney could not establish and maintain an effective system for distribution, servicing of Fund shareholders and maintenance of shareholder accounts; and (3) what services had been provided and were continuing to be provided under the Plan to the Fund and its shareholders. Based upon their review, the Trustees, including each of the Independent Trustees, determined that
45
continuation of each Plan would be in the best interest of the Fund and would have a reasonable likelihood of continuing to benefit the Fund and its shareholders.
The Plans may not be amended to increase materially the amount to be spent for the services described therein without approval by the shareholders of the affected Class or Classes of the Fund, and all material amendments to the Plans must also be approved by the Trustees. Each Plan may be terminated at any time, without payment of any penalty, by vote of a majority of the Independent Trustees or by a vote of a majority of the outstanding voting securities of the Fund (as defined in the Investment Company Act) on not more than 30 days' written notice to any other party to the Plans. So long as the Plans are in effect, the election and nomination of Independent Trustees shall be committed to the discretion of the Independent Trustees.
F. Other Service Providers
(1) Transfer Agent/Dividend Disbursing Agent
Morgan Stanley Services Company Inc. is the Transfer Agent for the Fund's shares and the Dividend Disbursing Agent for payment of dividends and distributions on Fund shares and Agent for shareholders under various investment plans. The principal business address of the Transfer Agent is Harborside Financial Center, 201 Plaza Two, 2nd Floor, Jersey City, NJ 07311.
(2) Custodian and Independent Registered Public Accounting Firm
State Street Bank and Trust Company, One Lincoln Street, Boston, MA 02111, is the Custodian of the Fund's assets. Any of the Fund's cash balances with the Custodian in excess of $250,000 (a temporary increase from $100,000, which is due to expire on December 31, 2013) are unprotected by federal deposit insurance. These balances may, at times, be substantial.
As of June 7, 2011, Ernst & Young LLP, located at 200 Clarendon Street, Boston, MA 02116-5072, is the independent registered public accounting firm of each Fund. Prior to June 7, 2011, Deloitte & Touche LLP, located at Two World Financial Center, New York, NY 10281, was the independent registered public accounting firm of the Fund. The Fund's independent registered public accounting firm is responsible for auditing the annual financial statements.
(3) Affiliated Persons
The Transfer Agent is an affiliate of the Adviser and the Distributor. As Transfer Agent and Dividend Disbursing Agent, the Transfer Agent's responsibilities include maintaining shareholder accounts, disbursing cash dividends and reinvesting dividends, processing account registration changes, handling purchase and redemption transactions, mailing prospectuses and reports, mailing and tabulating proxies, processing share certificate transactions, and maintaining shareholder records and lists. Pursuant to a Transfer Agency and Service Agreement, as consideration for the services it provides, the Transfer Agent receives certain fees from the Fund, which are approved by the Trustees, generally based on the number of shareholder accounts and is reimbursed for its out-of-pocket expenses in connection with such services. The Fund and the Transfer Agent may enter into agreements with unaffiliated third party intermediaries, pursuant to which such intermediaries agree to provide recordkeeping and other administrative services for their clients who invest in the Fund. In such instances, the Fund will pay certain fees to the intermediaries for the services they provide that otherwise would have been performed by the Transfer Agent.
G. Fund Management
Other Accounts Managed by the Portfolio Managers
As of July 31, 2011 for Mr. Bavoso:
As of August 31, 2011 for Mr. Moullé-Berteaux:
| Registered Investment Companies | Other Pooled Investment Vehicles | Other Accounts | |||||||||||||||||||||||||
| Portfolio Managers | Number of Accounts | Total Assets in the Accounts | Number of Accounts | Total Assets in the Accounts | Number of Accounts | Total Assets in the Accounts | |||||||||||||||||||||
| Mark A. Bavoso | 3 | $735.5 million | 2 | $781.8 million | 10 | $4.2 million | (1 | ) | |||||||||||||||||||
| Cyril Moullé-Berteaux | 5 | $849.4 million | 2 | $696.5 million | 9 | $4.1 million | (2 | ) | |||||||||||||||||||
(1) Of these other accounts, three accounts with total assets of $1.6 million, had performance-based fees.
(2) Of these other accounts, three accounts with total assets of $1.5 million, had performance based fees.
46
Because the portfolio managers may manage assets for other investment companies, pooled investment vehicles and/or other accounts (including institutional clients, pension plans and certain high net worth individuals), there may be an incentive to favor one client over another resulting in conflicts of interest. For instance, the Adviser may receive fees from certain accounts that are higher than the fee it receives from the Fund, or it may receive a performance-based fee on certain accounts. In those instances, the portfolio managers may have an incentive to favor the higher and/or performance-based fee accounts over the Fund. In addition, a conflict of interest could exist to the extent the Adviser has proprietary investments in certain accounts, where portfolio managers have personal investments in certain accounts or when certain accounts are investment options in the Adviser's employee benefits and/or deferred compensation plans. The portfolio managers may have an incentive to favor these accounts over others. If the Adviser manages accounts that engage in short sales of securities of the type in which the Fund invests, the Adviser could be seen as harming the performance of the Fund for the benefit of the accounts engaging in short sales if the short sales cause the market value of the securities to fall. The Adviser has adopted trade allocation and other policies and procedures that it believes are reasonably designed to address these and other conflicts of interest.
Portfolio Manager Compensation Structure
Portfolio managers receive a combination of base compensation and discretionary compensation, comprising a cash bonus and several deferred compensation programs described below. The methodology used to determine portfolio manager compensation is applied across all funds/accounts managed by the portfolio managers.
Base salary compensation. Generally, portfolio managers receive base salary compensation based on the level of their position with the Adviser.
Discretionary compensation. In addition to base compensation, portfolio managers may receive discretionary compensation.
Discretionary compensation can include:
• Cash Bonus.
• Morgan Stanley's Long Term Incentive Compensation awards — a mandatory program that defers a portion of discretionary year-end compensation into restricted stock units or other awards based on Morgan Stanley common stock or other plans that are subject to vesting and other conditions.
• Investment Management Alignment Plan (IMAP) awards — a mandatory program that defers a portion of discretionary year-end compensation and notionally invests it in designated funds advised by the Adviser or its affiliates. The award is subject to vesting and other conditions. Portfolio managers must notionally invest a minimum of 25% to a maximum of 100% of their IMAP deferral account into a combination of the designated funds they manage that are included in the IMAP fund menu, which may or may not include the Fund. IMAP awards contain a clawback provision that can be triggered if an individual engages in certain conduct detrimental to Morgan Stanley or one of its businesses — such as causing the need for a material restatement of results, a substantial loss on a holding or any loss on a holding if the employee operated outside of risk parameters, where such holding was a factor in determining compensation.
• Voluntary Deferred Compensation Plans — voluntary programs that permit certain employees to elect to defer a portion of their discretionary year-end compensation and notionally invest the deferred amount across a range of designated investment funds, which may include funds advised by the Adviser or its affiliates.
Several factors determine discretionary compensation, which can vary by portfolio management team and circumstances. These factors include:
• Revenues generated by the investment companies, pooled investment vehicles and other accounts managed by the portfolio manager.
• The investment performance of the funds/accounts managed by the portfolio manager.
• Contribution to the business objectives of the Adviser.
47
• The dollar amount of assets managed by the portfolio manager.
• Market compensation survey research by independent third parties.
• Other qualitative factors, such as contributions to client objectives.
• Performance of Morgan Stanley and Morgan Stanley Investment Management, and the overall performance of the investment team(s) of which the portfolio manager is a member.
Securities Ownership of Portfolio Managers
As of July 31, 2011 (August 31, 2011 with respect to Mr. Moullé-Berteaux), the dollar range of securities beneficially owned by each portfolio manager in the Fund is shown below:
| Mark A. Bavoso: | $ | 50,001 - $100,000 | |||||
| Cyril Moullé-Berteaux | None | ||||||
H. Codes of Ethics
The Fund, the Adviser and the Distributor have each adopted a Code of Ethics pursuant to Rule 17j-1 under the Investment Company Act. The Codes of Ethics are designed to detect and prevent improper personal trading. The Codes of Ethics permit personnel subject to the Codes to invest in securities, including securities that may be purchased, sold or held by the Fund, subject to a number of restrictions and controls, including prohibitions against purchases of securities in an initial public offering and a preclearance requirement with respect to personal securities transactions.
I. Proxy Voting Policy and Proxy Voting Record
The Board of Trustees believes that the voting of proxies on securities held by the Fund is an important element of the overall investment process. As such, the Trustees have delegated the responsibility to vote such proxies to Morgan Stanley Investment Management and its advisory affiliates ("MSIM").
A copy of MSIM's Proxy Voting Policy ("Proxy Policy") is attached hereto as Appendix A. In addition, a copy of the Proxy Policy, as well as the Fund's most recent proxy voting record for the 12-month period ended June 30, as filed with the SEC are available without charge on our web site at www.morganstanley.com/im. The Fund's proxy voting record is also available without charge on the SEC's web site at www.sec.gov.
J. Revenue Sharing
The Adviser and/or Distributor may pay compensation, out of their own funds and not as an expense of the Fund, to Morgan Stanley Smith Barney, Citigroup Global Markets Inc. ("CGM") and certain unaffiliated brokers, dealers or other financial intermediaries, including recordkeepers and administrators of various deferred compensation plans ("Intermediaries") in connection with the sale, distribution, marketing and retention of Fund shares and/or shareholder servicing. For example, the Adviser or the Distributor may pay additional compensation to Intermediaries for, among other things, promoting the sale and distribution of Fund shares, providing access to various programs, mutual fund platforms or preferred or recommended mutual fund lists offered by the Intermediary, granting the Distributor access to the Intermediary's financial advisors and consultants, providing assistance in the ongoing education and training of the Intermediary's financial personnel, furnishing marketing support, maintaining share balances and/or for sub-accounting, recordkeeping, administrative, shareholder or transaction processing services. Such payments are in addition to any distribution fees, shareholder service fees and/or transfer agency fees that may be payable by the Fund. The additional payments may be based on various factors, including level of sales (based on gross or net sales or some specified minimum sales or some other similar criteria related to sales of the Fund and/or some or all other Morgan Stanley Funds), amount of assets invested by the Intermediary's customers (which could include current or aged assets of the Fund and/or some or all other Morgan Stanley Funds), a Fund's advisory fees, some other agreed upon amount, or other measures as determined from time to time by the Adviser and/or Distributor. The amount of these payments may be different for different Intermediaries.
48
With respect to Morgan Stanley Smith Barney and CGM, these payments currently include the following amounts, which are paid in accordance with the applicable compensation structure:
(1) On $1 million or more of Class A shares (for which no sales charge was paid) or net asset value purchases by certain employee benefit plans, Morgan Stanley Smith Barney and CGM, as applicable, receive a gross sales credit of up to 1.00% of the amount sold.*
(2) On Class A, Class B, Class C and Class I shares of the Fund held in traditional brokerage accounts where Morgan Stanley Smith Barney or CGM is designated by purchasers as broker-dealer of record:
• For the period beginning January 1, 2011 and ending December 31, 2011, an amount up to $1.6 million, which covers the Fund and all other Morgan Stanley Funds; and
• For the period beginning January 1, 2012 and thereafter, an ongoing annual fee in an amount up to 0.13% of the total average quarterly net asset value of such shares.
(3) On Class I shares of the Fund held in traditional brokerage accounts where Morgan Stanley Smith Barney is designated by purchasers as broker-dealer of record, in addition to the amounts referenced in paragraph (2) above:
• A gross sales credit of 0.25% of the amount sold and an ongoing annual fee in an amount up to 0.10% of the total average quarterly net asset value of such shares; or
• An ongoing annual fee in an amount up to 35% of the advisory fee the Adviser receives based on the average daily net assets of such shares.
There is a chargeback of 100% of the gross sales credit amount paid if the Class I shares are redeemed in the first year and a chargeback of 50% of the gross sales credit amount paid if the shares are redeemed in the second year.
(4) On Class A, Class B, Class C and Class I shares of the Fund held in taxable accounts through any fee-based advisory program offered by the Morgan Stanley channel of Morgan Stanley Smith Barney, an ongoing annual fee in an amount up to 0.03% of the total average monthly net asset value of such shares.
(5) On any shares of the Fund held in an account through certain 401(k) platforms in the Morgan Stanley channel of Morgan Stanley Smith Barney's Corporate Retirement Solutions, an ongoing annual fee in an amount up to 0.20% of the total average monthly net asset value of such shares.
With respect to other Intermediaries, these payments currently include the following amounts, which are paid in accordance with the applicable compensation structure for each Intermediary:
(1) On $1 million or more of Class A shares (for which no sales charge was paid) or net asset value purchases by certain employee benefit plans, Intermediaries receive a gross sales credit of up to 1.00% of the amount sold.*
(2) On Class A, Class B and Class C shares of the Fund held in Intermediary accounts other than those held through Intermediary 401(k) platforms, an ongoing annual fee in an amount up to 0.10% of the total average monthly net asset value of such shares.
(3) On Class I shares of the Fund held in Intermediary accounts other than those held through Intermediary 401(k) platforms:
• A gross sales credit of 0.25% of the amount sold; and
• An ongoing annual fee in an amount up to 0.10% of the total average monthly net asset value of such shares.
* Commissions or transaction fees paid when Morgan Stanley Smith Barney, CGM or other Intermediaries initiate and are responsible for purchases of $1 million or more are computed on a percentage of the dollar value of such shares sold as follows: 1.00% on sales of $1 million to $2 million, plus 0.75% on the next $1 million, plus 0.50% on the next $2 million, plus 0.25% on the excess over $5 million.
49
There is a chargeback of 100% of the gross sales credit amount paid if the Class I shares are redeemed in the first year and a chargeback of 50% of the gross sales credit amount paid if the shares are redeemed in the second year.
The prospect of receiving, or the receipt of, additional compensation, as described above, by Intermediaries may provide such Intermediaries, and/or their financial advisors or other salespersons, with an incentive to favor sales of shares of the Fund over other investment options with respect to which an Intermediary does not receive additional compensation (or receives lower levels of additional compensation). These payment arrangements, however, will not change the price that an investor pays for shares of the Fund or the amount that the Fund receives to invest on behalf of an investor. Investors may wish to take such payment arrangements into account when considering and evaluating any recommendations relating to Fund shares and should review carefully any disclosure provided by Intermediaries as to their compensation.
VI. BROKERAGE ALLOCATION AND OTHER PRACTICES
A. Brokerage Transactions
Subject to the general supervision of the Trustees, the Adviser is responsible for decisions to buy and sell securities for the Fund, the selection of brokers and dealers to effect the transactions, and the negotiation of brokerage commissions, if any. Purchases and sales of securities on a stock exchange are effected through brokers who charge a commission for their services. In the OTC market, securities are generally traded on a "net" basis with dealers acting as principal for their own accounts without a stated commission, although the price of the security usually includes a profit to the dealer. The Fund also expects that securities will be purchased at times in underwritten offerings where the price includes a fixed amount of compensation, generally referred to as the underwriter's concession or discount. Options and futures transactions will usually be effected through a broker and a commission will be charged. On occasion, the Fund may also purchase certain money market instruments directly from an issuer, in which case no commissions or discounts are paid.
During the fiscal years ended July 31, 2009, 2010 and 2011, the Fund paid a total of $640,699, $1,143,691 and $526,725, respectively, in brokerage commissions. In March 2010 the Fund changed its principal investment strategy.
B. Commissions
Pursuant to an order issued by the SEC, the Fund is permitted to engage in principal transactions involving money market instruments, subject to certain conditions, with Morgan Stanley & Co., a broker-dealer affiliated with the Fund's Adviser.
During the fiscal years ended July 31, 2009, 2010 and 2011, the Fund did not effect any principal transactions with Morgan Stanley & Co.
Brokerage transactions in securities listed on exchanges or admitted to unlisted trading privileges may be effected through Morgan Stanley & Co., Citigroup, Inc. and other affiliated brokers and dealers. In order for an affiliated broker or dealer to effect any portfolio transactions on an exchange for the Fund, the commissions, fees or other remuneration received by the affiliated broker or dealer must be reasonable and fair compared to the commissions, fees or other remuneration paid to other brokers in connection with comparable transactions involving similar securities being purchased or sold on an exchange during a comparable period of time. This standard would allow the affiliated broker or dealer to receive no more than the remuneration which would be expected to be received by an unaffiliated broker in a commensurate arm's-length transaction. Furthermore, the Trustees, including the Independent Trustees, have adopted procedures which are reasonably designed to provide that any commissions, fees or other remuneration paid to an affiliated broker or dealer are consistent with the foregoing standard. The Fund does not reduce the management fee it pays to the Adviser by any amount of the brokerage commissions it may pay to an affiliated broker or dealer.
During the fiscal years ended July 31, 2009, 2010 and 2011, the Fund paid a total of $157,617, $104,178 and $0, respectively, in brokerage commissions to Morgan Stanley & Co.
50
For the period June 1, 2009 to July 31, 2009 and during the fiscal years ended July 31, 2010 and 2011, the Fund paid a total of $2,000, $21,482 and $545, respectively, in brokerage commissions to Citigroup, Inc. During the fiscal year ended July 31, 2011, the brokerage commissions paid to Citigroup, Inc. represented approximately 0.10% of the total brokerage commissions paid by the Fund during the year and were paid on account of transactions having an aggregate dollar value equal to approximately 0.01% of the aggregate dollar value of all portfolio transactions of the Fund during the year for which commissions were paid.
C. Brokerage Selection
The policy of the Fund regarding purchases and sales of securities for its portfolio is that primary consideration will be given to obtaining the most favorable prices and efficient executions of transactions. The Adviser is prohibited from directing brokerage transactions on the basis of the referral of clients or the sale of shares of investment companies for which it acts as investment adviser. Consistent with this policy, when securities transactions are effected on a stock exchange, the Fund's policy is to pay commissions which are considered fair and reasonable without necessarily determining that the lowest possible commissions are paid in all circumstances. The Fund believes that a requirement always to seek the lowest possible commission cost could impede effective portfolio management and preclude the Fund and the Adviser from obtaining a high quality of brokerage and research services. The Fund anticipates that certain of its transactions involving foreign securities will be effected on foreign securities exchanges. Fixed commissions on such transactions are generally higher than negotiated commissions on domestic transactions. There is also generally less government supervision and regulation of foreign securities exchanges and brokers than in the United States.
In seeking to implement the Fund's policies, the Adviser effects transactions with those broker-dealers that the Adviser believes provide prompt execution of orders in an effective manner at the most favorable prices. The Adviser may place portfolio transactions with those broker-dealers that also furnish research and other services to the Fund or the Adviser. Services provided may include certain research services (as described below) as well as effecting securities transactions and performing functions incidental thereto (such as clearance settlement and custody).
The Adviser and its affiliated investment advisers have established commission sharing arrangements under a commission management program (the "Commission Management Program" or "CMP"), pursuant to which execution and research costs or a portion of those costs are decoupled in accordance with applicable laws, rules and regulations. Under the CMP, the Adviser and its affiliated investment advisers select approved equity brokers (which include the Adviser's affiliates) for execution services, and after accumulation of commissions at such brokers, the Adviser and/or its affiliates instruct these approved equity brokers to pay for eligible research provided by executing brokers or third-party research providers, which are selected independently by a Research Services Committee of the Adviser and its affiliated investment advisers. Generally, the Adviser and its affiliated investment advisers will direct the approved equity broker to record research credits based upon a previously agreed-upon allocation and will periodically instruct the approved equity broker to direct specified dollar amounts from that pool to pay for eligible research services provided by third-party research providers and executing brokers. The research credits are pooled among the Adviser and its affiliated investment advisers and allocated from this pool. Likewise, the research services obtained under the CMP are shared among the Adviser and its affiliated investment advisers.
Selection of approved equity brokers for execution is based on three main criteria: access to liquidity, provision of capital and quality of execution. Under the CMP, each approved equity broker is responsible for the payment of fees for research services and obtains the research services pursuant to written agreements between the approved equity broker and the third-party research provider.
For those costs not decoupled, but retained by broker-dealer, the Adviser also effects transactions with brokers which directly pay for research services provided by those brokers in accordance with Section 28(e) of the Exchange Act. Such transactions include equity transactions and may include fixed-income transactions effected on an agency basis.
Transactions involving client accounts managed by two or more affiliated investment advisers may be aggregated and executed using the services of broker-dealers that provide third party benefits/research so long as: (i) all client accounts involved in the transaction benefit from one or more of the services offered by such broker-dealer; and (ii) each affiliated investment adviser has approved the use of such broker-dealer and the services provided thereby.
51
The research services received include those of the nature described above and other services which aid the Adviser in fulfilling its investment decision making responsibilities, including (a) furnishing advice as to the value of securities, the advisability of investing in, purchasing or selling securities, and the availability of securities or purchasers or sellers of securities; and (b) furnishing analyses and reports concerning issuers, industries, securities, economic factors and trends, portfolio strategy and the performance of accounts. Where a particular item has both research and non-research related uses (such as proxy services where both research services and services relating to the administration of the proxy itself are provided), the Adviser will make a reasonable allocation of the cost of the item between research and non-research uses and will only pay for the portion of the cost allocated to research uses with client brokerage transactions. Research services furnished or paid for by brokers through whom the Adviser effects transactions for a particular account may be used by the Adviser or its affiliated investment advisers in servicing their other accounts, and not all such services may be used for the benefit of the client which pays the brokerage commission which results in the receipt of such research services. Commissions paid to brokers providing research services may be higher than those charged by brokers not providing services.
The Adviser and its affiliated investment advisers make a good faith determination of the value of research services in accordance with Section 28(e) of the Exchange Act, UK Financial Services Authority Rules and other relevant regulatory requirements.
Certain investment professionals and other employees of the Adviser are also officers of affiliated investment advisers and may provide investment advisory services to clients of such affiliated investment advisers. The Adviser's personnel also provide research and trading support to personnel of certain affiliated investment advisers. Research related costs may be shared by affiliated investment advisers and may benefit the clients of such affiliated investment advisers. Research services that benefit the Adviser may be received in connection with commissions generated by clients of its affiliated investment advisers. Similarly, research services received in connection with commissions generated by the Adviser's clients may benefit affiliated investment advisers and their clients. Moreover, research services provided by broker-dealers through which the Adviser effects transactions for a particular account may be used by the Adviser and/or an affiliated investment adviser in servicing its other accounts and not all such research services may be used for the benefit of the particular client, which pays the brokerage commission giving rise to the receipt of such research services.
The Adviser and certain of its affiliates currently serve as investment adviser to a number of clients, including other investment companies, and may in the future act as investment adviser to others. It is the practice of the Adviser and its affiliates to cause purchase and sale transactions to be allocated among clients whose assets they manage (including the Fund) in such manner as it deems equitable. In making such allocations among the Fund and other client accounts, various factors may be considered, including the respective investment objectives, the relative size of portfolio holdings of the same or comparable securities, the availability of cash for investment, the size of investment commitments generally held and the opinions of the persons responsible for managing the portfolios of the Fund and other client accounts. The Adviser and its affiliates may operate one or more order placement facilities and each facility will implement order allocation in accordance with the procedures described above. From time to time, each facility may transact in a security at the same time as other facilities are trading in that security.
D. Regular Broker-Dealers
During the fiscal year ended July 31, 2011, the Fund purchased securities issued by Bank of America Securities LLC, Credit Suisse Group AG, Goldman Sachs & Co., J.P. Morgan Securities Inc., Barclays Capital Group, Royal Bank of Scotland PLC, Deutsche Bank AG and UBS Financial Services, Inc., which were among the ten brokers or ten dealers which executed transactions for or with the Fund in the largest dollar amounts during the period. At July 31, 2011, the Fund held securities issued by Bank of America Securities LLC, Credit Suisse Group AG, Goldman Sachs & Co., J.P. Morgan Securities Inc., Barclays Capital Group, Royal Bank of Scotland PLC, Deutsche Bank AG and UBS Financial Services Inc., with market values of $1,602,277, $813,289, $2,060,050, $3,502,907, $1,325,570, $811,595, $23,688,578 and $1,471,191, respectively.
VII. CAPITAL STOCK AND OTHER SECURITIES
The shareholders of the Fund are entitled to a full vote for each full share of beneficial interest held. The Fund is authorized to issue an unlimited number of shares of beneficial interest. All shares of beneficial
52
interest of the Fund are of $0.01 par value and are equal as to earnings, assets and voting privileges except that each Class will have exclusive voting privileges with respect to matters relating to distribution expenses borne solely by such Class or any other matter in which the interests of one Class differ from the interests of any other Class. In addition, Class B shareholders will have the right to vote on any proposed material increase in Class A's expenses, if such proposal is submitted separately to Class A shareholders. Also, Class A, Class B, Class C, Class R and Class W bear expenses related to the distribution of their respective shares.
The Fund's Declaration of Trust permits the Trustees to authorize the creation of additional series of shares (the proceeds of which would be invested in separate, independently managed portfolios) and additional Classes of shares within any series. The Trustees have not presently authorized any such additional series or Classes of shares other than as set forth in the Prospectus.
The Fund is not required to hold annual meetings of shareholders and in ordinary circumstances the Fund does not intend to hold such meetings. The Trustees may call special meetings of shareholders for action by shareholder vote as may be required by the Investment Company Act or the Declaration of Trust. Under certain circumstances, the Trustees may be removed by actions of the Trustees. In addition, under certain circumstances, the shareholders may call a meeting to remove Trustees and the Fund is required to provide assistance in communicating with shareholders about such a meeting. The voting rights of shareholders are not cumulative, so that holders of more than 50% of the shares voting can, if they choose, elect all Trustees being selected, while the holders of the remaining shares would be unable to elect any Trustees.
Under Massachusetts law, shareholders of a business trust may, under certain limited circumstances, be held personally liable as partners for the obligations of the Fund. However, the Declaration of Trust contains an express disclaimer of shareholder liability for acts or obligations of the Fund, requires that notice of such Fund obligations include such disclaimer, and provides for indemnification out of the Fund's property for any shareholder held personally liable for the obligations of the Fund. Thus, the risk of a shareholder incurring financial loss on account of shareholder liability is limited to circumstances in which the Fund itself would be unable to meet its obligations. Given the above limitations on shareholder personal liability, and the nature of the Fund's assets and operations, the possibility of the Fund being unable to meet its obligations is remote and thus, in the opinion of Massachusetts counsel to the Fund, the risk to Fund shareholders of personal liability is remote.
The Trustees themselves have the power to alter the number and the terms of office of the Trustees (as provided for in the Declaration of Trust), and they may at any time lengthen or shorten their own terms or make their terms of unlimited duration and appoint their own successors, provided that always at least a majority of the Trustees has been elected by the shareholders of the Fund.
VIII. PURCHASE, REDEMPTION AND PRICING OF SHARES
A. Purchase/Redemption of Shares
Information concerning how Fund shares are offered to the public (and how they are redeemed and exchanged) is provided in the Fund's Prospectus.
Suspension of Redemptions. Redemptions are not made on days during which the NYSE is closed. The right of redemption may be suspended and the payment therefore may be postponed for more than seven days during any period when (a) the NYSE is closed for other than customary weekends or holidays; (b) the SEC determines trading on the NYSE is restricted; (c) the SEC determines an emergency exists as a result of which disposal by the Fund of securities owned by it is not reasonably practicable or it is not reasonably practicable for the Fund to fairly determine the value of its net assets; or (d) the SEC, by order, so permits.
Transfer Agent as Agent. With respect to the redemption or repurchase of Fund shares, the application of proceeds to the purchase of new shares in the Fund or any other Morgan Stanley Funds and the general administration of the exchange privilege, the Transfer Agent acts as agent for the Distributor and for the shareholder's authorized broker-dealer, if any, in the performance of such functions. With respect to exchanges, redemptions or repurchases, the Transfer Agent is liable for its own negligence and not for the default or negligence of its correspondents or for losses in transit. The Fund is not liable for any default or negligence of the Transfer Agent, the Distributor or any authorized broker-dealer.
53
The Distributor and any authorized broker-dealer have appointed the Transfer Agent to act as their agent in connection with the application of proceeds of any redemption of Fund shares to the purchase of shares of any other Morgan Stanley Fund and the general administration of the exchange privilege. No commission or discounts will be paid to the Distributor or any authorized broker-dealer for any transaction pursuant to the exchange privilege.
Transfers of Shares. In the event a shareholder requests a transfer of Fund shares to a new registration, the shares will be transferred without sales charge at the time of transfer. With regard to the status of shares which are either subject to the CDSC or free of such charge (and with regard to the length of time shares subject to the charge have been held), any transfer involving less than all of the shares in an account will be made on a pro rata basis (that is, by transferring shares in the same proportion that the transferred shares bear to the total shares in the account immediately prior to the transfer). The transferred shares will continue to be subject to any applicable CDSC as if they had not been so transferred.
Outside Brokerage Accounts/Limited Portability. Most Fund shareholders hold their shares with Morgan Stanley Smith Barney. Please note that your ability to transfer your Fund shares to a brokerage account at another securities dealer may be limited. Fund shares may only be transferred to accounts held at a limited number of securities dealers or financial intermediaries that have entered into agreements with the Distributor. After a transfer, you may purchase additional shares of the Morgan Stanley Fund(s) you owned before the transfer and, in most instances, you will also be able to purchase shares of most other Morgan Stanley Funds. If you transfer shares of a fund that is not a Multi-Class Fund (for example, a Money Market Fund) you will not be able to exchange shares of that fund for any other Morgan Stanley Fund after the transfer.
If you wish to transfer Fund shares to a securities dealer or other financial intermediary that has not entered into an agreement with the Distributor, you may request that the securities dealer or financial intermediary maintain the shares in an account at the Transfer Agent registered in the name of such securities dealer or financial intermediary for your benefit. You may also hold your Fund shares in your own name directly with the Transfer Agent. In either case, you will continue to have the ability to purchase additional Morgan Stanley Funds and will have full exchange privileges. Other options may also be available; please check with the respective securities dealer or financial intermediary. If you choose not to hold your shares with the Transfer Agent, either directly or through a securities dealer or other financial intermediary, you must redeem your shares and pay any applicable CDSC.
B. Offering Price
The Fund's Class B, Class C, Class I, Class R and Class W shares are offered at net asset value per share and the Class A shares are offered at net asset value per share plus any applicable FSC which is distributed among the Fund's Distributor, Morgan Stanley Smith Barney and other authorized dealers as described in Section "V. Investment Advisory and Other Services — E. Rule 12b-1 Plan." The price of Fund shares, called "net asset value," is based on the value of the Fund's portfolio securities. Net asset value per share of each Class is calculated by dividing the value of the portion of the Fund's securities and other assets attributable to that Class, less the liabilities attributable to that Class, by the number of shares of that Class outstanding. The assets of each Class of shares are invested in a single portfolio. The net asset value of each Class, however, will differ because the Classes have different ongoing fees.
In the calculation of the Fund's net asset value: (1) an equity portfolio security listed or traded on the NYSE or other exchange is valued at its latest sale price, prior to the time when assets are valued; if there were no sales that day, the security is valued at the mean between the last reported bid and asked price; (2) an equity portfolio security listed or traded on the Nasdaq is valued at the Nasdaq Official Closing Price; if there were no sales that day, the security is valued at the mean between the last reported bid and asked price; and (3) all other portfolio securities for which OTC market quotations are readily available are valued at the mean between the last reported bid and asked price. In cases where a security is traded on more than one exchange, the security is valued on the exchange designated as the primary market. For equity securities traded on foreign exchanges, the closing price or the latest bid price may be used if there were no sales on a particular day. When market quotations are not readily available, including circumstances under which it is determined by the Adviser that the sale price, the bid price or the mean between the last reported bid and asked price are not reflective of a security's market value, portfolio securities are valued at their fair value as determined in good faith under procedures established by and under the general supervision of the Fund's Trustees. For valuation purposes, quotations of foreign portfolio securities, other assets
54
and liabilities and forward contracts stated in foreign currency are translated into U.S. dollar equivalents at the prevailing market rates prior to the close of the NYSE.
Short-term debt securities with remaining maturities of 60 days or less at the time of purchase are valued at amortized cost, unless the Trustees determine such price does not reflect the securities' market value, in which case these securities will be valued at their fair value as determined by the Trustees.
Certain of the Fund's portfolio securities may be valued by an outside pricing service approved by the Fund's Trustees. The pricing service may utilize a matrix system incorporating security quality, maturity and coupon as the evaluation model parameters, and/or research evaluations by its staff, including review of broker-dealer market price quotations in determining what it believes is the fair valuation of the portfolio securities valued by such pricing service.
Listed options on debt securities are valued at the latest sale price on the exchange on which they are listed unless no sales of such options have taken place that day, in which case they will be valued at the mean between their latest bid and asked prices. Unlisted options on debt securities and all options on equity securities are valued at the mean between their latest bid and asked prices. Futures are valued at the latest price published by the commodities exchange on which they trade unless it is determined that such price does not reflect their market value, in which case they will be valued at their fair value as determined in good faith under procedures established by and under the supervision of the Trustees.
Generally, trading in foreign securities, as well as corporate bonds, U.S. government securities and money market instruments, is substantially completed each day at various times prior to the close of the NYSE. The values of such securities used in computing the net asset value of the Fund's shares are determined as of such times. Foreign currency exchange rates are also generally determined prior to the close of the NYSE. Occasionally, events which may affect the values of such securities and such exchange rates may occur between the times at which they are determined and the close of the NYSE and will therefore not be reflected in the computation of the Fund's net asset value. If events that may affect the value of such securities occur during such period, then these securities may be valued at their fair value as determined in good faith under procedures established by and under the supervision of the Trustees.
IX. TAXATION OF THE FUND AND SHAREHOLDERS
The Fund generally will make two basic types of distributions: ordinary dividends and long-term capital gain distributions. These two types of distributions are reported differently on a shareholder's income tax return. The tax treatment of the investment activities of the Fund will affect the amount, timing and character of the distributions made by the Fund. The following discussion is only a summary of certain tax considerations generally affecting the Fund and shareholders of the Fund and is not intended as a substitute for careful tax planning. Tax issues relating to the Fund are not generally a consideration for shareholders such as tax-exempt entities and tax-advantaged retirement vehicles such as an IRA or 401(k) plan. Shareholders are urged to consult their own tax professionals regarding specific questions as to federal, state or local taxes.
Investment Company Taxation. The Fund intends to continue to qualify as a regulated investment company under Subchapter M of the Code. As such, the Fund will not be subject to federal income tax on its net investment income and capital gains, if any, to the extent that it timely distributes such income and capital gains to its shareholders. If the Fund fails to qualify for any taxable year as a regulated investment company, all of its taxable income will be subject to tax at regular corporate income tax rates without any deduction for distributions to shareholders, and such distributions generally will be taxable to shareholders as ordinary dividends to the extent of the Fund's current and accumulated earnings and profits.
The Fund generally intends to distribute sufficient income and gains so that the Fund will not pay corporate income tax on its earnings. The Fund also generally intends to distribute to its shareholders in each calendar year a sufficient amount of ordinary income and capital gains to avoid the imposition of a 4% excise tax. However, the Fund may instead determine to retain all or part of any income or net long-term capital gains in any year for reinvestment. In such event, the Fund will pay federal income tax (and possibly excise tax) on such retained income or gains.
Gains or losses on sales of securities by the Fund will generally be long-term capital gains or losses if the securities have a tax holding period of more than one year at the time of such sale. Gains or losses on the sale of securities with a tax holding period of one year or less will be short-term capital gains or
55
losses. Special tax rules may change the normal treatment of gains and losses recognized by the Fund when the Fund invests in forward foreign currency exchange contracts, options, futures transactions, and non-U.S. corporations classified as "passive foreign investment companies." Those special tax rules can, among other things, affect the treatment of capital gain or loss as long-term or short-term and may result in ordinary income or loss rather than capital gain or loss. The application of these special rules would therefore also affect the character of distributions made by the Fund.
The Fund may make investments in which it recognizes income or gain prior to receiving cash with respect to such investment. For example, under certain tax rules, the Fund may be required to accrue a portion of any discount at which certain securities are purchased as income each year even though the Fund receives no payments in cash on the security during the year. To the extent that the Fund makes such investments, it generally would be required to pay out such income or gain as a distribution in each year to avoid taxation at the Fund level. Such distributions will be made from the available cash of the Fund or by liquidation of portfolio securities if necessary. If a distribution of cash necessitates the liquidation of portfolio securities, the Adviser will select which securities to sell. The Fund may realize a gain or loss from such sales. In the event the Fund realizes net capital gains from such transactions, its shareholders may receive a larger capital gain distribution, if any, than they would in the absence of such transactions.
Taxation of Dividends and Distributions. Shareholders normally will be subject to federal income taxes, and any state and/or local income taxes, on the dividends and other distributions they receive from the Fund. Such dividends and distributions, to the extent that they are derived from net investment income or short-term capital gains, are generally taxable to the shareholder as ordinary income regardless of whether the shareholder receives such payments in additional shares or in cash. Under current law (through 2012), if certain holding period requirements are met with respect to your shares, a portion of income dividends received by a shareholder may be taxed at the same rate as long-term capital gains. However, even if income received in the form of income dividends is taxed at the same rate as long-term capital gains, such income will not be considered long-term capital gains for other federal income tax purposes. For example, you generally will not be permitted to offset income dividends with capital losses. Short-term capital gain distributions will continue to be taxed at ordinary income rates.
Distributions of net long-term capital gains, if any, are taxable to shareholders as long-term capital gains regardless of how long a shareholder has held the Fund's shares and regardless of whether the distribution is received in additional shares or in cash. Under current law, the maximum tax rate on long-term capital gains available to non-corporate shareholders generally is 15%. Without future congressional action, the maximum tax rate on long-term capital gains will return to 20% in 2013, and all dividends will be taxed at ordinary income rates.
Shareholders are generally taxed on any income dividend or capital gain distributions from the Fund in the year they are actually distributed. However, if any such dividends or distributions are declared in October, November or December and paid to shareholders of record of such month in January then such amounts will be treated for tax purposes as received by the shareholders on December 31.
Subject to certain exceptions, a corporate shareholder may be eligible for a 70% dividends received deduction to the extent that the Fund earns and distributes qualifying dividends from its investments. Distributions of net capital gains by the Fund will not be eligible for the dividends received deduction.
Shareholders who are not citizens or residents of the United States and certain foreign entities may be subject to withholding of U.S. tax on distributions made by the Fund of investment income and short-term capital gains. The Fund is not required to withhold any amounts with respect to distributions to foreign shareholders that are properly designated by the Fund as "interest-related dividends" or "short-term capital gain dividends," provided that the income would not be subject to federal income tax if earned directly by the foreign shareholder. However, the Fund may withhold on some of these amounts regardless of the fact that it is not required to do so. Any amounts withheld from payments made to a shareholder may be refunded or credited against the shareholder's U.S. federal income tax liability, if any, provided that the required information is furnished to the IRS. The provisions discussed above relating to distributions to foreign persons generally would apply to distributions with respect to taxable years of regulated investment companies beginning before January 1, 2012 (or a later date if extended by the U.S. Congress). Prospective investors are urged to consult their tax advisors regarding the specific tax consequences discussed above.
The Fund will be required to withhold U.S. federal withholding taxes (at 30%) from certain "withholdable payments" made to a Non-U.S. shareholder (other than a individual) after 2013, unless the
56
Non-U.S. shareholder complies with certain U.S. tax reporting (and, in some cases, withholding) requirements (generally relating to the entity's U.S. owners or account holders, if any) or otherwise qualifies for an exemption from such withholding. Withholdable payments generally will include interest (including original issue discount), dividends, rents, annuities, and other fixed or determinable annual or periodical gains, profits or income, if such payments are derived from U.S. sources, as well as gross proceeds from dispositions of securities that could produce U.S. source interest or dividends. Income which is effectively connected with the conduct of a U.S. trade or business is not, however, included in this definition.
After the end of each calendar year, shareholders will be sent information on their dividends and capital gain distributions for tax purposes, including the portion taxable as ordinary income, the portion taxable as long-term capital gains, and the amount of any dividends eligible for the federal dividends received deduction for corporations.
Purchases and Redemptions and Exchanges of Fund Shares. Any dividend or capital gains distribution received by a shareholder from any investment company will have the effect of reducing the net asset value of the shareholder's stock in that company by the exact amount of the dividend or capital gains distribution. Furthermore, such dividends and capital gains distributions are subject to federal income taxes. If the net asset value of the shares should be reduced below a shareholder's cost as a result of the payment of dividends or the distribution of realized long-term capital gains, such payment or distribution would be in part a return of the shareholder's investment but nonetheless would be taxable to the shareholder. Therefore, an investor should consider the tax implications of purchasing Fund shares immediately prior to a distribution record date.
Shareholders normally will be subject to federal income taxes, and state and/or local income taxes, on the sale or disposition of Fund shares. In general, a sale of shares results in capital gain or loss, and for individual shareholders, is taxable at a federal rate dependent upon the length of time the shares were held. A redemption of a shareholder's Fund shares is normally treated as a sale for tax purposes. Fund shares held for a period of one year or less at the time of such sale or redemption will, for tax purposes, generally result in short-term capital gains or losses and those held for more than one year will generally result in long-term capital gains or losses. Under current law, the maximum tax rate on long-term capital gains available to non-corporate shareholders generally is 15%. Without future congressional action, the maximum tax rate on long-term capital gains will return to 20% in 2013. Any loss realized by shareholders upon a sale or redemption of shares within six months of the date of their purchase will be treated as a long-term capital loss to the extent of any distributions of net long-term capital gains with respect to such shares during the six-month period.
Gain or loss on the sale or redemption of shares in the Fund is measured by the difference between the amount of cash received (or the fair market value of any property received) and the adjusted tax basis of the shares. Shareholders should keep records of investments made (including shares acquired through reinvestment of dividends and distributions) so they can compute the tax basis of their shares. Under certain circumstances a shareholder may compute and use an average cost basis in determining the gain or loss on the sale or redemption of shares.
Due to recent legislation, the Fund (or its administrative agent) is required to report to the Internal Revenue Service and furnish to Fund shareholders the cost basis information for sale transactions of shares purchased on or after January 1, 2012. Shareholders may elect to have one of several cost basis methods applied to their account when calculating the cost basis of shares sold, including average cost, FIFO, or some other specific identification method. Unless you instruct otherwise, the Fund will use average cost as its default cost basis method, and will treat sales as first coming from shares purchased prior to January 1, 2012. If average cost is used for the first sale of Fund shares covered by these new rules, the shareholder may only use an alternative cost basis method for shares purchased prospectively. Fund shareholders should consult with their tax advisors to determine the best cost basis method for their tax situation.
Exchanges of Fund shares for shares of another fund, including shares of other Morgan Stanley Funds, are also subject to similar tax treatment. Such an exchange is treated for tax purposes as a sale of the original shares in the Fund, followed by the purchase of shares in the other fund.
The ability to deduct capital losses may be limited. In addition, if a shareholder realizes a loss on the redemption or exchange of a fund's shares and receives securities that are considered substantially identical to that fund's shares or reinvests in that fund's shares or substantially identical shares within 30 days
57
before or after the redemption or exchange, the transactions may be subject to the "wash sale" rules, resulting in a postponement of the recognition of such loss for tax purposes.
X. UNDERWRITERS
The Fund's shares are offered to the public on a continuous basis. The Distributor, as the principal underwriter of the shares, has certain obligations under the Distribution Agreement concerning the distribution of the shares. These obligations and the compensation the Distributor receives are described above in the sections titled "Principal Underwriter" and "Rule 12b-1 Plan."
XI. PERFORMANCE DATA
Average annual returns assuming deduction of maximum sales charge
Period Ended July 31, 2011
| Class | Inception Date: | 1 Year | 5 Years | 10 Years | Life of Fund | ||||||||||||||||||
| Class A | 07/28/97 | 7.19 | % | 3.02 | % | 4.16 | % | 5.20 | % | ||||||||||||||
| Class B | 10/31/88 | 7.47 | % | 3.05 | % | 4.09 | %* | 8.50 | %* | ||||||||||||||
| Class C | 07/28/97 | 11.27 | % | 3.36 | % | 3.94 | % | 4.81 | % | ||||||||||||||
| Class I | 07/28/97 | 13.38 | % | 4.39 | % | 4.97 | % | 5.86 | % | ||||||||||||||
Average annual returns assuming NO deduction of sales charge
Period Ended July 31, 2011
| Class | Inception Date: | 1 Year | 5 Years | 10 Years | Life of Fund | ||||||||||||||||||
| Class A | 07/28/97 | 13.13 | % | 4.13 | % | 4.72 | % | 5.61 | % | ||||||||||||||
| Class B | 10/31/88 | 12.28 | % | 3.35 | % | 4.09 | %* | 8.50 | %* | ||||||||||||||
| Class C | 07/28/97 | 12.23 | % | 3.36 | % | 3.94 | % | 4.81 | % | ||||||||||||||
| Class I | 07/28/97 | 13.38 | % | 4.39 | % | 4.97 | % | 5.86 | % | ||||||||||||||
Aggregate total returns assuming NO deduction of sales charge
Period Ended July 31, 2011
| Class | Inception Date: | 1 Year | 5 Years | 10 Years | Life of Fund | ||||||||||||||||||
| Class A | 07/28/97 | 13.13 | % | 22.42 | % | 58.66 | % | 114.77 | % | ||||||||||||||
| Class B | 10/31/88 | 12.28 | % | 17.93 | % | 49.28 | %* | 539.21 | %* | ||||||||||||||
| Class C | 07/28/97 | 12.23 | % | 17.95 | % | 47.16 | % | 93.14 | % | ||||||||||||||
| Class I | 07/28/97 | 13.38 | % | 23.98 | % | 62.47 | % | 121.97 | % | ||||||||||||||
Average annual after-tax returns assuming deduction of maximum sales charge
Class B
Period Ended July 31, 2011
| Calculation Methodology | Inception Date: | 1 Year | 5 Years | 10 Years | Life of Fund | ||||||||||||||||||
| After taxes on distributions | 10/31/88 | 4.88 | % | 1.95 | % | 3.42 | %* | 7.03 | %* | ||||||||||||||
| After taxes on distributions and redemptions | 10/31/88 | 7.66 | % | 2.45 | % | 3.40 | %* | 6.91 | %* | ||||||||||||||
* Effective April 2005, Class B shares will generally convert to Class A shares approximately eight years after the end of the calendar month in which the shares were purchased. Performance for periods greater than eight years reflects this conversion (beginning April 2005).
Class R and Class W were not operational during the fiscal year ended July 31, 2011. As of the date of this SAI, Class R and Class W shares have not commenced operations.
XII. FINANCIAL STATEMENTS
The Fund's audited financial statements for the fiscal year ended July 31, 2011, including notes thereto, and the report of Ernst & Young LLP, are herein incorporated by reference from the Fund's Annual Report to Shareholders. A copy of the Fund's Annual Report to Shareholders must accompany the delivery of this SAI.
58
On June 7, 2011, Deloitte & Touche LLP was dismissed as the independent registered public accounting firm of the Fund. The Fund, with the approval of its Board of Trustees and its Audit Committee, engaged Ernst & Young LLP as its new independent registered public accounting firm as of June 7, 2011.
XIII. FUND COUNSEL
Dechert LLP, located at 1095 Avenue of the Americas, New York, NY 10036, acts as the Fund's legal counsel.
*****
This SAI and the Prospectus do not contain all of the information set forth in the Registration Statement the Fund has filed with the SEC. The complete Registration Statement may be obtained from the SEC.
59
MORGAN STANLEY INVESTMENT MANAGEMENT
PROXY VOTING POLICY AND PROCEDURES
I. POLICY STATEMENT
Morgan Stanley Investment Management's ("MSIM") policy and procedures for voting proxies ("Policy") with respect to securities held in the accounts of clients applies to those MSIM entities that provide discretionary investment management services and for which an MSIM entity has authority to vote proxies. This Policy is reviewed and updated as necessary to address new and evolving proxy voting issues and standards.
The MSIM entities covered by this Policy currently include the following: Morgan Stanley Investment Advisors Inc., Morgan Stanley AIP GP LP, Morgan Stanley Investment Management Inc., Morgan Stanley Investment Management Limited, Morgan Stanley Investment Management Company, Morgan Stanley Asset & Investment Trust Management Co., Limited, Morgan Stanley Investment Management Private Limited and Private Investment Partners Inc. (each an "MSIM Affiliate" and collectively referred to as the "MSIM Affiliates" or as "we" below).
Each MSIM Affiliate will use its best efforts to vote proxies as part of its authority to manage, acquire and dispose of account assets. With respect to the MSIM registered management investment companies ("MSIM Funds"), each MSIM Affiliate will vote proxies under this Policy pursuant to authority granted under its applicable investment advisory agreement or, in the absence of such authority, as authorized by the Board of Directors/Trustees of the MSIM Funds. A MSIM Affiliate will not vote proxies unless the investment management or investment advisory agreement explicitly authorizes the MSIM Affiliate to vote proxies.
MSIM Affiliates will vote proxies in a prudent and diligent manner and in the best interests of clients, including beneficiaries of and participants in a client's benefit plan(s) for which the MSIM Affiliates manage assets, consistent with the objective of maximizing long-term investment returns ("Client Proxy Standard"). In certain situations, a client or its fiduciary may provide an MSIM Affiliate with a proxy voting policy. In these situations, the MSIM Affiliate will comply with the client's policy.
Proxy Research Services — ISS and Glass Lewis (together with other proxy research providers as we may retain from time to time, the "Research Providers") are independent advisers that specialize in providing a variety of fiduciary-level proxy-related services to institutional investment managers, plan sponsors, custodians, consultants, and other institutional investors. The services provided include in-depth research, global issuer analysis, and voting recommendations. While we may review and utilize the recommendations of one or more Research Providers in making proxy voting decisions, we are in no way obligated to follow such recommendations. In addition to research, ISS provides vote execution, reporting, and recordkeeping services.
Voting Proxies for Certain Non-U.S. Companies — Voting proxies of companies located in some jurisdictions may involve several problems that can restrict or prevent the ability to vote such proxies or entail significant costs. These problems include, but are not limited to: (i) proxy statements and ballots being written in a language other than English; (ii) untimely and/or inadequate notice of shareholder meetings; (iii) restrictions on the ability of holders outside the issuer's jurisdiction of organization to exercise votes; (iv) requirements to vote proxies in person; (v) the imposition of restrictions on the sale of the securities for a period of time in proximity to the shareholder meeting; and (vi) requirements to provide local agents with power of attorney to facilitate our voting instructions. As a result, we vote clients' non-U.S. proxies on a best efforts basis only, after weighing the costs and benefits of voting such proxies, consistent with the Client Proxy Standard. ISS has been retained to provide assistance in connection with voting non-U.S. proxies.
II. GENERAL PROXY VOTING GUIDELINES
To promote consistency in voting proxies on behalf of its clients, we follow this Policy (subject to any exception set forth herein). The Policy addresses a broad range of issues, and provides general voting parameters on proposals that arise most frequently. However, details of specific proposals vary, and those
A-1
details affect particular voting decisions, as do factors specific to a given company. Pursuant to the procedures set forth herein, we may vote in a manner that is not in accordance with the following general guidelines, provided the vote is approved by the Proxy Review Committee (see Section III for description) and is consistent with the Client Proxy Standard. Morgan Stanley AIP GP LP will follow the procedures as described in Appendix A.
We endeavor to integrate governance and proxy voting policy with investment goals, using the vote to encourage portfolio companies to enhance long-term shareholder value and to provide a high standard of transparency such that equity markets can value corporate assets appropriately.
We seek to follow the Client Proxy Standard for each client. At times, this may result in split votes, for example when different clients have varying economic interests in the outcome of a particular voting matter (such as a case in which varied ownership interests in two companies involved in a merger result in different stakes in the outcome). We also may split votes at times based on differing views of portfolio managers.
We may abstain on matters for which disclosure is inadequate.
A. Routine Matters.
We generally support routine management proposals. The following are examples of routine management proposals:
• Approval of financial statements and auditor reports if delivered with an unqualified auditor's opinion.
• General updating/corrective amendments to the charter, articles of association or bylaws, unless we believe that such amendments would diminish shareholder rights.
• Most proposals related to the conduct of the annual meeting, with the following exceptions. We generally oppose proposals that relate to "the transaction of such other business which may come before the meeting," and open-ended requests for adjournment. However, where management specifically states the reason for requesting an adjournment and the requested adjournment would facilitate passage of a proposal that would otherwise be supported under this Policy (i.e. an uncontested corporate transaction), the adjournment request will be supported.
We generally support shareholder proposals advocating confidential voting procedures and independent tabulation of voting results.
B. Board of Directors.
1. Election of directors: Votes on board nominees can involve balancing a variety of considerations. In vote decisions, we may take into consideration whether the company has a majority voting policy in place that we believe makes the director vote more meaningful. In the absence of a proxy contest, we generally support the board's nominees for director except as follows:
a. We consider withholding support from or voting against a nominee if we believe a direct conflict exists between the interests of the nominee and the public shareholders, including failure to meet fiduciary standards of care and/or loyalty. We may oppose directors where we conclude that actions of directors are unlawful, unethical or negligent. We consider opposing individual board members or an entire slate if we believe the board is entrenched and/or dealing inadequately with performance problems; if we believe the board is acting with insufficient independence between the board and management; or if we believe the board has not been sufficiently forthcoming with information on key governance or other material matters.
b. We consider withholding support from or voting against interested directors if the company's board does not meet market standards for director independence, or if otherwise we believe board independence is insufficient. We refer to prevalent market standards as promulgated by a stock exchange or other authority within a given market (e.g., New York Stock Exchange or Nasdaq rules for most U.S. companies, and The Combined Code on Corporate Governance in the United Kingdom). Thus, for an NYSE company with no controlling shareholder, we would expect that at a minimum a majority of directors should be independent as defined by
A-2
NYSE. Where we view market standards as inadequate, we may withhold votes based on stronger independence standards. Market standards notwithstanding, we generally do not view long board tenure alone as a basis to classify a director as non-independent.
i. At a company with a shareholder or group that controls the company by virtue of a majority economic interest in the company, we have a reduced expectation for board independence, although we believe the presence of independent directors can be helpful, particularly in staffing the audit committee, and at times we may withhold support from or vote against a nominee on the view the board or its committees are not sufficiently independent. In markets where board independence is not the norm (e.g. Japan), however, we consider factors including whether a board of a controlled company includes independent members who can be expected to look out for interests of minority holders.
ii. We consider withholding support from or voting against a nominee if he or she is affiliated with a major shareholder that has representation on a board disproportionate to its economic interest.
c. Depending on market standards, we consider withholding support from or voting against a nominee who is interested and who is standing for election as a member of the company's compensation/remuneration, nominating/governance or audit committee.
d. We consider withholding support from or voting against nominees if the term for which they are nominated is excessive. We consider this issue on a market-specific basis.
e. We consider withholding support from or voting against nominees if in our view there has been insufficient board renewal (turnover), particularly in the context of extended poor company performance.
f. We consider withholding support from or voting against a nominee standing for election if the board has not taken action to implement generally accepted governance practices for which there is a "bright line" test. For example, in the context of the U.S. market, failure to eliminate a dead hand or slow hand poison pill would be seen as a basis for opposing one or more incumbent nominees.
g. In markets that encourage designated audit committee financial experts, we consider voting against members of an audit committee if no members are designated as such. We also may not support the audit committee members if the company has faced financial reporting issues and/or does not put the auditor up for ratification by shareholders.
h. We believe investors should have the ability to vote on individual nominees, and may abstain or vote against a slate of nominees where we are not given the opportunity to vote on individual nominees.
i. We consider withholding support from or voting against a nominee who has failed to attend at least 75% of the nominee's board and board committee meetings within a given year without a reasonable excuse. We also consider opposing nominees if the company does not meet market standards for disclosure on attendance.
j. We consider withholding support from or voting against a nominee who appears overcommitted, particularly through service on an excessive number of boards. Market expectations are incorporated into this analysis; for U.S. boards, we generally oppose election of a nominee who serves on more than six public company boards (excluding investment companies), although we also may reference National Association of Corporate Directors guidance suggesting that public company CEOs, for example, should serve on no more than two outside boards given level of time commitment required in their primary job.
k. We consider withholding support from or voting against a nominee where we believe executive remuneration practices are poor, particularly if the company does not offer shareholders a separate "say-on-pay" advisory vote on pay.
A-3
2. Discharge of directors' duties: In markets where an annual discharge of directors' responsibility is a routine agenda item, we generally support such discharge. However, we may vote against discharge or abstain from voting where there are serious findings of fraud or other unethical behavior for which the individual bears responsibility. The annual discharge of responsibility represents shareholder approval of disclosed actions taken by the board during the year and may make future shareholder action against the board difficult to pursue.
3. Board independence: We generally support U.S. shareholder proposals requiring that a certain percentage (up to 66 2/3%) of the company's board members be independent directors, and promoting all-independent audit, compensation and nominating/governance committees.
4. Board diversity: We consider on a case-by-case basis shareholder proposals urging diversity of board membership with respect to gender, race or other factors.
5. Majority voting: We generally support proposals requesting or requiring majority voting policies in election of directors, so long as there is a carve-out for plurality voting in the case of contested elections.
6. Proxy access: We consider on a case-by-case basis shareholder proposals on particular procedures for inclusion of shareholder nominees in company proxy statements.
7. Reimbursement for dissident nominees: We generally support well-crafted U.S. shareholder proposals that would provide for reimbursement of dissident nominees elected to a board, as the cost to shareholders in electing such nominees can be factored into the voting decision on those nominees.
8. Proposals to elect directors more frequently: In the U.S. public company context, we usually support shareholder and management proposals to elect all directors annually (to "declassify" the board), although we make an exception to this policy where we believe that long-term shareholder value may be harmed by this change given particular circumstances at the company at the time of the vote on such proposal. As indicated above, outside the United States we generally support greater accountability to shareholders that comes through more frequent director elections, but recognize that many markets embrace longer term lengths, sometimes for valid reasons given other aspects of the legal context in electing boards.
9. Cumulative voting: We generally support proposals to eliminate cumulative voting in the U.S. market context. (Cumulative voting provides that shareholders may concentrate their votes for one or a handful of candidates, a system that can enable a minority bloc to place representation on a board.) U.S. proposals to establish cumulative voting in the election of directors generally will not be supported.
10. Separation of Chairman and CEO positions: We vote on shareholder proposals to separate the Chairman and CEO positions and/or to appoint an independent Chairman based in part on prevailing practice in particular markets, since the context for such a practice varies. In many non-U.S. markets, we view separation of the roles as a market standard practice, and support division of the roles in that context. In the United States, we consider such proposals on a case-by-case basis, considering, among other things, the existing board leadership structure, company performance, and any evidence of entrenchment or perceived risk that power is overly concentrated in a single individual.
11. Director retirement age and term limits: Proposals setting or recommending director retirement ages or director term limits are voted on a case-by-case basis that includes consideration of company performance, the rate of board renewal, evidence of effective individual director evaluation processes, and any indications of entrenchment.
12. Proposals to limit directors' liability and/or broaden indemnification of officers and directors: Generally, we will support such proposals provided that an individual is eligible only if he or she has not acted in bad faith, with gross negligence or with reckless disregard of their duties.
A-4
C. Statutory auditor boards.
The statutory auditor board, which is separate from the main board of directors, plays a role in corporate governance in several markets. These boards are elected by shareholders to provide assurance on compliance with legal and accounting standards and the company's articles of association. We generally vote for statutory auditor nominees if they meet independence standards. In markets that require disclosure on attendance by internal statutory auditors, however, we consider voting against nominees for these positions who failed to attend at least 75% of meetings in the previous year. We also consider opposing nominees if the company does not meet market standards for disclosure on attendance.
D. Corporate transactions and proxy fights.
We examine proposals relating to mergers, acquisitions and other special corporate transactions (i.e., takeovers, spin-offs, sales of assets, reorganizations, restructurings and recapitalizations) on a case-by-case basis in the interests of each fund or other account. Proposals for mergers or other significant transactions that are friendly and approved by the Research Providers usually are supported if there is no portfolio manager objection. We also analyze proxy contests on a case-by-case basis.
E. Changes in capital structure.
1. We generally support the following:
• Management and shareholder proposals aimed at eliminating unequal voting rights, assuming fair economic treatment of classes of shares we hold.
• U.S. management proposals to increase the authorization of existing classes of common stock (or securities convertible into common stock) if: (i) a clear business purpose is stated that we can support and the number of shares requested is reasonable in relation to the purpose for which authorization is requested; and/or (ii) the authorization does not exceed 100% of shares currently authorized and at least 30% of the total new authorization will be outstanding. (We consider proposals that do not meet these criteria on a case-by-case basis.)
• U.S. management proposals to create a new class of preferred stock or for issuances of preferred stock up to 50% of issued capital, unless we have concerns about use of the authority for anti-takeover purposes.
• Proposals in non-U.S. markets that in our view appropriately limit potential dilution of existing shareholders. A major consideration is whether existing shareholders would have preemptive rights for any issuance under a proposal for standing share issuance authority. We generally consider market-specific guidance in making these decisions; for example, in the U.K. market we usually follow Association of British Insurers' ("ABI") guidance, although company-specific factors may be considered and for example, may sometimes lead us to voting against share authorization proposals even if they meet ABI guidance.
• Management proposals to authorize share repurchase plans, except in some cases in which we believe there are insufficient protections against use of an authorization for anti-takeover purposes.
• Management proposals to reduce the number of authorized shares of common or preferred stock, or to eliminate classes of preferred stock.
• Management proposals to effect stock splits.
• Management proposals to effect reverse stock splits if management proportionately reduces the authorized share amount set forth in the corporate charter. Reverse stock splits that do not adjust proportionately to the authorized share amount generally will be approved if the resulting increase in authorized shares coincides with the proxy guidelines set forth above for common stock increases.
• Management dividend payout proposals, except where we perceive company payouts to shareholders as inadequate.
A-5
2. We generally oppose the following (notwithstanding management support):
• Proposals to add classes of stock that would substantially dilute the voting interests of existing shareholders.
• Proposals to increase the authorized or issued number of shares of existing classes of stock that are unreasonably dilutive, particularly if there are no preemptive rights for existing shareholders. However, depending on market practices, we consider voting for proposals giving general authorization for issuance of shares not subject to pre-emptive rights if the authority is limited.
• Proposals that authorize share issuance at a discount to market rates, except where authority for such issuance is de minimis, or if there is a special situation that we believe justifies such authorization (as may be the case, for example, at a company under severe stress and risk of bankruptcy).
• Proposals relating to changes in capitalization by 100% or more.
We consider on a case-by-case basis shareholder proposals to increase dividend payout ratios, in light of market practice and perceived market weaknesses, as well as individual company payout history and current circumstances. For example, currently we perceive low payouts to shareholders as a concern at some Japanese companies, but may deem a low payout ratio as appropriate for a growth company making good use of its cash, notwithstanding the broader market concern.
F. Takeover Defenses and Shareholder Rights.
1. Shareholder rights plans: We generally support proposals to require shareholder approval or ratification of shareholder rights plans (poison pills). In voting on rights plans or similar takeover defenses, we consider on a case-by-case basis whether the company has demonstrated a need for the defense in the context of promoting long-term share value; whether provisions of the defense are in line with generally accepted governance principles in the market (and specifically the presence of an adequate qualified offer provision that would exempt offers meeting certain conditions from the pill); and the specific context if the proposal is made in the midst of a takeover bid or contest for control.
2. Supermajority voting requirements: We generally oppose requirements for supermajority votes to amend the charter or bylaws, unless the provisions protect minority shareholders where there is a large shareholder. In line with this view, in the absence of a large shareholder we support reasonable shareholder proposals to limit such supermajority voting requirements.
3. Shareholder rights to call meetings: We consider proposals to enhance shareholder rights to call meetings on a case-by-case basis. At large-cap U.S. companies, we generally support efforts to establish the right of holders of 10% or more of shares to call special meetings, unless the board or state law has set a policy or law establishing such rights at a threshold that we believe to be acceptable.
4. Written consent rights: In the U.S. context, we examine proposals for shareholder written consent rights on a case-by-case basis.
5. Reincorporation: We consider management and shareholder proposals to reincorporate to a different jurisdiction on a case-by-case basis. We oppose such proposals if we believe the main purpose is to take advantage of laws or judicial precedents that reduce shareholder rights.
6. Anti-greenmail provisions: Proposals relating to the adoption of anti-greenmail provisions will be supported, provided that the proposal: (i) defines greenmail; (ii) prohibits buyback offers to large block holders (holders of at least 1% of the outstanding shares and in certain cases, a greater amount) not made to all shareholders or not approved by disinterested shareholders; and (iii) contains no anti-takeover measures or other provisions restricting the rights of shareholders.
7. Bundled proposals: We may consider opposing or abstaining on proposals if disparate issues are "bundled" and presented for a single vote.
A-6
G. Auditors.
We generally support management proposals for selection or ratification of independent auditors. However, we may consider opposing such proposals with reference to incumbent audit firms if the company has suffered from serious accounting irregularities and we believe rotation of the audit firm is appropriate, or if fees paid to the auditor for non-audit-related services are excessive. Generally, to determine if non-audit fees are excessive, a 50% test will be applied (i.e., non-audit-related fees should be less than 50% of the total fees paid to the auditor). We generally vote against proposals to indemnify auditors.
H. Executive and Director Remuneration.
1. We generally support the following:
• Proposals for employee equity compensation plans and other employee ownership plans, provided that our research does not indicate that approval of the plan would be against shareholder interest. Such approval may be against shareholder interest if it authorizes excessive dilution and shareholder cost, particularly in the context of high usage ("run rate") of equity compensation in the recent past; or if there are objectionable plan design and provisions.
• Proposals relating to fees to outside directors, provided the amounts are not excessive relative to other companies in the country or industry, and provided that the structure is appropriate within the market context. While stock-based compensation to outside directors is positive if moderate and appropriately structured, we are wary of significant stock option awards or other performance-based awards for outside directors, as well as provisions that could result in significant forfeiture of value on a director's decision to resign from a board (such forfeiture can undercut director independence).
• Proposals for employee stock purchase plans that permit discounts, but only for grants that are part of a broad-based employee plan, including all non-executive employees, and only if the discounts are limited to a reasonable market standard or less.
• Proposals for the establishment of employee retirement and severance plans, provided that our research does not indicate that approval of the plan would be against shareholder interest.
2. We generally oppose retirement plans and bonuses for non-executive directors and independent statutory auditors.
3. In the U.S. context, shareholder proposals requiring shareholder approval of all severance agreements will not be supported, but proposals that require shareholder approval for agreements in excess of three times the annual compensation (salary and bonus) generally will be supported. We generally oppose shareholder proposals that would establish arbitrary caps on pay. We consider on a case-by-case basis shareholder proposals that seek to limit Supplemental Executive Retirement Plans (SERPs), but support such proposals where we consider SERPs to be excessive.
4. Shareholder proposals advocating stronger and/or particular pay-for-performance models will be evaluated on a case-by-case basis, with consideration of the merits of the individual proposal within the context of the particular company and its labor markets, and the company's current and past practices. While we generally support emphasis on long-term components of senior executive pay and strong linkage of pay to performance, we consider factors including whether a proposal may be overly prescriptive, and the impact of the proposal, if implemented as written, on recruitment and retention.
5. We generally support proposals advocating reasonable senior executive and director stock ownership guidelines and holding requirements for shares gained in executive equity compensation programs.
6. We generally support shareholder proposals for reasonable "claw-back" provisions that provide for company recovery of senior executive bonuses to the extent they were based on achieving financial benchmarks that were not actually met in light of subsequent restatements.
A-7
7. Management proposals effectively to re-price stock options are considered on a case-by-case basis. Considerations include the company's reasons and justifications for a re-pricing, the company's competitive position, whether senior executives and outside directors are excluded, potential cost to shareholders, whether the re-pricing or share exchange is on a value-for-value basis, and whether vesting requirements are extended.
8. Say-on-Pay: We consider proposals relating to an advisory vote on remuneration on a case-by-case basis. Considerations include a review of the relationship between executive remuneration and performance based on operating trends and total shareholder return over multiple performance periods. In addition, we review remuneration structures and potential poor pay practices, including relative magnitude of pay, discretionary bonus awards, tax gross ups, change-in-control features, internal pay equity and peer group construction. As long-term investors, we support remuneration policies that align with long-term shareholder returns.
I. Social, Political and Environmental Issues.
Shareholders in the United States and certain other markets submit proposals encouraging changes in company disclosure and practices related to particular corporate social, political and environmental matters. We consider how to vote on the proposals on a case-by-case basis to determine likely impacts on shareholder value. We seek to balance concerns on reputational and other risks that lie behind a proposal against costs of implementation, while considering appropriate shareholder and management prerogatives. We may abstain from voting on proposals that do not have a readily determinable financial impact on shareholder value. We support proposals that if implemented would enhance useful disclosure, but we generally vote against proposals requesting reports that we believe are duplicative, related to matters not material to the business, or that would impose unnecessary or excessive costs. We believe that certain social and environmental shareholder proposals may intrude excessively on management prerogatives, which can lead us to oppose them.
J. Fund of Funds.
Certain Funds advised by an MSIM Affiliate invest only in other MSIM Funds. If an underlying fund has a shareholder meeting, in order to avoid any potential conflict of interest, such proposals will be voted in the same proportion as the votes of the other shareholders of the underlying fund, unless otherwise determined by the Proxy Review Committee.
III. ADMINISTRATION OF POLICY
The MSIM Proxy Review Committee (the "Committee") has overall responsibility for the Policy. The Committee, which is appointed by MSIM's Long-Only Executive Committee, consists of investment professionals who represent the different investment disciplines and geographic locations of the firm, and is chaired by the director of the Corporate Governance Team ("CGT"). Because proxy voting is an investment responsibility and impacts shareholder value, and because of their knowledge of companies and markets, portfolio managers and other members of investment staff play a key role in proxy voting, although the Committee has final authority over proxy votes.
The CGT Director is responsible for identifying issues that require Committee deliberation or ratification. The CGT, working with advice of investment teams and the Committee, is responsible for voting on routine items and on matters that can be addressed in line with these Policy guidelines. The CGT has responsibility for voting case-by-case where guidelines and precedent provide adequate guidance.
The Committee will periodically review and have the authority to amend, as necessary, the Policy and establish and direct voting positions consistent with the Client Proxy Standard.
CGT and members of the Committee may take into account Research Providers' recommendations and research as well as any other relevant information they may request or receive, including portfolio manager and/or analyst comments and research, as applicable. Generally, proxies related to securities held in accounts that are managed pursuant to quantitative, index or index-like strategies ("Index Strategies") will be voted in the same manner as those held in actively managed accounts, unless economic interests of the accounts differ. Because accounts managed using Index Strategies are passively
A-8
managed accounts, research from portfolio managers and/or analysts related to securities held in these accounts may not be available. If the affected securities are held only in accounts that are managed pursuant to Index Strategies, and the proxy relates to a matter that is not described in this Policy, the CGT will consider all available information from the Research Providers, and to the extent that the holdings are significant, from the portfolio managers and/or analysts.
A. Committee Procedures
The Committee meets at least quarterly, and reviews and considers changes to the Policy at least annually. Through meetings and/or written communications, the Committee is responsible for monitoring and ratifying "split votes" (i.e., allowing certain shares of the same issuer that are the subject of the same proxy solicitation and held by one or more MSIM portfolios to be voted differently than other shares) and/or "override voting" (i.e., voting all MSIM portfolio shares in a manner contrary to the Policy). The Committee will review developing issues and approve upcoming votes, as appropriate, for matters as requested by CGT.
The Committee reserves the right to review voting decisions at any time and to make voting decisions as necessary to ensure the independence and integrity of the votes.
B. Material Conflicts of Interest
In addition to the procedures discussed above, if the CGT Director determines that an issue raises a material conflict of interest, the CGT Director may request a special committee to review, and recommend a course of action with respect to, the conflict(s) in question ("Special Committee").
A potential material conflict of interest could exist in the following situations, among others:
1. The issuer soliciting the vote is a client of MSIM or an affiliate of MSIM and the vote is on a matter that materially affects the issuer.
2. The proxy relates to Morgan Stanley common stock or any other security issued by Morgan Stanley or its affiliates except if echo voting is used, as with MSIM Funds, as described herein.
3. Morgan Stanley has a material pecuniary interest in the matter submitted for a vote (e.g., acting as a financial advisor to a party to a merger or acquisition for which Morgan Stanley will be paid a success fee if completed).
If the CGT Director determines that an issue raises a potential material conflict of interest, depending on the facts and circumstances, the issue will be addressed as follows:
1. If the matter relates to a topic that is discussed in this Policy, the proposal will be voted as per the Policy.
2. If the matter is not discussed in this Policy or the Policy indicates that the issue is to be decided case-by-case, the proposal will be voted in a manner consistent with the Research Providers, provided that all the Research Providers consulted have the same recommendation, no portfolio manager objects to that vote, and the vote is consistent with MSIM's Client Proxy Standard.
3. If the Research Providers' recommendations differ, the CGT Director will refer the matter to a Special Committee to vote on the proposal, as appropriate.
Any Special Committee shall be comprised of the CGT Director, and at least two portfolio managers (preferably members of the Committee), as approved by the Committee. The CGT Director may request non-voting participation by MSIM's General Counsel or his/her designee and the Chief Compliance Officer or his/her designee . In addition to the research provided by Research Providers, the Special Committee may request analysis from MSIM Affiliate investment professionals and outside sources to the extent it deems appropriate.
C. Proxy Voting Reporting
The CGT will document in writing all Committee and Special Committee decisions and actions, which documentation will be maintained by the CGT for a period of at least six years. To the extent these decisions relate to a security held by an MSIM Fund, the CGT will report the decisions to each applicable
A-9
Board of Trustees/Directors of those Funds at each Board's next regularly scheduled Board meeting. The report will contain information concerning decisions made during the most recently ended calendar quarter immediately preceding the Board meeting.
MSIM will promptly provide a copy of this Policy to any client requesting it. MSIM will also, upon client request, promptly provide a report indicating how each proxy was voted with respect to securities held in that client's account.
MSIM's Legal Department is responsible for filing an annual Form N-PX on behalf of each MSIM Fund for which such filing is required, indicating how all proxies were voted with respect to such Fund's holdings.
APPENDIX A
The following procedures apply to accounts managed by Morgan Stanley AIP GP LP and Private Investment Partners Inc. ("AIP").
Generally, AIP will follow the guidelines set forth in Section II of MSIM's Proxy Voting Policy and Procedures. To the extent that such guidelines do not provide specific direction, or AIP determines that consistent with the Client Proxy Standard, the guidelines should not be followed, the Proxy Review Committee has delegated the voting authority to vote securities held by accounts managed by AIP to the Fund of Hedge Funds investment team, the Private Equity Fund of Funds investment team or the Private Equity Real Estate Fund of Funds investment team of AIP. A summary of decisions made by the investment teams will be made available to the Proxy Review Committee for its information at the next scheduled meeting of the Proxy Review Committee.
In certain cases, AIP may determine to abstain from determining (or recommending) how a proxy should be voted (and therefore abstain from voting such proxy or recommending how such proxy should be voted), such as where the expected cost of giving due consideration to the proxy does not justify the potential benefits to the affected account(s) that might result from adopting or rejecting (as the case may be) the measure in question.
Waiver of Voting Rights
For regulatory reasons, AIP may either 1) invest in a class of securities of an underlying fund (the "Fund") that does not provide for voting rights; or 2) waive 100% of its voting rights with respect to the following:
1. Any rights with respect to the removal or replacement of a director, general partner, managing member or other person acting in a similar capacity for or on behalf of the Fund (each individually a "Designated Person," and collectively, the "Designated Persons"), which may include, but are not limited to, voting on the election or removal of a Designated Person in the event of such Designated Person's death, disability, insolvency, bankruptcy, incapacity, or other event requiring a vote of interest holders of the Fund to remove or replace a Designated Person; and
2. Any rights in connection with a determination to renew, dissolve, liquidate, or otherwise terminate or continue the Fund, which may include, but are not limited to, voting on the renewal, dissolution, liquidation, termination or continuance of the Fund upon the occurrence of an event described in the Fund's organizational documents; provided, however, that, if the Fund's organizational documents require the consent of the Fund's general partner or manager, as the case may be, for any such termination or continuation of the Fund to be effective, then AIP may exercise its voting rights with respect to such matter.
Revised October 1, 2011
A-10
APPENDIX B
RATINGS OF CORPORATE DEBT INSTRUMENTS INVESTMENTS
Moody's Investors Service Inc. ("Moody's")
Long-Term Obligations Rating
Moody's long-term obligation ratings are opinions of the relative credit risk of fixed-income obligations with an original maturity of one year or more. They address the possibility that a financial obligation will not be honored as promised. Such ratings reflect both the likelihood of default and any financial loss suffered in the event of default.
Aaa Obligations rated Aaa are judged to be of the highest quality, with minimal credit risk.
Aa Obligations rated Aa are judged to be of high quality and are subject to very low credit risk.
A Obligations rated A are considered upper-medium grade and are subject to low credit risk.
Baa Obligations rated Baa are subject to moderate credit risk. They are considered medium-grade and as such may possess certain speculative characteristics.
Ba Obligations rated Ba are judged to have speculative elements and are subject to substantial credit risk.
B Obligations rated B are considered speculative and are subject to high credit risk.
Caa Obligations rated Caa are judged to be of poor standing and are subject to very high credit risk.
Ca Obligations rated Ca are highly speculative and are likely in, or very near, default, with some prospect of recovery of principal and interest.
C Obligations rated C are the lowest rated class of bonds and are typically in default, with little prospect for recovery of principal or interest.
Note: Moody's appends numerical modifiers 1, 2, and 3 to each generic rating classification from Aa through Caa. The modifier 1 indicates that the obligation ranks in the higher end of its generic rating category; the modifier 2 indicates a mid-range ranking; and the modifier 3 indicates a ranking in the lower end of that generic rating category.
Short-Term Ratings
Moody's short-term ratings are opinions of the ability of issuers to honor short-term financial obligations. Ratings may be assigned to issuers, short-term programs or to individual short-term debt instruments. Such obligations generally have an original maturity not exceeding thirteen months, unless explicitly noted.
Moody's employs the following designations to indicate the relative repayment ability of rated issuers:
P-1 Issuers (or supporting institutions) rated Prime-1 have a superior ability to repay short-term debt obligations.
P-2 Issuers (or supporting institutions) rated Prime-2 have a strong ability to repay short-term debt obligations.
P-3 Issuers (or supporting institutions) rated Prime-3 have an acceptable ability to repay short-term obligations.
NP Issuers (or supporting institutions) rated Not Prime do not fall within any of the Prime rating categories.
Note: Canadian issuers rated P-1 or P-2 have their short-term ratings enhanced by the senior-most long-term rating of the issuer, its guarantor or support-provider.
Standard & Poor's Rating Group, a division of The McGraw Hill Companies, Inc. ("Standard & Poor's")
B-1
Issue Credit Rating Definitions
A Standard & Poor's issue credit rating is a current opinion of the creditworthiness of an obligor with respect to a specific financial obligation, a specific class of financial obligations, or a specific financial program (including ratings on medium term note programs and commercial paper programs). It takes into consideration the creditworthiness of guarantors, insurers, or other forms of credit enhancement on the obligation and takes into account the currency in which the obligation is denominated. The issue credit rating is not a recommendation to purchase, sell, or hold a financial obligation, inasmuch as it does not comment as to market price or suitability for a particular investor. Issue credit ratings are based on current information furnished by the obligors or obtained by Standard & Poor's from other sources it considers reliable. Standard & Poor's does not perform an audit in connection with any credit rating and may, on occasion, rely on unaudited financial information. Credit ratings may be changed, suspended, or withdrawn as a result of changes in, or unavailability of, such information, or based on other circumstances.
Issue credit ratings can be either long-term or short-term. Short-term ratings are generally assigned to those obligations considered short-term in the relevant market. In the U.S., for example, that means obligations with an original maturity of no more than 365 days-including commercial paper. Short-term ratings are also used to indicate the creditworthiness of an obligor with respect to put features on long-term obligations. The result is a dual rating, in which the short-term rating addresses the put feature, in addition to the usual long-term rating. Medium-term notes are assigned long-term ratings.
Long-Term Issue Credit Ratings
Issue credit ratings are based, in varying degrees, on the following considerations:
• Likelihood of payment-capacity and willingness of the obligor to meet its financial commitment on an obligation in accordance with the terms of the obligation;
• Nature of and provisions of the obligation;
• Protection afforded by, and relative position of, the obligation in the event of bankruptcy, reorganization, or other arrangement under the laws of bankruptcy and other laws affecting creditors' rights.
The issue rating definitions are expressed in terms of default risk. As such, they pertain to senior obligations of an entity. Junior obligations are typically rated lower than senior obligations, to reflect the lower priority in bankruptcy, as noted above. (Such differentiation applies when an entity has both senior and subordinated obligations, secured and unsecured obligations, or operating company and holding company obligations.) Accordingly, in the case of junior debt, the rating may not conform exactly with the category definition.
AAA An obligation rated "AAA" has the highest rating assigned by Standard & Poor's. The obligor's capacity to meet its financial commitment on the obligation is extremely strong.
AA An obligation rated "AA" differs from the highest-rate issues only in small degree. The obligor's capacity to meet its financial commitment on the obligation is very strong.
A An obligation rated "A" is somewhat more susceptible to the adverse effects of changes in circumstances and economic conditions than obligations in higher-rated categories. However, the obligor's capacity to meet its financial commitment on the obligation is still strong.
BBB An obligation rated "BBB" exhibits adequate protection parameters. However, adverse economic conditions or changing circumstances are more likely to lead to a weakened capacity of the obligor to meet its financial commitment on the obligation.
BB An obligation rated "BB" is less vulnerable to nonpayment than other speculative issues. However, it faces major ongoing uncertainties or exposure to adverse business, financial or economic conditions which could lead to inadequate capacity to meet its financial commitment on the obligation.
B An obligation rated "B" is more vulnerable to nonpayment than obligations rated "BB", but the obligor currently has the capacity to meet its financial commitment on the obligation. Adverse business, financial,
B-2
or economic conditions will likely impair the obligor's capacity or willingness to meet its financial commitment on the obligation.
CCC An obligation rated "CCC" is currently vulnerable to nonpayment, and is dependent upon favorable business, financial, and economic conditions for the obligor to meet its financial commitment on the obligation. In the event of adverse business, financial, or economic conditions, the obligor is not likely to have the capacity to meet its financial commitment on the obligation.
CC An obligation rated "CC" is currently highly vulnerable to nonpayment.
C A subordinated debt or preferred stock obligation rated "C" is currently highly vulnerable to nonpayment. The "C" rating may be used to cover a situation where a bankruptcy petition has been filed or similar action taken, but payments on this obligation are being continued. A "C" also will be assigned to a preferred stock issue in arrears on dividends or sinking fund payments, but that is currently paying.
D An obligation rated "D" is in payment default. The "D" rating category is used when payments on an obligation are not made on the date due even if the applicable grace period has not expired, unless Standard & Poor's believes that such payments will be made during such grace period. The "D" rating also will be used upon the filing of a bankruptcy petition or the taking of a similar action if payments on an obligation are jeopardized.
Plus (+) or minus (-): The ratings from "AA" to "CCC" may be modified by the addition of a plus or minus sign to show relative standing within the major rating categories.
r This symbol is attached to the ratings of instruments with significant noncredit risks. It highlights risks to principal or volatility of expected returns which are not addressed in the credit rating.
N.R. This indicates that no rating has been requested, that there is insufficient information on which to base a rating, or that Standard & Poor's does not rate a particular obligation as a matter of policy.
Short-Term Issue Credit Ratings
A-1 A short-term obligation rated "A-1" is rated in the highest category by Standard & Poor's. The obligor's capacity to meet its financial commitment on the obligation is strong. Within this category, certain obligations are designated with a plus sign (+). This indicates that the obligor's capacity to meet its financial commitment on these obligations is extremely strong.
A-2 A short-term obligation rated "A-2" is somewhat more susceptible to the adverse effects of changes in circumstances and economic conditions than obligations in higher rating categories. However, the obligor's capacity to meet its financial commitment on the obligation is satisfactory.
A-3 A short-term obligation rated "A-3" exhibits adequate protection parameters. However, adverse economic conditions or changing circumstances are more likely to lead to a weakened capacity of the obligor to meet its financial commitment on the obligation.
B A short-term obligation rated "B" is regarded as having significant speculative characteristics. The obligor currently has the capacity to meet its financial commitment on the obligation; however, it faces major ongoing uncertainties which could lead to the obligor's inadequate capacity to meet its financial commitment on the obligation.
C A short-term obligation rated "C" is currently vulnerable to nonpayment and is dependent upon favorable business, financial, and economic conditions for the obligor to meet its financial commitment on the obligation.
D A short-term obligation rated "D" is in payment default. The "D" rating category is used when payments on an obligation are not made on the date due even if the applicable grace period has not expired, unless Standard & Poor's believes that such payments will be made during such grace period. The "D" rating also will be used upon the filing of a bankruptcy petition or the taking of a similar action if payments on an obligation are jeopardized.
B-3
Fitch Ratings ("Fitch")
International Long-Term Credit Ratings
International Long-Term Credit Ratings are more commonly referred to as simply "Long-Term Ratings". The following scale applies to foreign currency and local currency ratings.
International credit ratings assess the capacity to meet foreign or local currency commitments. Both foreign and local currency ratings are internationally comparable assessments. The local currency rating measures the probability of payment only within the sovereign state's currency and jurisdiction.
Investment Grade
AAA Highest credit quality. "AAA" ratings denote the lowest expectation of credit risk. They are assigned only in case of exceptionally strong capacity for timely payment of financial commitments. This capacity is highly unlikely to be adversely affected by foreseeable events.
AA Very high credit quality. "AA" ratings denote a very low expectation of credit risk. They indicate very strong capacity for timely payment of financial commitments. This capacity is not significantly vulnerable to foreseeable events.
A High credit quality. "A" ratings denote a low expectation of credit risk. The capacity for timely payment of financial commitments is considered strong. This capacity may, nevertheless, be more vulnerable to changes in circumstances or in economic conditions than is the case for higher ratings.
BBB Good credit quality. "BBB" ratings indicate that there is currently a low expectation of credit risk. The capacity for timely payment of financial commitments is considered adequate, but adverse changes in circumstances and in economic conditions are more likely to impair this capacity. This is the lowest investment-grade category.
Speculative Grade
BB Speculative. "BB" ratings indicate that there is a possibility of credit risk developing, particularly as the result of adverse economic change over time; however, business or financial alternatives may be available to allow financial commitments to be met. Securities rated in this category are not investment grade.
B Highly speculative. "B" ratings indicate that significant credit risk is present, but a limited margin of safety remains. Financial commitments are currently being met; however, capacity for continued payment is contingent upon a sustained, favorable business and economic environment.
CCC, High default risk. Default is a real possibility. Capacity for meeting financial commitments is solely reliant
CC, C upon sustained, favorable business or economic developments. A "CC" rating indicates that default of some kind appears probable. "C" ratings signal imminent default.
DDD, Default. The ratings of obligations in this category are based on their prospects for achieving partial or full
DD, D recovery in a reorganization or liquidation of the obligor. While expected recovery values are highly speculative and cannot be estimated with any precision, the following serve as general guidelines. "DDD" obligations have the highest potential for recovery, around 90%-100% of outstanding amounts and accrued interest. "DD" indicates potential recoveries in the range of 50%-90% and "D" the lowest recovery potential, i.e., below 50%.
Entities rated in this category have defaulted on some or all of their obligations. Entities rated "DDD" have the highest prospect for resumption of performance or continued operation with or without a formal reorganization process. Entities rated "DD" and "D" are generally undergoing a formal reorganization or liquidation process; those rated "DD" are likely to satisfy a higher portion of their outstanding obligations, while entities rated "D" have a poor prospect of repaying all obligations.
Notes:
"+" or "-" may be appended to a rating to denote relative status within major rating categories. Such suffixes are not added to the "AAA" category or to categories below "CCC".
B-4
"NR" indicates that Fitch Ratings does not publicly rate the issuer or issue in question.
"Withdrawn": A rating is withdrawn when Fitch Ratings deems the amount of information available to be inadequate for rating purposes, or when an obligation matures, is called, or refinanced.
Rating Watch: Ratings are placed on Rating Watch to notify investors that there is a reasonable probability of a rating change and the likely direction of such change. These are designated as "Positive", indicating a potential upgrade, "Negative", for a potential downgrade, or "Evolving", if ratings may be raised, lowered or maintained. Rating Watch is typically resolved over a relatively short period.
A Rating Outlook indicates the direction a rating is likely to move over a one to two-year period. Outlooks may be positive, stable, or negative. A positive or negative Rating Outlook does not imply a rating change is inevitable. Similarly, ratings for which outlooks are "stable" could be upgraded or downgraded before an outlook moves to positive or negative if circumstances warrant such an action. Occasionally, Fitch may be unable to identify the fundamental trend and in these cases, the Rating Outlook may be described as "evolving".
International Short-Term Credit Ratings
International Short-Term Credit Ratings are more commonly referred to as simply "Short-Term Ratings". The following scale applies to foreign currency and local currency ratings.
A short-term rating has a time horizon of less than 12 months for most obligations, or up to three years for U.S. public finance securities, and thus places greater emphasis on the liquidity necessary to meet financial commitments in a timely manner.
International credit ratings assess the capacity to meet foreign or local currency commitments. Both foreign and local currency ratings are internationally comparable assessments. The local currency rating measures the probability of payment only within the sovereign state's currency and jurisdiction.
F1 Highest credit quality. Indicates the strongest capacity for timely payment of financial commitments; may have an added "+" to denote any exceptionally strong credit feature.
F2 Good credit quality. A satisfactory capacity for timely payment of financial commitments, but the margin of safety is not as great as in the case of the higher ratings.
F3 Fair credit quality. The capacity for timely payment of financial commitments is adequate; however, near-term adverse changes could result in a reduction to non-investment grade.
B Speculative. Minimal capacity for timely payment of financial commitments, plus vulnerability to near-term adverse changes in financial and economic conditions.
C High default risk. Default is a real possibility. Capacity for meeting financial commitments is solely reliant upon a sustained, favorable business and economic environment.
D Default. Denotes actual or imminent payment default.
Notes:
"+" may be appended to an "F1" rating class to denote relative status within the category.
"NR" indicates that Fitch Ratings does not publicly rate the issuer or issue in question.
"Withdrawn": A rating is withdrawn when Fitch Ratings deems the amount of information available to be inadequate for rating purposes, or when an obligation matures, is called, or refinanced.
Rating Watch: Ratings are placed on Rating Watch to notify investors that there is a reasonable probability of a rating change and the likely direction of such change. These are designated as "Positive", indicating a potential upgrade, "Negative", for a potential downgrade, or "Evolving", if ratings may be raised, lowered or maintained. Rating Watch is typically resolved over a relatively short period.
B-5
EVERY SHAREHOLDER’S VOTE IS IMPORTANT
| EASY VOTING OPTIONS: | |
|
|
|
|
| VOTE ON THE INTERNET Log on to: www.proxy-direct.com Follow the on-screen instructions available 24 hours |
|
|
|
|
| VOTE BY PHONE Call 1-800-337-3503 Follow the recorded instructions available 24 hours |
|
|
|
|
| VOTE BY MAIL Vote, sign and date this Proxy Card and return in the postage-paid envelope |
|
|
|
|
| VOTE IN PERSON Attend Shareholder Meeting 522 Fifth Avenue New York NY 10036 on September 27, 2012 |


Please detach at perforation before mailing.
PROXY | MORGAN STANLEY MID CAP GROWTH FUND | PROXY |
JOINT SPECIAL MEETING OF SHAREHOLDERS
TO BE HELD ON SEPTEMBER 27, 2012
This proxy is solicited on behalf of the Board of Trustees of Morgan Stanley Mid Cap Growth Fund.
The undersigned hereby constitutes and appoints Stefanie V. Chang Yu, Mary E. Mullin and Arthur Lev, and each of them, as proxies for the undersigned, with full power of substitution and resubstitution, and hereby authorizes said proxies, and each of them, to represent and vote, as designated on the reverse side, all shares of beneficial interest Morgan Stanley Mid Cap Growth Fund, held of record by the undersigned on July 2, 2012 at the Joint Special Meeting of Shareholders to be held at 522 Fifth Avenue, New York, NY 10036, on September 27, 2012 at 9:00 a.m., New York time, and at any adjournment or postponement thereof. The undersigned hereby revokes any and all proxies with respect to such shares heretofore given by the undersigned.
This proxy card, when properly executed, will be voted in the manner directed herein by the undersigned Shareholder, and, in the discretion of such proxies, upon any and all other matters as may properly come before the meeting or any adjournment or postponement thereof. If no direction is made, this proxy will be voted “FOR” the Proposal.
| VOTE VIA THE INTERNET: www.proxy-direct.com | |||
| VOTE VIA THE TELEPHONE: 1-800-337-3503 | |||
|
| |||
|
|
|
| |
|
Note: Please sign exactly as your name appears on this proxy card. All joint owners should sign. When signing as executor, administrator, attorney, trustee or guardian or as custodian for a minor please sign full title as such. If a corporation, please sign in full corporate name and indicate the signer’s office. If a partner, sign in the partnership name. | |||
|
| |||
|
| |||
| Signature | |||
|
| |||
| Signature (if held jointly) | |||
|
| |||
| Date | MCG_23735_071912 | ||
EVERY SHAREHOLDER’S VOTE IS IMPORTANT
Important Notice Regarding the Availability of Proxy Materials for the
Joint Special Meeting of Shareholders to Be Held on September 27, 2012.
The Proxy Statement for this meeting is available at: https://www.proxy-direct.com/mcg-23735
Please detach at perforation before mailing.
THE BOARD RECOMMENDS THAT YOU CAST YOUR VOTE “FOR” THE PROPOSAL AS DESCRIBED IN THE PROXY STATEMENT/PROSPECTUS.
TO VOTE, MARK BLOCKS BELOW IN BLUE OR BLACK INK AS IN THIS EXAMPLE: ![]()
o To vote in accordance with the Board’s recommendation mark this box. No other vote is necessary.
|
|
|
| FOR | AGAINST | ABSTAIN |
1. | To consider and vote upon a proposal to approve the actions and transactions described in that certain Agreement and Plan of Reorganization, dated June 28, 2012, between Morgan Stanley Mid Cap Growth Fund (“Mid Cap Growth”) and Morgan Stanley Institutional Fund Trust, on behalf of the Mid Cap Growth Portfolio (“MSIFT Mid Cap Growth”), pursuant to which substantially all of the assets and liabilities of Mid Cap Growth will be transferred to MSIFT Mid Cap Growth in exchange for shares of MSIFT Mid Cap Growth of the Class described in the Joint Proxy Statement and Prospectus and pursuant to which Mid Cap Growth will be liquidated and terminated. | o | o | o |
|
|
|
|
|
2. | To act upon such other matters as may properly come before the Meeting. |
|
|
|
PLEASE VOTE, SIGN AND DATE THIS PROXY AND RETURN IT PROMPTLY IN THE ENCLOSED ENVELOPE.
MCG_23735_071912
EVERY SHAREHOLDER’S VOTE IS IMPORTANT
| EASY VOTING OPTIONS: | |
|
| |
|
| VOTE ON THE INTERNET |
| Log on to: | |
| www.proxy-direct.com | |
| Follow the on-screen instructions | |
| available 24 hours | |
|
|
|
|
| VOTE BY PHONE |
| Call 1-800-337-3503 | |
| Follow the recorded instructions | |
| available 24 hours | |
|
|
|
|
| VOTE BY MAIL |
| Vote, sign and date this Proxy Card | |
| and return in the postage-paid | |
| envelope | |
|
|
|
|
| VOTE IN PERSON |
| Attend Shareholder Meeting | |
| 522 Fifth Avenue | |
| New York NY 10036 | |
| on September 27, 2012 | |


Please detach at perforation before mailing.
PROXY |
| MORGAN STANLEY GLOBAL STRATEGIST FUND |
| PROXY |
|
| JOINT SPECIAL MEETING OF SHAREHOLDERS |
|
|
|
| TO BE HELD ON SEPTEMBER 27, 2012 |
|
|
This proxy is solicited on behalf of the Board of Trustees of Morgan Stanley Global Strategist Fund.
The undersigned hereby constitutes and appoints Stefanie V. Chang Yu, Mary E. Mullin and Arthur Lev, and each of them, as proxies for the undersigned, with full power of substitution and resubstitution, and hereby authorizes said proxies, and each of them, to represent and vote, as designated on the reverse side, all shares of beneficial interest of Morgan Stanley Global Strategist Fund, held of record by the undersigned on July 2, 2012 at the Joint Special Meeting of Shareholders to be held at 522 Fifth Avenue, New York, NY 10036, on September 27, 2012 at 9:00 a.m., New York time, and at any adjournment or postponement thereof. The undersigned hereby revokes any and all proxies with respect to such shares heretofore given by the undersigned.
This proxy card, when properly executed, will be voted in the manner directed herein by the undersigned Shareholder, and, in the discretion of such proxies, upon any and all other matters as may properly come before the meeting or any adjournment or postponement thereof. If no direction is made, this proxy will be voted “FOR” the Proposal.
| VOTE VIA THE INTERNET: www.proxy-direct.com | |||
| VOTE VIA THE TELEPHONE: 1-800-337-3503 | |||
|
|
|
| |
|
|
|
| |
|
| |||
| Note: Please sign exactly as your name appears on this proxy card. All joint owners should sign. When signing as executor, administrator, attorney, trustee or guardian or as custodian for a minor please sign full title as such. If a corporation, please sign in full corporate name and indicate the signer’s office. If a partner, sign in the partnership name. | |||
|
| |||
|
| |||
| Signature | |||
|
| |||
| Signature (if held jointly) | |||
|
| |||
| Date | GSF_23727_071912 | ||
EVERY SHAREHOLDER’S VOTE IS IMPORTANT
Important Notice Regarding the Availability of Proxy Materials for the
Joint Special Meeting of Shareholders to Be Held on September 27, 2012.
The Proxy Statement for this meeting is available at: https://www.proxy-direct.com/gsf-23727
Please detach at perforation before mailing.
THE BOARD RECOMMENDS THAT YOU CAST YOUR VOTE “FOR” THE PROPOSAL AS DESCRIBED IN THE PROXY STATEMENT/PROSPECTUS.
TO VOTE, MARK BLOCKS BELOW IN BLUE OR BLACK INK AS IN THIS EXAMPLE: ![]()
o�� To vote in accordance with the Board’s recommendation mark this box. No other vote is necessary.
|
|
|
|
| FOR | AGAINST | ABSTAIN |
1. |
| To consider and vote upon a proposal to approve the actions and transactions described in that certain Agreement and Plan of Reorganization, dated June 28, 2012, between Morgan Stanley Global Strategist Fund (“Global Strategist”) and Morgan Stanley Institutional Fund Trust, on behalf of the Global Strategist Portfolio (“MSIFT Global Strategist”), pursuant to which substantially all of the assets and liabilities of Global Strategist will be transferred to MSIFT Global Strategist in exchange for shares of MSIFT Global Strategist of the Class described in the Joint Proxy Statement and Prospectus and pursuant to which Global Strategist will be liquidated and terminated. | o | o | o |
|
|
|
|
|
|
2. |
| To act upon such other matters as may properly come before the Meeting. |
|
|
|
PLEASE VOTE, SIGN AND DATE THIS PROXY AND RETURN IT PROMPTLY IN THE ENCLOSED ENVELOPE.
GSF_23727_071912
PART C. OTHER INFORMATION
ITEM 15. INDEMNIFICATION
The response to this item is incorporated herein by reference to Exhibits 1 and 2 under Item 16 below and by reference to Item 30 of the Company’s Post-Effective Amendment No. 107 to its Registration Statement on Form N-1A dated July 16, 2012 (File Nos. 2-89729; 811-03980).
ITEM 16. EXHIBITS
(1) |
| Amended and Restated Declaration of Trust, dated August 24, 2006, is incorporated by reference to Exhibit (a) of Post- Effective Amendment No. 70 to the Registration Statement on Form N-1A, as filed on November 30, 2006. |
|
|
|
(2) |
| Amended and Restated By-Laws, dated July 31, 2003, are incorporated by reference to Exhibit (b)(5) of Post-Effective Amendment No. 61 to the Registration Statement on Form N-1A, as filed on December 10, 2003. |
|
|
|
(3) |
| Not applicable. |
|
|
|
(4) |
| Copy of Agreement and Plan of Reorganization (filed herewith as Exhibit A to the Proxy Statement and Prospectus). |
|
|
|
(5) |
| Not applicable. |
|
|
|
(6) |
| Amended and Restated Investment Advisory Agreement with Morgan Stanley Investment Management Inc., dated June 1, 2005, is incorporated by reference to Exhibit (d)(1) of Post-Effective Amendment No. 100 to the Registration Statement on Form N-1A, as filed on February 6, 2012. |
|
|
|
(7) |
| Distribution Agreement with MAS Fund Distribution, Inc. (now Morgan Stanley Distribution, Inc.), dated May 31, 1997, is incorporated by reference to Exhibit 6(b) of Post-Effective Amendment No. 50 to the Registration Statement on Form N-1A, as filed on July 10, 1998. |
|
|
|
(8) |
| Not applicable. |
|
|
|
(9) |
| Custody Agreement between Registrant and State Street Bank and Trust Company, is incorporated by reference to Exhibit (g) to Post-Effective Amendment No. 107 to the Registration Statement on Form N-1A of Morgan Stanley Institutional Fund, Inc., filed on May 23, 2012. |
|
|
|
(10) (a) |
| Amended and Restated Shareholder Services Plan under Rule 12b-1 relating to Class P Shares, is incorporated by reference to Exhibit (m)(1) of Post-Effective Amendment No. 100 to the Registration Statement on Form N-1A, as filed on February 6, 2012. |
|
|
|
(b) |
| Shareholder Services Plan under Rule 12b-1 relating to Class H Shares, is incorporated by reference to Exhibit (m)(2) to Post-Effective Amendment No. 104 to the Registration Statement on Form N-1A filed on April 27, 2012. |
|
|
|
(c) |
| Distribution and Shareholder Services Plan under Rule 12b-1 relating to Class L shares, is incorporated by reference to Exhibit (m)(3) to Post-Effective Amendment No. 104 to the Registration Statement on Form N-1A filed on April 27, 2012. |
|
|
|
(d) |
| Amended Rule 18f-3 Multiple Class Plan, is incorporated by reference to Exhibit (n) to Post-Effective Amendment No. 104 to the Registration Statement on Form N-1A filed on April 27, 2012. |
|
|
|
(11) |
| Opinion and Consent of Dechert LLP, is filed herewith. |
|
|
|
(12) (a) |
| Form of Opinion (with respect to Mid Cap Growth and MSIFT Mid Cap Growth) of Dechert LLP (as to tax matters), is filed herewith. |
(b) |
| Form of Opinion (with respect to Global Strategist and MSIFT Global Strategist) of Dechert LLP (as to tax matters), is filed herewith. |
|
|
|
(13) (a) |
| Amended and Restated Administration Agreement with Morgan Stanley Investment Management Inc., dated November 1, 2004, is incorporated by reference to Exhibit (h)(1) of Post-Effective Amendment No. 100 to the Registration Statement on Form N-1A, as filed on February 6, 2012. |
|
|
|
(b) |
| Transfer Agency and Service Agreement with Morgan Stanley Services Company Inc., dated June 9, 2008, is incorporated by reference to Exhibit (h)(2) of Post-Effective Amendment No. 100 to the Registration Statement on Form N-1A, as filed on February 6, 2012. |
|
|
|
(c) |
| Amendment to Transfer Agency and Service Agreement between the Registrant and Morgan Stanley Services Company Inc., dated April 23, 2009, is incorporated by reference to Exhibit (h)(3) of Post-Effective Amendment No. 97 to the Registration Statement on Form N-1A, as filed on December 15, 2011. |
|
|
|
(14) |
| Consent of Ernst & Young LLP (with respect to Form N-14), is filed herewith. |
|
|
|
(15) |
| Not applicable. |
|
|
|
(16) |
| Powers of Attorney of Trustees, dated May 1, 2012, are incorporated by reference to Exhibit (16) to the Registration Statement on Form N-14 filed on May 24, 2012. |
ITEM 17. UNDERTAKINGS
(1) The undersigned registrant agrees that prior to any public reoffering of the securities registered through the use of a prospectus which is a part of this registration statement on Form N-14 by any person or party who is deemed to be an underwriter within the meaning of Rule 145(c) of the Securities Act, the reoffering prospectus will contain the information called for by the applicable registration form for the reofferings by persons who may be deemed underwriters, in addition to the information called for by the other items of the applicable form.
(2) The undersigned registrant agrees that every prospectus that is filed under paragraph (1) above will be filed as a part of an amendment to this registration statement on Form N-14 and will not be used until the amendment is effective, and that, in determining any liability under the Securities Act, each post-effective amendment shall be deemed to be a new registration statement for the securities offered therein, and the offering of the securities at that time shall be deemed to be the initial bona fide offering of them.
(3) The undersigned registrant undertakes to file a post-effective amendment to this registration statement upon the closing of the Reorganizations described in this registration statement that contains opinions of counsel supporting the tax matters discussed in this registration statement.
SIGNATURES
As required by the Securities Act of 1933, this registration statement has been signed on behalf of the registrant, in the City of New York and State of New York on this 23rd day of July, 2012.
| MORGAN STANLEY INSTITUTIONAL FUND TRUST | |
|
| |
| By: | /s/ Arthur Lev |
|
| Arthur Lev |
|
| President and Principal Executive Officer |
As required by the Securities Act of 1933, this registration statement has been signed below by the following persons in the capacities and on the dates indicated.
Signatures |
| Title |
| Date | |
(1) Principal Executive Officer |
| President and Principal Executive Officer |
|
| |
|
|
|
|
| |
By: | /s/ Arthur Lev |
|
|
| July 23, 2012 |
| Arthur Lev |
|
|
|
|
|
|
|
|
| |
(2) Principal Financial Officer |
| Principal Financial Officer |
|
| |
|
|
|
|
| |
By: | /s/ Francis J. Smith |
|
|
| July 23, 2012 |
| Francis J. Smith |
|
|
|
|
|
|
|
|
| |
(3) Majority of the Directors |
|
|
|
| |
|
|
|
|
| |
INDEPENDENT TRUSTEES |
|
|
|
| |
Frank L. Bowman |
| Michael F. Klein |
|
| |
Michael Bozic |
| Michael E. Nugent |
|
| |
Kathleen A. Dennis |
| W. Allen Reed |
|
| |
Dr. Manuel H. Johnson |
| Fergus Reid |
|
| |
Joseph J. Kearns |
|
|
|
| |
|
|
|
|
| |
By: | /s/ Carl Frischling |
|
|
| July 23, 2012 |
| Carl Frischling |
|
|
|
|
| Attorney-in-Fact for the |
|
|
|
|
| Independent Trustees |
|
|
|
|
|
|
|
|
| |
INTERESTED TRUSTEE |
|
|
|
| |
James F. Higgins |
|
|
|
| |
|
|
|
|
| |
By: | /s/ Stefanie V. Chang Yu |
|
|
| July 23, 2012 |
| Stefanie V. Chang Yu |
|
|
|
|
| Attorney-in-Fact for the |
|
|
|
|
| Interested Trustee |
|
|
|
|
EXHIBIT INDEX
(11) |
|
| Opinion and Consent of Dechert LLP. |
|
|
|
|
(12) | (a) |
| Form of Opinion (with respect to Mid Cap Growth and MSIFT Mid Cap Growth) of Dechert LLP (as to tax matters). |
|
|
|
|
| (b) |
| Form of Opinion (with respect to Global Strategist and MSIFT Global Strategist) of Dechert LLP (as to tax matters). |
|
|
|
|
(14) |
|
| Consent of Ernst & Young LLP (with respect to Form N-14). |