NOTICE & PROXY STATEMENT
SCHEDULE 14A INFORMATION
Proxy Statement Pursuant to Section 14(a) of the
Securities Exchange Act of 1934 (Amendment No. )
Filed by the Registrant x
Filed by a Party other than the Registrant ¨
Check the appropriate box:
¨ Preliminary Proxy Statement | ¨ CONFIDENTIAL, FOR USE OF THE COMMISSION ONLY (AS PERMITTED BY RULE 14A-6(E)(2)) |
x Definitive Proxy Statement
¨ Definitive Additional Materials
¨ Soliciting Material Pursuant to Section 240.14a-11(c) or Section 240.14a-12
Mahaska Investment Company
(Name of Registrant as Specified In Its Charter)
(Name of Person(s) Filing Proxy Statement, if other than the Registrant)
Payment of Filing Fee (Check the appropriate box):
| x | No fee required |
| ¨ | Fee computed on table below per Exchange Act Rules 14a-6(i)(4) and 0-11. |
| (1) | Title of each class of securities to which transaction applies: |
| (2) | Aggregate number of securities to which transaction applies: |
| (3) | Per unit price or other underlying value of transaction computed pursuant to Exchange Act Rule 0-11 (Set forth the amount on which the filing fee is calculated and state how it was determined): |
| (4) | Proposed maximum aggregate value of transaction: |
| (5) | Total fee paid: |
| ¨ | Fee paid previously with preliminary materials. |
| ¨ | Check box if any part of the fee is offset as provided by Exchange Act Rule 0-11(a)(2) and identify the filing for which the offsetting fee was paid previously. Identify the previous filing by registration statement number, or the Form of Schedule and the date of its filing. |
| (1) | Amount Previously Paid: |
| (2) | Form, Schedule or Registration Statement No.: |
| (3) | Filing Party: |
| (4) | Date Filed: |
NOTICE OF ANNUAL MEETING OF SHAREHOLDERS
TO BE HELD APRIL 30, 2003
To The Shareholders Of Mahaska Investment Company:
The Annual Meeting of Shareholders of Mahaska Investment Company will be held at the Elmhurst Country Club, 2214 South 11th Street, Oskaloosa, Iowa, on Wednesday, April 30, 2003, at 10:30 a.m., for the following purposes:
| 1. | To elect directors to serve until the Annual Meeting of Shareholders at which their term expires, and until their successors shall have been elected and qualified; |
| 2. | To vote upon an amendment to Article I of the Articles of Incorporation to change the name of Mahaska Investment Company to MidWestOne Financial Group, Inc.; |
| 3. | To ratify the appointment of KPMG LLP as independent auditors for the current fiscal year; and |
| 4. | To transact such other business as may properly come before the meeting or any adjournment thereof. |
* * * * *
The Board of Directors has fixed the close of business on February 25, 2003, as the record date for the determination of shareholders entitled to receive notice of and to vote at the Annual Meeting or any adjournment thereof.
To be sure that your shares are represented at the meeting, please either complete and promptly mail the enclosed proxy card in the envelope provided for this purpose or vote through the telephone or Internet voting procedures described on the proxy card. If your shares are registered in the name of a bank or brokerage firm, telephone or Internet voting will be available to you only if offered by your bank or broker and such procedures are described on the voting form sent to you.
By Order of the Board of Directors
Charles S. Howard, Chairman of the Board
Oskaloosa, Iowa
March 24, 2003
PROXY STATEMENT
Mahaska Investment Company
222 First Avenue East
Oskaloosa, Iowa 52577
INTRODUCTION
The enclosed Proxy is solicited by the Board of Directors of Mahaska Investment Company, an Iowa corporation (the “Company”), for use at the Annual Meeting of Shareholders to be held on April 30, 2003, and at any adjournment thereof. The Proxy may be revoked at any time before it is exercised by submitting a later dated Proxy, by giving notice of such revocation to the Company in writing, or by attending and requesting such revocation at the Annual Meeting. Attendance at the Annual Meeting will not in and of itself constitute the revocation of the Proxy. If the Proxy is not revoked, the shares represented thereby will be voted in the manner specified in the Proxy. A Proxy properly executed and received prior to the Annual Meeting which does not give specific voting instructions will be voted FOR the election of the nominees to the Board of Directors set forth herein, FOR the amendment authorizing the name change, and FOR the ratification of the appointment of KPMG LLP as independent auditors for the current fiscal year and as the persons designated as proxies on the enclosed proxy card determine is in the best interests of the Company in any other business that may properly come before the meeting or any adjournment thereof. Abstentions will be treated as shares present and entitled to vote for purposes of determining whether a quorum is present, but not voted for purposes of determining the approval of any matter submitted to the shareholders for a vote. If a Proxy returned by a broker indicates that the broker does not have discretionary authority to vote some or all of the shares covered thereby for any matter submitted to the shareholders for a vote (broker non-votes), such shares will be considered to be present for the purpose of determining whether a quorum is present, but will not be entitled to vote at the Annual Meeting of Shareholders.
For participants in the Mahaska Investment Company Employee Stock Ownership Plan and Trust (the “ESOP”), the proxy card will also serve as a voting instruction card for Mahaska State Bank, the trustee of the ESOP (the “Trustee”), with respect to shares held in the participants’ accounts. A participant cannot direct the voting of shares allocated to the participant’s account in the ESOP unless the proxy card is signed and returned. If proxy cards representing shares in the ESOP are not returned, those shares will be voted by the Trustee in the same proportion as the shares for which signed proxy cards are returned by the other participants in the ESOP.
The cost of preparing, assembling, and mailing this Proxy Statement, the Notice of Annual Meeting of Shareholders, and the accompanying Proxy is being borne by the Company. In addition to the solicitation by mail, officers, directors, and regular employees of the Company may solicit Proxies by telephone or personal interview. Such persons will receive no additional compensation for such services. Brokerage houses, nominees, fiduciaries, and other custodians will be requested to forward soliciting material to the beneficial owners of shares held of record by them and will be reimbursed by the Company for their reasonable expenses.
The record date for shareholders entitled to vote at the meeting is the close of business on February 25, 2003, at which time the Company had issued and outstanding 3,933,563 shares of Common Stock, and all of those shares are eligible to vote at the Annual Meeting of Shareholders. Holders of Common Stock are entitled to one vote per share on any matter that may properly come before the meeting.
This Proxy Statement, the enclosed Proxy, and the attached Notice were first sent to shareholders on approximately March 24, 2003.
PROPOSAL 1
Election Of Directors
Three directors are to be elected at the Annual Meeting of Shareholders by holders of Common Stock to serve until the Annual Meeting of Shareholders at which their respective term expires and until their respective successor has been elected and qualified. The Articles of Incorporation and Bylaws of the Company state that the Board of Directors of the Company shall set the size of the Board of Directors in a range of not less than five directors nor greater than fifteen directors. The Board of Directors set the size for the current Board of Directors at nine individuals.
Each shareholder of record shall be entitled to as many votes as the total of the number of shares of Common Stock, $5.00 par value per share, held of record by such shareholder. Proxies cannot be voted for a greater number of persons than the number of nominees named. The Company does not have cumulative voting.
Under applicable provisions of Iowa law and the Bylaws of the Company, a majority of the outstanding shares of the Company entitled to vote, represented in person or by Proxy, constitute a quorum. If a quorum is present, the affirmative vote of a majority of the shares represented at the meeting and entitled to vote on the election of directors in the manner set forth above, will be required to elect directors.
In the absence of instructions to the contrary, the Proxies solicited by the Board of Directors will be voted in favor of the election of the nominees identified in the following table, all of whom are members of the present Board of Directors.
The nominees and the directors of the Company whose terms continue beyond the 2003 Annual Meeting of Shareholders are identified in the following table. The term for which nominees William D. Hassel, Michael R. Welter, and Edward C. Whitham are nominated will expire at the 2006 Annual Meeting of Shareholders. Except as may be otherwise expressly stated, the nominees for director have been employed in the capacities indicated for more than five years. Additional information regarding these nominees and each director as of February 25, 2003 is set forth in the following table. The number of shares of Common Stock of the Company beneficially owned by each of the nominees and directors as of February 25, 2003, is set forth on pages 12 and 13.
2
Name and Principal Occupation for the last five years | First Became a Director | Present Term Expires at Annual Meeting | Age | |||
Nominees: | ||||||
William D. Hassel | 1999 | 2003 | 54 | |||
President and, since April 2000, Vice Chairman of Midwest Federal Savings and Loan Association of Eastern Iowa(1) | ||||||
Michael R. Welter | 2000 | 2003 | 52 | |||
President of M&M Enterprises, Sigourney, Iowa, doing general commercial contracting work in Southeast Iowa, and President of Sigourney Fast Stop, a convenience store located in Sigourney, Iowa | ||||||
Edward C. Whitham | 2000 | 2003 | 63 | |||
President, Financial Management Accounting, Inc., Burlington, Iowa. This is an accounting, tax preparation, and pension administration firm in which he is involved in all phases of the practice. | ||||||
Other Directors: | ||||||
Richard R. Donohue | 1999 | 2004 | 53 | |||
Managing Partner, Theobald, Donohue & Thompson, Oskaloosa, Iowa. This is a certified public accounting firm in which he is involved in all phases of the practice. | ||||||
Charles S. Howard | 1988 | 2005 | 47 | |||
Chairman of the Company since January 1998 and President and Chief Executive Officer of the Company since June 1993; previously Executive Vice President of the Company; Chairman of Central Valley Bank(1) from June 1994 to January 2000; Vice Chairman of Mahaska State Bank(1) since January 1996; Chairman of Pella State Bank(1) since November 1997; Chairman of MIC Financial, Inc.(1) since January 1998 | ||||||
David A. Meinert | 1991 | 2005 | 49 | |||
Executive Vice President of the Company since June 1993 and Chief Financial Officer since September 1984; President of Central Valley Bank from June 1994 to January 1997; Chairman of Central Valley Bank from January 2000; President of MIC Financial, Inc. since March 2000 | ||||||
John P. Pothoven | 1994 | 2004 | 60 | |||
President and, since January 1998, Chairman of Mahaska State Bank | ||||||
John W. N. Steddom | 1975 | 2004 | 72 | |||
Civil Engineer for the County of Keokuk, Iowa from 1988 to February 1995, Retired | ||||||
James G. Wake | 2000 | 2005 | 63 | |||
General Manager, Smith-Wake Investments, Inc., Oskaloosa, Iowa. This is an agri business involved in feed, grain, and livestock production. |
| (1) | Mahaska State Bank, Midwest Federal Savings and Loan Association of Eastern Iowa, Central Valley Bank, Pella State Bank, and MIC Financial, Inc. are subsidiaries of the Company (all located in Iowa). |
3
MANAGEMENT
Executive Officers
Name | Age | Position with the Company | ||
Charles S. Howard | 47 | Chairman, President and Chief Executive Officer | ||
David A. Meinert | 49 | Executive Vice President and Chief Financial Officer | ||
John P. Pothoven | 60 | Chairman and President of Mahaska State Bank | ||
William D. Hassel | 54 | Vice Chairman and President of Midwest Federal Savings and Loan Association of Eastern Iowa |
Charles S. Howard and David A. Meinert were elected by the Board of Directors of the Company to the positions described above for a term of one year in April 2002. John P. Pothoven and William D. Hassel were elected by their respective Board of Directors to the positions described above for a term of one year in January 2003. The responsibilities and experience of each executive officer are described below.
Charles S. Howard has been a director of the Company since 1988 and a director of Mahaska State Bank since 1993. He was elected President and Chief Executive Officer of the Company in June 1993 and elected Chairman of the Company in January 1998. Mr. Howard was elected Vice Chairman of Mahaska State Bank in January 1996. Mr. Howard served as Chairman of Central Valley Bank from June 1994 until January 2000 and has served as a director of Central Valley Bank since June 1994. He has also served as Chairman and as a director of Pella State Bank since November 1997. He has also been a director of Midwest Federal Savings and Loan Association of Eastern Iowa (Midwest Federal Savings) since October 1999. Prior thereto, he served as Executive Vice President and Chief Operating Officer of the Company. Mr. Howard was a Commercial Loan Officer of Mahaska State Bank from 1977 to 1984.
David A. Meinert, C.P.A., has been a director of the Company since 1991. He also serves as Executive Vice President and Chief Financial Officer of the Company. Mr. Meinert was elected as Chairman of Central Valley Bank in January 2000, has served as a director of Central Valley Bank since 1994, and served as President of Central Valley Bank from June 1994 to January 1997. He has also been a director of Pella State Bank since November 1997 and a director of Midwest Federal Savings since October 1999. Mr. Meinert was elected as President of MIC Financial, Inc. effective March 1, 2000. Mr. Meinert was the Auditor for Mahaska State Bank from 1978 to 1984.
John P. Pothoven has been a director of the Company since 1994 and a director of Mahaska State Bank since 1976. He has served as President and Chief Executive Officer of Mahaska State Bank since 1984 and as Chairman of Mahaska State Bank since January 1998. Mr. Pothoven joined Mahaska State Bank in 1976 as a Vice President and was promoted to Executive Vice President in 1978. Before joining the Bank, Mr. Pothoven worked in the Correspondent Department of Merchants National Bank, Cedar Rapids, Iowa.
William D. Hassel has been a director of the Company since 1999 and a director of Midwest Federal Savings since 1985. He has served as President and Chief Executive Officer of Midwest Federal Savings since 1989, and he was elected Vice Chairman of Midwest Federal Savings in April 2000. Mr. Hassel joined Midwest Federal Savings in 1972 as Comptroller, before being promoted to Treasurer in 1974 and to Chief Financial Officer in 1983. Mr. Hassel was President and Chief Executive Officer of Midwest Bancshares, Inc. since its organization in 1992 until its merger with the Company in September 1999.
Directors
Information about directors who are not executive officers is shown in the table set forth on page 3.
4
Director and Committee Meetings
Twelve regularly scheduled meetings and three special meetings of the Board of Directors of the Company were held during 2002. Each director attended at least 75 percent of the Board meetings and any meetings of committees on which he served. The Company has an Audit Committee and a Compensation Committee. The Company does not have a Nominating Committee.
For a description of the Compensation Committee, see “REPORT ON EXECUTIVE COMPENSATION FOR MAHASKA INVESTMENT COMPANY.” For a description of the Audit Committee, see “REPORT OF THE AUDIT COMMITTEE OF THE BOARD OF DIRECTORS.”
Directors’ Compensation
Non-employee directors of the Company are paid an annual retainer of $2,500, payable quarterly in advance, plus a fee for meetings attended. From January 1 through March 31, 2002, all directors were paid $300 per regular meeting and $50 per special meeting for directors’ meetings attended. From April 1 through December 31, 2002, all directors were paid $350 per regular and special meeting for directors’ meetings attended. In addition, each non-employee director is paid $50 per meeting for committee meetings attended. Beginning January 1, 2003, no inside directors are paid directors’ fees. After one year of service as a director, non-employee directors are also entitled to annual option grants under the Company’s 1998 Stock Incentive Plan pursuant to a formula based on the financial performance of the Company for the fiscal year. On April 30, 2002, each non-employee director of Mahaska Investment Company and its subsidiaries was granted a non-qualified stock option for 1,212 shares at an option price of $13.86 per share. The number of shares to be awarded pursuant to non-qualified stock options for non-employee directors is determined by dividing the fair market value (the bid price) of the underlying shares on the date of grant of the options into five percent of the pre-tax profits of the Company for the previous fiscal year. The number of shares so determined is then allocated equally among the eligible non-employee directors on the date of grant of the options (the date of the Annual Meeting of Shareholders of the Company).
The Company offers the option to the directors to defer receipt of all or a portion of the cash that would have been paid as directors’ fees. The deferred fees are invested by the Company, and the director is an unsecured general creditor of the Company. At the time the deferral election is made, the director specifies the amount of the fees to be deferred and the duration of the deferral. The deferred fees are credited with interest based upon the return on average tangible equity of the Company based upon an average of the last three fiscal years.
5
Executive Compensation
The following table sets forth information concerning the annual and long-term compensation of those persons who were at December 31, 2002, the Chairman, President, and Chief Executive Officer of the Company, the Executive Vice President and Chief Financial Officer of the Company, the Chairman and President of Mahaska State Bank, and the Vice Chairman and President of Midwest Federal Savings for the last three fiscal years ended December 31, 2002. No other executive officer was paid more than $100,000 for any such year.
Summary Compensation Table
Name and Principal Position | Year | Annual Compensation | Long-Term Compensation Awards Securities Underlying Options | All Other Compensation(2) | ||||||||||
Salary(1) | Bonus | |||||||||||||
Charles S. Howard, Chairman, President and Chief Executive Officer | 2002 2001 2000 | $
| 219,250 207,850 193,800 | $
| 31,731 21,665 12,852 | 7,000 4,000 4,000 | $
| 18,181 14,675 12,512 | (3) (3) (3) | |||||
David A. Meinert, Executive Vice President and Chief Financial Officer | 2002 2001 2000 | $
| 158,000 145,550 135,700 | $
| 24,494 15,306 9,072 | 7,000 4,000 3,750 | $
| 15,435 14,039 10,450 | (4) (4) (4) | |||||
John P. Pothoven, Chairman and President, Mahaska State Bank | 2002 2001 2000 | $
| 164,650 162,250 147,700 | $
| 26,300 0 7,500 | 5,000 4,000 3,750 | $
| 67,751 35,308 29,751 | (5) (5) (5) | |||||
William D. Hassel,(7) Vice Chairman and President, Midwest Federal Savings | 2002 2001 2000 | $
| 142,600 135,550 129,600 | $
| 14,500 13,500 5,606 | 5,000 4,000 3,750 | $
| 54,505 50,636 45,274 | (6) (6) (6) | |||||
| (1) | Amounts include director compensation of $6,100 from Mahaska Investment Company, $5,800 from Mahaska State Bank, and $3,400 from Pella State Bank for 2000, $6,150 from Mahaska Investment Company, $5,800 from Mahaska State Bank, and $3,400 from Pella State Bank for 2001, and $7,600 from Mahaska Investment Company, $7,050 from Mahaska State Bank, and $4,400 from Pella State Bank for 2002 to Charles S. Howard; $6,100 from Mahaska Investment Company and $3,600 from Pella State Bank for 2000, $6,150 from Mahaska Investment Company and $3,400 from Pella State Bank for 2001, and $7,600 from Mahaska Investment Company and $4,400 from Pella State Bank for 2002 to David A. Meinert; $6,100 from Mahaska Investment Company and $6,100 from Mahaska State Bank for 2000, $6,150 from Mahaska Investment Company and $6,100 from Mahaska State Bank for 2001, and $7,600 from Mahaska Investment Company and $7,050 from Mahaska State Bank for 2002 to John P. Pothoven; and $6,100 from Mahaska Investment Company for 2000, $5,550 from Mahaska Investment Company for 2001, and $7,600 from Mahaska Investment Company for 2002 to William D. Hassel. For 2001, David A. Meinert elected to defer $6,150 of director’s fees under the Deferred Compensation Plan for directors and John P. Pothoven elected to defer $6,100 of director’s fees under such Plan. For 2002, David A. Meinert elected to defer $7,600 of director’s fees under the Deferred Compensation Plan for directors and John P. Pothoven elected to defer $7,050 of director’s fees under such plan. |
| (2) | Amounts include Company contributions to the ESOP based upon a percentage of salary and bonus in 2000 to the accounts of Charles S. Howard, David A. Meinert, John P. Pothoven, and William D. Hassel in the amounts of $9,461, $6,678, $7,150, and $6,188, respectively; in 2001 to the accounts of Charles S. Howard, David A. Meinert, John P. Pothoven, and William D. Hassel in the amounts of $7,786, $5,500, $6,000, and $5,415, respectively; and in 2002 to the accounts of Charles S. Howard, David A. Meinert, John P. Pothoven, and William D. Hassel in the amounts of $10,454, $6,452, $6,557, and $5,740, respectively. Amounts also include Company matching contributions to the 401(k) Plan for 2001 to the accounts of Charles S. Howard, David A. Meinert, John P. Pothoven, and William D. Hassel in the amounts of $3,519, $4,372, $4,448, and $3,101, respectively, and for 2002 to the accounts of Charles S. Howard, David A. Meinert, John P. Pothoven, and William D. Hassel in the amounts of $4,004, $4,380, $4,918, and $3,375, respectively. The Company matches 50 percent of employee contributions up to a maximum employee contribution of 6 percent of compensation. |
6
| (3) | Amount includes $3,051 for 2000, $3,370 for 2001, and $3,723 for 2002 contributed by the Company to a salary continuation plan pursuant to which Charles S. Howard is to receive $29,900 per year for 15 years starting at age 65. |
| (4) | Amount includes $3,772 for 2000, $4,167 for 2001, and $4,603 for 2002 contributed by the Company to a salary continuation plan pursuant to which David A. Meinert is to receive $29,900 per year for 15 years starting at age 65. |
| (5) | Amount includes $22,601 for 2000, $24,860 for 2001, and $56,276 for 2002 contributed by the Company to a salary continuation plan pursuant to which John P. Pothoven is to receive $85,000 per year for 15 years starting at age 65. |
| (6) | Amount includes $39,086 for 2000, $42,120 for 2001, and $45,390 for 2002 contributed by the Company to a salary continuation plan pursuant to which William D. Hassel is to receive $50,000 per year for 10 years starting at age 65. |
| (7) | William D. Hassel participated in a defined benefit pension plan maintained by Midwest Federal Savings prior to the merger of Midwest Federal Savings into the Company on September 30, 1999. The pension plan was frozen upon completion of the merger and no additional contributions to the plan will be made by the Company. Mr. Hassel will receive benefits at the time and in the amount as provided by the plan. |
Stock Options
The following table sets forth information concerning the grant of stock options under the Company’s 1998 Stock Incentive Plan during the last fiscal year.
Option Grants in Last Fiscal Year
Individual Grants | Potential Realizable Value at Assumed Annual Rates of Stock Price Appreciation for Option Term(1) | |||||||||||||||
Number of Shares Underlying Options Granted | % of Total Options Granted to Employees in Fiscal Year | Exercise Price ($/Sh) | Expiration Date | |||||||||||||
Name | 5% | 10% | ||||||||||||||
Charles S. Howard | 7,000 | 7.82 | % | $ | 16.01 | 12/31/12 | $ | 70,480 | $ | 178,611 | ||||||
David A. Meinert | 7,000 | 7.82 | % | $ | 16.01 | 12/31/12 | $ | 70,480 | $ | 178,611 | ||||||
John P. Pothoven | 5,000 | 5.59 | % | $ | 16.01 | 12/31/12 | $ | 50,343 | $ | 127,579 | ||||||
William D. Hassel | 5,000 | 5.59 | % | $ | 16.01 | 12/31/12 | $ | 50,343 | $ | 127,579 | ||||||
| (1) | The amounts set forth represent the value that would be received by the Named Executive Officers upon exercise of the option on the date before the expiration date of the option based upon assumed annual growth rates in the market value of the Company’s shares of 5 percent and 10 percent, rates prescribed by applicable SEC rules. Actual gains, if any, on stock option exercises are dependent on the future performance of the Company’s shares and other factors such as the general condition of the stock market and the timing of the exercise of the options. |
Aggregated Option Exercises In Last Fiscal Year
And Fiscal Year-End Option Values
Name | Shares Acquired on Exercise | Value Realized | Number of Unexercised Options at FY-End(#) Exercisable/Unexercisable | Value of Unexercised In-The-Money Options at FY-End($) Exercisable/Unexercisable | ||||||
Charles S. Howard | 50,958 | $ | 203,259 | 24,952/11,040 | $ | 36,465/$23,140 | ||||
David A. Meinert | 0 |
| 0 | 67,996/10,955 | $ | 335,131/$22,491 | ||||
John P. Pothoven | 0 |
| 0 | 36,640/ 8,955 | $ | 139,053/$22,491 | ||||
William D. Hassel | 0 |
| 0 | 3,795/ 8,955 | $ | 25,180/$22,491 | ||||
7
Employment Contracts
Midwest Federal Savings had entered into an employment agreement with William D. Hassel prior to the merger of Midwest Federal Savings into the Company on September 30, 1999. The previous employment agreement was terminated upon the effective date of the merger, and a new employment agreement was entered into between Midwest Federal Savings and Mr. Hassel. The employment agreement is designed to assist Midwest Federal Savings to maintain a stable and competent management base. The continued success of Midwest Federal Savings depends to a significant degree on the skills and competence of its officers. The employment agreement provides for an annual base salary in an amount not less than the employee’s salary on the date of execution and an initial term of three years. The agreement provides for a one-year extension on each anniversary date, subject to review and approval of the extension by the Board members of Midwest Federal Savings following the Board’s review of a formal performance evaluation of Mr. Hassel by the disinterested members of the Board. The agreement provides for termination upon the employee’s death, for cause, or in certain events specified by the Office of Thrift Supervision regulations. The employment agreement provides for payment to the employee of up to 299% of the employee’s then-current annual compensation in the event there is a change in control of the Company where employment terminates involuntarily in connection with such change in control or within twelve months thereafter. This termination payment is subject to reduction by the amount of all other compensation to the employee deemed for purposes of the Internal Revenue Code to be contingent on a change in control. Such termination payment is provided on a similar basis in connection with a voluntary termination of employment, where the change in control was at any time opposed by the Board of Directors of the Company. For the purposes of the employment agreement, a change in control is defined to mean any acquisition of control as defined in 12 C.F.R. Section 574.4. The employment agreement provides, among other things, for participation in an equitable manner in employee benefits applicable to executive personnel of the Company.
REPORT ON EXECUTIVE COMPENSATION FOR MAHASKA INVESTMENT COMPANY
Compensation Committee Interlocks and Insider Participation
The Compensation Committee of the Board of Directors of the Company reviews and approves the Company’s executive compensation policies and evaluates the performance of the executive officers. The Compensation Committee consists of Richard R. Donohue, John W. N. Steddom, James G. Wake, Michael R. Welter, and Edward C. Whitham. All members of the Committee attended the one meeting held during the fiscal year. All members of the Compensation Committee are outside directors and there are no Compensation Committee interlocks.
Compensation Philosophy
The philosophy of the Compensation Committee in setting its compensation policies for executive officers is to maximize stockholder value over time. The Compensation Committee believes that executive compensation should be directly linked to continuous improvements in corporate performance and increases in stockholder value. In this regard, the Compensation Committee has adopted the following guidelines for compensation decisions:
| • | Provide a competitive total compensation package that enables the Company to attract and retain key executive talent. |
| • | Align executive compensation programs with the Company’s annual and long-term business strategies and objectives. |
| • | Provide variable compensation opportunities that are directly linked to the performance of the Company and the performance of the individual employee. |
8
The Compensation Committee focuses primarily on the following three components in forming the total compensation package for its executive officers:
| • | Base salary |
| • | Annual incentive bonus |
| • | Long-term incentives |
Base Salary
The Compensation Committee intends to compensate the executive officers competitively within the industry. In order to evaluate the Company’s competitive posture in the industry, the Compensation Committee reviews and analyzes the compensation packages, including base salary levels, offered by its peer group. In addition, the Compensation Committee, together with the Board of Directors, subjectively evaluates the level of performance of each executive officer in order to determine current and future appropriate base pay levels.
The Compensation Committee reviewed the compensation of the President and Executive Vice President and recommended an increase of 4.5 percent in the base salary of the President and an increase of 6.5 percent in the base salary of the Executive Vice President. The recommendations for the President and Executive Vice President were based upon peer review data, levels of responsibility, breadth of knowledge, prior experience, management recommendations for other employees, cost of living, and performance.
Management of the Company previously decided that effective for the fiscal year commencing January 1, 2003, no “inside directors” would be paid fees for attendance at board meetings of the parent company or any subsidiary. The Compensation Committee considered a one-time salary increase adjustment for each inside director in the amount of the income reduction that would otherwise have occurred through the loss of Board fee income. Because of the action taken by management, the Compensation Committee recommended that Charles S. Howard be awarded $17,800 of additional annual salary to cover his previous director’s fees. The Committee also recommended that David A. Meinert be awarded $11,100 of additional annual salary to cover his previous director’s fees. The total salary of Mr. Howard will be $227,000, and the total salary for Mr. Meinert will be $166,600 for 2003.
Annual Incentive Bonus
The Company uses a “Performance Compensation Plan” (the “Plan”) for employees of the Company and its subsidiaries. The Plan is designed to assist the Board of Directors and management in communicating to the employees the goal of profitable growth.
Each employee participating in the Plan is eligible to be considered to receive an annual bonus based upon pre-tax profits. At the bank subsidiary level, the Plan focuses on pre-tax profits at the individual bank plus the overall profitability of the Company. At the holding company level, the Plan focuses on consolidated budgeted pre-tax profits for the holding company. For the employees of the holding company, the Plan provides that a bonus pool will be created in the amount of 2 percent of the consolidated budgeted pre-tax profits for the Company. The size of the pool is then adjusted by a formula upward or downward depending upon how actual profits compared to budget. The amount of the pool is then allocated among three groups. The President and the Executive Vice President receive an aggregate of 25 percent of the pool. Additionally, the Board of Directors retains the discretion to deviate from the Plan if warranted. The Compensation Committee recommended payment of the annual incentive bonus to the President and Executive Vice President pursuant to the Plan formula. The Committee also recommended that the President and Executive Vice President each be awarded an additional $5,000 of the discretionary pool.
9
Long-term Incentives
The Company provides its executive officers with long-term incentive compensation through grants of stock options. The Compensation Committee is responsible for determining the individuals to whom grants should be made, the timing of grants, the exercise price per share, and the number of shares subject to each option. Other than the stock options, the Compensation Committee made no other long-term performance awards during the last fiscal year. The stock option grants are discretionary grants by the Compensation Committee. The Compensation Committee takes into consideration the profits of the Company during the most recent fiscal year, the profit trend line of the Company, the position of the employee, peer review of similar companies, and the total compensation package of the eligible employees in determining the amount of the grants.
The Compensation Committee believes that stock options provide the Company’s executive officers with the opportunity to purchase and maintain an equity interest in the Company and to share in the appreciation of the value of the stock. The Compensation Committee believes that stock options directly motivate an executive to maximize long-term stockholder value and help align the focus of the executive officers with the interests of the shareholders. The options also utilize vesting periods in order to encourage key employees to continue in the employ of the Company. All options to executive officers to date have been granted at the fair market value of the Company’s common stock determined on the basis of the bid price of the stock. All options for 2002 were granted at the bid price of the stock on December 31, 2002. The amount of the stock option awards is reflected in the compensation table for the executive officers.
Summary
The Compensation Committee believes that its executive compensation philosophy of paying its executive officers well by means of competitive base salaries, annual bonuses, and long-term incentives, as described in this report, serves the interests of the Company and the Company’s stockholders.
Richard R. Donohue
John W. N. Steddom
James G. Wake
Michael R. Welter
Edward C. Whitham
10
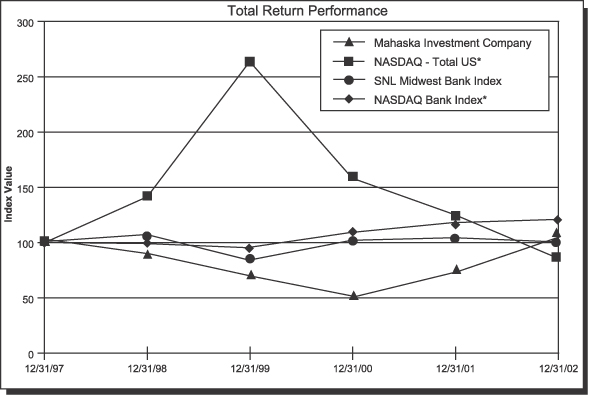
Financial Performance
The following graph illustrates the cumulative total return (assuming the reinvestment of dividends) experienced by the Company’s shareholders since December 31, 1997, through December 31, 2002, compared to the SNL Index comprised of Midwestern bank holding companies, NASDAQ Bank Index, and the performance of all NASDAQ US stocks.
MAHASKA INVESTMENT COMPANY
Stock Price Performance
Period Ending | ||||||||||||
Index | 12/31/97 | 12/31/98 | 12/31/99 | 12/31/00 | 12/31/01 | 12/31/02 | ||||||
Mahaska Investment Company | 100.00 | 87.28 | 67.32 | 49.24 | 71.61 | 102.70 | ||||||
NASDAQ—Total US* | 100.00 | 140.99 | 261.48 | 157.42 | 124.89 | 86.33 | ||||||
SNL Midwest Bank Index | 100.00 | 106.37 | 83.57 | 101.20 | 103.43 | 99.77 | ||||||
NASDAQ Bank Index* | 100.00 | 99.36 | 95.51 | 108.95 | 117.97 | 120.61 | ||||||
| * | Source: CRSP, Center for Research in Security Prices, Graduate School of Business, The University of Chicago 2003. Used with permission. All rights reserved. crsp.com. |
11
Loans to Officers and Directors and Other Transactions With Officers and Directors
During 2002, Mahaska State Bank, Midwest Federal Savings, Central Valley Bank, and Pella State Bank made loans or loan commitments, in the ordinary course of business, to directors and officers of the Company and to corporations or partnerships with which one or more of the officers or directors of the Company were associated. In the opinion of management of the Company, all such loans and loan commitments were made on substantially the same terms, including interest rates and collateral, as those prevailing at the time for comparable transactions with other persons, and did not involve more than the normal risk of collectibility or present other unfavorable features.
Ownership of Securities by Certain Beneficial Owners
The following table sets forth certain information as of February 25, 2003, with respect to the Common Stock beneficially owned by each director of the Company, by all executive officers and directors as a group and by each shareholder known by the Company to be the beneficial owner of more than five percent of the Common Stock.
Name | Amount and Nature of Beneficial Ownership(1) | Percent of Class(1) | |||
Mahaska Investment Company Employee Stock Ownership Plan (ESOP)(2)(3) | 555,113 | 14.2 | % | ||
Richard R. Donohue(4) | 2,175 | * |
| ||
William D. Hassel(5) | 50,378 | 1.3 | % | ||
Charles S. Howard(6) | 277,902 | 7.1 | % | ||
David A. Meinert(7) | 107,902 | 2.7 | % | ||
John P. Pothoven(8) | 100,296 | 2.5 | % | ||
John W. N. Steddom(9) | 58,325 | 1.5 | % | ||
James G. Wake(10) | 10,657 | * |
| ||
Michael R. Welter(11) | 5,221 | * |
| ||
Edward C. Whitham(12) | 1,640 | * |
| ||
Executive Officers and Directors as a group (9 persons)(13) | 614,495 | 15.1 | % |
| * | Less than 1%. |
| (1) | Except as described in the following notes, each person or group owns the shares directly and has sole voting and investment power with respect to such shares. The shares listed include shares subject to options exercisable within sixty days of February 25, 2003. |
| (2) | The Company’s ESOP holds shares of the Company’s Common Stock pursuant to the terms of the ESOP. The Trustee of the ESOP, the Trust Department of Mahaska State Bank, has the power to dispose of ESOP shares in accordance with the terms of the ESOP and votes any unallocated ESOP shares at the direction of the Committee acting as ESOP Administrators. The ESOP Administrators are Thomas W. Campbell, President of Central Valley Bank, Robert D. Maschmann, Executive Vice President and Treasurer of Midwest Federal Savings, Michael T. Patrick, President of Pella State Bank, David A. Meinert, and John P. Pothoven. Shares allocated to participants’ accounts are voted by the respective participants. Shares not voted by a participant will be voted by the Trustee in the same proportion as the shares for which signed proxy cards are returned by the other participants in the ESOP. The Trustee disclaims beneficial ownership of all of the shares, and the ESOP Administrators disclaim beneficial ownership of all shares other than those allocated to their respective accounts held by the ESOP. The amount of beneficial ownership shown for the ESOP includes those shares allocated to accounts of directors and executive officers of the Company, which shares are also reflected in the individual’s respective beneficial ownership as indicated in the footnotes below. |
| (3) | The address of the ESOP Administrators is 222 First Avenue East, Oskaloosa, IA 52577. |
| (4) | Such shares include 1,616 shares owned by his spouse and 19 shares held by a partnership. |
12
| (5) | Such shares include 9,000 shares owned jointly with his spouse, 75 shares owned jointly with his daughter, 1,878 shares held in his spouse’s IRA, 1,696 shares held in a Keogh, 7,800 shares held in his spouse’s profit sharing plan, 3,795 shares subject to currently exercisable options, and 18,759 shares allocated to his ESOP account. |
| (6) | Such shares include 51,539 shares owned by his spouse, 3,337 shares owned jointly with his spouse, a total of 2,193 shares owned as custodian for his two minor children, 57,503 shares in Howard Partners, L.P., in which Mr. Howard is a one-third partner, 24,952 shares subject to currently exercisable options, 23,232 shares allocated to his spouse’s ESOP account, and 33,778 shares allocated to his ESOP account. |
| (7) | Such shares include 7,596 shares owned jointly with his spouse, a total of 532 shares owned as custodian for his two minor children, 67,996 shares subject to currently exercisable options, and 31,778 shares allocated to his ESOP account. Excludes the remaining 523,335 ESOP shares with respect to which Mr. Meinert shares dispositive power as an ESOP Administrator. |
| (8) | Such shares include 4,117 shares held in an IRA, 36,640 shares subject to currently exercisable options, and 39,444 shares allocated to his ESOP account. Excludes the remaining 515,669 ESOP shares with respect to which Mr. Pothoven shares dispositive power as an ESOP Administrator. |
| (9) | Such shares include 600 shares held in his spouse’s IRA and 10,289 shares subject to currently exercisable options. |
| (10) | Such shares include 223 shares owned by his spouse, 1,380 shares owned by a corporation of which Mr. Wake has control, and 8,705 shares subject to currently exercisable options. |
| (11) | Such shares include 655 shares held in an IRA, 500 shares owned by a corporation of which Mr. Welter has control, and 4,066 shares subject to currently exercisable options. |
| (12) | Such shares include 500 shares held in a profit sharing plan, 395 shares held in his spouse’s IRA, 95 shares held in his spouse’s profit sharing plan, and 110 shares held in spouse’s money purchase pension plan. |
| (13) | Such shares include a total of 146,991 ESOP shares allocated to the accounts of directors and executive officers and a total of 156,443 shares subject to currently exercisable options. |
13
PROPOSAL 2
The Board of Directors of the Company at its meeting held on January 23, 2003 approved the amendment of the Articles of Incorporation of the Company to change the name of the Company from “Mahaska Investment Company” to “MidWestOneFinancial Group, Inc.” The Board of Directors recommends that the shareholders voteFOR such amendment.
The Company is presently doing business in a much broader service area than at the time the original name was selected. Approval of the name change will facilitate the growth of the Company as it continues to expand into new markets and introduce new products. The Company will be better positioned for growth in its markets if it has a name applicable to a broader geographical region and potential customer base.
Representation of a majority of the outstanding shares of the Company constitutes a quorum for action on this Proposal at the Annual Meeting. If a quorum exists, action on this Proposal is approved if the votes cast for the proposal exceed the votes cast against the Proposal.
The text of the Articles of Amendment would be in substantially the form attached hereto as Appendix A; except that the text of the form may be altered for any changes required by the Secretary of State of the State of Iowa and changes deemed necessary or advisable by the Board of Directors.
PROPOSAL 3
Ratification Of Auditors’ Appointment
The Board of Directors of the Company, at the recommendation of the Audit Committee, has approved the accounting firm of KPMG LLP, independent certified public accountants, as the principal accountant for the Company to conduct the audit examination of the Company and its subsidiaries for the 2003 fiscal year. KPMG LLP was also the principal accountant and performed the audit for the 2002 fiscal year.
A representative from KPMG LLP is anticipated to be present at the Annual Meeting of Shareholders. He will have the opportunity to make a statement if he desires to do so and is expected to be available to respond to appropriate questions from shareholders.
The Board recommends that shareholders vote FOR the ratification of the appointment of KPMG LLP as independent auditors for the 2003 fiscal year. In the absence of instructions to the contrary, proxies solicited by the Board of Directors will be voted FOR ratification of the appointment of KPMG LLP as independent auditors.
14
Independent Public Accountants
Audit Fees:
The aggregate fees billed for professional services rendered for the audit of the Company’s annual financial statements for the 2002 fiscal year and the reviews of the financial statements included in the Company’s Forms 10-Q for that fiscal year were $102,900.
Financial Information Systems Design and Implementation Fees:
There were no fees billed by KPMG LLP for professional services for financial information systems design and implementation for the 2002 fiscal year.
All Other Fees:
The aggregate fees billed for services rendered by KPMG LLP other than the services covered in the preceding two paragraphs for the 2002 fiscal year were $108,161. Of this amount, $42,000 was for tax return preparation and review, $4,600 was for an audit of the December 31, 2001 Mahaska Investment Company Employee Stock Ownership Plan and Trust, $4,600 was for an audit of the December 31, 2001 Mahaska Investment Company 401(k) Plan, and $56,961 was for professional services in regard to a profit improvement and advisory assistance project for Mahaska Investment Company.
Independence:
The Audit Committee has determined that the fees charged under the preceding two sections of this section are compatible with the maintenance of the independence of KPMG LLP.
15
REPORT OF THE AUDIT COMMITTEE OF THE BOARD OF DIRECTORS
The Audit Committee of the Board of Directors of the Company serves as the representative of the Board for general oversight of the Company’s financial accounting and reporting process, systems of internal controls regarding finance, accounting and legal compliance and monitoring the independence and performance of the Company’s independent auditors and internal auditing department. The Company’s management has primary responsibility for preparing the Company’s financial statements and the Company’s financial reporting process. The Company’s independent accountants, KPMG LLP, are responsible for expressing an opinion on the conformity of the Company’s audited financial statements to generally accepted accounting principles.
The Board adopted a written Charter for the Audit Committee, which was filed as an attachment to the Proxy for the annual meeting held in April 2001. The Audit Committee met eight times during the 2002 fiscal year.
As part of its responsibilities, the Audit Committee hereby reports as follows:
| 1. | The Audit Committee has reviewed and discussed the audited financial statements with the Company’s management. |
| 2. | The Audit Committee has discussed with the independent auditors the matters required to be discussed by SAS 61 (Codification of Statements on Auditing Standards, AU 380). |
| 3. | The Audit Committee has received the written disclosures and the letter from the independent accountants required by Independence Standards Board Standard No. 1 (Independence Standards Board Standard No. 1, Independence Discussions With Audit Committees) and has discussed with the independent accountants the independent accountants’ independence. |
| 4. | Based on the review and discussions referred to in paragraphs 1 through 3 above, the Audit Committee recommended to the Board of Directors of the Company, and the Board has approved, that the audited financial statements be included in the Company’s annual report on Form 10-K for the fiscal year ended December 31, 2002, for filing with the Securities and Exchange Commission. |
Each of the members of the Audit Committee is independent as defined under the listing standards of the NASD/AMEX exchange.
The undersigned members of the Audit Committee have submitted this Report.
Richard R. Donohue
Michael R. Welter
Edward C. Whitham
16
GENERAL MATTERS
Financial Statements
The Company’s 2002 Annual Report to Shareholders has accompanied the mailing of this Proxy Statement.
The Company will provide without charge to each shareholder solicited, upon the written request of any such shareholder, a copy of its annual report on Form 10-K as filed with the Securities and Exchange Commission, including the financial statements, for the fiscal year ended December 31, 2002. Such written request should be directed to Karen K. Binns, Secretary/Treasurer, Mahaska Investment Company, P. O. Box 1104, Oskaloosa, Iowa 52577-1104. It is also available on the Securities and Exchange Commission’s Internet web site at http://www.sec.gov/cgi-bin/srch-edgar.
Section 16(a) Beneficial Ownership Reporting Compliance
Section 16(a) of the Securities Exchange Act of 1934 requires that the Company’s directors and executive officers and persons who own more than 10 percent of the Company’s Common Stock file initial reports of ownership and reports of changes of ownership with the Securities and Exchange Commission and Nasdaq. Specific due dates for these reports have been established, and the Company is required to disclose in its Proxy Statement any failure to file by these dates during the Company’s 2002 fiscal year.
All the applicable filing requirements were satisfied by the officers, directors and 10 percent owners during 2002. In making this statement, the Company is relying upon written representations of its incumbent officers, directors, and 10 percent owners and copies of applicable reports furnished to the Company.
Shareholder Proposals
In order for any proposals of shareholders pursuant to the procedures prescribed in Rule 14a-8 under the Securities Exchange Act of 1934 to be presented as an item of business at the Annual Meeting of Shareholders of the Company to be held in 2004, the proposal must be received at the Company’s principal executive offices no later than November 25, 2003. A shareholder proposal submitted outside the procedures prescribed in Rule 14a-8 shall be considered untimely unless received no later than February 7, 2004.
Other Matters
Management does not know of any other matters to be presented at the meeting, but should other matters properly come before the meeting, the proxies will vote on such matters in accordance with their best judgment.
By Order of the Board of Directors
Karen K. Binns, Secretary
March 24, 2003
17
APPENDIX A
ARTICLES OF AMENDMENT
to the
Articles of Incorporation
of
MAHASKA INVESTMENT COMPANY
TO THE SECRETARY OF STATE OF THE STATE OF IOWA:
Pursuant to Section 1003 or 1006 of the Iowa Business Corporation Act, the undersigned corporation adopts the following amendment to the Corporation’s Articles of Incorporation.
| 1. | The name of the corporation is Mahaska Investment Company. |
| 2. | The corporation’s Articles of Incorporation filed on February 14, 1973, as previously amended on September 21, 1973, May 15, 1994, May 20, 1996 and May 26, 1998, shall be amended as follows: |
| “The | name of the corporation is MidWestOne Financial Group, Inc.” |
| 3. | The date of adoption of the amendment was April 30, 2003. |
| 4. | The amendment was approved by the shareholders at the Annual Meeting pursuant to notice. The designation, number of outstanding shares, number of votes entitled to be cast by each voting group entitled to vote separately on the amendment, and the number of votes of each voting group indisputably represented at the meeting is as follows: |
DESIGNATION OF GROUP | SHARES OUTSTANDING | VOTES ENTITLED TO BE CAST ON AMENDMENT | VOTES REPRESENTED AT MEETING | |||
Common Stock | 3,933,563 | 3,933,563 |
| 5. | The total number of votes cast for and against the amendment by each voting group entitled to vote separately on the amendment is as follows: |
VOTING GROUP | VOTES FOR | VOTES AGAINST | ||
Common Stock |
The number of votes cast for the amendment by each voting group was sufficient for approval by that voting group.
The effective date and time of this document shall be the time of filing on the date of filing.
MAHASKA INVESTMENT COMPANY | ||
By: | ||
MAHASKA INVESTMENT COMPANY
APPENDIX TO THE PROXY STATEMENT
FISCAL YEAR 2002
Contents
Management’s Discussion and Analysis | A-1 | |
Consolidated Balance Sheets | F-1 | |
Consolidated Statements of Income | F-2 | |
Consolidated Statements of Changes in Shareholders’ Equity and Comprehensive Income | F-3 | |
Consolidated Statements of Cash Flows | F-4 | |
Notes to Consolidated Financial Statements | F-5 | |
Independent Auditors’ Report | F-27 |
MAHASKA INVESTMENT COMPANY
MANAGEMENT’S DISCUSSION & ANALYSIS OF
RESULTS OF OPERATIONS AND FINANCIAL CONDITION
The following discussion and analysis is intended as a review of significant factors affecting the financial condition and results of operation of Mahaska Investment Company and subsidiaries (the “Company”) for the periods indicated. The discussion should be read in conjunction with the consolidated financial statements and the notes thereto. In addition to historical information, this discussion and analysis contains forward-looking statements that involve risks and uncertainties. The Company’s actual results could differ significantly from those anticipated in these forward-looking statements.
Overview
The Company’s principal business is conducted by its subsidiary banks and consists of full service community-based commercial and retail banking. Additionally, the Company derives a substantial portion of its operating revenue from its investments in pools of performing and nonperforming loans referred to as loan pool participations. The profitability of the Company depends primarily on its net interest income, provision for loan losses, other income, and operating expenses.
Net interest income is the difference between total interest income and total interest expense. Interest income is earned by the Company on its loans made to customers, the investment securities it holds in its portfolio, and the interest and discount recovery generated from its loan pool participations. The interest expense incurred by the Company results from the interest paid on customer deposits and borrowed funds. Fluctuations in net interest income can result from the changes in volumes of assets and liabilities as well as changes in market interest rates. The provision for loan losses reflects the cost of credit risk in the Company’s loan portfolio and is dependent on increases in the loan portfolio and management’s assessment of the collectibility of the loan portfolio under current economic conditions. Other income consists of service charges on deposit accounts, fees received for data processing services provided to nonaffiliated banks, other fees and commissions, and security gains or losses. Operating expenses include salaries and employee benefits, occupancy and equipment expenses, other noninterest expenses, and the amortization of goodwill and other intangible assets. These operating expenses are significantly influenced by the growth of operations, with additional employees necessary to staff new banking centers.
Performance Summary
For the year ended December 31, 2002, the Company recorded net income of $5,789,000, or $1.49 per share basic and $1.46 per share diluted. This compares with $4,356,000, or $1.10 per share basic and $1.09 per share diluted, for the year ended December 31, 2001. Net income increased $1,433,000, or 33 percent, in 2002 due to an increase in net interest income, lower loan loss provision and the discontinuation of the amortization of goodwill, which resulted in a decrease in operating expenses in 2002 compared with 2001. For comparison purposes, if the Company had not amortized goodwill in 2001, basic earnings per share would have been $1.24 and diluted earnings per share would have been $1.23.
Total assets of the Company decreased 1 percent to a year-end 2002 total of $537,782,000 compared with a 2001 year-end total of $545,795,000 reflecting a decline in loan and loan pool volumes. The Company’s total loans outstanding decreased 5 percent in 2002 to $306,024,000 at December 31, 2002. Loan demand slowed reflecting local and national economic conditions. Loan refinancing by customers to take advantage of the low interest rate environment also contributed to the reduction in loan volumes. Loan pool participations as of December 31, 2002 totaled $82,341,000, a decrease of 25 percent from the year-end 2001 balance of $110,393,000. Throughout 2002, the Company encountered limited opportunities to acquire loan pool participations. Paydown by borrowers to take advantage of the lower interest rates available in the market also
A-1
influenced the loan pool volume. Investment securities increased as U.S. Agency and corporate bonds were purchased with the excess funds. Given the reduced loan demand and the lower loan pool participation volumes, the Company did not emphasize balance sheet growth during 2002. Deposits increased 4 percent to $395,546,000 as of December 31, 2002. The increase in deposits and the reduced loan and loan pool volumes enabled the Company to reduce borrowed funds.
Return on average assets is a measure of profitability that indicates how effectively a financial institution utilizes its assets. It is calculated by dividing net income by average total assets. The Company’s return on average assets was 1.07 percent for 2002, .82 percent for 2001, and .81 percent for 2000. The increase in 2002 net income significantly improved the return on average assets. The .82 percent return on average assets in 2001 was not materially greater than the .81 percent for 2000 since the percentage increase in net income was not proportionately higher than the increase in average assets for the year. Return on average equity indicates what the Company earned on its shareholders’ investment and is calculated by dividing net income by average total shareholders’ equity. The return on average equity for the Company was 10.91 percent for 2002, 8.59 percent for 2001, and 8.18 percent for 2000. The increased return on average equity for 2002 compared to 2001 is attributable to the higher earnings. The increase in 2001 compared to 2000 was due to higher earnings in 2001.
Acquisition of Belle Plaine Service Corp.
On October 4, 2002, the Company announced that it had entered into an agreement to acquire 100 percent of the outstanding shares of the Belle Plaine Service Corp. (“BPSC”) for cash. BPSC is the holding company for Citizens Bank & Trust of Hudson, Iowa, with offices in Belle Plaine and Waterloo. As of December 31, 2002, Citizens Bank & Trust had total assets of $75,267,000, loans totaling $61,973,000, and deposits of $64,344,000. The transaction subsequently closed effective February 1, 2003. The Company’s financial statements for December 31, 2002 do not reflect the balances of BPSC as of that date. The Company’s results of operation for the year ended December 31, 2002 also do not include any income or expense related to BPSC.
Results of Operations
2002 compared to 2001
Net Interest Income. Net interest income is the total of interest income less interest expense. Net interest income increased $1,835,000 or 10 percent in 2002 to $20,513,000 compared with $18,678,000 in 2001. Net interest margin is a measurement of the net return on interest-earning assets and is computed by dividing net interest income for the year by the annual average balance of all interest-earning assets. The net interest margin on a tax-equivalent basis for 2002 was 4.10 percent compared with 3.84 percent for 2001. The higher net interest margin was attributable to the increase in net interest income. Overall, interest expense decreased more than interest income, thus improving the net interest margin in 2002.
Total interest income for 2002 was $37,540,000 compared with $40,105,000 for 2001. The 6 percent decrease of $2,565,000 was due primarily to lower interest rates. Interest income and fees on loans were $2,327,000 or 9 percent lower in 2002 primarily attributable to the decline in local and national market interest rates compared with 2001. The average yield on the Company’s loan portfolio was 7.30 percent for 2002 versus 7.96 percent in 2001. The average volume of loans outstanding for the year was $2,992,000 or 1 percent lower for 2002 in comparison to 2001 reflecting softer loan demand and the refinancing activity by customers to avail themselves of lower long-term rates. Loans outstanding averaged $313,041,000 in 2002 compared with $316,033,000 for 2001. The decrease in average loans outstanding for 2002 also contributed to the reduction in interest income compared with 2001. Interest and discount on loan pools was 5 percent or $463,000 greater in 2002 due to a higher average balance throughout the year. The average yield on loan pools declined to 10.60 percent in 2002 from 10.91 percent in 2001 following the decrease in the interest rate environment. The average loan pool balance for 2002 was $94,861,000 compared with $87,970,000 in 2001. The balance declined throughout the year as payments were received. Interest on bank deposits decreased $34,000 or 62 percent in
A-2
2002 due to lower market interest rates. Interest income on investment securities was $530,000 or 11 percent lower in 2002 even though the average balance was $7,016,000 higher. The decline in market rates offset the increase in interest income related to the higher balance. The average tax-equivalent yield on the investment portfolio declined to 5.37 percent for 2002 compared with 6.55 percent in 2001 as maturing securities were reinvested and new securities were purchased at lower market rates. Interest income from federal funds sold was $137,000 or 55 percent less in 2002 mainly due to the lower market interest rates. The overall yield on earning assets was 7.45 percent in 2002 compared with 8.17 percent for 2001. Average total earning assets were $12,103,000 higher in 2002 compared with 2001.
A significant decrease in interest expense for 2002 contributed to the Company’s improved profitability for the year. Total interest expense was $4,400,000 or 21 percent lower in 2002 reflecting the market interest rate decline. Interest expense on deposits was $3,834,000 or 25 percent lower in 2002. The average rate paid on interest-bearing deposits decreased to 3.21 percent for 2002 compared with 4.36 percent in 2001. Average interest-bearing deposits were $6,786,000 greater in 2002 compared with 2001. Many of the Company’s certificate of deposit customers have opted for shorter maturity certificates of deposit. In the event that market interest rates do start to move higher, these certificates will reprice more quickly at the higher rate and may increase the cost of deposits in future periods. Interest expense on immediately-repriceable deposits such as NOW, savings and money market accounts could also increase in the event rates move upward. The Federal Home Loan Bank advances utilized by the Company are at fixed rates that do not reprice prior to maturity. The average rate on Federal Home Loan Bank advances declined to 5.74 percent in 2002 from 6.28 percent in 2001 as advances with higher rates matured. Interest expense on other borrowed funds such as federal funds purchased and notes payable decreased in 2002 mainly as a result of the lower interest rate environment. The overall rate on paying liabilities for 2002 was 3.72 percent for 2002 compared with 4.77 percent in 2001.
Provision For Loan Losses. The provision for loan losses recorded by the Company for 2002 was $1,070,000, a decrease of $706,000 compared with the provision of $1,776,000 for 2001. Management determines an appropriate provision based on its evaluation of the adequacy of the allowance for loan losses in relationship to a continuing review of current collection risks within its loan portfolio, identified problem loans, the current local and national economic conditions, actual loss experience, regulatory policies, and industry trends. During 2001, the Company charged off one large line of credit totaling $1,000,000. This level of charge-offs did not reoccur in 2002, which allowed the provision to be reduced. The remainder of the 2002 provision for loan losses was determined to be necessary due to additional loan charge-offs and general uncertainties in the local and national economy.
Other Income. Other income increased $518,000 or 16 percent in 2002 to $3,787,000. This compares with other income of $3,269,000 for 2001, excluding security gains. The Company realized $1,018,000 from security gains in 2001. No security gains were realized in 2002. The increase in other income in 2002 was due to an increase in service charges and data processing fees. Other operating income was $429,000 or 45 percent greater mainly due to origination fees on commercial loans that were sold to other participating banks and on secondary market real estate loan origination fees. Much of the secondary market loan activity was the result of customers refinancing real estate loans to take advantage of lower market interest rates. Depending on future interest rates, the level of refinancing activity may change.
Other Expense. Noninterest expense totaled $14,426,000 for 2002 compared with $14,467,000 for 2001. Effective January 1, 2002, the Company ceased the amortization of goodwill in accordance with the provisions of Financial Accounting Standards Board Statements No. 142 and 147. Goodwill amortization included in the Company’s noninterest expense for 2001 totaled $699,000. Excluding goodwill amortization, noninterest expense for 2001 was $13,768,000. The Company’s noninterest expense for 2002 increased $658,000 or 5 percent when compared to the 2001 amount excluding goodwill amortization. Salaries and employee benefits increased $455,000, or 6 percent in 2002 reflecting higher salary and performance compensation levels as well as greater health insurance and other benefit costs. Net occupancy expense increased $177,000 or 8 percent as a result of higher building and equipment depreciation, increased real estate taxes, and greater maintenance costs
A-3
on data processing and check handling equipment. Professional fees were $330,000 or 33 percent lower in 2002 compared with 2001. During 2001, the Company utilized the services of on outside consultant to analyze profitability and suggest methods to improve it. This service was not recurring in 2002. Other operating expense was $417,000 or 13 percent greater in 2002 due to costs incurred related to a branch closing, the settlement of a lawsuit, higher correspondent bank charges, and expenses incurred in holding other real estate acquired in foreclosure.
Income Tax Expense. Income taxes increased $649,000 in 2002 compared with 2001. The amount of income before tax was greater in 2002, thus increasing income tax expense. The Company’s consolidated income tax rate varies from the statutory rate mainly due to tax-exempt income. The 2002 effective income tax as a percentage of income before tax was 34.2 percent compared with 35.2 percent for 2001.
2001 compared to 2000
Net Interest Income. The Company’s net interest income increased $1,279,000 or 7 percent to $18,678,000 in 2001 compared with $17,399,000 in 2000. The net interest margin on a tax-equivalent basis was 3.84 percent for 2001 compared with 3.87 percent for 2000. The increase in net interest income for 2001 was proportionately less than the increase in average earning assets, thus reducing the net interest margin slightly in comparison to 2000.
Total interest income for 2001 was $40,105,000, an increase of $1,279,000, or 3 percent, over the $38,826,000 recorded in 2000. Interest income and fees on loans decreased $126,000 to $25,172,000 in 2001 mainly due to the decline in national and local market interest rates. The Federal Reserve Board reduced interest rates eleven times during the year 2001. These cuts effectively reduced the rates the Company could charge its borrowing customers as many loans are tied to the prime rate and local market interest rates often move with the national market. The average yield on loans declined to 7.96 percent in 2001 compared with 8.37 percent in 2000. The average volume of loans was $13,880,000 greater in 2001 as the Company continued to experience growth in its loan portfolio. Interest and discount on loan pools increased $2,320,000, or 32 percent, reflecting a $26,417,000 increase in average loan pools in 2001 compared to 2000. For 2001, the average yield on loan pools was 10.91 percent compared to 11.82 percent in 2000. The reductions in national interest rates were reflected in the lower yield on loan pools as newly purchased pools were acquired at lower discount rates. The overall reduction in market interest rates caused the $60,000, or 51 percent, lower amount of income on interest-bearing bank deposits as the average balance was consistent between years. Interest income on investment securities decreased $943,000, or 16 percent, in 2001 from 2000 as the volume of securities was $9,028,000 lower in 2001 and the yields on newly purchased securities were lower reflecting national market rates. The yield on the Company’s investment portfolio was 6.55 percent in 2001 compared with 6.99 percent in 2000. Interest income on federal funds sold increased $88,000, or 54 percent, in 2001 due to higher volumes compared with 2000. Lower market interest rates offset, in part, the increased volume of federal funds sold. The Company’s overall yield on earning assets declined to 8.17 percent for 2001 compared with 8.53 percent in 2000. Average earning assets were $35,542,000 greater in 2001.
The 2001 total interest expense of $21,427,000 was equal to the interest expense incurred for 2000. Lower national and local market interest rates allowed the Company to reduce the amount of interest expense on its interest-bearing liabilities, offsetting the additional interest expense resulting from increased average balances of savings accounts, certificates of deposit, and Federal Home Loan Bank advances. The overall rate paid on interest-bearing deposits was 4.36 percent for 2001 compared with 4.64 percent for 2000 reflecting rate reductions in the immediately repriceable deposit accounts and the issuance of fixed-rate certificates of deposit at lower rates. The interest rates paid for federal funds purchased, Federal Home Loan Bank advances, and notes payable all decreased for 2001 following lower market rates. The average rate on all borrowed funds decreased to 6.28 percent for 2001 compared with 7.02 percent for 2000. The Company’s overall rate paid on interest-bearing liabilities was 4.77 percent for 2001 versus 5.14 percent for 2000.
A-4
Provision For Loan Losses. The Company’s provision for loan loss expense was $1,776,000 in 2001, an increase of $884,000 compared with 2000. The largest factor in the increase in loan loss provision for 2001 was the charge-off of one large agricultural line of credit totaling $1,000,000 in the third quarter of the year. The remainder of the provision for loan losses was due to concerns with specific identified problem credits, additional loan charge-offs, growth in the loan portfolio throughout the year, and general uncertainties in the local and national economy.
Other Income. Noninterest income increased $1,721,000, or 67 percent, in 2001 to $4,287,000. This compares with noninterest income of $2,566,000 in 2000. Approximately $296,000 of the increase was due to additional service charges and overdraft fees from deposit accounts. An additional $444,000 in noninterest income was collected from trust fees, brokerage fees, and the earnings recorded on the cash value of life insurance polices. The Company realized gains of $1,018,0000 in 2001 on the sale of available for sale investment securities, which were sold to meet liquidity needs and to purchase additional loan pool participations. Investment security gains realized in 2000 totaled $40,000.
Other Expense. The Company’s noninterest expense totaled $14,467,000 for 2001 compared with $13,313,000 for 2000. The increase of $1,154,000, or 9 percent, for 2001 was mainly due to higher salaries and employee benefit costs, increased occupancy and equipment expense, and additional professional fees incurred by the Company. Salary and benefits expense increased $779,000, or 12 percent, in 2001 primarily due to higher salary levels, additional employees, increased health insurance costs, and greater contributions to the ESOP and 401(k) plans. Occupancy and equipment expense rose $285,000, or 15 percent, in 2001 as a result of the opening of two new banking facilities early in the year. Professional fees were $330,000, or 50 percent, higher in 2001 as the Company utilized the services of an outside consultant to analyze profitability and suggest methods to improve it. Other operating expenses decreased $165,000, or 5 percent, in 2001 primarily due to lower other real estate expense. Other intangible asset amortization declined $75,000 in 2001 compared with 2000.
Income Tax Expense. Income taxes increased $607,000 in 2001 compared with 2000. The amount of income before taxes was higher in 2001, thus increasing income tax expense. The 2000 tax expense was reduced by $270,000 as a result of the utilization by the Company of a state franchise tax credit. The Company’s consolidated income tax rate varies from the statutory rate mainly due to tax-exempt income. The 2001 effective income tax rate as a percent of income before tax was 35.2 percent compared with 30.5 percent for 2000. Without the state franchise tax credit for 2000, the effective tax rate for that year would have been 35.2 percent.
Analysis of Financial Condition
Loans
The Company’s loan portfolio totals decreased $16,657,000, or 5 percent to $306,024,000 on December 31, 2002 from $322,681,000 on December 31, 2001. Loan volumes declined due to softness in the local and national economy and as borrowers refinanced their loans outside of the Company to take advantage of low long-term, fixed interest rates. The Company has traditionally not retained long-term fixed rate loans in its loan portfolio in order to minimize interest rate risk. As of December 31, 2002, the Company’s loan to deposit ratio was 77.4 percent, compared with 85.2 percent at December 31, 2001. The decline in the loan to deposit ratio resulted from the decrease in loan volume and to the increase in deposits. The loan portfolio largely reflects the economic profile of the communities in which the Company operates.
The Company’s total real estate loans (including 1-4 family residential, commercial, agricultural, construction, and multi-family real estate) were $216,850,000 as of December 31, 2002 compared with $223,126,000 as of December 31, 2001. Real estate loans of all types are the Company’s largest category of loans comprising 70.9 percent of total loans at year-end 2002 and 69.1 percent at December 31, 2001. Commercial loans are the next largest category of loan at December 31, 2002, totaling approximately $39,324,000 compared with $40,180,000 at December 31, 2001. As a percentage of the Company’s total loans, at
A-5
December 31, 2002 agricultural loans were 12.4 percent compared with 12.7 percent at December 31, 2001. Agricultural loans totaled $38,004,000 on December 31, 2002 compared with $41,084,000 in 2001. The remaining 3.8 percent of the portfolio as of December 31, 2002 consists of $11,846,000 in consumer and other loans.
Investment In Loan Pools
The Company invests in pools of performing and nonperforming loans categorized as loan pool participations. These loan pool participations are purchased at a discount from the aggregate outstanding principal amount of the underlying loans. Income is derived from this investment in the form of interest collected and the repayment of principal in excess of the purchase cost which is herein referred to as “discount.”
At year-end 2002, the Company’s loan pool participation total was $82,341,000 compared with $110,393,000 in 2001, a decrease of $28,052,000, or 25 percent. The average loan pool participation investment for 2002 was $94,861,000 compared with an average of $87,970,000 for 2001. During 2002, the Company was not as successful in purchasing loan pool participations as in previous years. Loan pool participation purchases made by the Company during 2002 totaled $32,364,000 compared with net purchases of $70,953,000 in 2001. Throughout 2002, loan pool participations averaged 18.7 percent of average earning assets while in 2001 they represented 17.8 percent of average earning assets. The yield on loan pool participation investments declined to 10.6 percent for 2002, compared with 10.9 percent in 2001. This was partially due to the decline in the national interest rate environment and also to the higher quality of assets being purchased.
Investment Securities
The Company manages its investment portfolio to provide both a source of liquidity and earnings. The Company purchased investment securities in 2002 with funds available from the reduction in loans and loan pools and the growth in deposits. Most of the securities acquired were either U.S. Agencies or corporate bonds with short or intermediate maturities. Investment securities available for sale totaled $91,193,000 on December 31, 2002 compared to $50,206,000 at December 31, 2001. Securities classified as held to maturity decreased by $4,661,000 to a balance of $16,671,000 on December 31, 2002 as proceeds from these maturing investments were reinvested in securities available for sale.
Goodwill and Other Intangible Assets
Goodwill totaled $9,351,000 on December 31, 2002, which was the same amount as of December 31, 2001. The Company adopted Financial Accounting Standards Board (“FASB”) Statement No’s. 142 and 147 effective January 1, 2002. The adoption of these statements allowed the Company to cease the amortization of goodwill in 2002. Goodwill is now subject to testing for impairment in accordance with the provisions of FASB Statement No. 142. Other intangible assets decreased to $1,034,000 as of December 31, 2002 as a result of the continued amortization of the core deposit intangible. This amortization is recorded using an accelerated method based on the estimated life of the core deposit intangible. Other intangible assets totaled $1,324,000 on December 31, 2001.
Deposits
Total deposits were $395,546,000 on December 31, 2002 compared with $378,645,000 as of December 31, 2001, an increase of $16,901,000, or 4 percent. This growth was mainly in demand deposits, savings and money market, and certificates of deposit. Interest bearing NOW accounts decreased $524,000, or 1 percent, at year-end 2002 compared to 2001.
Borrowed Funds
As of December 31, 2002, the Company had no borrowings on its revolving line of credit and had paid off its term loan from a major commercial bank. The Company maintained its revolving line arrangement that
A-6
provides for a maximum line of $9,000,000 and matures on June 30, 2003. Additionally, as of December 31, 2002, the Company’s subsidiaries had borrowed $69,293,000 in fixed-rate advances from the Federal Home Loan Bank of Des Moines. Advances from the Federal Home Loan Bank at year-end 2002 decreased $21,881,000 from 2001 as the growth in deposits and the reduction in loans and loan pool participations provided the Company with liquidity to pay off maturing advances.
The Company entered into an agreement on October 4, 2002, to acquire 100 percent of the outstanding shares of the Belle Plaine Service Corp. This transaction is intended to close in the first quarter of 2003 and will require the Company to draw on its revolving line of credit to fund the acquisition. The Company had no other material commitments for capital expenditures as of December 31, 2002.
Trust Preferred Security
On June 27, 2002, the Company obtained $10,310,000 in long-term subordinated debt from its participation in the issuance of a pooled trust preferred security. This security is a hybrid capital instrument that is included in Tier 1 capital for regulatory purposes, yet is non-dilutive to common shareholders and to return on equity. The trust preferred has a 30-year maturity, does not require any principal amortization and is callable in five years at par at the issuer’s option. The interest rate is variable based on the 3-month Libor rate plus 3.65 percent, with the interest payable quarterly. Proceeds from the pooled trust preferred were used to pay down the Company’s commercial bank line of credit.
The following table summarizes the payments due by period for the contractual obligations of the Company as of December 31, 2002:
Contractual Obligations | Total | Less than 1 Year | 1 to 3 Years | 3 to 5 Years | More than 5 Years | ||||||
Long-term Debt | $ | 10,310 | — | — | — | 10,310 | |||||
Capital Leases |
| — | — | — | — | — | |||||
Operating Leases |
| — | — | — | — | — | |||||
Purchase Obligations |
| — | — | — | — | — | |||||
Other Long-term Liabilities |
| — | — | — | — | — | |||||
Total | $ | 10,310 | — | — | — | 10,310 | |||||
Capital Resources
As of December 31, 2002, total shareholders’ equity was $55,698,000. Total equity increased by $4,871,000 in 2002 from $50,827,000 at December 31, 2001 mainly as a result of retained earnings and also due to unrealized gains in the available for sale portion of the Company’s investment portfolio. In October 2002, the Company’s Board of Directors authorized a stock repurchase of up to 5 percent of the common shares outstanding for a period of six months. During the period from January 1 through December 31, 2002, the Company repurchased 32,100 shares of stock on the open market at an average cost of $14.31 per share. A total of 90,014 shares were reissued upon the exercise of stock options throughout 2002, resulting in 3,930,508 shares outstanding at December 31, 2002.
Shareholders’ equity as a percentage of total assets was 10.36 percent on December 31, 2002, versus 9.31 percent on December 31, 2001. The increase in the percentage of shareholders’ equity to total assets reflects the growth in total capital and the decrease in total assets in 2002. Tangible shareholders’ equity was 8.6 percent at the end of 2002 compared with 7.5 percent at year-end 2001. Tangible equity is the ratio of shareholders’ equity less goodwill and other intangible assets in proportion to total assets less goodwill and other intangible assets.
The Company’s risk-based Tier 1 core capital ratio was 14.7 percent as of December 31, 2002, and the Total Capital ratio was 15.9 percent. Risk-based capital guidelines require the classification of assets and some off-balance-sheet items in terms of credit-risk exposure and the measuring of capital as a percentage of the
A-7
risk-adjusted asset totals. Tier 1 core capital is the Company’s total common shareholders’ equity plus the $10,310,000 trust preferred security, reduced by goodwill. Total Capital adds the allowance for loan losses to the Tier 1 capital amount. As of December 31, 2001, the Company’s Tier 1 capital ratio was 10.0 percent, and the Total Capital ratio was 10.9 percent. These ratios increased in 2002 from 2001 as a result of the inclusion of the trust preferred security in Tier 1 capital. They substantially exceeded the minimum regulatory requirements of 4.0 percent for Tier 1 capital and 8.0 percent for Total Capital. The Company’s Tier 1 Leverage ratio, which measures Tier 1 capital in relation to total assets, was 10.4 percent as of December 31, 2002 and 7.6 percent at December 31, 2001, exceeding the regulatory minimum requirement range of 3.0 percent to 5.0 percent. Following the acquisition of the Belle Plaine Service Corp., the Company’s risk-based and leverage ratios will continue to exceed the regulatory minimums.
The Company’s common stock closed the year 2002 at $16.01 per share, representing 1.13 times the December 31, 2002 book value per share of $14.17. The book value per share was $13.12 on December 31, 2001. Tangible book value per share was $11.53 on December 31, 2002 compared with 10.37 on December 31, 2001.
Liquidity
Liquidity management involves the ability to meet the cash flow requirements of depositors and borrowers. Liquidity management is conducted by the Company on both a daily and long-term basis. The Company adjusts its investments in liquid assets based upon management’s assessment of expected loan demand, projected loan sales, expected deposit flows, yields available on interest-bearing deposits, and the objectives of its asset/liability management program. Excess liquidity is invested generally in short-term U.S. Government and agency securities, short-term state and political subdivision securities, and other investment securities.
Liquid assets of cash on hand, balances due from other banks, and federal funds sold are maintained to meet customer needs. The Company had liquid assets of $16,053,000 as of December 31, 2002, compared with $15,837,000 as of December 31, 2001. Investment securities classified as available for sale and securities and loans maturing within one year totaled $147,781,000 and $114,362,000 as of December 31, 2002 and 2001, respectively. The increase in 2002 is mainly due to the purchase of short-term investment securities. Assets maturing within one year, combined with liquid assets, were 41.4 percent at December 31, 2002 and 34.4 percent at December 31, 2001 of total deposits as of the same dates.
The Company’s principal sources of funds are deposits, advances from the Federal Home Loan Bank, principal repayments on loans, proceeds from the sale of loans, principal recoveries on loan pool participations, proceeds from the maturity and sale of investment securities, its commercial bank line of credit, and funds provided by operations. While scheduled loan amortization and maturing interest-bearing deposits are relatively predictable sources of funds, deposit flows and loan prepayments are greatly influenced by economic conditions, the general level of interest rates, and competition. Principal recoveries on loan pool participations are also influenced by economic conditions and to a lesser extent, the interest rate environment. The Company utilizes particular sources of funds based on comparative costs and availability. This includes fixed-rate advances from the Federal Home Loan Bank that were obtained at a more favorable cost than deposits. The Company generally manages the pricing of its deposits to maintain a steady deposit base but has from time to time decided not to pay rates on deposits as high as its competition.
Net cash provided by operations is another major source of liquidity. The net cash provided by operating activities was $7,358,000 in 2002. This trend of strong cash from operations is expected to continue into the foreseeable future.
The Company anticipates that it will have sufficient funds available to fund its loan commitments. As of December 31, 2002, the Company had outstanding commitments to extend credit of $45,942,000 and had commitments to sell loans of $1,983,000. Certificates of deposit maturing in one year or less totaled $128,542,000 as of December 31, 2002. Management believes that a significant portion of these deposits will remain with the Company.
A-8
The Company continues to seek acquisition opportunities that would strengthen its presence in current and new market areas. Other than the transaction to acquire the Belle Plaine Service Corp., there are currently no pending acquisitions that would require the Company to secure capital from public or private markets.
Asset-Liability Management
The Company’s strategy with respect to asset-liability management is to maximize net interest income while limiting exposure to risks associated with volatile interest rates. This strategy is implemented by the subsidiary banks’ asset-liability committees that take action based upon their analysis of expected changes in the composition and volumes of the balance sheet and the fluctuations in market interest rates. One of the measures of interest-rate sensitivity is the gap ratio. This ratio indicates the amount of interest-earning assets repricing within a given period in comparison to the amount of interest-bearing liabilities repricing within the same period of time. A gap ratio of 1.0 indicates a matched position, in which case the effect on net interest income due to interest rate movements will be minimal. A gap ratio of less than 1.0 indicates that more liabilities than assets reprice within the time period and a ratio greater than 1.0 indicates that more assets reprice than liabilities.
As of December 31, 2002, the Company’s cumulative gap ratios for assets and liabilities repricing within three months and within one year were .35 and .52 respectively, meaning more liabilities than assets are scheduled to reprice within these periods. This situation suggests that a decrease in market interest rates may benefit net interest income and that an increase in interest rates may negatively impact the Company. The gap position is largely the result of classifying interest-bearing NOW accounts, money market accounts, and savings accounts as immediately repriceable. Historically, the Company has not repriced these accounts as frequently or as quickly as it adjusts the rates on new and renewing certificates of deposit. Loan pool participations are repriced over a three-year period based on the historical average for return of pool investment.
Market Risk Management
Market risk is the risk of earnings volatility that results from adverse changes in interest rates and market prices. The Company’s market risk is comprised primarily of interest rate risk arising from its core banking activities of lending and deposit taking. Interest rate risk is the risk that changes in market interest rates may adversely affect the Company’s net interest income. Management continually develops and applies strategies to mitigate this risk. Management does not believe that the Company’s primary market risk exposures and how those exposures were managed in 2002 changed when compared to 2001.
The Company uses a third-party computer software simulation modeling program to measure its exposure to potential interest rate changes. For various assumed hypothetical changes in market interest rates, numerous other assumptions are made such as prepayment speeds on loans and securities backed by mortgages, the slope of the Treasury yield curve, the rates and volumes of the Company’s deposits, and the rates and volumes of the Company’s loans. This analysis measures the estimated change in net interest income in the event of hypothetical changes in interest rates. The following table presents the Company’s projected changes in net interest income for the various rate shock levels at December 31, 2002.
$ Change | % Change | |||||
+200 bp | (2,000 | ) | -0.01 | % | ||
+100 bp | (16,000 | ) | -0.07 | % | ||
Base | 0 |
| 0.00 | % | ||
-100 bp | 5,000 |
| 0.02 | % | ||
-200 bp | (150,000 | ) | -0.67 | % |
As shown above, at December 31, 2002, the effect of a ramped 200 basis point increase in interest rates would decrease the Company’s net interest income by approximately $2,000. The effect of a ramped 200 basis point decrease in rates would decrease the Company’s net interest income by approximately $150,000. The reduction in national market interest rates that occurred in the past two years has allowed the Company to lower
A-9
the rates it is paying on many liquid deposit accounts to a point where they cannot be decreased by another 200 basis points. Interest rate floors in place on some of the Company’s loans have also been reached. Any additional reductions in market interest rates could reduce the Company’s net interest margin as rates on repriceable assets are reduced while rates on liabilities cannot be lowered. Based on the computer simulation, a 200 basis point ramped increase in interest rates would not have a significant effect on the net interest margin as variable rate assets and liabilities would reprice concurrently.
Computations of the prospective effects of hypothetical interest rate changes are based on numerous assumptions. Actual values may differ from those projections set forth above. Further, the computations do not contemplate any actions the Company may undertake in response to changes in interest rates.
Loan Quality
Total loans decreased 5 percent during 2002 to a year-end total of $306,024,000. Credits held by MIC Financial continued to be reduced through collection efforts and charge-offs during the year. As of December 31, 2002, the loans attributable to MIC Financial were $642,000, approximately .2 percent of the Company’s total loans outstanding.
Non-performing assets as of December 31, 2002 totaled $2,778,000. The year-end 2002 total of non-performing assets decreased $892,000, or 24 percent, when compared with the December 31, 2001, amount of $3,670,000. The ratio of non-performing assets to total loans was .91 percent for year-end 2002 and 1.14 percent for year-end 2001. Nonaccrual loans decreased $1,521,000 to a December 31, 2002 total of $1,038,000, consisting mainly of agricultural and commercial loans. Loans past due 90 days and over as of year-end 2002 totaled $1,401,000, and consisted primarily of residential real estate and agricultural loans. Loans past due 90 days and over as of December 31, 2002 increased $475,000 compared with the year-end 2001 total. Troubled debt restructurings were $206,000 on December 31, 2002. There were no troubled debt restructurings at the end of 2001. Other real estate consists of real estate acquired by the Company through foreclosure. Other real estate decreased $52,000 to $133,000 from the December 31, 2001 total of $185,000 primarily due to the sale of foreclosed property during the year. Efforts to further improve asset quality continue.
The allowance for loan losses was $3,967,000 on December 31, 2002 and totaled $3,381,000 as of December 31, 2001. The allowance represented 1.30 percent of total loans at December 31, 2002 and 1.05 percent of loans on December 31, 2001. The increase of $586,000 in the amount of the allowance for loan losses as of December 31, 2002 was the result of management’s concerns about deterioration in the national and local economy. The allowance as a percentage of non-performing assets was 142.8 percent on December 31, 2002 and 92.1 percent on December 31, 2001. Net loan charge-offs for 2002 were $484,000, or .15 percent of average loans, compared with 2001 charge-offs of $1,328,000, or .42 percent of average loans. Most of the net charge-offs during 2001 were commercial and commercial real estate credits. The allowance for loan losses is maintained at a level considered by management to be adequate to provide for loan losses inherent in the portfolio on the balance sheet date.
Future Prospects
Inflation can have a significant effect on the operating results of all industries. Management believes that inflation does not affect the banking industry as much as it does other industries with a high proportion of fixed assets and inventory. Inflation does, however, have an impact on the growth of total assets and the need to maintain a proper level of shareholders’ capital.
Interest rates are significantly affected by inflation. It is difficult to assess the impact rate changes have since neither the timing nor the magnitude of changes in the various inflation indices coincides with changes in interest rates. There is, of course, an impact on longer-term earning assets; however, this effect continues to diminish as investment maturities are shortened and interest-earning assets and interest-bearing liabilities shift from fixed-rate long-term to rate-sensitive short-term.
A-10
During 2002 the national inflation rate remained low with the economy determined to be in a mild recession. Interest rates remained relatively constant throughout the year. Management of the Company believes that the 2003 rate of inflation will remain consistent with 2002 and that interest rates may not move any lower. Rates in 2003 may move upward slightly later in the year as the economy is forecast to begin recovering from a recessionary period. Although the Company is in a negative gap position (a greater amount of interest-bearing liabilities are repriceable compared to repriceable interest-earning assets), additional declines in interest rates may not have a significant effect on the Company’s net interest margin since many rates on interest-paying liabilities cannot be moved lower. If interest rates do increase, the Company’s net interest margin may not change significantly as many interest-earning assets will reprice with the interest-paying liabilities. If interest rates remain constant, maturing fixed-rate deposits will continue to reprice at lower rates, thus reducing the Company’s overall cost of funds and benefiting the net interest margin. The full benefit of low market interest rates may not be recognized by the Company depending on the competitive environment for deposits in the individual subsidiaries’ markets. Management continues to focus on managing the net interest margin in 2003.
Management anticipates that in 2003 they will continue to explore opportunities to acquire additional loan pool participation investments. Bids on pool participations during the year will take into account the availability of funds to invest, the market for such pools in terms of price and availability, and the potential return on the pools relative to risk.
Accounting and Financial Reporting Developments
The American Institute of Certified Public Accountants (“AICPA”) has issued a proposed Statement of Position (“SOP”) that addresses the accounting for differences between contractual and expected future cash flows from an investor’s initial investment in certain loans and debt securities. It includes such loans acquired in purchase business combinations and would apply to all enterprises. The proposed SOP would limit the yield that may be accreted (accretable yield) to the excess of the investor’s estimate of undiscounted expected future principal and interest cash flows (expected future cash flows) over the investor’s initial investment in the loan. The implementation of this proposed SOP has been delayed pending agreement between the Financial Accounting Standards Board (“FASB”) and the AICPA.
In July 2001, the FASB issued Statement of Financial Accounting Standards (“SFAS”) No. 141, “Business Combinations,” and SFAS No. 142, “Goodwill and Other Intangible Assets.” SFAS No. 141 requires that the purchase method of accounting be used for all business combinations initiated after June 30, 2001 as well as all purchase method business combinations completed after June 30, 2001. SFAS No. 142 requires that goodwill and intangible assets with indefinite useful lives no longer be amortized, but instead tested for impairment at least annually in accordance with the provisions of SFAS No. 142. SFAS No. 142 also requires that intangible assets with estimable useful lives be amortized over their respective estimated useful lives to their estimated residual values, and reviewed for impairment in accordance with SFAS No. 121, “Accounting for the Impairment of Long-Lived Assets and for Long-Lived Assets to Be Disposed Of.” The Company adopted the provisions of SFAS No. 141 on July 1, 2001, and SFAS No. 142 on January 1, 2002. The adoption of SFAS No. 141 did not have a material effect on the Company’s financial statements. The adoption of SFAS No. 142 enabled the Company to realize a reduction in goodwill amortization expense for 2002 since the goodwill attributable to the merger of Midwest will no longer be amortized. The 2002 reduction in amortization expense was $252,000.
In June 2001, FASB issued SFAS No. 143, “Accounting for Asset Retirement Obligations.” SFAS No. 143 requires the Company to record the fair value of an asset retirement obligation as a liability in the period in which it incurs a legal obligation associated with the retirement of tangible long-lived assets that result from the acquisition, construction, development, and/or normal use of the assets. The Company also records a corresponding asset, which is depreciated over the life of the asset. The Company is required to adopt SFAS No. 143 on January 1, 2003. Management of the Company does not expect the adoption of SFAS No. 143 to have a material effect on its financial statements.
A-11
SFAS No. 144, “Accounting for the Impairment or Disposal of Long-Lived Assets” was issued in August 2001. SFAS No. 144 addresses financial accounting and reporting for the impairment or disposal of long-lived assets. The Company adopted SFAS No. 144 on January 1, 2002. The effects of implementation were immaterial.
In April 2002, the FASB issued SFAS No. 145, “Rescission of FASB Statements No. 4, 44, and 64, Amendment of FASB Statement No. 13, and Technical Corrections.” SFAS No. 145 amends existing guidance on reporting gains and losses on the extinguishment of debt to prohibit the classification of the gain or loss as extraordinary, as the use of such extinguishments have become part of the risk management strategy of many companies. SFAS No. 145 also amends SFAS No. 13 to require sale-leaseback accounting for certain lease modifications that have economic effects similar to sale-leaseback transactions. The provisions of the Statement related to the rescission of SFAS No. 4 are applied in fiscal years beginning after May 15, 2002. The provisions of the Statement related to SFAS No. 13 were effective for transactions occurring after May 15, 2002. The adoption of SFAS No. 145 will not have a material effect on the Company’s financial statements.
In June 2002, the FASB issued SFAS No. 146, “Accounting for Costs Associated with Exit or Disposal Activities.” This Statement addresses financial accounting and reporting for costs associated with exit or disposal activities and nullifies Emerging Issues Task Force (“EITF”) Issue No 94-3, “Liability Recognition for Certain Employee Termination Benefits and Other Costs to Exit an Activity (including Certain Costs Incurred in a Restructuring).” The provisions of this Statement are effective for exit and disposal activities that are initiated after December 31, 2002. The effect of this Statement is not material.
In October 2002, the FASB issued SFAS No. 147, “Acquisitions of Certain Financial Institutions,” which amends SFAS No. 72, “Accounting for Certain Acquisitions of Banking or Thrift Institutions” and no longer requires the separate recognition and subsequent amortization of goodwill that was originally required by SFAS No. 72. SFAS No. 147 also amended SFAS No. 144, “Accounting for Impairment or Disposal of Long-Lived Assets,” to include in its scope long-term customer-relationship intangible assets (such as core deposit intangibles). For the nine months of 2002 prior to the issuance and adoption of SFAS No. 147, the Company had continued to amortize unidentifiable intangible assets in accordance with the provisions of SFAS No. 72. The adoption of SFAS No. 147 on October 1, 2002, permitted the Company to cease this amortization through the remaining three months of 2002 and reverse the amortization recorded from January 1, 2002 through September 30, 2002 in the amount of $335,000.
In December 2002, the FASB issued SFAS No. 148, “Accounting for Stock-Based Compensation—Transition and Disclosure, an amendment of FASB Statement No. 123.” This Statement amends FASB No. 123, “Accounting for Stock-Based Compensation,” to provide alternative methods of transition for a voluntary change to the fair value method of accounting for stock-based employee compensation. In addition, this Statement amends the disclosure requirements of SFAS No. 123 to require prominent disclosures of both annual and interim financial statements. Certain of the disclosure modifications are required for fiscal years ending after December 15, 2002, and are included in the notes to the Company’s consolidated financial statements.
Critical Accounting Policies.
The Company has identified two critical accounting policies and practices relative to the financial condition and results of operation. These two accounting policies relate to the allowance for loan losses and to loan pool accounting.
The allowance for loan losses is based on management’s opinion, and is adequate to absorb losses in the existing portfolio. In evaluating the portfolio, management takes into consideration numerous factors, including current economic conditions, prior loan loss experience, the composition of the loan portfolio, and management’s estimate of probable credit losses. The allowance for loan loss is established through a provision for loss based on management’s evaluation of the risk inherent in the loan portfolio, the composition of the portfolio, specific
A-12
impaired loans, and current economic conditions. Such evaluation, which includes a review of all loans on which full collectibility may not be reasonably assured, considers among other matters, the estimated net realizable value or the fair value of the underlying collateral, economic conditions, historical loss experience, and other factors that warrant recognition in providing for an adequate allowance for loan loss.
The loan pool accounting practice relates to management’s opinion that the investment amount reflected on the Company’s financial statements does not exceed the estimated net realizable value or the fair value of the underlying collateral securing the purchased loans. In evaluating the purchased loan portfolio, management takes into consideration many factors, including the borrowers’ current financial situation, the underlying collateral, current economic conditions, historical collection experience, and other factors relative to the collection process.
In the event that management’s evaluation of the level of the allowance for loan losses is inadequate, the Company would need to increase its provision for loan losses. If the estimated realizable value of the loan pool participations is understated, the Company’s yield on the loan pools would be reduced.
Impact of the Sarbanes-Oxley Act Of 2002.
The Sarbanes-Oxley Act was signed into law on July 30, 2002. The Act aims to correct what are perceived as structural weaknesses affecting the capital markets, which may have contributed to massive losses such as those experienced by the stockholders of Enron and WorldCom. These structural weaknesses were revealed by substantial misstatements in the financial statements of these companies, the apparent failure of boards of directors and public accountants to detect and correct these errors on a timely basis, and the apparent failures of stock analysts to detect weaknesses in financial information. The Act aims to increase the reliability of financial information by placing corporate executives under considerable pressure to make sure financial information is correct. This includes a requirement for the CEO and CFO to certify reports submitted to the SEC and to report on the effectiveness of internal control. The Act strengthens the power and independence of corporate audit committees by requiring the committee to take charge of hiring, overseeing, and compensating the company’s auditor and requiring that the audit committee members be independent of the company. Auditors are to report directly to the audit committee. The Act also limits the non-audit services that the company’s audit firm may provide and requires that any allowable non-audit services must be pre-approved by the audit committee. The Act adds more disclosure to be included in financial reports filed with the SEC. It adds new sanctions and increases the severity of a number of civil and criminal penalties related to securities law violations, in addition to severe penalties for certification of faulty financial statements. Additionally, the Act places a number of restrictions on the activities of security firms and their employees that are supposed to isolate security analysts from pressures that may compromise the objectivity of their reports.
Management of the Company and the Company’s audit committee are working together to insure that the financial information reported by the Company is correct and reliable, that the required evaluation of internal controls takes place, and that certification by management is performed. The role and operation of the audit committee and its relationship with the Company’s outside auditor are being evaluated. It is the intent of the Company to comply with the law.
A-13
Consolidated Balance Sheets
December 31 | |||||||
2002 | 2001 | ||||||
(in thousands) | |||||||
Assets: | |||||||
Cash and due from banks | $ | 11,441 |
| 12,872 |
| ||
Interest-bearing deposits in banks |
| 2,662 |
| 2,965 |
| ||
Federal funds sold |
| 1,950 |
| — |
| ||
Cash and cash equivalents |
| 16,053 |
| 15,837 |
| ||
Investment securities (notes 2 and 9): | |||||||
Available for sale, at fair value |
| 91,193 |
| 50,206 |
| ||
Held to maturity (fair value of $17,511 in 2002 and $22,034 in 2001) |
| 16,671 |
| 21,332 |
| ||
Loans, net of unearned discount (notes 3,5, and 9) |
| 306,024 |
| 322,681 |
| ||
Allowance for loan losses (note 4) |
| (3,967 | ) | (3,381 | ) | ||
Net loans |
| 302,057 |
| 319,300 |
| ||
Loan pool participations |
| 82,341 |
| 110,393 |
| ||
Premises and equipment, net (note 6) |
| 8,376 |
| 8,355 |
| ||
Accrued interest receivable |
| 4,403 |
| 4,540 |
| ||
Goodwill |
| 9,351 |
| 9,351 |
| ||
Other intangible assets |
| 1,034 |
| 1,324 |
| ||
Other assets |
| 6,303 |
| 5,157 |
| ||
Total assets | $ | 537,782 |
| 545,795 |
| ||
Liabilities and Shareholders’ Equity: | |||||||
Deposits (notes 2 and 8): | |||||||
Demand | $ | 29,236 |
| 26,961 |
| ||
NOW and Super NOW |
| 44,848 |
| 45,372 |
| ||
Savings |
| 102,358 |
| 97,989 |
| ||
Certificates of deposit |
| 219,104 |
| 208,323 |
| ||
Total deposits |
| 395,546 |
| 378,645 |
| ||
Federal funds purchased |
| 1,500 |
| 10,650 |
| ||
Federal Home Loan Bank advances (note 9) |
| 69,293 |
| 91,174 |
| ||
Note payable (note 10) |
| — |
| 9,200 |
| ||
Long-term debt (note 11) |
| 10,310 |
| — |
| ||
Other liabilities |
| 5,435 |
| 5,299 |
| ||
Total liabilities |
| 482,084 |
| 494,968 |
| ||
Shareholders’ equity: | |||||||
Common stock, $5 par value; authorized 20,000,000 shares; issued 4,912,849 shares as of December 31, 2002 and 2001 |
| 24,564 |
| 24,564 |
| ||
Capital surplus |
| 12,942 |
| 13,033 |
| ||
Treasury stock at cost, 982,341 and 1,040,255 shares as of December 31, 2002 and 2001, respectively |
| (11,963 | ) | (12,595 | ) | ||
Retained earnings (note 18) |
| 28,375 |
| 25,082 |
| ||
Accumulated other comprehensive income |
| 1,780 |
| 743 |
| ||
Total shareholders’ equity |
| 55,698 |
| 50,827 |
| ||
Total liabilities and shareholders’ equity | $ | 537,782 |
| 545,795 |
| ||
See accompanying notes to consolidated financial statements.
F-1
Consolidated Statements of Income
Year Ended December 31 | |||||||
2002 | 2001 | 2000 | |||||
(in thousands, except per share amounts) | |||||||
Interest income: | |||||||
Interest and fees on loans | $ | 22,845 | 25,172 | 25,298 | |||
Interest income and discount on loan pool participations |
| 10,058 | 9,595 | 7,275 | |||
Interest on bank deposits |
| 22 | 56 | 116 | |||
Interest on federal funds sold |
| 115 | 252 | 164 | |||
Interest on investment securities: | |||||||
Available for sale |
| 3,376 | 3,542 | 4,182 | |||
Held to maturity |
| 1,124 | 1,488 | 1,791 | |||
Total interest income |
| 37,540 | 40,105 | 38,826 | |||
Interest expense: | |||||||
Interest on deposits (note 8): | |||||||
NOW and Super NOW |
| 270 | 521 | 782 | |||
Savings |
| 1,876 | 2,961 | 3,779 | |||
Certificates of deposit |
| 9,422 | 11,920 | 10,788 | |||
Interest on federal funds purchased |
| 21 | 57 | 191 | |||
Interest on Federal Home Loan Bank advances |
| 4,872 | 5,166 | 4,484 | |||
Interest on note payable |
| 270 | 802 | 1,403 | |||
Interest on long-term debt |
| 296 | — | — | |||
Total interest expense |
| 17,027 | 21,427 | 21,427 | |||
Net interest income |
| 20,513 | 18,678 | 17,399 | |||
Provision for loan losses (note 4) |
| 1,070 | 1,776 | 892 | |||
Net interest income after provision for loan losses |
| 19,443 | 16,902 | 16,507 | |||
Other income: | |||||||
Service charges |
| 2,185 | 2,117 | 1,821 | |||
Data processing income |
| 227 | 206 | 203 | |||
Mortgage origination fees |
| 555 | 309 | 188 | |||
Other operating income |
| 820 | 637 | 314 | |||
Investment security gains, net (note 2) |
| — | 1,018 | 40 | |||
Total noninterest income |
| 3,787 | 4,287 | 2,566 | |||
Other expense: | |||||||
Salaries and employee benefits expense (note 15) |
| 7,612 | 7,157 | 6,378 | |||
Net occupancy expense |
| 2,339 | 2,162 | 1,877 | |||
Professional fees |
| 658 | 988 | 658 | |||
Goodwill amortization |
| — | 699 | 699 | |||
Other intangible asset amortization |
| 290 | 351 | 426 | |||
Other operating expense |
| 3,527 | 3,110 | 3,275 | |||
Total noninterest expense |
| 14,426 | 14,467 | 13,313 | |||
Income before income tax expense |
| 8,804 | 6,722 | 5,760 | |||
Income tax expense (note 13) |
| 3,015 | 2,366 | 1,759 | |||
Net income | $ | 5,789 | 4,356 | 4,001 | |||
Net income per share—basic | $ | 1.49 | 1.10 | 0.99 | |||
Net income per share—diluted | $ | 1.46 | 1.09 | 0.99 | |||
See accompanying notes to consolidated financial statements.
F-2
Consolidated Statements of Changes in Shareholders’ Equity
and Comprehensive Income
Common Stock | Capital Surplus | Treasury Stock | Retained Earnings | Accumulated Other Comprehensive Income (Loss) | Total | |||||||||||||
(in thousands, except share data) | ||||||||||||||||||
Balance at December 31, 1999 | $ | 24,564 | 13,192 |
| (8,525 | ) | 21,511 |
| (507 | ) | 50,235 |
| ||||||
Comprehensive income: | ||||||||||||||||||
Net income |
| — | — |
| — |
| 4,001 |
| — |
| 4,001 |
| ||||||
Unrealized gains arising during the year on securities available for sale |
| — | — |
| — |
| — |
| 908 |
| 908 |
| ||||||
Less realized gains on securities available for sale, net of tax |
| — | — |
| — |
| — |
| (30 | ) | (30 | ) | ||||||
Total comprehensive income |
| — | — |
| — |
| 4,001 |
| 878 |
| 4,879 |
| ||||||
Dividends paid ($.60 per share) |
| — | — |
| — |
| (2,410 | ) | — |
| (2,410 | ) | ||||||
Stock options exercised (7,300 shares) |
| — | (65 | ) | 89 |
| — |
| — |
| 24 |
| ||||||
Treasury stock purchased (403,100 shares) |
| — | — |
| (3,433 | ) | — |
| — |
| (3,433 | ) | ||||||
Balance at December 31, 2000 |
| 24,564 | 13,127 |
| (11,869 | ) | 23,102 |
| 371 |
| 49,295 |
| ||||||
Comprehensive income: | ||||||||||||||||||
Net income |
| — | — |
| — |
| 4,356 |
| — |
| 4,356 |
| ||||||
Unrealized gains arising during the year on securities available for sale |
| — | — |
| — |
| — |
| 1,010 |
| 1,010 |
| ||||||
Less realized gains on securities available for sale, net of tax |
| — | — |
| — |
| — |
| (638 | ) | (638 | ) | ||||||
Total comprehensive income |
| — | — |
| — |
| 4,356 |
| 372 |
| 4,728 |
| ||||||
Dividends paid ($.60 per share) |
| — | — |
| — |
| (2,376 | ) | — |
| (2,376 | ) | ||||||
Stock options exercised (34,280 shares) |
| — | (94 | ) | 418 |
| — |
| — |
| 324 |
| ||||||
Treasury stock purchased (101,000 shares) |
| — | — |
| (1,144 | ) | — |
| — |
| (1,144 | ) | ||||||
Balance at December 31, 2001 |
| 24,564 | 13,033 |
| (12,595 | ) | 25,082 |
| 743 |
| 50,827 |
| ||||||
Comprehensive income: | ||||||||||||||||||
Net income |
| — | — |
| — |
| 5,789 |
| — |
| 5,789 |
| ||||||
Unrealized gains arising during the year on securities available for sale |
| — | — |
| — |
| — |
| 1,037 |
| 1,037 |
| ||||||
Total comprehensive income |
| — | — |
| — |
| 5,789 |
| 1,037 |
| 6,826 |
| ||||||
Dividends paid ($.64 per share) |
| — | — |
| — |
| (2,496 | ) | — |
| (2,496 | ) | ||||||
Stock options exercised (90,014 shares) |
| — | (172 | ) | 1,091 |
| — |
| — |
| 919 |
| ||||||
Treasury stock purchased (32,100 shares) |
| — | — |
| (459 | ) | — |
| — |
| (459 | ) | ||||||
ESOP shares allocated |
| — | 81 |
| — |
| — |
| — |
| 81 |
| ||||||
Balance at December 31, 2002 | $ | 24,564 | 12,942 |
| (11,963 | ) | 28,375 |
| 1,780 |
| 55,698 |
| ||||||
See accompanying notes to consolidated financial statements.
F-3
Consolidated Statements of Cash Flows
Year Ended December 31 | ||||||||||
2002 | 2001 | 2000 | ||||||||
(in thousands) | ||||||||||
Cash flows from operating activities: | ||||||||||
Net income | $ | 5,789 |
| 4,356 |
| 4,001 |
| |||
Adjustments to reconcile net income to net cash provided by operating activities: | ||||||||||
Depreciation and amortization |
| 1,526 |
| 1,991 |
| 1,788 |
| |||
Provision for loan losses |
| 1,070 |
| 1,776 |
| 892 |
| |||
Investment securities gains, net |
| — |
| (1,018 | ) | (40 | ) | |||
Loss on sale of premises and equipment |
| 95 |
| 53 |
| 5 |
| |||
Amortization of investment securities and loan premiums |
| 561 |
| 251 |
| 233 |
| |||
Accretion of investment securities and loan discounts |
| (196 | ) | (253 | ) | (262 | ) | |||
(Increase) decrease in other assets |
| (1,009 | ) | 801 |
| (2,689 | ) | |||
(Decrease) increase in other liabilities |
| (478 | ) | (97 | ) | 1,757 |
| |||
Total adjustments |
| 1,569 |
| 3,504 |
| 1,684 |
| |||
Net cash provided by operating activities |
| 7,358 |
| 7,860 |
| 5,685 |
| |||
Cash flows from investing activities: | ||||||||||
Investment securities available for sale: | ||||||||||
Proceeds from sales |
| — |
| 35,281 |
| 13,988 |
| |||
Proceeds from maturities |
| 10,923 |
| 9,245 |
| 5,265 |
| |||
Purchases |
| (50,661 | ) | (32,390 | ) | (17,956 | ) | |||
Investment securities held to maturity: | ||||||||||
Proceeds from maturities |
| 6,846 |
| 5,695 |
| 6,622 |
| |||
Purchases |
| (2,095 | ) | (1,000 | ) | (2,996 | ) | |||
Net decrease (increase) in loans |
| 16,142 |
| (11,862 | ) | (31,868 | ) | |||
Purchases of loan pool participations |
| (32,364 | ) | (96,957 | ) | (39,546 | ) | |||
Principal recovery on sale of loan pool participations |
| 18,707 |
| 26,004 |
| — |
| |||
Principal recovery on loan pool participations |
| 41,709 |
| 35,315 |
| 32,547 |
| |||
Purchases of premises and equipment |
| (1,207 | ) | (2,480 | ) | (953 | ) | |||
Proceeds from sale of premises and equipment |
| 25 |
| 3 |
| 44 |
| |||
Net cash provided by (used in) investing activities |
| 8,025 |
| (33,146 | ) | (34,853 | ) | |||
Cash flows from financing activities: | ||||||||||
Net increase in deposits |
| 16,901 |
| 8,565 |
| 21,568 |
| |||
Net (decrease) increase in federal funds purchased |
| (9,150 | ) | 8,305 |
| (620 | ) | |||
Federal Home Loan Bank advances |
| 1,000 |
| 41,500 |
| 53,500 |
| |||
Repayment of Federal Home Loan Bank advances |
| (23,073 | ) | (25,568 | ) | (42,063 | ) | |||
Advances on note payable |
| 3,000 |
| 3,000 |
| 1,900 |
| |||
Principal payments on note payable |
| (12,200 | ) | (7,000 | ) | (6,700 | ) | |||
Advances on long-term debt |
| 10,310 |
| — |
| — |
| |||
Dividends paid |
| (2,496 | ) | (2,376 | ) | (2,410 | ) | |||
Purchases of treasury stock |
| (459 | ) | (1,144 | ) | (3,433 | ) | |||
Proceeds from stock options exercised |
| 919 |
| 324 |
| 24 |
| |||
ESOP shares allocated |
| 81 |
| — |
| — |
| |||
Net cash (used in) provided by financing activities |
| (15,167 | ) | 25,606 |
| 21,766 |
| |||
Net increase (decrease) in cash and cash equivalents |
| 216 |
| 320 |
| (7,402 | ) | |||
Cash and cash equivalents at beginning of year |
| 15,837 |
| 15,517 |
| 22,919 |
| |||
Cash and cash equivalents at end of year | $ | 16,053 |
| 15,837 |
| 15,517 |
| |||
Supplemental disclosure of cash flow information: | ||||||||||
Cash paid during the period for: | ||||||||||
Interest | $ | 14,307 |
| 21,862 |
| 20,912 |
| |||
Income taxes | $ | 3,558 |
| 2,344 |
| 1,112 |
| |||
See accompanying notes to consolidated financial statements.
F-4
December 31, 2002, 2001, and 2000
1. Summary of Significant Accounting Policies
The accounting and reporting policies of Mahaska Investment Company and subsidiaries (the Company) conform to accounting principles generally accepted in the United States of America and to general practices within the banking industry. The consolidated financial statements of the Company include its 100 percent owned subsidiaries, Mahaska State Bank, Central Valley Bank, Pella State Bank, Midwest Federal Savings and Loan Association of Eastern Iowa, and MIC Financial, Inc. All material intercompany transactions have been eliminated in consolidation.
Nature of Operations
The bank subsidiaries engage in retail and commercial banking and related financial services, providing the usual products and services such as deposits, commercial, real estate, and consumer loans, and trust services. The Company also provides data processing services to affiliated and non-affiliated banks.
Since 1988, the Company, either directly or through the bank subsidiaries, has invested in loan pool participations that have been purchased by certain non-affiliated independent service corporations (collectively, the Servicer) from the Federal Deposit Insurance Corporation (FDIC), the Resolution Trust Corporation (RTC), or other sources. These loan pool investments are comprised of packages of loans previously made by financial institutions, which often include distressed or nonperforming loans, that have been sold at prices reflecting various discounts from the aggregate outstanding principal amount of the underlying loans depending on the credit quality of the portfolio. The Servicer collects and remits these amounts, less servicing fees, to the participants.
Effect of New Accounting Standards
In June 2001, the Financial Accounting Standards Board (“FASB”) issued Statement of Financial Accounting Standards (“SFAS”) No. 143, “Accounting for Asset Retirement Obligations.” SFAS No. 143 requires the Company to record the fair value of an asset retirement obligation as a liability in the period in which it incurs a legal obligation associated with the retirement of tangible long-lived assets that result from the acquisition, construction, development and/or normal use of assets. The Company also records a corresponding asset, which is depreciated over the life of the asset. The Company is required to adopt SFAS No. 143 on January 1, 2003. Management of the Company does not expect the adoption of SFAS No. 143 to have a material effect on its financial statements.
In July 2001, the FASB issued SFAS No. 141, “Business Combinations” and SFAS No. 142, “Goodwill and Other Intangible Assets.” SFAS No. 141 requires the purchase method of accounting be used for all business combinations initiated after June 30, 2001 as well as all purchase method business combinations completed after June 30, 2001. SFAS No. 142 requires that goodwill and intangible assets with indefinite useful lives no longer be amortized, but instead tested for impairment at least annually in accordance with the provisions of SFAS No. 142. SFAS No. 142 also requires that intangible assets with estimable useful lives be amortized over their respective estimated useful lives to their estimated residual values, and reviewed for impairment in accordance with SFAS No. 121, “Accounting for the Impairment of Long-Lived Assets and for Long-Lived Assets to Be Disposed Of.” The Company adopted the provisions of SFAS No. 141 on July 1, 2001, and SFAS No. 142 on January 1, 2002. The adoption of these Statements resulted in a $252,000 reduction in goodwill amortization in 2002.
In August 2001, the FASB issued SFAS No. 144, “Accounting for the Impairment or Disposal of Long-Lived Assets.” SFAS No. 144 addresses financial accounting and reporting for the impairment or disposal of long-lived assets. The Company adopted SFAS No. 144 on January 1, 2002. The effects of implementation were immaterial.
F-5
In April 2002, the FASB issued SFAS No. 145, “Rescission of FASB Statements No. 4, 44, and 64, Amendment of FASB Statement No. 13, and Technical Corrections.” SFAS No. 145 amends existing guidance on reporting gains and losses on the extinguishment of debt to prohibit the classification of the gain or loss as extraordinary, as the use of such extinguishments have become part of the risk management strategy of many companies. SFAS No. 145 also amends SFAS No. 13 to require sale-leaseback accounting for certain lease modifications that have economic effects similar to sale-leaseback transactions. The provisions of the Statement related to the rescission of the SFAS No. 4 are applied in fiscal years beginning after May 15, 2002. Earlier application of these provisions is encouraged. The provisions of the Statement related to SFAS No. 13 were effective for transactions occurring after May 15, 2002, with early application encouraged. The adoption of SFAS No. 145 is not expected to have a material effect on the Company’s financial statements.
In June 2002, the FASB issued SFAS No. 146, “Accounting for Cost Associated with Exit or Disposal Activities.” SFAS No. 146 addresses financial accounting and reporting for costs associated with exit or disposal activities and nullifies Emerging Issues Task Force (“EITF”) Issue No. 94-3, “Liability Recognition for Certain Employee Termination Benefits and Other Cost to Exit an Activity (including Certain Costs Incurred in a Restructuring).” The provisions of SFAS No. 146 are effective for exit and disposal activities that are initiated after December 31, 2002. The effect of this Statement is immaterial to the Company.
In October 2002, the FASB issued SFAS No. 147, “Acquisitions of Certain Financial Institutions,” which amends SFAS No. 72, “Accounting for Certain Acquisitions of Banking or Thrift Institutions”, and no longer requires the separate recognition and subsequent amortization of goodwill that was originally required by SFAS No. 72. SFAS No. 147 also amends SFAS No. 144, “Accounting for the Impairment or Disposal of Long-Lived Assets,” to include in its scope long-term customer-relationship intangible assets (such as core deposit intangibles). The adoption of SFAS No. 147 resulted in a $447,000 reduction in goodwill amortization in 2002.
In November 2002, the FASB issued Interpretation No. 45, “Guarantor’s Accounting and Disclosure Requirements for Guarantees, Including Indirect Guarantees of Indebtedness to Others, an interpretation of FASB Statements No. 5, 57, and 107 and a rescission of FASB Interpretation No. 34.” This Interpretation elaborates on the disclosures to be made by the guarantor in its interim and annual financial statements about its obligations under guarantees issued. The Interpretation also clarifies that a guarantor is required to recognize, at the inception of the guarantee, a liability for the fair value of the obligation undertaken. The initial recognition and measurement provisions of the Interpretation are applicable to guarantees issued or modified after December 31, 2002 and are not expected to have a material effect on the Company’s financial statements. The disclosure requirements are effective for financial statements of interim and annual periods ending after December 15, 2002.
In December 2002, the FASB issued SFAS No. 148, “Accounting for Stock-Based Compensation—Transaction and Disclosure, an amendment of SFAS No. 123”. SFAS No. 148 amends SFAS No. 123, “Accounting for Stock-Based Compensation,” to provide alternative methods of transition for a voluntary change to the fair value method of accounting for stock-based employee compensation. In addition, this Statement amends the disclosure requirements of SFAS No. 123 to require prominent disclosures of booth annual and interim financial statements. Certain of the disclosure modifications are required for fiscal years ending after December 15, 2002 and are included in the notes to the consolidated financial statements.
F-6
Earnings per Share
Basic earnings per share amounts are computed by dividing net income by the weighted average number of shares outstanding during the year. Diluted earnings per share amounts are computed by dividing net income by the weighted average number of shares and all potentially dilutive shares outstanding during the year. The Company has had a Stock Repurchase Plan in effect since April 1995. In accordance with the plan, 32,100, 101,000 and 403,100 shares of common stock were repurchased by the Company during 2002, 2001 and 2000, respectively. The following information was used in the computation of earnings per share on both a basic and diluted basis for the years ended December 31, 2002, 2001 and 2000:
2002 | 2001 | 2000 | |||||
(in thousands, except per share amounts) | |||||||
Basic EPS computation | |||||||
Numerator: | |||||||
Net income | $ | 5,789 | 4,356 | 4,001 | |||
Denominator: | |||||||
Weighted average shares outstanding |
| 3,891 | 3,951 | 4,052 | |||
Basic EPS | $ | 1.49 | 1.10 | 0.99 | |||
Diluted EPS computation | |||||||
Numerator: | |||||||
Net income | $ | 5,789 | 4,356 | 4,001 | |||
Denominator: | |||||||
Weighted average shares outstanding |
| 3,891 | 3,951 | 4,052 | |||
Weighted average dilutive shares outstanding for stock options |
| 84 | 35 | 5 | |||
| 3,975 | 3,986 | 4,057 | ||||
Diluted EPS | $ | 1.46 | 1.09 | 0.99 | |||
Stock Incentive Plan
The Company has a stock incentive plan under which up to 750,000 shares of common stock are reserved for issuance pursuant to options or other awards which may be granted to officers, key employees and certain nonaffiliated directors of the Company. The exercise price of each option equals the market price of the Company’s stock on the date of grant. The option’s maximum term is ten years, with vesting occurring at the rate of thirty-three percent on the one-year anniversary date of the grant, sixty-six percent vesting on the two-year anniversary, and one hundred percent vesting on the three-year anniversary date of the grant. The Company applies APB Opinion No. 25 and related interpretations in accounting for this plan. Accordingly, no compensation cost has been recognized for its stock options in the financial statements.
Had compensation cost for the Company’s stock incentive plan been determined consistent with SFAS No. 123, “Accounting for Stock-Based Compensation,” the Company’s net income and net income per share would have been reduced to the pro forma amounts indicated below:
2002 | 2001 | 2000 | |||||
(in thousands) | |||||||
Net income: | |||||||
As reported | $ | 5,789 | 4,356 | 4,001 | |||
Pro forma |
| 5,603 | 4,219 | 3,876 | |||
Net income per share: | |||||||
As reported—basic | $ | 1.49 | 1.10 | 0.99 | |||
As reported—diluted |
| 1.46 | 1.07 | 0.99 | |||
Pro forma—basic |
| 1.44 | 1.09 | 0.96 | |||
Pro forma—diluted |
| 1.44 | 1.07 | 0.96 | |||
F-7
The fair value of each option grant has been estimated using the Black-Scholes option-pricing model with the following weighted-average assumptions used for grants in 2002, 2001 and 2000, respectively: dividend yield of 3.00 percent for 2002 and 2001, 3.50 percent for 2000; excepted volatility of .284 for 2002, .292 for 2001 and .258 for 2000; risk free interest rates of 3.83 percent for 2002, 5.06 percent for 2001 and 5.16 percent for 2000; and expected lives of 7.5 years for all years.
Fair Value of Financial Instruments
Fair value estimates are made at a specific point in time, based on relevant market information about the financial instrument. These estimates do not reflect any premium or discount that could result from offering the Company’s entire holdings of a particular financial instrument for sale at one time. Unless included in assets available for sale, it is the Company’s general practice and intent to hold its financial instruments to maturity and not to engage in trading or sale activities.
Fair value estimates are based on judgments regarding future expected loss experience, current economic conditions, risk characteristics of various financial instruments and other factors. These estimates are subjective in nature and involve uncertainties and matters of significant judgment and therefore cannot be determined with precision. Changes in assumptions could significantly affect the estimates.
Estimated fair values have been determined by the Company using the best available information and an estimation method suitable for each category of financial instruments.
Cash and Due from Banks
The Company is required to maintain certain daily reserve balances on hand in accordance with federal banking regulations. The average reserve balances maintained in accordance with such regulations for the years ended December 31, 2002, 2001 and 2000 were $1,452,000, $1,341,000 and $1,362,000, respectively.
Investment Securities
The Company classifies investment securities based on the intended holding period. Securities which may be sold prior to maturity to meet liquidity needs, to respond to market changes, or to adjust the Company’s asset-liability position are classified as available for sale. Securities held principally for the purpose of near-term sales are classified as trading. Securities which the Company intends to hold until maturity are classified as held to maturity.
Investment securities available for sale are recorded at fair value. The aggregate unrealized gains and losses, net of the income tax effect, are recorded as a component of other comprehensive income until realized. Securities held to maturity are recorded at cost, adjusted for amortization of premiums and accretion of discounts. Unrealized losses judged to be other than temporary are charged to operations for both securities available for sale and securities held to maturity.
Net gains or losses on the sales of securities are shown in the consolidated statements of income using the specific identification method and are recognized on a trade date basis.
Loans
Loans are stated at the principal amount outstanding, net of unearned discount and allowance for loan losses. Unearned discount on installment loans is transferred to income over the term of the loan using the level yield method. Interest on all other loans is credited to income as earned based on the principal amount outstanding.
F-8
It is the Company’s policy to discontinue the accrual of interest income on any loan when, in the opinion of management, there is reasonable doubt as to the collectibility of interest or principal. Nonaccrual loans are returned to an accrual status when, in the opinion of management, the financial position of the borrower indicates there is no longer any reasonable doubt as to timely payment of principal or interest.
All impaired loans, including loans that are restructured in a troubled debt restructuring involving a modification of terms, are measured at the present value of expected future cash flows discounted at the loan initial effective interest rate. The fair value of the collateral of an impaired collateral-dependent loan or an observable market price, if one exists, may be used as an alternative to discounting. If the measure of the impaired loan is less than the recorded investment in the loan, impairment will be recognized through the allowance for loan losses. A loan is considered impaired when, based on current information and events, it is probable that a creditor will be unable to collect all amounts due according to the contractual terms of the loan agreement. All portfolio loans are reviewed for impairment on an individual basis.
Concentrations of Credit Risk
The Company originates real estate, consumer, and commercial loans primarily in its southeast Iowa market area and adjacent counties. Although the Company has a diversified portfolio, a substantial portion of its borrowers’ ability to repay their loans is dependent upon economic conditions in the Company’s market area.
Allowance for Loan Losses
The allowance for loan losses is established through a provision for loan losses charged to expense. Loans are charged against the allowance for loan losses when management believes collectibility of the principal is unlikely.
Management believes the allowance for loan losses is adequate to absorb losses in the loan portfolio on the balance sheet date. While management uses available information to recognize loan losses, future additions to the allowance may be necessary based on changes in economic conditions. In addition, various regulatory agencies, as an integral part of the examination process, periodically review the subsidiary banks’ allowance for loan losses. Such agencies may require the subsidiary banks to increase their allowance for loan losses based on their judgments and interpretations about information available to them at the time of their examinations.
Loan Pool Participations
The Company has invested in participations in pools of loans acquired from the FDIC, the RTC, and other sources at substantial discounts. The pools, all acquired since 1988, consist of loans to borrowers located throughout the United States.
The Company carries its investment in the loan pools as a separate earning asset on the balance sheet. Principal or interest restructures, write-downs, or write-offs within the pools are not included in the Company’s disclosures for its loan portfolio. The loan pools are managed by the Servicer operating in Omaha, Nebraska, the sole incentive of which is cash collection without regard to principal or income allocation of the payment. The investment in loan pools is accounted for on a cash basis. For loans receiving regular payments, cash is applied first to interest income for interest due at the contract rate. Payment amounts in excess of the interest due at the contractual interest rates are applied to the principal in a ratio of cost basis to loan face amount and to discount income with no recognition of interest due at the contract rate.
For loans where circumstances or new information lead the Servicer to believe that collection of the note or recovery through collateral is less than originally determined, the cost basis assigned to the loan is written down or off through a charge to discount income.
F-9
For loans where the Servicer negotiates a settlement of the obligation for a lump sum, the payment is applied first to principal, then to discount income and last to interest due at the contract rate.
Premises and Equipment
Premises and equipment are stated at cost less accumulated depreciation. Depreciation is computed using the straight-line or accelerated method over the estimated useful lives of the respective assets, which range from 5 to 40 years for buildings and improvements and 3 to 10 years for furniture and equipment.
Other Intangible Assets
Other intangible assets consist of core deposit premium which is being amortized using the effective-yield method over 10 years. Periodically, the Company reviews the core deposit for events or circumstances that may indicate impairment.
Other Real Estate Owned
Other real estate owned represents property acquired through foreclosure or deeded to the subsidiary banks in lieu of foreclosure on real estate mortgage loans on which the borrowers have defaulted as to payment of principal and interest. Other real estate owned is carried at the lower of the cost of acquisition or fair value, less estimated costs of disposition, and is included in other assets on the consolidated balance sheets. Reductions in the balance of other real estate at the date of acquisition are charged to the allowance for loan losses. Expenses incurred subsequent to the acquisition of the property and any subsequent write-downs to reflect current fair market value are charged as noninterest expense as incurred. Gains or losses on the disposition of other real estate are recognized in other income or expense in the period in which they are realized.
Trust Department Assets
Property held for customers in fiduciary or agency capacities is not included in the accompanying consolidated balance sheets, as such items are not assets of the Company.
Income Taxes
The Company files a consolidated federal income tax return. For state purposes, the bank subsidiaries each file a franchise return and the remaining entities file a consolidated income tax return.
Deferred tax assets and liabilities are recognized for the future tax consequences attributable to temporary differences between the financial statement carrying amounts and of existing assets and liabilities and their respective tax bases. Deferred tax assets and liabilities are measured using enacted tax rates expected to apply to taxable income in the years in which those temporary differences are expected to be recovered or settled. The effect on deferred tax assets and liabilities of a change in tax rates is recognized in income in the period that includes the enactment date.
Consolidated Statements of Cash Flows
For purposes of reporting cash flows, cash and cash equivalents include cash and due from banks, interest-bearing deposits in banks, and federal funds sold.
Reclassifications
Certain reclassifications have been made to prior years consolidated financial statements in order to conform to current year presentation.
F-10
Use of Estimates in the Preparation of Financial Statements
The preparation of the consolidated financial statements in conformity with accounting principles generally accepted in the United States of America requires management to make estimates and assumptions that affect the reported amounts of assets and liabilities and disclosure of contingent assets and liabilities at the date of the financial statements and the reported amounts of revenues and expenses during the reporting period. Actual results could differ from those estimates. Significant estimates that are particularly sensitive to change relate to the allowance for loan losses and the carrying basis of the loan pool participations.
2. Investment Securities
A summary of investment securities by type as of December 31, 2002 and 2001, follows:
December 31, 2002 | Amortized Cost | Gross Unrealized Gains | Gross Unrealized Losses | Fair Value | |||||
(in thousands) | |||||||||
Investment Securities Available for Sale: | |||||||||
U.S. government agency securities | $ | 47,840 | 1,770 | — | 49,610 | ||||
Obligations of states and political subdivisions |
| 3,077 | 117 | 21 | 3,173 | ||||
Other investment securities |
| 37,440 | 1,003 | 33 | 38,410 | ||||
Total | $ | 88,357 | 2,890 | 54 | 91,193 | ||||
Investment Securities Held to Maturity: | |||||||||
U.S. government agency securities | $ | 7,259 | 534 | — | 7,793 | ||||
Obligations of states and political subdivisions |
| 9,329 | 311 | 5 | 9,635 | ||||
Other investment securities |
| 83 | — | — | 83 | ||||
Total | $ | 16,671 | 845 | 5 | 17,511 | ||||
December 31, 2001 | Amortized Cost | Gross Unrealized Gains | Gross Unrealized Losses | Fair Value | |||||
(in thousands) | |||||||||
Investment Securities Available for Sale: | |||||||||
U.S. government agency securities | $ | 20,121 | 502 | 44 | 20,579 | ||||
Obligations of states and political subdivisions |
| 3,360 | 90 | — | 3,450 | ||||
Other investment securities |
| 25,539 | 689 | 51 | 26,177 | ||||
Total | $ | 49,020 | 1,281 | 95 | 50,206 | ||||
Investment Securities Held to Maturity: | |||||||||
U.S. government agency securities | $ | 12,047 | 519 | — | 12,566 | ||||
Obligations of states and political subdivisions |
| 9,098 | 192 | 9 | 9,281 | ||||
Other investment securities |
| 187 | — | — | 187 | ||||
Total | $ | 21,332 | 711 | 9 | 22,034 | ||||
Proceeds from the sale of investment securities available for sale during 2002, 2001, and 2000 were $0, $35,281,000, and $13,988,000, respectively. Gross gains and losses realized on the sale of investment securities available for sale for the years ended December 31 were as follows:
2002 | 2001 | 2000 | |||||||
(in thousands) | |||||||||
Realized gains | $ | — | 1,027 |
| 118 |
| |||
Realized losses |
| — | (9 | ) | (78 | ) | |||
Total | $ | — | 1,018 |
| 40 |
| |||
F-11
As of December 31, 2002 and 2001, investment securities with carrying values of approximately $15,035,000 and $12,379,000 respectively, were pledged as collateral to secure public fund deposits and for other purposes required or permitted by law. Public funds approximated $26,449,000 and $27,478,000 at December 31, 2002 and 2001, respectively.
The amortized cost and approximate fair value of investment securities as of December 31, 2002, by contractual maturity, are shown as follows. Expected maturities will differ from contractual maturities because issuers may have the right to call or repay obligations with or without call or prepayment penalties.
Amortized Cost | Fair Value | ||||
(in thousands) | |||||
Investment Securities Available for Sale: | |||||
Due in 1 year or less | $ | 8,566 | 8,716 | ||
Due after 1 year through 5 years |
| 71,218 | 73,772 | ||
Due after 5 years through 10 years |
| 755 | 757 | ||
Due after 10 years |
| 7,818 | 7,948 | ||
Total | $ | 88,357 | 91,193 | ||
Investment Securities Held to Maturity: | |||||
Due in 1 year or less | $ | 2,378 | 2,408 | ||
Due after 1 year through 5 years |
| 3,370 | 3,470 | ||
Due after 5 years through 10 years |
| 4,510 | 4,722 | ||
Due after 10 years |
| 6,413 | 6,911 | ||
Total | $ | 16,671 | 17,511 | ||
3. Loans
A summary of the respective loan categories as of December 31, 2002 and 2001, follows:
2002 | 2001 | ||||
(in thousands) | |||||
Real estate loans | $ | 216,850 | 223,126 | ||
Commercial and agricultural loans |
| 77,328 | 81,264 | ||
Loans to individuals |
| 11,517 | 17,854 | ||
Other loans |
| 329 | 437 | ||
Total | $ | 306,024 | 322,681 | ||
Total nonperfoming loans and assets at December 31, 2002 and 2001, were:
2002 | 2001 | ||||
(in thousands) | |||||
Impaired loans and leases: | |||||
Nonaccrual | $ | 1,038 | 2,559 | ||
Restructured |
| 206 | — | ||
Total impaired loans and leases |
| 1,244 | 2,559 | ||
Loans and leases past due 90 days and more |
| 1,401 | 926 | ||
Total nonperforming loans |
| 2,645 | 3,485 | ||
Other real estate owned |
| 133 | 185 | ||
Total nonperforming assets | $ | 2,778 | 3,670 | ||
F-12
The average balances of nonperforming loans for the years ended December 31, 2002 and 2001, were $3,741,000 and $4,271,000, respectively. The allowance for credit losses related to nonperforming loans at December 31, 2002 and 2001, was $246,000 and $246,000, respectively. Nonperforming loans of $1,147,000 and $763,000 at December 31, 2002 and 2001, respectively, were not subject to a related allowance for credit losses because of the net realizable value of loan collateral, guarantees and other factors. The effect of nonaccrual and restructured loans on interest income for each of the three years ended December 31, 2002, 2001, and 2000 was:
2002 | 2001 | 2000 | |||||
(in thousands) | |||||||
Interest income: | |||||||
As originally contracted | $ | 289 | 361 | 430 | |||
As recognized |
| 48 | 5 | 12 | |||
Reduction of interest income | $ | 241 | 356 | 418 | |||
4. Allowance for Loan Losses
Changes in the allowance for loan losses for the years ended December 31, 2002, 2001, and 2000 were as follows:
2002 | 2001 | 2000 | ||||||||
(in thousands) | ||||||||||
Balance at beginning of year | $ | 3,381 |
| 2,933 |
| 4,006 |
| |||
Provision for loan losses |
| 1,070 |
| 1,776 |
| 892 |
| |||
Recoveries on loans previously charged off |
| 89 |
| 158 |
| 221 |
| |||
Loans charged off |
| (573 | ) | (1,486 | ) | (2,186 | ) | |||
Balance at end of year | $ | 3,967 |
| 3,381 |
| 2,933 |
| |||
5. Loans to Related Parties
Certain directors and officers of the Company, including their immediate families and companies in which they are principal owners, were loan customers of the Company’s subsidiaries. All loans to this group were made in the ordinary course of business at prevailing terms and conditions. The loan activity of this group, including loans as of December 31, 2002 and 2001, was as follows:
2002 | 2001 | ||||
(in thousands) | |||||
Aggregate balance at beginning of year | $ | 13,741 | 13,782 | ||
Advances |
| 13,158 | 16,566 | ||
Payments |
| 18,935 | 16,607 | ||
Aggregate balance at end of year | $ | 7,964 | 13,741 | ||
F-13
6. Premises and Equipment
A summary of premises and equipment as of December 31, 2002 and 2001 was as follows:
2002 | 2001 | ||||
(in thousands) | |||||
Land and improvements | $ | 997 | 997 | ||
Building and improvements |
| 8,700 | 8,504 | ||
Furniture and equipment |
| 7,498 | 6,790 | ||
Total office properties and equipment at cost |
| 17,195 | 16,291 | ||
Less accumulated depreciation |
| 8,819 | 7,936 | ||
Total | $ | 8,376 | 8,355 | ||
7. Goodwill and Other Intangible Assets
The following table reconciles the reported earnings for the years ended December 31, 2001 and 2000 to “adjusted earnings,” which exclude goodwill amortization.
2002 | 2001 | ||||||||
Reported Earnings | Reported Earnings | Goodwill Amortization | Adjusted Earnings | ||||||
(in thousands, except per share amounts) | |||||||||
Net income | $ | 5,789 | 4,356 | 532 | 4,888 | ||||
Earnings per share: | |||||||||
Basic | $ | 1.49 | 1.10 | 0.14 | 1.24 | ||||
Diluted | $ | 1.46 | 1.09 | 0.14 | 1.23 | ||||
2000 | |||||||
Reported Earnings | Goodwill Amortization | Adjusted Earnings | |||||
Net income | $ | 4,001 | 532 | 4,533 | |||
Earnings per share: | |||||||
Basic | $ | 0.99 | 0.13 | 1.12 | |||
Diluted | $ | 0.99 | 0.13 | 1.12 | |||
The gross carrying amount of intangible assets and the associated accumulated amortization at December 31, 2002 is presented in the table below. Amortization expense for intangible assets was $290,000, $351,000, and $426,000 for the years ended December 31, 2002, 2001, and 2000, respectively.
Gross Carrying Amount | Accumulated Amortization | Unamortized Intangible Assets | |||||
(in thousands) | |||||||
Intangible assets: | |||||||
Core deposit premium | $ | 2,727 | 1,693 | 1,034 | |||
F-14
Projections of amortization expense are based on existing asset balances and the remaining useful lives. The following table shows the estimated future amortization expense for amortizing intangible assets for each of the years ended December 31:
Core Deposit Premium | |||
(in thousands) | |||
2003 | $ | 244 | |
2004 |
| 190 | |
2005 |
| 153 | |
2006 |
| 132 | |
2007 |
| 115 | |
Thereafter |
| 200 | |
8. Deposits
The scheduled maturities of certificate accounts are as follows as of December 31, 2002:
(in thousands) | |||
2003 | $ | 128,542 | |
2004 |
| 47,285 | |
2005 |
| 17,855 | |
2006 |
| 5,488 | |
2007 |
| 11,860 | |
Thereafter |
| 8,074 | |
Total | $ | 219,104 | |
Time deposits in excess of $100,000 approximated $32,052,000 and $29,577,000 as of December 31, 2002 and 2001, respectively. Interest expense on such deposits for the years ended December 31, 2002, 2001, and 2000 was approximately $1,150,000, $1,889,000, and $1,305,000, respectively.
9. Federal Home Loan Bank Advances
At December 31, 2002 and 2001, Federal Home Loan Bank (FHLB) advances consisted of the following:
2002 | Weighted- Average Interest Rate | 2001 | Weighted- Average Interest Rate | ||||||||
(in thousands) | |||||||||||
Maturity in year ending: | |||||||||||
2002 |
| — | — |
| 22,808 | 6.33 | % | ||||
2003 | $ | 10,308 | 5.08 | % | 9,308 | 5.36 |
| ||||
2004 |
| 2,308 | 5.24 |
| 2,308 | 5.24 |
| ||||
2005 |
| 11,424 | 5.49 |
| 11,424 | 5.49 |
| ||||
2006 |
| 8,000 | 5.35 |
| 8,000 | 5.35 |
| ||||
2007 |
| 2,000 | 4.76 |
| 2,000 | 4.76 |
| ||||
Thereafter |
| 35,253 | 5.25 |
| 35,326 | 5.25 |
| ||||
Total | $ | 69,293 | 5.26 |
| 91,174 | 5.56 |
| ||||
Advances from the FHLB are secured by stock in the FHLB. In addition, the bank subsidiaries have agreed to maintain unencumbered additional security in the form of certain residential mortgage loans, certain
F-15
commercial real estate loans, and certain investment securities aggregating from 105 percent to 175 percent of outstanding advances.
Many of the advances listed above have call provisions which allow the FHLB to request that the advance be paid back or refinanced at the rates then being offered by the FHLB. Call provisions are not included in the above listed advances.
10. Note Payable
As of December 31, 2002, the Company had no borrowings on its revolving line of credit with an unaffiliated bank. The note has a variable interest rate at 0.80 percent below the lender’s prime rate. Interest is payable quarterly. During the year 2002, the interest rate ranged from 3.95 percent to 3.45 percent. The weighted average interest paid on the notes payable for the years ended December 31, 2002, 2001, and 2000 was 4.11%, 6.61%, and 9.07%, respectively.
The note is secured by all of the common stock of the subsidiaries. The revolving line of credit has a maximum limit of $9,000,000 and matures June 30, 2003.
11. Long-term Debt
On June 27, 2002, the Company obtained $10,310,000 in long-term subordinated debt from its participation in the issuance of a pooled trust preferred security. The trust preferred has a 30 year maturity, does not require any principal amortization and is callable in five years at par at the issuers’ option. The interest rate is variable based on the three month Libor rate plus 3.65 percent, with interest payable quarterly.
12. Fair Value of Financial Instruments
The fair value of the Company’s financial instruments as of December 31, 2002 and 2001, were as follows:
2002 | Carrying Value | Fair Value | |||
(in thousands) | |||||
Financial assets: | |||||
Cash and due from banks | $ | 11,441 | 11,441 | ||
Interest-bearing deposits with banks |
| 2,662 | 2,662 | ||
Federal funds sold |
| 1,950 | 1,950 | ||
Investment securities |
| 107,864 | 108,704 | ||
Loans, net |
| 302,057 | 305,675 | ||
Loan pool participations |
| 82,341 | 82,341 | ||
Accrued interest receivable |
| 4,403 | 4,403 | ||
Financial liabilities: | |||||
Deposits | $ | 395,546 | 399,205 | ||
Federal funds purchased |
| 1,500 | 1,500 | ||
Federal Home Loan Bank advances |
| 69,293 | 74,005 | ||
Long-term debt |
| 10,310 | 10,310 | ||
Accrued interest payable |
| 1,254 | 1,254 | ||
F-16
2001 | Carrying Value | Fair Value | |||
(in thousands) | |||||
Financial assets: | |||||
Cash and due from banks | $ | 12,872 | 12,872 | ||
Interest-bearing deposits with banks |
| 2,965 | 2,965 | ||
Federal funds sold |
| — | — | ||
Investment securities |
| 71,538 | 72,240 | ||
Loans, net |
| 319,300 | 322,153 | ||
Loan pool participations |
| 110,393 | 110,393 | ||
Accrued interest receivable |
| 4,540 | 4,540 | ||
Financial liabilities: | |||||
Deposits | $ | 378,645 | 381,899 | ||
Federal funds purchased |
| 10,650 | 10,650 | ||
Federal Home Loan Bank advances |
| 91,174 | 91,634 | ||
Note payable |
| 9,200 | 9,200 | ||
Accrued interest payable |
| 1,467 | 1,467 | ||
The recorded amount of cash and due from banks, interest-bearing deposits with banks, accrued interest receivable and payable, and federal funds sold approximates fair value due to the short-term nature of these instruments.
The estimated fair value of investment securities has been determined using available quoted market prices.
Loans have been valued using a present value discounted cash flow with a discount rate approximating the current market rate for similar loans.
The recorded amount of the loan pool participation approximates fair value due to the characteristics of the loan pool participation. Any additional value attained in the loan pool participation over purchase cost is directly attributable to the expertise of the Servicer to collect a higher percentage of the book value of loans in the pools over the percentage paid.
Deposit liabilities with no stated maturities have an estimated fair value equal to the recorded balance. Deposits with stated maturities have been valued using a present value discounted cash flow with a discount rate approximating the current market rate for similar deposits. The fair value estimate does not include the benefit that results from the low-cost funding provided by the deposit liabilities compared to the cost of borrowing funds in the market. The Company believes the value of these depositor relationships to be significant.
The recorded amount of federal funds purchased approximates fair value due to the short-term nature of these instruments.
The estimated fair value of the Federal Home Loan Bank advances was determined using a present value discounted cash flow with a discount rate approximating the current market rate for similar borrowings.
The recorded amount of the note payable approximates fair value as a result of the short-term nature of this instrument.
The recorded amount of the long-term debt approximates fair value due to the variable nature of this instrument.
F-17
13. Income Taxes
Income tax expense (benefit) for the years ended December 31, 2002, 2001 and 2000, is as follows:
2002 | Federal | State | Total | |||||||
(in thousands) | ||||||||||
Current | $ | 2,975 |
| 546 |
| 3,521 |
| |||
Deferred |
| (437 | ) | (69 | ) | (506 | ) | |||
Total | $ | 2,538 |
| 477 |
| 3,015 |
| |||
2001 | Federal | State | Total | |||||||
(in thousands) | ||||||||||
Current | $ | 2,319 |
| 424 |
| 2,743 |
| |||
Deferred |
| (322 | ) | (55 | ) | (377 | ) | |||
Total | $ | 1,997 |
| 369 |
| 2,366 |
| |||
2000 | Federal | State | Total | |||||||
(in thousands) | ||||||||||
Current | $ | 1,225 |
| 69 |
| 1,294 |
| |||
Deferred |
| 448 |
| 17 |
| 465 |
| |||
Total | $ | 1,673 |
| 86 |
| 1,759 |
| |||
Income tax expense differs from the amount computed by applying the United States federal income tax rate of 34 percent in 2002, 2001, and 2000, to income before income tax expense. The reasons for these differences are a follows:
2002 | 2001 | 2000 | ||||||||
(in thousands) | ||||||||||
Provision at statutory rate | $ | 2,993 |
| 2,286 |
| 1,958 |
| |||
State franchise tax (net of federal tax benefit) |
| 315 |
| 244 |
| 57 |
| |||
Nontaxable interest income |
| (185 | ) | (206 | ) | (226 | ) | |||
Nondeductible goodwill amortization |
| — |
| 86 |
| 86 |
| |||
Life insurance cash value increase |
| (77 | ) | (52 | ) | (35 | ) | |||
Other, net |
| (31 | ) | 8 |
| (81 | ) | |||
Total | $ | 3,015 |
| 2,366 |
| 1,759 |
| |||
F-18
The tax effect of temporary differences that give rise to significant portions of the deferred tax assets and liabilities at December 31, 2002 and 2001, are as follows:
2002 | 2001 | ||||||
(in thousands) | |||||||
Deferred tax assets: | |||||||
Allowance for loan losses | $ | 1,415 |
| 904 |
| ||
Deferred compensation |
| 238 |
| 169 |
| ||
Premium amortization |
| — |
| 95 |
| ||
Other |
| — |
| 8 |
| ||
Gross deferred tax assets |
| 1,653 |
| 1,176 |
| ||
Deferred tax liabilities: | |||||||
Depreciation and amortization |
| (379 | ) | (325 | ) | ||
Federal Home Loan Bank stock |
| (109 | ) | (109 | ) | ||
Premium amortization |
| (66 | ) | — |
| ||
Deferred loan fees |
| (33 | ) | (48 | ) | ||
Purchase accounting amortization |
| (664 | ) | (813 | ) | ||
Unrealized gain on available for sale securities |
| (1,057 | ) | (442 | ) | ||
Other |
| (15 | ) | — |
| ||
Gross deferred tax liabilities |
| (2,323 | ) | (1,737 | ) | ||
Net deferred tax (liability) asset | $ | (670 | ) | (561 | ) | ||
Based upon the Company’s level of historical taxable income and anticipated future taxable income over the periods which the deferred tax assets are deductible, management believes it is more likely than not the Company will realize the benefits of these deductible differences.
14. Stock Incentive Plan
A summary of the status of the Company’s stock incentive plan as of December 31, 2002 and 2001, and the activity during the years ended on those dates is presented below:
2002 | 2001 | |||||||||
Shares | Exercise Price | Shares | Exercise Price | |||||||
Net income: | ||||||||||
Balance at beginning of year | 488,749 | $ | 7.50–22.00 | 462,102 | $ | 7.50–22.00 | ||||
Granted | 113,760 |
| 13.86–16.01 | 87,252 |
| 9.76–11.25 | ||||
Exercised | 90,014 |
| 7.50–12.00 | 34,280 |
| 8.10–9.00 | ||||
Forfeited | 21,597 |
| 8.375–22.00 | 26,325 |
| 8.375–19.875 | ||||
Outstanding at end of year | 490,898 | $ | 7.50–22.00 | 488,749 | $ | 7.50–22.00 | ||||
Options exercisable at year end | 296,808 | $ | 7.50–22.00 | 348,359 | $ | 7.50–22.00 | ||||
Weighted-average fair value of options granted during the year | $ | 3.98 | $ | 3.08 | ||||||
15. Employee Benefit Plans
The Company maintains an employee stock ownership plan (“ESOP”) covering substantially all employees meeting minimum age and service requirements. Contributions are determined by the board of directors of each subsidiary. Contributions relating to the plan were $181,000, $188,000, and $205,000 for 2002, 2001, and 2000, respectively. As of December 31, 2002 and 2001 the ESOP owned 555,113 and 592,361 shares of the Company’s common stock, respectively.
F-19
A 401(k) plan was adopted by the Company in 1994. The Company did not make contributions to this Plan prior to 2001. Beginning in 2001, the Company matched 50 percent of employee contributions up to a maximum employee contribution of 6 percent of compensation. Contributions relating to the plan were $131,000 in 2002 and $127,000 in 2001. The Company has also provided deferred compensation plans to certain executive officers, which provide for a series of payments to be made after retirement. The present value of the future payments is being accrued over the respective employees remaining active service periods. The total expense related to these plans was $133,000, $97,000, and $88,000, for the years ended December 31, 2002, 2001, and 2000, respectively.
The Company provides no material post-retirement benefits.
16. Regulatory Capital Requirements
The Company is subject to various capital requirements administered by the federal banking agencies. Failure to meet minimum capital requirements can initiate certain mandatory, and possible additional discretionary, actions by regulators that, if undertaken, could have a direct material effect on the Company’s financial statements. Under capital adequacy guidelines and the regulatory framework for prompt corrective action, the Company must meet specific capital guidelines that involve quantitative measures of the Company’s assets, liabilities and certain off-balance-sheet items as calculated under regulatory accounting practices. The Company capital amounts and classifications are also subject to qualitative judgments by the regulators about components, risk weightings, and other factors. Quantitative measures established by regulation to ensure capital adequacy require the Company to maintain minimum amounts and ratios (set forth in the following table) of total capital and Tier 1 capital to risk-weighted assets and of Tier 1 capital to average assets. As of December 31, 2002 and 2001, the Company and its subsidiary banks met all capital adequacy requirements to which they are subject.
F-20
The Company and its bank subsidiaries actual capital amounts and ratios are also presented in the following table.
Actual | Minimum for Capital Adequacy Purposes | To Be Well Capitalized Under Prompt Corrective Action Provisions | ||||||||||||||||
Amount | Ratio | Amount | Ratio | Amount | Ratio | |||||||||||||
(in thousands) | ||||||||||||||||||
As of December 31, 2002: | ||||||||||||||||||
Total capital (to risk-weighted assets): | ||||||||||||||||||
Consolidated | $ | 60,362 | 15.9 | % | $ | 30,336 | 8.0 | % |
| N/A | N/A |
| ||||||
Mahaska State Bank |
| 17,749 | 12.2 |
|
| 11,661 | 8.0 |
| $ | 14,576 | 10.0 | % | ||||||
Central Valley Bank |
| 10,728 | 12.9 |
|
| 6,675 | 8.0 |
|
| 8,343 | 10.0 |
| ||||||
Pella State Bank |
| 6,253 | 15.2 |
|
| 3,284 | 8.0 |
|
| 4,105 | 10.0 |
| ||||||
Midwest Federal |
| 14,316 | 14.3 |
|
| 8,001 | 8.0 |
|
| 10,002 | 10.0 |
| ||||||
Tier 1 capital (to risk-weighted assets): | ||||||||||||||||||
Consolidated | $ | 55,622 | 14.7 | % | $ | 15,168 | 4.0 | % |
| N/A | N/A |
| ||||||
Mahaska State Bank |
| 15,927 | 10.9 |
|
| 5,830 | 4.0 |
| $ | 8,746 | 6.0 | % | ||||||
Central Valley Bank |
| 9,685 | 11.6 |
|
| 3,337 | 4.0 |
|
| 5,006 | 6.0 |
| ||||||
Pella State Bank |
| 5,739 | 14.0 |
|
| 1,642 | 4.0 |
|
| 2,463 | 6.0 |
| ||||||
Midwest Federal |
| 13,444 | 13.4 |
|
| 4,001 | 4.0 |
|
| 6,001 | 6.0 |
| ||||||
Tier 1 capital (to average assets): | ||||||||||||||||||
Consolidated | $ | 55,622 | 10.4 | % | $ | 16,033 | 3.0 | % |
| N/A | N/A |
| ||||||
Mahaska State Bank |
| 15,927 | 8.6 |
|
| 5,552 | 3.0 |
| $ | 9,254 | 5.0 | % | ||||||
Central Valley Bank |
| 9,685 | 8.5 |
|
| 3,416 | 3.0 |
|
| 5,693 | 5.0 |
| ||||||
Pella State Bank |
| 5,739 | 10.7 |
|
| 1,606 | 3.0 |
|
| 2,677 | 5.0 |
| ||||||
Midwest Federal |
| 13,444 | 7.7 |
|
| 5,223 | 3.0 |
|
| 8,705 | 5.0 |
| ||||||
As of December 31, 2001: | ||||||||||||||||||
Total capital (to risk-weighted assets): | ||||||||||||||||||
Consolidated | $ | 43,832 | 10.9 | % | $ | 32,281 | 8.0 | % |
| N/A | N/A |
| ||||||
Mahaska State Bank |
| 16,749 | 10.6 |
|
| 12,617 | 8.0 |
| $ | 15,772 | 10.0 | % | ||||||
Central Valley Bank |
| 10,160 | 11.6 |
|
| 7,017 | 8.0 |
|
| 8,772 | 10.0 |
| ||||||
Pella State Bank |
| 5,541 | 14.9 |
|
| 2,975 | 8.0 |
|
| 3,719 | 10.0 |
| ||||||
Midwest Federal |
| 13,414 | 11.8 |
|
| 9,131 | 8.0 |
|
| 11,414 | 10.0 |
| ||||||
Tier 1 capital (to risk-weighted assets): | ||||||||||||||||||
Consolidated | $ | 40,153 | 10.0 | % | $ | 16,140 | 4.0 | % |
| N/A | N/A |
| ||||||
Mahaska State Bank |
| 15,068 | 9.6 |
|
| 6,309 | 4.0 |
| $ | 9,463 | 6.0 | % | ||||||
Central Valley Bank |
| 9,333 | 10.6 |
|
| 3,509 | 4.0 |
|
| 5,263 | 6.0 |
| ||||||
Pella State Bank |
| 5,105 | 13.7 |
|
| 1,488 | 4.0 |
|
| 2,232 | 6.0 |
| ||||||
Midwest Federal |
| 12,759 | 11.2 |
|
| 4,566 | 4.0 |
|
| 6,849 | 6.0 |
| ||||||
Tier 1 capital (to average assets): | ||||||||||||||||||
Consolidated | $ | 40,153 | 7.6 | % | $ | 16,140 | 3.0 | % |
| N/A | N/A |
| ||||||
Mahaska State Bank |
| 15,068 | 8.0 |
|
| 6,309 | 3.0 |
| $ | 9,463 | 5.0 | % | ||||||
Central Valley Bank |
| 9,333 | 8.3 |
|
| 3,509 | 3.0 |
|
| 5,263 | 5.0 |
| ||||||
Pella State Bank |
| 5,105 | 12.1 |
|
| 1,488 | 3.0 |
|
| 2,232 | 5.0 |
| ||||||
Midwest Federal |
| 12,759 | 7.0 |
|
| 4,566 | 3.0 |
|
| 6,849 | 5.0 |
| ||||||
F-21
17. Business Segments
The Company’s wholly-owned subsidiaries, Mahaska State Bank (“MSB”), Central Valley Bank (“CVB”), Pella State Bank (“PSB”) and Midwest Federal Savings and Loan Association of Eastern Iowa (“MFS”), have been identified as reportable operating segments in accordance with the provisions of SFAS No. 131, “Disclosures about Segments of an Enterprise and Related Information.
The Company evaluates performance and allocates resources based on the segment’s net income or loss, total assets, net interest margin (FTE), return on average assets and return on average equity. The segments follow generally accepted accounting principles as described in the summary of significant accounting policies.
Each subsidiary is managed separately with its own president, who reports directly to the Company’s chief operating decision maker, and board of directors.
The following table sets forth certain information about the reported profit or loss and assets for each of the Company’s reportable segments.
MSB | CVB | PSB | MFS | MIC Financial | Holding Co. | Elim. | Total | ||||||||||||||||||
(in thousands) | |||||||||||||||||||||||||
At or for the year ended December 31, 2002: | |||||||||||||||||||||||||
Total interest income | $ | 13,066 |
| 8,553 |
| 3,208 |
| 12,560 |
| 48 |
| 137 |
| (32 | ) | 37,540 |
| ||||||||
Total interest expense |
| 4,389 |
| 3,175 |
| 1,717 |
| 7,212 |
| — |
| 566 |
| (32 | ) | 17,027 |
| ||||||||
Provisions for loan losses |
| 629 |
| 260 |
| 60 |
| 48 |
| 73 |
| — |
| — |
| 1,070 |
| ||||||||
Total other income |
| 1,334 |
| 834 |
| 379 |
| 974 |
| — |
| 1,560 |
| (1,294 | ) | 3,787 |
| ||||||||
Goodwill and other intangible amortization |
| 33 |
| 43 |
| — |
| 214 |
| — |
| — |
| — |
| 290 |
| ||||||||
Total other expense |
| 4,088 |
| 2,762 |
| 1,348 |
| 3,798 |
| 23 |
| 3,411 |
| (1,294 | ) | 14,136 |
| ||||||||
Income tax expense |
| 1,804 |
| 1,140 |
| 167 |
| 780 |
| (16 | ) | (860 | ) | — |
| 3,015 |
| ||||||||
Net income |
| 3,457 |
| 2,007 |
| 295 |
| 1,482 |
| (32 | ) | (1,420 | ) | — |
| 5,789 |
| ||||||||
Total assets |
| 185,260 |
| 115,618 |
| 56,491 |
| 173,782 |
| 700 |
| 10,283 |
| (4,352 | ) | 537,782 |
| ||||||||
Net interest margin (FTE) |
| 5.10 | % | 4.98 | % | 3.18 | % | 3.13 | % | 5.62 | % | (7.80 | )% | 4.10 | % | ||||||||||
Return on average assets |
| 1.90 |
| 1.71 |
| 0.60 |
| 0.80 |
| (3.46 | ) | (14.33 | ) | 1.07 |
| ||||||||||
Return on average equity |
| 21.38 |
| 15.23 |
| 5.54 |
| 7.53 |
| (3.43 | ) | (2.68 | ) | 10.91 |
| ||||||||||
At or for the year ended December 31, 2001: | |||||||||||||||||||||||||
Total interest income | $ | 14,307 |
| 8,515 |
| 2,996 |
| 13,617 |
| 113 |
| 609 |
| (52 | ) | 40,105 |
| ||||||||
Total interest expense |
| 6,527 |
| 4,033 |
| 1,801 |
| 8,316 |
| — |
| 802 |
| (52 | ) | 21,427 |
| ||||||||
Provisions for loan losses |
| 1,350 |
| 210 |
| 120 |
| 48 |
| 48 |
| — |
| — |
| 1,776 |
| ||||||||
Total other income |
| 2,046 |
| 734 |
| 206 |
| 1,758 |
| 4 |
| 334 |
| (795 | ) | 4,287 |
| ||||||||
Goodwill and other intangible amortization |
| 101 |
| 421 |
| — |
| 528 |
| — |
| — |
| — |
| 1,050 |
| ||||||||
Total other expense |
| 4,431 |
| 2,717 |
| 1,229 |
| 3,562 |
| 63 |
| 2,210 |
| (795 | ) | 13,417 |
| ||||||||
Income tax expense |
| 1,333 |
| 667 |
| 20 |
| 1,048 |
| 2 |
| (704 | ) | — |
| 2,366 |
| ||||||||
Net income |
| 2,611 |
| 1,201 |
| 32 |
| 1,873 |
| 4 |
| (1,365 | ) | — |
| 4,356 |
| ||||||||
Total assets |
| 186,418 |
| 119,730 |
| 44,052 |
| 189,232 |
| 1,056 |
| 6,425 |
| (1,118 | ) | 545,795 |
| ||||||||
Net interest margin (FTE) |
| 4.55 | % | 4.36 | % | 3.21 | % | 3.11 | % | 9.01 | % | (3.71 | )% | 3.84 | % | ||||||||||
Return on average assets |
| 1.42 |
| 1.07 |
| 0.08 |
| 1.00 |
| 0.28 |
| (17.89 | ) | 0.82 |
| ||||||||||
Return on average equity |
| 16.24 |
| 9.08 |
| 0.62 |
| 9.37 |
| 0.29 |
| (2.69 | ) | 8.59 |
| ||||||||||
At or for the year ended December 31, 2000: | |||||||||||||||||||||||||
Total interest income | $ | 14,213 |
| 7,671 |
| 2,481 |
| 13,146 |
| 263 |
| 1,065 |
| (13 | ) | 38,826 |
| ||||||||
Total interest expense |
| 6,575 |
| 3,752 |
| 1,328 |
| 8,372 |
| 10 |
| 1,403 |
| (13 | ) | 21,427 |
| ||||||||
Provisions for loan losses |
| 547 |
| 180 |
| 55 |
| 48 |
| 62 |
| — |
| — |
| 892 |
| ||||||||
Total other income |
| 1,510 |
| 596 |
| 98 |
| 550 |
| 17 |
| 405 |
| (610 | ) | 2,566 |
| ||||||||
Goodwill and other intangible amortization |
| 101 |
| 424 |
| — |
| 600 |
| — |
| — |
| — |
| 1,125 |
| ||||||||
Total other expense |
| 4,413 |
| 2,483 |
| 823 |
| 3,049 |
| 359 |
| 1,671 |
| (610 | ) | 12,188 |
| ||||||||
Income tax expense |
| 1,201 |
| 458 |
| 141 |
| 435 |
| (51 | ) | (425 | ) | — |
| 1,759 |
| ||||||||
Net income |
| 2,886 |
| 970 |
| 232 |
| 1,192 |
| (100 | ) | (1,179 | ) | — |
| 4,001 |
| ||||||||
Total assets |
| 179,327 |
| 108,344 |
| 34,996 |
| 183,418 |
| 1,912 |
| 7,883 |
| (668 | ) | 515,212 |
| ||||||||
Net interest margin (FTE) |
| 4.91 | % | 4.35 | % | 4.02 | % | 2.91 | % | 8.46 | % | (4.55 | )% | 3.87 | % | ||||||||||
Return on average assets |
| 1.71 |
| 0.97 |
| 0.77 |
| 0.65 |
| (3.49 | ) | (12.11 | ) | 0.81 |
| ||||||||||
Return on average equity |
| 18.69 |
| 7.62 |
| 4.72 |
| 6.10 |
| (3.81 | ) | (2.41 | ) | 8.18 |
| ||||||||||
F-22
18. Dividend Restrictions
The Company derives a substantial portion of its cash flow, including that available for dividend payments to shareholders, from its bank subsidiaries in the form of dividends received. The bank subsidiaries are subject to certain statutory and regulatory restrictions that affect dividend payments. Based on minimum regulating guidelines as published by those regulators, the maximum dividends which could be paid by the bank subsidiaries to the Company at December 31, 2002, without prior regulatory approval, approximated $6,431,000.
19. Commitments and Contingencies
The Company is a party to financial instruments with off-balance-sheet risk in the normal course of business to meet the financing needs of its customers, which include commitments to extend credit. The Company’s exposure to credit loss in the event of nonperformance by the other party to the commitments to extend credit is represented by the contractual amount of those instruments. The Company uses the same credit policies in making commitments as it does for on-balance-sheet instruments.
Commitments to extend credit are agreements to lend to a customer as long as there is no violation of any conditions established in the contract. Commitments generally have fixed expiration dates or other termination clauses and may require payment of a fee. Since many of the commitments are expected to expire without being drawn upon, the total commitment amounts do not necessarily represent future cash requirements. The Company evaluates each customer’s creditworthiness on a case-by-case basis. As of December 31, 2002 and 2001, outstanding commitments to extend credit totaled approximately $45,942,000 and $35,662,000, respectively.
Commitments under standby letters of credit outstanding aggregated $1,067,000 and $769,000 as of December 31, 2002 and 2001, respectively. The Company does not anticipate any losses as a result of these transactions.
The Company is involved in various legal actions and proceedings arising from the normal course of operations. Management believes, based upon known facts and the advice of legal counsel, that the ultimate liability, if any, not covered by insurance, arising from all legal actions and proceedings will not have a material adverse effect upon the consolidated financial position of the Company.
The Company has no obligations under guarantees.
F-23
20. Mahaska Investment Company (Parent Company Only)
Balance Sheets
December 31 | |||||||
2002 | 2001 | ||||||
(in thousands) | |||||||
Assets: | |||||||
Cash on deposit at bank subsidiary | $ | 1,960 |
| 534 |
| ||
Cash at other institutions |
| 67 |
| 56 |
| ||
Cash and cash equivalents |
| 2,027 |
| 590 |
| ||
Investment securities |
| 835 |
| 433 |
| ||
Loans |
| 565 |
| 683 |
| ||
Loan pool participations |
| 3,650 |
| 3,092 |
| ||
Investments in: | |||||||
Bank subsidiaries |
| 55,181 |
| 52,939 |
| ||
Bank-related subsidiary |
| 717 |
| 1,054 |
| ||
Premises and equipment |
| 1,460 |
| 673 |
| ||
Other assets |
| 1,746 |
| 954 |
| ||
Total assets | $ | 66,181 |
| 60,418 |
| ||
Liabilities and Shareholders’ Equity: | |||||||
Note payable | $ | — |
| 9,200 |
| ||
Long-term debt |
| 10,310 |
| — |
| ||
Accrued expenses payable and other liabilities |
| 173 |
| 391 |
| ||
Total liabilities |
| 10,483 |
| 9,591 |
| ||
Shareholders’ equity: | |||||||
Common stock |
| 24,564 |
| 24,564 |
| ||
Capital surplus |
| 12,942 |
| 13,033 |
| ||
Treasury stock at cost |
| (11,963 | ) | (12,595 | ) | ||
Retained earnings |
| 28,375 |
| 25,082 |
| ||
Accumulated other comprehensive income |
| 1,780 |
| 743 |
| ||
Total shareholders’ equity |
| 55,698 |
| 50,827 |
| ||
Total liabilities and shareholders’ equity | $ | 66,181 |
| 60,418 |
| ||
F-24
Statements of Income
Year Ended December 31 | ||||||||||
2002 | 2001 | 2000 | ||||||||
(in thousands) | ||||||||||
Income: | ||||||||||
Dividends from subsidiaries | $ | 6,006 |
| 6,750 |
| 4,350 |
| |||
Interest income and discount on loan pool participations |
| 78 |
| 534 |
| 948 |
| |||
Management, audit, and loan review fees |
| 1,267 |
| 286 |
| 281 |
| |||
Other operating income |
| 353 |
| 126 |
| 241 |
| |||
Total income |
| 7,704 |
| 7,696 |
| 5,820 |
| |||
Expense: | ||||||||||
Salaries and benefits expense |
| 1,902 |
| 1,152 |
| 986 |
| |||
Interest on note payable |
| 270 |
| 802 |
| 1,403 |
| |||
Interest on long-term debt |
| 296 |
| — |
| — |
| |||
Other operating expense |
| 1,510 |
| 1,060 |
| 684 |
| |||
Total expense |
| 3,978 |
| 3,014 |
| 3,073 |
| |||
Income before income tax benefit and equity in undistributed earnings of subsidiaries |
| 3,726 |
| 4,682 |
| 2,747 |
| |||
Income tax benefit |
| (860 | ) | (703 | ) | (425 | ) | |||
Income before equity in undistributed (dividends in excess of earnings) earnings of subsidiaries |
| 4,586 |
| 5,385 |
| 3,172 |
| |||
Equity in undistributed (dividends in excess of earnings) earnings of subsidiaries |
| 1,203 |
| (1,029 | ) | 829 |
| |||
Net income | $ | 5,789 |
| 4,356 |
| 4,001 |
| |||
F-25
Statements of Cash Flows
Year Ended December 31 | ||||||||||
2002 | 2001 | 2000 | ||||||||
(in thousands) | ||||||||||
Cash flows from operating activities: | ||||||||||
Net income | $ | 5,789 |
| 4,356 |
| 4,001 |
| |||
Adjustments to reconcile net income to net cash provided by operating activities: | ||||||||||
Equity in (undistributed earnings) dividends in excess of earnings of subsidiaries |
| (1,203 | ) | 1,029 |
| (829 | ) | |||
Depreciation and amortization |
| 289 |
| 79 |
| 70 |
| |||
Investment securities losses (gains) |
| — |
| 1 |
| (84 | ) | |||
(Increase) decrease in other assets |
| (792 | ) | 130 |
| (250 | ) | |||
(Decrease) increase in other liabilities |
| (232 | ) | (287 | ) | 561 |
| |||
Total adjustments |
| (1,938 | ) | 952 |
| (532 | ) | |||
Net cash provided by operating activities |
| 3,851 |
| 5,308 |
| 3,469 |
| |||
Cash flows from investing activities: | ||||||||||
Purchases of investment securities |
| (364 | ) | (106 | ) | — |
| |||
Proceeds from investment securites sales |
| — |
| 349 |
| 284 |
| |||
Proceeds from investment securites maturities |
| 5 |
| 13 |
| — |
| |||
Net decrease in loans |
| 118 |
| 103 |
| 210 |
| |||
Purchases of loan pool participations |
| (2,960 | ) | (3,084 | ) | — |
| |||
Principal recovery on sales of loan pool participations |
| 226 |
| 1,744 |
| — |
| |||
Principal recovery on loan pool participations |
| 2,176 |
| 2,817 |
| 3,782 |
| |||
Purchases of bank premises and equipment |
| (1,077 | ) | (26 | ) | (128 | ) | |||
Proceeds from sale of bank premises and equipment |
| 1 |
| — |
| 22 |
| |||
Repayment of bank-related subsidiary equity |
| 306 |
| 554 |
| 2,095 |
| |||
Net cash (used in) provided by investing activities |
| (1,569 | ) | 2,364 |
| 6,265 |
| |||
Cash flows from financing activities: | ||||||||||
Advances on note payable |
| 3,000 |
| 3,000 |
| 1,900 |
| |||
Principal payments on note payable |
| (12,200 | ) | (7,000 | ) | (6,700 | ) | |||
Advances on long-term debt |
| 10,310 |
| — |
| — |
| |||
Dividends paid |
| (2,496 | ) | (2,376 | ) | (2,410 | ) | |||
Purchases of treasury stock |
| (459 | ) | (1,144 | ) | (3,433 | ) | |||
Proceeds from stock options exercised |
| 919 |
| 324 |
| 24 |
| |||
ESOP shares allocated |
| 81 |
| — |
| — |
| |||
Net cash used in financing activities |
| (845 | ) | (7,196 | ) | (10,619 | ) | |||
Net increase (decrease) in cash and cash equivalents |
| 1,437 |
| 476 |
| (885 | ) | |||
Cash and cash equivalents at beginning of year |
| 590 |
| 114 |
| 999 |
| |||
Cash and cash equivalents at end of year | $ | 2,027 |
| 590 |
| 114 |
| |||
F-26
The Board of Directors
Mahaska Investment Company:
We have audited the accompanying consolidated balance sheets of Mahaska Investment Company and subsidiaries as of December 31, 2002 and 2001, and the related statements of income, changes in shareholders’ equity and comprehensive income, and cash flows for each of the years in the three-year period ended December 31, 2002. These consolidated financial statements are the responsibility of the Company’s management. Our responsibility is to express an opinion on the consolidated financial statements based on our audits.
We conducted our audits in accordance with auditing standards generally accepted in the United States of America. Those standards require that we plan and perform the audit to obtain reasonable assurance about whether the financial statements are free of material misstatement. An audit includes examining, on a test basis, evidence supporting the amounts and disclosures in the financial statements. An audit also includes assessing the accounting principles used and significant estimates made by management, as well as evaluating the overall financial statement presentation. We believe that our audits provide a reasonable basis for our opinion.
In our opinion, the consolidated financial statements referred to above present fairly, in all material respects, the financial position of Mahaska Investment Company and subsidiaries as of December 31, 2002 and 2001, and the results of their operations and their cash flows for each of the years in the three-year period ended December 31, 2002, in conformity with accounting principles generally accepted in the United States of America. As discussed in note one to the consolidated financial statements, the Company changed its method of accounting for goodwill in 2002.

KPMG LLP
Des Moines, Iowa
January 30, 2003
F-27
THE DIRECTORS AND OFFICERS
OF MAHASKA INVESTMENT COMPANY
CORDIALLY INVITE YOU TO ATTEND THE ANNUAL MEETING OF SHAREHOLDERS
WEDNESDAY, APRIL 30, 2003, 10:30 A.M. CDT
ELMHURST COUNTRY CLUB
2214 SOUTH 11TH STREET
OSKALOOSA, IA 52577
You can vote in one of three ways: 1) By Mail, 2) By Phone, 3) By Internet.
See the reverse side of this sheet for instructions.
IF YOU ARE NOT VOTING BY TELEPHONE OR BY INTERNET, COMPLETE
BOTH SIDES OF PROXY CARD, DETACH AND RETURN IN THE ENCLOSED
ENVELOPE TO:
Illinois Stock Transfer Co.
209 West Jackson Boulevard, Suite 903
Chicago, Illinois 60606
DETACH PROXYCARD HERE |
THIS PROXY WHEN PROPERLY EXECUTED WILL BE VOTED IN THE MANNER DIRECTED HEREIN BY THE UNDERSIGNED SHAREHOLDER. IF NO DIRECTION IS MADE, THIS PROXY WILL BE VOTED FOR PROPOSALS 1, 2 AND 3.
Date:
Signature:
Signature if Held Jointly:
Please sign exactly as name appears. When shares are held by joint tenants, both should sign. When signing as an attorney, executor, administrator, trustee or guardian, please give full title as such. If a corporation, please sign in full corporate name by President or other authorized officer. If a partnership, please sign in partnership name by authorized person.
PLEASE MARK, SIGN, DATE AND RETURN THE PROXY CARD PROMPTLY USING THE ENCLOSED ENVELOPE.
MAHASKA INVESTMENT COMPANY
If you plan to personally attend the Annual Meeting
of Shareholders on April 30, 2003, please check
the box and list the names of attendees below.
Return this stub in the enclosed envelope with
your completed proxy card.
I/We do plan to attend [ ]
the Annual meeting.
Names of persons attending:
TO VOTE BY MAIL
To vote by mail, complete both sides, sign and date the proxy card below. Detach the card below and return it in the envelope provided.
TO VOTE BY TELEPHONE
Your telephone vote is quick, confidential and immediate. Just follow these easy steps:
| 1. | Read the accompanying Proxy Statement. |
| 2. | Using a Touch-Tone telephone, call Toll Free 1-800-555-8140 and follow the instructions. |
| 3. | When asked for your Voter Control Number, enter the number printed just above your name on the front of the proxy card below. |
Please note that all votes cast by telephone must be submitted prior to Monday, April 28, 2003 at 11:59 P.M. Central Time. Your Telephone vote authorizes the named proxies to vote your shares to the same extent as if you marked, signed, dated and returned the proxy card.
If You Vote By TELEPHONE, Please Do Not Return Your Proxy Card By Mail.
TO VOTE BY INTERNET
Your Internet vote is quick, confidential and your vote is immediately submitted. Just follow these easy steps:
| 1. | Read the accompanying Proxy Statement. |
| 2. | Visit our Internet voting site athttp://www.eproxyvote.com/ist-mhkcm/and follow the instructions on the screen. |
| 3. | When prompted for your Voter Control Number, enter the number printed just above your name on the front of the proxy card. |
Please note that all votes cast by Internet must be submitted prior to Monday, April 28, 2003 at 11:59 P.M. Central Time.
Your Internet vote authorizes the named proxies to vote your shares to the same extent as if you marked, signed, dated and returned the proxy card.
This is a “secured” web page site. Your software and/or Internet provider must be “enabled” to access this site. Please call your software or Internet provider for further information.
REVOCABLE PROXY MAHASKA INVESTMENT COMPANY
THIS PROXY IS SOLICITED ON BEHALF OF THE BOARD OF DIRECTORS
The undersigned as a shareholder of record on February 25, 2003 hereby appoints Charles S. Howard and David A. Meinert as Proxies, each with the power to appoint his substitute and hereby authorizes them to represent and to vote, as designated below, all the shares of Common Stock of Mahaska Investment Company which the undersigned is entitled to vote at the Annual Meeting of Shareholders to be held on April 30, 2003, or any adjournment thereof.
Proposal 1—Election of Directors for a three year term.
| ¨ | For all the nominees listed below (Except as marked to the contrary below) |
| ¨ | Withhold authority to vote all the nominees below (Instructions: to withhold authority to vote for any individual nominee, strike through the nominee’s name.) |
01. William D. Hassel
02. Michael R. Welter
03. Edward C. Whitham
Proposal 2—Vote for amendment to Article I of the Articles of Incorporation to change the Company’s name to MidWestOne Financial Group, Inc.
¨ For ¨ Against ¨ Abstain
Proposal 3—Ratify the Appointment of KPMG LLP as Independent Auditors for the Company
¨ For ¨ Against ¨ Abstain
In their discretion, the proxies are authorized to vote upon such other business as may properly come before the meeting.
(to be signed on the other side)
2