Exhibit 99.2
Earnings Conference Call Results for the 2nd Quarter 2010 Supplemental Slides August 2, 2010 |
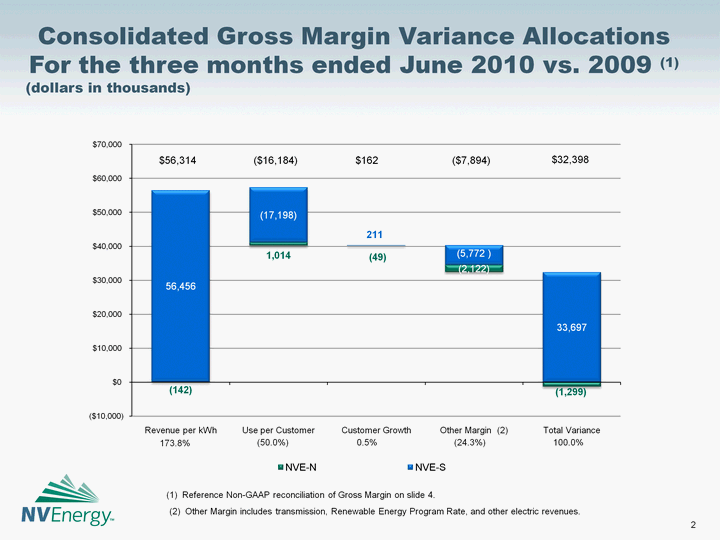
Consolidated Gross Margin Variance Allocations For the three months ended June 2010 vs. 2009 (1) (dollars in thousands) $56,314 ($16,184) $162 ($7,894) $32,398 173.8% (50.0%) 0.5% (24.3%) 100.0% (1) Reference Non-GAAP reconciliation of Gross Margin on slide 4. (2) Other Margin includes transmission, Renewable Energy Program Rate, and other electric revenues. |
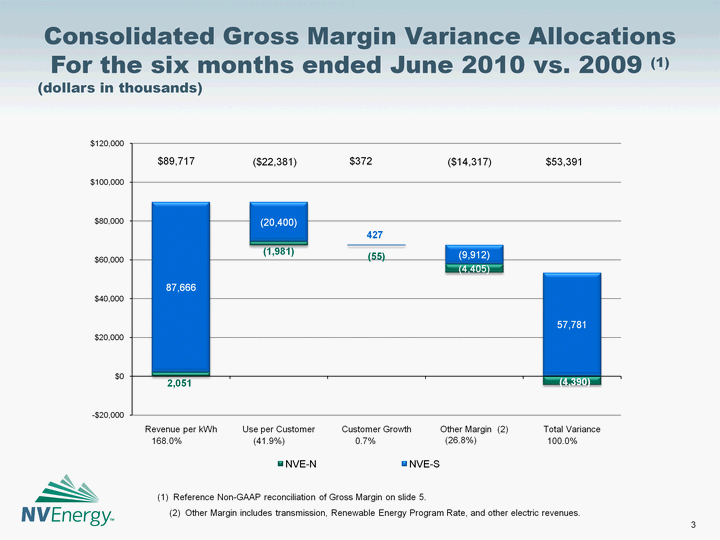
Consolidated Gross Margin Variance Allocations For the six months ended June 2010 vs. 2009 (1) (dollars in thousands) ($22,381) $372 ($14,317) $89,717 $53,391 168.0% (41.9%) 0.7% (26.8%) 100.0% (1) Reference Non-GAAP reconciliation of Gross Margin on slide 5. (2) Other Margin includes transmission, Renewable Energy Program Rate, and other electric revenues. |
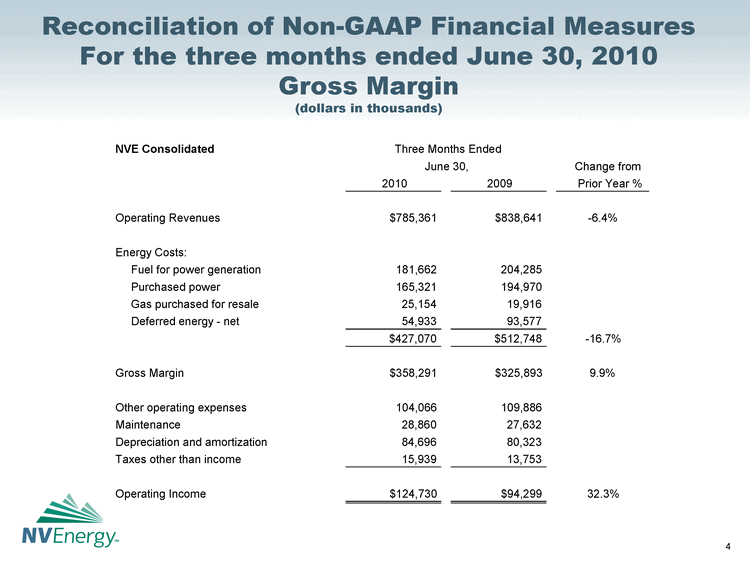
Reconciliation of Non-GAAP Financial Measures For the three months ended June 30, 2010 Gross Margin (dollars in thousands) NVE Consolidated Three Months Ended June 30, % Change from 2010 2009 Prior Year Operating Revenues $785,361 $838,641 -6.4% Energy Costs: Fuel for power generation 181,662 204,285 Purchased Power 165,321 194,970 Gas purchased for resale 25,154 19,916 Deferred energy - net 54,933 93,577 427,070 512,748 -16.7% Gross Margin $358,291 $325,893 9.9% Other operating expenses 104,066 109,886 Maintenance 28,860 27,632 Depreciation and amortization 84,696 80,323 Taxes other than income 15,939 13,753 Operating Income $124,730 $94,299 32.3% |
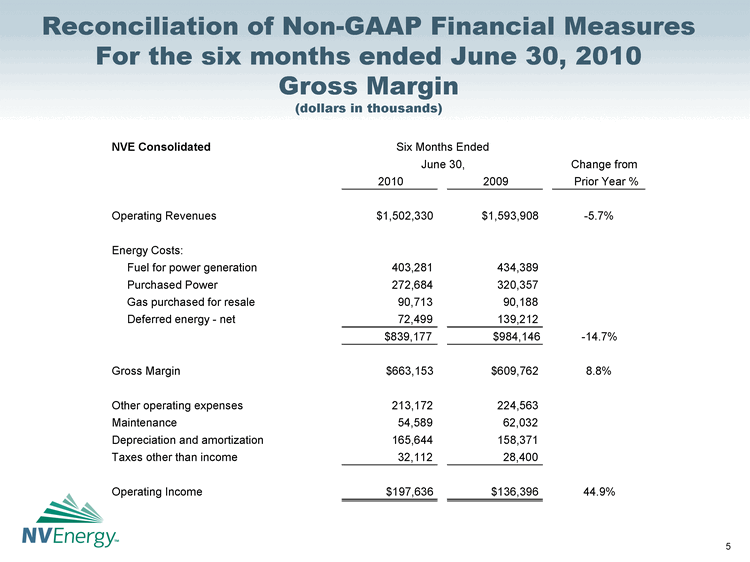
Reconciliation of Non-GAAP Financial Measures For the six months ended June 30, 2010 Gross Margin (dollars in thousands) NVE Consolidated Six Months Ended June 30, % Change from 2010 2009 Prior Year Operating Revenues $1,502,330 $1,593,908 -5.7% Energy Costs: Fuel for power generation 403,281 434,389 Purchased Power 272,684 320,357 Gas purchased for resale 90,713 90,188 Deferred energy - net 72,499 139,212 839,177 984,146 -14.7% Gross Margin $663,153 $609,762 8.8% Other operating expenses 213,172 224,563 Maintenance 54,589 62,032 Depreciation and amortization 165,644 158,371 Taxes other than income 32,112 28,400 Operating Income $197,636 $136,396 44.9% |
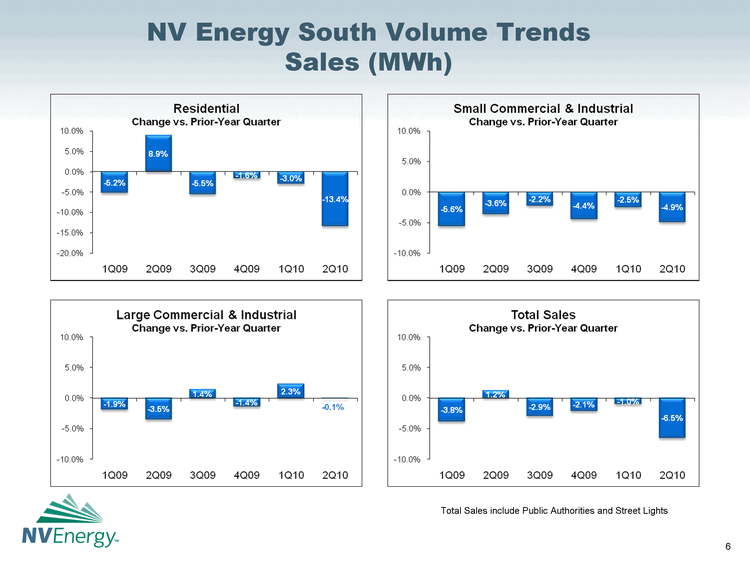
NV Energy South Volume Trends Sales (MWh) Total Sales include Public Authorities and Street Lights |
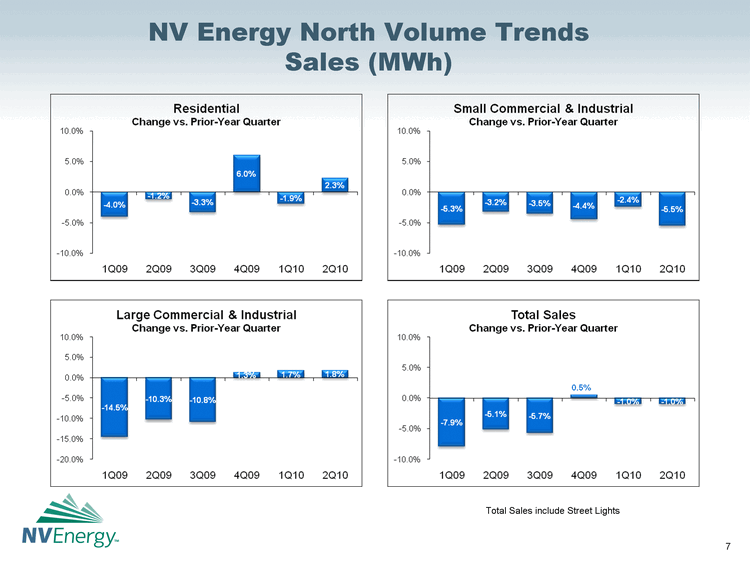
NV Energy North Volume Trends Sales (MWh) Total Sales include Street Lights |
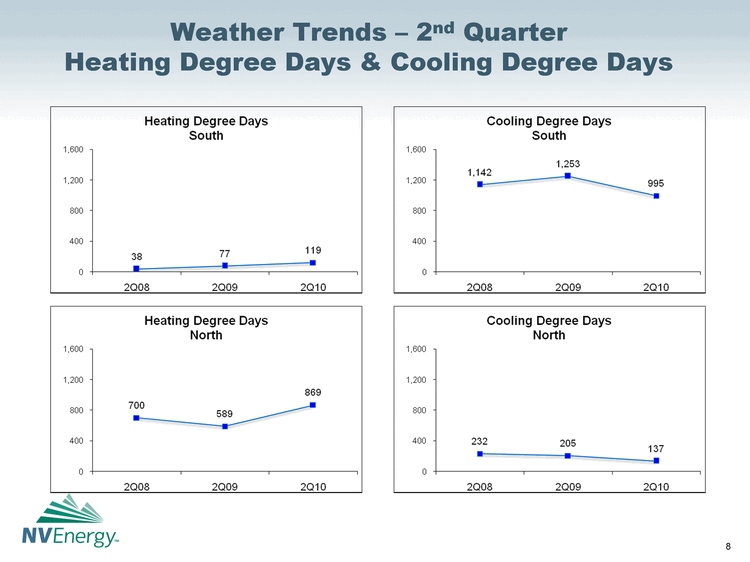
Weather Trends - 2nd Quarter Heating Degree Days & Cooling Degree Days |
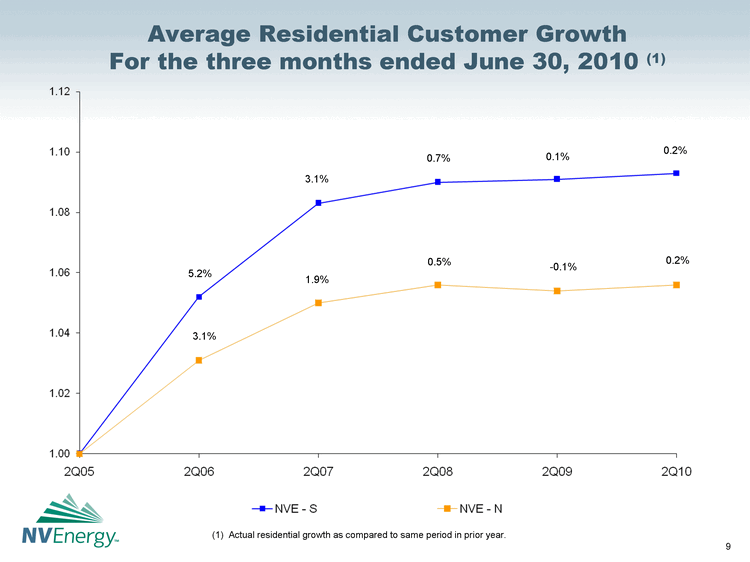
Average Residential Customer Growth For the three months ended June 30, 2010 (1) 0.7% 5.2% 0.1% 1.9% - -0.1% 3.1% 3.1% 0.5% 0.2% 0.2% (1) Actual residential growth as compared to same period in prior year. |
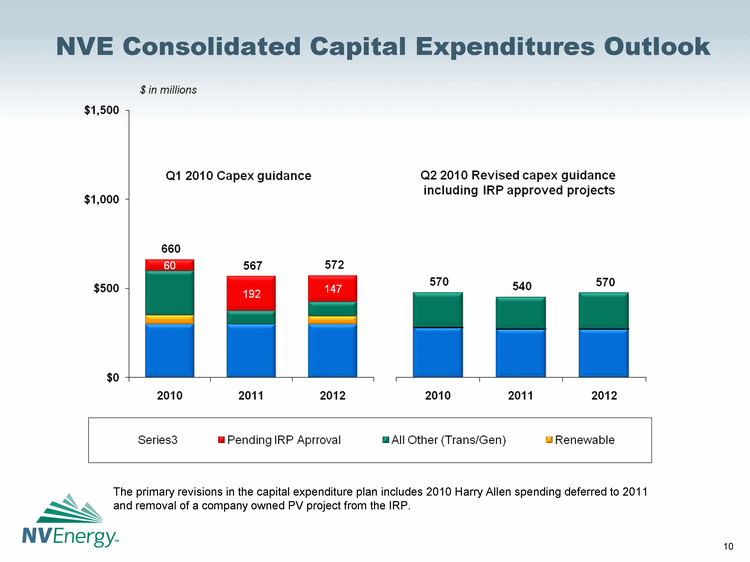
NVE Consolidated Capital Expenditures Outlook NVE Consolidated Capital Expenditures Outlook The primary revisions in the capital expenditure plan includes 2010 Harry Allen spending deferred to 2011 and removal of a company owned PV project from the IRP. |