 NVE 3.0 Investor Meetings New York May 15-16, 2012 Exhibit 99.1 |
 2 Table of Contents Page No. Presentation Supplemental Material Earnings per Share …………………………….. 34 Energy Supply ………………………………….. 35 Energy Delivery………………………………….. Energy Strategy………………………………….. Regulation………………………………………... Other………………………………………………. 4 - 32 .………………………………………….. 36 – 37 38 - 45 46 - 50 51 - 52 |
 3 Safe Harbor Statement IR Contacts Max Kuniansky Britta Carlson Executive, Investor Relations Manager, Investor and Shareholder Relations (702) 402-5627 (702) 402-5624 mkuniansky@nvenergy.com bcarlson@nvenergy.com This presentation may contain forward-looking statements within the meaning of the Private Securities Litigation Reform Act of 1995 regarding the future performance of NV Energy, Inc. and its subsidiaries, Nevada Power Company and Sierra Pacific Power Company both d/b/a NV Energy. Forward-looking statements include earnings guidance and estimates or forecasts of operating and financial metrics. These statements reflect current expectations of future conditions and events and as such are subject to a variety of risks, uncertainties and assumptions that could cause actual results to differ materially from current expectations. These risks, uncertainties and assumptions include, but are not limited to, NV Energy Inc.'s ability to maintain access to the capital markets, NV Energy Inc.'s ability to receive dividends from its subsidiaries, the financial performance of NV Energy Inc.'s subsidiaries, particularly Nevada Power Company and Sierra Pacific Power Company both d/b/a NV Energy, and the discretion of NV Energy Inc.'s Board of Directors with respect to the payment of future dividends based on its periodic review of factors that ordinarily affect dividend policy, such as current and prospective financial condition, earnings and liquidity, prospective business conditions, regulatory factors, and dividend restrictions in NV Energy Inc.'s and its subsidiaries' financing agreements. For Nevada Power Company and Sierra Pacific Power Company both d/b/a NV Energy, these risks and uncertainties include, but are not limited to, future economic conditions both nationally and regionally, changes in the rate of industrial, commercial and residential growth in their service territories, their ability to procure sufficient renewable energy sources in each compliance year to satisfy the Nevada Renewable Energy Portfolio Standard, changes in environmental laws and regulations, construction risks, including but not limited to those associated with the ON Line project, their ability to maintain access to the capital markets for general corporate purposes and to finance construction projects, employee workforce factors, unseasonable weather, drought, wildfire and other natural phenomena, explosions, fires, accidents, mechanical breakdowns that may occur while operating and maintaining an electric and natural gas system, their ability to purchase sufficient fuel, natural gas and power to meet their power demands and natural gas demands for Sierra Pacific Power Company d/b/a NV Energy, financial market conditions, and unfavorable rulings in their pending and future regulatory filings. Further risks, uncertainties and assumptions that may cause actual results to differ from current expectations pertain to weather conditions, customer and sales growth, plant outages, operations and maintenance expense, depreciation and allowance for funds used during construction, interest rates and expense, cash flow and regulatory matters. Additional cautionary statements regarding other risk factors that could have an effect on the future performance of NV Energy, Inc., Nevada Power Company and Sierra Pacific Power Company both d/b/a NV Energy are contained in their Annual Reports on Form 10-K for the year ended December 31, 2011, and quarterly reports on Form 10-Q for the period ended March 31, 2012, each filed with the Securities and Exchange Commission. NV Energy Inc., Nevada Power Company and Sierra Pacific Power Company both d/b/a NV Energy undertake no obligation to release publicly the result of any revisions to these forward-looking statements that may be made to reflect events or circumstances after the date hereof or to reflect the occurrence of unanticipated events. |
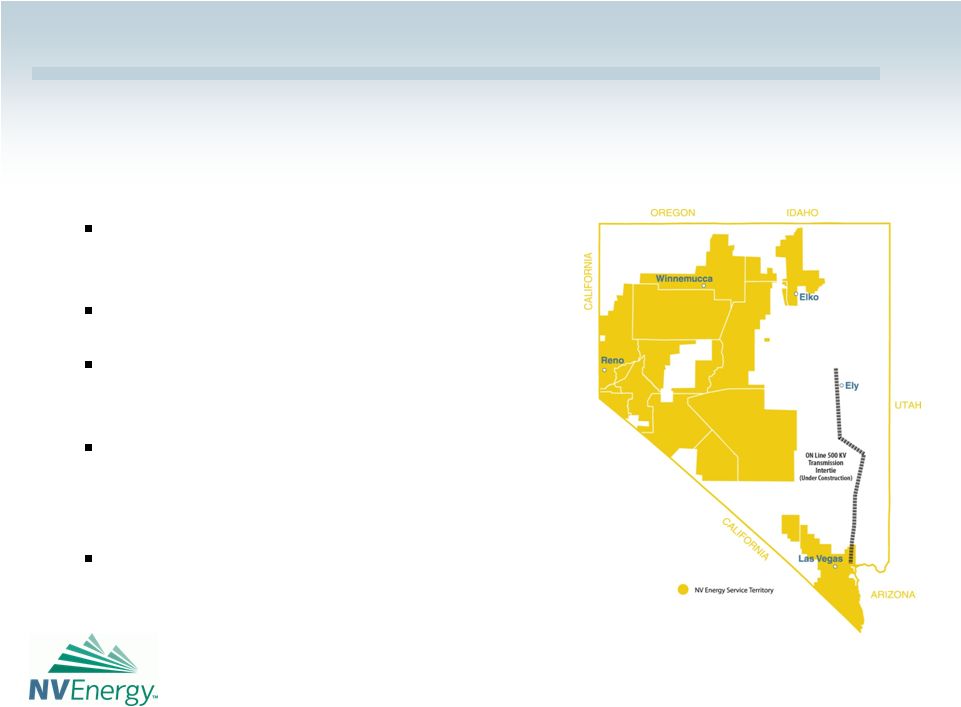
 NV Energy: Who We Are NYSE Ticker: NVE Market Capitalization: $3.9 Billion Customers: 2.4 million Nevadans ~90% of state population 1.3 million customer accounts 40 million tourists annually Territory: ~45,000 sq. miles Transmission: >3,700 miles Generation capacity: 5,862 MW 83% of peak load 2011 peak load: 7,052 MW 4 |
 5 Strong Track Record 2012: Transitioning from rate case-driven growth to deploying free cash flow 1999: Sierra Pacific Resources and Nevada Power merge 2002 – 2011: Western energy crisis; financial recovery; rapid growth; generation expansion NVE 1.0 NVE 2.0 NVE 3.0 Transforming NV Energy |
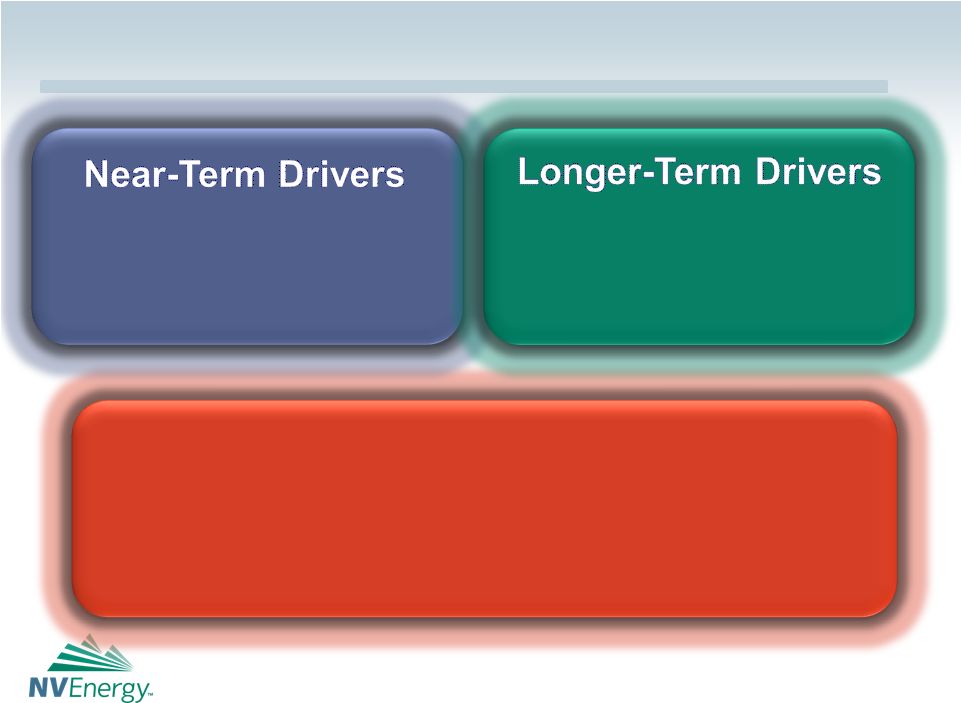
 Rate base additions Economic recovery Operationally well positioned NVE 3.0: Building Shareholder Value Less need for major rate relief Stable earnings, improving ROE Free cash flow Customer-focused philosophy Empowering employees Reasonable, constructive regulation Sound corporate governance Near-Term Drivers Longer-Term Drivers |
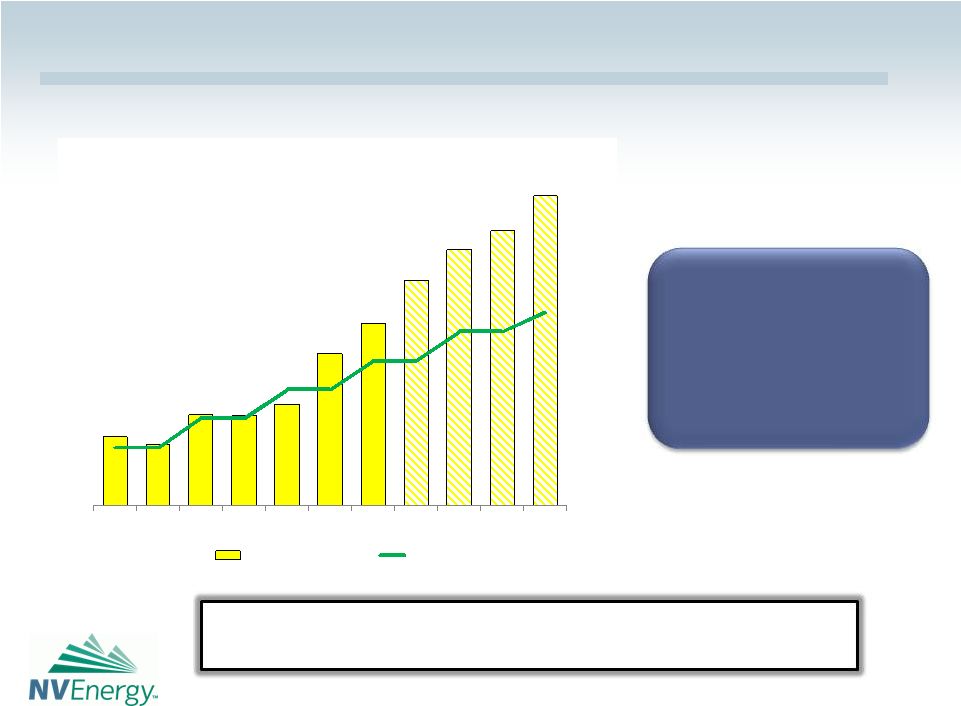
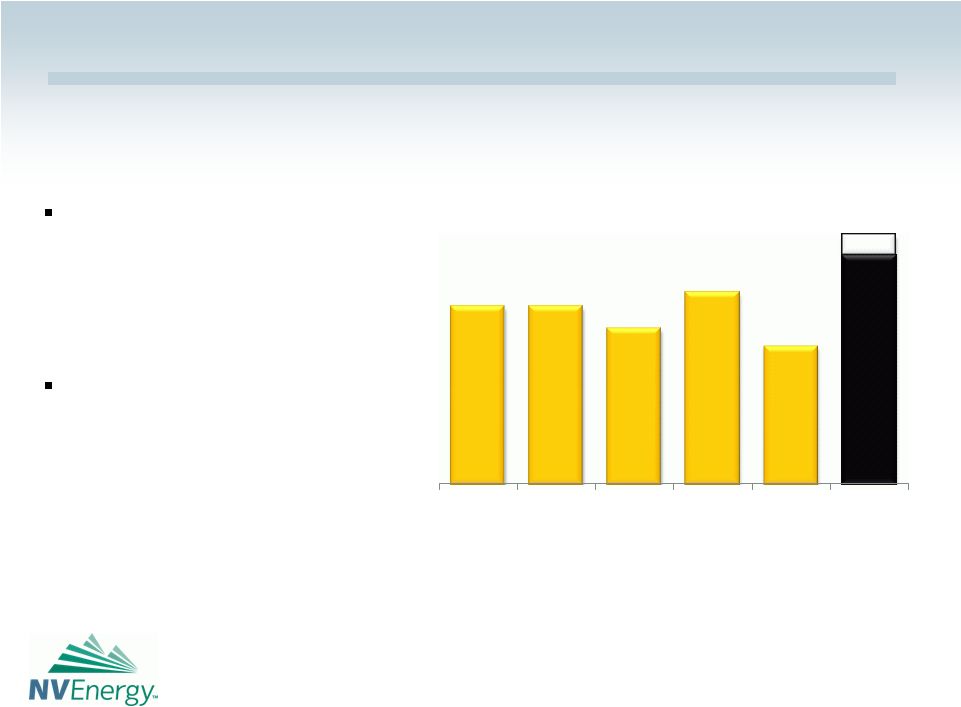 7 Less Need for Major Rate Relief Driven by: – Generation expansion – Demand growth – Rate relief Rate increases: – $223 million effective July 2009 – $159 million effective January 2012 Guidance: $1.15 - $1.25 Past Results * Based on midpoint of guidance range As provided on most recent earnings conference call. Does not constitute an affirmation of guidance previously provided. $0.89 $0.89 $0.78 $0.96 $0.69 2007 2008 2009 2010 2011 2012 Earnings Per Share GAAP 7.0% 6.8% 5.8% 6.9% 4.8% 8%* ROE |
 Less Need for Major Rate Relief Generation Expansion Cycle Complete Additions 2006: Lenzie Gas 1,102 Harry Allen Peaker Gas 80 Silverhawk Gas 395 2008: Tracy Gas 541 Clark Peakers Gas 619 Higgins Gas 530 2010: Goodsprings Waste heat 5 2011: Harry Allen Gas 484 Retirements and other (691) Net capacity added 3,065 8 All capacity additions are now in rates NV-Owned Generation (MW) 2,797 5,862 |
 9 Stable Earnings, Improving ROE Entering a period of more stable earnings – No major projects – Slow demand growth Lower-risk earnings drivers: – Cost control – Lower interest expense Current Environment * Forecast |
 Stable Earnings, Improving ROE Regulatory ROE should be much closer to allowed ROE GAAP ROE will reflect:* – Holding company debt – Goodwill – Lenzie regulatory asset – Deferred energy (Western energy crisis) Regulatory Lag Decreasing *For further details, see Note 3 of the 2011 Form 10-K 10 |
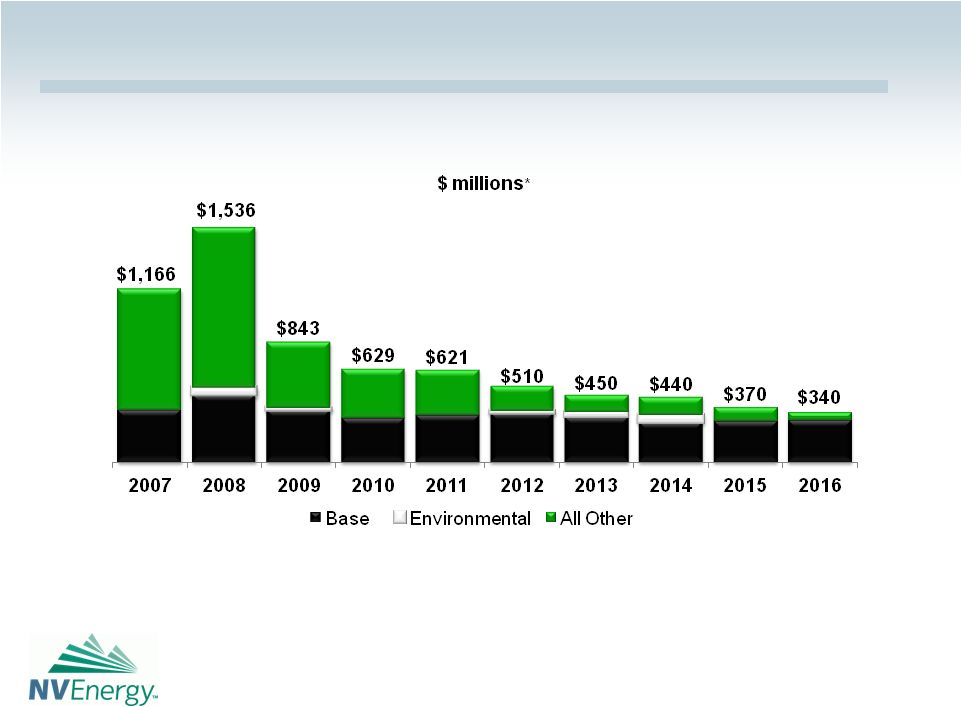 11 Free Cash Flow Decreasing Capital Expenditures Are a Key Driver * Gross expenditures, including contributions in aid of construction, debt AFUDC, and net salvage |
 12 Free Cash Flow Drivers: – Decreasing capital expenditures – Generation additions now in rates – NOL carryforward – Deferred energy Uses: – Increase dividend payout – Reduce debt – Potential new investments – Deferred energy Uses are not mutually exclusive. All can be accomplished over the next several years. |
 13 Free Cash Flow More than doubled quarterly dividend since 2007 Increased dividend 31% in May 2012 Policy: target dividend payout ratio = 55%-65% Can be achieved while reducing debt and considering investments * Assumes $0.17/share in Q3/Q4 2012 Committed to Dividend Growth Building shareholder value by returning capital |
 14 Free Cash Flow Goal: achieve more balanced capital structure over next several years Benefits earnings Strengthens balance sheet before next growth cycle Debt Reduction Capital Structure As of March 31, 2012 |
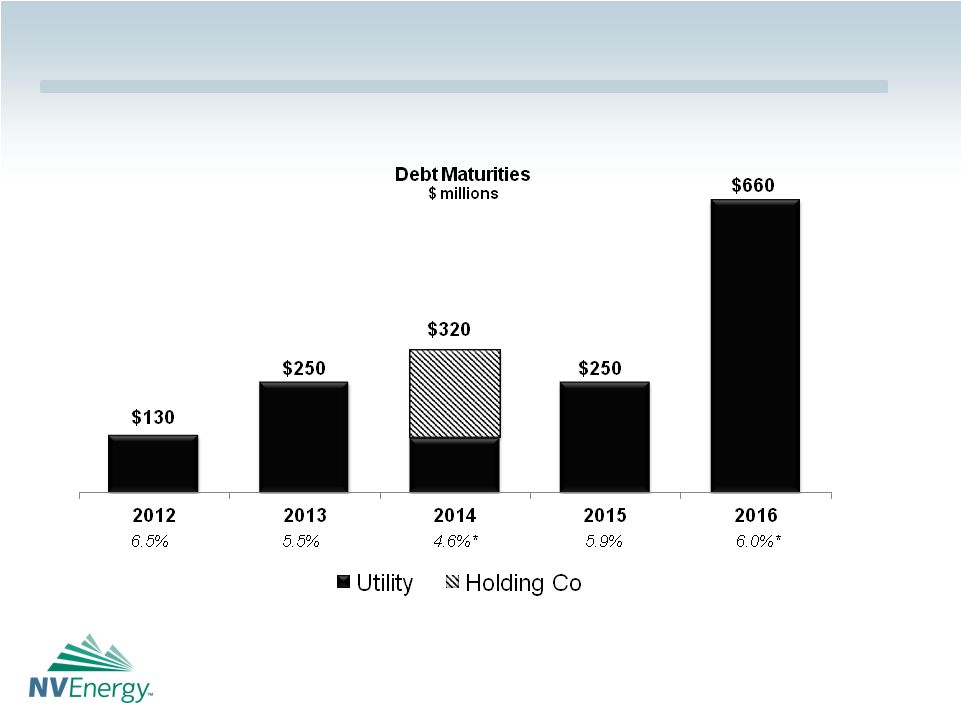 Free Cash Flow Some Maturities May be Met With Cash * Weighted average Coupon: 15 |
 NVE 3.0: Building Shareholder Value Customer-focused philosophy Empowering employees Reasonable, constructive regulation Sound corporate governance Less need for major rate relief Stable earnings, improving ROE Free cash flow Rate base additions Economic recovery Operationally well positioned 16 Near-Term Drivers Longer-Term Drivers |
 NV Energize: – $164 million – year-end 2012 ON Line: – $139 million – Second half of 2013 Rate Base Additions Over $300 Million by 2013 2013 O&M reduction: $12 million 17 |
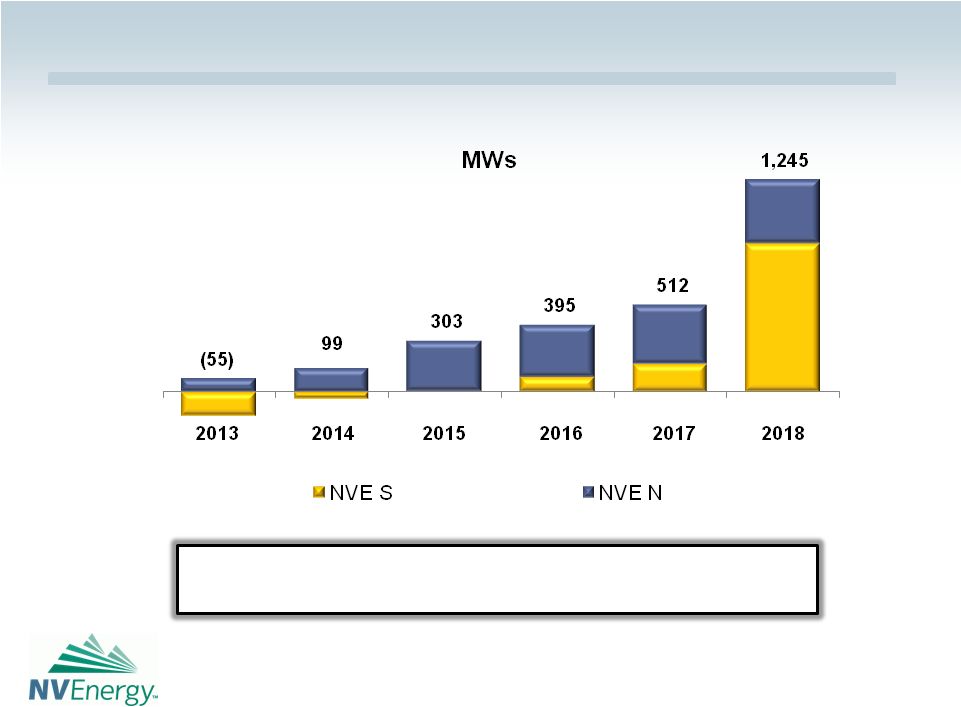 Outlook: Generation Capacity Needs PPA contract expirations include: 125 MW in 2012, 224 MW in 2013, and 620 MW in 2017 18 |
 19 Controlling costs in a difficult economy Well positioned for near-flat demand – Controlling O&M – Reducing debt – Returning capital to shareholders Infrastructure in place for future growth Upside leverage when recovery commences Economic Recovery Slow Recovery Expected in Nevada |
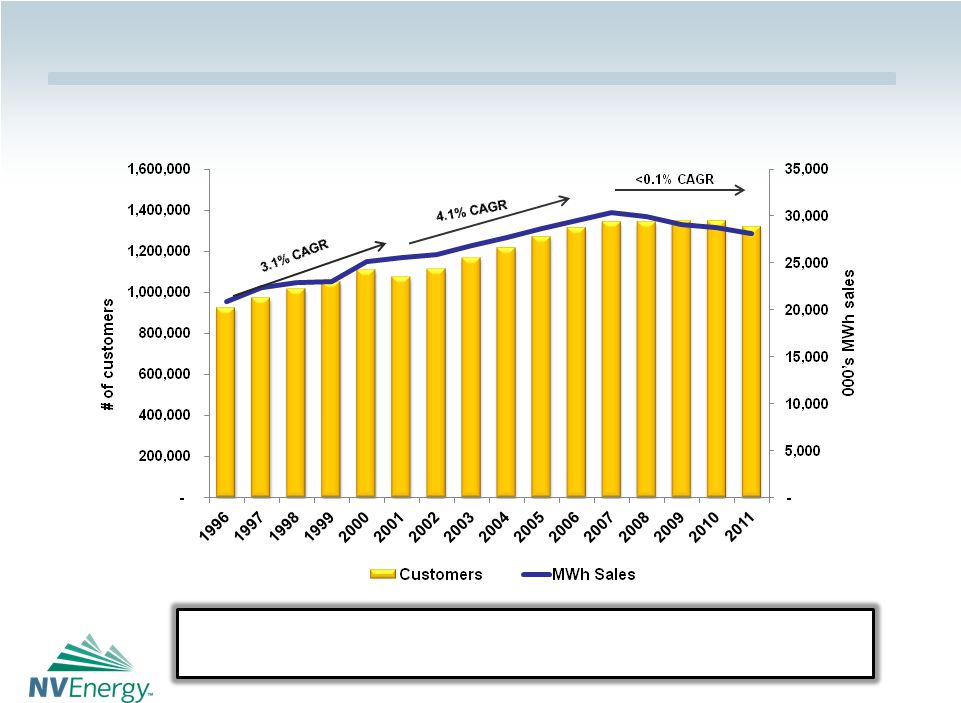 Nevada Economy 3-4% Customer Growth Before Recession Key economic indicators for NVE include unemployment, job growth, population and low-use accounts 20 |
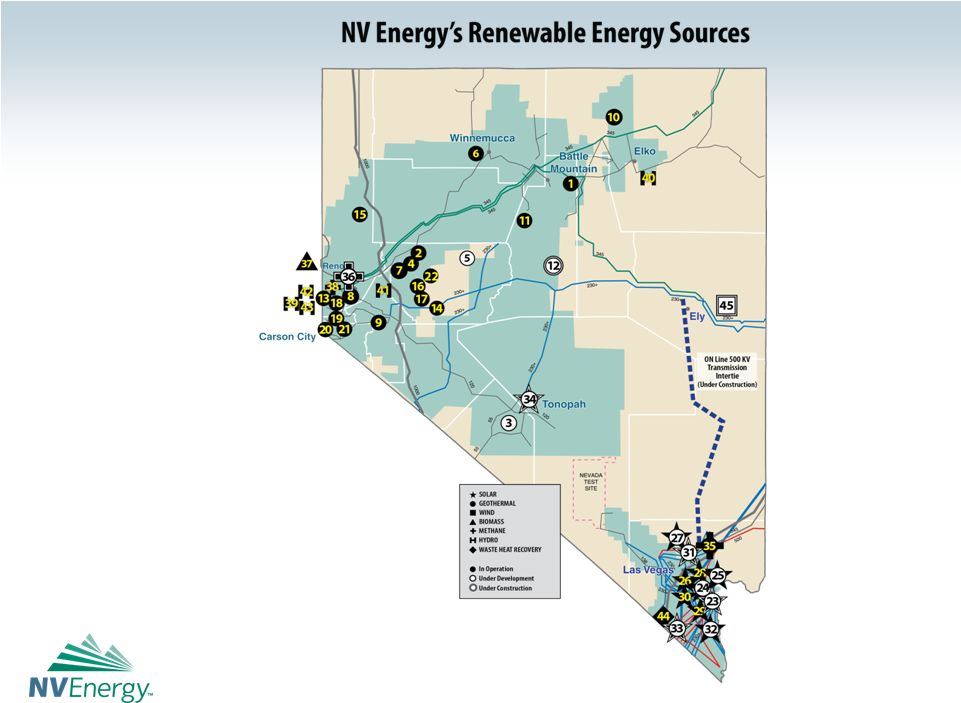
 21 Operationally Well Positioned Ideal for renewable energy – Solar – Geothermal Renewable portfolio standard: 25% by 2025 Potential to export to CA, AZ Exploring transmission opportunities Strategically Located in Desert Southwest Committed Renewable Energy Projects 45 Projects, 1,090 MW as of March 2012 |
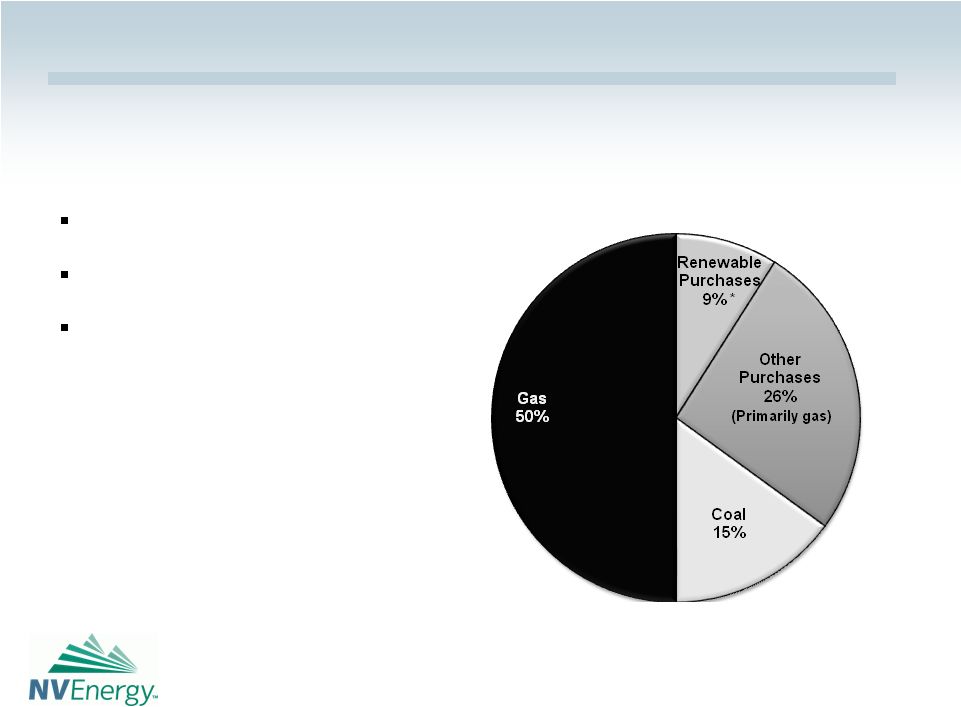 22 Operationally Well Positioned New, efficient gas plants 8 of 9 coal units scrubbed Low-mercury coal Total Sources 2011 30.4 million MWh * Does not include energy efficiency and conservation, demand side management and other programs which contribute to renewable portfolio standard compliance. Low Environmental Compliance Exposure |
 Operationally Well Positioned Number of service interruptions per customer per year Hours of service interruptions per customer per year Top-Ranked Reliability 23 Reliability metrics were the best in the nation in 2009 and ranked in the top decile in 2010. Both metrics improved in 2011. |
 NVE 3.0: Building Shareholder Value Customer-focused philosophy Customer-focused philosophy Empowering employees Empowering employees Reasonable, constructive regulation Reasonable, constructive regulation Sound corporate governance Sound corporate governance Less need for major rate relief Stable earnings, improving ROE Free cash flow Rate base additions Economic recovery Operationally well positioned 24 Near-Term Drivers Longer-Term Drivers |
 Customer-Focused Philosophy Customer-Focused Reasonable, Constructive Regulation Building Shareholder Value • Safe, reliable, affordable energy • Empowering customers with self-managed usage 25 |
 26 Customer-Focused Philosophy Affordable Energy Increased revenues contributing to earnings with minimal impact to customers $0.116 /kWh $0.114 /kWh NVE-S* NVE-N* * Residential $0.124 /kWh $0.100 /kWh Earned Return Pass Through $0.070 $0.044 $0.044 $0.072 $0.075 $0.039 $0.049 $0.061 2007 2012 2007 2012 |
 27 Continuously improve processes Control O&M expense while load is flat Other opportunities include: Empowering Employees Improve Processes, Reduce Costs, Enhance Performance - NV Energize - Operating highly efficient generating facilities - Vendor contract negotiations - ON Line related savings |
 28 Reasonable, Constructive Regulation December rate decision was fair, reasonable IRP process reduces risk; major projects approved in advance Quarterly fuel and DEAA adjustments should stabilize cash flows Allowed to recover lost revenue Potential for higher equity ratio Supports Stable Earnings $ billions Rate base = $7.3 44% equity = $3.2 50% equity = $3.7 |
 29 Sound Corporate Governance Incentive-based, pay for performance compensation Stock ownership guidelines for board, senior officers 9 of 10 directors are independent Separated Chairman and CEO roles Eliminated classified board Adopted majority voting, reduced supermajority provisions Responded to all shareholder proposals Aligned with Investors’ Interests |
 30 Outlook: 2012 2012 Earnings Guidance: $1.15 - $1.25 / share* Guidance is based on ongoing, normalized EPS, excluding unexpected events such as plant outages, required regulatory/accounting adjustments, etc. For further information see forward –looking statements and risk factors in 2011 Form 10-K and Form 10-Q for the period ended March 31, 2012. As provided on most recent earnings conference call. Does not constitute an affirmation of guidance previously provided. * Excludes NVE-S rate increase effective January 1 Assumptions Weather Normal Gross margin ~1% increase* from customer growth O&M expense Flat Depreciation, AFUDC Harry Allen, capital expenditures Interest expense Decrease due to 2011 refinancings , debt reduction |
 31 Why Invest in NV Energy? Focused on Building Value for Shareholders slow growth = return capital to shareholders aspiration: 50% spread narrowing initiated Nevada economy Dividend payout Debt Equity ratio ROE vs. allowed Need for rate relief Guidance The Road Ahead |
 NVE 3.0: Building Shareholder Value Customer-focused philosophy Customer-focused philosophy Empowering employees Empowering employees Reasonable, constructive regulation Reasonable, constructive regulation Sound corporate governance Sound corporate governance Less need for major rate relief Stable earnings, improving ROE Free cash flow Rate base additions Economic recovery Operationally well positioned 32 |
 33 Supplemental Material |
 Earnings per Share (diluted) Third Quarter is Key to 12-Month Results Summer weather in southern Nevada can significantly affect financial results 34 |
 Energy Supply Capacity Utilization Reflects Highly Seasonal Demand Efficient, Low-Cost Generation NV’s Tracy and Higgins units were the lowest- cost producers in the Electric Utilities Cost Group in 2011 and 2009 respectively. 35 |
 Energy Delivery Sales 28.2 million MWh* Electric Revenues $2.6 billion* *Excludes California 2011 Retail Mining and gaming follow different cycles, making these sectors somewhat counter-balancing 36 |
 Top-Ranked Reliability Both reliability metrics were ranked top-decile among surveyed companies in 2010 37 |
 38 The NVE Transformation 2003 2011 % Increase/(Decrease) Self-Owned Generation (MW) 2,797 5,862 110% O&M (Cents/kWh) $2.76 $2.64 -4% Effective Rate (Cents/kWh) ¹ $9.77 $10.00 2% Fuel (Cents/kWh) ² $7.23 $4.66 -36% Non-Fuel (Cents/kWh) ³ $2.54 $5.34 110% Gross Margin ($ millions) $845 $1,543 83% Effective Cost of Debt 9.5% 6.4% -33% Price per Share (Year-ended) $7.34 $16.35 123% Dividend per Share --- $0.49 --- Credit Ratings (S&P/Moody's) NVE-S BB,B+ / Ba2 BBB / Baa2 NVE-N BB,B+ / Ba2 BBB / Baa2 1 Defined as Total Retail Electric Revenue/Total Retail Electric Sales [2011 includes NVE-South GRC of approx. $158 million, offset with $58 million NVE-South GRC and reduced BTER rates of $45 million] 2 Defined as Total Fuel & Purchased Power Costs + Deferred Energy-Net/Total Retail Electric Sales 3 Defined as Total Retail Electric Revenue - (Fuel & Purchased Power Costs + Deferred Energy-Net)/Total Retail Electric Sales |
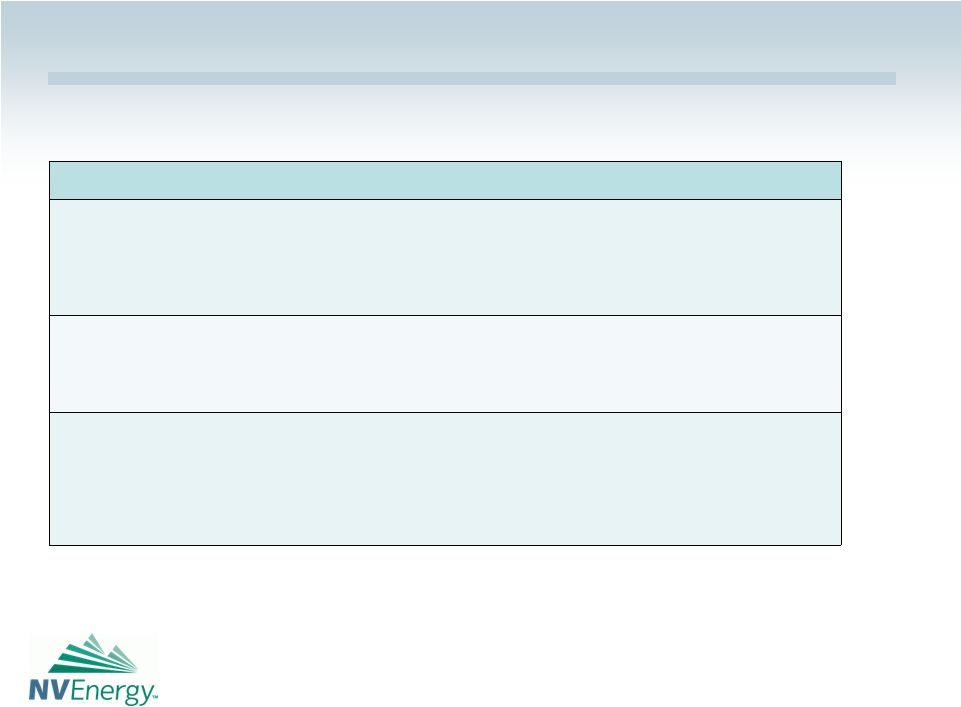
 39 Energy Strategy: Evolution 2007-2011 Results The Road Ahead Increase energy efficiency, conservation • Significant energy savings • Included in portfolio standard • DOE grant • Over 900,000 smart meters • “Lost revenue” recovery EMPOWER CUSTOMERS THROUGH MORE FOCUSED ENERGY EFFICIENCY PROGRAMS Expand renewable energy initiatives and investments • Met portfolio standard while minimizing costs • Invested in Goodsprings • Expanded to include out -of-state and PEC-only purchases PURSUE COST-EFFECTIVE RENEWABLE ENERGY INITIATIVES Add new generation and transmission • Achieved energy independence through acquisitions, construction • Obtained ON Line approval OPTIMIZE GENERATION EFFICIENCY AND TRANSMISSION ENGAGE EMPLOYEES TO IMPROVE PROCESSES, REDUCE COSTS, ENHANCE PERFORMANCE |
 40 Can contribute 1/4 of Portfolio Standard PUCN approved recovery of lost revenues, program costs NV Energize: smart meters for all customers – Estimated total cost: $300 million – Federal grant: $139 million Empower Customers through More Focused Energy Efficiency Programs Energy Strategy |
 41 Complying with portfolio standard cost effectively – 15% in 2011 - 2012 – 25% by 2025 Find investments that add value for customers, shareholders Expand transmission capability for export Energy Strategy Pursue Cost-Effective Renewable Energy Initiatives |
 42 Nevada Portfolio Standard Escalating Renewable Energy Requirement: 25% by 2025 Standard 2011-2012 15% 2013-2014 18% 2015-2019 20% 2020-2024 22% 2025 and after 25% Up to 1/4 of standard can be met from demand side management, energy efficiency and conservation 7% 6% 9% 9% 10% 16% 19% 23% 27% 29% 32% 2005A 2007A 2009A 2011A 2013E 2015E Percentage of Retail Sales NV actual/forecast Standard |
 43 Committed Renewable Energy Projects Geothermal MW Solar MW Hydro MW 1 Beowawe Power 17.7 23 Amonix Pecos 0.5 39 Fleish 2.3 2 Brady 24.0 24 CNLV 1.0 40 Hooper 0.8 3 Clayton Valley 1 53.5 25 FRV Spectrum 30.0 41 Truckee Carson Irrigation District 4.0 4 Desert Peak 25.0 26 Las Vegas Valley Water District (Six Projects) 3.0 42 Verdi 2.2 5 Dixie Meadows 51.0 27 Mountain View 20.0 43 Washoe 2.2 6 Faulkner 1 49.5 28 Nellis AFB Solar Star 13.2 7 Galena 2 13.0 29 Nevada Solar One 69.0 Waste Heat Recovery MW 8 Galena 3 26.5 30 Procaps Laboratory 0.2 44 Goodsprings 7.5 9 Homestretch 2.1 31 RV Apex 20.0 10 Tuscarora (aka Hot Sulphur Springs 2) 25.0 32 Searchlight 17.5 Wind MW 11 Jersey Valley 22.5 33 Silver State 50.0 45 Spring Valley 151.8 12 McGinness Hills 52.0 34 Crescent Dunes 110.0 13 Richard Burdette 26.0 14 Salt Wells 23.6 Biomass/Methane MW 15 San Emidio 11.8 35 CC Landfill Energy 12.0 16 Soda Lake I 3.6 36 Lockwood Renewable Energy 3.2 17 Soda Lake II 19.5 37 Sierra Pacific Industries 10.0 18 Steamboat Hills 14.6 38 Truckee Meadows Water Reclamation 0.8 19 Steamboat IA 2.0 20 Steamboat II 13.4 21 Steamboat III 13.4 22 Stillwater 2 47.2 Stillwater 2 Photovoltaic Addition 22.0 1,090 Megawatts |
 44 |
 45 235 mile 500 kV line will interconnect northern, southern systems Permits economic fleet dispatch Increases reliability, key for renewable energy development Estimated cost: $556 million. NVE’s ownership portion: $139 million (includes AFUDC) Joint venture : 25% NVE, 75% Great Basin Transmission Optimize Generation Efficiency and Transmission Energy Strategy ON Line |
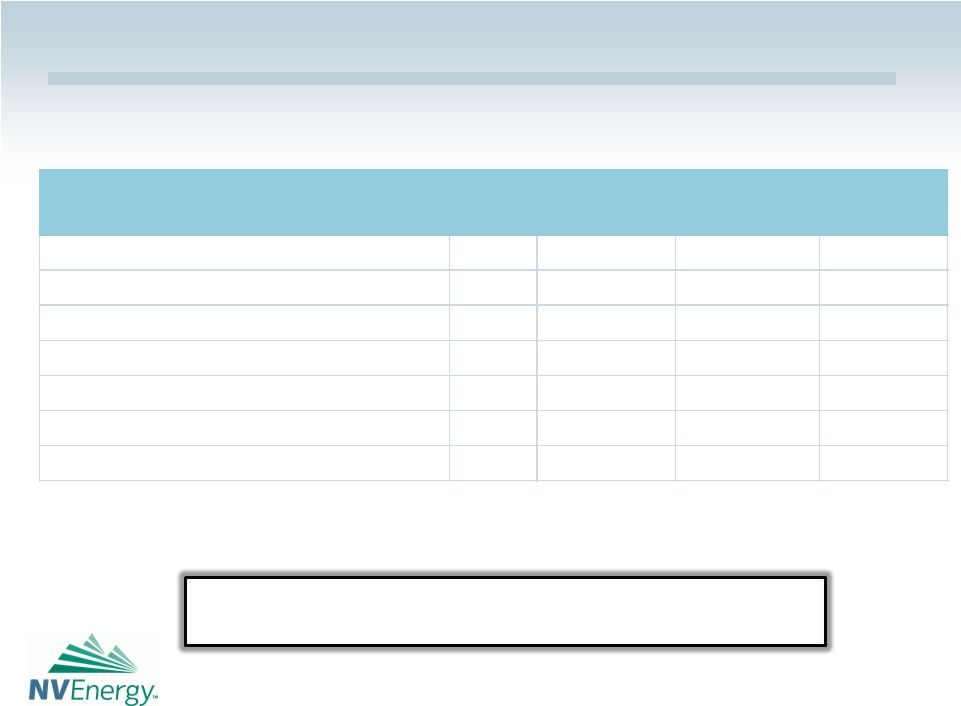
 46 Key Regulatory Metrics Total NVE – S NVE – N Rate base $1.84 ($ billions, 12/31/2011) $7.34 $5.50 Equity ratio: GAAP actual, 12/31/2011 39.8% 45.2% 45.3% Regulatory - allowed 44.3%* 44.4% 44.1% ROE, 2011: GAAP 4.8% 4.7% 6.2% Regulatory - actual 6.9%* 6.2% 9.3% Regulatory – allowed 10.0%* 10.0% 10.1% Last general rate order 12/23/2011 12/23/2010 * Total is weighted based on rate base. |
 47 NVE South Rate Case New rates effective January 1, 2012 Benefits: – Harry Allen plant cost recovery ($700 million investment) – Should reduce shortfall vs. allowed return – Free cash flow Granted Requested Revenue increase ($ millions) $158.6 (1) $249.9 Return on equity 10.00% 11.25% Rate base ($ billions) $5.48 $5.59 (1) $17 million = increased depreciation, excluding Harry Allen. $12.7 million = increased amortization (DSM cost recovery) |
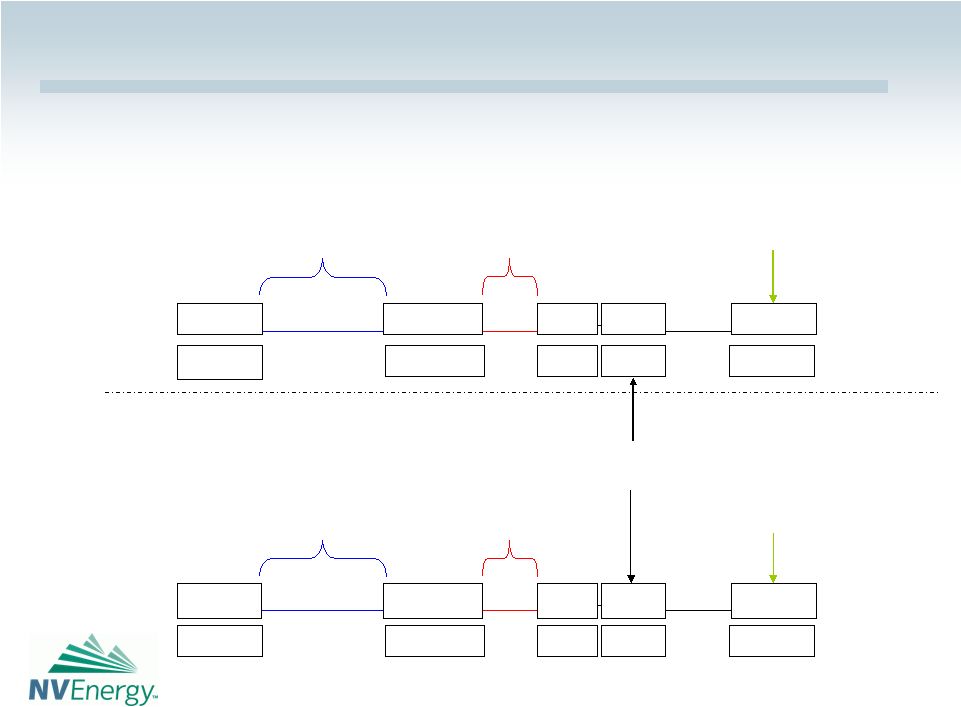 48 Rate Case Filing Calendar TEST PERIOD CERTIFICATION RATES IN EFFECT May 2011 January 2010 December 2010 June 2011 January 2012 TEST PERIOD CERTIFICATION FILE GRC RATES IN EFFECT May 2013 January 2012 December 2012 June 2013 January 2014 NV Energy South NV Energy North January 2013 January 2015 December 2013 May 2014 May 2016 June 2014 January 2015 December 2015 June 2016 January 2017 PERIOD PERIOD |
 49 Public Utility Commission of Nevada Three Commissioners; Four-Year Terms; Appointed by the Governor Alaina Burtenshaw (D) Began Serving: January 2010 Term Ends: September 30, 2013 Appointed Chairman February 2011. Administrative law background. Has been with the PUCN since 1992, served as Staff Counsel and Assistant Staff Counsel. Rebecca Wagner (R) Began Serving: September 2006 Term Ends: September 30, 2015 Served as Energy Advisor to the Governor and Director of the Nevada State Office of Energy. Previously worked for Nevada-based geothermal company. David Noble (NP) Began Serving: August 2011 Term Ends: September 30, 2012 Has been with the PUCN since 1997 as administrative attorney, assistant staff counsel, assistant general counsel, and hearings officer. Also served as Commission liaison to Nevada Legislature on utility and administrative matters over last six regular legislative sessions. |
 50 Regulatory Matters Fact Sheet May 1, 2012 Issue Timeline Docket Fuel, Purchased Power and Renewable Energy • March 1, 2012: Made annual filings. Hearings to review prudency and reasonableness of fuel and purchased power costs expected in late summer. New renewable energy program rates expected effective October 1, 2012. 12-03004 (NVE-South) 12-03005 (NVE-North- Electric) 12-03006 (NVE-North- Gas) Energy Efficiency Cost /Lost Revenue Recovery • July 9, 2012: Filing for proposed reset of rates. New rates effective Jan 1, 2013. TBD Integrated Resource Plan • June 29, 2012: NVE-S files integrated resource plan, energy supply plan and demand side management plan. • August 2012: NVE-N files energy supply plan and demand side management plan. • Decision expected by year-end 2012. TBD |
 51 Solid Financial Position Standard & Poor's Moody's Fitch Latest Ratings Review 26-Oct-11 11-May-11 16-May-11 Nevada Power Senior secured debt BBB Baa2 BBB Outlook Stable Stable Stable Sierra Pacific Power Senior secured debt BBB Baa2 BBB Outlook Stable Stable Stable NV Energy Senior unsecured debt BB+ Ba2 BB Outlook Stable Stable Stable Utilities Rated Investment Grade |
 52 Southern Nevada Economy Key Metrics Indicator Date Latest Period Previous Period Year Ago Total Employment Feb-12 799,500 802,900 797,300 Unemployment Rate Feb-12 12.20% 13.30% 13.70% New Residents (Drivers License Count) Feb-12 5,061 6,885 4,437 Active Residential Electric Meter Count Feb-12 744,422 743,513 731,295 Median Price of a New Home Feb-12 $193,900 $207,000 $193,000 Median Price of an Existing Home Feb-12 $105,000 $108,000 $115,000 Apartment Vacancy Rate Q4 2011 9.70% 10.40% 10.60% Gaming and tourism industry conditions affect employment, but are not a primary driver of NVE results |