
Q2 2016 Earnings Presentation August, 2016 Presented By: Henry Dubois, Chief Executive Officer Steven Balthazor, Chief Financial Officer (NYSE Mkt: HH) 1
2 Safe Harbor Statement 2 This presentation may contain forward-looking statements within the meaning of the federal securities laws. Forward-looking statements may generally be identified by the use of words such as "anticipate," "believe," "expect," "intends," "plan," and "will" or, in each case, their negative, and other variations or comparable terminology. These forward-looking statements include all statements other than historical facts. Any forward-looking statement made by management during this call is not a guarantee of future performance, and actual results may differ materially from those expressed in or suggested by the forward- looking statements, as a result of various factors, including, without limitation the factors discussed in the “Risk Factors” section of the company’s Annual Report on Form 10-K for the year ended December 31, 2015, as the same may be updated from time-to-time in subsequent filings with the Securities and Exchange Commission. Any forward-looking statement made by management on this call speaks only as of the date hereof, and the Company has no obligation, and does not intend, to update any forward-looking statements after the date hereof, except as required by federal securities laws. In addition, management uses the non-GAAP performance measures EBITDA and Adjusted EBITDA on this call. You can find a reconciliation of such measures to their nearest GAAP equivalent in the Company’s earnings release, which is available on our website.
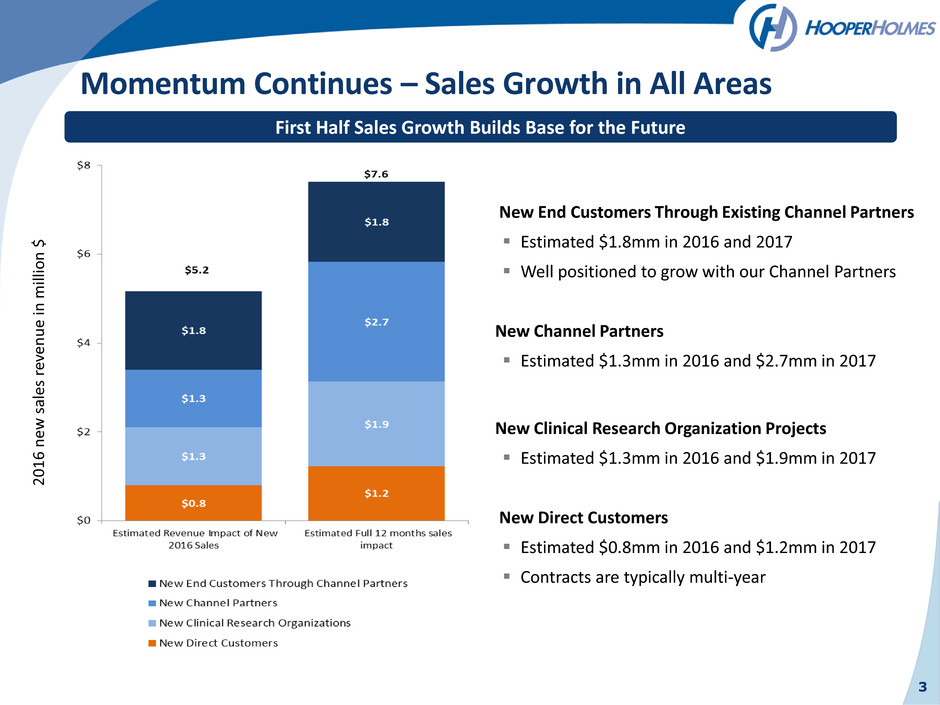
3 2 0 1 6 n ew s al e s re ve n u e in mil lio n $ Momentum Continues – Sales Growth in All Areas First Half Sales Growth Builds Base for the Future New End Customers Through Existing Channel Partners Estimated $1.8mm in 2016 and 2017 Well positioned to grow with our Channel Partners New Channel Partners Estimated $1.3mm in 2016 and $2.7mm in 2017 New Clinical Research Organization Projects Estimated $1.3mm in 2016 and $1.9mm in 2017 New Direct Customers Estimated $0.8mm in 2016 and $1.2mm in 2017 Contracts are typically multi-year
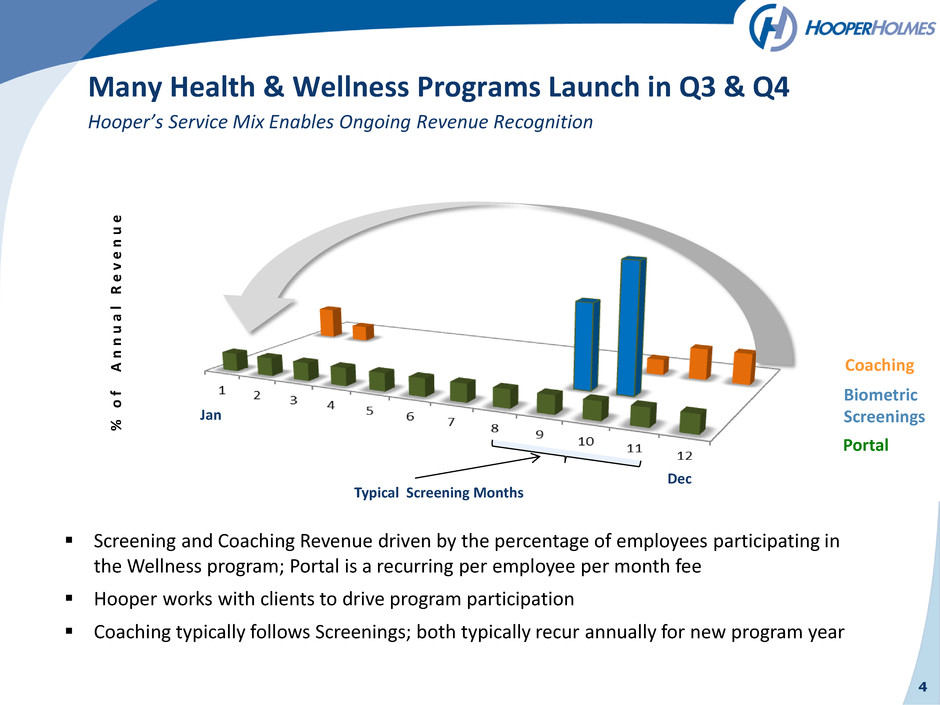
4 Many Health & Wellness Programs Launch in Q3 & Q4 Hooper’s Service Mix Enables Ongoing Revenue Recognition Screening and Coaching Revenue driven by the percentage of employees participating in the Wellness program; Portal is a recurring per employee per month fee Hooper works with clients to drive program participation Coaching typically follows Screenings; both typically recur annually for new program year % o f A n n u a l R e v e n u e Portal Coaching Biometric Screenings Typical Screening Months Dec Jan
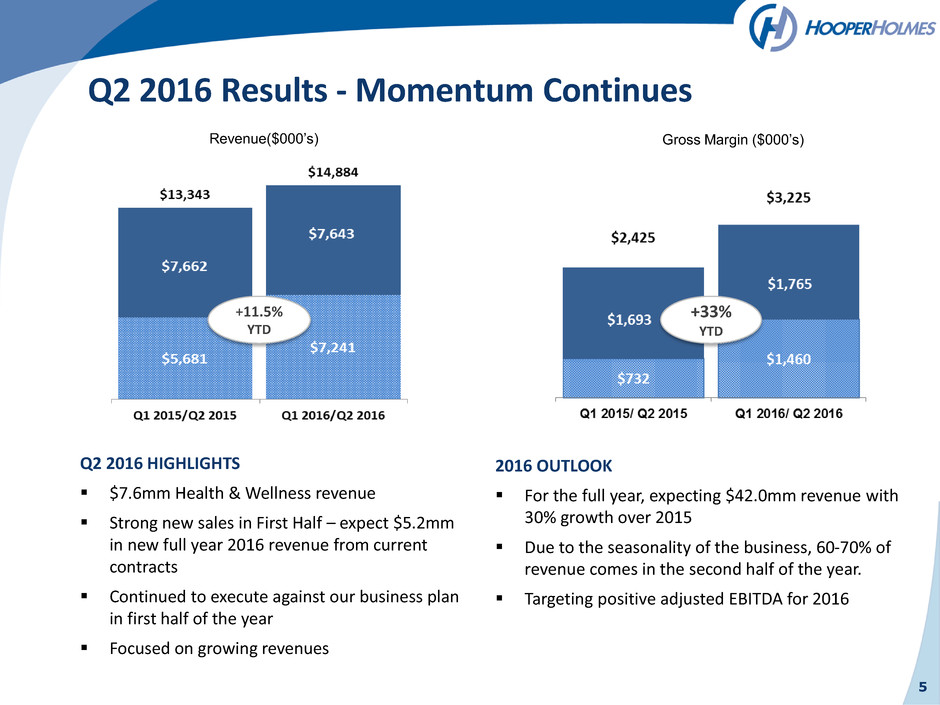
5 Q2 2016 HIGHLIGHTS $7.6mm Health & Wellness revenue Strong new sales in First Half – expect $5.2mm in new full year 2016 revenue from current contracts Continued to execute against our business plan in first half of the year Focused on growing revenues Q2 2016 Results - Momentum Continues 2016 OUTLOOK For the full year, expecting $42.0mm revenue with 30% growth over 2015 Due to the seasonality of the business, 60-70% of revenue comes in the second half of the year. Targeting positive adjusted EBITDA for 2016 Gross Margin ($000’s) +33% YTD +11.5% YTD Revenue($000’s)
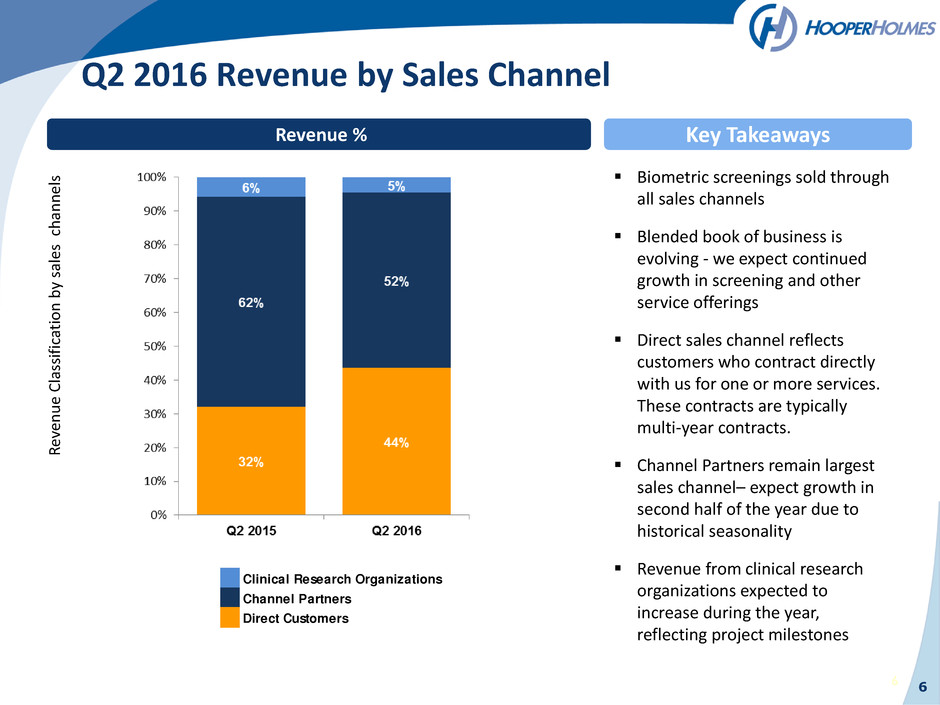
6 6 Revenue % Key Takeaways Q2 2016 Revenue by Sales Channel R ev en u e C la ss if ic atio n b y sal e s c h an n e ls Biometric screenings sold through all sales channels Blended book of business is evolving - we expect continued growth in screening and other service offerings Direct sales channel reflects customers who contract directly with us for one or more services. These contracts are typically multi-year contracts. Channel Partners remain largest sales channel– expect growth in second half of the year due to historical seasonality Revenue from clinical research organizations expected to increase during the year, reflecting project milestones Clinical Research Or anizations Channel Partners Direct Customers
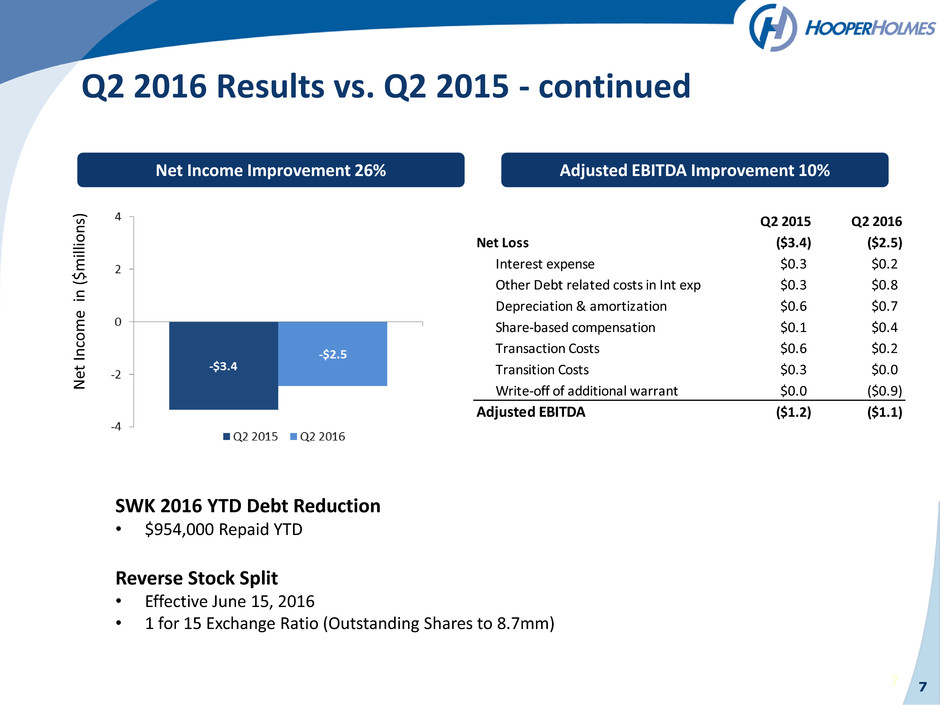
7 7 Net Income Improvement 26% N et In come i n ( $ mill io n s) Q2 2016 Results vs. Q2 2015 - continued Adjusted EBITDA Improvement 10% SWK 2016 YTD Debt Reduction • $954,000 Repaid YTD Reverse Stock Split • Effective June 15, 2016 • 1 for 15 Exchange Ratio (Outstanding Shares to 8.7mm) Q2 2015 Q2 2016 Net Loss ($3.4) ($2.5) Interest expense $0.3 $0.2 Other Debt related costs in Int exp $0.3 $0.8 Depreciation & amortization $0.6 $0.7 Share-based compensation $0.1 $0.4 Transaction Costs $0.6 $0.2 Transition Costs $0.3 $0.0 Write-off of additional warrant $0.0 ($0.9) Adjusted EBITDA ($1.2) ($1.1)
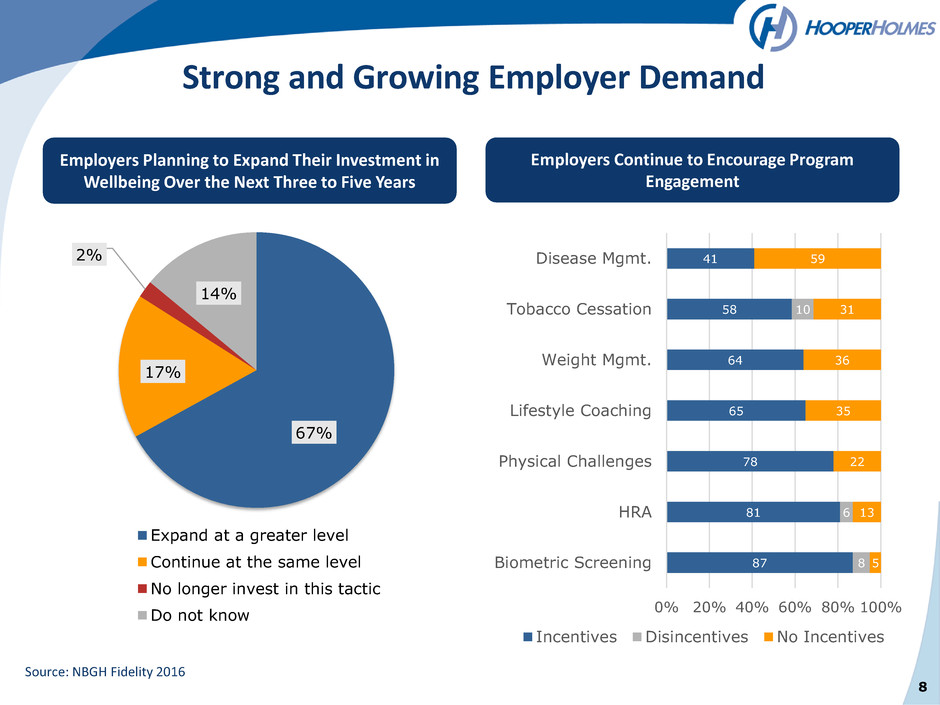
Strong and Growing Employer Demand Source: NBGH Fidelity 2016 67% 17% 2% 14% Expand at a greater level Continue at the same level No longer invest in this tactic Do not know Employers Continue to Encourage Program Engagement 87 81 78 65 64 58 41 8 6 10 5 13 22 35 36 31 59 0% 20% 40% 60% 80% 100% Biometric Screening HRA Physical Challenges Lifestyle Coaching Weight Mgmt. Tobacco Cessation Disease Mgmt. Incentives Disincentives No Incentives Employers Planning to Expand Their Investment in Wellbeing Over the Next Three to Five Years 8
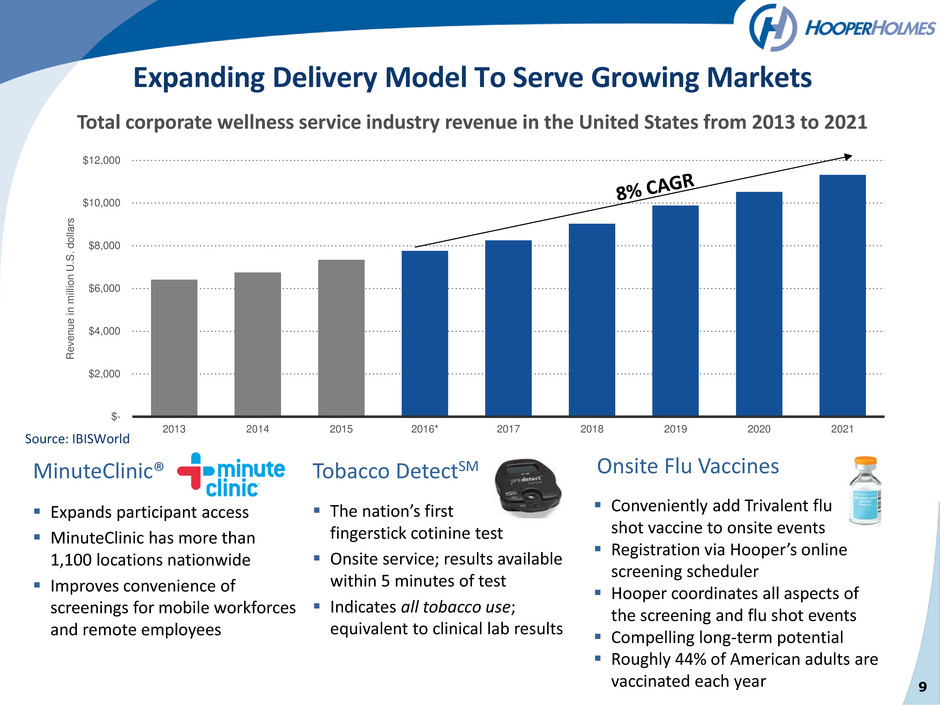
Tobacco DetectSM The nation’s first fingerstick cotinine test Onsite service; results available within 5 minutes of test Indicates all tobacco use; equivalent to clinical lab results Onsite Flu Vaccines Conveniently add Trivalent flu shot vaccine to onsite events Registration via Hooper’s online screening scheduler Hooper coordinates all aspects of the screening and flu shot events Compelling long-term potential Roughly 44% of American adults are vaccinated each year MinuteClinic® Expands participant access MinuteClinic has more than 1,100 locations nationwide Improves convenience of screenings for mobile workforces and remote employees Tobacco DetectSM Onsite Flu Vaccines Expanding Delivery Model To Serve Growing Markets 9 $- $2,000 $4,000 $6,000 $8,000 $10,000 $12,000 2013 2014 2015 2016* 2017 2018 2019 2020 2021 R e v e n u e in m ill io n U .S . d o lla rs Total corporate wellness service industry revenue in the United States from 2013 to 2021 Source: IBISWorld
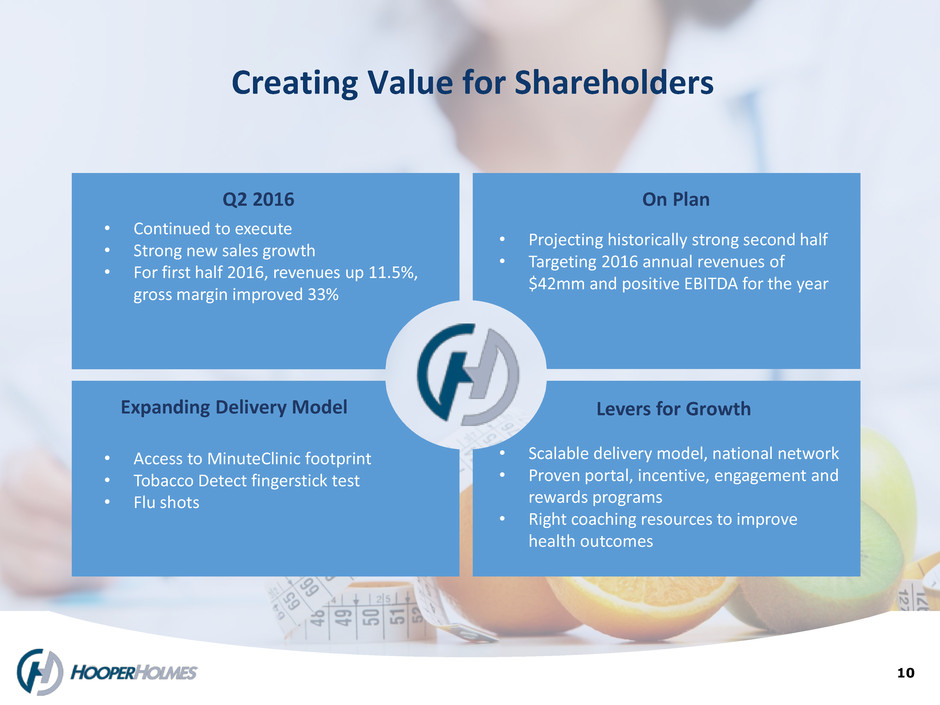
10 Expanding Delivery Model Levers for Growth Q2 2016 On Plan Creating Value for Shareholders • Continued to execute • Strong new sales growth • For first half 2016, revenues up 11.5%, gross margin improved 33% • Projecting historically strong second half • Targeting 2016 annual revenues of $42mm and positive EBITDA for the year • Access to MinuteClinic footprint • Tobacco Detect fingerstick test • Flu shots • Scalable delivery model, national network • Proven portal, incentive, engagement and rewards programs • Right coaching resources to improve health outcomes


