
(OTCQX: HPHW) Q2 Earnings Results Presentation August 10, 2017 Speakers: Henry Dubois, Chief Executive Officer Steven Balthazor, Chief Financial Officer (OTCQX: HPHW)
Safe Harbor 2 Special Note Regarding Forward-Looking Statements This presentation contains forward-looking statements, as such term is defined in the Private Securities Litigation Reform Act of 1995, concerning the Company’s plans, objectives, goals, strategies, future events or performances, which are not statements of historical fact and can be identified by words such as: “expect,” “continue,” “should,” “may,” “will,” “project,” “anticipate,” “believe,” “plan,” “goal,” and similar references to future periods. The forward-looking statements contained in this presentation reflect our current beliefs and expectations. Actual results or performance may differ materially from what is expressed in the forward looking statements. Among the important factors that could cause actual results to differ materially from those expressed in, or implied by, the forward- looking statements contained in this presentation are our ability to realize the expected benefits from the acquisition of Accountable Health Solutions and our strategic alliance with Clinical Reference Laboratory; our ability to realize the expected synergies and other benefits from the merger with Provant Health Solutions; our ability to successfully implement our business strategy and integrate Accountable Health Solutions’ and Provant Health Solutions’ business with ours; our ability to retain and grow our customer base; our ability to recognize operational efficiencies and reduce costs; uncertainty as to our working capital requirements over the next 12 to 24 months; our ability to maintain compliance with the financial covenants contained in our credit facilities; the rate of growth in the Health and Wellness market and such other factors as discussed in Part I, Item 1A, Risk Factors, and Part II, Item 7, Management’s Discussion and Analysis of Financial Conditions and Results of Operations of our Annual Report on Form 10-K for the year ended December 31, 2016. The Company undertakes no obligation to update or release any revisions to these forward-looking statements to reflect events or circumstances, or to reflect the occurrence of unanticipated events, after the date of this presentation, except as required by law. This presentation contains information from third-party sources, including data from studies conducted by others and market data and industry forecasts obtained from industry publications. Although the Company believes that such information is reliable, the Company has not independently verified any of this information and the Company does not guarantee the accuracy or completeness of this information. Any references to documents not included in the presentation itself are qualified by the full text and content of those documents. During our prepared comments or responses to your questions, we may offer incremental metrics to provide greater insight into the dynamics of our business or our quarterly results, such as references to EBITDA and adjusted EBITDA, and other measures of financial performance. Please be advised that this additional detail may be one-time in nature and we may or may not provide an update in the future. These and other financial measures may also have been prepared on a non-GAAP basis.
3 Reaffirming Guidance Rapid Progress on Merger Synergies Reaffirming 2018 Guidance $5+ million adjusted EBITDA Positive net income Milestones Merger Closed May 11, 2017 Achieved over $5.1 million in annualized synergies Won $11.9 million in annualized new sales Increased access to capital Reaffirming Guidance for Q2 – Q4 2017 $54+ million in revenue $3+ million adjusted EBITDA $7 million in annualized synergies
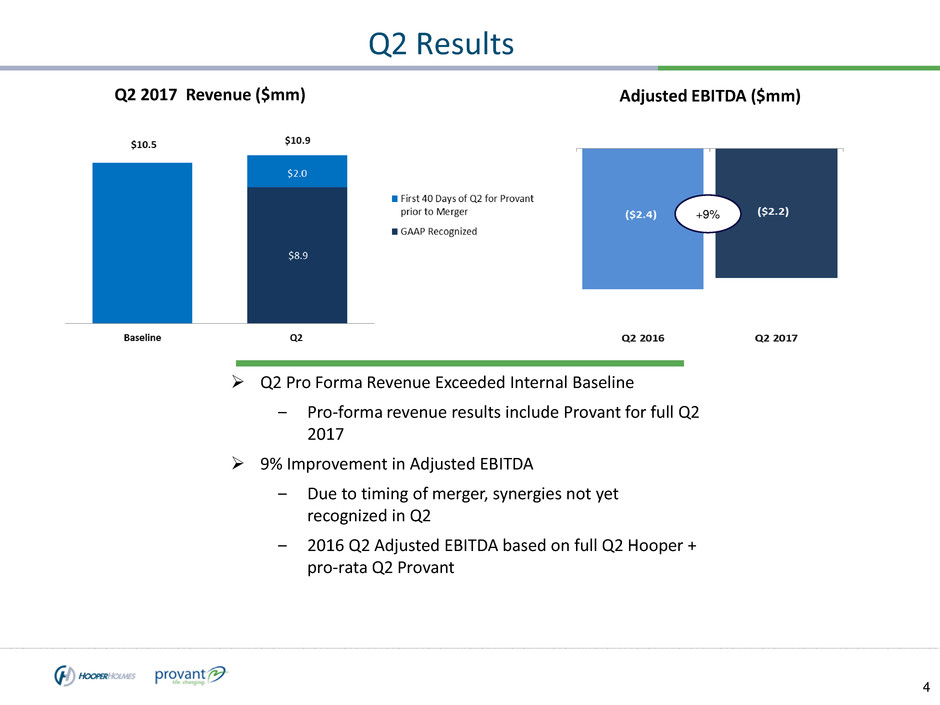
4 Q2 Results Q2 Pro Forma Revenue Exceeded Internal Baseline ‒ Pro-forma revenue results include Provant for full Q2 2017 9% Improvement in Adjusted EBITDA ‒ Due to timing of merger, synergies not yet recognized in Q2 ‒ 2016 Q2 Adjusted EBITDA based on full Q2 Hooper + pro-rata Q2 Provant Q2 2017 Revenue ($mm) Adjusted EBITDA ($mm) +9%
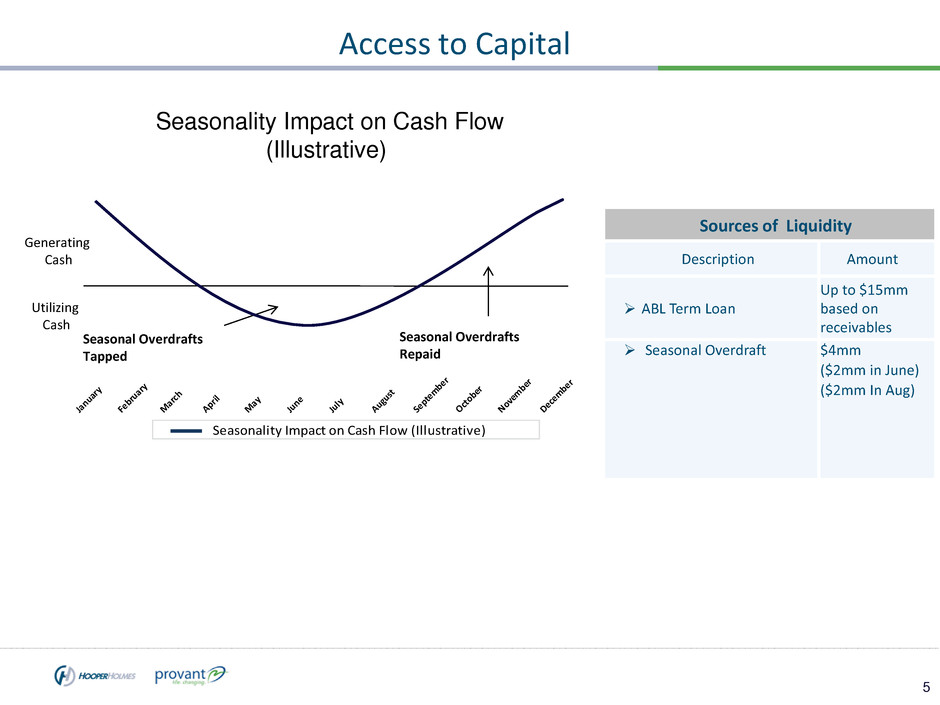
5 Access to Capital Sources of Liquidity Description Amount ABL Term Loan Up to $15mm based on receivables Seasonal Overdraft $4mm ($2mm in June) ($2mm In Aug) Ja nu ar y Fe br ua ry M ar ch Ap ril M ay Ju ne Ju ly Au gu st Se pt em be r Oc to be r No ve m be r De ce mb er Seasonal Overdrafts Repaid Seasonal Overdrafts Tapped Seasonality Impact on Cash Flow (Illustrative) Seasonality Impact on Cash Flow (Illustrative) Generating Cash Utilizing Cash
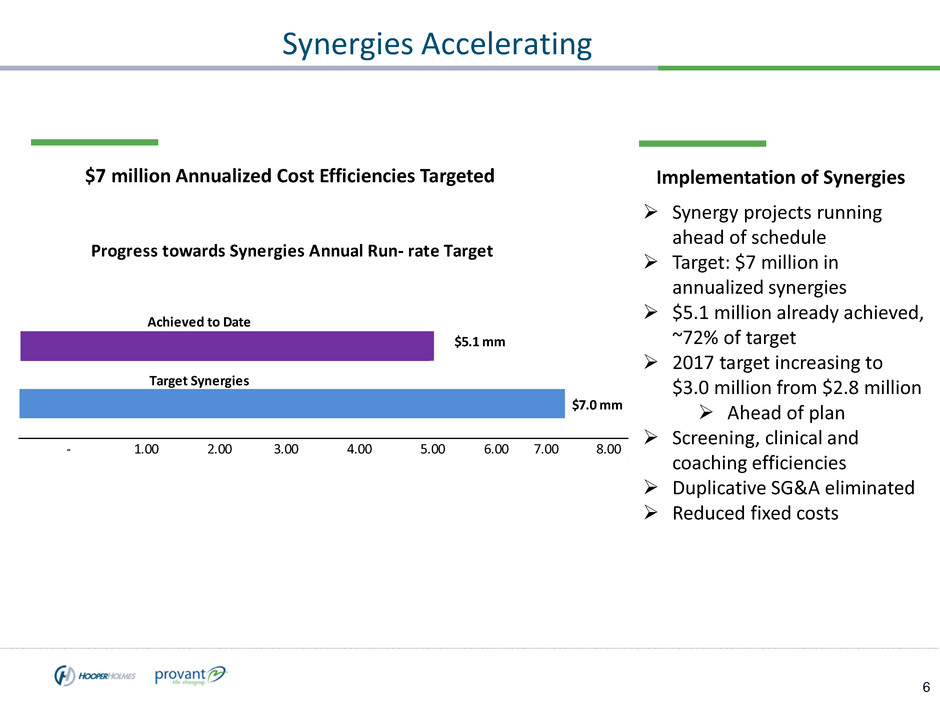
6 Synergies Accelerating $7 million Annualized Cost Efficiencies Targeted Implementation of Synergies Synergy projects running ahead of schedule Target: $7 million in annualized synergies $5.1 million already achieved, ~72% of target 2017 target increasing to $3.0 million from $2.8 million Ahead of plan Screening, clinical and coaching efficiencies Duplicative SG&A eliminated Reduced fixed costs $5.1 mm $7.0 mm - 1.00 2.00 3.00 4.00 5.00 6.00 7.00 8.00 Progress towards Synergies Annual Run- rate Target Target Synergies Achieved to Date
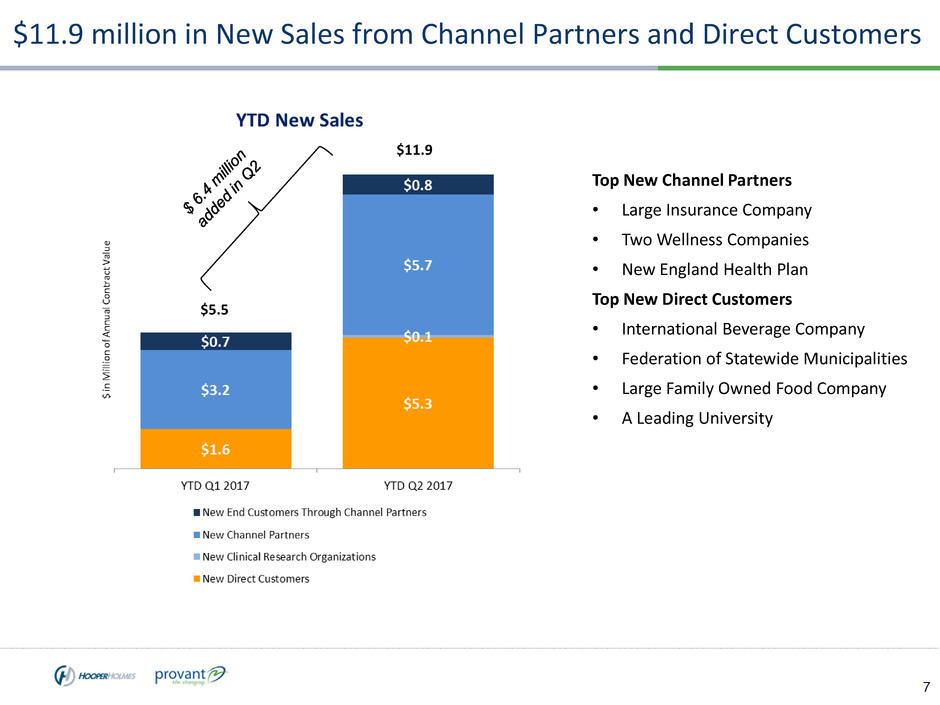
7 $11.9 million in New Sales from Channel Partners and Direct Customers Top New Channel Partners • Large Insurance Company • Two Wellness Companies • New England Health Plan Top New Direct Customers • International Beverage Company • Federation of Statewide Municipalities • Large Family Owned Food Company • A Leading University $11.9 $5.5
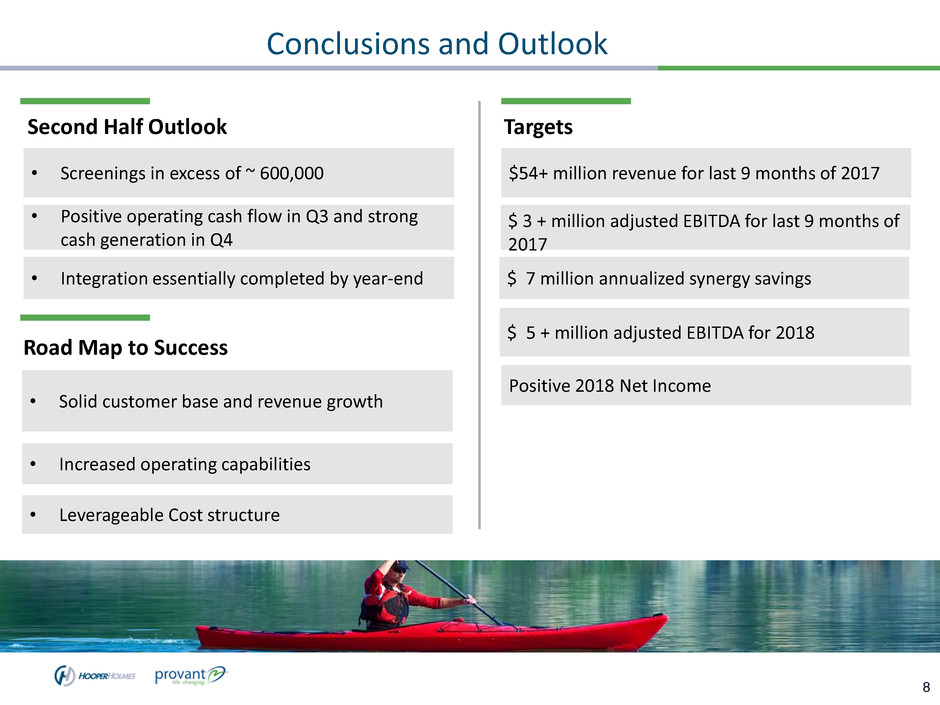
8 Conclusions and Outlook • Screenings in excess of ~ 600,000 • Positive operating cash flow in Q3 and strong cash generation in Q4 • Integration essentially completed by year-end Second Half Outlook • Solid customer base and revenue growth • Increased operating capabilities • Leverageable Cost structure Road Map to Success Targets $ 3 + million adjusted EBITDA for last 9 months of 2017 $ 7 million annualized synergy savings $ 5 + million adjusted EBITDA for 2018 Positive 2018 Net Income $54+ million revenue for last 9 months of 2017


