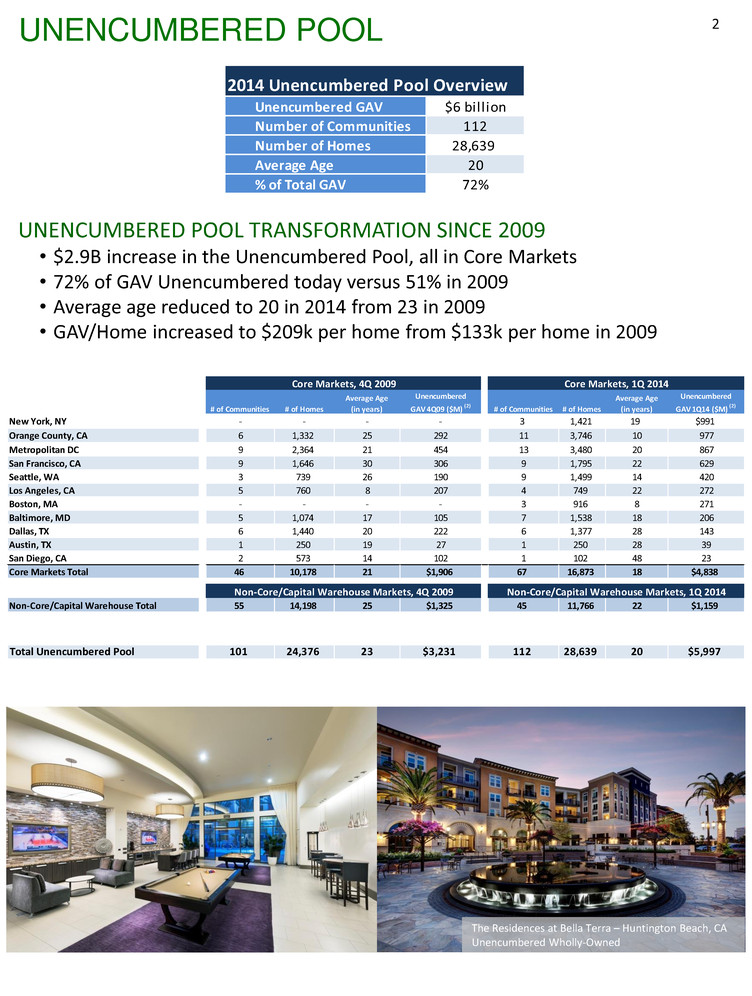
UNENCUMBERED POOL 2 UNENCUMBERED POOL TRANSFORMATION SINCE 2009 • $2.9B increase in the Unencumbered Pool, all in Core Markets • 72% of GAV Unencumbered today versus 51% in 2009 • Average age reduced to 20 in 2014 from 23 in 2009 • GAV/Home increased to $209k per home from $133k per home in 2009 The Residences at Bella Terra – Huntington Beach, CA Unencumbered Wholly-Owned Unencumbered GAV $6 bill ion Number of Communities 112 Number of Homes 28,639 Average Age 20 % of Total GAV 72% 2014 Unencumbered Pool Overview # of Communities # of Homes Average Age (in years) Unencumbered GAV 4Q09 ($M) (2) # of Communities # of Homes Average Age (in years) Unencumbered GAV 1Q14 ($M) (2) New York, NY - - - - 3 1,421 19 $991 Orange County, CA 6 1,332 25 292 11 3,746 10 977 Metropolitan DC 9 2,364 21 454 13 3,480 20 867 San Francisco, CA 9 1,646 30 306 9 1,795 22 629 Seattle, WA 3 739 26 190 9 1,499 14 420 Los Angeles, CA 5 760 8 207 4 749 22 272 Boston, MA - - - - 3 916 8 271 Baltimore, MD 5 1,074 17 105 7 1,538 18 206 Dallas, TX 6 1,440 20 222 6 1,377 28 143 Austin, X 1 250 19 27 1 250 28 39 San Diego, CA 2 573 14 102 1 102 48 23 Cor Markets Total 46 10,178 21 $1,906 67 16,873 18 $4,838 Non-Core/Capital Warehouse Total 55 14,198 25 $1,325 45 11,766 22 $1,159 Total Unencumbered Pool 101 24,376 23 $3,231 112 28,639 20 $5,997 Core Markets, 1Q 2014Core Markets, 4Q 2009 Non-Core/Capital Warehouse Markets, 1Q 2014Non-Core/Capital Warehouse Markets, 4Q 2009

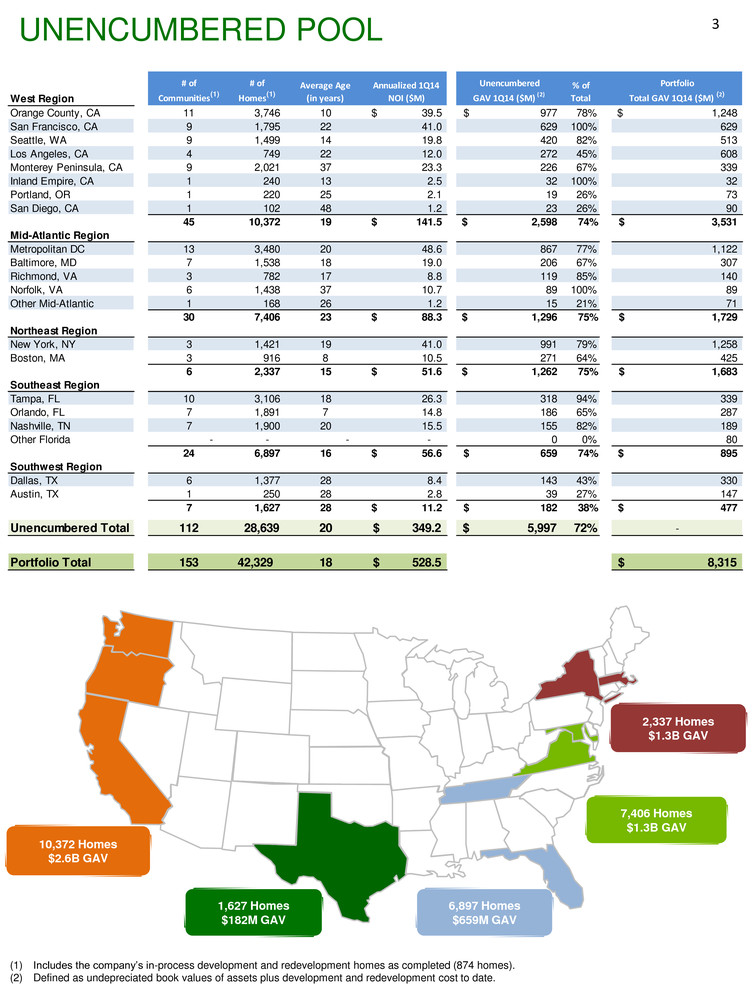
(1) Includes the company’s in-process development and redevelopment homes as completed (874 homes). (2) Defined as undepreciated book values of assets plus development and redevelopment cost to date. UNENCUMBERED POOL 3 10,372 Homes $2.6B GAV 1,627 Homes $182M GAV 6,897 Homes $659M GAV 7,406 Homes $1.3B GAV 2,337 Homes $1.3B GAV West Region # of Communities(1) # of Homes(1) Average Age (in years) Annualized 1Q14 NOI ($M) Unencumbered GAV 1Q14 ($M) (2) % of Total Portfolio Total GAV 1Q14 ($M) (2) Orange County, CA 11 3,746 10 39.5$ 977$ 78% 1,248$ San Francisco, CA 9 1,795 22 41.0 629 100% 629 Seattle, WA 9 1,499 14 19.8 420 82% 513 Los Angeles, CA 4 749 22 12.0 272 45% 608 Monterey Peninsula, CA 9 2,021 37 23.3 226 67% 339 Inland Empire, CA 1 240 13 2.5 32 100% 32 Portland, OR 1 220 25 2.1 19 26% 73 San Diego, CA 1 102 48 1.2 23 26% 90 45 10,372 19 141.5$ 2,598$ 74% 3,531$ Mid-Atlantic Region Metropolitan DC 13 3,480 20 48.6 867 77% 1,122 Baltimore, MD 7 1,538 18 19.0 206 67% 307 Richmond, VA 3 782 17 8.8 119 85% 140 Norfolk, VA 6 1,438 37 10.7 89 100% 89 Other Mid-Atlantic 1 168 26 1.2 15 21% 71 30 7,406 23 88.3$ 1,296$ 75% 1,729$ Northeast Region New York, NY 3 1,421 19 41.0 991 79% 1,258 Boston, MA 3 916 8 10.5 271 64% 425 6 2,337 15 51.6$ 1,262$ 75% 1,683$ Southeast Region Tampa, FL 10 3,106 18 26.3 318 94% 339 Orlando, FL 7 1,891 7 14.8 186 65% 287 Nashville, TN 7 1,900 20 15.5 155 82% 189 Other Florida - - - - 0 0% 80 24 6,897 16 56.6$ 659$ 74% 895$ Southwest Region Dallas, TX 6 1,377 28 8.4 143 43% 330 Austin, TX 1 250 28 2.8 39 27% 147 7 1,627 28 11.2$ 182$ 38% 477$ Unencumbered Total 112 28,639 20 349.2$ 5,997$ 72% - Portfolio Total 153 42,329 18 528.5$ 8,315$


