Exhibit 99.1
Edgewater - San Francisco, CA Residences at The Domain - Austin, TX Delancey at Shirlington - Arlington VA 989 Elements & Elements Too - Bellevue, WA Island Square - Mercer Island, WA September 2009 |
2 UDR Overview National portfolio of high quality, well leased multi-family assets Concentrated in markets with low single- family home affordability and job growth ahead of national average 44,990 Homes in 162 Communities Avg. Age: 16 years Avg. Monthly Income per Home: $1,167 compared to national average of $961 96% occupancy in June 2009 Same store NOI growth of .4% through Q2 2009 vs. sector average of -2.4% Percents indicate contribution of 2009 total net operating income Leading Multifamily REIT NYSE: UDR 37 year track record S&P 400 Enterprise Value $5 Billion |
Why UDR? Strategically Positioned in Markets with Low Single-Family Home Affordability Cycle - tested operating excellence Industry leading technology platform Transformational redevelopment capability Strong and flexible balance sheet Positively Levered to the economic recovery 3 |
4 Consistent Execution of Core Strategy; Focused on Continued Success in Current Challenging Environment Primary Objectives Focus on markets with strong fundamentals Above average job growth Low home affordability Leading development and redevelopment capability in target markets Opportunistically capture accretive opportunities Recent Achievements / Current Focus Completed six year repositioning initiative in 2008 Established $450 million Joint Venture with the Kuwait Finance House to purchase "A" quality assets in markets with high barriers to entry Completed redevelopment of 2,387 homes and new development of 1,707 homes (93 - 97% occupancy and performing in-line with budgets) Completing development of 2,341 new homes 87% of homes to be developed in 2010 Strategy |
5 Consistent Execution of Core Strategy; Focused on Continued Success in Current Challenging Environment Primary Objectives Intense focus on property-level operations Improve efficiency and effectiveness Continued execution of technology initiatives Recent Achievements / Current Focus Raised over $1 billion of capital from a variety of capital sources Reduced dividend to retain $79M annually Repurchased $279 MM of unsecured debt at a discount Rate locked $107 MM secured debt with FNMA at a rate of 5.38% for 10 yrs Superior operating performance in 2008 and YTD 2009 Industry leading technology platform Continued focus on delivering high quality product to customers Preserve strong liquidity position Fortify balance sheet with debt reduction, debt laddering and asset sales Maintain investment grade rating Strategy |
6 Portfolio Strategically Located in Low Home Affordability Markets Completed Transformation from Commodity Markets to Protected Markets 2002 Dallas 6% Houston 6% Orlando 5% Phoenix 5% San Antonio 4% Top 5 markets = 26% of NOI Top 10 markets = 47% of NOI 71,968 Mature Apartment Homes 2009 Orange Co 17% San Francisco 8% Metro DC 8% Tampa 7% Orlando 5% Top 5 markets = 45% of NOI Top 10 markets = 69% of NOI 33,545 Mature Apartment homes Same Community Market 2011* Orange Co 13% Metro DC 13% San Francisco 8% Tampa 6% Baltimore 6% Top 5 markets = 46% of NOI Top 10 markets = 69% of NOI 46,524 Mature Apartment homes * REPRESENTS WEIGHTINGS BASED ON CURRENT PHASING IN OF ACQUIRED, DEVELOPMENT AND REDEVELOPMENT * |
7 UDR's market rents provide for above market occupancy Top 11 markets generate 73% on Company NOI Top Market Quality Weighted average: |
8 Strategically Located in Low Home Affordability Markets Home Affordability Comparison Low home affordability provides room to grow rent Portfolio weighted average rental income and fees is 29% below the average monthly mortgage payment for our markets House prices could fall by 33% or interest rates could decrease by 3.3% before the gap disappears |
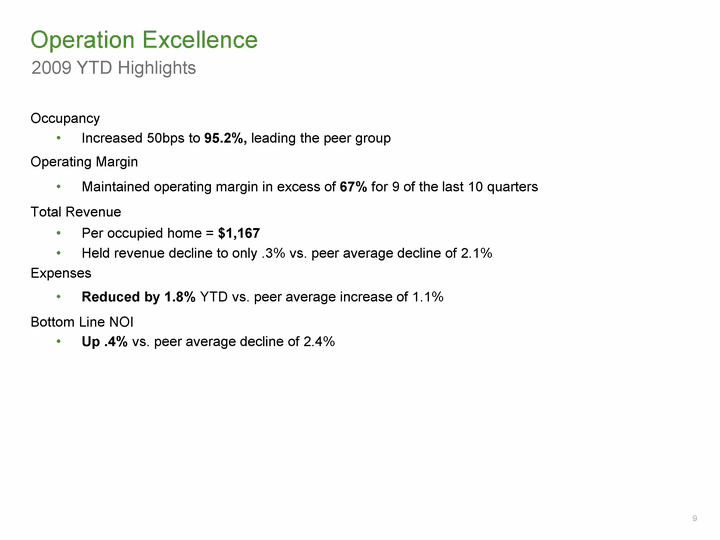
9 Operation Excellence 2009 YTD Highlights Occupancy Increased 50bps to 95.2%, leading the peer group Operating Margin Maintained operating margin in excess of 67% for 9 of the last 10 quarters Total Revenue Per occupied home = $1,167 Held revenue decline to only .3% vs. peer average decline of 2.1% Expenses Reduced by 1.8% YTD vs. peer average increase of 1.1% Bottom Line NOI Up .4% vs. peer average decline of 2.4% |
10 Operational Excellence through Cycle Last 10 Quarters-June 2009 |
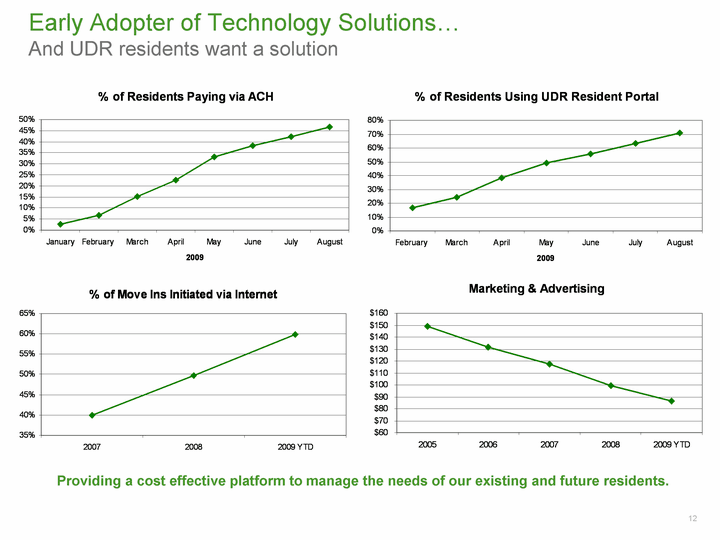
11 Levering Technology to Enhance Business Model Increase Channels of Distribution iPhone, Twitter, MySpace Mobile User search capability Spanish language website Quick Response 2D Bar Code Achieved 1 million organic search engine visitors Maximize Corporate Resources ACH Payment Improve cash management Reduce administrative interaction Online lease origination/work orders Increase "office hours" Improve resident capture rate 24 x 7 call center Adoption of technology solutions at a nominal cost will expand operating margins. |
12 Early Adopter of Technology Solutions... And UDR residents want a solution Providing a cost effective platform to manage the needs of our existing and future residents. |
We have created value through redeveloping 4,108 homes, with incremental investment of $173.4M Transformational Redevelopment Capability Targeting "Forever Great" and Emerging Locations Positive neighborhood trends Proximity to quality employment Convenient to retail, recreation, and transportation Hubs Markets with high barriers to entry Good site exposure and access Revenue Generating Impact Potential Opportunities to improve unit mix, and unit layouts to improve functionality and volume Dated exterior appearance that can be improved Missing amenities or upgrades that can be added Outdated leasing facilities that can be updated or replaced Capturing excess density Market Upside Potential Adequate rent gap to justify investment in improvements Capacity to increase rents while remaining below new product levels Potential to improve resident profile * Adopting Green Components Where Possible* 13 Before After |
14 Taylor Place - Arlington, VA Lobby Area Before Redevelopment After Redevelopment Rent prior to redevelopment $1,336 Rent post redevelopment $1,688 Cost $14 Million Scope Included: Kitchens Baths Exterior Landscaping Common areas New fitness center A 26% increase in rents |
15 Gayton Pointe Townhomes - Richmond, VA Cost $20 Million Scope Included: Kitchens Baths Exterior Landscaping Common areas Before Redevelopment After Redevelopment Rent Before Repositioning $782 Rent After Repositioning $1,278 A 64% increase in rents |
Development $450 Million of Projects in Process Fully funded Meaningfully contributes to NOI in 2H 2010 and 2011 Applying for LEED certifications on 10 developments in process ranging from silver to first platinum rating for a multifamily project No new developments planned until market conditions improve Will continue to research and evaluate sites that reinforce our low home affordability market strategy 16 |
Development Opportunities Vitruvian Park - A Phased Development Opportunity 17 |
18 Strong and Flexible Balance Sheet Current Financials - Q2 2009 Cash and undrawn credit facilities totaling $980MM Existing debt totals $3.2B, with weighted average rate of 4.5% and 6.0 years to mature Investment grade rating from Standard & Poor's and Moody's Fixed charge coverage of 2.13x Unencumbered pool of $3.3B Recent Developments New $450 million joint venture with Kuwait Finance House $37 million bond tender resulting in savings of $15 to $17 million in future interest expense Locked $107 million of a $200 million Fannie facility at a rate of 5.38% for 10 years |
19 Access to Multiple Sources of Capital We have accessed a number of capital sources over the last 8 years: Common Equity: $502M Preferred: $135M Secured Debt: $1.0B Unsecured Debt: $2.3B Joint Venture Capital: $1.2B And the option of: Untapped liquidity from $227 million unencumbered NOI that has a cost basis of $3.3B Access to secured debt from the GSE Future asset sales |
20 Balance Sheet Capacity Credit Capacity well in excess of needs through 2010 and limited additional capital needed in 2011 |
21 Capital Structure and Debt Maturities Note: Assumes all available extensions are executed. UDR's $600M line of credit matures July 2012. Current Capital Structure Manageable Debt Maturities |
Positively Levered to the Economic Recovery Average leases of 10 months allow for adjusting cash flow as economy improves High portfolio occupancy supports rising rental rates as demand turns Technology platform designed to "talk to target market" and take market share Development pipeline meaningfully contributes NOI in 2H 2010 and full year 2011 Balance sheet provides capacity to fund business model and capital needs through 2010 and limited additional capital needed in 2011 22 |
Forward-Looking Statement Certain statements made in this presentation may constitute "forward-looking statements." The words "expect," "intend," "believe," "anticipate," "likely," "will" and similar expressions generally identify forward-looking statements. These forward-looking statements are subject to risks and uncertainties which can cause actual results to differ materially from those currently anticipated, due to a number of factors, which include, but are not limited to, unfavorable changes in the apartment market, changing economic conditions, the impact of inflation/deflation on rental rates and property operating expenses, expectations concerning availability of capital and the stabilization of the capital markets, the impact of competition and competitive pricing, acquisitions or new developments not achieving anticipated results, delays in completing developments and lease-ups on schedule, expectations on job growth, home affordability and demand/supply ratio for multifamily housing, expectations concerning development and redevelopment activities, expectations on occupancy levels, expectations concerning the Vitruvian Park project, expectations that automation will help grow net operating income, expectations on post-renovated stabilized annual operating income, expectations on annualized net operating income and other risk factors discussed in documents filed by the Company with the Securities and Exchange Commission from time to time, including the Company's Annual Report on Form 10-K and the Company's Quarterly Reports on Form 10-Q. These forward-looking statements and such risks, uncertainties and other factors speak only as of the date of this presentation, and the Company expressly disclaims any obligation or undertaking to disseminate any updates or revisions to any forward- looking statement contained herein, to reflect any change in the Company's expectations with regard thereto, or any other change in events, conditions or circumstances on which any such statement is based, except to the extent otherwise required by law. |
Page intentionally left blank |