- UDR Dashboard
- Financials
- Filings
-
Holdings
- Transcripts
- ETFs
- Insider
- Institutional
- Shorts
-
8-K Filing
UDR (UDR) 8-KRegulation FD Disclosure
Filed: 9 Jun 05, 12:00am
| 2005 NAREIT Investor Forum June 8 — 10 |

| Blank Slide Intentional |

| Safe Harbor Statement Statements contained in this presentation, which are not historical facts, are forward-looking statements, as the term is defined in the Private Securities Litigation Reform Act of 1995. You can identify these forward-looking statements by the Company’s use of words such as, “expects,” “plans,” “estimates,” “projects,” “intends,” “believes,” and similar expressions that do not relate to historical matters. Such forward-looking statements are subject to risks and uncertainties which can cause actual results to differ materially from those currently anticipated, due to a number of factors, which include, but are not limited to, unfavorable changes in the apartment market, changing economic conditions, the impact of competition and competitive pricing, acquisitions or new developments not achieving anticipated results, the expectation that approximately 50% of projected 2005 net operating income will come from California, Florida and Metropolitan Washington D.C., delays in completing developments and lease-ups on schedule, difficulties in selling existing apartment communities, and other risk factors discussed in documents filed by the Company with the Securities and Exchange Commission from time to time including the Company’s Annual Report on Form 10-K and the Company’s Quarterly Reports on Form 10- Q. All forward-looking statements in this press release are made as of today, based upon information known to management as of the date hereof. The Company assumes no obligation to update or revise any of its forward-looking statements even if experience or future changes show that indicated results or events will not be realized. The Calvert Washington D.C. Pine Avenue Long Beach, CA Rancho Villacitos San Marcos, CA |

| Blank Slide Intentional |
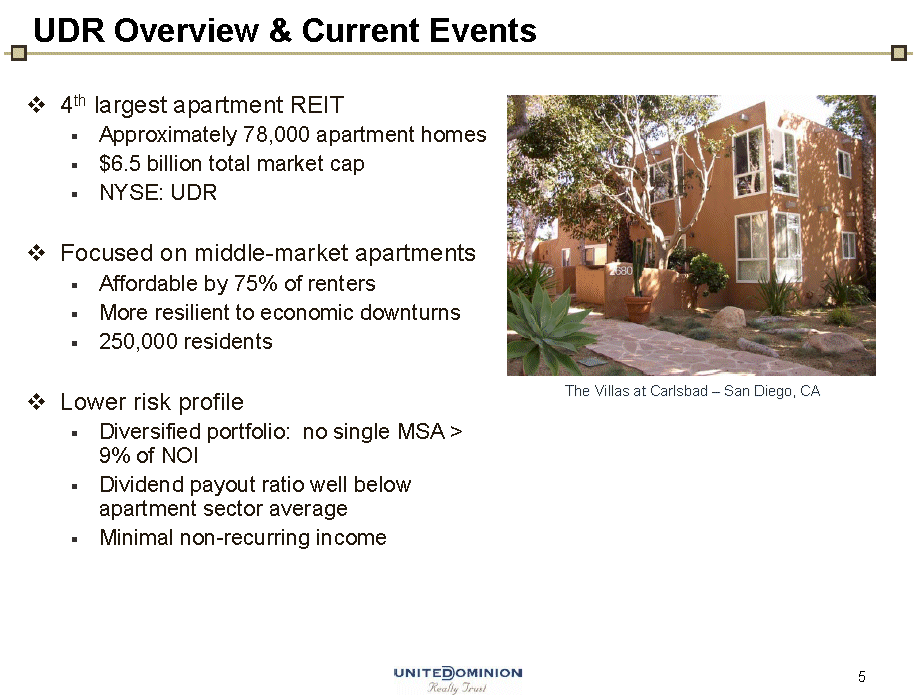
| UDR Overview & Current Events 4th largest apartment REIT Approximately 78,000 apartment homes $6.5 billion total market cap NYSE: UDR Focused on middle-market apartments Affordable by 75% of renters More resilient to economic downturns 250,000 residents Lower risk profile Diversified portfolio: no single MSA > 9% of NOI Dividend payout ratio well below apartment sector average Minimal non-recurring income The Villas at Carlsbad – San Diego, CA |
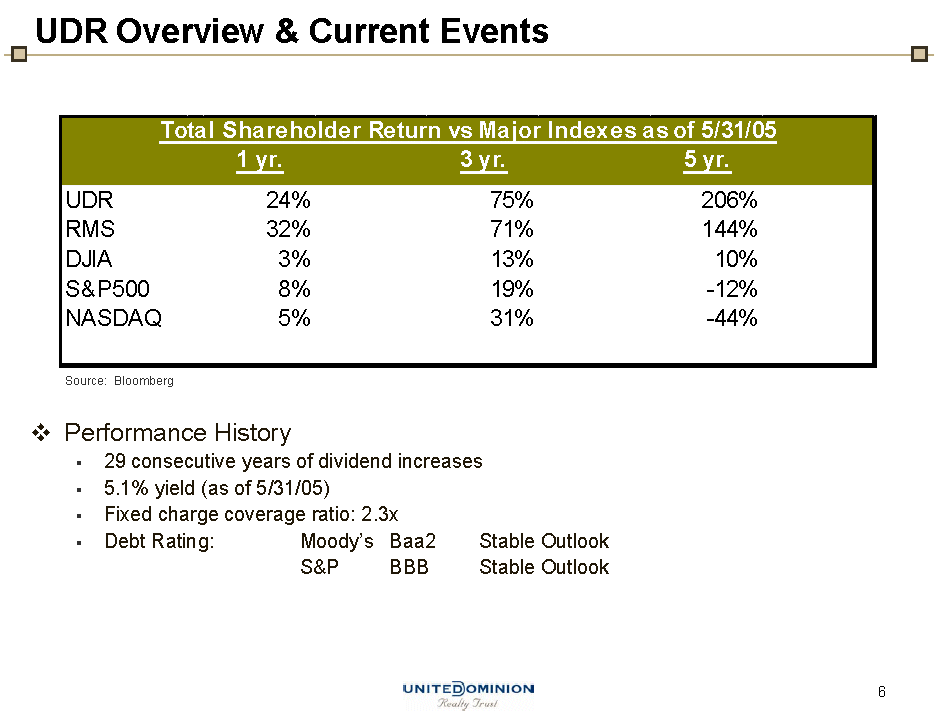
| UDR Overview & Current Events Performance History 29 consecutive years of dividend increases 5.1% yield (as of 5/31/05) Fixed charge coverage ratio: 2.3x Debt Rating: Moody’s Baa2Stable Outlook S&P BBB Stable Outlook Source: Bloomberg |
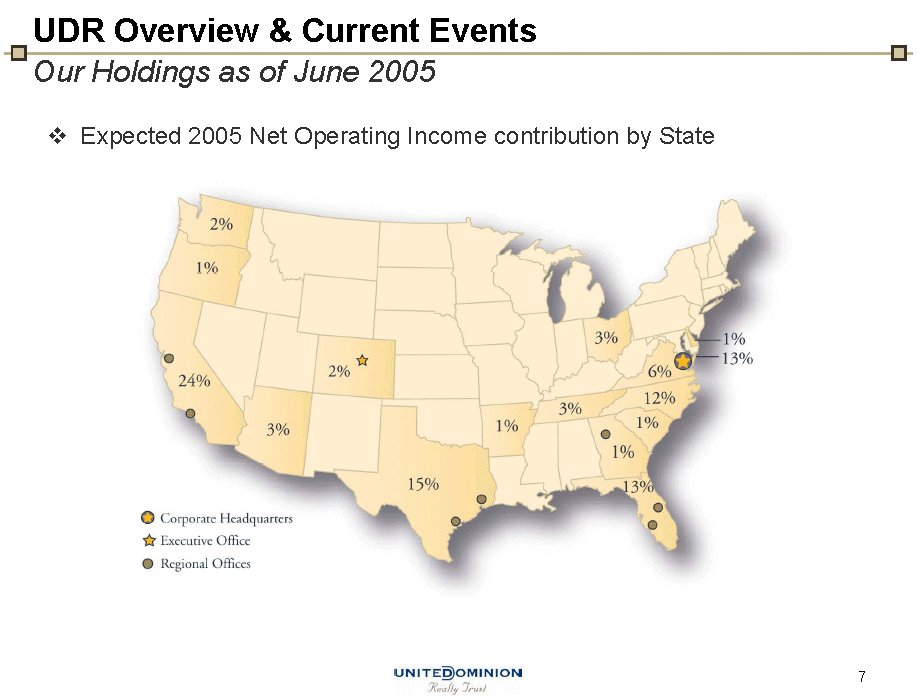
| Expected 2005 Net Operating Income contribution by State UDR Overview & Current EventsOur Holdings as of June 2005 |
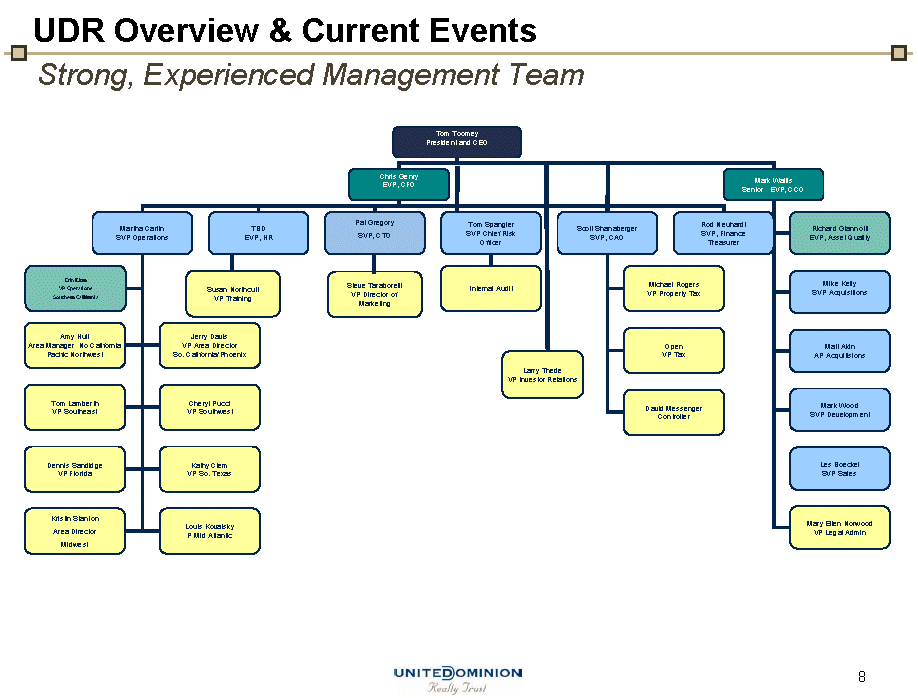
| UDR Overview & Current EventsStrong, Experienced Management Team |
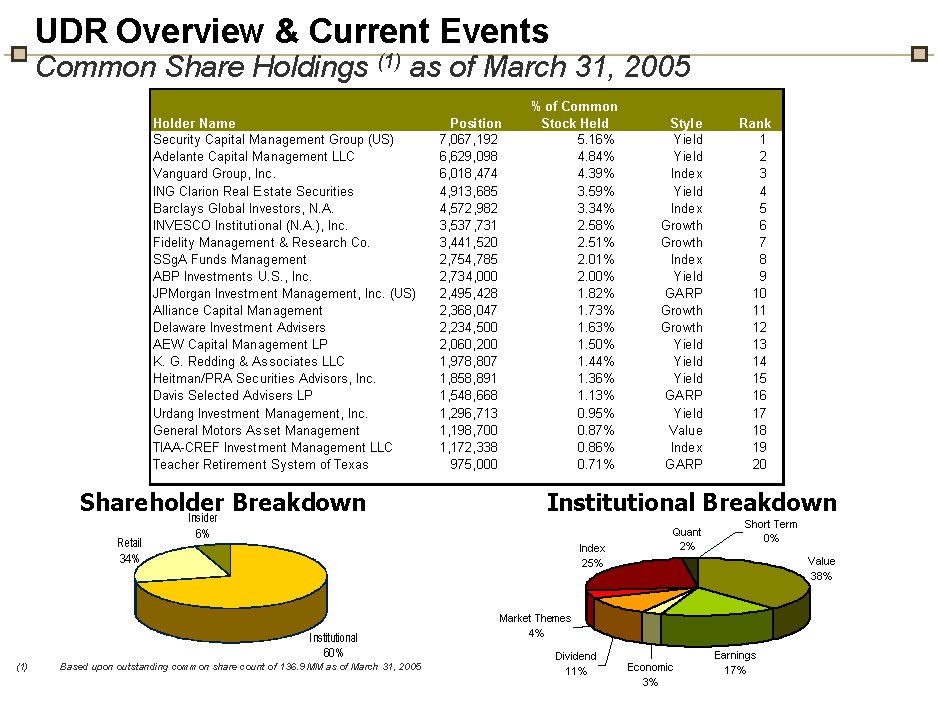
| UDR Overview & Current EventsCommon Share Holdings(1)as of March 31, 2005 Shareholder Breakdown Institutional Breakdown(1) Based upon outstanding common share count of 136.9 MM as of March 31, 2005 |
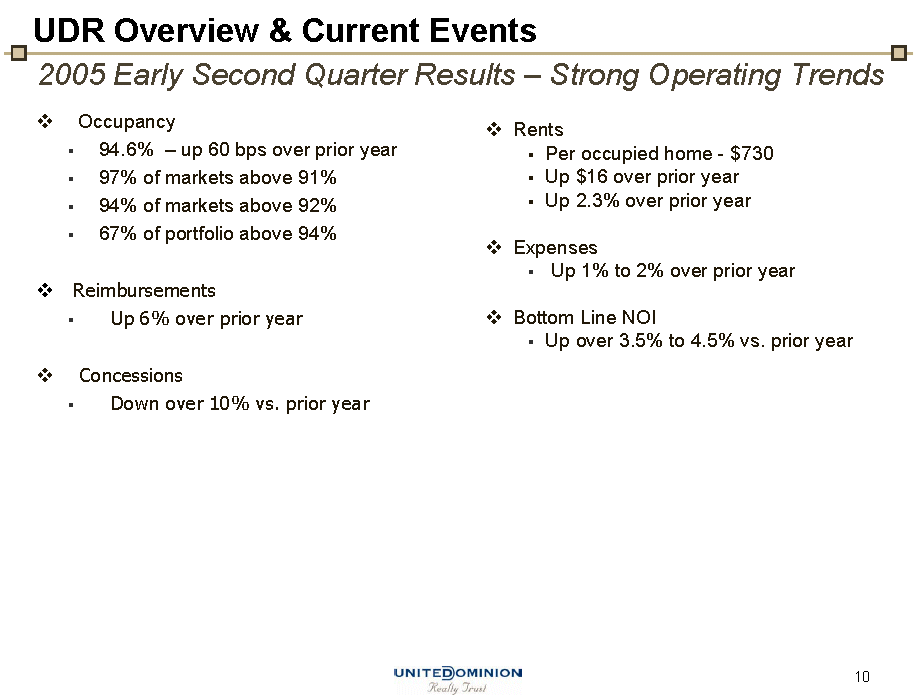
| UDR Overview & Current Events2005 Early Second Quarter Results – Strong Operating Trends Occupancy 94.6% – up 60 bps over prior year 97% of markets above 91% 94% of markets above 92% 67% of portfolio above 94% Reimbursements Up 6% over prior year Concessions Down over 10% vs. prior year Rents Per occupied home — $730 Up $16 over prior year Up 2.3% over prior year Expenses Up 1% to 2% over prior year Bottom Line NOI Up over 3.5% to 4.5% vs. prior year |
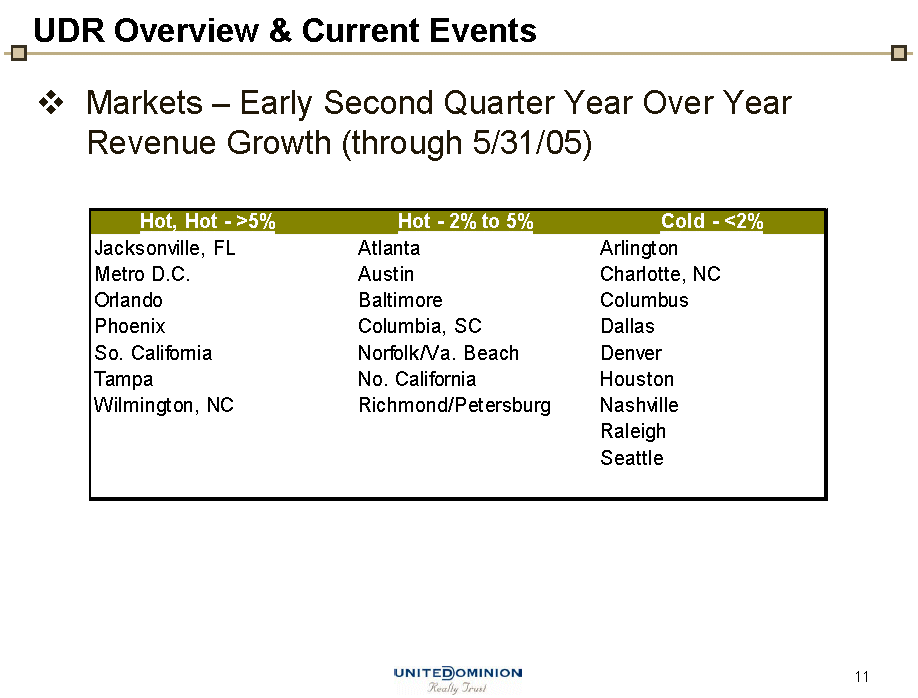
| UDR Overview & Current Events Markets – Early Second Quarter Year Over Year Revenue Growth (through 5/31/05) |
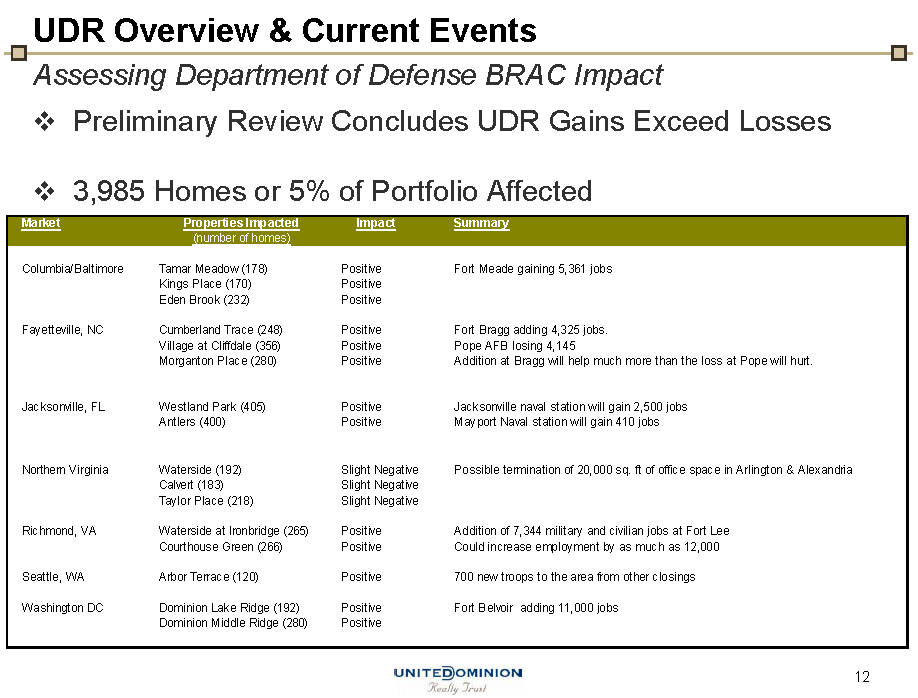
| UDR Overview & Current EventsAssessing Department of Defense BRAC Impact Preliminary Review Concludes UDR Gains Exceed Losses 3,985 Homes or 5% of Portfolio Affected |
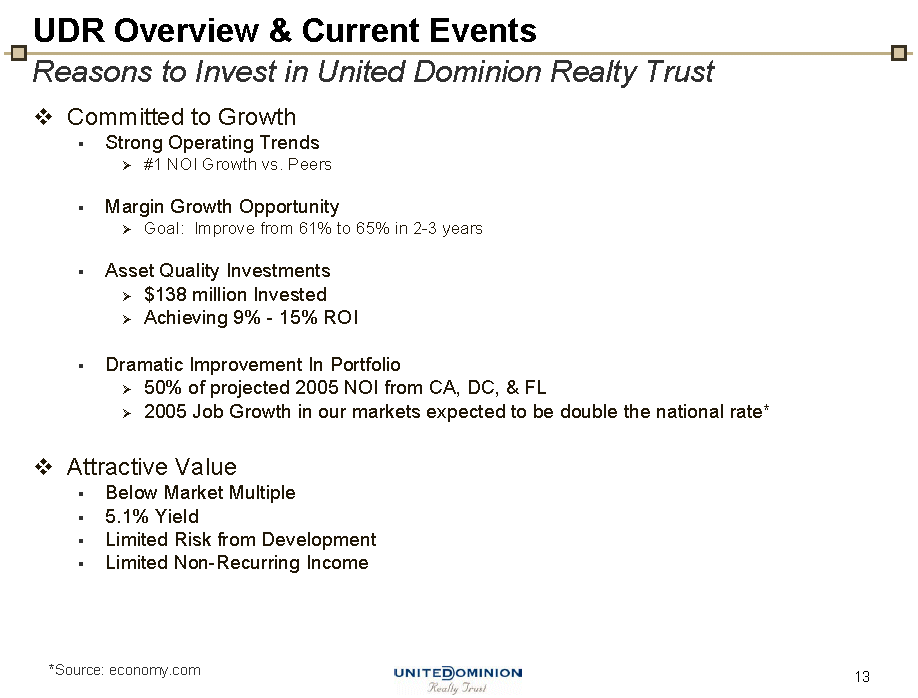
| UDR Overview & Current EventsReasons to Invest in United Dominion Realty Trust Committed to Growth Strong Operating Trends #1 NOI Growth vs. Peers Margin Growth Opportunity Goal: Improve from 61% to 65% in 2-3 years Asset Quality Investments $138 million Invested Achieving 9% — 15% ROI Dramatic Improvement In Portfolio 50% of projected 2005 NOI from CA, DC, & FL 2005 Job Growth in our markets expected to be double the national rate* Attractive Value Below Market Multiple 5.1% Yield Limited Risk from Development Limited Non-Recurring Income *Source: economy.com |

| Blank Slide Intentional |
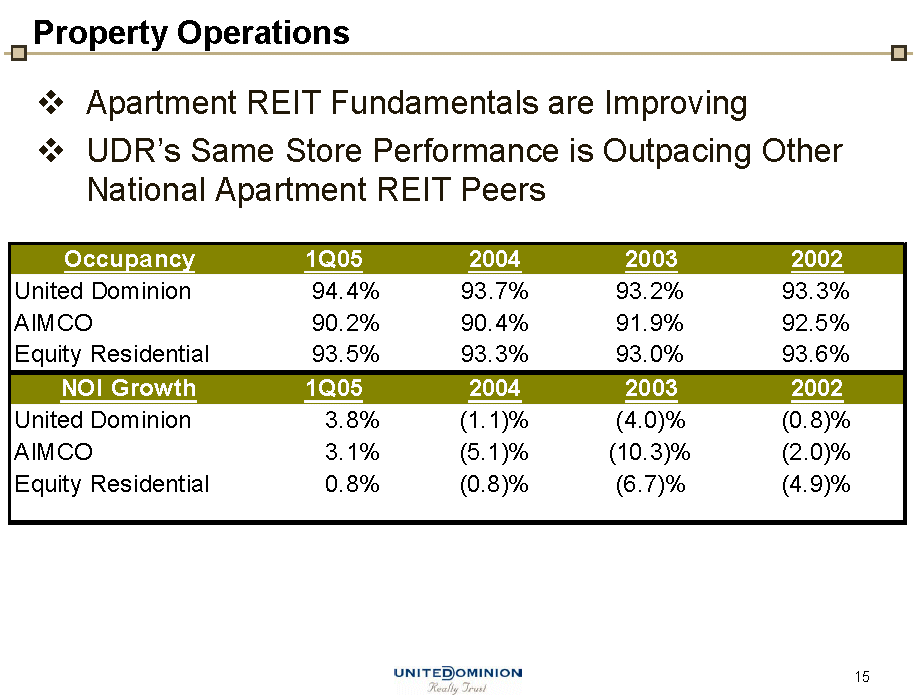
| Property Operations Apartment REIT Fundamentals are Improving UDR’s Same Store Performance is Outpacing Other National Apartment REIT Peers |
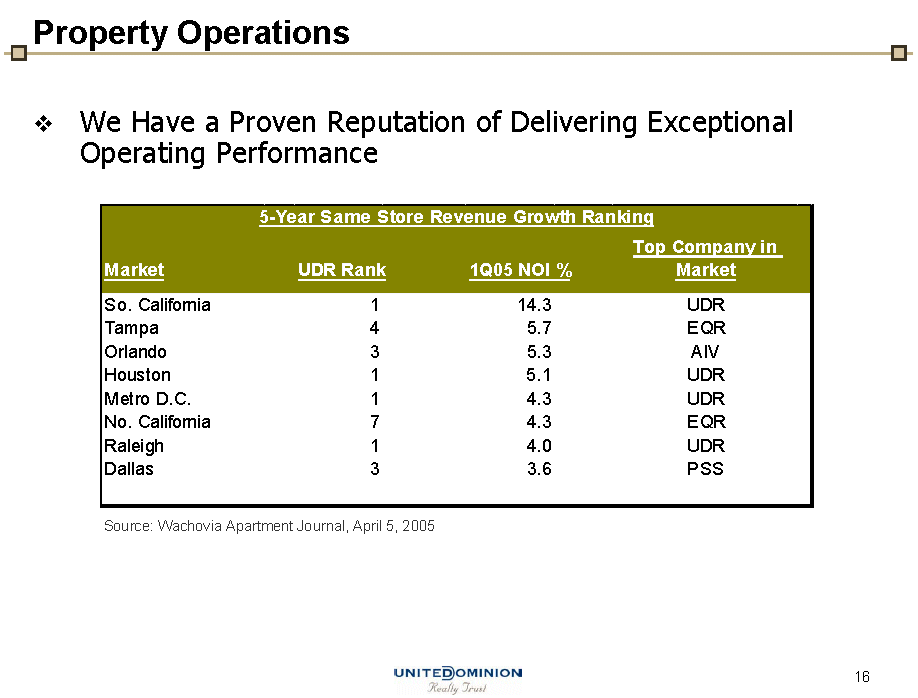
| Property Operations We Have a Proven Reputation of Delivering Exceptional Operating Performance Source: Wachovia Apartment Journal, April 5, 2005 |
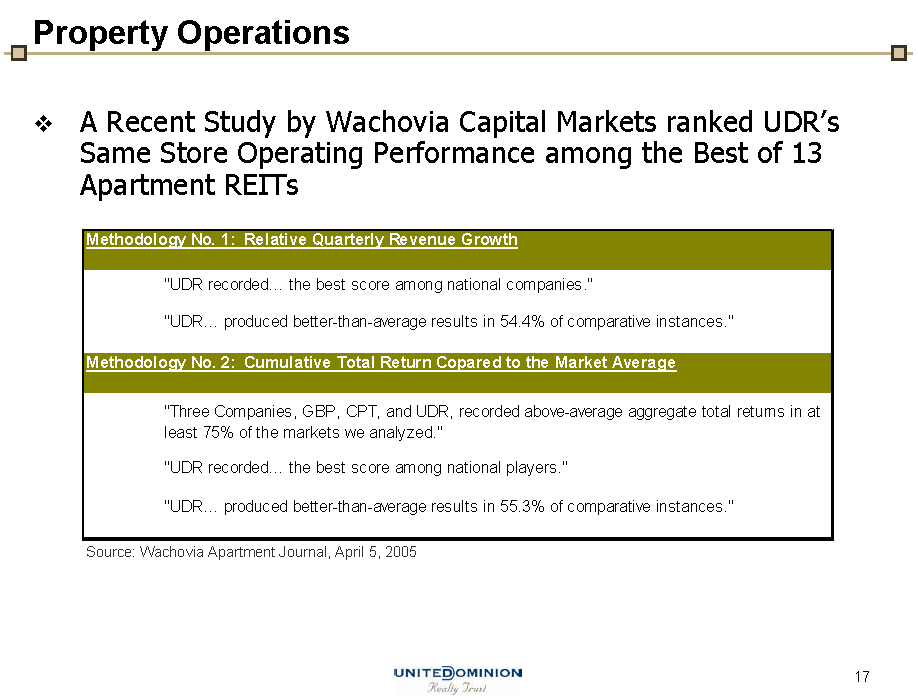
| Property Operations A Recent Study by Wachovia Capital Markets ranked UDR’s Same Store Operating Performance among the Best of 13 Apartment REITs Source: Wachovia Apartment Journal, April 5, 2005 |
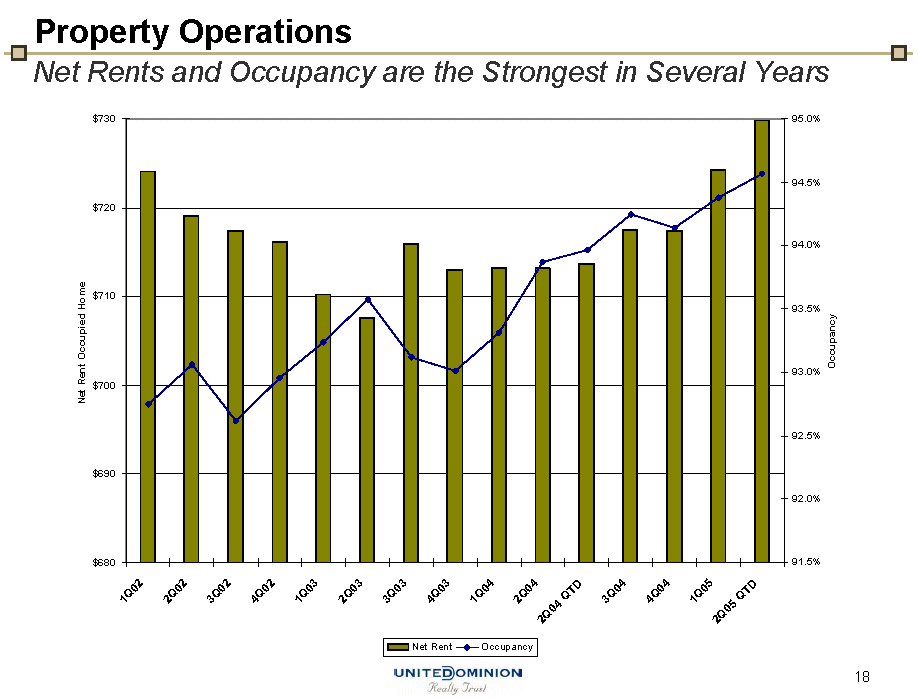
| Property OperationsNet Rents and Occupancy are the Strongest in Several Years |
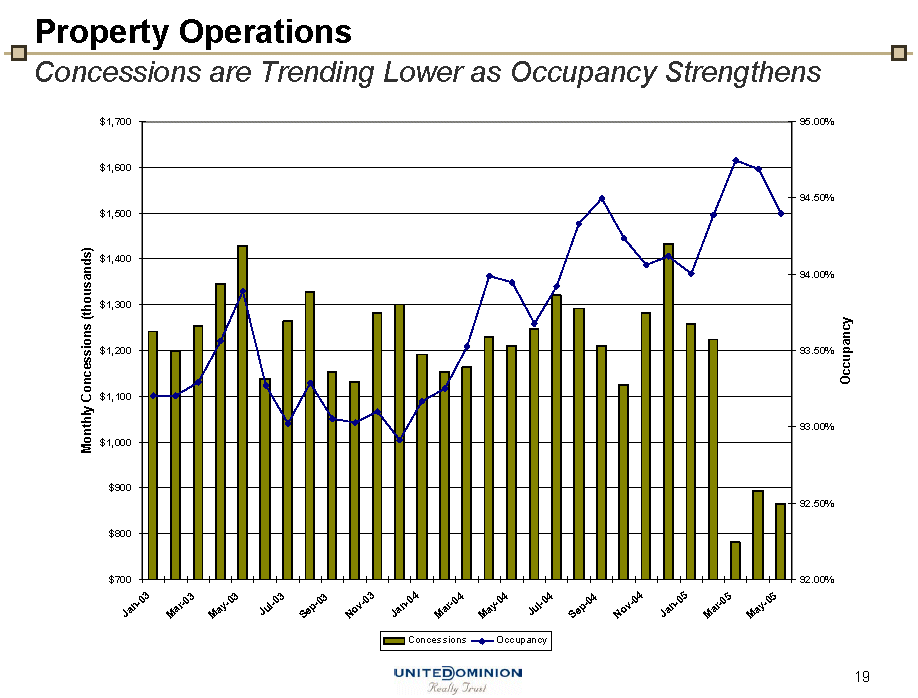
| Property OperationsConcessions are Trending Lower as Occupancy Strengthens |
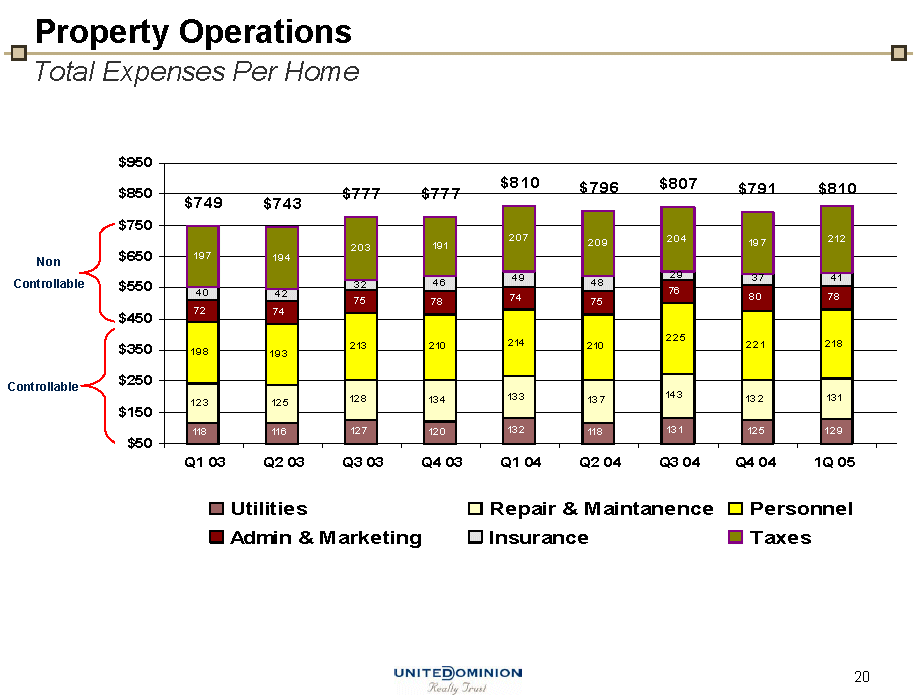
| Property OperationsTotal Expenses Per Home Utilities Admin & Marketing Repair & Maintanence Insurance Personnel Taxes |
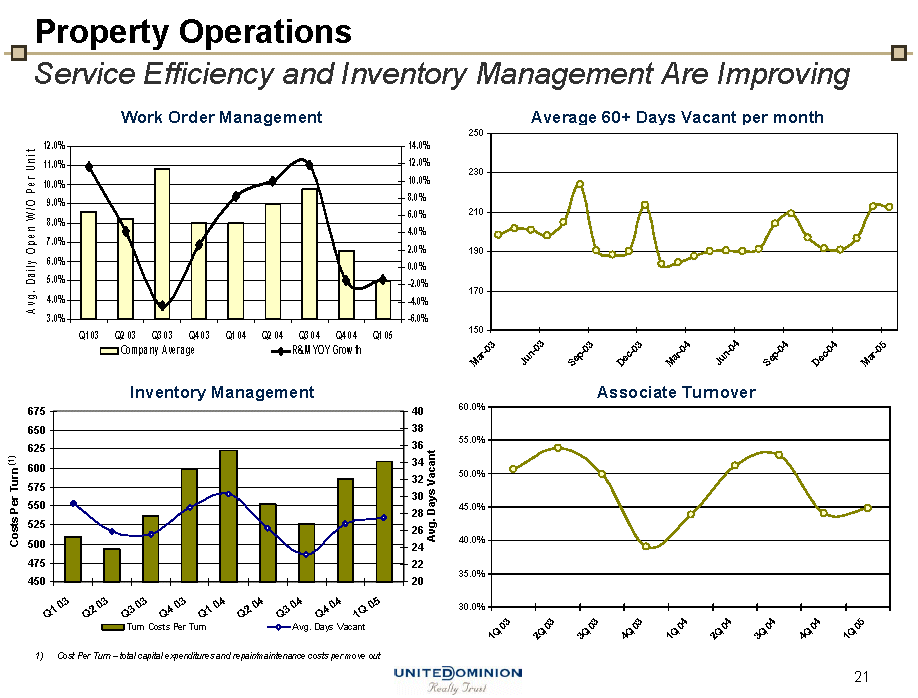
| Property OperationsService Efficiency and Inventory Management Are Improving Work Order Management Average 60+ Days Vacant per month Inventory Management Associate Turnover1) Cost Per Turn — total capital expenditures and repair/maintenance costs per move out |
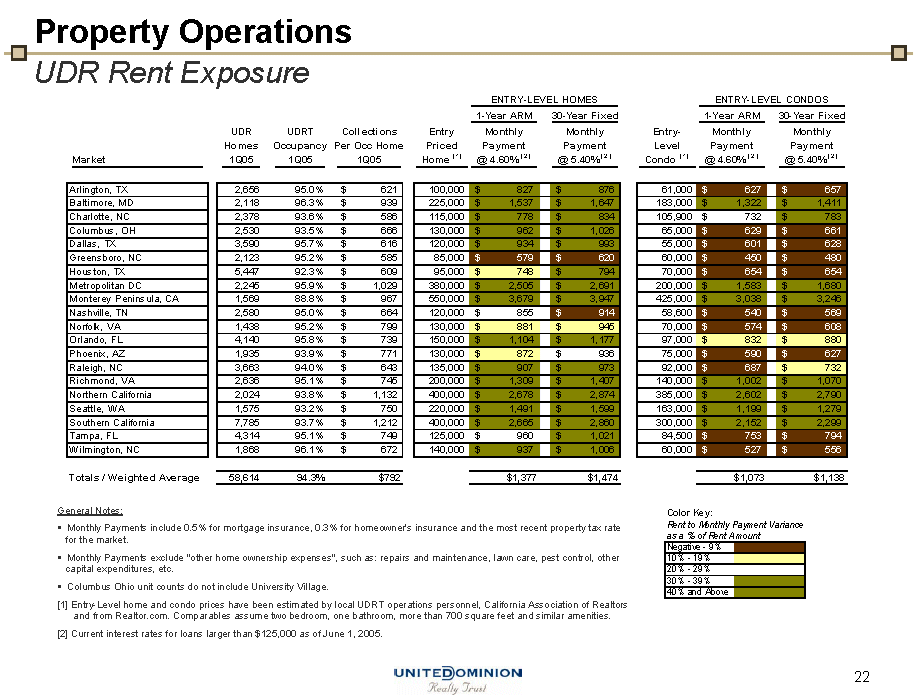
| Property OperationsUDR Rent Exposure |
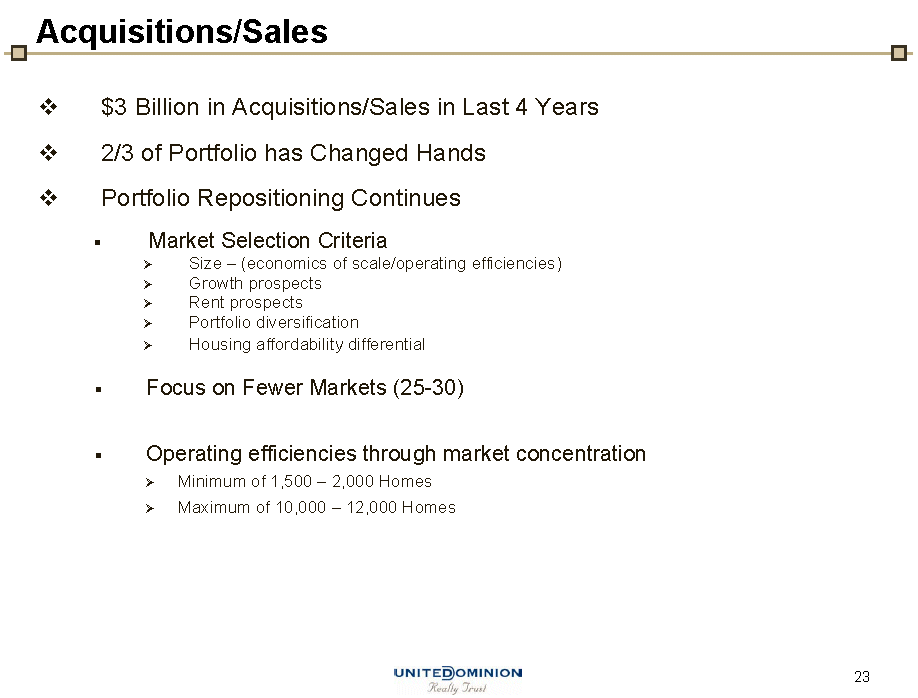
| Acquisitions/Sales $3 Billion in Acquisitions/Sales in Last 4 Years 2/3 of Portfolio has Changed Hands Portfolio Repositioning Continues Market Selection Criteria Size — (economics of scale/operating efficiencies) Growth prospects Rent prospects Portfolio diversification Housing affordability differential Focus on Fewer Markets (25-30) Operating efficiencies through market concentration Minimum of 1,500 — 2,000 Homes Maximum of 10,000 — 12,000 Homes |
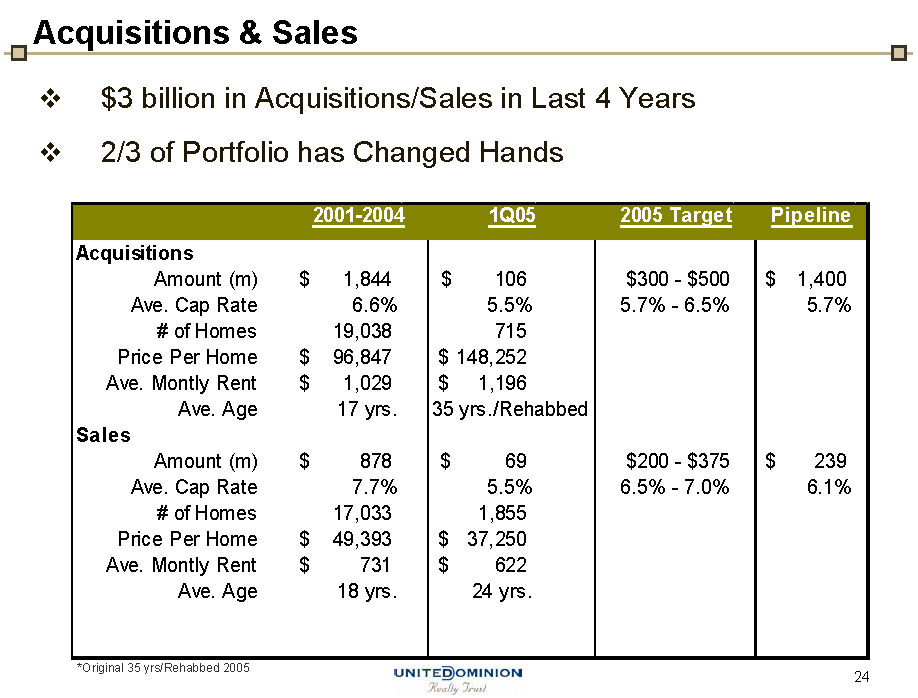
| Acquisitions & Sales $3 billion in Acquisitions/Sales in Last 4 Years 2/3 of Portfolio has Changed Hands *Original 35 yrs/Rehabbed 2005 |
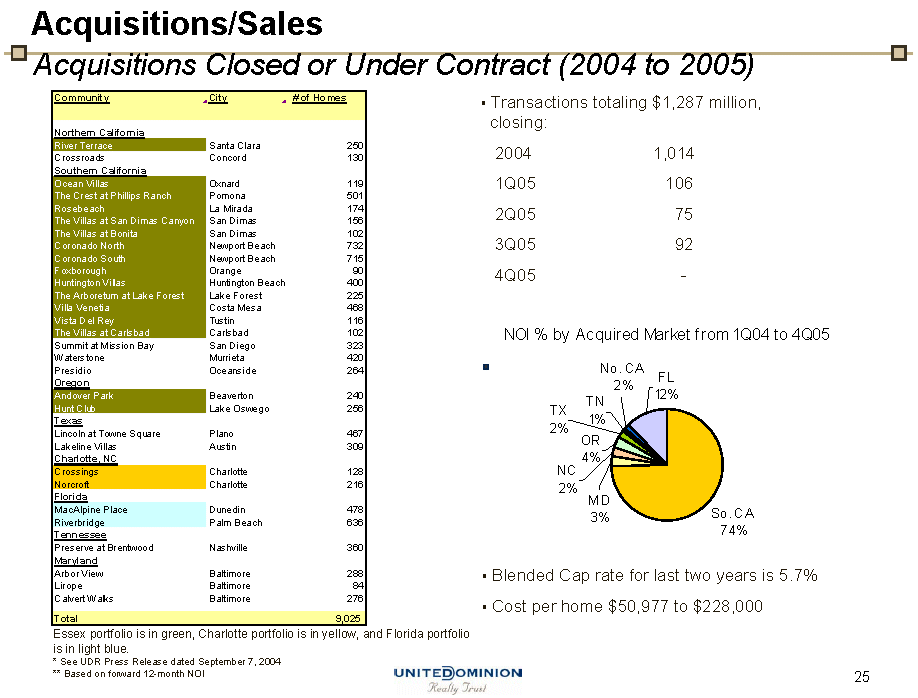
| Acquisitions/SalesAcquisitions Closed or Under Contract (2004 to 2005) Transactions totaling $1,287 million, closing: 2004 1,014 1Q05 106 2Q05 75 3Q05 92 4Q05 - NOI % by Acquired Market from 1Q04 to 4Q05 Blended Cap rate for last two years is 5.7% Cost per home $50,977 to $228,000 Essex portfolio is in green, Charlotte portfolio is in yellow, and Florida portfolio is in light blue. * See UDR Press Release dated September 7, 2004 ** Based on forward 12-month NOI |
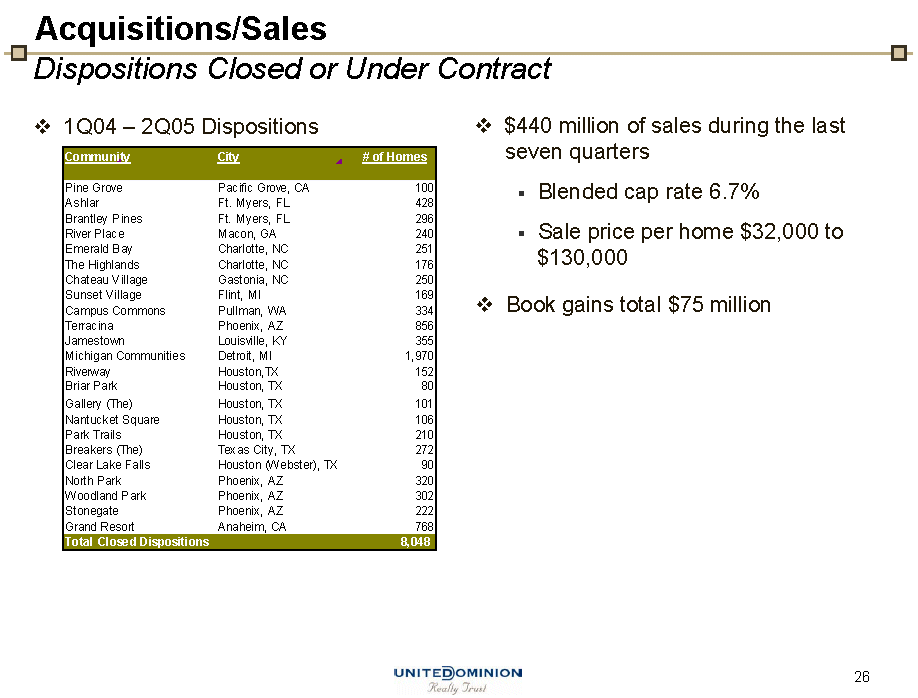
| Acquisitions/SalesDispositions Closed or Under Contract 1Q04 – 2Q05 Dispositions $440 million of sales during the last seven quarters Blended cap rate 6.7% Sale price per home $32,000 to $130,000 Book gains total $75 million |
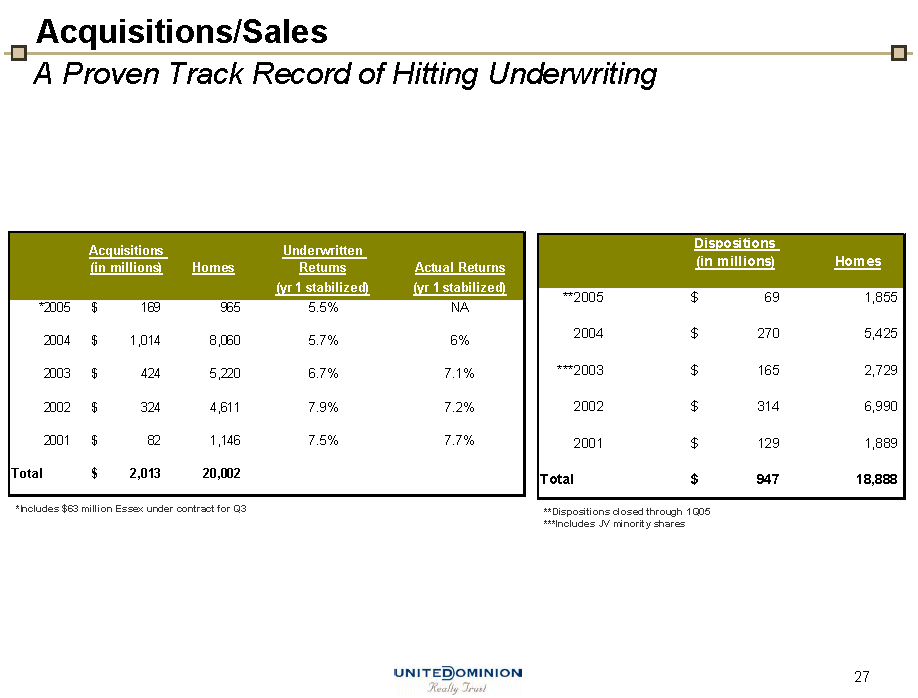
| Acquisitions/SalesA Proven Track Record of Hitting Underwriting *Includes $63 million Essex under contract for Q3 **Dispositions closed through 1Q05 ***Includes JV minority shares |

| Blank Slide Intentional |
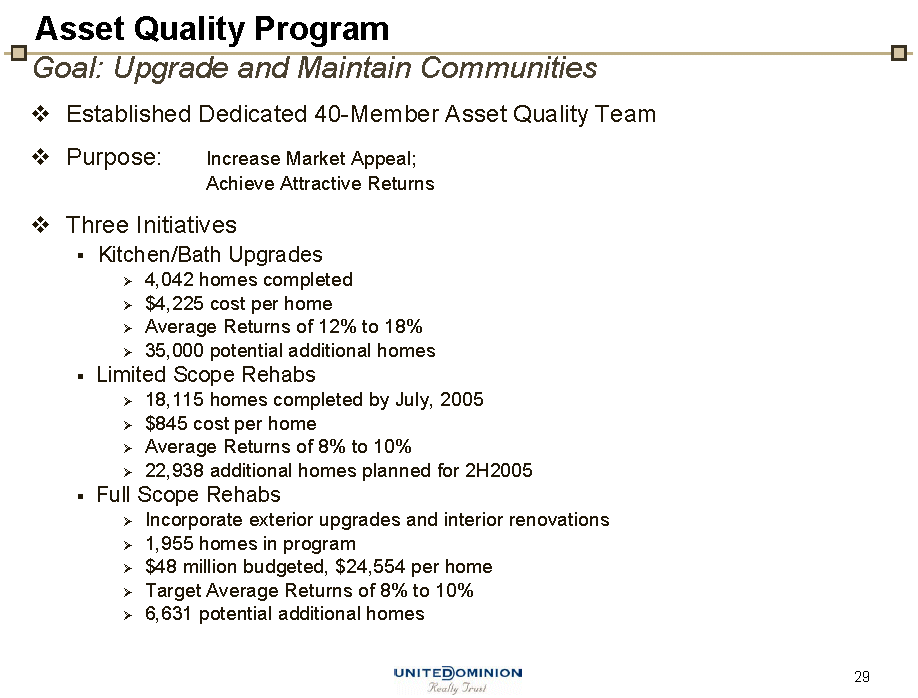
| Asset Quality ProgramGoal: Upgrade and Maintain Communities Established Dedicated 40-Member Asset Quality Team Purpose:Increase Market Appeal; Achieve Attractive Returns Three Initiatives Kitchen/Bath Upgrades 4,042 homes completed $4,225 cost per home Average Returns of 12% to 18% 35,000 potential additional homes Limited Scope Rehabs 18,115 homes completed by July, 2005 $845 cost per home Average Returns of 8% to 10% 22,938 additional homes planned for 2H2005 Full Scope Rehabs Incorporate exterior upgrades and interior renovations 1,955 homes in program $48 million budgeted, $24,554 per home Target Average Returns of 8% to 10% 6,631 potential additional homes |
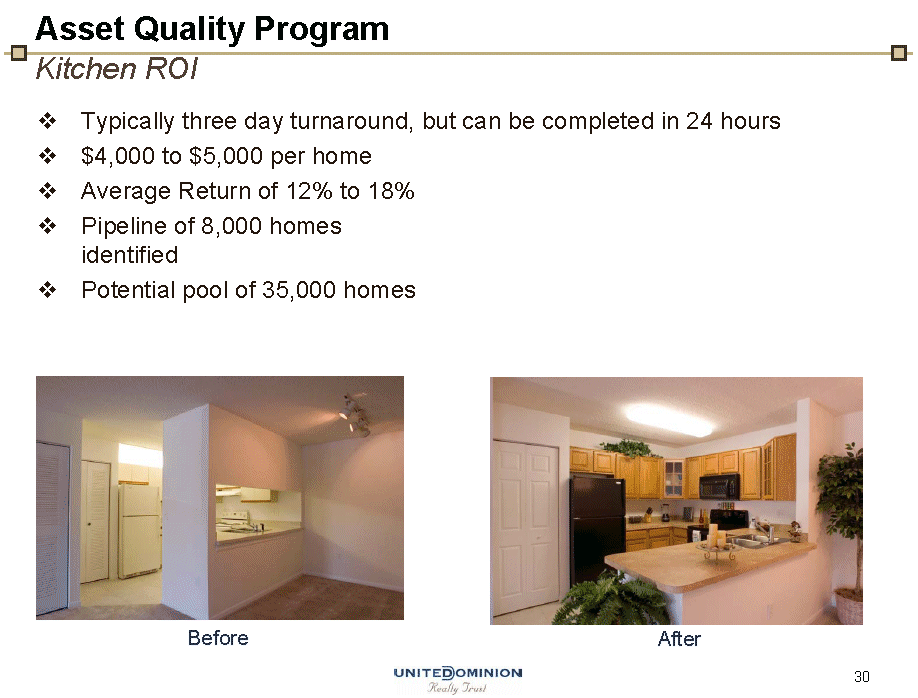
| Asset Quality ProgramKitchen ROI Typically three day turnaround, but can be completed in 24 hours $4,000 to $5,000 per home Average Return of 12% to 18% Pipeline of 8,000 homes identified Potential pool of 35,000 homes Before After |
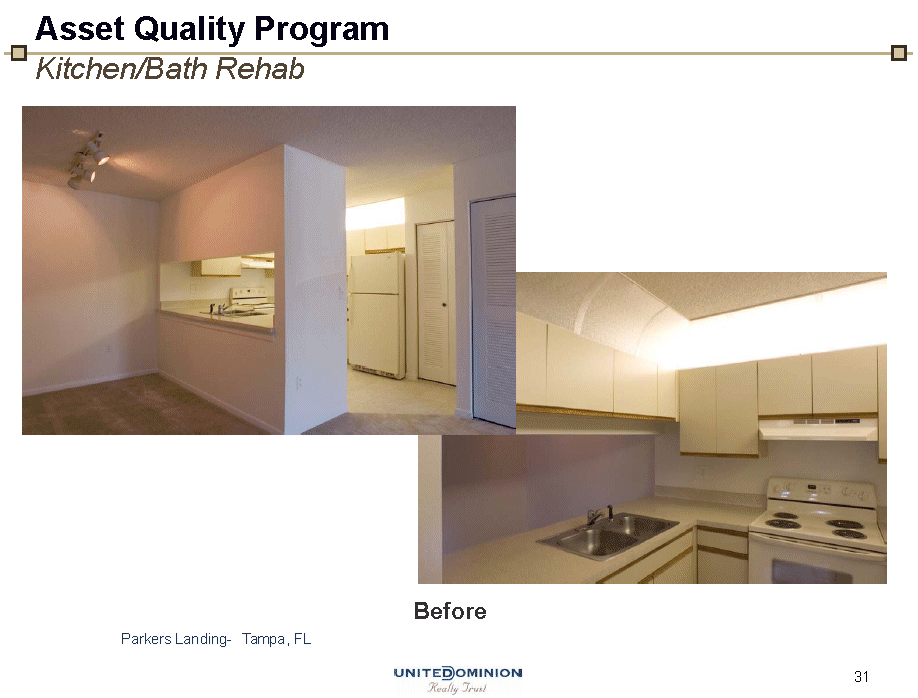
| Before Parkers Landing- Tampa, FL Asset Quality ProgramKitchen/Bath Rehab |
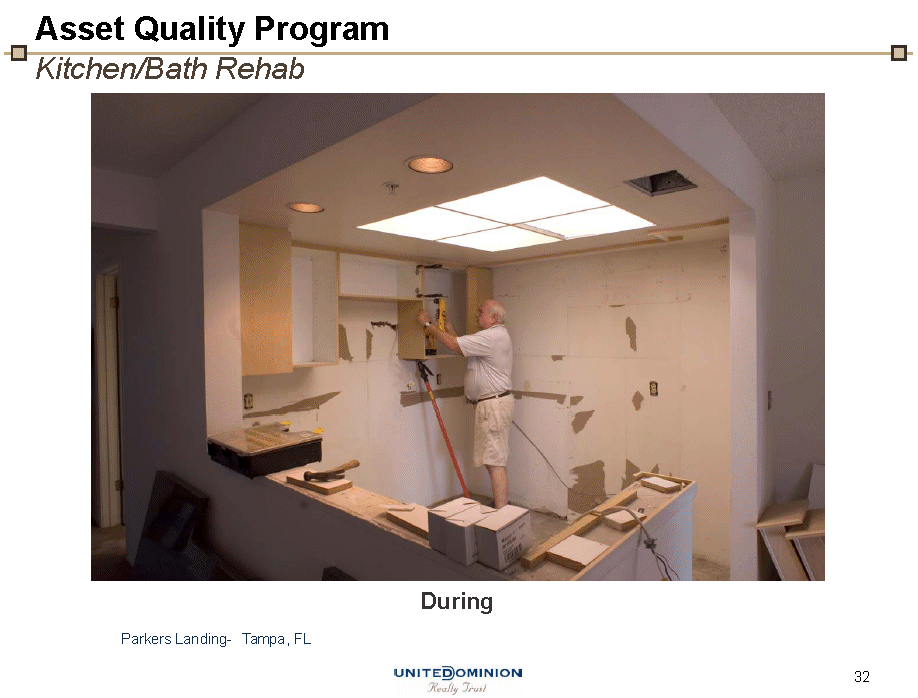
| Asset Quality ProgramKitchen/Bath Rehab During Parkers Landing- Tampa, FL |
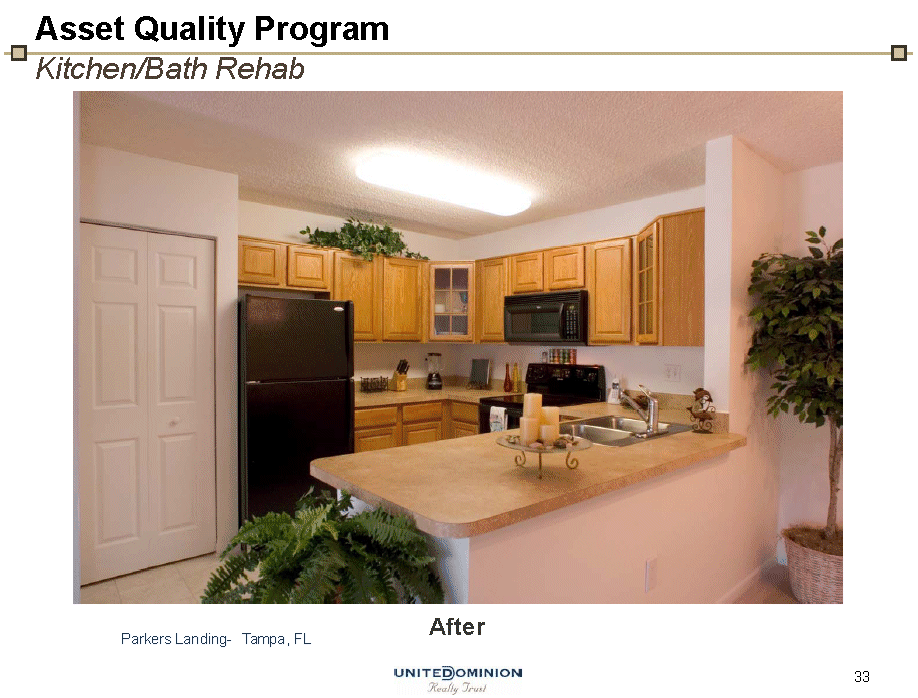
| Asset Quality ProgramKitchen/Bath Rehab After Parkers Landing- Tampa, FL |
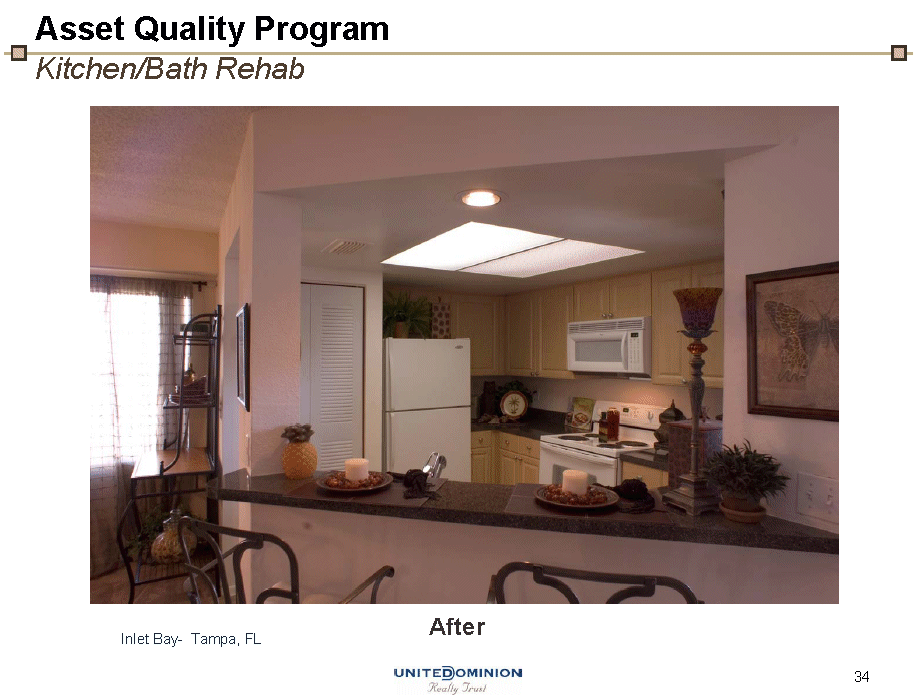
| Inlet Bay- Tampa, FL After Asset Quality ProgramKitchen/Bath Rehab |
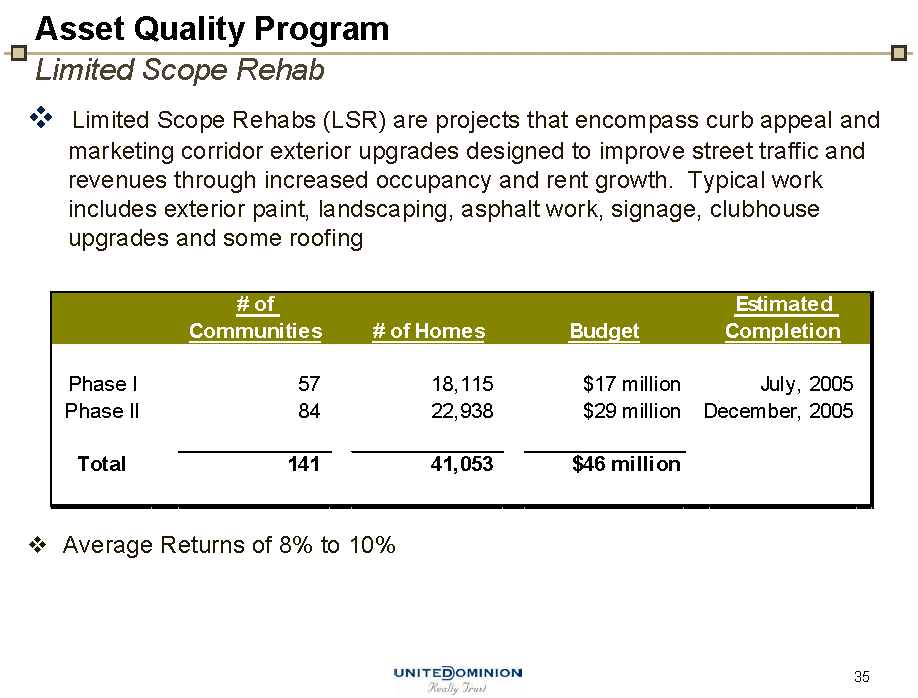
| Asset Quality ProgramLimited Scope Rehab Limited Scope Rehabs (LSR) are projects that encompass curb appeal and marketing corridor exterior upgrades designed to improve street traffic and revenues through increased occupancy and rent growth. Typical work includes exterior paint, landscaping, asphalt work, signage, clubhouse upgrades and some roofing Average Returns of 8% to 10% |
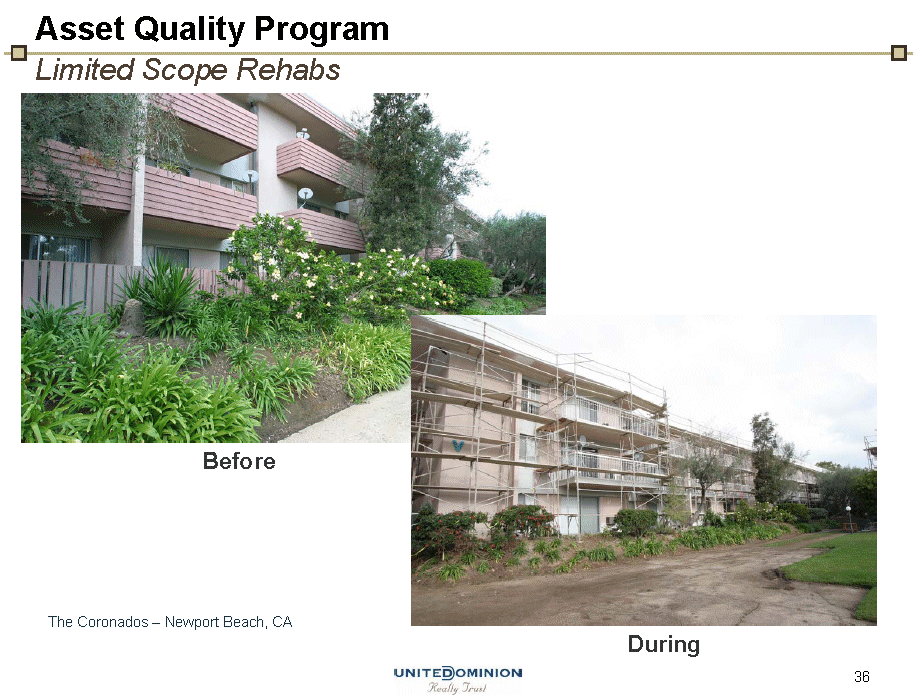
| Before During The Coronados – Newport Beach, CA Asset Quality ProgramLimited Scope Rehabs |
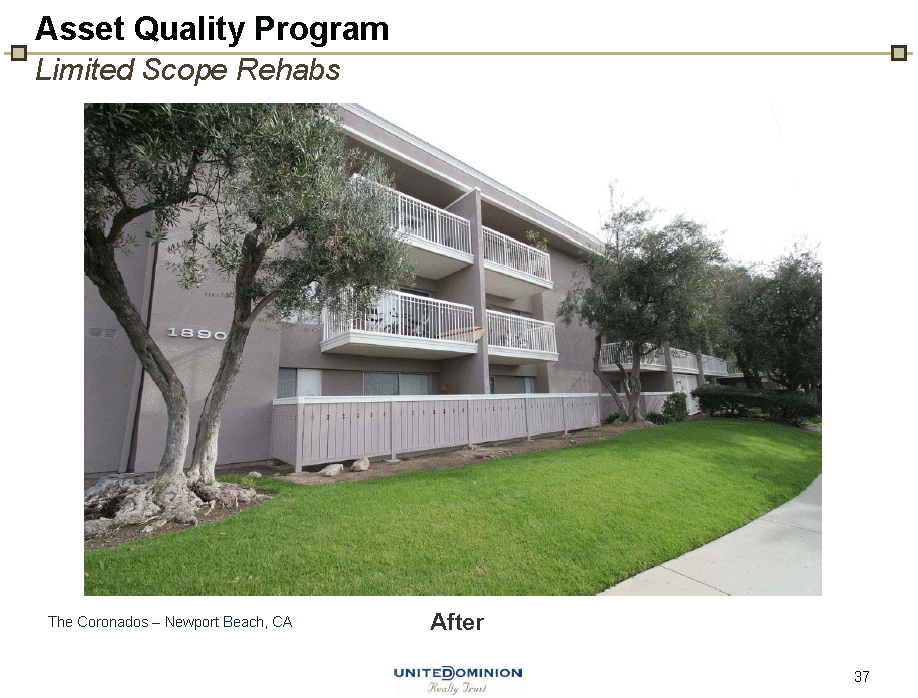
| Asset Quality ProgramLimited Scope Rehabs After The Coronados – Newport Beach, CA |
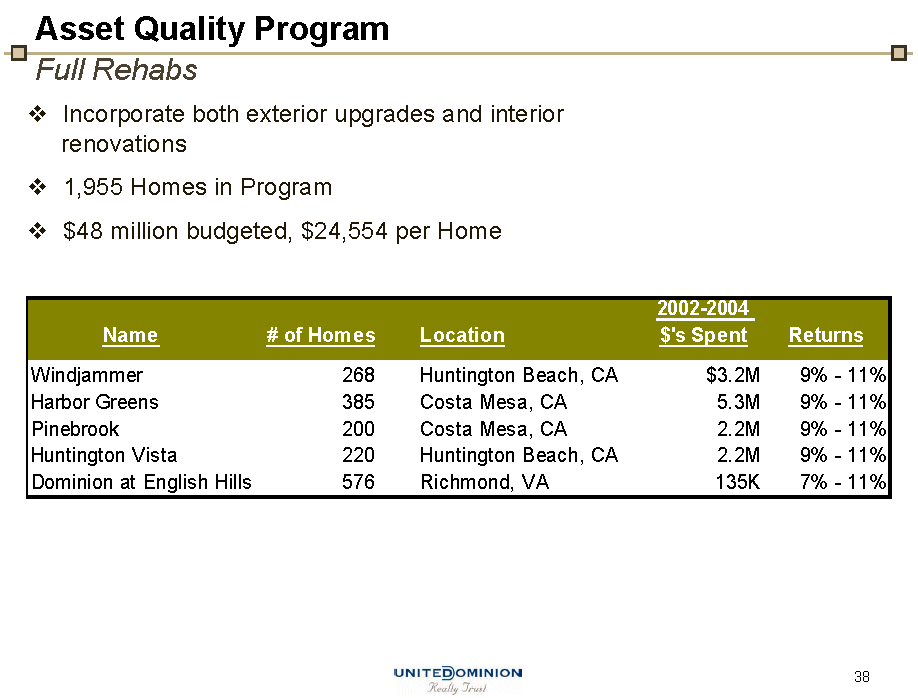
| Incorporate both exterior upgrades and interior renovations 1,955 Homes in Program $48 million budgeted, $24,554 per Home Asset Quality ProgramFull Rehabs |
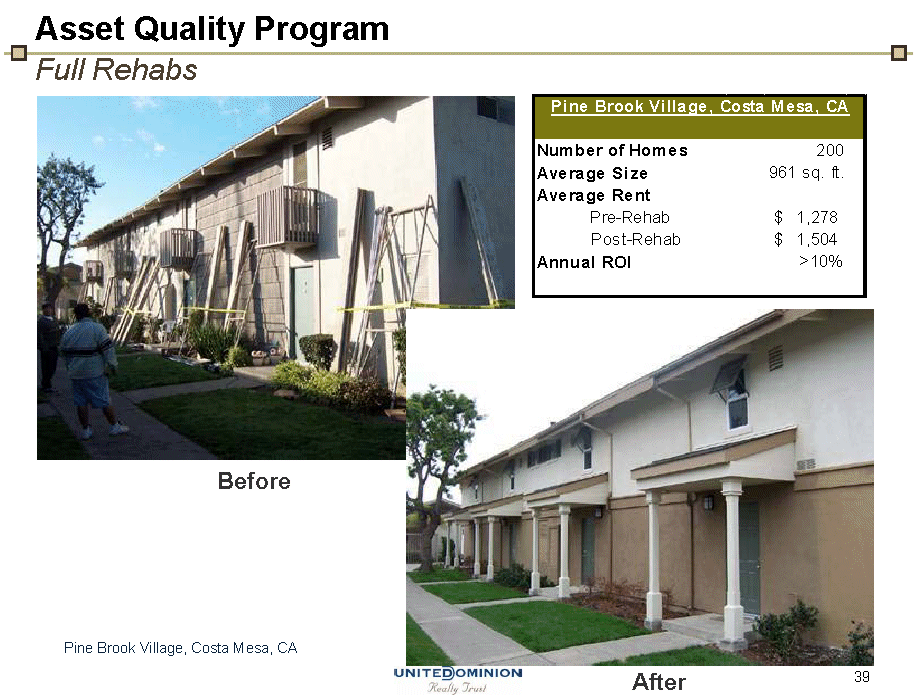
| Before Pine Brook Village, Costa Mesa, CA Asset Quality ProgramFull Rehabs After |
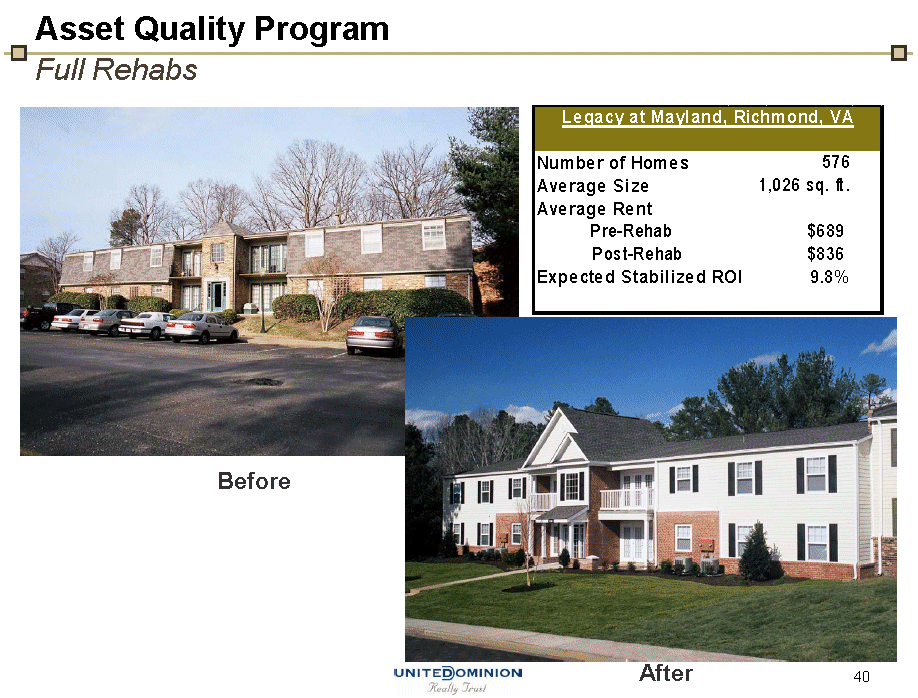
| Before After Asset Quality ProgramFull Rehabs |
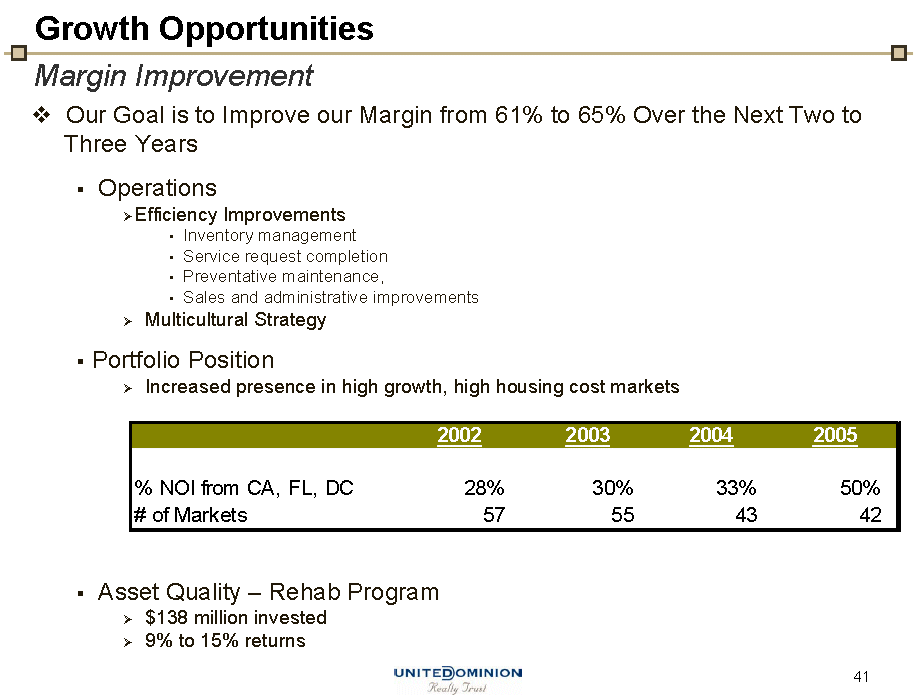
| Growth OpportunitiesMargin Improvement Our Goal is to Improve our Margin from 61% to 65% Over the Next Two to Three Years Operations Efficiency Improvements Inventory management Service request completion Preventative maintenance, Sales and administrative improvements Multicultural Strategy Portfolio Position Increased presence in high growth, high housing cost markets Asset Quality – Rehab Program $138 million invested 9% to 15% returns |
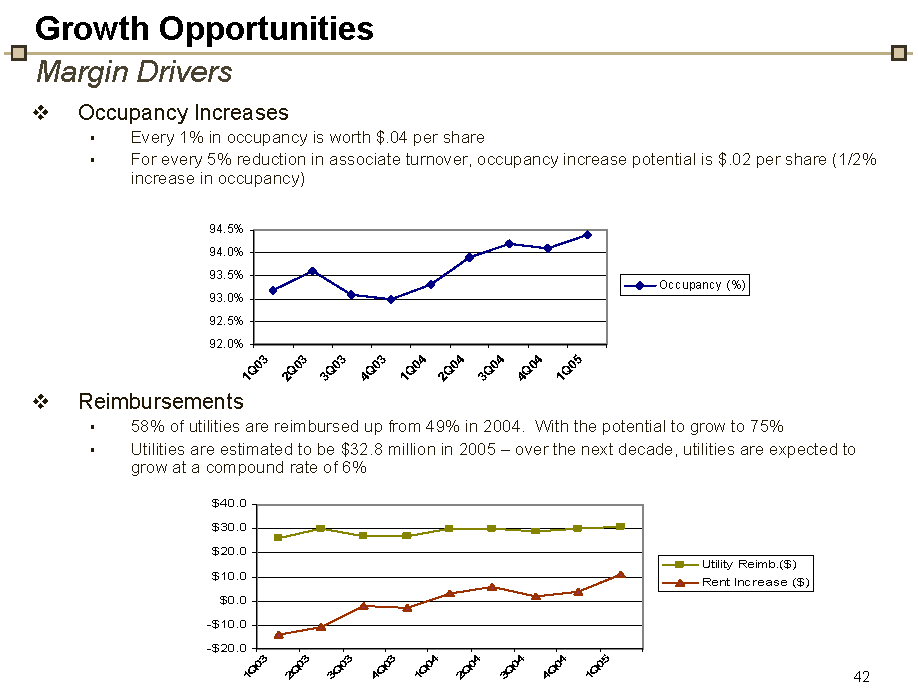
| Growth OpportunitiesMargin Drivers Occupancy Increases Every 1% in occupancy is worth $.04 per share For every 5% reduction in associate turnover, occupancy increase potential is $.02 per share (1/2% increase in occupancy) Reimbursements 58% of utilities are reimbursed up from 49% in 2004. With the potential to grow to 75% Utilities are estimated to be $32.8 million in 2005 – over the next decade, utilities are expected to grow at a compound rate of 6% |
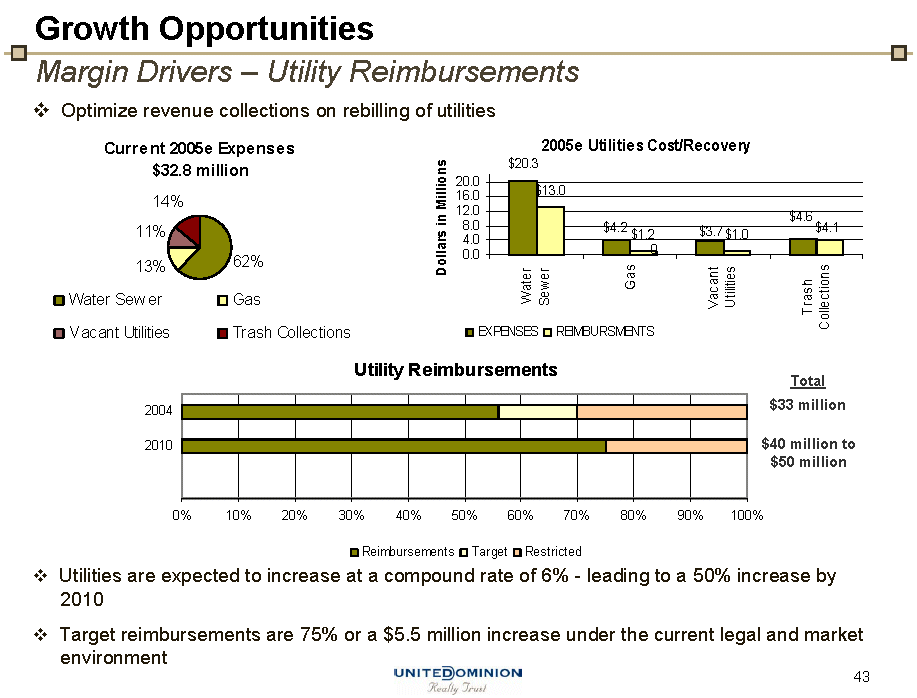
| Growth OpportunitiesMargin Drivers – Utility Reimbursements Optimize revenue collections on rebilling of utilities Utility Reimbursements Utilities are expected to increase at a compound rate of 6% — leading to a 50% increase by 2010 Target reimbursements are 75% or a $5.5 million increase under the current legal and market environment |
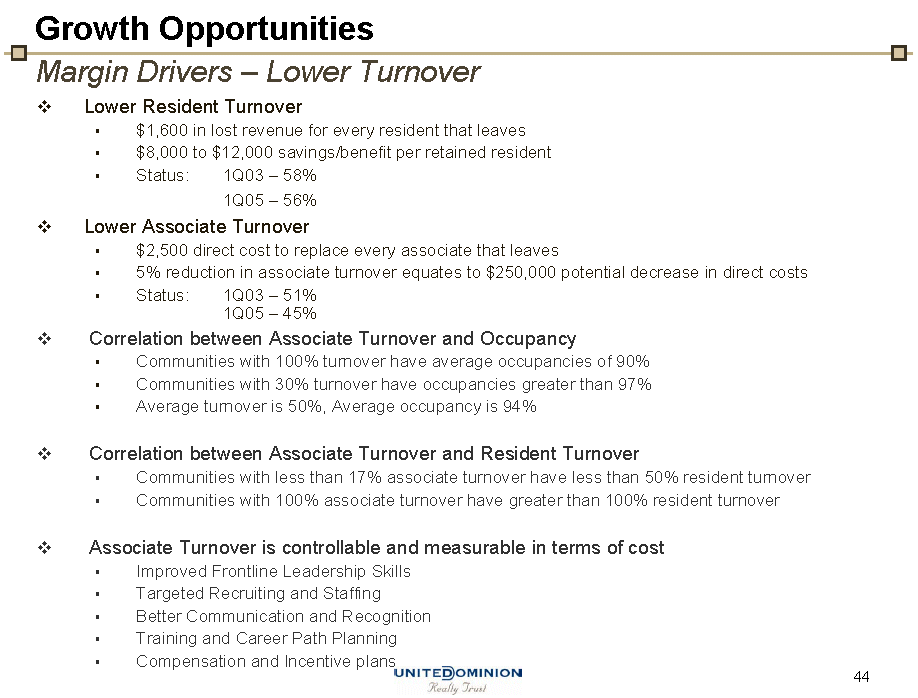
| Growth OpportunitiesMargin Drivers – Lower Turnover Lower Resident Turnover $1,600 in lost revenue for every resident that leaves $8,000 to $12,000 savings/benefit per retained resident Status: 1Q03 – 58% 1Q05 – 56% Lower Associate Turnover $2,500 direct cost to replace every associate that leaves 5% reduction in associate turnover equates to $250,000 potential decrease in direct costs Status: 1Q03 – 51% 1Q05 – 45% Correlation between Associate Turnover and Occupancy Communities with 100% turnover have average occupancies of 90% Communities with 30% turnover have occupancies greater than 97% Average turnover is 50%, Average occupancy is 94% Correlation between Associate Turnover and Resident Turnover Communities with less than 17% associate turnover have less than 50% resident turnover Communities with 100% associate turnover have greater than 100% resident turnover Associate Turnover is controllable and measurable in terms of cost Improved Frontline Leadership Skills Targeted Recruiting and Staffing Better Communication and Recognition Training and Career Path Planning Compensation and Incentive plans |

| Growth OpportunitiesMargin Drivers Efficiency Improvements Inventory Management Service Request Completion Preventative Maintenance Sales and Administrative Improvements Multicultural Strategy Latinos are 13% of US population, with 55% renters 51% of UDR 2005 NOI is from markets with greater than 15% Latinos in market |
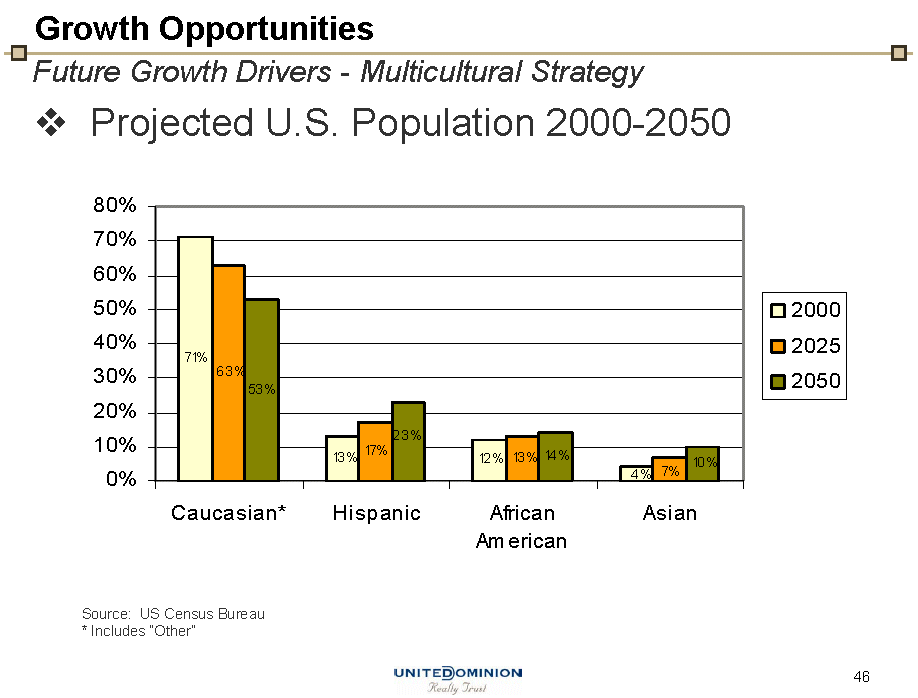
| Growth OpportunitiesFuture Growth Drivers — Multicultural Strategy Projected U.S. Population 2000-2050 Source: US Census Bureau * Includes “Other” |
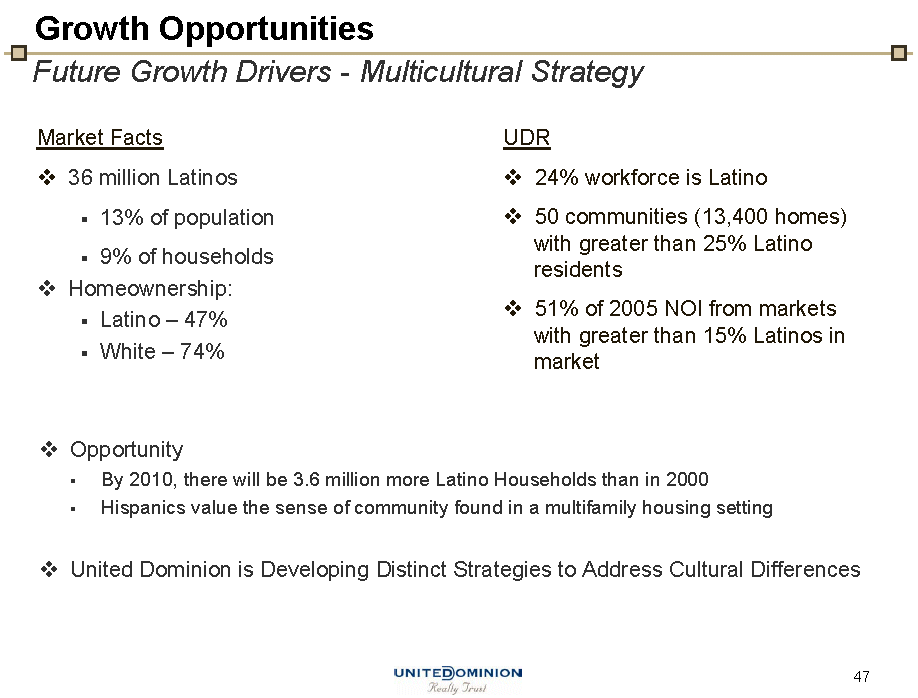
| Growth OpportunitiesFuture Growth Drivers — Multicultural Strategy Market Facts UDR 36 million Latinos 13% of population 9% of households Homeownership: Latino – 47% White – 74% 24% workforce is Latino 50 communities (13,400 homes) with greater than 25% Latino residents 51% of 2005 NOI from markets with greater than 15% Latinos in market Opportunity By 2010, there will be 3.6 million more Latino Households than in 2000 Hispanics value the sense of community found in a multifamily housing setting United Dominion is Developing Distinct Strategies to Address Cultural Differences |
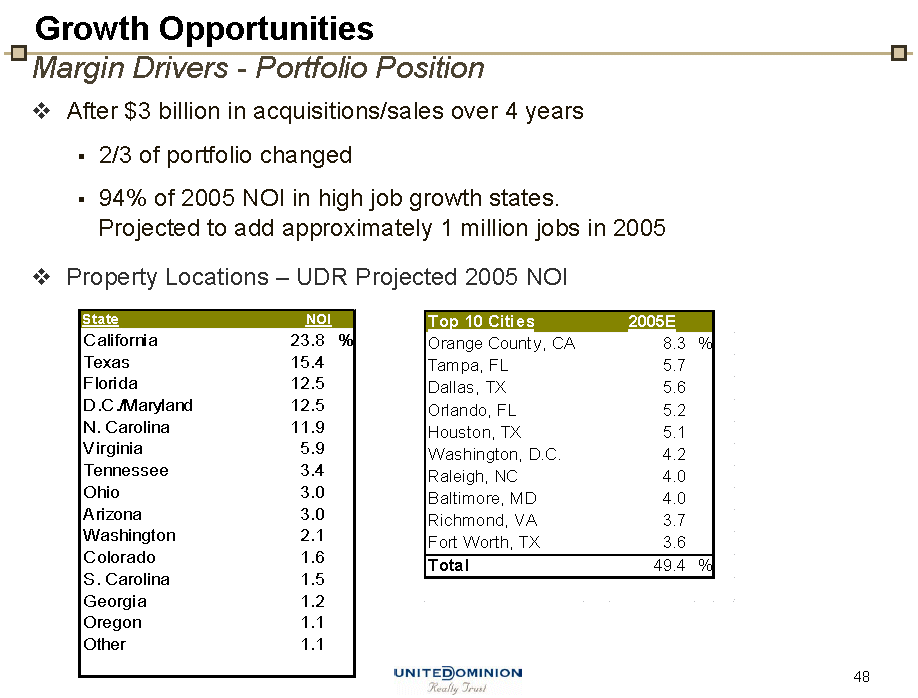
| Growth OpportunitiesMargin Drivers — Portfolio Position After $3 billion in acquisitions/sales over 4 years 2/3 of portfolio changed 94% of 2005 NOI in high job growth states. Projected to add approximately 1 million jobs in 2005 |
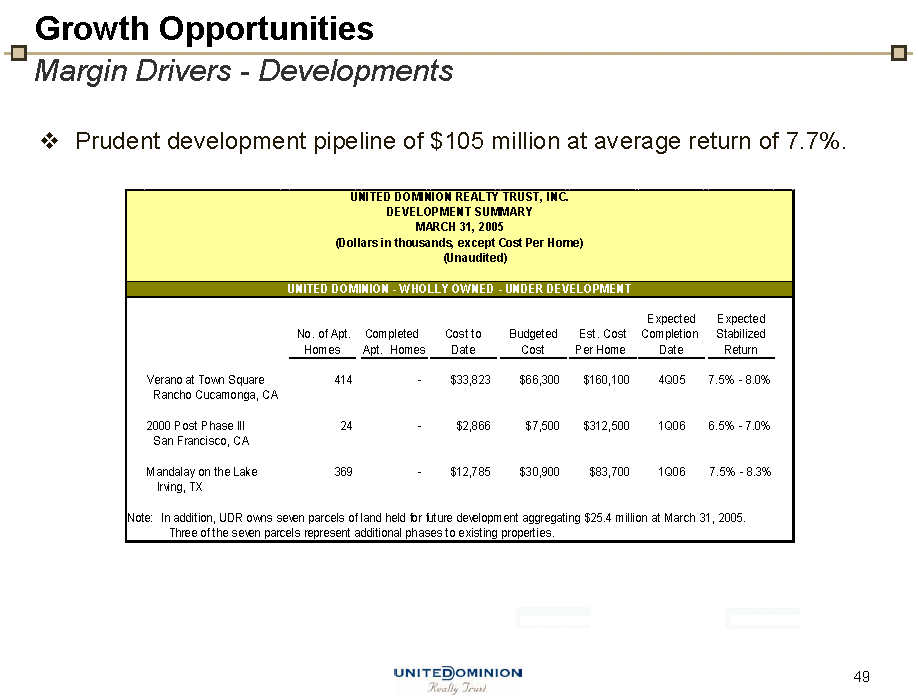
| Property Locations – UDR Projected 2005 NOI Growth OpportunitiesMargin Drivers — Developments Prudent development pipeline of $105 million at average return of 7.7%. |

| Blank Slide Intentional |
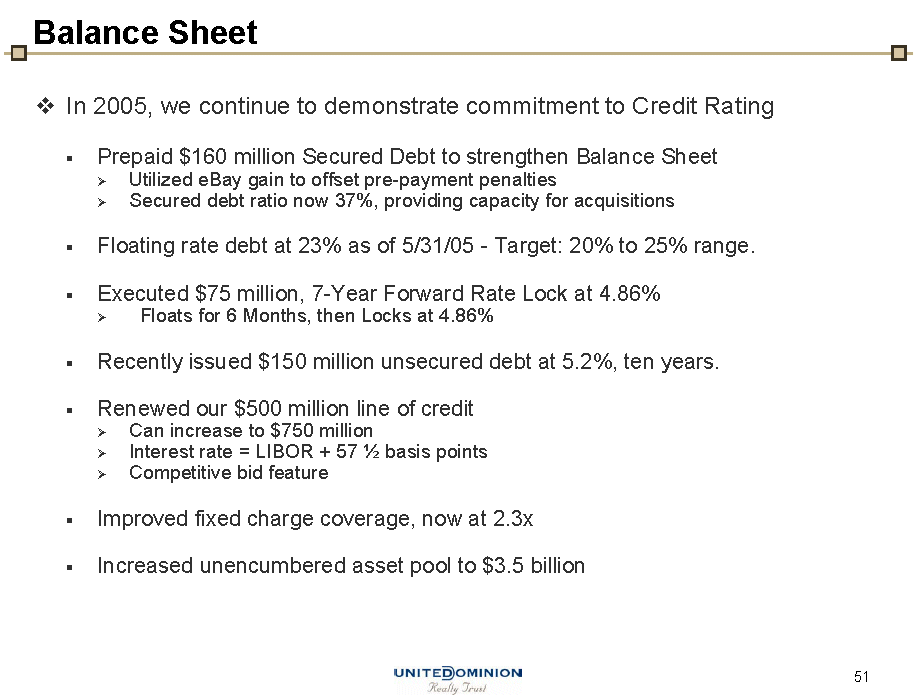
| Balance Sheet In 2005, we continue to demonstrate commitment to Credit Rating Prepaid $160 million Secured Debt to strengthen Balance Sheet Utilized eBay gain to offset pre-payment penalties Secured debt ratio now 37%, providing capacity for acquisitions Floating rate debt at 23% as of 5/31/05 — Target: 20% to 25% range. Executed $75 million, 7-Year Forward Rate Lock at 4.86% Floats for 6 Months, then Locks at 4.86% Recently issued $150 million unsecured debt at 5.2%, ten years. Renewed our $500 million line of credit Can increase to $750 million Interest rate = LIBOR + 571/2 basis points Competitive bid feature Improved fixed charge coverage, now at 2.3x Increased unencumbered asset pool to $3.5 billion |
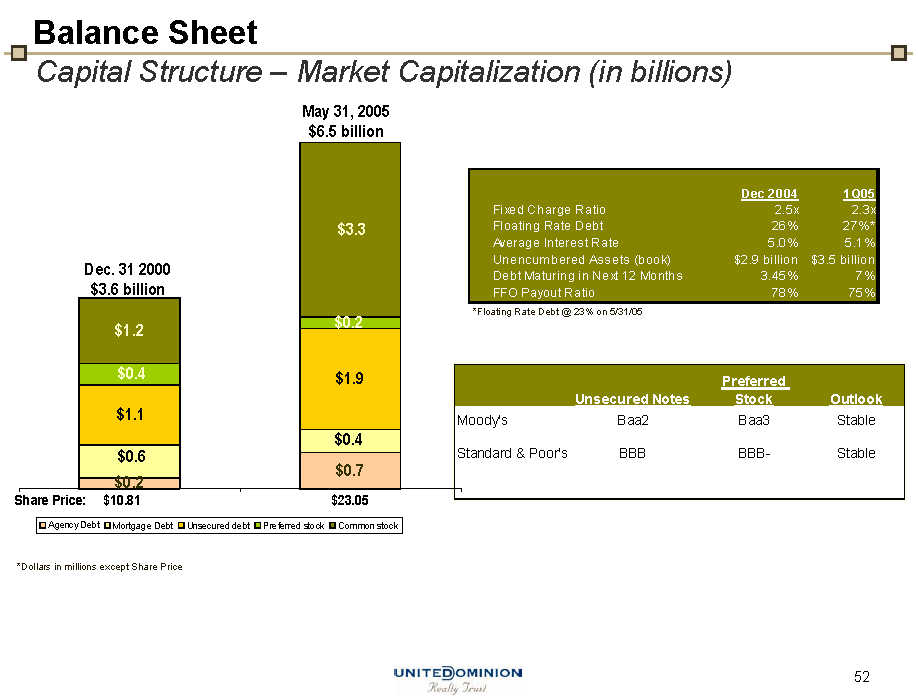
| Balance SheetCapital Structure – Market Capitalization (in billions) |

| Balance SheetGoals to Maintain Safety and Fund Our Growth 2005 ACTION PLAN Improve outlook on investment grade rating of BBB/Baa2 $96 million of debt maturing at an average rate of 7.33% Redeemed remaining $50 million of Preferred D in 4Q04 Continue to increase size and quality of unencumbered asset pool, now at $3.5 billion Line of Credit renewed in May, 2005 Executed $75 million, 7- Year Forward Rate Lock at 4.86% Prepaid $160 million of Secured Debt at a cost of $8.9 million utilizing eBay gain, which reduces Secured Debt Ratio from 42% to 36% on a proforma basis as of Dec. 31, 2004, reduces principle amortization by approximately $1.4 million, improves fixed charge coverage from 2.36x to 2.38x in 2005, and improves run rate earnings by $0.02 per share in 2006. PREDICTABILITY Enhance earnings predictability and security of the dividend Well- balanced maturity schedule (12% to14% of total debt per annum) Prudent level of variable rate debt at 20% to 25% of total debt Manage our exposure to our “Rate Sensitive Debt” (variable rate debt + next 12 months debt and SWAP maturities) STRENGTH & FLEXIBILITY Enhance ability to capitalize on opportunities $3.5 billion current value of unencumbered asset pool improves leverage ratios Maintain price- optimized access to fixed income market $800 million of availability under existing credit facilities |
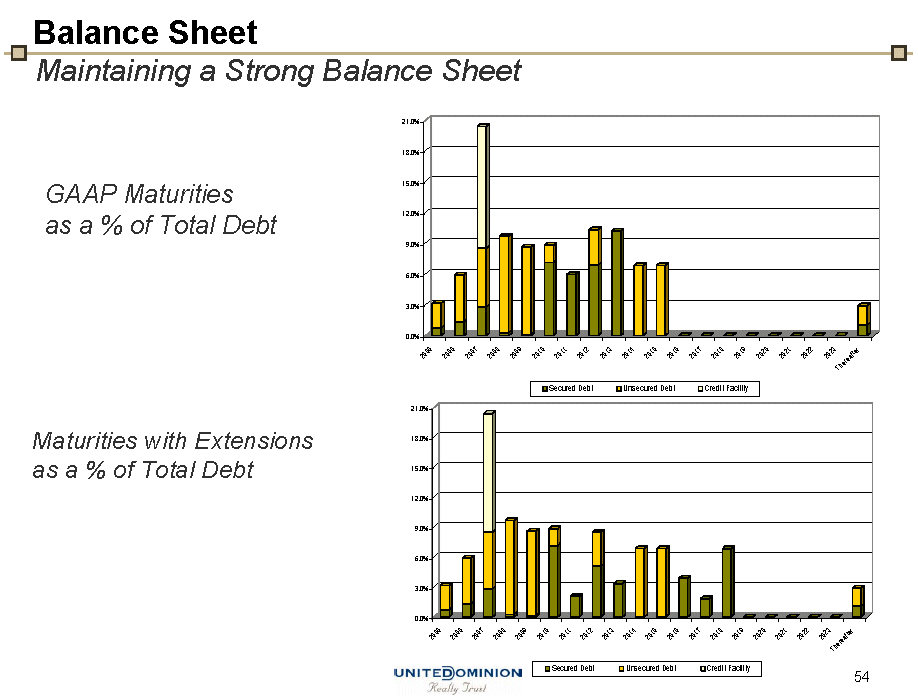
| Balance SheetMaintaining a Strong Balance Sheet GAAP Maturities as a % of Total Debt Maturities with Extensions as a % of Total Debt |
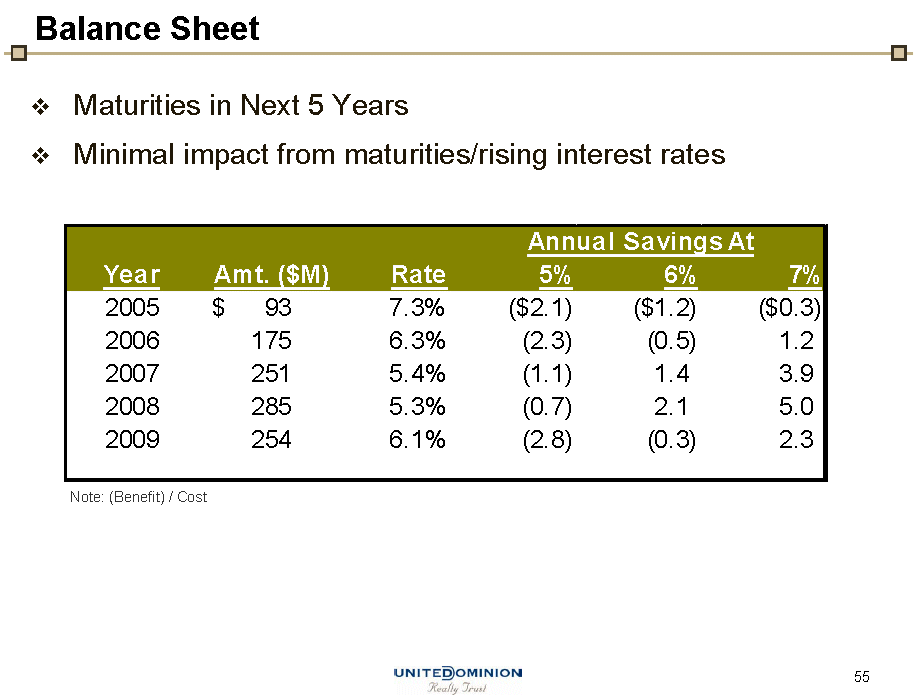
| Balance Sheet Maturities in Next 5 Years Minimal impact from maturities/rising interest rates |
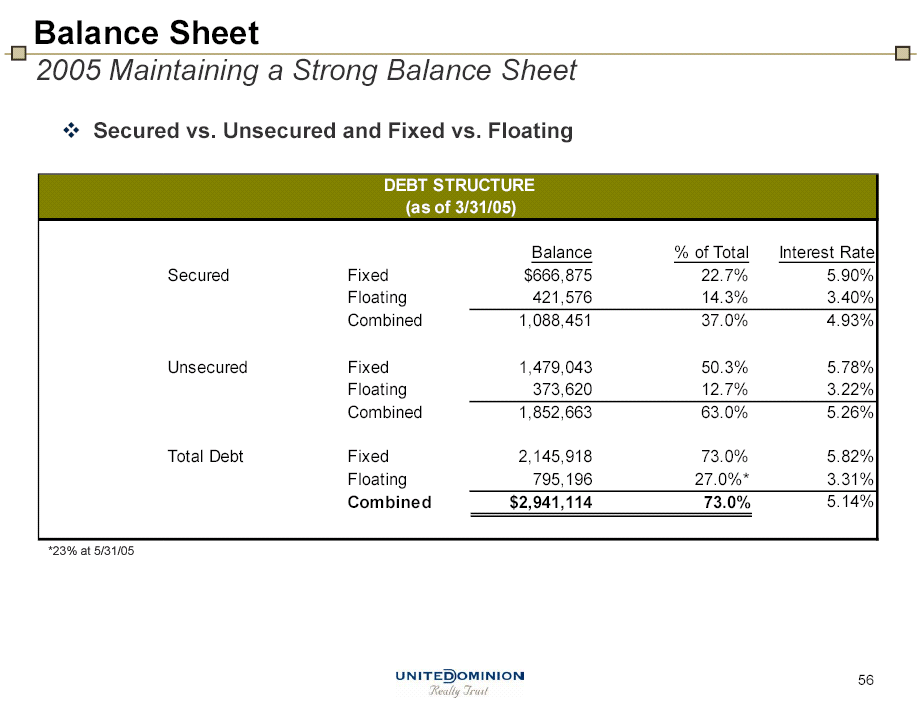
| Balance Sheet 2005 Maintaining a Strong Balance Sheet Secured vs. Unsecured and Fixed vs. Floating DEBT STRUCTURE (as of 3/31/05) Balance % of Total Interest Rate Secured Fixed $666,875 22.7% 5.90% Floating 421,576 14.3% 3.40% Combined 1,088,451 37.0% 4.93% Unsecured Fixed 1,479,043 50.3% 5.78% Floating 373,620 12.7% 3.22% Combined 1,852,663 63.0% 5.26% Total DebtFixed 2,145,918 73.0% 5.82% Floating 795,196 27.0%* 3.31% Combined $2,941,114 73.0% 5.14% *23% at 5/31/05 56 |
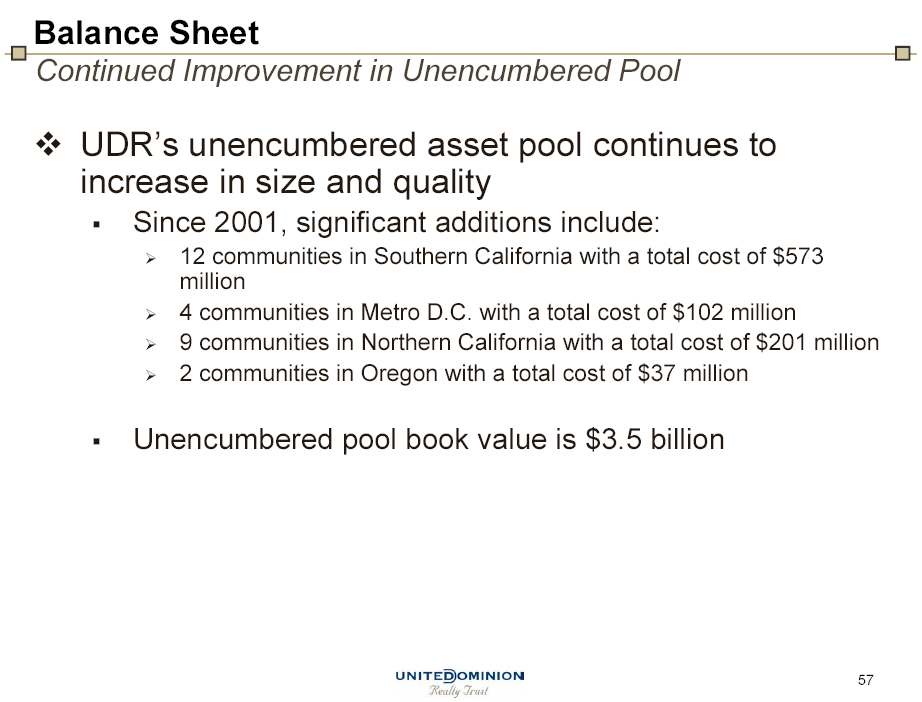
| Balance Sheet Continued Improvement in Unencumbered Pool UDR’s unencumbered asset pool continues to increase in size and quality Since 2001, significant additions include: 12 communities in Southern California with a total cost of $573 million 4 communities in Metro D.C. with a total cost of $102 million 9 communities in Northern California with a total cost of $201 million 2 communities in Oregon with a total cost of $37 million Unencumbered pool book value is $3.5 billion 57 |
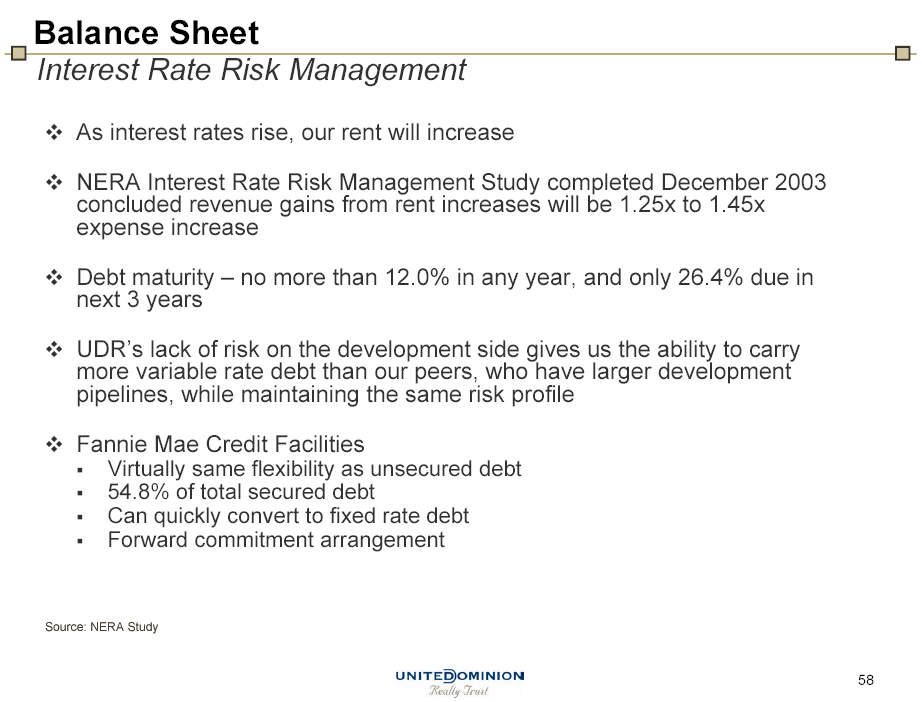
| Balance Sheet Interest Rate Risk Management As interest rates rise, our rent will increase NERA Interest Rate Risk Management Study completed December 2003 concluded revenue gains from rent increases will be 1.25x to 1.45x expense increase Debt maturity – no more than 12.0% in any year, and only 26.4% due in next 3 years UDR’s lack of risk on the development side gives us the ability to carry more variable rate debt than our peers, who have larger development pipelines, while maintaining the same risk profile Fannie Mae Credit Facilities Virtually same flexibility as unsecured debt 54.8% of total secured debt Can quickly convert to fixed rate debt Forward commitment arrangement Source: NERA Study 58 |
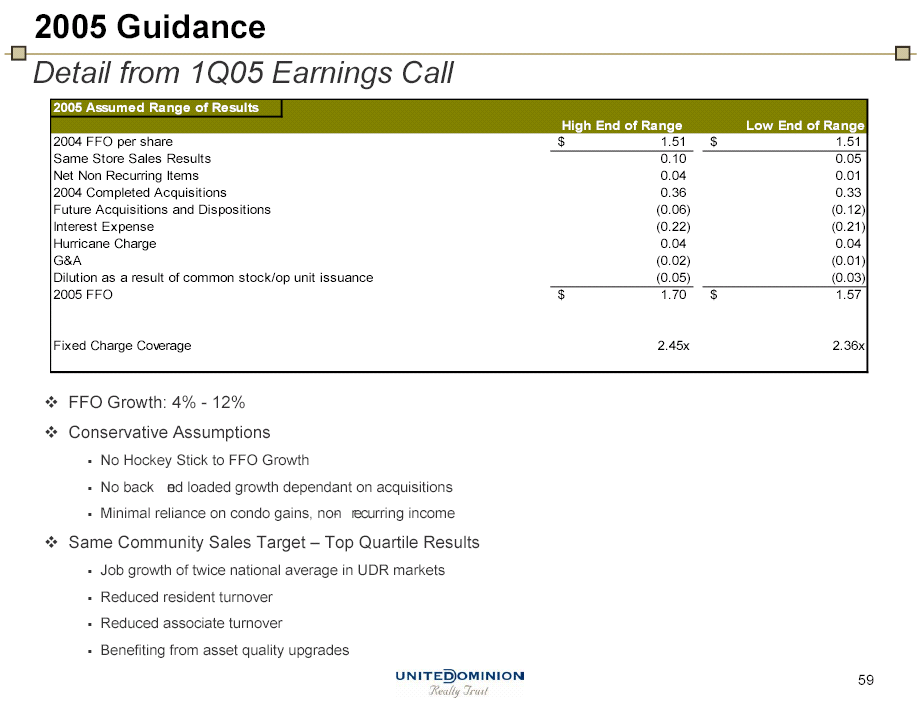
| 2005 Guidance Detail from 1Q05 Earnings Call 2005 Assumed Range of Results High End of Range Low End of Range 2004 FFO per share $ 1.51 $ 1.51 Same Store Sales Results 0.10 0.05 Net Non Recurring Items 0.04 0.01 2004 Completed Acquisitions 0.36 0.33 Future Acquisitions and Dispositions (0.06) (0.12) Interest Expense (0.22) (0.21) Hurricane Charge 0.04 0.04 G&A (0.02) (0.01) Dilution as a result of common stock/op unit issuance (0.05) (0.03) 2005 FFO $ 1.70 $ 1.57 Fixed Charge Coverage2.45x 2.36x FFO Growth: 4% — 12% Conservative Assumptions No Hockey Stick to FFO Growth No back- end loaded growth dependant on acquisitions Minimal reliance on condo gains, non- recurring income Same Community Sales Target – Top Quartile Results Job growth of twice national average in UDR markets Reduced resident turnover Reduced associate turnover Benefiting from asset quality upgrades 59 |
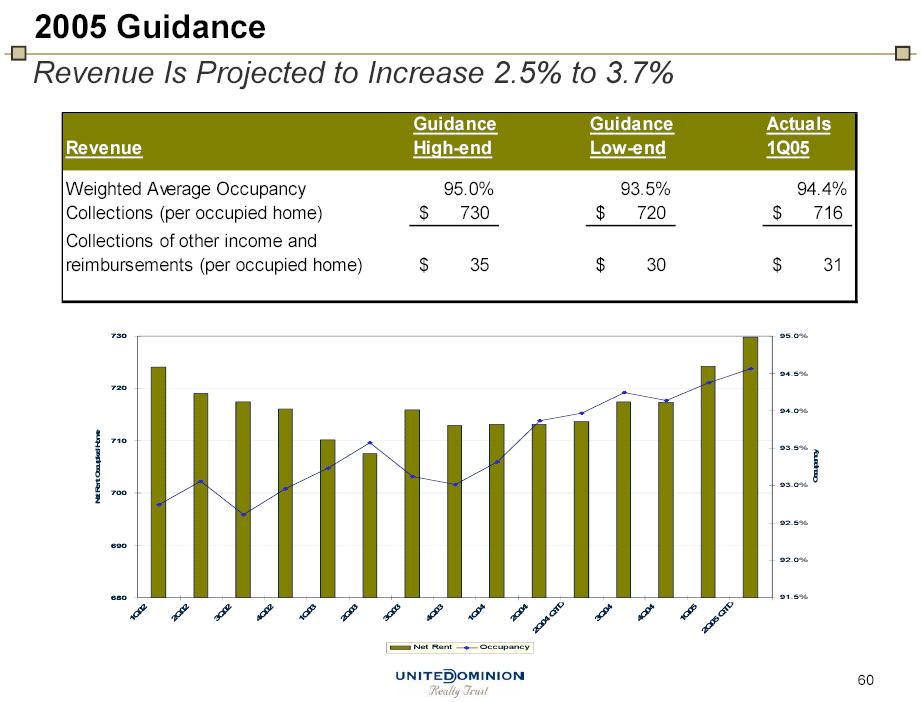
| 2005 Guidance Revenue Is Projected to Increase 2.5% to 3.7% Guidance Guidance Actuals Revenue High-end Low-end 1Q05 Weighted Average Occupancy 95.0% 93.5% 94.4% Collections (per occupied home) $ 730 $ 720 $ 716 Collections of other income and reimbursements (per occupied home) $ 35 $ 30 $ 31 730 95.0% 94.5% 720 94.0% 710 93.5% Occupancy 93.0% Net Rent Occupied Home 700 92.5% 690 92.0% 68091.5% 3D 45 D 0202 0202 03 0 03 03 04 04 T 04 0 0 QT Q3Q 4Q1Q Q Q Q 1Q2Q 3Q4Q 1Q 2 2Q 04 3Q 4 1 05 2Q2Q Net Rent Occupancy 60 |
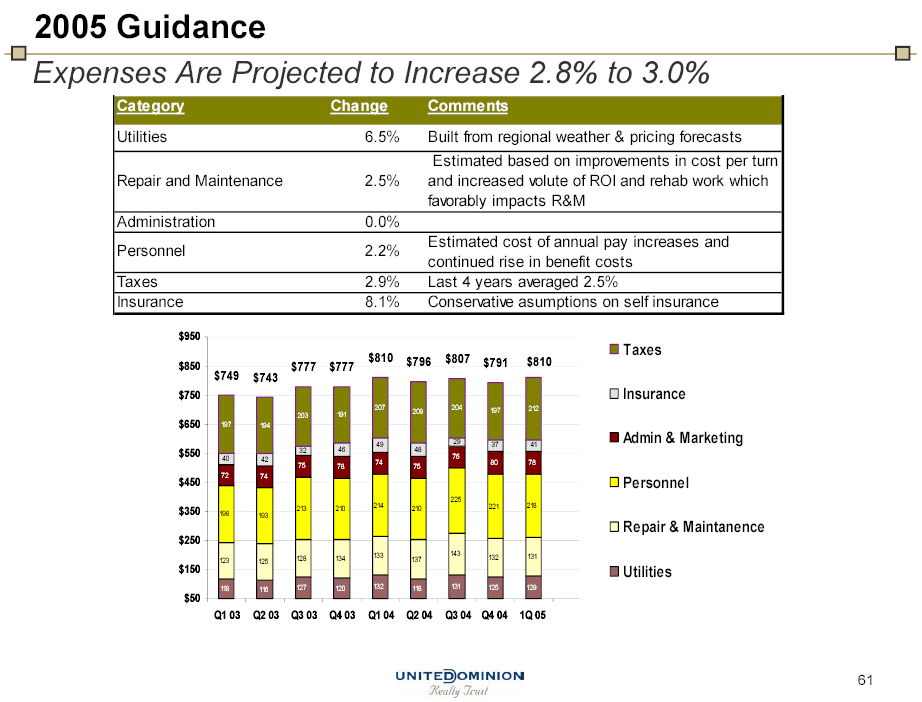
| 2005 Guidance Expenses Are Projected to Increase 2.8% to 3.0% Category Change Comments Utilities 6.5% Built from regional weather & pricing forecasts Estimated based on improvements in cost per turn Repair and Maintenance 2.5% and increased volute of ROI and rehab work which favorably impacts R&M Administration 0.0% Estimated cost of annual pay increases and Personnel 2.2% continued rise in benefit costs Taxes 2.9% Last 4 years averaged 2.5% Insurance 8.1% Conservative asumptions on self insurance $950 Taxes $810 $796 $807 $791 $810 $850 $777 $777 $749 $743 $750 Insurance 207 204 197 212 191 209 203 $650 197 194 29 Admin & Marketing 4937 41 $55032 46 48 4042 76 7574 80 78 7875 7274 $450 Personnel 225 213210 214 210 221 218 $350 198 193 Repair & Maintanence $250 133 143 132 131 12 3 125 128 134 137 $150 Utilities 118 116 127 120 132 118 131 125 129 $50 Q1 03 Q2 03 Q3 03 Q4 03 Q1 04 Q2 04 Q3 04 Q4 04 1Q 05 61 |
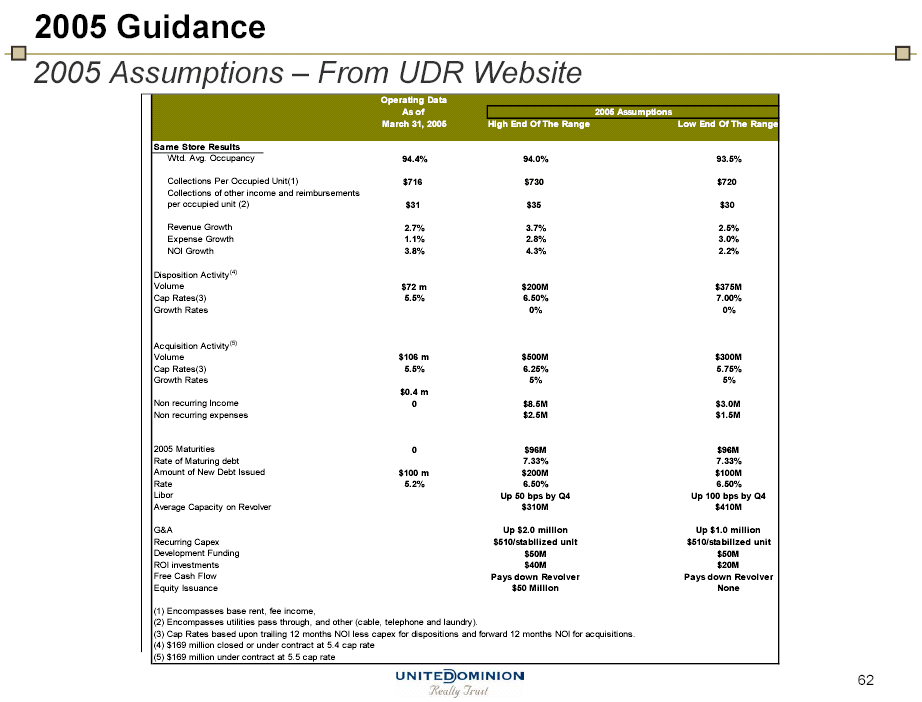
| 2005 Guidance 2005 Assumptions – From UDR Website Operating Data As of 2005 Assumptions March 31, 2005High End Of The Range Low End Of The Range Same Store Results Wtd. Avg. Occupancy 94.4% 94.0% 93.5% Collections Per Occupied Unit(1) $716 $730 $720 Collections of other income and reimbursements per occupied unit (2) $31 $35 $30 Revenue Growth 2.7% 3.7% 2.5% Expense Growth 1.1% 2.8% 3.0% NOI Growth 3.8% 4.3% 2.2% Disposition Activity(4) Volume $72 m $200M $375M Cap Rates(3) 5.5% 6.50% 7.00% Growth Rates 0% 0% Acquisition Activity(5) Volume$106 m $500M $300M Cap Rates(3)5.5%6.25%5.75% Growth Rates5%5% $0.4 m Non recurring Income 0 $8.5M $3.0M Non recurring expenses $2.5M $1.5M 2005 Maturities 0 $96M $96M Rate of Maturing debt 7.33% 7.33% Amount of New Debt Issued $100 m $200M $100M Rate5.2%6.50% 6.50% Libor Up 50 bps by Q4Up 100 bps by Q4 Average Capacity on Revolver $310M $410M G&A Up $2.0 millionUp $1.0 million Recurring Capex $510/stabilized unit $510/stabilized unit Development Funding$50M $50M ROI investments $40M $20M Free Cash Flow Pays down Revolver Pays down Revolver Equity Issuance $50 Million None (1) Encompasses base rent, fee income, (2) Encompasses utilities pass through, and other (cable, telephone and laundry). (3) Cap Rates based upon trailing 12 months NOI less capex for dispositions and forward 12 months NOI for acquisitions. (4) $169 million closed or under contract at 5.4 cap rate (5) $169 million under contract at 5.5 cap rate 62 |
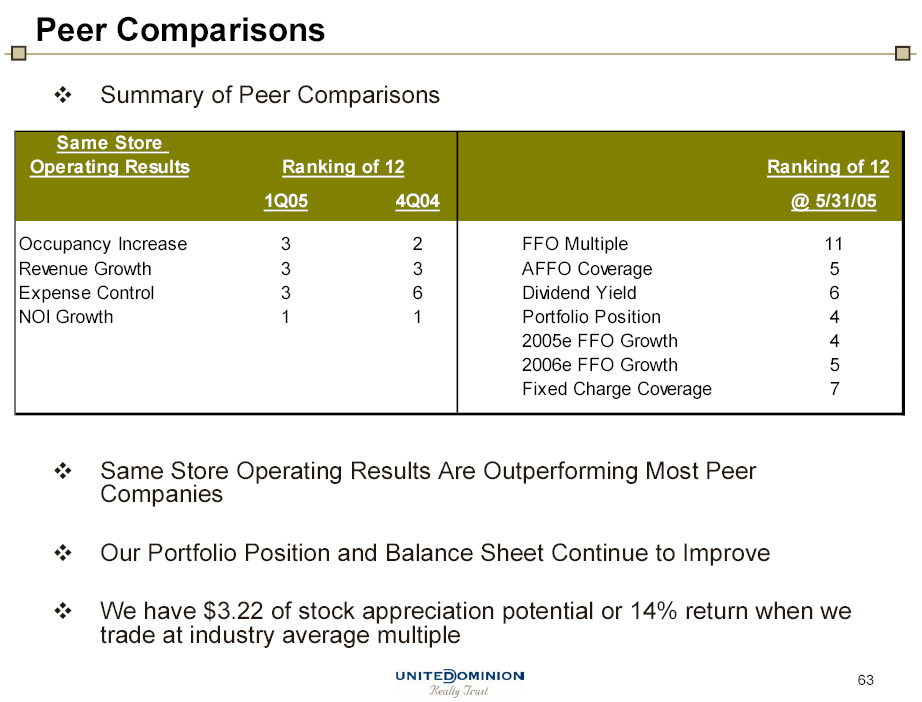
| Peer Comparisons Summary of Peer Comparisons Same Store Operating Results Ranking of 12 Ranking of 12 1Q05 4Q04 @ 5/31/05 Occupancy Increase 3 2 FFO Multiple 11 Revenue Growth 3 3 AFFO Coverage 5 Expense Control 3 6 Dividend Yield 6 NOI Growth 1 1 Portfolio Position 4 2005e FFO Growth 4 2006e FFO Growth 5 Fixed Charge Coverage 7 Same Store Operating Results Are Outperforming Most Peer Companies Our Portfolio Position and Balance Sheet Continue to Improve We have $3.22 of stock appreciation potential or 14% return when we trade at industry average multiple 63 |
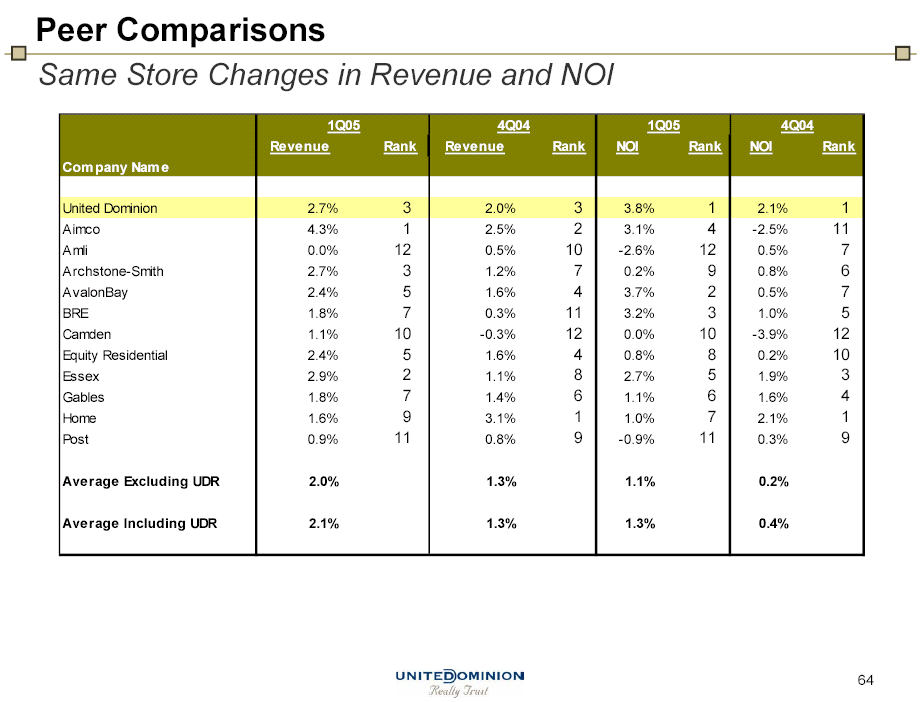
| Peer Comparisons Same Store Changes in Revenue and NOI 1Q05 4Q04 1Q05 4Q04 Revenue Rank Revenue Rank NOI Rank NOI Rank Company Name United Dominion 2.7% 3 2.0% 3 3.8% 1 2.1% 1 Aimco 4.3% 1 2.5% 2 3.1% 4 -2.5% 11 Amli 0.0% 12 0.5% 10 -2.6% 12 0.5% 7 Archstone-Smith 2.7% 3 1.2% 7 0.2% 9 0.8% 6 AvalonBay 2.4% 5 1.6% 4 3.7% 2 0.5% 7 BRE 1.8% 7 0.3% 11 3.2% 3 1.0% 5 Camden 1.1% 10 -0.3% 12 0.0% 10 -3.9% 12 Equity Residential 2.4% 5 1.6% 4 0.8% 8 0.2% 10 Essex 2.9% 2 1.1% 8 2.7% 5 1.9% 3 Gables 1.8% 7 1.4% 6 1.1% 6 1.6% 4 Home 1.6% 9 3.1% 1 1.0% 7 2.1% 1 Post 0.9% 11 0.8% 9 -0.9% 11 0.3% 9 Average Excluding UDR2.0% 1.3%1.1% 0.2% Average Including UDR2.1% 1.3%1.3% 0.4% 64 |
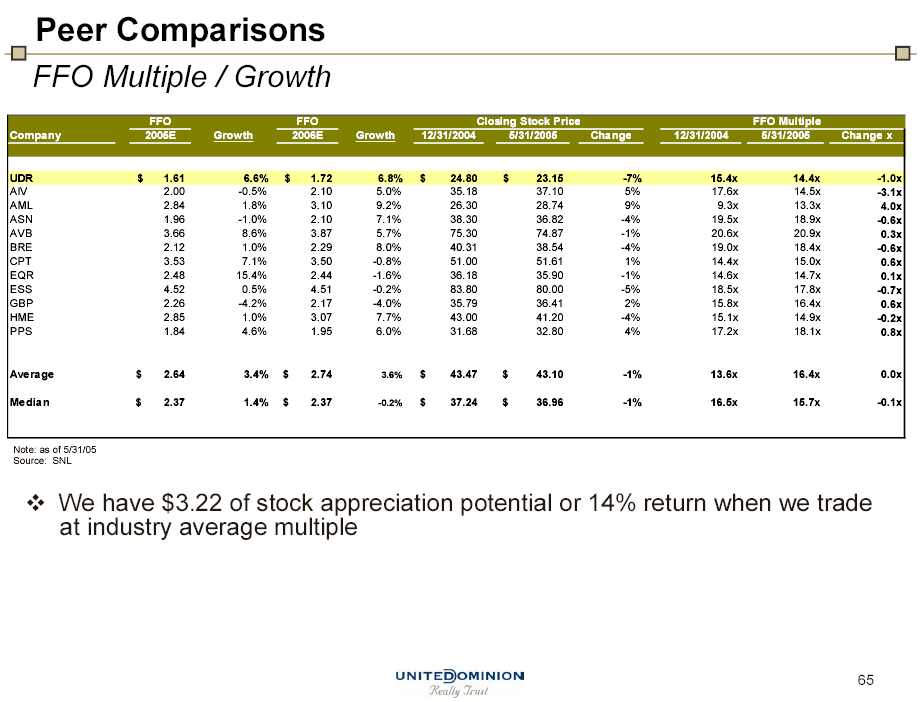
| Peer Comparisons FFO Multiple / Growth FFO FFO Closing Stock Price FFO Multiple Company 2005E Growth 2006E Growth 12/31/2004 5/31/2005 Change 12/31/2004 5/31/2005 Change x UDR $ 1.61 6.6% $ 1.72 6.8% $ 24.80 $ 23.15 -7% 15.4x 14.4x -1.0x AIV 2.00 -0.5% 2.10 5.0% 35.18 37.10 5% 17.6x 14.5x -3.1x AML 2.84 1.8% 3.10 9.2% 26.30 28.74 9% 9.3x 13.3x 4.0x ASN 1.96 -1.0% 2.10 7.1% 38.30 36.82 -4% 19.5x 18.9x -0.6x AVB 3.66 8.6% 3.87 5.7% 75.30 74.87 -1% 20.6x 20.9x 0.3x BRE 2.12 1.0% 2.29 8.0% 40.31 38.54 -4% 19.0x 18.4x -0.6x CPT 3.53 7.1% 3.50 -0.8% 51.00 51.61 1% 14.4x 15.0x 0.6x EQR 2.48 15.4% 2.44 -1.6% 36.18 35.90 -1% 14.6x 14.7x 0.1x ESS 4.52 0.5% 4.51 -0.2% 83.80 80.00 -5% 18.5x 17.8x -0.7x GBP 2.26 -4.2% 2.17 -4.0% 35.79 36.41 2% 15.8x 16.4x 0.6x HME 2.85 1.0% 3.07 7.7% 43.00 41.20 -4% 15.1x 14.9x -0.2x PPS 1.84 4.6% 1.95 6.0% 31.68 32.80 4% 17.2x 18.1x 0.8x Average $ 2.64 3.4% $ 2.74 3.6% $ 43.47 $ 43.10 -1% 13.6x 16.4x 0.0x Median $ 2.37 1.4% $ 2.37 -0.2% $ 37.24 $ 36.96 -1% 16.5x 15.7x -0.1x Note: as of 5/31/05 Source: SNL We have $3.22 of stock appreciation potential or 14% return when we trade at industry average multiple 65 |
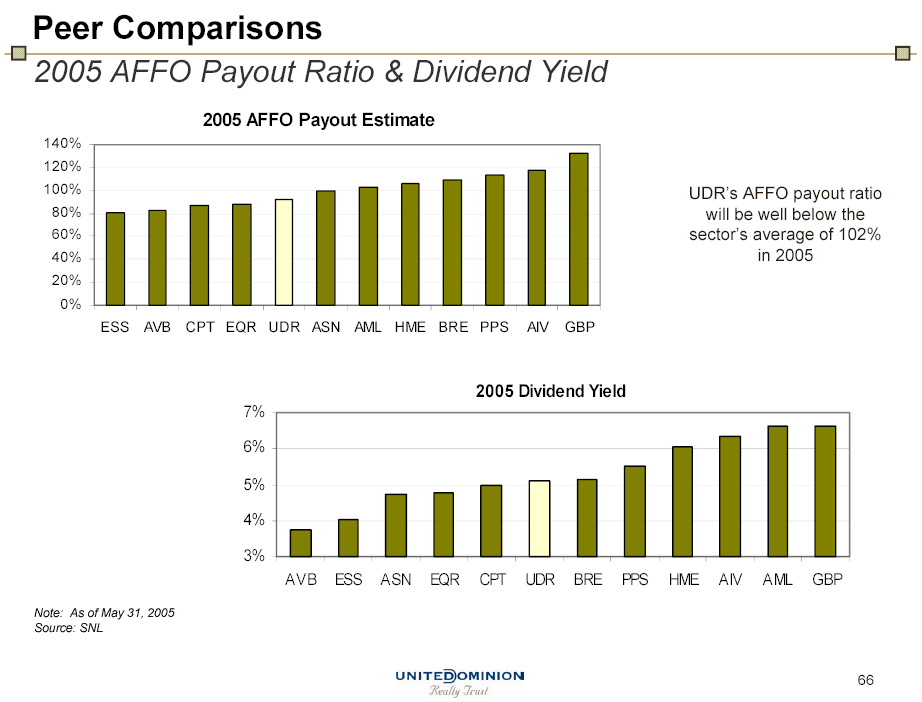
| Peer Comparisons 2005 AFFO Payout Ratio & Dividend Yield 2005 AFFO Payout Estimate 140% 120% 100% UDR’s AFFO payout ratio 80% will be well below the 60% sector’s average of 102% 40% in 2005 20% 0% ESS AVB CPT EQR UDR ASN AML HME BRE PPS AIV GBP 2005 Dividend Yield 7% 6% 5% 4% 3% AVB ESS ASN EQR CPT UDR BRE PPS HME AIV AML GBP Note: As of May 31, 2005 Source: SNL 66 |
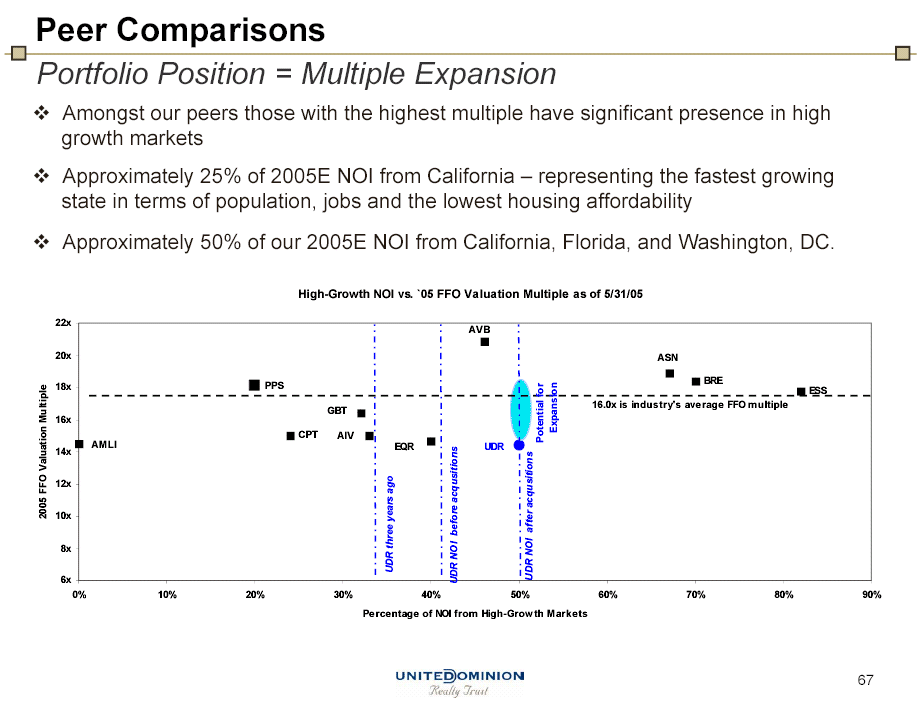
| Peer Comparisons Portfolio Position = Multiple Expansion Amongst our peers those with the highest multiple have significant presence in high growth markets Approximately 25% of 2005E NOI from California – representing the fastest growing state in terms of population, jobs and the lowest housing affordability Approximately 50% of our 2005E NOI from California, Florida, and Washington, DC. High-Growth NOI vs. `05 FFO Valuation Multiple as of 5/31/05 22x AVB 20xASN BRE 18x PPS ESS 16.0x is industry’s average FFO multiple GBT 16x Expansion CPT AIVPotential for AMLI EQRUDR 14x 2005 FFO Valuation Multiple 12x 10x 8x UDR three years ago UDR NOI after acqusitions 6x UDR NOI before acqusitions 0% 10% 20% 30% 40% 50% 60% 70% 80% 90% Percentage of NOI from High-Growth Markets 67 |
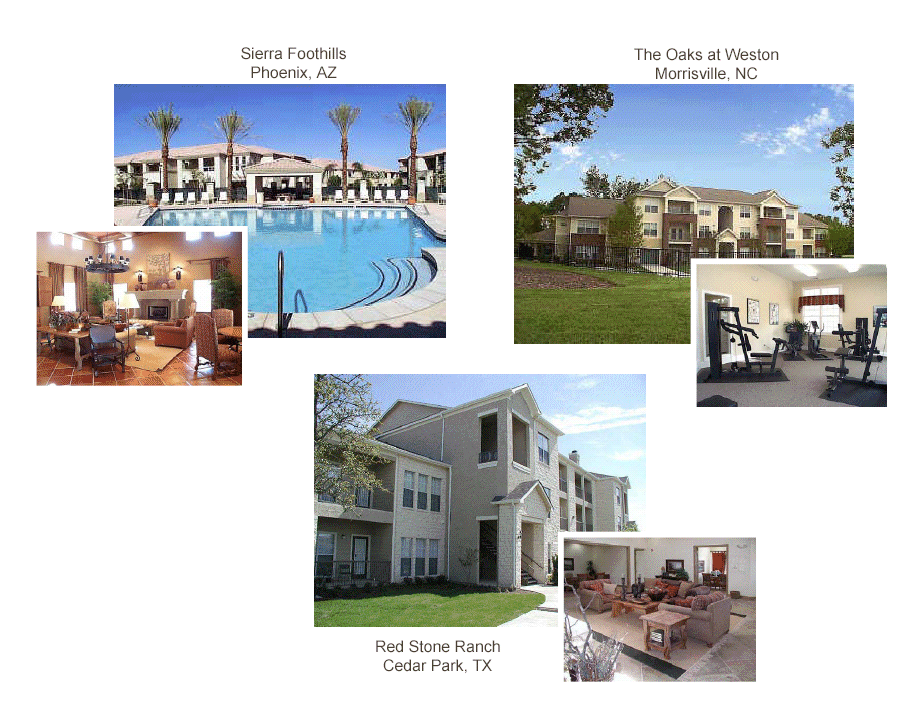
| Sierra Foothills The Oaks at Weston Phoenix, AZ Morrisville, NC Red Stone Ranch Cedar Park, TX 68 |

| 2005 NAREIT Investor Forum June 8 — 10 |
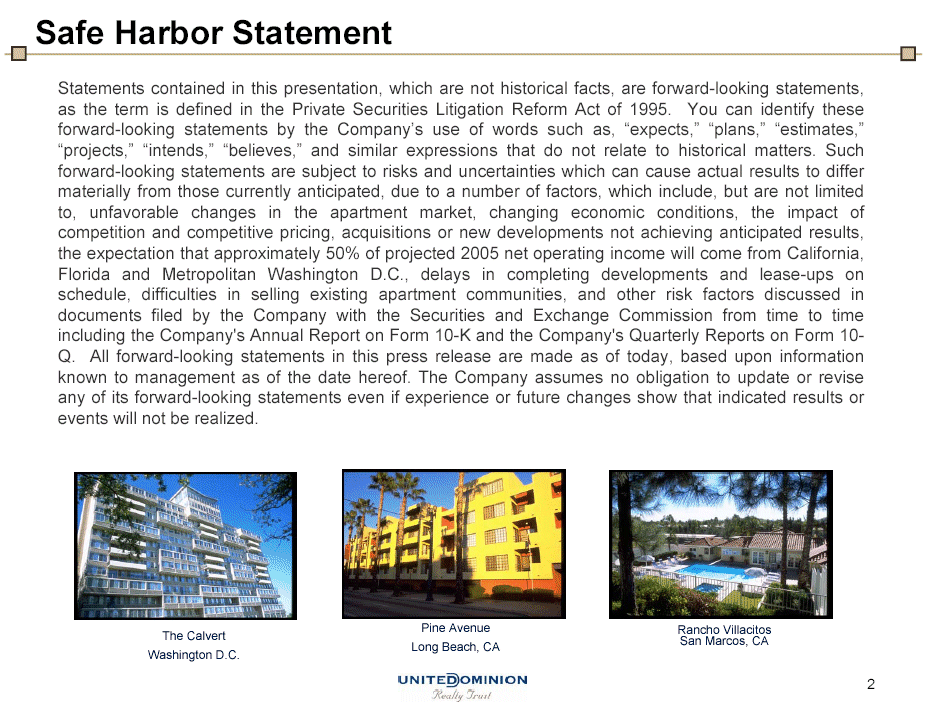
| Safe Harbor Statement Statements contained in this presentation, which are not historical facts, are forward-looking statements, as the term is defined in the Private Securities Litigation Reform Act of 1995. You can identify these forward-looking statements by the Company’s use of words such as, “expects,” “plans,” “estimates,” “projects,” “intends,” “believes,” and similar expressions that do not relate to historical matters. Such forward-looking statements are subject to risks and uncertainties which can cause actual results to differ materially from those currently anticipated, due to a number of factors, which include, but are not limited to, unfavorable changes in the apartment market, changing economic conditions, the impact of competition and competitive pricing, acquisitions or new developments not achieving anticipated results, the expectation that approximately 50% of projected 2005 net operating income will come from California, Florida and Metropolitan Washington D.C., delays in completing developments and lease-ups on schedule, difficulties in selling existing apartment communities, and other risk factors discussed in documents filed by the Company with the Securities and Exchange Commission from time to time including the Company’s Annual Report on Form 10-K and the Company’s Quarterly Reports on Form 10-Q. All forward-looking statements in this press release are made as of today, based upon information known to management as of the date hereof. The Company assumes no obligation to update or revise any of its forward-looking statements even if experience or future changes show that indicated results or events will not be realized. Pine Avenue Rancho Villacitos San Marcos, CA Long Beach, CA Washington D.C. |
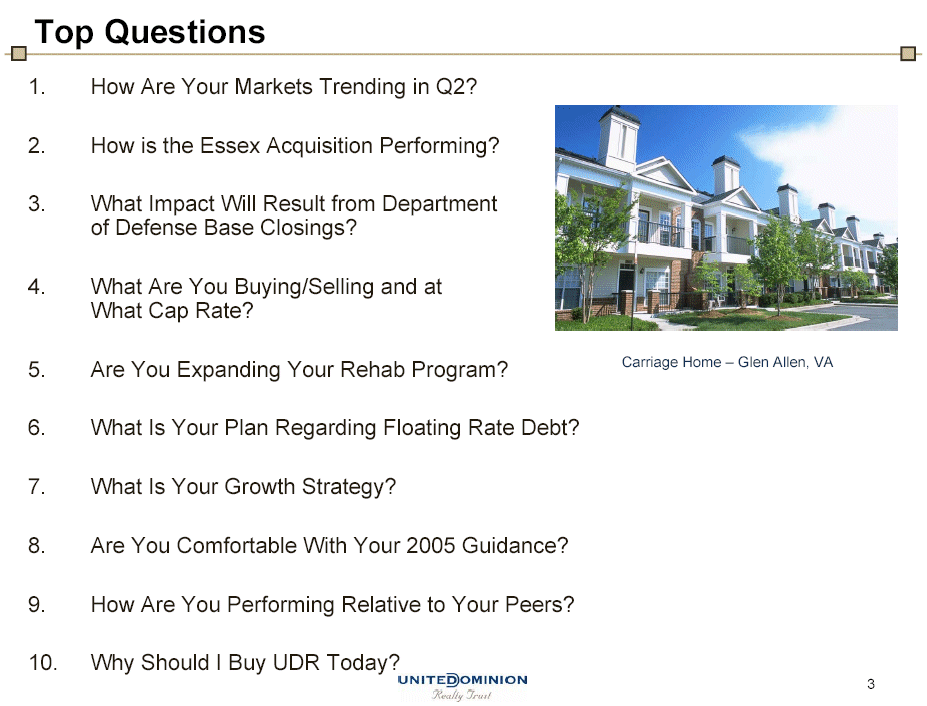
| Top Questions 1. How Are Your Markets Trending in Q2? 2. How is the Essex Acquisition Performing? 3. What Impact Will Result from Department of Defense Base Closings? 4. What Are You Buying/Selling and at What Cap Rate? 5. Are You Expanding Your Rehab Program? Carriage Home – Glen Allen, VA 6. What Is Your Plan Regarding Floating Rate Debt? 7. What Is Your Growth Strategy? 8. Are You Comfortable With Your 2005 Guidance? 9. How Are You Performing Rel ative to Your Peers? 10. Why Should I Buy UDR Today? |
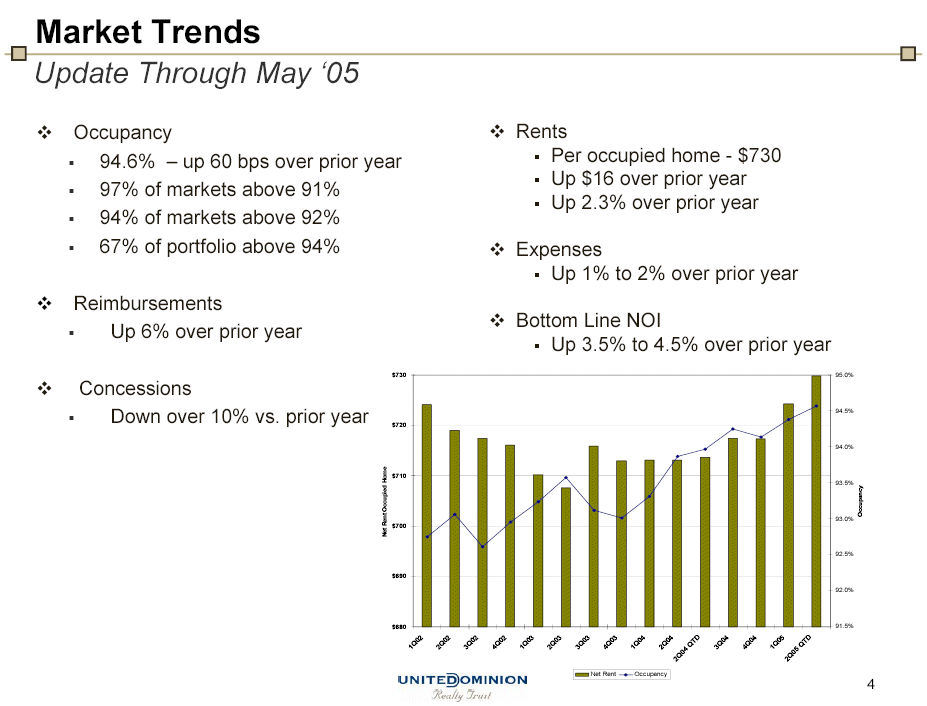
| Market TrendsUpdate Through May ‘05 Occupancy Rents 94.6% – up 60 bps over prior year Per occupied home — $730 Up $16 over prior year 97% of markets above 91% Up 2.3% over prior year 94% of markets above 92% 67% of portfolio above 94% Expenses Up 1% to 2% over prior year Reimbursements Bottom Line NOI Up 6% over prior year Up 3.5% to 4.5% over prior year$73095.0% Concessions Down over 10% vs. prior year 94.5%$720 94.0%$710 93.5%Occupancy 93.0%Net Rent Occupied Home $700 92.5%$690 92.0%$68091.5%2 2 2 2 3 3 3 3 4 4 4 4 500 Q0 0 0 0 Q0 Q0 0 0TDQ0 0 0TD1Q2Q 3 4Q 1Q 2Q 3 4 1Q 2QQ 3 4Q 1QQ4500Q22Q Net Rent Occupancy |
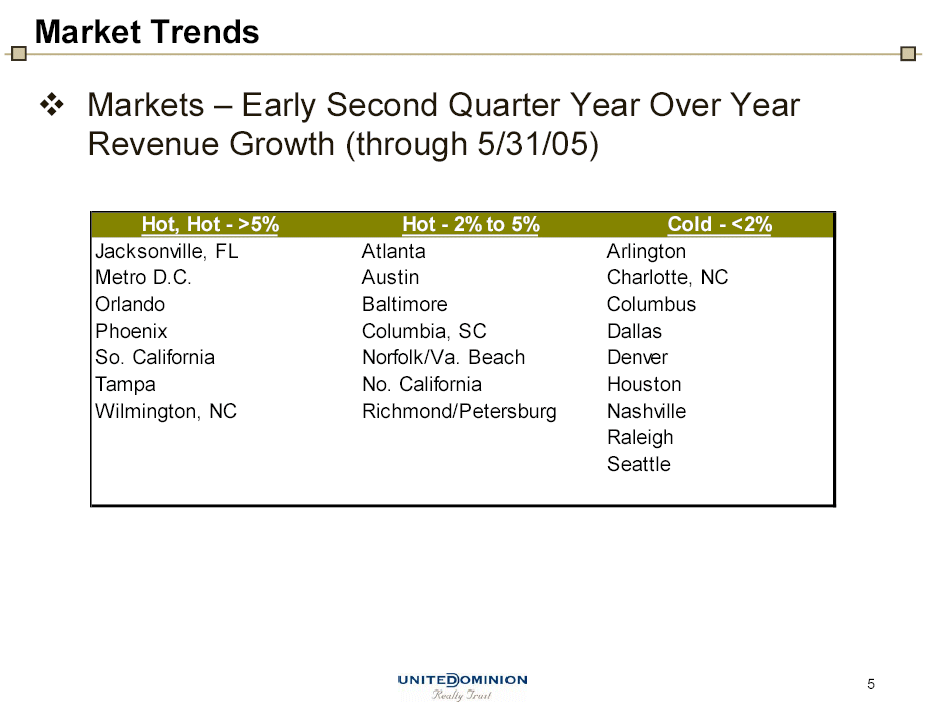
| Market Trends Markets – Early Second Quarter Year Over Year Revenue Growth (through 5/31/05)Hot, Hot — >5% Hot — 2% to 5% Cold — <2% Jacksonville, FL Atlanta Arlington Metro D.C. Austin Charlotte, NC Orlando Baltimore Columbus Phoenix Columbia, SC Dallas So. California Norfolk/Va. Beach Denver Tampa No. California Houston Wilmington, NC Richmond/Petersburg Nashville Raleigh Seattle |
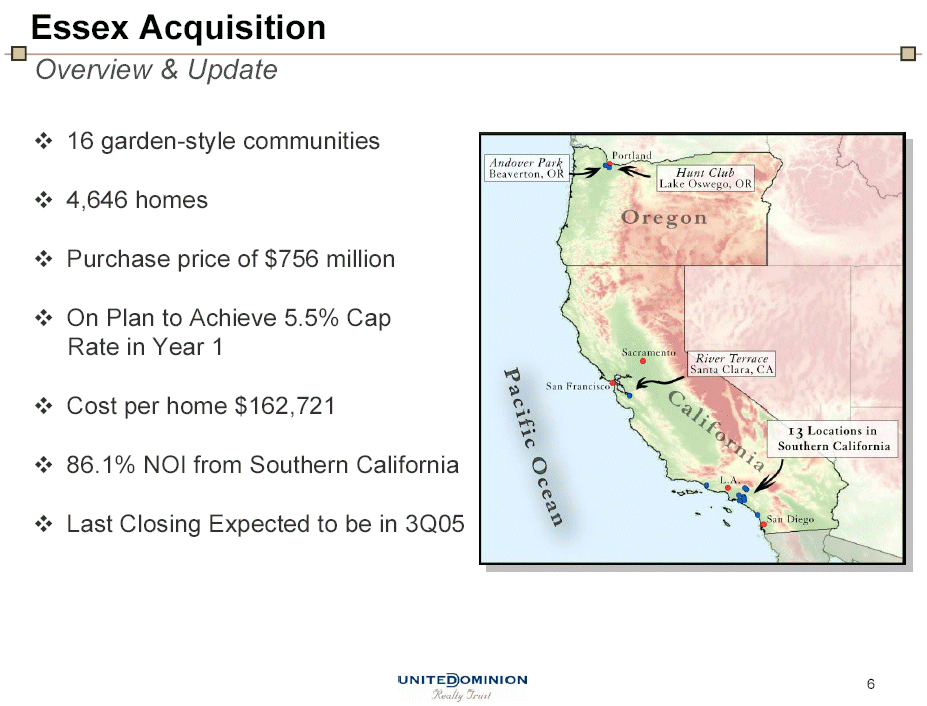
| Essex AcquisitionOverview & Update 16 garden-style communities 4,646 homes Purchase price of $756 million On Plan to Achieve 5.5% Cap Rate in Year 1 Cost per home $162,721 86.1% NOI from Southern California Last Closing Expected to be in 3Q05 |
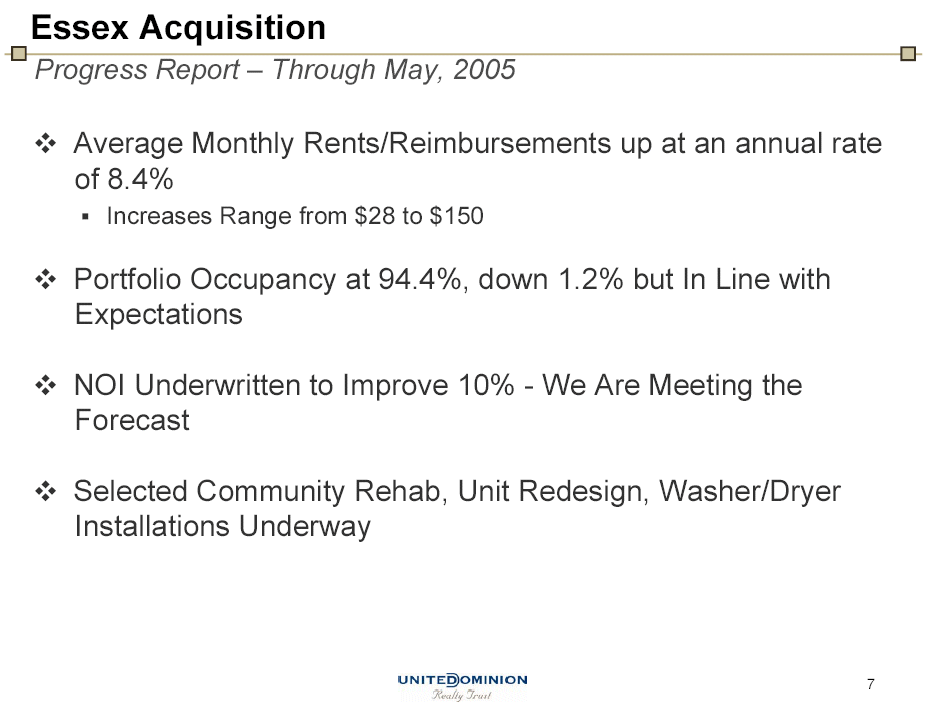
| Essex AcquisitionProgress Report – Through May, 2005 Average Monthly Rents/Reimbursements up at an annual rate of 8.4% Increases Range from $28 to $150 Portfolio Occupancy at 94.4%, down 1.2% but In Line with Expectations NOI Underwritten to Improve 10% — We Are Meeting the Forecast Selected Community Rehab, Unit Redesign, Washer/Dryer Installations Underway |
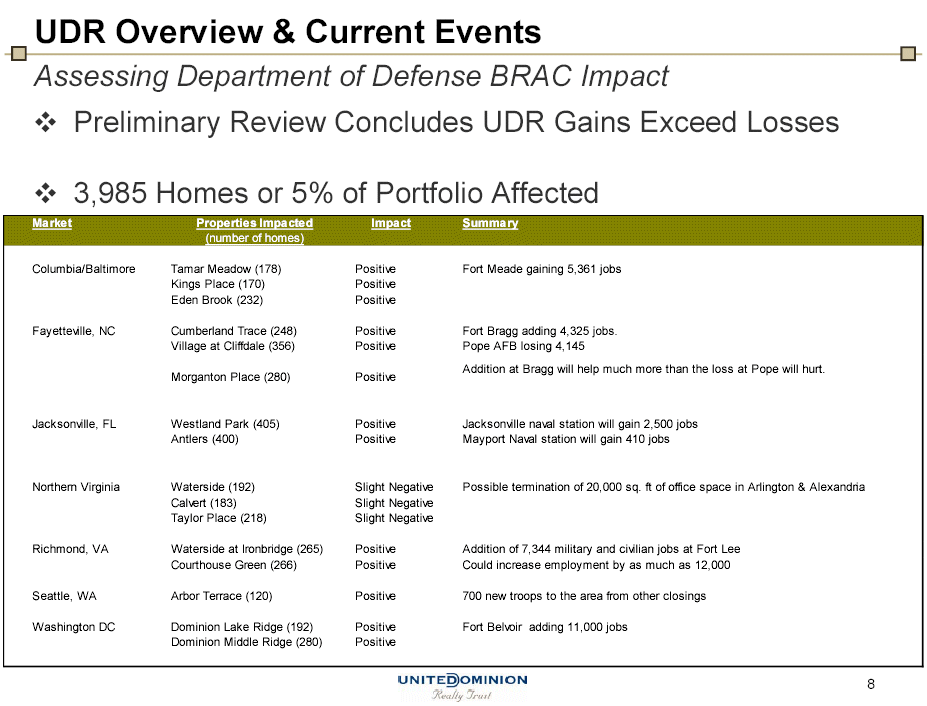
| UDR Overview & Current EventsAssessing Department of Defense BRAC Impact Preliminary Review Concludes UDR Gains Exceed Losses 3,985 Homes or 5% of Portfolio AffectedMarket Properties Impacted Impact Summary (number of homes) Columbia/Baltimore Tamar Meadow (178) Positive Fort Meade gaining 5,361 jobs Kings Place (170) Positive Eden Brook (232) Positive Fayetteville, NC Cumberland Trace (248) Positive Fort Bragg adding 4,325 jobs. Village at Cliffdale (356) Positive Pope AFB losing 4,145 Addition at Bragg will help much more than the loss at Pope will hurt. Morganton Place (280) Positive Jacksonville, FL Westland Park (405) Positive Jacksonville naval station will gain 2,500 jobs Antlers (400) Positive Mayport Naval station will gain 410 jobs Northern Virginia Waterside (192) Slight Negative Possible termination of 20,000 sq. ft of office space in Arlington & Alexandria Calvert (183) Slight Negative Taylor Place (218) Slight Negative Richmond, VA Waterside at Ironbridge (265) Positive Addition of 7,344 military and civilian jobs at Fort Lee Courthouse Green (266) Positive Could increase employment by as much as 12,000 Seattle, WA Arbor Terrace (120) Positive 700 new troops to the area from other closings Washington DC Dominion Lake Ridge (192) Positive Fort Belvoir adding 11,000 jobs Dominion Middle Ridge (280) Positive |
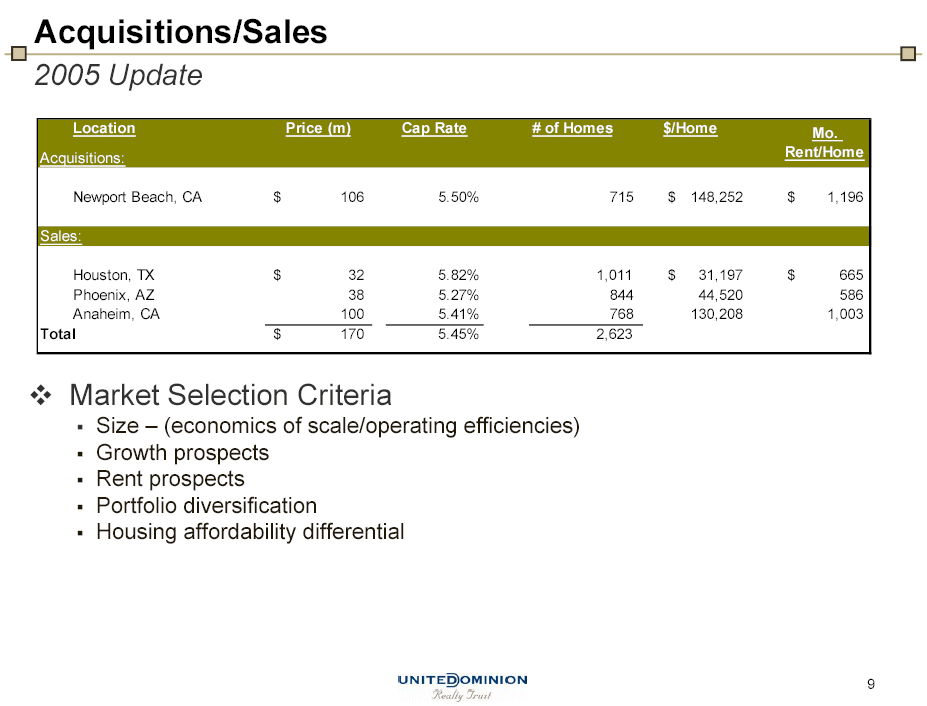
| Acquisitions/Sales2005 UpdateLocation Price (m)Cap Rate # of Homes $/Home Mo. Acquisitions:Rent/HomeNewport Beach, CA $106 5.50% 715 $148,252 $1,196 Sales: Houston, TX $ 32 5.82% 1,011 $ 31,197 $ 665 Phoenix, AZ 38 5.27% 844 44,520 586 Anaheim, CA 100 5.41% 768 130,208 1,003Total$ 170 5.45% 2,623 Market Selection Criteria Size – (economics of scale/operating efficiencies) Growth prospects Rent prospects Portfolio di versification Housing affordability differential |
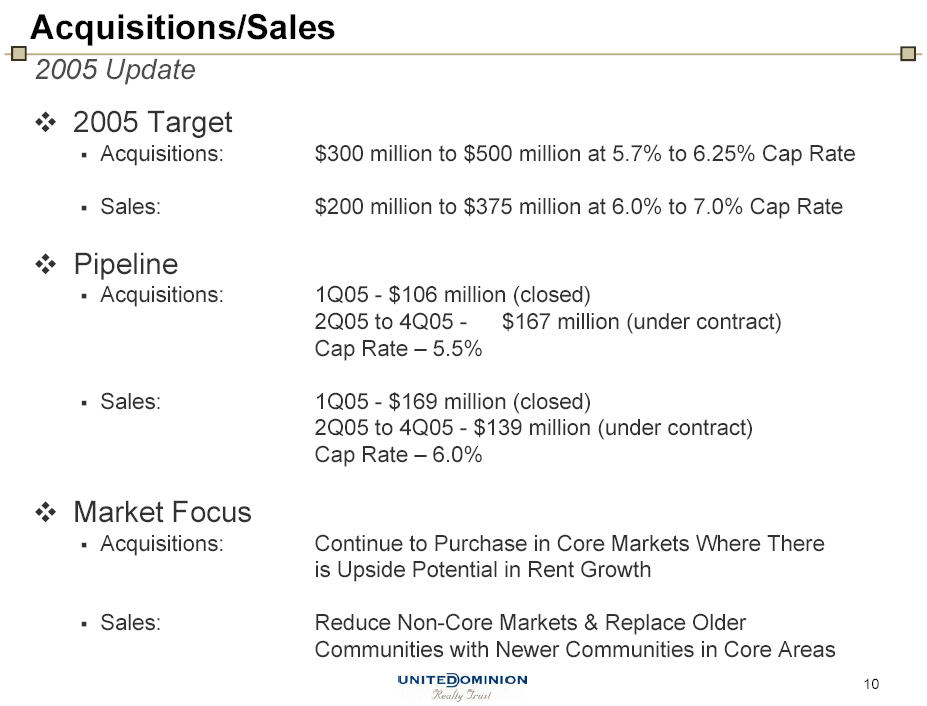
| Acquisitions/Sales2005 Update 2005 Target Acquisitions: $300 million to $500 million at 5.7% to 6.25% Cap Rate Sales: $200 million to $375 million at 6.0% to 7.0% Cap Rate Pipeline Acquisitions: 1Q05 — $106 million (closed) 2Q05 to 4Q05 — $167 million (under contract) Cap Rate – 5.5% Sales: 1Q05 — $169 million (closed) 2Q05 to 4Q05 — $139 million (under contract) Cap Rate – 6.0% Market Focus Acquisitions: Continue to Purchase in Core Markets Where There is Upside Potential in Rent Growth Sales: Reduce Non-Core Markets & Replace Older Communities with Newer Communities in Core Areas |
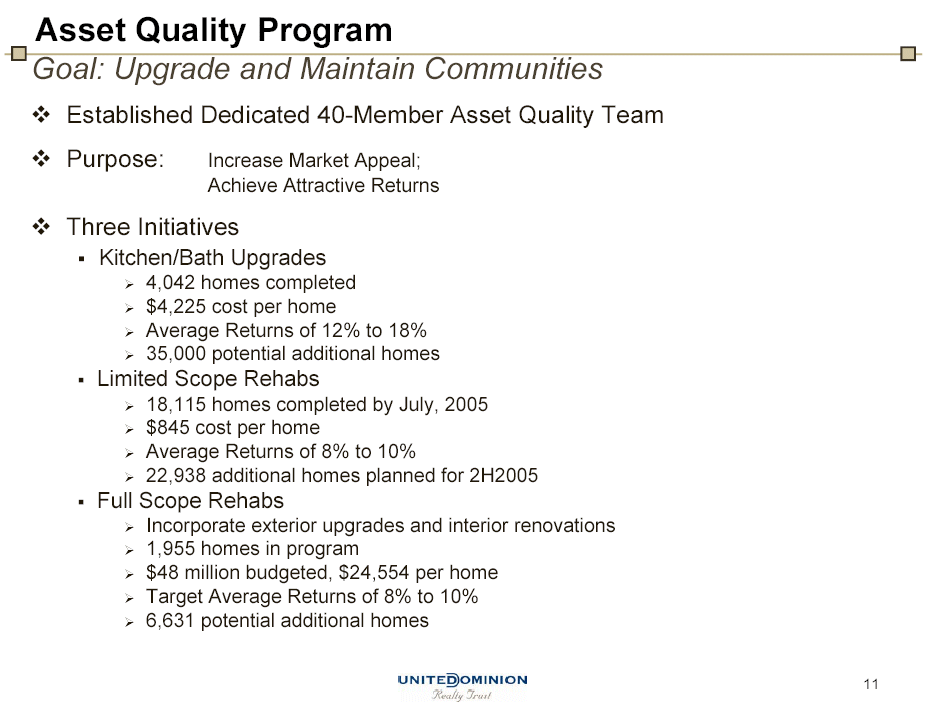
| Asset Quality ProgramGoal: Upgrade and Maintain Communities Established Dedicated 40-Member Asset Quality Team Purpose: Increase Market Appeal; Achieve Attractive Returns Three Initiatives Kitchen/Bath Upgrades 4,042 homes completed $4,225 cost per home Average Returns of 12% to 18% 35,000 potential additional homes Limited Scope Rehabs 18,115 homes completed by July, 2005 $845 cost per home Average Returns of 8% to 10% 22,938 additional homes pl anned for 2H2005 Full Scope Rehabs Incorporate exterior upgrades and interior renovations 1,955 homes in program $48 million budgeted, $24,554 per home Target Average Returns of 8% to 10% 6,631 potential additional homes |
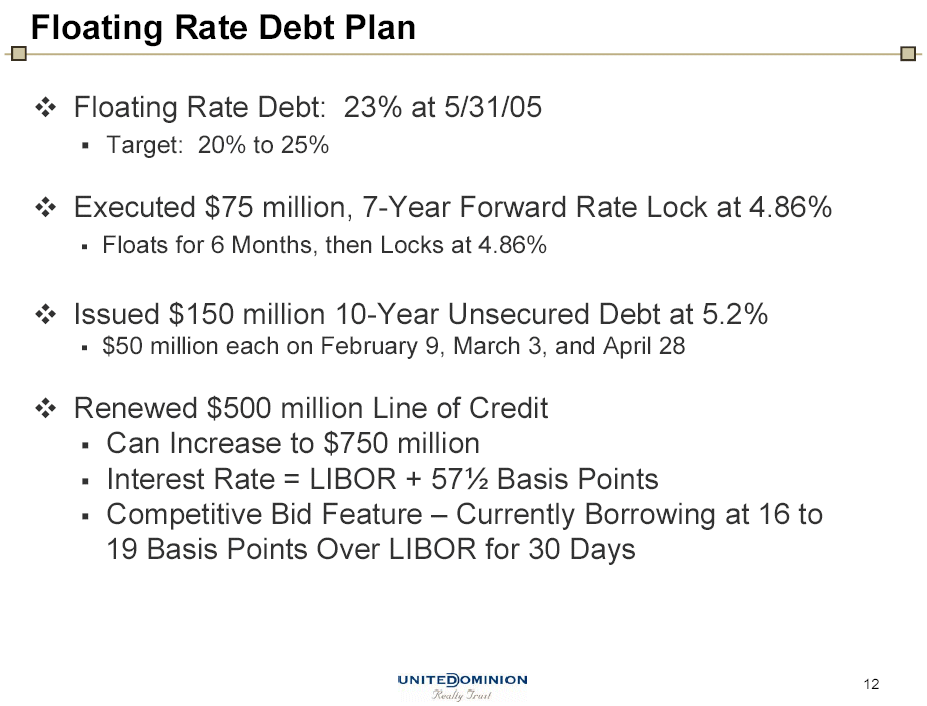
| Floating Rate Debt Plan Floating Rate Debt: 23% at 5/31/05 Target: 20% to 25% Executed $75 million, 7-Year Forward Rate Lock at 4.86% Floats for 6 Months, then Locks at 4.86% Issued $150 million 10-Year Unsecured Debt at 5.2% $50 million each on February 9, March 3, and April 28 Renewed $500 million Line of Credit Can Increase to $750 million Interest Rate = LIBOR + 571/2 Basis Points Competitive Bid Feature – Currently Borrowing at 16 to 19 Basis Points Over LIBOR for 30 Days |
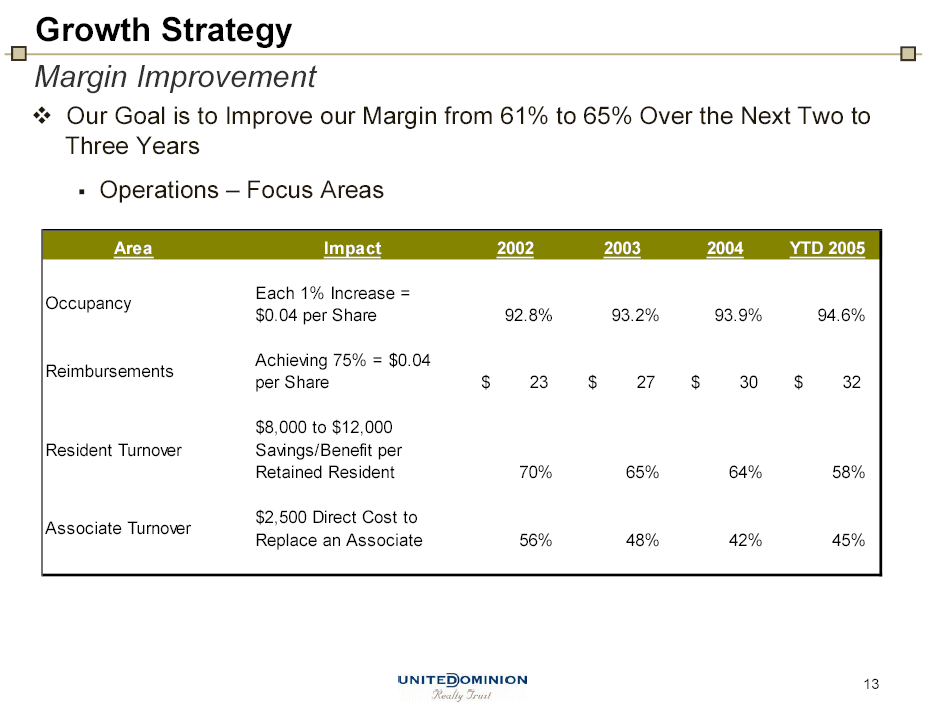
| Growth StrategyMargin Improvement Our Goal is to Improve our Margin from 61% to 65% Over the Next Two to Three Years Operations – Focus AreasArea Impact2002 2003 2004 YTD 2005 Each 1% Increase = Occupancy $0.04 per Share92.8% 93.2% 93.9% 94.6% Achieving 75% = $0.04 Reimbursements per Share $23 $27 $30 $32 $8,000 to $12,000 Resident Turnover Savings/Benefit per Retained Resident 70% 65% 64% 58% $2,500 Direct Cost to Associate Turnover Replace an Associate 56% 48% 42% 45% |
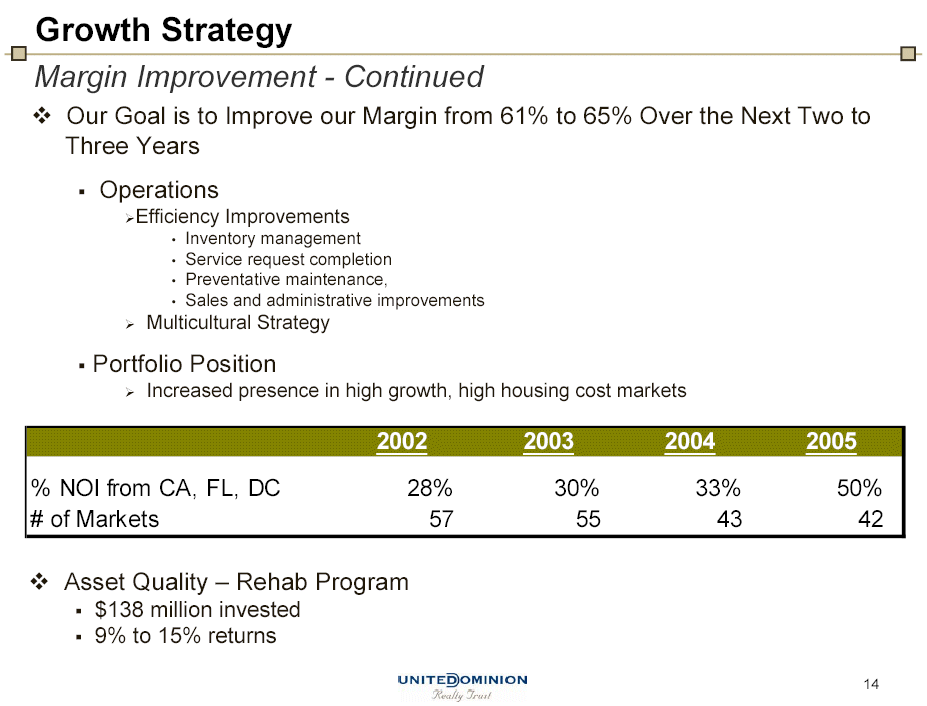
| Growth StrategyMargin Improvement — Continued Our Goal is to Improve our Margin from 61% to 65% Over the Next Two to Three Years Operations Efficiency Improvements · Inventory management · Service request completion · Preventative maintenance, · Sales and administrative improvements Multicultural Strategy Portfolio Position Increased presence in high growth, high housing cost markets2002 2003 2004 2005 % NOI from CA, FL, DC 28% 30% 33% 50% # of Markets 57 55 43 42 Asset Quality – Rehab Program $138 million invested 9% to 15% returns |

| 2005 Guidance2005 Assumptions – From UDR WebsiteOperating DataAs of 2005 AssumptionsMarch 31, 2005 High End Of The Range Low End Of The Range Same Store Results Wtd. Avg. Occupancy94.4% 94.0% 93.5% Collections Per Occupied Unit(1)$716 $730 $720Collections of other income and reimbursements per occupied unit (2)$31 $35 $30 Revenue Growth2.7% 3.7% 2.5%Expense Growth1.1% 2.8%3.0%NOI Growth3.8% 4.3% 2.2% Disposition Activity(4) Volume$72 m $200M $375MCap Rates(3)5.5% 6.50% 7.00% Growth Rates0% 0% Acquisition Activi ty(5) Volume$106 m $500M $300MCap Rates(3)5.5% 6.25% 5.75% Growth Rates5% 5% Non recurring Income$0.4 m $8.5M $3.0MNon recurring expenses0 $2.5M$1.5M 2005 Maturities$96M $96MRate of Maturing debt07.33%7.33%Amount of New Debt Issued$100 m$200M$100M Rate5.2% 6.50% 6.50%LiborUp 50 bps by Q4 Up 100 bps by Q4 Average Capacity on Revolver$310M $410M G&AUp $2.0 million Up $1.0 millionRecurring Capex$510/stabilized unit $510/stabilized unit Development Funding$50M $50MROI investments$40M $20M Free Cash FlowPays down Revolver Pays down Revolver Equity Issuance$50 Million None (1) Encompasses base rent, fee income, (2) Encompasses utilities pass through, and other (cable, telephone and laundry). (3) Cap Rates based upon trailing 12 months NOI less capex for dispositions and forward 12 months NOI for acquisitions. (4) $169 million closed or under contract at 5.4 cap rate (5) $169 million under contract at 5.5 cap rate |
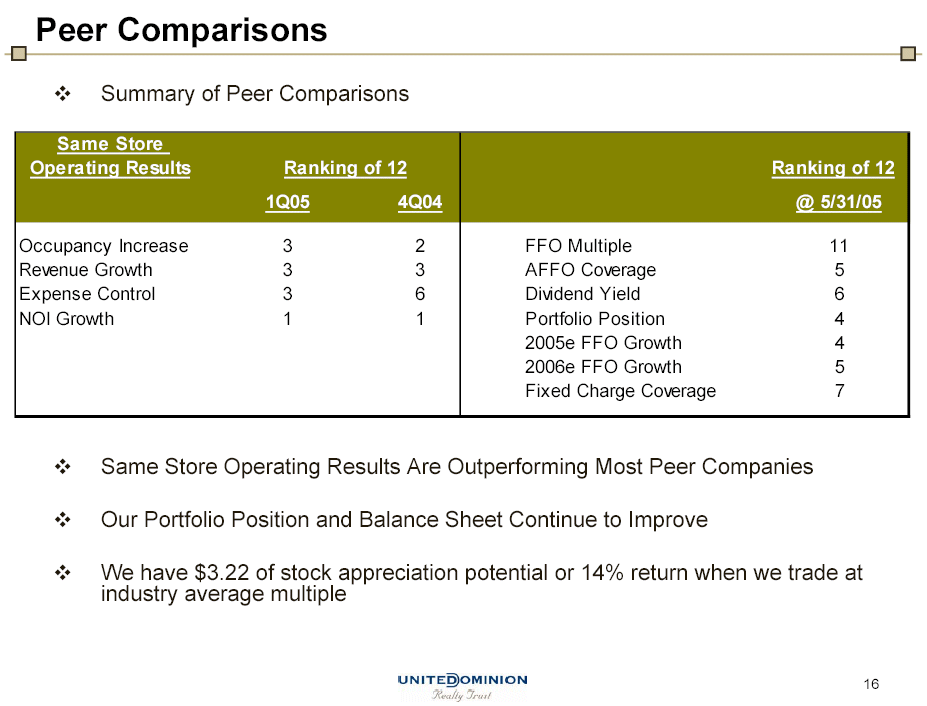
| Peer Comparisons Summary of Peer ComparisonsSame StoreOperating Results Ranking of 12 Ranking of 12 1Q05 4Q04 @ 5/31/05 Occupancy Increase 3 2 FFO Multiple 11 Revenue Growth 3 3 AFFO Coverage 5 Expense Control 3 6 Dividend Yield 6 NOI Growth 1 1 Portfolio Position 4 2005e FFO Growth 4 2006e FFO Growth 5 Fixed Charge Coverage 7 Same Store Operating Results Are Outperforming Most Peer Companies Our Portfolio Position and Balance Sheet Conti nue to Improve We have $3.22 of stock appreciation potential or 14% return when we trade at industry average multiple |
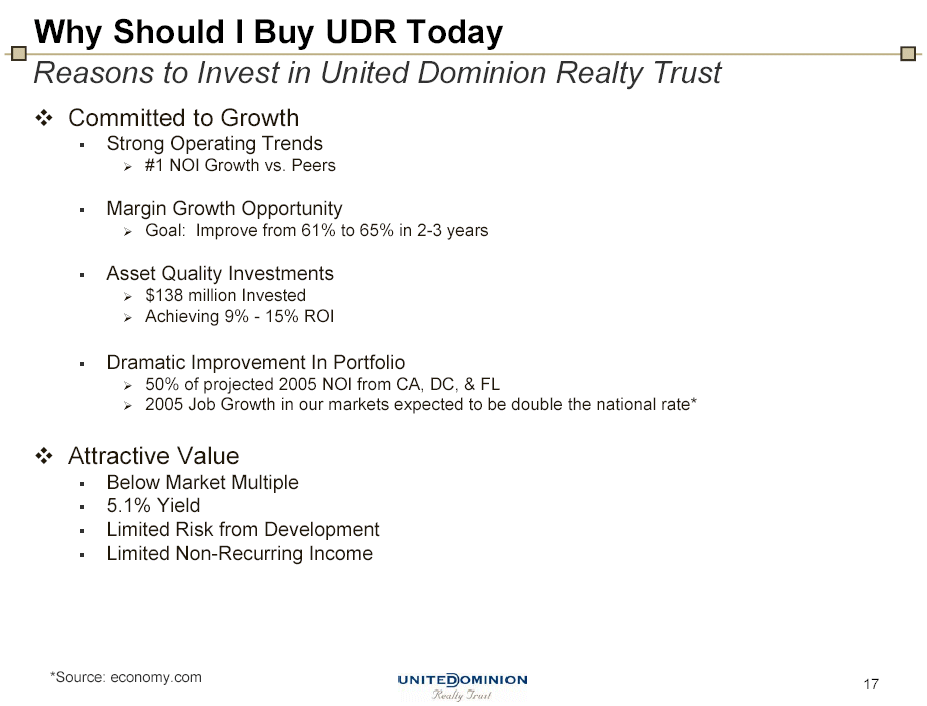
| Why Should I Buy UDR TodayReasons to Invest in United Dominion Realty Trust Committed to Growth Strong Operating Trends #1 NOI Growth vs. Peers Margin Growth Opportunity Goal: Improve from 61% to 65% in 2-3 years Asset Quality Investments $138 million Invested Achieving 9% — 15% ROI Dramatic Improvement In Portfolio 50% of projected 2005 NOI from CA, DC, & FL 2005 Job Growth in our markets expected to be double the national ra te* Attractive Value Below Market Multiple 5.1% Yield Limited Risk from Development Limited Non-Recurring Income *Source: economy.com /TD> |
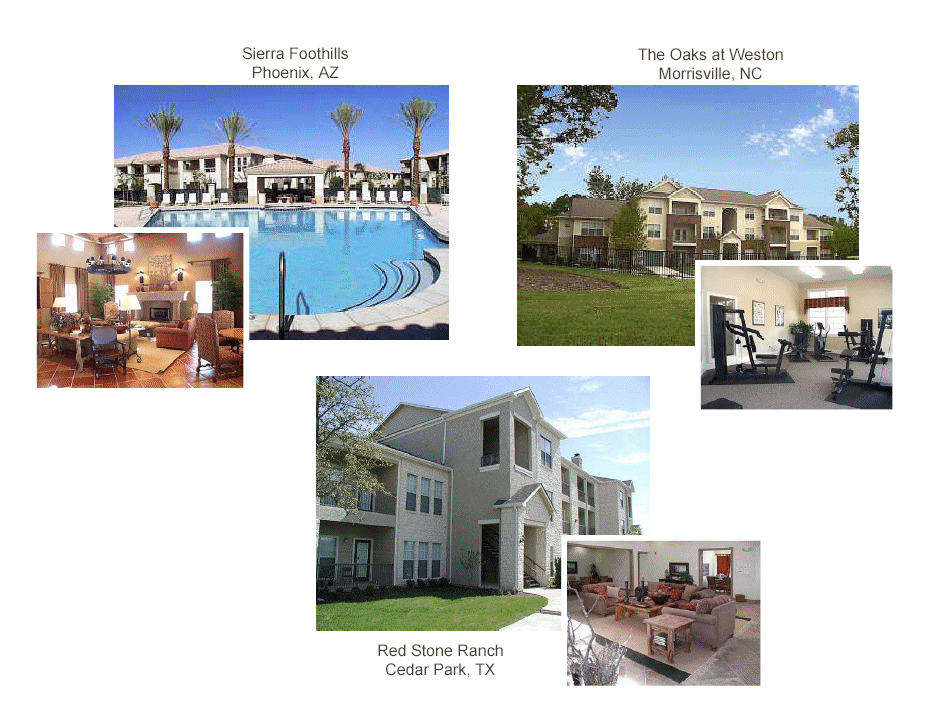
| Sierra Foothills The Oaks at Phoenix, AZ Morrisville, NC Red Stone Ranch Cedar Park, TX |