| NAREIT Investor Conference ~ Chicago November 2 - 4, 2005 | EXHIBIT 99.2 |

| Safe Harbor Statement The Calvert Washington D.C. Pine Avenue Long Beach, CA Statements contained in this presentation, which are not historical facts, are forward-looking statements, as the term is defined in the Private Securities Litigation Reform Act of 1995. You can identify these forward-looking statements by the Company's use of words such as, "expects," "plans," "estimates," "projects," "intends," "believes," and similar expressions that do not relate to historical matters. Such forward-looking statements are subject to risks and uncertainties which can cause actual results to differ materially from those currently anticipated, due to a number of factors, which include, but are not limited to, unfavorable changes in the apartment market, changing economic conditions, the impact of competition and competitive pricing, acquisitions or new developments not achieving anticipated results, the expectation that approximately 50% of projected 2005 net operating income will come from California, Florida and Metropolitan Washington D.C., delays in completing developments and lease-ups on schedule, difficulties in selling existing apartment communities, and other risk factors discussed in documents filed by the Company with the Securities and Exchange Commission from time to time including the Company's Annual Report on Form 10-K and the Company's Quarterly Reports on Form 10- Q. All forward-looking statements in this presentation are made as of today, based upon information known to management as of the date hereof. The Company assumes no obligation to update or revise any of its forward-looking statements even if experience or future changes show that indicated results or events will not be realized. Rancho Villacitos San Marcos, CA |
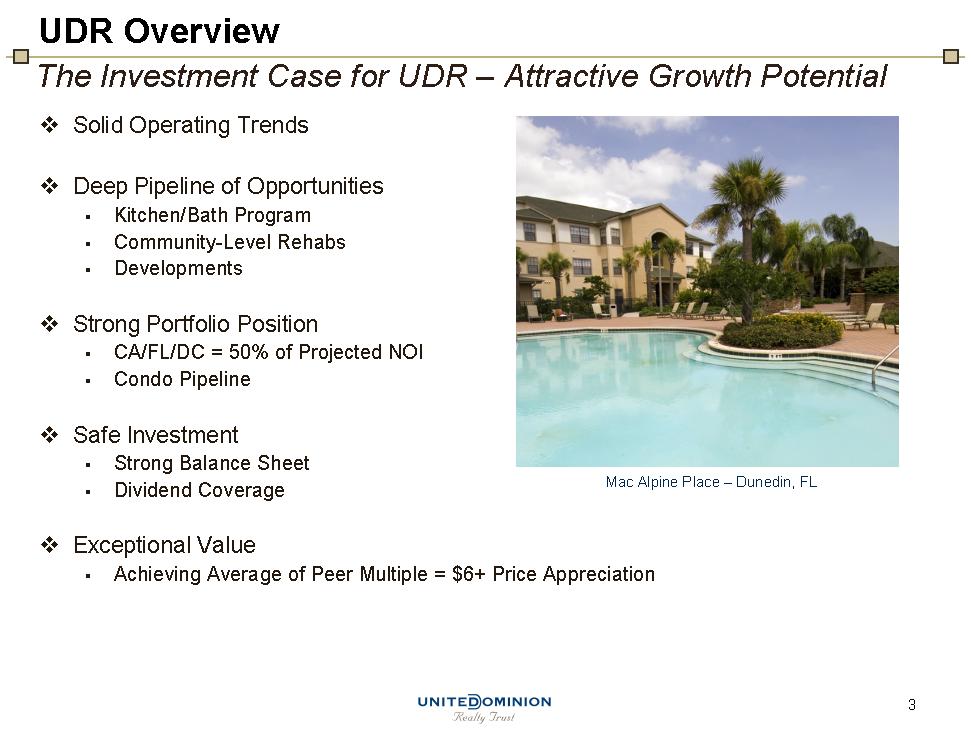
| UDR Overview The Investment Case for UDR - Attractive Growth Potential Solid Operating Trends Deep Pipeline of Opportunities Kitchen/Bath Program Community-Level Rehabs Developments Strong Portfolio Position CA/FL/DC = 50% of Projected NOI Condo Pipeline Safe Investment Strong Balance Sheet Dividend Coverage Exceptional Value Achieving Average of Peer Multiple = $6+ Price Appreciation Mac Alpine Place - Dunedin, FL |
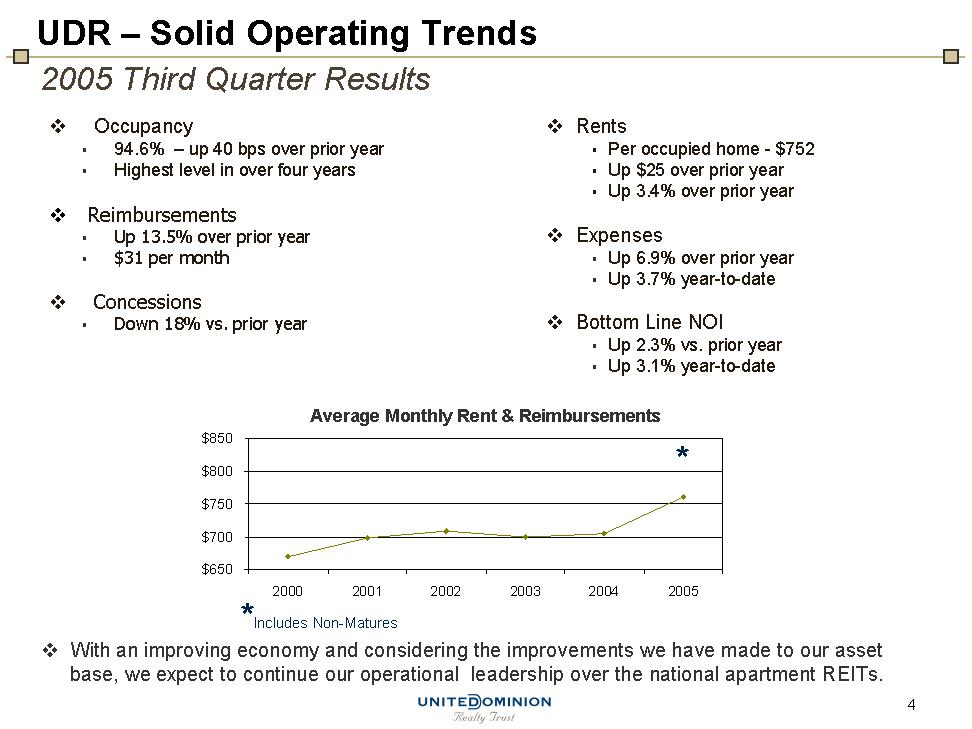
| Occupancy 94.6% - up 40 bps over prior year Highest level in over four years Reimbursements Up 13.5% over prior year $31 per month Concessions Down 18% vs. prior year 2005 Third Quarter Results Rents Per occupied home - $752 Up $25 over prior year Up 3.4% over prior year Expenses Up 6.9% over prior year Up 3.7% year-to-date Bottom Line NOI Up 2.3% vs. prior year Up 3.1% year-to-date UDR - Solid Operating Trends With an improving economy and considering the improvements we have made to our asset base, we expect to continue our operational leadership over the national apartment REITs. Average Monthly Rent & Reimbursements * *Includes Non-Matures |
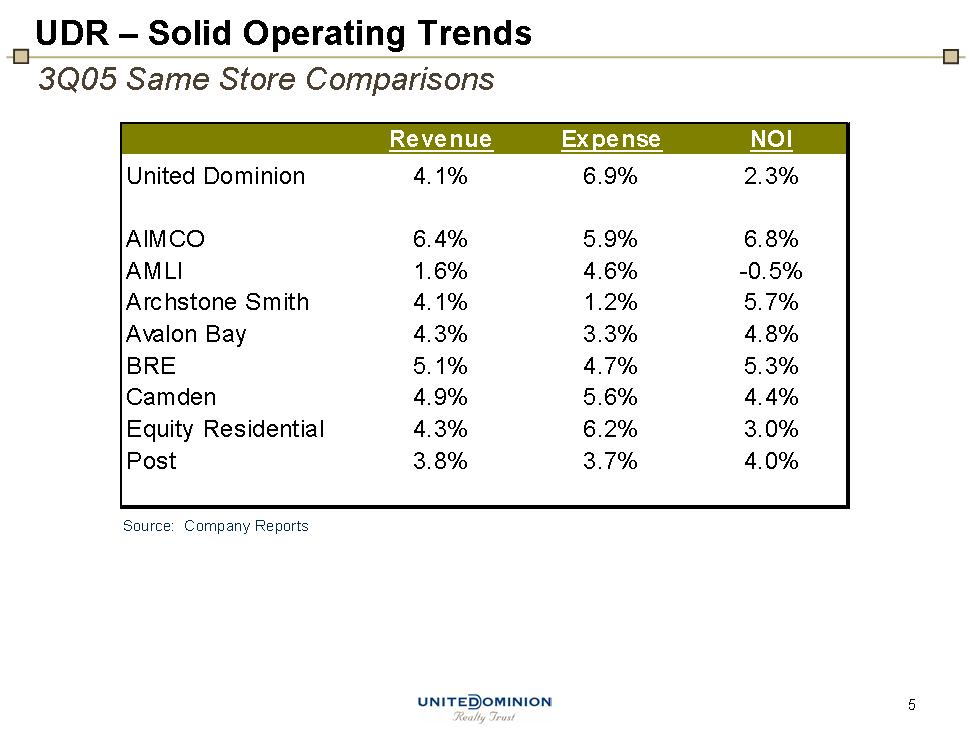
| 3Q05 Same Store Comparisons UDR - Solid Operating Trends Source: Company Reports |
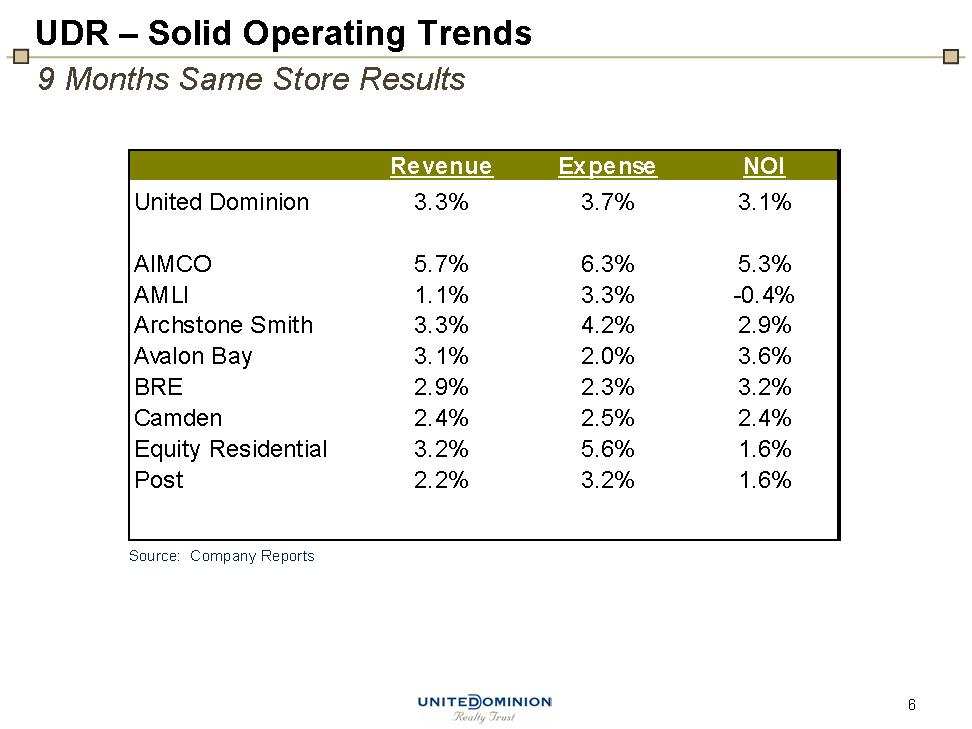
| 9 Months Same Store Results UDR - Solid Operating Trends Source: Company Reports |
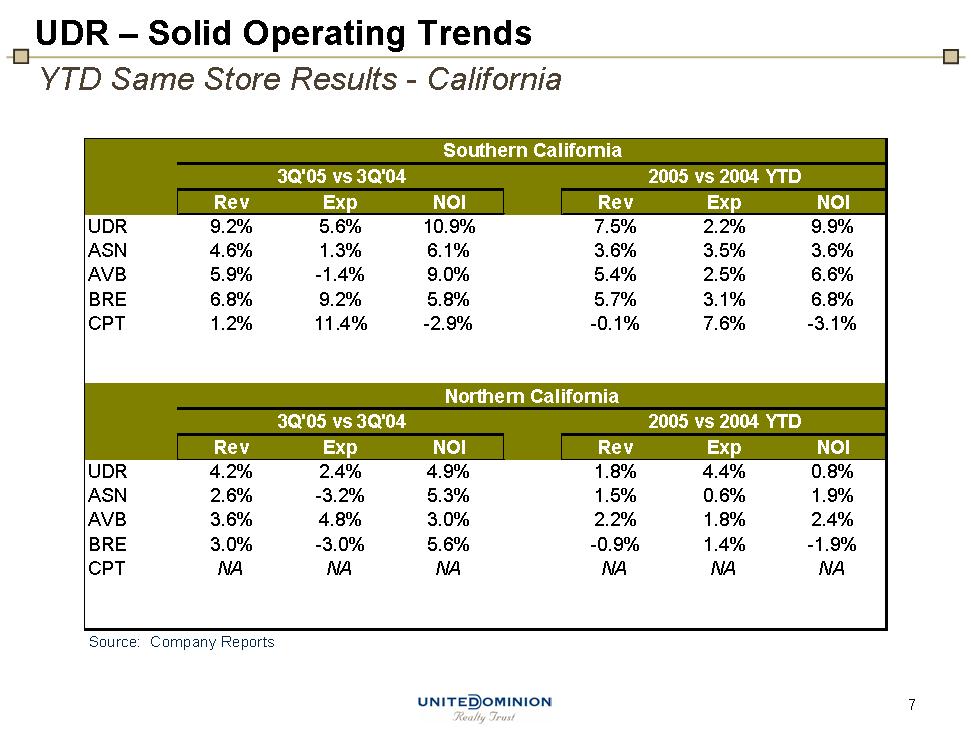
| YTD Same Store Results - California UDR - Solid Operating Trends Source: Company Reports |

| Net Rents and Occupancy are the Strongest in Several Years as Concessions Decline UDR - Solid Operating Trends |
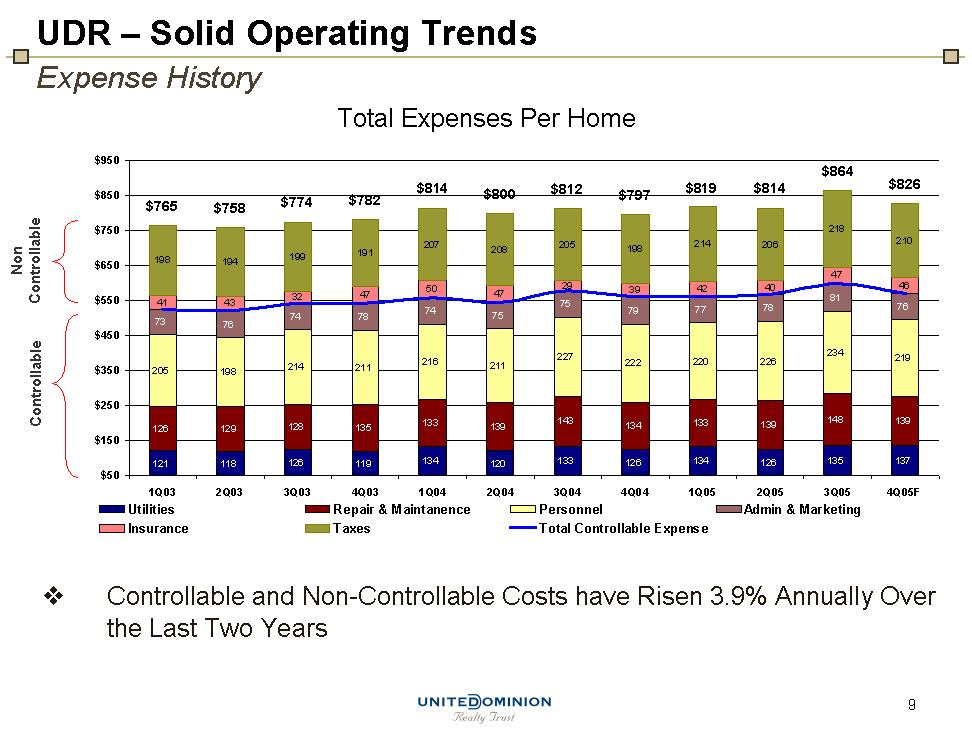
| Expense History UDR - Solid Operating Trends Total Expenses Per Home Non Controllable Controllable Controllable and Non-Controllable Costs have Risen 3.9% Annually Over the Last Two Years |
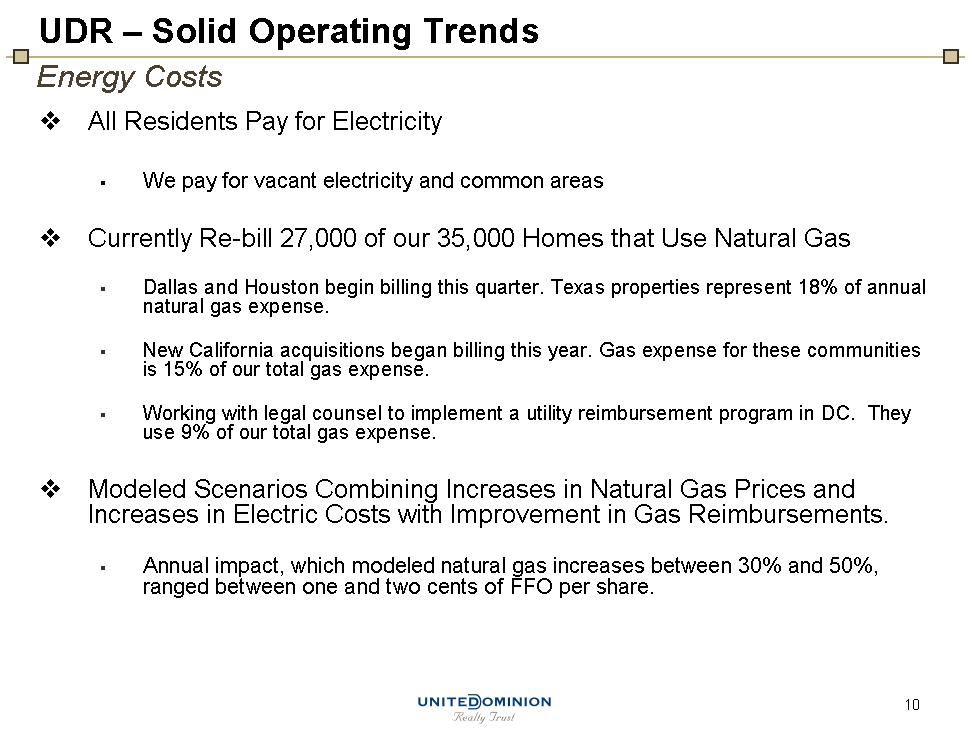
| All Residents Pay for Electricity We pay for vacant electricity and common areas Currently Re-bill 27,000 of our 35,000 Homes that Use Natural Gas Dallas and Houston begin billing this quarter. Texas properties represent 18% of annual natural gas expense. New California acquisitions began billing this year. Gas expense for these communities is 15% of our total gas expense. Working with legal counsel to implement a utility reimbursement program in DC. They use 9% of our total gas expense. Modeled Scenarios Combining Increases in Natural Gas Prices and Increases in Electric Costs with Improvement in Gas Reimbursements. Annual impact, which modeled natural gas increases between 30% and 50%, ranged between one and two cents of FFO per share. Energy Costs UDR - Solid Operating Trends |
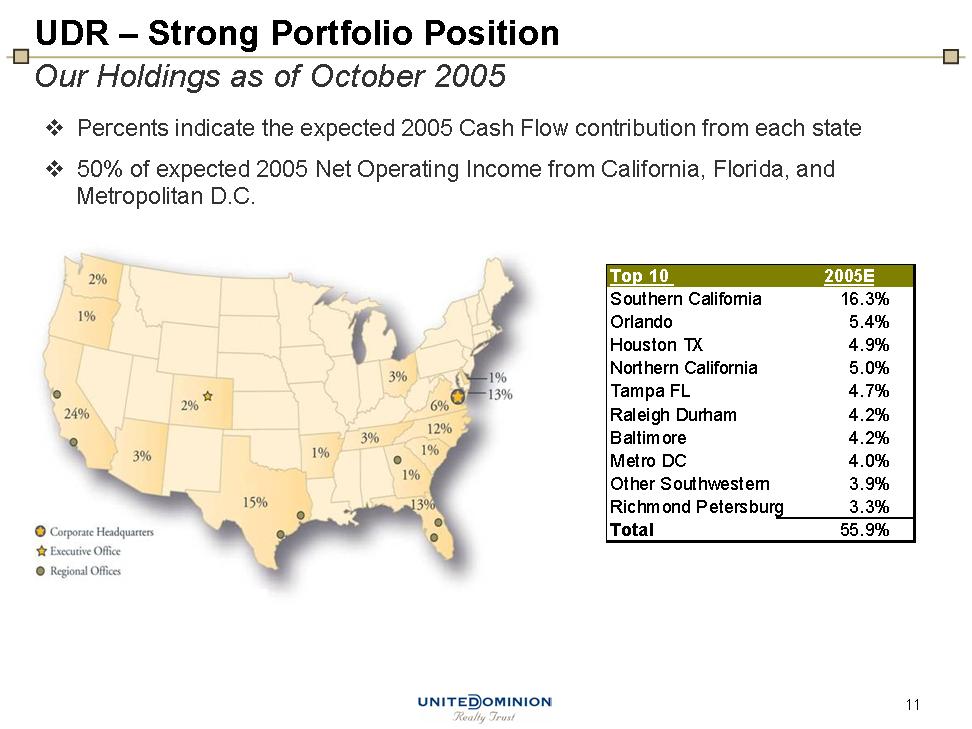
| Percents indicate the expected 2005 Cash Flow contribution from each state 50% of expected 2005 Net Operating Income from California, Florida, and Metropolitan D.C. Metropolitan D.C. Metropolitan D.C. Metropolitan D.C. UDR - Strong Portfolio Position Our Holdings as of October 2005 |
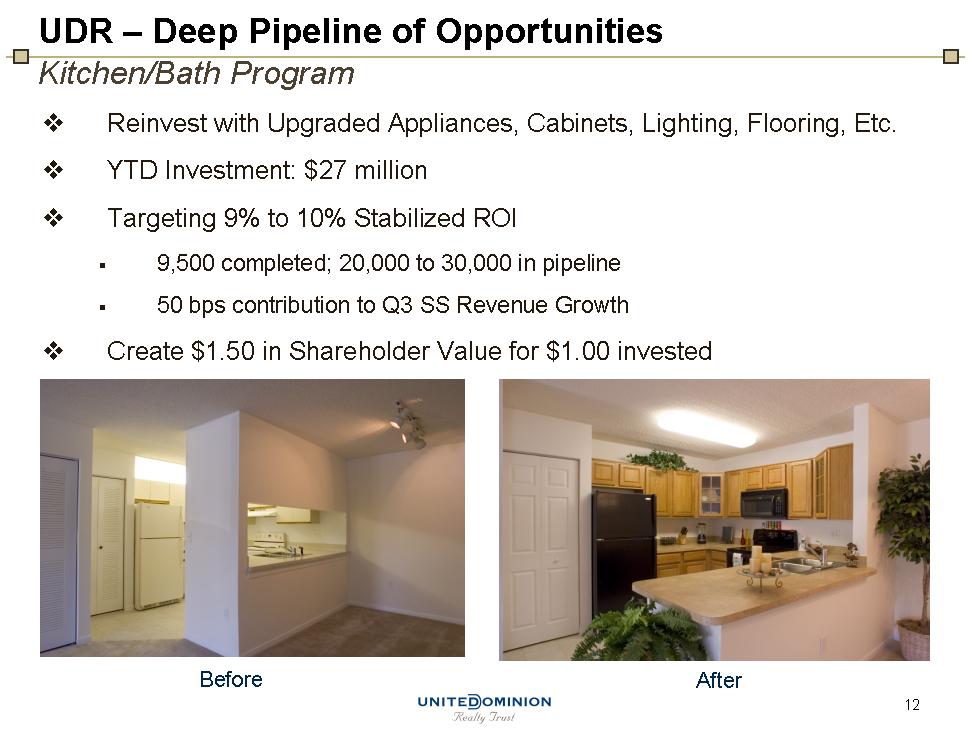
| UDR - Deep Pipeline of Opportunities Kitchen/Bath Program Reinvest with Upgraded Appliances, Cabinets, Lighting, Flooring, Etc. YTD Investment: $27 million Targeting 9% to 10% Stabilized ROI 9,500 completed; 20,000 to 30,000 in pipeline 50 bps contribution to Q3 SS Revenue Growth Create $1.50 in Shareholder Value for $1.00 invested Before After |
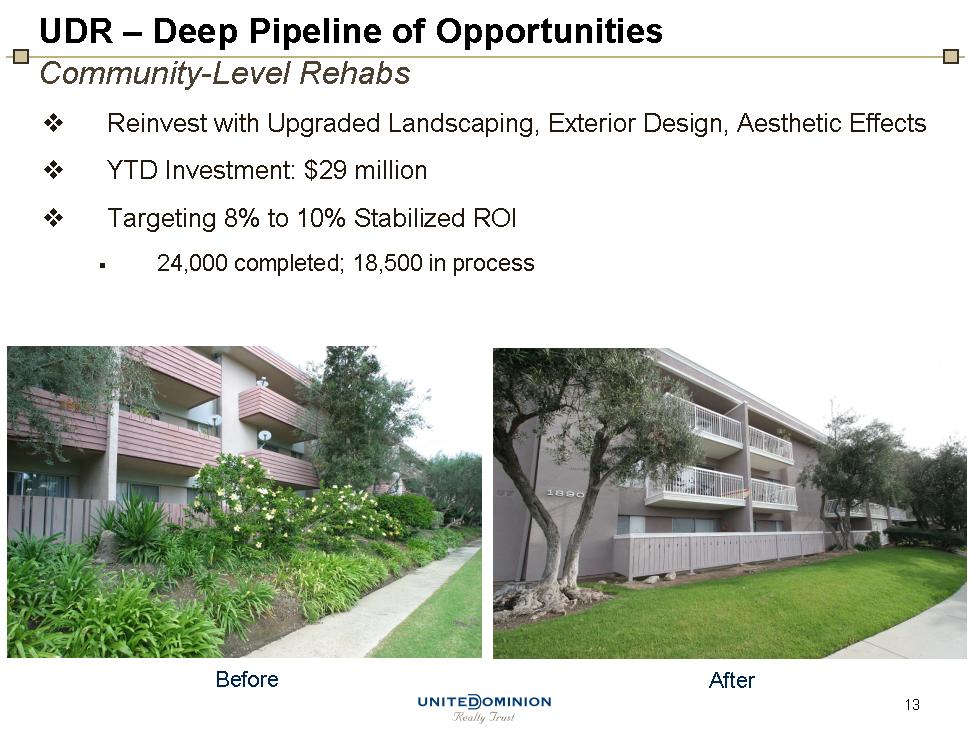
| UDR - Deep Pipeline of Opportunities Community-Level Rehabs Reinvest with Upgraded Landscaping, Exterior Design, Aesthetic Effects YTD Investment: $29 million Targeting 8% to 10% Stabilized ROI 24,000 completed; 18,500 in process Before After |

| UDR - Deep Pipeline of Opportunities Full Scope Rehabs Reinvest with Exterior Upgrades and Interior Renovations 5 Communities Underway; $63 million Budgeted Targeting 8% to 9% Stabilized ROI 2,251 homes in program Before After |
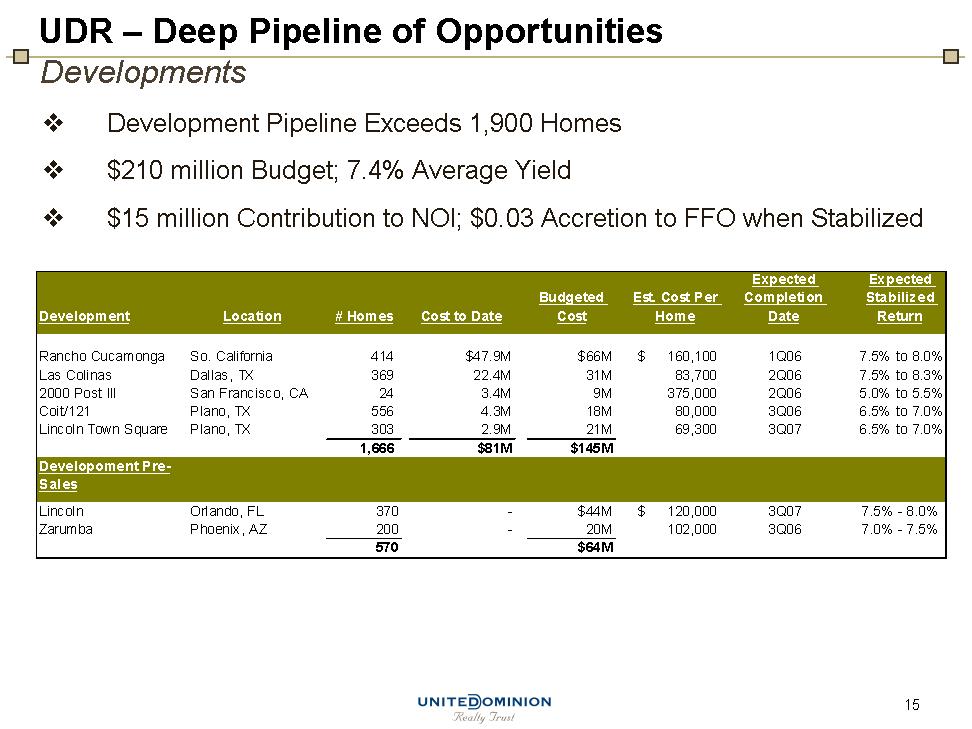
| Developments UDR - Deep Pipeline of Opportunities Development Pipeline Exceeds 1,900 Homes $210 million Budget; 7.4% Average Yield $15 million Contribution to NOI; $0.03 Accretion to FFO when Stabilized |
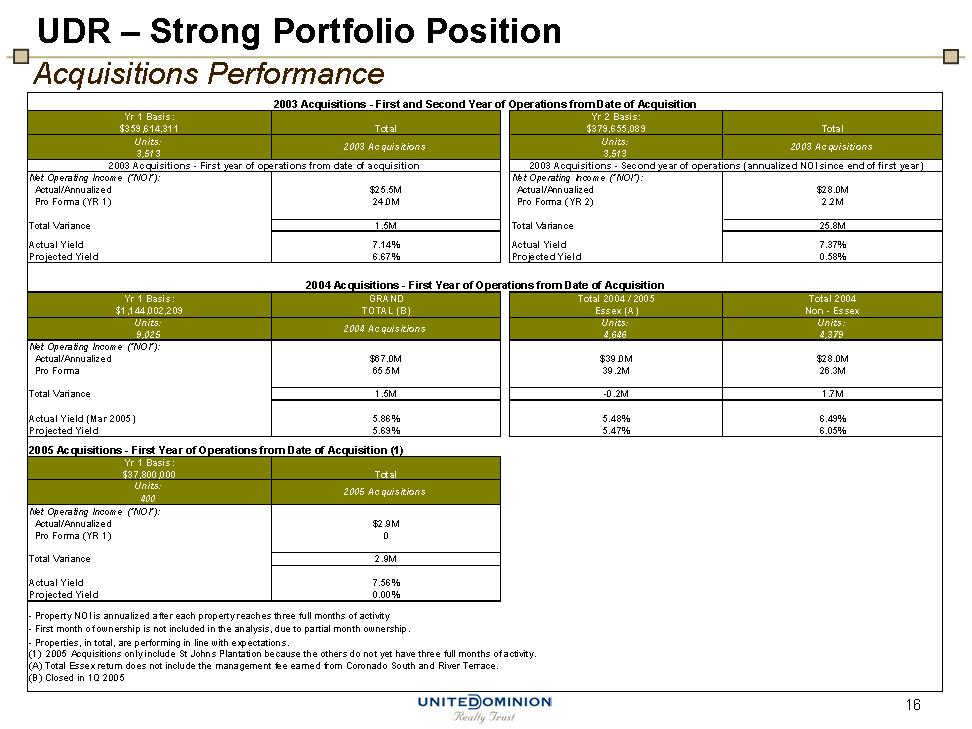
| Acquisitions Performance UDR - Strong Portfolio Position |
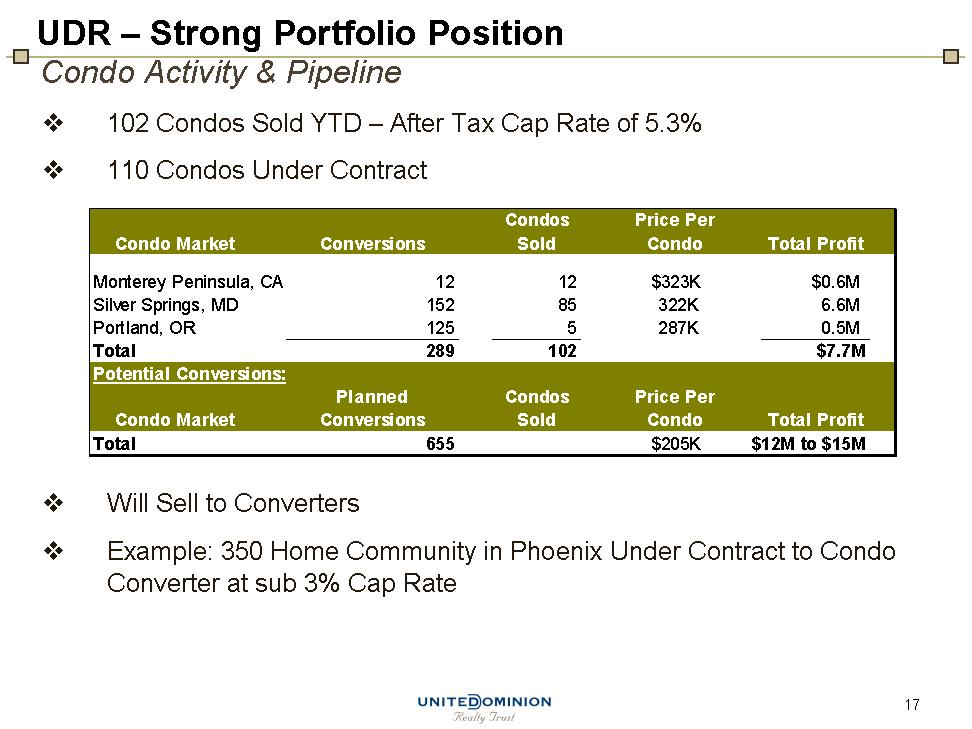
| Condo Activity & Pipeline 102 Condos Sold YDT - After Tax Cap Rate of 5.3% 110 Condos Under Contract Will Sell to Converters Example: 350 Home Community in Phoenix Under Contract to Condo Converter at sub 3% Cap Rate UDR - Strong Portfolio Position |
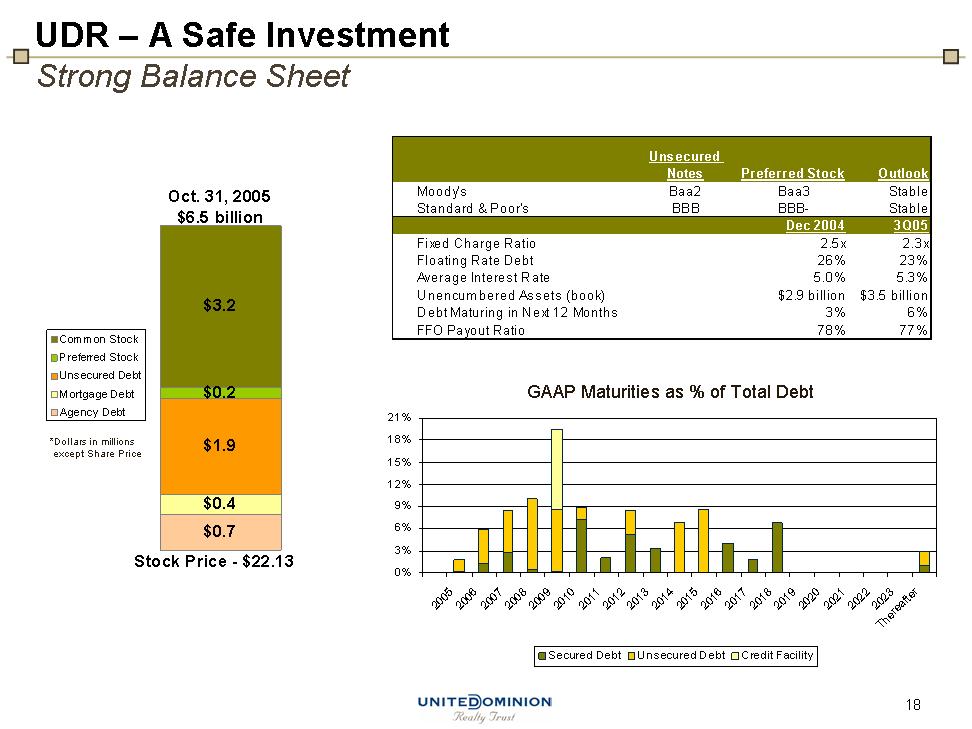
| *Dollars in millions except Share Price UDR - A Safe Investment Strong Balance Sheet GAAP Maturities as % of Total Debt |
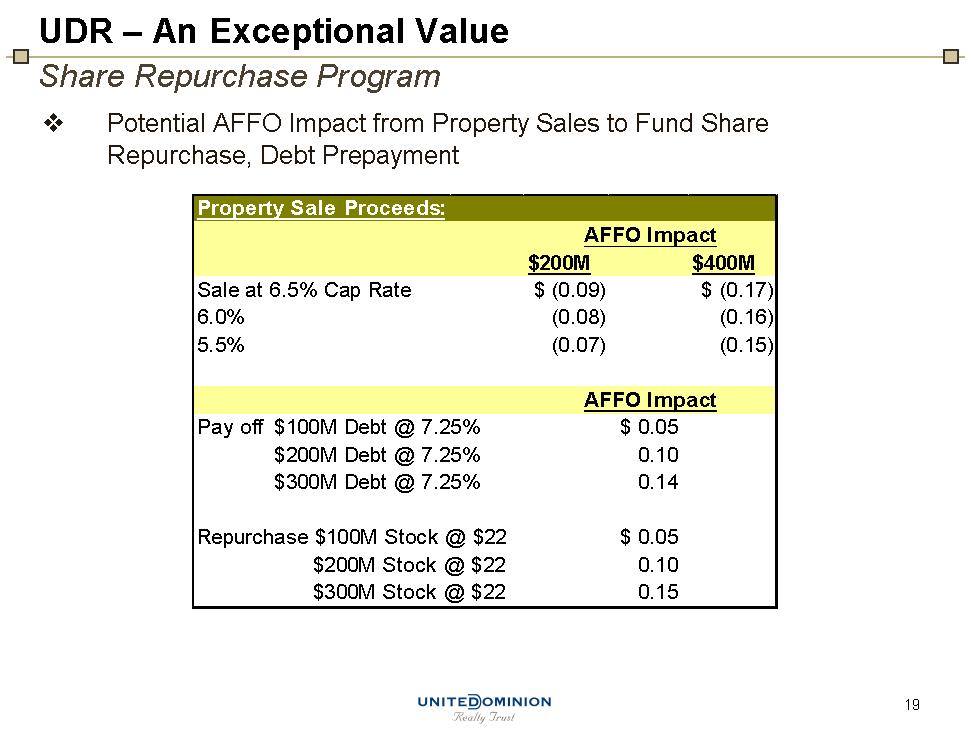
| UDR - An Exceptional Value Share Repurchase Program Potential AFFO Impact from Property Sales to Fund Share Repurchase, Debt Prepayment |
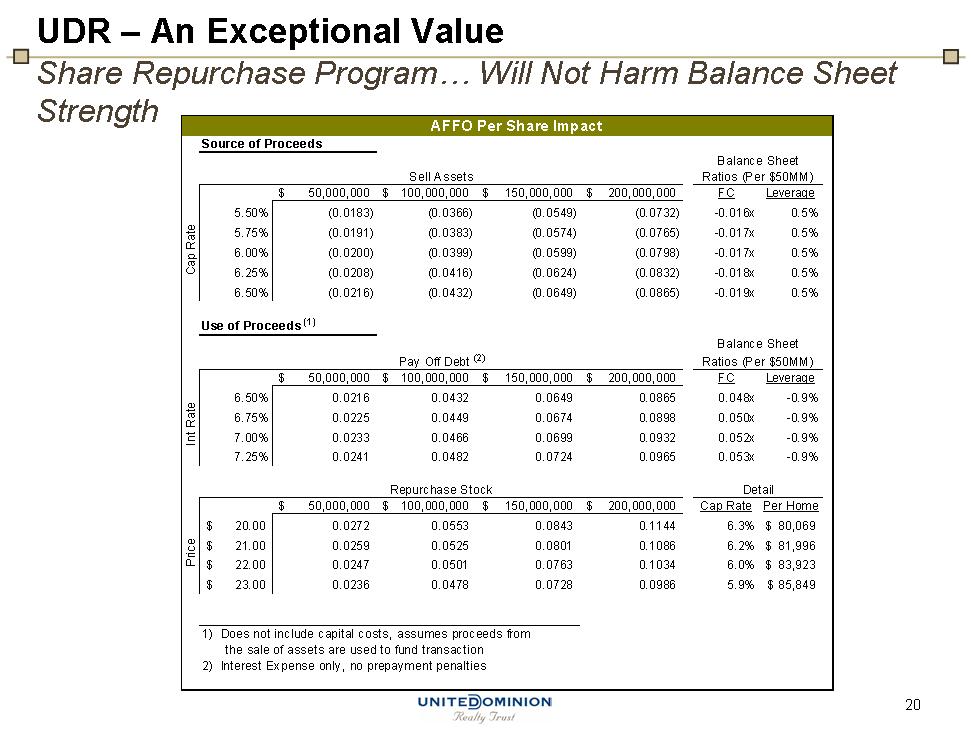
| UDR - An Exceptional Value Share Repurchase Program... Will Not Harm Balance Sheet Strength |
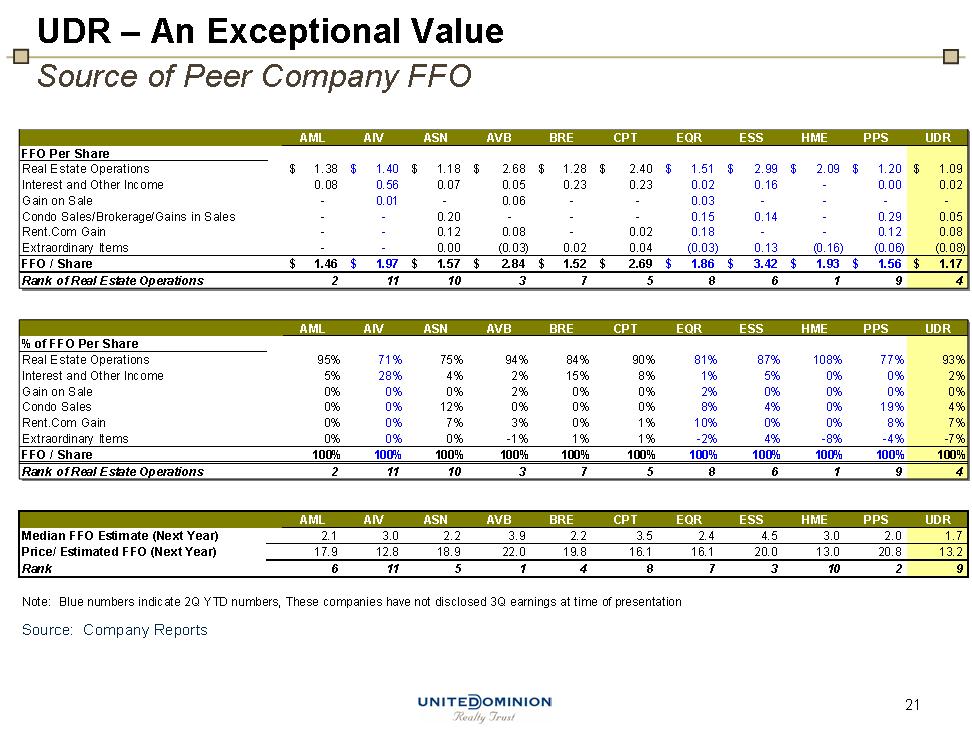
| UDR - An Exceptional Value Source of Peer Company FFO Source: Company Reports |
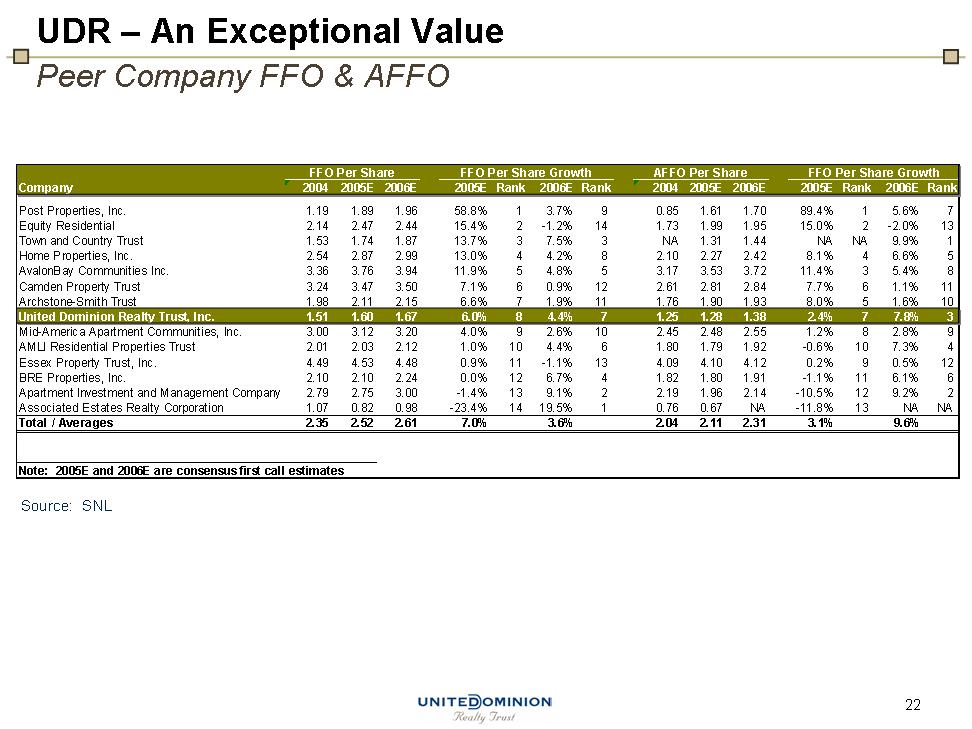
| UDR - An Exceptional Value Peer Company FFO & AFFO Source: SNL |
| Definitions Funds From Operations (FFO) - The National Association of Real Estate Investment Trusts ("NAREIT") defines funds from operations ("FFO") (April 2002 White Paper) as net income (computed in accordance with accounting principles generally accepted in the United States (GAAP)), excluding gains (or losses) from sales of depreciable property, plus depreciation and amortization, and after adjustments for unconsolidated partnerships and joint ventures. The Company believes that FFO is helpful to investors as a supplemental measure of the operating performance of a real estate company because it provides investors an understanding of the ability of the Company to incur and service debt and to make capital expenditures. FFO in and of itself does not represent net income or net cash flows from operating activities in accordance with GAAP. Therefore, FFO should not be exclusively considered as an alternative to net income or to net cash flows from operating activities as determined by GAAP or as a measure of liquidity. Adjusted Funds From Operations (AFFO) - AFFO is usually calculated by adjusting out of Funds From Operations (FFO) certain "non cash" revenues and expenses and normalized recurring expenditures that are capitalized by the REIT and then amortized, but which are necessary to maintain a REIT's properties and its revenue stream (e.g., new carpeting and drapes in apartment units, leasing expenses and tenant improvement allowances). This calculation also is called Cash Available for Distribution (CAD) or Funds Available for Distribution (FAD). |