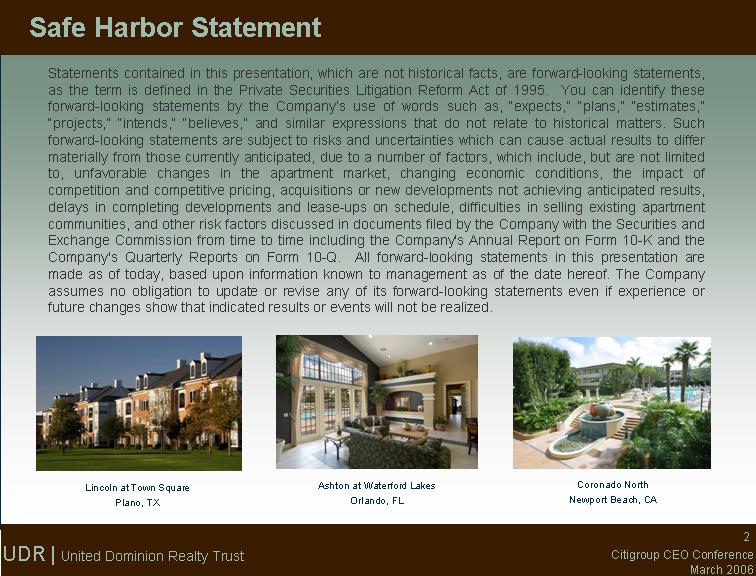
| Statements contained in this presentation, which are not historical facts, are forward-looking statements, as the term is defined in the Private Securities Litigation Reform Act of 1995. You can identify these forward-looking statements by the Company's use of words such as, "expects," "plans," "estimates," "projects," "intends," "believes," and similar expressions that do not relate to historical matters. Such forward-looking statements are subject to risks and uncertainties which can cause actual results to differ materially from those currently anticipated, due to a number of factors, which include, but are not limited to, unfavorable changes in the apartment market, changing economic conditions, the impact of competition and competitive pricing, acquisitions or new developments not achieving anticipated results, delays in completing developments and lease-ups on schedule, difficulties in selling existing apartment communities, and other risk factors discussed in documents filed by the Company with the Securities and Exchange Commission from time to time including the Company's Annual Report on Form 10-K and the Company's Quarterly Reports on Form 10-Q. All forward-looking statements in this presentation are made as of today, based upon information known to management as of the date hereof. The Company assumes no obligation to update or revise any of its forward-looking statements even if experience or future changes show that indicated results or events will not be realized. Safe Harbor Statement Lincoln at Town Square Plano, TX Ashton at Waterford Lakes Orlando, FL Coronado North Newport Beach, CA |
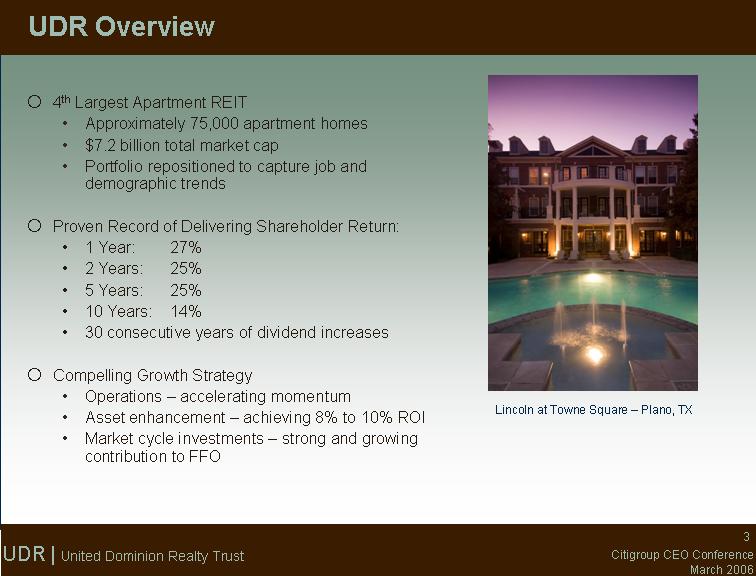
| 4th Largest Apartment REIT Approximately 75,000 apartment homes $7.2 billion total market cap Portfolio repositioned to capture job and demographic trends Proven Record of Delivering Shareholder Return: 1 Year: 27% 2 Years: 25% 5 Years: 25% 10 Years: 14% 30 consecutive years of dividend increases Compelling Growth Strategy Operations - accelerating momentum Asset enhancement - achieving 8% to 10% ROI Market cycle investments - strong and growing contribution to FFO UDR Overview Lincoln at Towne Square - Plano, TX Lincoln at Towne Square - Plano, TX |
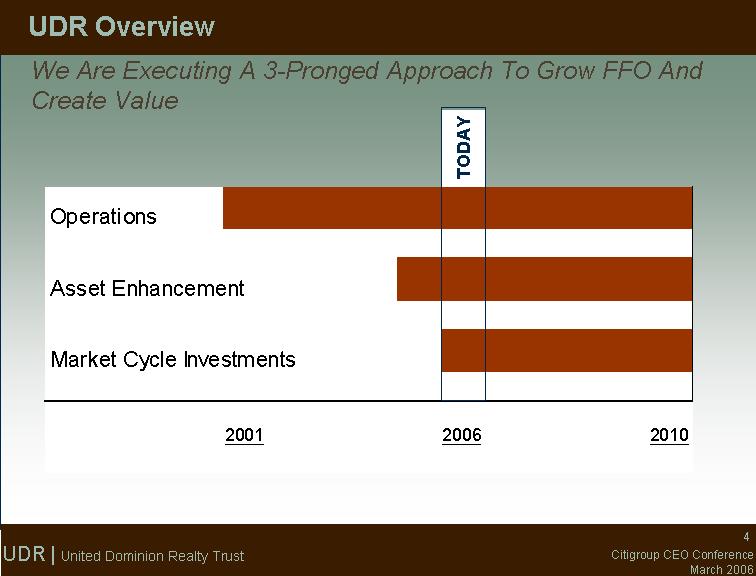
| UDR Overview We Are Executing A 3-Pronged Approach To Grow FFO And Create Value TODAY |

| UDR - Overview Value Creation Highlights - 2005 Operations Best same store operating performance in over 5 years Q4 Full Year Occupancy: 94.7% 94.6% Revenue Growth: 5.2% 3.8% NOI Growth: 3.9% 3.4% Momentum accelerating in 2006 Asset Enhancement Completed 5,400 kitchen and bath upgrades Completed 686 full scope rehabs Development pipeline exceeds 2,200 homes Market Cycle Investments Sold 240 condos - $16.7 million post-tax profit Sold development - $3.8 million post-tax profit Initiated development joint ventures |

| UDR - Overview Value Creation Highlights - 2006 Operations Potential FFO/Share Rent - $25 to $30/month increase: $0.11 to 0.14 Reimbursements - improve by 5% 0.01 Occupancy - 40 bps increase: 0.02 Expense - 3% to 5% growth: (0.05) to (0.08) Asset Enhancement Estimate $150 million work to be contracted in 2006 Kitchen & bath upgrades: complete 250 to 400 per month Full scope rehabs: 2,818 homes in program Development: plan to complete 807 new homes, $107 million investment Market Cycle Investments Estimate $14 million condo profit, post-tax Development in Las Colinas (Dallas) potential sale Expand internal and pre-sales development pipeline |

| Our Holdings as of December 2005 UDR - Operations Top States for 2006 Projected Net Operating Income California: 25% Florida: 15% Metro D.C.: 15% Texas: 12% North Carolina: 12% |
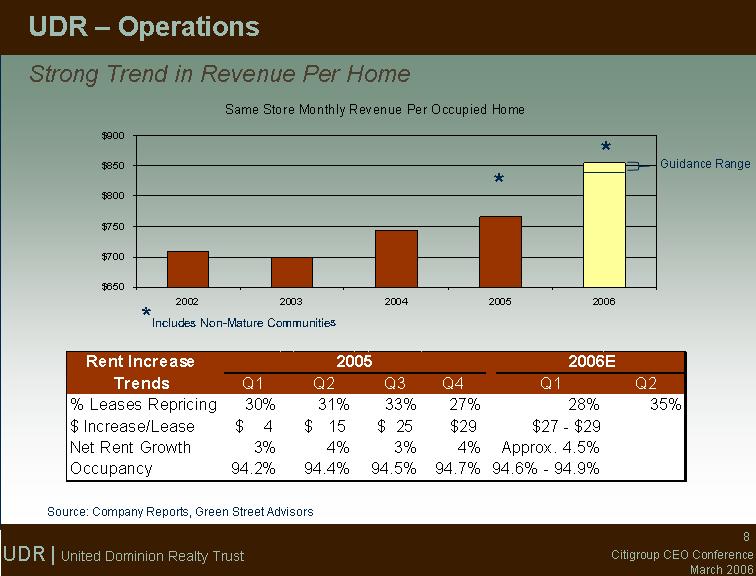
| Strong Trend in Revenue Per Home UDR - Operations Source: Company Reports, Green Street Advisors *Includes Non-Mature Communities * Guidance Range * |
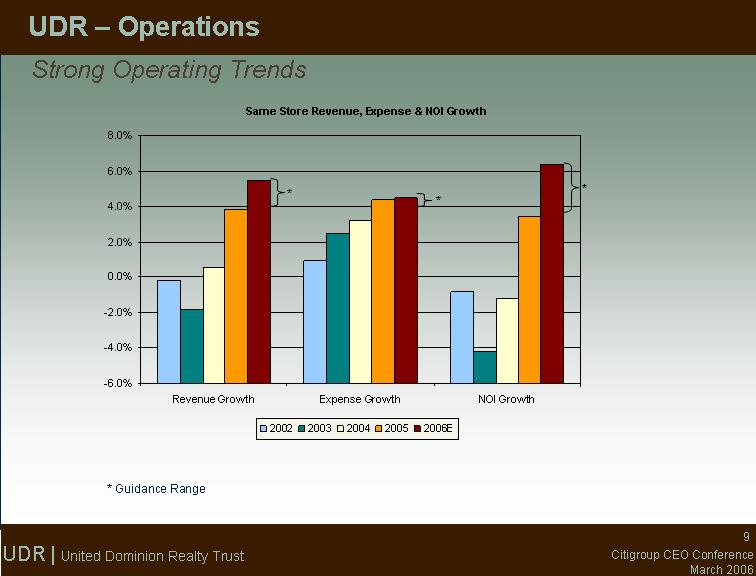
| UDR - Operations Strong Operating Trends * Guidance Range |

| UDR - Operations 2006 Guidance * Amounts based on 2006 same store properties |
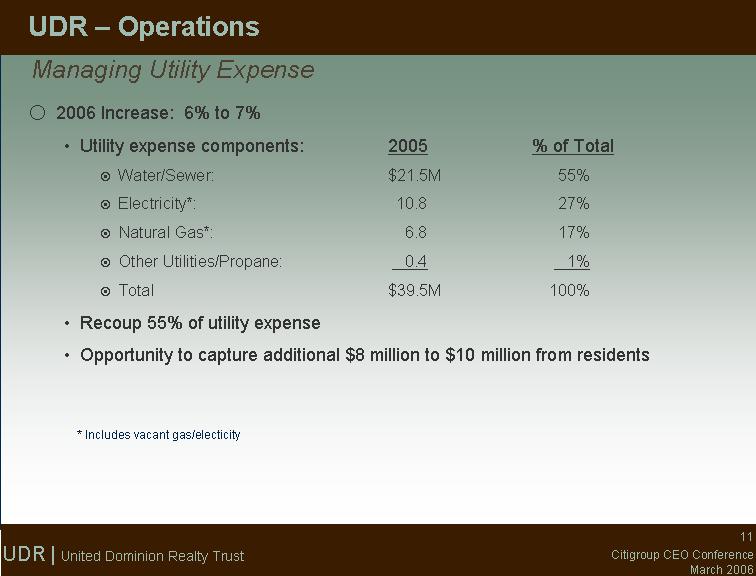
| * Includes vacant gas/electicity UDR - Operations Managing Utility Expense 2006 Increase: 6% to 7% Utility expense components: 2005 % of Total Water/Sewer: $21.5M 55% Electricity*: 10.8 27% Natural Gas*: 6.8 17% Other Utilities/Propane: 0.4 1% Total $39.5M 100% Recoup 55% of utility expense Opportunity to capture additional $8 million to $10 million from residents |
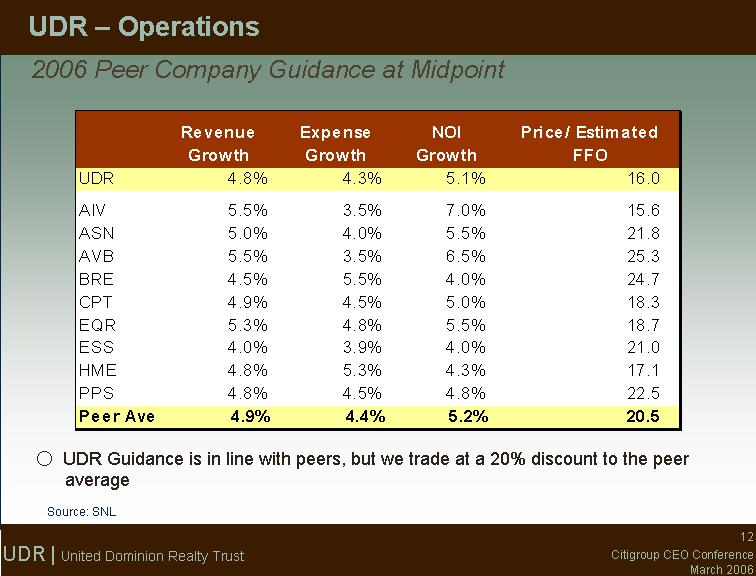
| UDR - Operations 2006 Peer Company Guidance at Midpoint Source: SNL UDR Guidance is in line with peers, but we trade at a 20% discount to the peer average |
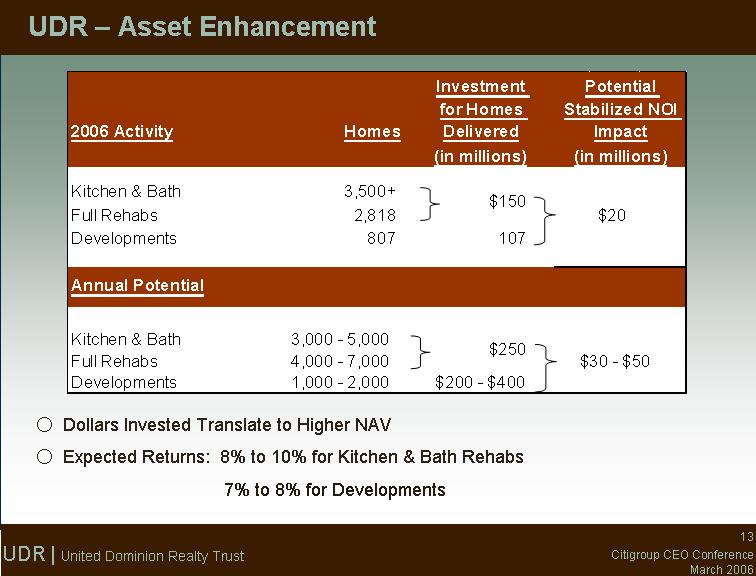
| UDR - Asset Enhancement Dollars Invested Translate to Higher NAV Expected Returns: 8% to 10% for Kitchen & Bath Rehabs 7% to 8% for Developments |
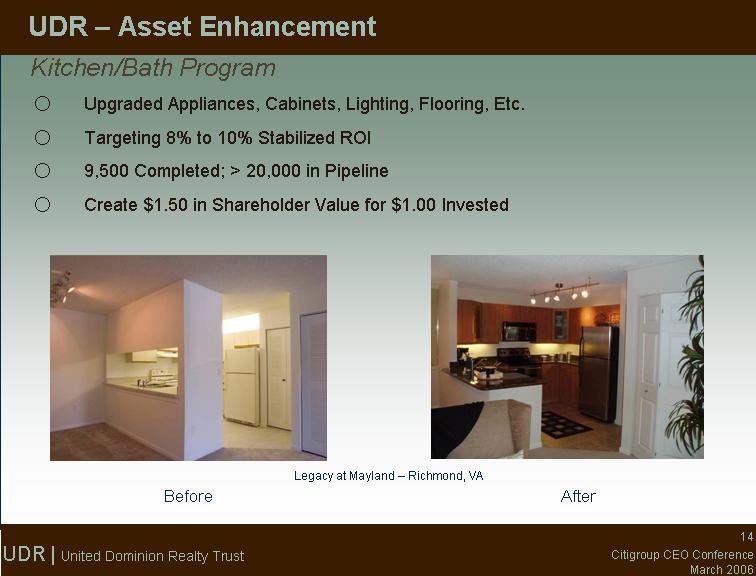
| Kitchen/Bath Program Before After UDR - Asset Enhancement Legacy at Mayland - Richmond, VA Upgraded Appliances, Cabinets, Lighting, Flooring, Etc. Targeting 8% to 10% Stabilized ROI 9,500 Completed; > 20,000 in Pipeline Create $1.50 in Shareholder Value for $1.00 Invested |
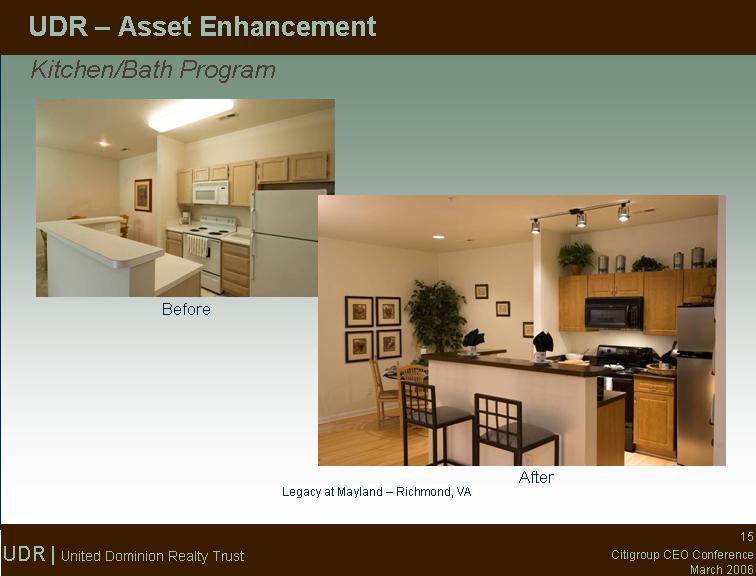
| Kitchen/Bath Program Before After UDR - Asset Enhancement Legacy at Mayland - Richmond, VA |

| Full Scope Rehabs Before After UDR - Asset Enhancement Legacy at Mayland - Richmond, VA Reinvest with Exterior Upgrades and Interior Renovations 7 Communities Underway, 2,818 Homes Targeting 8% to 10% Stabilized ROI 7,000 Homes Under Study |
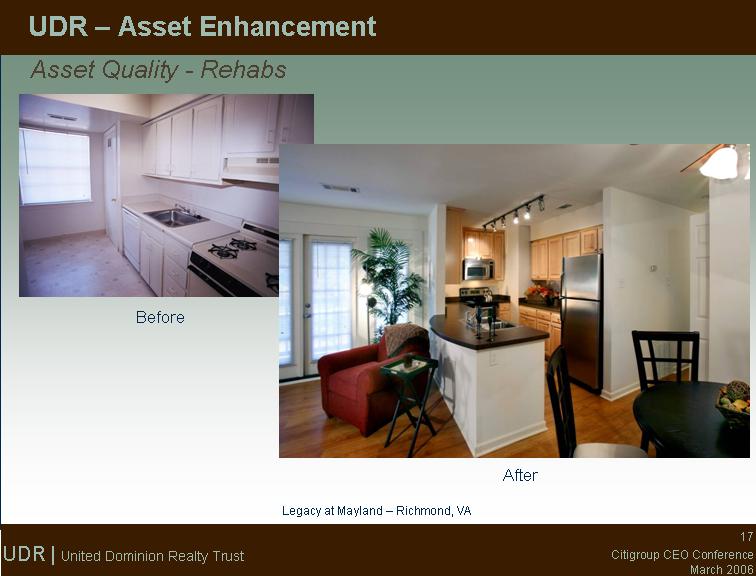
| Asset Quality - Rehabs Before After UDR - Asset Enhancement Legacy at Mayland - Richmond, VA |
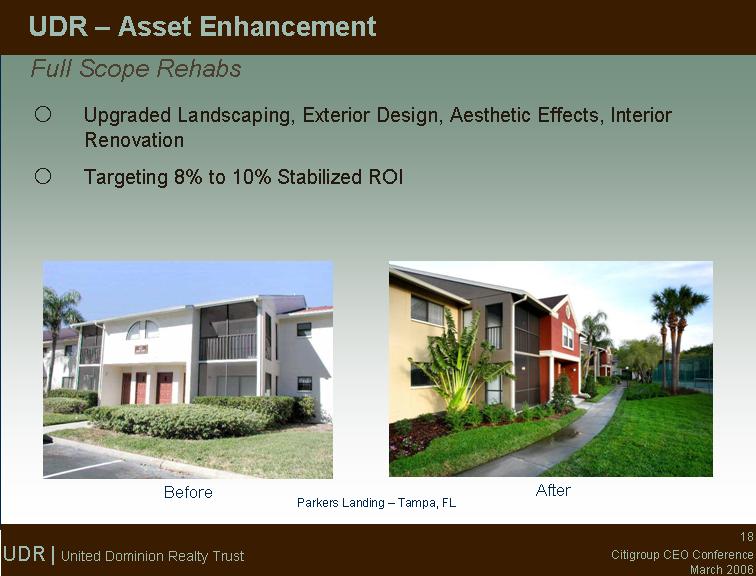
| Before After UDR - Asset Enhancement Parkers Landing - Tampa, FL Full Scope Rehabs Upgraded Landscaping, Exterior Design, Aesthetic Effects, Interior Renovation Targeting 8% to 10% Stabilized ROI |
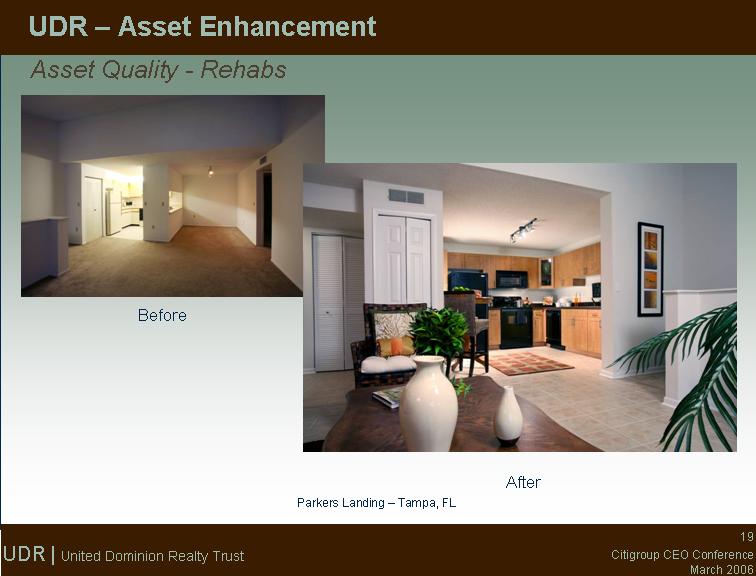
| Before After UDR - Asset Enhancement Parkers Landing - Tampa, FL Asset Quality - Rehabs |
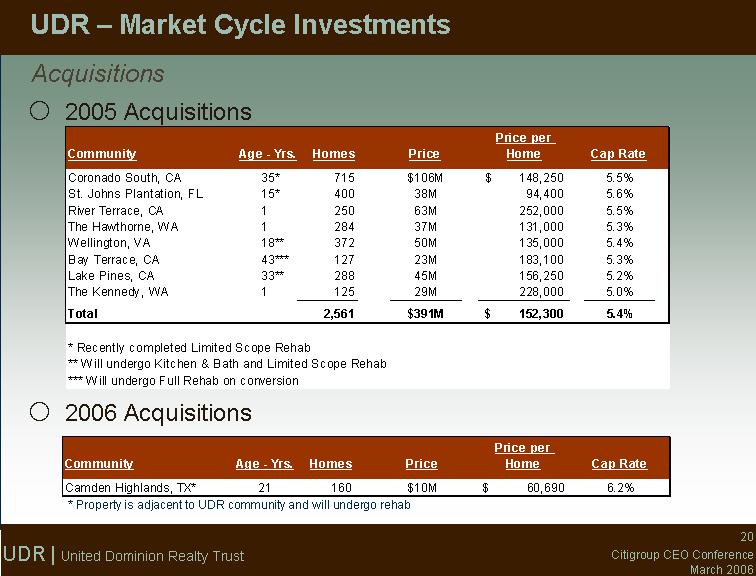
| Acquisitions UDR - Market Cycle Investments * Property is adjacent to UDR community and will undergo rehab 2005 Acquisitions 2006 Acquisitions |
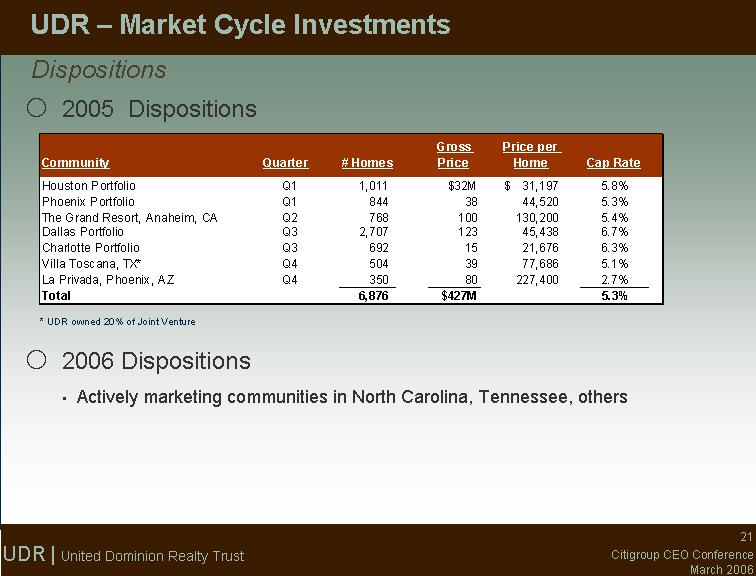
| Dispositions * UDR owned 20% of Joint Venture UDR - Market Cycle Investments 2005 Dispositions 2006 Dispositions Actively marketing communities in North Carolina, Tennessee, others |
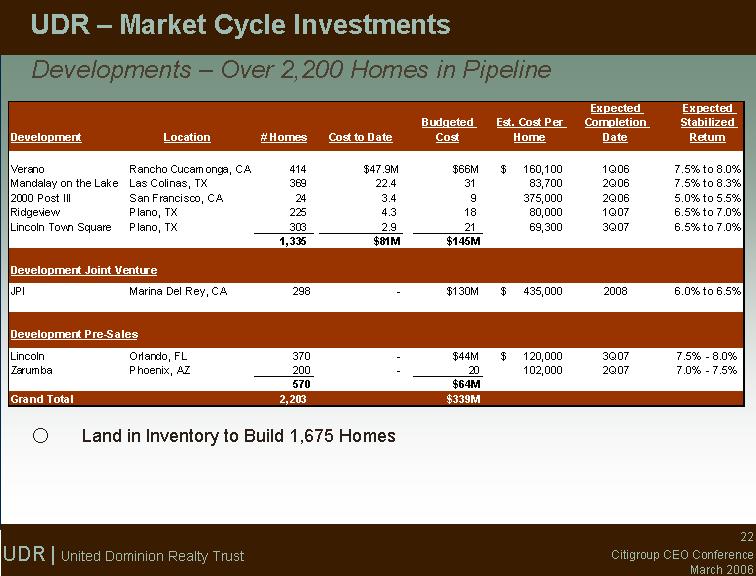
| Developments - Over 2,200 Homes in Pipeline UDR - Market Cycle Investments Land in Inventory to Build 1,675 Homes |
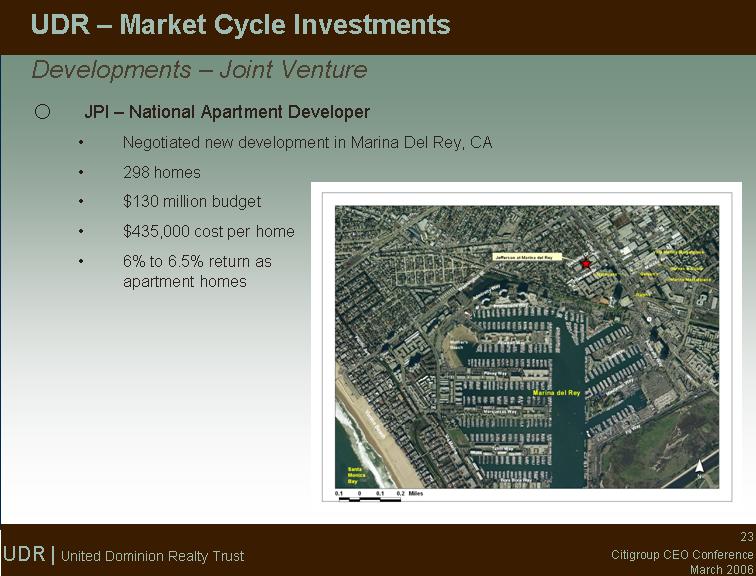
| Developments - Joint Venture UDR - Market Cycle Investments UDR - Market Cycle Investments JPI - National Apartment Developer Negotiated new development in Marina Del Rey, CA 298 homes $130 million budget $435,000 cost per home 6% to 6.5% return as apartment homes |
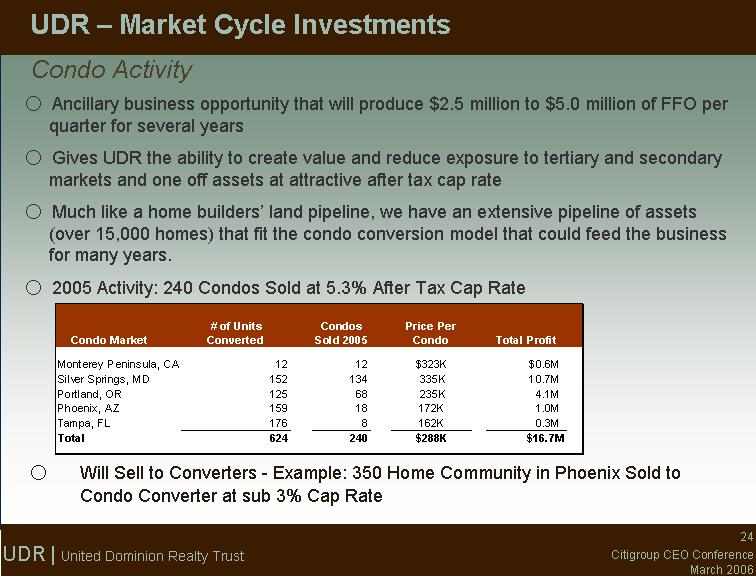
| Condo Activity UDR - Market Cycle Investments Ancillary business opportunity that will produce $2.5 million to $5.0 million of FFO per quarter for several years Gives UDR the ability to create value and reduce exposure to tertiary and secondary markets and one off assets at attractive after tax cap rate Much like a home builders' land pipeline, we have an extensive pipeline of assets (over 15,000 homes) that fit the condo conversion model that could feed the business for many years. 2005 Activity: 240 Condos Sold at 5.3% After Tax Cap Rate Will Sell to Converters - Example: 350 Home Community in Phoenix Sold to Condo Converter at sub 3% Cap Rate |
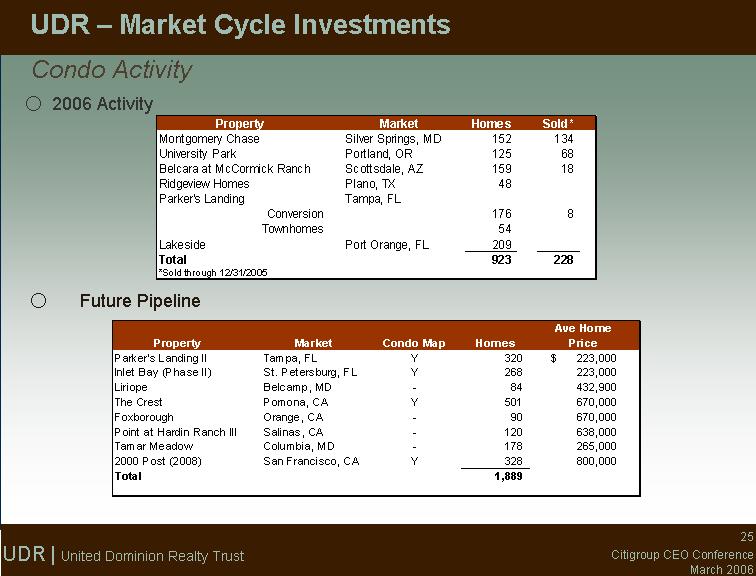
| Condo Activity UDR - Market Cycle Investments 2006 Activity Future Pipeline |
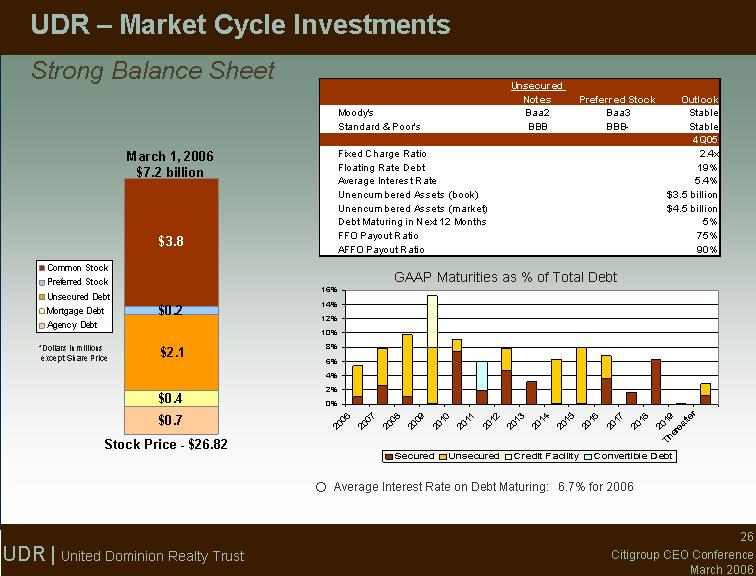
| *Dollars in millions except Share Price Strong Balance Sheet GAAP Maturities as % of Total Debt UDR - Market Cycle Investments Average Interest Rate on Debt Maturing: 6.7% for 2006 |
| Recent Equity and Debt Activity UDR - Market Cycle Investments Share Repurchase Repurchased 3.2 million shares at average price of $23.03 in Q4 Board authorized new 10 million share repurchase program in February Dividend Board authorized 4.2% increase in February, the 30th consecutive annual increase, to an annual rate of $1.25 per share AFFO coverage of 87% to 92%% Financing Issued $250 million convertible senior notes due 2035 with 4% coupon in December, with conversion feature at $28.33 (21% premium to share price) |
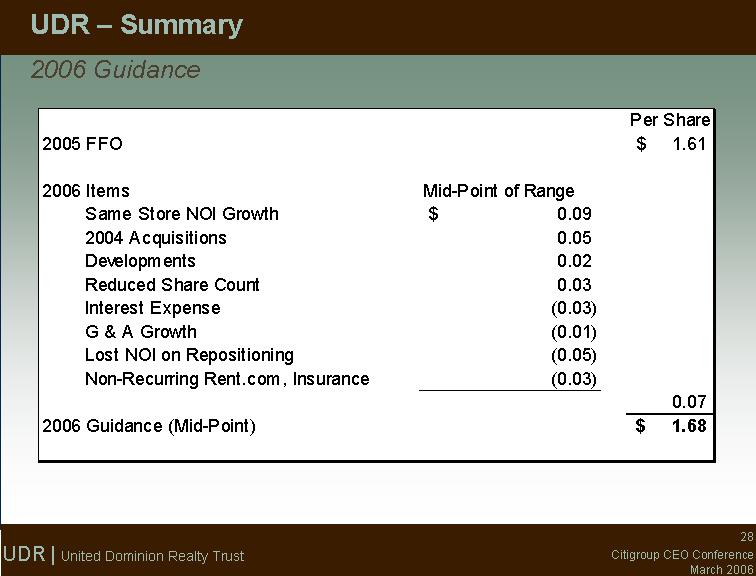
| 2006 Guidance UDR - Summary |
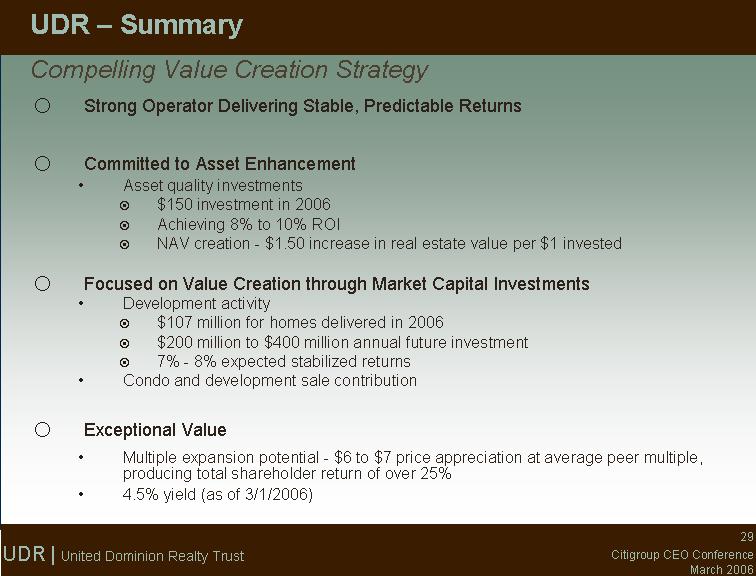
| Compelling Value Creation Strategy UDR - Summary Strong Operator Delivering Stable, Predictable Returns Committed to Asset Enhancement Asset quality investments $150 investment in 2006 Achieving 8% to 10% ROI NAV creation - $1.50 increase in real estate value per $1 invested Focused on Value Creation through Market Capital Investments Development activity $107 million for homes delivered in 2006 $200 million to $400 million annual future investment 7% - 8% expected stabilized returns Condo and development sale contribution Exceptional Value Multiple expansion potential - $6 to $7 price appreciation at average peer multiple, producing total shareholder return of over 25% 4.5% yield (as of 3/1/2006) |
| Definitions Funds From Operations (FFO) - The National Association of Real Estate Investment Trusts ("NAREIT") defines funds from operations ("FFO") (April 2002 White Paper) as net income (computed in accordance with accounting principles generally accepted in the United States (GAAP)), excluding gains (or losses) from sales of depreciable property, plus depreciation and amortization, and after adjustments for unconsolidated partnerships and joint ventures. The Company believes that FFO is helpful to investors as a supplemental measure of the operating performance of a real estate company because it provides investors an understanding of the ability of the Company to incur and service debt and to make capital expenditures. FFO in and of itself does not represent net income or net cash flows from operating activities in accordance with GAAP. Therefore, FFO should not be exclusively considered as an alternative to net income or to net cash flows from operating activities as determined by GAAP or as a measure of liquidity. Adjusted Funds From Operations (AFFO) - AFFO is usually calculated by adjusting out of Funds From Operations (FFO) certain "non cash" revenues and expenses and normalized recurring expenditures that are capitalized by the REIT and then amortized, but which are necessary to maintain a REIT's properties and its revenue stream (e.g., new carpeting and drapes in apartment units, leasing expenses and tenant improvement allowances). This calculation also is called Cash Available for Distribution (CAD) or Funds Available for Distribution (FAD). |