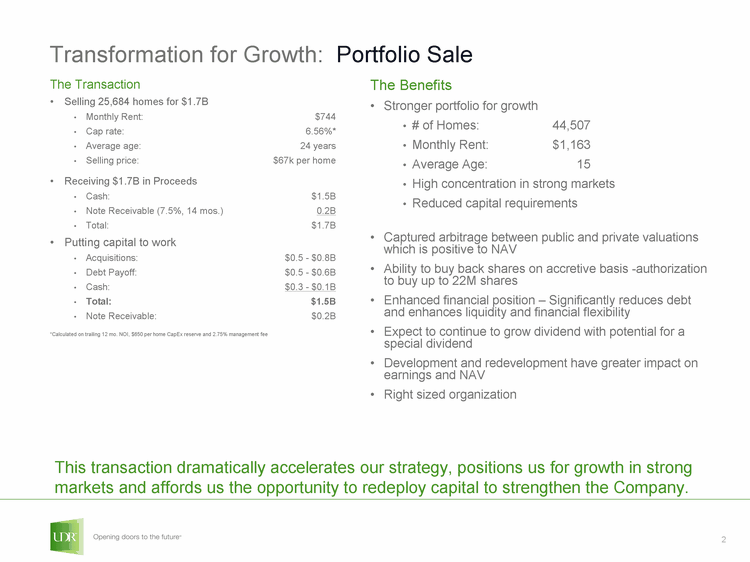
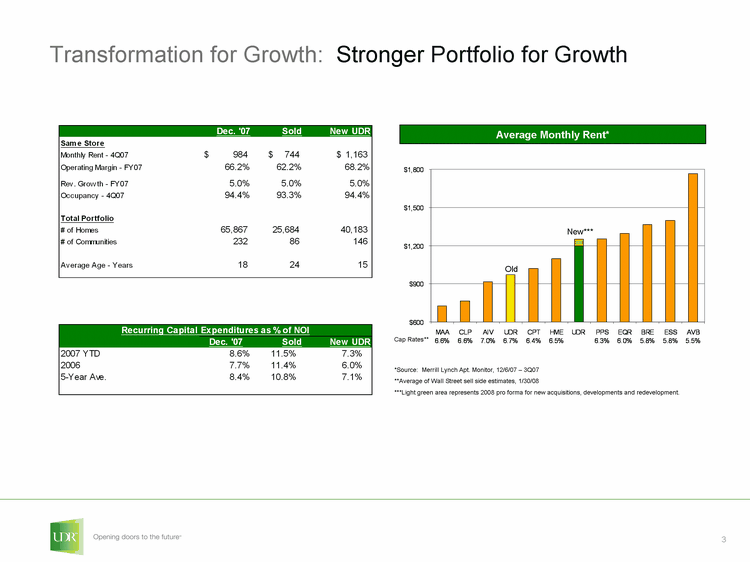
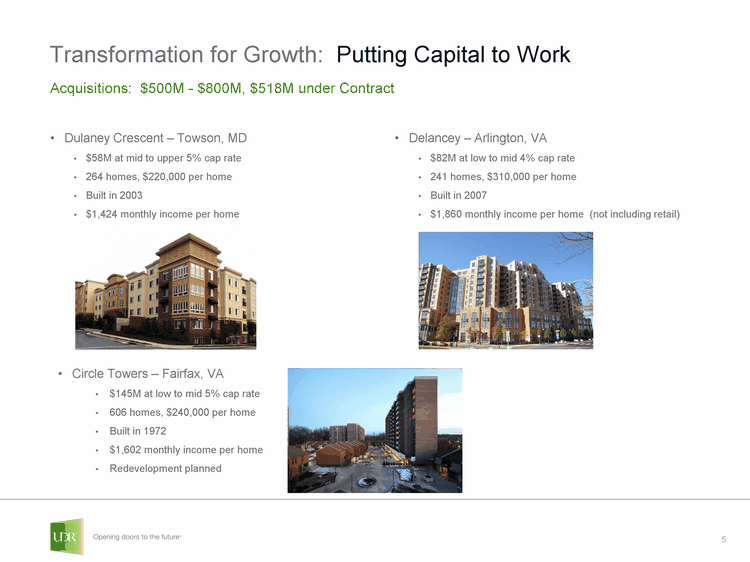
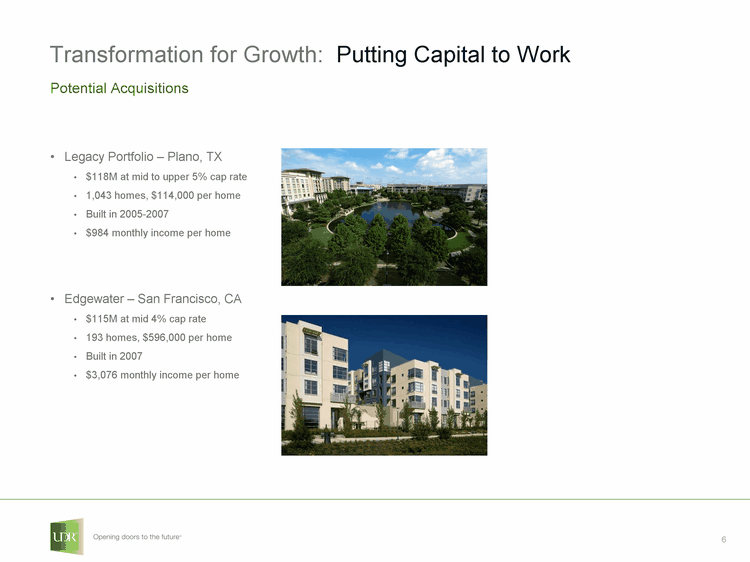
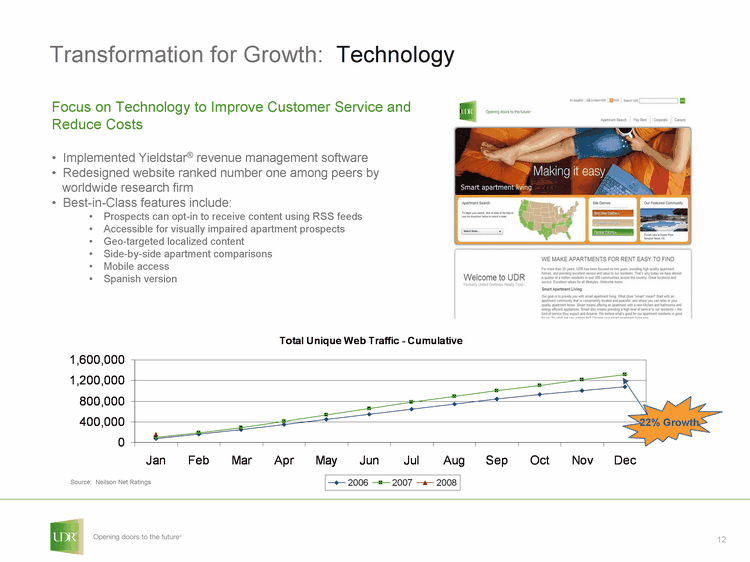
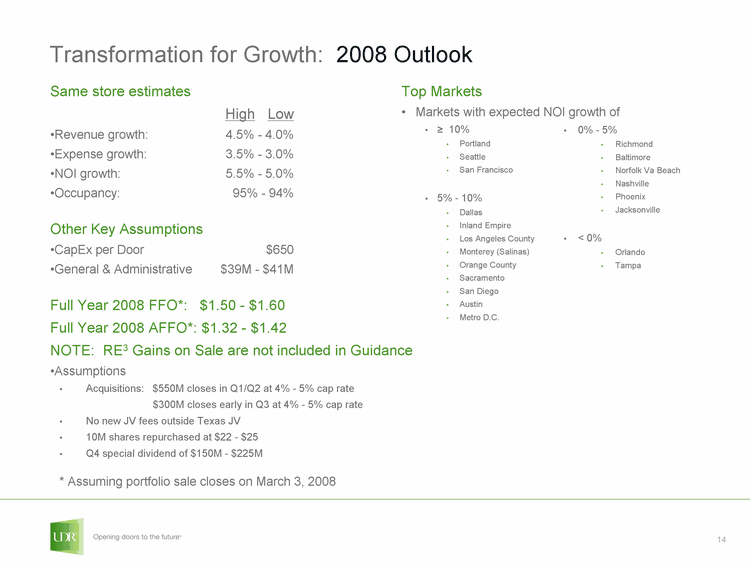
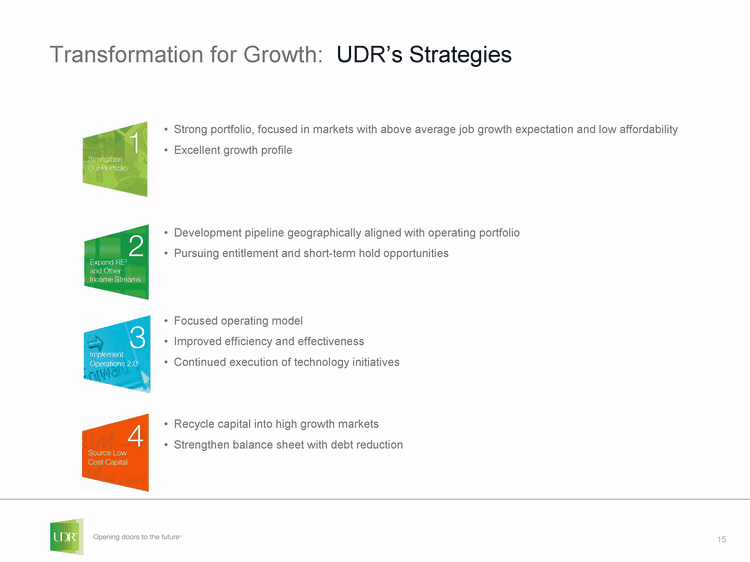
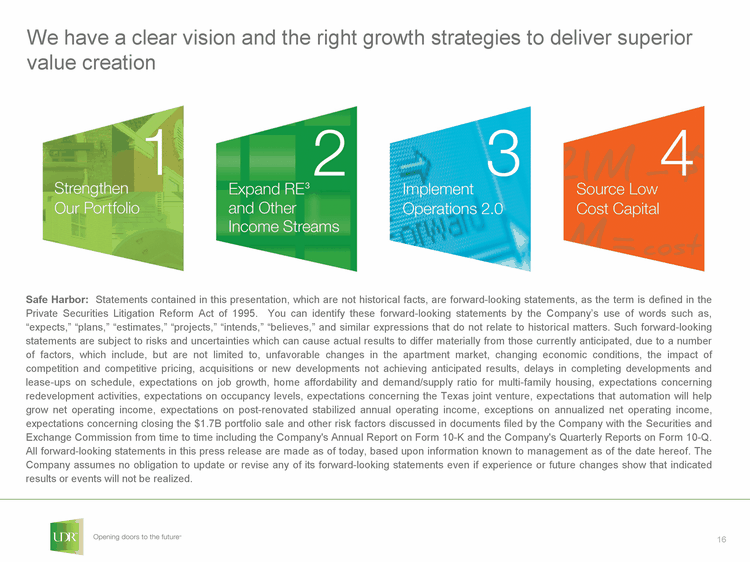
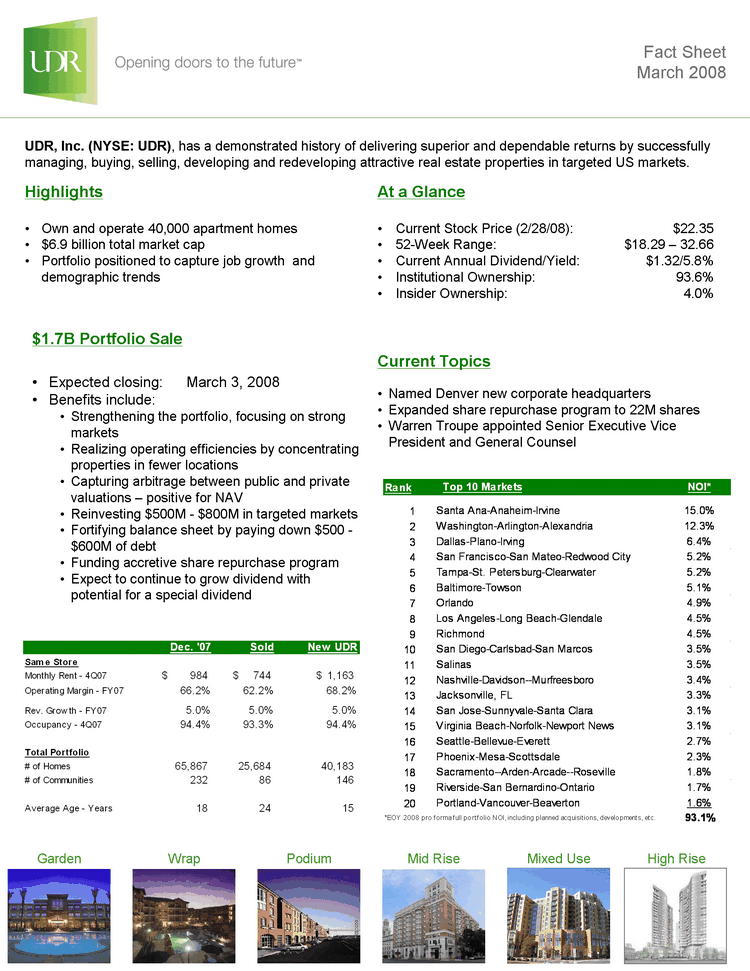
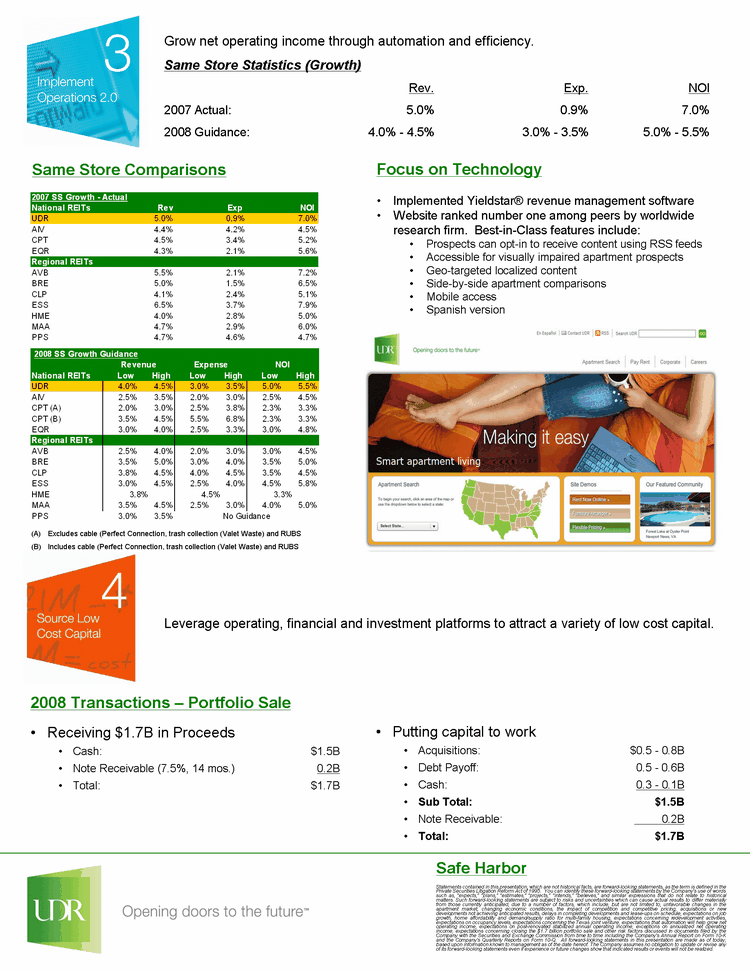
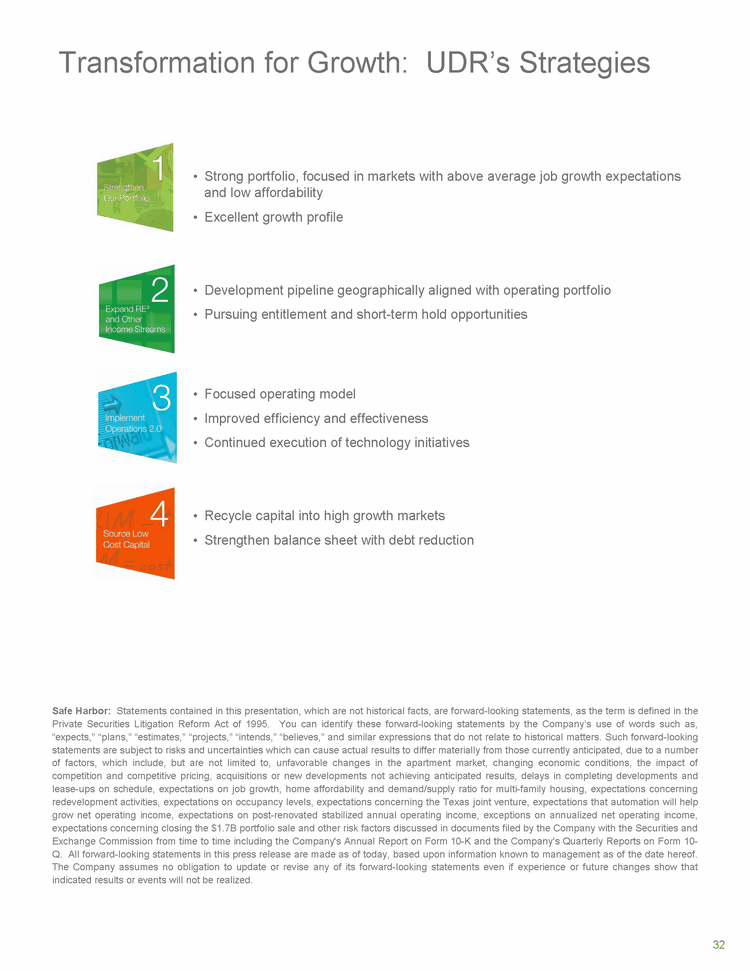
| Statements contained in this presentation, which are not historical facts, are forward-looking statements, as the term is defined in the Private Securities Litigation Reform Act of 1995. You can identify these forward-looking statements by the Company's use of words such as, "expects," "plans," "estimates," "projects," "intends," "believes," and similar expressions that do not relate to historical matters. Such forward-looking statements are subject to risks and uncertainties which can cause actual results to differ materially from those currently anticipated, due to a number of factors, which include, but are not limited to, unfavorable changes in the apartment market, changing economic conditions, the impact of competition and competitive pricing, acquisitions or new developments not achieving anticipated results, delays in completing developments and lease-ups on schedule, expectations on job growth, home affordability and demand/supply ratio for multi-family housing, expectations concerning redevelopment activities, expectations on occupancy levels, expectations concerning the Texas joint venture, expectations that automation will help grow net operating income, expectations on post-renovated stabilized annual operating income, exceptions on annualized net operating income, expectations concerning closing the $1.7 billion portfolio sale and other risk factors discussed in documents filed by the Company with the Securities and Exchange Commission from time to time including the Company's Annual Report on Form 10-K and the Company's Quarterly Reports on Form 10-Q. All forward-looking statements in this presentation are made as of today, based upon information known to management as of the date hereof. The Company assumes no obligation to update or revise any of its forward-looking statements even if experience or future changes show that indicated results or events will not be realized. Leverage operating, financial and investment platforms to attract a variety of low cost capital. Safe Harbor Grow net operating income through automation and efficiency. Same Store Statistics (Growth) Rev. Exp. NOI 2007 Actual: 5.0% 0.9% 7.0% 2008 Guidance: 4.0% - 4.5% 3.0% - 3.5% 5.0% - 5.5% 2008 Transactions - Portfolio Sale Receiving $1.7B in Proceeds Cash: $1.5B Note Receivable (7.5%, 14 mos.) 0.2B Total: $1.7B Focus on Technology Implemented Yieldstar(r) revenue management software Website ranked number one among peers by worldwide research firm. Best-in-Class features include: Prospects can opt-in to receive content using RSS feeds Accessible for visually impaired apartment prospects Geo-targeted localized content Side-by-side apartment comparisons Mobile access Spanish version Putting capital to work Acquisitions: $0.5 - 0.8B Debt Payoff: 0.5 - 0.6B Cash: 0.3 - 0.1B Sub Total: $1.5B Note Receivable: 0.2B Total: $1.7B Same Store Comparisons Excludes cable (Perfect Connection, trash collection (Valet Waste) and RUBS Includes cable (Perfect Connection, trash collection (Valet Waste) and RUBS |
