EXHIBIT 99.1
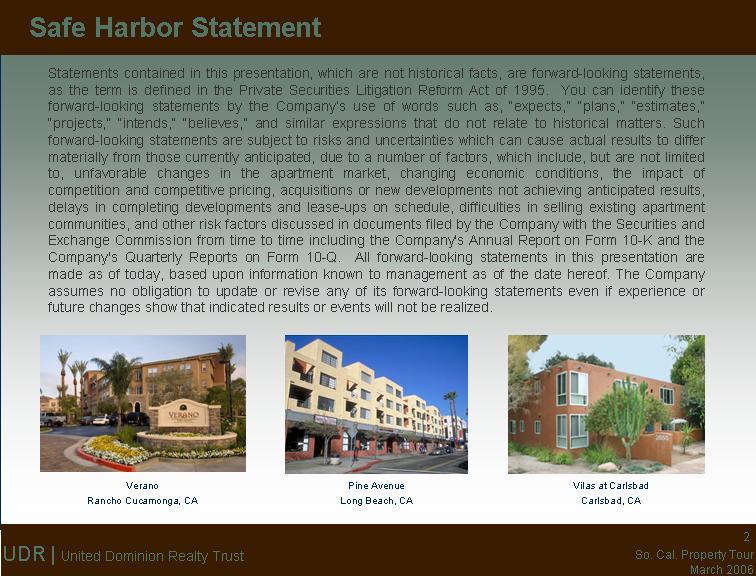
| Statements contained in this presentation, which are not historical facts, are forward-looking statements, as the term is defined in the Private Securities Litigation Reform Act of 1995. You can identify these forward-looking statements by the Company's use of words such as, "expects," "plans," "estimates," "projects," "intends," "believes," and similar expressions that do not relate to historical matters. Such forward-looking statements are subject to risks and uncertainties which can cause actual results to differ materially from those currently anticipated, due to a number of factors, which include, but are not limited to, unfavorable changes in the apartment market, changing economic conditions, the impact of competition and competitive pricing, acquisitions or new developments not achieving anticipated results, delays in completing developments and lease-ups on schedule, difficulties in selling existing apartment communities, and other risk factors discussed in documents filed by the Company with the Securities and Exchange Commission from time to time including the Company's Annual Report on Form 10-K and the Company's Quarterly Reports on Form 10-Q. All forward-looking statements in this presentation are made as of today, based upon information known to management as of the date hereof. The Company assumes no obligation to update or revise any of its forward-looking statements even if experience or future changes show that indicated results or events will not be realized. Safe Harbor Statement Vilas at Carlsbad Carlsbad, CA Verano Rancho Cucamonga, CA Pine Avenue Long Beach, CA |
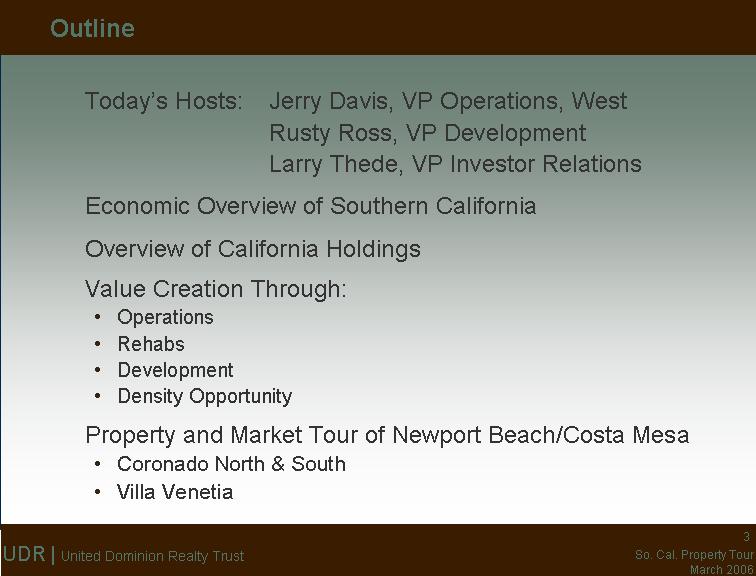
| Today's Hosts: Jerry Davis, VP Operations, West Rusty Ross, VP Development Larry Thede, VP Investor Relations Economic Overview of Southern California Overview of California Holdings Value Creation Through: Operations Rehabs Development Density Opportunity Property and Market Tour of Newport Beach/Costa Mesa Coronado North & South Villa Venetia Outline |
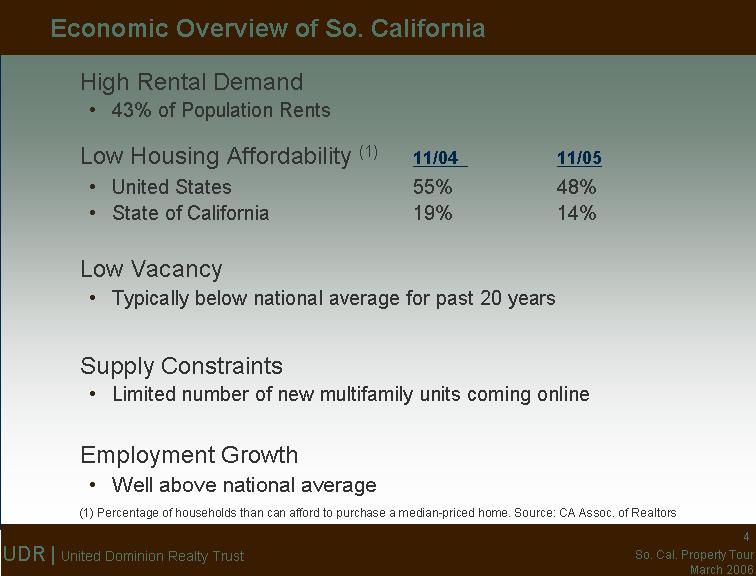
| High Rental Demand 43% of Population Rents Low Housing Affordability (1) 11/04 11/05 United States 55% 48% State of California 19% 14% Low Vacancy Typically below national average for past 20 years Supply Constraints Limited number of new multifamily units coming online Employment Growth Well above national average Economic Overview of So. California (1) Percentage of households than can afford to purchase a median-priced home. Source: CA Assoc. of Realtors |
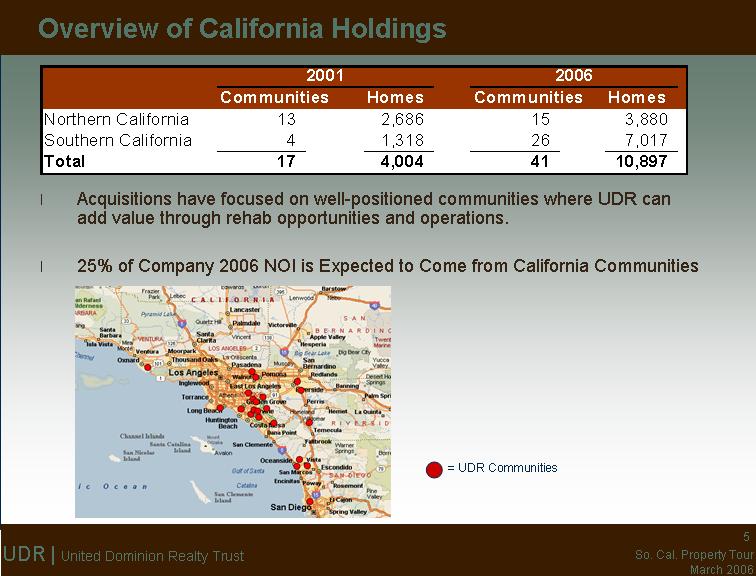
| Overview of California Holdings Acquisitions have focused on well-positioned communities where UDR can add value through rehab opportunities and operations. 25% of Company 2006 NOI is Expected to Come from California Communities = UDR Communities |
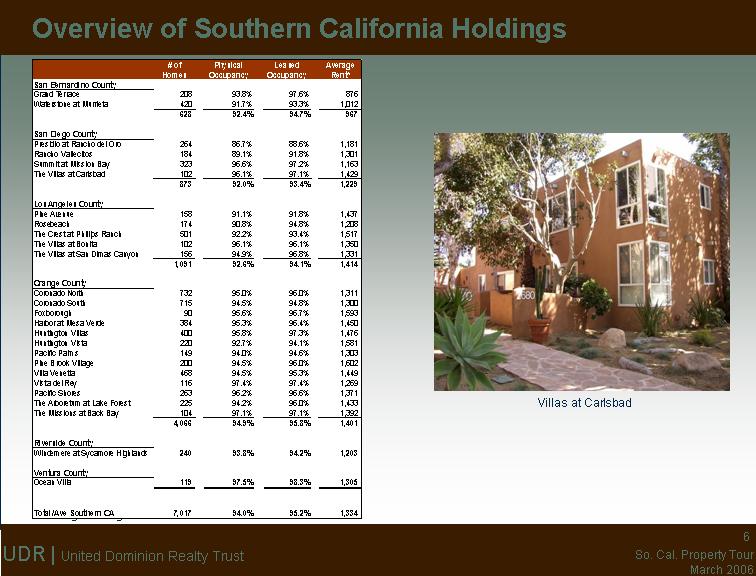
| Overview of Southern California Holdings * Average asking rents. Villas at Carlsbad |
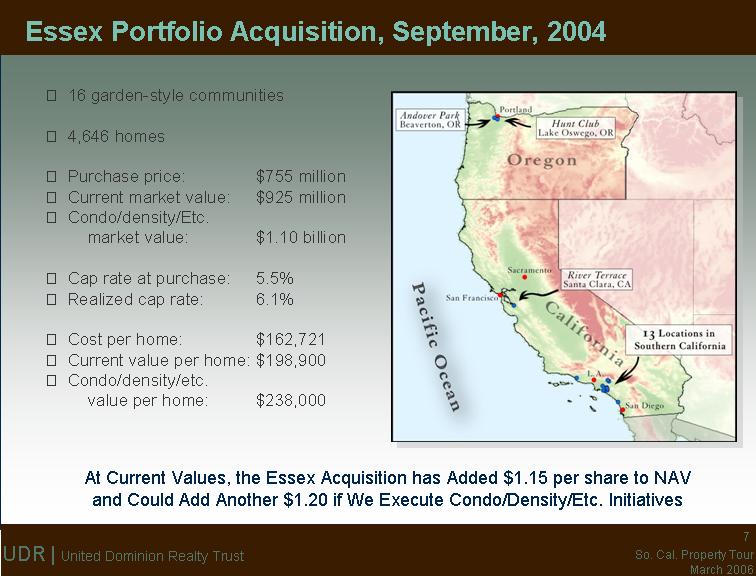
| 16 garden-style communities 4,646 homes Purchase price: $755 million Current market value: $925 million Condo/density/Etc. market value: $1.10 billion Cap rate at purchase: 5.5% Realized cap rate: 6.1% Cost per home: $162,721 Current value per home: $198,900 Condo/density/etc. value per home: $238,000 Essex Portfolio Acquisition, September, 2004 At Current Values, the Essex Acquisition has Added $1.15 per share to NAV and Could Add Another $1.20 if We Execute Condo/Density/Etc. Initiatives |
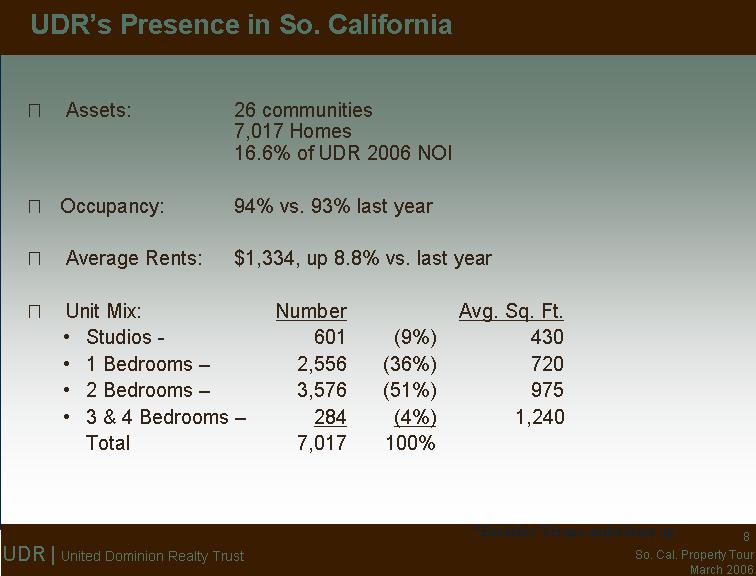
| UDR's Presence in So. California Assets: 26 communities 7,017 Homes 16.6% of UDR 2006 NOI Occupancy: 94% vs. 93% last year Average Rents: $1,334, up 8.8% vs. last year Unit Mix: Number Avg. Sq. Ft. Studios - 601 (9%) 430 1 Bedrooms - 2,556 (36%) 720 2 Bedrooms - 3,576 (51%) 975 3 & 4 Bedrooms - 284 (4%) 1,240 Total 7,017 100% *Excludes Verano under lease up |
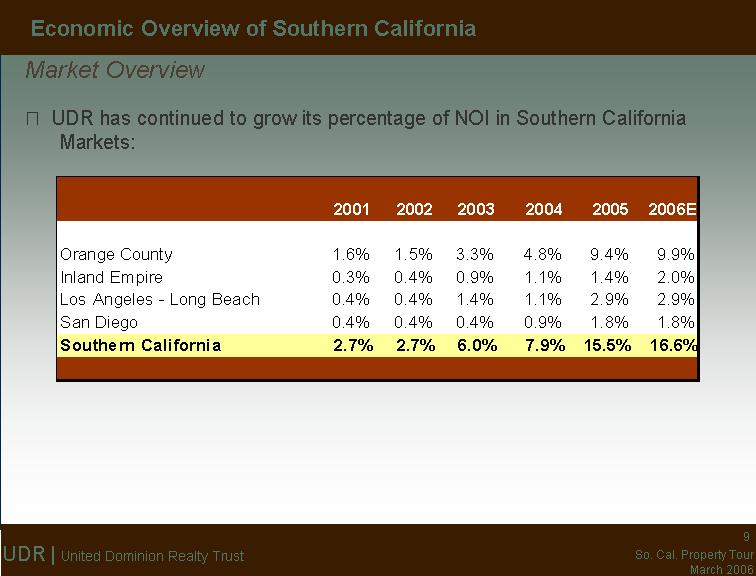
| Market Overview UDR has continued to grow its percentage of NOI in Southern California Markets: Economic Overview of Southern California |
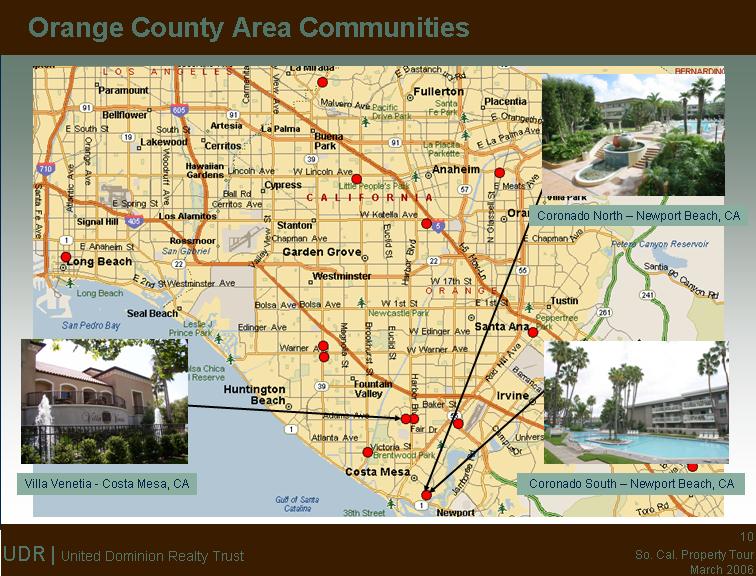
| Orange County Area Communities Villa Venetia - Costa Mesa, CA Coronado North - Newport Beach, CA Coronado South - Newport Beach, CA |
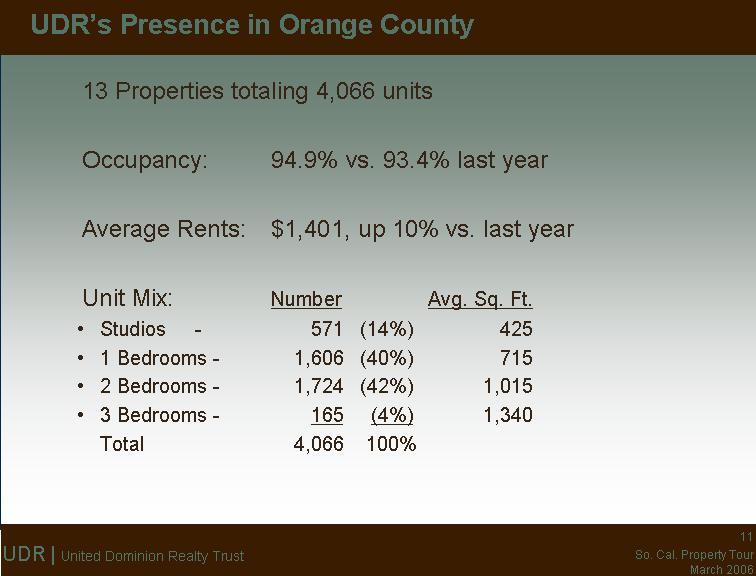
| UDR's Presence in Orange County 13 Properties totaling 4,066 units Occupancy: 94.9% vs. 93.4% last year Average Rents: $1,401, up 10% vs. last year Unit Mix: Number Avg. Sq. Ft. Studios - 571 (14%) 425 1 Bedrooms - 1,606 (40%) 715 2 Bedrooms - 1,724 (42%) 1,015 3 Bedrooms - 165 (4%) 1,340 Total 4,066 100% |
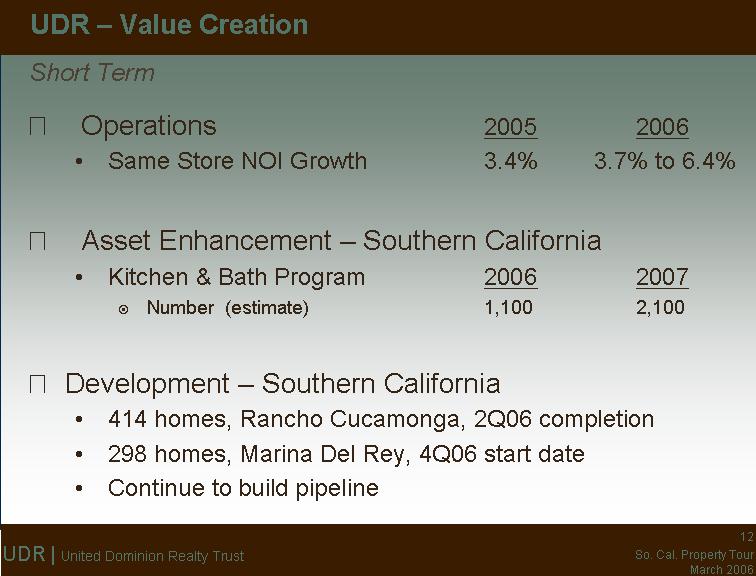
| UDR - Value Creation Operations 2005 2006 Same Store NOI Growth 3.4% 3.7% to 6.4% Asset Enhancement - Southern California Kitchen & Bath Program 2006 2007 Number (estimate) 1,100 2,100 Development - Southern California 414 homes, Rancho Cucamonga, 2Q06 completion 298 homes, Marina Del Rey, 4Q06 start date Continue to build pipeline Short Term |
| UDR - Value Creation Operations NOI growth consistently above average Asset Enhancement Kitchen & bath program: 9,500 completed - >20,000 in pipeline (company wide) Rehab program: 2,818 homes underway - 7,000 under study (company wide) Condo Pipeline 923 active/approved homes 2,361 homes in future pipeline The Crest, Pomona, CA - 501 homes 2000 Post, San Francisco, CA - 328 homes Density / Development Density: Build vertically Scrape & rebuild Sell to capture value Density example: Coronado North & South - 30 acres Phase II sites (develop vacant land adjacent to communities) Presidio, Oceanside, CA - 3.5 acres of land adjacent to property Post Street III, San Francisco, CA - 24 new homes being built on adjacent property Lincoln at Towne Square, Plano, TX - 10.6 acres of land next to community Long Term |

| JPI - National Apartment Developer Negotiated new development in Marina Del Rey, CA 298 homes $130 million budget $435,000 cost per home 6% to 6.5% return as apartment homes Developments - Joint Venture UDR - Value Creation UDR - Value Creation |
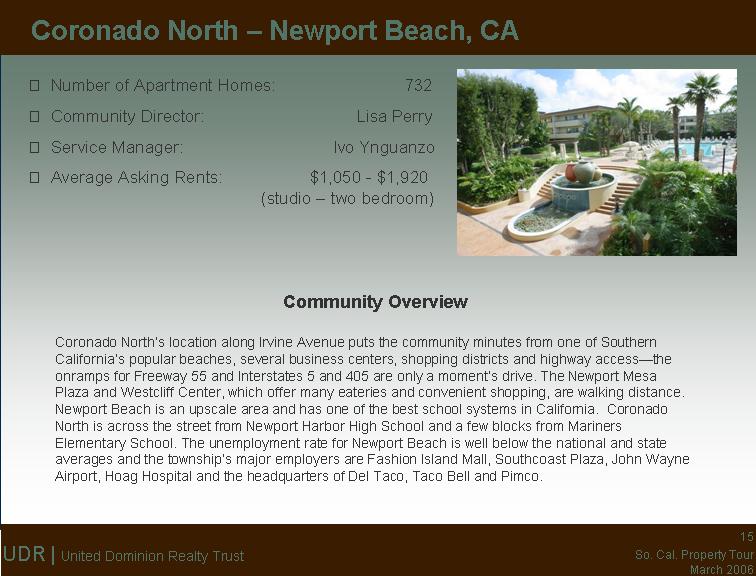
| Coronado North - Newport Beach, CA Number of Apartment Homes: 732 Community Director: Lisa Perry Service Manager: Ivo Ynguanzo Average Asking Rents: $1,050 - $1,920 (studio - two bedroom) Community Overview Coronado North's location along Irvine Avenue puts the community minutes from one of Southern California's popular beaches, several business centers, shopping districts and highway access-the onramps for Freeway 55 and Interstates 5 and 405 are only a moment's drive. The Newport Mesa Plaza and Westcliff Center, which offer many eateries and convenient shopping, are walking distance. Newport Beach is an upscale area and has one of the best school systems in California. Coronado North is across the street from Newport Harbor High School and a few blocks from Mariners Elementary School. The unemployment rate for Newport Beach is well below the national and state averages and the township's major employers are Fashion Island Mall, Southcoast Plaza, John Wayne Airport, Hoag Hospital and the headquarters of Del Taco, Taco Bell and Pimco. |
| Kitchen and bath renovation in process Exploring additional interior upgrades (Crown molding, two-tone paint, 6-panel doors etc..) Add "card" access to amenities Upgrade business center to include Wi/Fi access for clubhouse and pool area Renovate hallways to include painting, carpeting, doors, hardware, etc. Coronado North - Newport Beach, CA Current and Planned Renovations |

| Number of Apartment Homes: 715 Community Director: Susan Gonnell Service Manager: Gilbert Darling Average Asking Rents: $1,050 - $1,825 (studio - two bedroom) Coronado South - Newport Beach, CA Community Overview Coronado South is minutes from one of Southern California's popular beaches, several business centers, shopping districts and highway access-the onramps for Freeway 55 and Interstates 5 and 405 are only a moment's drive. The Newport Mesa Plaza and Westcliff Center, which offer many eateries and convenient shopping, are walking distance. Newport Beach is an upscale area and has one of the best school systems in California. Coronado South is across the street from Newport Harbor High School and a few blocks from Mariners Elementary School. The unemployment rate for Newport Beach is well below the national and state averages and the township's major employers are Fashion Island Mall, Southcoast Plaza, John Wayne Airport, Hoag Hospital and the headquarters of Del Taco, Taco Bell and Pimco. |
| Kitchen and bath renovation in process Exploring additional interior upgrades (Crown molding, two-tone paint, 6-panel doors etc..) Add "card" access to amenities Renovate existing theater room, similar to Coronado North Upgrade business center to include Wi/Fi access for clubhouse and pool area Complete clubhouse renovation to include pool tables, chairs, ect. Coronado South - Newport Beach, CA Current and Planned Renovations |
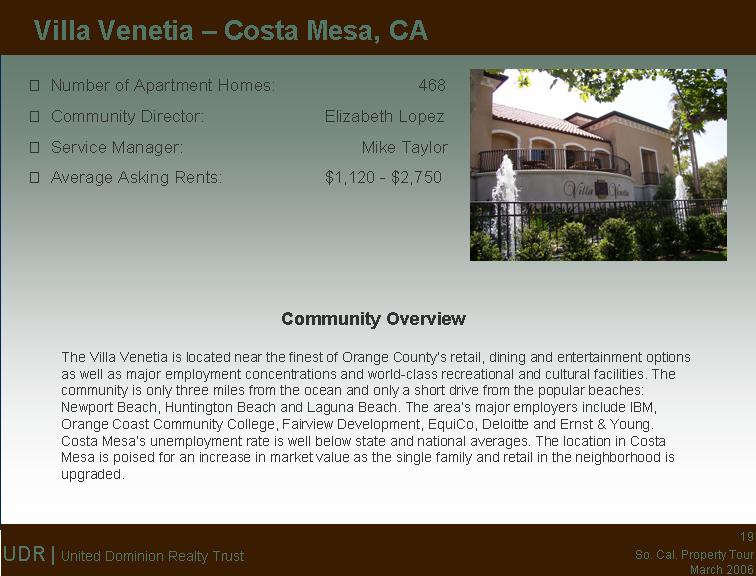
| Number of Apartment Homes: 468 Community Director: Elizabeth Lopez Service Manager: Mike Taylor Average Asking Rents: $1,120 - $2,750 Villa Venetia - Costa Mesa, CA Community Overview The Villa Venetia is located near the finest of Orange County's retail, dining and entertainment options as well as major employment concentrations and world-class recreational and cultural facilities. The community is only three miles from the ocean and only a short drive from the popular beaches: Newport Beach, Huntington Beach and Laguna Beach. The area's major employers include IBM, Orange Coast Community College, Fairview Development, EquiCo, Deloitte and Ernst & Young. Costa Mesa's unemployment rate is well below state and national averages. The location in Costa Mesa is poised for an increase in market value as the single family and retail in the neighborhood is upgraded. |
| Current and Planned Renovations Villa Venetia - Costa Mesa, CA Kitchen and bath renovation in process Add "card" access to amenities Expand business center to allow for separate conference area and computer usage Add store front glass between game room and office to allow resident usage during business hours |
| Appendix Appendix |
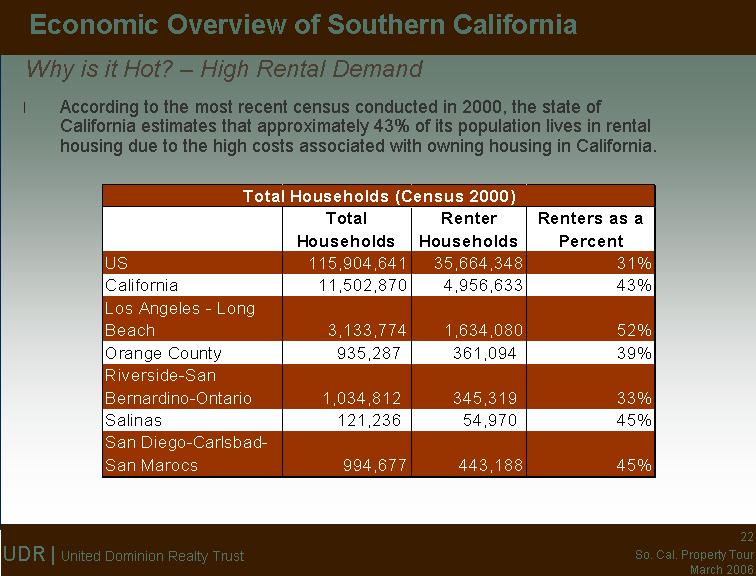
| According to the most recent census conducted in 2000, the state of California estimates that approximately 43% of its population lives in rental housing due to the high costs associated with owning housing in California. Why is it Hot? - High Rental Demand Economic Overview of Southern California |
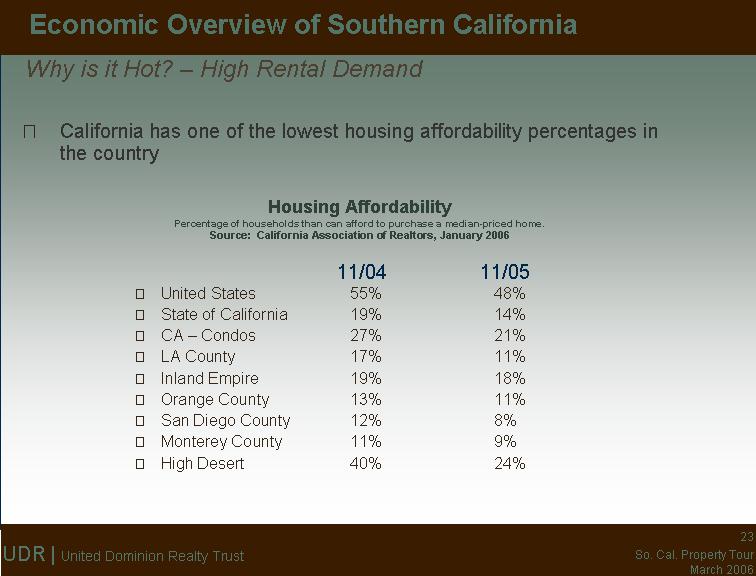
| California has one of the lowest housing affordability percentages in the country Why is it Hot? - High Rental Demand Economic Overview of Southern California United States 55% 48% State of California 19% 14% CA - Condos 27% 21% LA County 17% 11% Inland Empire 19% 18% Orange County 13% 11% San Diego County 12% 8% Monterey County 11% 9% High Desert 40% 24% Housing Affordability Percentage of households than can afford to purchase a median-priced home. Source: California Association of Realtors, January 2006 11/04 11/05 |
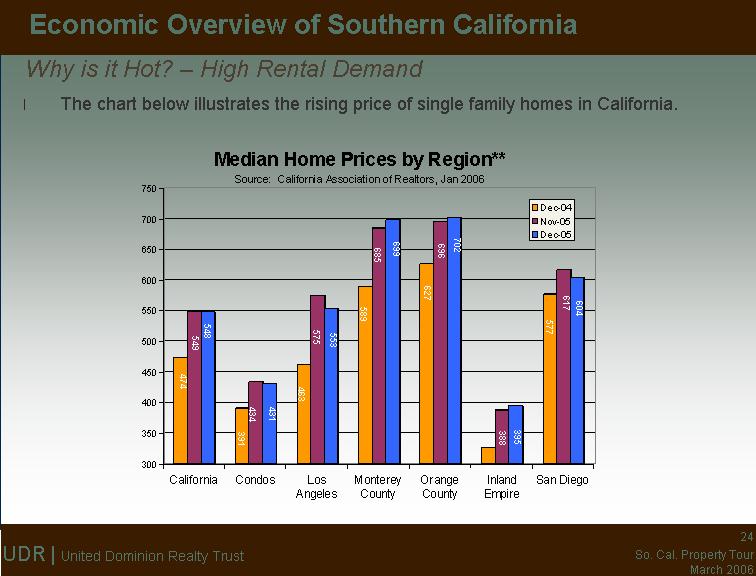
| The chart below illustrates the rising price of single family homes in California. Why is it Hot? - High Rental Demand Economic Overview of Southern California |

| During the last 20 years, Southern California vacancy rates typically have been below the national average Economic Overview of Southern California Why is it Hot? - Low Vacancy Rates Overall Vacancy Rates Rest of Country Los Angeles County Orange County Inland Empire San Diego County 1981 1982 1983 1984 1985 0.037 0.086 0.044 1986 0.109 0.035 0.025 0.075 0.054 1987 0.099 0.044 0.038 0.079 0.062 1988 0.101 0.055 0.073 0.101 0.085 1989 0.093 0.058 0.065 0.103 0.066 1990 0.073 0.062 0.035 0.099 0.039 1991 0.076 0.067 0.035 0.089 0.049 1992 0.074 0.082 0.047 0.086 0.049 1993 0.086 0.095 0.086 0.103 0.078 1994 0.07 0.087 0.073 0.104 0.064 1995 0.07 0.097 0.071 0.087 0.087 1996 0.073 0.088 0.059 0.086 0.06 1997 0.072 0.08 0.062 0.093 0.052 1998 0.072 0.07 0.044 0.091 0.051 1999 0.074 0.051 0.042 0.081 0.042 2000 0.075 0.047 0.022 0.075 0.04 2001 0.079 0.034 0.039 0.041 0.044 2002 0.087 0.039 0.051 0.052 0.078 2003 0.101 0.031 0.059 0.059 0.06 2004 0.1 0.033 0.059 0.064 0.058 2005 0.096 0.032 0.055 0.064 0.057 2006 0.091 0.031 0.047 0.062 0.052 Source: Rosen Consulting Group (RCG) |

| Across Southern California, employment growth is above the national average of 1.1%. Employment growth in the region should range from 1.1% to 3.5% annually. Economic Overview of Southern California Will it Stay Hot? - YES...Employment Growth Year-Over-Year Employment Growth Rest of Country Los Angeles County Orange County Inland Empire San Diego County 1984 1985 1986 1987 1988 1989 1990 1991 -0.014 -0.034 -0.035 -0.012 -0.019 1992 0.011 -0.044 -0.006 0.022 -0.01 1993 0.032 -0.02 -0.002 0.012 0.012 1994 0.031 0.01 0.023 0.045 0.013 1995 0.023 0.011 0.02 0.028 0.029 1996 0.026 0.014 0.029 0.03 0.027 1997 0.031 0.022 0.052 0.044 0.054 1998 0.027 0.019 0.047 0.067 0.051 1999 0.027 0.02 0.031 0.067 0.038 2000 0.02 0.012 0.032 0.036 0.033 2001 -0.018 -0.016 -0.004 0.034 0.008 2002 -0.003 -0.005 0.012 0.041 0.014 2003 -0.003 -0.01 0.009 0.009 0.003 2004 0.011 0.011 0.012 0.027 0.019 2005 0.013 0.018 0.026 0.035 0.028 2006 0.013 0.017 0.025 0.032 0.028 Source: Rosen Consulting Group (RCG) |
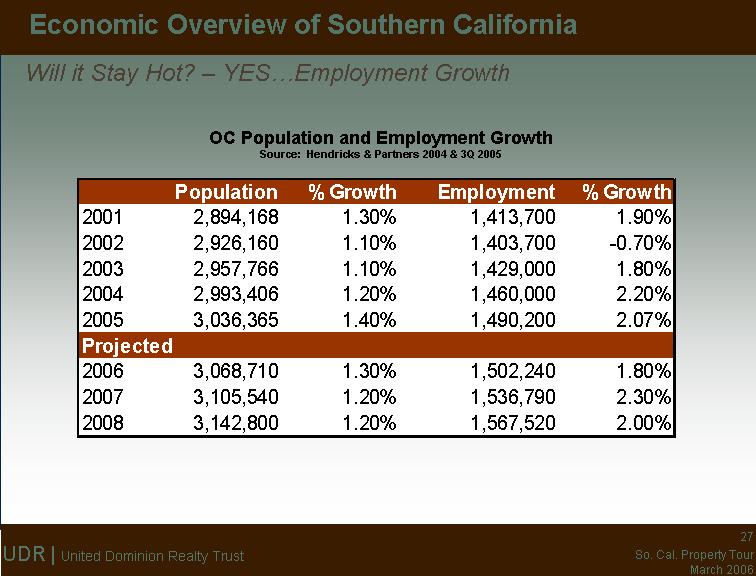
| OC Population and Employment Growth Source: Hendricks & Partners 2004 & 3Q 2005 Economic Overview of Southern California Will it Stay Hot? - YES...Employment Growth |
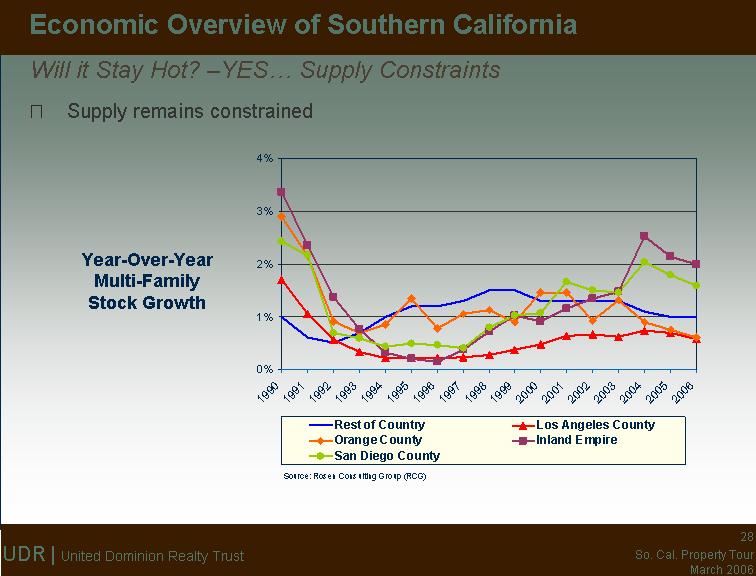
| Supply remains constrained Economic Overview of Southern California Will it Stay Hot? -YES... Supply Constraints Rest of Country Los Angeles County Orange County Inland Empire San Diego County 1981 0.02 1982 0.025 1983 0.04 1984 0.035 1985 0.031 0.024 0.0374 0.1381 0.0932 1986 0.025 0.0367 0.0517 0.15 0.1004 1987 0.018 0.0415 0.0604 0.1302 0.0861 1988 0.016 0.03 0.0544 0.0565 0.048 1989 0.014 0.0237 0.0397 0.048 0.0381 1990 0.01 0.0171 0.029 0.0336 0.0243 1991 0.006 0.0106 0.0215 0.0236 0.0217 1992 0.005 0.0056 0.0091 0.0137 0.007 1993 0.007 0.0033 0.007 0.0076 0.0059 1994 0.01 0.0021 0.0085 0.0032 0.0044 1995 0.012 0.0021 0.0135 0.002 0.0049 1996 0.012 0.0022 0.0078 0.0014 0.0046 1997 0.013 0.0023 0.0106 0.0037 0.0041 1998 0.015 0.0027 0.0112 0.0072 0.008 1999 0.015 0.0037 0.009 0.0102 0.0102 2000 0.013 0.0048 0.0146 0.0091 0.0107 2001 0.013 0.0063 0.0146 0.0116 0.0166 2002 0.013 0.0067 0.0092 0.0135 0.015 2003 0.013 0.0062 0.0132 0.0147 0.0146 2004 0.011 0.0074 0.0089 0.0252 0.0204 2005 0.01 0.0069 0.0075 0.0214 0.0179 2006 0.01 0.0058 0.0061 0.0199 0.0159 Year-Over-Year Multi-Family Stock Growth Source: Rosen Consulting Group (RCG) |