Exhibit 99.1

| UDR Opening doors to the future TM |
| Mature Market Trends As of 9/30/2007 |

| Safe Harbor Statement |
| Statements contained in this presentation, which are not historical facts, are forward-looking statements, as the term is defined in the Private Securities Litigation Reform Act of 1995. You can identify these forward-looking statements by the Company’s use of words such as, “expects,” “plans,” “estimates,” “projects,” “intends,” “believes,” and similar expressions that do not relate to historical matters. Such forward-looking statements are subject to risks and uncertainties which can cause actual results to differ materially from those currently anticipated, due to a number of factors, which include, but are not limited to, unfavorable changes in the apartment market, changing economic conditions, the impact of competition and competitive pricing, acquisitions or new developments not achieving anticipated results, delays in completing developments and lease-ups on schedule, expectations on job growth, home affordability and demand/supply ratio for multi-family housing, expectations concerning redevelopment activities, expectations on occupancy levels, expectations concerning the Texas joint venture, expectations that automation will help grow net operating income, expectations on post-renovated stabilized annual operating income, exceptions on annualized net operating income, and other risk factors discussed in documents filed by the Company with the Securities and Exchange Commission from time to time including the Company’s Annual Report on Form 10-K and the Company’s Quarterly Reports on Form 10-Q. All forward-looking statements in this press release are made as of today, based upon information known to management as of the date hereof. The Company assumes no obligation to update or revise any of its forward-looking statements even if experience or future changes show that indicated results or events will not be realized. |
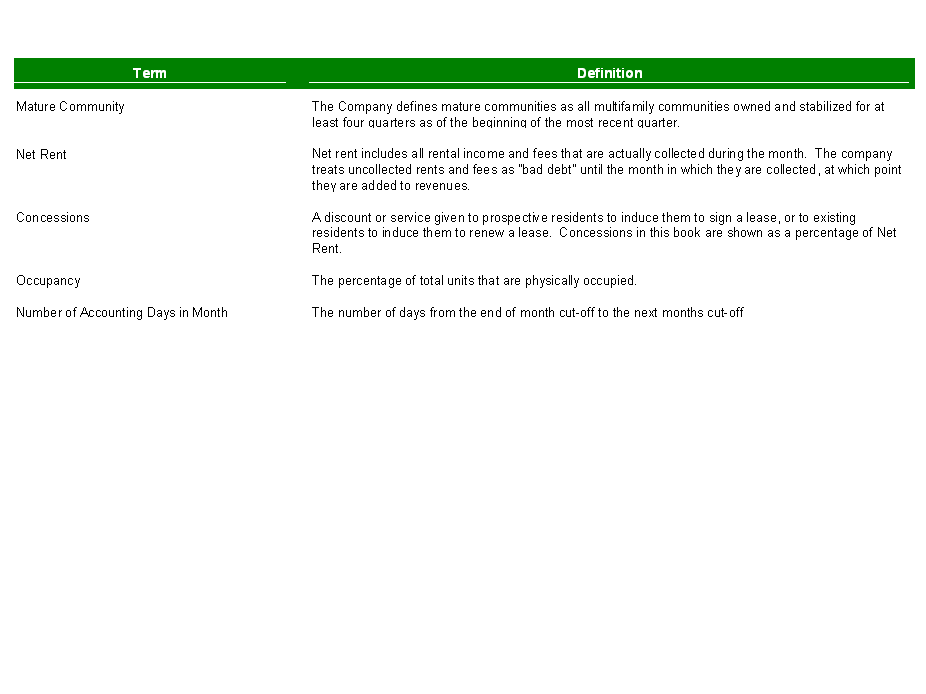
| Term Definition Mature Community The Company defines mature communities as all multifamily communities owned and stabilized for at least four quarters as of the beginning of the most recent quarter. Net Rent Net rent includes all rental income and fees that are actually collected during the month. The company treats uncollected rents and fees as “bad debt” until the month in which they are collected, at which point they are added to revenues. Concessions A discount or service given to prospective residents to induce them to sign a lease, or to existing residents to induce them to renew a lease. Concessions in this book are shown as a percentage of Net Rent. Occupancy The percentage of total units that are physically occupied. Number of Accounting Days in Month The number of days from the end of month cut-off to the next months cut-off |
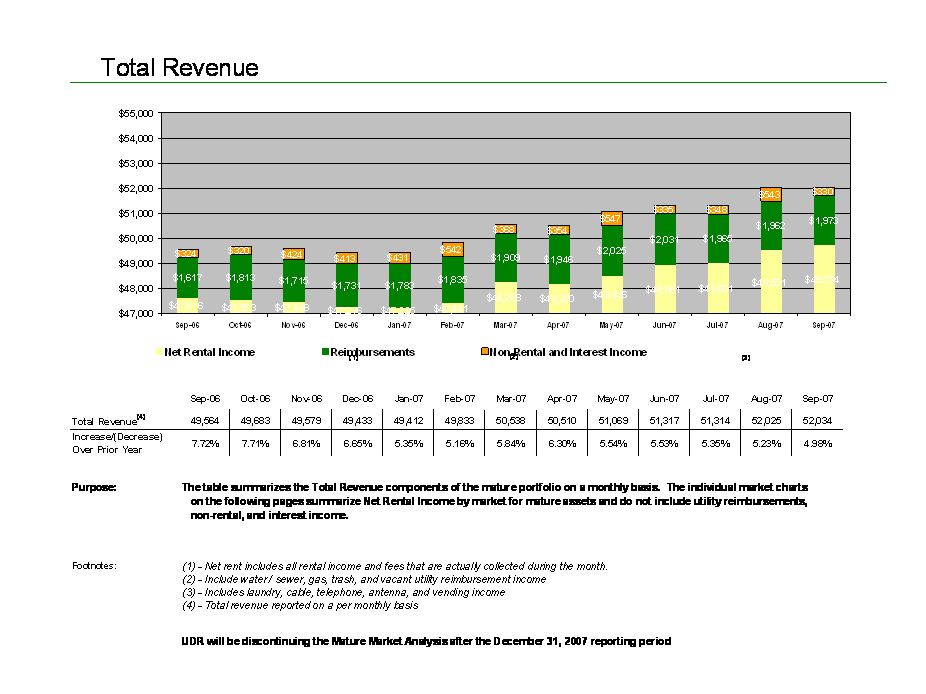
| Total Revenue $55,000 $54,000 $53,000 $52,000 $51,000 $50,000 $49,000 $48,000 $47,000 $324 $320 $424 $413 $542 $368 $354 $368 $547 $335 $348 $543 $330 $1,617 $1,813 $1,715 $1,731 $1,783 $1,835 $1,909 $1,946 $2,025 $2,031 $1,965 $1,962 $1,973 $47,616 $47,533 $47,448 $47,276 $47,225 $47,441 $48,268 $48,200 $48,496 $48,951 $49,001 $49,521 $49,734 Net Rental Income Reimbursements Non-Rental and Interest Income Sep-06 Oct-06 Nov-06 Dec-06 Jan-07 Feb-07 Mar-07 Apr-07 May-07 Jun-07 Jul-07 Aug-07 Sep-07 Total Revenue (4) 49,564 49,683 49,579 49,433 49,412 49,833 50,538 50,510 51,069 51,317 51,314 52,025 52,034 Increase/(Decrease) Over Prior Year 7.72% 7.71% 6.81% 6.65% 5.35% 5.16% 5.84% 6.30% 5.54% 5.53% 5.35% 5.23% 4.98% Purpose: The table summarizes the Total Revenue components of the mature portfolio on a monthly basis. The individual market charts on the following pages summarize Net Rental Income by market for mature assets and do not include utility reimbursements, non-rental, and interest income. Footnotes: (1) — Net rent includes all rental income and fees that are actually collected during the month. (2) — Include water / sewer, gas, trash, and vacant utility reimbursement income (3) — Includes laundry, cable, telephone, antenna, and vending income (4) — Total revenue reported on a per monthly basis UDR will be discontinuing the Mature Market Analysis after the December 31, 2007 reporting period |

| Rental Income and Fees by Market UDR Rental Income and Fees by Market Mature Communities Net Rent Units Sep-06 Oct-06 Nov-06 - - Austin TX 792 $ 531,527.88 $ 521,428.77 $ 525,524.78 Baltimore 1819 $ 1,804,587.17 $ 1,783,524.80 $ 1,791,991.60 Charlotte NC 1226 $ 852,171.63 $ 858,166.41 $ 862,068.62 Columbus OH 2530 $ 1,655,380.23 $ 1,663,623.05 $ 1,656,918.26 Ft Worth TX 1428 $ 847,050.65 $ 839,293.64 $ 824,764.97 Houston TX 4263 $ 2,525,458.79 $ 2,504,647.61 $ 2,478,493.99 Inland Empire 660 $ 634,651.65 $ 633,064.43 $ 604,093.31 Jacksonville FL 1557 $ 1,215,793.19 $ 1,190,809.01 $ 1,173,533.51 LA County 1052 $ 1,385,011.93 $ 1,410,833.37 $ 1,413,622.15 Metro DC 2097 $ 2,401,636.59 $ 2,403,239.69 $ 2,405,412.25 Monterey (Salinas) 1565 $ 1,348,116.69 $ 1,373,244.31 $ 1,349,378.99 Nashville TN 2580 $ 1,827,738.43 $ 1,829,911.74 $ 1,822,465.82 Norfolk Va Beach NN 1438 $ 1,216,343.69 $ 1,188,678.30 $ 1,204,459.07 Orange County 4067 $ 5,418,333.67 $ 5,497,957.41 $ 5,517,819.50 Orlando 2820 $ 2,407,947.04 $ 2,404,458.82 $ 2,391,723.30 Other Florida 2192 $ 1,839,946.09 $ 1,832,878.89 $ 1,831,953.38 Other MidAtlantic 2817 $ 2,238,640.23 $ 2,262,866.61 $ 2,247,089.18 Other Midwestern 444 $ 296,797.47 $ 290,194.06 $ 296,188.47 Other Southeastern 1752 $ 1,056,989.35 $ 1,029,503.17 $ 1,038,719.40 Other Southwestern 1816 $ 1,152,171.17 $ 1,155,678.36 $ 1,174,945.35 Phoenix, AZ 914 $ 795,311.80 $ 786,602.56 $ 781,218.82 Portland, OR 1365 $ 949,880.18 $ 928,188.99 $ 919,577.63 Raleigh Durham 3463 $ 2,204,294.83 $ 2,196,332.89 $ 2,200,136.65 Richmond Petersburg 1807 $ 1,494,940.53 $ 1,446,643.11 $ 1,461,369.14 Sacramento 914 $ 679,303.33 $ 718,178.13 $ 699,824.17 San Diego County 1123 $ 1,289,270.32 $ 1,292,224.82 $ 1,312,641.51 Seattle,WA 1199 $ 1,136,079.83 $ 1,111,656.84 $ 1,115,407.12 SF Bay Area 1775 $ 2,600,068.55 $ 2,596,356.06 $ 2,624,385.58 Tampa FL 2873 $ 2,486,798.95 $ 2,454,342.01 $ 2,407,568.89 Wilmington NC 1868 $ 1,323,463.64 $ 1,328,235.15 $ 1,314,559.05 Total 56216 $47,615,705.51 $47,532,762.99 $47,447,854.45 |
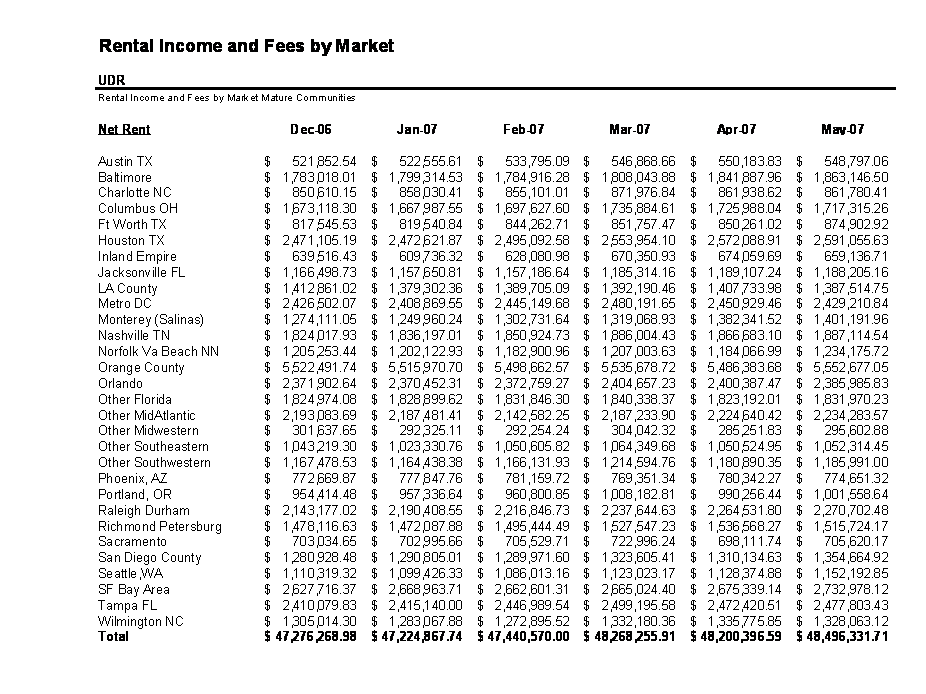
| Rental Income and Fees by Market UDR Rental Income and Fees by Market Mature Communities Net Rent Dec-06 Jan-07 Feb-07 Mar-07 Apr-07 May-07 - - Austin TX $ 521,852.54 $ 522,555.61 $ 533,795.09 $ 546,868.66 $ 550,183.83 $ 548,797.06 Baltimore $ 1,783,018.01 $ 1,799,314.53 $ 1,784,916.28 $ 1,808,043.88 $ 1,841,887.96 $ 1,863,146.50 Charlotte NC $ 850,610.15 $ 858,030.41 $ 855,101.01 $ 871,976.84 $ 861,938.62 $ 861,780.41 Columbus OH $ 1,673,118.30 $ 1,667,987.55 $ 1,697,627.60 $ 1,735,884.61 $ 1,725,988.04 $ 1,717,315.26 Ft Worth TX $ 817,545.53 $ 819,540.84 $ 844,262.71 $ 851,757.47 $ 850,261.02 $ 874,902.92 Houston TX $ 2,471,105.19 $ 2,472,621.87 $ 2,495,092.58 $ 2,553,954.10 $ 2,572,088.91 $ 2,591,055.63 Inland Empire $ 639,516.43 $ 609,736.32 $ 628,080.98 $ 670,350.93 $ 674,059.69 $ 659,136.71 Jacksonville FL $ 1,166,498.73 $ 1,157,650.81 $ 1,157,186.64 $ 1,185,314.16 $ 1,189,107.24 $ 1,188,205.16 LA County $ 1,412,861.02 $ 1,379,302.36 $ 1,389,705.09 $ 1,392,190.46 $ 1,407,733.98 $ 1,387,514.75 Metro DC $ 2,426,502.07 $ 2,408,869.55 $ 2,445,149.68 $ 2,480,191.65 $ 2,450,929.46 $ 2,429,210.84 Monterey (Salinas) $ 1,274,111.05 $ 1,249,960.24 $ 1,302,731.64 $ 1,319,068.93 $ 1,382,341.52 $ 1,401,191.96 Nashville TN $ 1,824,017.93 $ 1,836,197.01 $ 1,850,924.73 $ 1,886,004.43 $ 1,866,683.10 $ 1,887,114.54 Norfolk Va Beach NN $ 1,205,253.44 $ 1,202,122.93 $ 1,182,900.96 $ 1,207,003.63 $ 1,184,066.99 $ 1,234,175.72 Orange County $ 5,522,491.74 $ 5,515,970.70 $ 5,498,662.57 $ 5,535,678.72 $ 5,486,383.68 $ 5,552,677.05 Orlando $ 2,371,902.64 $ 2,370,452.31 $ 2,372,759.27 $ 2,404,657.23 $ 2,400,387.47 $ 2,385,985.83 Other Florida $ 1,824,974.08 $ 1,828,899.62 $ 1,831,846.30 $ 1,840,338.37 $ 1,823,192.01 $ 1,831,970.23 Other MidAtlantic $ 2,193,083.69 $ 2,187,481.41 $ 2,142,582.25 $ 2,187,233.90 $ 2,224,640.42 $ 2,234,283.57 Other Midwestern $ 301,637.65 $ 292,325.11 $ 292,254.24 $ 304,042.32 $ 285,251.83 $ 295,602.88 Other Southeastern $ 1,043,219.30 $ 1,023,330.76 $ 1,050,605.82 $ 1,064,349.68 $ 1,050,524.95 $ 1,052,314.45 Other Southwestern $ 1,167,478.53 $ 1,164,438.38 $ 1,166,131.93 $ 1,214,594.76 $ 1,180,890.35 $ 1,185,991.00 Phoenix, AZ $ 772,669.87 $ 777,847.76 $ 781,159.72 $ 769,351.34 $ 780,342.27 $ 774,651.32 Portland, OR $ 954,414.48 $ 957,336.64 $ 960,800.85 $ 1,008,182.81 $ 990,256.44 $ 1,001,558.64 Raleigh Durham $ 2,143,177.02 $ 2,190,408.55 $ 2,216,846.73 $ 2,237,644.63 $ 2,264,531.80 $ 2,270,702.48 Richmond Petersburg $ 1,478,116.63 $ 1,472,087.88 $ 1,495,444.49 $ 1,527,547.23 $ 1,536,568.27 $ 1,515,724.17 Sacramento $ 703,034.65 $ 702,995.66 $ 705,529.71 $ 722,996.24 $ 698,111.74 $ 705,620.17 San Diego County $ 1,280,928.48 $ 1,290,805.01 $ 1,289,971.60 $ 1,323,605.41 $ 1,310,134.63 $ 1,354,664.92 Seattle,WA $ 1,110,319.32 $ 1,099,426.33 $ 1,086,013.16 $ 1,123,023.17 $ 1,128,374.88 $ 1,152,192.85 SF Bay Area $ 2,627,716.37 $ 2,668,963.71 $ 2,662,601.31 $ 2,665,024.40 $ 2,675,339.14 $ 2,732,978.12 Tampa FL $ 2,410,079.83 $ 2,415,140.00 $ 2,446,989.54 $ 2,499,195.58 $ 2,472,420.51 $ 2,477,803.43 Wilmington NC $ 1,305,014.30 $ 1,283,067.88 $ 1,272,895.52 $ 1,332,180.36 $ 1,335,775.85 $ 1,328,063.12 Total $47,276,268.98 $47,224,867.74 $47,440,570.00 $48,268,255.91 $48,200,396.59 $48,496,331.71 |
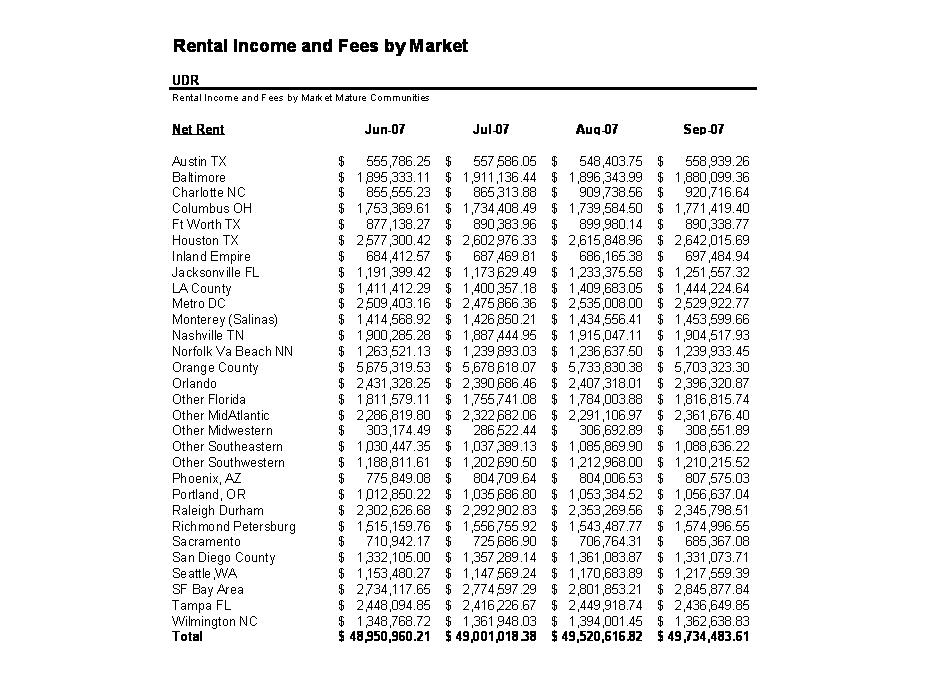
| Rental Income and Fees by Market UDR Rental Income and Fees by Market Mature Communities Net Rent Jun-07 Jul-07 Aug-07 Sep-07 - - Austin TX $ 555,786.25 $ 557,586.05 $ 548,403.75 $ 558,939.26 Baltimore $ 1,895,333.11 $ 1,911,136.44 $ 1,896,343.99 $ 1,880,099.36 Charlotte NC $ 855,555.23 $ 865,313.88 $ 909,738.56 $ 920,716.64 Columbus OH $ 1,753,369.61 $ 1,734,408.49 $ 1,739,584.50 $ 1,771,419.40 Ft Worth TX $ 877,138.27 $ 890,383.96 $ 899,980.14 $ 890,338.77 Houston TX $ 2,577,300.42 $ 2,602,976.33 $ 2,615,848.96 $ 2,642,015.69 Inland Empire $ 684,412.57 $ 687,469.81 $ 686,165.38 $ 697,484.94 Jacksonville FL $ 1,191,399.42 $ 1,173,629.49 $ 1,233,375.58 $ 1,251,557.32 LA County $ 1,411,412.29 $ 1,400,357.18 $ 1,409,683.05 $ 1,444,224.64 Metro DC $ 2,509,403.16 $ 2,475,866.36 $ 2,535,008.00 $ 2,529,922.77 Monterey (Salinas) $ 1,414,568.92 $ 1,426,850.21 $ 1,434,556.41 $ 1,453,599.66 Nashville TN $ 1,900,285.28 $ 1,887,444.95 $ 1,915,047.11 $ 1,904,517.93 Norfolk Va Beach NN $ 1,263,521.13 $ 1,239,893.03 $ 1,236,637.50 $ 1,239,933.45 Orange County $ 5,675,319.53 $ 5,678,618.07 $ 5,733,830.38 $ 5,703,323.30 Orlando $ 2,431,328.25 $ 2,390,686.46 $ 2,407,318.01 $ 2,396,320.87 Other Florida $ 1,811,579.11 $ 1,755,741.08 $ 1,784,003.88 $ 1,816,815.74 Other MidAtlantic $ 2,286,819.80 $ 2,322,682.06 $ 2,291,106.97 $ 2,361,676.40 Other Midwestern $ 303,174.49 $ 286,522.44 $ 306,692.89 $ 308,551.89 Other Southeastern $ 1,030,447.35 $ 1,037,389.13 $ 1,085,869.90 $ 1,088,636.22 Other Southwestern $ 1,188,811.61 $ 1,202,690.50 $ 1,212,968.00 $ 1,210,215.52 Phoenix, AZ $ 775,849.08 $ 804,709.64 $ 804,006.53 $ 807,575.03 Portland, OR $ 1,012,850.22 $ 1,035,686.80 $ 1,053,384.52 $ 1,056,637.04 Raleigh Durham $ 2,302,626.68 $ 2,292,902.83 $ 2,353,269.56 $ 2,345,798.51 Richmond Petersburg $ 1,515,159.76 $ 1,556,755.92 $ 1,543,487.77 $ 1,574,996.55 Sacramento $ 710,942.17 $ 725,686.90 $ 706,764.31 $ 685,367.08 San Diego County $ 1,332,105.00 $ 1,357,289.14 $ 1,361,083.87 $ 1,331,073.71 Seattle,WA $ 1,153,480.27 $ 1,147,569.24 $ 1,170,683.89 $ 1,217,559.39 SF Bay Area $ 2,734,117.65 $ 2,774,597.29 $ 2,801,853.21 $ 2,845,877.84 Tampa FL $ 2,448,094.85 $ 2,416,226.67 $ 2,449,918.74 $ 2,436,649.85 Wilmington NC $ 1,348,768.72 $ 1,361,948.03 $ 1,394,001.45 $ 1,362,638.83 Total $48,950,960.21 $49,001,018.38 $49,520,616.82 $49,734,483.61 |
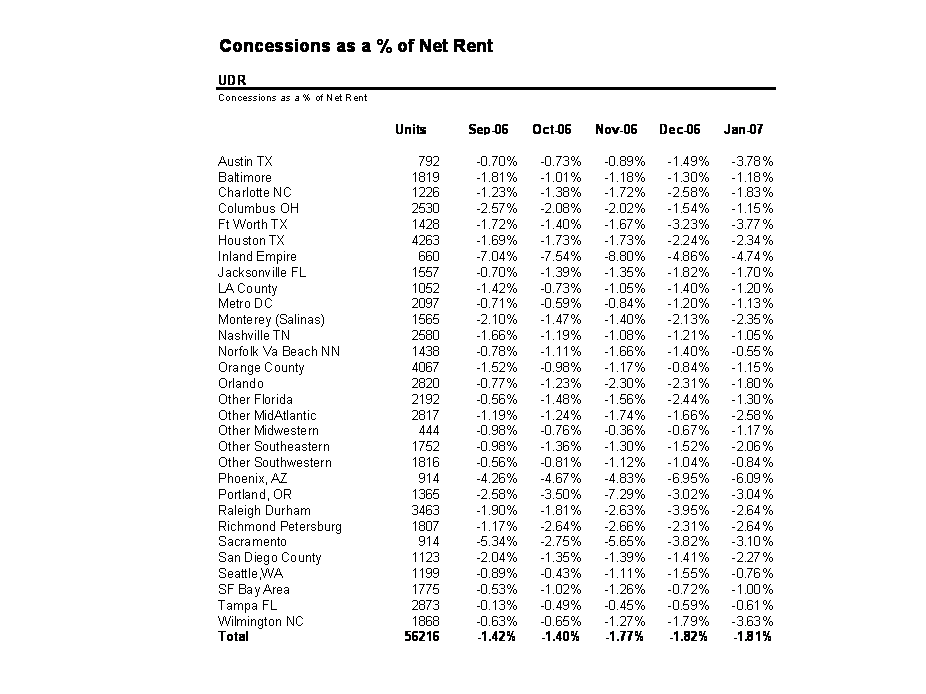
| Concessions as a % of Net Rent UDR Concessions as a % of Net RentUnits Sep-06 Oct-06 Nov-06 Dec-06 Jan-07 Austin TX 792 -0.70% -0.73% -0.89% -1.49% -3.78% Baltimore 1819 -1.81% -1.01% -1.18% -1.30% -1.18% Charlotte NC 1226 -1.23% -1.38% -1.72% -2.58% -1.83% Columbus OH 2530 -2.57% -2.08% -2.02% -1.54% -1.15% Ft Worth TX 1428 -1.72% -1.40% -1.67% -3.23% -3.77% Houston TX 4263 -1.69% -1.73% -1.73% -2.24% -2.34% Inland Empire 660 -7.04% -7.54% -8.80% -4.86% -4.74% Jacksonville FL 1557 -0.70% -1.39% -1.35% -1.82% -1.70% LA County 1052 -1.42% -0.73% -1.05% -1.40% -1.20% Metro DC 2097 -0.71% -0.59% -0.84% -1.20% -1.13% Monterey (Salinas) 1565 -2.10% -1.47% -1.40% -2.13% -2.35% Nashville TN 2580 -1.66% -1.19% -1.08% -1.21% -1.05% Norfolk Va Beach NN 1438 -0.78% -1.11% -1.66% -1.40% -0.55% Orange County 4067 -1.52% -0.98% -1.17% -0.84% -1.15% Orlando 2820 -0.77% -1.23% -2.30% -2.31% -1.80% Other Florida 2192 -0.56% -1.48% -1.56% -2.44% -1.30% Other MidAtlantic 2817 -1.19% -1.24% -1.74% -1.66% -2.58% Other Midwestern 444 -0.98% -0.76% -0.36% -0.67% -1.17% Other Southeastern 1752 -0.98% -1.36% -1.30% -1.52% -2.06% Other Southwestern 1816 -0.56% -0.81% -1.12% -1.04% -0.84% Phoenix, AZ 914 -4.26% -4.67% -4.83% -6.95% -6.09% Portland, OR 1365 -2.58% -3.50% -7.29% -3.02% -3.04% Raleigh Durham 3463 -1.90% -1.81% -2.63% -3.95% -2.64% Richmond Petersburg 1807 -1.17% -2.64% -2.66% -2.31% -2.64% Sacramento 914 -5.34% -2.75% -5.65% -3.82% -3.10% San Diego County 1123 -2.04% -1.35% -1.39% -1.41% -2.27% Seattle,WA 1199 -0.89% -0.43% -1.11% -1.55% -0.76% SF Bay Area 1775 -0.53% -1.02% -1.26% -0.72% -1.00% Tampa FL 2873 -0.13% -0.49% -0.45% -0.59% -0.61% Wilmington NC 1868 -0.63% -0.65% -1.27% -1.79% -3.63%Total 56216 -1.42% -1.40% -1.77% -1.82% -1.81% |
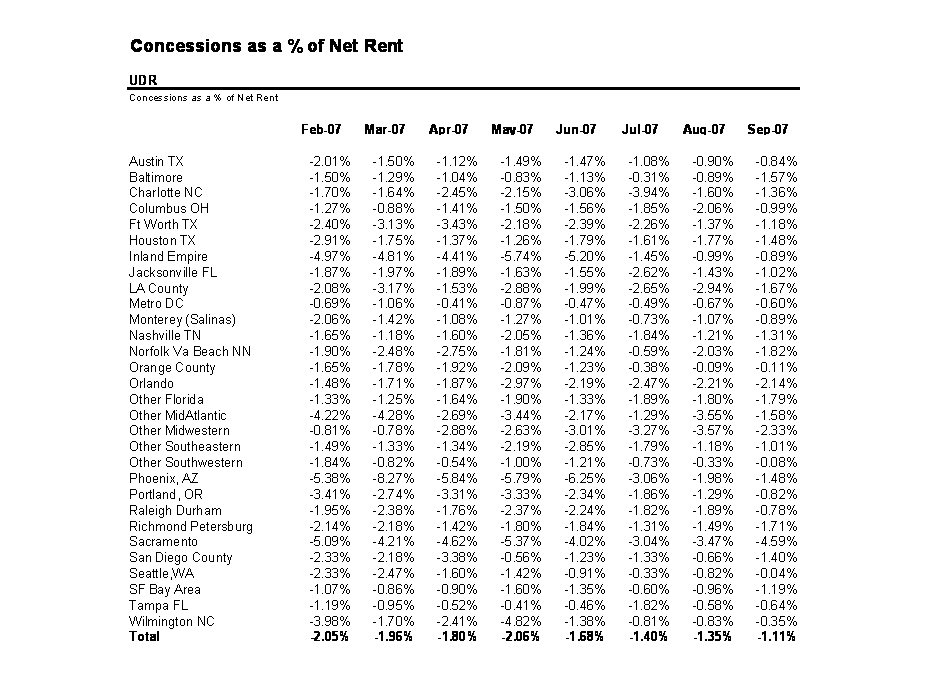
| Concessions as a % of Net Rent UDR Concessions as a % of Net Rent Feb-07 Mar-07 Apr-07 May-07 Jun-07 Jul-07 Aug-07 Sep-07 Austin TX -2.01% -1.50% -1.12% -1.49% -1.47% -1.08% -0.90% -0.84% Baltimore -1.50% -1.29% -1.04% -0.83% -1.13% -0.31% -0.89% -1.57% Charlotte NC -1.70% -1.64% -2.45% -2.15% -3.06% -3.94% -1.60% -1.36% Columbus OH -1.27% -0.88% -1.41% -1.50% -1.56% -1.85% -2.06% -0.99% Ft Worth TX -2.40% -3.13% -3.43% -2.18% -2.39% -2.26% -1.37% -1.18% Houston TX -2.91% -1.75% -1.37% -1.26% -1.79% -1.61% -1.77% -1.48% Inland Empire -4.97% -4.81% -4.41% -5.74% -5.20% -1.45% -0.99% -0.89% Jacksonville FL -1.87% -1.97% -1.89% -1.63% -1.55% -2.62% -1.43% -1.02% LA County -2.08% -3.17% -1.53% -2.88% -1.99% -2.65% -2.94% -1.67% Metro DC -0.69% -1.06% -0.41% -0.87% -0.47% -0.49% -0.67% -0.60% Monterey (Salinas) -2.06% -1.42% -1.08% -1.27% -1.01% -0.73% -1.07% -0.89% Nashville TN -1.65% -1.18% -1.60% -2.05% -1.36% -1.84% -1.21% -1.31% Norfolk Va Beach NN -1.90% -2.48% -2.75% -1.81% -1.24% -0.59% -2.03% -1.82% Orange County -1.65% -1.78% -1.92% -2.09% -1.23% -0.38% -0.09% -0.11% Orlando -1.48% -1.71% -1.87% -2.97% -2.19% -2.47% -2.21% -2.14% Other Florida -1.33% -1.25% -1.64% -1.90% -1.33% -1.89% -1.80% -1.79% Other MidAtlantic -4.22% -4.28% -2.69% -3.44% -2.17% -1.29% -3.55% -1.58% Other Midwestern -0.81% -0.78% -2.88% -2.63% -3.01% -3.27% -3.57% -2.33% Other Southeastern -1.49% -1.33% -1.34% -2.19% -2.85% -1.79% -1.18% -1.01% Other Southwestern -1.84% -0.82% -0.54% -1.00% -1.21% -0.73% -0.33% -0.08% Phoenix, AZ -5.38% -8.27% -5.84% -5.79% -6.25% -3.06% -1.98% -1.48% Portland, OR -3.41% -2.74% -3.31% -3.33% -2.34% -1.86% -1.29% -0.82% Raleigh Durham -1.95% -2.38% -1.76% -2.37% -2.24% -1.82% -1.89% -0.78% Richmond Petersburg -2.14% -2.18% -1.42% -1.80% -1.84% -1.31% -1.49% -1.71% Sacramento -5.09% -4.21% -4.62% -5.37% -4.02% -3.04% -3.47% -4.59% San Diego County -2.33% -2.18% -3.38% -0.56% -1.23% -1.33% -0.66% -1.40% Seattle,WA -2.33% -2.47% -1.60% -1.42% -0.91% -0.33% -0.82% -0.04% SF Bay Area -1.07% -0.86% -0.90% -1.60% -1.35% -0.60% -0.96% -1.19% Tampa FL -1.19% -0.95% -0.52% -0.41% -0.46% -1.82% -0.58% -0.64% Wilmington NC -3.98% -1.70% -2.41% -4.82% -1.38% -0.81% -0.83% -0.35%Total -2.05% -1.96% -1.80% -2.06% -1.68% -1.40% -1.35% -1.11% |
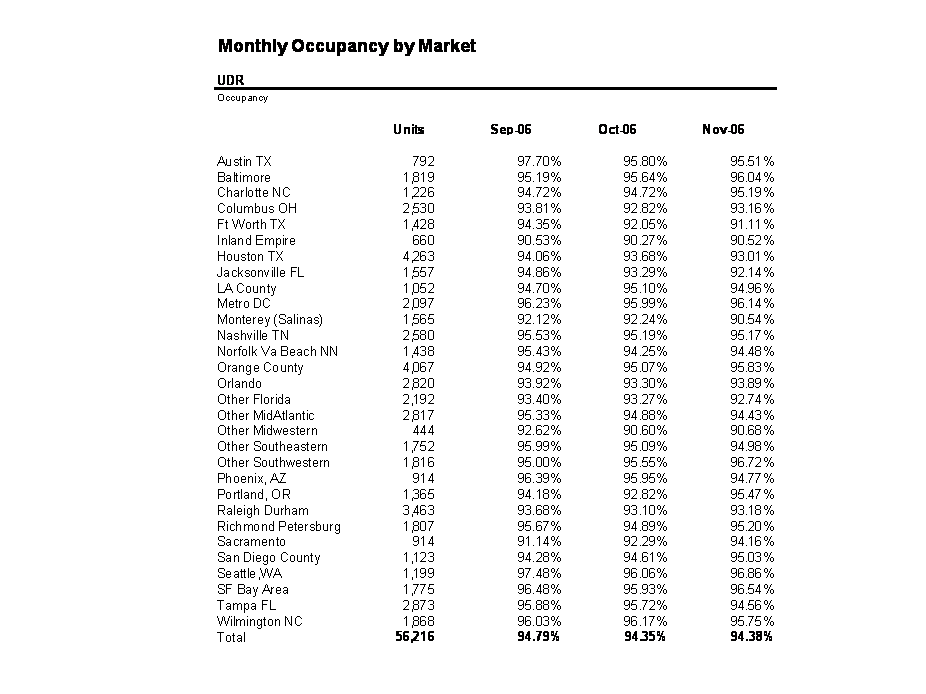
| Monthly Occupancy by Market UDR Occupancy Units Sep-06 Oct-06 Nov-06 Austin TX 792 97.70% 95.80% 95.51% Baltimore 1,819 95.19% 95.64% 96.04% Charlotte NC 1,226 94.72% 94.72% 95.19% Columbus OH 2,530 93.81% 92.82% 93.16% Ft Worth TX 1,428 94.35% 92.05% 91.11% Inland Empire 660 90.53% 90.27% 90.52% Houston TX 4,263 94.06% 93.68% 93.01% Jacksonville FL 1,557 94.86% 93.29% 92.14% LA County 1,052 94.70% 95.10% 94.96% Metro DC 2,097 96.23% 95.99% 96.14% Monterey (Salinas) 1,565 92.12% 92.24% 90.54% Nashville TN 2,580 95.53% 95.19% 95.17% Norfolk Va Beach NN 1,438 95.43% 94.25% 94.48% Orange County 4,067 94.92% 95.07% 95.83% Orlando 2,820 93.92% 93.30% 93.89% Other Florida 2,192 93.40% 93.27% 92.74% Other MidAtlantic 2,817 95.33% 94.88% 94.43% Other Midwestern 444 92.62% 90.60% 90.68% Other Southeastern 1,752 95.99% 95.09% 94.98% Other Southwestern 1,816 95.00% 95.55% 96.72% Phoenix, AZ 914 96.39% 95.95% 94.77% Portland, OR 1,365 94.18% 92.82% 95.47% Raleigh Durham 3,463 93.68% 93.10% 93.18% Richmond Petersburg 1,807 95.67% 94.89% 95.20% Sacramento 914 91.14% 92.29% 94.16% San Diego County 1,123 94.28% 94.61% 95.03% Seattle,WA 1,199 97.48% 96.06% 96.86% SF Bay Area 1,775 96.48% 95.93% 96.54% Tampa FL 2,873 95.88% 95.72% 94.56% Wilmington NC 1,868 96.03% 96.17% 95.75% Total56,216 94.79% 94.35% 94.38% |
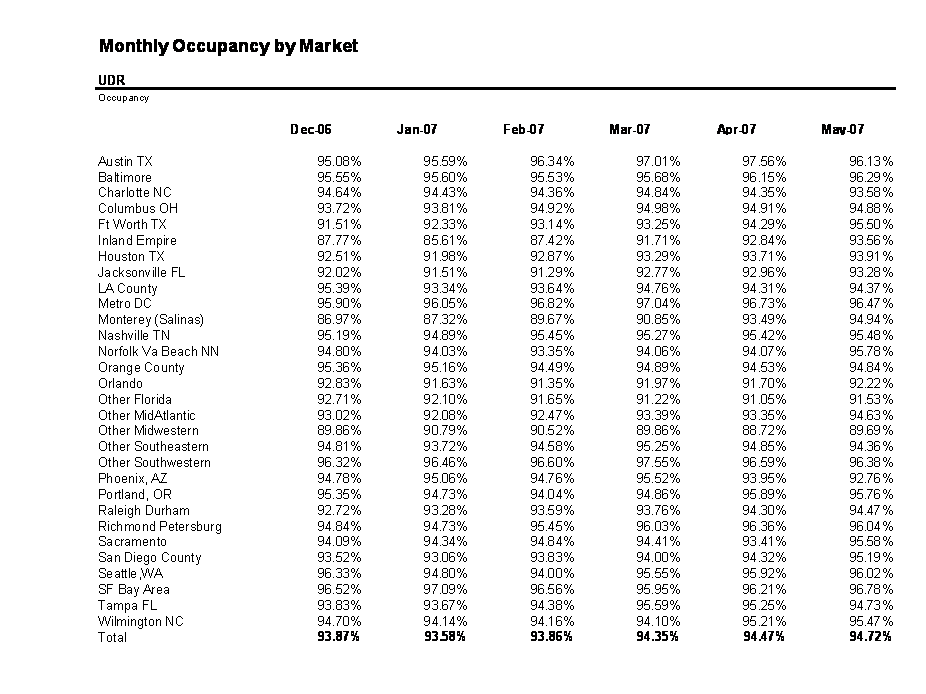
| Monthly Occupancy by Market UDR Occupancy Dec-06 Jan-07 Feb-07 Mar-07 Apr-07 May-07 Austin TX 95.08% 95.59% 96.34% 97.01% 97.56% 96.13% Baltimore 95.55% 95.60% 95.53% 95.68% 96.15% 96.29% Charlotte NC 94.64% 94.43% 94.36% 94.84% 94.35% 93.58% Columbus OH 93.72% 93.81% 94.92% 94.98% 94.91% 94.88% Ft Worth TX 91.51% 92.33% 93.14% 93.25% 94.29% 95.50% Inland Empire 87.77% 85.61% 87.42% 91.71% 92.84% 93.56% Houston TX 92.51% 91.98% 92.87% 93.29% 93.71% 93.91% Jacksonville FL 92.02% 91.51% 91.29% 92.77% 92.96% 93.28% LA County 95.39% 93.34% 93.64% 94.76% 94.31% 94.37% Metro DC 95.90% 96.05% 96.82% 97.04% 96.73% 96.47% Monterey (Salinas) 86.97% 87.32% 89.67% 90.85% 93.49% 94.94% Nashville TN 95.19% 94.89% 95.45% 95.27% 95.42% 95.48% Norfolk Va Beach NN 94.80% 94.03% 93.35% 94.06% 94.07% 95.78% Orange County 95.36% 95.16% 94.49% 94.89% 94.53% 94.84% Orlando 92.83% 91.63% 91.35% 91.97% 91.70% 92.22% Other Florida 92.71% 92.10% 91.65% 91.22% 91.05% 91.53% Other MidAtlantic 93.02% 92.08% 92.47% 93.39% 93.35% 94.63% Other Midwestern 89.86% 90.79% 90.52% 89.86% 88.72% 89.69% Other Southeastern 94.81% 93.72% 94.58% 95.25% 94.85% 94.36% Other Southwestern 96.32% 96.46% 96.60% 97.55% 96.59% 96.38% Phoenix, AZ 94.78% 95.06% 94.76% 95.52% 93.95% 92.76% Portland, OR 95.35% 94.73% 94.04% 94.86% 95.89% 95.76% Raleigh Durham 92.72% 93.28% 93.59% 93.76% 94.30% 94.47% Richmond Petersburg 94.84% 94.73% 95.45% 96.03% 96.36% 96.04% Sacramento 94.09% 94.34% 94.84% 94.41% 93.41% 95.58% San Diego County 93.52% 93.06% 93.83% 94.00% 94.32% 95.19% Seattle,WA 96.33% 94.80% 94.00% 95.55% 95.92% 96.02% SF Bay Area 96.52% 97.09% 96.56% 95.95% 96.21% 96.78% Tampa FL 93.83% 93.67% 94.38% 95.59% 95.25% 94.73% Wilmington NC 94.70% 94.14% 94.16% 94.10% 95.21% 95.47% Total93.87% 93.58% 93.86% 94.35% 94.47% 94.72% |
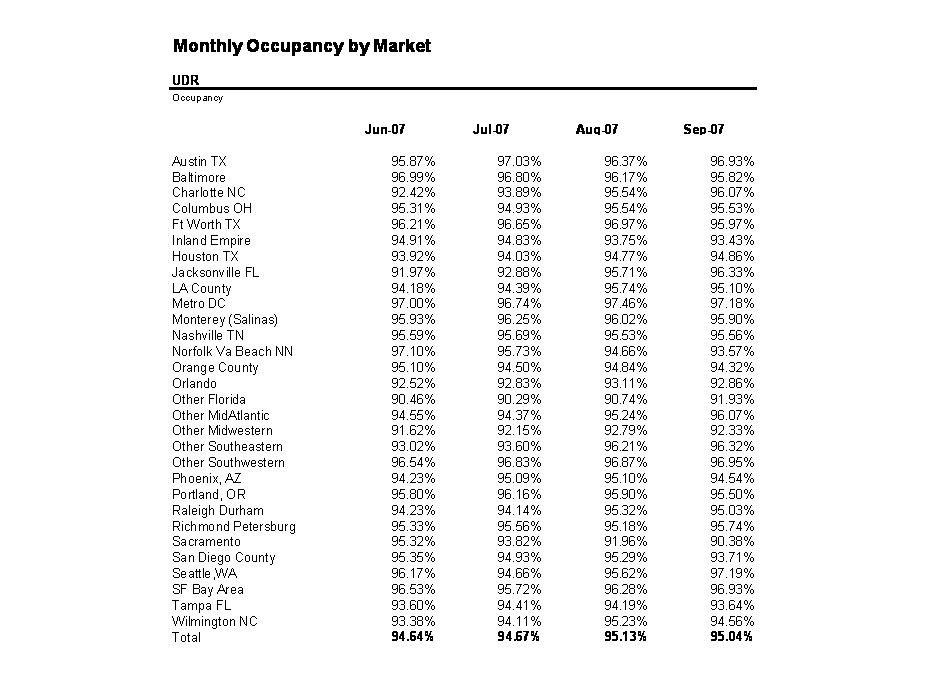
| Monthly Occupancy by Market UDR Occupancy Jun-07 Jul-07 Aug-07 Sep-07 Austin TX 95.87% 97.03% 96.37% 96.93% Baltimore 96.99% 96.80% 96.17% 95.82% Charlotte NC 92.42% 93.89% 95.54% 96.07% Columbus OH 95.31% 94.93% 95.54% 95.53% Ft Worth TX 96.21% 96.65% 96.97% 95.97% Inland Empire 94.91% 94.83% 93.75% 93.43% Houston TX 93.92% 94.03% 94.77% 94.86% Jacksonville FL 91.97% 92.88% 95.71% 96.33% LA County 94.18% 94.39% 95.74% 95.10% Metro DC 97.00% 96.74% 97.46% 97.18% Monterey (Salinas) 95.93% 96.25% 96.02% 95.90% Nashville TN 95.59% 95.69% 95.53% 95.56% Norfolk Va Beach NN 97.10% 95.73% 94.66% 93.57% Orange County 95.10% 94.50% 94.84% 94.32% Orlando 92.52% 92.83% 93.11% 92.86% Other Florida 90.46% 90.29% 90.74% 91.93% Other MidAtlantic 94.55% 94.37% 95.24% 96.07% Other Midwestern 91.62% 92.15% 92.79% 92.33% Other Southeastern 93.02% 93.60% 96.21% 96.32% Other Southwestern 96.54% 96.83% 96.87% 96.95% Phoenix, AZ 94.23% 95.09% 95.10% 94.54% Portland, OR 95.80% 96.16% 95.90% 95.50% Raleigh Durham 94.23% 94.14% 95.32% 95.03% Richmond Petersburg 95.33% 95.56% 95.18% 95.74% Sacramento 95.32% 93.82% 91.96% 90.38% San Diego County 95.35% 94.93% 95.29% 93.71% Seattle,WA 96.17% 94.66% 95.62% 97.19% SF Bay Area 96.53% 95.72% 96.28% 96.93% Tampa FL 93.60% 94.41% 94.19% 93.64% Wilmington NC 93.38% 94.11% 95.23% 94.56% Total94.64% 94.67% 95.13% 95.04% |