Elements Too - Bellevue, WA UDR, Inc. (NYSE: UDR), has a demonstrated history of successfully managing, buying, selling, developing, and redeveloping attractive real estate properties in primarily coastal, core U.S. markets S&P 400 Company $13 Billion Enterprise 23 Markets, 185 Communities, 52,949 Apartment Homes CFO: Tom Herzog 720.283.6139 Investor Relations: Chris Van Ens 720.348.7762 UDR, Inc. ? 1745 Shea Center Drive, Suite 200 ? Highlands Ranch, CO 80129 ? www.UDR.com February 2014 Exhibit 99.3 |
TOPIC PAGE Strategic Priorities 3 Review of 2013 - Results versus Plan 4 Capital Allocation / Portfolio Improvement 5 Operational Excellence 8 Cash Flow, Dividend and NAV per Share Growth 9 Balance Sheet Management 10 2014-2016 Expectations 11 2014 Market Growth Expectations 13 Comparison of Updated 2014-2016 Strategic Plan to Initial 2013-2015 Strategic Plan 14 Definitions and Reconciliations 15 Table of Contents 2 Channel @ Mission Bay - San Francisco, CA Development - Lease Up |
Drives Value Creation and Total Shareholder Return 1 2 4 Strategic Priorities Our Strategic Priorities remain unchanged and we are highly focused on their continued execution Capital Allocation / portfolio improvement Disciplined allocation of capital to growth opportunities that are accretive to NAV and cash flow per share Development represents a strong use of capital Strengthen market mix and physical quality of portfolio Operational Excellence Continued enhancements to our best-in-class operating platform Boost margins through top-line growth, improving efficiencies and investments in technology Ensure resident and associate satisfaction Balance sheet management Maintain a strong and flexible balance sheet Continue to deleverage and improve balance sheet metrics 3 Cash flow, dividend and nav per share growth Generate high-quality cash flow, dividend and NAV per share growth Drive strong CVNI growth (NAV + dividend growth) which is highly correlated with Total Shareholder Returns 3 |
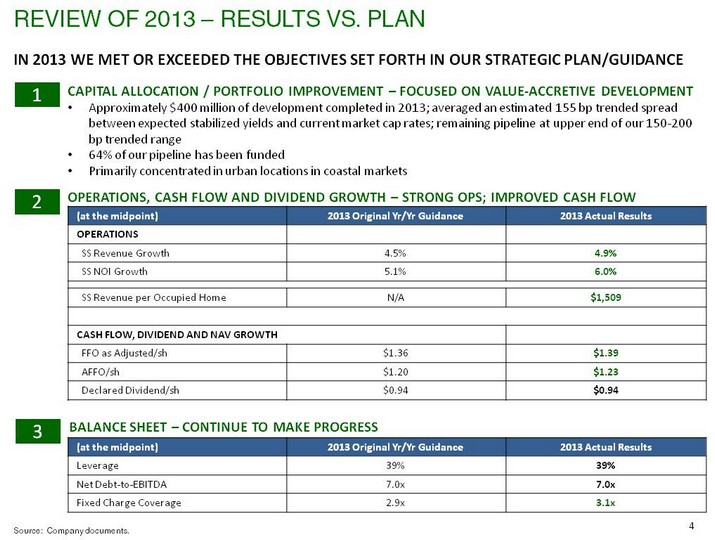
OPERATIONS, CASH FLOW AND DIVIDEND GROWTH - STRONG OPS; IMPROVED CASH FLOW 2 Review of 2013 - Results vs. plan (at the midpoint) 2013 Original Yr/Yr Guidance 2013 Actual Results OPERATIONS SS Revenue Growth 4.5% 4.9% SS NOI Growth 5.1% 6.0% SS Revenue per Occupied Home N/A $1,509 CASH FLOW, DIVIDEND AND NAV GROWTH CASH FLOW, DIVIDEND AND NAV GROWTH FFO as Adjusted/sh $1.36 $1.39 AFFO/sh $1.20 $1.23 Declared Dividend/sh $0.94 $0.94 BALANCE SHEET - CONTINUE TO MAKE PROGRESS 3 (at the midpoint) 2013 Original Yr/Yr Guidance 2013 Actual Results Leverage 39% 39% Net Debt-to-EBITDA 7.0x 7.0x Fixed Charge Coverage 2.9x 3.1x In 2013 we met or exceeded the objectives set forth in our Strategic Plan/Guidance CAPITAL ALLOCATION / PORTFOLIO IMPROVEMENT - FOCUSED ON VALUE-ACCRETIVE DEVELOPMENT Approximately $400 million of development completed in 2013; averaged an estimated 155 bp trended spread between expected stabilized yields and current market cap rates; remaining pipeline at upper end of our 150-200 bp trended range 64% of our pipeline has been funded Primarily concentrated in urban locations in coastal markets 1 Source: Company documents. 4 |
As of December 31, 2013. Dollar amounts presented at UDR's ownership interest. UDR has the option to purchase the property upon completion of construction and we receive 50% of the upside upon acquisition of the asset or sale to a third party. Note: Redevelopment spend necessary to finish current projects is insignificant at approximately $40 million. Source: Company documents. 5 Development represents An AFFO and NAV ACCRETIVE use of capital Capital Allocation / Portfolio Improvement Development Pipeline statistics (1) Size: 3,552 homes at 100% Cost: $1.2 billion, $407K per home at 100% Spent to date: $800 million (~64% of total cost) Size of development pipeline limited by: Funding/Balance Sheet risk: Max size of 10% of enterprise value mitigates balance sheet stress. 64% of pipeline has been funded Earnings drag: Significant expansion or contraction of a development pipeline can contribute to earnings volatility Completion of remaining underway development: 2014: $480 million 2015: $326 million 2016: $162 million We own land for future development projects in: Los Angeles, Boston, Addison, TX, Seattle, San Francisco Bay Area, Orange County Development pipeline ($M) (2) Development: Weighted average trended spread between stabilized yields and market cap rates is 150-200 bps Funded through sales of non- core assets and equity issuances, when we are trading at or above NAV Denver (3) 1 asset, $108 5 |
As of December 31, 2013. Excludes Pacific City land site in Huntington Beach, CA. Source: Company documents and forecasts. 6 Capital Allocation / Portfolio Improvement We have a $1.1 billion shadow development pipeline focused in our core markets Seattle: 1 land parcel San Francisco Area: 2 land parcels LA / OC: 7 land parcels Dallas: 1 land parcel Boston: 1 land parcel UDR Land Parcels: 4 total; 2 entitled Cost Basis: $56 million at 100% Potential Homes: 300 to 400 homes at 100% Potential Construction Cost: $150 to $200 million, ~$500K per home at 100% UDR/MetLife Joint Venture Land Parcels: 8 total; 5 entitled Cost Basis: $229 million at 100% UDR Cost Basis: $32 million Potential Homes: 3,000 to 4,000 homes at 100% Potential Construction Cost: $850 to $1,100 million, ~$275K per home at 100% Shadow Development Pipeline (1) 6 |
7 Capital Allocation / Portfolio Improvement development is expected to generate strong cash flow and nav growth TAKEAWAYS Development FFO/sh drag is expected to total $0.10 against accretion of $0.10 during the 2014 through 2016 time period Upon stabilization, our current $1.2 billion pipeline is expected to generate annual FFO/sh accretion of $0.06 From 2014 through 2016 we expect our pipeline to generate approximately $2.10 of NAV/sh accretion . Source: Company documents. (CHART) (CHART) 2013 2014 2015/2016 Avg. Stabilized Estimated drag and accretion from current pipeline 2014-2016 Estimated drag and accretion for udr's current $1.2 Billion development pipeline 7 Thereafter |
Top-notch operations drive property cash flow growth which supports ffo, dividend and nav per share growth over time Investments in technology and personnel will continue to drive efficiency and improve our resident's experiences Best-in-class operating platform Operational Excellence Our Operations stack up well over time versus peers Source: Company documents and forecasts and peer documents. (CHART) ...AND ARE EXPECTED TO REMAIN STRONG through 2016 (CHART) 3.50%-4.25% 8 |
Cash flow, dividend and nav growth After a decade of transforming the portfolio, our cash flow, NAV and CVNI growth are expected to be strong through 2016 Source: Company documents and forecasts. (CHART) (CHART) (CHART) Primary drivers of 2014 AFFO/sh growth at the midpoint include: Mature/Non-mature NOI 7.0% Dev./Redev. Earn-in 2.5% Change in Dev./Redev. Drag 1.0% 1031 Transactions (1.0%) Capex and Other (1.5%) Total 8.0% 2015 growth is expected to look similar to 2014 2016 growth, at this time, is expected to be affected by the timing of our development starts and higher interest rate assumptions Growth contemplated in a flat cap rate environment 9 |
METRIC YEAR-END 2013A YEAR-END 2014E YEAR-END 2016E Debt-to-assets 39% 38% to 40% 35% to 38% Net debt-to-EBITDA 7.0x 6.3x to 6.7x 5.6x to 6.2x Fixed Charge Coverage 3.1x 3.4x to 3.6x 3.6x to 3.8x Balance sheet management 3 Well-Laddered Maturity Schedule 4 Investment Grade Ratings S&P: BBB, stable outlook Moody's: Baa2, positive outlook Source: Company documents and forecasts. Primary Drivers of the EXPECTED Improvement in Balance Sheet Metrics Completion of in-process development projects Strong same-store and non-mature property operating growth Managing Business at investment grade (BBB+ / BAA1) metrics 10 |
Earnings and Operating Expectations $ IN MILLIONS, EXCEPT PER SHARE 2013A 2014E 2015E - 2016E CUMULATIVE EARNINGS FFO per Share $1.44 $1.47 to $1.53 10.0% to 14.0% FFO as Adjusted per Share $1.39 $1.47 to $1.53 10.0% to 15.0% AFFO per Share $1.23 $1.30 to $1.36 13.0% to 17.0% Wtd. Avg. Dil. Shares/Units (M) 263.9 265.7 N/A Annualized Declared Dividend per Share $0.94 $1.04 N/A SAME-STORE OPERATIONS (YR/YR) Revenue Growth 4.9% 3.50% to 4.25% 6.5% to 8.5% Expense Growth 2.6% 2.75% to 3.25% 5.5% to 7.5% NOI Growth 6.0% 3.75% to 5.00% 6.5% to 9.5% Physical Occupancy 96.0% 96.0% N/A OTHER ADDITIONS/(DEDUCTIONS) Interest ($126) ($132) to ($136) ($270) to ($290) G&A, gross ($42) ($43) to ($47) ($90) to ($100) Tax Benefit for RE3, net (1) $10 $6 to $8 $6 to $10 JV Fee Income, net $11 $11 to $13 $28 to $32 Total JV FFO (excluding fees) $27 $33 to $37 $80 to $90 RE3 Gain on Asset Sales $2.7 $1 to $6 $0 to $10 Acquisition-related Costs $0 ($1) to ($3) ($2) to ($4) Average # of Homes for Capital Expenditures 41,052 40,900 TBD Average Recurring Capital Expenditures/Home ($1,040) ($1,100) ($1,145) Average Revenue Enhancing Capital Expenditures/Home ($253) ($275) ($350) 2014 - 2016 expectations 11 Excludes $3.0 million in tax expense related to the sale of the Lodge at Stoughton community in 4Q13. |
Capital Markets, Transactional and Balance Sheet Expectations $ IN MILLIONS, EXCEPT PER SHARE 2013A 2014E 2015E - 2016E CUMULATIVE CAPITAL MARKETS ACTIVITY Debt Maturities (1) $160 $348 $800 New Debt Issuances (2) $300 $250 to $350 $650 to $850 Equity Issuances $0 $50 to $150 $500 to $700 TRANSACTIONAL ACTIVITY Acquisitions (3) $0 $200 to $300 $250 to $350 Dispositions (3) $307 $250 to $350 $400 to $600 Cap Rate Spread N/A (150) to (200) bps (75) To (125) bps Development Spending (4) $457 $425 to $475 $900 to $1,100 BALANCE SHEET METRICS YE 2013A YE 2014E 2016E Fixed Charge Coverage 3.1x 3.4x to 3.6x 3.6x to 3.8x Net Debt-to-EBITDA 7.0x 6.3x to 6.7x 5.6x to 6.2x Debt to Gross Asset Value 39% 38% to 40% 35% to 38% 2014 - 2016 expectations 12 Maturing debt interest rates, including extensions, are 5.3%, 5.3% and 4.8% in 2014, 2015 and 2016, respectively. New debt issuance interest rates are assumed at 5.0%, 5.5% and 6.0% in 2014, 2015 and 2016, respectively. Excludes swaps of ownership interests in UDR/MetLife I joint venture communities. Includes redevelopment spend. |
(1) Revenue growth based on UDR's same store revenue guidance for calendar year 2014. % NOI concentrations based on 100% of NOI. Core Markets: Seattle, San Fran. Bay Area, LA, Orange County, San Diego, Denver, Austin, Dallas, Boston, NYC, Baltimore/Washington D.C. area and Philadelphia. Capital Warehouse Markets: Portland, Inland Empire, Nashville, Richmond, Tampa, Orlando and Other FL. Non-Core Markets: Monterey Peninsula and Norfolk. Market % of 4Q13 SS NOI % of 4Q13 Total NOI Market % of 4Q13 SS NOI % of 4Q13 Total NOI Market % of 4Q13 SS NOI % of 4Q13 Total NOI Austin 2.5% 2.6% Nashville 3.8% 2.9% Monterey Peninsula 3.2% 2.5% Baltimore 6.1% 4.8% New York 4.9% 12.9% San Diego 1.0% 1.2% Boston 4.8% 5.4% Norfolk 2.3% 1.8% Seattle 5.9% 6.4% Dallas 4.7% 5.0% Orange County 10.3% 10.5% San Fran. Bay Area 12.9% 9.8% Inland Empire 1.7% 1.3% Orlando 5.8% 4.4% Tampa 6.4% 4.9% Los Angeles 3.3% 4.3% Portland 1.4% 1.1% TOTAL 98.3% 97.4% Metro Wash., D.C. 14.2% 13.2% Richmond 3.1% 2.4% 2014 Market Growth expectations 13 West Coast: % of SS NOI: 39.7% % of Total NOI: 37.1% Southwest: % of SS NOI: 7.2% % of Total NOI: 8.2% Southeast: % of SS NOI: 17.4% % of Total NOI: 13.3% Mid-Atlantic % of SS NOI: 26.0% % of Total NOI: 22.4% Northeast % of SS NOI: 9.7% % of Total NOI: 19.0% Portland Inland Empire |
Updated '14-'16 Plan vs Initial '13-'15 Plan 2013-2015E Cash Flow growth is expected to be better in the new versus old plan (CHART) ...the same is true for same store Growth (CHART) (CHART) 14 |
Definitions and reconciliations Acquired Communities: The Company defines Acquired Communities as those communities acquired by the Company, other than development and redevelopment activity, that did not achieve stabilization as of the most recent quarter. Adjusted Funds From Operations ("AFFO"): The Company defines AFFO as FFO as Adjusted less recurring capital expenditures that are necessary to help preserve the value of and maintain functionality at our communities. Management considers AFFO a useful supplemental performance metric for investors as it is more indicative of the Company's operational performance than FFO or FFO as Adjusted. AFFO is not intended to represent cash flow or liquidity for the period, and is only intended to provide an additional measure of our operating performance. The Company believes that net income attributable to UDR, Inc. is the most directly comparable GAAP financial measure to AFFO. Management believes that AFFO is a widely recognized measure of the operations of REITs, and presenting AFFO will enable investors to assess our performance in comparison to other REITs. However, other REITs may use different methodologies for calculating AFFO and, accordingly, our AFFO may not always be comparable to AFFO calculated by other REITs. AFFO should not be considered as an alternative to net income (determined in accordance with GAAP) as an indication of financial performance, or as an alternative to cash flows from operating activities (determined in accordance with GAAP) as a measure of our liquidity, nor is it indicative of funds available to fund our cash needs, including our ability to make distributions. A reconciliation from net income attributable to UDR, Inc. to AFFO is provided on page 19 of this presentation. Development Communities: The Company defines Development Communities as those communities recently developed or under development by the Company, that are currently majority owned by the Company and have not achieved stabilization as of the most recent quarter. Discontinued Operations: FASB ASC Subtopic 205.20, requires, among other things, that the primary assets and liabilities and the results of operations of UDR's real properties that have been sold or are held for disposition, be classified as discontinued operations and segregated in UDR's Consolidated Statements of Operations and Consolidated Balance Sheets. Properties classified as real estate held for disposition generally represent properties actively marketed or contracted for sale that are expected to close within the next twelve months. The primary assets and liabilities and the net operating results of those properties sold or classified as held for disposition through December 31, 2013, are accounted for as discontinued operations for all periods presented. This presentation does not have an impact on net income available to common stockholders, it only results in the reclassification of the operating results of all properties sold or classified as held for disposition through December 31, 2013, within the Consolidated Statements of Operations for the periods ended December 31, 2013 and 2012, and the reclassification of the assets and liabilities within the Consolidated Balance Sheets as of December 31, 2013 and December 31, 2012. During the twelve months ended December 31, 2013, UDR sold 2 communities with a total of 914 homes. During the twelve months ended December 31, 2012, UDR disposed of 21 communities with a total of 6,507 homes. At December 31, 2013, UDR has one commercial property classified as real estate held for disposition. The results of operations for these properties are classified on the Consolidated Statements of Operations on Attachment 1 of the Company's quarterly supplemental disclosure in the line item entitled "Income from discontinued operations, net of tax". In thousands 4Q 2013 4Q 2012 YTD 2013 YTD 2012 Rental income $ 2,021 $ 2,296 $ 9,151 $ 39,543 Rental expenses 777 826 3,511 14,106 Property management 56 63 252 1,088 Real estate depreciation 350 539 1,958 8,474 Other operating expenses 8 (96) 7 - 34 (96) 30 791 Non-property (income)/expense 8 (96) 7 - 34 (96) 30 791 1,095 1,435 5,659 24,489 Income before net impairment of real estate held for disposition and net gain on the sale of depreciable property 926 (1,469) 41,919 861 - 156 3,492 (1,469) 41,919 15,054 - 251,554 Impairment of real estate held for disposition, net of tax 926 (1,469) 41,919 861 - 156 3,492 (1,469) 41,919 15,054 - 251,554 Net gain on the sale of depreciable property, net of tax 926 (1,469) 41,919 861 - 156 3,492 (1,469) 41,919 15,054 - 251,554 Income from discontinued operations, net of tax $ 41,376 $ 1,017 $ 43,942 $ 266,608 Effective New Lease Rate Growth: The Company defines effective new lease rate growth as the increase in gross potential rent realized less all concessions for the new lease term (current effective rent) versus prior resident effective rent for the prior lease term on all new leases commenced during the current quarter. Management considers effective new lease rate growth a useful metric for investors as it assesses market-level new demand trends. Effective Renewal Lease Rate Growth: The Company defines effective renewal lease rate growth as the increase in gross potential rent realized less all concessions for the new lease term (current effective rent) versus prior effective rent for the prior lease term on all renewed leases commenced during the current quarter. Management considers effective renewal lease rate growth a useful metric for investors as it assesses market-level, in-place demand trends. Estimated Quarter of Completion: The Company defines estimated quarter of completion of a development or redevelopment project as the date on which construction is expected to be completed, but does not represent the date of stabilization. Fixed Charge Coverage Ratio: The Company defines Fixed Charge Coverage Ratio as net income, excluding the impact of interest expense, real estate depreciation and amortization of wholly owned and other joint venture communities, other depreciation and amortization, noncontrolling interests, net gain on the sale of depreciable property, RE3 income tax, divided by total interest plus preferred dividends. Management considers fixed charge coverage a useful metric for investors as it provides ratings agencies, investors and lending partners with a widely-used measure of the Company's ability to service its debt obligations as well as compare leverage against that of its peer REITs. A reconciliation of the components that comprise fixed charge coverage is provided on page 18 of this presentation. Funds From Operations as Adjusted: The Company defines FFO as Adjusted as FFO excluding the impact of acquisition-related costs and other non-comparable items including, but not limited to, prepayment costs/benefits associated with early debt retirement, gains on sales of marketable securities and TRS property, deferred tax valuation allowance increases and decreases, storm-related expenses, severance costs and legal costs. Management believes that FFO as Adjusted is useful supplemental information regarding our operating performance as it provides a consistent comparison of our operating performance across time periods and allows investors to more easily compare our operating results with other REITs. FFO as Adjusted is not intended to represent cash flow or liquidity for the period, and is only intended to provide an additional measure of our operating performance. The Company believes that net income attributable to UDR, Inc. is the most directly comparable GAAP financial measure to FFO as Adjusted. However, other REITs may use different methodologies for calculating FFO as Adjusted or similar FFO measures and, accordingly, our FFO as Adjusted may not always be comparable to FFO as Adjusted or similar FFO measures calculated by other REITs. FFO as Adjusted should not be considered as an alternative to net income (determined in accordance with GAAP) as an indication of financial performance, or as an alternative to cash flows from operating activities (determined in accordance with GAAP) as a measure of our liquidity. A reconciliation from net income attributable to UDR, Inc. to FFO as Adjusted is provided on page 19 of this presentation. Net Asset Value: Net Asset Value ("NAV") is defined as marked-to-market value of assets less marked-to-market value of liabilities and preferred equity, divided by total outstanding diluted shares and operating units. Management considers NAV a useful metric for investors as it provides context to portfolio value changes over time based on widely accepted market inputs. 15 |
Definitions and reconciliations Funds From Operations ("FFO"): The Company defines FFO as net income (computed in accordance with GAAP), excluding impairment write-downs of depreciable real estate or of investments in non-consolidated investees that are driven by measurable decreases in the fair value of depreciable real estate held by the investee, gains (or losses) from sales of depreciable property, plus real estate depreciation and amortization, and after adjustments for unconsolidated partnerships and joint ventures. This definition conforms with the National Association of Real Estate Investment Trust's definition issued in April 2002. In the computation of diluted FFO, OP units, unvested restricted stock, stock options, and the shares of Series E Cumulative Convertible Preferred Stock are dilutive; therefore, they are included in the diluted share count. Activities of our taxable REIT subsidiary (TRS), RE3, include development and land entitlement. From time to time, we develop and subsequently sell a TRS property which results in a short-term use of funds that produces a profit that differs from the traditional long-term investment in real estate for REITs. We believe that the inclusion of these TRS gains in FFO is consistent with the standards established by NAREIT as the short-term investment is incidental to our main business. TRS gains on sales, net of taxes, are defined as net sales proceeds less a tax provision and the gross investment basis of the asset before accumulated depreciation. Management considers FFO a useful metric for investors as the Company uses FFO in evaluating property acquisitions and its operating performance and believes that FFO should be considered along with, but not as an alternative to, net income and cash flow as a measure of the Company's activities in accordance with GAAP. FFO does not represent cash generated from operating activities in accordance with GAAP and is not necessarily indicative of funds available to fund our cash needs. A reconciliation from net income attributable to UDR, Inc. to FFO is provided on page 19 of this presentation. Held For Disposition Communities: The Company defines Held for Disposition Communities as those communities that were held for sale as of the end of the most recent quarter. Interest Coverage Ratio: The Company defines Interest Coverage Ratio as net income, excluding the impact of interest expense, real estate depreciation and amortization of wholly owned and joint venture communities, other depreciation and amortization, noncontrolling interests, net gain on the sale of depreciable property, RE3 income tax, divided by total interest. Management considers interest coverage ratio a useful metric for investors as it provides ratings agencies, investors and lending partners with a widely-used measure of the Company's ability to service its debt obligations as well as compare leverage against that of its peer REITs. A reconciliation of the components that comprise interest coverage ratio is provided on page 18 of this presentation. Joint Venture Reconciliation at UDR's Weighted Average Pro-Rata Ownership Interest JV Return on Equity ("ROE"): The Company defines JV ROE as the pro rata share of property NOI plus property and asset management fee revenue less interest expense, divided by the average of beginning and ending equity capital for the quarter. Management considers ROE a useful metric for investors as it provides a widely used measure of how well the Company is investing its capital on a leveraged basis. JV Return on Invested Capital ("ROIC"): The Company defines JV ROIC as the pro rata share of property NOI plus property and asset management fee revenue divided by the average of beginning and ending invested capital for the quarter. Management considers ROIC a useful metric for investors as it provides a widely used measure of how well the Company is investing its capital on an unleveraged basis. Net Debt to EBITDA: The Company defines net debt to EBITDA as total debt net of cash and cash equivalents divided by EBITDA. EBITDA is defined as net income, excluding the impact of interest expense, real estate depreciation and amortization of wholly owned and other joint venture communities, other depreciation and amortization, noncontrolling interests, net gain on the sale of depreciable property, and RE3 income tax. Management considers net debt to EBITDA a useful metric for investors as it provides ratings agencies, investors and lending partners with a widely-used measure of the Company's ability to service its debt obligations as well as compare leverage against that of its peer REITs. A reconciliation between net income and EBITDA is provided on page 18 of this presentation. Net Operating Income ("NOI"): The Company defines NOI as rental income less direct property rental expenses. Rental income represents gross market rent less adjustments for concessions, vacancy loss and bad debt. Rental expenses include real estate taxes, insurance, personnel, utilities, repairs and maintenance, administrative and marketing. Excluded from NOI is property management expense which is calculated as 2.75% of property revenue to cover the regional supervision and accounting costs related to consolidated property operations, and land rent. Management considers NOI a useful metric for investors as it is a more meaningful representation of a community's continuing operating performance than net income as it is prior to corporate-level expense allocations, general and administrative costs, capital structure and depreciation and amortization and is a widely used input, along with capitalization rates, in the determination of real estate valuations. A reconciliation from net income attributable to UDR, Inc. to NOI is provided below. In thousands 4Q 2013 YTD 2013 Income/(loss) from unconsolidated entities $ 5,666 $ (415) Management fee 980 3,647 Interest expense 7,359 27,056 Depreciation 9,491 34,953 General and administrative 273 495 Other income/expense 328 (621) (8,331) 781 (2,400) (8,331) NOI from sold and newly consolidated properties 328 (621) (8,331) 781 (2,400) (8,331) Gain on sale 328 (621) (8,331) 781 (2,400) (8,331) Total Joint Venture NOI at UDR's Pro-Rata Ownership Interest $ 15,145 $ 55,786 In thousands 4Q 2013 3Q 2013 2Q 2013 1Q 2013 4Q 2012 YTD 2013 YTD 2012 Net income/(loss) attributable to UDR, Inc. $ 36,700 $ 3,188 $ 5,192 $ (268) $ (12,300) $ 44,812 $ 212,177 Property management 5,233 5,168 5,123 5,004 4,954 20,528 19,378 Other operating expenses 1,925 1,776 1,799 1,636 1,457 7,136 5,718 Real estate depreciation and amortization 88,301 83,738 84,595 82,898 82,917 339,532 341,926 Interest expense 33,360 30,939 30,803 30,981 30,660 126,083 138,792 Hurricane-related (recoveries)/charges, net - (6,460) (2,772) (3,021) 8,495 (12,253) 8,495 General and administrative 11,532 11,364 9,866 9,476 10,653 42,238 43,792 Tax provision/(benefit), net (includes valuation adjustment) 15 (2,658) (2,683) (1,973) (1,628) (7,299) (30,282) Income/(loss) from unconsolidated entities (5,666) 3,794 (515) 2,802 2,757 415 8,579 Interest and other income, net (1,328) (829) (1,446) (1,016) (1,089) (4,619) (3,524) Joint venture management and other fees (3,095) (3,207) (3,217) (2,923) (2,885) (12,442) (11,911) Other depreciation and amortization 3,281 1,176 1,138 1,146 1,092 6,741 4,105 Income from discontinued operations, net of tax (41,376) (884) (829) (853) (1,017) (43,942) (266,608) Net income/(loss) attributable to noncontrolling interests 1,302 47 162 (41) (655) 1,470 8,126 Total consolidated NOI $ 130,184 $ 127,152 $ 127,216 $ 123,848 $ 123,411 $ 508,400 $ 478,763 16 |
Definitions and reconciliations Non-Mature: The Company defines Non-Mature Communities as those communities that have not met the criteria to be included in Same-Store Communities. Non-Residential / Other: The Company defines Non-Residential / Other as non-apartment components of mixed-use properties, land held, properties being prepared for redevelopment and properties where a material change in home count has occurred. Physical Occupancy: The Company defines physical occupancy as the number of occupied homes divided by the total homes available at a community. QTD Same-Store ("SS") Communities: The Company defines QTD SS Communities as those communities stabilized for five consecutive quarters. These communities were owned and had stabilized occupancy and operating expenses as of the beginning of the prior year, there is no plan to conduct substantial redevelopment activities, and the community is not held for disposition within the current year. RE3: RE3 is the Company's taxable REIT subsidiary ("TRS") that focuses on development, land entitlement and short-term hold investments. TRS gains on sales, net of taxes, is defined as net sales proceeds less a tax provision and the gross investment basis of the asset before accumulated depreciation. Recurring Capital Expenditures: The Company defines recurring capital expenditures as expenditures that are necessary to help preserve the value of and maintain functionality at its communities. Redevelopment Communities: The Company generally defines Redevelopment Communities as those communities where greater than 10% of the available apartment homes are off-line for major renovation and those that did not achieve stabilization as of the most recent quarter. Redevelopment Projected Weighted Average Return on Incremental Capital Invested: The projected weighted average return on incremental capital invested for redevelopment projects is NOI as set forth in the Stabilization Period for Redevelopment Yield definition, less the project's annualized operating NOI prior to commencing the redevelopment, divided by total cost of the project. Return on Equity ("ROE"): The Company defines ROE as a referenced quarter's NOI less interest expense, annualized, divided by the average of beginning and ending equity capital for the quarter. Management considers ROE a useful metric for investors as it provides a widely used measure of how well the Company is investing its capital on a leveraged basis. Return on Invested Capital ("ROIC"): The Company defines ROIC as a referenced quarter's NOI, annualized, divided by the average of beginning and ending invested capital for the quarter. Management considers ROIC a useful metric for investors as it provides a widely used measure of how well the Company is investing its capital on an unleveraged basis. Revenue Enhancing Capital Expenditures: The Company defines revenue-enhancing capital expenditures as expenditures that result in increased income generation over time. Management considers revenue enhancing capital expenditures a useful metric for investors as it quantifies the amount of capital expenditures that are expected to grow, not just maintain, revenues. Sold Communities: The Company defines Sold Communities as those communities that previously met the criteria for discontinued operations and were disposed of prior to the end of the most recent quarter. Stabilization for Same Store Classification: The Company generally defines stabilization as when a community's occupancy reaches 90% or above for at least three consecutive months. Stabilized, Non-Mature Communities: The Company defines Stabilized, Non-Mature Communities as those communities that are stabilized but not yet in the Company's Same-Store portfolio. Stabilization Period for Development Yield: The Company defines the stabilization period for development property yield as the forward twelve month NOI, excluding any remaining lease-up concessions outstanding, commencing one year following the delivery of the final home of the project. Stabilization Period for Redevelopment Yield: The Company defines the stabilization period for a redevelopment property yield for purposes of computing the Projected Weighted Average Return on Incremental Capital Invested, as the forward twelve month NOI, excluding any remaining lease-up concessions outstanding, following the delivery of the final home of a project. Stabilized Yield on Developments: Expected stabilized yields on development are calculated as follows, projected stabilized NOI less management fees divided by budgeted construction cost on a project-specific basis. Projected stabilized NOI for development projects, calculated in accordance with the NOI reconciliation provided on page 16 of this presentation is set forth in the definition of Stabilization Period for Development Yield. Given the differing completion dates and years for which NOI is being projected for these communities as well as the complexities associated with estimating other expenses upon completion such as corporate overhead allocation, general and administrative costs and capital structure, a reconciliation to GAAP measures is not meaningful. Projected NOI for these projects is neither provided, nor is representative of Management's expectations for the Company's overall financial performance or cash flow growth and there can be no assurances that forecast NOI growth implied in the estimated construction yield of any project will be achieved. Management considers estimated stabilized yield on development as a useful metric for investors as it helps provide context to the expected effects that development projects will have on the Company's future performance once stabilized. Total Revenue per Occupied Home: The Company defines total revenue per occupied home as rental and other revenues, calculated in accordance with GAAP, divided by the product of occupancy and the number of apartment homes. Management considers total revenue per occupied home a useful metric for investors as it serves as a proxy for portfolio quality, both geographic and physical. All guidance is based on current expectations of future economic conditions and the judgment of the Company's management team. The following reconciles from GAAP net income/(loss) per share for full year 2014 and first quarter of 2014 to forecasted FFO, FFO as Adjusted and AFFO per share: Full Year 2014 Full Year 2014 Low High Forecasted earnings per diluted share $ 0.04 $ 0.10 Conversion from GAAP share count (0.08) (0.08) Depreciation 1.51 1.51 Noncontrolling Interests (0.01) (0.01) Preferred Dividends 0.01 0.01 Forecasted FFO per diluted share $ 1.47 $ 1.53 TRS gains from asset sales (0.01) (0.01) Acquisition costs 0.01 0.01 Forecasted FFO as Adjusted per diluted share $ 1.47 $ 1.53 Recurring capital expenditures (0.17) (0.17) Forecasted AFFO per diluted share $ 1.30 $ 1.36 1Q 2014 1Q 2014 Low High Forecasted earnings per diluted share $ (0.02) $ 0.00 Conversion from GAAP share count (0.02) (0.02) Depreciation 0.38 0.38 Noncontrolling Interests (0.00) (0.00) Preferred Dividends 0.00 0.00 Forecasted FFO per diluted share $ 0.34 $ 0.36 TRS gains from asset sales (0.01) (0.01) Acquisition costs - - Forecasted FFO as Adjusted per diluted share $ 0.33 $ 0.35 Recurring capital expenditures (0.03) (0.03) Forecasted AFFO per diluted share $ 0.30 $ 0.32 17 |
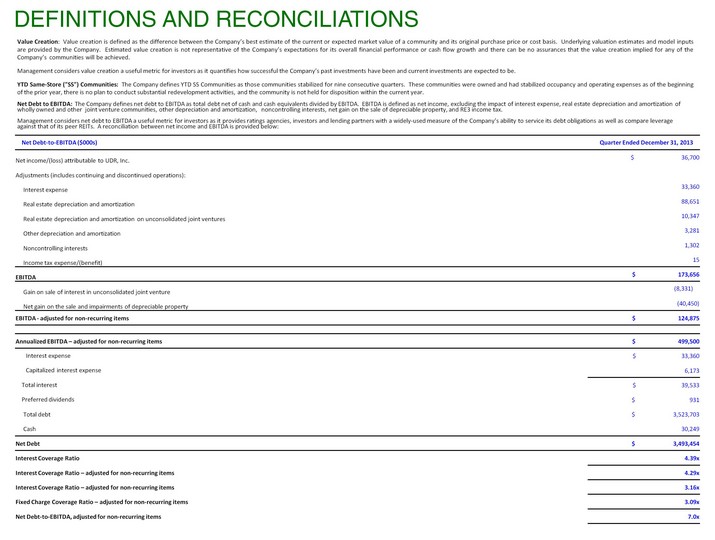
Value Creation: Value creation is defined as the difference between the Company's best estimate of the current or expected market value of a community and its original purchase price or cost basis. Underlying valuation estimates and model inputs are provided by the Company. Estimated value creation is not representative of the Company's expectations for its overall financial performance or cash flow growth and there can be no assurances that the value creation implied for any of the Company's communities will be achieved. Management considers value creation a useful metric for investors as it quantifies how successful the Company's past investments have been and current investments are expected to be. YTD Same-Store ("SS") Communities: The Company defines YTD SS Communities as those communities stabilized for nine consecutive quarters. These communities were owned and had stabilized occupancy and operating expenses as of the beginning of the prior year, there is no plan to conduct substantial redevelopment activities, and the community is not held for disposition within the current year. Net Debt to EBITDA: The Company defines net debt to EBITDA as total debt net of cash and cash equivalents divided by EBITDA. EBITDA is defined as net income, excluding the impact of interest expense, real estate depreciation and amortization of wholly owned and other joint venture communities, other depreciation and amortization, noncontrolling interests, net gain on the sale of depreciable property, and RE3 income tax. Management considers net debt to EBITDA a useful metric for investors as it provides ratings agencies, investors and lending partners with a widely-used measure of the Company's ability to service its debt obligations as well as compare leverage against that of its peer REITs. A reconciliation between net income and EBITDA is provided below: Definitions and reconciliations Net Debt-to-EBITDA ($000s) Quarter Ended December 31, 2013 Net income/(loss) attributable to UDR, Inc. $ 36,700 Adjustments (includes continuing and discontinued operations): Interest expense 33,360 Real estate depreciation and amortization 88,651 Real estate depreciation and amortization on unconsolidated joint ventures 10,347 Other depreciation and amortization 3,281 Noncontrolling interests 1,302 Income tax expense/(benefit) 15 EBITDA $ 173,656 Gain on sale of interest in unconsolidated joint venture (8,331) Net gain on the sale and impairments of depreciable property (40,450) EBITDA - adjusted for non-recurring items $ 124,875 Annualized EBITDA - adjusted for non-recurring items $ 499,500 Interest expense $ 33,360 Capitalized interest expense 6,173 Total interest $ 39,533 Preferred dividends $ 931 Total debt $ 3,523,703 Cash 30,249 Net Debt $ 3,493,454 Interest Coverage Ratio 4.39x Interest Coverage Ratio - adjusted for non-recurring items 4.29x Interest Coverage Ratio - adjusted for non-recurring items 3.16x Fixed Charge Coverage Ratio - adjusted for non-recurring items 3.09x Net Debt-to-EBITDA, adjusted for non-recurring items 7.0x |
(1) Real estate depreciation on unconsolidated joint ventures excludes the portion of the GAAP gain (discussed in Note 3 of Attachment 1 of the Company's 4Q 2013 supplemental report) related to depreciation, net of tax, in order to accurately reflect the FFO gain of the transaction. (2) $2.7 million of the net gain on the sale of our interest in the unconsolidated joint venture (discussed in Note 3 of Attachment 1 of the Company's 4Q 2013 supplemental report) is included in FFO and excluded from FFO as Adjusted as it was a gain on a development asset, which is incidental to our main business. The $2.7 million FFO gain represents the net sales proceeds less a tax provision and the gross investment basis of the asset before accumulated depreciation. (3) During 2012, the tax benefit related to the reversal of a deferred tax valuation allowance was excluded from FFO and FFO as Adjusted. In order to be consistent with the FFO definition per NAREIT, we have modified our presentation to leave this benefit in 2012 FFO, and removed this benefit when computing FFO as Adjusted. As a result, 2012 YTD diluted FFO increased by $0.09 per share, and 2012 YTD FFO as Adjusted was unchanged. (4) Adjustment primarily represents the portion of Hurricane Sandy insurance recoveries in 2013 that relate to the $9.3 million in charges added back to FFO as Adjusted in 4Q 2012. The $2.6 million difference between the $12.3 million hurricane-related recoveries reflected on the Consolidated Statements of Operations for the twelve months ended December 31, 2013 and the $9.7 million adjustment above represents the amount of 2013 business interruption recoveries during 2013. The business interruption insurance recoveries for the twelve months ended December 31, 2013 are offset by lost rental revenues from the business interruption in 2013. Definitions and reconciliations Three Months Ended Three Months Ended Twelve Months Ended Twelve Months Ended December 31, December 31, December 31, December 31, In thousands, except per share amounts 2013 2012 2013 2012 Net income attributable to UDR, Inc. $ 36,700 $ (12,300) $ 44,812 $ 212,177 Distributions to preferred stockholders (931) (931) (3,724) (6,010) Real estate depreciation and amortization, including discontinued operations 88,651 83,456 341,490 350,400 Noncontrolling interest 1,302 (655) 1,470 8,126 Real estate depreciation and amortization on unconsolidated joint ventures(1) 7,718 9,897 33,180 32,531 Net (gain)/loss on the sale of depreciable property in discontinued operations, excluding TRS (40,450) (156) (40,450) (243,805) Premium on preferred stock redemptions, net - - - (2,791) Funds from operations ("FFO") - basic $ 92,990 $ 79,311 $ 376,778 $ 350,628 Distributions to preferred stockholders - Series E (Convertible) 931 931 3,724 3,724 FFO, diluted(2) $ 93,921 $ 80,242 $ 380,502 $ 354,352 FFO per common share, basic $ 0.36 $ 0.31 $ 1.45 $ 1.41 FFO per common share, diluted $ 0.36 $ 0.30 $ 1.44 $ 1.40 Weighted average number of common shares and OP Units outstanding - basic 259,310 259,211 259,306 248,262 Weighted average number of common shares, OP Units, and common stock equivalents outstanding - diluted 263,908 263,529 263,926 252,659 Impact of adjustments to FFO: Acquisition-related costs (including joint ventures) $ - $ 550 $ - $ 2,762 Joint venture financing and acquisition fees - - (254) - Costs/(benefit) associated with debt extinguishment and tender offer - - 178 (277) Redemption of preferred stock - - - 2,791 Gain on sale of TRS property/marketable securities (2) (2,651) - (2,651) (7,749) Severance costs and other restructuring expense - 484 - 733 Reversal of deferred tax valuation allowance (3) - 1,346 - (21,530) Hurricane-related (recoveries)/charges, net (4) - 9,262 (9,665) 9,262 $ (2,651) $ 11,642 $ (12,392) $ (14,008) FFO as Adjusted, diluted(2) $ 91,270 $ 91,884 $ 368,110 $ 340,344 FFO as Adjusted per common share, diluted $ 0.35 $ 0.35 $ 1.39 $ 1.35 Recurring capital expenditures (11,732) (9,389) (42,707) (42,249) AFFO $ 79,538 $ 82,495 $ 325,403 $ 298,095 AFFO per common share, diluted $ 0.30 $ 0.31 $ 1.23 $ 1.18 |
Definitions and reconciliations Forward Looking Statements Certain statements made in this presentation may constitute "forward-looking statements." Words such as "expects," "intends," "believes," "anticipates," "plans," "likely," "will," "seeks," "estimates" and variations of such words and similar expressions are intended to identify such forward- looking statements. Forward-looking statements, by their nature, involve estimates, projections, goals, forecasts and assumptions and are subject to risks and uncertainties that could cause actual results or outcomes to differ materially from those expressed in a forward-looking statement, due to a number of factors, which include, but are not limited to, unfavorable changes in the apartment market, changing economic conditions, the impact of inflation/deflation on rental rates and property operating expenses, expectations concerning availability of capital and the stabilization of the capital markets, the impact of competition and competitive pricing, acquisitions, developments and redevelopments not achieving anticipated results, delays in completing developments, redevelopments and lease-ups on schedule, expectations on job growth, home affordability and demand/supply ratio for multifamily housing, expectations concerning development and redevelopment activities, expectations on occupancy levels, expectations concerning the joint ventures with third parties, expectations that automation will help grow net operating income, expectations on annualized net operating income and other risk factors discussed in documents filed by the Company with the Securities and Exchange Commission from time to time, including the Company's Annual Report on Form 10-K and the Company's Quarterly Reports on Form 10-Q. Actual results may differ materially from those described in the forward-looking statements. These forward-looking statements and such risks, uncertainties and other factors speak only as of the date of this presentation, and the Company expressly disclaims any obligation or undertaking to update or revise any forward-looking statement contained herein, to reflect any change in the Company's expectations with regard thereto, or any other change in events, conditions or circumstances on which any such statement is based, except to the extent otherwise required under the U.S. securities laws. This presentation and these forward-looking statements include UDR's analysis and conclusions and reflect UDR's judgment as of the date of these materials. UDR assumes no obligation to revise or update to reflect future events or circumstances. About UDR, Inc. UDR, Inc. (NYSE:UDR), an S&P 400 company, is a leading multifamily real estate investment trust with a demonstrated performance history of delivering superior and dependable returns by successfully managing, buying, selling, developing and redeveloping attractive real estate properties in targeted U.S. markets. As of December 31, 2013, UDR owned or had an ownership position in 52,949 apartment homes including 1,790 homes under development. For over 41 years, UDR has delivered long-term value to shareholders, the best standard of service to residents and the highest quality experience for associates. Additional information can be found on the Company's website at www.udr.com. 20 |
notes 21 |
notes 22 |
notes 23 |
Investor Relations Contact: Chris Van Ens cvanens@udr.com 720.348.7762 |