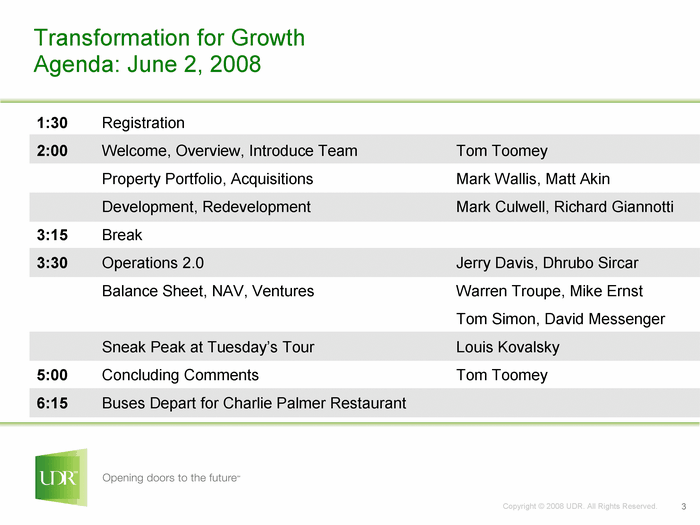
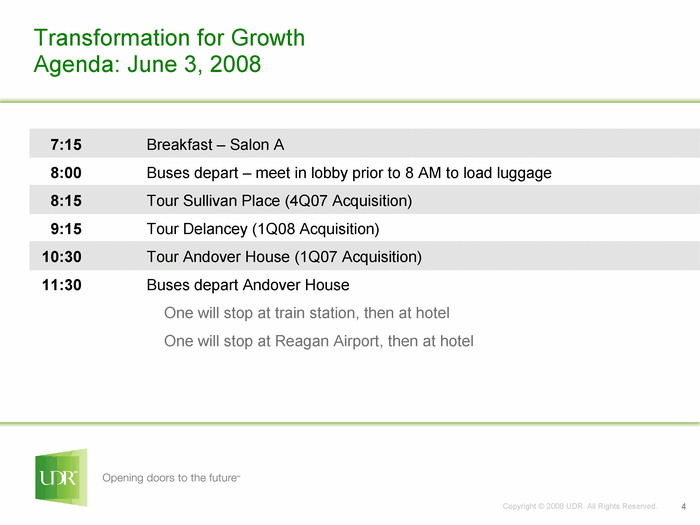
Exhibit 99.2
| The Right Properties in the Right Markets June 2008 |
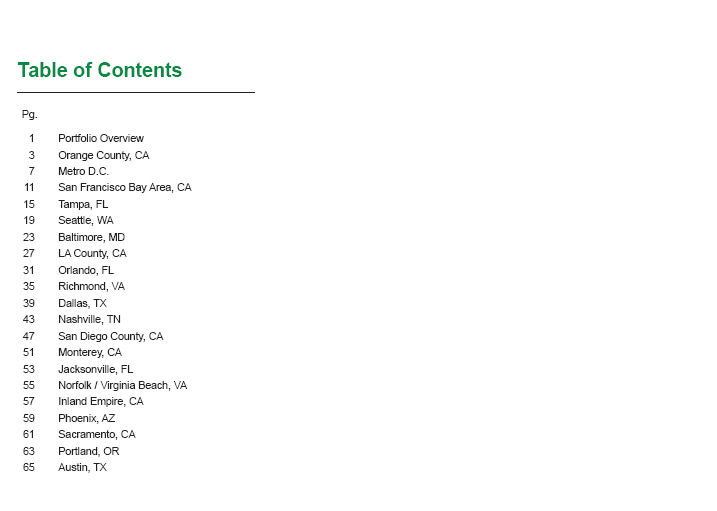
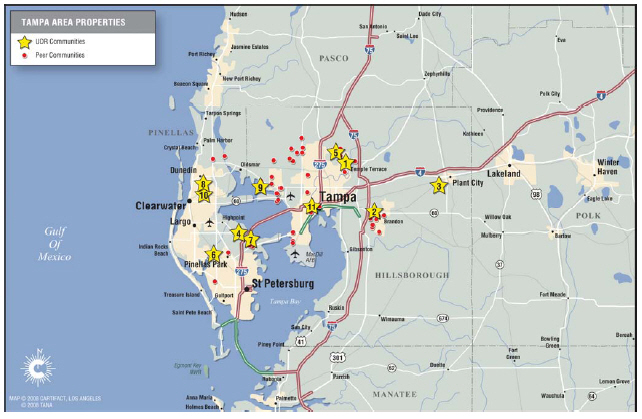
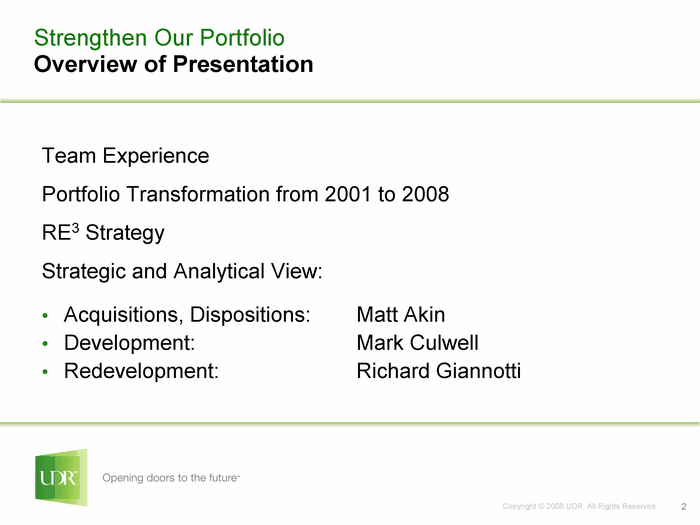
| Table of Contents _____ Pg. 1 Portfolio Overview 3 Orange County, CA 7 Metro D.C. 11 San Francisco Bay Area, CA 15 Tampa, FL 19 Seattle, WA 23 Baltimore, MD 27 LA County, CA 31 Orlando, FL 35 Richmond, VA 39 Dallas, TX 43 Nashville, TN 47 San Diego County, CA 51 Monterey, CA 53 Jacksonville, FL 55 Norfolk / Virginia Beach, VA 57 Inland Empire, CA 59 Phoenix, AZ 61 Sacramento, CA 63 Portland, OR 65 Austin, TX |

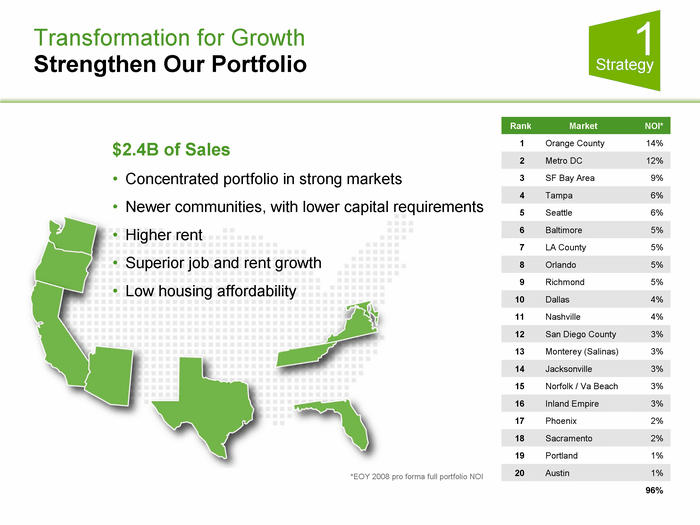
| UDR (NYSE:UDR) is a leading multifamily real estate investment trust (REIT) with a demonstrated performance history of delivering superior and _____ dependable returns by successfully managing, buying, selling, developing _____ and redeveloping attractive real estate properties in targeted U.S. markets. For over 30 years, UDR has delivered long-term value to shareholders, the best standard of service to residents, and the highest quality experience for _____ associates. Additional information can be found on the Company’s website _____ at www.udr.com. UDR Portfolio Characteristics Same Non- Average Pro forma NOI Store Mature Monthly _____ Rank _____ Market % of Total* Homes Homes Rent** 1 Orange County, CA 14.4 4,067 — $ 1,573 2 Metro D.C. 12.1 2,097 1,888 1,325 3 San Francisco Bay Area, CA 8.7 1,768 321 1,785 4 Tampa, FL 6.4 3,081 209 962 5 Seattle, WA 5.5 1,199 71 1,117 6 Baltimore, MD 5.3 1,556 564 1,173 7 LA County, CA 5.1 1,052 328 1,535 8 Orlando, FL 4.8 2,140 1,027 983 9 Richmond, VA 4.6 1,958 253 987 10 Dallas, TX 4.0 305 4,147 1,609 11 Nashville, TN 3.5 1,874 386 869 12 San Diego County, CA 3.1 1,123 — 1,368 13 Monterey / Salinas, CA 3.1 1,565 — 999 14 Jacksonville, FL 2.9 1,557 300 870 15 Norfolk / Virginia Beach, VA 2.8 1,438 — 964 16 Inland Empire, CA 2.8 660 414 1,165 17 Phoenix, AZ 2.1 914 — 960 18 Sacramento, CA 1.6 914 — 915 19 Portland, OR 1.4 716 — 973 20 Austin, TX 1.4 250 — 954 TOTAL: 95.6% 30,234 9,908 $ 1,168 *EOY 2008 pro forma full portfolio NIO, including jvs, planned acquisitions, developments, redevelopments, etc. **As of March 31, 2008 |
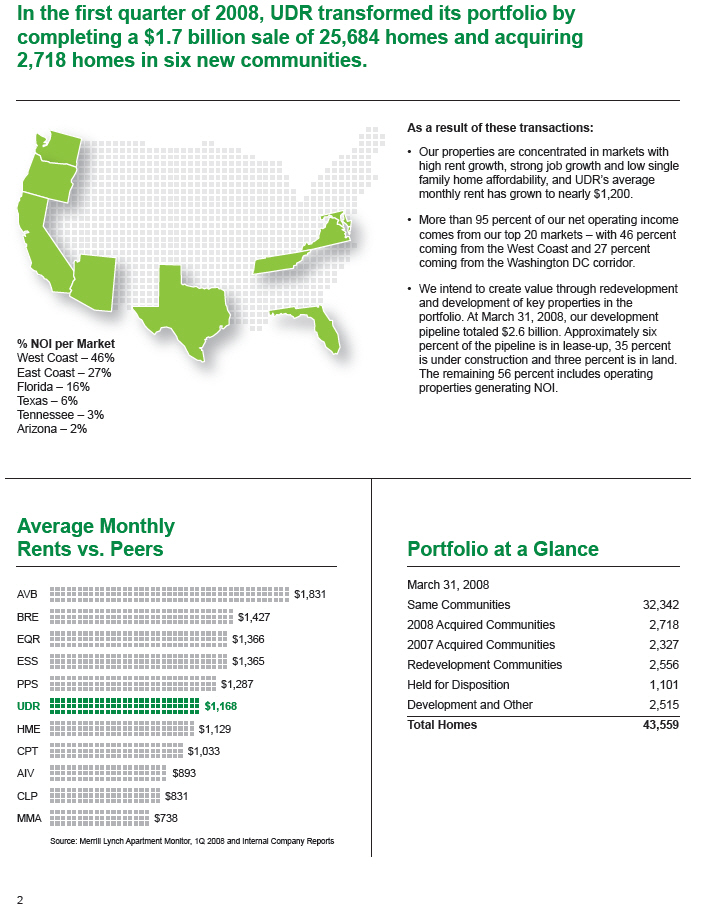
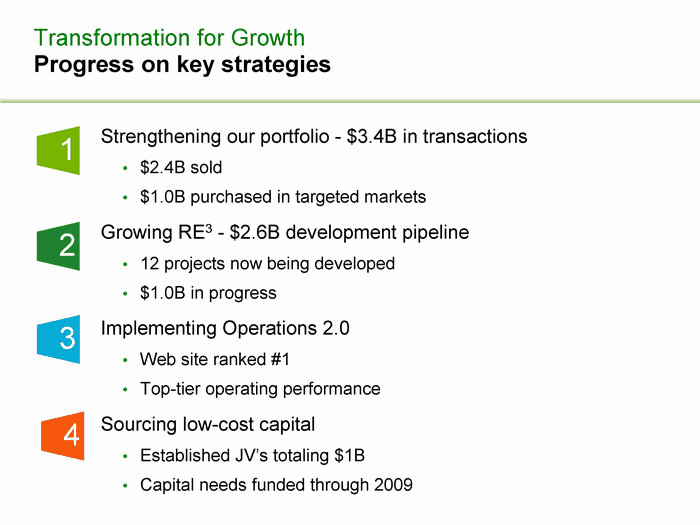
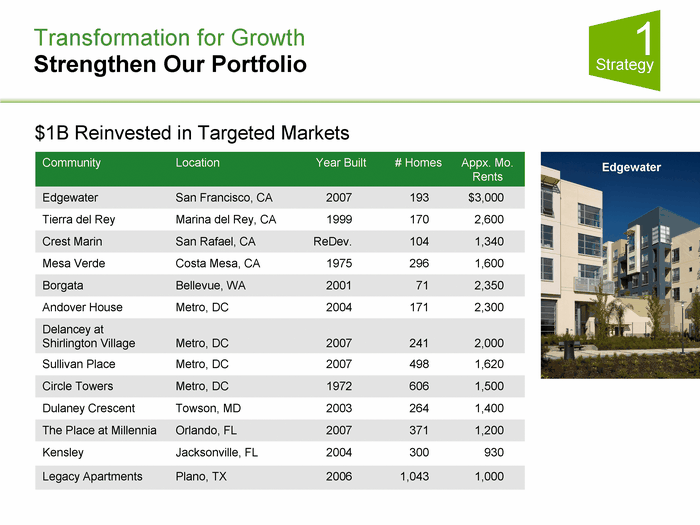
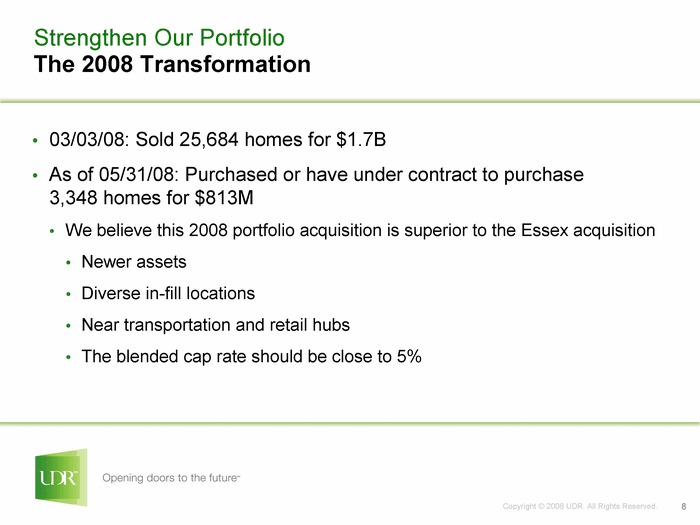
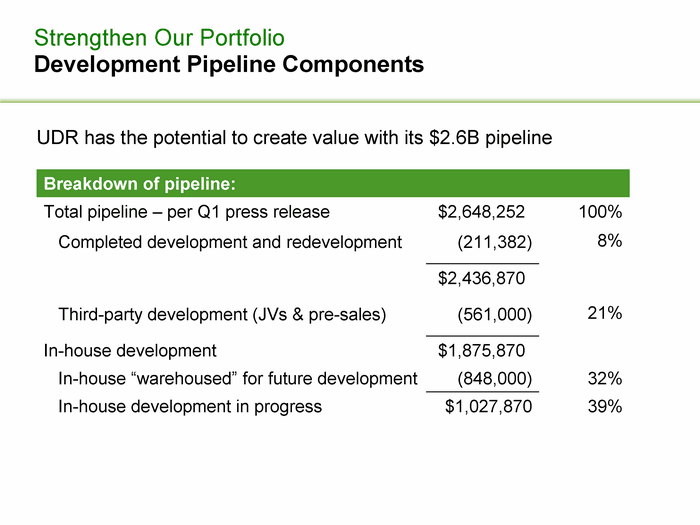
| In the first quarter of 2008, UDR transformed its portfolio by completing a $1.7 billion sale of 25,684 homes and acquiring 2,718 homes in six new communities. As a result of these transactions: Our properties are concentrated in markets with high rent growth, strong job growth and low single family home affordability, and UDR’s average monthly rent has grown to nearly $1,200. More than 95 percent of our net operating income comes from our top 20 markets — with 46 percent coming from the West Coast and 27 percent coming from the Washington DC corridor. We intend to create value through redevelopment and development of key properties in the portfolio. At March 31, 2008, our development pipeline totaled $2.6 billion. Approximately six _____ % NOI per Market percent of the pipeline is in lease-up, 35 percent West Coast — 46% is under construction and three percent is in land. East Coast — 27% The remaining 56 percent includes operating Florida — 16% properties generating NOI. Texas — 6% Tennessee — 3% Arizona — 2% Average Monthly Rents vs. Peers Portfolio at a Glance March 31, 2008 AVB $1,831 Same Communities 32,342 BRE $1,427 2008 Acquired Communities 2,718 EQR $1,366 2007 Acquired Communities 2,327 ESS $1,365 Redevelopment Communities 2,556 PPS $1,287 Held for Disposition 1,101 UDR $1,168 Development and Other 2,515 HME $1,129 Total Homes 43,559 CPT $1,033 AIV $893 CLP $831 MMA $738 Source: Merrill Lynch Apartment Monitor, 1Q 2008 and Internal Company Reports |
| | |
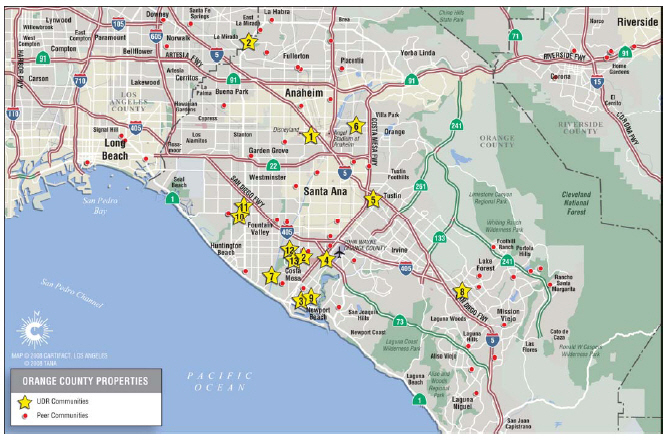
 | | Orange County
Market Fact Sheet |
Market Statistics & Peer Comparison
| | | | | |
| Orange Co. Portfolio | | Homes | |
| Same Store Pool | | | 4,067 | |
| Non-Matures | | | — | |
| Development Pipeline | | | 260 | |
| | | | |
Total | | | 4,327 | |
| 1Q08 Mo. Inc./ Home (SS) | | $ | 1,573 | |
| 1Q08 Occupancy | | | 95 | % |
Source: Company Reports
| | | | | | | | | |
| Company | | # of Homes | | | Ave. Rent | |
| CPT | | | 1,216 | | | $ | 1,659 | |
| EQR | | | 3,179 | | | | 1,601 | |
| BRE | | | 2,899 | | | | 1,574 | |
| UDR | | | 4,067 | | | | 1,573 | |
| HME | | | 2,016 | | | | 1,542 | |
| AIV | | | 247 | | | | 1,499 | |
| AVB | | | 1,174 | | | | 1,486 | |
| | | | | | | |
| | | | 14,798 | | | $ | 1,574 | |
Sources: 1Q ’08 SSP Homes — Axiometrics; 1Q ’08 SSP Ave. Rent — Merrill Lynch
Orange County is UDR’s
#1market, and is expected
to contribute14.4%of the
Company’s total net
operating income*
*EOY 2008 pro forma full portfolio NOI, including JV’s, planned acquisitions, developments, redevelopments, etc.
Orange County Market Statistics
| | | | | | | | | | | | | | | | | |
| 2008 Forecast | | | Low Home Affordability | | | Economy | |
| Effective Rent (Q4) | | $ | 1,495 | | | Ave. Market Rent | | $ | 1,574 | | | Population | | | 2,997,033 | |
| Occupancy Rate (Q4) | | | 93.1 | % | | Mo Payment (Entry Level*): | | | | | | Job Growth | | | -0.8 | % |
| Rental Rate Growth | | | -2.0 | % | | Home | | $ | 3,610 | | | Median Income | | $ | 78,700 | |
| Effective Rent (‘09F) | | $ | 1,551 | | | Condo | | $ | 3,048 | | | Housing Stock | | | | |
| Effective Rent (‘10F) | | $ | 1,616 | | | Median Home Price | | $ | 630,000 | | | Renter | | | 386,511 | |
| Multifamily Permits | | | 5,277 | | | Housing Affordability Index | | | 57.2 | | | % of Total | | | 37.8 | % |
Source: Axiometrics
* Assumes 30 yr fixed at 6.31%
Recent Activity
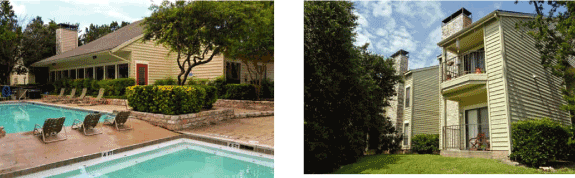
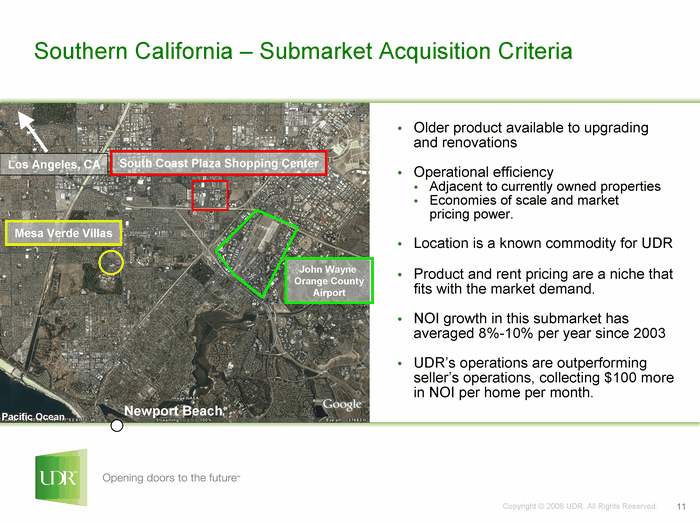
The Orange County, California market represents UDR’s largest concentration of apartment homes as measured by NOI. These homes are in premier coastal locations and many communities are just minutes from the beach.
The Company is creating value in this market through the following initiatives:
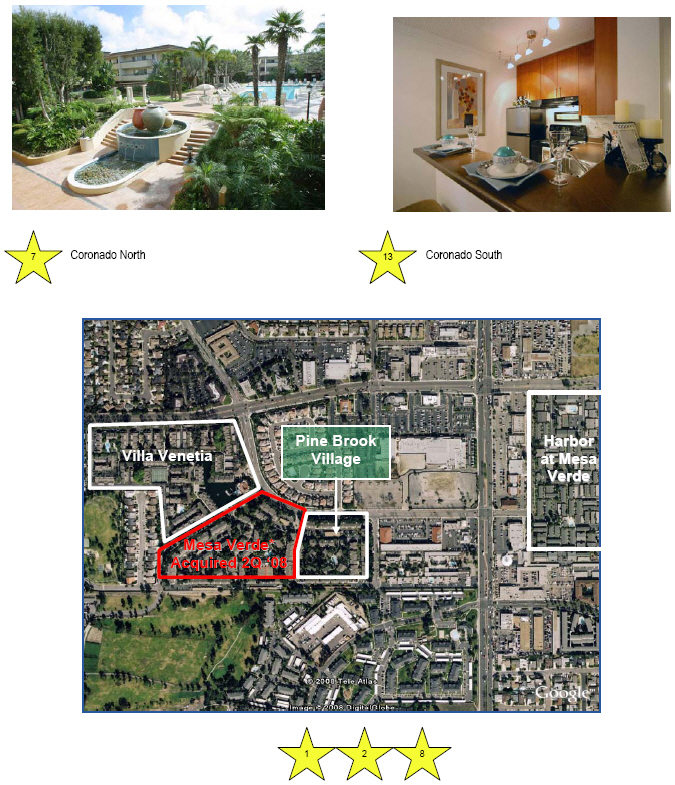
| | • | | Acquisitions: Mesa Verde Villas, a 296 unit community, was purchased on May 15th in Costa Mesa, CA. This community is a twin to Pine Brook Village, a 200 unit community. The property was constructed by the same builder as Pine Brook Village. The two properties share the same architecture, design and floor plans. Pine Brook Village and Mesa Verde also share the main entry into both properties, making Mesa Verde an excellent candidate to be merged with Pine Brook. This merger creates value immediately through operating efficiencies in leasing staff, maintenance staff and purchasing. |
| | • | �� | Development: Foxborough, a 260 home, $77M development in Orange, CA |
| | • | | Redevelopment: More than 1,600 kitchen and bath renovations have been completed at an average cost of $10,800 and we are realizing an average annual return of 13.3%. Example of average rent increases include Huntington Vista: $1,600 before, $1,775 after, a 10.9% increase |
The local economy has recently softened due to the loss of 7,000 jobs in the sub-prime lending industry, but long term prospects are excellent. The region enjoys employment diversity, a highly educated work force and an attractive year round climate affording a variety of recreational activities.
3
Orange County
Market Fact Sheet
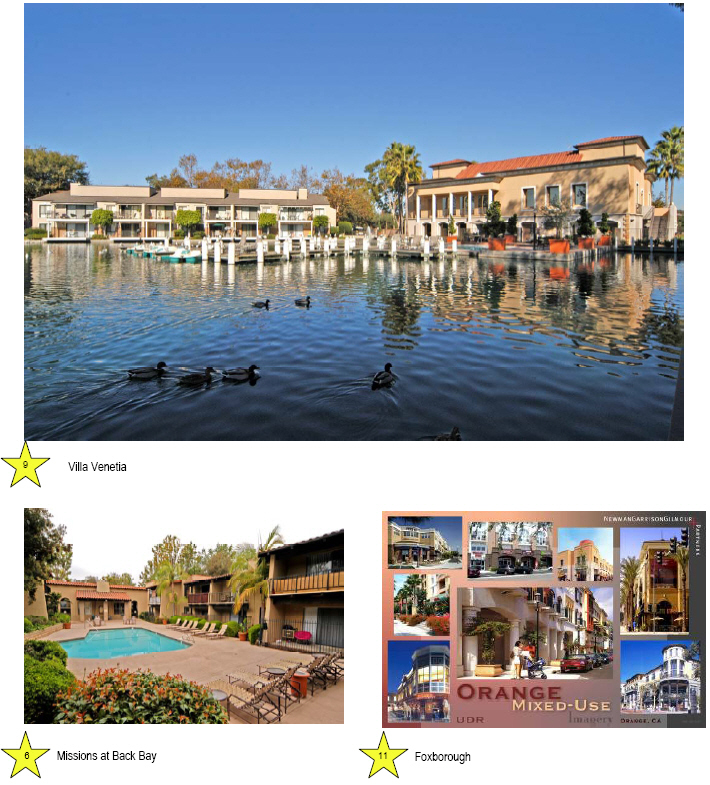
Villa Venetia Foxborough
Missions at Back Bay |
4
Orange County
Market Fact Sheet
Coronado South
Coronado NorthMesa Verde* Acquired 2Q ‘08 Harbor at Mesa Verde |
5
Orange County
Market Fact Sheet
| | | | | | | | | | | | | | | | | | | | | |
| | | | | | | Year Built | | | | | | | | | | | Inc. per Occ. | |
| Operating Properties | | # Homes | | | ReDev | | | Redev. | | | Occupancy* | | | Home* | |
| 1 Harbor at Mesa Verde | | | 384 | | | | 1965 | | | | K/B | | | | 94 | % | | $ | 1,621 | |
| 2 Pine Brook Village | | | 200 | | | | 1979 | | | | K/B | | | | 97 | % | | | 1,718 | |
| 3 Pacific Shores | | | 264 | | | | 1971 | | | | K/B | | | | 96 | % | | | 1,559 | |
| 4 Huntington Vista | | | 220 | | | | 1970 | | | | K/B | | | | 95 | % | | | 1,768 | |
| 5 Pacific Palms | | | 149 | | | | 1962 | | | | | | | | 96 | % | | | 1,314 | |
| 6 Missions at Back Bay | | | 104 | | | | 1969 | | | | K/B | | | | 95 | % | | | 1,517 | |
| 7 Coronado North | | | 732 | | | | 1968 | | | | K/B | | | | 94 | % | | | 1,455 | |
| 8 Huntington Villas | | | 400 | | | | 1972 | | | | K/B | | | | 97 | % | | | 1,682 | |
| 9 Villa Venetia | | | 468 | | | | 2008 | | | | K/B | | | | 95 | % | | | 1,662 | |
| 10 Vista Del Ray | | | 116 | | | | 1969 | | | | K/B | | | | 99 | % | | | 1,414 | |
| 11 Foxborough | | | 90 | | | | 1969 | | | | | | | | 96 | % | | | 1,816 | |
| 12 The Arboretum at Lake Forest | | | 225 | | | | 1970 | | | | K/B | | | | 94 | % | | | 1,591 | |
| 13 Coronado South | | | 715 | | | | 1970 | | | | K/B | | | | 95 | % | | | 1,504 | |
| | | | | | | | | | | | | | | | |
Grand Total | | | 4,067 | | | | | | | | | | | | 95 | % | | $ | 1,573 | |
| | | | | | | | | | | | | | | | |
*As of 1Q 2008
| | | | | | | | | | | | | | | | | | | | | |
| | | | | | | | | | | Budgeted | | | Cost per | | | Expected | |
| Development Pipeline | | Expected Return | | | # of Homes | | | Cost | | | Home | | | Completion | |
| (11) Foxborough II | | | 6.0%-6.5% | | | | 260 | | | $ | 76,562 | | | $ | 294,469 | | | | 2011 | |
| | | | | | | | | | | | | | | | | | | |
Total | | | | | | | 260 | | | $ | 76,562 | | | | | | | | | |
| | | | | | | | | | | | | | | | | | | |
6
| | |
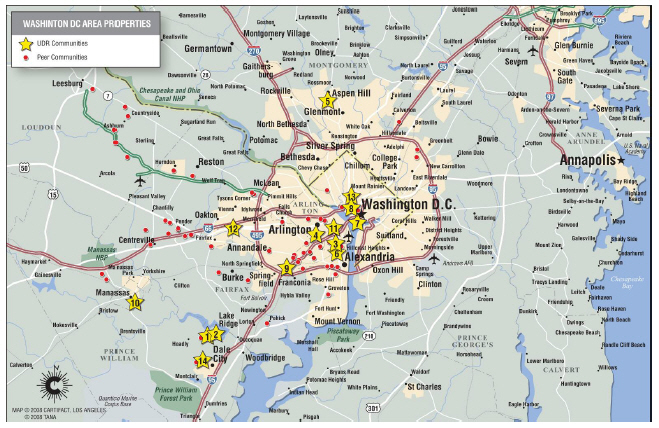
| | Metro D.C.
Market Fact Sheet |
Market Statistics & Peer Comparison
| | | | | |
| Metro DC Portfolio | | Homes | |
| Same Store Pool | | | 2,097 | |
| Non-Matures | | | 1,888 | |
| Development Pipeline | | | 813 | |
| | | | |
Total | | | 4,798 | |
| 1Q08 Mo. Inc./ Home (SS) | | $ | 1,325 | |
| 1Q08 Occupancy | | | 96 | % |
Source: Company Reports
| | | | | | | | | |
| Company | | # of Homes | | | Ave. Rent | |
| AVB | | | 2,793 | | | $ | 1,735 | |
| CPT | | | 2,740 | | | | 1,446 | |
| EQR | | | 7,740 | | | | 1,395 | |
| UDR | | | 2,097 | | | | 1,325 | |
| HME | | | 4,549 | | | | 1,184 | |
| AIV | | | 8,340 | | | | 1,120 | |
| | | | | | | |
| | | | 28,259 | | | $ | 1,313 | |
Sources: 1Q ’08 SSP Homes — Axiometrics; 1Q ’08 SSP Ave. Rent — Merrill Lynch
Metro DC is UDR’s
#2market, and is expected
to contribute12.1%of the
Company’s total net
operating income*
*EOY 2008 pro forma full portfolio NOI, including JV’s, planned acquisitions, developments, redevelopments, etc.
Metro DC Market Statistics
| | | | | | | | | | | | | | | | | |
| 2008 Forecast | | | Low Home Affordability | | | Economy | |
| Effective Rent (Q4) | | $ | 1431 | | | Ave. Market Rent | | $ | 1,313 | | | Population | | | 4,151,047 | |
| Occupancy Rate (Q4) | | | 94.2 | % | | Mo Payment (Entry Level*): | | | | | | Job Growth | | | 0.9 | % |
| Rental Rate Growth | | | 2.3 | % | | Home | | $ | 2,353 | | | Median Income | | $ | 94,500 | |
| Effective Rent (’09F) | | $ | 1,434 | | | Condo | | $ | 1,971 | | | Housing Stock | | | | |
| Effective Rent (‘10F) | | $ | 1,518 | | | Median Home Price | | $ | 400,100 | | | Renter | | | 558,818 | |
| Multifamily Permits | | | 6,685 | | | Housing Affordability Index | | | 103.1 | | | % of Total | | | 33.7 | % |
Source: Axiometrics
* Assumes 30 yr fixed at 6.31%
Recent Activity
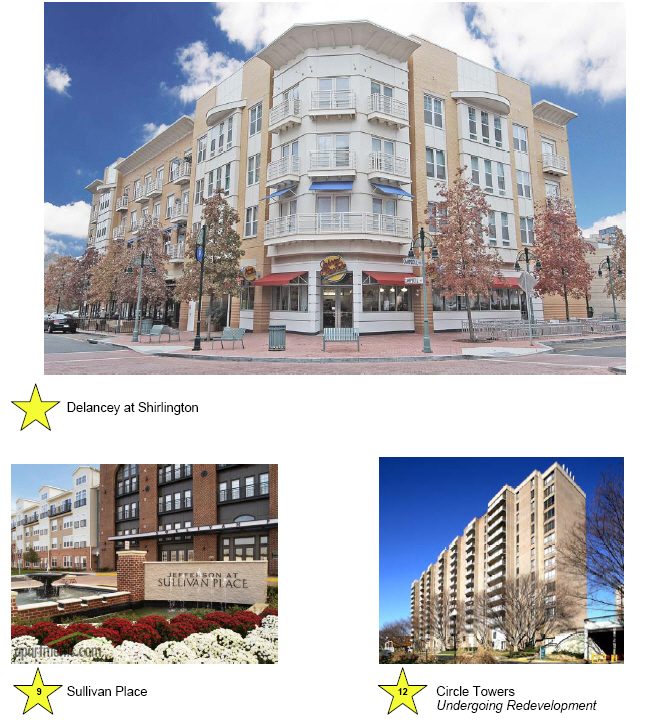
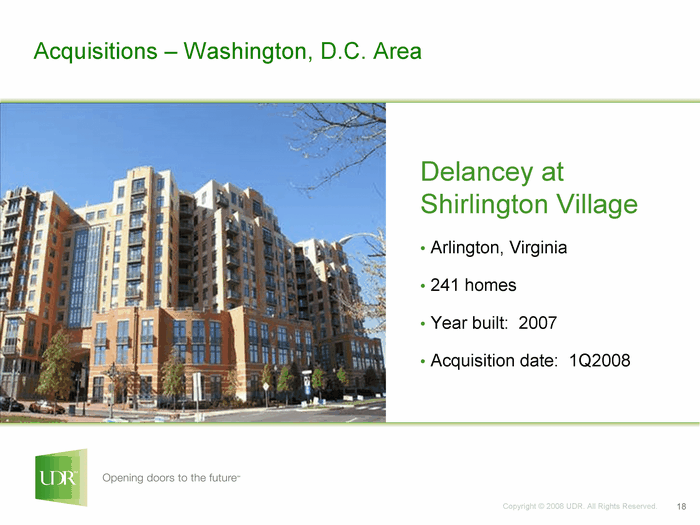
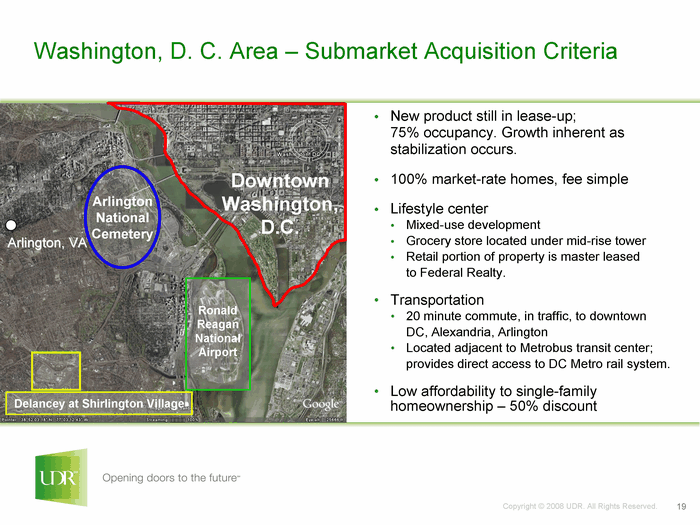
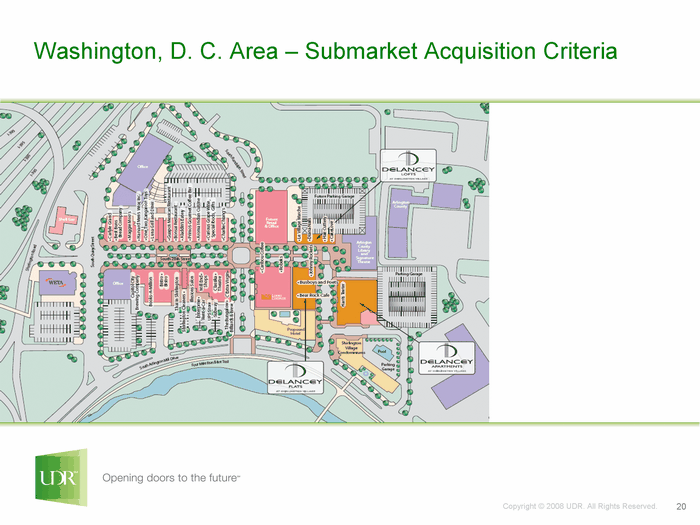
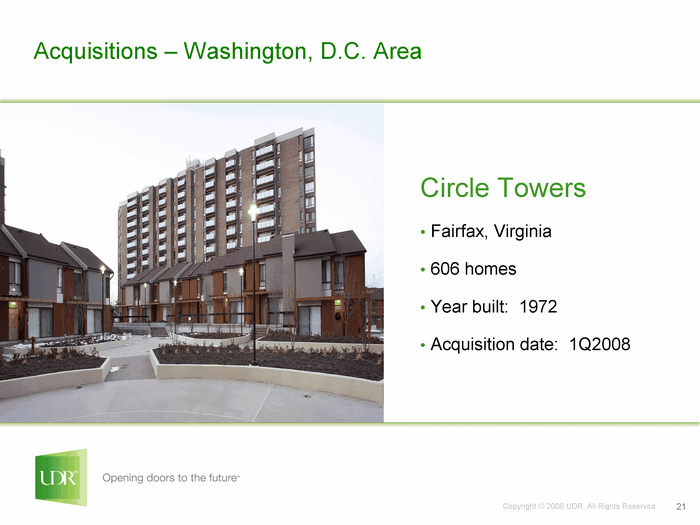
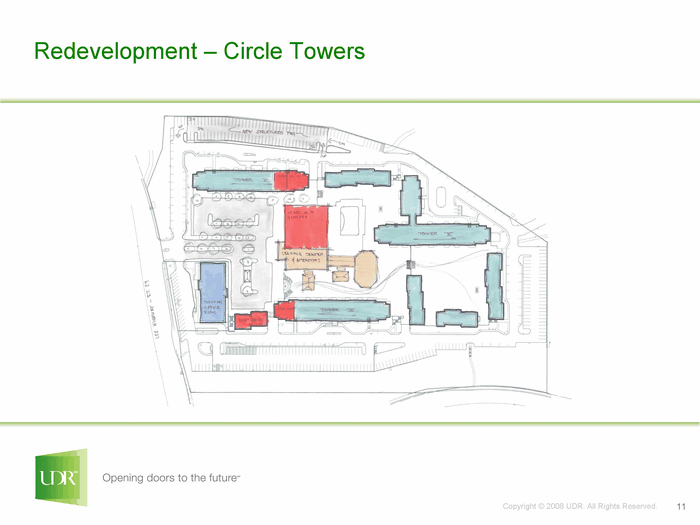
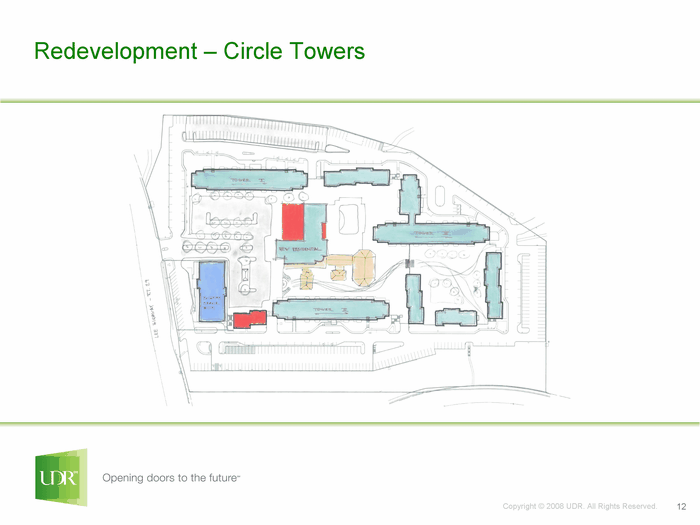
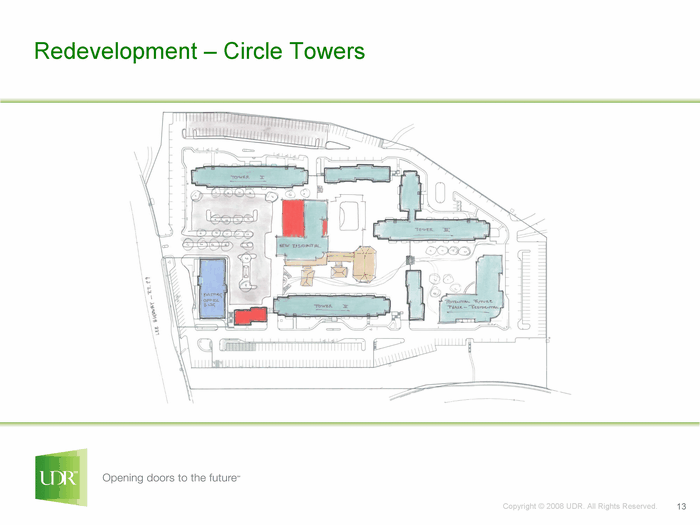
In the 1st quarter of 2008, we acquired two communities (Delancey at Shirlington and Circle Towers) with 847 homes. UDR intends to expand its presence in this market by buying communities in lease-up and well located properties with renovation potential
Value Creation:
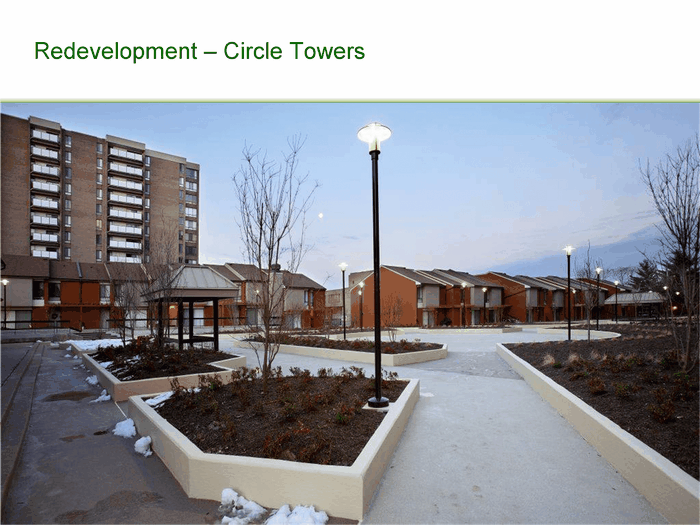
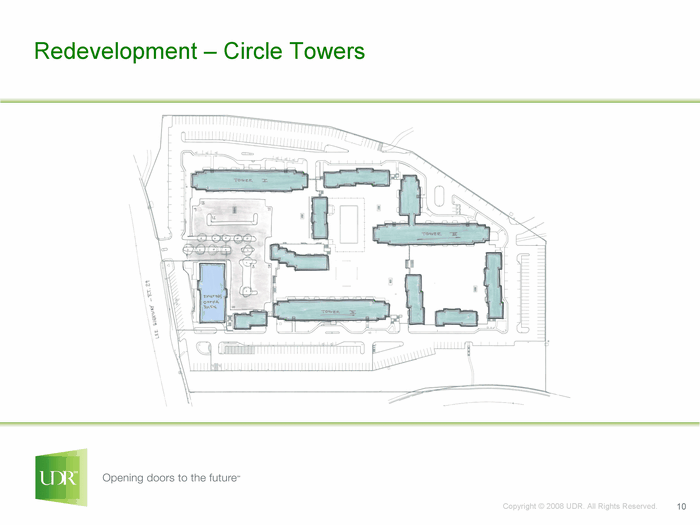
| • | | In the first quarter of 2008 we purchased Circle Towers, a mixed use development that includes 606 apartment homes and more than 50,000 SF of office and retail space for $144.3M. This project is slated for redevelopment in 2009. |
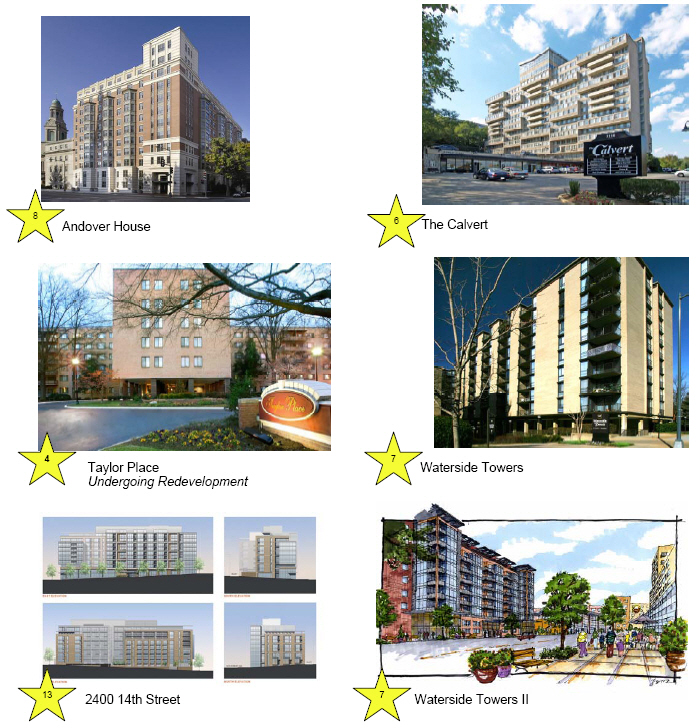
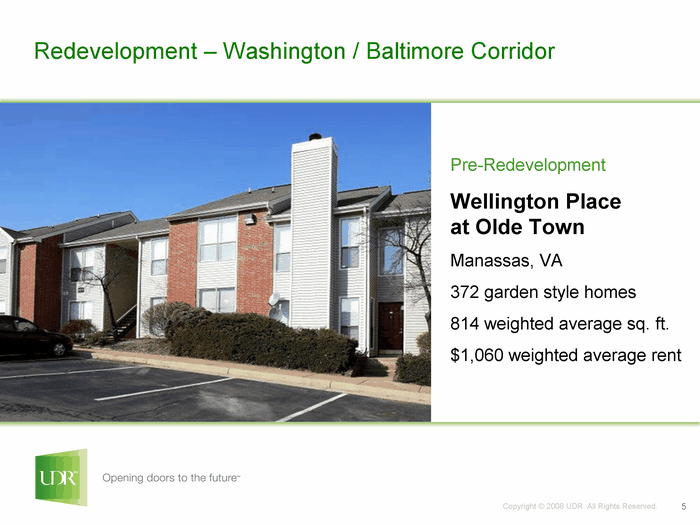
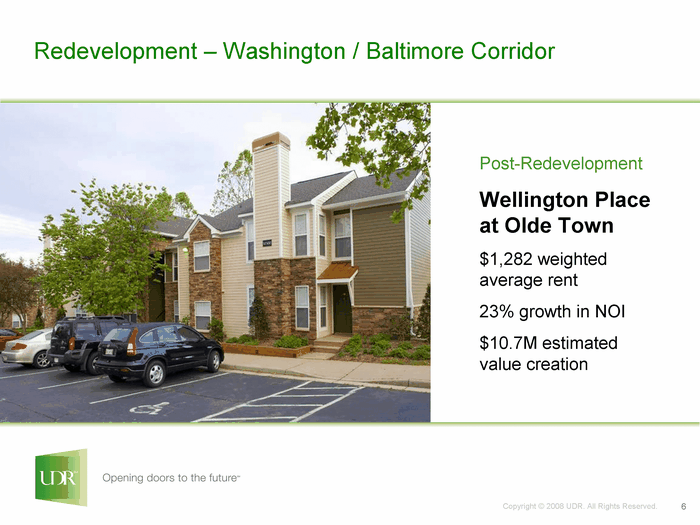
| • | | In the first quarter of 2008 we completed the interior renovation portion of the full redevelopment of Wellington Place, a 372 home community in Manassas, VA that we purchased for $50.1M or $135,000 per home in 2005. Following the completion of the exterior upgrades, we expect to realize an 8.0% cash on cash return from the incremental investment, a nearly 30% improvement in cash flow, and estimate value creation of over $11M. |
| • | | The 2nd quarter of 2008 will see the start of major work for the full redevelopment of Taylor Place, a 218 home mid-rise community, located in Arlington, VA. This $13.9M redevelopment project is expected to realize a 8.0% return on incremental investment, a 41% improvement in cash flow, and estimated value creation of $18M. |
| • | | We’ve completed more than 1,500 kitchen and bath renovations at an average cost of $9,836 and are realizing an average annual return of 9.2%. |
| • | | We intend to construct an 11 story tower on existing property adjacent to Waterside Towers; a 550 home mid-rise structure located 15 minutes from the National Mall. |
7
Metro D.C.
Market Fact Sheet
8
Metro D.C.
Market Fact Sheet
9
Metro D.C.
Market Fact Sheet
| | | | | | | | | | | | | | | | | | | |
| | | | | | | Year Built | | | | | | | | | Inc. per Occ. | |
| Operating Properties | | # Homes | | | ReDev | | | Redev. | | Occupancy* | | | Home* | |
| 1 Dominion Middle Ridge | | | 280 | | | | 1990 | | | K/B | | | 94 | % | | $ | 1,273 | |
| 2 Dominion Lake Ridge | | | 192 | | | | 1987 | | | K/B | | | 95 | % | | | 1,272 | |
| 3 Presidential Greens | | | 396 | | | | 1988 | | | K/B | | | 96 | % | | | 1,105 | |
| 4 Taylor Place | | | 218 | | | | 2008 | | | Full | | | 98 | % | | | 1,472 | |
| 5 Ridgewood I | | | 274 | | | | 1988 | | | K/B | | | 96 | % | | | 1,373 | |
| 6 The Calvert | | | 187 | | | | 1962 | | | K/B | | | 95 | % | | | 1,341 | |
| 7 Waterside Towers | | | 550 | | | | 1971 | | | K/B | | | 98 | % | | | 1,437 | |
| | | | | | | | | | | | | | |
Subtotal | | | 2,097 | | | | | | | | | | 96 | % | | | 1,325 | |
Non-Mature | | | | | | | | | | | | | | | | | | |
| 8 Andover House | | | 171 | | | | 2004 | | | | | | 98 | % | | | 2,307 | |
| 9 Sullivan Place — In Lease-Up | | | 498 | | | | 2007 | | | | | | 65 | % | | | 1,617 | |
| 10 Wellington Place — Under Redev. | | | 372 | | | | 2007 | | | Full | | | 77 | % | | | 1,115 | |
| 11 Delancey at Shirlington (in Lease-up) | | | 241 | | | | 2008 | | | | | | 76 | % | | | 2,024 | |
| 12 Circle Towers | | | 606 | | | | 1972 | | | Full | | | 92 | % | | | 1,507 | |
| | | | | | | | | | | | | | |
Subtotal | | | 1,888 | | | | | | | | | | | | | | 1,581 | |
| | | | | | | | | | | | | | |
Grand Total | | | 3,985 | | | | | | | | | | | | | $ | 1,441 | |
| | | | | | | | | | | | | | |
*As of 1Q 2008
| | | | | | | | | | | | | | | | | |
| | | | | # of | | | Budgeted | | | Cost per | | | Expected |
| Development Pipeline | | Expected Return | | Homes | | | Cost | | | Home | | | Completion |
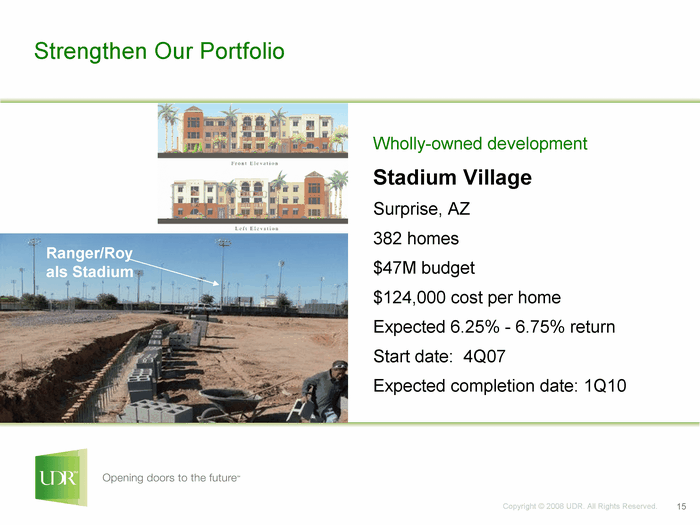
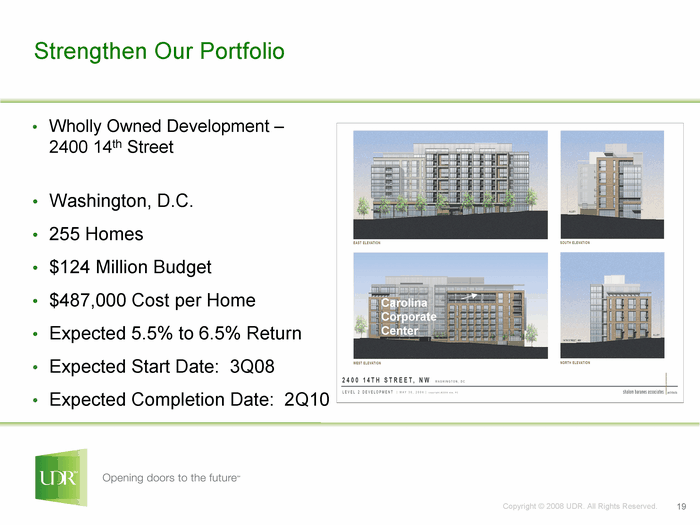
13 2400 14th Street | | 5.5%-6.0% | | | 255 | | | $ | 124,000 | | | $ | 486,275 | | | 2010 |
| (7) Waterside Towers | | TBD | | | 198 | | | | 101,000 | | | | 510,101 | | | TBD |
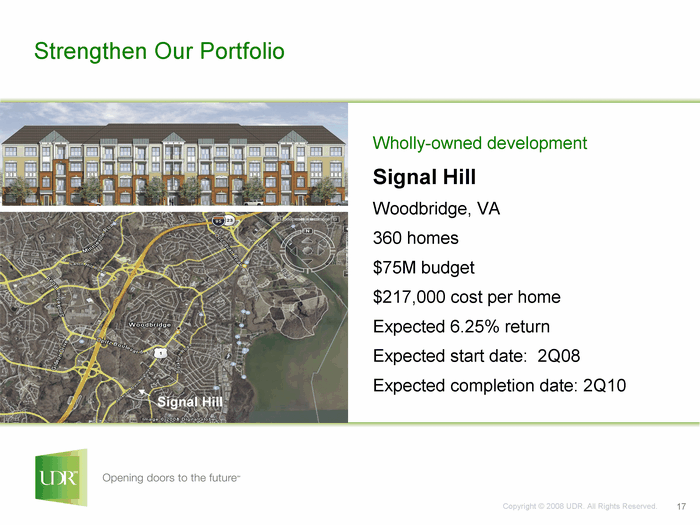
| 14 Signal Hill — Woodbridge, VA | | 6.0%-6.5% | | | 360 | | | | 75,000 | | | $ | 208,333 | | | 2010 |
| | | | | | | | | | | | | | | |
Total | | | | | 813 | | | $ | 300,000 | | | | | | | |
| | | | | | | | | | | | | | | |
10
San Francisco
Market Fact Sheet
Market Statistics & Peer Comparison
| | | | | |
| San Francisco Portfolio | | Homes | |
| Same Store Pool | | | 1,768 | |
| Non-Matures | | | 321 | |
| Development Pipeline | | | 200 | |
| | | | |
Total | | | 2,289 | |
| 1Q08 Mo. Inc./ Home (SS) | | $ | 1,785 | |
| 1Q08 Occupancy | | | 96 | % |
Source: Company Reports
| | | | | | | | | |
| Company | | # of Homes | | | Ave. Rent | |
| AVB | | | 2,482 | | | $ | 2,151 | |
| BRE | | | 775 | | | | 1,809 | |
| UDR | | | 1,768 | | | | 1,785 | |
| ESS | | | 846 | | | | 1,766 | |
| EQR | | | 736 | | | | 1,601 | |
| AIV | | | 418 | | | | 1,485 | |
| | | | | | | |
| | | | 7,025 | | | $ | 1,878 | |
Sources: 1Q ‘08 SSP Homes — Axiometrics; 1Q ‘08 SSP Ave. Rent — Merrill Lynch
San Francisco is UDR’s
#3market, and is expected
to contribute8.7%of the
Company’s total net
operating income*
*EOY 2008 pro forma full portfolio NOI, including JV’s, planned acquisitions, developments, redevelopments, etc.
San Francisco Market Statistics
| | | | | | | | | | | | | | | | | | | | | | | | | | | | | |
| 2008 Forecast | | | Low Home Affordability | | | Economy | |
| Effective Rent (Q4) | | | | | | $ | 2,061 | | | Ave. Market Rent | | | | | | $ | 1,878 | | | Population | | | | | | | 1,720,056 | |
| Occupancy Rate (Q4) | | | | | | | 95.8 | % | | Mo Payment: Entry Level*: | | | | | | | | | | Job Growth | | | | | | | 2.2 | % |
| Rental Rate Growth | | | | | | | 2.2 | % | | Home | | | | | | $ | 4,551 | | | Median Income | | | | | | $ | 86,500 | |
| Effective Rent (‘09F) | | | | | | $ | 2,008 | | | Condo | | | | | | $ | 3,845 | | | Housing Stock | | | | | | | | |
| Effective Rent (‘10F) | | | | | | $ | 2,100 | | | Median Home Price | | | | | | $ | 840,000 | | | Renter | | | | | | | 347,146 | |
| Multifamily Permits | | | | | | | 3,206 | | | Housing Affordability Index | | | | | | | 49.6 | | | % of Total | | | | | | | 47.5 | % |
Source: Axiometrics
* Assumes 30 yr fixed at 6.31%
Recent Activity
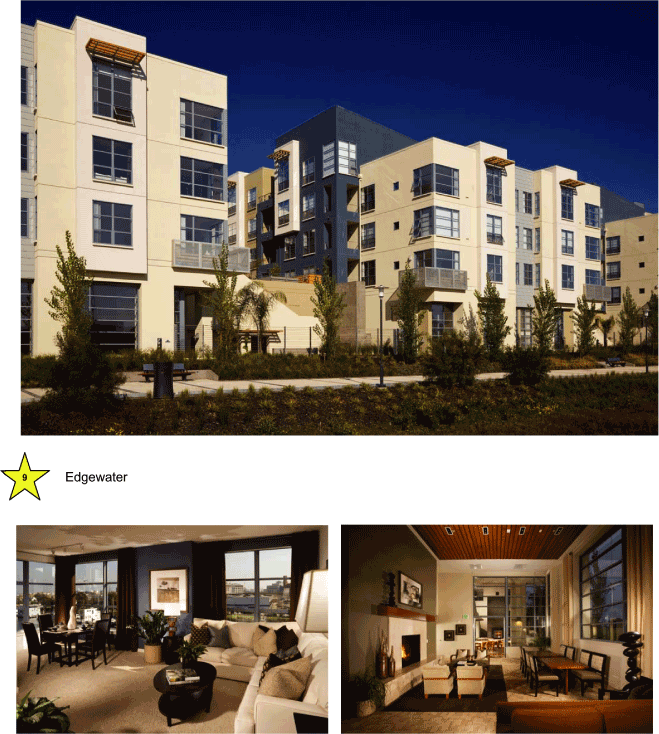
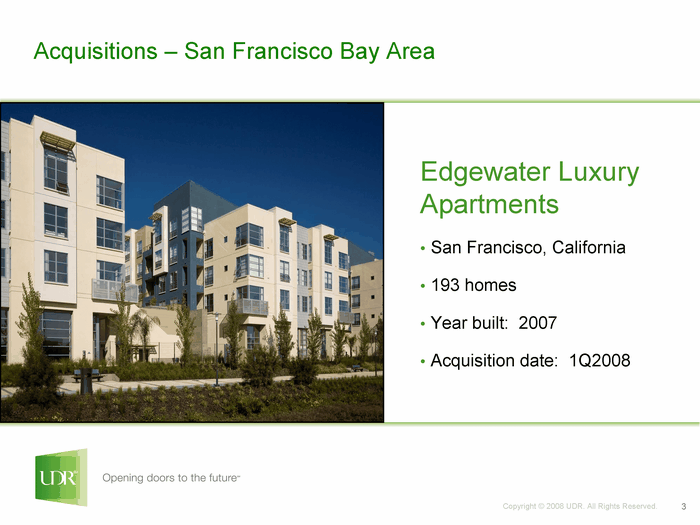
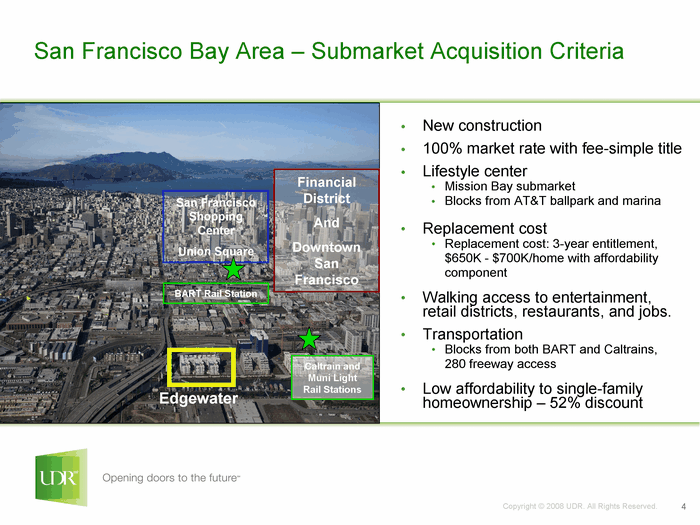
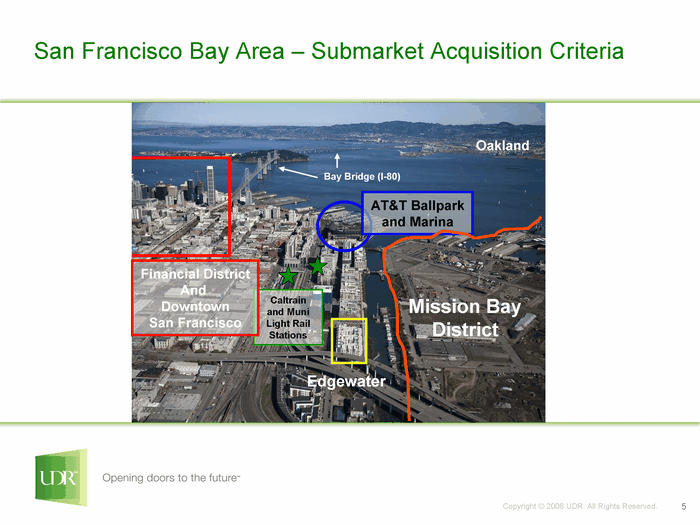
In the first quarter of 2008, UDR acquired Edgewater, a 193 home community in the Mission Bay district of San Francisco. The property was constructed in 2007 and is strategically located near public transportation and entertainment venues. Rents range from $2,200 for a studio apartment to $3,800 for a two bedroom home.
In the fourth quarter, 2007, the Company expanded its presence in this market with the purchase of 104 apartment homes in San Rafael. The community is located directly adjacent to Highlands of Marin, an existing UDR property. Both properties will be completely renovated with new exterior siding, kitchens, baths, and more with expected rent increases of approximately $200 — $250 per home.
The company is improving existing homes though its kitchen and bath renovation program:
| | • | | Over 350 kitchen and bath renovations have been completed at an average cost of $14,250 and we are realizing an average annual return of 9.8%. |
| | • | | Example of average rent increases: $1,270 before, $1,337 after, a 5.3% increase |
The region enjoys employment diversity, a highly educated work force and an attractive year round climate affording a variety of recreational activities. The median existing home price is $840,000 making this one of the least affordable markets in the U.S. UDR plans to expand its presence in this market.
11
San Francisco
Market Fact Sheet
12
San Francisco
Market Fact Sheet
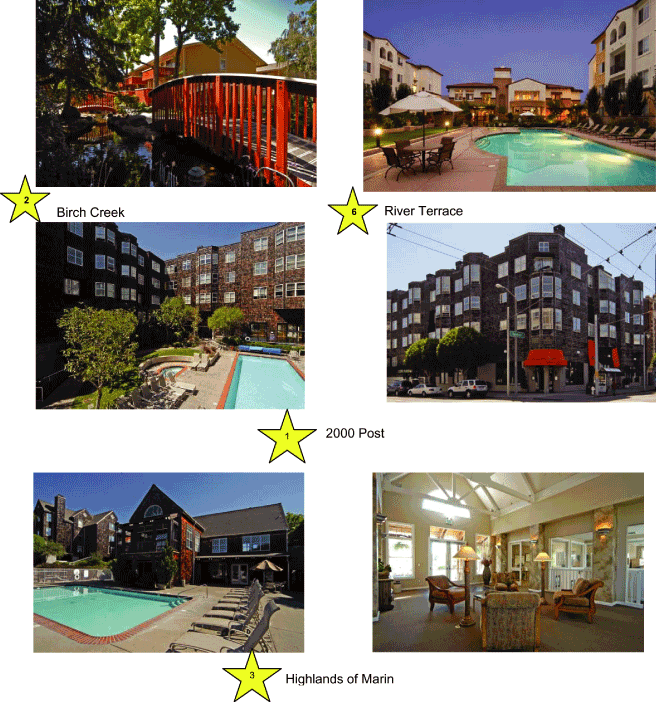
| Birch Creek River Terrace 2000 Post Highlands of Marin |
13
San Francisco
Market Fact Sheet
| | | | | | | | | | | | | | | | | | | | | |
| | | | | | | Year Built | | | | | | | | | | | Inc. per Occ. | |
| Operating Properties | | # Homes | | | ReDev | | | Redev. | | | Occupancy* | | | Home* | |
| 1 2000 Post Street I | | | 304 | | | | 1987 | | | | K/B | | | | 98 | % | | $ | 2,230 | |
| 2 Birch Creek | | | 184 | | | | 1968 | | | | | | | | 97 | % | | | 1,741 | |
| 3 Highlands of Marin | | | 220 | | | | 2008 | | | | Full | | | | 94 | % | | | 1,615 | |
| 4 Marina Playa | | | 272 | | | | 1971 | | | | | | | | 98 | % | | | 1,640 | |
| 5 Crossroads Apartments | | | 130 | | | | 1986 | | | | K/B | | | | 93 | % | | | 1,414 | |
| 6 River Terrace | | | 250 | | | | 2005 | | | | | | | | 96 | % | | | 2,043 | |
| 7 Lake Pines | | | 288 | | | | 2008 | | | | | | | | 96 | % | | | 1,522 | |
| 8 Bay Terrace | | | 120 | | | | 1962 | | | | | | | | 98 | % | | | 1,819 | |
| | | | | | | | | | | | | | | | |
Subtotal | | | 1,768 | | | | | | | | | | | | 96 | % | | | 1,785 | |
Non-Mature | | | | | | | | | | | | | | | | | | | | |
| (1) 2000 Post Street II | | | 24 | | | | 2006 | | | | K/B | | | | 63 | % | | | 2,412 | |
| (3) Highlands of Marin II | | | 104 | | | | 2008 | | | | Full | | | | 98 | % | | | 1,339 | |
| 9 Edgewater | | | 193 | | | | 2008 | | | | | | | | 98 | % | | | ~3,000 | |
| | | | | | | | | | | | | | | | |
Subtotal | | | 321 | | | | | | | | | | | | | | | | 2,418 | |
| | | | | | | | | | | | | | | | |
Grand Total | | | 2,089 | | | | | | | | | | | | | | | $ | 1,882 | |
| | | | | | | | | | | | | | | | |
*As of 1Q 2008
| | | | | | | | | | | | | | | | | | | | | |
| | | | | | | | | | Budgeted | | | Cost per | | | Expected | |
| Development Pipeline | | Expected Return | | | # of Homes | | | Cost | | | Home | | | Completion | |
| (8) Bay Terrace | | | 5.5%-6.0% | | | | 200 | | | $ | 78,906 | | | $ | 394,528 | | | | 2010 | |
| | | | | | | | | | | | | | | | | | | |
Total | | | | | | | 200 | | | $ | 78,906 | | | | | | | | | |
| | | | | | | | | | | | | | | | | | | |
14
| | |
| | Tampa
Market Fact Sheet |
Market Statistics & Peer Comparison
| | | | | |
| Tampa Portfolio | | Homes | |
| Same Store Pool | | | 3,081 | |
| Non-Matures | | | 209 | |
| Development Pipeline | | | 249 | |
| | | | |
Total | | | 3,593 | |
| 1Q08 Mo. Inc./ Home (SS) | | $ | 962 | |
| 1Q08 Occupancy | | | 95 | % |
Source: Company Reports
| | | | | | | | | |
| Company | | # of Homes | | | Ave. Rent | |
| UDR | | | 3,081 | | | $ | 962 | |
| CPT | | | 5,225 | | | | 855 | |
| MAA | | | 1,120 | | | | 852 | |
| EQR | | | 2,887 | | | | 823 | |
| AIV | | | 4,265 | | | | 796 | |
| | | | | | | |
| | | | 16,578 | | | $ | 854 | |
Sources: 1Q ’08 SSP Homes & Avg. Rent — Axiometrics;
Tampa is UDR’s
#4market, and is expected
to contribute6.4%of the
Company’s total net
operating income*
*EOY 2008 pro forma full portfolio NOI, including JV’s, planned acquisitions, developments, redevelopments, etc.
Tampa Market Statistics
| | | | | | | | | | | | | | | | | |
| 2008 Forecast | | | Low Home Affordability | | | Economy | |
| Effective Rent (Q4) | | $ | 869 | | | Ave. Market Rent | | $ | 854 | | | Population | | | 2,723,949 | |
| Occupancy Rate (Q4) | | | 92.1 | % | | Mo Payment: Entry Level*: | | | | | | Job Growth | | | -0.5 | % |
| Rental Rate Growth | | | -1.5 | % | | Home | | $ | 1,372 | | | Median Income | | $ | 53,900 | |
| Effective Rent (‘09F) | | $ | 878 | | | Condo | | $ | 1,129 | | | Housing Stock | | | | |
| Effective Rent (‘10F) | | $ | 896 | | | Median Home Price | | $ | 201,600 | | | Renter | | | 360,743 | |
| Multifamily Permits | | | 3,580 | | | Housing Affordability Index | | | 116.4 | | | % of Total | | | 27.9 | % |
Source: Axiometrics
* Assumes 30 yr fixed at 6.31%
Recent Activity
The Company has demonstrated success in creating additional value from its Tampa properties in a variety of ways:
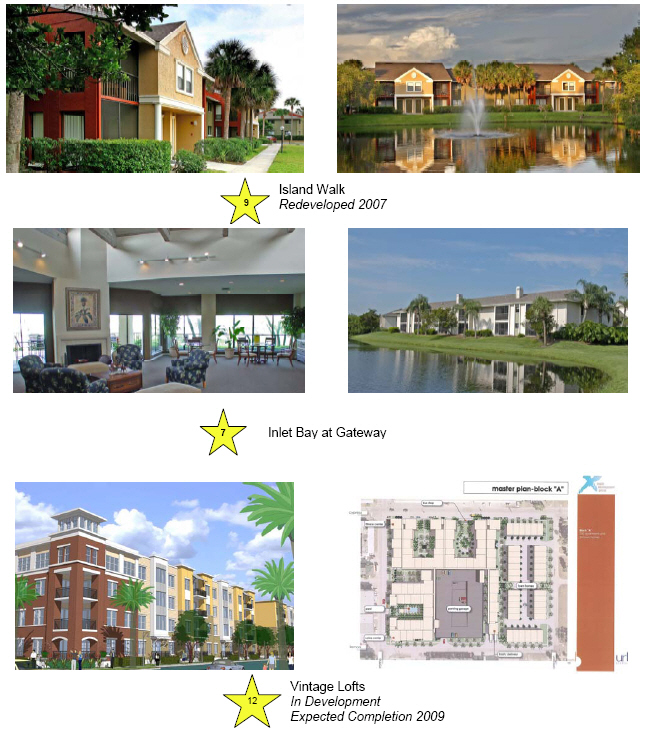
| | • | | Redevelopment — we recently completed full redevelopment of two communities totaling 609 units. In addition to the redevelopment program, we have completed more than 1,600 kitchen and bath renovations. |
| |
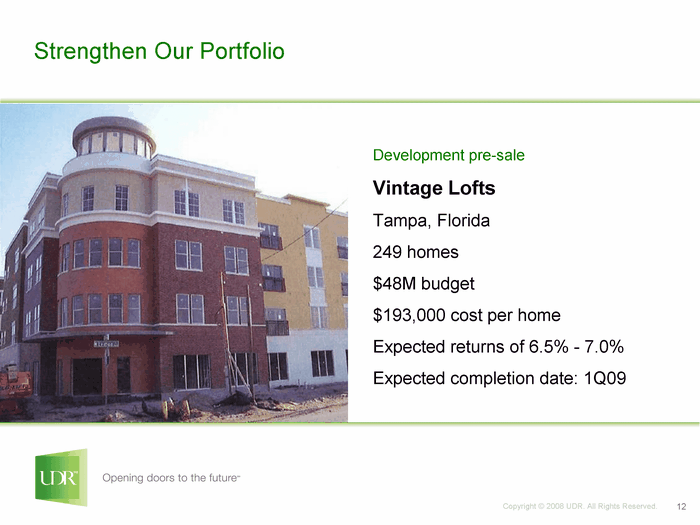
| | • | | New Development — We have a pre-sale agreement to purchase upon completion in 2009 a 249 home community, Vintage Lofts, at North Hyde Park in Tampa. The budgeted cost is $48.1M or $193,400 per home. |
Recent issues in the housing and lending sectors have slowed Tampa’s economy but AXIOMetrics forecasts solid job growth in a number of sectors, including education and health services, government, other services, leisure and hospitality and trade, transportation and utilities.
15
Tampa
Market Fact Sheet
16
Tampa
Market Fact Sheet
17
Tampa
Market Fact Sheet
| | | | | | | | | | | | | | | | | | | |
| | | | | | | Year Built | | | | | | | | | Inc. per Occ. | |
| Operating Properties | | # Homes | | | ReDev | | | Redev. | | Occupancy* | | | Home* | |
| 1 Summit West | | | 266 | | | | 1972 | | | — | | | 94 | % | | $ | 859 | |
| 2 Lakewood Place | | | 346 | | | | 1986 | | | K/B | | | 94 | % | | | 853 | |
| 3 Hunters Ridge | | | 352 | | | | 1992 | | | K/B | | | 90 | % | | | 841 | |
| 4 Bay Meadows | | | 288 | | | | 1985 | | | K/B | | | 98 | % | | | 992 | |
| 5 Cambridge Woods | | | 275 | | | | 1985 | | | K/B | | | 97 | % | | | 865 | |
| 6 Sugar Mill Creek | | | 212 | | | | 1988 | | | K/B | | | 94 | % | | | 907 | |
| 7 Inlet Bay at Gateway | | | 464 | | | | 1988 | | | Full | | | 97 | % | | | 990 | |
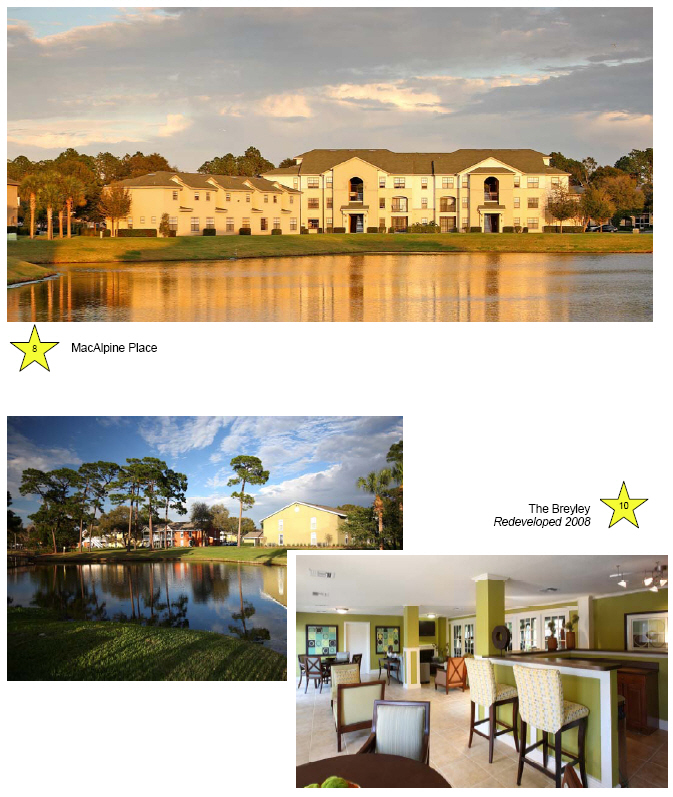
| 8 MacAlpine Place | | | 478 | | | | 2001 | | | — | | | 95 | % | | | 1,126 | |
| 9 Island Walk | | | 400 | | | | 1985 | | | Full | | | 93 | % | | | 1,073 | |
| | | | | | | | | | | | | | | |
Subtotal | | | 3,081 | | | | | | | | | | 95 | % | | | 962 | |
Non-Mature | | | | | | | | | | | | | | | | | | |
| 10 The Breyley Apartments | | | 209 | | | | 1977 | | | Full | | | 98 | % | | | 952 | |
| | | | | | | | | | | | | | | |
Subtotal | | | 209 | | | | | | | | | | 84 | % | | | 952 | |
| | | | | | | | | | | | | | | |
Grand Total | | | 3,290 | | | | | | | | | | | | | $ | 961 | |
| | | | | | | | | | | | | | | |
*As of 1Q 2008
| | | | | | | | | | | | | | | | | |
| | | Expected | | | | | | Budgeted | | | Cost per | | | Expected |
| Development Pipeline | | Return | | # of Homes | | | Cost | | | Home | | | Completion |
| 11 Vintage Lofts (Presale) | | 6.5%-7.0% | | | 249 | | | $ | 48,100 | | | $ | 193,400 | | | 2009 |
| | | | | | | | | | | | | | | |
Total | | | | | 249 | | | $ | 48,100 | | | | | | | |
| | | | | | | | | | | | | | | |
18
| | |
| | Seattle
Market Fact Sheet |
Market Statistics & Peer Comparison
| | | | | |
| Seattle Portfolio | | Homes | |
| Same Store Pool | | | 1,199 | |
| Non-Matures | | | 71 | |
| Development Pipeline | | | 704 | |
| | | | |
Total | | | 1,974 | |
| 1Q08 Mo. Inc./ Home (SS) | | $ | 1,117 | |
| 1Q08 Occupancy | | | 96 | % |
Source: Company Reports
| | | | | | | | | |
| Company | | # of Homes | | | Ave. Rent | |
| AVB | | | 2,892 | | | $ | 1,295 | |
| BRE | | | 3,068 | | | | 1,252 | |
| UDR | | | 1,280 | | | | 1,117 | |
| ESS | | | 4,553 | | | | 1,130 | |
| EQR | | | 6,967 | | | | 1,119 | |
| AIV | | | 364 | | | | 1,023 | |
| | | | | | | |
| | | | 19,124 | | | $ | 1,168 | |
Sources: 1Q ’08 SSP Homes & Avg. Rent — Axiometrics;
Seattle is UDR’s
#5market, expected to
contribute5.5%of the
Company’s total net
operating income*
*EOY 2008 pro forma full portfolio NOI, including JV’s, planned acquisitions, developments, redevelopments, etc.
Seattle Market Statistics
| | | | | | | | | | | | | | | | | |
| 2008 Forecast | | | Low Home Affordability | | | Economy | |
| Effective Rent (Q4) | | $ | 1,187 | | | Ave. Market Rent | | $ | 1,168 | | | Population | | | 2,536,182 | |
| Occupancy Rate (Q4) | | | 94.1 | % | | Mo Payment: Entry Level*: | | | | | | Job Growth | | | 2.9 | % |
| Rental Rate Growth | | | 0.5 | % | | Home | | $ | 2,274 | | | Median Income | | $ | 75,600 | |
| Effective Rent (‘09F) | | $ | 1,193 | | | Condo | | $ | 1,903 | | | Housing Stock | | | | |
| Effective Rent (‘10F) | | $ | 1,246 | | | Median Home Price | | $ | 377,500 | | | Renter | | | 396,722 | |
| Multifamily Permits | | | 8,476 | | | Housing Affordability Index | | | 91.8 | | | % of Total | | | 36.9 | % |
Source: Axiometrics
* Assumes 30 yr fixed at 6.31%
Recent Activity
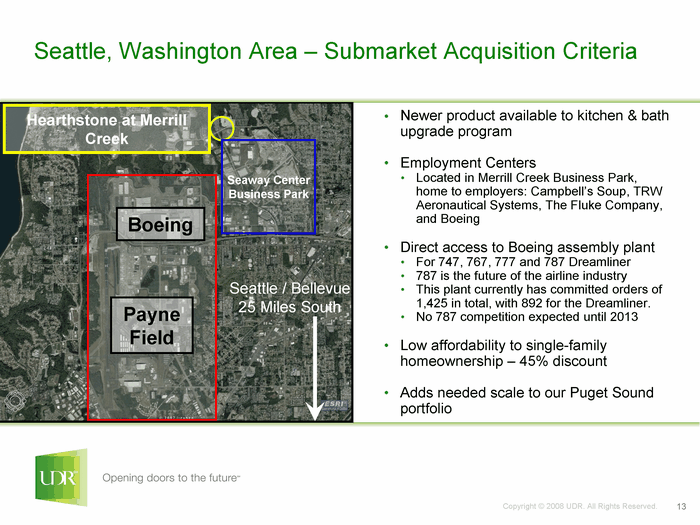
The Company has been expanding its presence in the Seattle/Bellevue market. Recent activity includes:
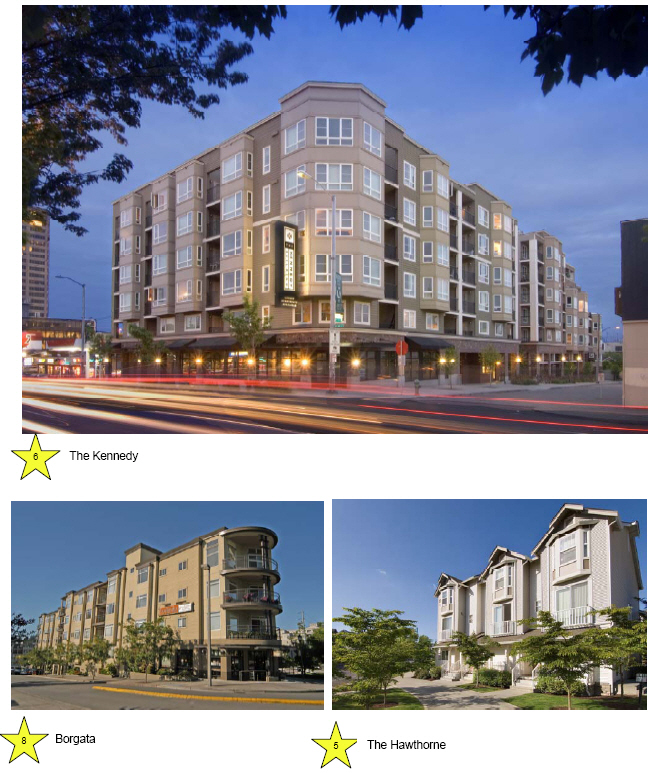
| | • | | Closing on a 49% joint venture interest in 989 Elements in January, 2007. This is a recently completed 23-story high-rise mixed use property located in the central business district of Bellevue with 166-apartment homes and 17,611 square feet of commercial space. |
| | • | | The acquisition of Borgata Apartments in May, 2007. This is a mixed-use community with 71-apartment homes and 5,358 square feet of retail space in Bellevue. The community was completed in 2001 and will be undergoing kitchen and bath upgrades. |
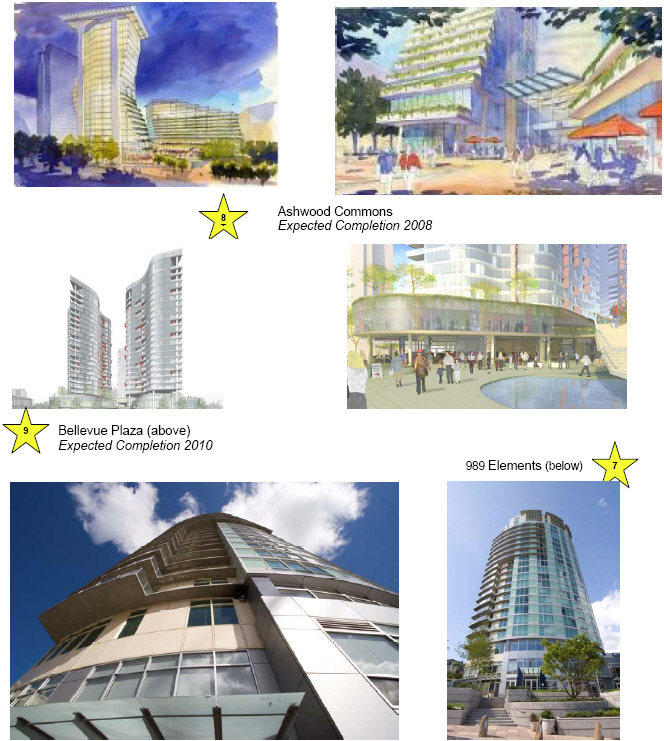
Two joint venture developments are underway with Su Development in which UDR has a 49% interest:
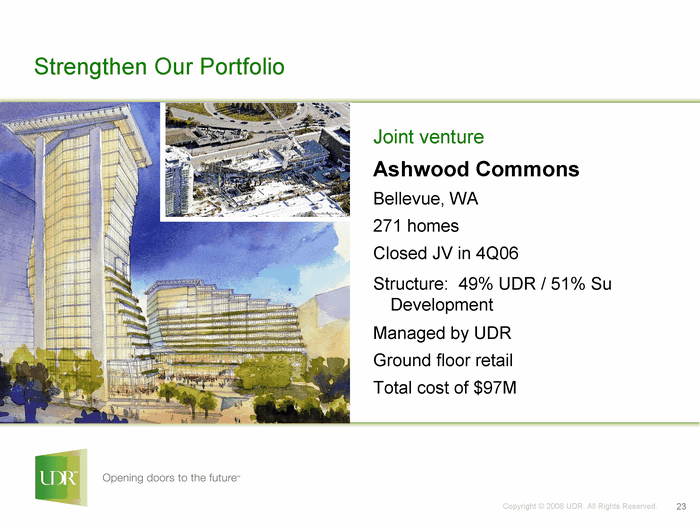
| | • | | Ashwood Commons, a 271 home high-rise community with ground floor retail. Construction is underway and expected completion is end of 2008. |
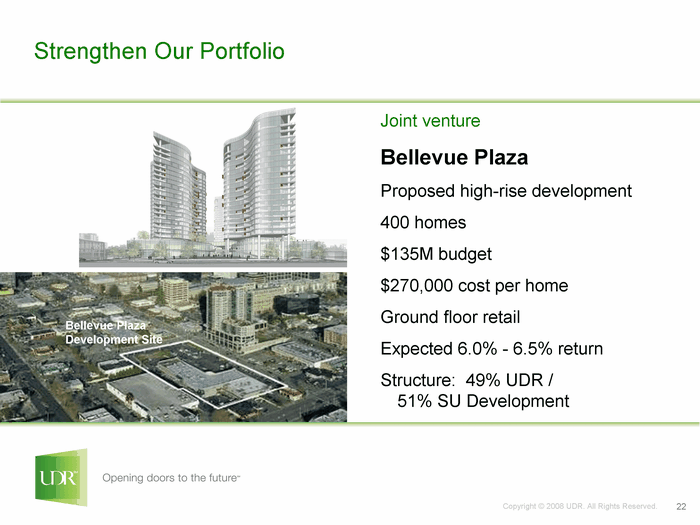
| | • | | Bellevue Plaza, a 400 home high rise community with ground floor retail. Construction is underway and completion is expected in late 2010. |
Seattle enjoys a strong and diverse local economy with a highly educated work force. 2007 job growth was 2.9% and AXIOMetrics forecasts 1.9% growth for 2008 and 2009, both approximately double their forecast for the U.S. average.
19
Seattle
Market Fact Sheet
20
Seattle
Market Fact Sheet
21
Seattle
Market Fact Sheet
| | | | | | | | | | | | | | | | | | | |
| | | | | | | Year Built | | | | | | | | | Inc. per Occ. | |
| Operating Properties | | # Homes | | | ReDev | | | Redev. | | Occupancy* | | | Home* | |
| 1 Hilltop | | | 156 | | | | 1985 | | | K/B | | | 97 | % | | $ | 959 | |
| 2 Crown Pointe | | | 196 | | | | 1987 | | | K/B | | | 97 | % | | | 918 | |
| 3 Arbor Terrace | | | 276 | | | | 1996 | | | K/B | | | 95 | % | | | 919 | |
| 4 Aspen Creek | | | 162 | | | | 1996 | | | — | | | 92 | % | | | 969 | |
| 5 The Hawthorne Apartments | | | 284 | | | | 2003 | | | — | | | 96 | % | | | 1,400 | |
| 6 The Kennedy Building | | | 125 | | | | 2005 | | | — | | | 96 | % | | | 1,604 | |
| | | | | | | | | | | | | | | |
Subtotal | | | 1,199 | | | | | | | | | | 95 | % | | | 1,117 | |
Non-Mature and Other | | | | | | | | | | | | | | | | | | |
| 7 989 Elements (JV) | | | 166 | | | | 2007 | | | | | | 94 | % | | | 2,105 | |
| 8 Borgata Apartment Homes | | | 71 | | | | 2007 | | | K/B | | | 93 | % | | | 2,352 | |
| | | | | | | | | | | | | | | |
Subtotal | | | 71 | * | | | | | | | | | | | | | 2,178 | |
| | | | | | | | | | | | | | | |
Grand Total | | | 1,270 | | | | | | | | | | | | | $ | 1,660 | |
| | | | | | | | | | | | | | | |
*As of 1Q 2008
| | | | | | | | | | | | | | | | | |
| | | | | # of | | | Budgeted Cost | | | Cost per | | | Expected |
| Development Pipeline | | Expected Return | | Homes | | | (000) | | | Home | | | Completion |
| 7 Ashwood Commons/Elements II | | 6.0%-6.5% | | | 274 | | | $ | 97,000 | | | $ | 358,000 | | | 2008 |
| 9 Bellevue Plaza | | 6.0%-6.5% | | | 430 | | | | 135,000 | | | $ | 270,000 | | | 2010 |
| | | | | | | | | | | | | | | |
Total | | | | | 704 | | | $ | 232,000 | | | | | | | |
| | | | | | | | | | | | | | | |
*Excludes joint venture homes
22
Baltimore
Market Fact Sheet
Market Statistics & Peer Comparison
| | | | | |
| Baltimore Portfolio | | Homes | |
| Same Store Pool | | | 1,556 | |
| Non-Matures | | | 564 | |
| Development Pipeline | | | — | |
| | | | |
Total | | | 2,120 | |
| 1Q08 Mo. Inc./ Home (SS) | | $ | 1,173 | |
| 1Q08 Occupancy | | | 97 | % |
Source: Company Reports
| | | | | | | | | |
| Company | | # of Homes | | | Ave. Rent | |
| CPT | | | 628 | | | $ | 1,436 | |
| AVB | | | 1,290 | | | | 1,205 | |
| AIV | | | 1,247 | | | | 1,186 | |
| UDR | | | 1,566 | | | | 1,173 | |
| EQR | | | 438 | | | | 1,082 | |
| HME | | | 4,715 | | | | 1,054 | |
| | | | | | | |
| | | | 9,884 | | | $ | 1,135 | |
Sources: 1Q ’08 SSP Homes & Avg. Rent — Axiometrics;
Baltimore is UDR’s
#6market, and is expected
to contribute5.3%of the
Company’s total net
operating income*
*EOY 2008 pro forma full portfolio NOI, including JV’s, planned acquisitions, developments, redevelopments, etc.
Baltimore Market Statistics
| | | | | | | | | | | | | | | | | | | | | | | | | | | | | |
| 2008 Forecast | | | Low Home Affordability | | | Economy | |
| Effective Rent (Q4) | | | | | | $ | 1,147 | | | Ave. Market Rent | | | | | | $ | 1,135 | | | Population | | | | | | | 2,668,056 | |
| Occupancy Rate (Q4) | | | | | | | 95.1 | % | | Mo Payment: Entry Level*: | | | | | | | | | | Job Growth | | | | | | | 0.9 | % |
| Rental Rate Growth | | | | | | | 2.5 | % | | Home | | | | | | $ | 1,865 | | | Median Income | | | | | | $ | 75,800 | |
| Effective Rent (‘09F) | | | | | | $ | 1,151 | | | Condo | | | | | | $ | 1,552 | | | Housing Stock | | | | | | | | |
| Effective Rent (‘10F) | | | | | | $ | 1,194 | | | Median Home Price | | | | | | $ | 275,100 | | | Renter | | | | | | | 344,827 | |
| Multifamily Permits | | | | | | | 1,515 | | | Housing Affordability Index | | | | | | | 120.3 | | | % of Total | | | | | | | 31.3 | % |
Source: Axiometrics
* Assumes 30 yr fixed at 6.31%
Recent Activity
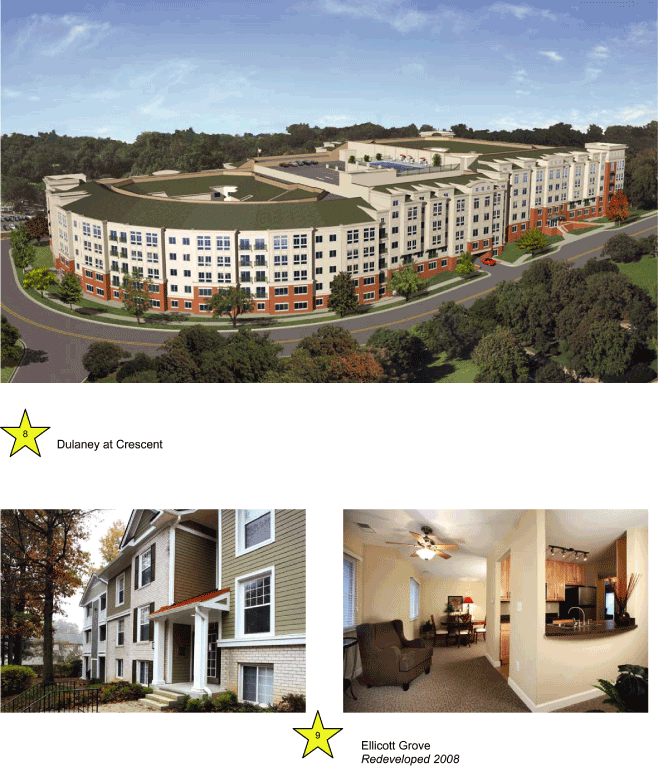
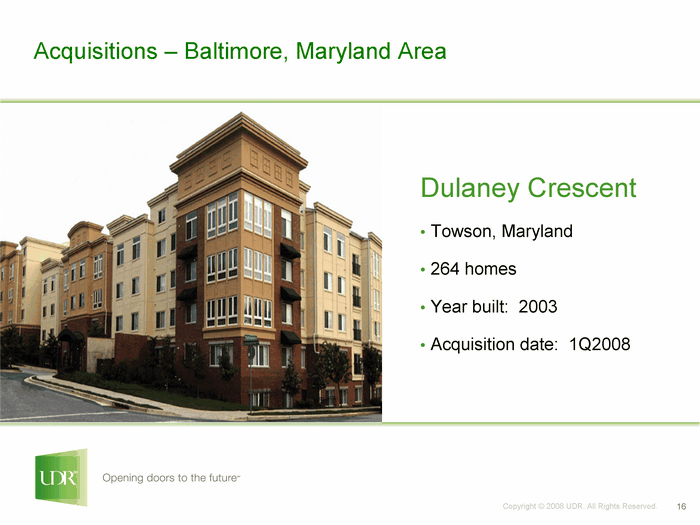
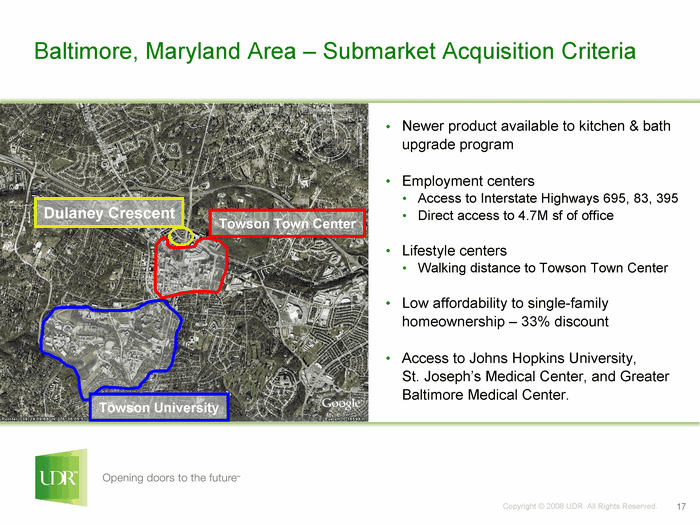
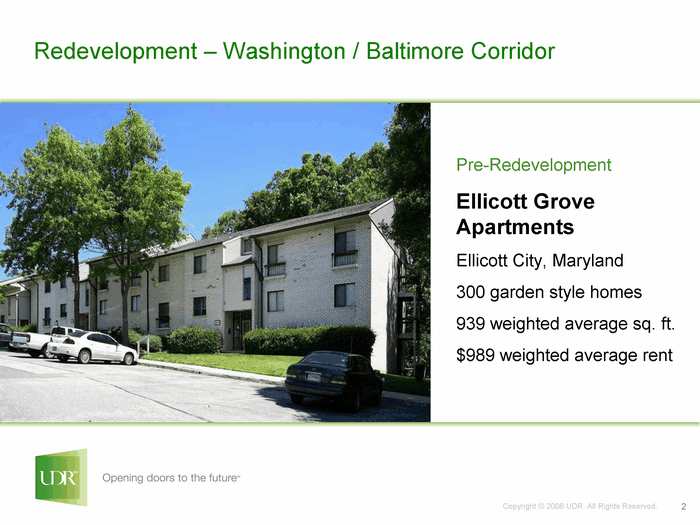
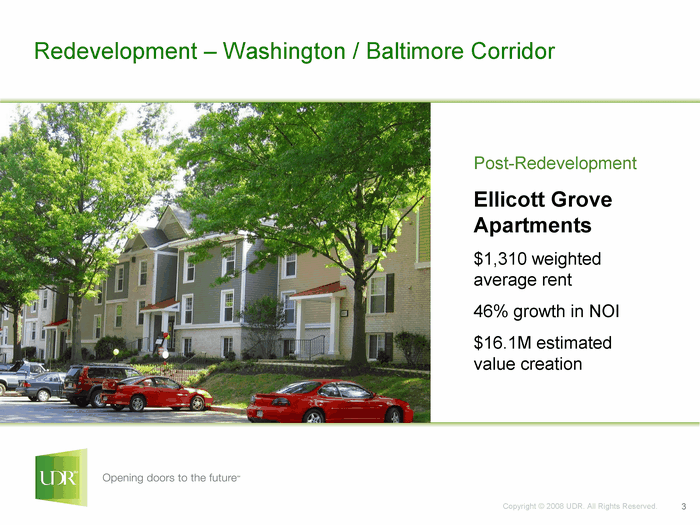
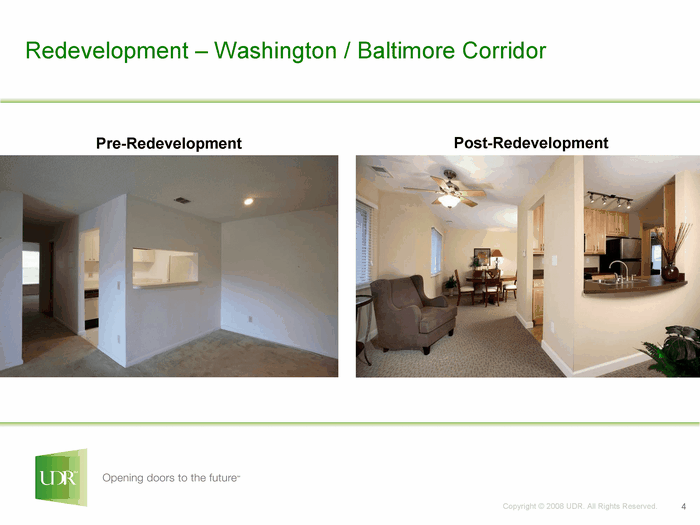
In the 1st quarter of 2008, we acquired Dulaney Crescent, a 264-home community in Towson, MD. The Company has demonstrated success in creating additional value in this market in a variety of ways:
| | • | | Redevelopment – we are nearing the completion of the full redevelopment of Dominion Great Oaks, a 300-home community now known as Ellicott Grove. This is expected to result in a 7.9% cash-on-cash return with a 43% growth in cash flow to $3.3 million, for total value creation of $16 million. |
In addition to the redevelopment program, we have completed more than 1,000 kitchen and bath renovations.
The area has a stable employment base led by substantial government jobs and institutional employment in the education and health sectors. The median existing home price is $275,100 making it less affordable than the national average.
23
Baltimore
Market Fact Sheet
| Dulaney At Crescent Ellicott Grove redeveloped 2008 |
24
Baltimore
Market Fact Sheet
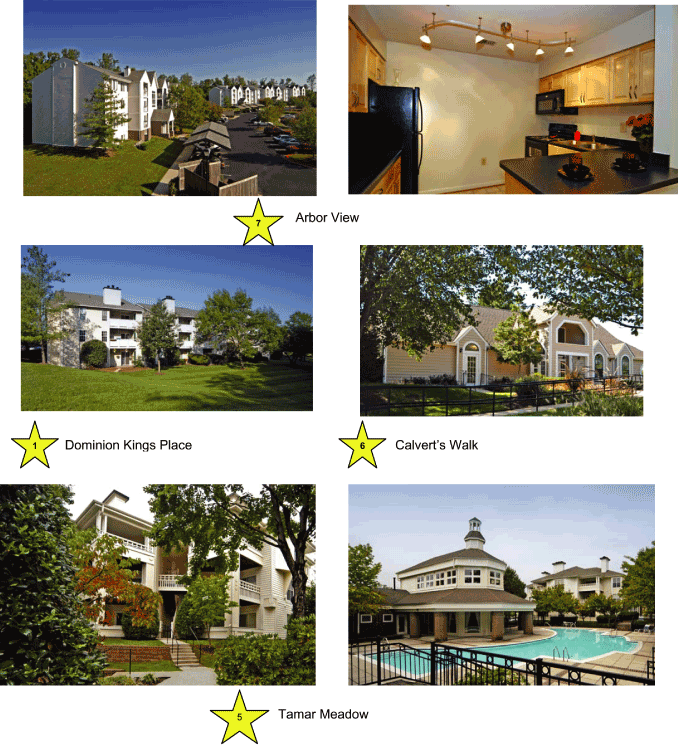
| Arbor View Dominion Kings Place Calvert’s Walk tamar Meadow |
25
Baltimore
Market Fact Sheet
| | | | | | | | | | | | | | | | | | | | | |
| | | | | | | Year Built | | | | | | | | | | | Inc. per Occ. | |
| Operating Properties | | # Homes | | | ReDev | | | Redev. | | | Occupancy* | | | Home* | |
| 1 Dominion Kings Place | | | 170 | | | | 1983 | | | | K/B | | | | 97 | % | | $ | 1,187 | |
| | | | | | | | | | | | | | | | |
| 2 Dominion at Eden Brook | | | 232 | | | | 1984 | | | | K/B | | | | 97 | % | | | 1,209 | |
| 3 Dominion Constant Friendship | | | 136 | | | | 1990 | | | | K/B | | | | 94 | % | | | 1,107 | |
| | | | | | | | | | | | | | | | |
| 4 Lakeside Mill | | | 192 | | | | 1989 | | | | K/B | | | | 98 | % | | | 1.104 | |
| 5 Tamar Meadow | | | 178 | | | | 1990 | | | | K/B | | | | 97 | % | | | 1,439 | |
| | | | | | | | | | | | | | | | |
| 6 Calvert’s Walk | | | 276 | | | | 1988 | | | | K/B | | | | 96 | % | | | 1,104 | |
| 7 Arborview | | | 372 | | | | 1992 | | | | K/B | | | | 97 | % | | | 1,129 | |
| | | | | | | | | | | | | | | | |
Subtotal | | | 1,556 | | | | | | | | | | | | 97 | % | | | 1,173 | |
*As of 1Q 2008 | | | | | | | | | | | | | | | | | | | | |
| Non-Mature and Other | | | | | | | | | | | | | | | | | | | | |
| 8 Dulaney Crescent | | | 264 | | | | 2003 | | | | | | | | 96 | % | | | 1,400 | |
| 9 Ellicott Grove | | | 300 | | | | 2008 | | | | | | | | 73 | % | | | 1,016 | |
| | | | | | | | | | | | | | | | |
Subtotal | | | 564 | | | | | | | | | | | | | | | | 1,196 | |
| | | | | | | | | | | | | | | | |
Grand Total | | | 2,120 | | | | | | | | | | | | | | | $ | 1,179 | |
| | | | | | | | | | | | | | | | |
26
| | |
| | Los Angeles County
Market Fact Sheet |
Market Statistics & Peer Comparison
| | | | | |
| LA County Portfolio | | Homes | |
| Same Store Pool | | | 1,052 | |
| Non-Matures | | | 328 | |
| Development Pipeline | | | 516 | |
| | | | |
Total | | | 1,896 | |
| 1Q08 Mo. Inc./ Home (SS) | | $ | 1,535 | |
| 1Q08 Occupancy | | | 95 | % |
Source: Company Reports
| | | | | | | | | |
| Company | | # of Homes | | | Ave. Rent | |
| AIV | | | 1,980 | | | $ | 2,266 | |
| CPT | | | 538 | | | | 2,013 | |
| AVB | | | 2,077 | | | | 1,914 | |
| ESS | | | 2,958 | | | | 1,892 | |
| BRE | | | 2,142 | | | | 1,797 | |
| EQR | | | 5,831 | | | | 1,691 | |
| UDR | | | 1,052 | | | | 1,535 | |
| | | | | | | |
| | | | 16,578 | | | $ | 1,838 | |
Sources: 1Q ’08 SSP Homes & Avg. Rent — Axiometrics;
LA County is UDR’s
#7market, and is expected
to contribute5.1%of the
Company’s total net
operating income*
*EOY 2008 pro forma full portfolio NOI, including JV’s, planned acquisitions, developments, redevelopments, etc.
LA County Market Statistics
| | | | | | | | | | | | | | | | | |
| 2008 Forecast | | | Low Home Affordability | | | Economy | |
| Effective Rent (Q4) | | $ | 1,838 | | | Ave. Market Rent | | $ | 1,838 | | | Population | | | 9,878,554 | |
| Occupancy Rate (Q4) | | | 95.2 | % | | Mo Payment: Entry Level*: | | | | | | Job Growth | | | 0.3 | % |
| Rental Rate Growth | | | 0.4 | % | | Home | | $ | 3,024 | | | Median Income | | $ | 56,500 | |
| Effective Rent (‘09F) | | $ | 1,860 | | | Condo | | $ | 2,546 | | | Housing Stock | | | | |
| Effective Rent (‘10F) | | $ | 1,931 | | | Median Home Price | | $ | 521,000 | | | Renter | | | 1,681,679 | |
| Multifamily Permits | | | 10,806 | | | Housing Affordability Index | | | 48.5 | % | | % of Total | | | 50.1 | % |
Source: Axiometrics
* Assumes 30 yr fixed at 6.31%
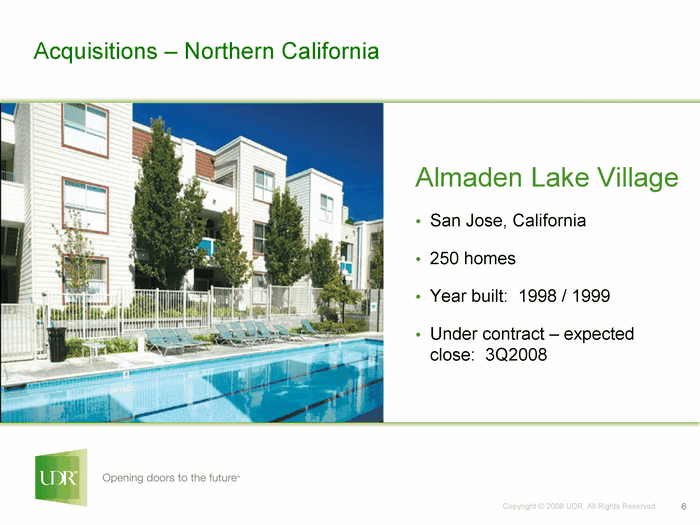
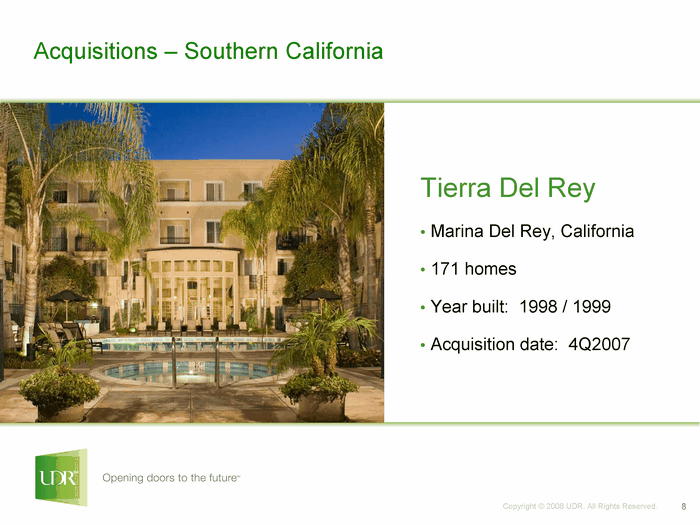
Recent Activity
UDR is expanding its presence in this market with one recent acquisition and two new developments:
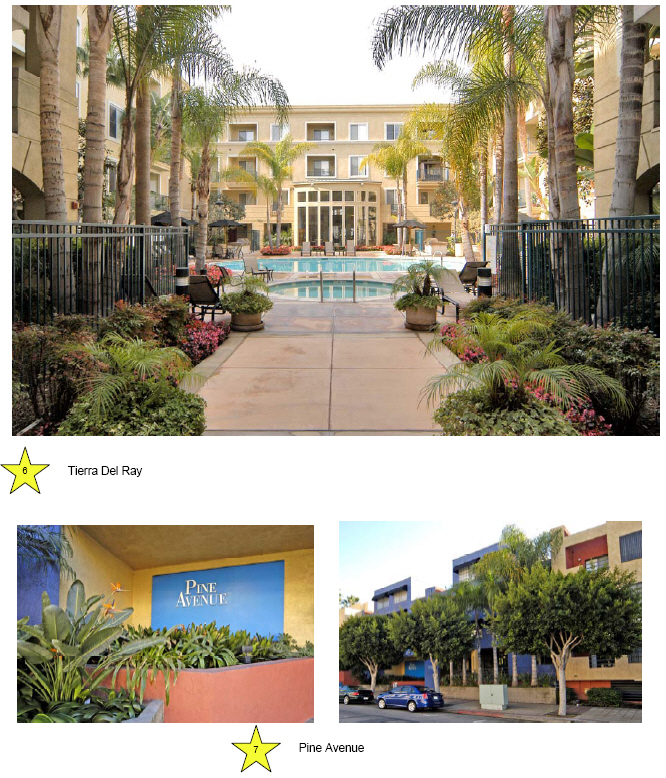
| | • | | Tierra Del Rey, Marina del Ray, CA — 170-home community acquired in Q4 2007 for $76 million. Built in 1999, this community is undergoing a kitchen and bath renovation. |
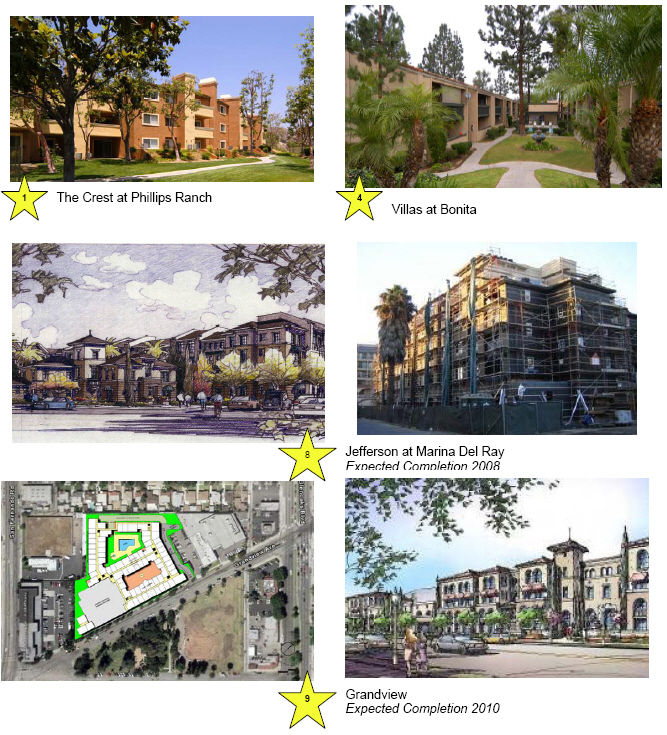
| | • | | Jefferson at Marina del Rey — 298 homes at an average cost of $463,000 per home, being developed in a joint venture with JPI. Completion is expected in the first quarter, 2008. |
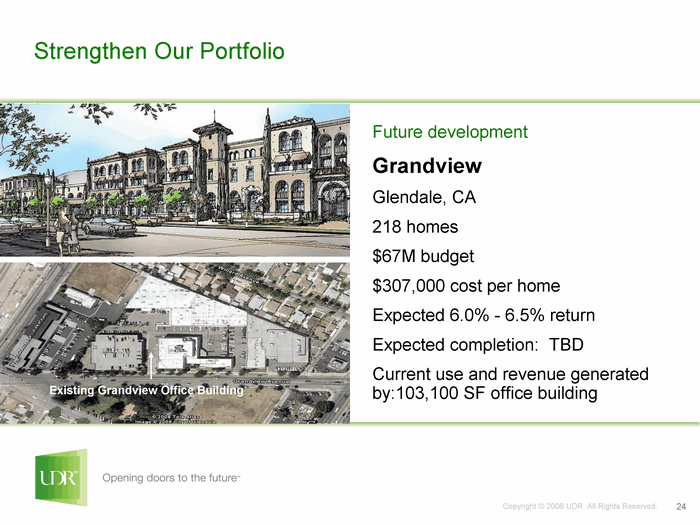
| | • | | Grandview, Glendale, CA — wholly owned development of 218 homes at an average cost of $307,000 per home, expected to yield a return of 6.0% — 6.5%. This project is underway with an expected completion of late 2009. |
The local economy has recently softened, however key local industries including Leisure and Hospitality, Other Services, and Education and Health Services, the entertainment sector and the ports of Los Angeles and Long Beach remain strong. The region enjoys a highly educated work force and an attractive year round climate affording a variety of recreational activities.
The median existing home price is $521,000 placing it among the least affordable markets in the U.S.
27
Los Angeles County
Market Fact Sheet
28
Los Angeles County
Market Fact Sheet
29
Los Angeles County
Market Fact Sheet
| | | | | | | | | | | | | | | | | | | |
| | | | | | | Year Built | | | | | | | | | Inc. per Occ. | |
| Operating Properties | | # Homes | | | ReDev | | | Redev. | | Occupancy* | | | Home* | |
| 1 The Crest at Phillips Ranch | | | 501 | | | | 1989 | | | K/B | | | 97 | % | | $ | 1,616 | |
| 2 Rosebeach | | | 174 | | | | 1970 | | | K/B | | | 95 | % | | | 1,429 | |
| 3 The Villas at San Dimas | | | 156 | | | | 1981 | | | K/B | | | 93 | % | | | 1,497 | |
| 4 The Villas at Bonita | | | 102 | | | | 1981 | | | | | | 95 | % | | | 1,472 | |
| 5 Ocean Villas | | | 119 | | | | 1965 | | | | | | 95 | % | | | 1,440 | |
| | | | | | | | | | | | | | | |
Subtotal | | | 1,052 | | | | | | | | | | 95 | % | | | 1,535 | |
Non-Mature and Other | | | | | | | | | | | | | | | | | | |
| 6 Tierra del Rey | | | 170 | | | | 1999 | | | K/B | | | 92 | % | | | 2,605 | |
| 7 Pine Avenue | | | 158 | | | | 1987 | | | Full | | | 69 | % | | | 1,348 | |
| | | | | | | | | | | | | | | |
Subtotal | | | 328 | | | | | | | | | | | | | $ | 2,089 | |
| | | | | | | | | | | | | | | |
Grand Total | | | 1,380 | | | | | | | | | | | | | | | |
| | | | | | | | | | | | | | | |
*As of 1Q 2008
| | | | | | | | | | | | | | | | | |
| | | | | # of | | | Budgeted | | | Cost per | | | Expected |
| Development Pipeline | | Expected Return | | Homes | | | Cost ($000) | | | Home | | | Completion |
| 8 Marina Del Rey | | 5.5% - 6.0% | | | 298 | | | $ | 138,000 | | | $ | 463,087 | | | 2008 |
| 9 Grandview | | | | | 218 | | | | 67,419 | | | $ | 309,261 | | | 2010 |
| | | | | | | | | | | | | | | |
Total | | | | | 516 | | | $ | 205,419 | | | | | | | |
| | | | | | | | | | | | | | | |
30
| | |
| | | |
 | |
Orlando
Market Fact Sheet |
Market Statistics & Peer Comparison
| | | | | |
| Orlando Portfolio | | Homes | |
| Same Store Pool | | | 2,140 | |
| Non-Matures | | | 1,027 | |
| Development Pipeline | | | 395 | |
| | | | |
Total | | | 3,562 | |
| 1Q08 Mo. Inc./ Home (SS) | | $ | 983 | |
| 1Q08 Occupancy | | | 92 | % |
Source: Company Reports
| | | | | | | | | |
| Company | | # of Homes | | | Ave. Rent | |
| CLP | | | 2,251 | | | $ | 996 | |
| UDR | | | 2,140 | | | | 983 | |
| CPT | | | 3,296 | | | | 925 | |
| EQR | | | 7,296 | | | | 902 | |
| AIV | | | 3,888 | | | | 851 | |
| MAA | | | 288 | | | | 839 | |
| | | | | | | |
| | | | 19,159 | | | $ | 915 | |
Sources: 1Q ’08 SSP Homes & Avg. Rent — Axiometrics;
Orlando is UDR’s
#8market, and is expected
to contribute4.8%of the
Company’s total net
operating income*
*EOY 2008 pro forma full portfolio NOI, including JV’s, planned acquisitions, developments, redevelopments, etc.
Orlando Market Statistics
| | | | | | | | | | | | | | | | | |
| 2008 Forecast | | | Low Home Affordability | | | Economy | |
| Effective Rent (Q4) | | $ | 920 | | | Ave. Market Rent | | $ | 915 | | | Population | | | 2,032,496 | |
| Occupancy Rate (Q4) | | | 93.2 | % | | Mo Payment: Entry Level*: | | | | | | Job Growth | | | 1.7 | % |
| Rental Rate Growth | | | -1.2 | % | | Home | | $ | 1,570 | | | Median Income | | $ | 54,900 | |
| Effective Rent (‘09F) | | $ | 910 | | | Condo | | $ | 1,299 | | | Housing Stock | | | | |
| Effective Rent (‘10F) | | $ | 921 | | | Median Home Price | | $ | 240,400 | | | Renter | | | 274,932 | |
| Multifamily Permits | | | 7,309 | | | Housing Affordability Index | | | 91.8 | % | | % of Total | | | 32.2 | % |
Source: Axiometrics
* Assumes 30 yr fixed at 6.31%
Recent Activity
UDR has demonstrated success in creating addition value from its Orlando properties in a variety of ways:
| | • | | Redevelopment – we recently completed full redevelopment of two communities: Altamira Place and Canopy Villas (656 units). |
| |
| | • | | Kitchen and Bath Program: We’ve completed more than 800 kitchen and bath renovations at an average cost of $13,800 and are realizing an average annual return of 9.8%. |
| |
| | • | | New Development: This included a presale agreement to purchase upon completion a 370 home community, The Place at Millenia in Orlando. In the first quarter of 2008, we completed the purchase at a cost of $50.1M or $135,127 per home. |
Orlando’s economy has been impacted by the housing slump and high fuel prices; however, Real Data reports that in the past year the area added over 18,000 new jobs, with education and health services and professional and business services as the fastest growing industries. The local economy in influenced by the leisure and hospitality industry but is diversified with significant employment in the transportation and utility sectors as well.
31
Orlando
Market Fact Sheet
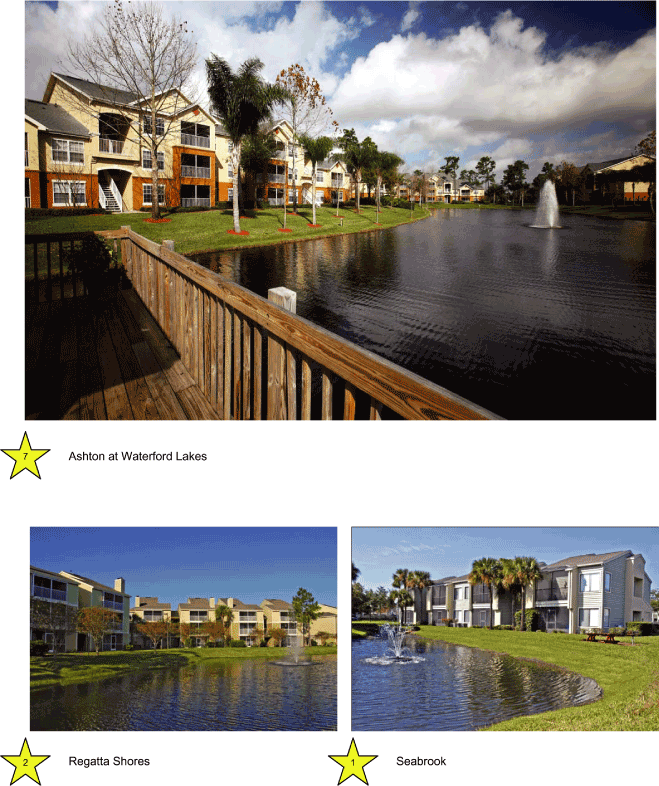
| Ashton At Waterford Lakes Regatta Shores Seabrook |
32
Orlando
Market Fact Sheet
| Altamira Place - Redeveloped 2007 Canopy Villas - Redeveloped 2008 Millenia Mail Phase I - Completed 2008 Phase II - Expected Completion 2010 |
33
Orlando
Market Fact Sheet
| | | | | | | | | | | | | | | | | | | | | |
| | | | | | | Year Built | | | | | | | | | | | Inc. per Occ. | |
| Operating Properties | | # Homes | | | ReDev | | | Redev. | | | Occupancy* | | | Home* | |
| 1 Seabrook | | | 200 | | | | 2004 | | | | | | | | 88 | % | | $ | 999 | |
| 2 Regatta Shores | | | 256 | | | | 2007 | | | Full | | | 90 | % | | | 827 | |
| 3 Alafaya Woods | | | 296 | | | | 2006 | | | Full | | | 91 | % | | | 998 | |
| 4 Los Altos | | | 328 | | | | 2004 | | | K/B | | | 94 | % | | | 964 | |
| 5 Lotus Landing | | | 260 | | | | 2006 | | | K/B | | | 95 | % | | | 889 | |
| 6 Seville on the Green | | | 170 | | | | 2004 | | | | | | | | 97 | % | | | 984 | |
| 7 Ashton at Waterford Lakes | | | 292 | | | | 2000 | | | Full | | | 94 | % | | | 1,175 | |
| 8 Arbors at Lee Vista | | | 338 | | | | 2007 | | | K/B | | | 90 | % | | | 997 | |
| | | | | | | | | | | | | | | | |
Subtotal | | | 2,140 | | | | | | | | | | | | 92 | % | | | 983 | |
Non-Mature and Other | | | | | | | | | | | | | | | | | | | | |
| 9 Altamira Place | | | 360 | | | | 2007 | | | Full | | | 96 | % | | | 943 | |
| 10 Canopy Villas | | | 296 | | | | 2008 | | | Full | | | 87 | % | | | 978 | |
| 11 The Place at Millenia (Lease-up) | | | 370 | | | | 2007 | | | Full | | | n/a | | | | n/a | |
| | | | | | | | | | | | | | | | |
Subtotal | | | 1,027 | | | | | | | | | | | | | | | $ | 958 | |
| | | | | | | | | | | | | | | | |
Grand Total | | | 3,167 | | | | | | | | | | | | | | | $ | 977 | |
| | | | | | | | | | | | | | | | |
*As of 1Q 2008
| | | | | | | | | | | | | | | | | | | | | |
| | | | | | | # of | | | Budgeted | | | Cost per | | | Expected | |
| Development Pipeline | | Expected Return | | | Homes | | | Cost $000) | | | Home | | | Completion | |
| 11 The Place at Millenia -Phase II | | 6.0% - 6.5% | | | 395 | | | $ | 64,276 | | | $ | 162,724 | | | | 2010 | |
| | | | | | | | | | | | | | | | | | | |
Total | | | | | | | 395 | | | $ | 64,276 | | | | | | | | | |
| | | | | | | | | | | | | | | | | | | |
34
| | |
| | Richmond
Market Fact Sheet |
Market Statistics & Peer Comparison
| | | | | |
| Richmond Portfolio | | Homes | |
| Same Store Pool | | | 1,958 | |
| Non-Matures | | | 253 | |
| Development Pipeline | | | — | |
| | | | |
Total | | | 2,211 | |
| 1Q08 Mo. Inc./ Home (SS) | | $ | 987 | |
| 1Q08 Occupancy | | | 92 | % |
Source: Company Reports
| | | | | | | | | |
| Company | | # of Homes | | | Ave. Rent | |
| UDR | | | 2,211 | | | $ | 987 | |
| AIV | | | 744 | | | | 903 | |
| CLP | | | 1,368 | | | | 812 | |
| | | | | | | |
| | | | 4,323 | | | $ | 917 | |
Sources: 1Q ‘08 SSP Homes & Avg. Rent — Axiometrics;
Richmond is UDR’s
#9market, and is expected
to contribute4.6%of the
Company’s total net
operating income*
| | |
| * | EOY 2008 pro forma full portfolio NOI, including JV’s, planned acquisitions, developments, redevelopments, etc. |
Richmond Market Statistics
| | | | | | | | | | | | | | | | | | | | | | | | | |
| 2008 Forecast | | | Low Home Affordability | | | | | Economy | |
| Effective Rent (Q4) | | | | $ | 900 | | | Ave. Market Rent | | $ | | | 917 | | | | | Population | | | | | 1,212,977 | |
| Occupancy Rate (Q4) | | | | | 94.1 | % | | Mo Payment: Entry Level*: | | | | | | | | | | Job Growth | | | | | 1.0 | % |
| Rental Rate Growth | | | | | 2.0 | % | | Home | | $ | | | 1,482 | | | | | Median Income | | | | $ | 68,700 | |
| Effective Rent (‘09F) | | | | $ | 910 | | | Condo | | $ | | | 1,224 | | | | | Housing Stock | | | | | | |
| Effective Rent (‘10F) | | | | $ | 933 | | | Median Home Price | | $ | | | 225,700 | | | | | Renter | | | | | 155,191 | |
| Multifamily Permits | | | | | 1,062 | | | Housing Affordability Index | | | | | 134.3 | % | | | | % of Total | | | | | 30.8 | % |
Source: Axiometrics
| | |
| * | Assumes 30 yr fixed at 6.31% |
Recent Activity
UDR’s apartment communities in the Richmond market are in excellent locations and the Company has invested to modernize the homes in several ways:
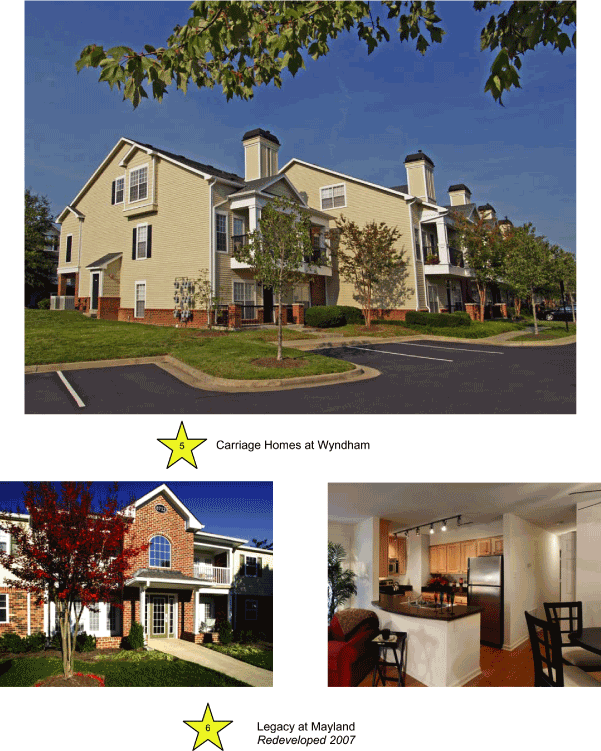
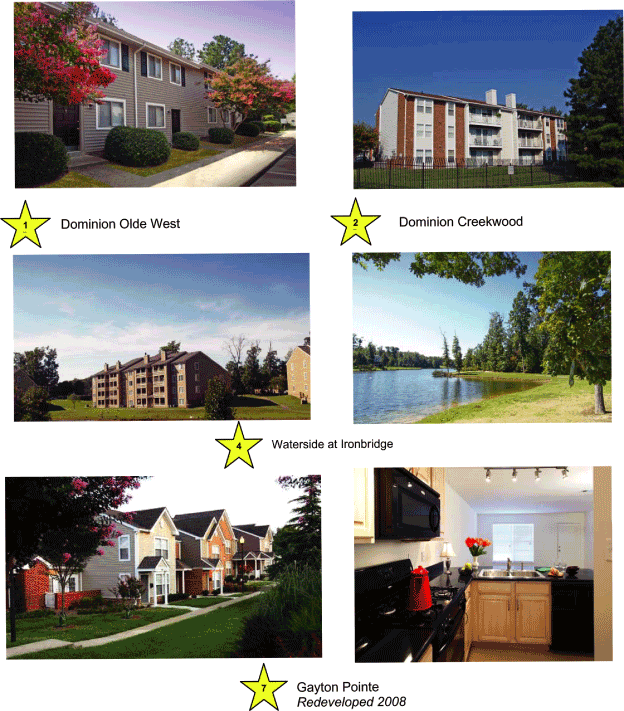
| | • | | Redevelopment: Two communities, Legacy at Mayland and Gayton Pointe Townhomes, have been completely redeveloped. Legacy at Mayland completed in late 2006, produced an increase in cash flow of 85% and estimated value creation of $33.6M. Construction at Gayton Pointe has recently been completed with focus on lease-up activities. Once stabilized, we expect a 7.7% return on incremental capital invested with an estimated $17M in value created. |
| |
| | • | | Kitchen and Bath Program: Over 1,300 kitchen and bath renovations have been completed at an average cost of $9,604, and are yielding an average annual return of 11.9%. |
Richmond has a diversified economy with significant employment in the government sector and in trade, transportation and utilities. Job growth is expected to be 0.4% in 2009 and 1.6% in 2010.
35
Richmond
Market Fact Sheet
| Carriage Homes At Wyndham Legacy at Mayland Redeveloped 2007 |
36
Richmond
Market Fact Sheet
| Dominion Olde West Dominion Creekwood Waterside at Ironbridge gayton Pointe Redeveloped 2008 |
37
Richmond
Market Fact Sheet
| | | | | | | | | | | | | | | | | | | | | |
| | | | | | | Year Built | | | | | | | | | | | Inc. per Occ. | |
| Operating Properties | | # Homes | | | ReDev | | | Redev. | | | Occupancy* | | | Home* | |
| 1 Dominion Olde West | | | 287 | | | | 1978 | | | Full | | | 96 | % | | $ | 883 | |
| 2 Dominion Creekwood | | | 216 | | | | 1984 | | | | K/B | | | | 95 | % | | | 850 | |
| 3 Dominion West End | | | 350 | | | | 1989 | | | | K/B | | | | 97 | % | | | 962 | |
| 4 Waterside at Ironbridge | | | 265 | | | | 1987 | | | | K/B | | | | 95 | % | | | 945 | |
| 5 Carriage House at Wyndham | | | 264 | | | | 1998 | | | | K/B | | | | 93 | % | | | 1,275 | |
| 6 Legacy at Mayland | | | 576 | | | | 2007 | | | Full | | | 96 | % | | | 998 | |
| | | | | | | | | | | | | | | | |
Subtotal | | | 1,958 | | | | | | | | | | | | 96 | % | | | 987 | |
| | | | | | | | | | | | | | | | |
*As of 1Q 2008 | | | | | | | | | | | | | | | | | | | | |
Non-Mature | | | | | | | | | | | | | | | | | | | | |
| 7 Gayton Pointe Townhomes | | | 253 | | | | 2007 | | | Full | | | 67 | % | | | 1,010 | |
| | | | | | | | | | | | | | | | |
Subtotal | | | 253 | | | | | | | | | | | | | | | | 1,010 | |
| | | | | | | | | | | | | | | | |
Grand Total | | | 2,211 | | | | | | | | | | | | | | | $ | 990 | |
| | | | | | | | | | | | | | | | |
38
| | |
| | Dallas
Market Fact Sheet |
Market Statistics & Peer Comparison
| | | | | |
| Dallas Portfolio | | Homes | |
| Same Store Pool | | | 305 | |
| Non-Matures | | | 4,147 | |
| Development Pipeline | | | 6,903 | |
| | | | |
Total | | | 11,355 | |
| 1Q08 Mo. Inc./ Home (SS) | | $ | 1,609 | |
| 1Q08 Occupancy | | | 91 | % |
Source: Company Reports
| | | | | | | | | |
| Company | | # of Homes | | | Ave. Rent | |
| UDR | | | 680 | | | $ | 1,609 | |
| EQR | | | 3,643 | | | | 902 | |
| CPT | | | 5,191 | | | | 747 | |
| AIV | | | 2,385 | | | | 733 | |
| MAA | | | 3,195 | | | | 731 | |
| CLP | | | 2,710 | | | | 722 | |
| | | | | | | |
| | | | 17,429 | | | $ | 786 | |
Sources: 1Q ’08 SSP Homes & Avg. Rent — Axiometrics;
Dallas is UDR’s
#10market and is expected
to contribute4.0%of the
Company’s total net
operating income*
| | | |
| * EOY 2008 pro forma full portfolio NOI, including JV’s, planned acquisitions, developments, redevelopments, etc. |
Dallas Market Statistics
| | | | | | | | | | | | | | | | | | | | | | | | | |
| 2008 Forecast | | | Low Home Affordability | | | | | Economy | |
| Effective Rent (Q4) | | | | $ | 859 | | | Ave. Market Rent | | | | $ | 786 | | | | | Population | | | | | 4,111,529 | |
| Occupancy Rate (Q4) | | | | | 94.1 | % | | Mo Payment: Entry Level*: | | | | | | | | | | Job Growth | | | | | 2.8 | % |
| Rental Rate Growth | | | | | 2.1 | % | | Home | | | | $ | 1,097 | | | | | Median Income | | | | $ | 62,200 | |
| Effective Rent (‘09F) | | | | $ | 849 | | | Condo | | | | $ | 894 | | | | | Housing Stock | | | | | | |
| Effective Rent (‘10F) | | | | $ | 871 | | | Median Home Price | | | | $ | 145,000 | | | | | Renter | | | | | 601,729 | |
| Multifamily Permits | | | | | 10,804 | | | Housing Affordability Index | | | | | 168.1 | | | | | % of Total | | | | | 39.0 | % |
Source: Axiometrics
| | |
| * Assumes 30 yr fixed at 6.31% |
Recent Activity
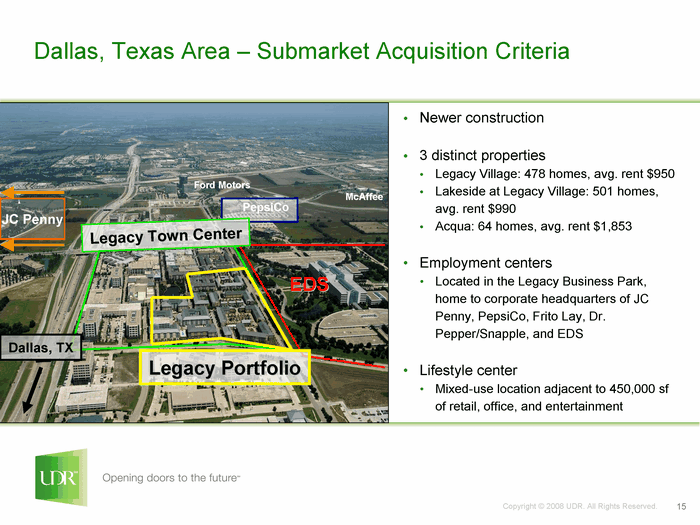
The Company has been active in the Dallas market in a variety of ways:
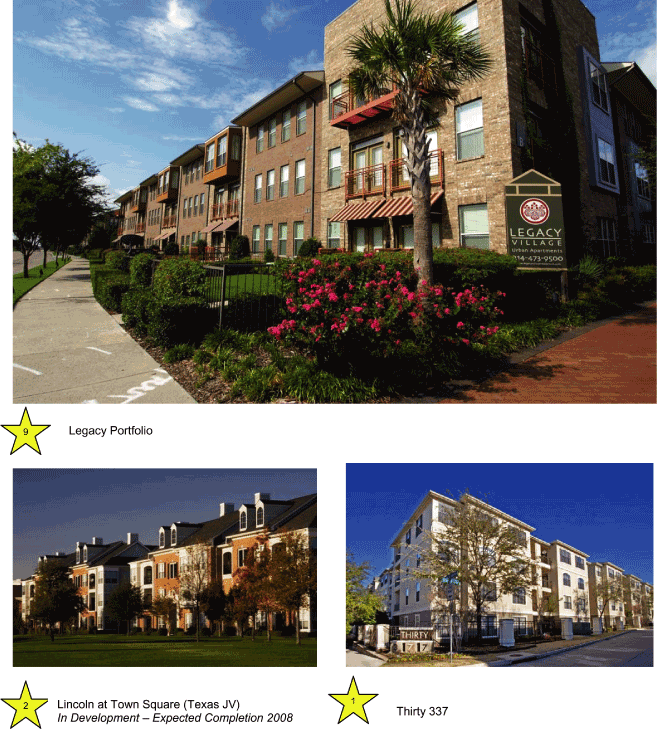
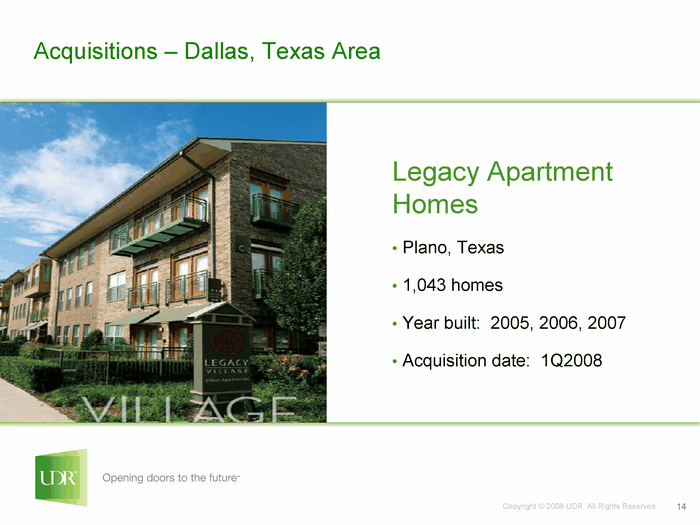
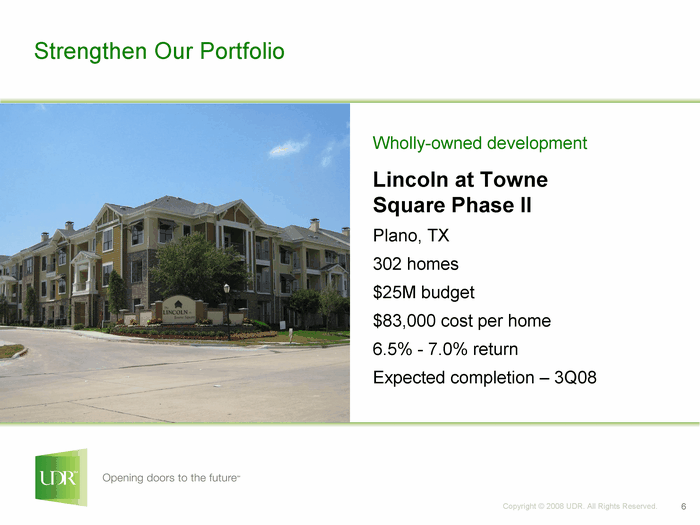
| | • | | In the first quarter of 2008, we acquired Legacy Village (three communities) consisting of 1,043 homes in the Plano submarket. |
| |
| | • | | At Thirty 377, we have completed 70 kitchen and bath renovations at an average cost of $18,869 and we are realizing an average annual return of 11.8%. |
| |
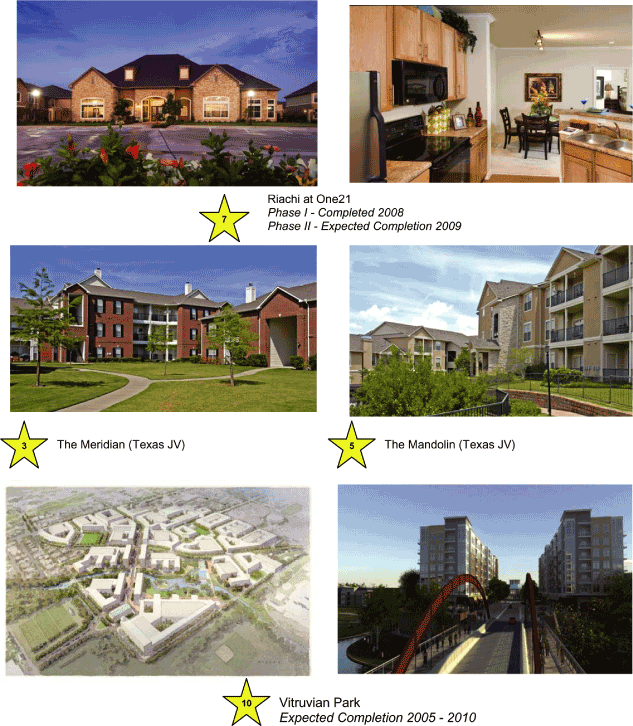
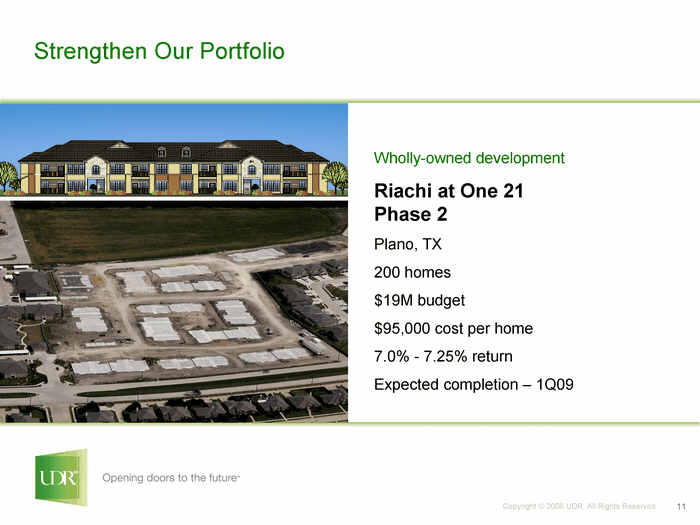
| | • | | Construction of 202 homes at Riachi at One21 in the Dallas suburb of Plano was completed in the fourth quarter of 2007. Construction of 198 units in Phase II of the community has begun and completion is anticipated 1Q2009. |
| |
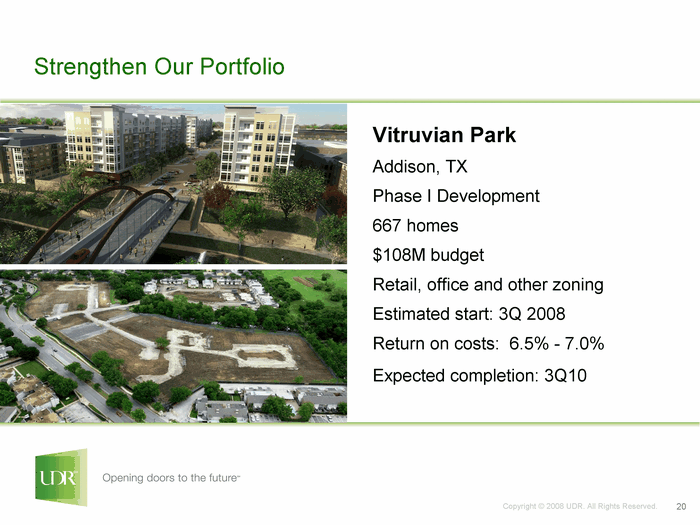
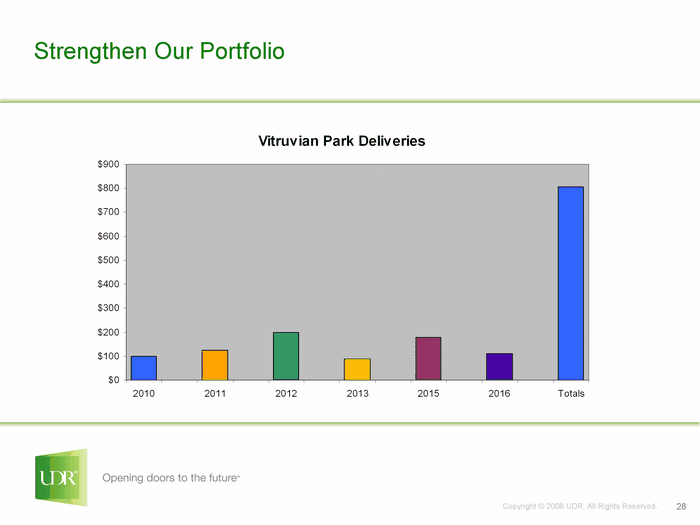
| | • | | An assemblage of 99 acres in Addison, named Vitruvian Park, was completed in the second quarter of 2007. The city of Addison has approved doubling the density to over 5,500 homes and zoning for 500,000 square feet of retail and office space. The Company anticipates that the development will be completed in conjunction with one or more institutional investors. |
The Dallas economy is diverse with significant employment in the energy sector, trade, transportation, government, education and the health sector.
39
Dallas
Market Fact Sheet
| Legacy Portfolio Lincoin at Town Square (Texas JV) In Development - expected Completion 2008 Thirty 337 |
40
Dallas
Market Fact Sheet
| Riachi at One 21 Phase I - Completed 2008 Phase II - Expected Completion 2009 The Meridian (Texas JV) The Mandolin (Texas JV) Vitruvian Park Expected Completion 2005 - 2010 |
41
Dallas
Market Fact Sheet
| | | | | | | | | | | | | | | | | | | | | |
| Operating Properties | | # Homes | | | Year Built
ReDev | | | Redev. | | | Occupancy* | | | Rent per Occ.
Home* | |
| 1 Thirty377 | | | 305 | | | | 2007 | | | | K/B | | | | 91 | % | | $ | 1,609 | |
| | | | | | | | | | | | | | | | |
Subtotal | | | 305 | | | | | | | | | | | | 91 | % | | | 1,609 | |
| | | | | | | | | | | | | | | | | | | | | |
Non-Mature* | | | | | | | | | | | | | | | | | | | | |
| 6 Villas at Ridgeview | | | 48 | | | | 2007 | | | | | | | | 69 | % | | | 1,872 | |
| 7 Riachi at One21 - Phase I | | | 202 | | | | 2007 | | | | | | | | 75 | % | | | 902 | |
| 8 Highlands of Preston | | | 380 | | | | 2007 | | | | | | | | 87 | % | | | 758 | |
| 9 Legacy Village | | | 1,043 | | | | ’05-‘07 | | | | | | | | 92 | % | | | 1,000 | |
| 10 Addison/Vitruvian Park (In demolition) | | | 1,987 | | | | | | | | | | | | | | | | | |
| | | | | | | | | | | | | | | | |
Subtotal | | | 4,147 | | | | | | | | | | | | 84 | % | | | 955 | |
| | | | | | | | | | | | | | | | |
Grand Total | | | 4,452 | | | | | | | | | | | | | | | $ | 1,003 | |
| | | | | | | | | | | | | | | | | | | | | |
| Development Pipeline | | Expected Return | | | # of
Homes | | | Budgeted
Cost ($000) | | | Cost per
Home | | | Expected
Completion | |
| 10 Addison/Vitruvian Park | | | 6.5%-7.0% | | | | 5,949 | | | $ | 805,000 | | | $ | 135,343 | | | | 2009-2015 | |
| (7) Riachi at One21 - Phase II | | | 7.5%-8.0% | | | | 200 | | | | 18,955 | | | | 94,775 | | | | 2009 | |
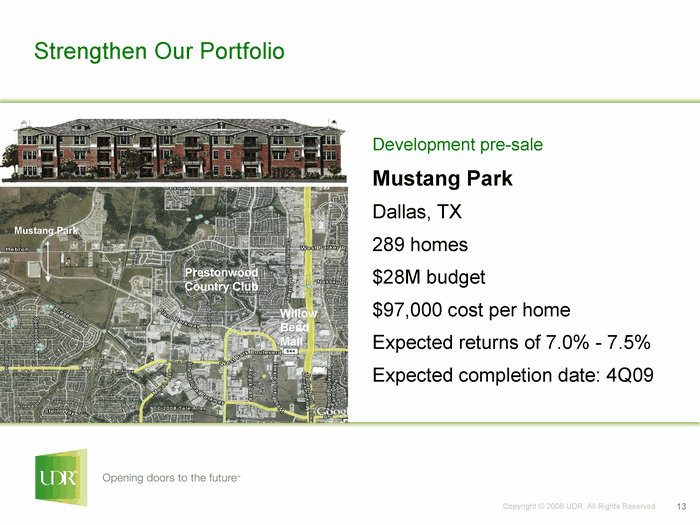
| 11 Mustang Park | | | 7.0%-7.5% | | | | 289 | | | | 29,000 | | | | 100,346 | | | | 2009 | |
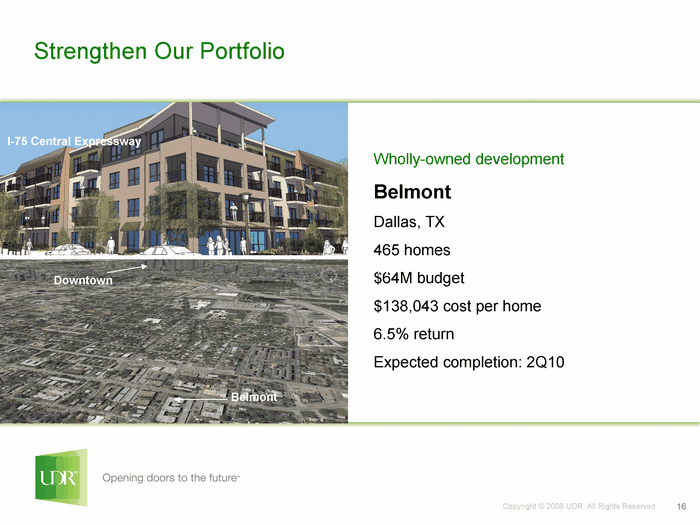
| 12 Belmont (formerly Bennett) | | | 6.5%-7.0% | | | | 465 | | | | 63,000 | | | $ | 135,484 | | | | 2010 | |
| | | | | | | | | | | | | | | | | | | |
Total | | | | | | | 6,903 | | | $ | 915,955 | | | | | | | | | |
| | | | | | | | | | | | | | | | | | | |
| | | |
| * | Stars 2-5 designate Texas JV properties; non-mature properties subtotal includes 487 homes in other Texas markets. |
42
| | |
| | | |
| |
Nashville
Market Fact Sheet |
Market Statistics & Peer Comparison
| | | | | |
| Nashville Portfolio | | Homes | |
| Same Store Pool | | | 1,874 | |
| Non-Matures | | | 386 | |
| Development Pipeline | | | — | |
| | | | |
Total | | | 2,260 | |
| 1Q08 Mo. Inc./ Home (SS) | | $ | 869 | |
| 1Q08 Occupancy | | | 96 | % |
Source: Company Reports
| | | | | | | | | |
| Company | | # of Homes | | | Ave. Rent | |
| EQR | | | 396 | | | $ | 949 | |
| UDR | | | 1,874 | | | | 869 | |
| AIV | | | 2,166 | | | | 815 | |
| MAA | | | 1,855 | | | | 785 | |
| | | | | | | |
| | | | 6,291 | | | $ | 831 | |
Sources: 1Q ‘08 SSP Homes & Avg. Rent — Axiometrics;
Nashville is UDR’s
#11market, and is expected
to contribute3.5%of the
Company’s total net
operating income*
*EOY 2008 pro forma full portfolio NOI, including JV’s, planned acquisitions, developments, redevelopments, etc.
Recent Activity
Nashville Market Statistics
| | | | | | | | | | | | | | | | | |
| 2008 Forecast | | | Low Home Affordability | | | Economy | |
| Effective Rent (Q4) | | $ | 830 | | | Ave. Market Rent | | $ | 831 | | | Population | | | 1,521,437 | |
| Occupancy Rate (Q4) | | | 93.2 | % | | Mo Payment: Entry Level*: | | | | | | Job Growth | | | 1.3 | % |
| Rental Rate Growth | | | -0.2 | % | | Home | | $ | 1,041 | | | Median Income | | $ | 60,100 | |
| Effective Rent (‘09F) | | $ | 832 | | | Condo | | $ | 846 | | | Housing Stock | | | | |
| Effective Rent (‘10F) | | $ | 853 | | | Median Home Price | | $ | 154,700 | | | Renter | | | 200,811 | |
| Multifamily Permits | | | 1,744 | | | Housing Affordability Index | | | 159.7 | | | % of Total | | | 32.0 | % |
Source: Axiometrics
* Assumes 30 yr fixed at 6.31%
UDR has demonstrated success in creating addition value from its Nashville properties in a variety of ways:
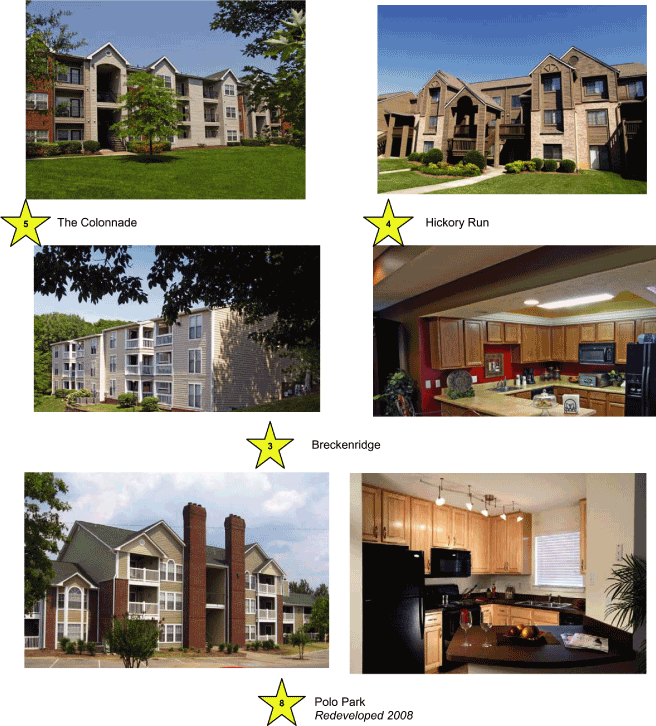
| | • | | Redevelopment — we are nearing the completion of the full redevelopment of Polo Park, a 386 home community we purchased for $20.9M or $54,082 per home in 2006. It is expected to deliver a cash on cash return of 7.9%, an increase in total cash flow of 48% for total value creation of $4 million. |
| |
| | • | | Kitchens/Baths — In addition to the redevelopment program, we have completed over 800 kitchen and bath renovations at an average cost of $12,113 and are yielding an average annual return of 10.3%. |
Nashville has a diversified economy with significant employment in trade, transportation and utilities and education and health activity. The median existing home price is $154,700 making it more affordable than the national average.
43
Nashville
Market Fact Sheet
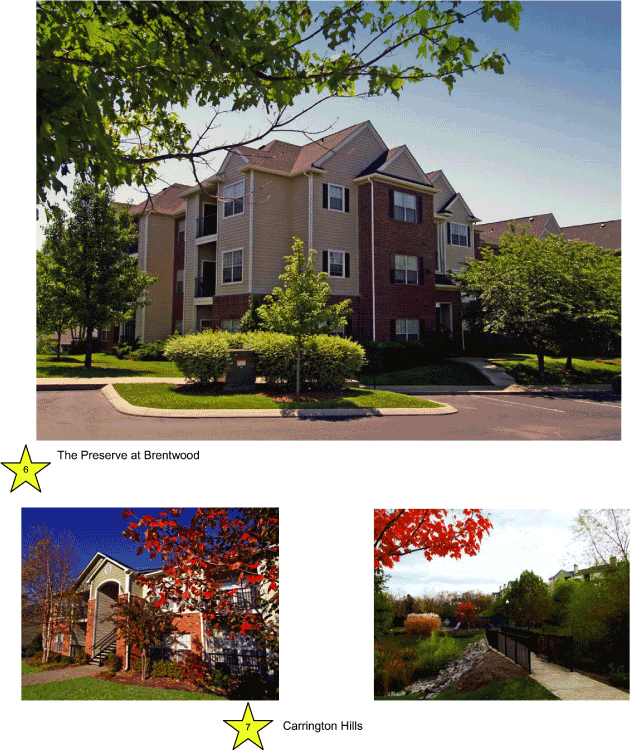
| The Preserve at Brentwood Carrington Hills |
44
Nashville
Market Fact Sheet
| The Colonnade Hickory Run Breckenridge Polo ParkRedeveloped 2008 |
45
Nashville
Market Fact Sheet
| | | | | | | | | | | | | | | | | | | |
| | | | | | | Year Built | | | | | | | | | Inc. per Occ. | |
| Operating Properties | | # Homes | | | ReDev | | | Redev. | | Occupancy* | | | Home* | |
| 1 Legacy Hill | | | 206 | | | | 1977 | | | K/B | | | 97 | % | | $ | 856 | |
| 2 Brookridge | | | 176 | | | | 1986 | | | K/B | | | 95 | % | | | 744 | |
| 3 Breckenridge | | | 190 | | | | 1986 | | | K/B | | | 96 | % | | | 762 | |
| 4 Hickory Run | | | 294 | | | | 1989 | | | K/B | | | 97 | % | | | 785 | |
| 5 The Colonnade | | | 288 | | | | 1998 | | | K/B | | | 95 | % | | | 813 | |
| 6 The Preserve at Brentwood | | | 360 | | | | 1998 | | | K/B | | | 97 | % | | | 987 | |
| 7 Carrington Hills | | | 360 | | | | 1999 | | | K/B | | | 95 | % | | | 987 | |
| | | | | | | | | | | | | | | |
Subtotal | | | 1,874 | | | | | | | | | | 96 | % | | | 869 | |
*As of 1Q 2008 | | | | | | | | | | | | | | | | | | |
Non-Mature | | | | | | | | | | | | | | | | | | |
| 8 Polo Park | | | 386 | | | | 1987 | | | Full | | | 71 | % | | | 696 | |
| | | | | | | | | | | | | | | |
Subtotal | | | 386 | | | | | | | | | | 71 | % | | | 696 | |
| | | | | | | | | | | | | | | |
Grand Total | | | 2,260 | | | | | | | | | | | | | $ | 846 | |
| | | | | | | | | | | | | | | |
46
| | | |
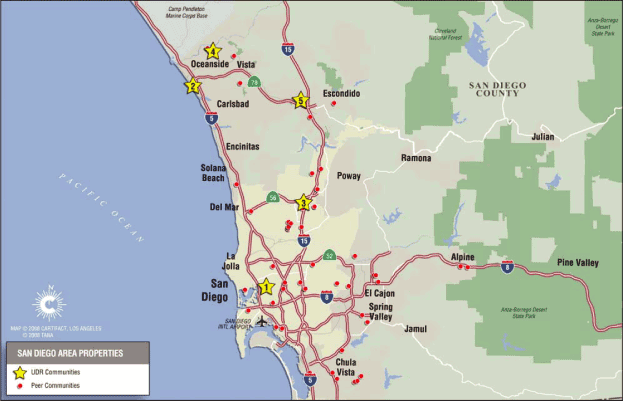
| | San Diego County
Market Fact Sheet
|
Market Statistics & Peer Comparison
| | | | | |
| San Diego Portfolio | | Homes | |
| Same Store Pool | | | 1,123 | |
| Non-Matures | | | — | |
| Development Pipeline | | | — | |
| | | | |
Total | | | 1,123 | |
| 1Q08 Mo. Inc./ Home (SS) | | $ | 1,368 | |
| 1Q08 Occupancy | | | 94 | % |
Source: Company Reports
| | | | | | | | | |
| Company | | # of Homes | | | Ave. Rent | |
| CPT | | | 582 | | | $ | 1,734 | |
| BRE | | | 3,711 | | | | 1,546 | |
| EQR | | | 4,000 | | | | 1,527 | |
| AVB | | | 1,057 | | | | 1,433 | |
| AIV | | | 1,830 | | | | 1,379 | |
| UDR | | | 1,123 | | | | 1,368 | |
| ESS | | | 2,984 | | | | 1,114 | |
| | | | | | | |
| | | | 15,287 | | | $ | 1.423 | |
Sources: 1Q ‘08 SSP Homes & Avg. Rent — Axiometrics;
San Diego is UDR’s
#12market, and is expected
to contribute3.1%of the
Company’s total net
operating income*
*EOY 2008 pro forma full portfolio NOI, including JV’s, planned acquisitions, developments, redevelopments, etc.
San Diego Market Statistics
| | | | | | | | | | | | | | | | | |
| 2008 Forecast | | | Low Home Affordability | | | Economy | |
| Effective Rent (Q4) | | $ | 1,418 | | | Ave. Market Rent | | $ | 1,423 | | | Population | | | 2,974,859 | |
| Occupancy Rate (Q4) | | | 94.8 | % | | Mo Payment: Entry Level*: | | | | | | Job Growth | | | 0.4 | % |
| Rental Rate Growth | | | -0.8 | % | | Home | | $ | 2,867 | | | Median Income | | $ | 69,400 | |
| Effective Rent (‘09F) | | $ | 1,417 | | | Condo | | $ | 2,411 | | | Housing Stock | | | | |
| Effective Rent (‘10F) | | $ | 1,460 | | | Median Home Price | | $ | 500,000 | | | Renter | | | 469,302 | |
| Multifamily Permits | | | 3,287 | | | Housing Affordability Index | | | 63.0 | | | % of Total | | | 41.7 | % |
Source: Axiometrics
* Assumes 30 yr fixed at 6.31%
Recent Activity
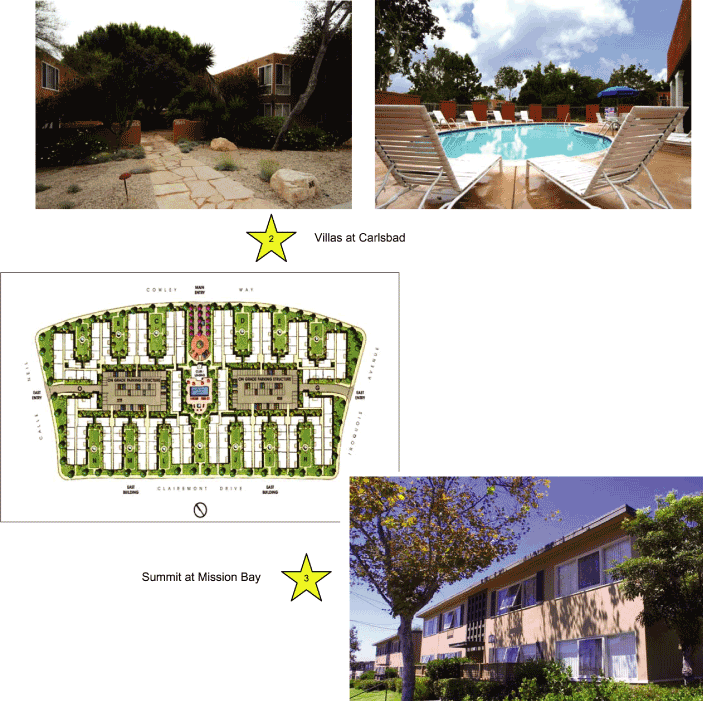
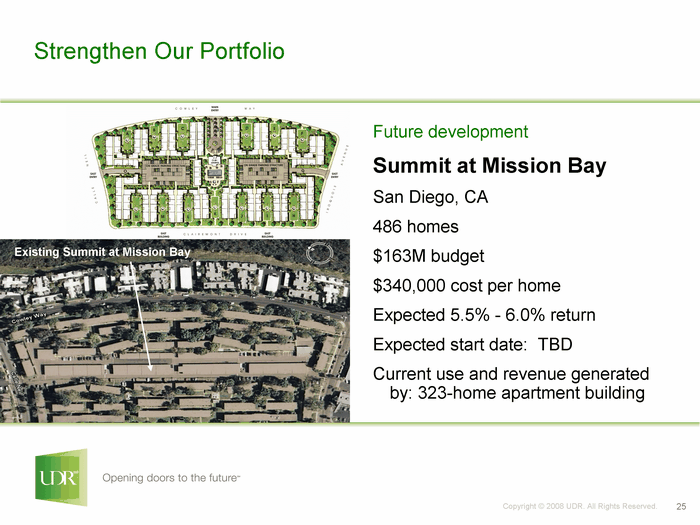
UDR expects to expand its presence in this market, with plans underway to add 49 new apartment homes to Presidio at Rancho Del Oro, in Oceanside. In addition, there are plans to tear down and rebuild The Summit at Mission Bay, making it multiple levels with subterranean parking. This will increase the size of the property by 135 apartment homes and offer ocean views.
The company continues to improve its existing homes through the Kitchen and Bath program:
| | • | | 230 kitchen and bath renovations have been completed at an average cost of $6,000 to $7,000 with an annualized average return of 21.6%. The average increase in market rent is $150.00. |
The local housing market has softened and home ownership less is attainable. While San Diego County experienced a loss of jobs in 2007 due to fall out of the sub prime market, as well as loss of construction starts, it continues to be an attractive place to live with its diverse population, highly skilled and educated workforce, as well as several military bases. In addition the climate is very mild year round and provides multiple options for outdoor activities and tourism.
47
San Diego County
Market Fact Sheet
48
San Diego County
Market Fact Sheet
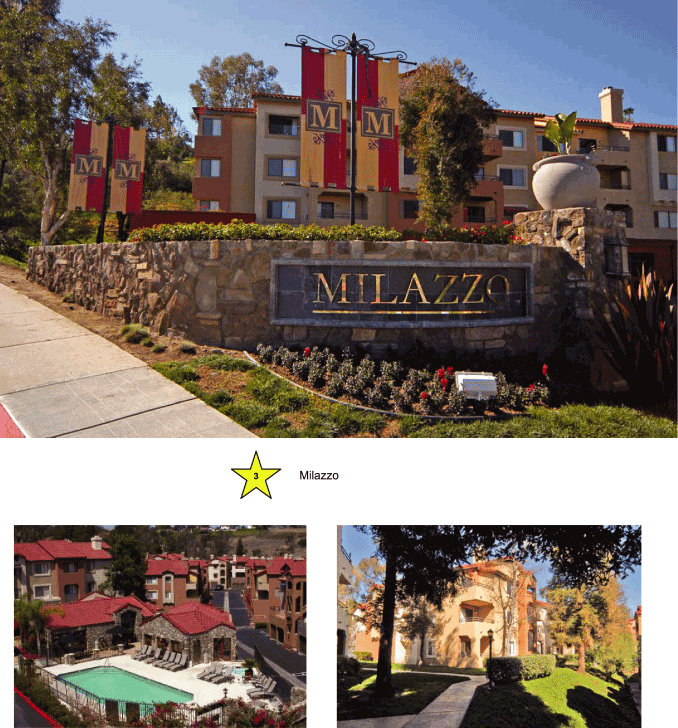
| Villas at Carlsbad Summit at Mission Bay |
49
San Diego County
Market Fact Sheet
| | | | | | | | | | | | | | | | | | | |
| | | | | | | Year Built | | | | | | | | | Inc. per Occ. | |
| Operating Properties | | # Homes | | | ReDev | | | Redev. | | Occupancy* | | | Home* | |
| 1 Presidio at Rancho del Oro | | | 264 | | | | 1987 | | | K/B | | | 91 | % | | $ | 1,268 | |
| 2 Villas at Carlsbad | | | 102 | | | | 1966 | | | K/B | | | 91 | % | | | 1,536 | |
| 3 Summit at Mission Bay | | | 323 | | | | 1953 | | | — | | | 96 | % | | | 1,264 | |
| 4 Rancho Vallecitos | | | 184 | | | | 1988 | | | K/B | | | 94 | % | | | 1,464 | |
| 5 Milazzo | | | 250 | | | | 1986 | | | K/B | | | 94 | % | | | 1,474 | |
| | | | | | | | | | | | | | | |
Grand Total | | | 1,123 | | | | | | | | | | 94 | % | | $ | 1,368 | |
| | | | | | | | | | | | | | | |
*As of 1Q 2008
50
| | | |
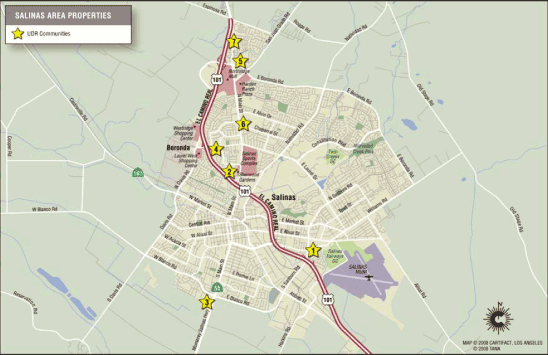
| | Monterey/Salinas
Market Fact Sheet
|
Market Statistics & Peer Comparison
| | | | | |
| Monterey Portfolio | | Homes | |
| Same Store Pool | | | 1,565 | |
| Non-Matures | | | — | |
| Development Pipeline | | | — | |
| | | | |
Total | | | 1,565 | |
| 1Q08 Mo. Inc./ Home (SS) | | $ | 999 | |
| 1Q08 Occupancy | | | 92 | % |
Source: Company Reports
Monterey is UDR’s
#13market, and is expected
to contribute3.1%of the
Company’s total net
operating income*
*EOY 2008 pro forma full portfolio NOI, including JV’s, planned acquisitions, developments, redevelopments, etc.
Monterey Market Statistics
| | | | | | | | | | | | | | | | | |
| 2008 Forecast | | | Low Home Affordability | | | Economy | |
| Effective Rent (Q4) | | $ | 1,108 | | | Ave. Market Rent | | $ | 999 | | | Population | | | 407,637,000 | |
| Occupancy Rate (Q4) | | | 92.4 | % | | Mo Payment: Entry Level*: | | | | | | Job Growth | | | 2.2 | % |
| Rental Rate Growth | | | 1.1 | % | | Home | | $ | 2,930 | | | Median Income | | $ | 63,400 | |
| Effective Rent (‘09F) | | $ | 1,116 | | | Condo | | $ | 2,465 | | | Housing Stock | | | | |
| Effective Rent (‘10F) | | $ | 1,142 | | | Median Home Price | | $ | 520,000 | | | Renter | | | 59,382 | |
| Multifamily Permits | | | 243 | | | Housing Affordability Index | | | 55.9 | | | % of Total | | | 42.8 | % |
Source: Axiometrics
* Assumes 30 yr fixed at 6.31%
Recent Activity
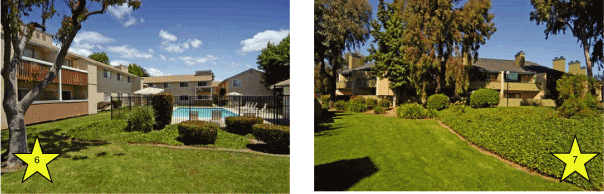
UDR’s Monterey portfolio consists of 1,565 apartment homes in seven communities in Salinas, CA. Average rents are $1,000.
The Salinas economy is heavily influenced by the agricultural industry and is known as “America’s Salad Bowl”. The market has heavy population fluctuations related to the seasonality of the farming industry with highs in the March-November months. UDR’s occupancy tends to fluctuate between 91% in the low season and as high as 98% in the high season. 2007 job growth was 0.8% and AXIOMetrics forecasts 0.1% growth for 2008 and 1.6% growth for 2009.
51
Monterey/Salinas
Market Fact Sheet
| | | | | | | | | | | | | | | | | | | |
| | | | | | | Year Built | | | | | | | | | Inc. per Occ. | |
| Operating Properties | | # Homes | | | ReDev | | | Redev. | | Occupancy* | | | Home* | |
| 1 Garden Court | | | 107 | | | | 1986 | | | — | | | 92 | % | | $ | 869 | |
| 2 Cambridge Court | | | 332 | | | | 1974 | | | K/B | | | 89 | % | | | 942 | |
| 3 The Pointe at Westlake | | | 139 | | | | 1979 | | | K/B | | | 97 | % | | | 914 | |
| 4 Laurel Tree | | | 157 | | | | 1979 | | | K/B | | | 95 | % | | | 916 | |
| 5 Boranda Manor | | | 204 | | | | 1977 | | | K/B | | | 91 | % | | | 886 | |
| 6 The Pointe at Northridge | | | 187 | | | | 1975 | | | K/B | | | 93 | % | | | 1,085 | |
| 7 The Pointe at Harden Ranch | | | 439 | | | | 1973 | | | K/B | | | 93 | % | | | 1,144 | |
| | | | | | | | | | | | | | | |
Grand Total | | | 1,565 | | | | | | | | | | 92 | % | | $ | 999 | |
| | | | | | | | | | | | | | | |
*As of 1Q 2008
52
| | | |
| | Jacksonville
Market Fact Sheet
|
Market Statistics & Peer Comparison
| | | | | |
| Jacksonville Portfolio | | Homes | |
| Same Store Pool | | | 1,557 | |
| Non-Matures | | | 300 | |
| Development Pipeline | | | — | |
| | | | |
Total | | | 1,857 | |
| 1Q08 Mo. Inc./ Home (SS) | | $ | 870 | |
| 1Q08 Occupancy | | | 95 | |
Source: Company Reports
| | | | | | | | | |
| Company | | # of Homes | | | Ave. Rent | |
| AIV | | | 1,919 | | | $ | 880 | |
| UDR | | | 1,557 | | | | 870 | |
| MAA | | | 3,346 | | | | 816 | |
| EQR | | | 3,474 | | | | 803 | |
| | | | | | | |
| | | | 10,296 | | | $ | 832 | |
Sources: 1Q ‘08 SSP Homes & Avg. Rent — Axiometrics; & Internal Company Reports
Jacksonville is UDR’s
#14market, and is expected
to contribute2.9%of the
Company’s total net
operating income*
*EOY 2008 pro forma full portfolio NOI, including JV’s, planned acquisitions, developments, redevelopments, etc.
Jacksonville Market Statistics
| | | | | | | | | | | | | | | | | |
| 2008 Forecast | | | Low Home Affordability | | | Economy | |
| Effective Rent (Q4) | | $ | 836 | | | Ave. Market Rent | | $ | 832 | | | Population | | | 1,300,823 | |
| Occupancy Rate (Q4) | | | 93.0 | % | | Mo Payment: Entry Level*: | | | | | | Job Growth | | | 1,1 | % |
| Rental Rate Growth | | | -0.6 | % | | Home | | $ | 1,201 | | | Median Income | | $ | 59,700 | |
| Effective Rent (‘09F) | | $ | 817 | | | Condo | | $ | 983 | | | Housing Stock | | | | |
| Effective Rent (‘10F) | | $ | 831 | | | Median Home Price | | $ | 177,600 | | | Renter | | | 179,448 | |
| Multifamily Permits | | | 2,523 | | | Housing Affordability Index | | | 142.4 | | | %of Total | | | 31.5 | % |
Source: Axiometrics
* Assumes 30 yr fixed at 6.31%
Recent Activity
UDR has demonstrated success in creating additional value from its Jacksonville properties in a variety of ways.
| | • | | Kitchen and Bath program. We have completed 455 Kitchen and bath renovations at an average cost of $10,200 and are realizing an average return of 9% |
| |
| | • | | We have also completed a limited scope reposition of 352 units. |
AXIOMetrics most recent report shows Jacksonville’s population grew at +1.7% in 2007, above the national average. Jacksonville’s household income is slightly above the US average. Annual job growth is expected to decline slightly, feeling the pressure of the weakened national business climate. Most new jobs are coming from professional, business services, education, health services as well as leisure and hospitality industries.
AXIOMETRICS reports that single-family permitting decreased -31.2% from a year ago. Multi-family permitting decreased -53.2% from a year ago with 2,523 units permitted. Permitting is expected to increase +22.9% in 2009 and +21.8% in 2010.
53
Jacksonville
Market Fact Sheet
| | | | | | | | | | | | | | | | | | | |
| | | | | | | Year Built | | | | | | | | | Inc. per Occ. | |
| Operating Properties | | # Homes | | | ReDev | | | Redev. | | Occupancy* | | | Home* | |
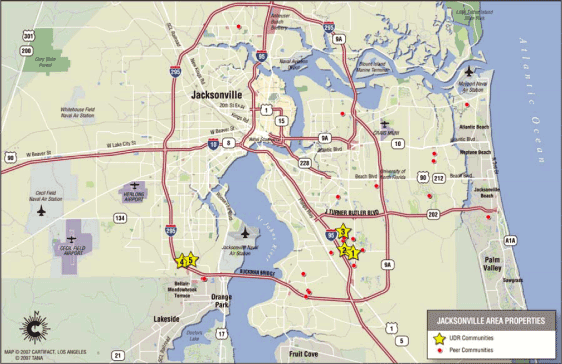
| 1 The Antlers | | | 400 | | | | 1985 | | | — | | | 97 | % | | $ | 844 | |
| 2 Green Tree Place | | | 352 | | | | 1986 | | | K/B | | | 96 | % | | | 858 | |
| 3 St John’s Plantation | | | 400 | | | | 1989 | | | K/B | | | 95 | % | | | 930 | |
| 4 Westland Park | | | 405 | | | | 1990 | | | K/B | | | 92 | % | | | 850 | |
| | | | | | | | | | | | | | | |
Subtotal | | | 1,557 | | | | | | | | | | 95 | % | | | 870 | |
Non-Mature | | | | | | | | | | | | | | | | | | |
| 5 The Kensley Apartment Homes | | | 300 | | | | 2004 | | | — | | | 91 | % | | | 930 | |
| | | | | | | | | | | | | | | |
Subtotal | | | 300 | | | | | | | | | | 91 | % | | | 930 | |
| | | | | | | | | | | | | | | |
Grand Total | | | 1,857 | | | | | | | | | | | | | $ | 880 | |
| | | | | | | | | | | | | | | |
As of Q12008
54
| | | |
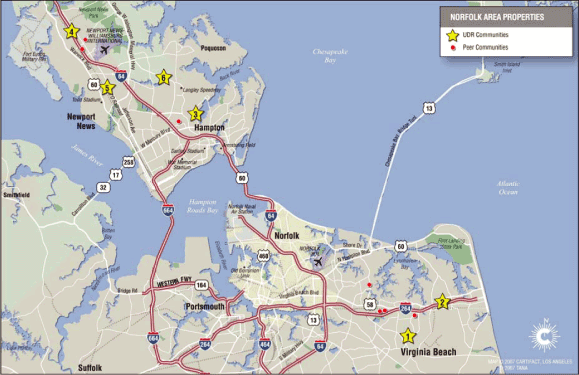
| | Norfolk/VA Beach
Market Fact Sheet
|
Market Statistics & Peer Comparison
| | | | | |
| Norfolk/VA Beach Portfolio | | Homes | |
| Same Store Pool | | | 1,438 | |
| Non-Matures | | | — | |
| Development Pipeline | | | — | |
| | | | |
Total | | | 1,438 | |
| 1Q08 Mo. Inc./ Home (SS) | | $ | 964 | |
| 1Q08 Occupancy | | | 95 | % |
Source: Company Reports
| | | | | | | | | |
| Company | | # of Homes | | | Ave. Rent | |
| AIV | | | 3,161 | | | $ | 998 | |
| UDR | | | 1,438 | | | | 964 | |
| CLP | | | 497 | | | | 837 | |
| | | | | | | |
| | | | 5,096 | | | $ | 973 | |
Sources: 1Q ‘08 SSP Homes & Avg. Rent — Axiometrics; & Internal Company Reports
Norfolk is UDR’s
#15market, and is expected
to contribute2.8%of the
Company’s total net
operating income*
*EOY 2008 pro forma full portfolio NOI, including JV’s, planned acquisitions, developments, redevelopments, etc.
Norfolk/VA Beach Market Statistics
| | | | | | | | | | | | | | | | | |
| 2008 Forecast | | | Low Home Affordability | | | Economy | |
| Effective Rent (Q4) | | $ | 967 | | | Ave. Market Rent | | $ | 973 | | | Population | | | 1,658,754 | |
| Occupancy Rate (Q4) | | | 93.2 | % | | Mo Payment: Entry Level*: | | | | | | Job Growth | | | 0.9 | % |
| Rental Rate Growth | | | 0.8 | % | | Home | | $ | 1,544 | | | Median Income | | $ | 64,100 | |
| Effective Rent (‘09F) | | $ | 979 | | | Condo | | $ | 1,277 | | | Housing Stock | | | | |
| Effective Rent (‘10F) | | $ | 1,011 | | | Median Home Price | | $ | 236,000 | | | Renter | | | 235,029 | |
| Multifamily Permits | | | 1,105 | | | Housing Affordability Index | | | 118.5 | | | % of Total | | | 34.7 | % |
Source: Axiometrics
* Assumes 30 yr fixed at 6.31%
Recent Activity
Norfolk/Virginia Beach apartment communities are in solid locations and the Company has invested to modernize the homes in the following way:
| | • | | Kitchen and Bath Program: Over 1,400 kitchen and bath renovations have been completed at an average cost of $9,760, and are yielding an average annual return of 8.0%. |
Virginia Beach has a diversified economy with significant employment in the government sector and in trade, transportation and utilities. Job growth is expected to be 0.6% in 2009 and 1.2% in 2010. The median existing home price is $236,000 so housing affordably is in line with the national average.
55
Norfolk/VA Beach
Market Fact Sheet
| | | | | | | | | | | | | | | | | | | | | |
| | | | | | | Year Built | | | | | | | | | | | Inc. per Occ. | |
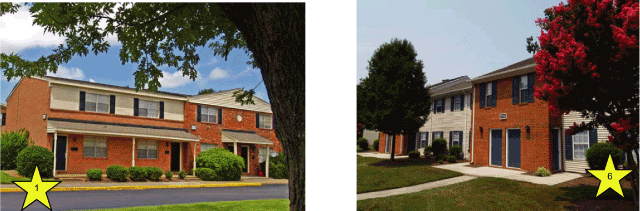
| Operating Properties | | # Homes | | | ReDev | | | Redev. | | | Occupancy* | | | Home* | |
| 1 Dominion Waterside/Lynnhaven | | | 192 | | | | 1966 | | | | K/B | | | | 94 | % | | $ | 996 | |
| 2 Eastwind | | | 200 | | | | 1970 | | | | K/B | | | | 96 | % | | | 1,087 | |
| 3 Heather Lake | | | 252 | | | | 1972 | | | | K/B | | | | 93 | % | | | 971 | |
| 4 Woodscape | | | 296 | | | | 1974 | | | | — | | | | 93 | % | | | 779 | |
| 5 Forest Lakes at Oyster Pt. | | | 296 | | | | 1986 | | | | K/B | | | | 98 | % | | | 988 | |
| 6 Dominion Yorkshire Downs | | | 202 | | | | 1987 | | | | K/B | | | | 97 | % | | | 1,029 | |
| | | | | | | | | | | | | | | | |
Grand Total | | | 1,438 | | | | | | | | | | | | 95 | % | | $ | 964 | |
| | | | | | | | | | | | | | | | |
As of Q12008
56
| | | |
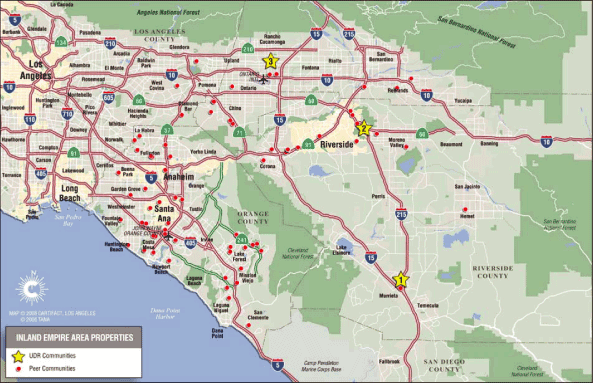
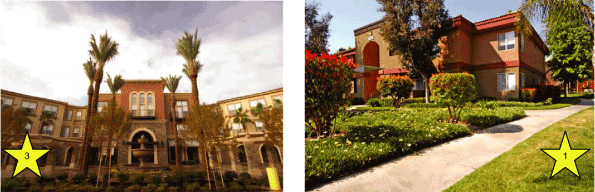
| | Inland Empire, CA
Market Fact Sheet
|
Market Statistics & Peer Comparison
| | | | | |
| Inland Empire Portfolio | | Homes | |
| Same Store Pool | | | 660 | |
| Non-Matures | | | 414 | |
| Development Pipeline | | | — | |
| | | | |
Total | | | 1,074 | |
| 1Q08 Mo. Inc./ Home (SS) | | $ | 1,165 | |
| 1Q08 Occupancy | | | 92.0 | % |
Source: Company Reports
| | | | | | | | | |
| Company | | # of Homes | | | Ave. Rent | |
| CPT | | | 264 | | | $ | 1,331 | |
| EQR | | | 4,098 | | | | 1,244 | |
| BRE | | | 2,929 | | | | 1,206 | |
| UDR | | | 660 | | | | 1,165 | |
| AIV | | | 198 | | | | 1,063 | |
| ESS | | | 588 | | | | 998 | |
| AVB | | | 320 | | | | 939 | |
| | | | | | | |
| | | | 9,057 | | | $ | 1,198 | |
Sources: 1Q ‘08 SSP Homes & Avg. Rent — Axiometrics; & Internal Company Reports
Inland Empire is UDR’s
#16market, and is expected
to contribute2.8%of the
Company’s total net
operating income*
*EOY 2008 pro forma full portfolio NOI, including JV’s, planned acquisitions, developments, redevelopments, etc.
Inland Empire Market Statistics
| | | | | | | | | | | | | | | | | |
| 2008 Forecast | | | Low Home Affordability | | | Economy | |
| Effective Rent (Q4) | | $ | 1,196 | | | Ave. Market Rent | | $ | 1,198 | | | Population | | | 4,081,371 | |
| Occupancy Rate (Q4) | | | 91.3 | % | | Mo Payment: Entry Level*: | | | | | | Job Growth | | | -0.3 | % |
| Rental Rate Growth | | | -1,7 | % | | Home | | $ | 1,959 | | | Median Income | | $ | 59,200 | |
| Effective Rent (‘09F) | | $ | 1,209 | | | Condo | | $ | 1,633 | | | Housing Stock | | | | |
| Effective Rent (‘10F) | | $ | 1,238 | | | Median Home Price | | $ | 325,000 | | | Renter | | | 426,415 | |
| Multifamily Permits | | | 2,955 | | | Housing Affordability Index | | | 81.5 | | | % of Total | | | 30.4 | % |
Source: Axiometrics
* Assumes 30 yr fixed at 6.31%
Recent Activity
In the Inland Empire market, UDR is improving existing homes though its kitchen and bath program. Approximately 200 kitchen and bath renovations have been completed at an average cost of $8,802 and we are realizing an average annual return of 13.5%. We achieved average rent increases of 13.5% per home at Waterstone at Murrieta: $975 before and $1,075 after.
The local economy has recently softened and AXIOMetrics forecasts annual job growth to decline from +0.1% in 2007 to -1.4% in 2008. Job growth is forecasted at -0.3% in 2009, but rebounds to +1.4% in 2010. San Bernardino County is known as the “transportation hub of the Southwestern United States,” according to Grubb & Ellis. With Ontario International Airport, the County hosts one of the 15 busiest cargo airports in the country. Freight trains roll through the region on two of the busiest transcontinental rail lines in the nation. This region, one of California’s fastest growing, offers a diversified economy, cultural amenities, and an attractive quality of life for individuals and families, as well as businesses, seeking to relocate. A safe, family-oriented environment and a well-educated work force combine to make the Inland Empire an ideal place to live, work and play.
The median existing home price is $325,000 placing it among the most affordable markets in the U.S.
57
Inland Empire, CA
Market Fact Sheet
| | | | | | | | | | | | | | | | | | | |
| | | | | | | Year Built | | | | | | | | | Inc. per Occ. | |
| Operating Properties | | # Homes | | | ReDev | | | Redev. | | Occupancy* | | | Home* | |
| 1 Waterstone at Murietta | | | 420 | | | | 1990 | | | K/B | | | 92 | % | | $ | 1,112 | |
| 2 Windemere/Sycamore Heights | | | 240 | | | | 2001 | | | — | | | 92 | % | | | 1,257 | |
| | | | | | | | | | | | | | | |
Subtotal | | | 660 | | | | | | | | | | 92 | % | | | 1,165 | |
Non-Mature | | | | | | | | | | | | | | | | | | |
| 3 Verano at Town Square | | | 414 | | | | 2006 | | | — | | | 95 | % | | | 1,583 | |
| | | | | | | | | | | | | | | |
Subtotal | | | 414 | | | | | | | | | | 95 | % | | | 1,583 | |
| | | | | | | | | | | | | | | |
Grand Total | | | 1,074 | | | | | | | | | | 93 | % | | $ | 1,329 | |
| | | | | | | | | | | | | | | |
As of 1Q 2008
58
| | |
| | Phoenix
Market Fact Sheet
|
Market Statistics & Peer Comparison
| | | | | |
| Phoenix Portfolio | | Homes | |
| Same Store Pool | | | 914 | |
| Non-Matures | | | — | |
| Development Pipeline | | | 582 | |
| | | | |
Total | | | 1,496 | |
| 1Q08 Mo. Inc./ Home (SS) | | $ | 960 | |
| 1Q08 Occupancy | | | 95 | % |
Source: Company Reports
| | | | | | | | | |
| Company | | # of Homes | | | Ave. Rent | |
| AIV | | | 198 | | | | 1,063 | |
| UDR | | | 914 | | | $ | 960 | |
| BRE | | | 1,898 | | | | 935 | |
| CLP | | | 952 | | | | 923 | |
| CPT | | | 1,729 | | | | 917 | |
| EQR | | | 10,794 | | | | 842 | |
| | | | | | | |
| | | | 16,485 | | | $ | 874 | |
Sources: 1Q ’08 SSP Homes & Avg. Rent — Axiometrics; & Internal Company Reports
Phoenix is UDR’s
#17market, and is expected
to contribute2.1%of the
Company’s total net
operating income*
| | | |
| *EOY 2008 pro forma full portfolio NOI, including JV’s, planned acquisitions, developments, redevelopments, etc. |
Phoenix Market Statistics
| | | | | | | | | | | | | | | | | | | | | | | |
| 2008 Forecast | | | Low Home Affordability | | | Economy | |
| Effective Rent (Q4) | | | | $ | 843 | | | Ave. Market Rent | | | | $ | 874 | | | Population | | | | | 4,179,427 | |
| Occupancy Rate (Q4) | | | | | 92.7 | % | | Mo Payment: Entry Level*: | | | | | | | | Job Growth | | | | | 0.9 | % |
| Rental Rate Growth | | | | | -0.7 | % | | Home | | | | $ | 1,490 | | | Median Income | | | | $ | 59,100 | |
| Effective Rent (‘09F) | | | | $ | 836 | | | Condo | | | | $ | 1,231 | | | Housing Stock | | | | | | |
| Effective Rent (‘10F) | | | | $ | 844 | | | Median Home Price | | | | $ | 241,700 | | | Renter | | | | | 501,262 | |
| Multifamily Permits | | | | | 22,111 | | | Housing Affordability Index | | | | | 105.2 | | | % of Total | | | | | 30.9 | % |
Source: Axiometrics
* Assumes 30 yr fixed at 6.31%
Recent Activity
UDR is expanding its presence in this market with two new developments:
| | • | | Waterford at Peoria – 200 homes at an average cost of $125,000 per home, being developed in a pre-sale agreement with Zaremba Group. Lease up began in the 2nd quarter of 2008. |
| |
| | • | | The Residences at Stadium Village – wholly owned development of 382 homes at an average cost of $123,037 per home, expected to yield a return of 6.5%. This project is underway with an expected completion 2nd quarter of 2009. |
The local economy has recently softened and AXIOMetrics forecasts job growth to decline from +1.3% in 2007 to -0.1% in both 2008 and 2009. Job growth is forecasted to improve +0.7% in 2010. Single-family permitting is down -33.6% compared to a year ago. Multifamily permitting is up +12.3% from a year ago with 7,905 units permitted. Total permitting is forecasted to decline - -48.0% in 2008. Key local industries include Trade, Trans. & Utilities, Professional & Business, Education & Health, Leisure and Hospitality and Government. The market has outstanding recreational and extra-curricular activities, an attractive year round climate, a reasonable cost of living and a young educated work force. Phoenix offers ample room for continued job growth and population growth.
The median existing home price is $241,700 placing it among the most affordable markets in the U.S.
59
Phoenix
Market Fact Sheet
| | | | | | | | | | | | | | | | | | | | | |
| | | | | | | Year Built | | | | | | | | | | | Inc. per Occ. | |
| Operating Properties | | # Homes | | | ReDev | | | Redev. | | | Occupancy* | | | Home* | |
| 1 Finisterra | | | 356 | | | | 1997 | | | | — | | | | 95 | % | | $ | 970 | |
| 2 Sierra Foothills | | | 322 | | | | 1998 | | | | — | | | | 95 | % | | | 980 | |
| 3 Sierra Canyon | | | 236 | | | | 2001 | | | | — | | | | 95 | % | | | 915 | |
| | | | | | | | | | | | | | | | |
Grand Total | | | 914 | | | | | | | | | | | | 95 | % | | | 960 | |
| | | | | | | | | | | | | | | | |
*As of 1Q 2008
| | | | | | | | | | | | | | | | | | | | | |
| | | Expected | | | # of | | | Budgeted | | | Cost per | | | Expected | |
| Development Pipeline | | Return | | | Homes | | | Cost ($000) | | | Home | | | Completion | |
| 4 Waterford Peoria | | | 6.25-6.75% | | | | 200 | | | $ | 25,000 | | | $ | 125,000 | | | | 2008 | |
| 5 Residences/Stadium | | | 6.25-6.75% | | | | 382 | | | $ | 47,000 | | | $ | 123,037 | | | | 2010 | |
| | | | | | | | | | | | | | | | | | | |
| | | | | | | | 582 | | | $ | 72,000 | | | | | | | | | |
| | | | | | | | | | | | | | | | | | | |
60
| | |
| | Sacramento
Market Fact Sheet
|
Market Statistics & Peer Comparison
| | | | | |
| Sacramento Portfolio | | Homes | |
| Same Store Pool | | | 914 | |
| Non-Matures | | | — | |
| Development Pipeline | | | — | |
| | | | |
Total | | | 914 | |
| 1Q08 Mo. Inc./ Home (SS) | | $ | 915 | |
| 1Q08 Occupancy | | | 88 | % |
| | | | | | | | | |
| Company | | # of Homes | | | Ave. Rent | |
| BRE | | | 1,796 | | | $ | 1,095 | |
| EQR | | | 504 | | | | 1,082 | |
| AIV | | | 180 | | | | 1.070 | |
| UDR | | | 914 | | | | 915 | |
| | | | | | | |
| | | | 3,394 | | | $ | 987 | |
Sources: 1Q ’08 SSP Homes & Avg. Rent — Axiometrics; & Internal Company Reports
Sacramento is UDR’s
#18market, and is expected
to contribute1.6%of the
Company’s total net
operating income*
*EOY 2008 pro forma full portfolio NOI, including JV’s, planned acquisitions, developments, redevelopments, etc.
Sacramento Market Statistics
| | | | | | | | | | | | | | | | | | | | | | | |
| 2008 Forecast | | | Low Home Affordability | | | Economy | |
| Effective Rent (Q4) | | | | $ | 1,034 | | | Ave. Market Rent | | | | $ | 987 | | | Population | | | | | 2,091,120 | |
| Occupancy Rate (Q4) | | | | | 90.8 | % | | Mo Payment: Entry Level*: | | | | | | | | Job Growth | | | | | 0.5 | % |
| Rental Rate Growth | | | | | -0.8 | % | | Home | | | | $ | 1,891 | | | Median Income | | | | $ | 67,200 | |
| Effective Rent (‘09F) | | | | $ | 1,031 | | | Condo | | | | $ | 1,574 | | | Housing Stock | | | | | | |
| Effective Rent (‘10F) | | | | $ | 1,048 | | | Median Home Price | | | | $ | 312,800 | | | Renter | | | | | 296,533 | |
| Multifamily Permits | | | | | 862 | | | Housing Affordability Index | | | | | 88.9 | | | % of Total | | | | | 35.4 | % |
Source: Axiometrics
* Assumes 30 yr fixed at 6.31%
Recent Activity
The Company owns two properties comprised of 914 apartment homes in Sacramento. UDR’s Sacramento properties have average rents of $915. Sacramento is the state capitol of California and also is home to Sacramento State University.
2007 job growth was 0.6% and AXIOMetrics forecasts -0.2% growth for 2008 and -0.3% for 2009.
The Company has no plans to expand further in this market.
61
Sacramento, CA
Market Fact Sheet
| | | | | | | | | | | | | | | | | | | | | |
| | | | | | | | | | | | | | | | | | | Inc. per | |
| | | | | | | Year Built | | | | | | | | | | | Occ. | |
| Operating Properties | | # Homes | | | ReDev | | | Redev. | | | Occupancy* | | | Home* | |
| 1 Woodlake Village | | | 646 | | | | 1979 | | | | | | | | 86 | % | | $ | 843 | |
| 2 Foothills Tennis Village | | | 268 | | | | 1988 | | | | | | | | 92 | % | | | 1,078 | |
| | | | | | | | | | | | | | | | |
Grand Total | | | 914 | | | | | | | | | | | | 88 | % | | $ | 915 | |
| | | | | | | | | | | | | | | | |
*As of 1Q 2008
62
| | |
| | Portland
Market Fact Sheet
|
Market Statistics & Peer Comparison
| | | | | |
| Portland Portfolio | | Homes | |
| Same Store Pool | | | 716 | |
| Non-Matures | | | — | |
| Development Pipeline | | | — | |
| | | | |
Total | | | 716 | |
| 1Q08 Mo. Inc./ Home (SS) | | $ | 973 | |
| 1Q08 Occupancy | | | 93 | % |
Source: Company Reports
| | | | | | | | | |
| Company | | # of Homes | | | Ave. Rent | |
| UDR | | | 716 | | | $ | 973 | |
| EQR | | | 3,713 | | | | 870 | |
| | | | | | | |
| | | | 4,429 | | | $ | 887 | |
Sources: 1Q ’08 SSP Homes & Avg. Rent — Axiometrics; & Internal Company Reports
Portland is UDR’s
#19market, and is expected
to contribute1.4%of the
Company’s total net
operating income*
*EOY 2008 pro forma full portfolio NOI, including JV’s, planned acquisitions, developments, redevelopments, etc.
Portland Market Statistics
| | | | | | | | | | | | | | | | | | | | | | | |
| 2008 Forecast | | | Low Home Affordability | | | Economy | |
| Effective Rent (Q4) | | | | $ | 891 | | | Ave. Market Rent | | | | $ | 887 | | | Population | | | | | 2,175,113 | |
| Occupancy Rate (Q4) | | | | | 93.8 | % | | Mo Payment: Entry Level*: | | | | | | | | Job Growth | | | | | 1.9 | % |
| Rental Rate Growth | | | | | -1.8 | % | | Home | | | | $ | 1,902 | | | Median Income | | | | $ | 63,800 | |
| Effective Rent (‘09F) | | | | $ | 895 | | | Condo | | | | $ | 1,584 | | | Housing Stock | | | | | | |
| Effective Rent (‘10F) | | | | $ | 924 | | | Median Home Price | | | | $ | 290,500 | | | Renter | | | | | 308,265 | |
| Multifamily Permits | | | | | 3,352 | | | Housing Affordability Index | | | | | 93.1 | | | % of Total | | | | | 35.3 | % |
Source: Axiometrics
* Assumes 30 yr fixed at 6.31%
Recent Activity
UDR owns 716 apartment homes in three communities in the Portland market. The Company sold two of its Portland properties in the March portfolio sale. Rents average $973 at UDR’s Portland properties with three bedroom homes renting for as much as $2,200. The Portland economy is fueled in large part by the technology industry and is home to Nike in the Portland suburb of Beaverton.
2007 job growth was 2.1% and AXIOMetrics forecasts -0.2% growth for 2008 and 1.2% for 2009.
63
| | |
| | | Portland
Market Fact Sheet |
| | | | | | | | | | | | | | | | | | | | | |
| | | | | | | Year Built | | | | | | | | | | | Inc. per Occ. | |
| Operating Properties | | # Homes | | | ReDev | | | Redev. | | | Occupancy* | | | Home* | |
| 1 Hunt Club | | | 256 | | | | 1985 | | | | K/B | | | | 95 | % | | $ | 913 | |
| 2 Tualatin Heights | | | 220 | | | | 1989 | | | | K/B | | | | 91 | % | | | 998 | |
| 3 Andover Park | | | 240 | | | | 1989 | | | | K/B | | | | 93 | % | | | 1,014 | |
| | | | | | | | | | | | | | | | |
Grand Total | | | 716 | | | | | | | | | | | | 93 | % | | $ | 973 | |
| | | | | | | | | | | | | | | | |
* As of 1Q 2008
64
| | |
| | Austin
Market Fact Sheet |
Market Statistics & Peer Comparison
| | | | | |
| Austin Portfolio | | Homes | |
| Same Store Pool | | | 250 | |
| Non-Matures | | | 633 | |
| Development Pipeline | | | — | |
| | | | |
Total | | | 883 | |
| 1Q08 Mo. Inc./ Home (SS) | | $ | 954 | |
| 1Q08 Occupancy | | | 97 | % |
Source: Company Reports
| | | | | | | | | |
| Company | | # of Homes | | | Ave. Rent | |
| UDR | | | 250 | | | $ | 954 | |
| CPT | | | 2,611 | | | | 918 | |
| EQR | | | 2,985 | | | | 807 | |
| CLP | | | 1,910 | | | | 807 | |
| MAA | | | 1,776 | | | | 806 | |
| AIV | | | 1,499 | | | | 770 | |
| | | | | | | |
| | | | 11,031 | | | $ | 831 | |
Sources: 1Q ’08 SSP Homes & Avg. Rent — Axiometrics; & Internal Company Reports
Austin is UDR’s
#20market, and is expected
to contribute1.4%of the
Company’s total net
operating income*
*EOY 2008 pro forma full portfolio NOI, including JV’s, planned acquisitions, developments, redevelopments, etc.
Austin Market Statistics
| | | | | | | | | | | | | | | | | | | | | | | |
| 2008 Forecast | | | Low Home Affordability | | | Economy | |
| Effective Rent (Q4) | | | | $ | 846 | | | Ave. Market Rent | | | | $ | 831 | | | Population | | | | | 1,598,161 | |
| Occupancy Rate (Q4) | | | | | 93.5 | % | | Mo Payment: Entry Level*: | | | | | | | | Job Growth | | | | | 4.4 | % |
| Rental Rate Growth | | | | | 0.9 | % | | Home | | | | $ | 1,391 | | | Median Income | | | | $ | 69,300 | |
| Effective Rent (‘09F) | | | | $ | 834 | | | Condo | | | | $ | 1,146 | | | Housing Stock | | | | | | |
| Effective Rent (‘10F) | | | | $ | 857 | | | Median Home Price | | | | $ | 185,700 | | | Renter | | | | | 247,328 | |
| Multifamily Permits | | | | | 6,929 | | | Housing Affordability Index | | | | | 147.5 | | | % of Total | | | | | 40.3 | % |
Source: Axiometrics
* Assumes 30 yr fixed at 6.31%
Recent Activity
UDR expects to begin a reposition of Barton Creek Landing in June 2008 based on the following criteria:
| | • | | Prime location in the SW region of Austin within minutes of downtown. Surrounded by the beautiful greenbelt and fresh water springs. |
| |
| | • | | Diversified demographics |
| |
| | • | | Stability of major employers within the state and government agencies (Capital of Texas), health care sector, energy and the tourist/ service/ retail industry. |
| |
| | • | | Confidence in our ability to capture the necessary return |
| |
| | • | | Positions us to be more in-line with the type of product in our immediate area |
65
Austin
Market Fact Sheet
| | | | | | | | | | | | | | | | | | | | | |
| | | | | | | Year Built | | | | | | | | | | | Inc. per Occ. | |
| Operating Properties | | # Homes | | | ReDev | | | Redev. | | | Occupancy* | | | Home* | |
| 1 Barton Creek Landing | | | 250 | | | | 1986 | | | | K/B | | | | 97 | % | | $ | 954 | |
| | | | | | | | | | | | | | | | |
Subtotal | | | 250 | | | | | | | | | | | | 97 | % | | | 954 | |
Non-Mature and Other | | | | | | | | | | | | | | | | | | | | |
| Red Stone Ranch (Texas JV) | | | 324 | | | | | | | | | | | | 97 | % | | | 811 | |
| Lakeline Villas (Texas JV) | | | 309 | | | | | | | | | | | | 97 | % | | | 783 | |
| | | | | | | | | | | | | | | | |
Subtotal | | | 633 | | | | | | | | | | | | 97 | % | | | 797 | |
| | | | | | | | | | | | | | | | |
Grand Total (UDR) | | | 250 | | | | | | | | | | | | | | | $ | 841 | |
| | | | | | | | | | | | | | | | |
*As of 1Q 2008
66
Transformation for Growth: UDR’s Strategies
| | | | | |
| | •
• | | Strong portfolio, focused in markets with above average job growth expectation and low affordability
Excellent growth profile |
| | | | | |
| | •
• | | Development pipeline geographically aligned with operating portfolio
Pursuing entitlement and short-term hold opportunities |
| | | | | |
| | •
•
• | | Focused operating model
Improved efficiency and effectiveness
Continued execution of technology initiatives |
| | | | | |
| | •
• | | Recycle capital into high growth markets
Strengthen balance sheet with debt reduction |
Safe Harbor:Statements contained in this presentation, which are not historical facts, are forward-looking statements, as the term is defined in the Private Securities Litigation Reform Act of 1995. You can identify these forward-looking statements by the Company’s use of words such as, “expects,” “plans,” “estimates,” “projects,” “intends,” “believes,” and similar expressions that do not relate to historical matters. Such forward-looking statements are subject to risks and uncertainties which can cause actual results to differ materially from those currently anticipated, due to a number of factors, which include, but are not limited to, unfavorable changes in the apartment market, changing economic conditions, the impact of competition and competitive pricing, acquisitions or new developments not achieving anticipated results, delays in completing developments and lease-ups on schedule, expectations on job growth, home affordability and demand/supply ratio for multi-family housing, expectations concerning redevelopment activities, expectations on occupancy levels, expectations concerning the Texas joint venture, expectations that automation will help grow net operating income, expectations on post-renovated stabilized annual operating income, exceptions on annualized net operating income, and other risk factors discussed in documents filed by the Company with the Securities and Exchange Commission from time to time including the Company’s Annual Report on Form 10-K and the Company’s Quarterly Reports on Form 10-Q. All forward-looking statements in this presentation are made as of today, based upon information known to management as of the date hereof. The Company assumes no obligation to update or revise any of its forward-looking statements even if experience or future changes show that indicated results or events will not be realized.
| UDR Investor Day June 2, 2008 Transformation for Growth |
| Larry Thede Vice President Investor Relations |
| Transformation for Growth Agenda: June 2, 2008 1:30 Registration 2:00 Welcome, Overview, Introduce Team Tom Toomey Property Portfolio, Acquisitions Mark Wallis, Matt Akin Development, Redevelopment Mark Culwell, Richard Giannotti 3:15 Break 3:30 Operations 2.0 Jerry Davis, Dhrubo Sircar Balance Sheet, NAV, Ventures Warren Troupe, Mike Ernst Tom Simon, David Messenger Sneak Peak at Tuesday's Tour Louis Kovalsky 5:00 Concluding Comments Tom Toomey 6:15 Buses Depart for Charlie Palmer Restaurant |
| Transformation for Growth Agenda: June 3, 2008 7:15 Breakfast - Salon A 8:00 Buses depart - meet in lobby prior to 8 AM to load luggage 8:15 Tour Sullivan Place (4Q07 Acquisition) 9:15 Tour Delancey (1Q08 Acquisition) 10:30 Tour Andover House (1Q07 Acquisition) 11:30 Buses depart Andover House One will stop at train station, then at hotel One will stop at Reagan Airport, then at hotel |
| Statements contained in this presentation, which are not historical facts, are forward-looking statements, as the term is defined in the Private Securities Litigation Reform Act of 1995. You can identify these forward- looking statements by the Company's use of words such as, "expects," "plans," "estimates," "projects," "intends," "believes," and similar expressions that do not relate to historical matters. Such forward-looking statements are subject to risks and uncertainties which can cause actual results to differ materially from those currently anticipated, due to a number of factors, which include, but are not limited to, unfavorable changes in the apartment market, changing economic conditions, the impact of competition and competitive pricing, acquisitions or new developments not achieving anticipated results, delays in completing developments and lease-ups on schedule, expectations on job growth, home affordability and demand/supply ratio for multi-family housing, expectations concerning development and redevelopment activities, expectations on occupancy levels, expectations concerning the Vitruvian Park project, including expectations that the Company will be able to secure one of more institutional investor-partners, expectations that automation will help grow net operating income, expectations on post-renovated stabilized annual operating income, exceptions on annualized net operating income and other risk factors discussed in documents filed by the Company with the Securities and Exchange Commission from time to time including the Company's Annual Report on Form 10-K and the Company's Quarterly Reports on Form 10-Q. All forward-looking statements in this presentation are made as of today, based upon information known to management as of the date hereof. The Company assumes no obligation to update or revise any of its forward-looking statements even if experience or future changes show that indicated results or events will not be realized. Safe Harbor Statement |
| Tom Toomey President & CEO |
| Update progress on key strategies Describe how strategies position us to prosper in the short term and assure long-term success Interact with UDR leadership Answer your questions Transformation for Growth Today's Objectives |
| We have consistently executed against this strategy. Transformation for Growth A year ago at investor day we laid out our strategy: |
| Strengthening our portfolio - $3.4B in transactions $2.4B sold $1.0B purchased in targeted markets Growing RE3 - $2.6B development pipeline 12 projects now being developed $1.0B in progress Implementing Operations 2.0 Web site ranked #1 Top-tier operating performance Sourcing low-cost capital Established JV's totaling $1B Capital needs funded through 2009 1 2 3 4 Transformation for Growth Progress on key strategies |
| $2.4B of Sales Concentrated portfolio in strong markets Newer communities, with lower capital requirements Higher rent Superior job and rent growth Low housing affordability *EOY 2008 pro forma full portfolio NOI Transformation for Growth Strengthen Our Portfolio 1 Strategy Rank Market NOI* 1 Orange County 14% 2 Metro DC 12% 3 SF Bay Area 9% 4 Tampa 6% 5 Seattle 6% 6 Baltimore 5% 7 LA County 5% 8 Orlando 5% 9 Richmond 5% 10 Dallas 4% 11 Nashville 4% 12 San Diego County 3% 13 Monterey (Salinas) 3% 14 Jacksonville 3% 15 Norfolk / Va Beach 3% 16 Inland Empire 3% 17 Phoenix 2% 18 Sacramento 2% 19 Portland 1% 20 Austin 1% 96% |
| $1B Reinvested in Targeted Markets Edgewater Community Location Year Built # Homes Appx. Mo. Rents Edgewater San Francisco, CA 2007 193 $3,000 Tierra del Rey Marina del Rey, CA 1999 170 2,600 Crest Marin San Rafael, CA ReDev. 104 1,340 Mesa Verde Costa Mesa, CA 1975 296 1,600 Borgata Bellevue, WA 2001 71 2,350 Andover House Metro, DC 2004 171 2,300 Delancey at Shirlington Village Metro, DC 2007 241 2,000 Sullivan Place Metro, DC 2007 498 1,620 Circle Towers Metro, DC 1972 606 1,500 Dulaney Crescent Towson, MD 2003 264 1,400 The Place at Millennia Orlando, FL 2007 371 1,200 Kensley Jacksonville, FL 2004 300 930 Legacy Apartments Plano, TX 2006 1,043 1,000 1 Strategy Transformation for Growth Strengthen Our Portfolio |
| 8 communities completed - 2,680 homes 8%-10% incremental ROI on $41K average investment per home 65% growth in post-renovated cash flow to $19.8M 3 communities underway - 1,052 homes $44M budgeted cost - $123M total investment Targeting 8%-10% stabilized ROI on $75K average investment per home Expect 37% growth in post-renovated cash flow to $9.6M California and west coast communities will be added to pipeline in 2008/2009 After Redevelopment: 1 Strategy Transformation for Growth Strengthen Our Portfolio |
| $2.6B Development Pipeline Bellevue, WA Houston, TX 2 Strategy Breakdown of pipeline: No. of Homes Budget in $000 % of total Total pipeline - per Q1 press release 16,044 $2,648,252 100% Completed development and redevelopment 2,192 (211,382) 8% $2,436,870 Third-party development (JVs & pre-sales) 2,437 (561,000) 21% In-house development $1,875,870 In-house "warehoused" for future development 5,419 (848,000) 32% In-house development in progress 6,996 $1,027,870 39% Transformation for Growth Expand RE3 and other Income Streams In Lease-up - 56% Land - 35% Generating NOI - 6 % Under Construction - 3% 56 35 6 3 |
| Transformation for Growth Implement Operations 2.0 Strong same-store results 15th consecutive quarter of revenue growth 13th consecutive quarter of NOI growth Trailing 5 quarters average 7.5% NOI growth Full-year guidance 4.0% - 4.5% revenue growth 3.0% - 3.5% expense growth 5.0% - 5.5% NOI growth 3 Strategy |
| Creating an eBusiness Model Web site ranked #1 by world-wide Internet research firm Launched Spanish-language site Launched mobile phone application 46% of Q1 move-ins via Internet Implemented YieldStar(r) Business model serves customers the way they want to do business Transformation for Growth Implement Operations 2.0 3 Strategy |
| Established $1B in JVs Increased credit facility to $600M, extended maturity to July 2012 Redeemed $135M 8.6% Preferred stock issue, replaced with 6.75% issue Completed $150M 5.5% medium-term note due 2014 Closed two-year unsecured term loan - $240M at blended rate of 3.55% Increased share repurchase authorization to 22M shares Completed 8.4M of share repurchases for $204M Paid down $300M debt 4 Strategy Transformation for Growth Source Low-Cost Capital |
| Transformation for Growth Organization and Key Leadership Changes Named Denver corporate headquarters Recorded staff realignment charge Tapped new leadership in key areas: Warren Troupe Senior Executive Vice President David Messenger Chief Financial Officer Tom Simon Senior Vice President and Treasurer Jerry Davis Senior Vice President, Operations Dhrubo Sircar Senior Vice President and Chief Information Officer Katie Miles-Ley Senior Vice President, Human Resources |
| Transformation for Growth Strategy Update: |
| Mark Wallis Senior Executive Vice President |
| Team Experience Portfolio Transformation from 2001 to 2008 RE3 Strategy Strategic and Analytical View: Acquisitions, Dispositions: Matt Akin Development: Mark Culwell Redevelopment: Richard Giannotti Strengthen Our Portfolio Overview of Presentation |
| Strengthen Our Portfolio The Investment Team Mark Wallis Investment Strategy Senior Executive Vice President Doug Walker, SVP Asset Quality & Condo Conversions Matt Akin, SVP Acquisitions & Dispositions Richard Giannotti, EVP Redevelopment Mark Culwell, SVP Development |
| Strengthen Our Portfolio Portfolio Transformation: 2001 to 2008 Portfolio now concentrated in strong markets where the cost of housing is high, job growth is strong, and demographic trends are favorable. Completed $7.6B of transactions since 2001 $3.5B in sales Exited 40 markets Sold 63,070 homes $4.1B in acquisitions Purchased 29,908 homes |
| 2001 2008 California 12% 39% Florida 15% 16% Metro D.C. 3% 12% Virginia 7% 9% Maryland 4% 6% Washington 1% 6% Texas 21% 6% Tennessee 5% 3% Arizona 5% 2% Oregon 1% 1% North Carolina 15% --- Ohio 3% --- South Carolina 2% --- Colorado 2% --- Georgia 2% --- Arkansas 1% --- Delaware 1% --- (Geographic concentration based on % NOI) Strengthen Our Portfolio Portfolio Transformation: 2001 to 2008 |
| Strengthen Our Portfolio Improved Market Concentration NOI by State 2001 2008 |
| 0 Strengthen Our Portfolio Portfolio Transformation: 2001 to 2008 2001 2008 Number of homes 77,567 43,559 Number of communities 274 156 Average monthly rent $703 $1,168 Average age 25 years 15 years UDR has the right portfolio for a prosperous future. |
| Strengthen Our Portfolio The 2008 Transformation 03/03/08: Sold 25,684 homes for $1.7B As of 05/31/08: Purchased or have under contract to purchase 3,348 homes for $813M We believe this 2008 portfolio acquisition is superior to the Essex acquisition Newer assets Diverse in-fill locations Near transportation and retail hubs The blended cap rate should be close to 5% |
| Continue to source fee streams from joint venture activities RE3 is a tax entity that provides us more flexibility to sell assets in a short-term hold scenario Captures NAV efficiently Provides flexibility to enter into joint ventures Provides flexibility for development Creates appropriate entity structure for extra value from condo sales Short-term hold transactions are cyclical and not appropriate for including in guidance Expand RE3 and Other Income Streams RE3 Update |
| Strengthen Our Portfolio UDR Investment Criteria Find "Forever Great" submarket locations Target high-growth markets: Low home affordability index Favorable demand/supply ratio Strong/sustainable job formation Positive operating trends Identify value-add opportunities for each asset that will increase NAV |
| Strengthen Our Portfolio Acquisitions & Dispositions |
| Matt Akin Senior Vice President Acquisitions and Dispositions |
| Submarket Acquisition Criteria Employment centers Proximity to jobs and expanding employment corridors Lifestyle centers Proximity to shopping, restaurants, and entertainment Transportation centers Proximity to transportation hubs, including highway access, railways, etc. Low single-family affordability Single-family home ownership represents a premium to renting an apartment home Operational efficiency / market knowledge Proximity to other UDR owned and operated properties |
| Acquisitions - San Francisco Bay Area Edgewater Luxury Apartments San Francisco, California 193 homes Year built: 2007 Acquisition date: 1Q2008 |
| San Francisco Bay Area - Submarket Acquisition Criteria New construction 100% market rate with fee-simple title Lifestyle center Mission Bay submarket Blocks from AT&T ballpark and marina Replacement cost Replacement cost: 3-year entitlement, $650K - $700K/home with affordability component Walking access to entertainment, retail districts, restaurants, and jobs. Transportation Blocks from both BART and Caltrains, 280 freeway access Low affordability to single-family homeownership - 52% discount Edgewater Financial District And Downtown San Francisco Caltrain and Muni Light Rail Stations BART Rail Station San Francisco Shopping Center Union Square |
| San Francisco Bay Area - Submarket Acquisition Criteria Edgewater Caltrain and Muni Light Rail Stations AT&T Ballpark and Marina Financial District And Downtown San Francisco Bay Bridge (I-80) Oakland Mission Bay District |
| Acquisitions - Northern California Almaden Lake Village San Jose, California 250 homes Year built: 1998 / 1999 Under contract - expected close: 3Q2008 |
| Northern California - Submarket Acquisition Criteria Almaden Lake Village Lake Almaden Westfield Oakridge Mall And Shopping Center Light Rail Station San Jose Milpitas Sunnyvale Highway 87 To San Jose 10-year-old product Kitchen & bath renovation program Transportation Adjacent to Valley Transit Authority light rail Immediate access to the 101 Freeway Employment Centers Access to Silicon Valley, home to headquarters, such as Google, Yahoo, eBay, Apple, Intel, and Adobe Low affordability to single-family homeownership - 65% discount Adds scale to our Northern California portfolio |
| Acquisitions - Southern California Tierra Del Rey Marina Del Rey, California 171 homes Year built: 1998 / 1999 Acquisition date: 4Q2007 |
| Southern California - Submarket Acquisition Criteria Tierra Del Rey Marina Villa Marina Marketplace Retail Shopping Center Jefferson at Marina Del Rey (UDR Joint Venture) Los Angeles, CA 10 year-old product Kitchen and bath renovation program 100% market rate rentals with fee simple title Lifestyle center Adjacent to Villa Marina Marketplace Adjacent to restaurants Walking distance to marina and beach area Employment centers Access to West Los Angeles job markets, easy access to downtown L.A. Job markets via the 10 Freeway Low affordability to single-family Homeownership - 57% discount |
| Mesa Verde Villas Costa Mesa, California 296 homes Year built: 1975 Acquisition date: 2Q2008 Acquisitions - Southern California Mesa Verde Pine Brook Village Villa Venetia Harbor at Mesa Verde |
| Southern California - Submarket Acquisition Criteria John Wayne Orange County Airport Mesa Verde Villas Newport Beach South Coast Plaza Shopping Center Los Angeles, CA Pacific Ocean Older product available to upgrading and renovations Operational efficiency Adjacent to currently owned properties Economies of scale and market pricing power. Location is a known commodity for UDR Product and rent pricing are a niche that fits with the market demand. NOI growth in this submarket has averaged 8%-10% per year since 2003 UDR's operations are outperforming seller's operations, collecting $100 more in NOI per home per month. |
| Acquisitions - Seattle, Washington Area Hearthstone at Merrill Creek Everett, Washington 220 homes Year built: 2000 Acquisition date: 2Q2008 |
| Seattle, Washington Area - Submarket Acquisition Criteria Hearthstone at Merrill Creek Boeing Payne Field Seaway Center Business Park Seattle / Bellevue 25 Miles South Newer product available to kitchen & bath upgrade program Employment Centers Located in Merrill Creek Business Park, home to employers: Campbell's Soup, TRW Aeronautical Systems, The Fluke Company, and Boeing Direct access to Boeing assembly plant For 747, 767, 777 and 787 Dreamliner 787 is the future of the airline industry This plant currently has committed orders of 1,425 in total, with 892 for the Dreamliner. No 787 competition expected until 2013 Low affordability to single-family homeownership - 45% discount Adds needed scale to our Puget Sound portfolio |
| Acquisitions - Dallas, Texas Area Legacy Apartment Homes Plano, Texas 1,043 homes Year built: 2005, 2006, 2007 Acquisition date: 1Q2008 |
| Dallas, Texas Area - Submarket Acquisition Criteria EDS PepsiCo JC Penny McAffee Legacy Town Center Legacy Portfolio Ford Motors Dallas, TX Newer construction 3 distinct properties Legacy Village: 478 homes, avg. rent $950 Lakeside at Legacy Village: 501 homes, avg. rent $990 Acqua: 64 homes, avg. rent $1,853 Employment centers Located in the Legacy Business Park, home to corporate headquarters of JC Penny, PepsiCo, Frito Lay, Dr. Pepper/Snapple, and EDS Lifestyle center Mixed-use location adjacent to 450,000 sf of retail, office, and entertainment |
| Acquisitions - Baltimore, Maryland Area Dulaney Crescent Towson, Maryland 264 homes Year built: 2003 Acquisition date: 1Q2008 |
| Baltimore, Maryland Area - Submarket Acquisition Criteria Dulaney Crescent Towson Town Center Towson University Newer product available to kitchen & bath upgrade program Employment centers Access to Interstate Highways 695, 83, 395 Direct access to 4.7M sf of office Lifestyle centers Walking distance to Towson Town Center Low affordability to single-family homeownership - 33% discount Access to Johns Hopkins University, St. Joseph's Medical Center, and Greater Baltimore Medical Center. |
| Acquisitions - Washington, D.C. Area Delancey at Shirlington Village Arlington, Virginia 241 homes Year built: 2007 Acquisition date: 1Q2008 |
| Washington, D. C. Area - Submarket Acquisition Criteria Delancey at Shirlington Village Ronald Reagan National Airport Downtown Washington, D.C. Arlington National Cemetery Arlington, VA New product still in lease-up; 75% occupancy. Growth inherent as stabilization occurs. 100% market-rate homes, fee simple Lifestyle center Mixed-use development Grocery store located under mid-rise tower Retail portion of property is master leased to Federal Realty. Transportation 20 minute commute, in traffic, to downtown DC, Alexandria, Arlington Located adjacent to Metrobus transit center; provides direct access to DC Metro rail system. Low affordability to single-family homeownership - 50% discount |
| Washington, D. C. Area - Submarket Acquisition Criteria |
| Acquisitions - Washington, D.C. Area Circle Towers Fairfax, Virginia 606 homes Year built: 1972 Acquisition date: 1Q2008 |
| Mark Wallis Senior Executive Vice President |
| Strengthen Our Portfolio Development |
| Strengthen Our Portfolio Development Pipeline Components UDR has the potential to create value with its $2.6B pipeline Breakdown of pipeline: Breakdown of pipeline: Breakdown of pipeline: Total pipeline - per Q1 press release $2,648,252 100% Completed development and redevelopment (211,382) 8% $2,436,870 Third-party development (JVs & pre-sales) (561,000) 21% In-house development $1,875,870 In-house "warehoused" for future development (848,000) 32% In-house development in progress $1,027,870 39% |
| Strengthen Our Portfolio Solid private developers are administering 21% of the volume Only 32% of the pipeline ($1B) is in house UDR Development Redevelopment is currently running at about 50% of volume of past 3 years Development has an experienced staff that is overseeing a very manageable volume of under $1B Mark Culwell's staff is deep enough to handle at least another $500M in volume 32% of the pipeline is being warehoused with income producing assets; we will carefully time the move of these assets into the production pool |
| Strengthen Our Portfolio Appropriate Pipeline for Improving Market Conditions National development supply of multi-family housing has remained at 200,000 homes added annually - not too far ahead of demand Credit crunch is putting a restraint on construction lending; will prevent many private developers from starting new projects over the next year Home builders are reducing production dramatically and the excess single-family inventory should be absorbed in approximately 2 years The multi-family rental pool will dramatically increase in 2010, as the 25-35 age cohort population increases Job market to weaken through 2008, with a consensus forecast of recovery in 2009-2010 |
| Strengthen Our Pipeline Development Pipeline Delivery |
| Strengthen Our Portfolio Appropriate Pipeline for Improving Market Conditions Baseline $1.6B pipeline in current production overseen by an experienced team led by Mark Culwell Third-party developer alliances provide: Expanded exposure to target markets UDR overhead is reduced - risk is transferred to private developer Pipeline can be appropriately expanded by $800M - $900M to respond to market conditions Next 24 months provides an excellent time to build new product that can be delivered in an improving 2010 market |
| Mark Culwell Senior Vice President Development |
| Strengthen Our Portfolio Strong Development Team Strong development team with combined experience of over 140 years including: Trammell Crow Residential Gables Residential JPI Lincoln Property Company Fairfield Residential Shea Homes Strong construction team with combined experience of over 102 years including: Manhattan Construction Centex Construction ICI Construction |
| Strengthen Our Portfolio Attractive Target Markets Low home affordability index: Seattle @ 60.1% Los Angeles @ 32.5% No.Va./D.C. @ 70.9% Favorable demand/supply ratio: Houston @ 5.4 Raleigh @ 5.8 Dallas @ 4.7 Positive operating trends - rent growth: Seattle @ 4.2% Houston @ 4.5% Dallas @ 3.0% Strong/sustainable job formation: Houston @ 80,000 Seattle @ 29,000 Dallas @ 40,800 Strong demographics - median income: Seattle @ $75,000 Dallas @ $62,000 No.Va./D.C. @ $94,500 |
| Strengthen Our Portfolio Target Markets: Seattle/Puget Sound - infill/redevelopment sites; Bellevue San Francisco/Bay Area - infill/redevelopment sites Los Angeles/San Diego - redevelopment sites Phoenix - infill/redevelopment sites Dallas - infill/redevelopment sites, proximity to major employment centers Houston - near major transportation corridors, proximity to employment Washington D.C. - inside the beltway, near major employment, Metro stops Northern Virginia - high incomes, near major employment centers |
| 2008 Deliveries Strengthen Our Portfolio |
| Strengthen Our Portfolio Wholly-owned development Lincoln at Towne Square Phase II Plano, TX 302 homes $25M budget $83,000 cost per home 6.5% - 7.0% return Expected completion - 3Q08 |
| Strengthen Our Portfolio Woodlands Site I-45 Wholly-owned development Laurelwoode Montgomery County, TX 324 homes $25M budget $77,200 cost per home Expected 7.0% return Start date: 2Q07 Expected completion date: 3Q08 |
| Strengthen Our Portfolio Joint venture Jefferson at Marina del Rey JPI - national apartment developer Negotiated new development in Marina Del Rey, CA 298 homes $138M budget $463,000 cost per home Expected 6.0% - 6.5% return Expected completion Q3 2008 |
| Strengthen Our Portfolio Development pre-sale The Waterford Phoenix, Arizona 200 homes $25M budget $125,000 cost per home Expected returns of 7.0% - 7.5% Expected completion date: 4Q08 |
| 2009 Deliveries Strengthen Our Portfolio |
| Strengthen Our Portfolio Wholly-owned development Riachi at One 21 Phase 2 Plano, TX 200 homes $19M budget $95,000 cost per home 7.0% - 7.25% return Expected completion - 1Q09 |
| Strengthen Our Portfolio Development pre-sale Vintage Lofts Tampa, Florida 249 homes $48M budget $193,000 cost per home Expected returns of 6.5% - 7.0% Expected completion date: 1Q09 |
| Strengthen Our Portfolio Development pre-sale Mustang Park Dallas, TX 289 homes $28M budget $97,000 cost per home Expected returns of 7.0% - 7.5% Expected completion date: 4Q09 Mustang Park Willow Bend Mall Prestonwood Country Club |
| 2010 Deliveries Strengthen Our Portfolio |
| Strengthen Our Portfolio Wholly-owned development Stadium Village Surprise, AZ 382 homes $47M budget $124,000 cost per home Expected 6.25% - 6.75% return Start date: 4Q07 Expected completion date: 1Q10 Ranger/Roy als Stadium |
| Wholly-owned development Belmont Dallas, TX 465 homes $64M budget $138,043 cost per home 6.5% return Expected completion: 2Q10 Strengthen Our Portfolio I-75 Central Expressway Garrett Ave Bennett Ave. Fitzhugh Ave Downtown Belmont |
| Strengthen Our Portfolio Caroline Village I -95 Wholly-owned development Signal Hill Woodbridge, VA 360 homes $75M budget $217,000 cost per home Expected 6.25% return Expected start date: 2Q08 Expected completion date: 2Q10 Signal Hill |
| Strengthen Our Portfolio Wholly-owned development The Tribute Raleigh, NC 359 homes $45.5M budget $130,000 cost per home Expected 6.5% - 7.0% return Expected start date: 1Q08 Expected completion date: 1Q10 Expected completion date: 1Q10 Expected completion date: 1Q10 Expected completion date: 1Q10 Expected completion date: 1Q10 Expected completion date: 1Q10 Expected completion date: 1Q10 Expected completion date: 1Q10 Expected completion date: 1Q10 Expected completion date: 1Q10 Carolina Corporate Center Glenwood Avenue Carolina Corporate Centre Office Park |
| Strengthen Our Portfolio Wholly Owned Development - 2400 14th Street Washington, D.C. 255 Homes $124 Million Budget $487,000 Cost per Home Expected 5.5% to 6.5% Return Expected Start Date: 3Q08 Expected Completion Date: 2Q10 Carolina Corporate Center |
| Vitruvian Park Addison, TX Phase I Development 667 homes $108M budget Retail, office and other zoning Estimated start: 3Q 2008 Return on costs: 6.5% - 7.0% Expected completion: 3Q10 Strengthen Our Portfolio |
| 2011 Deliveries Strengthen Our Portfolio |
| Bellevue Plaza Development Site Strengthen Our Portfolio Joint venture Bellevue Plaza Proposed high-rise development 400 homes $135M budget $270,000 cost per home Ground floor retail Expected 6.0% - 6.5% return Structure: 49% UDR / 51% SU Development |
| Strengthen Our Portfolio Joint venture Ashwood Commons Bellevue, WA 271 homes Closed JV in 4Q06 Structure: 49% UDR / 51% Su Development Managed by UDR Ground floor retail Total cost of $97M |
| Strengthen Our Portfolio Future development Grandview Glendale, CA 218 homes $67M budget $307,000 cost per home Expected 6.0% - 6.5% return Expected completion: TBD Current use and revenue generated by:103,100 SF office building Existing Grandview Office Building |
| Strengthen Our Portfolio Future development Summit at Mission Bay San Diego, CA 486 homes $163M budget $340,000 cost per home Expected 5.5% - 6.0% return Expected start date: TBD Current use and revenue generated by: 323-home apartment building Existing Summit at Mission Bay |
| Strengthen Our Portfolio Future development Foxborough Orange, CA 260 homes $77M budget $296,000 cost per home Expected 6.0% - 6.5% return Expected start date: TBD Current use and revenue generated by: 90-home apartment building Existing Foxborough |
| Strengthen Our Portfolio VITRUVIAN PARK: Infill opportunity of 99 acres couldn't be assembled and entitled within 2 years without experienced, capable people Phase I is $100M starting in 2008 City invests $40M starting in 2008 In execution, it's a phase by phase project, mitigating risk because: Balance of land is income producing (existing apartments) Scale of project ensures transformation of neighborhood UDR controls supply by controlling the land |
| Mark Wallis Senior Executive Vice President |
| Strengthen Our Portfolio Redevelopment Pipeline |
| Strengthen Our Portfolio Redevelopment Successfully completed 3,245 homes 7% - 9% cash-on-cash returns on capital investment, on 1,600-1,800 homes per year with a focus on Northern Virginia and California Investment criteria for redevelopment: Older asset in "Forever Great" location Opportunity to significantly increase rents and change the resident profile, substantiated by detailed market study Physical characteristic of structure allows for transforming architectural change Favorable local entitlement process |
| Richard Giannotti Executive Vice President Redevelopment |
| Redevelopment - Washington / Baltimore Corridor Pre-Redevelopment Ellicott Grove Apartments Ellicott City, Maryland 300 garden style homes 939 weighted average sq. ft. $989 weighted average rent |
| Redevelopment - Washington / Baltimore Corridor Post-Redevelopment Ellicott Grove Apartments $1,310 weighted average rent 46% growth in NOI $16.1M estimated value creation |
| Redevelopment - Washington / Baltimore Corridor Pre-Redevelopment Post-Redevelopment Post-Redevelopment Post-Redevelopment |
| Redevelopment - Washington / Baltimore Corridor Pre-Redevelopment Wellington Place at Olde Town Manassas, VA 372 garden style homes 814 weighted average sq. ft. $1,060 weighted average rent |
| Redevelopment - Washington / Baltimore Corridor Redevelopment - Washington / Baltimore Corridor Post-Redevelopment Wellington Place at Olde Town $1,282 weighted average rent 23% growth in NOI $10.7M estimated value creation |
| Redevelopment - Circle Towers |
| Redevelopment - Circle Towers |
| Redevelopment - Circle Towers |
| Redevelopment - Circle Towers |
| Redevelopment - Circle Towers |
| Redevelopment - Circle Towers |
| Redevelopment - Circle Towers |
| Operations 2.0 UDR Investor Presentation |
| Louis Kovalsky Virginia, Maryland, Washington DC, Tennessee (20 years industry experience, 6.5 years with UDR) Dennis Sandidge Florida (31 years industry experience, 12.5 years with UDR) Kathy Clem Texas (28 years industry experience, 4 years with UDR) Teresa Barker Northern California, Washington, Oregon (19 years industry experience, 7 years with UDR) Tracy Saffos Southern California, Phoenix (18 years industry experience, 6 years with UDR) Implement Ops 2.0 Operations Leadership by Area |
| Dhrubo Sircar Senior Vice President and Chief Information Officer |
| Enhanced Customer Service & Experience Phone calls, paper work orders Phone calls, call center, Real Estate Mgmt System (1-Site) logs interactions Extended facility hours, 7x24 Call Center support Service techs alerted via Text/SMS messages, Residents notified of work completion via text/SMS messages Leasing Hand-written Type-written Word-processor & disk file Electronic Leasing Template Electronic Leasing, e-sig, E-Document mgmt & storage, regional leasing teams Sales & Marketing Balloons, walk-in foot traffic Print ads, call center Internet leads Craigslist, Yieldstar (46% of leases originate from internet leads) Mobile marketing, bar code messaging Renewals Campaigns, letters, phone calls, face to face Yieldstar driven renewal letters Call Center driven warm solicitation Automated electronic renewals via self-service portals, e-sig, Web-link via e-mail Payments Processing Checks & money orders ACH transactions Credit cards & rewards 80% cashless / 20% other Bartering - chickens & goats Stage 1 2 3 4 5 50% of all renewals via self-service portals and E-mail links Community & socialization, convenience & mixed use setups, personalized information, contact history, warm follow-ups Vision: create an effective e-business model in the multi-family industry |
| Implement Ops 2.0 Evolution of Sales & Marketing - From the 80's to Today and Tomorrow Stage 1 Balloons Walk-in Foot Traffic Stage 2 Print Ads Answering Service Stage 3 Internet Leads Answering Service |
| Stage 5 Mobile marketing bar code messaging best results in the industry social media optimization/mktg. (75% of leases originate from internet leads) Implement Ops 2.0 Evolution of Sales & Marketing - From the 80's to Today and Tomorrow Stage 4 Craigslist ILS Yieldstar (Price Optimization) Enhanced Answering Service (Currently 46% of leases originate from internet leads) |
| Random Call from the UDR Call Center... |
| Prospects see our bar code in advertising as they walk or drive by and they can connect via their mobile phone and get directed to a UDR Mobile web page with complete photos and descriptions Implement Ops 2.0 Quick Response 2-D Bar Code |
| UDR(r) BMW(r) Business Week(r) Carphone Warehouse(r) eBay(r) ESPN(r) University of Texas(r) Hilton Hotels(r) Implement Ops 2.0 Companies Already Using 2-D Bar Coding in Advertising |
| Enhanced Customer Service & Experience Leasing Sales & Marketing Renewals Payments Processing Stage 1 2 3 4 5 Vision: create an effective e-business model in the multi-family industry Phone calls, paper work orders Phone calls, call center, Real Estate Mgmt System (1-Site) logs interactions Extended facility hours, 7x24 Call Center support Service techs alerted via Text/SMS messages, Residents notified of work completion via text/SMS messages Balloons, walk-in foot traffic Print ads, call center Internet leads Craigslist, Yieldstar (46% of leases originate from internet leads) Mobile marketing, bar code messaging Community & socialization, convenience & mixed use setups, personalized information, contact history, warm follow-ups Hand-written Type-written Word-processor & disk file Electronic Leasing Template Electronic leasing, e-signature, E-document mgmt & storage, regional leasing teams |
| Word-processor & disk file Internet leads Electronic Leasing Template Craigslist, Yieldstar (46% of leases originate from internet leads) Type-written Print ads, call center Hand-written Balloons, walk-in foot traffic Mobile marketing, bar code messaging Electronic Leasing, e-sig, E-Document mgmt & storage, regional leasing teams Enhanced Customer Service & Experience Leasing Sales & Marketing Renewals Payments Processing Stage 1 2 3 4 5 Vision: create an effective e-business model in the multi-family industry Checks & money orders ACH transactions Credit cards & rewards 80% cashless / 20% other Cash |
| Phone calls, paper work orders Phone calls, call center, Real Estate Mgmt System (1-Site) logs interactions Extended facility hours, 7x24 Call Center support Service techs alerted via Text/SMS messages, Residents notified of work completion via text/SMS messages Community & socialization, convenience & mixed use setups, personalized information, contact history, warm follow-ups Balloons, walk-in foot traffic Print ads, call center Internet leads Craigslist, Yieldstar (46% of leases originate from internet leads) Mobile marketing, bar code messaging Enhanced Customer Service & Experience Leasing Sales & Marketing Renewals Payments Processing 1 2 3 4 5 Vision: create an effective e-business model in the multi-family industry Campaigns, letters, phone calls, face to face Yieldstar driven renewal letters Call center driven warm solicitation Automated electronic renewals via self-service portals, e-signature, Web-link via e-mail 50% of all renewals via self-service portals and E-mail links Stage |
| Enhanced Customer Service & Experience Leasing Sales & Marketing Renewals Payments Processing Stage 1 2 3 4 5 Vision: create an effective e-business model in the multi-family industry Phone calls, paper work orders Phone calls, call center, Real Estate Mgmt System (1-Site) logs interactions Extended facility hours, 7x24 call center support Service techs alerted via Text/SMS messages, residents notified of work completion via text/SMS messages Community & socialization, convenience & mixed use setups, personalized information, contact history, warm follow-ups Hand-written Type-written Word-processor & disk file Electronic Leasing Template Electronic Leasing, e-sig, E-Document mgmt & storage, regional leasing teams Balloons, walk-in foot traffic Print ads, call center Internet leads Craigslist, Yieldstar (46% of leases originate from internet leads) Mobile marketing, bar code messaging |
| Enhanced Customer Service & Experience Phone calls, paper work orders Phone calls, call center, Real Estate Mgmt System (1-Site) logs interactions Extended facility hours, 7x24 Call Center support Service techs alerted via Text/SMS messages, Residents notified of work completion via text/SMS messages Leasing Hand-written Type-written Word-processor & disk file Electronic Leasing Template Electronic Leasing, e-sig, E-Document mgmt & storage, regional leasing teams Sales & Marketing Balloons, walk-in foot traffic Print ads, call center Internet leads Craigslist, Yieldstar (46% of leases originate from internet leads) Mobile marketing, bar code messaging Renewals Campaigns, letters, phone calls, face to face Yieldstar driven renewal letters Call Center driven warm solicitation Automated electronic renewals via self-service portals, e-sig, Web-link via e-mail Payments Processing Checks & money orders ACH transactions Credit cards & rewards 80% cashless / 20% other Bartering - chickens & goats Stage 1 2 3 4 5 50% of all renewals via self-service portals and E-mail links Community & socialization, convenience & mixed use setups, personalized information, contact history, warm follow-ups Vision: create an effective e-business model in the multi-family industry |
| Implement Ops 2.0 Financial Impact of Ops 2.0 Estimated annual NOI benefit for an average property is approximately $100,000 With 171 properties this means the annual company-wide impact is approximately $17M FFO/share will increase $.10-$.13 per share Assuming a cap rate of 5%, the value of UDR's properties would increase $300-$350M End result is an increase in NAV of $2.00-$2.50 per share |
| Implement Ops 2.0 Financial View of a Property Pre/Post Ops 2.0 e-Business Average year Sales and Marketing Leasing Payment Processing Renewals Customer Service Net Effect of Ops 2.0 Financial Futures Gross Potential Rent 3,566,568 36,000 36,000 3,602,568 Concessions (40,896) (40,896) Effective Rent 3,525,672 36,000 36,000 3,561,672 Vacancy Loss (193,908) 13,800 13,800 13,800 13,800 55,200 (138,708) Bad Debit (18,828) 3,600 3,600 (15,228) Net Rental Income 3,312,936 13,800 13,800 3,600 13,800 49,800 94,800 3,407,736 Fee income 134,232 134,232 Utility Reimbursement 128,760 128,760 Total Other Income 262,992 262,992 Total Revenue 3,575,928 13,800 13,800 3,600 13,800 49,800 94,800 3,670,728 Taxes and Insurance 394,884 - 394,884 Utilities 176,232 500 500 500 500 2,000 178,232 Repairs and Maintenance 190,356 1,000 3,600 4,600 194,956 Personnel 290,688 32,000 10,000 6,000 (20,000) 28,000 318,688 Administrative and Marketing 84,252 1,000 1,000 6,000 1,000 9,000 93,252 Total Expenses 1,136,412 1,500 33,500 10,000 13,500 (14,900) 43,600 1,180,012 Net Operating Income 2,439,516 15,300 47,300 13,600 27,300 34,900 138,400 2,577,916 |
| Implement Ops 2.0 Conclusions We are taking our business to where residents want us to be We feel Ops 2.0 is mutually beneficial for both our residents and UDR. We are giving them the flexibility they want while increasing the value of our enterprise The bar just keeps rising. We will change to accommodate customer preference |
| Implement Ops 2.0 Discussion & Questions |
| Mike Ernst Executive Vice President |
| Tom Simon Senior Vice President and Treasurer |
| Debt Portfolio Today ($M) Debt Debt Secured $1,151 Unsecured 2,028 Total* $3,179 Floating rate % 4% 2008 maturities $76 2009 maturities $379 Debt to market cap 47% * 5.15% avg. rate, 6.4 yr. avg. maturity * 5.15% avg. rate, 6.4 yr. avg. maturity |
| Current balance $0 Available balance $600 Debt to assets 39% - Covenant 60% Fixed charge coverage 2.03X - Covenant 1.50X Unencumbered pool value $5,890 Unencumbered pool value to unsecured debt 290% - Covenant 150% Source Low Cost Capital Line Of Credit ($M) |
| Portfolio Sale As of June 2, 2008 ($M) Sources Gross sales $1,710 Deferred sales (8) Note receivable (200) Closing costs and pro-rations (24) Net proceeds $1,478 Uses 1031 acquisitions closed $ 558 1031 acquisitions remaining 176 - 279 Special dividend 190 - 130 Paid off debt 430 - 387 Stock buy back 124 $1,478 |
| Capital Budget June 1, 2008 through December 31, 2009 ($M) Uses 2008 2009 Development and redevelopment $265 $279 1031 acquisitions 279 - ROI projects 34 30 Special dividend - 137 Debt maturities 76 379 $654 $825 |
| Capital Budget June 1, 2008 through December 31, 2009 ($M) Sources 2008 2009 Operating cash flow (1) $15 $55 Construction financing draws 250 200 Note receivable - 200 Secured debt facility draw 115 - City of Addison initial funding 24 - 1031 exchange funds 240 - Draws on line 10 370 $654 $825 Available line balance $590 $220 (1) Cash flow less regular dividend and recurring Capex (1) Cash flow less regular dividend and recurring Capex (1) Cash flow less regular dividend and recurring Capex |
| Capital Transactions Construction Loans: Currently in market on 5 projects for $250M Other identified projects for $200M Unsecured Bonds: $100M - $200M as market allows Weighted average rate of expiring unsecured debt is 6.3% |
| David Messenger Chief Financial Officer |
| UDR - NAV Pools of Assets Mature communities Non-mature communities Future NAV creators |
| Mature Communities 32,342 homes Forward 12 month NOI ($M) $264.8 Capex assumption $650/home Management fee 2.75% NAV: $26.77 to $30.73 per share* * Represents a range of cap rates on the mature NOI above; all non-mature investments are included at their respective costs. |
| Non-Mature Communities Development Redevelopment JVs Pre-sale arrangements 2007 acquisitions Homes Stabilized NOI 6,632 $115.0 2,556 18.0 972 15.4 1,504 14.9 2,327 18.2 NAV: $1.96 to 4.09 per share* *Represents value creation using various cap rates on stabilized NOI less expected total project costs |
| Future NAV Creators UDR-owned development on drawing board Vitruvian Park development rights Below-market rate debt Ops 2.0 and a 5-year capex strategy Future redevelopment Fee and JV Income Kitchen & bath program NAV: at least $1.00 per share |
| UDR - Cap Rate Sensitivity Cap Rate Matures Non-Matures Future NAV 5.0% $30.73 $4.09 $1.00 $35.82 5.2% 29.30 3.32 1.00 33.52 5.4% 27.99 2.63 1.00 31.62 5.6% 26.77 1.96 1.00 29.73 |
| Warren Troupe Senior Executive Vice President |
| Selected Capital Market Initiatives Expand Joint Venture Activity Rationale Generates fee income to supplement property income Promoted return on general partner interest in fund Another potential source of capital Lowers overall corporate risk |
| Selected Capital Market Initiatives Expand Joint Venture Activity Form of joint venture: Institutional Investors Merchant Builders Funds |
| Existing Joint Ventures Current program is over $1B Amount ($M) UDR% Interest Texas Texas Texas Invested $350 20 Committed 300 20 Bellevue 291 49 Marina del Rey 138 49 |
| Existing Joint Ventures Amount ($M) UDR% Interest Texas 9 properties 3,690 Homes Lincoln Town Square II 302 Homes Status: Construction, 56 homes completed as of 3/31/2008, estimated completion 3Q08 $650 20 Bellevue 989 Elements 166 Homes Status: Stabilized Ashwood Commons 274 Homes Status: Construction, estimated 4Q08 Bellevue Plaza 430 Homes Status: Pre-construction, estimated completion 4Q10 $291 49 Marina Del Rey Jefferson at Marina Del Rey 298 Homes Status: Construction/Lease-up (non-stabilized), estimated completion 3Q08 $138 100 (less profit Interest) |
| Timing Portfolio acquisitions 2008-2009 Leverage operating platform Candidates for kitchen and bath program Redevelopment 2008-2009 Exterior upgrades and interior renovations Development 2009 $2.6B pipeline Vitruvian Park Funds 2009-2010 Seek to establish additional JVs with institutional investors |
| Special Dividend Amount Range of $130M - $190M Complete 1031 acquisitions by August 30, 2008 and finalize amount of special dividend in 3Q08 Form of Special Dividend . . . Reviewing Cash Stock Combination of cash and stock (minimum of 20% cash) Timing Must be declared by Board of Directors on or prior to December 31, 2008 Payable in 4Q or no later than January 31, 2009 |
| Tom Toomey President & CEO |
| Transformation for Growth In summary We've covered a lot of ground - but everything we've discussed is driven by our core strategies: is driven by our core strategies: is driven by our core strategies: |
| We have a clear vision and the right growth strategies to deliver superior value creation We have the management bench, discipline and capital resources to implement our plan We can improve our strong past performance to deliver future growth Transformation for Growth In summary: |
| Strengthen our portfolio More emphasis on urbanization & energy investing Expand RE3 and other income streams $171M new development delivered $30M re-development delivered Implement Ops 2.0 Utilize hand-held devices to execute leases 60% of leases via internet Source low-cost capital Increase JV capital Transformation for Growth Before we adjourn, let me offer a glimpse of what we'll share at our 2009 Investor Day: |
| Strengthen our portfolio Communities attuned to resident affordability: close to transportation, energy efficient Expand RE3 and other income streams Development locations - urban settings, energy initiatives Redevelopment incorporates more sustainability/green initiatives Implement Ops 2.0 Full electronic leasing resulting in margin expansion Operating model allows 24x7 communication with residents Source low-cost capital Several JV funds established Transformation for Growth And, let me look forward 5 years for important industry trends |
| Before we adjourn, I want to comment on tonight's dinner speaker, Paul Hawken. He is an: Environmentalist Entrepreneur Journalist Author He has dedicated his life to sustainability and changing the relationship between business and the environment. Transformation for Growth |
| UDR Investor Day June 2, 2008 Thank you for attending and for your interest in UDR |