Exhibit 99.1
The Right Properties in the Right Markets
Third Quarter 2008 |
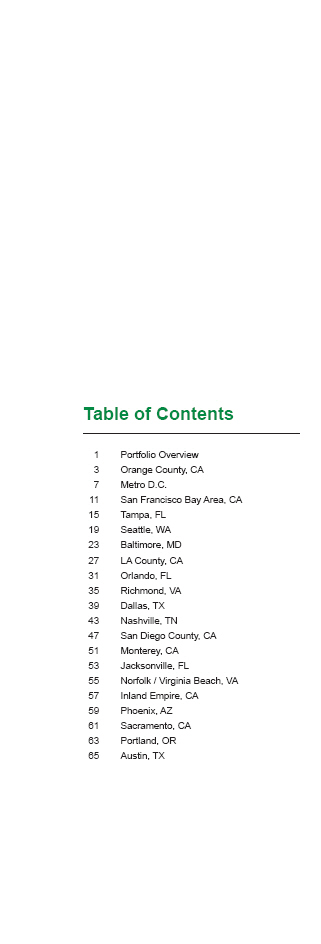
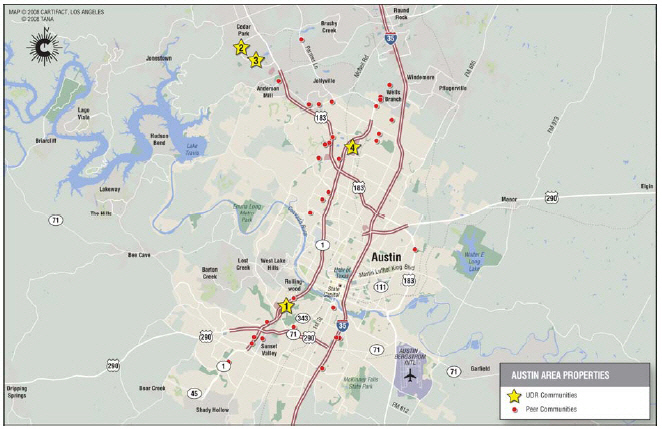
| 1 Portfolio Overview 3 Orange County, CA 7 Metro D.C. 11 San Francisco Bay Area, CA 15 Tampa, FL 19 Seattle, WA 23 Baltimore, MD 27 LA County, CA 31 Orlando, FL 35 Richmond, VA 39 Dallas, TX 43 Nashville, TN 47 San Diego County, CA 51 Monterey, CA 53 Jacksonville, FL 55 Norfolk / Virginia Beach, VA 57 Inland Empire, CA 59 Phoenix, AZ 61 Sacramento, CA 63 Portland, OR 65 Austin, TX Table of Contents |
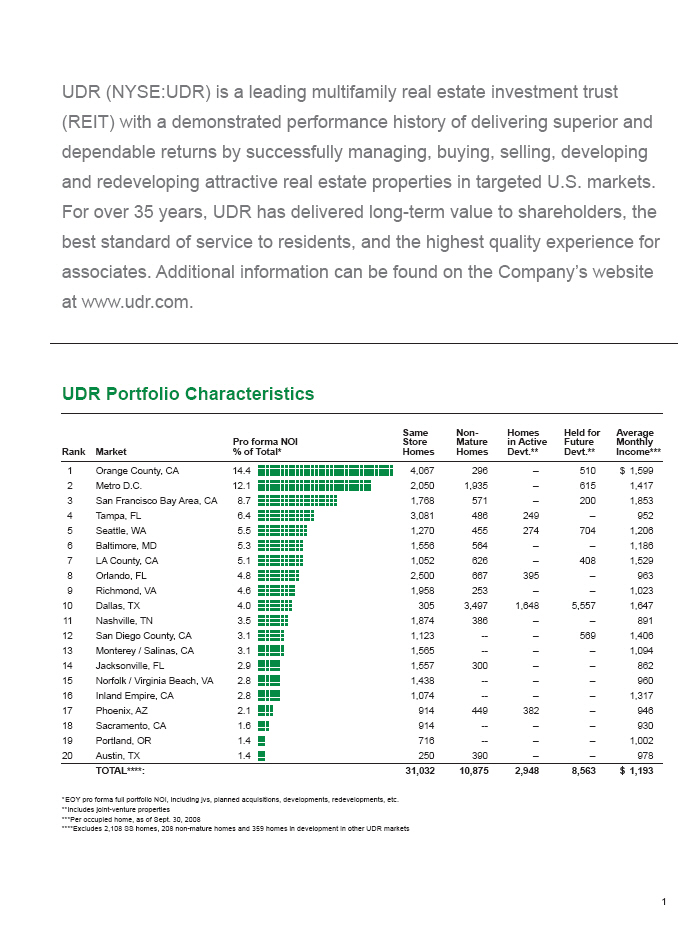 |
| UDR (NYSE:UDR) is a leading multifamily real estate investment trust (REIT) with a demonstrated performance history of delivering superior and dependable returns by successfully managing, buying, selling, developing and redeveloping attractive real estate properties in targeted U.S. markets. For over 35 years, UDR has delivered long-term value to shareholders, the best standard of service to residents, and the highest quality experience for associates. Additional information can be found on the Company’s website at www.udr.com. UDR Portfolio Characteristics Homes in Active Devt.** Held for Future Devt.** Non- Mature Homes Rank Market Pro forma NOI _____ % of Total* Same Store Homes Average Monthly Income*** 14.4 12.1 8.7 6.4 5.5 5.3 5.1 4.8 4.6 4.0 3.5 3.1 3.1 2.9 2.8 2.8 2.1 1.6 1.4 1.4 Orange County, CA Metro D.C. San Francisco Bay Area, CA Tampa, FL Seattle, WA Baltimore, MD LA County, CA Orlando, FL Richmond, VA Dallas, TX Nashville, TN San Diego County, CA Monterey / Salinas, CA Jacksonville, FL Norfolk / Virginia Beach, VA Inland Empire, CA Phoenix, AZ Sacramento, CA Portland, OR Austin, TX TOTAL****: 4,067 2,050 1,768 3,081 1,270 1,556 1,052 2,500 1,958 305 1,874 1,123 1,565 1,557 1,438 1,074 914 914 716 250 31,032 296 1,935 571 486 455 564 626 667 253 3,497 386 — — 300 — — 449 — — 390 10,875 510 615 200 — 704 — 408 — — 5,557 — 569 — — — — — — — — 8,563 $1,599 1,417 1,853 952 1,206 1,186 1,529 963 1,023 1,647 891 1,406 1,094 862 960 1,317 946 930 1,002 978 $1,193 — — — 249 274 — — 395 — 1,648 — — — — — — 382 — — — 2,948 1 2 3 4 5 6 7 8 9 10 11 12 13 14 15 16 17 18 19 20 *EOY pro forma full portfolio NOI, including jvs, planned acquisitions, developments, redevelopments, etc. **Includes joint-venture properties ***Per occupied home, as of Sept. 30, 2008 ****Excludes 2,108 SS homes, 208 non-mature homes and 359 homes in development in other UDR markets 1 |
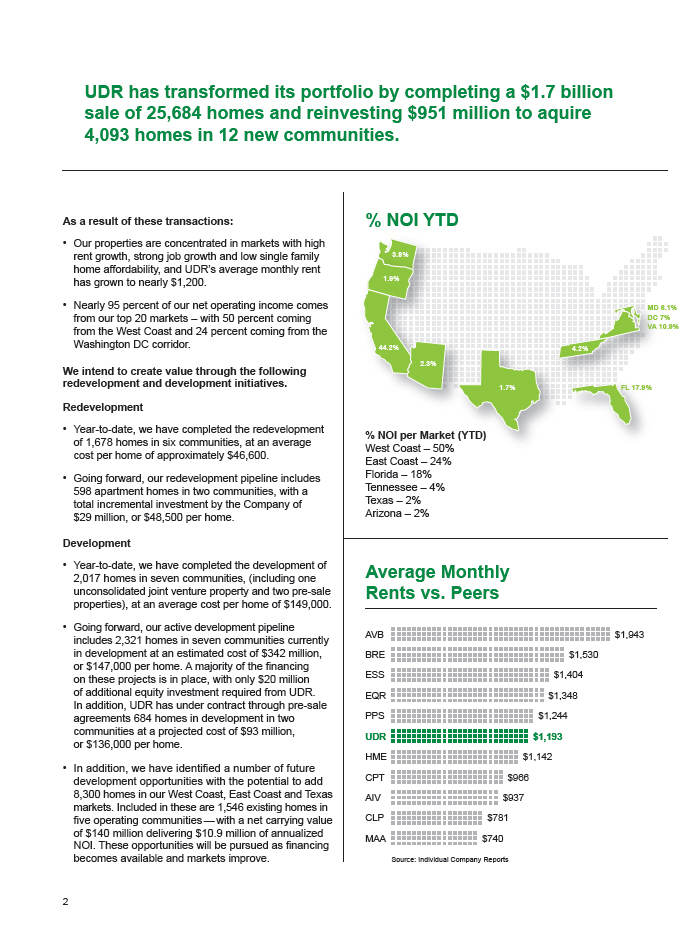
| UDR has transformed its portfolio by completing a $1.7 billion sale of 25,684 homes and reinvesting $951 million to aquire 4,093 homes in 12 new communities. % NOI YTD As a result of these transactions:• Our properties are concentrated in markets with high rent growth, strong job growth and low single family home affordability, and UDR’s average monthly rent has grown to nearly $1,200.• Nearly 95 percent of our net operating income comes from our top 20 markets — with 50 percent coming from the West Coast and 24 percent coming from the Washington DC corridor. We intend to create value through the following redevelopment and development initiatives. Redevelopment• Year-to-date, we have completed the redevelopment of 1,678 homes in six communities, at an average cost per home of approximately $46,600.• Going forward, our redevelopment pipeline includes 598 apartment homes in two communities, with a total incremental investment by the Company of $29 million, or $48,500 per home. Development• Year-to-date, we have completed the development of 2,017 homes in seven communities, (including one unconsolidated joint venture property and two pre-sale properties), at an average cost per home of $149,000.• Going forward, our active development pipeline includes 2,321 homes in seven communities currently in development at an estimated cost of $342 million, or $147,000 per home. A majority of the financing on these projects is in place, with only $20 million of additional equity investment required from UDR. In addition, UDR has under contract through pre-sale agreements 684 homes in development in two communities at a projected cost of $93 million, or $136,000 per home.• In addition, we have identified a number of future development opportunities with the potential to add 8,300 homes in our West Coast, East Coast and Texas markets. Included in these are 1,546 existing homes in five operating communities — with a net carrying value of $140 million delivering $10.9 million of annualized NOI. These opportunities will be pursued as financing becomes available and markets improve. 3.8% 1.9% MD 6.1% DC 7% VA 10.9% 44.2% 4.2% 2.3% FL 17.9% 1.7% % NOI per Market (YTD) West Coast — 50% East Coast — 24% Florida — 18% Tennessee — 4% Texas — 2% Arizona — 2% Average Monthly Rents vs. Peers AVB BRE ESS EQR PPS UDR HME CPT AIV CLP MAA $781 $740 $937 $966 $1,142 $1,244 $1,404 $1,348 $1,530 $1,943 $1,193 Source: Individual Company Reports 2 |
| | |
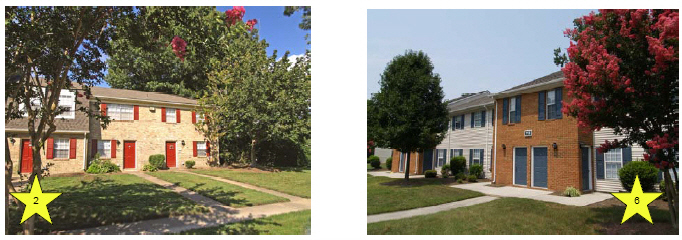
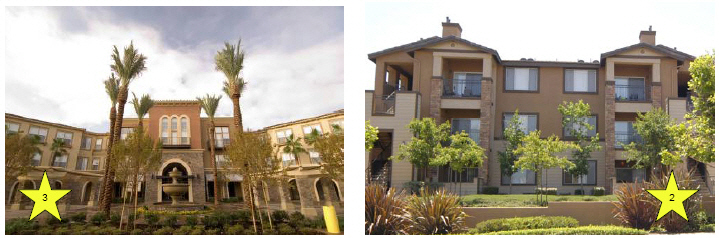
 | | Orange County
Market Fact Sheet |
Market Statistics & Peer Comparison
| | | | | |
| Orange County Portfolio | | Homes | |
| Same Store Pool | | | 4,067 | |
| Non-Matures | | | 296 | |
| Homes in Development | | | — | |
| Held for Future Development | | | 510 | |
| | | | |
Total | | | 4,873 | |
| MRQ Mo. Inc./ Occ. Home (SS) | | $ | 1,599 | |
| MRQ Occupancy (SS) | | | 95.2 | % |
| | | | | | | | | |
| Company | | # Homes (SS) | | | Avg. Rent | |
| UDR | | | 4,067 | | | $ | 1,599 | |
| ESS | | | 2,016 | | | | 1,578 | |
| BRE | | | 2,899 | | | | 1,575 | |
| CPT | | | 1,216 | | | | 1,549 | |
| EQR | | | 3,180 | | | | 1,505 | |
| AVB | | | 1,174 | | | | 1,393 | |
| AIV | | | 247 | | | | 1,379 | |
| | | | | | | |
| | | | 14,799 | | | $ | 1,547 | |
Orange County is UDR’s
#1market and is expected
to contribute14.4%of the
Company’s 2008 total
pro forma NOI.
Orange County Market Statistics
| | | | | | | | | | | | | | | | | |
| 2008 Forecast | | | Low Home Affordability | | | Economy | |
| Effective Rent (MRQ) | | $ | 1,657 | | | Ave. Market Rent | | $ | 1,547 | | | Population | | | 2,997,033 | |
| Occupancy (MRQ) | | | 94.0 | % | | Mo Payment: Entry Level*: | | | | | | Job Growth (MRQ) | | | -2.1 | % |
| Eff. Rent Growth ‘08F | | | -0.9 | % | | Home | | $ | 3,050 | | | Median Income | | $ | 84,100 | |
| Eff. Rent Growth ‘09F | | | -2.8 | % | | Condo | | $ | 2,568 | | | Housing Stock | | | | |
| Eff. Rent Growth ‘10F | | | 6.4 | % | | Median Home Price (MRQ) | | $ | 539,000 | | | Renter | | | 364,220 | |
| Multifamily Permits | | | 2,858 | | | Housing Affordability Score | | | 39 | | | % of Total | | | 37.3 | % |
Sources: AXIOMetrics and Company Reports, Most Recent Quarter (MRQ), Merrill Lynch Apartment Monitor, Latest Available Data (LAD)
* Assumes 30 yr fixed at 6.3%
Recent Activity
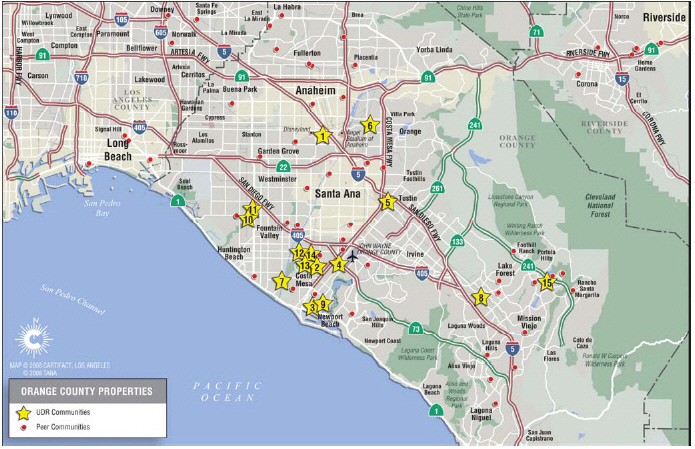
The Orange County, California market represents UDR’s largest concentration of apartment homes as measured by NOI. These homes are in premier costal locations; many communities are west of the 405 beltway, only minutes from the beach. The Company is creating value in this market through the following initiatives:
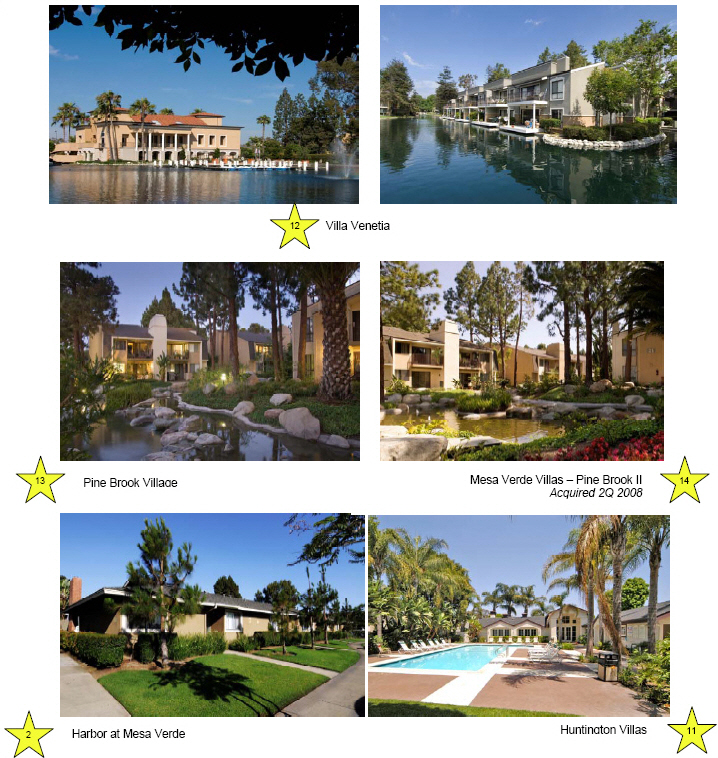
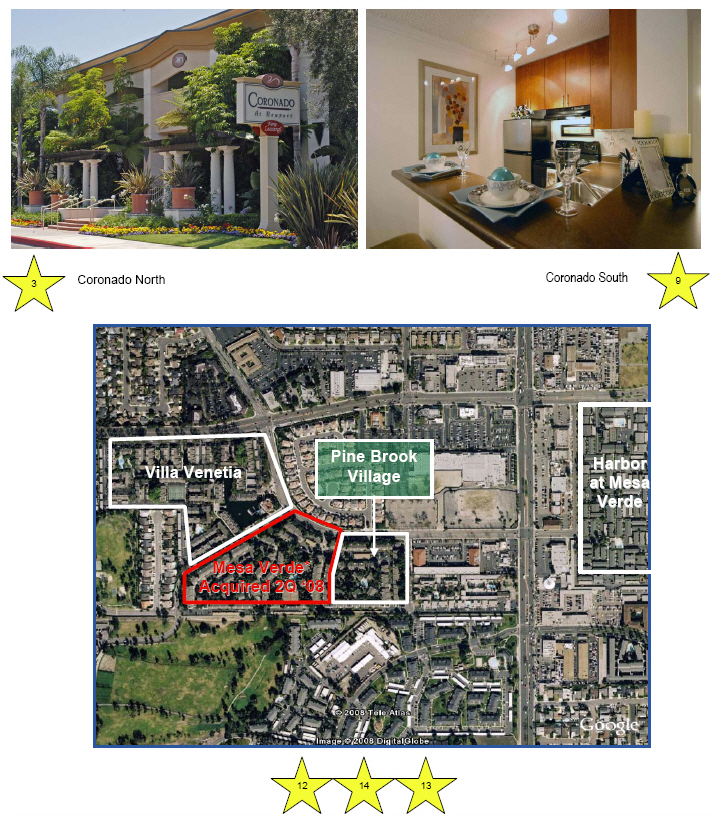
| • | | Acquisitions: Mesa Verde Villas, a 296-home community, was purchased in Q2 in Costa Mesa, CA. This community is a twin to Pine Brook Village, a 200-home community. Both were constructed by the same builder and share the same architecture, design and floor plans. Pine Brook Village and Mesa Verde also share a main entry into both properties, making Mesa Verde an excellent candidate to be merged with Pine Brook. This merger creates value immediately through operating efficiencies in leasing staff, maintenance staff and purchasing. |
| |
| • | | Redevelopment: More than 1,600 kitchen and bath renovations have been completed at an average cost of $10,800 and we are realizing an average return of 13.3 percent. An example of average rent increases: Huntington Vista — $1,600 before, $1,775 after, a 10.9% increase. |
| |
| • | | Potential Future Development: Foxborough, a 90-home operating community with in Orange, CA with annualized NOI of $1.3 million, is a potential future development opportunity, which would nearly triple the number of homes to 260. |
The local economy has recently softened due to the loss of jobs in the sub-prime lending industry, but long-term prospects are excellent. The region enjoys employment diversity, a highly educated work force and an attractive year round climate affording a variety of recreational activities.
3
Orange County
Market Fact Sheet
4
Orange County
Market Fact Sheet
5
Orange County
Market Fact Sheet
| | | | | | | | | | | | | | | | | | | | | |
| | | | | | | Year Built | | | | | | | | | | | Inc. per Occ. | |
| Operating Properties | | # Homes | | | ReDev | | | Redev. | | | Occupancy | | | Home | |
| 1 Pacific Palms | | | 149 | | | | 1962 | | | | | | | | 97.5 | % | | $ | 1,369 | |
| 2 Harbor at Mesa Verde | | | 384 | | | | 2003 | | | | K/B | | | | 94.6 | % | | | 1,640 | |
| 3 Coronado North | | | 732 | | | | 2000 | | | | K/B | | | | 94.3 | % | | | 1,489 | |
| 4 Missions at Back Bay | | | 104 | | | | 1969 | | | | K/B | | | | 96.9 | % | | | 1,521 | |
| 5 Vista del Rey | | | 116 | | | | 1969 | | | | K/B | | | | 96.8 | % | | | 1,434 | |
| 6 Foxborough | | | 90 | | | | 1969 | | | | | | | | 97.0 | % | | | 1,810 | |
| 7 Huntington Vista | | | 220 | | | | 1970 | | | | K/B | | | | 96.1 | % | | | 1,793 | |
| 8 The Arboretum at Lake Forest | | | 225 | | | | 1970 | | | | K/B | | | | 91.6 | % | | | 1,591 | |
| 9 Coronado South | | | 715 | | | | 2000 | | | | K/B | | | | 94.8 | % | | | 1,528 | |
| 10 Pacific Shores | | | 264 | | | | 2003 | | | | K/B | | | | 95.9 | % | | | 1,574 | |
| 11 Huntington Villas | | | 400 | | | | 1972 | | | | K/B | | | | 95.8 | % | | | 1,719 | |
| 12 Villa Venetia | | | 468 | | | | 2008 | | | | Full | | | | 95.7 | % | | | 1,711 | |
| 13 Pine Brook Village | | | 200 | | | | 1979 | | | | K/B | | | | 95.5 | % | | | 1,718 | |
| | | | | | | | | | | | | | | | |
Sub Total | | | 4,067 | | | | | | | | | | | | 95.2 | % | | | 1,599 | |
Non-Mature and Other | | | | | | | | | | | | | | | | | | | | |
| 14 Mesa Verde Villas (Pine Brook II) | | | 296 | | | | 1975 | | | | | | | | 96.0 | % | | | 1,732 | |
| | | | | | | | | | | | | | | | |
Sub Total | | | 296 | | | | | | | | | | | | 96.0 | % | | | 1,732 | |
| | | | | | | | | | | | | | | | |
Grand Total | | | 4,363 | | | | | | | | | | | | 95.2 | % | | $ | 1,608 | |
| | | | | | | | | | | | | | | | |
| | | | | | | | | | | | | | | | | | | | | | | | | |
| | | | | | | Current | | | Est. | | | Est. Cost | | | Est. Cost | | | Est. | |
| Development Opportunities | | Status | | | # Homes | | | # Homes | | | ($000) | | | per Home | | | Completion | |
| 6 Foxborough II | | Future | | | 90 | | | | 260 | | | $ | 77,000 | | | $ | 296,000 | | | TBD^ |
| 15 Mission Viejo | | Future | | | (land) | | | | 250 | | | | 90,000 | | | | 360,000 | | | TBD^ |
| | | | | | | | | | | | | | | | | | | | | | | |
Total | | | | | | | | | | | 510 | | | $ | 167,000 | | | | | | | | | |
| | | | | | | | | | | | | | | | | | | | | | | |
^ Properties will move into active development as financing opportunities and market conditions improve.
6
| | |
| | Metro DC
Market Fact Sheet |
Market Statistics & Peer Comparison
| | | | | |
| Metro DC Portfolio | | Homes | |
| Same Store Pool | | | 2,050 | |
| Non-Matures | | | 1,935 | |
| Homes in Development | | | — | |
| Held for Future Development | | | 615 | |
| | | | |
Total | | | 4,600 | |
| MRQ Mo. Inc./ Home (SS) | | $ | 1,417 | |
| MRQ Occupancy (SS) | | | 96.9 | % |
| | | | | | | | | |
| Company | | # Homes (SS) | | | Ave. Rent | |
| AVB | | | 2,793 | | | $ | 1,943 | |
| PPS | | | 1,972 | | | | 1,874 | |
| CPT | | | 3,081 | | | | 1,582 | |
| EQR | | | 7,859 | | | | 1,481 | |
| UDR | | | 2,050 | | | | 1,417 | |
| HME | | | 4,549 | | | | 1,308 | |
| AIV | | | 6,663 | | | | 1,254 | |
| CLP | | | 258 | | | | 886 | |
| | | | | | | |
| | | | 29,225 | | | $ | 1,474 | |
Metro DC is UDR’s#2
market and is expected to
contribute12.1%of the
Company’s 2008 total
pro forma NOI.
Metro DC Market Statistics
| | | | | | | | | | | | | | | | | |
| 2008 Forecast | | | Low Home Affordability | | | Economy | |
| Effective Rent (MRQ) | | $ | 1,380 | | | Ave. Market Rent | | $ | 1,474 | | | Population | | | 4,151,047 | |
| Occupancy (MRQ) | | | 94.3 | % | | Mo Payment: Entry Level*: | | | | | | Job Growth (MRQ) | | | 1.5 | % |
| Eff. Rent Growth ‘08F | | | 2.8 | % | | Home | | $ | 2,137 | | | Median Income | | $ | 99,000 | |
| Eff. Rent Growth ‘09F | | | 3.0 | % | | Condo | | $ | 1,785 | | | Housing Stock | | | | |
| Eff. Rent Growth ‘10F | | | 4.9 | % | | Median Home Price (MRQ) | | $ | 370,300 | | | Renter | | | 511,015 | |
| Multifamily Permits | | | 5,671 | | | Housing Affordability Score | | | 85 | | | % of Total | | | 33.3 | % |
Source: AXIOMetrics and Company Reports, Most Recent Quarter (MRQ), Merrill Lynch Apartment Monitor, Latest Available Data (LAD)
* Assumes 30 yr fixed at 6.3%
Recent Activity
UDR is expanding its presence in this market by buying communities in lease-up and well-located properties with renovation potential.
Value Creation:
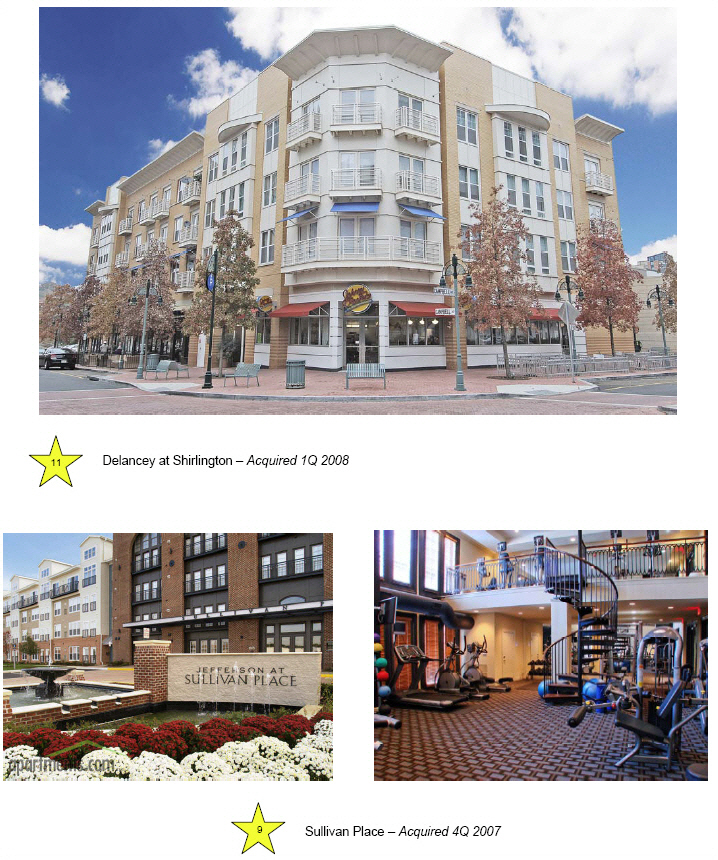
| • | | In the first quarter of 2008, we purchased Circle Towers, a mixed-use development that includes 606 apartment homes and more than 50,000 SF of office and retail space for $144.3M. Also in the first quarter, we purchased Delancey at Shirlington Village, a 241-home community in Alexandria, VA, for $85M. |
| |
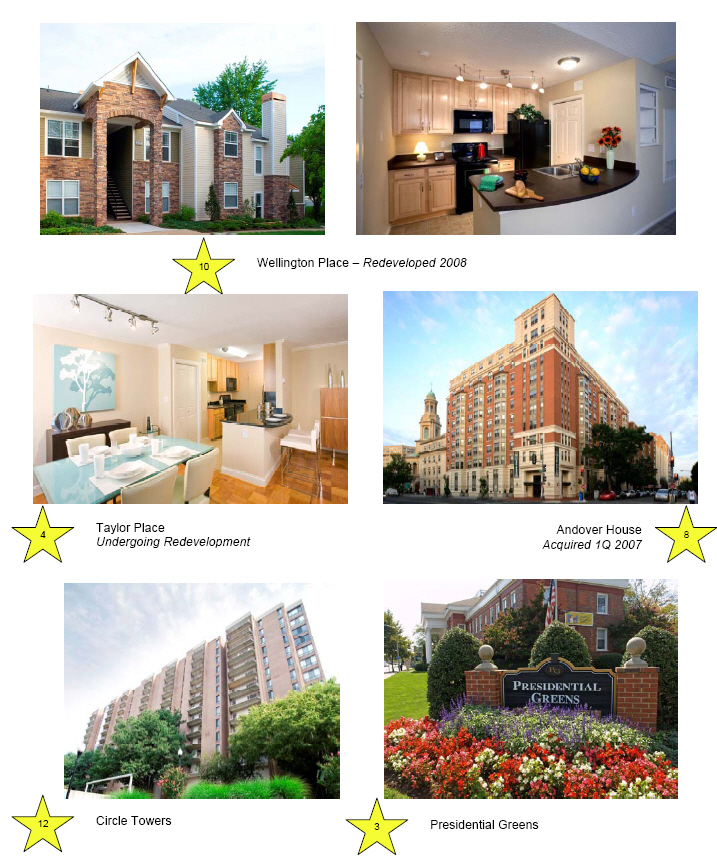
| • | | In the second quarter of 2008, we completed the full redevelopment of Wellington Place, a 372-home community in Manassas, VA that we purchased for $50.1M, or $135,000 per home, in 2005. We expect to realize an 4.9% cash-on-cash return from the incremental investment, a 22% improvement in cash flow, and estimated value creation of approximately $6.4M. |
| |
| • | | In the second quarter of 2008, we began full redevelopment of Taylor Place, a 218-home mid-rise community, located in Arlington, VA. This $13.9M redevelopment project is expected to realize an 8.2% return on incremental investment, a 52% improvement in cash flow, and estimated value creation of $15.3M. |
| |
| • | | We’ve completed more than 1,500 kitchen and bath renovations at an average cost of $9,836 and are realizing an average annualized return of 9.2%. |
7
Metro DC
Market Fact Sheet
8
Metro DC
Market Fact Sheet
9
Metro DC
Market Fact Sheet
| | | | | | | | | | | | | | | | | | | | | |
| | | | | | | Year Built | | | | | | | | | | | Inc. per Occ. | |
| Operating Properties | | # Homes | | | ReDev | | | Redev. | | | Occupancy | | | Home | |
| 1 Dominion Middle Ridge | | | 280 | | | | 1990 | | | | K/B | | | | 96.9 | % | | $ | 1,310 | |
| 2 Dominion Lake Ridge | | | 192 | | | | 1987 | | | | K/B | | | | 94.7 | % | | | 1,274 | |
| 3 Presidential Greens | | | 396 | | | | 1938 | | | | K/B | | | | 96.1 | % | | | 1,134 | |
| 5 Ridgewood I | | | 274 | | | | 1988 | | | | K/B | | | | 96.4 | % | | | 1,421 | |
| 6 The Calvert | | | 187 | | | | 1962 | | | | K/B | | | | 96.0 | % | | | 1,357 | |
| 7 Waterside Towers | | | 550 | | | | 1971 | | | | K/B | | | | 98.6 | % | | | 1,518 | |
| 8 Andover House | | | 171 | | | | 2004 | | | | | | | | 97.1 | % | | | 2,314 | |
| | | | | | | | | | | | | | | | |
Subtotal | | | 2,050 | | | | | | | | | | | | 96.9 | % | | | 1,417 | |
Non-Mature and Other | | | | | | | | | | | | | | | | | | | | |
| 4 Taylor Place — under redevelopment | | | 218 | | | | 2008 | | | | Full | | | | 30.5 | % | | | 1,092 | |
| 9 Sullivan Place — in lease-up | | | 498 | | | | 2007 | | | | | | | | 92.0 | % | | | 1,668 | |
| 10 Wellington Place | | | 372 | | | | 2008 | | | | Full | | | | 93.4 | % | | | 1,238 | |
| 11 Delancey at Shirlington — in lease-up | | | 241 | | | | 2008 | | | | | | | | 90.3 | % | | | 1,842 | |
| 12 Circle Towers | | | 606 | | | | 1972 | | | | Full | | | | 91.4 | % | | | 1,608 | |
| | | | | | | | | | | | | | | | |
Subtotal | | | 1,935 | | | | | | | | | | | | 84.9 | % | | | 1,557 | |
| | | | | | | | | | | | | | | | |
Grand Total | | | 3,985 | | | | | | | | | | | | 91.1 | % | | $ | 1,480 | |
| | | | | | | | | | | | | | | | |
| | | | | | | | | | | | | | | | | | | | | | | | | |
| | | | | | | Current | | | Est. | | | Est. Cost | | | Est. Cost | | | Est. | |
| Development Opportunities | | Status | | | # Homes | | | # Homes | | | ($000) | | | per Home | | | Completion | |
13 2400 14thStreet | | Future | | | — | | | | 255 | | | $ | 120,000 | | | $ | 470,600 | | | TBD^ |
| 14 Signal Hill — Woodbridge, VA | | Future | | | — | | | | 360 | | | | 82,700 | | | | 230,000 | | | TBD^ |
| | | | | | | | | | | | | | | | | | | | | | | |
Total | | | | | | | | | | | 615 | | | $ | 202,700 | | | | | | | | | |
| | | | | | | | | | | | | | | | | | | | | | | |
^ Properties held for future development pending financing.
10
| | |
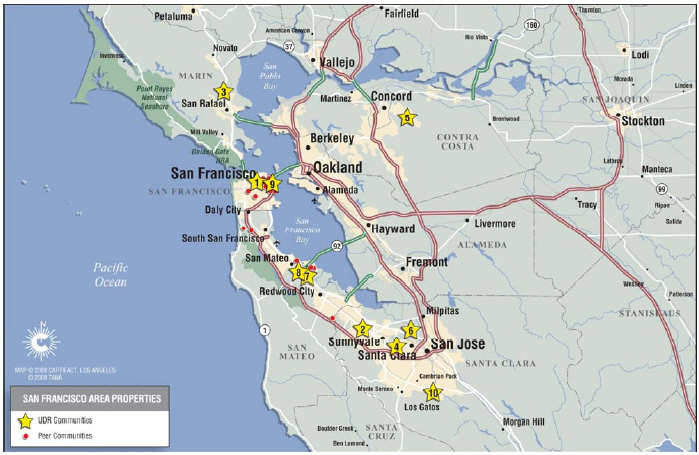
| | San Francisco
Market Fact Sheet |
Market Statistics & Peer Comparison
| | | | | |
| San Francisco Portfolio | | Homes | |
| Same Store Pool | | | 1,768 | |
| Non-Matures | | | 571 | |
| Homes in Development | | | — | |
| Held for Future Development | | | 200 | |
| | | | |
Total | | | 2,539 | |
| MRQ Mo. Inc./ Occ. Home (SS) | | $ | 1,853 | |
| MRQ Occupancy (SS) | | | 96.5 | % |
| | | | | | | | | |
| Company | | # Homes (SS) | | | Ave. Rent | |
| AVB | | | 2,482 | | | $ | 2,266 | |
| BRE | | | 1,265 | | | | 2,253 | |
| EQR | | | 736 | | | | 1,996 | |
| UDR | | | 1,768 | | | | 1,853 | |
| ESS | | | 765 | | | | 1,614 | |
| AIV | | | 496 | | | | 1,607 | |
| | | | | | | |
| | | | 7,512 | | | $ | 2,030 | |
San Francisco is UDR’s#3
market and is expected to
contribute8.7%of the
Company’s 2008 total pro forma NOI.
San Francisco Market Statistics
| | | | | | | | | | | | | | | | | |
| 2008 Forecast | | | Low Home Affordability | | | Economy | |
| Effective Rent (MRQ) | | $ | 2,062 | | | Ave. Market Rent | | $ | 2,030 | | | Population | | | 1,720,056 | |
| Occupancy (MRQ) | | | 95.6 | % | | Mo Payment: Entry Level*: | | | | | | Job Growth (MRQ) | | | 0.7 | % |
| Eff. Rent Growth ‘08F | | | 5.1 | % | | Home | | $ | 4,355 | | | Median Income | | $ | 94,300 | |
| Eff. Rent Growth ‘09F | | | 2.9 | % | | Condo | | $ | 3,668 | | | Housing Stock | | | | |
| Eff. Rent Growth ‘10F | | | 6.6 | % | | Median Home Price (MRQ) | | $ | 809,000 | | | Renter | | | 330,681 | |
| Multifamily Permits | | | 2,605 | | | Housing Affordability Score | | | 43 | | | % of Total | | | 49.1 | % |
Source: AXIOMetrics and Company Reports, Most Recent Quarter (MRQ), Merrill Lynch Apartment Monitor, Latest Available Data (LAD)
* Assumes 30 yr fixed at 6.3%
Recent Activity
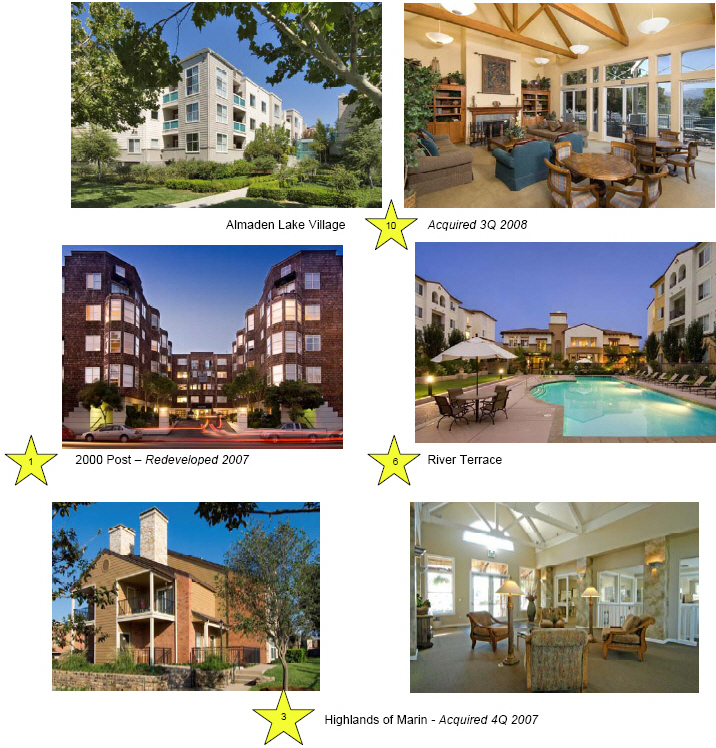
In July 2008, the Company acquired Almaden Lake Village, a 250-home community in San Jose, located adjacent to the Almaden Station for the Valley Transit Authority (VTA). This station provides direct light rail access to Silicon Valley employment centers and downtown San Jose. The property is also located one mile from the popular Westfield Oakridge Regional Mall, and the property is adjacent to Lake Almaden, providing residents direct access to a popular recreational area.
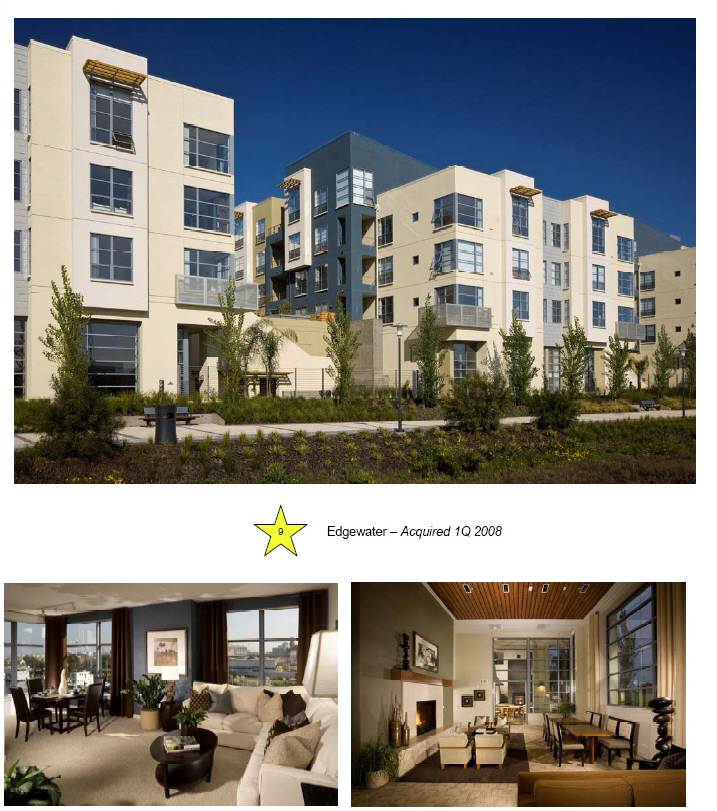
In the first quarter of 2008, UDR acquired Edgewater, a 193-home community in the Mission Bay district of San Francisco. The property was constructed in 2007 and is strategically located near public transportation and entertainment venues.
In the fourth quarter of 2007, the Company expanded its presence in this market with the purchase of Crest Marin, a 104-home community in San Rafael. The community is located directly adjacent to Highlands of Marin, an existing UDR property. Both properties will be completely renovated with new exterior siding, kitchens, baths, and more with expected rent increases of approximately $200 - $250 per home.
The company is improving existing homes though its kitchen and bath renovation program. Over 350 kitchen and bath renovations have been completed at an average cost of $14,250 and we are realizing an average annual return of 9.8%.
The region enjoys employment diversity, a highly educated work force and an attractive year round climate affording a variety of recreational activities. The median existing home price is $809,000 making this one of the least affordable markets in the U.S.
11
San Francisco
Market Fact Sheet
12
San Francisco
Market Fact Sheet
13
San Francisco
Market Fact Sheet
| | | | | | | | | | | | | | | | | | | | | |
| Operating Properties | | # Homes | | | Year Built
ReDev | | | Redev. | | | Occupancy | | | Inc. per Occ.
Home | |
| 1 2000 Post Street I | | | 304 | | | | 1987 | | | | K/B | | | | 98.1 | % | | $ | 2,320 | |
| 2 Birch Creek | | | 184 | | | | 1968 | | | | | | | | 97.2 | % | | | 1,792 | |
| 3 Highlands of Marin | | | 220 | | | | 2008 | | | | Full | | | | 94.8 | % | | | 1,676 | |
| 4 Marina Playa | | | 272 | | | | 1971 | | | | | | | | 97.4 | % | | | 1,708 | |
| 5 Crossroads Apartments | | | 130 | | | | 1986 | | | | K/B | | | | 94.4 | % | | | 1,449 | |
| 6 River Terrace | | �� | 250 | | | | 2005 | | | | | | | | 97.8 | % | | | 2,111 | |
| 7 Lake Pines | | | 288 | | | | 2008 | | | | | | | | 94.5 | % | | | 1,585 | |
| 8 Bay Terrace | | | 120 | | | | 1962 | | | | | | | | 97.7 | % | | | 1,917 | |
| | | | | | | | | | | | | | | | |
Subtotal | | | 1,768 | | | | | | | | | | | | 96.5 | % | | | 1,853 | |
Non-Mature | | | | | | | | | | | | | | | | | | | | |
| 1 2000 Post Street II (in lease-up) | | | 24 | | | | 2007 | | | | | | | | 86.9 | % | | | 2,298 | |
3 Highlands of Marin II(in lease-up) | | | 104 | | | | 2008 | | | | Full | | | | 90.0 | % | | | 1,280 | |
| 9 Edgewater | | | 193 | | | | 2008 | | | | | | | | 93.6 | % | | | 2,929 | |
| 10 Almaden Lake Village | | | 250 | | | | 1999 | | | | | | | | 97.1 | % | | | 1,613 | |
| | | | | | | | | | | | | | | | |
Subtotal | | | 571 | | | | | | | | | | | | 94.2 | % | | | 2,024 | |
| | | | | | | | | | | | | | | | |
Grand Total | | | 2,339 | | | | | | | | | | | | 95.9 | % | | $ | 1,894 | |
| | | | | | | | | | | | | | | | |
| | | | | | | | | | | | | | | | | | | | | | | | | |
| | | | | | | Current | | | Est. | | | Est. Cost | | | Est. Cost | | | Est. | |
| Development Opportunities | | Status | | | # Homes | | | # Homes | | | ($000) | | | per Home | | | Completion | |
| 8 Bay Terrace^ | | Future | | | 120 | | | | 200 | | | $ | 79,000 | | | $ | 395,000 | | | TBD^ |
| | | | | | | | | | | | | | | | | | | | | | | |
Total | | | | | | | | | | | 200 | | | $ | 79,000 | | | | | | | | | |
| | | | | | | | | | | | | | | | | | | | | | | |
^Bay Terrace currently has a net carrying value of $21M and delivers annualized NOI of $1.8M. This property will move into active development as financing opportunities and market conditions improve.
14
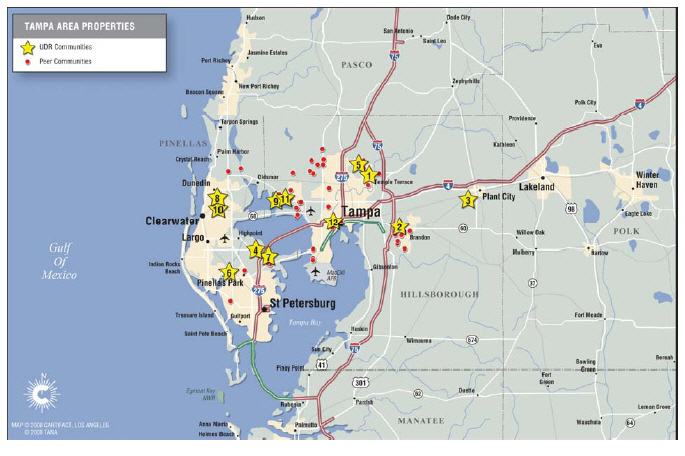
| | |
| | Tampa
Market Fact Sheet |
Market Statistics & Peer Comparison
| | | | | |
| Tampa Portfolio | | Homes | |
| Same Store Pool | | | 3,081 | |
| Non-Matures | | | 486 | |
| Homes in Development | | | 249 | |
| Held for Future Development | | | — | |
| | | | |
Total | | | 3,816 | |
| MRQ Mo. Inc./ Occ. Home (SS) | | $ | 952 | |
| MRQ Occupancy (SS) | | | 94.3 | % |
| | | | | | | | | |
| Company | | # of Homes (SS) | | | Ave. Rent | |
| PPS | | | 1,644 | | | $ | 1,390 | |
| UDR | | | 3,081 | | | | 952 | |
| CLP | | | 318 | | | | 933 | |
| MAA | | | 1,120 | | | | 850 | |
| CPT | | | 5,503 | | | | 839 | |
| EQR | | | 2,887 | | | | 812 | |
| AIV | | | 3,658 | | | | 806 | |
| | | | | | | |
| | | | 18,211 | | | $ | 899 | |
Tampa is UDR’s#4market
and is expected to
contribute6.4%of the
Company’s 2008 total pro forma NOI.
Tampa Market Statistics
| | | | | | | | | | | | | | | | | |
| 2008 Forecast | | | Low Home Affordability | | | Economy | |
| Effective Rent (MRQ) | | $ | 817 | | | Ave. Market Rent | | $ | 899 | | | Population | | | 2,723,949 | |
| Occupancy (MRQ) | | | 91.2 | % | | Mo Payment: Entry Level*: | | | | | | Job Growth (MRQ) | | | -1.6 | % |
| Eff. Rent Growth ‘08F | | | -3.0 | % | | Home | | $ | 1,226 | | | Median Income | | $ | 56,500 | |
| Eff. Rent Growth ‘09F | | | -4.8 | % | | Condo | | $ | 1,004 | | | Housing Stock | | | | |
| Eff. Rent Growth ‘10F | | | 1.0 | % | | Median Home Price (MRQ) | | $ | 180,800 | | | Renter | | | 321,771 | |
| Multifamily Permits | | | 4,204 | | | Housing Affordability Score | | | 96 | | | % of Total | | | 29.0 | % |
Source: AXIOMetrics and Company Reports, Most Recent Quarter (MRQ), Merrill Lynch Apartment Monitor, Latest Available Data (LAD)
* Assumes 30 yr fixed at 6.3%
Recent Activity
The Company has demonstrated success in creating additional value from its Tampa properties in a variety of ways:
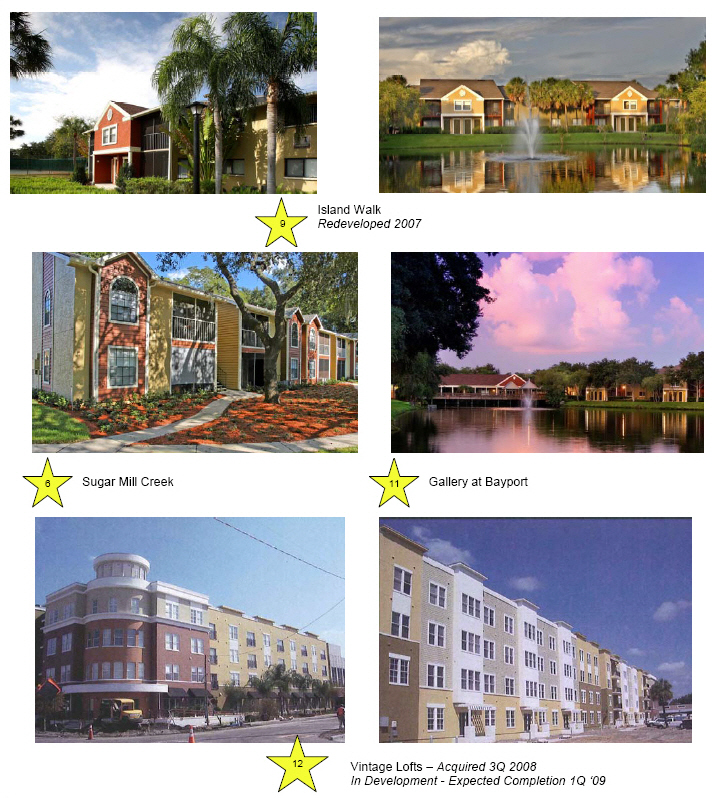
| • | | New Development — In the third quarter of 2008, we completed the purchase of a 249-home community, Vintage Lofts, at North Hyde Park in Tampa, utilizing 1031 exchange funds from the March 2008 portfolio sale. This property is currently under development at a budgeted cost of $52M, with an expected completion date of 1Q ‘09. |
| |
| • | | Redevelopment — we recently completed full redevelopment The Breyley, a 209-home community in Clearwater. In addition to the redevelopment program, we have completed more than 1,600 kitchen and bath renovations. |
Recent issues in the housing and lending sectors have slowed Tampa’s economy but AXIOMetrics forecasts job growth in a number of sectors, including education and health services, government, other services, leisure and hospitality and trade, transportation and utilities.
15
Tampa
Market Fact Sheet
16
Tampa
Market Fact Sheet
17
Tampa
Market Fact Sheet
| | | | | | | | | | | | | | | | | | | | | |
| | | | | | | Year Built | | | | | | | | | | | Inc. per Occ. | |
| Operating Properties | | # Homes | | | ReDev | | | Redev. | | | Occupancy | | | Home | |
| 1 Summit West | | | 266 | | | | 1972 | | | | — | | | | 92.9 | % | | $ | 869 | |
| 2 Lakewood Place | | | 346 | | | | 1986 | | | | K/B | | | | 94.2 | % | | | 845 | |
| 3 Hunters Ridge | | | 352 | | | | 1992 | | | | K/B | | | | 91.7 | % | | | 811 | |
| 4 Bay Meadows | | | 288 | | | | 1985 | | | | K/B | | | | 95.5 | % | | | 985 | |
| 5 Cambridge Woods | | | 275 | | | | 1985 | | | | K/B | | | | 93.8 | % | | | 861 | |
| 6 Sugar Mill Creek | | | 212 | | | | 1988 | | | | K/B | | | | 96.2 | % | | | 895 | |
| 7 Inlet Bay at Gateway | | | 464 | | | | 1988 | | | | Full | | | | 94.9 | % | | | 977 | |
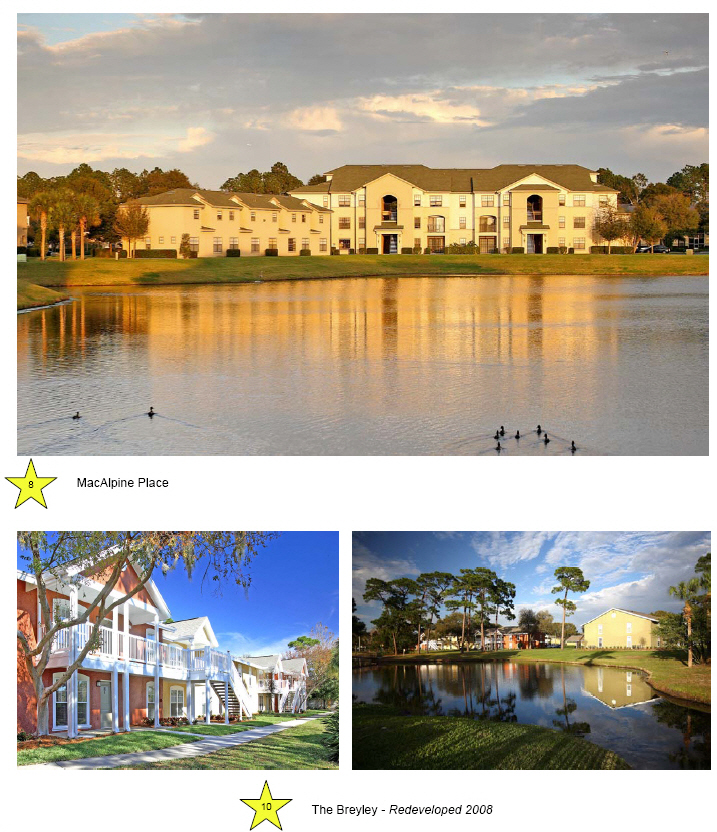
| 8 MacAlpine Place | | | 478 | | | | 2007 | | | | — | | | | 95.1 | % | | | 1,118 | |
| 9 Island Walk | | | 400 | | | | 1985 | | | | Full | | | | 94.2 | % | | | 1,057 | |
| | | | | | | | | | | | | | | | |
Subtotal | | | 3,081 | | | | | | | | | | | | 94.3 | % | | | 952 | |
Non-Mature | | | | | | | | | | | | | | | | | | | | |
| 10 The Breyley Apartments | | | 209 | | | | 2008 | | | | Full | | | | 93.0 | % | | | 973 | |
| 11 Gallery at Bayport (held for disposition) | | | 277 | | | | | | | | | | | | 74.9 | % | | | 958 | |
Subtotal | | | 486 | | | | | | | | | | | | 82.6 | % | | | 965 | |
| | | | | | | | | | | | | | | | |
Grand Total | | | 3,567 | | | | | | | | | | | | 92.7 | % | | $ | 954 | |
| | | | | | | | | | | | | | | | |
| | | | | | | | | | | | | | | | | | | | | | | | | |
| | | | | | | Current | | | Est. | | | Est. Cost | | | Est. Cost | | | Expected | |
| Development Opportunities | | Status | | | # Homes | | | # Homes | | | ($000) | | | per Home | | | Completion | |
| 12 Vintage Lofts | | Active | | | — | | | | 249 | | | $ | 52,000 | | | $ | 208,800 | | | | 1Q 09 | |
| | | | | | | | | | | | | | | | | | | | | | | |
Total | | | | | | | | | | | 249 | | | $ | 52,000 | | | | | | | | | |
| | | | | | | | | | | | | | | | | | | | | | | |
18
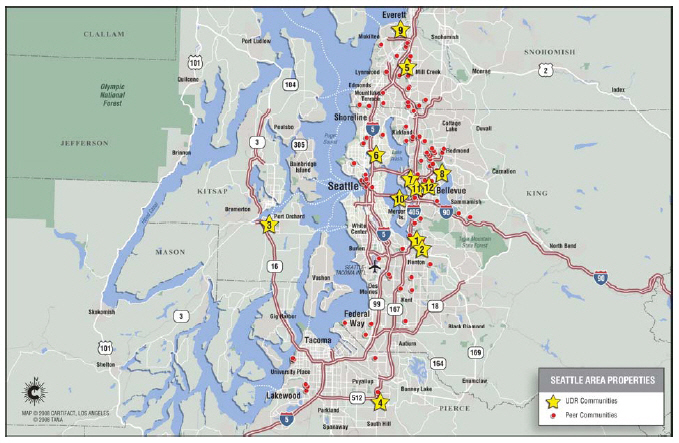
| | |
| | Seattle
Market Fact Sheet |
Market Statistics & Peer Comparison
| | | | | |
| Seattle Portfolio | | Homes | |
| Same Store Pool | | | 1,270 | |
| Non-Matures | | | 455 | |
| Homes in Development | | | 274 | |
| Held for Future Development | | | 704 | |
| | | | |
Total | | | 2,703 | |
| MRQ Mo. Inc./ Occ. Home (SS) | | $ | 1,206 | |
| MRQ Occupancy (SS) | | | 96.3 | % |
| | | | | | | | | |
| Company | | # of Homes (SS) | | | Ave. Rent | |
| BRE | | | 3,491 | | | $ | 1,338 | |
| AVB | | | 2,492 | | | | 1,316 | |
| AIV | | | 468 | | | | 1,265 | |
| UDR | | | 1,270 | | | | 1,206 | |
| ESS | | | 5,164 | | | | 1,184 | |
| EQR | | | 6,886 | | | | 1,170 | |
| | | | | | | |
| | | | 19,771 | | | $ | 1,226 | |
Seattle is UDR’s#5market
and is expected to
contribute5.5%of the
Company’s 2008 total
pro forma NOI.
Seattle Market Statistics
| | | | | | | | | | | | | | | | | |
| 2008 Forecast | | | Low Home Affordability | | | Economy | |
| Effective Rent (MRQ) | | $ | 1,212 | | | Ave. Market Rent | | $ | 1,226 | | | Population | | | 2,536,182 | |
| Occupancy (MRQ) | | | 94.3 | % | | Mo Payment: Entry Level*: | | | | | | Job Growth (MRQ) | | | 2.3 | % |
| Eff. Rent Growth ‘08F | | | 4.8 | % | | Home | | $ | 2,291 | | | Median Income | | $ | 81,400 | |
| Eff. Rent Growth ‘09F | | | 0.9 | % | | Condo | | $ | 1,917 | | | Housing Stock | | | | |
| Eff. Rent Growth ‘10F | | | 1.7 | % | | Median Home Price (MRQ) | | $ | 380,500 | | | Renter | | | 367,516 | |
| Multifamily Permits | | | 7,943 | | | Housing Affordability Score | | | 64 | | | % of Total | | | 36.0 | % |
Source: AXIOMetrics and Company Reports, Most Recent Quarter (MRQ), Merrill Lynch Apartment Monitor, Latest Available Data (LAD)
* Assumes 30 yr fixed at 6.3%
Recent Activity
| |
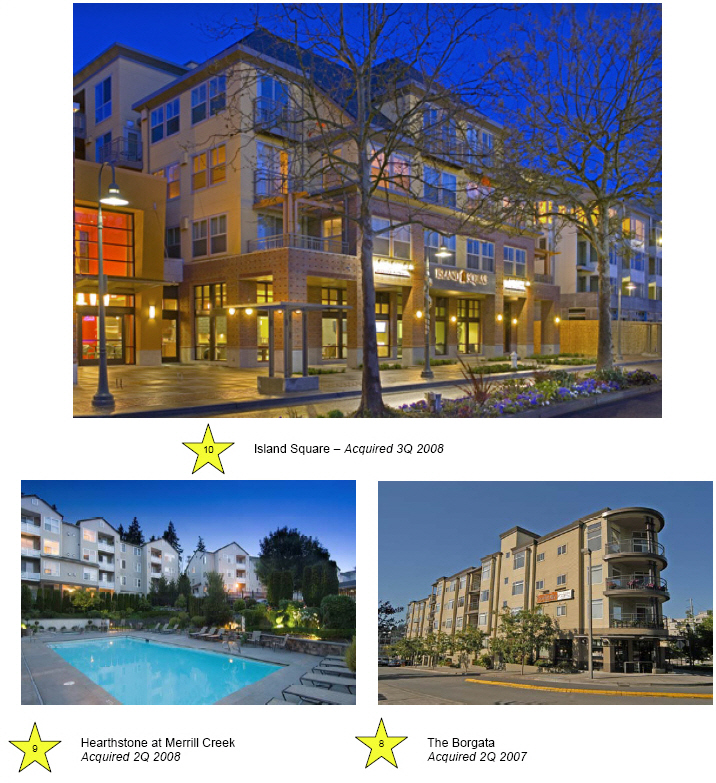
| UDR has been expanding its presence in the Seattle market in a number of ways, including: |
| • | | The acquisition of two new communities in 2008: |
| | • | | Island Square, a mixed-use development with 235 apartment homes, 25K square feet of retail and 14K square feet of office space, located on Mercer Island, with access to both downtown Seattle and Bellevue job centers; and |
| |
| | • | | Hearthstone at Merrill Creek, a 220-home community located in Merrill Creek Business Park, home to employers including Campbell’s Soup, TRW Aeronautical Systems, The Fluke Company, and Boeing. |
| • | | The acquisition of Borgata Apartments in May, 2007. This is a mixed-use community with 71-apartment homes and 5,358 square feet of retail space in Bellevue. |
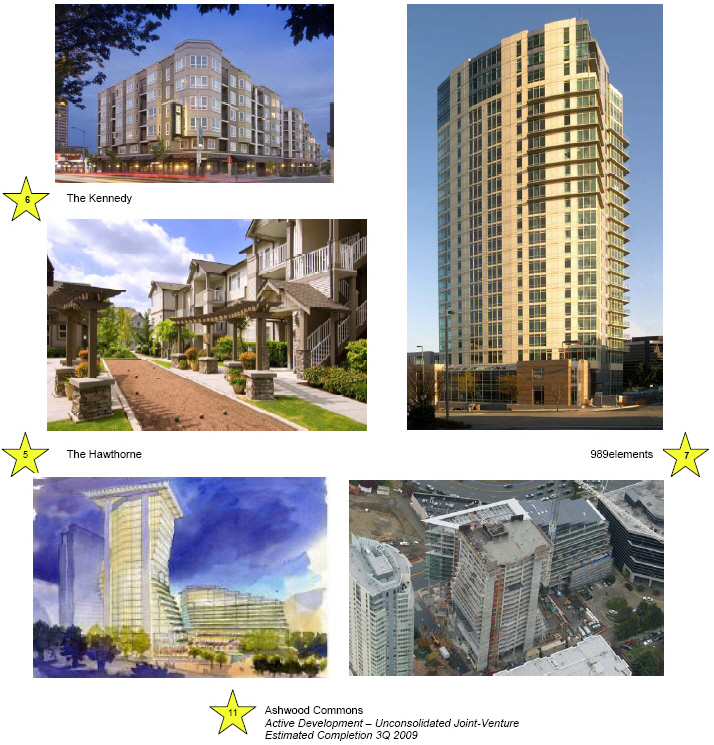
| |
| • | | Closing on a 49% joint venture interest in 989elements in January, 2007. This is a recently completed 23-story high-rise mixed use property located in the central business district of Bellevue with 166-apartment homes and 17,611 square feet of commercial space. |
| |
| • | | UDR has two joint venture developments with Su Development in which UDR has a 49% interest: |
| | • | | Ashwood Commons, a 274-home high-rise community with ground floor retail. Construction is underway with expected completion in the third quarter of 2009. |
| |
| | • | | Bellevue Plaza, a 430-home high-rise community with ground floor retail. This property is planned for future development. |
19
Seattle
Market Fact Sheet
20
Seattle
Market Fact Sheet
21
Seattle
Market Fact Sheet
| | | | | | | | | | | | | | | | | | | | | |
| | | | | | | Year Built | | | | | | | | | | | Inc. per Occ. | |
| Operating Properties | | # Homes | | | ReDev | | | Redev. | | | Occupancy | | | Home | |
| 1 Hilltop | | | 156 | | | | 1985 | | | | K/B | | | | 97.2 | % | | $ | 1,010 | |
| 2 Crown Pointe | | | 196 | | | | 1987 | | | | K/B | | | | 96.0 | % | | | 952 | |
| 3 Arbor Terrace | | | 276 | | | | 1996 | | | | K/B | | | | 95.4 | % | | | 908 | |
| 4 Aspen Creek | | | 162 | | | | 1996 | | | | — | | | | 95.5 | % | | | 969 | |
| 5 The Hawthorne Apartments | | | 284 | | | | 2003 | | | | — | | | | 97.9 | % | | | 1,401 | |
| 6 The Kennedy Building | | | 125 | | | | 2005 | | | | — | | | | 94.8 | % | | | 1,679 | |
| 8 Borgata Apartment Homes | | | 71 | | | | 2001 | | | | K/B | | | | 96.1 | % | | | 2,438 | |
| | | | | | | | | | | | | | | | |
Subtotal | | | 1,270 | | | | | | | | | | | | 96.3 | % | | | 1,206 | |
Non-Mature and Other | | | | | | | | | | | | | | | | | | | | |
7 989elements(Operating JV — 49%) | | | 166 | | | | 2007 | | | | — | | | | 97.1 | % | | | 1,911 | |
| 9 Hearthstone at Merrill Creek | | | 220 | | | | 2000 | | | | — | | | | 94.9 | % | | | 1,182 | |
| 10 Island Square | | | 235 | | | | 2007 | | | | — | | | | 90.3 | % | | | 1,776 | |
| | | | | | | | | | | | | | | | |
Subtotal (UDR)* | | | 455 | | | | | | | | | | | | 92.5 | % | | | 1,482 | |
| | | | | | | | | | | | | | | | |
Grand Total (UDR)* | | | 1,725 | | | | | | | | | | | | 95.3 | % | | $ | 1,277 | |
| | | | | | | | | | | | | | | | |
* Excludes joint venture homes
| | | | | | | | | | | | | | | | | | | | | | | | | |
| | | | | | | Current | | | Est. | | | Est. Cost | | | Cost per | | | Expected | |
| Development Opportunities | | Status | | | # Homes | | | # Homes | | | ($000) | | | Home | | | Completion | |
11 Ashwood Commons(JV — 49%)** | | Active | | | — | | | | 274 | | | $ | 49,000 | | | $ | 365,000 | | | | 3Q 09 | |
| 12 Bellevue Plaza (JV — 49%)** | | Future | | | — | | | | 430 | | | | 66,000 | | | | 314,000 | | | TBD^ |
| | | | | | | | | | | | | | | | | | | | | | | |
Total | | | | | | | | | | | 274 | | | $ | 115,000 | | | | | | | | | |
| | | | | | | | | | | | | | | | | | | | | | | |
** Est. costs, except for cost per home, are calculated based on UDR’s ownership percentage of 49%.
^ This property will move into active development as financing opportunities and market conditions improve.
22
| | |
| | Baltimore
Market Fact Sheet |
Market Statistics & Peer Comparison
| | | | | |
| Baltimore Portfolio | | Homes | |
| Same Store Pool | | | 1,556 | |
| Non-Matures | | | 564 | |
| Homes in Development | | | — | |
| Held for Future Development | | | — | |
| | | | |
Total | | | 2,120 | |
| MRQ Mo. Inc./ Home (SS) | | $ | 1,186 | |
| MRQ Occupancy (SS) | | | 96.8 | % |
| | | | | | | | | |
| Company | | # of Homes (SS) | | | Ave. Rent | |
| AEC | | | 316 | | | $ | 1,426 | |
| CPT | | | 628 | | | | 1,372 | |
| AVB | | | 1,278 | | | | 1,201 | |
| UDR | | | 1,556 | | | | 1,186 | |
| AIV | | | 1,438 | | | | 1,137 | |
| EQR | | | 438 | | | | 1,055 | |
| HME | | | 6,114 | | | | 1,006 | |
| | | | | | | |
| | | | 11,768 | | | $ | 1,100 | |
Baltimore is UDR’s#6
market and is expected to
contribute5.3%of the
Company’s 2008 total
pro forma NOI.
Baltimore Market Statistics
| | | | | | | | | | | | | | | | | |
| 2008 Forecast | | | Low Home Affordability | | | Economy | |
| Effective Rent (MRQ) | | $ | 1,040 | | | Ave. Market Rent | | $ | 1,100 | | | Population | | | 2,668,056 | |
| Occupancy (MRQ) | | | 94.0 | % | | Mo Payment: Entry Level*: | | | | | | Job Growth (MRQ) | | | 0.6 | % |
| Eff. Rent Growth ‘08F | | | 1.6 | % | | Home | | $ | 1,854 | | | Median Income | | $ | 78,200 | |
| Eff. Rent Growth ‘09F | | | 1.9 | % | | Condo | | $ | 1,542 | | | Housing Stock | | | | |
| Eff. Rent Growth ‘10F | | | 2.9 | % | | Median Home Price (MRQ) | | $ | 280,500 | | | Renter | | | 307,537 | |
| Multifamily Permits | | | 1,939 | | | Housing Affordability Score | | | 89 | | | % of Total | | | 30.9 | % |
Sources: AXIOMetrics and Company Reports, Most Recent Quarter (MRQ), Merrill Lynch Apartment Monitor, Latest Available Data (LAD)
* Assumes 30 yr fixed at 6.3%
Recent Activity
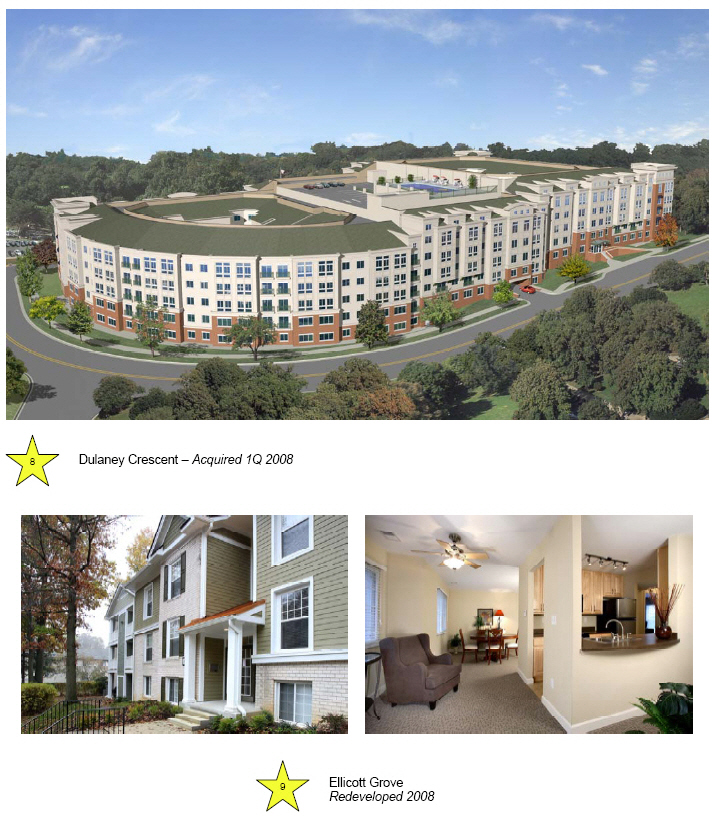
In the first quarter of 2008, we acquired Dulaney Crescent, a 264-home community in Towson, MD. The Company has demonstrated success in creating additional value in this market in a variety of ways:
| • | | Redevelopment — in the second quarter of 2008, we completed the full redevelopment of Dominion Great Oaks, a 300-home community now known as Ellicott Grove. This is expected to result in a 7.9% cash-on-cash return, for total value creation of $16.1 million. |
| |
| • | | In addition to the redevelopment program, we have completed more than 1,000 kitchen and bath renovations. |
The area has a stable employment base led by substantial government jobs and institutional employment in the education and health sectors.
23
Baltimore
Market Fact Sheet
24
Baltimore
Market Fact Sheet
25
Baltimore
Market Fact Sheet
| | | | | | | | | | | | | | | | | | | | | |
| | | | | | | Year Built | | | | | | | | | | | Inc. per Occ. | |
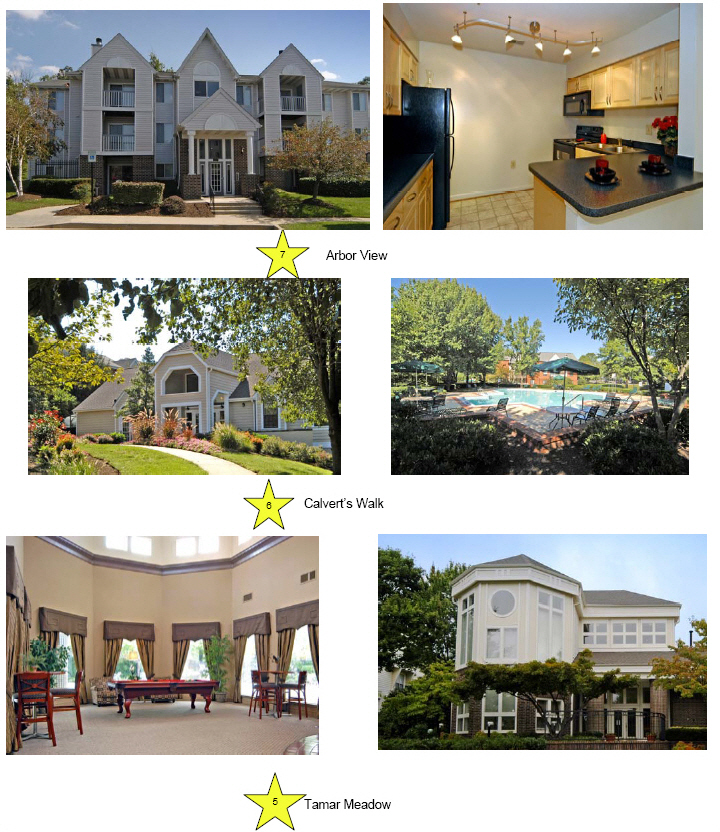
| Operating Properties | | # Homes | | | ReDev | | | Redev. | | | Occupancy | | | Home | |
| 1 Dominion Kings Place | | | 170 | | | | 1983 | | | | K/B | | | | 97.2 | % | | $ | 1,198 | |
| 2 Dominion at Eden Brook | | | 232 | | | | 1984 | | | | K/B | | | | 96.5 | % | | | 1,233 | |
| 3 Dominion Constant Friendship | | | 136 | | | | 1990 | | | | K/B | | | | 97.0 | % | | | 1,142 | |
| 4 Lakeside Mill | | | 192 | | | | 1989 | | | | K/B | | | | 96.9 | % | | | 1,102 | |
| 5 Tamar Meadow | | | 178 | | | | 1990 | | | | K/B | | | | 95.8 | % | | | 1,425 | |
| 6 Calvert’s Walk | | | 276 | | | | 1988 | | | | K/B | | | | 97.5 | % | | | 1,113 | |
| 7 Arborview | | | 372 | | | | 1992 | | | | K/B | | | | 96.7 | % | | | 1,141 | |
| | | | | | | | | | | | | | | | |
Subtotal | | | 1,556 | | | | | | | | | | | | 96.8 | % | | | 1,186 | |
Non-Mature | | | | | | | | | | | | | | | | | | | | |
| 8 Dulaney Crescent | | | 264 | | | | 2003 | | | | — | | | | 92.6 | % | | | 1,583 | |
| 9 Ellicott Grove | | | 300 | | | | 2008 | | | | Full | | | | 95.3 | % | | | 1,297 | |
| | | | | | | | | | | | | | | | |
Subtotal | | | 564 | | | | | | | | | | | | 94.0 | % | | | 1,429 | |
| | | | | | | | | | | | | | | | |
Grand Total | | | 2,120 | | | | | | | | | | | | 96.1 | % | | $ | 1,249 | |
| | | | | | | | | | | | | | | | |
26
| | |
| | Los Angeles County
Market Fact Sheet |
Market Statistics & Peer Comparison
| | | | | |
| LA County Portfolio | | Homes | |
| Same Store Pool | | | 1,052 | |
| Non-Matures | | | 626 | |
| Homes in Development | | | — | |
| Held for Future Development | | | 408 | |
| | | | |
Total | | | 2,086 | |
| MRQ Mo. Inc./ Home (SS) | | $ | 1,529 | |
| MRQ Occupancy (SS) | | | 94.9 | % |
| | | | | | | | | |
| Company | | # of Homes (SS) | | | Ave. Rent | |
| AIV | | | 2,179 | | | $ | 2,600 | |
| CPT | | | 538 | | | | 2,090 | |
| ESS | | | 3,016 | | | | 1,874 | |
| AVB | | | 2,392 | | | | 1,837 | |
| BRE | | | 2,237 | | | | 1,761 | |
| EQR | | | 6,079 | | | | 1,686 | |
| UDR | | | 1,052 | | | | 1,529 | |
| | | | | | | |
| | | | 17,439 | | | $ | 1,865 | |
LA County is UDR’s#7
market and is expected to
contribute5.1%of the
Company’s 2008 total
pro forma NOI.
LA County Market Statistics
| | | | | | | | | | | | | | | | | |
| 2008 Forecast | | | Low Home Affordability | | | Economy | |
| Effective Rent (MRQ) | | $ | 1,817 | | | Ave. Market Rent | | $ | 1,865 | | | Population | | | 9,878,554 | |
| Occupancy (MRQ) | | | 93.6 | % | | Mo Payment: Entry Level*: | | | | | | Job Growth (MRQ) | | | -0.5 | % |
| Eff. Rent Growth ‘08F | | | 0.2 | % | | Home | | $ | 2,489 | | | Median Income | | $ | 59,800 | |
| Eff. Rent Growth ‘09F | | | 0.4 | % | | Condo | | $ | 2,087 | | | Housing Stock | | | | |
| Eff. Rent Growth ‘10F | | | 2.7 | % | | Median Home Price (MRQ) | | $ | 435,000 | | | Renter | | | 1,623,435 | |
| Multifamily Permits | | | 3,942 | | | Housing Affordability Score | | | 53 | | | % of Total | | | 51.0 | % |
Sources: AXIOMetrics and Company Reports, Most Recent Quarter (MRQ), Merrill Lynch Apartment Monitor, Latest Available Data (LAD)
* Assumes 30 yr fixed at 6.3%
Recent Activity
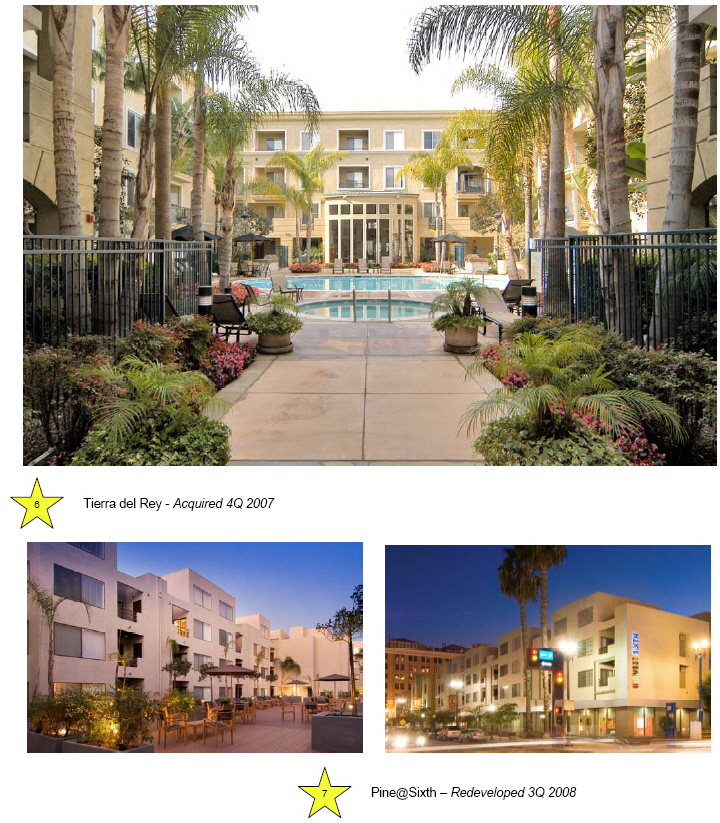
UDR is expanding its presence in this market with one recent acquisition, one recently completed development and one recently completed redevelopment:
| • | | Tierra del Rey, Marina del Ray, CA — a 170-home community acquired in the fourth quarter of 2007 for $76 million. Built in 1999, this community is undergoing a kitchen and bath renovation. |
| |
| • | | Jefferson at Marina del Rey — 298 homes developed at an average cost of $463,000 per home in a joint venture with JPI. This property was completed in the third quarter, 2008 and is now in lease-up. |
| |
| • | | Pine@Sixth, a 158-home redevelopment community completed in the third quarter of 2008. |
The local economy has recently softened, however key local industries including leisure and hospitality, other services, and education and health Services, the entertainment sector and the ports of Los Angeles and Long Beach remain stable. The region enjoys a highly educated work force and an attractive year round climate affording a variety of recreational activities.
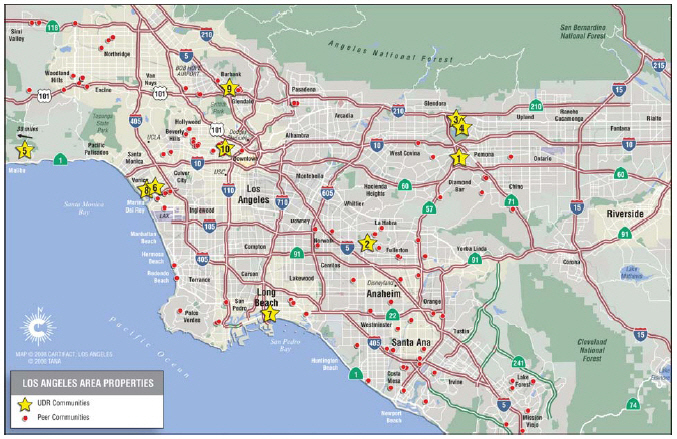
27
Los Angeles County
Market Fact Sheet
28
Los Angeles County
Market Fact Sheet
29
Los Angeles County
Market Fact Sheet
| | | | | | | | | | | | | | | | | | | | | |
| | | | | | | Year Built | | | | | | | | | | | Inc. per Occ. | |
| Operating Properties | | # Homes | | | ReDev | | | Redev. | | | Occupancy | | | Home | |
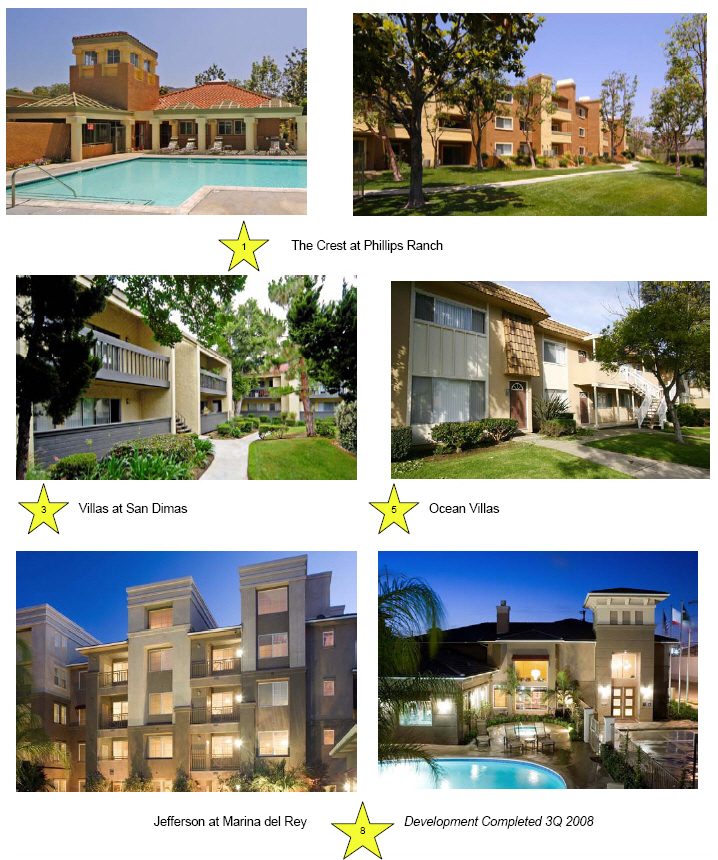
| 1 The Crest at Phillips Ranch | | | 501 | | | | 1989 | | | | K/B | | | | 94.5 | % | | $ | 1,588 | |
| 2 Rosebeach | | | 174 | | | | 1970 | | | | K/B | | | | 93.6 | % | | | 1,447 | |
| 3 The Villas at San Dimas | | | 156 | | | | 1981 | | | | K/B | | | | 95.5 | % | | | 1,500 | |
| 4 The Villas at Bonita | | | 102 | | | | 1981 | | | | — | | | | 95.3 | % | | | 1,496 | |
| 5 Ocean Villa | | | 119 | | | | 1965 | | | | — | | | | 97.3 | % | | | 1,471 | |
| | | | | | | | | | | | | | | | |
Subtotal | | | 1,052 | | | | | | | | | | | | 94.9 | % | | | 1,529 | |
Non-Mature and Other | | | | | | | | | | | | | | | | | | | | |
| 6 Tierra del Rey | | | 170 | | | | 1999 | | | | K/B | | | | 95.4 | % | | | 2,499 | |
| 7 Pine@Sixth | | | 158 | | | | 2008 | | | | Full | | | | 84.1 | % | | | 1,266 | |
| 8 Jefferson at Marina del Rey (in lease-up) | | | 298 | | | | 2008 | | | | — | | | | 37.9 | % | | | 2,661 | |
| | | | | | | | | | | | | | | | |
Subtotal | | | 626 | | | | | | | | | | | | 79.7 | % | | | 2,142 | |
| | | | | | | | | | | | | | | | |
Grand Total | | | 1,678 | | | | | | | | | | | | 89.9 | % | | $ | 1,707 | |
| | | | | | | | | | | | | | | | |
| | | | | | | | | | | | | | | | | | | | | | | | | |
| | | | | | | Current | | | Est. | | | Est. Cost | | | Est. Cost | | | Est. | |
| Development Opportunities | | Status | | | # Homes | | | # Homes | | | ($000) | | | per Home | | | Completion | |
| 9 Grandview | | Future | | | — | | | | 218 | | | $ | 67,000 | | | $ | 307,000 | | | TBD^ |
| 10 3033 Wilshire | | (land) | | | — | | | | 190 | | | | 100,900 | | | | 531,000 | | | TBD^ |
| | | | | | | | | | | | | | | | | | | | | | | |
Total | | | | | | | | | | | 408 | | | $ | 167,900 | | | | | | | | | |
| | | | | | | | | | | | | | | | | | | | | | | |
^ Grandview is an operating property with a net carrying value of $10M, delivering annualized NOI of $.6M. Wilshire is entitled land with an estimated net carrying value of $11M. These properties will move into active development as financing opportunities and market conditions improve.
30
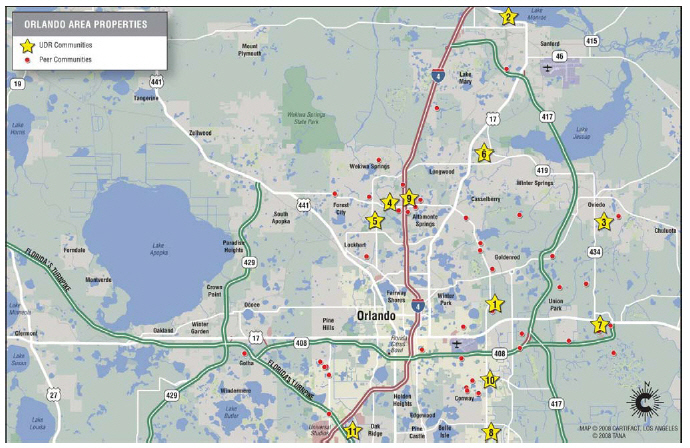
Market Statistics & Peer Comparison
| | | | | |
| Orlando Portfolio | | Homes | |
| Same Store Pool | | | 2,500 | |
| Non-Matures | | | 667 | |
| Homes in Development | | | 395 | |
| Held for Future Development | | | — | |
| | | | |
Total | | | 3,562 | |
| MRQ Mo. Inc./ Home (SS) | | $ | 963 | |
| MRQ Occupancy (SS) | | | 92.1 | % |
| | | | | | | | | |
| Company | | # of Homes (SS) | | | Ave. Rent | |
| PPS | | | 427 | | | $ | 1,473 | |
| CLP | | | 2,251 | | | | 1,007 | |
| AEC | | | 288 | | | | 992 | |
| UDR | | | 2,500 | | | | 963 | |
| EQR | | | 6,960 | | | | 924 | |
| CPT | | | 3,296 | | | | 904 | |
| AIV | | | 3,888 | | | | 797 | |
| MMA | | | 288 | | | | 792 | |
| | | | | | | |
| | | | 19,898 | | | $ | 921 | |
Orlando is UDR’s#8
market and is expected to
contribute4.8%of the
Company’s 2008 total
pro forma NOI.
Orlando Market Statistics
| | | | | | | | | | | | | | | | | |
| 2008 Forecast | | | Low Home Affordability | | | Economy | |
| Effective Rent (MRQ) | | $ | 833 | | | Ave. Market Rent | | $ | 921 | | | Population | | | 2,032,496 | |
| Occupancy (MRQ) | | | 90.5 | % | | Mo Payment: Entry Level*: | | | | | | Job Growth (MRQ) | | | -0.1 | % |
| Eff. Rent Growth ‘08F | | | -3.1 | % | | Home | | $ | 1,452 | | | Median Income | | $ | 59,200 | |
| Eff. Rent Growth ‘09F | | | -2.5 | % | | Condo | | $ | 1,198 | | | Housing Stock | | | | |
| Eff. Rent Growth ‘10F | | | 0.9 | % | | Median Home Price (MRQ) | | $ | 223,500 | | | Renter | | | 248,958 | |
| Multifamily Permits | | | 6,124 | | | Housing Affordability Score | | | 84 | | | % of Total | | | 32.8 | % |
Sources: AXIOMetrics and Company Reports, Most Recent Quarter (MRQ), Merrill Lynch Apartment Monitor, Latest Available Data (LAD)
* Assumes 30 yr fixed at 6.3%
Recent Activity
UDR has demonstrated success in creating additional value from its Orlando properties in a variety of ways:
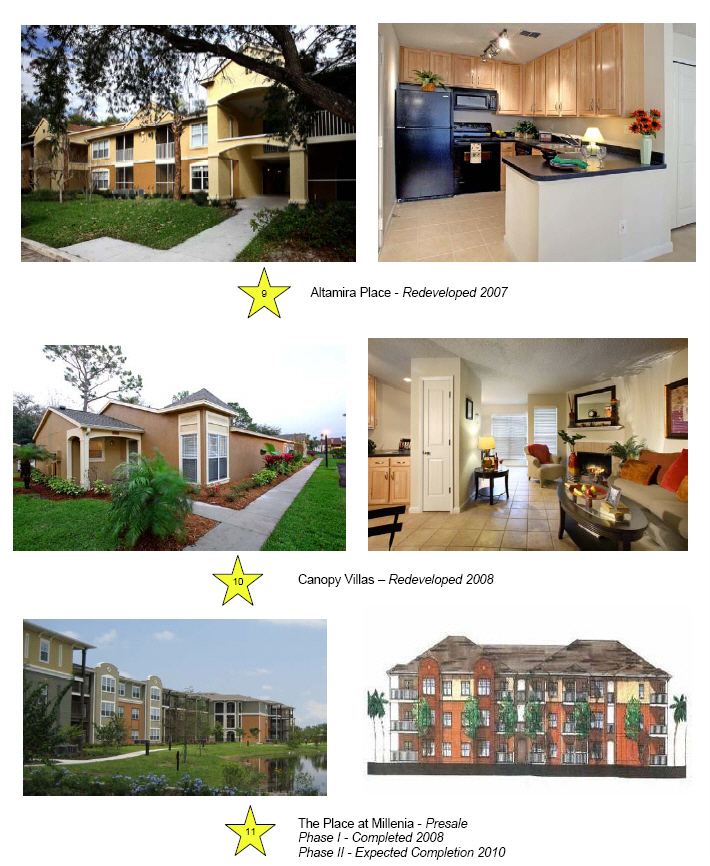
| | • | | Redevelopment — In 2008, we completed full redevelopment of two communities: Altamira Place and Canopy Villas (656 homes). |
| |
| | • | | Kitchen and Bath Program: We’ve completed more than 800 kitchen and bath renovations at an average cost of $13,800 and are realizing an average annual return of 9.8%. |
| |
| | • | | Development: In the first quarter of 2008, we completed the purchase of a presale community, The Place at Millenia. Phase one, which included 371 homes. Phase II, which includes 395 homes, is estimated to be completed in 2010. |
Orlando’s economy has been impacted by the housing slump and high fuel prices. The local economy in influenced by the leisure and hospitality industry but is diversified with significant employment in the transportation and utility sectors as well.
31
Orlando
Market Fact Sheet
32
Orlando
Market Fact Sheet
33
Orlando
Market Fact Sheet
| | | | | | | | | | | | | | | | | | | |
| | | | | | | Year Built | | | | | | | | | Inc. per Occ. | |
| Operating Properties | | # Homes | | | ReDev | | | Redev. | | Occupancy | | | Home | |
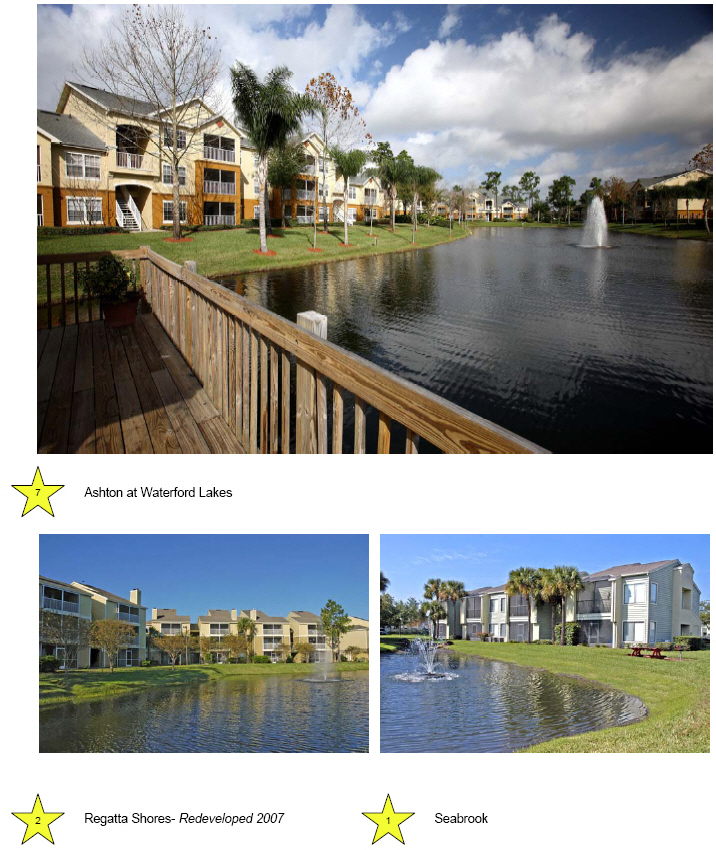
| 1 Seabrook | | | 200 | | | | 2004 | | | — | | | 89.4 | % | | $ | 961 | |
| 2 Regatta Shores | | | 256 | | | | 2007 | | | Full | | | 88.3 | % | | | 813 | |
| 3 Alafaya Woods | | | 296 | | | | 2006 | | | Full | | | 89.8 | % | | | 1,002 | |
| 4 Los Altos | | | 328 | | | | 2004 | | | K/B | | | 91.2 | % | | | 948 | |
| 5 Lotus Landing | | | 260 | | | | 2006 | | | K/B | | | 90.5 | % | | | 839 | |
| 6 Seville on the Green | | | 170 | | | | 2004 | | | — | | | 94.5 | % | | | 988 | |
| 7 Ashton at Waterford Lakes | | | 292 | | | | 2000 | | | Full | | | 95.8 | % | | | 1,147 | |
| 8 Arbors at Lee Vista | | | 338 | | | | 2007 | | | K/B | | | 93.0 | % | | | 999 | |
| 9 Altamira Place | | | 360 | | | | 2007 | | | Full | | | 95.0 | % | | | 936 | |
| | | | | | | | | | | | | | |
Subtotal | | | 2,500 | | | | | | | | | | 92.1 | % | | | 963 | |
Non-Mature and Other | | | | | | | | | | | | | | | | | | |
| 10 Canopy Villas (in lease-up) | | | 296 | | | | 2007 | | | Full | | | 91.7 | % | | | 1,005 | |
| 11 The Place at Millenia, Phase I (in lease-up) | | | 371 | | | | 2007 | | | Full | | | 81.9 | % | | | 921 | |
| | | | | | | | | | | | | | |
Subtotal | | | 667 | | | | | | | | | | 86.3 | % | | | 961 | |
| | | | | | | | | | | | | | |
Grand Total | | | 3,167 | | | | | | | | | | 90.9 | % | | $ | 963 | |
| | | | | | | | | | | | | | | | | | | | | |
| | | | | | | Est. | | | Est. Cost | | | Est. Cost | | | Expected | |
| Development Opportunities | | Status | | | # Homes | | | ($000) | | | per Home | | | Completion | |
| 11 The Place at Millenia (Phase II)^ | | Active | | | 395 | | | $ | 64,000 | | | $ | 162,000 | | | | 2010^ | |
| | | | | | | | | | | | | | | | | | | |
Total | | | | | | | 395 | | | $ | 64,000 | | | $ | 162,000 | | | | | |
^ Presale property, construction pending financing by 3rd party developer.
34
| | | |
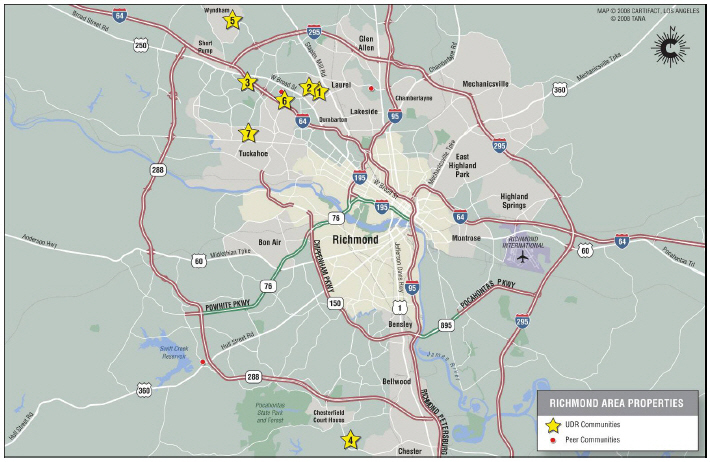
| | Richmond
Market Fact Sheet |
Market Statistics & Peer Comparison
| | | | | |
| Richmond Portfolio | | Homes | |
| Same Store Pool | | | 1,958 | |
| Non-Matures | | | 253 | |
| Homes in Development | | | — | |
| Held for Future Development | | | — | |
| | | | |
Total | | | 2,211 | |
| MRQ Mo. Inc./ Home (SS) | | $ | 1,023 | |
| MRQ Occupancy (SS) | | | 96.3 | % |
| | | | | | | | | |
| Company | | # of Homes (SS) | | | Ave. Rent | |
| UDR | | | 1,958 | | | $ | 1,023 | |
| AEC | | | 240 | | | | 1,000 | |
| AIV | | | 744 | | | | 869 | |
| CLP | | | 1,368 | | | | 838 | |
| | | | | | | |
| | | | 4,310 | | | $ | 936 | |
Richmond is UDR’s#9
market and is expected to
contribute 4.6%of the
Company’s 2008 total
pro forma NOI.
Richmond Market Statistics
| | | | | | | | | | | | | | | | | |
| 2008 Forecast | | | Low Home Affordability | | | Economy | |
| Effective Rent (MRQ) | | $ | 900 | | | Ave. Market Rent | | $ | 936 | | | Population | | | 1,212,977 | |
| Occupancy (MRQ) | | | 93.8 | % | | Mo Payment: Entry Level*: | | | | | | Job Growth (MRQ) | | | 0.5 | % |
| Eff. Rent Growth ‘08F | | | 1.2 | % | | Home | | $ | 1,452 | | | Median Income | | $ | 69,300 | |
| Eff. Rent Growth ‘09F | | | 0.9 | % | | Condo | | $ | 1,198 | | | Housing Stock | | | | |
| Eff. Rent Growth ‘10F | | | 1.9 | % | | Median Home Price (MRQ) | | $ | 225,700 | | | Renter | | | 146,226 | |
| Multifamily Permits | | | 853 | | | Housing Affordability Score | | | n/a | | | % of Total | | | 31.2 | % |
Sources: AXIOMetrics and Company Reports, Most Recent Quarter (MRQ), Merrill Lynch Apartment Monitor, Latest Available Data (LAD)
* Assumes 30 yr fixed at 6.3%
Recent Activity
UDR’s apartment communities in the Richmond market are in excellent locations and the Company has invested to modernize the homes in several ways:
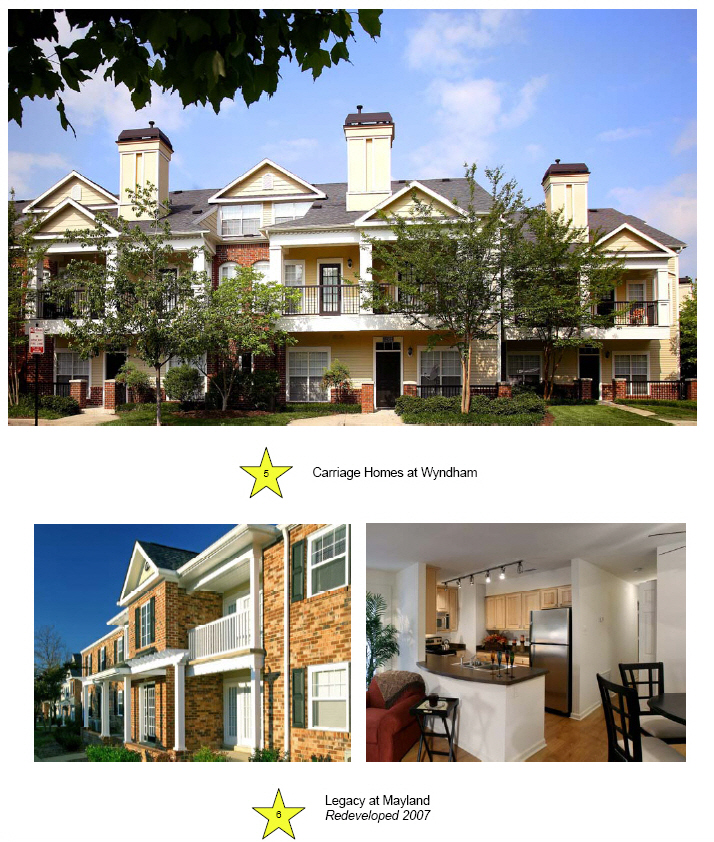
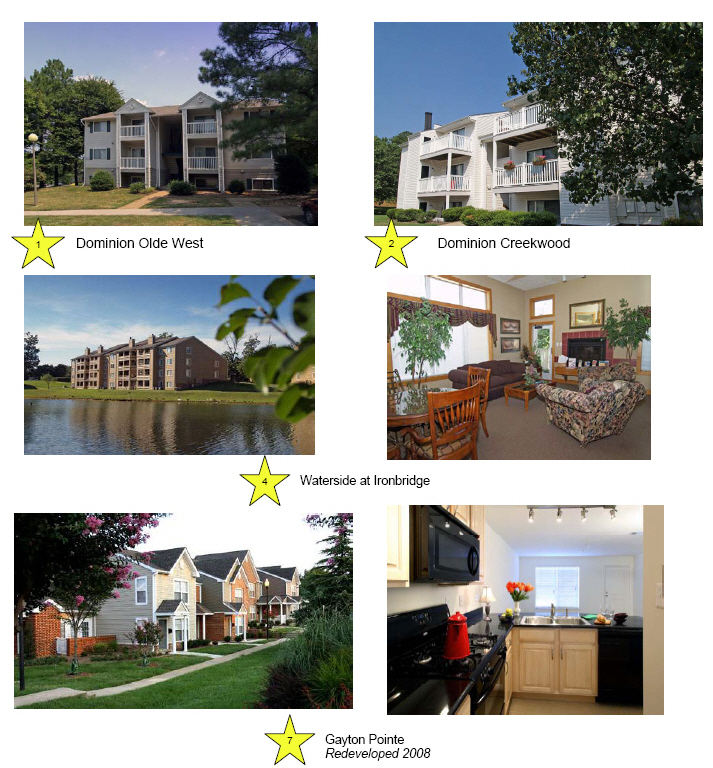
| | • | | Redevelopment: Two communities, Legacy at Mayland and Gayton Pointe Townhomes, have been completely redeveloped. Legacy at Mayland, completed in 2007, produced an increase in cash flow of 85% and estimated value creation of $33.6M. Construction at Gayton Pointe has recently been completed with focus on lease-up activities. Once stabilized, we expect a 7.7% return on incremental capital invested with an estimated $17M in value created. |
| |
| | • | | Kitchen and Bath Program: Over 1,300 kitchen and bath renovations have been completed at an average cost of $9,604, and are yielding an average annual return of 11.9%. |
Richmond has a diversified economy with significant employment in the government sector and in trade, transportation and utilities.
35
Richmond
Market Fact Sheet
36
Richmond
Market Fact Sheet
37
Richmond
Market Fact Sheet
| | | | | | | | | | | | | | | | | | | |
| | | | | | | Year Built | | | | | | | | | Inc. per Occ. | |
| Operating Properties | | # Homes | | | ReDev | | | Redev. | | Occupancy | | | Home | |
| 1 Dominion Olde West | | | 287 | | | | 1978 | | | Full | | | 93.4 | % | | $ | 901 | |
| 2 Dominion Creekwood | | | 216 | | | | 1984 | | | K/B | | | 96.0 | % | | | 864 | |
| 3 Dominion West End | | | 350 | | | | 1989 | | | K/B | | | 97.9 | % | | | 981 | |
| 4 Waterside at Ironbridge | | | 265 | | | | 1987 | | | K/B | | | 94.0 | % | | | 944 | |
| 5 Carriage Homes at Wyndham | | | 264 | | | | 1998 | | | K/B | | | 95.8 | % | | | 1,350 | |
| 6 Legacy at Mayland | | | 576 | | | | 2007 | | | Full | | | 98.1 | % | | | 1,054 | |
| | | | | | | | | | | | | | |
Subtotal | | | 1,958 | | | | | | | | | | 96.3 | % | | | 1,023 | |
Non-Mature | | | | | | | | | | | | | | | | | | |
| 7 Gayton Pointe Townhomes | | | 253 | | | | 2008 | | | Full | | | 95.7 | % | | | 1,304 | |
| | | | | | | | | | | | | | |
Subtotal | | | 253 | | | | | | | | | | 95.7 | % | | | 1,304 | |
| | | | | | | | | | | | | | |
Grand Total | | | 2,211 | | | | | | | | | | 96.2 | % | | $ | 1,055 | |
| | | | | | | | | | | | | | |
38
Market Statistics & Peer Comparison
| | | | | |
| Dallas Portfolio | | Homes | |
| Same Store Pool | | | 305 | |
| Non-Matures | | | 3,497 | |
| Homes in Development | | | 1,648 | |
| Held for Future Development | | | 5,557 | |
| | | | |
Total | | | 11,007 | |
| MRQ Mo. Inc./ Home (SS) | | $ | 1,647 | |
| MRQ Occupancy (SS) | | | 95.5 | % |
| | | | | | | | | |
| Company | | # of Homes (SS) | | | Ave. Rent | |
| UDR | | | 305 | | | $ | 1,647 | |
| PPS | | | 3,796 | | | | 1,136 | |
| EQR | | | 3,191 | | | | 915 | |
| CPT | | | 4,719 | | | | 806 | |
| CLP | | | 2,468 | | | | 750 | |
| MAA | | | 3,195 | | | | 743 | |
| AIV | | | 1,721 | | | | 738 | |
| | | | | | | |
| | | | 19,090 | | | $ | 866 | |
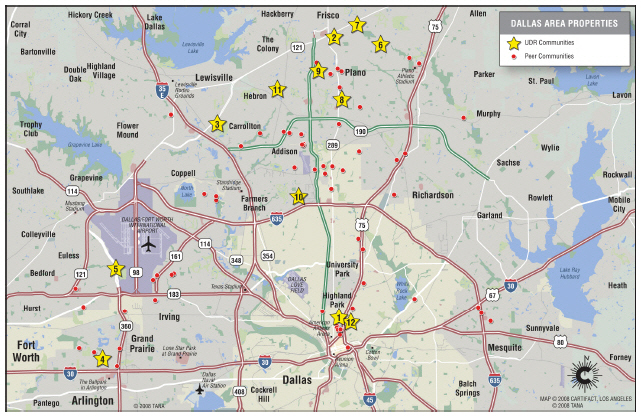
Dallas is UDR’s#10
market and is expected to
contribute4.0%of the
Company’s 2008 total
pro forma NOI.
Dallas Market Statistics
| | | | | | | | | | | | | | | | | |
| 2008 Forecast | | | Low Home Affordability | | | Economy | |
| Effective Rent (MRQ) | | $ | 830 | | | Ave. Market Rent | | $ | 866 | | | Population | | | 4,111,429 | |
| Occupancy (MRQ) | | | 92.4 | % | | Mo Payment: Entry Level*: | | | | | | Job Growth | | | 2.1 | % |
| Eff. Rent Growth ‘08F | | | 2.0 | % | | Home | | $ | 1,094 | | | Median Income | | $ | 64,800 | |
| Eff. Rent Growth ‘09F | | | 1.6 | % | | Condo | | $ | 891 | | | Housing Stock | | | | |
| Eff. Rent Growth ‘10F | | | 1.1 | % | | Median Home Price (MRQ) | | $ | 151,000 | | | Renter | | | 529,053 | |
| Multifamily Permits | | | 13,501 | | | Housing Affordability Score | | | 125 | | | % of Total | | | 37.3 | % |
Sources: AXIOMetrics and Company Reports, Most Recent Quarter (MRQ), Merrill Lynch Apartment Monitor, Latest Available Data (LAD)
* Assumes 30 yr fixed at 6.3%
Recent Activity
The Company has been active in the Dallas market in a variety of ways:
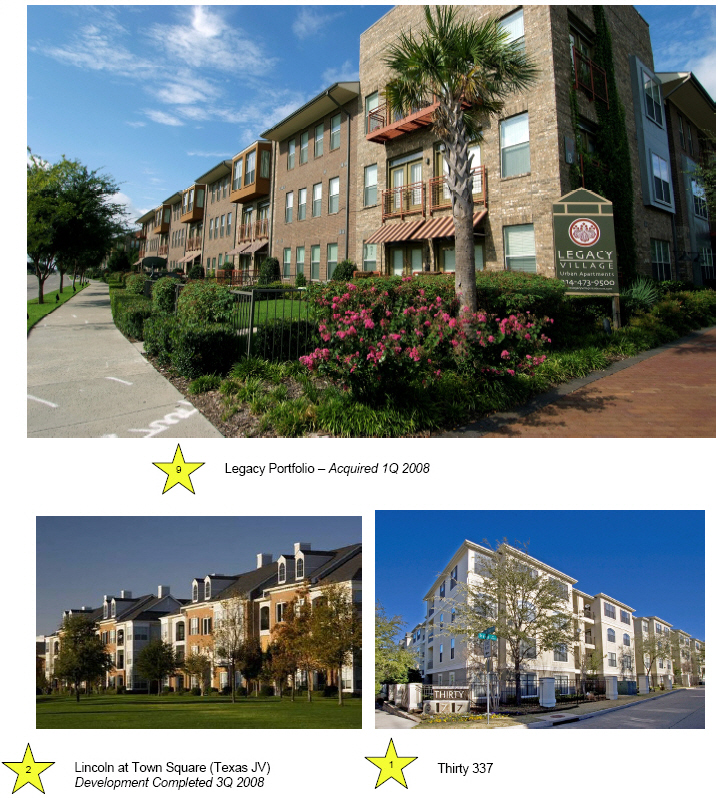
| | • | | In the first quarter of 2008, we acquired Legacy Village (three communities) consisting of 1,043 homes in the Plano submarket. |
| |
| | • | | At Thirty 377, we have completed 70 kitchen and bath renovations at an average cost of $18,869 and we are realizing an average annual return of 11.8%. |
| |
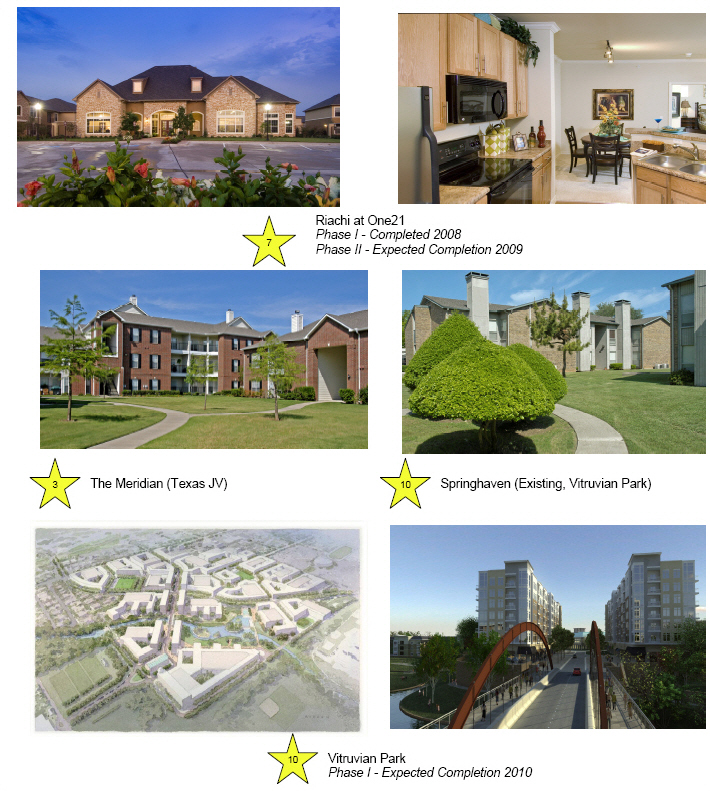
| | • | | Construction of 202 homes at Riachi at One21 in the Dallas suburb of Plano was completed in the fourth quarter of 2007. Construction of 198 units in Phase II of the community has begun and completion is anticipated in 2009. |
| |
| | • | | Construction of 302 homes at Lincoln at Towne Square was completed in the third quarter of 2008 within the Company’s Texas joint-venture. |
| |
| | • | | An assemblage of 99 acres in Addison, named Vitruvian Park, was completed in the second quarter of 2007, and the Company broke ground on Phase I of development in the second quarter of 2008. The city of Addison has approved doubling the density to over 5,500 homes with zoning for 500,000 square feet of retail and office space. They have also agreed to contribute $40 million to the project. The Company anticipates that the development will be completed in conjunction with one or more institutional investors. |
The Dallas economy is diverse with significant employment in the energy sector, trade, transportation, government, education and the health sector.
39
Dallas
Market Fact Sheet
40
Dallas
Market Fact Sheet
41
Dallas
Market Fact Sheet
| | | | | | | | | | | | | | | | | | | |
| | | | | | | Year Built | | | | | | | | | Inc. per Occ. | |
| Operating Properties | | # Homes | | | ReDev | | | Redev. | | Occupancy | | | Home | |
| 1 Thirty377 | | | 305 | | | | 2007 | | | K/B | | | 95.5 | % | | $ | 1,647 | |
| | | | | | | | | | | | | | | |
Subtotal** | | | 305 | | | | | | | | | | 95.5 | % | | | 1,647 | |
Non-Mature and Other | | | | | | | | | | | | | | | | | | |
| 2 Lincoln at Towne Square (JV) | | | 702 | | | | 2008 | | | — | | | 81.3 | % | | | 961 | |
| 3 Meridian II, The (JV) | | | 520 | | | | 2002 | | | — | | | 96.7 | % | | | 856 | |
| 4 Cliffs, The (JV) | | | 400 | | | | 1992 | | | — | | | 97.1 | % | | | 796 | |
| 5 Mandolin, The (JV) | | | 486 | | | | 2003 | | | — | | | 96.2 | % | | | 1,000 | |
| 6 Villas at Ridgeview | | | 48 | | | | 2007 | | | — | | | 97.2 | % | | | 1,692 | |
| 7 Riachi at One21 - Phase I | | | 202 | | | | 2007 | | | — | | | 94.4 | % | | | 983 | |
| 8 Highlands of Preston (in redevelopment) | | | 380 | | | | 2007 | | | — | | | 81.2 | % | | | 746 | |
| 9 Legacy Village | | | 1,043 | | | | '05-'07 | | | — | | | 90.4 | % | | | 994 | |
| 10 Vitruvian Park | | | 1,013 | | | | | | | — | | | 94.4 | % | | | 672 | |
| | | | | | | | | | | | | | | |
Subtotal (UDR)** | | | 3,497 | | | | | | | | | | n/a | | | | n/a | |
| | | | | | | | | | | | | | | |
Grand Total (UDR)** | | | 3,802 | | | | | | | | | | n/a | | | | n/a | |
| | | | | | | | | | | | | | | |
** Excludes Unconsolidated JV homes and includes 811 homes in other Texas markets
| | | | | | | | | | | | | | | | | | | | | |
| | | | | | | | | Est. | | | | | | | | | |
| | | | | Current | | | # | | | Est, Cost | | | Est. Cost | | | Est. |
| Development Opportunities | | Status | | # Homes | | | Homes | | | ($000) | | | per Home | | | Completion |
| 7 Riachi at One21 - Phase II | | Active | | | | | | | 200 | | | $ | 17,900 | | | $ | 89,500 | | | 2009 |
| 10 Vitruvian Park^ — Phase I | | Active | | | | | | | 392 | | | | 66,500 | | | | 170,000 | ^^ | | 2010 |
| 10 Vitruvian Park^ — Future Phases | | Future | | | 1,013 | | | | 5,557 | | | $ | 737,000 | | | | 132,600 | | | TBD |
| 11 Mustang Park (Presale) | | Active | | | | | | | 289 | | | | 29,000 | | | | 100,000 | | | 2009 |
| 12 Belmont (formerly Bennett) | | Active | | | | | | | 465 | | | | 63,000 | | | $ | 135,000 | | | 2010 |
| | | | | | | | | | | | | | | | | | | |
Total | | | | | | | | | 6,903 | | | $ | 913,400 | | | | | | | |
| | | | | | | | | | | | | | | | | | | |
| | | |
| ^ | | Our development of Vitruvian Park will be completed in phases. We are currently developing 392 homes in Phase I. Vitruvian Park consists of an assemblage of operating properties, including 1,013 homes with a net carrying value of $52.5M, delivering annualized NOI of $3.7M. Future phases will move into active development as financing opportunities and market conditions improve. |
| |
| ^^ | | Includes 16,050 square feet of retail space. |
42
| | | |
| | Nashville
Market Fact Sheet |
Market Statistics & Peer Comparison
| | | | | |
| Nashville Portfolio | | Homes | |
| Same Store Pool | | | 1,874 | |
| Non-Matures | | | 386 | |
| Homes in Development | | | — | |
| Held for Future Development | | | — | |
| | | | |
Total | | | 2,260 | |
| MRQ Mo. Inc./ Home (SS) | | $ | 891 | |
| MRQ Occupancy (SS) | | | 95.5 | % |
| | | | | | | | | |
| Company | | # of Homes (SS) | | | Ave. Rent | |
| EQR | | | 396 | | | $ | 914 | |
| UDR | | | 1,874 | | | | 891 | |
| AIV | | | 2,192 | | | | 856 | |
| MAA | | | 1,855 | | | | 816 | |
| | | | | | | |
| | | | 6,317 | | | $ | 858 | |
Nashville is UDR’s#11
market and is expected to
contribute3.5%of the
Company’s 2008 total
pro forma NOI.
Nashville Market Statistics
| | | | | | | | | | | | | | | | | |
| 2008 Forcast | | | Low Home Affordability | | | Economy | |
| Effective Rent (MRQ) | | $ | 784 | | | Ave. Market Rent | | $ | 858 | | | Population | | | 1,521,437 | |
| Occupancy (MRQ) | | | 92.8 | % | | Mo Payment: Entry Level*: | | | | | | Job Growth (MRQ) | | | 0.1 | % |
| Eff. Rent Growth ‘08F | | | 0.7 | % | | Home | | $ | 1,072 | | | Median Income | | $ | 63,200 | |
| Eff. Rent Growth ‘09F | | | 0.1 | % | | Condo | | $ | 872 | | | Housing Stock | | | | |
| Eff. Rent Growth ‘10F | | | 1.3 | % | | Median Home Price (MRQ) | | $ | 163,100 | | | Renter | | | 177,467 | |
| Multifamily Permits | | | 1,605 | | | Housing Affordability Score | | | n/a | | | % of Total | | | 30.3 | % |
Sources: AXIOMetrics and Company Reports, Most Recent Quarter (MRQ), Merrill Lynch Apartment Monitor, Latest Available Data (LAD)
* Assumes 30 yr fixed at 6.3%
Recent Activity
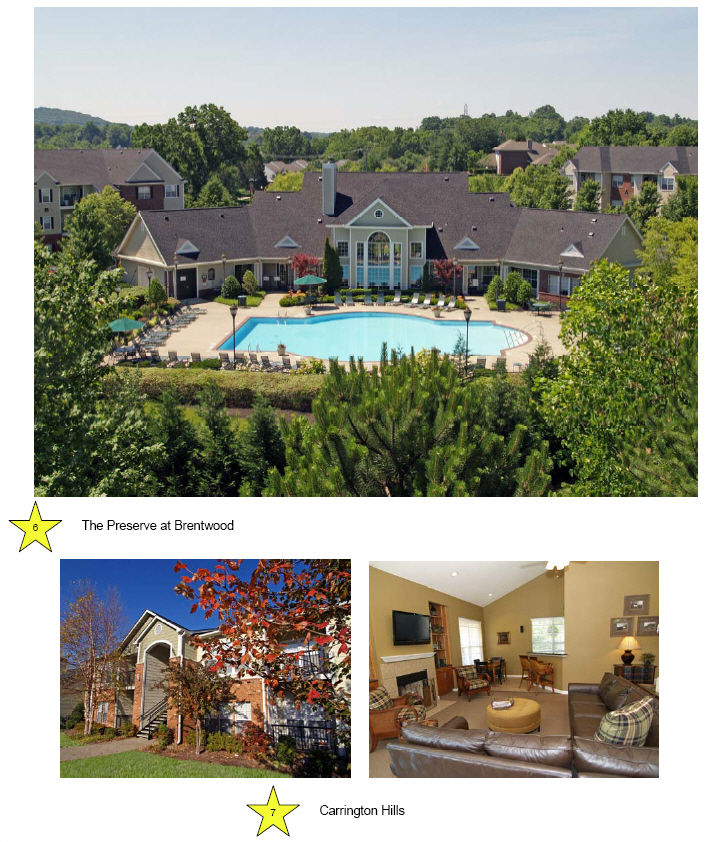
UDR has demonstrated success in creating additional value from its Nashville properties in a variety of ways:
| | • | | Redevelopment — we have completed the full redevelopment of Polo Park, a 386-home community we purchased for $20.9M or $54,082 per home in 2006. It is expected to deliver a cash-on-cash return of 7.9%, and an increase in total cash flow of 48% for total value creation of $4 million. |
| |
| | • | | Kitchens/Baths — In addition to the redevelopment program, we have completed over 800 kitchen and bath renovations at an average cost of $12,113 and are yielding an average annual return of 10.3%. |
Nashville has a diversified economy with significant employment in trade, transportation and utilities and education and health activity.
43
Nashville
Market Fact Sheet
44
Nashville
Market Fact Sheet
45
Nashville
Market Fact Sheet
| | | | | | | | | | | | | | | | | | | |
| | | | | | | Year Built | | | | | | | | | Inc. per Occ. | |
| Operating Properties | | # Homes | | | ReDev | | | Redev. | | Occupancy | | | Home | |
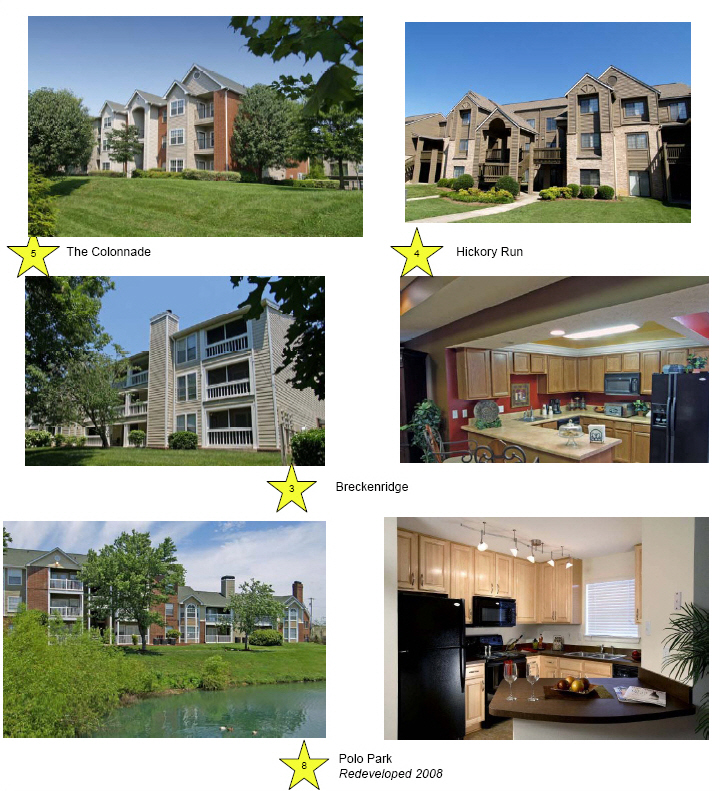
| 1 Legacy Hill | | | 206 | | | | 1977 | | | K/B | | | 95.2 | % | | $ | 870 | |
| 2 Brookridge | | | 176 | | | | 1986 | | | K/B | | | 93.6 | % | | | 729 | |
| 3 Breckenridge | | | 190 | | | | 1986 | | | K/B | | | 95.6 | % | | | 773 | |
| 4 Hickory Run | | | 294 | | | | 1989 | | | K/B | | | 95.8 | % | | | 802 | |
| 5 The Colonnade | | | 288 | | | | 1998 | | | K/B | | | 95.4 | % | | | 852 | |
| 6 The Preserve at Brentwood | | | 360 | | | | 1998 | | | K/B | | | 95.6 | % | | | 1,006 | |
| 7 Carrington Hills | | | 360 | | | | 1999 | | | K/B | | | 96.5 | % | | | 1,031 | |
| | | | | | | | | | | | | | | |
Subtotal | | | 1,874 | | | | | | | | | | 95.5 | % | | | 891 | |
Non-Mature | | | | | | | | | | | | | | | | | | |
| 8 Polo Park | | | 386 | | | | 1987 | | | Full | | | 95.6 | % | | | 817 | |
| | | | | | | | | | | | | | | |
Subtotal | | | 386 | | | | | | | | | | 95.6 | % | | | 817 | |
| | | | | | | | | | | | | | | |
Grand Total | | | 2,260 | | | | | | | | | | 95.5 | % | | $ | 878 | |
| | | | | | | | | | | | | | | |
46
| | | |
| | San Diego County
Market Fact Sheet |
Market Statistics & Peer Comparison
| | | | | |
| San Diego Portfolio | | Homes | |
| Same Store Pool | | | 1,123 | |
| Non-Matures | | | — | |
| Homes in Development | | | — | |
| Held for Future Development | | | 569 | |
| | | | |
Total | | | 1,692 | |
| MRQ Mo. Inc./ Home (SS) | | $ | 1,406 | |
| MRQ Occupancy (SS) | | | 95.5 | % |
| | | | | | | | | |
| Company | | # of Homes (SS) | | | Ave. Rent | |
| CPT | | | 879 | | | $ | 1,803 | |
| EQR | | | 4,000 | | | | 1,628 | |
| BRE | | | 3,711 | | | | 1,593 | |
| AVB | | | 1,057 | | | | 1,456 | |
| UDR | | | 1,123 | | | | 1,406 | |
| AIV | | | 1,830 | | | | 1,406 | |
| ESS | | | 3,284 | | | | 1,187 | |
| | | | | | | |
| | | | 15,884 | | | $ | 1,486 | |
San Diego is UDR’s#12
market and is expected to
contribute3.1%of the
Company’s 2008 total
pro forma NOI.
San Diego Market Statistics
| | | | | | | | | | | | | | | | | |
| 2008 Forecast | | | Low Home Affordability | | | Economy | |
| Effective Rent (MRQ) | | $ | 1,453 | | | Ave. Market Rent | | $ | 1,486 | | | Population | | | 2,974,859 | |
| Occupancy (MRQ) | | | 94.6 | % | | Mo Payment: Entry Level*: | | | | | | Job Growth (MRQ) | | | -0.4 | % |
| Eff. Rent Growth ‘08F | | | 2.7 | % | | Home | | $ | 2,386 | | | Median Income | | $ | 72,100 | |
| Eff. Rent Growth ‘09F | | | 0.7 | % | | Condo | | $ | 1,998 | | | Housing Stock | | | | |
| Eff. Rent Growth ‘10F | | | 2.0 | % | | Median Home Price (MRQ) | | $ | 415,000 | | | Renter | | | 461,022 | |
| Multifamily Permits | | | 3,349 | | | Housing Affordability Score | | | 51 | | | % of Total | | | 44.1 | % |
Sources: AXIOMetrics and Company Reports, Most Recent Quarter (MRQ), Merrill Lynch Apartment Monitor, Latest Available Data (LAD)
* Assumes 30 yr fixed at 6.3%
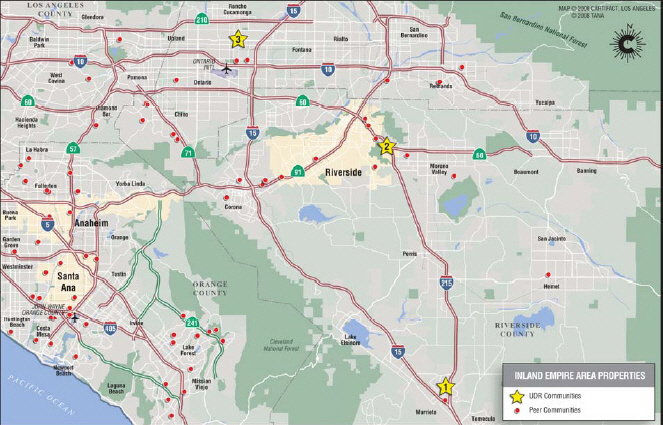
Recent Activity
UDR has the opportunity to expand its presence in this market with two development projects. Future plans are to add 65 new apartment homes to Presidio at Rancho del Oro, in Oceanside and to tear down and rebuild The Summit at Mission Bay, making it multiple levels with subterranean parking. This will increase the size of the property by 181 apartment homes and offer ocean views. Both of these development projects are held for future development, subject to financing opportunities and market conditions.
The company continues to improve its existing homes through the Kitchen and Bath Program:
| | • | | 230 kitchen and bath renovations have been completed at an average cost of $6,000 to $7,000 with an annualized average return of 21.6%. The average increase in market rent is $150.00. |
The local housing market has softened and home ownership is less attainable. While San Diego County experienced a loss of jobs in 2007 and 2008 due to fall out of the sub prime market, as well as loss of construction starts, it continues to be an attractive place to live with its diverse population, highly skilled and educated workforce, as well as several military bases. In addition the climate is very mild year round and provides multiple options for outdoor activities and tourism.
47
San Diego
Market Fact Sheet
48
San Diego
Market Fact Sheet
49
San Diego
Market Fact Sheet
| | | | | | | | | | | | | | | | | | | |
| | | | | | | Year Built | | | | | | | | | Inc. per Occ. | |
| Operating Properties | | # Homes | | | ReDev | | | Redev. | | Occupancy | | | Home | |
| 1 Presidio at Rancho del Oro | | | 264 | | | | 1987 | | | K/B | | | 94.4 | % | | $ | 1,273 | |
| 2 Villas at Carlsbad | | | 102 | | | | 1966 | | | K/B | | | 94.9 | % | | | 1,569 | |
| 3 Summit at Mission Bay | | | 323 | | | | 1953 | | | — | | | 97.4 | % | | | 1,296 | |
| 4 Rancho Vallecitos | | | 184 | | | | 1988 | | | K/B | | | 94.9 | % | | | 1,528 | |
| 5 Milazzo | | | 250 | | | | 1986 | | | K/B | | | 95.1 | % | | | 1,534 | |
| | | | | | | | | | | | | | | |
Grand Total | | | 1,123 | | | | | | | | | | 95.5 | % | | $ | 1,406 | |
| | | | | | | | | | | | | | | | | | | |
| | | | | Current # | | Est. # | | | Est. Cost | | | Est. Cost | | | Est. |
| Development Opportunities | | Status | | Homes | | Homes | | | ($000s) | | | per Home | | | Completion |
| 1 Presidio — Phase II^ | | Future | | (land) | | | 65 | | | $ | 9,000 | | | $ | 138,500 | | | TBD^ |
| 3 Summit at Mission Bay^ | | Future | | 323 | | | 504 | | | | 172,000 | | | $ | 341,300 | | | TBD^ |
| | | | | | | | | | | | | | | | |
Total | | | | | | | 569 | | | $ | 181,000 | | | | | | | |
| | | | | | | | | | | | | | | | |
| | | |
| ^ | | These properties will move into active development as financing opportunities and market conditions improve. |
50
| | | |
| | Monterey/Salinas
Market Fact Sheet |
Market Statistics & Peer Comparison
| | | | | |
| Monterey Portfolio | | Homes | |
| Same Store Pool | | | 1,565 | |
| Non-Matures | | | — | |
| Homes in Development | | | — | |
| Held for Future Development | | | | |
| | | | |
Total | | | 1,565 | |
| MRQ Mo. Inc./ Home (SS) | | $ | 1,094 | |
| MRQ Occupancy (SS) | | | 96.7 | % |
| | | | | | | | | |
| Company | | # of Homes (SS) | | | Ave. Rent | |
| UDR | | | 1,565 | | | $ | 1,094 | |
| | | | | | | |
| | | | 1,565 | | | $ | 1,094 | |
Monterey is UDR’s#13
market and is expected to
contribute3.1%of the
Company’s 2008 total
pro forma NOI.
Monterey Market Statistics
| | | | | | | | | | | | | | | | | |
| 2008 Forecast | | | Low Home Affordability | | | Economy | |
| Effective Rent (MRQ) | | $ | 1,175 | | | Ave. Market Rent | | $ | 1,094 | | | Population | | | 407,637 | |
| Occupancy (MRQ) | | | 95.5 | % | | Mo Payment: Entry Level*: | | | | | | Job Growth (MRQ) | | | 1.1 | % |
| Eff. Rent Growth ‘08F | | | 6.2 | % | | Home | | $ | 2,026 | | | Median Income | | $ | 64,800 | |
| Eff. Rent Growth ‘09F | | | 2.0 | % | | Condo | | $ | 1,690 | | | Housing Stock | | | | |
| Eff. Rent Growth ‘10F | | | 2.3 | % | | Median Home Price (MRQ) | | $ | 350,000 | | | Renter | | | 61,203 | |
| Multifamily Permits | | | 240 | | | Housing Affordability Score | | | 43 | | | % of Total | | | 48.6 | % |
Sources: AXIOMetrics and Company Reports, Most Recent Quarter (MRQ), Merrill Lynch Apartment Monitor, Latest Available Data (LAD)
* Assumes 30 yr fixed at 6.3%
Recent Activity
UDR’s Monterey portfolio consists of 1,565 apartment homes in seven communities in Salinas, CA. Average monthly rents are $1,094.
The Salinas economy is heavily influenced by the agricultural industry and is known as “America’s Salad Bowl”. The market has heavy population fluctuations related to the seasonality of the farming industry with highs in the March-November months. UDR’s occupancy tends to fluctuate between 91% in the low season and as high as 98% in the high season.
51
| | | |
| | Monterey/Salinas
Market Fact Sheet |
| | | | | | | | | | | | | | | | | | | |
| | | | | | | Year Built | | | | | | | | | Inc. per Occ. | |
| Operating Properties | | # Homes | | | ReDev | | | Redev. | | Occupancy | | | Home | |
| 1 Garden Court | | | 107 | | | | 1986 | | | — | | | 99.6 | % | | $ | 974 | |
| 2 Cambridge Court | | | 332 | | | | 1974 | | | K/B | | | 97.5 | % | | | 1,014 | |
| 3 The Pointe at Westlake | | | 139 | | | | 1979 | | | K/B | | | 96.9 | % | | | 1,004 | |
| 4 Laurel Tree | | | 157 | | | | 1979 | | | K/B | | | 95.6 | % | | | 986 | |
| 5 Boranda Manor | | | 204 | | | | 1977 | | | K/B | | | 98.0 | % | | | 1,064 | |
| 6 The Pointe at Northridge | | | 187 | | | | 1975 | | | K/B | | | 95.5 | % | | | 1,157 | |
| 7 The Pointe at Harden Ranch | | | 439 | | | | 1973 | | | K/B | | | 95.5 | % | | | 1,243 | |
| | | | | | | | | | | | | | | |
Grand Total | | | 1,565 | | | | | | | | | | 96.7 | % | | $ | 1,094 | |
| | | | | | | | | | | | | | | |
52
| | | |
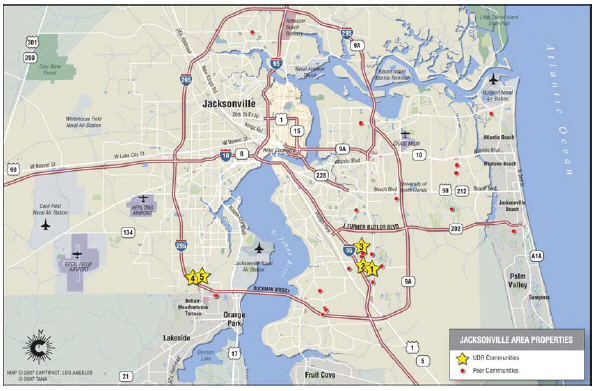
| | Jacksonville
Market Fact Sheet |
Market Statistics & Peer Comparison
| | | | | |
| Jacksonville Portfolio | | Homes | |
| Same Store Pool | | | 1,557 | |
| Non-Matures | | | 300 | |
| Homes in Development | | | — | |
| Held for Future Development | | | — | |
| | | | |
Total | | | 1,857 | |
| MRQ Mo. Inc./ Home (SS) | | $ | 862 | |
| MRQ Occupancy (SS) | | | 94.7 | % |
| | | | | | | | | |
| Company | | # of Homes (SS) | | | Ave. Rent | |
| UDR | | | 1,557 | | | $ | 862 | |
| AIV | | | 1,919 | | | | 831 | |
| EQR | | | 3,474 | | | | 791 | |
| MAA | | | 3,346 | | | | 781 | |
| | | | | | | |
| | | | 10,296 | | | $ | 806 | |
Jacksonville is UDR’s#14
market and is expected to
contribute 2.9%of the
Company’s 2008 total
pro forma NOI.
Jacksonville Market Statistics
| | | | | | | | | | | | | | | | | |
| 2008 Forecast | | | Low Home Affordability | | | Economy | |
| Effective Rent (MRQ) | | $ | 803 | | | Ave. Market Rent | | $ | 806 | | | Population | | | 1,300,823 | |
| Occupancy (MRQ) | | | 90.2 | % | | Mo Payment: Entry Level*: | | | | | | Job Growth (MRQ) | | | -0.9 | % |
| Eff. Rent Growth ‘08F | | | -2.8 | % | | Home | | $ | 1,232 | | | Median Income | | $ | 63,900 | |
| Eff. Rent Growth ‘09F | | | 0.0 | % | | Condo | | $ | 1,009 | | | Housing Stock | | | | |
| Eff. Rent Growth ‘10F | | | 0.2 | % | | Median Home Price (MRQ) | | $ | 186,800 | | | Renter | | | 157,002 | |
| Multifamily Permits | | | 2,169 | | | Housing Affordability Score | | | 108 | | | % of Total | | | 31.0 | % |
Source: AXIOMetrics, Merrill Lynch Apartment Monitor and Company Reports(MRQ)
* Assumes 30 yr fixed at 6.31%
Recent Activity
UDR has demonstrated success in creating additional value from its Jacksonville properties in a variety of ways.
| | • | | In 2007, we acquired The Kensley Apartment Homes, a 300-homes community, for $34.2M, or $114,000 per home. |
| |
| | • | | We have completed 455 kitchen and bath renovations at an average cost of $10,200 and are realizing an average return of 9% |
| |
| | • | | We have also completed a limited scope reposition of 352 homes at Green Tree Place. |
AXIOMetrics most recent report shows Jacksonville’s population grew at +1.7% in 2007, above the national average. Jacksonville’s household income is slightly above the US average. Annual job growth is expected to decline slightly, feeling the pressure of the weakened national business climate. Most new jobs are coming from professional, business services, education, health services as well as leisure and hospitality industries.
53
| | | |
| | Jacksonville
Market Fact Sheet |
| | | | | | | | | | | | | | | | | | | |
| | | | | | | Year Built | | | | | | | | | Inc. per Occ. | |
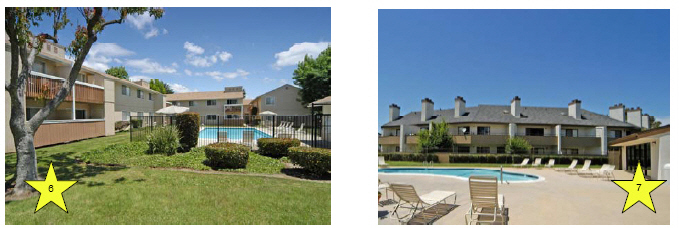
| Operating Properties | | # Homes | | | ReDev | | | Redev. | | Occupancy | | | Home | |
| 1 The Antlers | | | 400 | | | | 1985 | | | — | | | 96.3 | % | | $ | 839 | |
| 2 Green Tree Place | | | 352 | | | | 1986 | | | K/B | | | 95.4 | % | | | 859 | |
| 3 St John’s Plantation | | | 400 | | | | 1989 | | | K/B | | | 93.4 | % | | | 931 | |
| 4 Westland Park | | | 405 | | | | 1990 | | | K/B | | | 93.7 | % | | | 819 | |
| | | | | | | | | | | | | | | |
Subtotal | | | 1,557 | | | | | | | | | | 94.7 | % | | | 862 | |
Non-Mature | | | | | | | | | | | | | | | | | | |
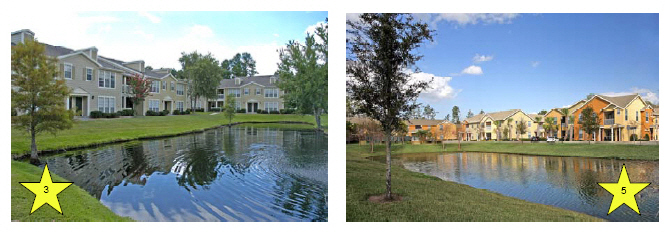
| 5 The Kensley Apartment Homes | | | 300 | | | | 2004 | | | — | | | 89.9 | % | | | 906 | |
| | | | | | | | | | | | | | | |
Subtotal | | | 300 | | | | | | | | | | 89.9 | % | | | 906 | |
| | | | | | | | | | | | | | | |
Grand Total | | | 1,857 | | | | | | | | | | 93.9 | % | | $ | 869 | |
| | | | | | | | | | | | | | | |
54
| | | |
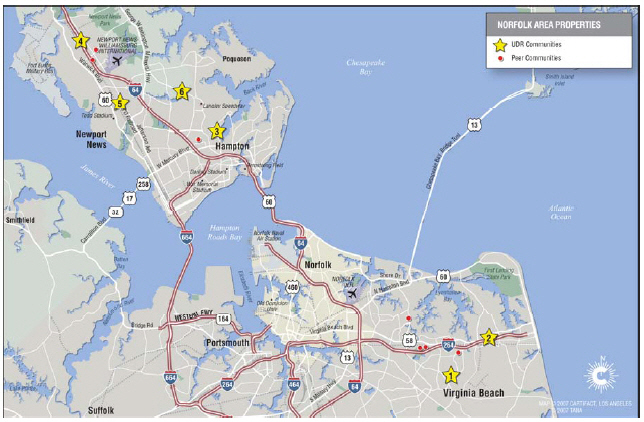
| | Norfolk/VA Beach
Market Fact Sheet |
Market Statistics & Peer Comparison
| | | | | |
| Norfolk/VA Beach Portfolio | | Homes | |
| Same Store Pool | | | 1,438 | |
| Non-Matures | | | — | |
| Homes in Development | | | — | |
| Held for Future Development | | | — | |
| | | | |
Total | | | 1,438 | |
| MRQ Mo. Inc./ Home (SS) | | $ | 960 | |
| | | | | | | | | |
| Company | | # of Homes (SS) | | | Ave. Rent | |
| AEC | | | 268 | | | $ | 1,363 | |
| AIV | | | 2,721 | | | $ | 976 | |
| UDR | | | 1,438 | | | | 960 | |
| CLP | | | 497 | | | | 795 | |
| | | | | | | |
| | | | 4,924 | | | $ | 974 | |
Norfolk is UDR’s#15
market and is expected to
contribute 2.8%of the
Company’s 2008 total
pro forma NOI.
Norfolk/VA Beach Market Statistics
| | | | | | | | | | | | | | | | | |
| 2008 Forecast | | | Low Home Affordability | | | Economy | |
| Effective Rent (MRQ) | | $ | 952 | | | Ave. Market Rent | | $ | 974 | | | Population | | | 1,658,754 | |
| Occupancy (MRQ) | | | 93.8 | % | | Mo Payment: Entry Level*: | | | | | | Job Growth (MRQ) | | | 2.1 | % |
| Eff. Rent Growth ‘08F | | | 1.6 | % | | Home | | $ | 1,541 | | | Median Income | | $ | 65,100 | |
| Eff. Rent Growth ‘09F | | | 0.9 | % | | Condo | | $ | 1,274 | | | Housing Stock | | | | |
| Eff. Rent Growth ‘10F | | | 1.7 | % | | Median Home Price (MRQ) | | $ | 239,700 | | | Renter | | | 217,725 | |
| Multifamily Permits | | | 2,004 | | | Housing Affordability Score | | | 91 | | | % of Total | | | 34.9 | % |
Sources: AXIOMetrics and Company Reports, Most Recent Quarter (MRQ), Merrill Lynch Apartment Monitor, Latest Available Data (LAD)
* Assumes 30 yr fixed at 6.3%
Recent Activity
Norfolk/Virginia Beach apartment communities are in solid locations and the Company has invested to modernize the homes in the following way:
| | • | | Kitchen and Bath Program: Over 1,400 kitchen and bath renovations have been completed at an average cost of $9,760, yielding an average annual return of 8.0%. |
Virginia Beach has a diversified economy with significant employment in the government sector and in trade, transportation and utilities.
55
| | | |
| | Norfolk/VA Beach
Market Fact Sheet |
| | | | | | | | | | | | | | | | | | | |
| | | | | | | Year Built | | | | | | | | | Inc. per Occ. | |
| Operating Properties | | # Homes | | | ReDev | | | Redev. | | Occupancy | | | Home | |
| 1 Dominion Waterside/Lynnhaven | | | 192 | | | | 1966 | | | K/B | | | 93.9 | % | | $ | 1,003 | |
| 2 Eastwind | | | 200 | | | | 1970 | | | K/B | | | 93.8 | % | | | 1,079 | |
| 3 Heather Lake | | | 252 | | | | 1972 | | | K/B | | | 92.6 | % | | | 957 | |
| 4 Woodscape | | | 296 | | | | 1974 | | | — | | | 94.4 | % | | | 809 | |
| 5 Forest Lakes at Oyster Pt. | | | 296 | | | | 1986 | | | K/B | | | 95.4 | % | | | 958 | |
| 6 Dominion Yorkshire Downs | | | 202 | | | | 1987 | | | K/B | | | 96.6 | % | | | 1,024 | |
| | | | | | | | | | | | | | | |
Grand Total | | | 1,438 | | | | | | | | | | 94.5 | % | | $ | 960 | |
| | | | | | | | | | | | | | | |
56
| | | |
| | Inland Empire, CA
Market Fact Sheet |
Market Statistics & Peer Comparison
| | | | | |
| Inland Empire Portfolio | | Homes | |
| Same Store Pool | | | 1,074 | |
| Non-Matures | | | — | |
| Homes in Development | | | — | |
| Held for Future Development | | | — | |
| | | | |
Total | | | 1,074 | |
| MRQ Mo. Inc./ Home (SS) | | $ | 1,317 | |
| MRQ Occupancy (SS) | | | 93.8 | % |
| | | | | | | | | |
| Company | | # of Homes (SS) | | | Ave. Rent | |
| UDR | | | 1,074 | | | $ | 1,317 | |
| CPT | | | 264 | | | | 1,298 | |
| EQR | | | 4,350 | | | | 1,246 | |
| BRE | | | 2,929 | | | | 1,188 | |
| ESS | | | 588 | | | | 942 | |
| AIV | | | 198 | | | | 925 | |
| AVB | | | 320 | | | | 850 | |
| | | | | | | |
| | | | 9,723 | | | $ | 1,200 | |
Inland Empire is UDR’s
#16market and is
expected to contribute
2.8%of the Company’s
2008 total pro forma NOI.
Inland Empire Market Statistics
| | | | | | | | | | | | | | | | | |
| 2008 Forecast | | | Low Home Affordability | | | Economy | |
| Effective Rent (MRQ) | | $ | 1,167 | | | Ave. Market Rent | | $ | 1,200 | | | Population | | | 4,081,371 | |
| Occupancy (MRQ) | | | 91.8 | % | | Mo Payment: Entry Level*: | | | | | | Job Growth (MRQ) | | | -1.7 | % |
| Eff. Rent Growth ‘08F | | | -3.1 | % | | Home | | $ | 1,606 | | | Median Income | | $ | 62,000 | |
| Eff. Rent Growth ‘09F | | | -1.0 | % | | Condo | | $ | 1,330 | | | Housing Stock | | | | |
| Eff. Rent Growth ‘10F | | | 1.7 | % | | Median Home Price (MRQ) | | $ | 260,000 | | | Renter | | | 403,123 | |
| Multifamily Permits | | | 2,789 | | | Housing Affordability Score | | | 77 | | | % of Total | | | 32.4 | % |
Source: AXIOMetrics, Merrill Lynch Apartment Monitor and Company Reports(MRQ)
* Assumes 30 yr fixed at 6.31%
Recent Activity
In the Inland Empire market, UDR is improving existing homes though its Kitchen and Bath Program. Approximately 200 kitchen and bath renovations have been completed at an average cost of $8,802 and we are realizing an average annual return of 13.5%. We achieved average rent increases of 13.5% per home at Waterstone at Murrieta: $975 before and $1,075 after.
San Bernardino County is known as the “transportation hub of the Southwestern United States,” according to Grubb & Ellis. With Ontario International Airport, the County hosts one of the 15 busiest cargo airports in the country. Freight trains roll through the region on two of the busiest transcontinental rail lines in the nation. This region offers a diversified economy, cultural amenities, and an attractive quality of life for individuals and families, as well as businesses, seeking to relocate. A safe, family-oriented environment and a well-educated work force combine to make the Inland Empire an ideal place to live, work and play.
57
| | | |
| | Inland Empire, CA
Market Fact Sheet |
| | | | | | | | | | | | | | | | | | | |
| | | | | | | Year Built | | | | | | | | | Inc. per Occ. | |
| Operating Properties | | # Homes | | | ReDev | | | Redev. | | Occupancy | | | Home | |
| 1 Waterstone at Murietta | | | 420 | | | | 1990 | | | K/B | | | 93.3 | % | | | 1,112 | |
| 2 Windemere/Sycamore Heights | | | 240 | | | | 2001 | | | — | | | 92.4 | % | | | 1,244 | |
| 3 Verano at Town Square | | | 414 | | | | 2006 | | | — | | | 95.1 | % | | | 1,562 | |
| | | | | | | | | | | | | | | |
Grand Total | | | 1,074 | | | | | | | | | | 93.8 | % | | $ | 1,317 | |
| | | | | | | | | | | | | | | |
58
Market Statistics & Peer Comparison
| | | | | |
| Phoenix Portfolio | | Homes | |
| Same Store Pool | | | 914 | |
| Non-Matures | | | 449 | |
| Homes in Development | | | 382 | |
| Held for Future Development | | | — | |
| | | | |
Total | | | 1,745 | |
| MRQ Mo. Inc./ Home (SS) | | $ | 946 | |
| MRQ Occupancy (SS) | | | 93.3 | % |
| | | | | | | | | |
| Company | | # of Homes (SS) | | | Ave. Rent | |
| UDR | | | 914 | | | $ | 946 | |
| CLP | | | 952 | | | | 906 | |
| BRE | | | 1,898 | | | | 900 | |
| CPT | | | 1,729 | | | | 869 | |
| MAA | | | 240 | | | | 797 | |
| EQR | | | 11,066 | | | | 790 | |
| AIV | | | 5,012 | | | | 718 | |
| | | | | | | |
| | | | 21,811 | | | $ | 801 | |
Phoenix is UDR’s#17
market and is expected to
contribute 2.1%of the
Company’s 2008 total
pro forma NOI.
Phoenix Market Statistics
| | | | | | | | | | | | | | | | | |
| 2008 Forecast | | | Low Home Affordability | | | Economy | |
| Effective Rent (MRQ) | | $ | 774 | | | Ave. Market Rent | | $ | 801 | | | Population | | | 4,179,427 | |
| Occupancy (MRQ) | | | 89.5 | % | | Mo Payment: Entry Level*: | | | | | | Job Growth (MRQ) | | | -2.0 | % |
| Eff. Rent Growth ‘08F | | | -3.9 | % | | Home | | $ | 1,283 | | | Median Income | | $ | 64,200 | |
| Eff. Rent Growth ‘09F | | | -1.9 | % | | Condo | | $ | 1,053 | | | Housing Stock | | | | |
| Eff. Rent Growth ‘10F | | | 0.2 | % | | Median Home Price (MRQ) | | $ | 205,100 | | | Renter | | | 456,220 | |
| Multifamily Permits | | | 6,788 | | | Housing Affordability Score | | | 109 | | | % of Total | | | 31.5 | % |
Sources: AXIOMetrics and Company Reports, Most Recent Quarter (MRQ), Merrill Lynch Apartment Monitor, Latest Available Data (LAD)
* Assumes 30 yr fixed at 6.3%
Recent Activity
UDR is expanding its presence in this market with the following:
| | • | | In the third quarter of 2008, the Company purchased Waterford at Peoria — a 200-home presale development community completed in the third quarter. |
| |
| | • | | The Residences at Stadium Village is an active development project — with 382 homes being built at an estimated average cost of $124,000 per home, with an expected completion in 2010. |
The local economy has recently softened; however job growth is forecasted to improve in 2010. Key local industries include trade, transportation and utilities, professional and business, education and health, leisure and hospitality and government. The market has outstanding recreational and extra-curricular activities, an attractive year round climate, a reasonable cost of living and a young educated work force. Phoenix offers ample room for continued job growth and population growth.
59
| | | | | | | | | | | | | | | | | | | |
| | | | | | | Year Built | | | | | | | | | Inc. per Occ. | |
| Operating Properties | | # Homes | | | ReDev | | | Redev. | | Occupancy | | | Home | |
| 1 Finisterra | | | 356 | | | | 1997 | | | — | | | 92.7 | % | | $ | 960 | |
| 2 Sierra Foothills | | | 322 | | | | 1998 | | | — | | | 93.3 | % | | | 953 | |
| 3 Sierra Canyon | | | 236 | | | | 2001 | | | — | | | 94.2 | % | | | 915 | |
| | | | | | | | | | | | | | | |
Sub Total | | | 914 | | | | | | | | | | 93.3 | % | | | 946 | |
Non-Mature | | | | | | | | | | | | | | | | | | |
| 4 Sierra Palms (Held for Disposition) | | | 249 | | | | 1997 | | | | | | 82.5 | % | | | 852 | |
| 5 Waterford Peoria (In lease-up) | | | 200 | | | | 2008 | | | | | | 39.0 | % | | | 869 | |
| | | | | | | | | | | | | | | |
Sub Total | | | 449 | | | | | | | | | | 63.1 | % | | | 857 | |
| | | | | | | | | | | | | | | |
Grand Total | | | 1,363 | | | | | | | | | | 83.4 | % | | $ | 924 | |
| | | | | | | | | | | | | | | | | | | |
| | | | | # of | | | Budgeted | | | Cost per | | | Expected | |
| Development Opportunities | | Status | | Homes | | | Cost (000) | | | Home | | | Completion | |
| 6 Residences/Stadium | | Active | | | 382 | | | $ | 47,400 | | | $ | 124,000 | | | | 2010 | |
| | | | | | | | | | | | | | | | | |
| | | | | | 382 | | | $ | 47,400 | | | | | | | | | |
| | | | | | | | | | | | | | | | | |
60
| | | |
| | Sacramento
Market Fact Sheet |
Market Statistics & Peer Comparison
| | | | | |
| Sacramento Portfolio | | Homes | |
| Same Store Pool | | | 914 | |
| Non-Matures | | | — | |
| Homes in Development | | | — | |
| Held for Future Development | | | — | |
| | | | |
Total | | | 914 | |
| MRQ Mo. Inc./ Home (SS) | | $ | 930 | |
| MRQ Occupancy (SS) | | | 93.9 | % |
| | | | | | | | | |
| Company | | # of Homes (SS) | | | Ave. Rent | |
| BRE | | | 1,242 | | | $ | 1,155 | |
| EQR | | | 504 | | | | 1,076 | |
| AIV | | | 180 | | | | 1,050 | |
| UDR | | | 914 | | | | 930 | |
| | | | | | | |
| | | | 2,840 | | | $ | 1,062 | |
Sacramento is UDR’s#18
market and is expected to
contribute 1.6%of the
Company’s 2008 total
pro forma NOI.
Sacramento Market Statistics
| | | | | | | | | | | | | | | | | |
| 2008 Forecast | | | Low Home Affordability | | | Economy | |
| Effective Rent (MRQ) | | $ | 1,028 | | | Ave. Market Rent | | $ | 1,062 | | | Population | | | 2,091,120 | |
| Occupancy (MRQ) | | | 92.8 | % | | Mo Payment: Entry Level*: | | | | | | Job Growth (MRQ) | | | -1.1 | % |
| Eff. Rent Growth ‘08F | | | 0.8 | % | | Home | | $ | 1,523 | | | Median Income | | $ | 71,000 | |
| Eff. Rent Growth ‘09F | | | -0.8 | % | | Condo | | $ | 1,259 | | | Housing Stock | | | | |
| Eff. Rent Growth ‘10F | | | 1.5 | % | | Median Home Price (MRQ) | | $ | 250,000 | | | Renter | | | 282,068 | |
| Multifamily Permits | | | 1,225 | | | Housing Affordability Score | | | 96 | | | % of Total | | | 36.8 | % |
Sources: AXIOMetrics and Company Reports, Most Recent Quarter (MRQ), Merrill Lynch Apartment Monitor, Latest Available Data (LAD) * Assumes 30 yr fixed at 6.3%
Recent Activity
The Company owns two properties comprised of 914 apartment homes in Sacramento. UDR’s Sacramento properties have average rents of $930. Sacramento is the state capitol of California and also is home to Sacramento State University.
AXIOMetrics forecasts a soft job market through 2009, but improving in 2010 and beyond.
The Company has no plans to expand further in this market
61
| | | |
| | Sacramento
Market Fact Sheet |
| | | | | | | | | | | | | | | | | | | | | |
| | | | | | | Year Built | | | | | | | | | | | Inc. per | |
| Operating Properties | | # Homes | | | ReDev | | | Redev. | | | Occupancy | | | Occ. Home | |
| 1 Woodlake Village | | | 646 | | | | 1979 | | | | K/B | | | | 93.4 | % | | $ | 871 | |
| 2 Foothills Tennis Village | | | 268 | | | | 1988 | | | | K/B | | | | 95.0 | % | | | 1,068 | |
| | | | | | | | | | | | | | | | |
Grand Total | | | 914 | | | | | | | | | | | | 93.9 | % | | $ | 930 | |
| | | | | | | | | | | | | | | | |
62
| | | |
| | Portland
Market Fact Sheet |
Market Statistics & Peer Comparison
| | | | | |
| Portland Portfolio | | Homes | |
| Same Store Pool | | | 716 | |
| Non-Matures | | | — | |
| Homes in Development | | | — | |
| Held for Future Development | | | — | |
| | | | |
Total | | | 716 | |
| MRQ Mo. Inc./ Home (SS) | | $ | 1,002 | |
| MRQ Occupancy (SS) | | | 95.3 | % |
| | | | | | | | | |
| Company | | # of Homes (SS) | | | Ave. Rent | |
| UDR | | | 716 | | | $ | 1,002 | |
| EQR | | | 3,713 | | | | 892 | |
| | | | | | | |
| | | | 4,429 | | | $ | 909 | |
Portland is UDR’s#19
market and is expected to
contribute 1.4%of the
Company’s 2008 total
pro forma NOI.
Portland Market Statistics
| | | | | | | | | | | | | | | | | |
| 2008 Forecast | | | Low Home Affordability | | | Economy | |
| Effective Rent (MRQ) | | $ | 869 | | | Ave. Market Rent | | $ | 909 | | | Population | | | 2,175,113 | |
| Occupancy (MRQ) | | | 94.5 | % | | Mo Payment: Entry Level*: | | | | | | Job Growth (MRQ) | | | 0.2 | % |
| Eff. Rent Growth ‘08F | | | 0.8 | % | | Home | | $ | 1,776 | | | Median Income | | $ | 67,500 | |
| Eff. Rent Growth ‘09F | | | 1.0 | % | | Condo | | $ | 1,476 | | | Housing Stock | | | | |
| Eff. Rent Growth ‘10F | | | 1.4 | % | | Median Home Price (MRQ) | | $ | 286,100 | | | Renter | | | 290,704 | |
| Multifamily Permits | | | 4,022 | | | Housing Affordability Score | | | 77 | | | % of Total | | | 34.9 | % |
Sources: AXIOMetrics and Company Reports, Most Recent Quarter (MRQ), Merrill Lynch Apartment Monitor, Latest Available Data (LAD)
* Assumes 30 yr fixed at 6.3%
Recent Activity
UDR owns 716 apartment homes in three communities in the Portland market. The Company sold two of its Portland properties in the March portfolio sale. Rents average $1,002 at UDR’s Portland properties with three bedroom homes renting for as much as $2,200. The Portland economy is fueled in large part by the technology industry and is home to Nike in the Portland suburb of Beaverton.
63
| | | |
| | Portland
Market Fact Sheet |
| | | | | | | | | | | | | | | | | | | | | |
| | | | | | | Year Built | | | | | | | | | | | Inc. per Occ. | |
| Operating Properties | | # Homes | | | ReDev | | | Redev. | | | Occupancy | | | Home | |
| 1 Hunt Club | | | 256 | | | | 1985 | | | | K/B | | | | 95.5 | % | | $ | 935 | |
| 2 Tualatin Heights | | | 220 | | | | 1989 | | | | K/B | | | | 95.5 | % | | | 1,023 | |
| 3 Andover Park | | | 240 | | | | 1989 | | | | K/B | | | | 94.8 | % | | | 1,054 | |
| | | | | | | | | | | | | | | | |
Grand Total | | | 716 | | | | | | | | | | | | 95.3 | % | | $ | 1,002 | |
| | | | | | | | | | | | | | | | |
64
Market Statistics & Peer Comparison
| | | | | |
| Austin Portfolio | | Homes | |
| Same Store Pool | | | 250 | |
| Non-Matures | | | 390 | |
| Homes in Development | | | — | |
| Held for Future Development | | | — | |
| | | | |
Total | | | 640 | |
| MRQ Mo. Inc./ Home (SS) | | $ | 978 | |
| MRQ Occupancy (SS) | | | 98.0 | % |
| | | | | | | | | |
| Company | | # of Homes | | | Ave. Rent | |
| PPS | | | 308 | | | $ | 1,371 | |
| CPT | | | 1,898 | | | | 985 | |
| UDR | | | 250 | | | | 978 | |
| CLP | | | 1,910 | | | | 839 | |
| MAA | | | 1,776 | | | | 803 | |
| AIV | | | 1,499 | | | | 756 | |
| | | | | | | |
| | | | 7,641 | | | $ | 877 | |
Austin is UDR’s#20
market and is expected to
contribute 1.4%of the
Company’s 2008 total
pro forma NOI.
Austin Market Statistics
| | | | | | | | | | | | | | | | | |
| 2008 Forecast | | | Low Home Affordability | | | Economy | |
| Effective Rent (MRQ) | | $ | 864 | | | Ave. Market Rent | | $ | 877 | | | Population | | | 1,598,161 | |
| Occupancy (MRQ) | | | 93.1 | % | | Mo Payment: Entry Level*: | | | | | | Job Growth (MRQ) | | | 2.2 | % |
| Eff. Rent Growth ‘08F | | | 1.7 | % | | Home | | $ | 1,331 | | | Median Income | | $ | 69,100 | |
| Eff. Rent Growth ‘09F | | | 2.5 | % | | Condo | | $ | 1,094 | | | Housing Stock | | | | |
| Eff. Rent Growth ‘10F | | | 1.3 | % | | Median Home Price (MRQ) | | $ | 194,200 | | | Renter | | | 234,574 | |
| Multifamily Permits | | | 5,620 | | | Housing Affordability Score | | | 102 | | | % of Total | | | 40.2 | % |
Sources: AXIOMetrics and Company Reports, Most Recent Quarter (MRQ), Merrill Lynch Apartment Monitor, Latest Available Data (LAD)
* Assumes 30 yr fixed at 6.3%
Recent Activity
In the third quarter of 2008, UDR purchased Residences at The Domain, a 390-home community built in 2007. This property is located in Domain Urban Village, an attractive mixed-use development with 700,000 square feet of retail and 75,000 square feet of office space. It is located in close proximity to proposed rail lines, including Capital MetroRail and Union Pacific Rail Line and to Central Austin and Northwest Austin job centers.
65
| | | | | | | | | | | | | | | | | | | |
| | | | | | | Year Built | | | | | | | | | Inc. per Occ. | |
| Operating Properties | | # Homes | | | ReDev | | | Redev. | | Occupancy | | | Home | |
| 1 Barton Creek Landing | | | 250 | | | | 1986 | | | K/B | | | 98.0 | % | | $ | 978 | |
| | | | | | | | | | | | | | | |
Subtotal | | | 250 | | | | | | | | | | 98.0 | % | | | 978 | |
Non-Mature and Other | | | | | | | | | | | | | | | | | | |
| 2 Red Stone Ranch (Texas JV) | | | 324 | | | | 2001 | | | — | | | 95.9 | % | | | 845 | |
| 3 Lakeline Villas (Texas JV) | | | 309 | | | | 2002 | | | — | | | 97.5 | % | | | 813 | |
| 4 Residences at The Domain | | | 390 | | | | 2007 | | | | | | 91.0 | % | | | 1,253 | |
| | | | | | | | | | | | | | | |
Subtotal** | | | 390 | | | | | | | | | | 91.0 | % | | | 1,253 | |
| | | | | | | | | | | | | | | |
Grand Total (UDR)** | | | 640 | | | | | | | | | | 93.7 | % | | $ | 1,141 | |
| | | | | | | | | | | | | | | |
**JV homes not included.
66
Transformation for Growth: UDR’s Strategies
| | | |
 | | • Strong portfolio, focused in markets with above average job growth expectations and low affordability
• Excellent growth profile |
| | | |
 | | • Development pipeline geographically aligned with operating portfolio
• Pursuing entitlement and short-term hold opportunities |
| | | |
 | | • Focused operating model
• Improved efficiency and effectiveness
• Continued execution of technology initiatives |
| | | |
 | | • Recycle capital into high growth markets
• Strengthen balance sheet with debt reduction |
Safe Harbor:Statements contained in this document, which are not historical facts, are forward-looking statements, as the term is defined in the Private Securities Litigation Reform Act of 1995. You can identify these forward-looking statements by the Company’s use of words such as, “expects,” “plans,” “estimates,” “projects,” “intends,” “believes,” and similar expressions that do not relate to historical matters. Such forward-looking statements are subject to risks and uncertainties which can cause actual results to differ materially from those currently anticipated, due to a number of factors, which include, but are not limited to, unfavorable changes in the apartment market, changing economic conditions, the impact of competition and competitive pricing, acquisitions or new developments not achieving anticipated results, delays in completing developments and lease-ups on schedule, expectations on job growth, home affordability and demand/supply ratio for multi-family housing, expectations concerning development and redevelopment activities, expectations on occupancy levels, expectations concerning the Vitruvian Park project, including expectations that the Company will be able to secure one or more institutional investor-partners, expectations that automation will help grow net operating income, expectations on post-renovated stabilized annual operating income, expectations on annualized net operating income and other risk factors discussed in documents filed by the Company with the Securities and Exchange Commission from time to time including the Company’s Annual Report on Form 10-K and the Company’s Quarterly Reports on Form 10-Q. All forward-looking statements in this document are made as of August 6, 2008, based upon information known to management as of the date hereof. The Company assumes no obligation to update or revise any of its forward-looking statements even if experience or future changes show that indicated results or events will not be realized.