
Discussion Materials
2 Forward Looking Statements This presentation contains highly confidential information and is solely for informational purposes. You should not rely upon or use it to form the definitive basis for any decision or action whatsoever, with respect to any proposed transaction or otherwise. You and your affiliates and agents must hold this presentation and any oral information provided in connection with this presentation, as well as any information derived by you from the information contained herein, in strict confidence and may not communicate, reproduce or disclose it to any other person, or refer to it publicly, in whole or in part at any time except with our prior written consent. If you are not the intended recipient of this presentation, please delete and destroy all copies immediately. This presentation is “as is” and is based, in part, on information obtained from other sources. Our use of such information does not imply that we have independently verified or necessarily agree with any of such information, and we have assumed and relied upon the accuracy and completeness of such information for purposes of this presentation. Neither we nor any of our affiliates or agents, make any representation or warranty, express or implied, in relation to the accuracy or completeness of the information contained in this presentation or any oral information provided in connection herewith, or any data it generates and expressly disclaim any and all liability (whether direct or indirect, in tract, tort or otherwise) in relation to any of such information or any error or omissions therein. Any views or terms contained herein are preliminary, and are based on financial, economic, market and other conditions prevailing as of the date of this presentation and are subject to change. We undertake no obligation or responsibility to update any information contained in this presentation. Past performance does not guarantee or predict future performance. This presentation contains certain non-GAAP financial measures which the Invacare Corporation (the “Company”) uses as performance measures. These non-GAAP financial measures should not be considered in isolation or as a substitute for their most directly comparable as reported measure prepared in accordance with GAAP and, along with the other information set forth herein, should be read in conjunction with the Company’s financial statements and related footnotes contained in documents with the U.S. Securities and Exchange Commission. Other companies may defined such non-GAAP financial measures differently. Non-GAAP financial measures should be considered to be a supplement to, and not as a substitute for, or superior to, financial measures prepared in accordance with GAAP. This presentation contains financial forecasts or projections (collectively, “Forecasts”) prepared by the Company. The Company’s independent registered public accounting firm has not audited, reviewed, compiled or performed any procedures with respect to the Forecasts for the purpose of their inclusion in this presentation, and accordingly, the Company expresses no opinion nor provides any other form of assurance with respect thereto for the purpose of this presentation. These Forecasts should not be relied upon as being necessarily indicative of future results. The Forecasts presented herein are provided solely for illustrative purposes, reflect the current beliefs of the Company as of the date hereof, and are based on a variety of assumptions and estimates which are subject to change. The Company assumes no obligation to update the Forecasts or information, data, models, facts or assumptions underlying the foregoing in this presentation. This presentation does not constitute an offer to sell or the solicitation of an offer to buy any security, nor does it constitute an offer or commitment to lend, syndicate or arrange a financing, underwrite or purchase or act as an agent or advisor or in any other capacity with respect to any transaction, or commit capital, or to participate in any trading strategies, and does not constitute legal, regulatory, accounting or tax advice to the recipient. This presentation does not constitute and should not be considered as any form of financial opinion or recommendation by us or any of our affiliates. This presentation is not a research report nor should it be construed as such.
3 Forward Looking Statements (Cont’d) Cautionary Statement Concerning Forward-Looking Statements Statements contained in this presentation that are not historical facts are forward-looking statements within the meaning of Section 27A of the Securities Act of 1933, as amended, and Section 21E of the Exchange Act. Forward-looking statements include words or phrases such as “anticipate,” “believe,” “estimate,” “expect,” “intend,” “plan,” “project,” “could,” “may,” “might,” “should,” “will” and similar words. Forward-looking statements are based on management’s current expectations, beliefs, assumptions and estimates and may include, for example, statements regarding the voluntary cases commenced by the company and certain of its subsidiaries under Chapter 11 of the U.S. Bankruptcy Code in the Court (the “Chapter 11 Cases”), the Term DIP Credit Agreement and the ABL DIP Credit Agreement (collectively, the “DIP Credit Agreements”), the Company’s ability to consummate and complete a plan of reorganization and its ability to continue operating in the ordinary course while the Chapter 11 Cases are pending. These statements are subject to significant risks, uncertainties, and assumptions that are difficult to predict and could cause actual results to differ materially and adversely from those expressed or implied in the forward-looking statements, including risks and uncertainties regarding the Company’s ability to successfully complete a restructuring under Chapter 11; consummation of a plan of reorganization; potential adverse effects of the Chapter 11 Cases on the Company’s liquidity and results of operations; the Company’s ability to obtain timely approval by the U.S. Bankruptcy Court for the Southern District of Texas (the “Bankruptcy Court”) with respect to the motions filed in the Chapter 11 Cases; objections to the Company’s recapitalization process, DIP Credit Agreements, or other pleadings filed that could protract the Chapter 11 Cases; employee attrition and the Company’s ability to retain senior management and other key personnel due to the distractions and uncertainties; the Company’s ability to comply with the restrictions imposed by the terms and conditions of the DIP Credit Agreements and other financing arrangements; the Company’s ability to maintain relationships with suppliers, customers, employees and other third parties and regulatory authorities as a result of the Chapter 11 Cases; the effects of the Chapter 11 Cases on the Company and on the interests of various constituents, including holders of the Company’s common shares; the Bankruptcy Court’s rulings in the Chapter 11 Cases, including the approvals of the terms and conditions of any plan of reorganization and the DIP Credit Agreements, and the outcome of the Chapter 11 Cases generally; the length of time that the Company will operate under Chapter 11 protection and the continued availability of operating capital during the pendency of the Chapter 11 Cases; risks associated with third party motions in the Chapter 11 Cases, which may interfere with the Company’s ability to consummate a plan of reorganization or an alternative restructuring; increased administrative and legal costs related to the Chapter 11 process; and other litigation and inherent risks involved in a bankruptcy process. Forward-looking statements are also subject to the risk factors and cautionary language described from time to time in the reports the Company files with the U.S. Securities and Exchange Commission, including those in the Company’s most recent Annual Report on Form 10-K and any updates thereto in the Company’s Quarterly Reports on Form 10-Q and Current Reports on Form 8-K. These risks and uncertainties may cause actual future results to be materially different than those expressed in such forward-looking statements. Each forward-looking statement speaks only as of the date of the particular statement, and we undertake no obligation to publicly update or revise any forward-looking statements, except as required by law.
III. Summary of 4-Year Financial Projections 11 I. Situation Overview 4 II. Global Transformation Overview 6 Table of Contents

I. Situation Overview
6 • In Q4 2022, the Company’s operating performance improved sequentially with Preliminary Adjusted EBITDA (unaudited) for 4Q22 approximately breakeven as compared to loss in 3Q22. Europe delivered positive operating income in 4Q22. Sequential improvement driven by reported sales growth in each segment and product categories, gross margin expansion and lower SG&A expense • Europe, for first period of 2023, achieved the sales forecast with operating income favorable by $1MM. January in NA is pressured by payment holds as the Company prepares for a chapter 11 filing • In 2022, the Company pursued a financing / refinancing transaction to reduce past-due accounts payable; the process culminated in the Highbridge transaction, which provided the Company with $66.5MM on July 26, 2022, and $18.5MM on October 3, 2022 • The capital received by the Company as part of the Highbridge transaction was partially offset by numerous factors, including the timing of the closing, the Company’s increasing balance of past-due accounts payable and associated product shipment delays, fees and expenses associated with the financing and repayment / extinguishment of the European ABL and North American ABLs. Net of these uses, the Company added $29.6MM of cash to its balance sheet of which $20.5MM was used to pay down accounts payable • On December 23, 2022, Highbridge funded an additional $5.5MM • Since the beginning of the 2022, the Company has been working with multiple turnaround financial advisors to develop specific strategies for various regions. The Company has effectuated numerous initiatives outlined by its turnaround financial advisors during 2022 and is accelerating changes planned in 2024 and 2025 into 2023 • The IT contract has been terminated for cause and the Company is re-insourcing IT services. In light of footprint changes, the Company is evaluating if there are less expensive options for North America • In 2021, the Company conducted an extensive and comprehensive marketing process led by an investment bank which ultimately did not lead to a transaction ► During the process, which included the marketing of the entire Company as well as certain divisions and regions, the Company received multiple indications of interest, but various organizational and operational factors complicated the Company’s ability to execute a transaction Situation Overview Recent Performance Highbridge Financing Prepetition Strategic Initiatives

7 II. Transformation Overview
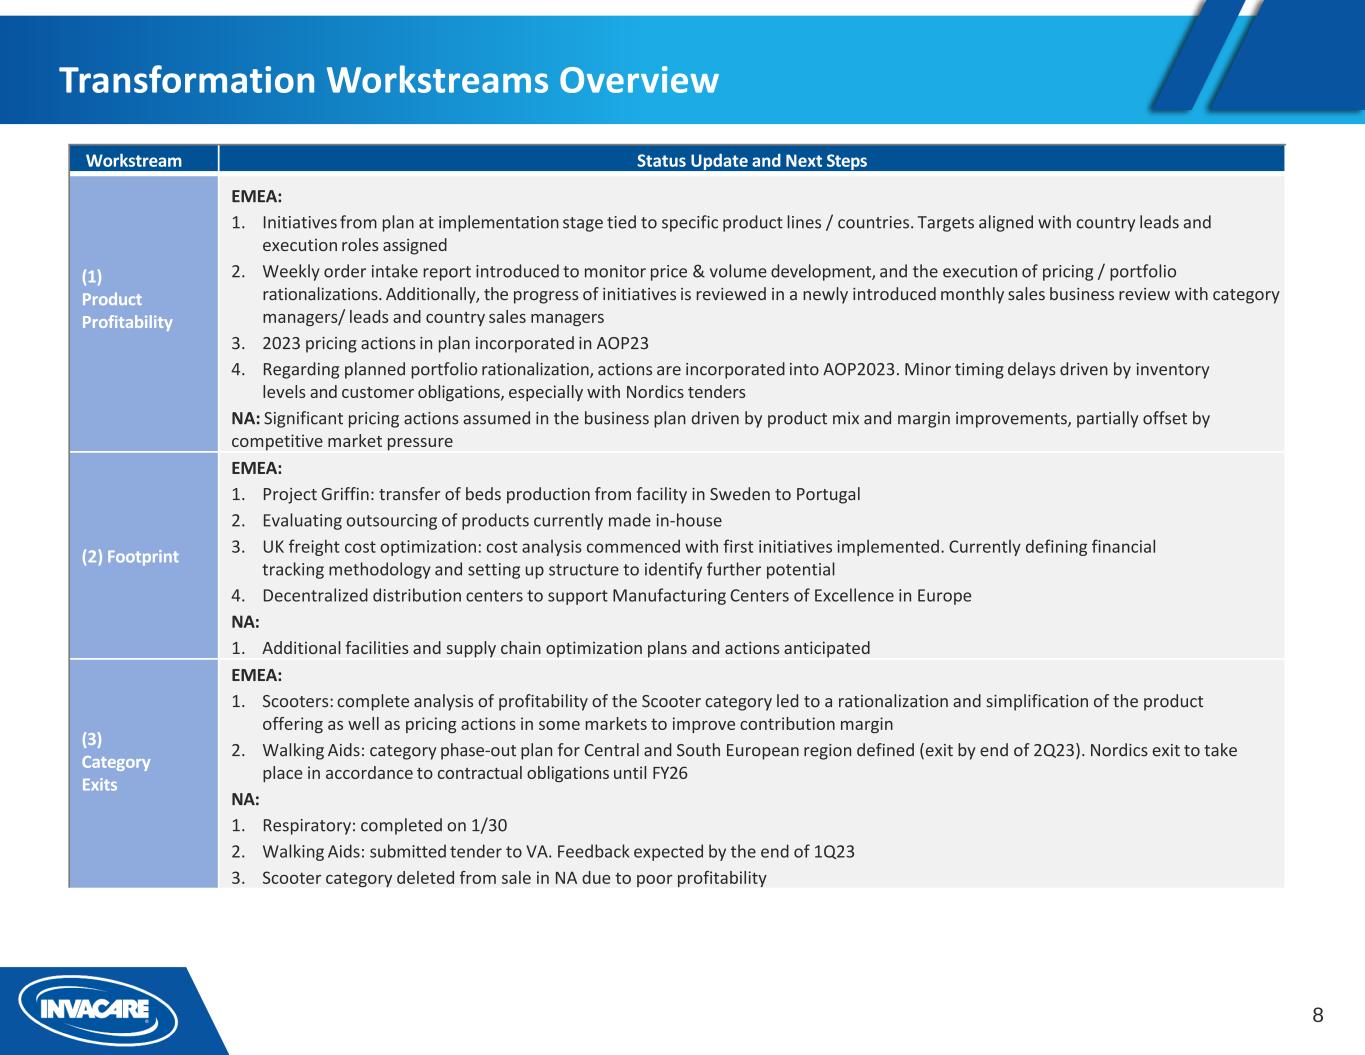
8 Workstream Status Update and Next Steps (1) Product Profitability EMEA: 1. Initiatives from plan at implementation stage tied to specific product lines / countries. Targets aligned with country leads and execution roles assigned 2. Weekly order intake report introduced to monitor price & volume development, and the execution of pricing / portfolio rationalizations. Additionally, the progress of initiatives is reviewed in a newly introduced monthly sales business review with category managers/ leads and country sales managers 3. 2023 pricing actions in plan incorporated in AOP23 4. Regarding planned portfolio rationalization, actions are incorporated into AOP2023. Minor timing delays driven by inventory levels and customer obligations, especially with Nordics tenders NA: Significant pricing actions assumed in the business plan driven by product mix and margin improvements, partially offset by competitive market pressure (2) Footprint EMEA: 1. Project Griffin: transfer of beds production from facility in Sweden to Portugal 2. Evaluating outsourcing of products currently made in-house 3. UK freight cost optimization: cost analysis commenced with first initiatives implemented. Currently defining financial tracking methodology and setting up structure to identify further potential 4. Decentralized distribution centers to support Manufacturing Centers of Excellence in Europe NA: 1. Additional facilities and supply chain optimization plans and actions anticipated (3) Category Exits EMEA: 1. Scooters: complete analysis of profitability of the Scooter category led to a rationalization and simplification of the product offering as well as pricing actions in some markets to improve contribution margin 2. Walking Aids: category phase-out plan for Central and South European region defined (exit by end of 2Q23). Nordics exit to take place in accordance to contractual obligations until FY26 NA: 1. Respiratory: completed on 1/30 2. Walking Aids: submitted tender to VA. Feedback expected by the end of 1Q23 3. Scooter category deleted from sale in NA due to poor profitability Transformation Workstreams Overview
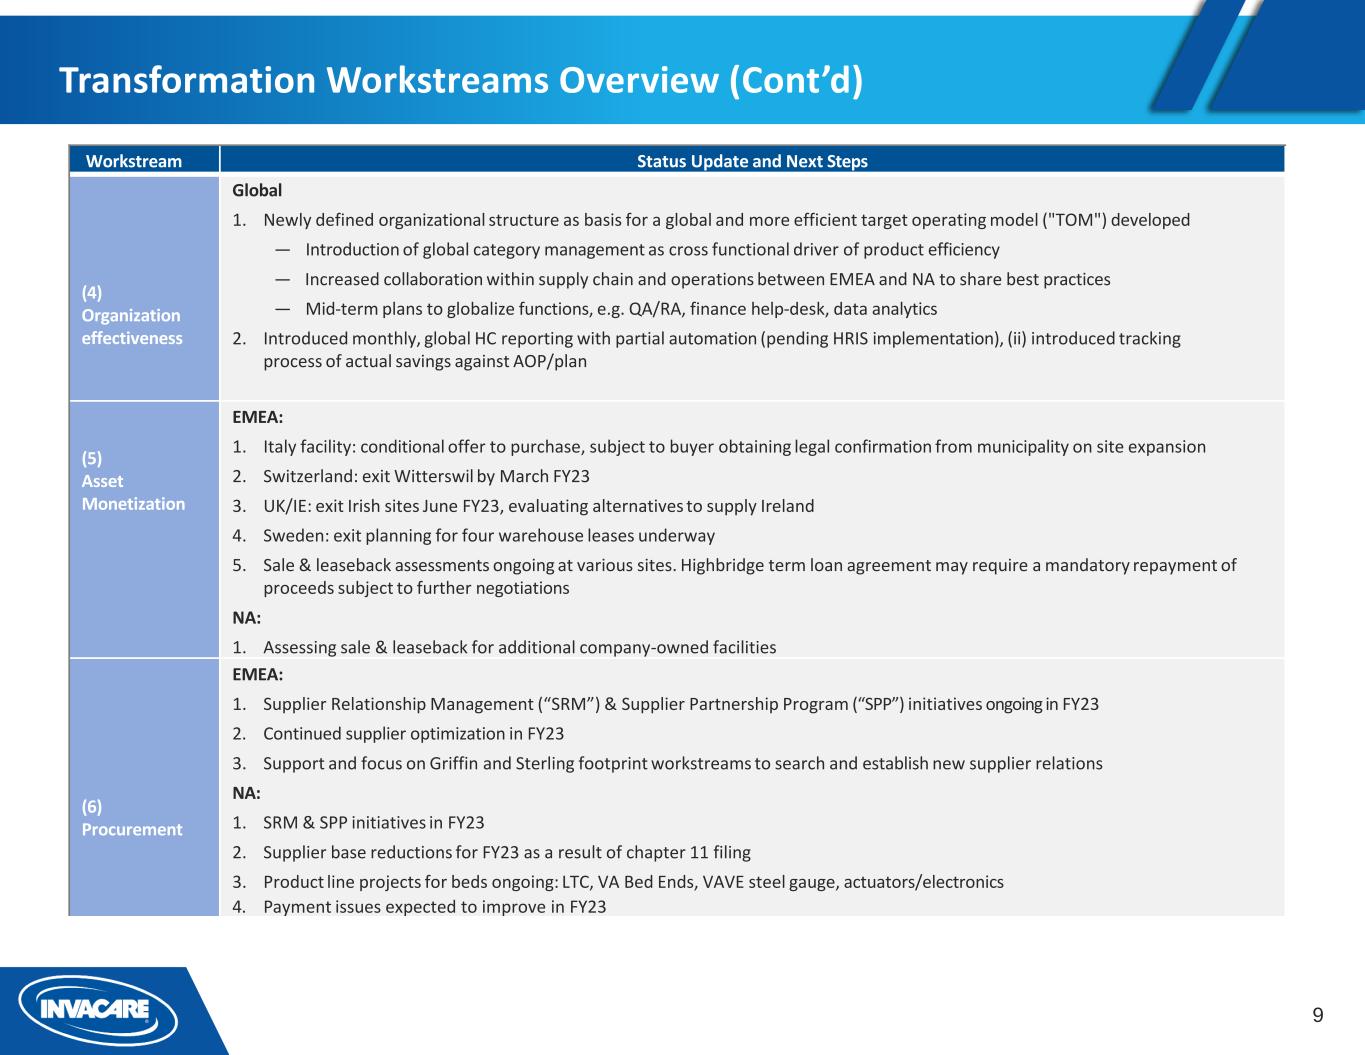
9 Workstream Status Update and Next Steps (4) Organization effectiveness Global 1. Newly defined organizational structure as basis for a global and more efficient target operating model ("TOM") developed ― Introduction of global category management as cross functional driver of product efficiency ― Increased collaboration within supply chain and operations between EMEA and NA to share best practices ― Mid-term plans to globalize functions, e.g. QA/RA, finance help-desk, data analytics 2. Introduced monthly, global HC reporting with partial automation (pending HRIS implementation), (ii) introduced tracking process of actual savings against AOP/plan (5) Asset Monetization EMEA: 1. Italy facility: conditional offer to purchase, subject to buyer obtaining legal confirmation from municipality on site expansion 2. Switzerland: exit Witterswil by March FY23 3. UK/IE: exit Irish sites June FY23, evaluating alternatives to supply Ireland 4. Sweden: exit planning for four warehouse leases underway 5. Sale & leaseback assessments ongoing at various sites. Highbridge term loan agreement may require a mandatory repayment of proceeds subject to further negotiations NA: 1. Assessing sale & leaseback for additional company-owned facilities (6) Procurement EMEA: 1. Supplier Relationship Management (“SRM”) & Supplier Partnership Program (“SPP”) initiatives ongoing in FY23 2. Continued supplier optimization in FY23 3. Support and focus on Griffin and Sterling footprint workstreams to search and establish new supplier relations NA: 1. SRM & SPP initiatives in FY23 2. Supplier base reductions for FY23 as a result of chapter 11 filing 3. Product line projects for beds ongoing: LTC, VA Bed Ends, VAVE steel gauge, actuators/electronics 4. Payment issues expected to improve in FY23 Transformation Workstreams Overview (Cont’d)
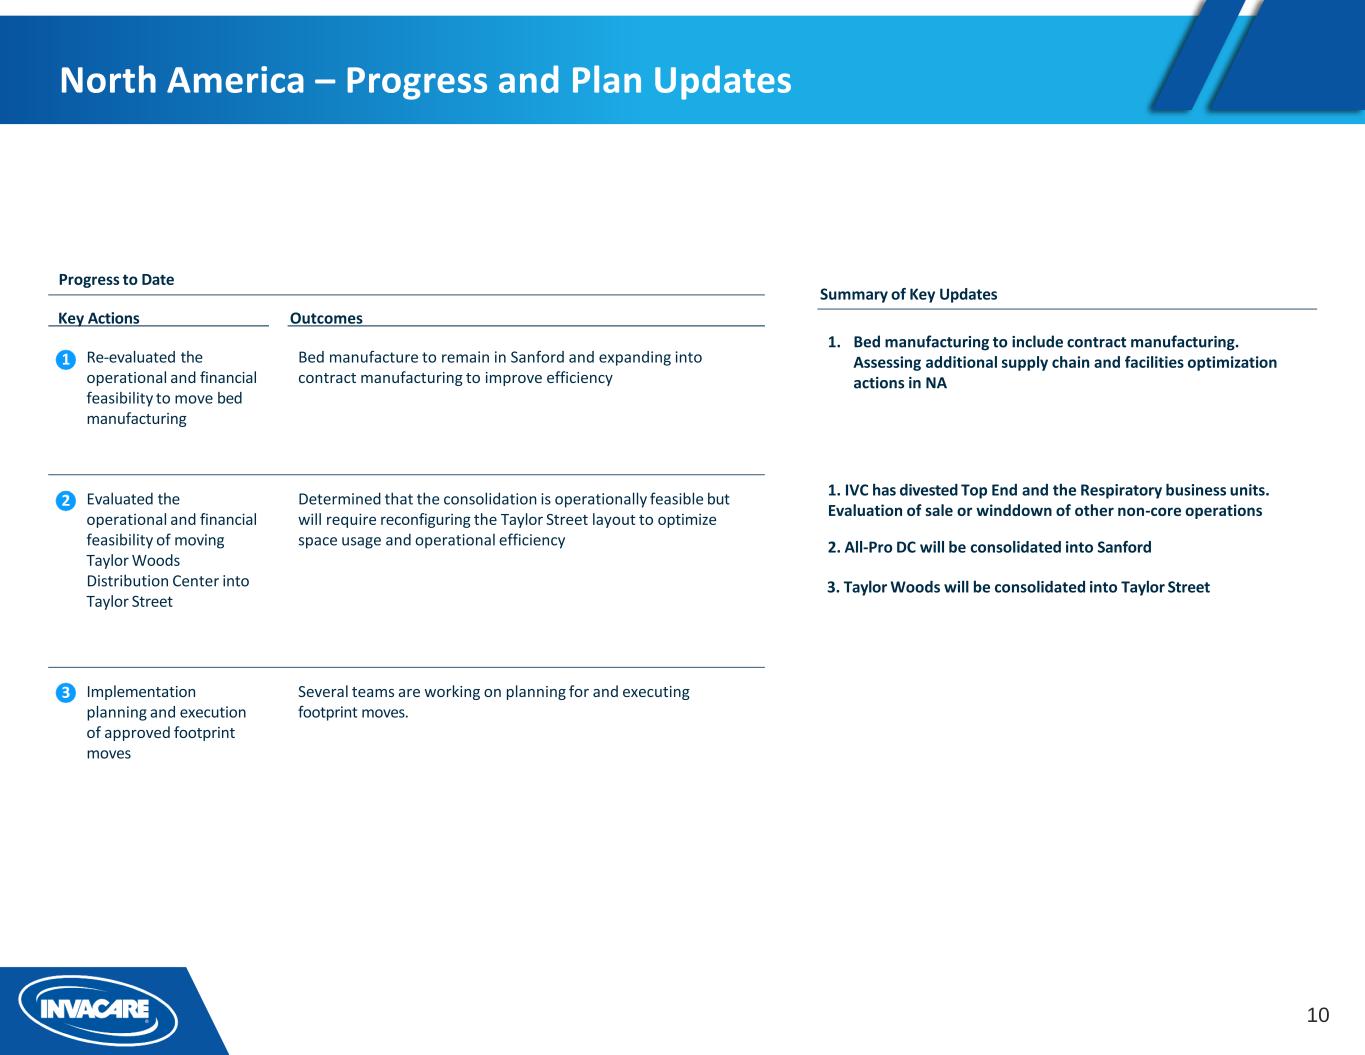
10 Progress to Date Summary of Key Updates Key Actions Outcomes Re-evaluated the operational and financial feasibility to move bed manufacturing Bed manufacture to remain in Sanford and expanding into contract manufacturing to improve efficiency Evaluated the operational and financial feasibility of moving Taylor Woods Distribution Center into Taylor Street Determined that the consolidation is operationally feasible but will require reconfiguring the Taylor Street layout to optimize space usage and operational efficiency Implementation planning and execution of approved footprint moves Several teams are working on planning for and executing footprint moves. 1 2 3 1. Bed manufacturing to include contract manufacturing. Assessing additional supply chain and facilities optimization actions in NA 1. IVC has divested Top End and the Respiratory business units. Evaluation of sale or winddown of other non-core operations 2. All-Pro DC will be consolidated into Sanford 3. Taylor Woods will be consolidated into Taylor Street 7 North America – Progress and Plan Updates 7
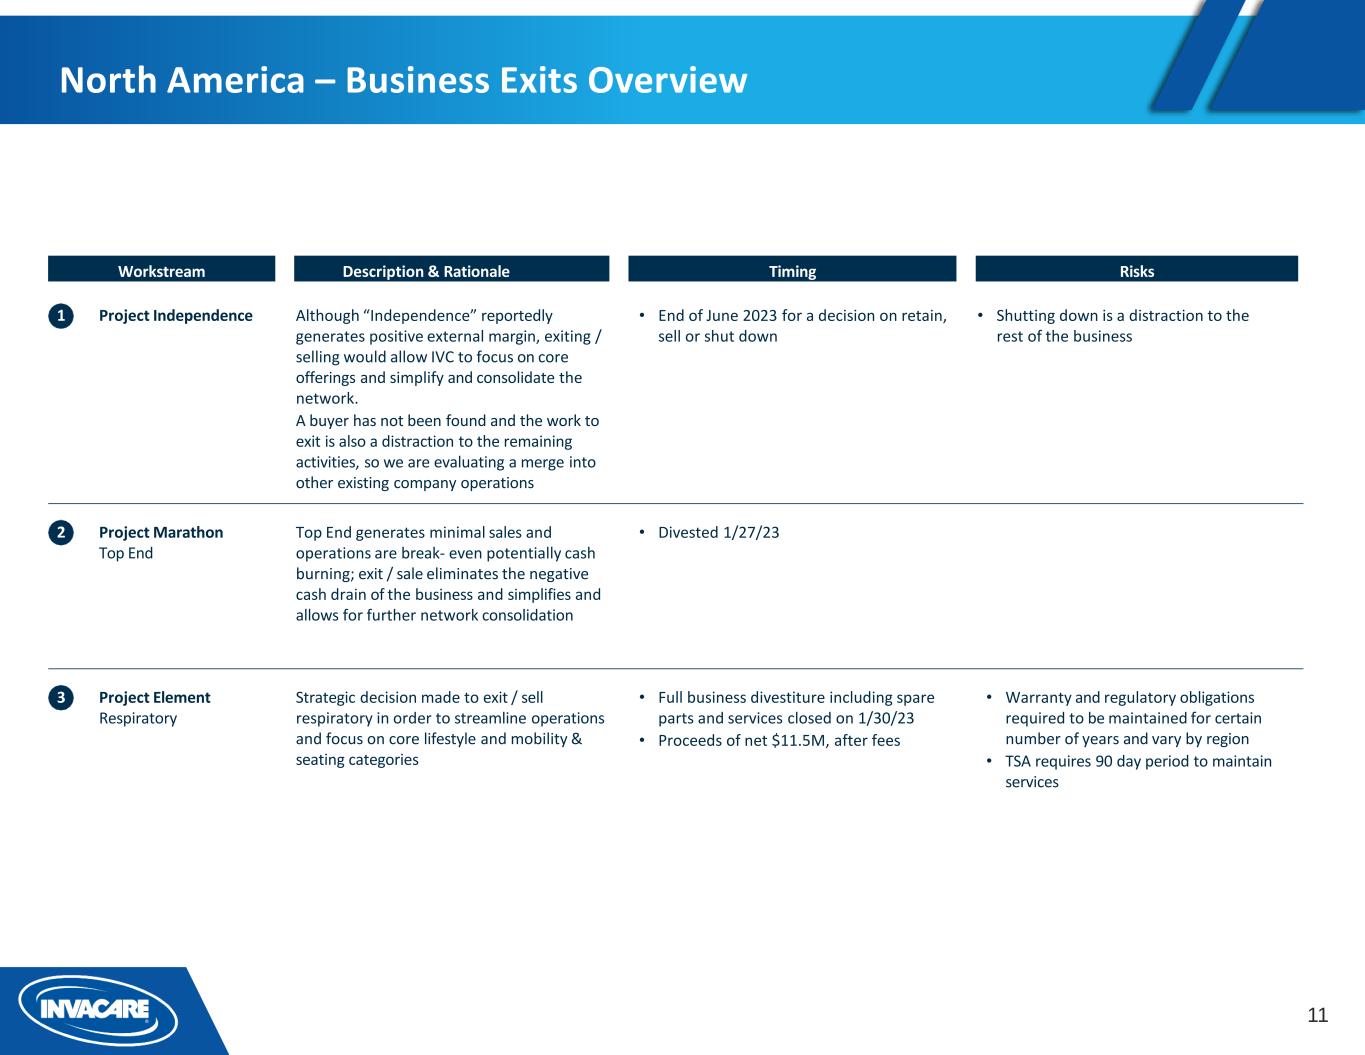
11 Workstream RisksTiming 1 Project Independence • End of June 2023 for a decision on retain, sell or shut down • Shutting down is a distraction to the rest of the business 2 Project Marathon Top End • Divested 1/27/23 3 9 Project Element Respiratory • Full business divestiture including spare parts and services closed on 1/30/23 • Proceeds of net $11.5M, after fees • Warranty and regulatory obligations required to be maintained for certain number of years and vary by region • TSA requires 90 day period to maintain services Description & Rationale Although “Independence” reportedly generates positive external margin, exiting / selling would allow IVC to focus on core offerings and simplify and consolidate the network. A buyer has not been found and the work to exit is also a distraction to the remaining activities, so we are evaluating a merge into other existing company operations Top End generates minimal sales and operations are break- even potentially cash burning; exit / sale eliminates the negative cash drain of the business and simplifies and allows for further network consolidation Strategic decision made to exit / sell respiratory in order to streamline operations and focus on core lifestyle and mobility & seating categories North America – Business Exits Overview
III. 4-Year Financial Projections
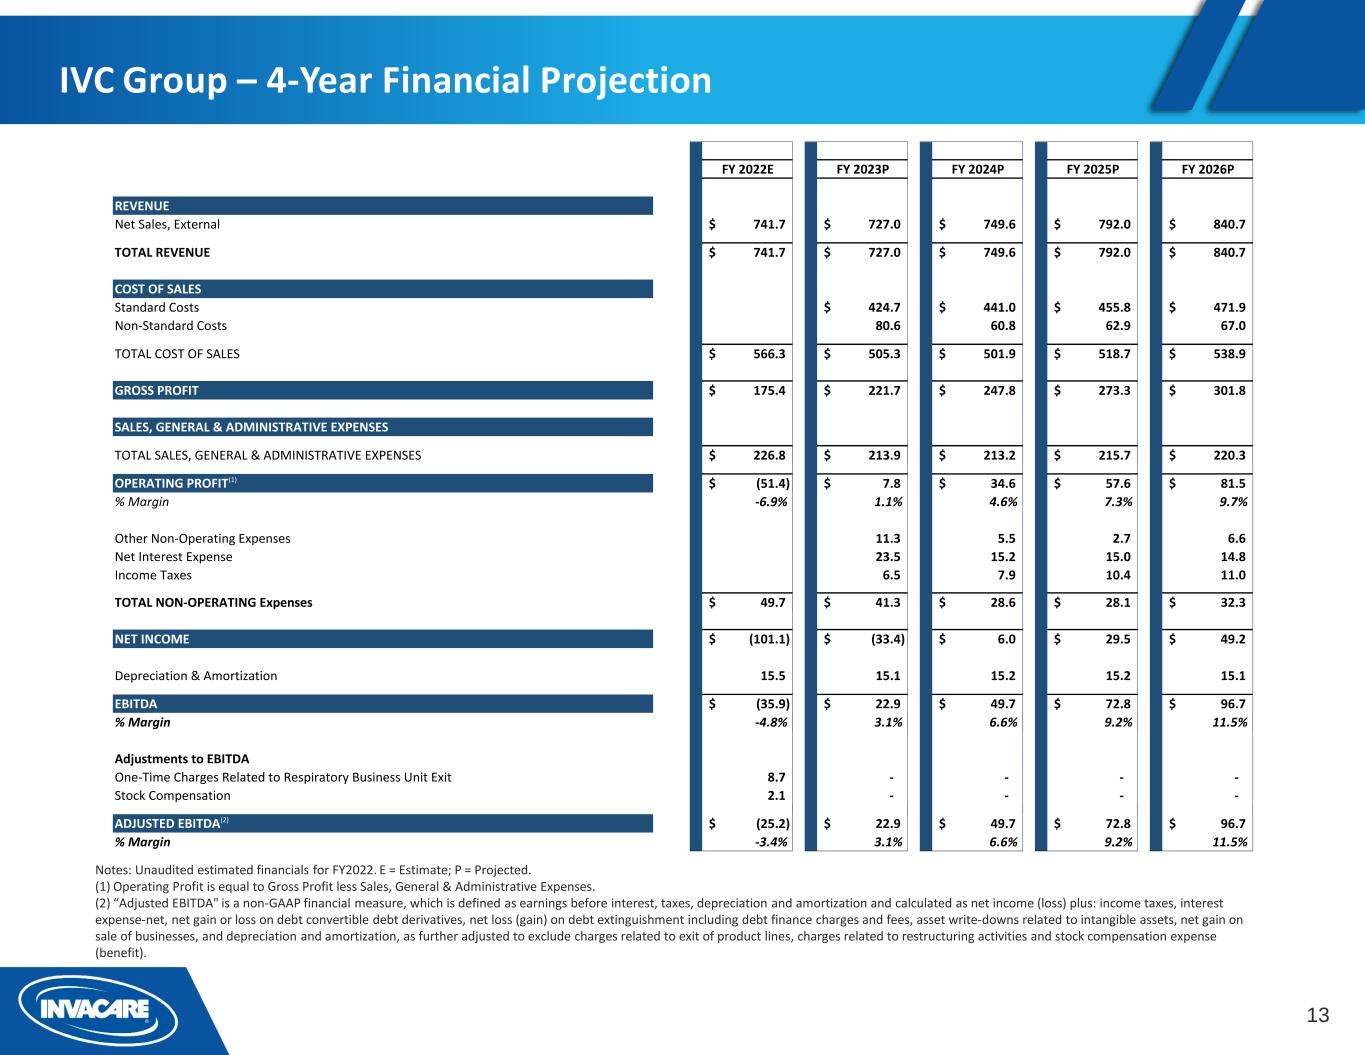
13 IVC Group – 4-Year Financial Projection Notes: Unaudited estimated financials for FY2022. E = Estimate; P = Projected. (1) Operating Profit is equal to Gross Profit less Sales, General & Administrative Expenses. (2) “Adjusted EBITDA" is a non-GAAP financial measure, which is defined as earnings before interest, taxes, depreciation and amortization and calculated as net income (loss) plus: income taxes, interest expense-net, net gain or loss on debt convertible debt derivatives, net loss (gain) on debt extinguishment including debt finance charges and fees, asset write-downs related to intangible assets, net gain on sale of businesses, and depreciation and amortization, as further adjusted to exclude charges related to exit of product lines, charges related to restructuring activities and stock compensation expense (benefit). FY 2022E FY 2023P FY 2024P FY 2025P FY 2026P REVENUE Net Sales, External 741.7$ 727.0$ 749.6$ 792.0$ 840.7$ TOTAL REVENUE 741.7$ 727.0$ 749.6$ 792.0$ 840.7$ COST OF SALES Standard Costs 424.7$ 441.0$ 455.8$ 471.9$ Non-Standard Costs 80.6 60.8 62.9 67.0 TOTAL COST OF SALES 566.3$ 505.3$ 501.9$ 518.7$ 538.9$ GROSS PROFIT 175.4$ 221.7$ 247.8$ 273.3$ 301.8$ SALES, GENERAL & ADMINISTRATIVE EXPENSES TOTAL SALES, GENERAL & ADMINISTRATIVE EXPENSES 226.8$ 213.9$ 213.2$ 215.7$ 220.3$ OPERATING PROFIT(1) (51.4)$ 7.8$ 34.6$ 57.6$ 81.5$ % Margin -6.9% 1.1% 4.6% 7.3% 9.7% Other Non-Operating Expenses 11.3 5.5 2.7 6.6 Net Interest Expense 23.5 15.2 15.0 14.8 Income Taxes 6.5 7.9 10.4 11.0 TOTAL NON-OPERATING Expenses 49.7$ 41.3$ 28.6$ 28.1$ 32.3$ NET INCOME (101.1)$ (33.4)$ 6.0$ 29.5$ 49.2$ Depreciation & Amortization 15.5 15.1 15.2 15.2 15.1 EBITDA (35.9)$ 22.9$ 49.7$ 72.8$ 96.7$ % Margin -4.8% 3.1% 6.6% 9.2% 11.5% Adjustments to EBITDA One-Time Charges Related to Respiratory Business Unit Exit 8.7 - - - - Stock Compensation 2.1 - - - - ADJUSTED EBITDA(2) (25.2)$ 22.9$ 49.7$ 72.8$ 96.7$ % Margin -3.4% 3.1% 6.6% 9.2% 11.5%
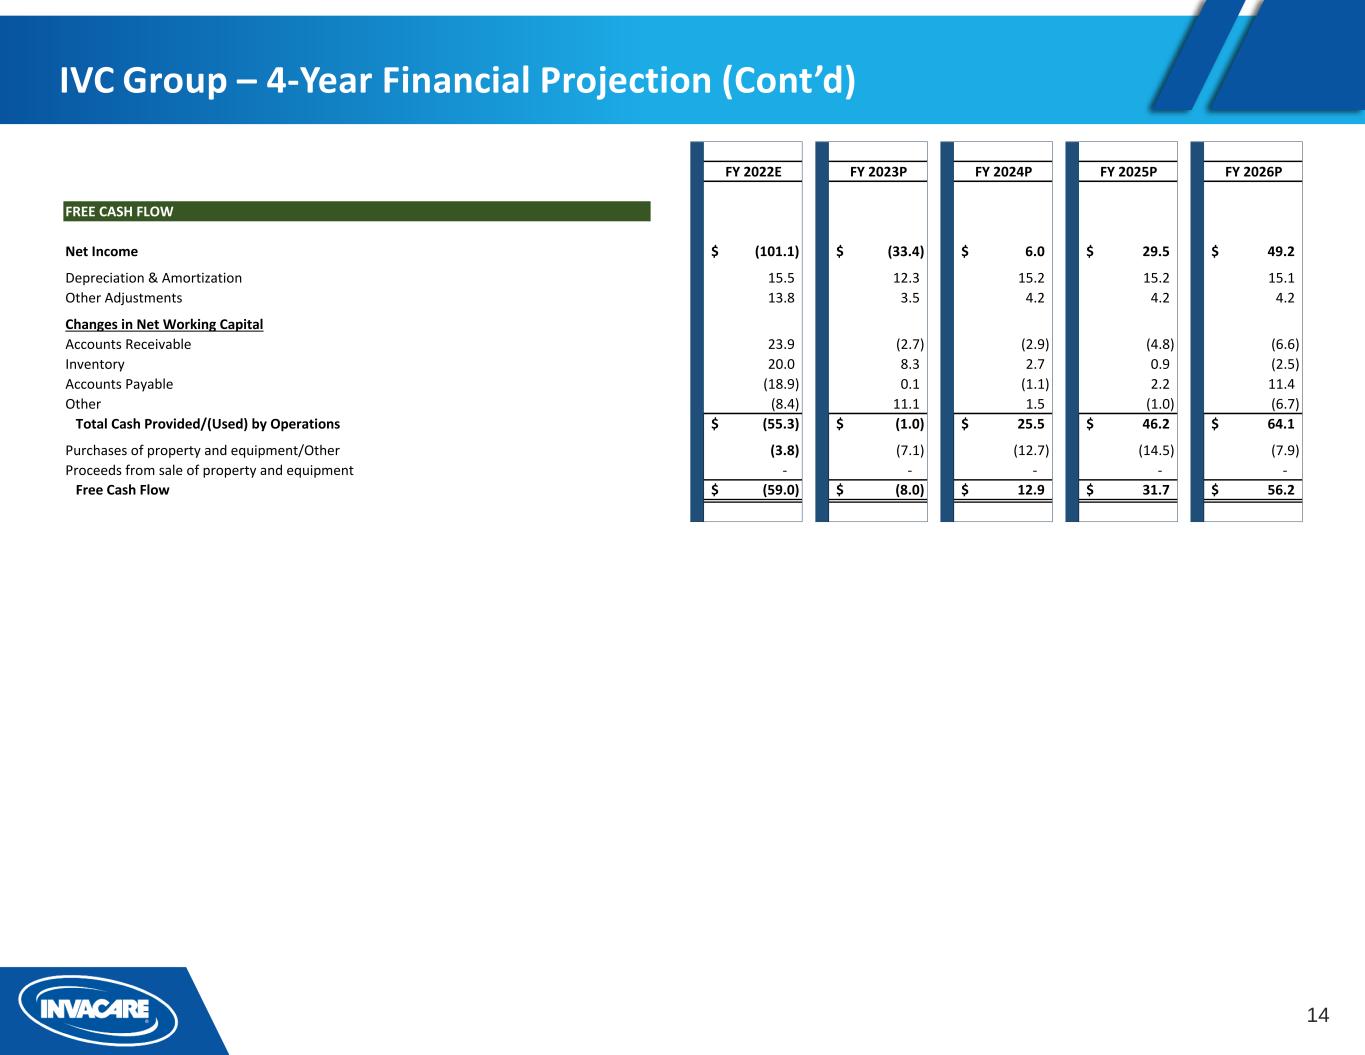
14 IVC Group – 4-Year Financial Projection (Cont’d) FY 2022E FY 2023P FY 2024P FY 2025P FY 2026P FREE CASH FLOW Net Income (101.1)$ (33.4)$ 6.0$ 29.5$ 49.2$ Depreciation & Amortization 15.5 12.3 15.2 15.2 15.1 Other Adjustments 13.8 3.5 4.2 4.2 4.2 Changes in Net Working Capital Accounts Receivable 23.9 (2.7) (2.9) (4.8) (6.6) Inventory 20.0 8.3 2.7 0.9 (2.5) Accounts Payable (18.9) 0.1 (1.1) 2.2 11.4 Other (8.4) 11.1 1.5 (1.0) (6.7) Total Cash Provided/(Used) by Operations (55.3)$ (1.0)$ 25.5$ 46.2$ 64.1$ Purchases of property and equipment/Other (3.8) (7.1) (12.7) (14.5) (7.9) Proceeds from sale of property and equipment - - - - - Free Cash Flow (59.0)$ (8.0)$ 12.9$ 31.7$ 56.2$

15 NA & Corporate – 4-Year Financial Projection FY 2023P FY 2024P FY 2025P FY 2026P REVENUE Net Sales, External 262.1$ 273.8$ 295.0$ 320.0$ TOTAL REVENUE 262.1$ 273.8$ 295.0$ 320.0$ COST OF SALES Standard Costs 141.4$ 157.4$ 164.2$ 172.0$ Non-Standard Costs 41.2 23.3 24.3 27.3 TOTAL COST OF SALES 182.6$ 180.7$ 188.5$ 199.3$ GROSS PROFIT 79.6$ 93.1$ 106.5$ 120.6$ % Margin 30.4% 34.0% 36.1% 37.7% SALES, GENERAL & ADMINISTRATIVE EXPENSES TOTAL SALES, GENERAL & ADMINISTRATIVE EXPENSES 108.3$ 107.5$ 109.7$ 114.2$ OPERATING PROFIT (28.7)$ (14.4)$ (3.2)$ 6.5$ % Margin -10.9% -5.3% -1.1% 2.0% Other Non-Operating Expenses 8.3 2.3 2.2 6.0 Net Interest Expense 20.8 14.9 14.6 14.4 Income Taxes 1.4 1.3 2.5 1.4 TOTAL NON-OPERATING Expenses 30.5$ 18.5$ 19.3$ 21.8$ NET INCOME (59.2)$ (32.9)$ (22.4)$ (15.3)$ Depreciation & Amortization 8.5 8.5 8.5 8.5 ADJUSTED EBITDA (20.2)$ (5.9)$ 5.3$ 15.0$ % Margin -7.7% -2.2% 1.8% 4.7%
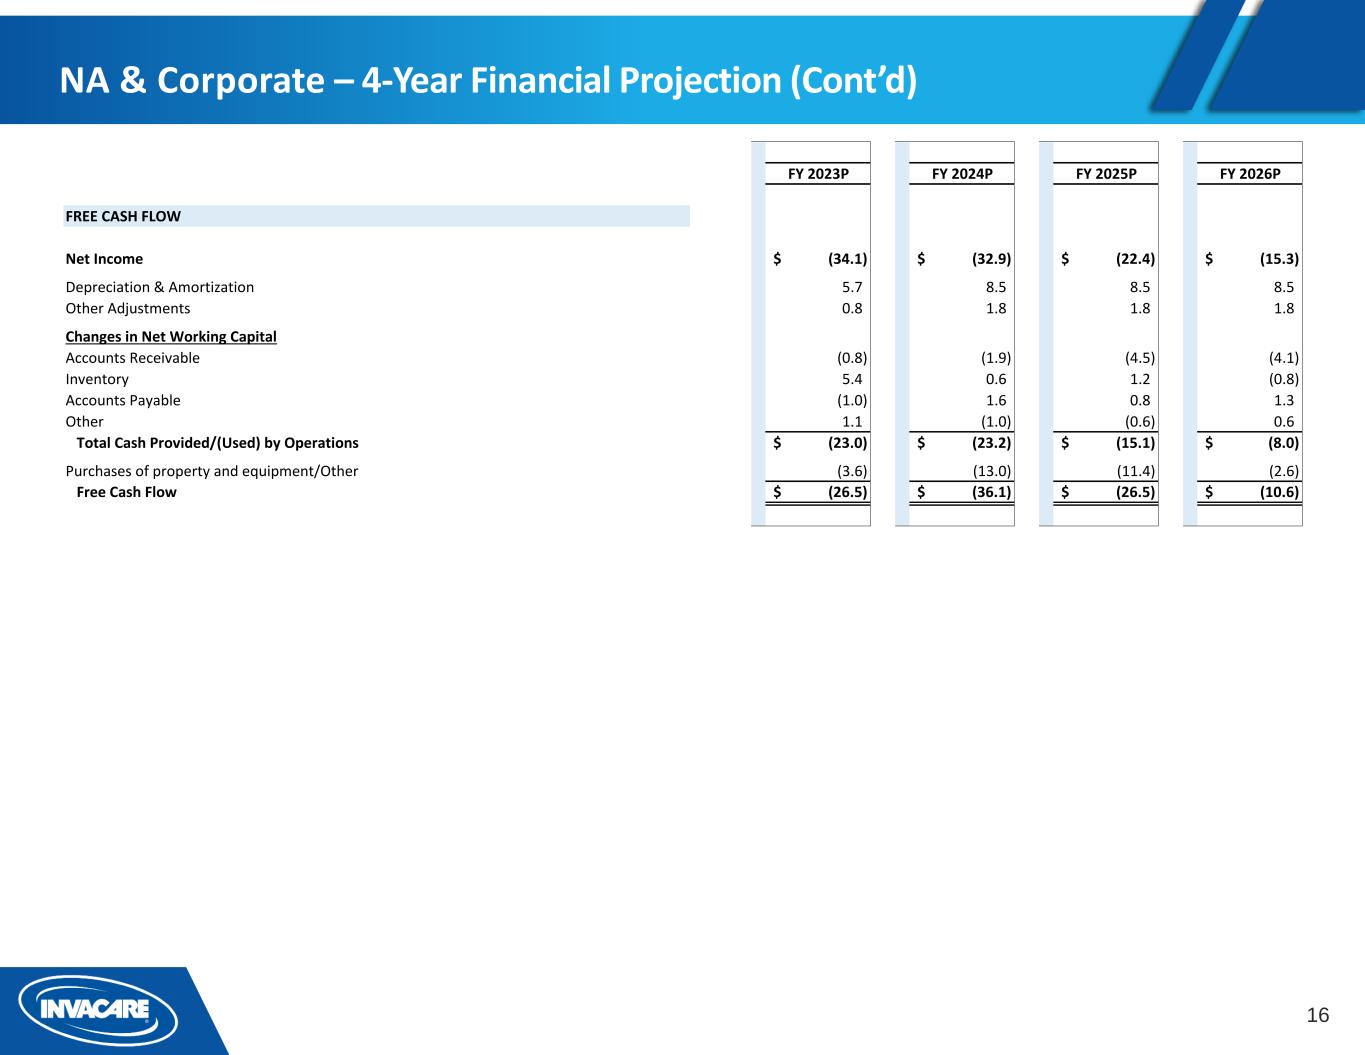
16 NA & Corporate – 4-Year Financial Projection (Cont’d) FY 2023P FY 2024P FY 2025P FY 2026P FREE CASH FLOW Net Income (34.1)$ (32.9)$ (22.4)$ (15.3)$ Depreciation & Amortization 5.7 8.5 8.5 8.5 Other Adjustments 0.8 1.8 1.8 1.8 Changes in Net Working Capital Accounts Receivable (0.8) (1.9) (4.5) (4.1) Inventory 5.4 0.6 1.2 (0.8) Accounts Payable (1.0) 1.6 0.8 1.3 Other 1.1 (1.0) (0.6) 0.6 Total Cash Provided/(Used) by Operations (23.0)$ (23.2)$ (15.1)$ (8.0)$ Purchases of property and equipment/Other (3.6) (13.0) (11.4) (2.6) Free Cash Flow (26.5)$ (36.1)$ (26.5)$ (10.6)$
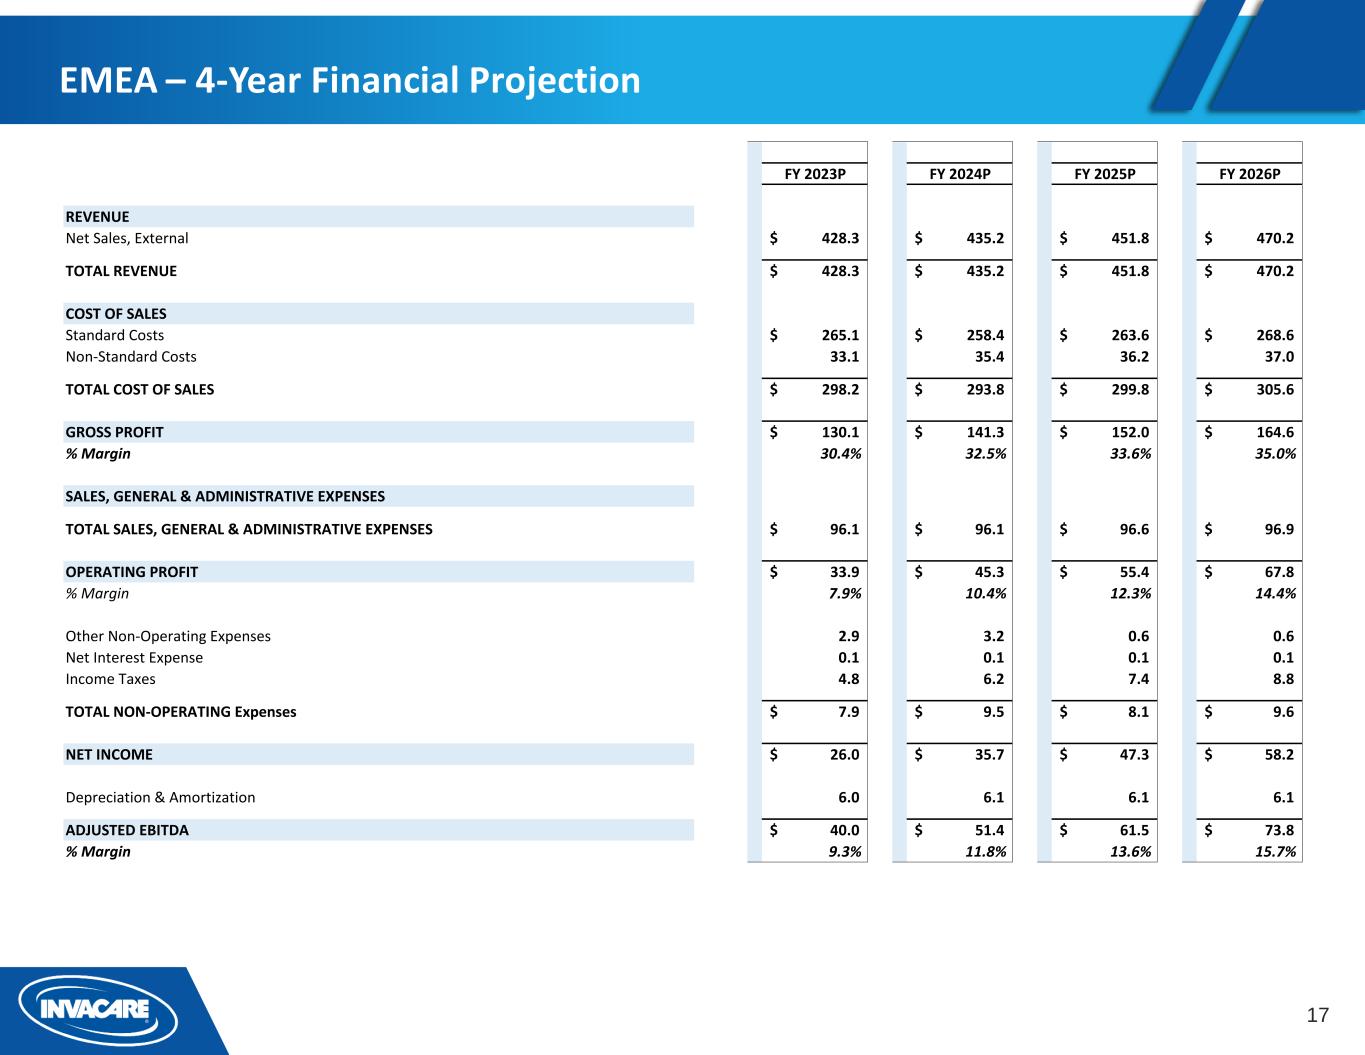
17 EMEA – 4-Year Financial Projection FY 2023P FY 2024P FY 2025P FY 2026P REVENUE Net Sales, External 428.3$ 435.2$ 451.8$ 470.2$ TOTAL REVENUE 428.3$ 435.2$ 451.8$ 470.2$ COST OF SALES Standard Costs 265.1$ 258.4$ 263.6$ 268.6$ Non-Standard Costs 33.1 35.4 36.2 37.0 TOTAL COST OF SALES 298.2$ 293.8$ 299.8$ 305.6$ GROSS PROFIT 130.1$ 141.3$ 152.0$ 164.6$ % Margin 30.4% 32.5% 33.6% 35.0% SALES, GENERAL & ADMINISTRATIVE EXPENSES TOTAL SALES, GENERAL & ADMINISTRATIVE EXPENSES 96.1$ 96.1$ 96.6$ 96.9$ OPERATING PROFIT 33.9$ 45.3$ 55.4$ 67.8$ % Margin 7.9% 10.4% 12.3% 14.4% Other Non-Operating Expenses 2.9 3.2 0.6 0.6 Net Interest Expense 0.1 0.1 0.1 0.1 Income Taxes 4.8 6.2 7.4 8.8 TOTAL NON-OPERATING Expenses 7.9$ 9.5$ 8.1$ 9.6$ NET INCOME 26.0$ 35.7$ 47.3$ 58.2$ Depreciation & Amortization 6.0 6.1 6.1 6.1 ADJUSTED EBITDA 40.0$ 51.4$ 61.5$ 73.8$ % Margin 9.3% 11.8% 13.6% 15.7%
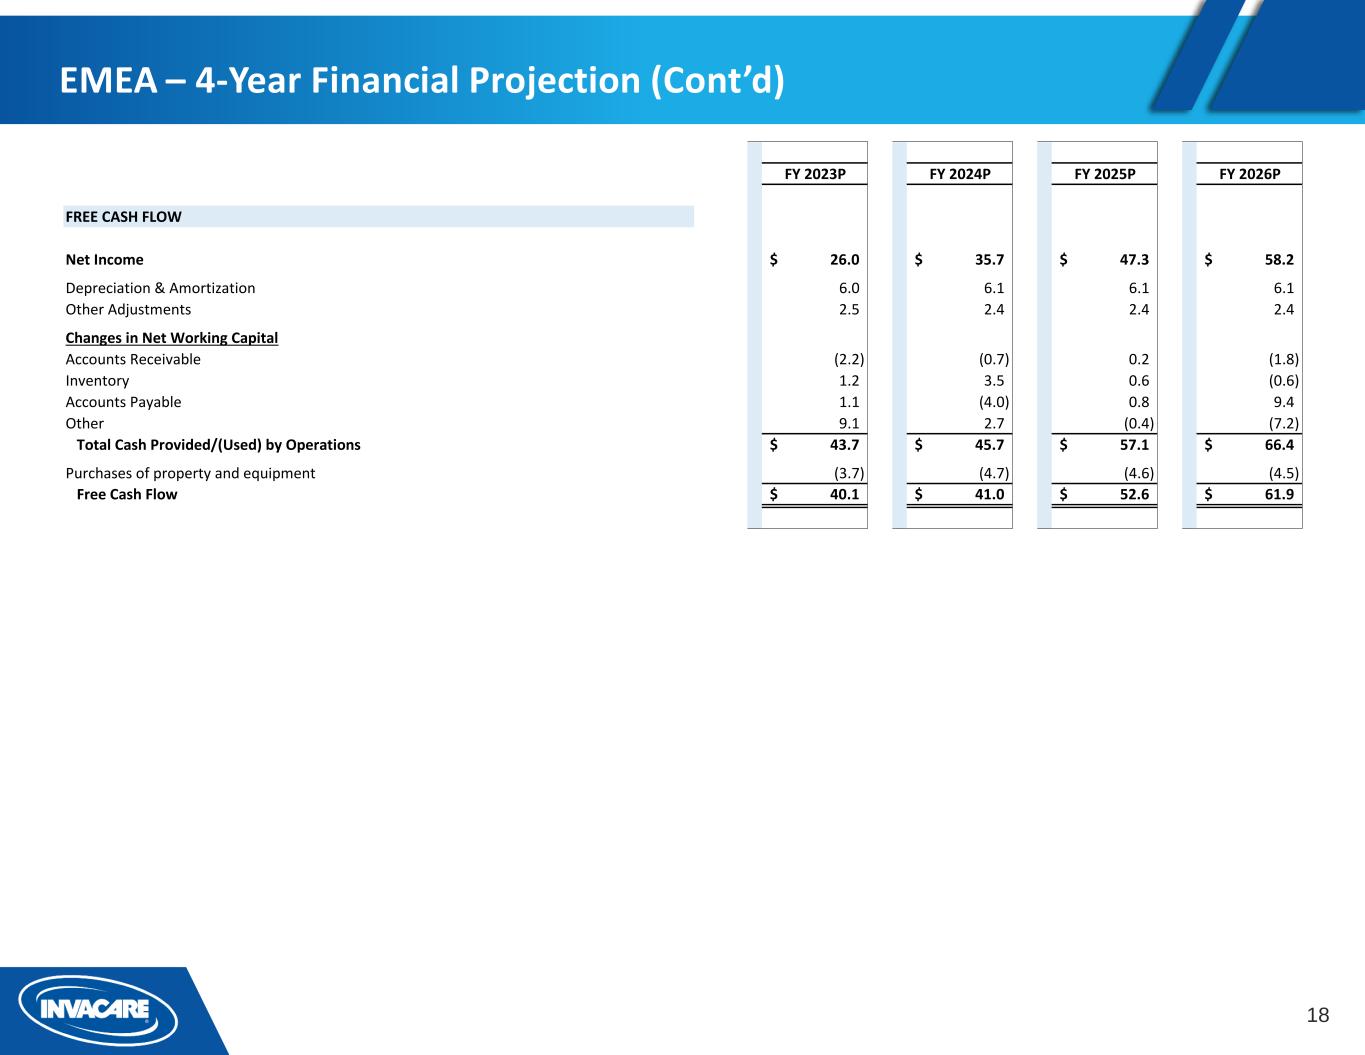
18 EMEA – 4-Year Financial Projection (Cont’d) FY 2023P FY 2024P FY 2025P FY 2026P FREE CASH FLOW Net Income 26.0$ 35.7$ 47.3$ 58.2$ Depreciation & Amortization 6.0 6.1 6.1 6.1 Other Adjustments 2.5 2.4 2.4 2.4 Changes in Net Working Capital Accounts Receivable (2.2) (0.7) 0.2 (1.8) Inventory 1.2 3.5 0.6 (0.6) Accounts Payable 1.1 (4.0) 0.8 9.4 Other 9.1 2.7 (0.4) (7.2) Total Cash Provided/(Used) by Operations 43.7$ 45.7$ 57.1$ 66.4$ Purchases of property and equipment (3.7) (4.7) (4.6) (4.5) Free Cash Flow 40.1$ 41.0$ 52.6$ 61.9$
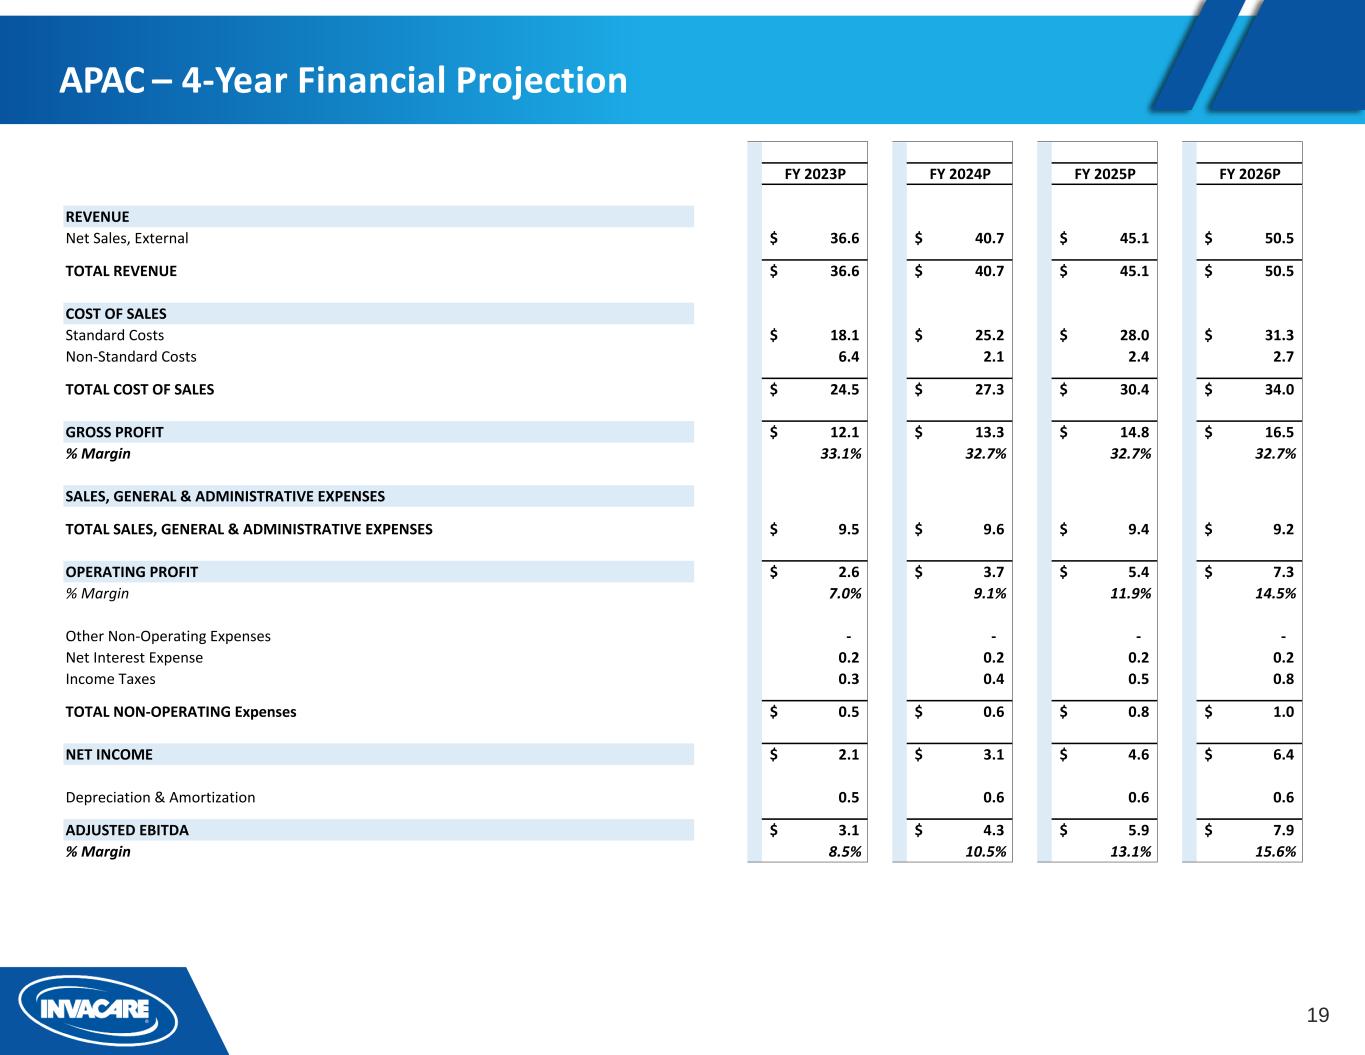
19 APAC – 4-Year Financial Projection FY 2023P FY 2024P FY 2025P FY 2026P REVENUE Net Sales, External 36.6$ 40.7$ 45.1$ 50.5$ TOTAL REVENUE 36.6$ 40.7$ 45.1$ 50.5$ COST OF SALES Standard Costs 18.1$ 25.2$ 28.0$ 31.3$ Non-Standard Costs 6.4 2.1 2.4 2.7 TOTAL COST OF SALES 24.5$ 27.3$ 30.4$ 34.0$ GROSS PROFIT 12.1$ 13.3$ 14.8$ 16.5$ % Margin 33.1% 32.7% 32.7% 32.7% SALES, GENERAL & ADMINISTRATIVE EXPENSES TOTAL SALES, GENERAL & ADMINISTRATIVE EXPENSES 9.5$ 9.6$ 9.4$ 9.2$ OPERATING PROFIT 2.6$ 3.7$ 5.4$ 7.3$ % Margin 7.0% 9.1% 11.9% 14.5% Other Non-Operating Expenses - - - - Net Interest Expense 0.2 0.2 0.2 0.2 Income Taxes 0.3 0.4 0.5 0.8 TOTAL NON-OPERATING Expenses 0.5$ 0.6$ 0.8$ 1.0$ NET INCOME 2.1$ 3.1$ 4.6$ 6.4$ Depreciation & Amortization 0.5 0.6 0.6 0.6 ADJUSTED EBITDA 3.1$ 4.3$ 5.9$ 7.9$ % Margin 8.5% 10.5% 13.1% 15.6%
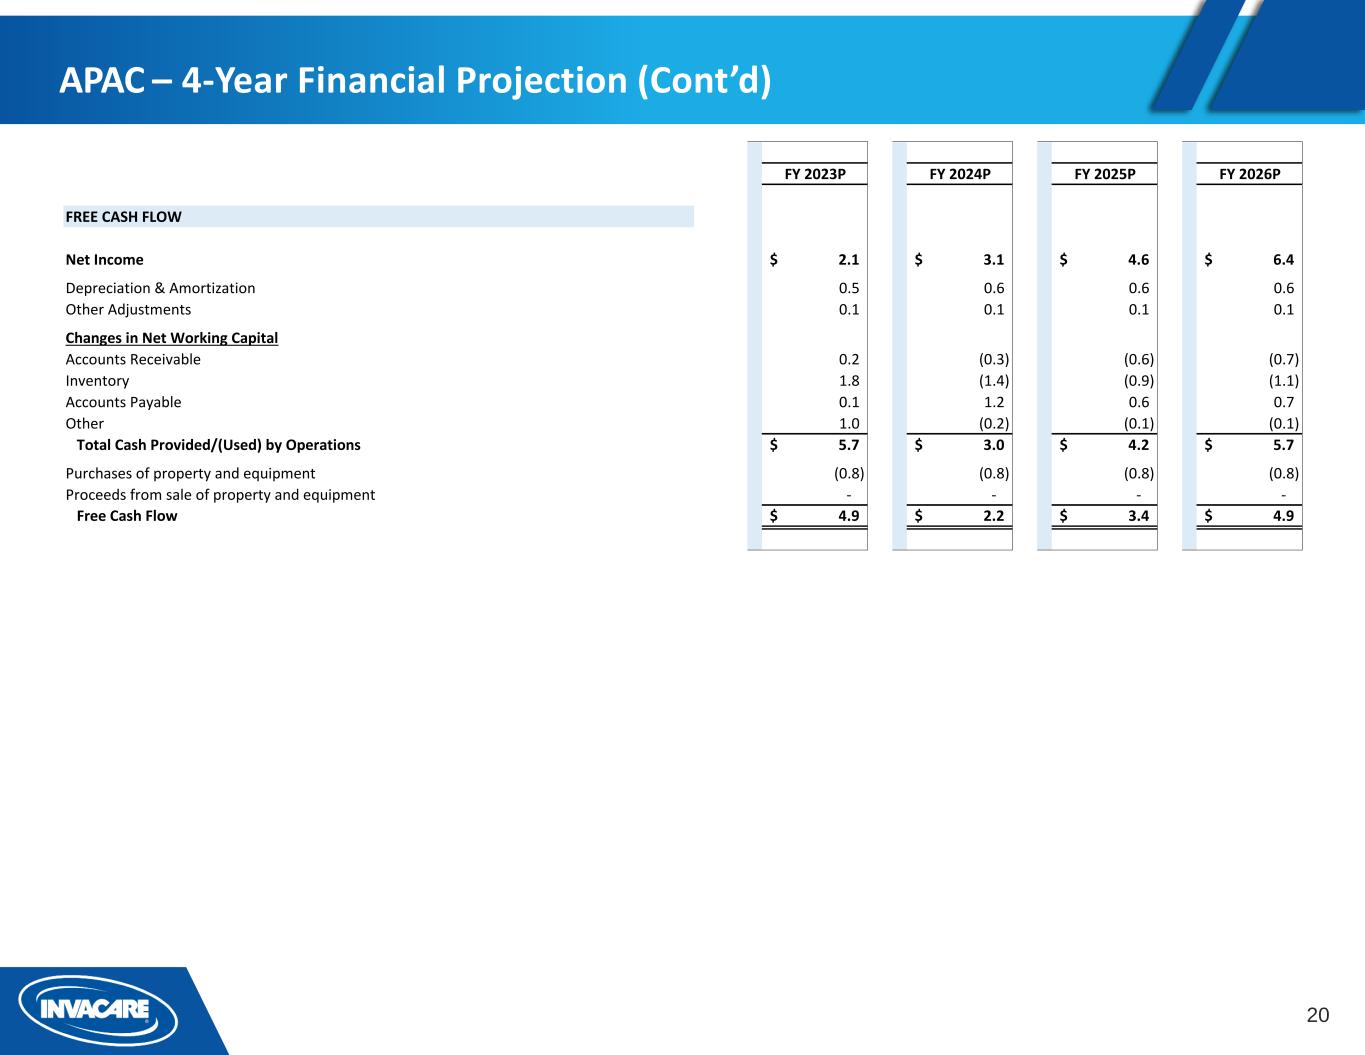
20 APAC – 4-Year Financial Projection (Cont’d) FY 2023P FY 2024P FY 2025P FY 2026P FREE CASH FLOW Net Income 2.1$ 3.1$ 4.6$ 6.4$ Depreciation & Amortization 0.5 0.6 0.6 0.6 Other Adjustments 0.1 0.1 0.1 0.1 Changes in Net Working Capital Accounts Receivable 0.2 (0.3) (0.6) (0.7) Inventory 1.8 (1.4) (0.9) (1.1) Accounts Payable 0.1 1.2 0.6 0.7 Other 1.0 (0.2) (0.1) (0.1) Total Cash Provided/(Used) by Operations 5.7$ 3.0$ 4.2$ 5.7$ Purchases of property and equipment (0.8) (0.8) (0.8) (0.8) Proceeds from sale of property and equipment - - - - Free Cash Flow 4.9$ 2.2$ 3.4$ 4.9$

21


