Exhibit 99.1
Investor Presentation March 2009
Safe Harbor
During the course of this presentation I will be making forward-looking statements (as such term is defined in the Private Securities Litigation Reform Act of 1995) that are based on management’s current expectations, beliefs and assumptions about the industry and markets in which we and our subsidiaries operate. Because such statements include risks and uncertainties, actual results may differ materially from what is expressed and no assurance can be given that the Company will meet its 2009 earnings estimates, successfully execute its growth strategy, or declare or pay future dividends. For information on other factors that could cause actual results to differ materially from expectations, please refer to our December 31, 2008 Annual Report on Form 10-K and other reports filed with the Securities and Exchange Commission. Many of the factors that will determine our future results are beyond our ability to control or predict. Participants should not place undue reliance on forward-looking statements, which reflect our views only as of today. We undertake no obligation to revise or update any forward-looking statements, or to make any other forward-looking statements, whether as a result of new information, future events or otherwise. Important assumptions and other important factors that could cause actual results to differ materially from those set forth in the forward-looking information include a loss of a major customer, compliance with and changes to applicable laws and regulations, access to cost effective transportation services, access to insurance and other financial assurances, loss of key personnel, lawsuits, adverse economic conditions, government funding or competitive pressures, incidents that could limit or suspend specific operations, implementation of new technologies, our ability to perform under required contracts, our willingness or ability to pay dividends and our ability to integrate any potential acquisitions.
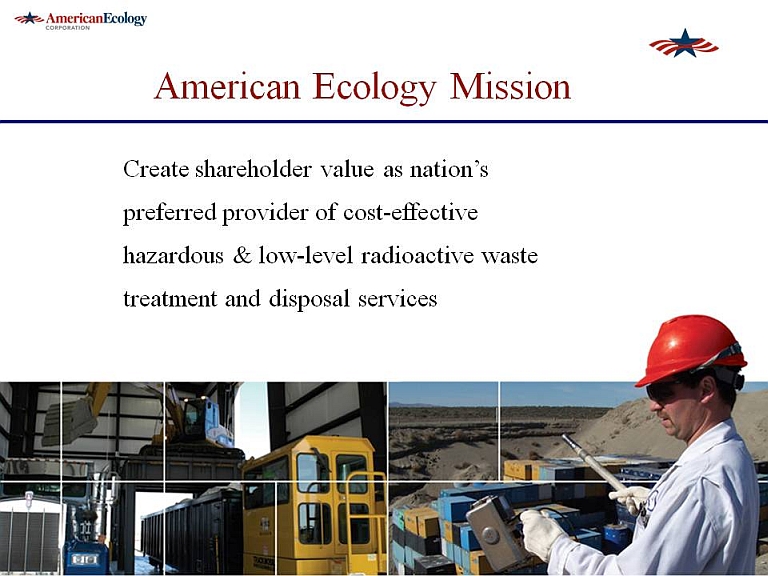
American Ecology Mission Create shareholder value as nation’s preferred provider of cost-effective hazardous & low-level radioactive waste treatment and disposal services
American Ecology History •50+ years industry experience Public since 1983 (previous Teledyne subsidiary) •Strategic changes in 2001–Idaho operation acquired through stock purchase–Industry veteran Steve Romano named senior executive •41% annualized operating income growth since 2001
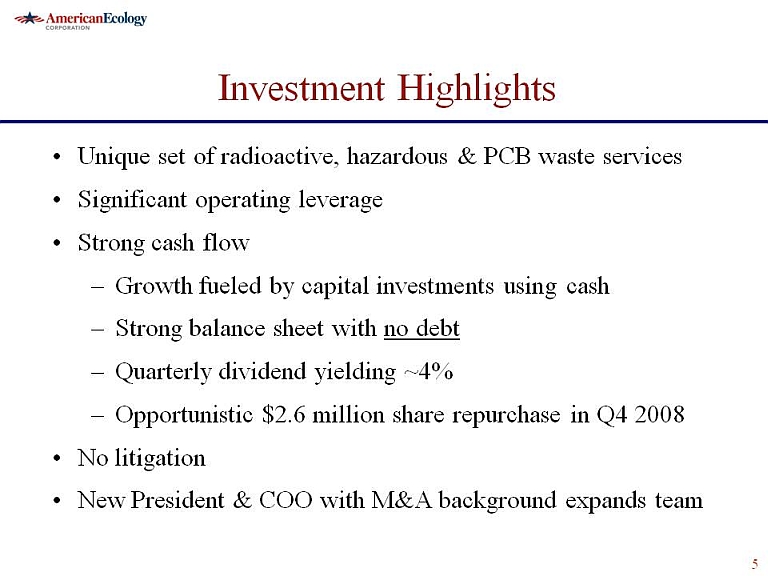
Investment Highlights•Unique set of radioactive, hazardous & PCB waste •Significant operating leverage•Strong cash flow –Growth fueled by capital investments using cash Strong balance sheet with no debt –Quarterly dividend yielding ~4% $2.6 million share repurchase in Q4 2008 •No litigation •New President & COO with M&A background expands team
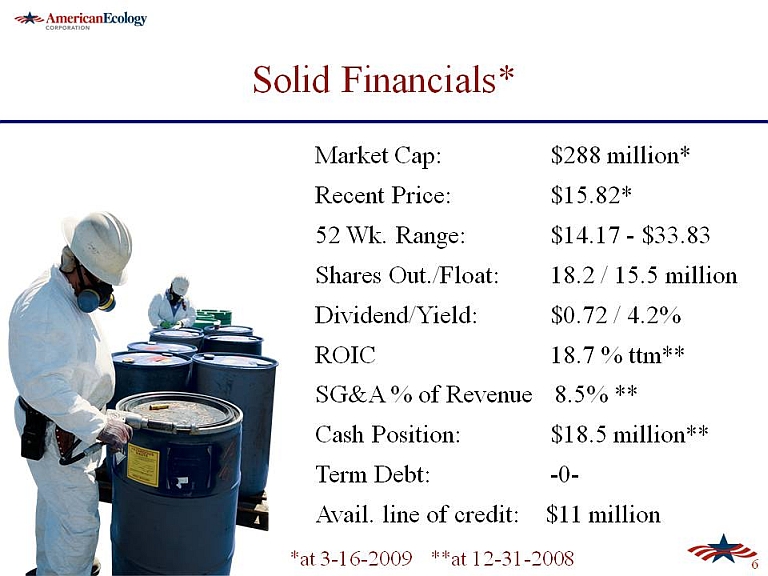
*Solid Financials Market Cap: $288 million* Recent Price: $15.82*52 Wk. Range: $14.17 -$33.83g Shares Out./Float:18.2 / 15.5 million Dividend/Yield:$0.72 / 4.2% ROIC18.7 % ttm**SG&A % of Revenue 8.5% ** Cash Position:$18.5 million**Term Debt:-0- 66Avail. line of credit: $11 million*at 3-16-2009 **at 12-31-2008
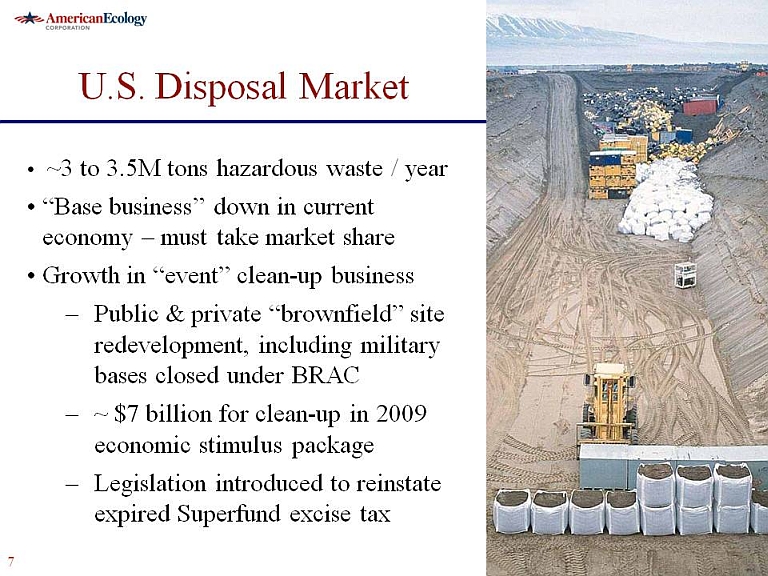
MarketU.S. Disposal Market •~3 to 3.5M tons hazardous waste / year •“Base business” down in current economy –must take market share •Growth in “event” clean-up business–Public & private “brownfield” site redevelopment, including military bases closed under BRAC ~ $7 billion for clean-up in 2009 economic stimulus package Legislation introduced to reinstate expired Superfund excise tax
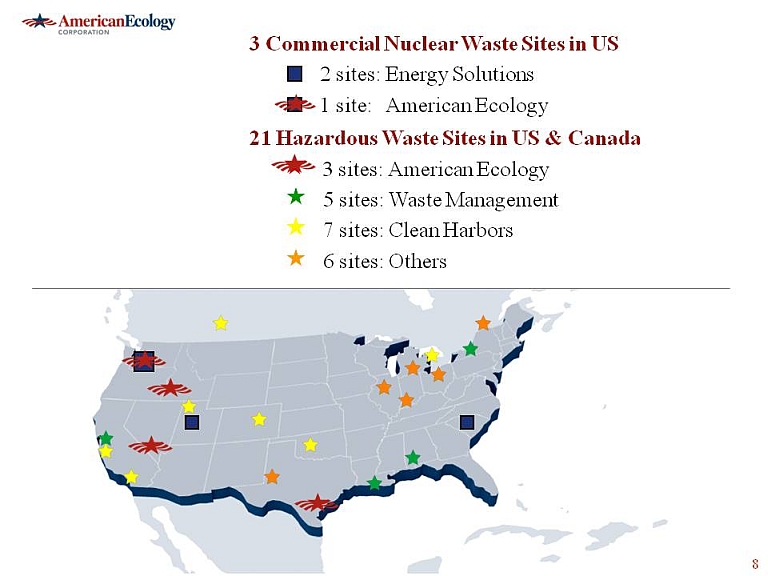
3 Commercial Nuclear Waste Sites in US2 sites: Energy Solutions 1 site: American Ecology21 Hazardous Waste Sites in US & Canada 3 sites: American Ecology 5 sites: Waste Management7 sites: Clean Harbors6 sites: Others
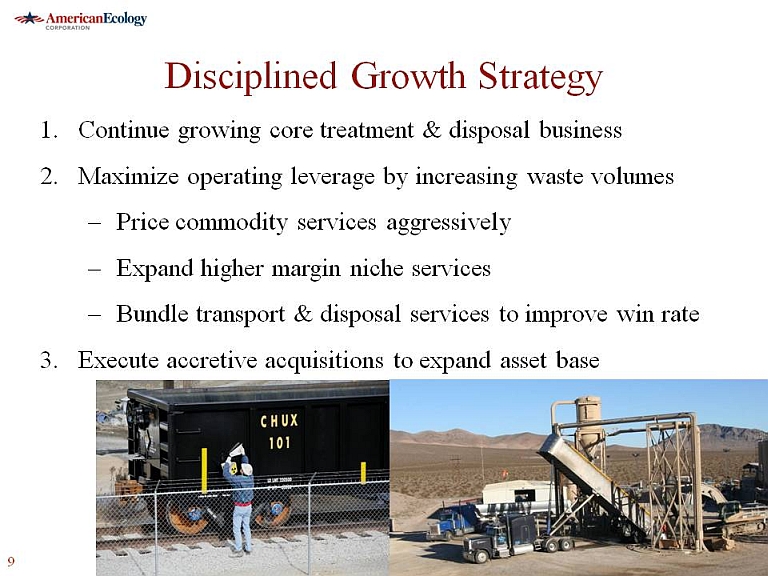
Disciplined Growth Strategy 1.Continue growing core treatment & disposal business 2.Maximize operating leverage by increasing waste volumes–Price commodity services aggressively –Expand higher margin niche services–Bundle transport & disposal services to improve win rate 3.Execute accretive acquisitions to expand asset base
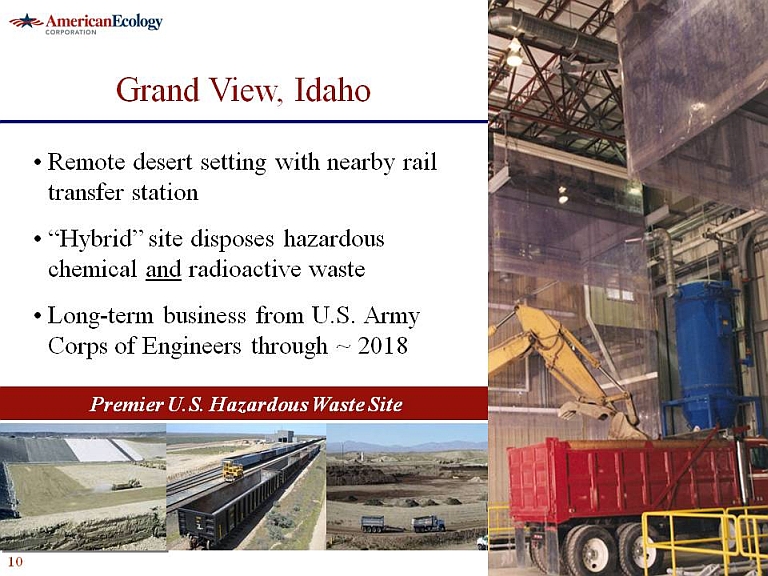
Grand View, Idaho •lRemote desert setting with nearby rail transfer station •“Hybrid” site disposes hazardous chemical and radioactive waste•Long-term business from U.S. Army Corps of Engineers through ~ 2018 Premier U.S. Hazardous Waste Site
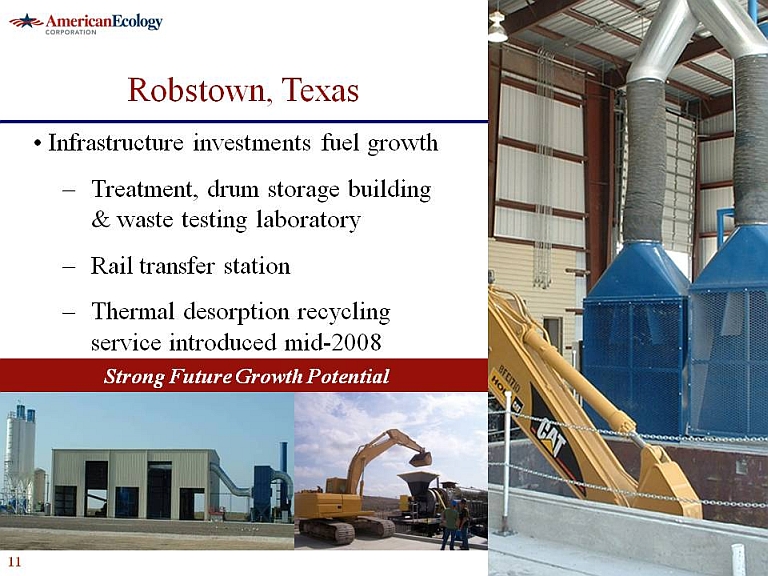
Robstown, Texas •Infrastructure investments fuel growth –Treatment, drum storage building & waste testing laboratory –Rail transfer station –Thermal desorption recycling service introduced mid-2008 Strong Future Growth Potential
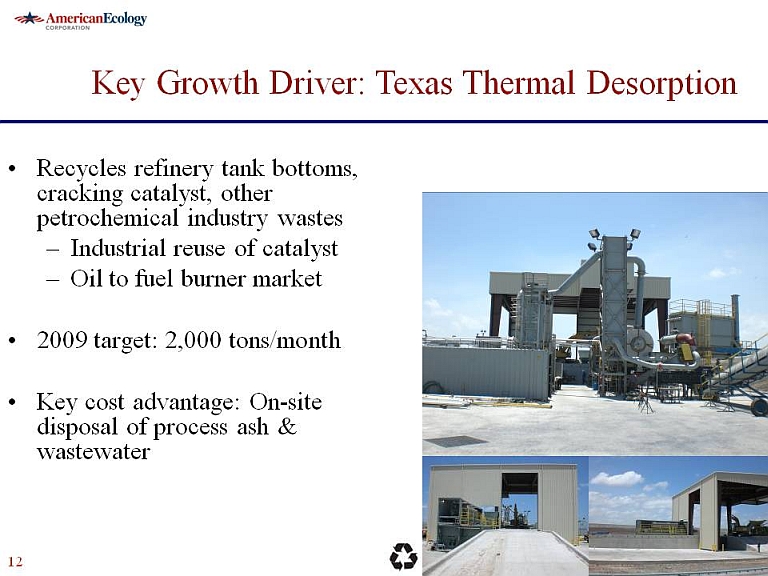
Key Growth Driver: Texas Thermal Desorption Recycles refinery tank bottoms, cracking catalyst, other petrochemical industry wastes Industrial reuse of catalyst–Industrial reuse of catalyst–Oil to fuel burnermarket •2009 target: 2,000 tons/month•Key cost advantage: On-site disposal of process ash & wastewater
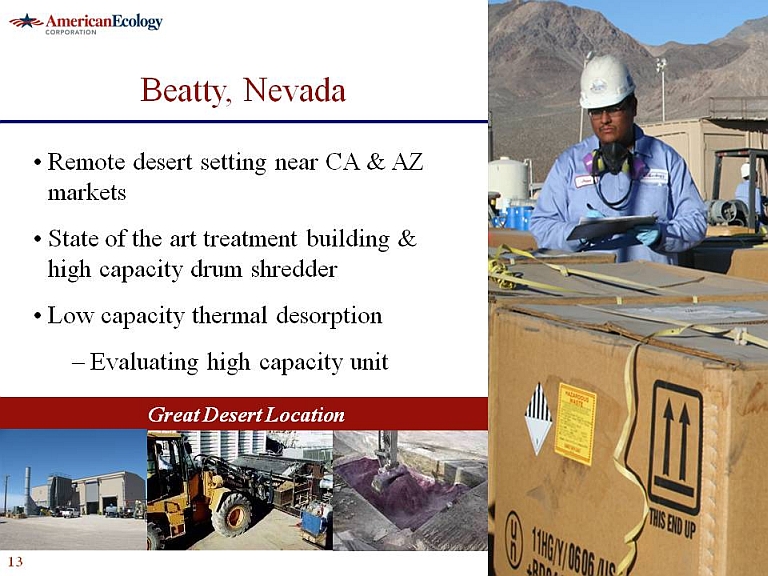
Beatty, Nevada •Remote desert setting near CA&AZ markets •State of the art treatment building & high capacity drum shredder•Low capacity thermal desorption –Evaluating high capacity unit
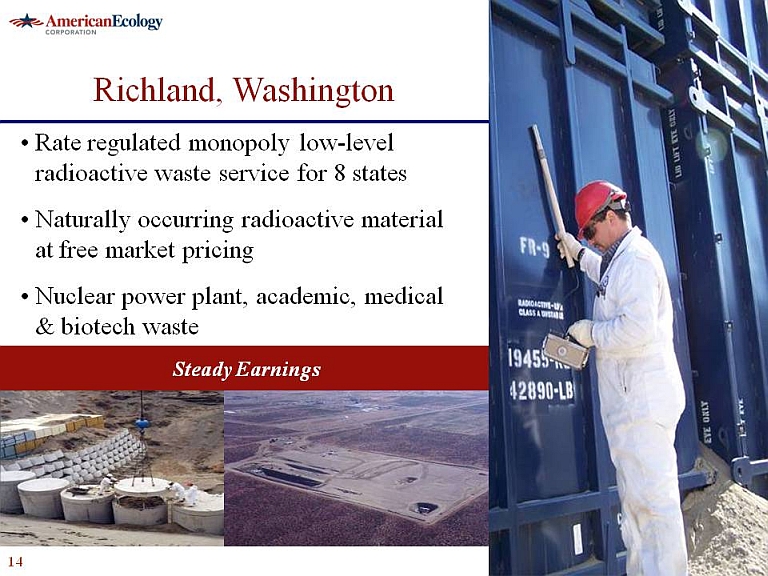
Richland, Washington •Rate regulated monopoly low-level radioactive waste service for 8 states•Naturally occurring radioactive material at free market pricing •Nuclear power plant, academic, medical & biotech waste Steady Earnings
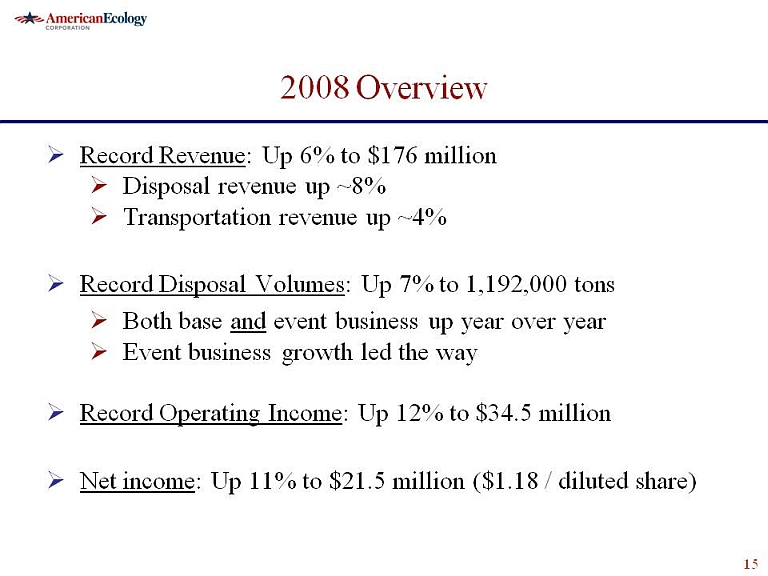
2008 Overview Record Revenue: Up 6% to $176 Disposal revenue up ~8%Transportation revenue up ~4% Record Disposal Volumes: Up 7% to 1,192,000 tons Both base and event business up year over Event business growth led the way Record Income: Up 12% to $34.5 million Net income: Up 11% to $21.5 million ($1.18 / diluted share)
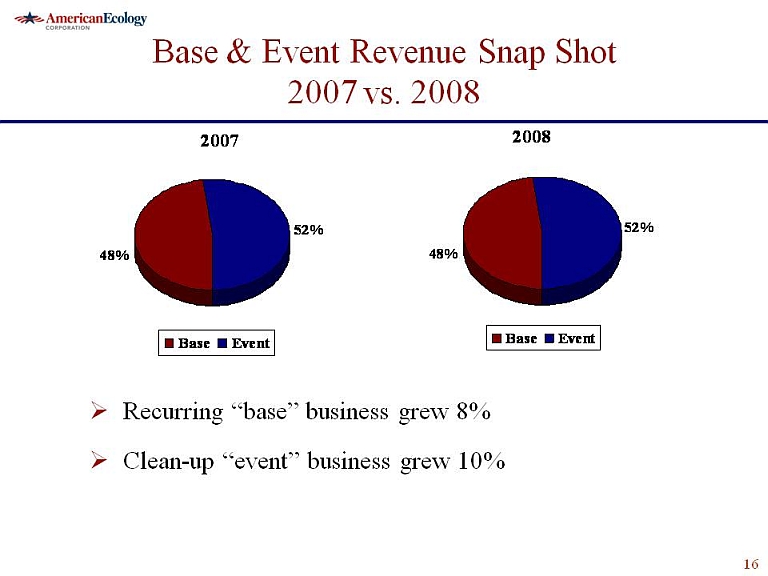
Base & Event Revenue Snap Shot 2007 vs. 2008 Recurring base business grew 8% Clean-up “event” business grew 10%
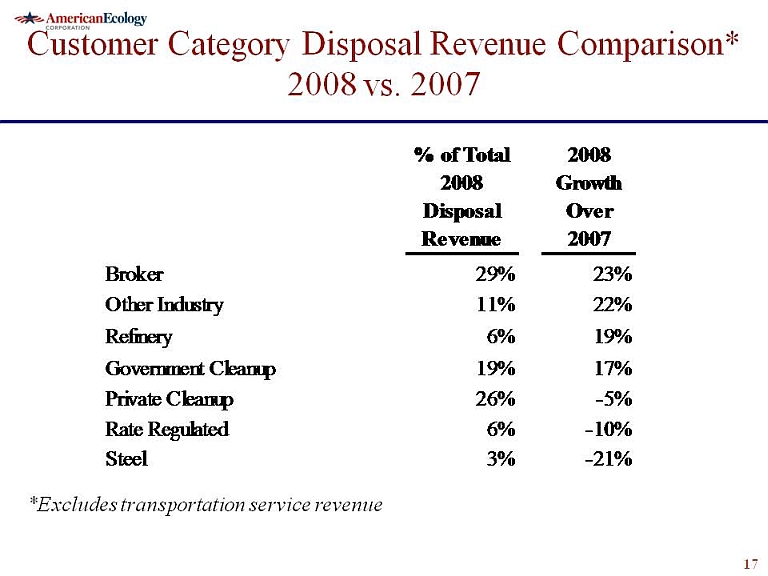
Customer Category Disposal Revenue Comparison*2008 vs. 2007 % of Total 2008 2008 Disposal Revenue Growth Over 2007 Broker29%23%Other Industry11%22% Government Cleanup19%17%Private Cleanup26%-5% Rate Regulated6%-10%Steel3%-21% Refinery 6% 19% 1717*Excludes transportation service revenue
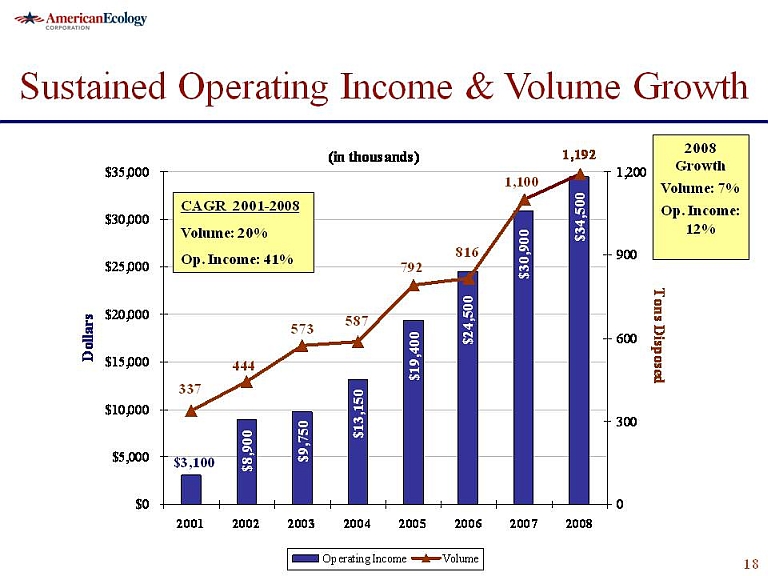
Sustained Operating Income & Volume Growth35,000 30,000, 25,000, 20,000, 15,000, 10,000, 5,000, 2001, 2002, 2003,2004, 2005, 2006, 2007, 2008 0 300 600 900 1,200 (in thousands) 337 444 573 587 792 816 1.100.1.192 2008 Growth Volume: 7% op. Income: 12%
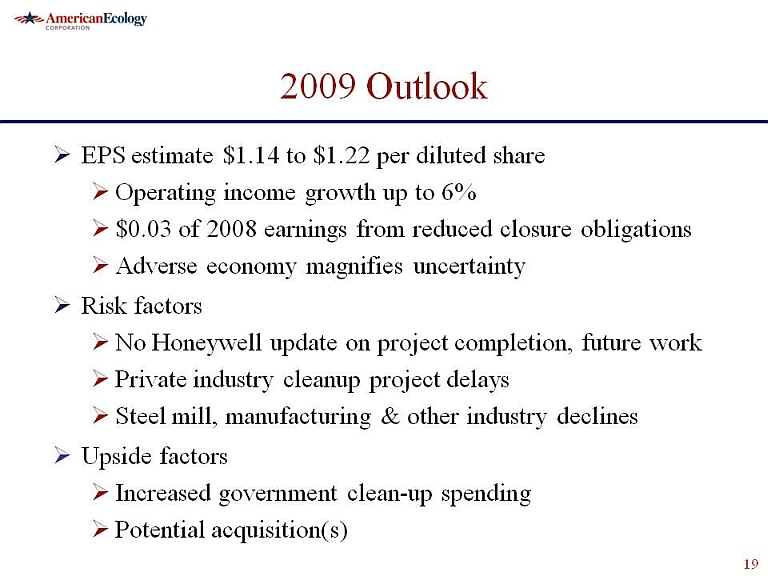
2009 Outlook EPS estimate $1.14 to $1.22 per diluted share Operating income growth up to 6%$0.03 of 2008 earnings from reduced closure obligations Adverse economy magnifies uncertainty Risk factors No Honeywell update on project completion, future work Private industry cleanup project delays mill, manufacturing & other industry declines Upside factors Increased government clean-up spending Potential acquisition(s)
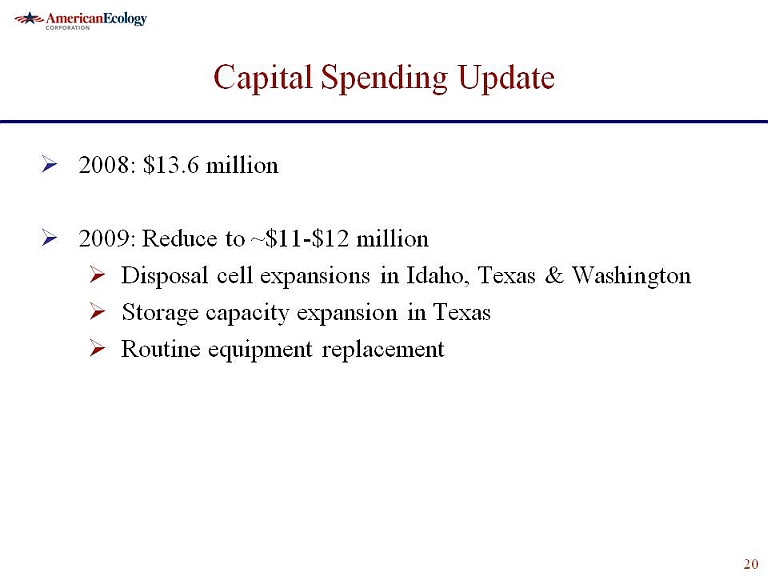
Capital Spending Update 2008: $13.6 million 2009: Reduce to ~$11-$12 million Disposal cell expansions in Idaho, Texas & Washington Storage capacity expansion in Texas Routine equipment replacement
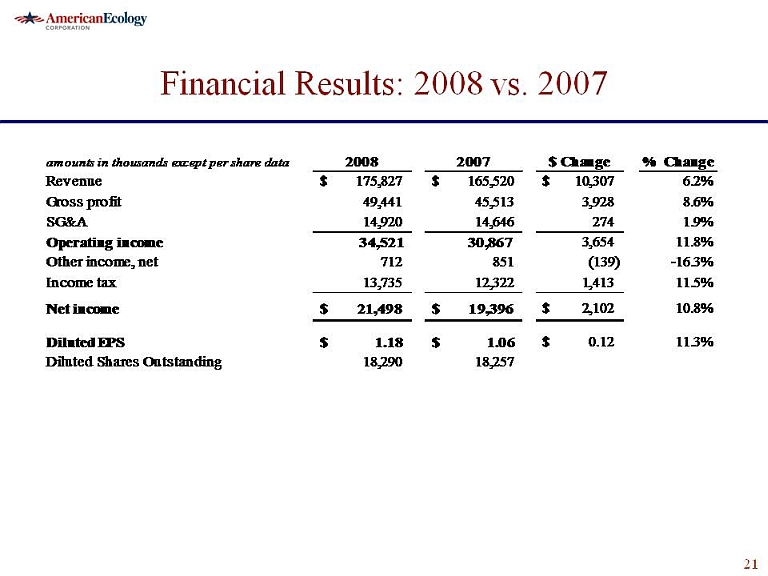
Financial Results: 2008 vs. 2007 amountsinthousandsexceptpersharedata20082007$Change%Changeamounts in thousands except per share data20082007$ Change% Change Revenue $ 175,827 $ 165,520 $ 10,307 6.2%Gross profit 49,441 45,513 3,928 8.6%SG&A 14,920 14,646 274 1.9% Operating income 34,521 30,867 3,654 11.8%Operating income 34,521 30,867 3,654 11.8%Other income, net 712 851 (139)-16.3% Income tax 13,735 12,322 1,413 11.5% Net income $ 21,498 $ 19,396 $ 2,102 10.8% Diluted EPS $ 1.18 $ 1.06 $ 0.12 11.3%Diluted Shares Outstanding 18,290 18,257