Exhibit 99.2

Proposed Acquisition of EQ - The Environmental Quality Company April 7, 2014

Forward - Looking Statements 2 During the course of this presentation the Company will be making forward - looking statements (as such term is defined in the Private Securities Litigation Reform Act of 1995 ) that are based on our current expectations, beliefs and assumptions about the industry and markets in which US Ecology, Inc . and its subsidiaries operate as well as the proposed acquisition of The Environmental Quality Company . Such statements may include, but are not limited to, statements about the Company’s ability to close its proposed acquisition, its ability to raise the capital necessary to complete the transaction, expected synergies from the transaction, projections of the financial results of the combined company and other statements that are not historical facts . Such statements involve known and unknown risks, uncertainties and other factors that could cause the actual results of the Company to differ materially from the results expressed or implied by such statements, including general economic and business conditions, conditions affecting the industries served by US Ecology, The Environmental Quality Company and their respective subsidiaries, conditions affecting our customers and suppliers, competitor responses to our products and services, the overall market acceptance of such products and services, the integration and performance of acquisitions (including the proposed acquisition of The Environmental Quality Company) and other factors disclosed in the Company’s periodic reports filed with the Securities and Exchange Commission . For information on other factors that could cause actual results to differ materially from expectations, please refer to US Ecology, Inc . ’s December 31 , 2013 Annual Report on Form 10 - K and other reports filed with the Securities and Exchange Commission . Many of the factors that will determine the Company’s future results are beyond the ability of management to control or predict . Participants should not place undue reliance on forward - looking statements, which reflect management’s views only as of the date hereof . The Company undertakes no obligation to revise or update any forward - looking statements, or to make any other forward - looking statements, whether as a result of new information, future events or otherwise . Important assumptions and other important factors that could cause actual results to differ materially from those set forth in the forward - looking information include a loss of a major customer or contract, compliance with and changes to applicable laws, rules, or regulations, access to cost effective transportation services, access to insurance, surety bonds and other financial assurances, loss of key personnel, lawsuits, labor disputes, adverse economic conditions, government funding or competitive pressures, incidents or adverse weather conditions that could limit or suspend specific operations, implementation of new technologies, market conditions, average selling prices for recycled materials, our ability to replace business from recently completed large projects, our ability to perform under required contracts, our ability to permit and contract for timely construction of new or expanded disposal cells, our willingness or ability to pay dividends and our ability to effectively close, integrate and realize anticipated synergies from future acquisitions, which can be impacted by the failure of the acquired company to achieve anticipated revenues, earnings or cash flows, assumption of liabilities that exceed our estimates, potential compliance issues, diversion of management’s attention or other resources from our existing business, risks associated with entering product / service areas in which we have limited experience, increases in working capital investment, unexpected capital expenditures, potential losses of key employees and customers of the acquired company and future write - offs of intangible and other assets, including goodwill, if the acquired operations fail to generate sufficient cash flows .
Agenda ▪ Transaction Summary ▪ EQ - The Environmental Quality Company Business Overview ▪ Acquisition Rationale ▪ Financial Review ▪ Q&A 3

Transaction Summary US Ecology , Inc. (“ECOL”) to acquire EQ - The Environmental Quality Company (“EQ”) Transaction expected to close in the second or third quarter of 2014, subject to regulatory approvals and customary closing conditions Total purchase consideration of $465 million To be funded with cash and approximately $415 million of term loan Received commitment from Wells Fargo and Credit Suisse for new credit facility; total commitment includes a $415 million term loan and a $125 million revolving line of credit Low cost financing will enhance accretion to adjusted EPS and returns to stockholders, while maintaining a conservative and flexible capital structure Consideration A Compelling Combination: Broader Geographic Footprint and Greater Array of Services to Drive Value Transaction Financing 4

EQ - The Environmental Quality Company EQ is an Environmental Services Company Providing Essential Hazardous Waste and Industrial & Field Services to a Diverse U.S. Customer Base Overview Provider of cradle - to - grave environmental solutions Two organizational segments: treatment and disposal (T&D), and services One RCRA/TSCA permitted hazardous waste landfill 13 treatment and recycling facilities 21 dedicated service locations and 5 co - located with treatment facilities 1,250+ employees 6,000+ active customer accounts High percentage of recurring base business Strong track record of compliance built over more than five decades Experienced management team Business Mix (FY2013) Revenue Representative Blue - Chip Customers ($ in millions) 5 Treatment & Disposal 71% Services 29% EBITDA T&D 40% Services 60%

Complementary Treatment and Disposal Facility Footprint One RCRA/TSCA permitted landfill 13 treatment and recycling facilities Rail - accessible facilities Overview Treatment and Disposal Services x Industrial and hazardous wastes x Mobile solvent recycling x Organic chemical recycling x Aircraft deicing fluid recycling x Emergency response x Metals recovery and recycling US Ecology Facilities EQ Landfill Treatment and Recycling Facilities (Total: 13 locations) Note: The Company provides multiple services at certain locations 6

Industrial and Field Services Broaden Customer Solutions Industrial Services: Comprehensive suite of maintenance and cleaning, tank & oil processing and sewer services Field Services: Turnkey environmental solutions, including remediation, transfer and processing, less than truckload (LTL) and retail services Overview Industrial and Field Services x Industrial cleaning and maintenance x Waste transportation x In - plant services x Retail services x Remediation x Emergency response x Waste management x Household hazardous waste 7 Note: The Company provides multiple services at certain locations and the Company co - locates services at certain of its treatment facilities. Services Facilities • 21 Dedicated Facilities • 5 Co - Located Service Sites
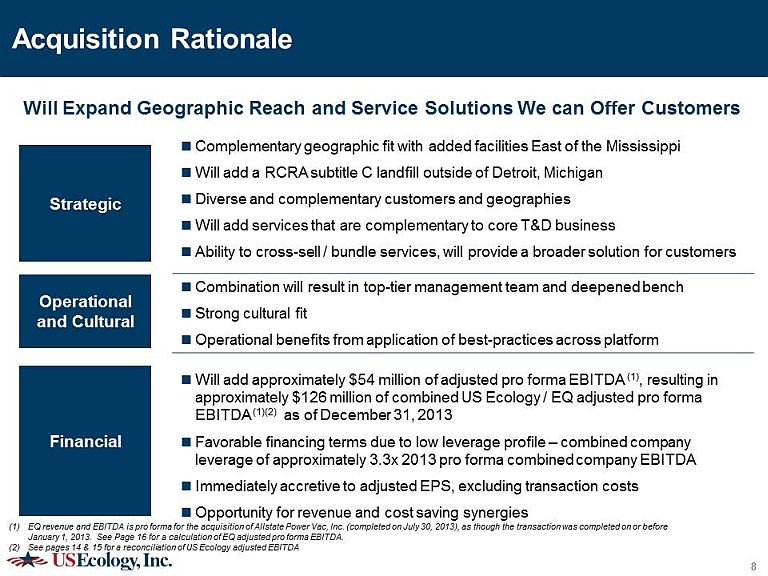
Acquisition Rationale Complementary geographic fit with added facilities East of the Mississippi Will add a RCRA subtitle C landfill outside of Detroit, Michigan Diverse and complementary customers and geographies Will add services that are complementary to core T&D business Ability to cross - sell / bundle services, will provide a broader solution for customers Combination will result in top - tier management team and deepened bench Strong cultural fit Operational benefits from application of best - practices across platform Will add approximately $54 million of adjusted pro forma EBITDA (1) , resulting in approximately $126 million of combined US Ecology / EQ adjusted pro forma EBITDA (1)(2) as of December 31, 2013 Favorable financing terms due to low leverage profile – combined company leverage of approximately 3.3x 2013 pro forma combined company EBITDA Immediately accretive to adjusted EPS, excluding transaction costs Opportunity for revenue and cost saving synergies Operational and Cultural Strategic Financial 8 Will Expand Geographic Reach and Service Solutions W e can Offer Customers (1) EQ revenue and EBITDA is pro forma for the acquisition of Allstate Power Vac , I nc. (completed on July 30, 2013), as though the transaction was completed on or before January 1, 2013. See Page 16 for a calculation of EQ adjusted pro forma EBITDA. (2) See pages 14 & 15 for a reconciliation of US Ecology adjusted EBITDA

Executing on Acquisition Strategy Alignment with our core strategic vision Opportunity to expand our customer base and service offering Cultural fit Acquisition Approach & Criteria EQ Ability to improve our competitive positioning Financial returns x Longstanding relationships with a diverse customer base x Exceptional regulatory compliance track record x Recurring base revenue with upside from events x Will add back - end treatment and disposal assets complementary with existing geographies x Will provide access to a complementary set of services and capabilities x Serves over 6,000 active customers, ranging from Fortune 1,000 to small public and private companies x Committed to compliance and health & safety x Knowledge of the industry and end markets x Results - oriented management team x Will position ECOL to better service the Midwest and Eastern U.S. x Will increase diversity of service offering, improving ability to serve as a total solutions provider x Will improve revenue and EBITDA growth prospects x Cross - selling opportunities and integration will create potential for synergies 9
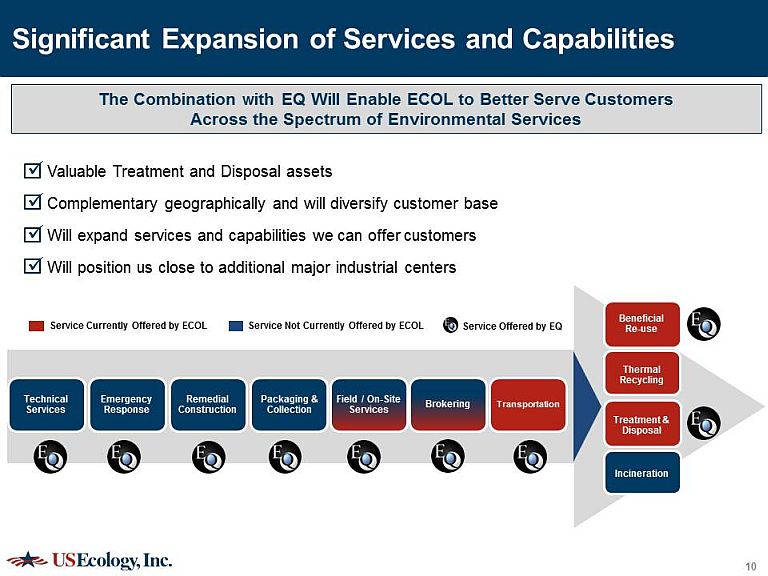
Significant Expansion of Services and Capabilities x Valuable Treatment and Disposal assets x Complementary geographically and will diversify customer base x Will expand services and capabilities we can offer customers x Will position us close to additional major industrial centers The Combination with EQ Will Enable ECOL to Better Serve Customers Across the Spectrum of Environmental Services Service Offered by EQ High Technical Services Emergency Response Remedial Construction Packaging & Collection Brokering Transportation Beneficial Re - use Thermal Recycling Incineration Treatment & Disposal Service Currently Offered by ECOL Service Not Currently Offered by ECOL Field / On - Site Services 10

Increased Diversification of Business Model Industrial Services 2013 Revenue: $95.4 % of Total Revenue: 25.0% 2013 EBITDA: $9.7 million % of Total 2013 EBITDA: 17.6% Treatment & Disposal 2013 Revenue: $149.1 % of Total Revenue: 39.6% 2013 EBITDA: $40.2 % of Total 2013 EBITDA: 72.5% Field Services 2013 Revenue: $131.8 million % of Total Revenue: 35.0% 2013 EBITDA: $5.4 million % of Total 2013 EBITDA: 9.9% 2013 Revenue 2013 Revenue: $201m 2013 Pro Forma Revenue: $577m 11 (1) EQ revenue and EBITDA is pro forma for the acquisition of Allstate Power Vac , I nc. (completed on July 30, 2013), as though the transaction was completed on or before January 1, 2013. See Page 16 for a calculation of EQ adjusted pro f orma EBITDA. (2) See pages 14 - 15 for a reconciliation of US Ecology adjusted EBITDA 2013 EBITDA 2013 Revenue: $376m 2013 EBITDA: $71m 2013 EBITDA: $54m US Ecology EQ Pro Forma (1) US Ecology (2) EQ Pro Forma (1) Services 46% T&D 54% 2013 Pro Forma EBITDA: $126m Services (Transport.) 18% T&D 54% Services 46% Services 29% T&D 100 % T&D 88% Services 12% T&D 71% T&D 82% T&D 40% Services 60%

A Financially Compelling Transaction US Ecology EQ (1)(2) Pro Forma Combined Company 2013 Revenue $201 million $376 million $577 million 2013 Adj. EBITDA $71 million (3) $54 million (4) $126 million Leverage -- N/A 3.3x Locations / Customers 6 / 1,000+ 35 / 6,000+ 41 / 7,000+ Immediately accretive to Adjusted Pro Forma EPS Opportunity for cross - selling and cost synergies over time Updated guidance will be provided at a later date 12 (1) Financial information for EQ is pro forma for the acquisition of Allstate Power Vac , I nc. (completed on July 30, 2013), as though the transaction was completed on or before January 1, 2013 (2) Financial information for EQ is adjusted for certain one - time or non - recurring expenses, in order to reflect the Company’s ongoi ng earnings generating capacity (3) See reconciliation of adjusted EBITDA for US Ecology on pages 14 & 15 of this presentation (4) See calculation of EQ adjusted pro forma EBITDA on page 16 of this presentation Will Create a Platform of Greater Size and Scale with an Enhanced Position in the Industry to Better Serve Customers

Highly Favorable Terms Low leverage profile supported by strong cash flow to effectively service debt Total new debt of approximately $415 million at rates of LIBOR plus [X] 13 Q & A

US Ecology Adjusted EBITDA Reconciliation 14 US Ecology reports adjusted EBITDA which is a non - GAAP financial measures, as a complement to results provided in accordance with generally accepted accounting principles in the United States (GAAP) and believes that such information provides analysts, shareholders, and other users information to better understand the Company’s operating performance. Because adjusted EBITDA is not a measurement determined in accordance with GAAP and is thus susceptible to varying calculations it may not be comparable to similar measures used by other companies. Items excluded from adjusted EBITDA are significant components in understanding and assessing financial performance. Adjusted EBITDA should not be considered in isolation or as an alternative to, or substitute for, net income, cash flows generated by operations, investing or financing activities, or other financial statement data presented in the consolidated financial statements as indicators of financial performance or liquidity. Adjusted EBITDA has limitations as an analytical tool and should not be considered in isolation or a substitute for analyzing our results as reported under GAAP. Some of the limitations are: • Adjusted EBITDA does not reflect changes in, or cash requirements for, our working capital needs; • Adjusted EBITDA does not reflect our interest expense, or the requirements necessary to service interest or principal payments on our debt; • Adjusted EBITDA does not reflect our income tax expenses or the cash requirements to pay our taxes; • Adjusted EBITDA does not reflect our cash expenditures or future requirements for capital expenditures or contractual commitments; and • although depreciation and amortization charges are non - cash charges, the assets being depreciated and amortized will often have to be replaced in the future, and Adjusted EBITDA does not reflect cash requirements for such replacements.
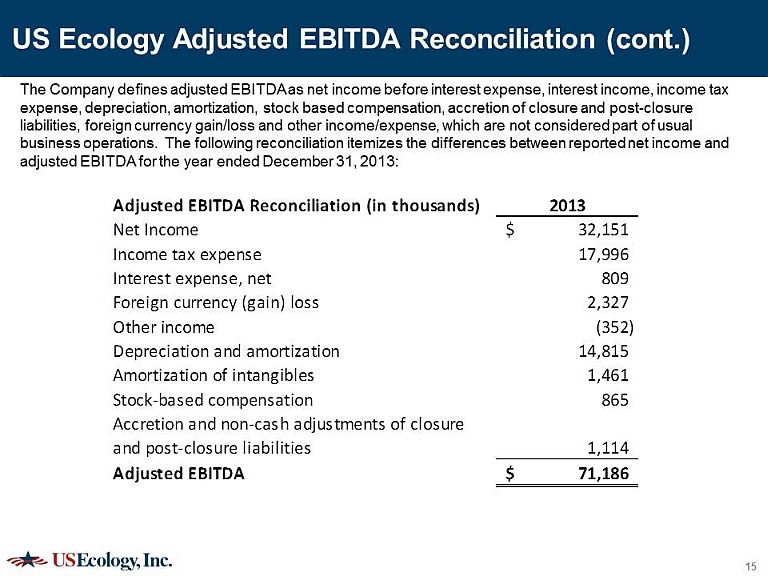
US Ecology Adjusted EBITDA Reconciliation (cont.) 15 The Company defines adjusted EBITDA as net income before interest expense, interest income, income tax expense, depreciation, amortization, stock based compensation, accretion of closure and post - closure liabilities, foreign currency gain/loss and other income/expense, which are not considered part of usual business operations. The following reconciliation itemizes the differences between reported net income and adjusted EBITDA for the year ended December 31, 2013: Adjusted EBITDA Reconciliation (in thousands) 2013 Net Income 32,151$ Income tax expense 17,996 Interest expense, net 809 Foreign currency (gain) loss 2,327 Other income (352) Depreciation and amortization 14,815 Amortization of intangibles 1,461 Stock-based compensation 865 Accretion and non-cash adjustments of closure and post-closure liabilities 1,114 Adjusted EBITDA 71,186$

EQ Adjusted Pro Forma EBITDA Calculation 16 The following table presents the calculation of adjusted pro forma EBITDA for EQ for the year ended December 31, 2013: EQ Adjusted Pro Forma EBITDA Reconciliation (in thousands) 2013 Net Income 2,997$ Income tax expense 3,334 Interest expense 4,619 Depreciation expense 12,781 Amortization - intangible assets 13,304 Accretion expense 1,674 Allstate pro forma adjustments 6,210 Allstate acquisition and financing Fees 3,648 Cash payments and losses on defined remediation project 693 Related party loss on sale of wetland 1,353 Incurred expenses related to sale process 1,080 Share-based compensation 790 Private equity sponsor management fees 775 Other 1,061 EQ - Adjusted Pro Forma EBITDA 54,319$