Exhibit 99
Exhibit 99
RPC, Inc. Corporate Overview and Q1 2019 Update 2 Forward - Looking Statement Disclosure Certain statements and information included in this presentation constitute "forward - looking statements" within the meaning of the Private Securities Litigation Reform Act of 1995, including all statements that look forward in time or express management’s beliefs, expectations or hopes. In particular, such statements include, without limitation, that we are pleased with our prospects for the immediate future, and that we have indications of strong customer activity through the beginning of 2018. These statements involve known and unknown risks, uncertainties and other factors which may cause the actual results, performance or achievements of RPC to be materially different from any future results, performance or achievements expressed or implied in such forward - looking statements. Additional discussion of factors that could cause the actual results to differ materially from management's projections, forecasts, estimates and expectations is contained in RPC's Form 10 - K filed with the Securities and Exchange Commission for the year ended December 31, 2018. RPC has used the non - GAAP financial measure of Earnings Before Interest, Taxes, Depreciation and Amortization (EBITDA) in this presentation. EBITDA should not be considered in isolation or as a substitute for operating income, net income or other performance measures prepared in accordance with GAAP. RPC uses EBITDA as a measure of operating performance because it allows us to compare performance consistently over various periods without regard to changes in our capital structure. A non - GAAP financial measure is a numerical measure of financial performance, financial position, or cash flows that either 1) excludes amounts, or is subject to adjustments that have the effect of excluding amounts, that are included in the most directly comparable measure calculated and presented in accordance with GAAP in the statement of operations, balance sheet or statement of cash flows, or 2) includes amounts, or is subject to adjustments that have the effect of including amounts, that are excluded from the most directly comparable measure so calculated and presented. Set forth in Appendix A is a reconciliation of EBITDA with Net Income, the most comparable GAAP measure. This reconciliation also appears on RPC's investor website, which can be found on the Internet at www.rpc.net .. 2
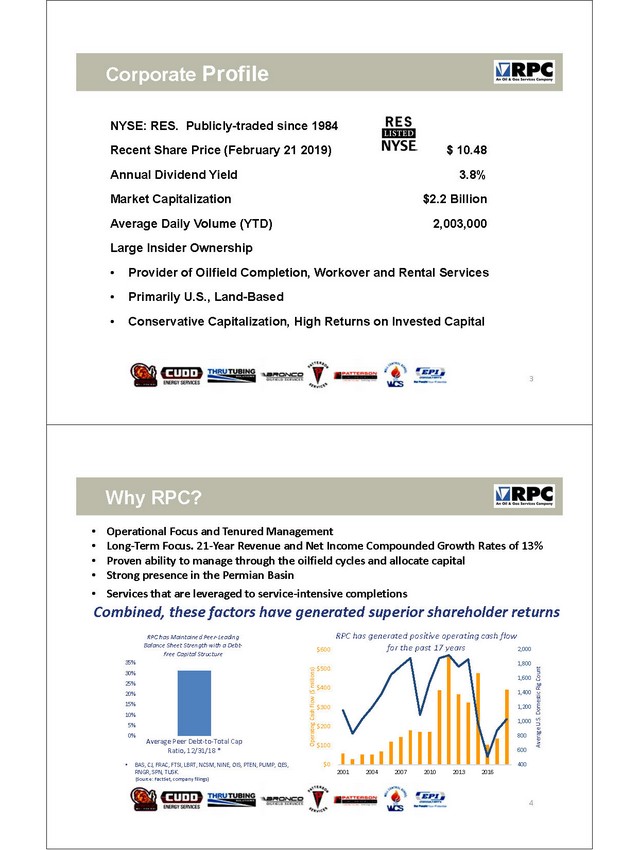
3 Corporate Profile NYSE: RES. Publicly - traded since 1984 Recent Share Price (February 21 2019) $ 10.48 Annual Dividend Yield 3.8% Market Capitalization $2.2 B illion Average Daily Volume (YTD) 2,003,000 Large Insider Ownership • Provider of Oilfield Completion, Workover and Rental Services • Primarily U.S., Land - Based • Conservative Capitalization, High Returns on Invested Capital 3 4 Why RPC? 4 400 600 800 1,000 1,200 1,400 1,600 1,800 2,000 $0 $100 $200 $300 $400 $500 $600 2001 2004 2007 2010 2013 2016 Average U.S. Domestic Rig Count Operating Cash Flow ($ millions) RPC has generated positive operating cash flow for the past 17 years 0% 5% 10% 15% 20% 25% 30% 35% Average Peer Debt - to - Total Cap Ratio, 12/31/18 * RPC has Maintained Peer - Leading Balance Sheet Strength with a Debt - Free Capital Structure • BAS, CJ, FRAC, FTSI, LBRT, NCSM, NINE, OIS, PTEN, PUMP, QES, RNGR, SPN, TUSK. (Source: FactSet , company filings) • O perational Focus and Tenured Management • Long - Term Focus. 21 - Year Revenue and Net Income Compounded G rowth R ates of 13% • Proven ability to manage through the oilfield cycles and allocate capital • Strong presence in the Permian Basin • Services that are leveraged to service - intensive completions Combined, these factors have generated superior shareholder returns
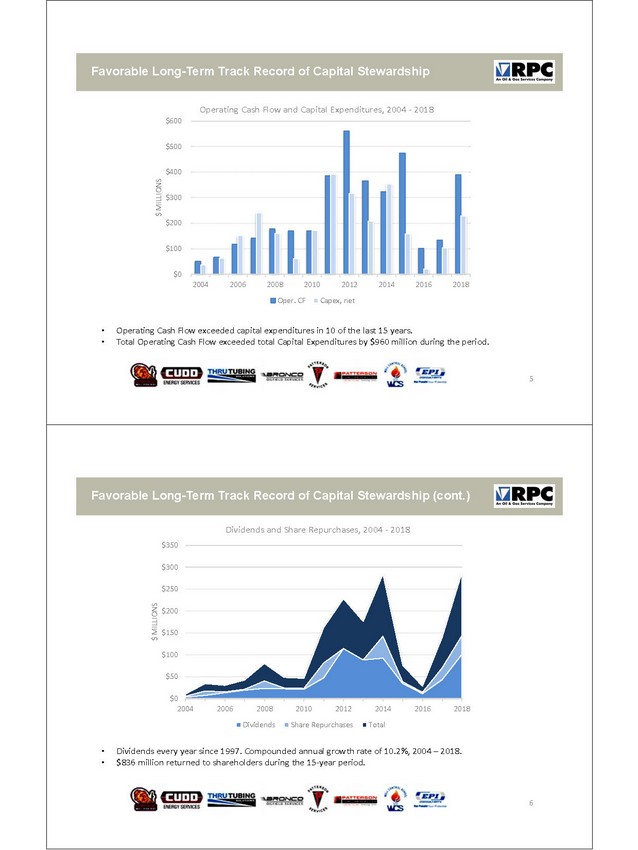
5 Favorable Long - Term Track Record of Capital Stewardship 5 $0 $100 $200 $300 $400 $500 $600 2004 2006 2008 2010 2012 2014 2016 2018 $ MILLIONS Operating Cash Flow and Capital Expenditures, 2004 - 2018 Oper. CF Capex, net • Operating Cash Flow exceeded capital expenditures in 10 of the last 15 years. • Total Operating Cash Flow exceeded total Capital Expenditures by $960 million during the period. 6 Favorable Long - Term Track Record of Capital Stewardship (cont.) 6 $0 $50 $100 $150 $200 $250 $300 $350 2004 2006 2008 2010 2012 2014 2016 2018 $ MILLIONS Dividends and Share Repurchases, 2004 - 2018 Dividends Share Repurchases Total • Dividends every year since 1997. Compounded annual growth rate of 10.2%, 2004 – 2018. • $836 million returned to shareholders during the 15 - year period.
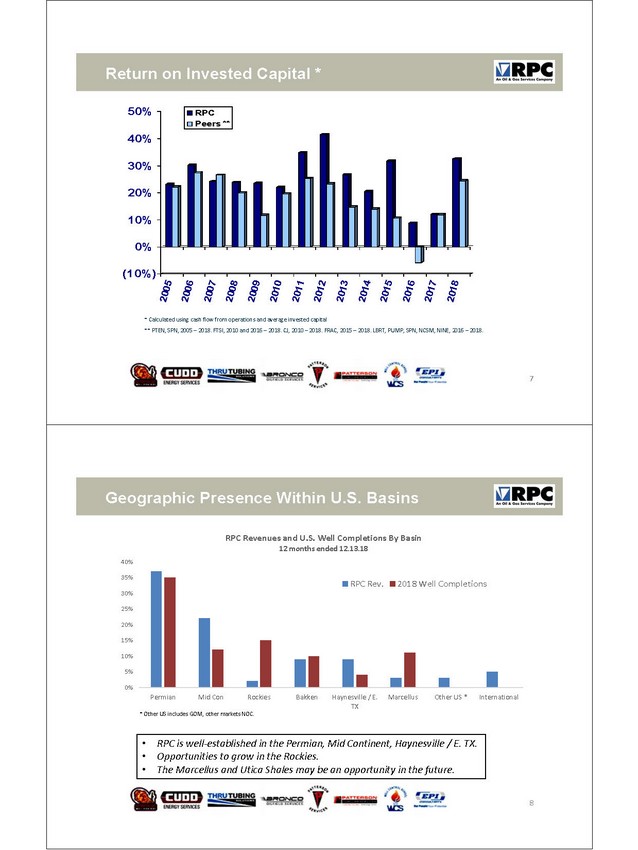
7 Return on Invested Capital * 7 (10%) 0% 10% 20% 30% 40% 50% 20052006200720082009201020112012201320142015201620172018 RPC Peers ** * Calculated using cash flow from operations and average invested capital ** PTEN, SPN, 2005 – 2018. FTSI, 2010 and 2016 – 2018. CJ, 2010 – 2018. FRAC, 2015 – 2018. LBRT, PUMP, SPN, NCSM, NINE, 2016 – 2 018. 8 Geographic Presence Within U.S. Basins 8 0% 5% 10% 15% 20% 25% 30% 35% 40% Permian Mid Con Rockies Bakken Haynesville / E. TX Marcellus Other US * International RPC Revenues and U.S. Well Completions By Basin 12 months ended 12.13.18 RPC Rev. 2018 Well Completions * Other US includes GOM, other markets NOC . • RPC is well - established in the Permian, Mid Continent, Haynesville / E. TX. • Opportunities to grow in the Rockies. • The Marcellus and Utica Shales may be an opportunity in the future.
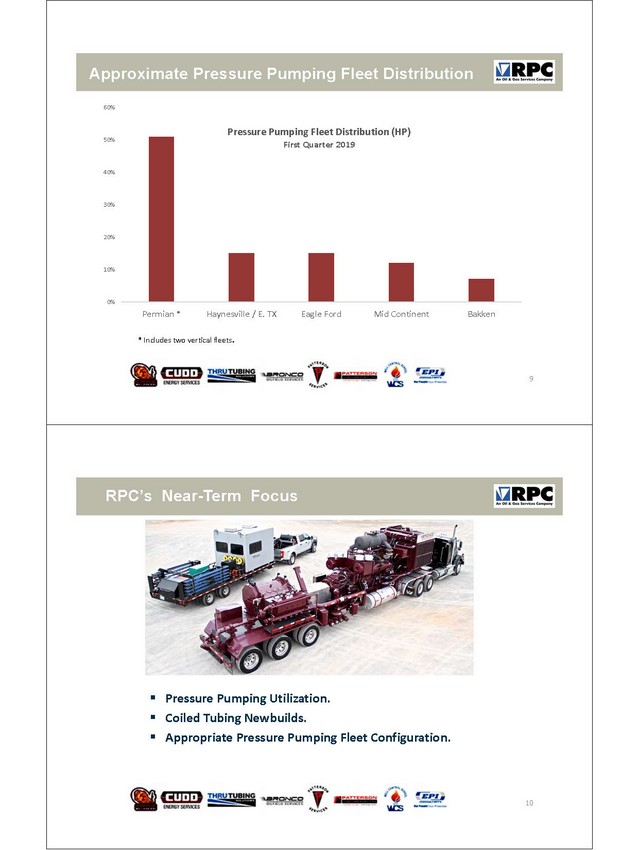
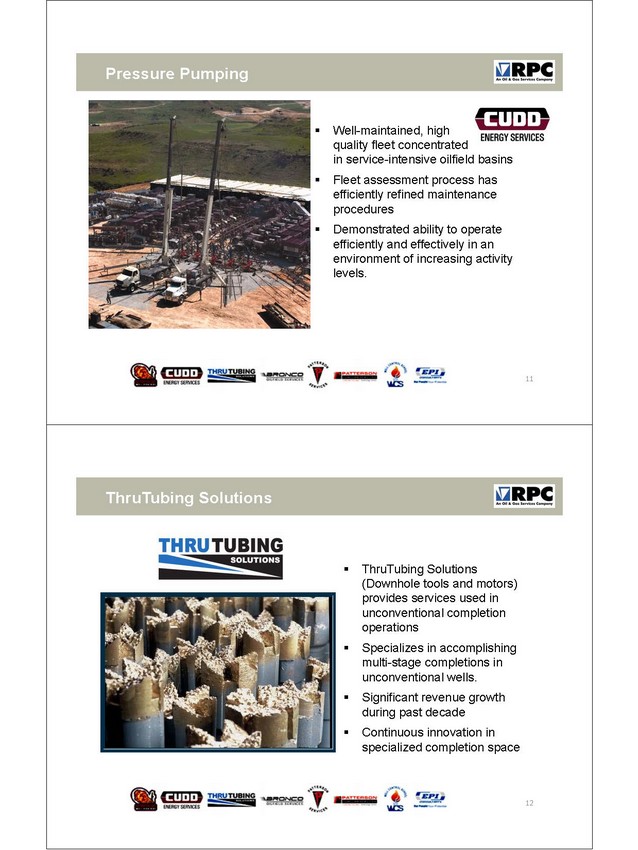
9 Approximate Pressure Pumping Fleet Distribution 9 0% 10% 20% 30% 40% 50% 60% Permian * Haynesville / E. TX Eagle Ford Mid Continent Bakken Pressure Pumping Fleet Distribution (HP) First Quarter 2019 * Includes two vertical fleets .10 RPC’s Near - Term Focus 10 ▪ Pressure Pumping Utilization. ▪ Coiled Tubing Newbuilds . ▪ Appropriate Pressure Pumping Fleet Configuration.
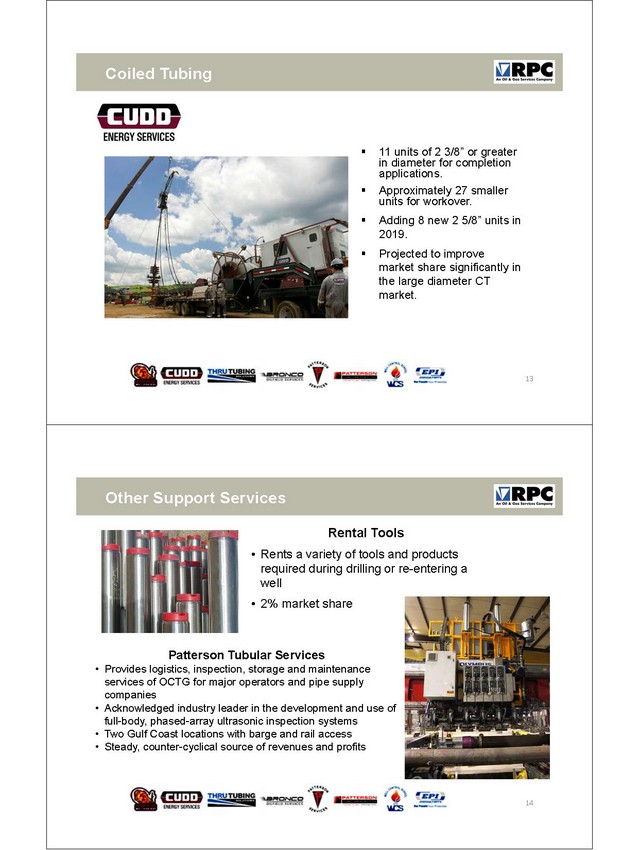
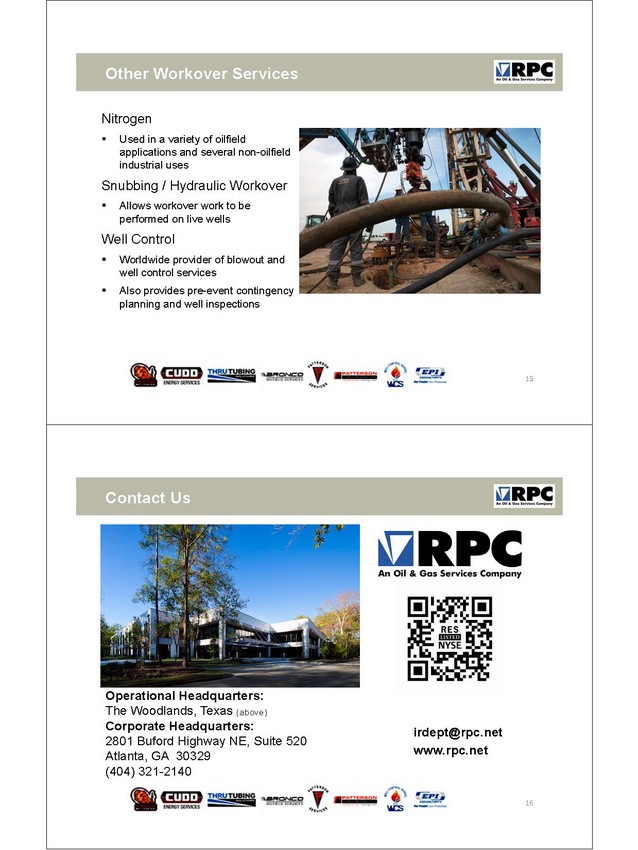
11 Pressure Pumping ▪ Well - maintained, high quality fleet concentrated in service - intensive oilfield basins ▪ Fleet assessment process has efficiently refined maintenance procedures ▪ Demonstrated ability to operate efficiently and effectively in an environment of increasing activity levels . 11 12 ThruTubing Solutions ▪ ThruTubing Solutions (Downhole tools and motors) provides services used in unconventional completion operations ▪ Specializes in accomplishing multi - stage completions in unconventional wells. ▪ Significant revenue growth during past decade ▪ Continuous innovation in specialized completion space 12
13 Coiled Tubing ▪ 11 units of 2 3/8” or greater in diameter for completion applications. ▪ Approximately 27 smaller units for workover. ▪ Adding 8 new 2 5/8” units in 2019. ▪ Projected to improve market share significantly in the large diameter CT market. 13 14 Other Support Services Rental Tools • Rents a variety of tools and products required during drilling or re - entering a well • 2% market share 14 Patterson Tubular Services • Provides logistics, inspection, storage and maintenance services of OCTG for major operators and pipe supply companies • Acknowledged industry leader in the development and use of full - body, phased - array ultrasonic inspection systems • Two Gulf Coast locations with barge and rail access • Steady, counter - cyclical source of revenues and profits
15 Other Workover Services Nitrogen ▪ Used in a variety of oilfield applications and several non - oilfield industrial uses Snubbing / Hydraulic Workover ▪ Allows workover work to be performed on live wells Well Control ▪ Worldwide provider of blowout and well control services ▪ Also provides pre - event contingency planning and well inspections 15 16 Contact Us Operational Headquarters: The Woodlands, Texas (above) Corporate Headquarters: 2801 Buford Highway NE, Suite 520 Atlanta, GA 30329 (404) 321 - 2140 16 irdept@rpc.net www.rpc.net

17 Appendix A 17 RPC has used the non - GAAP financial measure of Earnings B efore I nterest , Taxes , Depreciation and Amortization (EBITDA) in these discussion materials. EBITDA should not be considered in isolation or as a substitute for operating income, net income or other performance measures prepared in accordance with U.S. GAAP. RPC uses EBITDA as a measure of operating performance because it allows us to compare performance consistently over various periods without regard to changes in our capital structure. A non - GAAP financial measure is a numerical measure of financial performance, financial position, or cash flows that either 1) excludes amounts, or is subject to adjustments that have the effect of excluding amounts, that are included in the most directly comparable measure calculated and presented in accordance with GAAP in the statement of operations, balance sheet or statement of cash flows, or 2) includes amounts, or is subject to adjustments that have the effect of including amounts, that are excluded from the most directly comparable measure so calculated and presented. Set forth below is a reconciliation of EBITDA with Net Income, the most comparable GAAP measure. This reconciliation also appears on RPC's investor website, which can be found on the Internet at www.rpc.net . Periods ended, (Unaudited) (In thousands) December 31, 2018 September 30, 2018 December 31, 2017 2018 2017 Reconciliation of Net Income to EBITDA Net Income $ 13,362 $ 49,967 $ 57,703 $ 175,402 $ 162,511 Add: Income tax provision 6,477 5,506 5,688 45,878 70,305 Interest expense 121 150 104 489 426 Depreciation and amortization 42,553 42,993 38,024 163,120 163,537 Less: Interest income 783 783 466 2,426 1,494 EBITDA $ 61,730 $ 97,833 $ 101,053 $ 382,463 $ 395,285 Three Months Ended Twelve Months Ended