United States
Securities and Exchange Commission
Washington, D.C. 20549
Form N-CSR
Certified Shareholder Report of Registered Management Investment Companies
811-3984
(Investment Company Act File Number)
Federated International Series, Inc.
_______________________________________________________________
(Exact Name of Registrant as Specified in Charter)
Federated Investors Funds
4000 Ericsson Drive
Warrendale, Pennsylvania 15086-7561
(Address of Principal Executive Offices)
(412) 288-1900
(Registrant's Telephone Number)
John W. McGonigle, Esquire
Federated Investors Tower
1001 Liberty Avenue
Pittsburgh, Pennsylvania 15222-3779
(Name and Address of Agent for Service)
(Notices should be sent to the Agent for Service)
Date of Fiscal Year End: 11/30/13
Date of Reporting Period: 11/30/13
Item 1. Reports to Stockholders

Annual Shareholder Report
November 30, 2013
| Share Class | Ticker |
| A | FTIIX |
| B | FTBBX |
| C | FTIBX |
Federated International Bond Fund
Fund Established 1991
A Portfolio of Federated International Series, Inc.
Dear Valued Shareholder,
I am pleased to present the Annual Shareholder Report for your fund covering the period from December 1, 2012 through November 30, 2013. This report includes Management's Discussion of Fund Performance, a complete listing of your fund's holdings, performance information and financial statements along with other important fund information.
In addition, our website, FederatedInvestors.com, offers easy access to Federated resources that include timely fund updates, economic and market insights from our investment strategists, and financial planning tools. We invite you to register to take full advantage of its capabilities.
Thank you for investing with Federated. I hope you find this information useful and look forward to keeping you informed.
Sincerely,
J. Christopher Donahue, President
Not FDIC Insured • May Lose Value • No Bank Guarantee
CONTENTS
| 1 |
| 8 |
| 10 |
| 16 |
| 19 |
| 21 |
| 23 |
| 24 |
| 37 |
| 38 |
| 40 |
| 41 |
| 47 |
| 52 |
| 52 |
Management's Discussion of Fund Performance (unaudited)
The total return of Federated International Bond Fund (the “Fund”), based on net asset value, for the 12-month reporting period ended November 30, 2013, was -6.36% for Class A Shares, -7.00% for Class B Shares and -7.04% for Class C Shares. The total return for the J.P. Morgan Global (ex-U.S.) Government Bond Index (JPMGXUS)1, the Fund's broad-based securities market index, was -5.33% for the same period. The Fund's total return for the most recently completed fiscal year reflected actual cash flows, transaction costs and other expenses which were not reflected in the total return of the JPMGXUS.
During the reporting period, the Fund's investment strategy focused on three central factors which helped define the Fund's performance relative to the JPMGXUS: (1) the currency denomination of the selected securities; (2) the effective duration2 of the portfolio; and (3) security and country selection. These three market elements were the most significant factors affecting the Fund's performance relative to the JPMGXUS.
The following discussion will focus on the Fund's Class A Shares. During the reporting period, the Fund's Class A Shares underperformed the JPMGXUS.
MARKET OVERVIEW
During the 12-month reporting period, risk premiums in the international bond3,4 markets were governed by four pillar risks. At the forefront, the U.S. Federal Reserve (the Fed) monetary policy was the leading topic that shaped the course of international financial markets. Specifically, the prospect for moderating quantitative easing (QE) in the United States resonated through currency, equity and bond markets. In contrast, intensified Japanese economic stimulus was the second market staple. Third, Europe's ability to successfully navigate its way out of the financial crisis was yet another key driver to global bond markets. Finally, the reinvigoration of Chinese economic activity also left its mark on global markets.
Annual Shareholder Report
U.S. economic statistics proved quintessential in the past 12-month reporting period. The Fed was very explicit in tying monetary guidance directly to U.S. economic data. Specifically, they fashioned U.S. employment statistics as the main driver behind their policy decisions. The Fed's stance on QE was the reigning influence on both global foreign exchange and bond markets. As the reporting year unfolded, benchmark global yields along with the U.S. dollar began to rise on the projection that the Fed would finally begin to moderate its QE. Then, just as the reporting period was drawing to a close, the Fed surprised market participants and did not taper QE despite a healthy upturn in economic data. Ironically, this scrutiny over QE infused more volatility into the market rather than reducing it.
A European economic recovery began to seed itself early in the reporting period and maintained an upward trajectory all the way into the close of the reporting period. After six consecutive quarters of contraction, the 17 nation euro area finally emerged from its record long recession. Euro-zone Gross Domestic Product (GDP) expanded by 0.3% and even beat market estimations of around 0.2% growth. Germany and France were largely responsible for this expansion, but the peripheral economies also registered improvements. Notably, the existing German Chancellor, Angela Merkel, secured one of the largest election victories in Germany since 1990. This triumph helped to cement existing governmental policies and stabilize any geopolitical uncertainties. On the European peripheral front, developments were largely encouraging, with all members posting improving economic trends, albeit from still depleted levels for many. To help counter the effects of rising global yields, the European Central Bank reduced key rates down to 0.50% and maintained a cautious focus on downside economic risks.
After a slow start, economic data in the United Kingdom (UK) began to accelerate to the topside and exhibited signs of a strong economic recovery. Consumer confidence rose to 3.5-year highs, manufacturing to levels not seen in two years, and services reached 6-year high levels. Additionally, housing prices climbed back up to 7-year high valuations. Ironically, housing in the UK, which had been a drag on the economy these past few years, very quickly transformed itself into a potential source of inflationary concern. The Monetary Pricing Committee took a page from the Fed playbook and implemented a forward-looking policy that was anchored around employment growth. This economic revival was the central reason why the British pound was among the best performing currencies during the reporting period. In response, the Bank of England left key rates steady throughout the reporting period.
Annual Shareholder Report
A medley of factors led to the underperformance of the Dollar-bloc bond markets (Canada, Australia and New Zealand), but generally speaking, rising global yields were at the heart of their dilemma. Mixed Chinese data, commodity weakness and excessive Japanese government bond volatility also conspired against this trio. Dollar-bloc economies are very commodity sensitive, and as hard commodity prices began to unravel over concerns of rising global rates, so did their currency and bond markets. In fact, the bulk of the poor performance was directly tied to currency weakness, especially in Australia and Canada. This 12-month reporting period also registered evident economic divergence between the two main Nordic economies, Norway and Sweden. As the economic recovery in Europe took hold, Swedish growth began to outpace its Norwegian sibling. Swedish employment figures steadily improved, while retail sales climbed to levels not enjoyed since 2012. In contrast, Norwegian GDP endured significant setbacks and, towards the tail end of this 12-month reporting period, was nearly flat.
In late 2012, the Japanese prime minister, Shinzo Abe, instituted a 2% inflation mandate for the Japanese economy and delegated this responsibility to the Bank of Japan (BOJ). The execution of this decree was carried out with aggressive monetary stimulus, infamously dubbed “Abenomics.” This inflation goal was easily the single biggest economic driver in Japan. In fact, this narrative was probably one of the biggest macro investment themes throughout the reporting period, falling second only to the “U.S. Taper” theme. This regime intentionally pursued the weakening of the Japanese yen in order to bolster both exports and inflation simultaneously. Consequently, the Japanese yen was the worst performing currency among the top 20 developed economies during the period.
CURRENCY
The Fund's selection in currency denomination for the underlying securities was pivotal to the overall performance of the portfolio. Given the massive easing deployed by the BOJ, the Fund maintained an underweight Japanese yen exposure relative to JPMGXUS throughout the entire 12-month reporting period. This underweight decision varied anywhere from -5% to -11% of total net assets throughout the Fund's reporting period. The Fund also eliminated an overweight allocation to the Australian dollar relative to JPMGXUS very early on in the reporting period. Lastly, in response to the volatility generated by U.S. QE tapering, the Fund reduced overweight allocations relative to JPMGXUS to higher Beta (securities/currencies with higher sensitivity to market volatility) currency denominations. As a result, the Fund's general yen underweight, neutral Australian dollar and lower Beta decision relative to the JPMGXUS, all made a significant and positive contribution to Fund performance during the period. Finally, the Fund deployed several option-based currency strategies to both protect the portfolio against excessive volatility, and to take advantage of valuation misalignments. The use of options within the Fund generated a positive contribution to Fund performance.
Annual Shareholder Report
DURATION
The Fund's weighted average duration at the end of the 12-month reporting period was 5.93 years. In magnitude of impact on overall performance, duration management was second only to currency denomination. Fund duration is effectively the Fund's sensitivity to movements in interest rates—the lower the duration the less the net asset value of the Fund will fluctuate due to changes in interest rates. The Fund generally maintained an underweight allocation relative to JPMGXUS throughout the 12-month reporting period. This underweight allocation was almost entirely concentrated in Japanese yen denominated bonds. Consequently, the Fund's generally shorter duration during the reporting period, relative to the JPMGXUS had a negative effect on the Fund's overall net asset value and performance relative to the JPMGXUS.
SECURITY AND COUNTRY SELECTION
Security selection in the Fund was designed to reduce overall portfolio variance by continuing to focus on high-grade debt securities. Although this focus succeeded in reducing portfolio volatility, it did however detract from overall Fund performance. Country selection varied throughout the 12-month reporting period, but overweight exposures relative to JPMGXUS in the European peripheral countries were a constant variable. As economic conditions began to progress in Europe, peripheral countries, which had been at the epicenter of the European Union financial crisis, began to recover markedly. We maintained overweight exposures to Italy and Spain that were offset by underweight allocations to the core economies of Germany and France (duration weights were relative to JPMGXUS). Both Italy and Spain dramatically outperformed their core European counterparts. Consequently, country selection benefited Fund performance during the reporting period.
| 1 | Please see the footnotes to the line graphs under “Fund Performance and Growth of a $10,000 Investment” below for the definition of, and more information about, the JPMGXUS. |
| 2 | Duration is a measure of a security's price sensitivity to changes in interest rates. Securities with longer durations are more sensitive to changes in interest rates than securities with shorter durations |
| 3 | International investing involves special risks including currency risk, increased volatility of foreign securities, political risks, and differences in auditing and other financial standards. |
| 4 | Bond prices are sensitive to changes in interest rates, and a rise in interest rates can cause a decline in their prices. |
Annual Shareholder Report
FUND PERFORMANCE AND GROWTH OF A $10,000 INVESTMENT
The Average Annual Total Return table below shows returns for each class averaged over the stated periods. The graphs below illustrate the hypothetical investment of $10,0001 in the Federated International Bond Fund from November 30, 2003 to November 30, 2013, compared to the JPMorgan Global (ex-U.S.) Government Bond Index (JPMGXUS).2
Average Annual Total Returns for the Period Ended 11/30/2013
(returns reflect all applicable sales charges and contingent deferred sales charges as specified below in footnote #1)
| Share Class | 1 Year | 5 Years | 10 Years |
| Class A Shares | -10.58% | 2.71% | 3.06% |
| Class B Shares | -12.01% | 2.57% | 2.92% |
| Class C Shares | -7.95% | 2.91% | 2.76% |
Performance data quoted represents past performance which is no guarantee of future results. Investment return and principal value will fluctuate so that an investor's shares, when redeemed, may be worth more or less than their original cost. Mutual fund performance changes over time and current performance may be lower or higher than what is stated. For current to the most recent month-end performance and after-tax returns, visit FederatedInvestors.com or call 1-800-341-7400. Returns shown do not reflect the deduction of taxes that a shareholder would pay on Fund distributions or the redemption of Fund shares. Mutual funds are not obligations of or guaranteed by any bank and are not federally insured.
Annual Shareholder Report
Growth of a $10,000 Investment – class a shares
Growth of $10,000 as of November 30, 2013
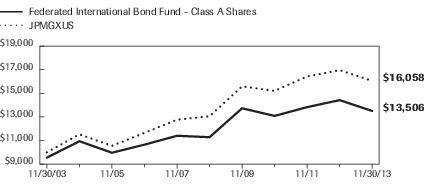
| Federated International Bond Fund - | Class A Shares | JPMGXUS |
| 11/30/2003 | 9,550 | 10,000 |
| 11/30/2004 | 10,943 | 11,529 |
| 11/30/2005 | 9,968 | 10,554 |
| 11/30/2006 | 10,652 | 11,648 |
| 11/30/2007 | 11,407 | 12,766 |
| 11/30/2008 | 11,283 | 13,055 |
| 11/30/2009 | 13,732 | 15,590 |
| 11/30/2010 | 13,088 | 15,208 |
| 11/30/2011 | 13,830 | 16,431 |
| 11/30/2012 | 14,424 | 16,962 |
| 11/30/2013 | 13,506 | 16,058 |
41 graphic description end -->
| ■ | Total returns shown include the maximum sales charge of 4.50% ($10,000 investment minus $450 sales charge = $9,550). |
| | |
Growth of a $10,000 Investment – class b shares
Growth of $10,000 as of November 30, 2013

| Federated International Bond Fund - | Class B Shares | JPMGXUS |
| 11/30/2003 | 10,000 | 10,000 |
| 11/30/2004 | 11,380 | 11,529 |
| 11/30/2005 | 10,287 | 10,554 |
| 11/30/2006 | 10,906 | 11,648 |
| 11/30/2007 | 11,589 | 12,766 |
| 11/30/2008 | 11,376 | 13,055 |
| 11/30/2009 | 13,758 | 15,590 |
| 11/30/2010 | 13,020 | 15,208 |
| 11/30/2011 | 13,655 | 16,431 |
| 11/30/2012 | 14,241 | 16,962 |
| 11/30/2013 | 13,335 | 16,058 |
41 graphic description end -->
| ■ | Total returns shown include the maximum contingent deferred sales charge of 5.50% as applicable. |
| |
|
Annual Shareholder Report
Growth of a $10,000 Investment – class c shares
Growth of $10,000 as of November 30, 2013
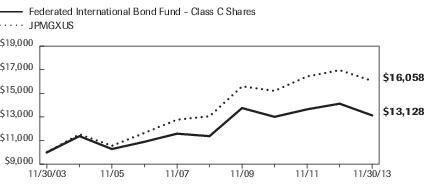
| Federated International Bond Fund - | Class C Shares | JPMGXUS |
| 11/30/2003 | 10,000 | 10,000 |
| 11/30/2004 | 11,374 | 11,529 |
| 11/30/2005 | 10,282 | 10,554 |
| 11/30/2006 | 10,896 | 11,648 |
| 11/30/2007 | 11,582 | 12,766 |
| 11/30/2008 | 11,373 | 13,055 |
| 11/30/2009 | 13,753 | 15,590 |
| 11/30/2010 | 13,008 | 15,208 |
| 11/30/2011 | 13,645 | 16,431 |
| 11/30/2012 | 14,122 | 16,962 |
| 11/30/2013 | 13,128 | 16,058 |
41 graphic description end -->
| ■ | Total returns shown include the maximum contingent deferred sales charge of 1.00% as applicable. |
| | |
| 1 | Represents a hypothetical investment of $10,000 in the Fund after deducting applicable sales charge: for Class A Shares, the maximum sales charge of 4.50% ($10,000 investment minus $450 sales charge = $9,550); for Class B Shares, the maximum contingent deferred sales charge is 5.50% on any redemption less than one year from the purchase date; for Class C Shares, a 1.00% contingent deferred sales charge would be applied to any redemption less than one year from the purchase date. |
| 2 | The JPMGXUS is a broad measure of bond performance in developed countries, excluding the United States. The JPMGXUS is not adjusted to reflect sales loads, expenses or other fees that the Securities and Exchange Commission (SEC) requires to be reflected in the Fund's performance. The index is unmanaged and, unlike the Fund, is not affected by cash flows. It is not possible to invest directly in an index. |
Annual Shareholder Report
Portfolio of Investments Summary Table (unaudited)
At November 30, 2013, the Fund's issuer country and currency exposure composition1 were as follows:
| Country | Country Exposure
as a Percentage of
Total Net Assets2 | Currency Exposure
as a Percentage of
Total Net Assets3 |
| Japan | 17.3% | 37.0% |
| Italy | 12.3% | — |
| France | 10.0% | — |
| Spain | 8.5% | — |
| Germany | 6.6% | — |
| Netherlands | 5.8% | — |
| United Kingdom | 4.8% | 11.0% |
| Supranational4 | 3.7% | — |
| Belgium | 3.6% | — |
| Canada | 3.6% | 3.6% |
| Sweden | 3.1% | 0.6% |
| United States | 3.1% | — |
| Ireland | 2.9% | — |
| Denmark | 2.2% | 2.0% |
| Austria | 1.9% | — |
| United Arab Emirates | 1.7% | — |
| Singapore | 1.7% | 1.6% |
| Australia | 1.7% | 1.6% |
| Mexico | 1.0% | 0.6% |
| Norway | 0.2% | 1.0% |
| Euro | — | 36.7% |
| SUB-TOTAL | 95.7% | 95.7% |
| Other Securities5 | 2.3% | 2.3% |
| Cash Equivalents6 | 1.2% | 1.2% |
| Derivative Contracts7 | (0.2%) | (0.2%) |
| Other Assets and Liabilities—Net8 | 1.0% | 1.0% |
| TOTAL | 100.0% | 100.0% |
Annual Shareholder Report
| 1 | Unless otherwise noted below, this table does not give effect to the impact of derivative contract instruments owned by the Fund. More complete information regarding the Fund's investments in derivative contracts can be found in the tables at the end of the Portfolio of Investments included in this Report. |
| | The fixed-income securities of some issuers may not be denominated in the currency of the issuer's designated country. Therefore, the two columns above “Country Exposure as a Percentage of Total Net Assets” and “Currency Exposure as a Percentage of Total Net Assets” may not be equal. |
| 2 | This column depicts the Fund's exposure to various countries through its investment in foreign fixed-income securities, along with the Fund's holdings of cash equivalents and other assets and liabilities. With respect to foreign corporate fixed-income securities, country allocations are based primarily on the country in which the issuing company has registered the security. However, the Fund's Adviser may allocate the company to a country based on other factors such as the location of the company's head office, the jurisdiction of the company's incorporation, the location of the principal trading market for the company's securities or the country from which a majority of the company's revenue is derived. |
| 3 | This column depicts the Fund's exposure to various currencies through its investment in foreign fixed-income securities, currency derivative contracts and foreign exchange contracts (which for purposes of this Report includes any currency options sold by the Fund and currency forward contracts). |
| 4 | Supranational consists of European Investment Banks. |
| 5 | Other Securities includes an Investment Fund and affiliated holding. |
| 6 | Cash Equivalents includes any investments in money market mutual funds and/or overnight repurchase agreements. This does not include cash held in the Fund that is denominated in foreign currencies. See the Statement of Assets and Liabilities for information regarding the Fund's foreign cash position. |
| 7 | Based upon net unrealized appreciation (depreciation) or value of the derivative contracts as applicable. Derivative contracts may consist of futures, forwards, options and swaps. The impact of a derivative contract on the Fund's performance may be larger than its unrealized appreciation (depreciation) or value may indicate. In many cases, the notional value or amount of a derivative contract may provide a better indication of the contract's significance to the portfolio. More complete information regarding the Fund's direct investments in derivative contracts, including unrealized appreciation (depreciation), value, and notional values or amounts of such contracts, can be found in the table at the end of the Portfolio of Investments included in this Report. |
| 8 | Assets, other than investments in securities, currency derivative contracts and foreign exchange contracts, less liabilities. See Statement of Assets and Liabilities. |
Annual Shareholder Report
Portfolio of Investments
November 30, 2013
Foreign
Currency
Par Amount
or Shares | | | Value in
U.S. Dollars |
| | | BONDS—95.7% | |
| | | AUSTALIAN DOLLAR—1.6% | |
| | | State/Provincial—1.6% | |
| 1,090,000 | | Queensland Treasury Corp., 4.00%, 6/21/2019 | $987,662 |
| | | British Pound—11.3% | |
| | | Finance - Automotive—2.9% | |
| 1,000,000 | | GE Capital European Funding, Company Guarantee, (Series EMTN), 4.625%, 1/18/2016 | 1,744,313 |
| | | Insurance—1.2% | |
| 435,000 | | MetLife Global Funding I, (Series EMTN), 2.875%, 1/11/2023 | 681,518 |
| | | Retailers—1.3% | |
| 400,000 | | Wal-Mart Stores, Inc., Sr. Unsecd. Note, 5.625%, 3/27/2034 | 787,132 |
| | | Sovereign—4.8% | |
| 1,550,000 | | United Kingdom, Government of, Bond 1.75%, 9/7/2022 | 2,368,383 |
| 325,000 | | United Kingdom, Government of, Bond 3.25%, 1/22/2044 | 497,852 |
| | | TOTAL | 2,866,235 |
| | | Utilities—1.1% | |
| 350,000 | | RWE Finance B.V., Company Guarantee, (Series EMTN), 6.50%, 4/20/2021 | 676,808 |
| | | TOTAL BRITISH POUND | 6,756,006 |
| | | Canadian Dollar—3.6% | |
| | | Sovereign—3.6% | |
| 565,000 | | Canada, Government of, Bond 1.25%, 9/1/2018 | 520,307 |
| 1,080,000 | | Canada, Government of, Bond, 3.25%, 6/1/2021 | 1,088,497 |
| 100,000 | | Canada, Government of, Bond, 4.00%, 6/1/2016 | 100,735 |
| 450,000 | | Canada, Government of, Bond 4.00%, 6/1/2017 | 461,465 |
| | | TOTAL CANADIAN DOLLAR | 2,171,004 |
| | | Danish Krone—2.2% | |
| | | Mortgage Banks—0.4% | |
| 1,049,284 | | Realkredit Danmark A/S, (Series 23D), 5.00%, 10/1/2035 | 211,159 |
| | | Sovereign—1.8% | |
| 5,700,000 | | Denmark, Government of, Unsecd. Deb., 2.50%, 11/15/2016 | 1,109,613 |
| | | TOTAL DANISH KRONE | 1,320,772 |
Annual Shareholder Report
Foreign
Currency
Par Amount
or Shares | | | Value in
U.S. Dollars |
| | | BONDS—continued | |
| | | Euro—39.4% | |
| | | Automotive—2.1% | |
| 950,000 | | Daimler AG, (Series EMTN), 1.75%, 1/21/2020 | $1,284,825 |
| | | Metals & Mining—1.7% | |
| 730,000 | | Xstrata Finance (Dubai) Ltd., (Series EMTN), 2.625%, 11/19/2018 | 1,009,149 |
| | | Services—0.9% | |
| 400,000 | | Adecco International Financial Services, (Series EMTN), 2.75%, 11/15/2019 | 548,115 |
| | | Sovereign—34.7% | |
| 740,000 | | Austria, Government of, Sr. Unsecd. Note, 3.65%, 4/20/2022 | 1,150,931 |
| 970,000 | | Belgium, Government of, 2.25%, 6/22/2023 | 1,307,129 |
| 210,000 | | Belgium, Government of, 3.00%, 9/28/2019 | 311,033 |
| 350,000 | | Belgium, Government of, Sr. Unsecd. Note, 4.00%, 3/28/2018 | 537,656 |
| 1,500,000 | | Bonos Y Oblig Del Estado, Sr. Unsub., 4.00%, 4/30/2020 | 2,123,508 |
| 450,000 | | Bundesrepublic Deutschland, 2.25%, 9/4/2021 | 655,048 |
| 850,000 | | Buoni Poliennali Del Tes, 3.75%, 8/1/2016 | 1,220,873 |
| 1,800,000 | | Buoni Poliennali Del Tes, 4.50%, 5/1/2023 | 2,571,079 |
| 930,000 | | Buoni Poliennali Del Tes, 5.00%, 8/1/2039 | 1,300,966 |
| 790,000 | | France, Government of, Bond, 3.50%, 4/25/2026 | 1,172,494 |
| 724,000 | | France, Government of, Bond, 4.25%, 10/25/2023 | 1,158,646 |
| 1,025,000 | | France, Government of, Bond, 4.50%, 4/25/2041 | 1,704,118 |
| 1,500,000 | | Italy, Government of, Bond, 4.25%, 2/1/2015 | 2,119,738 |
| 885,000 | | Netherlands, Government of, 1.75%, 7/15/2023 | 1,173,921 |
| 410,000 | | Netherlands, Government of, Bond, 3.25%, 7/15/2015 | 584,504 |
| 1,220,000 | | Spain, Government of, 3.80%, 1/31/2017 | 1,747,093 |
| | | TOTAL | 20,838,737 |
| | | TOTAL EURO | 23,680,826 |
| | | Japanese Yen—30.9% | |
| | | Agency—4.8% | |
| 200,000,000 | | Caisse d'Amortissement de la Dette Sociale (CADES), (Series EMTN), 0.61%, 3/12/2014 | 1,951,799 |
| 100,000,000 | | Instituto de Credito Official, Series 1, 0.84%, 4/23/2014 | 955,924 |
| | | TOTAL | 2,907,723 |
| | | Banking—7.1% | |
| 50,000,000 | | Asian Development Bank, 2.35%, 6/21/2027 | 580,945 |
| 180,000,000 | | KFW, 2.05%, 2/16/2026 | 2,025,971 |
| 160,000,000 | | Nordic Investment Bank, Sr. Unsecd. Note, 1.70%, 4/27/2017 | 1,643,992 |
| | | TOTAL | 4,250,908 |
Annual Shareholder Report
Foreign
Currency
Par Amount
or Shares | | | Value in
U.S. Dollars |
| | | BONDS—continued | |
| | | Japanese Yen—continued | |
| | | Finance—1.7% | |
| 97,000,000 | | General Electric Capital Corp., (Series MTN), 2.00%, 2/22/2017 | $997,193 |
| | | Sovereign—17.3% | |
| 314,000,000 | | Japan, Government of, 1.30%, 3/20/2021 | 3,263,498 |
| 265,000,000 | | Japan, Government of, 1.90%, 12/20/2023 | 2,906,836 |
| 240,000,000 | | Japan, Government of, Sr. Unsecd. Note, 1.70%, 9/20/2017 | 2,480,088 |
| 172,000,000 | | Japan-284 (10 Year Issue), 1.70%, 12/20/2016 | 1,759,467 |
| | | TOTAL | 10,409,889 |
| | | TOTAL JAPANESE YEN | 18,565,713 |
| | | MEXICAN PESO—0.9% | |
| | | Sovereign—0.9% | |
| 6,900,000 | | Mex Bonos Desarr Fix Rate, 6.50%, 6/10/2021 | 547,687 |
| | | Norwegian Krone—1.0% | |
| | | Finance - Automotive—0.8% | |
| 3,000,000 | | BMW Finance N.V., (Series EMTN), 3.50%, 7/17/2015 | 499,539 |
| | | Sovereign—0.2% | |
| 600,000 | | Norway, Government of, Bond, 4.25%, 5/19/2017 | 105,925 |
| | | TOTAL NORWEGIAN KRONE | 605,464 |
| | | SINGAPORe DOLLAR—1.7% | |
| | | Sovereign—1.7% | |
| 1,170,000 | | Singapore, Government of, Sr. Unsecd. Note, 2.50%, 6/1/2019 | 989,931 |
| | | SWEDISH KRONA—3.1% | |
| | | Sovereign—3.1% | |
| 11,600,000 | | Sweden, Government of, 3.00%, 7/12/2016 | 1,855,671 |
| | | TOTAL BONDS
(IDENTIFIED COST $62,440,376) | 57,480,736 |
| | | INVESTMENT FUND—0.1% | |
| 453 | 1 | GML Agricultural Commodity Trade Finance Fund
(IDENTIFIED COST $45,313) | 36,016 |
| | | INVESTMENT COMPANIES—3.4%2 | |
| 763,264 | 3 | Federated Prime Value Obligations Fund, Institutional Shares, 0.07% | 763,264 |
Annual Shareholder Report
Foreign
Currency
Par Amount
or Shares | | | Value in
U.S. Dollars |
| | | INVESTMENT COMPANIES—continued2 | |
| 136,471 | | Federated Project and Trade Finance Core Fund | $1,329,230 |
| | | TOTAL INVESTMENT COMPANIES
(IDENTIFIED COST $2,122,675) | 2,092,494 |
| | | TOTAL INVESTMENTS
(IDENTIFIED COST $64,608,364)4 | 59,609,246 |
| | | OTHER ASSETS AND LIABILITIES - NET—0.8%5 | 465,311 |
| | | TOTAL NET ASSETS—100% | $60,074,557 |
At November 30, 2013, the Fund had the following outstanding foreign exchange contracts:
| Settlement Date | | Foreign Currency
Units to
Receive/Deliver | | In
Exchange
For | | Unrealized
Appreciation/
(Depreciation) |
| Contracts Purchased: |
| 12/3/2013 | | 3,350,000 Mexican Peso | | $260,871 | | $(5,621) |
| 12/5/2013 | | 896,143 New Zealand Dollar | | 550,000 Euro | | $(10,945) |
| 12/5/2013 | | 1,174,286 Euro | | 10,475,920 Swedish Krona | | $18,215 |
| 12/5/2013 | | 115,795,400 Japanese Yen | | 1,400,000 New Zealand Dollar | | $(15,220) |
| 12/5/2013 | | 1,400,000 New Zealand Dollar | | 115,753,400 Japanese Yen | | $(8,683) |
| 12/5/2013 | | 247,246,200 Japanese Yen | | 1,800,000 Euro | | $(22,695) |
| 12/5/2013 | | 1,800,000 Euro | | 247,039,200 Japanese Yen | | $12,131 |
| 12/5/2013 | | 76,150,000 Japanese Yen | | $775,143 | | $(31,780) |
| 12/5/2013 | | 76,150,000 Japanese Yen | | $770,437 | | $(27,074) |
| 12/5/2013 | | 872,720 Canadian Dollar | | 1,000,000 New Zealand Dollar | | $(15,749) |
| 12/5/2013 | | 1,000,000 New Zealand Dollar | | 873,660 Canadian Dollar | | $(17,092) |
| 12/5/2013 | | 1,100,000 Euro | | 1,781,120 New Zealand Dollar | | $5,124 |
| 12/5/2013 | | 10,489,072 Swedish Krona | | 1,174,286 Euro | | $22,310 |
| 12/5/2013 | | 600,000 Australian Dollar | | 589,422 Canadian Dollar | | $(18,832) |
| 12/5/2013 | | 9,000,000 Swedish Krona | | $1,345,815 | | $26,119 |
| 12/5/2013 | | 112,892,400 Japanese Yen | | 1,350,000 New Zealand Dollar | | $(27,932) |
| 12/5/2013 | | 578,571 New Zealand Dollar | | 48,089,122 Japanese Yen | | $(11,271) |
| 12/5/2013 | | 893,217 New Zealand Dollar | | 550,000 Euro | | $(19,434) |
| 12/5/2013 | | 771,429 New Zealand Dollar | | 64,343,314 Japanese Yen | | $(16,784) |
| 12/5/2013 | | 1,400,000 Australian Dollar | | 1,390,200 Canadian Dollar | | $(52,595) |
| 12/5/2013 | | 1,977,900 Canadian Dollar | | 2,000,000 Australian Dollar | | $(34,049) |
| 12/24/2013 | | 3,225,000 Euro | | $4,313,083 | | $69,020 |
| 12/24/2013 | | 217,500 Euro | | $289,956 | | $5,582 |
| 12/24/2013 | | 457,500 Euro | | $611,418 | | $10,230 |
| 12/24/2013 | | 2,025,000 Euro | | $2,739,367 | | $12,186 |
Annual Shareholder Report
| Settlement Date | | Foreign Currency
Units to
Receive/Deliver | | In
Exchange
For | | Unrealized
Appreciation/
(Depreciation) |
| 1/17/2014 | | 317,554,300 Japanese Yen | | 2,290,000 Euro | | $(8,356) |
| 1/17/2014 | | 2,290,000 Euro | | 319,455,000 Japanese Yen | | $(6) |
| 1/29/2014 | | 950,000 Euro | | $1,282,690 | | $8,229 |
| 1/30/2014 | | 148,879,640 Japanese Yen | | 9,800,000 Swedish Krona | | $(19,589) |
| 1/30/2014 | | 42,418,750 Japanese Yen | | 5,500,000 Mexico Neuvo Peso | | $(5,581) |
| 2/5/2014 | | 181,972,299 Japanese Yen | | 1,365,000 Euro | | $(74,719) |
| Contracts Sold: |
| 12/3/2013 | | 3,350,000 Mexican Peso | | $ 249,191 | | $(6,059) |
| 12/5/2013 | | 1,174,286 Euro | | 10,489,072 Swedish Krona | | $(19,010) |
| 12/5/2013 | | 550,000 Euro | | 896,143 New Zealand Dollar | | $(7,599) |
| 12/5/2013 | | 10,475,920 Swedish Krona | | 1,174,286 Euro | | $(19,510) |
| 12/5/2013 | | 1,400,000 New Zealand Dollar | | 115,795,400 Japanese Yen | | $7,027 |
| 12/5/2013 | | 115,753,400 Japanese Yen | | 1,400,000 New Zealand Dollar | | $17,285 |
| 12/5/2013 | | 1,800,000 Euro | | 247,246,200 Japanese Yen | | $(9,577) |
| 12/5/2013 | | 247,039,200 Japanese Yen | | 1,800,000 Euro | | $22,162 |
| 12/5/2013 | | 873,660 Canadian Dollar | | 1,000,000 New Zealand Dollar | | $8,231 |
| 12/5/2013 | | 1,000,000 New Zealand Dollar | | 872,720 Canadian Dollar | | $23,726 |
| 12/5/2013 | | 1,781,120 New Zealand Dollar | | 1,100,000 Euro | | $41,042 |
| 12/5/2013 | | 1,350,000 New Zealand Dollar | | 112,892,400 Japanese Yen | | $32,064 |
| 12/5/2013 | | 48,089,122 Japanese Yen | | 578,571 New Zealand Dollar | | $12,363 |
| 12/5/2013 | | 550,000 Euro | | 893,217 New Zealand Dollar | | $(1,489) |
| 12/5/2013 | | 64,343,314 Japanese Yen | | 771,429 New Zealand Dollar | | $16,050 |
| 12/5/2013 | | 152,300,000 Japanese Yen | | $ 1,558,997 | | $72,271 |
| 12/5/2013 | | 4,498,855 Swedish Krona | | $ 675,091 | | $(10,701) |
| 12/5/2013 | | 4,501,145 Swedish Krona | | $ 675,545 | | $(10,596) |
| 12/5/2013 | | 589,422 Canadian Dollar | | 600,000 Australian Dollar | | $10,149 |
| 12/5/2013 | | 1,390,200 Canadian Dollar | | 1,400,000 Australian Dollar | | $18,330 |
| 12/5/2013 | | 2,000,000 Australian Dollar | | 1,977,900 Canadian Dollar | | $75,378 |
| 12/24/2013 | | 375,000 Euro | | $ 503,831 | | $(5,716) |
| 12/24/2013 | | 5,550,000 Euro | | $ 7,418,075 | | $(123,219) |
| 1/17/2014 | | 2,290,000 Euro | | 317,554,300 Japanese Yen | | $(2,430) |
| 1/17/2014 | | 319,455,000 Japanese Yen | | 2,290,000 Euro | | $(7,769) |
| 1/30/2014 | | 9,800,000 Swedish Krona | | 148,879,640 Japanese Yen | | $(18,644) |
| 1/30/2014 | | 5,500,000 Mexican Peso | | 42,418,750 Japanese Yen | | $2,647 |
| 2/5/2014 | | 1,365,000 Euro | | 181,972,299 Japanese Yen | | $(3,020) |
| NET UNREALIZED DEPRECIATION ON FOREIGN EXCHANGE CONTRACTS | $(141,475) |
Net Unrealized Depreciation on Foreign Exchange Contracts is included “Other Assets and Liabilities—Net.”
| 1 | Fair value determined in accordance with procedures established by and under the general supervision of the Fund's Board of Directors (the “Directors”). |
Annual Shareholder Report
| 2 | Affiliated holdings. |
| 3 | 7-day net yield. |
| 4 | The cost of investments for federal tax purposes amounts to $65,115,487. |
| 5 | Assets, other than investments in securities, less liabilities. See Statement of Assets and Liabilities. |
Note: The categories of investments are shown as a percentage of total net assets at November 30, 2013.
Various inputs are used in determining the value of the Fund's investments. These inputs are summarized in the three broad levels listed below:
Level 1—quoted prices in active markets for identical securities, including investments companies with daily net asset values, if applicable.
Level 2—other significant observable inputs (including quoted prices for similar securities, interest rates, prepayment speeds, credit risk, etc.) Also includes securities valued at amortized cost.
Level 3—significant unobservable inputs (including the Fund's own assumptions in determining the fair value of investments).
The inputs or methodology used for valuing securities are not an indication of the risk associated with investing in those securities.
The following is a summary of the inputs used, as of November 30, 2013, in valuing the Fund's assets carried at fair value:
| Valuation Inputs | | | | |
| | Level 1 —
Quoted
Prices and
Investments in
Certain Investment
Companies | Level 2 —
Other
Significant
Observable
Inputs | Level 3 —
Significant
Unobservable
Inputs | Total |
| Debt Securities: | | | | |
| Bonds | $— | $57,480,736 | $— | $57,480,736 |
| Investment Fund | — | — | 36,016 | 36,016 |
| Investment Companies | 763,264 | 1,329,2301 | — | 2,092,494 |
| TOTAL SECURITIES | $763,264 | $58,809,966 | $36,016 | $59,609,246 |
| OTHER FINANCIAL INSTRUMENTS* | $— | ($141,475) | $— | ($141,475) |
| 1 | Federated Project and Trade Finance Core Fund is an affiliated holding offered only to registered investment companies and other accredited investors. |
| * | Other financial instruments include foreign exchange contracts. |
See Notes which are an integral part of the Financial Statements.
Annual Shareholder Report
Financial Highlights–Class A Shares
(For a Share Outstanding Throughout Each Period)
| Year Ended November 30 | 2013 | 2012 | 2011 | 2010 | 2009 |
| Net Asset Value, Beginning of Period | $11.65 | $11.67 | $11.53 | $12.81 | $10.99 |
| Income From Investment Operations: | | | | | |
| Net investment income1 | 0.14 | 0.15 | 0.19 | 0.21 | 0.25 |
| Net realized and unrealized gain (loss) on investments, futures contracts, options and foreign currency transactions | (0.86) | 0.33 | 0.44 | (0.81) | 2.06 |
| TOTAL FROM INVESTMENT OPERATIONS | (0.72) | 0.48 | 0.63 | (0.60) | 2.31 |
| Less Distributions: | | | | | |
| Distributions from net investment income | (0.35) | (0.50) | (0.49) | (0.68) | (0.49) |
| Net Asset Value, End of Period | $10.58 | $11.65 | $11.67 | $11.53 | $12.81 |
| Total Return2 | (6.36)% | 4.29% | 5.67% | (4.69)% | 21.70% |
| Ratios to Average Net Assets: | | | | | |
| Net expenses | 0.99% | 0.99% | 0.99% | 0.99% | 0.98% |
| Net investment income | 1.32% | 1.31% | 1.60% | 1.79% | 2.15% |
| Expense waiver/reimbursement3 | 0.95% | 1.03% | 1.01% | 0.94% | 0.92% |
| Supplemental Data: | | | | | |
| Net assets, end of period (000 omitted) | $49,202 | $59,710 | $65,555 | $60,723 | $76,602 |
| Portfolio turnover | 44% | 67% | 37% | 35% | 64% |
| 1 | Per share numbers have been calculated using the average shares method. |
| 2 | Based on net asset value, which does not reflect the sales charge, redemption fee or contingent deferred sales charge, if applicable. |
| 3 | This expense decrease is reflected in both the net expense and net investment income ratios shown above. |
See Notes which are an integral part of the Financial Statements
Annual Shareholder Report
Financial Highlights–Class B Shares
(For a Share Outstanding Throughout Each Period)
| Year Ended November 30 | 2013 | 2012 | 2011 | 2010 | 2009 |
| Net Asset Value, Beginning of Period | $11.32 | $11.35 | $11.22 | $12.47 | $10.70 |
| Income From Investment Operations: | | | | | |
| Net investment income1 | 0.06 | 0.06 | 0.10 | 0.12 | 0.16 |
| Net realized and unrealized gain (loss) on investments, futures contracts, options and foreign currency transactions | (0.84) | 0.32 | 0.43 | (0.79) | 2.02 |
| TOTAL FROM INVESTMENT OPERATIONS | (0.78) | 0.38 | 0.53 | (0.67) | 2.18 |
| Less Distributions: | | | | | |
| Distributions from net investment income | (0.23) | (0.41) | (0.40) | (0.58) | (0.41) |
| Net Asset Value, End of Period | $10.31 | $11.32 | $11.35 | $11.22 | $12.47 |
| Total Return2 | (7.00)% | 3.44% | 4.88% | (5.37)% | 20.94% |
| Ratios to Average Net Assets: | | | | | |
| Net expenses | 1.74% | 1.74% | 1.74% | 1.71% | 1.69% |
| Net investment income | 0.55% | 0.58% | 0.87% | 1.08% | 1.42% |
| Expense waiver/reimbursement3 | 0.70% | 0.78% | 0.76% | 0.73% | 0.72% |
| Supplemental Data: | | | | | |
| Net assets, end of period (000 omitted) | $1,986 | $3,444 | $5,748 | $6,998 | $8,897 |
| Portfolio turnover | 44% | 67% | 37% | 35% | 64% |
| 1 | Per share numbers have been calculated using the average shares method. |
| 2 | Based on net asset value, which does not reflect the sales charge, redemption fee or contingent deferred sales charge, if applicable. |
| 3 | This expense decrease is reflected in both the net expense and net investment income ratios shown above. |
See Notes which are an integral part of the Financial Statements
Annual Shareholder Report
Financial Highlights–Class C Shares
(For a Share Outstanding Throughout Each Period)
| Year Ended November 30 | 2013 | 2012 | 2011 | 2010 | 2009 |
| Net Asset Value Beginning of Period | $11.26 | $11.29 | $11.16 | $12.42 | $10.65 |
| Income From Investment Operations: | | | | | |
| Net investment income1 | 0.06 | 0.06 | 0.10 | 0.12 | 0.16 |
| Net realized and unrealized gain (loss) on investments, futures contracts, options and foreign currency transactions | (0.83) | 0.32 | 0.43 | (0.79) | 2.01 |
| TOTAL FROM INVESTMENT OPERATIONS | (0.77) | 0.38 | 0.53 | (0.67) | 2.17 |
| Less Distributions: | | | | | |
| Distributions from net investment income | (0.26) | (0.41) | (0.40) | (0.59) | (0.40) |
| Net Asset Value, End of Period | $10.23 | $11.26 | $11.29 | $11.16 | $12.42 |
| Total Return2 | (7.04)% | 3.49% | 4.90% | (5.41)% | 20.93% |
| Ratios to Average Net Assets: | | | | | |
| Net expenses | 1.74% | 1.74% | 1.74% | 1.71% | 1.70% |
| Net investment income | 0.56% | 0.57% | 0.87% | 1.08% | 1.43% |
| Expense waiver/reimbursement3 | 0.70% | 0.78% | 0.76% | 0.73% | 0.72% |
| Supplemental Data: | | | | | |
| Net assets, end of period (000 omitted) | $8,887 | $11,647 | $12,828 | $14,789 | $19,270 |
| Portfolio turnover | 44% | 67% | 37% | 35% | 64% |
| 1 | Per share numbers have been calculated using the average shares method. |
| 2 | Based on net asset value, which does not reflect the sales charge, redemption fee or contingent deferred sales charge, if applicable. |
| 3 | This expense decrease is reflected in both the net expense and net investment income ratios shown above. |
See Notes which are an integral part of the Financial Statements
Annual Shareholder Report
Statement of Assets and Liabilities
November 30, 2013
| Assets: | | |
| Total investment in securities, at value including $2,092,494 in affiliated holdings (Note 5) (identified cost $64,608,364) | | $59,609,246 |
| Cash | | 5,550 |
| Cash denominated in foreign currencies (identified cost $615,753) | | 620,893 |
| Income receivable | | 630,615 |
| Unrealized appreciation on foreign exchange contracts | | 547,871 |
| Receivable for shares sold | | 126,979 |
| Receivable for investments sold | | 47,999 |
| TOTAL ASSETS | | 61,589,153 |
| Liabilities: | | |
| Unrealized depreciation on foreign exchange contracts | $689,346 | |
| Payable for investments purchased | 588,405 | |
| Payable for shares redeemed | 82,381 | |
| Payable for portfolio accounting fees | 55,881 | |
| Payable for transfer agent fee | 15,711 | |
| Payable for shareholder services fee (Note 5) | 10,645 | |
| Payable for distribution services fee (Note 5) | 6,919 | |
| Payable for Directors'/Trustees' fees (Note 5) | 1,022 | |
| Accrued expenses (Note 5) | 64,286 | |
| TOTAL LIABILITIES | | 1,514,596 |
| Net assets for 5,709,881 shares outstanding | | $60,074,557 |
| Net Assets Consists of: | | |
| Paid-in capital | | $67,717,425 |
| Net unrealized depreciation of investments and translation of assets and liabilities in foreign currency | | (5,131,161) |
| Accumulated net realized loss on investments, options, futures contracts, and foreign currency transactions | | (3,206,768) |
| Undistributed net investment income | | 695,061 |
| TOTAL NET ASSETS | | $60,074,557 |
Annual Shareholder Report
Statement of Assets and Liabilities–continued
| Net Asset Value, Offering Price and Redemption Proceeds Per Share | | |
| Class A Shares: | | |
| Net asset value per share ($49,201,724 ÷ 4,648,886 shares outstanding) $0.0001 par value, 500,000,000 shares authorized | | $10.58 |
| Offering price per share (100/95.50 of $10.58) | | $11.08 |
| Redemption proceeds per share | | $10.58 |
| Class B Shares: | | |
| Net asset value per share ($1,986,185 ÷ 192,615 shares outstanding) $0.0001 par value, 500,000,000 shares authorized | | $10.31 |
| Offering price per share | | $10.31 |
| Redemption proceeds per share (94.50/100 of $10.31) | | $9.74 |
| Class C Shares: | | |
| Net asset value per share ($8,886,648 ÷ 868,380 shares outstanding) $0.0001 par value, 500,000,000 shares authorized | | $10.23 |
| Offering price per share | | $10.23 |
| Redemption proceeds per share (99.00/100 of $10.23) | | $10.13 |
See Notes which are an integral part of the Financial Statements
Annual Shareholder Report
Statement of Operations
Year Ended November 30, 2013
| Investment Income: | | | |
| Dividends received from affiliated holding (Note 5) | | | $61,951 |
| Interest | | | 1,444,231 |
| TOTAL INCOME | | | 1,506,182 |
| Expenses: | | | |
| Investment adviser fee (Note 5) | | $489,027 | |
| Administrative fee (Note 5) | | 50,885 | |
| Custodian fees | | 20,925 | |
| Transfer agent fee | | 102,471 | |
| Directors'/Trustees' fees (Note 5) | | 5,372 | |
| Auditing fees | | 31,200 | |
| Legal fees | | 8,728 | |
| Distribution services fee (Note 5) | | 225,347 | |
| Shareholder services fee (Note 5) | | 161,411 | |
| Account administration fee (Note 2) | | 1,198 | |
| Portfolio accounting fees | | 134,526 | |
| Share registration costs | | 46,719 | |
| Printing and postage | | 29,823 | |
| Insurance premiums (Note 5) | | 4,200 | |
| Tax expenses | | 5,529 | |
| Miscellaneous (Note 5) | | 11,200 | |
| TOTAL EXPENSES | | 1,328,561 | |
Annual Shareholder Report
Statement of Operations–continued
| Waivers and Reimbursement (Note 5): | | | |
| Waiver/reimbursement of investment adviser fee | $(454,903) | | |
| Waiver of distribution services fee | (131,681) | | |
| TOTAL WAIVERS AND REIMBURSEMENT | | (586,584) | |
| Net expenses | | | 741,977 |
| Net investment income | | | 764,205 |
| Realized and Unrealized Gain (Loss) on Investments, Options, Written Options and Foreign Currency Transactions: | | | |
| Net realized loss on investments and foreign currency transactions | | | (692,590) |
| Net realized loss on futures contracts | | | (42,645) |
| Net realized gain on written options | | | 20,957 |
| Realized gain distribution from affiliated investment company shares (Note 5) | | | 3,587 |
| Net change in unrealized depreciation of investments, futures contracts, options and translation of assets and liabilities in foreign currency | | | (4,690,239) |
| Net realized and unrealized loss on investments, options, futures contracts, and foreign currency transactions | | | (5,400,930) |
| Change in net assets resulting from operations | | | $(4,636,725) |
See Notes which are an integral part of the Financial Statements
Annual Shareholder Report
Statement of Changes in Net Assets
| Year Ended November 30 | 2013 | 2012 |
| Increase (Decrease) in Net Assets | | |
| Operations: | | |
| Net investment income | $764,205 | $903,553 |
| Net realized gain (loss) on investments, futures contracts, options and foreign currency transactions | (710,691) | 1,709,593 |
| Net change in unrealized appreciation/depreciation of investments, options, futures contracts and translation of assets and liabilities in foreign currency | (4,690,239) | 493,013 |
| CHANGE IN NET ASSETS RESULTING FROM OPERATIONS | (4,636,725) | 3,106,159 |
| Distributions to Shareholders: | | |
| Distributions from net investment income | | |
| Class A Shares | (1,794,640) | (2,800,481) |
| Class B Shares | (67,870) | (203,228) |
| Class C Shares | (256,284) | (459,262) |
| CHANGE IN NET ASSETS RESULTING FROM DISTRIBUTIONS TO SHAREHOLDERS | (2,118,794) | (3,462,971) |
| Share Transactions: | | |
| Proceeds from sale of shares | 18,376,726 | 12,726,490 |
| Net asset value of shares issued to shareholders in payment of distributions declared | 1,482,297 | 2,471,354 |
| Cost of shares redeemed | (27,829,185) | (24,171,207) |
| CHANGE IN NET ASSETS RESULTING FROM SHARE TRANSACTIONS | (7,970,162) | (8,973,363) |
| Change in net assets | (14,725,681) | (9,330,175) |
| Net Assets: | | |
| Beginning of period | 74,800,238 | 84,130,413 |
| End of period (including undistributed net investment income of $695,061 and $2,117,701, respectively) | $60,074,557 | $74,800,238 |
See Notes which are an integral part of the Financial Statements
Annual Shareholder Report
Notes to Financial Statements
November 30, 2013
1. ORGANIZATION
Federated International Series, Inc. (the “Corporation”) is registered under the Investment Company Act of 1940, as amended (the “Act”), as an open-end management investment company. The Corporation consists of one non-diversified portfolio, Federated International Bond Fund (the “Fund”). The Fund offers three classes of shares: Class A Shares, Class B Shares and Class C Shares. All shares of the Fund have equal rights with respect to voting, except on class-specific matters. The investment objective of the Fund is to obtain a total return on its assets.
2. SIGNIFICANT ACCOUNTING POLICIES
The following is a summary of significant accounting policies consistently followed by the Fund in the preparation of its financial statements. These policies are in conformity with U.S. generally accepted accounting principles (GAAP).
Investment Valuation
In calculating its net asset value (NAV), the Fund generally values investments as follows:
| ■ | Fixed-income securities acquired with remaining maturities greater than 60 days are fair valued using price evaluations provided by a pricing service approved by the Fund's Board of Directors (the “Directors”). |
| ■ | Fixed-income securities and repurchase agreements acquired with remaining maturities of 60 days or less are valued at their amortized cost (adjusted for the accretion of any discount or amortization of any premium) unless the issuer's creditworthiness is impaired or other factors indicate that amortized cost is not an accurate estimate of the investment's fair value, in which case it would be valued in the same manner as a longer-term security. |
| ■ | Derivative contracts listed on exchanges are valued at their reported settlement or closing price. |
| ■ | Over-the-counter (OTC) derivative contracts are fair valued using price evaluations provided by a pricing service approved by the Directors. |
| ■ | Shares of other mutual funds or non-exchange-traded investment companies are valued based upon their reported NAVs. |
| ■ | Equity securities listed on an exchange or traded through a regulated market system are valued at their last reported sale price or official closing price in their principal exchange or market. |
| ■ | For securities that are fair valued in accordance with procedures established by and under the general supervision of the Directors, certain factors may be considered such as: the purchase price of the security, information obtained by contacting the issuer, analysis of the issuer's financial statements or other available documents, fundamental analytical data, the nature and duration of restrictions on disposition, the movement of the market in which the security is normally traded and public trading in similar securities of the issuer or comparable issuers. |
If the Fund cannot obtain a price or price evaluation from a pricing service for an investment, the Fund may attempt to value the investment based upon the mean of bid and asked quotations or fair value the investment based on price evaluations, from one or more dealers. If any price, quotation, price evaluation or other pricing source is not readily available when the NAV is calculated, or if the Fund cannot obtain price evaluations from a pricing service or from
Annual Shareholder Report
more than one dealer for an investment within a reasonable period of time as set forth in the Fund's valuation policies and procedures, the Fund uses the fair value of the investment determined in accordance with the procedures described below. There can be no assurance that the Fund could purchase or sell an investment at the price used to calculate the Fund's NAV.
Fair Valuation and Significant Events Procedures
The Directors have appointed a Valuation Committee comprised of officers of the Fund, Federated Investment Management Company (“Adviser”) and certain of the Adviser's affiliated companies to determine fair value of securities and in overseeing the calculation of the NAV. The Directors have also authorized the use of pricing services recommended by the Valuation Committee to provide fair value evaluations of the current value of certain investments for purposes of calculating the NAV. The Valuation Committee employs various methods for reviewing third-party pricing-service evaluations including periodic reviews of third-party pricing services' policies, procedures and valuation methods (including key inputs and assumptions), transactional back-testing, comparisons of evaluations of different pricing services and review of price challenges by the Adviser based on recent market activity. In the event that market quotations and price evaluations are not available for an investment, the Valuation Committee determines the fair value of the investment in accordance with procedures adopted by the Directors. The Directors periodically review and approve the fair valuations made by the Valuation Committee and any changes made to the procedures.
Factors considered by pricing services in evaluating an investment include the yields or prices of investments of comparable quality, coupon, maturity, call rights and other potential prepayments, terms and type, reported transactions, indications as to values from dealers and general market conditions. Some pricing services provide a single price evaluation reflecting the bid-side of the market for an investment (a “bid” evaluation). Other pricing services offer both bid evaluations and price evaluations indicative of a price between the prices bid and asked for the investment (a “mid” evaluation). The Fund normally uses bid evaluations for U.S. Treasury and Agency securities, mortgage-backed securities and municipal securities. The Fund normally uses mid evaluations for other types of fixed-income securities and OTC derivative contracts. In the event that market quotations and price evaluations are not available for an investment, the fair value of the investment is determined in accordance with procedures adopted by the Directors.
The Directors also have adopted procedures requiring an investment to be priced at its fair value whenever the Adviser determines that a significant event affecting the value of the investment has occurred between the time as of which the price of the investment would otherwise be determined and the time as of which the NAV is computed. An event is considered significant if there is both an affirmative expectation that the investment's value will change in response to the event and a reasonable basis for quantifying the resulting change in value. Examples of significant events that may occur after the close of the principal market on which a security is traded, or after the time of a price evaluation provided by a pricing service or a dealer, include:
| ■ | With respect to securities traded in foreign markets, significant trends in U.S. equity markets or in the trading of foreign securities index futures contracts; |
| ■ | Political or other developments affecting the economy or markets in which an issuer conducts its operations or its securities are traded; and |
| ■ | Announcements concerning matters such as acquisitions, recapitalizations, litigation developments, a natural disaster affecting the issuer's operations or regulatory changes or market developments affecting the issuer's industry. |
Annual Shareholder Report
The Directors have approved the use of a pricing service to determine the fair value of equity securities traded principally in foreign markets when the Adviser determines that there has been a significant trend in the U.S. equity markets or in index futures trading. For other significant events, the Fund may seek to obtain more current quotations or price evaluations from alternative pricing sources. If a reliable alternative pricing source is not available, the Fund will determine the fair value of the investment using another method approved by the Directors.
Repurchase Agreements
The Fund may invest in repurchase agreements for short-term liquidity purposes. It is the policy of the Fund to require the other party to a repurchase agreement to transfer to the Fund's custodian or sub-custodian eligible securities or cash with a market value (after transaction costs) at least equal to the repurchase price to be paid under the repurchase agreement. The eligible securities are transferred to accounts with the custodian or sub-custodian in which the Fund holds a “securities entitlement” and exercises “control” as those terms are defined in the Uniform Commercial Code. The Fund has established procedures for monitoring the market value of the transferred securities and requiring the transfer of additional eligible securities if necessary to equal at least the repurchase price. These procedures also allow the other party to require securities to be transferred from the account to the extent that their market value exceeds the repurchase price or in exchange for other eligible securities of equivalent market value.
The insolvency of the other party or other failure to repurchase the securities may delay the disposition of the underlying securities or cause the Fund to receive less than the full repurchase price. Under the terms of the repurchase agreement, any amounts received by the Fund in excess of the repurchase price and related transaction costs must be remitted to the other party.
The Fund may enter into repurchase agreements in which eligible securities are transferred into joint trading accounts maintained by the custodian or sub-custodian for investment companies and other clients advised by the Fund's Adviser and its affiliates. The Fund will participate on a pro rata basis with the other investment companies and clients in its share of the securities transferred under such repurchase agreements and in its share of proceeds from any repurchase or other disposition of such securities.
Investment Income, Gains and Losses, Expenses and Distributions
Investment transactions are accounted for on a trade-date basis. Realized gains and losses from investment transactions are recorded on an identified-cost basis. Interest income and expenses are accrued daily. Dividend income and distributions to shareholders are recorded on the ex-dividend date. Foreign dividends are recorded on the ex-dividend date or when the Fund is informed of the ex-dividend date. Distributions of net investment income are declared daily and paid annually. Non-cash dividends included in dividend income, if any, are recorded at fair value. Investment income, realized and unrealized gains and losses, and certain fund-level expenses are allocated to each class based on relative average daily net assets, except that Class A Shares, Class B Shares and Class C Shares may bear account administration fees, distribution services fees and shareholder services fees unique to those classes.
Annual Shareholder Report
For the year ended November 30, 2013, account administration fees for the Fund were as follows:
| | Account
Administration
Fees Incurred |
| Class A Shares | $1,198 |
Dividends are declared separately for each class. No class has preferential dividend rights; differences in per share dividend rates are generally due to differences in separate class expenses.
Premium and Discount Amortization
All premiums and discounts on fixed-income securities are amortized/accreted using the effective-interest-rate method.
Federal Taxes
It is the Fund's policy to comply with the Subchapter M provision of the Internal Revenue Code (the “Code”) and to distribute to shareholders each year substantially all of its income. Accordingly, no provision for federal income tax is necessary. As of and during the year ended November 30, 2013, the Fund did not have a liability for any uncertain tax positions. The Fund recognizes interest and penalties, if any, related to tax liabilities as income tax expense in the Statement of Operations. As of November 30, 2013, tax years 2010 through 2013 remain subject to examination by the Fund's major tax jurisdictions, which include the United States of America, the state of Maryland and the Commonwealth of Pennsylvania.
The Fund may be subject to taxes imposed by governments of countries in which it invests. Such taxes are generally based on either income or gains earned or repatriated. The Fund accrues and applies such taxes to net investment income, net realized gains and net unrealized gains as income and/or gains are earned.
Other Taxes
As an open-end management investment company incorporated in the state of Maryland but domiciled in the Commonwealth of Pennsylvania, the Fund is subject to the Pennsylvania Franchise Tax. This franchise tax is assessed annually on the value of the Fund, as represented by average net assets for the tax year.
When-Issued and Delayed-Delivery Transactions
The Fund may engage in when-issued or delayed-delivery transactions. The Fund records when-issued securities on the trade date and maintains security positions such that sufficient liquid assets will be available to make payment for the securities purchased. Securities purchased on a when-issued or delayed-delivery basis are marked to market daily and begin earning interest on the settlement date. Losses may occur on these transactions due to changes in market conditions or the failure of counterparties to perform under the contract.
Futures Contracts
The Fund purchases and sells financial futures contracts to increase return and to manage duration risk. Upon entering into a financial futures contract with a broker, the Fund is required to deposit in a segregated account a specified amount of cash or U.S. government securities which is shown as Restricted Cash in the Statement of Assets and Liabilities. Futures contracts are valued daily and unrealized gains or losses are recorded in a “variation
Annual Shareholder Report
margin” account. Daily, the Fund receives from or pays to the broker a specified amount of cash based upon changes in the variation margin account. When a contract is closed, the Fund recognizes a realized gain or loss. Futures contracts have market risks, including the risk that the change in the value of the contract may not correlate with the changes in the value of the underlying securities. There is minimal counterparty risk to the Fund since futures are exchange traded and the exchange's clearing house, as counterparty to all exchange traded futures, guarantees the futures against default.
At November 30, 2013, the Fund had no outstanding futures contracts.
The average notional value of futures contracts held by the Fund throughout the period was $87,416. This is based on amounts held as of each month-end throughout the fiscal period.
Foreign Exchange Contracts
The Fund may enter into foreign exchange contracts to increase return and to manage currency risk. Purchased contracts are used to acquire exposure to foreign currencies, whereas, contracts to sell are used to hedge the Fund's securities against currency fluctuations. Risks may arise upon entering into these transactions from the potential inability of counterparties to meet the terms of their commitments and from unanticipated movements in security prices or foreign exchange rates. The foreign exchange contracts are adjusted by the daily exchange rate of the underlying currency and any gains or losses are recorded for financial statement purposes as unrealized until the settlement date.
Foreign exchange contracts are subject to Master Netting Agreements (MNA) which are agreements between the Fund and its counterparties that provides for the net settlement of all transactions and collateral with the Fund, through a single payment, in the event of default or termination. Amounts presented on the Portfolio of Investments and Statement of Assets and Liabilities are not net settlement amounts but gross. Foreign exchange contracts outstanding at period end, including net unrealized appreciation/depreciation or net settlement amounts, are listed after the Fund's Portfolio of Investments.
The average value at settlement date payable and receivable of foreign exchange contracts purchased and sold by the Fund throughout the period was $533,079 and $398,473, respectively. This is based on the contracts held as of each month-end throughout the fiscal period.
Foreign Currency Translation
The accounting records of the Fund are maintained in U.S. dollars. All assets and liabilities denominated in foreign currencies (FCs) are translated into U.S. dollars based on the rates of exchange of such currencies against U.S. dollars on the date of valuation. Purchases and sales of securities, income and expenses are translated at the rate of exchange quoted on the respective date that such transactions are recorded. The Fund does not isolate that portion of the results of operations resulting from changes in foreign exchange rates on investments from the fluctuations arising from changes in market prices of securities held. Such fluctuations are included with the net realized and unrealized gain or loss from investments.
Annual Shareholder Report
Reported net realized foreign exchange gains or losses arise from sales of portfolio securities, sales and maturities of short-term securities, sales of FCs, currency gains or losses realized between the trade and settlement dates on securities transactions, the difference between the amounts of dividends, interest and foreign withholding taxes recorded on the Fund's books and the U.S. dollar equivalent of the amounts actually received or paid. Net unrealized foreign exchange gains and losses arise from changes in the value of assets and liabilities other than investments in securities at fiscal year end, resulting from changes in the exchange rate.
Option Contracts
The Fund buys or sells put and call options to increase return and to manage currency risk. The seller (writer) of an option receives a payment or premium, from the buyer, which the writer keeps regardless of whether the buyer exercises the option. When the Fund writes a put or call option, an amount equal to the premium received is recorded as a liability and subsequently marked to market to reflect the current value of the option written. Premiums received from writing options which expire are treated as realized gains. The Fund, as a writer of an option, bears the market risk of an unfavorable change in the price of the underlying reference instrument. When the Fund purchases a put or call option, an amount equal to the premium paid is recorded as an increase to the cost of the investment and subsequently marked to market to reflect the current value of the option purchased. Premiums paid for purchasing options which expire are treated as realized losses. Premiums received/paid for writing/purchasing options which are exercised or closed are added to the proceeds or offset against amounts paid on the underlying reference instrument to determine the realized gain or loss. The risk associated with purchasing put and call options is limited to the premium paid. Options can trade on securities or commodities exchanges. In this case, the exchange sets all the terms of the contract except for the price. Most exchanges require investors to maintain margin accounts through their brokers to cover their potential obligations to the exchange. This protects investors against potential defaults by the counterparty.
The following is a summary of the Fund's written option activity:
| Contracts | Number of
Contracts | Premium |
| Outstanding at November 30, 2012 | — | $— |
| Contracts written | 2,594 | 20,957 |
| Contracts expired | (2,594) | (20,957) |
| Outstanding at November 30, 2013 | — | $— |
The average notional amount of purchased options and average value of written call option contracts held by the Fund throughout the period was $11,998 and a net payable of $3,334, respectively. This is based on amounts held as of each month-end throughout the fiscal period.
Annual Shareholder Report
Additional Disclosure Related to Derivative Instruments
| Fair Value of Derivative Instruments |
| | Asset | Liability |
| | Statement of
Assets and
Liabilities
Location | Fair Value | Statement of
Assets and
Liabilities
Location | Fair Value |
Derivatives not accounted for as
hedging instruments under ASC
Topic 815 | | | | |
| Foreign exchange contracts | Unrealized
appreciation on
foreign exchange
contracts | $547,871 | Unrealized
depreciation
on foreign
exchange
contracts | $689,346 |
The Effect of Derivative Instruments on the Statement of Operations for the Year Ended November 30, 2013
| Amount of Realized Gain or (Loss) on Derivatives Recognized in Income |
| | Futures | Options
Purchased | Written
Options | Forward
Currency
Contracts | Total |
| Foreign exchange contracts | $— | $(233,591) | $20,957 | $(1,005,733) | $(1,218,367) |
| Interest rate contracts | $(42,645) | $— | $— | $— | $(42,645) |
| TOTAL | $(42,645) | $(233,591) | $20,957 | $(1,005,733) | $(1,261,012) |
| Change in Unrealized Appreciation or (Depreciation) on Derivatives Recognized in Income |
| | Options
Purchased | Forward
Currency
Contracts | Total |
| Foreign exchange contracts | $— | $245,463 | $245,463 |
| Interest rate contracts | $12,233 | $— | $12,233 |
| TOTAL | $12,233 | $245,463 | $257,696 |
Other
The preparation of financial statements in conformity with GAAP requires management to make estimates and assumptions that affect the amounts of assets, liabilities, expenses and revenues reported in the financial statements. Actual results could differ from those estimated.
Annual Shareholder Report
3. SHARES OF BENEFICIAL INTEREST
The following tables summarize capital stock activity:
| Year Ended November 30 | 2013 | 2012 |
| Class A Shares: | Shares | Amount | Shares | Amount |
| Shares sold | 1,573,493 | $16,630,815 | 905,663 | $10,369,916 |
| Shares issued to shareholders in payment of distributions declared | 107,486 | 1,214,587 | 175,264 | 1,962,956 |
| Shares redeemed | (2,158,293) | (22,942,098) | (1,570,217) | (17,883,385) |
| NET CHANGE RESULTING FROM CLASS A SHARE TRANSACTIONS | (477,314) | $(5,096,696) | (489,290) | $(5,550,513) |
| Year Ended November 30 | 2013 | 2012 |
| Class B Shares: | Shares | Amount | Shares | Amount |
| Shares sold | 48,705 | $507,659 | 29,383 | $328,059 |
| Shares issued to shareholders in payment of distributions declared | 4,810 | 53,294 | 15,248 | 167,118 |
| Shares redeemed | (165,060) | (1,722,113) | (246,798) | (2,754,157) |
| NET CHANGE RESULTING FROM CLASS B SHARE TRANSACTIONS | (111,545) | $(1,161,160) | (202,167) | $(2,258,980) |
| Year Ended November 30 | 2013 | 2012 |
| Class C Shares: | Shares | Amount | Shares | Amount |
| Shares sold | 119,657 | $1,238,252 | 184,249 | $2,028,515 |
| Shares issued to shareholders in payment of distributions declared | 19,492 | 214,416 | 31,310 | 341,280 |
| Shares redeemed | (305,067) | (3,164,974) | (317,102) | (3,533,665) |
| NET CHANGE RESULTING FROM CLASS C SHARE TRANSACTIONS | (165,918) | $(1,712,306) | (101,543) | $(1,163,870) |
| NET CHANGE RESULTING FROM TOTAL FUND SHARE TRANSACTIONS | (754,777) | $(7,970,162) | (793,000) | $(8,973,363) |
4. FEDERAL TAX INFORMATION
The timing and character of income and capital gain distributions are determined in accordance with income tax regulations, which may differ from GAAP. These differences are primarily due to differing treatments for foreign currency transactions, partnerships, short-term capital distributions from registered investment companies and discount accretion/premium amortization on debt securities.
For the year ended November 30, 2013, permanent differences identified and reclassified among the components of net assets were as follows:
| Increase (Decrease) |
Undistributed
Net Investment
Income (Loss) | Accumulated
Net Realized
Gain (Loss) |
| $(68,051) | $68,051 |
Annual Shareholder Report
Net investment income (loss), net realized gains (losses) and net assets were not affected by the reclassification.
The tax character of distributions as reported on the Statement of Changes in Net Assets for the years ended November 30, 2013 and 2012, was as follows:
| | 2013 | 2012 |
| Ordinary income | $2,118,794 | $3,462,971 |
As of November 30, 2013, the components of distributable earnings on a tax basis were as follows:
| Undistributed ordinary income | $695,061 |
| Net unrealized depreciation | $(5,496,809) |
| Capital loss carryforwards | $(2,841,120) |
The difference between book-basis and tax-basis net unrealized appreciation/depreciation is attributable to differing treatments for partnership investments and discount accretion/premium amortization on debt securities.
At November 30, 2013, the cost of investments for federal tax purposes was $65,115,487. The net unrealized depreciation of investments for federal tax purposes excluding: a) any unrealized appreciation/depreciation resulting from the translation from FCs to U.S. dollars of assets and liabilities other than investments in securities and b) outstanding foreign currency commitments was $5,506,241. This consists of net unrealized appreciation from investments for those securities having an excess of value over cost of $690,274 and net unrealized depreciation from investments for those securities having an excess of cost over value of $6,196,515.
At November 30, 2013, the Fund had a capital loss carryforward of $2,841,120 which will reduce the Fund's taxable income arising from future net realized gains on investments, if any, to the extent permitted by the Code, thereby reducing the amount of distributions to shareholders which would otherwise be necessary to relieve the Fund of any liability for federal income tax. Pursuant to the Code, a net capital loss incurred in taxable years beginning on or before December 22, 2010, is characterized as short-term and may be carried forward for a maximum of eight tax years (“Carryforward Limit”), whereas a net capital loss incurred in taxable years beginning after December 22, 2010, retains its character as either short-term or long-term, does not expire and is required to be utilized prior to the losses which have a Carryforward Limit.
The following schedule summarizes the Fund's capital loss carryforwards and expiration years:
| Expiration Year | Short-Term | Long-Term | Total |
| No expiration | $340,490 | $— | $340,490 |
| 2014 | $ 744,773 | NA | $744,773 |
| 2015 | $ 539,014 | NA | $539,014 |
| 2016 | $ 203,258 | NA | $203,258 |
| 2017 | $ 844,999 | NA | $844,999 |
| 2018 | $ 168,586 | NA | $168,586 |
Annual Shareholder Report
The Fund used capital loss carryforwards of $43,872 to offset taxable capital gains realized during the year ended November 30, 2013.
5. INVESTMENT ADVISER FEE AND OTHER TRANSACTIONS WITH AFFILIATES
Investment Adviser Fee
The advisory agreement between the Fund and the Adviser provides for an annual fee equal to 0.75% of the Fund's average daily net assets. Subject to the terms described in the Expense Limitation note, the Adviser may also voluntarily choose to waive any portion of its fee. For the year ended November 30, 2013, the Adviser voluntarily waived $454,370 of its fee.
Administrative Fee
Federated Administrative Services (FAS), under the Administrative Services Agreement, provides the Fund with administrative personnel and services. For purposes of determining the appropriate rate breakpoint, “Investment Complex” is defined as all of the Federated Funds subject to a fee under the Administrative Services Agreement. The fee paid to FAS is based on the average daily net assets of the Investment Complex as specified below, plus certain out-of-pocket expenses:
| Administrative Fee | Average Daily Net Assets
of the Investment Complex |
| 0.150% | on the first $5 billion |
| 0.125% | on the next $5 billion |
| 0.100% | on the next $10 billion |
| 0.075% | on assets in excess of $20 billion |
Subject to the terms described in the Expense Limitation note, FAS may voluntarily choose to waive any portion of its fee. For the year ended November 30, 2013, the fee paid to FAS was 0.078% of average daily net assets of the Fund.
Distribution Services Fee
The Fund has adopted a Distribution Plan (the “Plan”) pursuant to Rule 12b-1 under the Act. Under the terms of the Plan, the Fund will compensate Federated Securities Corp. (FSC), the principal distributor, from the daily net assets of the Fund's Class A Shares, Class B Shares and Class C Shares to finance activities intended to result in the sale of these shares. The Plan provides that the Fund may incur distribution expenses at the following percentages of average daily net assets annually, to compensate FSC:
| Share Class Name | Percentage of Average Daily
Net Assets of Class |
| Class A Shares | 0.25% |
| Class B Shares | 0.75% |
| Class C Shares | 0.75% |
Annual Shareholder Report
Subject to the terms described in the Expense Limitation note, FSC may voluntarily choose to waive any portion of its fee. For the year ended November 30, 2013, distribution services fees for the Fund were as follows:
| | Distribution
Service Fees
Incurred | Distribution
Services Fees
Waived |
| Class A Shares | $131,840 | $(131,681) |
| Class B Shares | 19,274 | — |
| Class C Shares | 74,233 | — |
| TOTAL | $225,347 | $(131,681) |
When FSC receives fees, it may pay some or all of them to financial intermediaries whose customers purchase shares. For the year ended November 30, 2013, FSC retained $10,850 of fees paid by the Fund.
Sales Charges
Front-end sales charges and contingent deferred sales charges (CDSC) do not represent expenses of the Fund. They are deducted from the proceeds of sales of Fund shares prior to investment or from redemption proceeds prior to remittance, as applicable. For the year ended November 30, 2013, FSC retained $2,968 in sales charges from the sale of Class A Shares. FSC also retained $26, $9,697 and $884 of CDSC relating to redemptions of Class A Shares, Class B Shares and Class C Shares, respectively.
Shareholder Services Fee
The Fund may pay fees (“Service Fees”) up to 0.25% of the average daily net assets of the Fund's Class A Shares, Class B Shares and Class C Shares to financial intermediaries or to Federated Shareholder Services Company (FSSC) for providing services to shareholders and maintaining shareholder accounts. Subject to the terms described in the Expense Limitation note, FSSC may voluntarily reimburse the Fund for Service Fees. For the year ended November 30, 2013, Service Fees for the Fund were as follows:
| | Service Fees
Incurred |
| Class A Shares | $130,242 |
| Class B Shares | 6,425 |
| Class C Shares | 24,744 |
| TOTAL | $161,411 |
For the year ended November 30, 2013, FSSC received $4,811 of Service Fees paid by the Fund.
Interfund Transactions
During the year ended November 30, 2013, the Fund engaged in purchase and sale transactions with funds that have a common investment adviser (or affiliated investment advisers), common Directors/Trustees, and/or common Officers. These purchase and sale transactions complied with Rule 17a-7 under the Act and amounted to $1,664,838 and $1,648,025, respectively.
Annual Shareholder Report
Expense Limitation
The Adviser and certain of its affiliates (which may include FSC, FAS and FSSC) have voluntarily agreed to waive their respective fees and/or reimburse expenses so that the total annual fund operating expenses (as shown in the financial highlights, excluding extraordinary expenses and proxy-related expenses paid by the Fund, if any) paid by the Fund's Class A Shares, Class B Shares and Class C Shares (after the voluntary waivers and reimbursements) will not exceed 0.99%, 1.74% and 1.74% (the “Fee Limit”), respectively, up to but not including the later of (the “Termination Date”): (a) February 1, 2015; or (b) the date of the Fund's next effective Prospectus. While the Adviser and its applicable affiliates currently do not anticipate terminating or increasing these arrangements prior to the Termination Date, these arrangements may only be terminated or the Fee Limit increased prior to the Termination Date with the agreement of the Directors.
General
Certain Officers and Directors of the Fund are Officers and Directors or Trustees of certain of the above companies. To efficiently facilitate payment, Directors'/Trustees' fees and certain expenses related to conducting meetings of the Directors/Trustees and other miscellaneous expenses are paid by an affiliate of the Adviser which in due course are reimbursed by the Fund.
Transactions Involving Affiliated Holdings
Affiliated holdings are mutual funds which are managed by the Adviser or an affiliate of the Adviser. The Adviser has agreed to reimburse the Fund for certain investment adviser fees as a result of transactions in other affiliated mutual funds. For the year ended November 30, 2013, the Adviser reimbursed $533. Transactions with the affiliated holdings during the year ended November 30, 2013, were as follows:
| | Federated
Prime Value
Obligations
Fund,
Institutional
Shares | Federated
Project and
Trade Finance
Core | Total of
Affiliated
Transactions |
| Balance of Shares Held 11/30/2012 | 200,658 | 129,328 | 329,986 |
| Purchases/Additions | 17,636,959 | 7,143 | 17,644,102 |
| Sales/Reductions | (17,074,353) | — | (17,074,353) |
| Balance of Shares Held 11/30/2013 | 763,264 | 136,471 | 899,735 |
| Value | $763,264 | $1,329,230 | $2,092,494 |
| Dividend Income | $452 | $61,499 | $61,951 |
| Capital Gain Distribution | $— | $3,587 | $3,587 |
6. Investment TRANSACTIONS
Purchases and sales of investments, excluding long-term U.S. government securities and short-term obligations, for the year ended November 30, 2013 were as follows:
| Purchases | $27,534,879 |
| Sales | $35,235,580 |
Annual Shareholder Report
7. CONCENTRATION OF RISK
The Fund invests in securities of non-U.S. issuers. Political or economic developments may have an effect on the liquidity and volatility of portfolio securities and currency holdings.
The Fund may invest a portion of its assets in securities of companies that are deemed by the Fund's management to be classified in similar business sectors. Economic developments may have an effect on the liquidity and volatility of the portfolio securities.
8. LINE OF CREDIT
The Fund participates in a $100,000,000 unsecured, uncommitted revolving line of credit (LOC) agreement with PNC Bank. The LOC was made available for extraordinary or emergency purposes, primarily for financing redemption payments. Borrowings are charged interest at a rate offered to the Fund by PNC Bank at the time of the borrowing. As of November 30, 2013, there were no outstanding loans. During the year ended November 30, 2013, the Fund did not utilize the LOC.
9. INTERFUND LENDING
Pursuant to an Exemptive Order issued by the Securities and Exchange Commission, the Fund, along with other funds advised by subsidiaries of Federated Investors, Inc., may participate in an interfund lending program. This program provides an alternative credit facility allowing the Fund to borrow from other participating affiliated funds. As of November 30, 2013, there were no outstanding loans. During the year ended November 30, 2013, the program was not utilized.
Annual Shareholder Report
Report of Independent Registered Public Accounting Firm
TO THE BOARD OF DIRECTORS OF Federated inTERNATIONAL series funds, inc. AND SHAREHOLDERS OF federated INTERNATIONAL bond fund:
We have audited the accompanying statement of assets and liabilities of Federated International Bond Fund (the “Fund”) (the sole portfolio of Federated International Series, Inc.), including the portfolio of investments, as of November 30, 2013 and the related statement of operations for the year then ended, the statement of changes in net assets for each of the two years in the period then ended and the financial highlights for each of the five years in the period then ended. These financial statements and financial highlights are the responsibility of the Fund's management. Our responsibility is to express an opinion on these financial statements and financial highlights based on our audits.
We conducted our audits in accordance with standards of the Public Company Accounting Oversight Board (United States). Those standards require that we plan and perform the audit to obtain reasonable assurance about whether the financial statements and financial highlights are free of material misstatement. We were not engaged to perform an audit of the Fund's internal control over financial reporting. Our audits included consideration of internal control over financial reporting as a basis for designing audit procedures that are appropriate in the circumstances, but not for the purpose of expressing an opinion on the effectiveness of the Fund's internal control over financial reporting. Accordingly, we express no such opinion. An audit also includes examining, on a test basis, evidence supporting the amounts and disclosures in the financial statements and financial highlights, assessing the accounting principles used and significant estimates made by management, and evaluating the overall financial statement presentation. Our procedures included confirmation of securities owned as of November 30, 2013, by correspondence with the custodian and others or by other appropriate auditing procedures where replies from others were not received. We believe that our audits provide a reasonable basis for our opinion.
In our opinion, the financial statements and financial highlights referred to above present fairly, in all material respects, the financial position of the Federated International Bond Fund, the sole portfolio of Federated International Series, Inc., at November 30, 2013, the results of its operations for the year then ended, the changes in its net assets for each of the two years in the period then ended and the financial highlights for each of the five years in the period then ended, in conformity with U.S. generally accepted accounting principles.
Boston, Massachusetts
January 24, 2014
Annual Shareholder Report
Shareholder Expense Example (unaudited)
As a shareholder of the Fund, you incur two types of costs: (1) transaction costs, including sales charges (loads) on purchase or redemption payments; and (2) ongoing costs, including management fees and to the extent applicable, distribution (12b-1) fees and/or shareholder services fees and other Fund expenses. This Example is intended to help you to understand your ongoing costs (in dollars) of investing in the Fund and to compare these costs with the ongoing costs of investing in other mutual funds. It is based on an investment of $1,000 invested at the beginning of the period and held for the entire period from June 1, 2013 to November 30, 2013.
ACTUAL EXPENSES
The first section of the table below provides information about actual account values and actual expenses. You may use the information in this section, together with the amount you invested, to estimate the expenses that you incurred over the period. Simply divide your account value by $1,000 (for example, an $8,600 account value divided by $1,000 = 8.6), then multiply the result by the number in the first section under the heading entitled “Expenses Paid During Period” to estimate the expenses attributable to your investment during this period.
HYPOTHETICAL EXAMPLE FOR COMPARISON PURPOSES
The second section of the table below provides information about hypothetical account values and hypothetical expenses based on the Fund's actual expense ratio and an assumed rate of return of 5% per year before expenses, which is not the Fund's actual return. Thus, you should not use the hypothetical account values and expenses to estimate the actual ending account balance or your expenses for the period. Rather, these figures are required to be provided to enable you to compare the ongoing costs of investing in the Fund with other funds. To do so, compare this 5% hypothetical example with the 5% hypothetical examples that appear in the shareholder reports of the other funds.
Annual Shareholder Report
Please note that the expenses shown in the table are meant to highlight your ongoing costs only and do not reflect any transaction costs, such as sales charges (loads) on purchase or redemption payments. Therefore, the second section of the table is useful in comparing ongoing costs only, and will not help you determine the relative total costs of owning different funds. In addition, if these transaction costs were included, your costs would have been higher.
| | Beginning
Account Value
6/1/2013 | Ending
Account Value
11/30/2013 | Expenses Paid
During Period1 |
| Actual: | | | |
| Class A Shares | $1,000 | $1,022.20 | $5.02 |
| Class B Shares | $1,000 | $1,018.80 | $8.81 |
| Class C Shares | $1,000 | $1,018.90 | $8.81 |
Hypothetical (assuming a 5% return
before expenses): | | | |
| Class A Shares | $1,000 | $1,020.10 | $5.01 |
| Class B Shares | $1,000 | $1,016.34 | $8.80 |
| Class C Shares | $1,000 | $1,016.34 | $8.80 |
| 1 | Expenses are equal to the Fund's annualized net expense ratios, multiplied by the average account value over the period, multiplied by 183/365 (to reflect the one-half-year period). The annualized net expense ratios are as follows: |
| Class A Shares | 0.99% |
| Class B Shares | 1.74% |
| Class C Shares | 1.74% |
Annual Shareholder Report
Shareholder Meeting Results (unaudited)
A Special Meeting of Shareholders of Federated International Series, Inc. (the “Corporation”), of which the Fund is a portfolio, was held on October 28, 2013. On August 29, 2013, the record date for shareholders voting at the meeting, there were 5,944,427.678 total outstanding shares of the Corporation.
The following item was considered by shareholders of the Corporation and the results of their voting were as follows:
AGENDA ITEM
Proposal to elect certain Directors of the Corporation:1
| Name | For | Withheld |
| John T. Collins | 4,437,225.632 | 28,672.228 |
| Maureen Lally-Green | 4,418,104.568 | 47,793.292 |
| Thomas M. O'Neill | 4,437,225.632 | 28,672.228 |
| P. Jerome Richey | 4,421,832.279 | 44,065.581 |
| 1 | The following Directors continued their terms:
John F. Donahue, J. Christopher Donahue, Maureen Lally-Green (having been previously appointed by the Board), Peter E. Madden, Charles F. Mansfield, Jr., Thomas M. O'Neill (having been previously appointed by the Board), and John S. Walsh. |
Board of Directors and Corporation Officers
The Board of Directors is responsible for managing the Corporation's business affairs and for exercising all the Corporation's powers except those reserved for the shareholders. The following tables give information about each Director and the senior officers of the Fund. Where required, the tables separately list Directors who are “interested persons” of the Fund (i.e., “Interested” Directors) and those who are not (i.e., “Independent” Directors). Unless otherwise noted, the address of each person listed is Federated Investors Tower, 1001 Liberty Avenue, Pittsburgh, PA 15222. The address of all Independent Directors listed is 4000 Ericsson Drive, Warrendale, PA 15086-7561; Attention: Mutual Fund Board. As of December 31, 2013, the Corporation comprised one portfolio(s), and the Federated Fund Family consisted of 42 investment companies (comprising 135 portfolios). Unless otherwise noted, each Officer is elected annually. Unless otherwise noted, each Director oversees all portfolios in the Federated Fund Family and serves for an indefinite term. The Fund's Statement of Additional Information includes additional information about Corporation Directors and is available, without charge and upon request, by calling 1-800-341-7400.
In Memoriam - John F. Cunningham, Independent Director
With deep sadness, Federated announces the passing of John F. Cunningham, who served as an independent member of the Board of the Federated Fund Family since 1999. Mr. Cunningham's savvy business acumen and incisive intellect made him a powerful force on the Federated Fund Board. He was an advocate for shareholders and a respected colleague within the Federated family. Mr. Cunningham enjoyed an outstanding career in technology, having served as President and in other Senior Executive positions with leading companies in the industry. Federated expresses gratitude to Mr. Cunningham for his fine contributions as a Board member, colleague and friend. He will be greatly missed.
Interested DIRECTORS Background
Name
Birth Date
Positions Held with Corporation
Date Service Began | Principal Occupation(s) for Past Five Years,
Other Directorships Held and Previous Position(s) |
John F. Donahue*
Birth Date: July 28, 1924
Director
Began serving: March 1984 | Principal Occupations: Director or Trustee of the Federated Fund Family; Chairman and Director, Federated Investors, Inc.; Chairman of the Federated Fund Family's Executive Committee.
Previous Positions: Chairman of the Federated Fund Family; Trustee, Federated Investment Management Company; Chairman and Director, Federated Investment Counseling. |
Annual Shareholder Report
Name
Birth Date
Positions Held with Corporation
Date Service Began | Principal Occupation(s) for Past Five Years,
Other Directorships Held and Previous Position(s) |
J. Christopher Donahue*
Birth Date: April 11, 1949
President and Director
Began serving: January 2000 | Principal Occupations: Principal Executive Officer and President of certain of the Funds in the Federated Fund Family; Director or Trustee of the Funds in the Federated Fund Family; President, Chief Executive Officer and Director, Federated Investors, Inc.; Chairman and Trustee, Federated Investment Management Company; Trustee, Federated Investment Counseling; Chairman and Director, Federated Global Investment Management Corp.; Chairman, Federated Equity Management Company of Pennsylvania and Passport Research, Ltd. (investment advisory subsidiary of Federated); Trustee, Federated Shareholder Services Company; Director, Federated Services Company.
Previous Positions: President, Federated Investment Counseling; President and Chief Executive Officer, Federated Investment Management Company, Federated Global Investment Management Corp. and Passport Research, Ltd. |
| * | Family relationships and reasons for “interested” status: John F. Donahue is the father of J. Christopher Donahue; both are “interested” due to their beneficial ownership of shares of Federated Investors, Inc. and the positions they hold with Federated and its subsidiaries. |
INDEPENDENT DIRECTORS Background
Name
Birth Date
Positions Held with Corporation
Date Service Began | Principal Occupation(s) for Past Five Years,
Other Directorships Held, Previous Position(s) and Qualifications |
John T. Collins
Birth Date: January 24, 1947
Director
Began serving: October 2013 | Principal Occupations: Director or Trustee of the Federated Fund Family; Chairman and CEO, The Collins Group, Inc. (a private equity firm).
Other Directorships Held: Chairman Emeriti, Bentley University; Director, Sterling Suffolk Downs, Inc.; Former Director, National Association of Printers and Lithographers.
Previous Positions: Director and Audit Committee Member, Bank of America Corp.
Qualifications: Business management and director experience. |
Annual Shareholder Report
Name
Birth Date
Positions Held with Corporation
Date Service Began | Principal Occupation(s) for Past Five Years,
Other Directorships Held, Previous Position(s) and Qualifications |
Maureen Lally-Green
Birth Date: July 5, 1949
Director
Began serving: August 2009 | Principal Occupations: Director or Trustee of the Federated Fund Family; Associate General Secretary and Director, Office for Church Relations, Diocese of Pittsburgh; Adjunct Professor of Law, Duquesne University School of Law; Superior Court of Pennsylvania (service began 1998 and ended July 2009).
Other Directorships Held: Director, Consol Energy (service started June 2013); Director, Auberle (service ended December 2013); Member, Pennsylvania State Board of Education; Director, Saint Vincent College; Director, Ireland Institute of Pittsburgh (service ended December 2013); Director and Chair, UPMC Mercy Hospital; Regent, St. Vincent Seminary; Director, Epilepsy Foundation of Western and Central Pennsylvania; Director, Saint Thomas More Society (service ended December 2013); Director, Our Campaign for the Church Alive!, Inc.; Director, Pennsylvania Bar Institute (2013-present); Director, Cardinal Wuerl North Catholic High School (2013-present).
Previous Position: Professor of Law, Duquesne University School of Law, Pittsburgh (1983-1998).
Qualifications: Legal and director experience. |
Peter E. Madden
Birth Date: March 16, 1942
Director
Began serving: August 1991 | Principal Occupation: Director or Trustee, and Chairman of the Board of Directors or Trustees, of the Federated Fund Family.
Previous Positions: Representative, Commonwealth of Massachusetts General Court; President, Chief Operating Officer and Director, State Street Bank and Trust Company and State Street Corporation (retired); Director, VISA USA and VISA International; Chairman and Director, Massachusetts Bankers Association; Director, Depository Trust Corporation; Director, The Boston Stock Exchange.
Qualifications: Business management, mutual fund services and director experience. |
Charles F. Mansfield, Jr.
Birth Date: April 10, 1945
Director
Began serving: January 1999 | Principal Occupations: Director or Trustee of the Federated Fund Family; Management Consultant.
Previous Positions: Chief Executive Officer, PBTC International Bank; Partner, Arthur Young & Company (now Ernst & Young LLP); Chief Financial Officer of Retail Banking Sector, Chase Manhattan Bank; Senior Vice President, HSBC Bank USA (formerly Marine Midland Bank); Vice President, Citibank; Assistant Professor of Banking and Finance, Frank G. Zarb School of Business, Hofstra University; Executive Vice President, DVC Group, Inc. (marketing, communications and technology).
Qualifications: Banking, business management, education and director experience. |
Annual Shareholder Report
Name
Birth Date
Positions Held with Corporation
Date Service Began | Principal Occupation(s) for Past Five Years,
Other Directorships Held, Previous Position(s) and Qualifications |
Thomas M. O'Neill
Birth Date: June 14, 1951
Director
Began serving: October 2006 | Principal Occupations: Director or Trustee, Vice Chairman of the Audit Committee of the Federated Fund Family; Sole Proprietor, Navigator Management Company (investment and strategic consulting).
Other Directorships Held: Board of Overseers, Children's Hospital of Boston; Visiting Committee on Athletics, Harvard College; Board of Directors, Medicines for Humanity; Board of Directors, The Golisano Children's Museum of Naples, Florida.
Previous Positions: Chief Executive Officer and President, Managing Director and Chief Investment Officer, Fleet Investment Advisors; President and Chief Executive Officer, Aeltus Investment Management, Inc.; General Partner, Hellman, Jordan Management Co., Boston, MA; Chief Investment Officer, The Putnam Companies, Boston, MA; Credit Analyst and Lending Officer, Fleet Bank; Director and Consultant, EZE Castle Software (investment order management software); Director, Midway Pacific (lumber).
Qualifications: Business management, mutual fund, director and investment experience. |
P. Jerome Richey
Birth Date: February 23, 1949
Director
Began serving: October 2013 | Principal Occupations: Director or Trustee of the Federated Fund Family; General Counsel, University of Pittsburgh.
Other Directorships Held: Board Chairman, Epilepsy Foundation of Western Pennsylvania; Board Member, World Affairs Council of Pittsburgh.
Previous Positions: Chief Legal Officer and Executive Vice President, CONSOL Energy Inc.; Shareholder, Buchanan Ingersoll & Rooney PC (a law firm).
Qualifications: Business management, legal and director experience. |
John S. Walsh
Birth Date: November 28, 1957
Director
Began serving: January 1999 | Principal Occupations: Director or Trustee, Chairman of the Audit Committee of the Federated Fund Family; President and Director, Heat Wagon, Inc. (manufacturer of construction temporary heaters); President and Director, Manufacturers Products, Inc. (distributor of portable construction heaters); President, Portable Heater Parts, a division of Manufacturers Products, Inc.
Previous Position: Vice President, Walsh & Kelly, Inc.
Qualifications: Business management and director experience. |
Annual Shareholder Report
OFFICERS
Name
Birth Date
Address
Positions Held with Corporation
Date Service Began | Principal Occupation(s) for Past Five Years
and Previous Position(s) |
John W. McGonigle
Birth Date: October 26, 1938
EXECUTIVE VICE PRESIDENT AND SECRETARY
Officer since: March 1984 | Principal Occupations: Executive Vice President and Secretary of the Federated Fund Family; Vice Chairman, Executive Vice President, Secretary and Director, Federated Investors, Inc.
Previous Positions: Trustee, Federated Investment Management Company and Federated Investment Counseling; Director, Federated Global Investment Management Corp., Federated Services Company and Federated Securities Corp. |
Lori A. Hensler
Birth Date: January 6, 1967
TREASURER
Officer since: April 2013 | Principal Occupations: Principal Financial Officer and Treasurer of the Federated Fund Family; Senior Vice President, Federated Administrative Services; Financial and Operations Principal for Federated Securities Corp. and Edgewood Services, Inc.; and Assistant Treasurer, Federated Investors Trust Company. Ms. Hensler has received the Certified Public Accountant designation.
Previous Positions: Controller of Federated Investors, Inc.; Senior Vice President and Assistant Treasurer, Federated Investors Management Company; Treasurer, Federated Investors Trust Company; Assistant Treasurer, Federated Administrative Services, Federated Administrative Services, Inc., Federated Securities Corp., Edgewood Services, Inc., Federated Advisory Services Company, Federated Equity Management Company of Pennsylvania, Federated Global Investment Management Corp., Federated Investment Counseling, Federated Investment Management Company, Passport Research, Ltd., and Federated MDTA, LLC; Financial and Operations Principal for Federated Securities Corp., Edgewood Services, Inc. and Southpointe Distribution Services, Inc. |
Peter J. Germain
Birth Date: September 3, 1959
CHIEF LEGAL OFFICER
Officer since: January 2005 | Principal Occupations: Mr. Germain is Chief Legal Officer of the Federated Fund Family. He is General Counsel and Vice President, Federated Investors, Inc.; President, Federated Administrative Services and Federated Administrative Services, Inc.; Vice President, Federated Securities Corp.; Secretary, Federated Private Asset Management, Inc.; and Secretary, Retirement Plan Service Company of America. Mr. Germain joined Federated in 1984 and is a member of the Pennsylvania Bar Association.
Previous Positions: Deputy General Counsel, Special Counsel, Managing Director of Mutual Fund Services, Federated Investors, Inc.; Senior Vice President, Federated Services Company; and Senior Corporate Counsel, Federated Investors, Inc. |
Richard B. Fisher
Birth Date: May 17, 1923
VICE PRESIDENT
Officer since: March 1984 | Principal Occupations: Vice Chairman or Vice President of some of the Funds in the Federated Fund Family; Vice Chairman, Federated Investors, Inc.; Chairman, Federated Securities Corp.
Previous Positions: President and Director or Trustee of some of the Funds in the Federated Fund Family; Executive Vice President, Federated Investors, Inc.; Director and Chief Executive Officer, Federated Securities Corp. |
Annual Shareholder Report
Name
Birth Date
Address
Positions Held with Corporation
Date Service Began | Principal Occupation(s) for Past Five Years
and Previous Position(s) |
Brian P. Bouda
Birth Date: February 28, 1947
CHIEF COMPLIANCE OFFICER AND SENIOR VICE PRESIDENT
Officer since: August 2004 | Principal Occupations: Senior Vice President and Chief Compliance Officer of the Federated Fund Family; Vice President and Chief Compliance Officer of Federated Investors, Inc. and Chief Compliance Officer of certain of its subsidiaries. Mr. Bouda joined Federated in 1999 and is a member of the American Bar Association and the State Bar Association of Wisconsin.
Previous Positions: Served in Senior Management positions with a large regional banking organization. |
Stephen F. Auth
Birth Date: September 3, 1956
450 Lexington Avenue
Suite 3700
New York, NY 10017-3943
CHIEF INVESTMENT OFFICER
Officer since: January 2003 | Principal Occupations: Stephen F. Auth is Chief Investment Officer of various Funds in the Federated Fund Family; Executive Vice President, Federated Investment Counseling, Federated Global Investment Management Corp. and Federated Equity Management Company of Pennsylvania.
Previous Positions: Executive Vice President, Federated Investment Management Company and Passport Research, Ltd. (investment advisory subsidiary of Federated); Senior Vice President, Global Portfolio Management Services Division; Senior Vice President, Federated Investment Management Company and Passport Research, Ltd.; Senior Managing Director and Portfolio Manager, Prudential Investments. |
Robert J. Ostrowski
Birth Date: April 26, 1963
Chief Investment Officer
Officer since: May 2004 | Principal Occupations: Robert J. Ostrowski joined Federated in 1987 as an Investment Analyst and became a Portfolio Manager in 1990. He was named Chief Investment Officer of Federated's taxable fixed-income products in 2004 and also serves as a Senior Portfolio Manager. Mr. Ostrowski became an Executive Vice President of the Fund's Adviser in 2009 and served as a Senior Vice President of the Fund's Adviser from 1997 to 2009. Mr. Ostrowski has received the Chartered Financial Analyst designation. He received his M.S. in Industrial Administration from Carnegie Mellon University. |
Ihab Salib
Birth Date: December 14, 1964
VICE PRESIDENT
Officer since: May 2006
Portfolio Manager since:
July 2002 | Principal Occupations: Ihab Salib has been a Portfolio Manager of the Fund since July 2002. He is Vice President of the Trust with respect to the Fund Mr. Salib joined Federated in April 1999 as a Senior Fixed-Income Trader/Assistant Vice President of the Fund's Adviser. In July 2000, he was named a Vice President of the Fund's Adviser and in January 2007 he was named a Senior Vice President of the Fund's Adviser. He has served as a Portfolio Manager since January 2002. From January 1994 through March 1999, Mr. Salib was employed as a Senior Global Fixed-Income Analyst with UBS Brinson, Inc. Mr. Salib received his B.A. with a major in Economics from Stony Brook University. |
Annual Shareholder Report
Evaluation and Approval of Advisory Contract–May 2013
Federated International Bond Fund (the “Fund”)
Following a review and recommendation of approval by the Fund's independent directors, the Fund's Board reviewed and approved at its May 2013 meetings the Fund's investment advisory contract for an additional one-year term. The Board's decision regarding the contract reflects the exercise of its business judgment on whether to continue the existing arrangements.
In this connection, the Federated Funds' Board had previously appointed a Senior Officer, whose duties include specified responsibilities relating to the process by which advisory fees are to be charged to a Federated fund. The Senior Officer has the authority to retain consultants, experts, or staff as may be reasonably necessary to assist in the performance of his duties, reports directly to the Board, and may be terminated only with the approval of a majority of the independent members of the Board. The Senior Officer prepared and furnished to the Board an independent, written evaluation that covered topics discussed below (the “Evaluation”). The Board considered that Evaluation, along with other information, in deciding to approve the advisory contract.
The Board is also familiar with and considered judicial decisions concerning allegedly excessive investment advisory fees, which have indicated that the following factors may be relevant to an Adviser's fiduciary duty with respect to its receipt of compensation from a fund: the nature and quality of the services provided by the Adviser to a fund and its shareholders, including the performance and expenses of the fund and of comparable funds; the Adviser's cost of providing the services, including the profitability to the Adviser of providing advisory services to a fund; the extent to which the Adviser may realize “economies of scale” as a fund grows larger and, if such economies exist, whether they have been shared with a fund and its shareholders or the family of funds; any “fall-out financial benefits” that accrue to the Adviser because of its relationship with a fund (including research services received from brokers that execute fund trades and any fees paid to affiliates of the Adviser for services rendered to a fund); comparative fee structures, including a comparison of fees paid to the Adviser with those paid by similar funds; and the extent to which the Board members are fully informed about all facts the Board deems relevant to its consideration of the Adviser's services and fees. Consistent with these judicial decisions, the Board also considered management fees charged to institutional and other clients of the Adviser for what might be viewed as like services. The Board was aware of these factors and was guided by them in its review of the Fund's advisory contract to the extent it considered them to be appropriate and relevant, as discussed further below.
Annual Shareholder Report
The Board considered and weighed these circumstances in light of its substantial accumulated experience in governing the Fund and working with Federated on matters relating to the Federated funds, and was assisted in its deliberations by independent legal counsel. Throughout the year, and in connection with its May meetings, the Board requested and received substantial and detailed information about the Fund and the Federated organization that was in addition to the extensive materials that comprise and accompany the Senior Officer's Evaluation. Federated provided much of this information at each regular meeting of the Board, and furnished additional substantial information in connection with the May meeting at which the Board's formal review of the advisory contract occurred. At this May meeting, senior management of the Adviser also met with the independent directors and their counsel to discuss the materials presented and any other matters thought relevant by the Adviser or the directors. Between regularly scheduled meetings, the Board also received information on particular matters as the need arose. Thus, the Board's consideration of the advisory contract included review of the Senior Officer's Evaluation, accompanying data and additional information covering such matters as: the Adviser's investment philosophy, revenue, profitability, personnel and processes; investment and operating strategies; the Fund's short- and long-term performance (in absolute terms, both on a gross basis and net of expenses, as well as in relationship to its particular investment program and certain competitor or “peer group” funds and/or other benchmarks, as appropriate), and comments on the reasons for performance; the Fund's investment objectives; the Fund's expenses (including the advisory fee itself and the overall expense structure of the Fund, both in absolute terms and relative to similar and/or competing funds, with due regard for contractual or voluntary expense limitations); the use and allocation of brokerage commissions derived from trading the Fund's portfolio securities (if any); and the nature, quality and extent of the advisory and other services provided to the Fund by the Adviser and its affiliates. The Board also considered the preferences and expectations of Fund shareholders; the entrepreneurial risk assumed by the Adviser in sponsoring the funds; the continuing state of competition in the mutual fund industry and market practices; the range of comparable fees for similar funds in the mutual fund industry; the Fund's relationship to the Federated family of funds which include a comprehensive array of funds with different investment objectives, policies and strategies which are available for exchange without the incurrence of additional sales charges; compliance and audit reports concerning the Federated funds and the Federated companies that service them (including communications from regulatory agencies), as well as Federated's responses to any issues raised therein; and relevant developments in the mutual fund industry and how the Federated funds and/or Federated are responding to them. The Board's evaluation process is evolutionary. The criteria considered and the emphasis placed on relevant criteria change in recognition of changing circumstances in the mutual fund marketplace.
Annual Shareholder Report
While mindful that courts have cautioned against giving such comparisons too much weight, the Board has found the use of comparisons of the Fund's fees and expenses to other mutual funds with comparable investment programs to be relevant. The Board focused on comparisons with other similar mutual funds more heavily than non-mutual fund products or services because it is believed that they are more relevant. For example, other mutual funds are the products most like the Fund, they are readily available to Fund shareholders as alternative investment vehicles, and they are the type of investment vehicle in fact chosen and maintained by the Fund's investors. The range of their fees and expenses therefore appears to be a relevant indicator of what consumers have found to be reasonable in the precise marketplace in which the Fund competes.
It was noted in the materials for the Board meeting that for the period covered by the Evaluation, the Fund's investment advisory fee was waived in its entirety. The Board reviewed the contractual fee rate and other expenses of the Fund with the Adviser, noting that the overall expense structure of the Fund, after waivers and expense reimbursements, was below the median of the relevant peer group, and was satisfied that the overall expense structure of the Fund remained competitive.
By contrast, the Senior Officer has reviewed Federated's fees for providing advisory services to products outside the Federated family of funds (e.g., institutional and separate accounts). He concluded that mutual funds and institutional accounts are inherently different products. Those differences include, but are not limited to, different types of targeted investors; being subject to different laws and regulations; different legal structures; different average account sizes; different associated costs; different portfolio management techniques made necessary by different cash flows; and the time spent by portfolio managers and their teams, funds financial services, legal, compliance and risk management in reviewing securities pricing, addressing different administrative responsibilities, addressing different degrees of risk associated with management and a variety of different costs. The Senior Officer did not consider these fee schedules to be determinative in judging the appropriateness of mutual fund advisory fees.
The Fund's ability to deliver competitive performance when compared to its peer group was also deemed to be relevant by the Board as a useful indicator of how the Adviser is executing the Fund's investment program, which in turn assisted the Board in reaching a conclusion that the nature, extent, and quality of the Adviser's investment management services were such as to warrant continuation of the advisory contract.
The Senior Officer reviewed information compiled by Federated, using data supplied by independent fund ranking organizations, regarding the performance of, and fees charged by, other mutual funds, noting his view that comparisons to fund peer groups are relevant, though not conclusive in judging the reasonableness of proposed fees.
Annual Shareholder Report
The Fund's performance fell below the median of the relevant peer group for the one-year, three-year and five-year periods covered by the Evaluation. The Board discussed the Fund's performance with the Adviser and recognized the efforts being undertaken by the Adviser. The Board will continue to monitor these efforts and the performance of the Fund.
The Board also received financial information about Federated, including information regarding the compensation and benefits Federated derived from its relationships with the Federated funds. This information covered not only the fees under the advisory contracts, but also fees received by Federated's subsidiaries for providing other services to the Federated funds under separate contracts (e.g., for serving as the Federated funds' administrator). The information also detailed any indirect benefit Federated may derive from its receipt of research services from brokers who execute Federated fund trades. In addition, the Board considered the fact that, in order for a fund to be competitive in the marketplace, Federated and its affiliates frequently waived fees and/or reimbursed expenses and have disclosed to fund investors and/or indicated to the Board their intention to do so in the future, where appropriate. Moreover, the Board receives regular reporting as to the institution, adjustment or elimination of these voluntary waivers.
Federated furnished information, requested by the Senior Officer, that reported revenues on a fund-by-fund basis and made estimates of the allocation of expenses on a fund-by-fund basis, using allocation methodologies specified by the Senior Officer. The Senior Officer noted that, while these cost allocation reports apply consistent allocation processes, the inherent difficulties in arbitrarily allocating costs continues to cause the Senior Officer to question the precision of the process and to conclude that such reports may be unreliable, since a single change in an allocation estimate can dramatically alter the resulting estimate of cost and/or profitability of a fund. The allocation information was considered in the analysis by the Board but was determined to be of limited use.
The Board and the Senior Officer also reviewed information compiled by Federated comparing profitability information for Federated to other publicly held fund management companies. In this regard, the Senior Officer noted the limited availability of such information, but nonetheless concluded that Federated's profit margins did not appear to be excessive. The Board agreed with this assessment.
The Senior Officer's Evaluation also discussed the notion of possible realization of “economies of scale” as a fund grows larger. The Board considered in this regard that the Adviser has made significant and long-term investments in areas that support all of the Federated family of funds, such as personnel and processes for the portfolio management, shareholder services, compliance, internal audit, and risk management functions; and systems technology; and that the benefits of these efforts (as well as any economies, should they exist) were likely to be enjoyed by the fund family as a whole. Finally, the Board also noted the absence of any applicable regulatory or industry guidelines on this subject,
Annual Shareholder Report
which (as discussed in the Senior Officer's Evaluation) is compounded by the lack of any common industry practice or general pattern with respect to structuring fund advisory fees with “breakpoints” that serve to reduce the fee as the fund attains a certain size.
The Senior Officer noted that, subject to the comments and recommendations made within his Evaluation, his observations and the information accompanying the Evaluation supported a finding by the Board that the management fees for each of the funds were reasonable. Under these circumstances, no changes were recommended to, and no objection was raised to, the continuation of the Fund's advisory contract.
In its decision to continue an existing investment advisory contract, the Board was mindful of the potential disruptions of the Fund's operations and various risks, uncertainties and other effects that could occur as a result of a decision to terminate or not renew an advisory contract. In particular, the Board recognized that many shareholders have invested in the Fund on the strength of the Adviser's industry standing and reputation and with the expectation that the Adviser will have a continuing role in providing advisory services to the Fund. Thus, the Board's approval of the advisory contract reflected the fact that it is the shareholders who have effectively selected the Adviser by virtue of having invested in the Fund. The Board concluded that, in light of the factors discussed above, including the nature, quality and scope of the services provided to the Fund by the Adviser and its affiliates, continuation of the advisory contract was appropriate.
The Board based its decision to approve the advisory contract on the totality of the circumstances and relevant factors and with a view to past and future long-term considerations. Not all of the factors and considerations identified above were necessarily relevant to the Fund, nor did the Board consider any one of them to be determinative. With respect to the factors that were relevant, the Board's decision to approve the contract reflects its determination that Federated's performance and actions provided a satisfactory basis to support the decision to continue the existing arrangements.
Annual Shareholder Report
Voting Proxies on Fund Portfolio Securities
A description of the policies and procedures that the Fund uses to determine how to vote proxies, if any, relating to securities held in the Fund's portfolio is available, without charge and upon request, by calling 1-800-341-7400. A report on “Form N-PX” of how the Fund voted any such proxies during the most recent 12-month period ended June 30 is available via the Proxy Voting Record (Form N-PX) link associated with the Fund and share class name at www.Federatedinvestors.com/FundInformation. Form N-PX filings are also available at the SEC's website at www.sec.gov.
Quarterly Portfolio Schedule
The Fund files with the SEC a complete schedule of its portfolio holdings, as of the close of the first and third quarters of its fiscal year, on “Form N-Q.” These filings are available on the SEC's website at www.sec.gov and may be reviewed and copied at the SEC's Public Reference Room in Washington, DC. (Call 1-800-SEC-0330 for information on the operation of the Public Reference Room.) You may also access this information via the link to the Fund and share class name at www.Federatedinvestors.com/FundInformation.
Annual Shareholder Report
Mutual funds are not bank deposits or obligations, are not guaranteed by any bank and are not insured or guaranteed by the U.S. government, the Federal Deposit Insurance Corporation, the Federal Reserve Board or any other government agency. Investment in mutual funds involves investment risk, including the possible loss of principal.
This Report is authorized for distribution to prospective investors only when preceded or accompanied by the Fund's Prospectus, which contains facts concerning its objective and policies, management fees, expenses and other information.
Federated International Bond Fund
Federated Investors Funds
4000 Ericsson Drive
Warrendale, PA 15086-7561
Contact us at FederatedInvestors.com
or call 1-800-341-7400.
Federated Securities Corp., Distributor
CUSIP 31420G408
CUSIP 31420G507
CUSIP 31420G606
3010401 (1/14)
Federated is a registered trademark of Federated Investors, Inc.
2014 ©Federated Investors, Inc.
Item 2. Code of Ethics
(a) As of the end of the period covered by this report, the registrant has adopted a code of ethics (the "Section 406 Standards for Investment Companies - Ethical Standards for Principal Executive and Financial Officers") that applies to the registrant's Principal Executive Officer and Principal Financial Officer; the registrant's Principal Financial Officer also serves as the Principal Accounting Officer.
(c) Not Applicable
(d) Not Applicable
(e) Not Applicable
(f)(3) The registrant hereby undertakes to provide any person, without charge, upon request, a copy of the code of ethics. To request a copy of the code of ethics, contact the registrant at 1-800-341-7400, and ask for a copy of the Section 406 Standards for Investment Companies - Ethical Standards for Principal Executive and Financial Officers.
Item 3. Audit Committee Financial Expert
The registrant's Board has determined that each of the following members of the Board's Audit Committee is an “audit committee financial expert,” and is "independent," for purposes of this Item: Charles F. Mansfield, Jr., Thomas M. O'Neill and John S. Walsh.
Item 4. Principal Accountant Fees and Services
(a) Audit Fees billed to the registrant for the two most recent fiscal years:
Fiscal year ended 2013 - $31,400
Fiscal year ended 2012 - $30,200
(b) Audit-Related Fees billed to the registrant for the two most recent fiscal years:
Fiscal year ended 2013 - $0
Fiscal year ended 2012 - $36
Travel to Audit Committee Meeting.
Amount requiring approval of the registrant’s audit committee pursuant to paragraph (c)(7)(ii) of Rule 2-01 of Regulation S-X, $0 and $0 respectively.
(c) Tax Fees billed to the registrant for the two most recent fiscal years:
Fiscal year ended 2013 - $0
Fiscal year ended 2012 - $0
Amount requiring approval of the registrant’s audit committee pursuant to paragraph (c)(7)(ii) of Rule 2-01 of Regulation S-X, $0 and $0 respectively.
(d) All Other Fees billed to the registrant for the two most recent fiscal years:
Fiscal year ended 2013 - $0
Fiscal year ended 2012 - $0
Amount requiring approval of the registrant’s audit committee pursuant to paragraph (c)(7)(ii) of Rule 2-01 of Regulation S-X, $12,320 and $14,277 respectively. Fiscal year ended 2013- Service fee for analysis of potential Passive Foreign Investment Company holdings. Fiscal year ended 2012- Service fee for analysis of potential Passive Foreign Investment Company holdings.
(e)(1) Audit Committee Policies regarding Pre-approval of Services.
The Audit Committee is required to pre-approve audit and non-audit services performed by the independent auditor in order to assure that the provision of such services do not impair the auditor’s independence. Unless a type of service to be provided by the independent auditor has received general pre-approval, it will require specific pre-approval by the Audit Committee. Any proposed services exceeding pre-approved cost levels will require specific pre-approval by the Audit Committee.
Certain services have the general pre-approval of the Audit Committee. The term of the general pre-approval is 12 months from the date of pre-approval, unless the Audit Committee specifically provides for a different period. The Audit Committee will annually review the services that may be provided by the independent auditor without obtaining specific pre-approval from the Audit Committee and may grant general pre-approval for such services. The Audit Committee will revise the list of general pre-approved services from time to time, based on subsequent determinations. The Audit Committee will not delegate its responsibilities to pre-approve services performed by the independent auditor to management.
The Audit Committee has delegated pre-approval authority to its Chairman. The Chairman will report any pre-approval decisions to the Audit Committee at its next scheduled meeting. The Committee will designate another member with such pre-approval authority when the Chairman is unavailable.
AUDIT SERVICES
The annual Audit services engagement terms and fees will be subject to the specific pre-approval of the Audit Committee. The Audit Committee must approve any changes in terms, conditions and fees resulting from changes in audit scope, registered investment company (RIC) structure or other matters.
In addition to the annual Audit services engagement specifically approved by the Audit Committee, the Audit Committee may grant general pre-approval for other Audit Services, which are those services that only the independent auditor reasonably can provide. The Audit Committee has pre-approved certain Audit services, all other Audit services must be specifically pre-approved by the Audit Committee.
AUDIT-RELATED SERVICES
Audit-related services are assurance and related services that are reasonably related to the performance of the audit or review of the Company’s financial statements or that are traditionally performed by the independent auditor. The Audit Committee believes that the provision of Audit-related services does not impair the independence of the auditor, and has pre-approved certain Audit-related services, all other Audit-related services must be specifically pre-approved by the Audit Committee.
TAX SERVICES
The Audit Committee believes that the independent auditor can provide Tax services to the Company such as tax compliance, tax planning and tax advice without impairing the auditor’s independence. However, the Audit Committee will not permit the retention of the independent auditor in connection with a transaction initially recommended by the independent auditor, the purpose of which may be tax avoidance and the tax treatment of which may not be supported in the Internal Revenue Code and related regulations. The Audit Committee has pre-approved certain Tax services, all Tax services involving large and complex transactions must be specifically pre-approved by the Audit Committee.
ALL OTHER SERVICES
With respect to the provision of services other than audit, review or attest services the pre-approval requirement is waived if:
| (1) | The aggregate amount of all such services provided constitutes no more than five percent of the total amount of revenues paid by the registrant, the registrant’s adviser (not including any sub-adviser whose role is primarily portfolio management and is subcontracted with or overseen by another investment adviser), and any entity controlling, controlled by, or under common control with the investment adviser that provides ongoing services to the registrant to its accountant during the fiscal year in which the services are provided; |
| (2) | Such services were not recognized by the registrant, the registrant’s adviser (not including any sub-adviser whose role is primarily portfolio management and is subcontracted with or overseen by another investment adviser), and any entity controlling, controlled by, or under common control with the investment adviser that provides ongoing services to the registrant at the time of the engagement to be non-audit services; and |
| (3) | Such services are promptly brought to the attention of the Audit Committee of the issuer and approved prior to the completion of the audit by the Audit Committee or by one or more members of the Audit Committee who are members of the board of directors to whom authority to grant such approvals has been delegated by the Audit Committee. |
The Audit Committee may grant general pre-approval to those permissible non-audit services classified as All Other services that it believes are routine and recurring services, and would not impair the independence of the auditor.
The SEC’s rules and relevant guidance should be consulted to determine the precise definitions of prohibited non-audit services and the applicability of exceptions to certain of the prohibitions.
PRE-APPROVAL FEE LEVELS
Pre-approval fee levels for all services to be provided by the independent auditor will be established annually by the Audit Committee. Any proposed services exceeding these levels will require specific pre-approval by the Audit Committee.
PROCEDURES
Requests or applications to provide services that require specific approval by the Audit Committee will be submitted to the Audit Committee by both the independent auditor and the Principal Accounting Officer and/or Internal Auditor, and must include a joint statement as to whether, in their view, the request or application is consistent with the SEC’s rules on auditor independence.
(e)(2) Percentage of services identified in items 4(b) through 4(d) that were approved by the registrants audit committee pursuant to paragraph (c)(7)(i)(C) of Rule 2-01 of Regulation S-X:
4(b)
Fiscal year ended 2013 – 0%
Fiscal year ended 2012 - 0%
Percentage of services provided to the registrants investment adviser and any entity controlling, controlled by, or under common control with the investment adviser that provides ongoing services to the registrant that were approved by the registrants audit committee pursuant to paragraph (c)(7)(i)(C) of Rule 2-01 of Regulation S-X, 0% and 0% respectively.
4(c)
Fiscal year ended 2013 – 0%
Fiscal year ended 2012 – 0%
Percentage of services provided to the registrants investment adviser and any entity controlling, controlled by, or under common control with the investment adviser that provides ongoing services to the registrant that were approved by the registrants audit committee pursuant to paragraph (c)(7)(i)(C) of Rule 2-01 of Regulation S-X, 0% and 0% respectively.
4(d)
Fiscal year ended 2013 – 0%
Fiscal year ended 2012 – 0%
Percentage of services provided to the registrants investment adviser and any entity controlling, controlled by, or under common control with the investment adviser that provides ongoing services to the registrant that were approved by the registrants audit committee pursuant to paragraph (c)(7)(i)(C) of Rule 2-01 of Regulation S-X, 0% and 0% respectively.
| (g) | Non-Audit Fees billed to the registrant, the registrant’s investment adviser, and certain entities controlling, controlled by or under common control with the investment adviser: |
Fiscal year ended 2013 - $107,168
Fiscal year ended 2012 - $293,686
(h) The registrant’s Audit Committee has considered that the provision of non-audit services that were rendered to the registrant’s adviser (not including any sub-adviser whose role is primarily portfolio management and is subcontracted with or overseen by another investment adviser), and any entity controlling, controlled by, or under common control with the investment adviser that provides ongoing services to the registrant that were not pre-approved pursuant to paragraph (c)(7)(ii) of Rule 2-01 of Regulation S-X is compatible with maintaining the principal accountant’s independence.
Item 5. Audit Committee of Listed Registrants
Not Applicable
Item 6. Schedule of Investments
(a) The registrant’s Schedule of Investments is included as part of the Report to Stockholders filed under Item 1 of this form.
(b) Not Applicable; Fund had no divestments during the reporting period covered since the previous Form N-CSR filing.
Item 7. Disclosure of Proxy Voting Policies and Procedures for Closed-End Management Investment Companies
Item 8. Portfolio Managers of Closed-End Management Investment Companies
Item 9. Purchases of Equity Securities by Closed-End Management Investment Company and Affiliated Purchasers
Item 10. Submission of Matters to a Vote of Security Holders
No Changes to Report
Item 11. Controls and Procedures
(a) The registrant’s President and Treasurer have concluded that the
registrant’s disclosure controls and procedures (as defined in rule 30a-3(c) under the Act) are effective in design and operation and are sufficient to form the basis of the certifications required by Rule 30a-(2) under the Act, based on their evaluation of these disclosure controls and procedures within 90 days of the filing date of this report on Form N-CSR.
(b) There were no changes in the registrant’s internal control over financial reporting (as defined in rule 30a-3(d) under the Act) during the second fiscal quarter of the period covered by this report that have materially affected, or are reasonably likely to materially affect, the registrant’s internal control over financial reporting.
Item 12. Exhibits
(a)(1) Code of Ethics- Not Applicable to this Report.
(a)(2) Certifications of Principal Executive Officer and Principal Financial Officer.
(a)(3) Not Applicable.
(b) Certifications pursuant to 18 U.S.C. Section 1350.
SIGNATURES
Pursuant to the requirements of the Securities Exchange Act of 1934 and the Investment Company Act of 1940, the registrant has duly caused this report to be signed on its behalf by the undersigned, thereunto duly authorized.
Registrant Federated International Series, Inc.
By /S/ Lori A. Hensler
Lori A. Hensler, Principal Financial Officer
Date January 24, 2014
Pursuant to the requirements of the Securities Exchange Act of 1934 and the Investment Company Act of 1940, this report has been signed below by the following persons on behalf of the registrant and in the capacities and on the dates indicated.
By /S/ J. Christopher Donahue
J. Christopher Donahue, Principal Executive Officer
Date January 24, 2014
By /S/ Lori A. Hensler
Lori A. Hensler, Principal Financial Officer
Date January 24, 2014