Exhibit 99.1
| -1- April 2007 B. Riley & Co. Investor Conference April 2, 2008 |
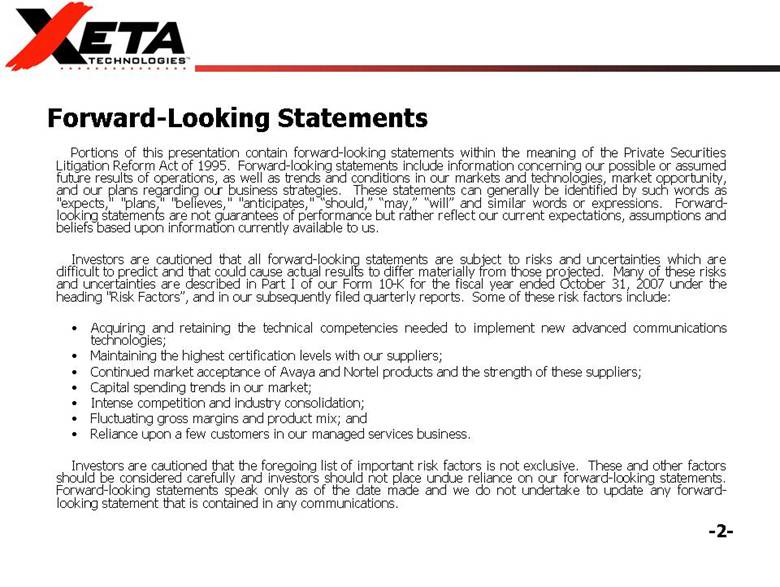
| -2- Portions of this presentation contain forward-looking statements within the meaning of the Private Securities Litigation Reform Act of 1995. Forward-looking statements include information concerning our possible or assumed future results of operations, as well as trends and conditions in our markets and technologies, market opportunity, and our plans regarding our business strategies. These statements can generally be identified by such words as “expects,” “plans,” “believes,” “anticipates,” “should,” “may,” “will” and similar words or expressions. Forward-looking statements are not guarantees of performance but rather reflect our current expectations, assumptions and beliefs based upon information currently available to us. Investors are cautioned that all forward-looking statements are subject to risks and uncertainties which are difficult to predict and that could cause actual results to differ materially from those projected. Many of these risks and uncertainties are described in Part I of our Form 10-K for the fiscal year ended October 31, 2007 under the heading “Risk Factors”, and in our subsequently filed quarterly reports. Some of these risk factors include: • Acquiring and retaining the technical competencies needed to implement new advanced communications technologies; • Maintaining the highest certification levels with our suppliers; • Continued market acceptance of Avaya and Nortel products and the strength of these suppliers; • Capital spending trends in our market; • Intense competition and industry consolidation; • Fluctuating gross margins and product mix; and • Reliance upon a few customers in our managed services business. Investors are cautioned that the foregoing list of important risk factors is not exclusive. These and other factors should be considered carefully and investors should not place undue reliance on our forward-looking statements. Forward-looking statements speak only as of the date made and we do not undertake to update any forward-looking statement that is contained in any communications. Forward-Looking Statements |
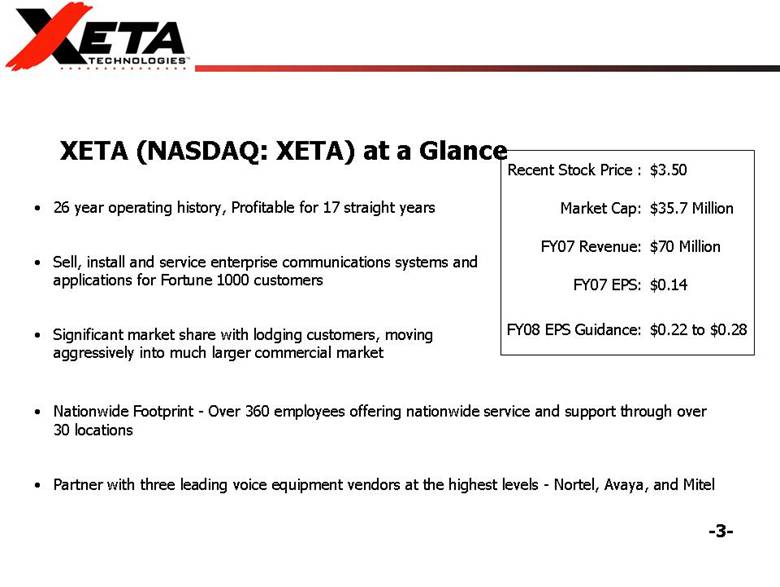
| -3- • 26 year operating history, Profitable for 17 straight years • Sell, install and service enterprise communications systems and applications for Fortune 1000 customers • Significant market share with lodging customers, moving aggressively into much larger commercial market XETA (NASDAQ: XETA) at a Glance • Nationwide Footprint - Over 360 employees offering nationwide service and support through over 30 locations • Partner with three leading voice equipment vendors at the highest levels - Nortel, Avaya, and Mitel $0.22 to $0.28 FY08 EPS Guidance: $0.14 FY07 EPS: $70 Million FY07 Revenue: $35.7 Million Market Cap: $3.50 Recent Stock Price : |
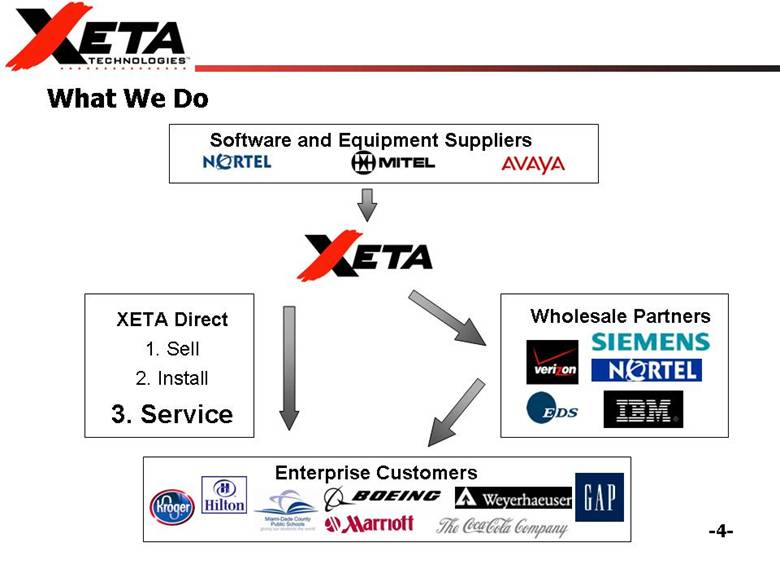
| -4- What We Do Software and Equipment Suppliers Wholesale Partners Enterprise Customers XETA Direct 1. Sell 2. Install 3. Service |
| -5- • Taking Market Share: Well positioned to acquire significant market share with targeted 15% top line organic growth over the next 3 to 5 years. • Improving Profitability: to come from a shift in the revenue mix and operating leverage....targeted EBITDA of 12% versus 5% in 2007. • Recurring Revenue Increases Predictability: Growing base of recurring revenue will drive earnings growth and predictability • Competitive Differentiated: One of two systems integrators that can sell/install/service both Avaya and Nortel at the highest levels. Investment Considerations |

| -6- Market Overview |
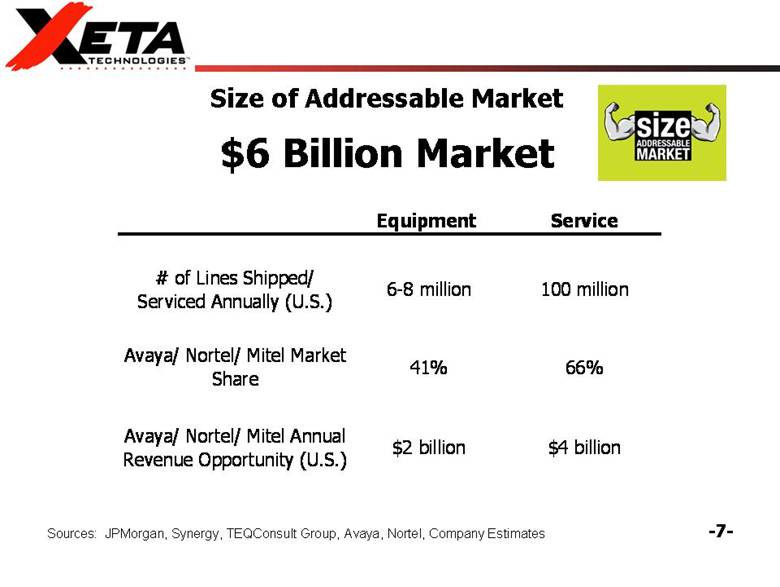
| -7- Size of Addressable Market $6 Billion Market Sources: JPMorgan, Synergy, TEQConsult Group, Avaya, Nortel, Company Estimates Equipment Service # of Lines Shipped/ Serviced Annually (U.S.) 6-8 million 100 million Avaya/ Nortel/ Mitel Market Share 41% 66% Avaya/ Nortel/ Mitel Annual Revenue Opportunity (U.S.) $2 billion $4 billion |
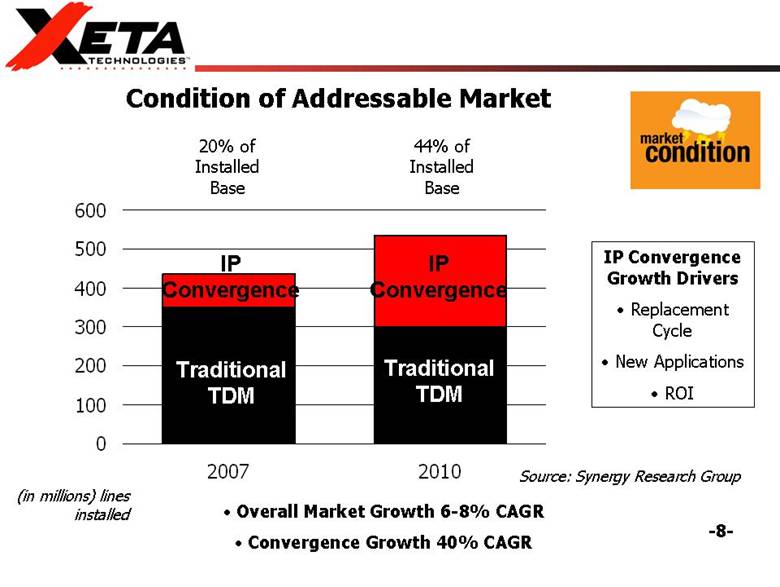
| -8- 0 100 200 300 400 500 600 2007 2010 IP Convergence Growth Drivers • Replacement Cycle • New Applications • ROI 44% of Installed Base Source: Synergy Research Group • Overall Market Growth 6-8% CAGR • Convergence Growth 40% CAGR 20% of Installed Base Condition of Addressable Market ( in millions ) lines installed IP Convergence Traditional TDM Traditional TDM IP Convergence |
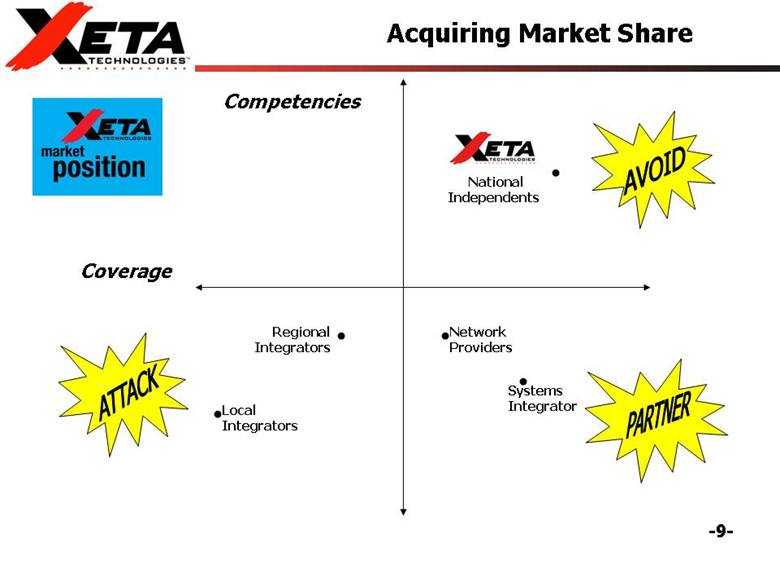
| -9- National Independents Regional Integrators Systems Integrator Network Providers Local Integrators Competencies Coverage Acquiring Market Share |
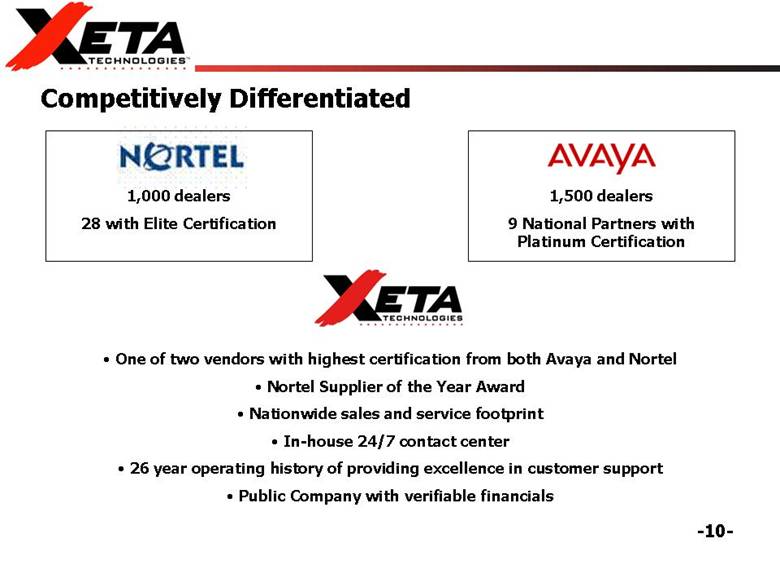
| -10- Competitively Differentiated 1,000 dealers 28 with Elite Certification • One of two vendors with highest certification from both Avaya and Nortel • Nortel Supplier of the Year Award • Nationwide sales and service footprint • In-house 24/7 contact center • 26 year operating history of providing excellence in customer support • Public Company with verifiable financials 1,500 dealers 9 National Partners with Platinum Certification |
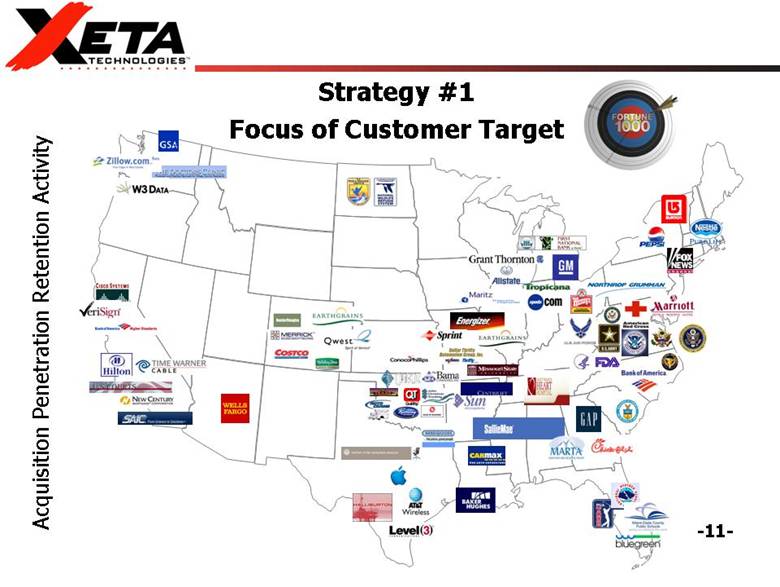
| -11- Strategy #1 Focus of Customer Target Acquisition Penetration Retention Activity |
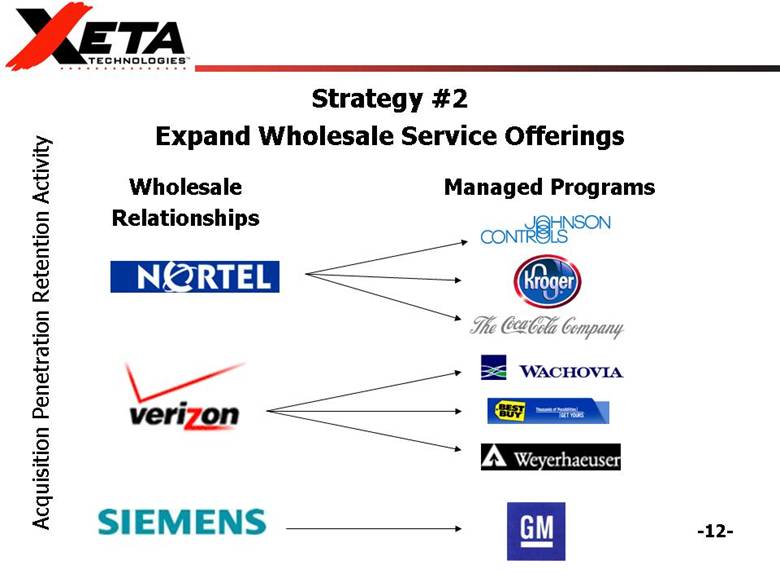
| -12- Wholesale Relationships Managed Programs Acquisition Penetration Retention Activity Strategy #2 Expand Wholesale Service Offerings |
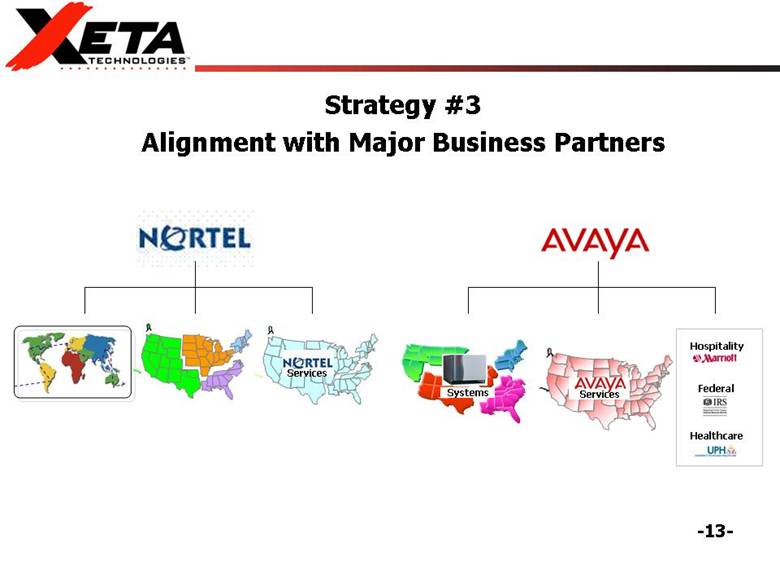
| -13- Strategy #3 Alignment with Major Business Partners Services Services Systems Hospitality Healthcare Federal |
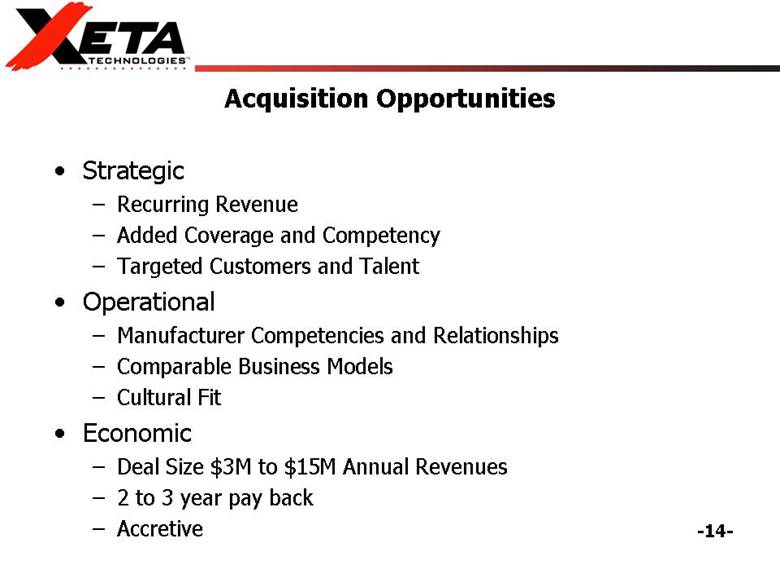
| -14- • Strategic – Recurring Revenue – Added Coverage and Competency – Targeted Customers and Talent • Operational – Manufacturer Competencies and Relationships – Comparable Business Models – Cultural Fit • Economic – Deal Size $3M to $15M Annual Revenues – 2 to 3 year pay back – Accretive Acquisition Opportunities |
| -15- Experienced Leadership Team •Greg Forrest – CEO and President – CEO since June 2007, joined the company in July 2005 through acquisition. Prior to XETA, founded several fast-growing companies in the clothing, commercial interior and telecommunications industries. •Robert Wagner – CFO – Joined the company in 1986. 24 years public Accounting/ financial management experience. •Don Reigel – Executive Director, Avaya – Joined company in 1993. Prior to XETA, held senior sales management positions at large Avaya dealer. •Scott Davis – Executive Director, Nortel – Joined company in 2006. 10 years senior sales positions inside Nortel •Tom Luce – Executive Director, Managed Services – Joined the company during it’s founding in 1982. |
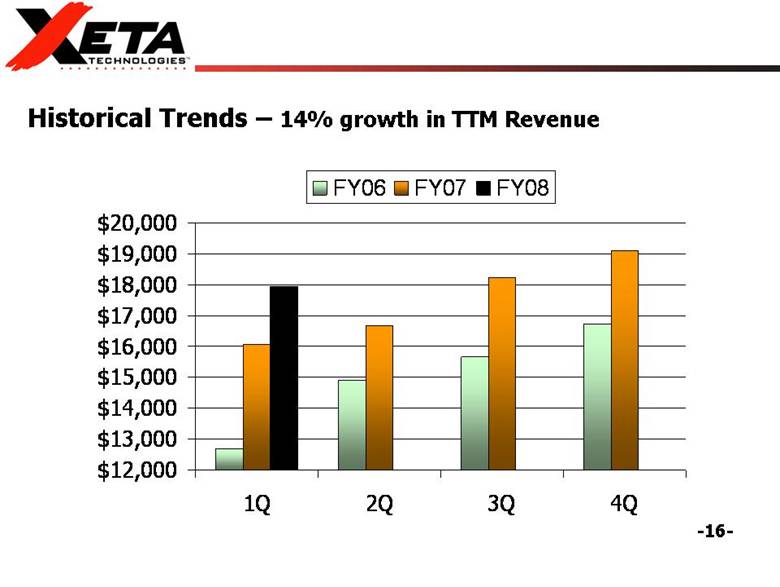
| -16- Historical Trends – 14% growth in TTM Revenue $12,000 $13,000 $14,000 $15,000 $16,000 $17,000 $18,000 $19,000 $20,000 1Q 2Q 3Q 4Q FY06 FY07 FY08 |
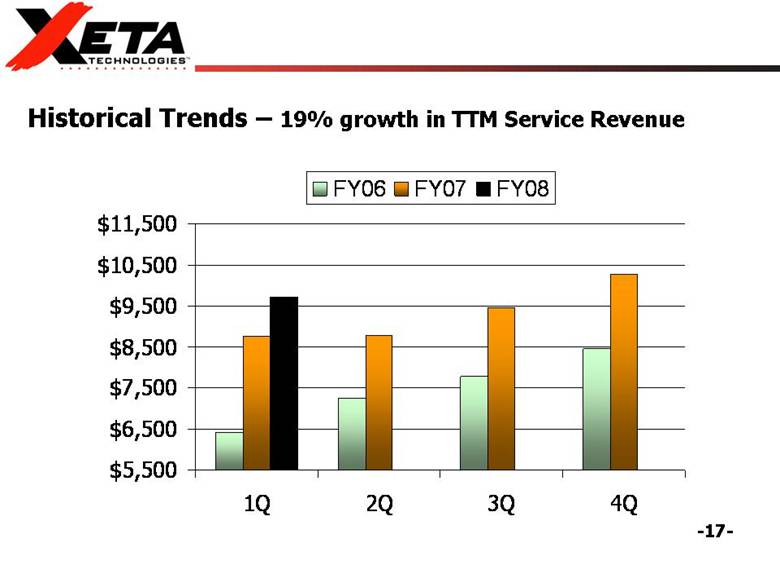
| -17- Historical Trends – 19% growth in TTM Service Revenue $5,500 $6,500 $7,500 $8,500 $9,500 $10,500 $11,500 1Q 2Q 3Q 4Q FY06 FY07 FY08 |
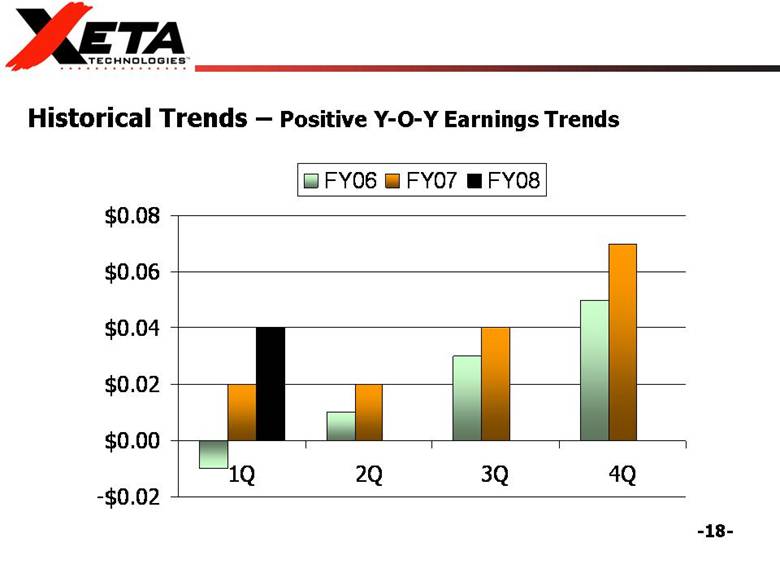
| -18- Historical Trends – Positive Y-O-Y Earnings Trends -$0.02 $0.00 $0.02 $0.04 $0.06 $0.08 1Q 2Q 3Q 4Q FY06 FY07 FY08 |
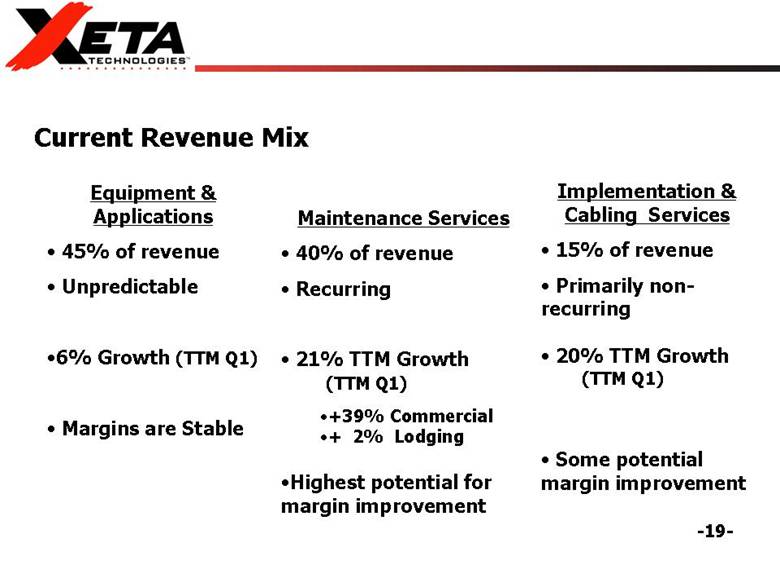
| -19- Current Revenue Mix Maintenance Services • 40% of revenue • Recurring • 21% TTM Growth (TTM Q1) •+39% Commercial •+ 2% Lodging •Highest potential for margin improvement Implementation & Cabling Services • 15% of revenue • Primarily non-recurring • 20% TTM Growth (TTM Q1) • Some potential margin improvement Equipment & Applications • 45% of revenue • Unpredictable •6% Growth (TTM Q1) • Margins are Stable |
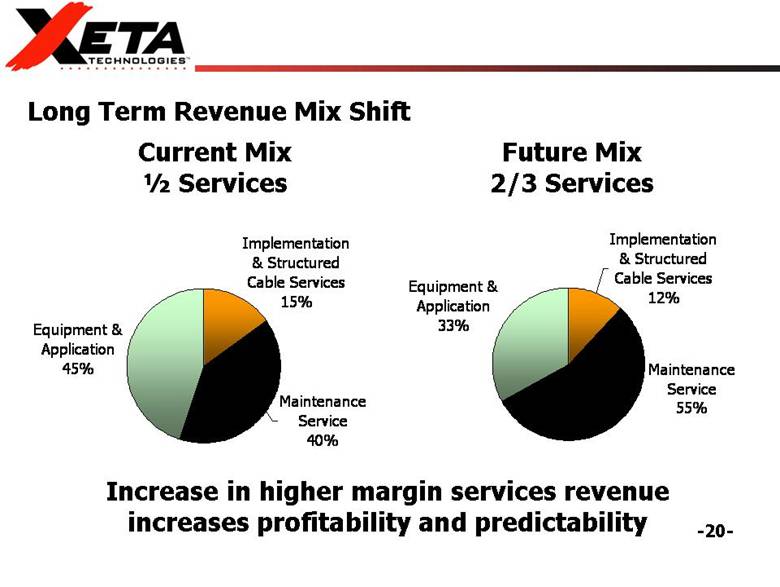
| -20- Long Term Revenue Mix Shift Current Mix ½ Services Future Mix 2/3 Services Increase in higher margin services revenue increases profitability and predictability Equipment & Application 45% Implementation & Structured Cable Services 15% Maintenance Service 40% Equipment & Application 33% Implementation & Structured Cable Services 12% Maintenance Service 55% |
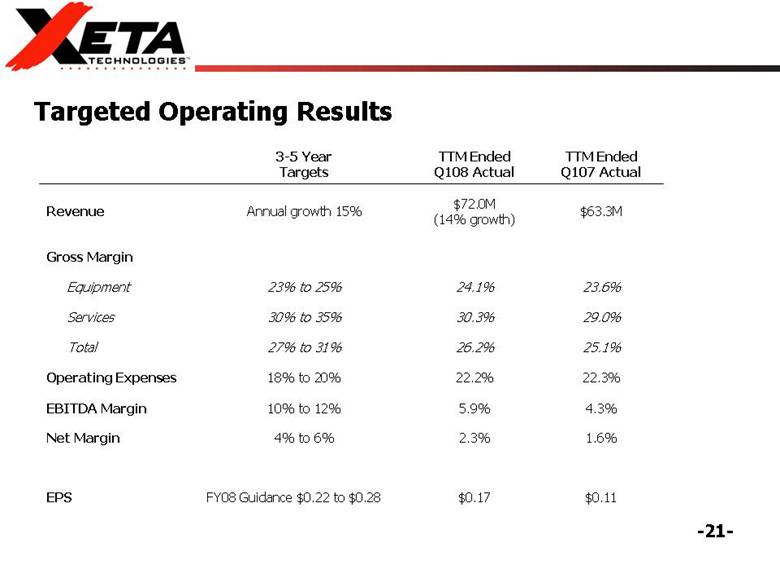
| -21- Targeted Operating Results FY08 Guidance $0.22 to $0.28 4% to 6% 10% to 12% 18% to 20% 27% to 31% 30% to 35% 23% to 25% Annual growth 15% 3-5 Year Targets $0.17 2.3% 5.9% 22.2% 26.2% 30.3% 24.1% $72.0M (14% growth) TTM Ended Q108 Actual $0.11 EPS 1.6% Net Margin 4.3% EBITDA Margin 22.3% Operating Expenses 25.1% Total 29.0% Services 23.6% Equipment Gross Margin $63.3M Revenue TTM Ended Q107 Actual |
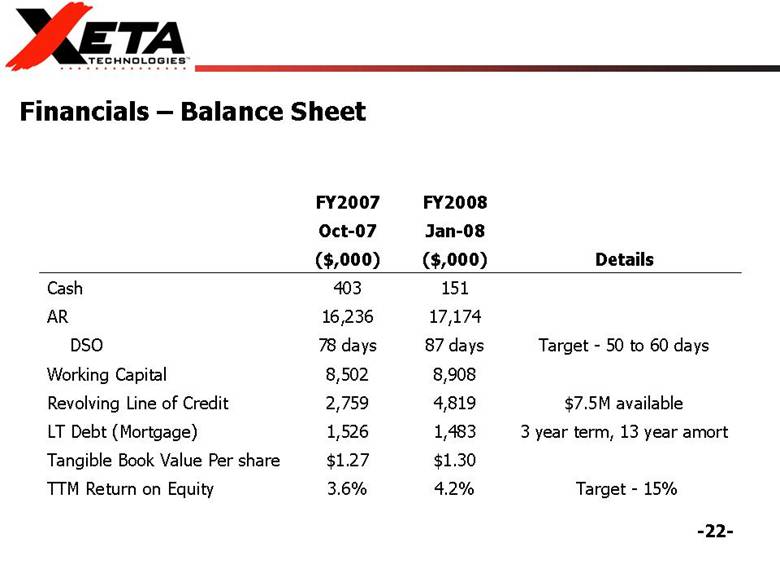
| -22- Financials – Balance Sheet Target - 15% 4.2% 3.6% TTM Return on Equity $1.30 $1.27 Tangible Book Value Per share 3 year term, 13 year amort 1,483 1,526 LT Debt (Mortgage) $7.5M available 4,819 2,759 Revolving Line of Credit 8,908 8,502 Working Capital Target - 50 to 60 days 87 days 78 days DSO 17,174 16,236 AR 151 403 Cash Details ($,000) ($,000) Jan-08 Oct-07 FY2008 FY2007 |
| -23- • Taking Market Share: Well positioned to acquire significant market share with targeted 15% top line organic growth over the next 3 to 5 years. • Improving Profitability: to come from a shift in the revenue mix and operating leverage....targeted EBITDA of 12% versus 5% in 2007. • Recurring Revenue Increases Predictability: Growing base of recurring revenue will drive earnings growth and predictability • Competitive Differentiated: One of two systems integrators that can sell/install/service both Avaya and Nortel at the highest levels. Investment Considerations |
| -24- April 2007 Investor Presentation |