
INVESTOR DAY New York, New York February 9, 2016 TM Exhibit 99.1
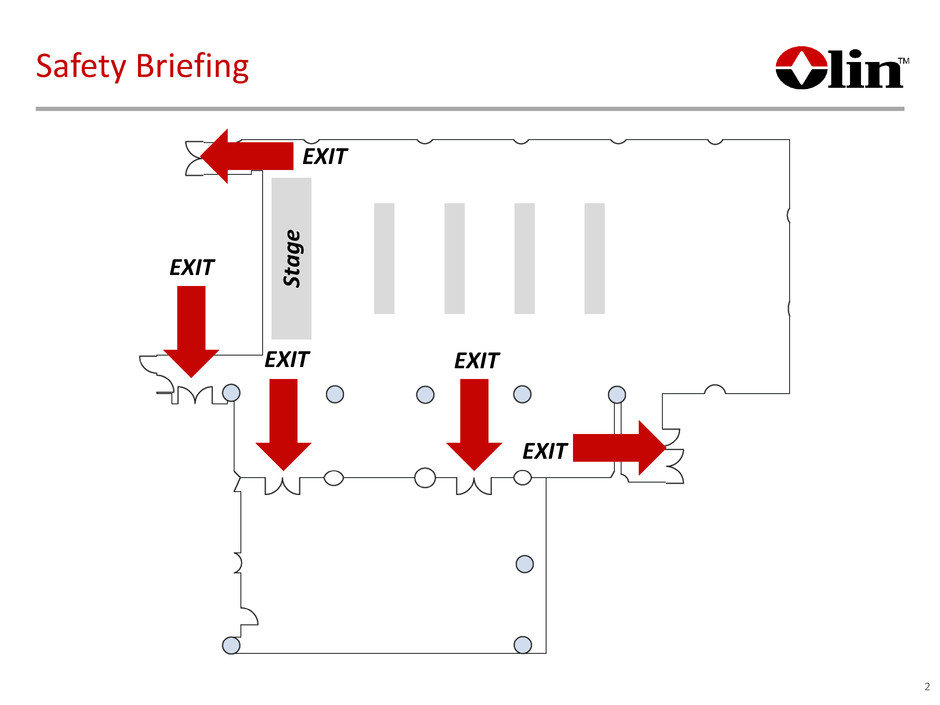
Safety Briefing St ag e EXIT EXIT EXIT EXIT EXIT 2
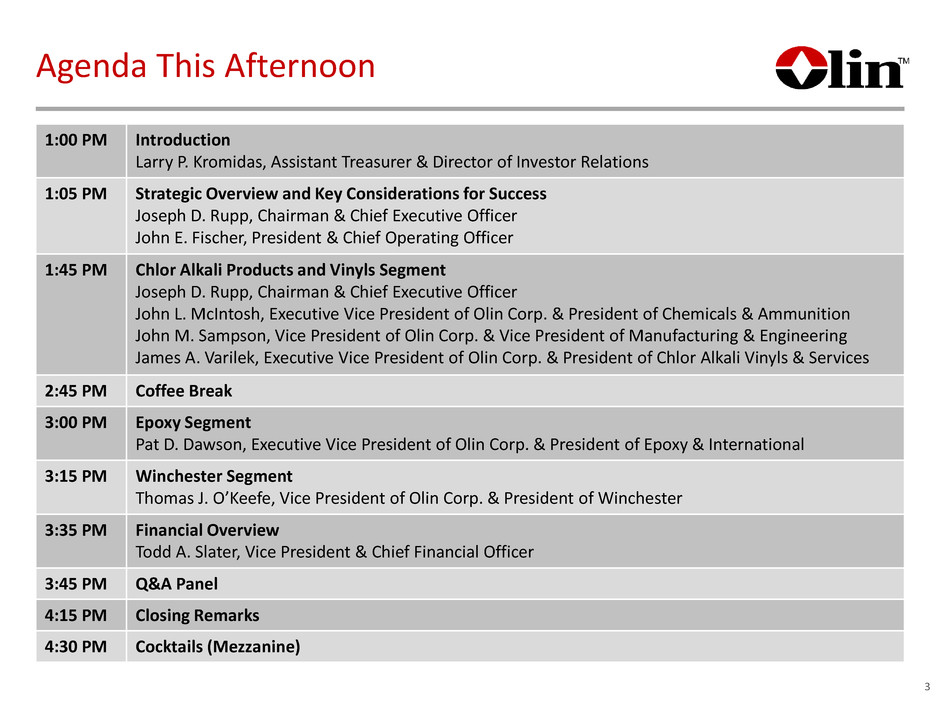
1:00 PM Introduction Larry P. Kromidas, Assistant Treasurer & Director of Investor Relations 1:05 PM Strategic Overview and Key Considerations for Success Joseph D. Rupp, Chairman & Chief Executive Officer John E. Fischer, President & Chief Operating Officer 1:45 PM Chlor Alkali Products and Vinyls Segment Joseph D. Rupp, Chairman & Chief Executive Officer John L. McIntosh, Executive Vice President of Olin Corp. & President of Chemicals & Ammunition John M. Sampson, Vice President of Olin Corp. & Vice President of Manufacturing & Engineering James A. Varilek, Executive Vice President of Olin Corp. & President of Chlor Alkali Vinyls & Services 2:45 PM Coffee Break 3:00 PM Epoxy Segment Pat D. Dawson, Executive Vice President of Olin Corp. & President of Epoxy & International 3:15 PM Winchester Segment Thomas J. O’Keefe, Vice President of Olin Corp. & President of Winchester 3:35 PM Financial Overview Todd A. Slater, Vice President & Chief Financial Officer 3:45 PM Q&A Panel 4:15 PM Closing Remarks 4:30 PM Cocktails (Mezzanine) 3 Agenda This Afternoon
Forward-Looking Statements 4 This communication includes forward-looking statements. These statements relate to analyses and other information that are based on management’s beliefs, certain assumptions made by management, forecasts of future results, and current expectations, estimates and projections about the markets and economy in which Olin Corporation (“Olin”) and The Dow Chemical Company’s (“TDCC”) chlorine products business operate. These statements may include statements regarding the proposed combination of TDCC’s chlorine products business with Olin in a “Reverse Morris Trust” transaction, the expected timetable for completing the transaction, benefits and synergies of the transaction, future opportunities for the combined company and products and any other statements regarding Olin’s and TDCC’s chlorine products businesses’ future operations, anticipated business levels, future earnings, planned activities, anticipated growth, market opportunities, strategies and competition. The statements contained in this communication that are not statements of historical fact may include forward-looking statements that involve a number of risks and uncertainties. We have used the words “anticipate,” “intend,” “may,” “expect,” “believe,” “plan,” “estimate,” “will,” and variations of such words and similar expressions in this communication to identify such forward-looking statements. These statements are not guarantees of future performance and involve certain risks, uncertainties and assumptions, which are difficult to predict and many of which are beyond our control. Therefore, actual outcomes and results may differ materially from those matters expressed or implied in such forward-looking statements. Factors that could cause or contribute to such differences include, but are not limited to: factors relating to the satisfaction of the conditions to the proposed transaction, including regulatory approvals; the parties’ ability to meet expectations regarding the timing, completion and accounting and tax treatments of the proposed transaction; the possibility that Olin may be unable to achieve expected synergies and operating efficiencies in connection with the transaction within the expected time-frames or at all; the integration of the TDCC’s chlorine products business being more difficult, time-consuming or costly than expected; the effect of any changes resulting from the proposed transaction in customer, supplier and other business relationships; general market perception of the proposed transaction; exposure to lawsuits and contingencies associated with TDCC’s chlorine products business; the ability to attract and retain key personnel; prevailing market conditions; changes in economic and financial conditions of Olin and TDCC’s chlorine products business; uncertainties and matters beyond the control of management; and the other risks detailed in Olin’s Form 10-K for the fiscal year ended December 31, 2014 and Olin’s Form 10-Q for the fiscal quarter ended September 30, 2015. These risks, as well as other risks associated with Olin, TDCC’s chlorine products business and the proposed transaction are also more fully discussed in the prospectus included in the registration statement on Form S-4 filed with the Securities and Exchange Commission (the “SEC”) by Olin, and declared effective by the SEC, on September 2, 2015. The forward-looking statements should be considered in light of these factors. In addition, other risks and uncertainties not presently known to Olin or that Olin considers immaterial could affect the accuracy of our forward-looking statements. The reader is cautioned not to rely unduly on these forward-looking statements. Olin and TDCC undertake no obligation to update publicly any forward-looking statements, whether as a result of future events, new information or otherwise.
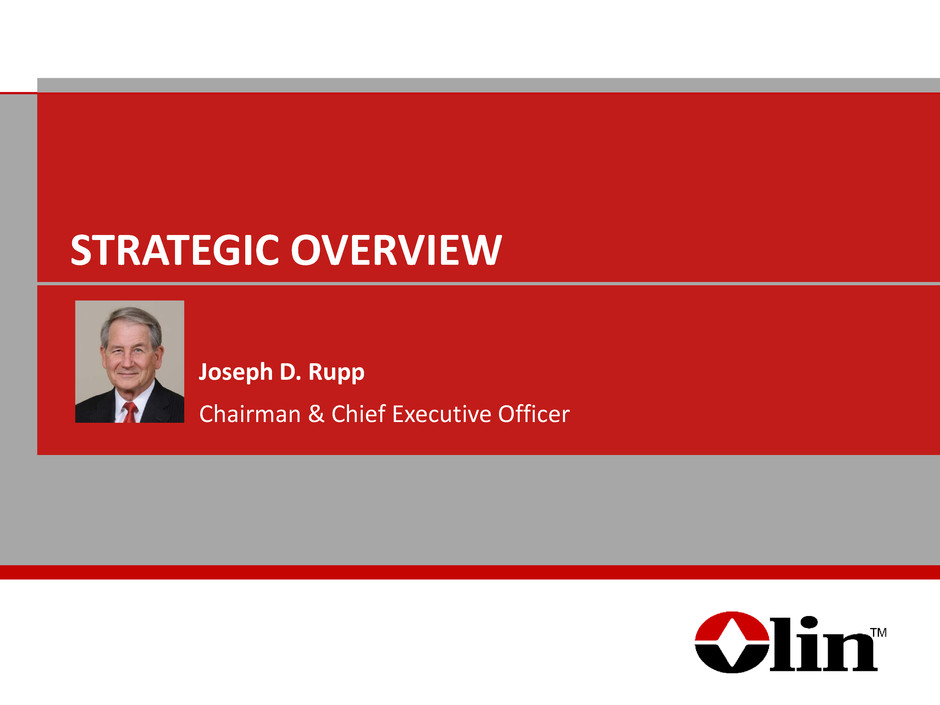
STRATEGIC OVERVIEW Joseph D. Rupp Chairman & Chief Executive Officer
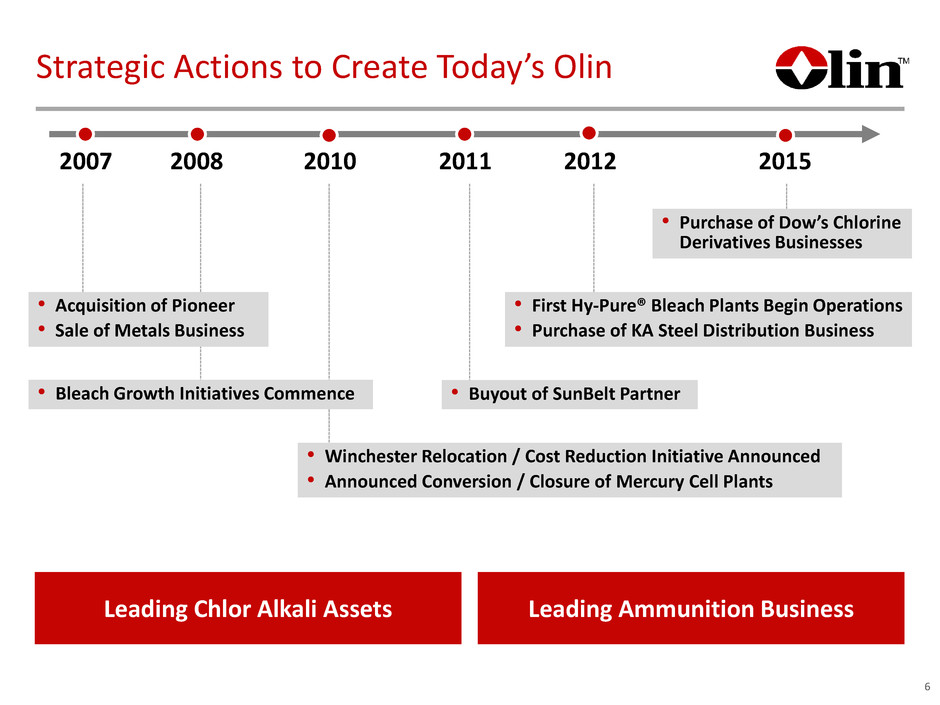
Strategic Actions to Create Today’s Olin 6 Leading Chlor Alkali Assets Leading Ammunition Business 2007 2008 2010 2011 2012 2015 • Winchester Relocation / Cost Reduction Initiative Announced • Announced Conversion / Closure of Mercury Cell Plants • First Hy-Pure® Bleach Plants Begin Operations • Purchase of KA Steel Distribution Business • Purchase of Dow’s Chlorine Derivatives Businesses • Acquisition of Pioneer • Sale of Metals Business • Buyout of SunBelt Partner• Bleach Growth Initiatives Commence
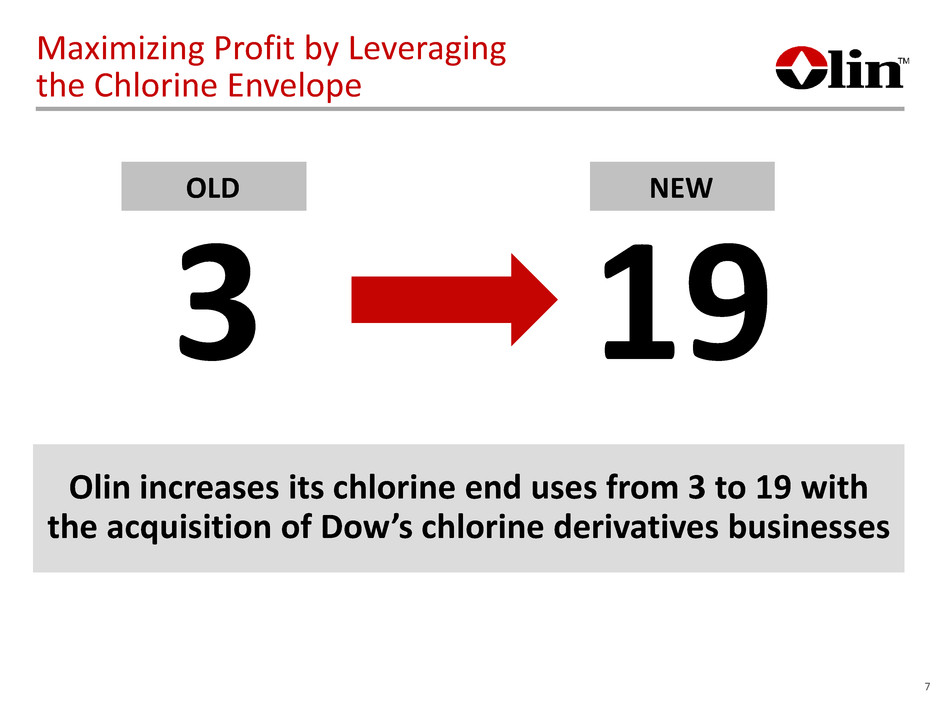
Maximizing Profit by Leveraging the Chlorine Envelope 7 OLD 3 Olin increases its chlorine end uses from 3 to 19 with the acquisition of Dow’s chlorine derivatives businesses 19 NEW
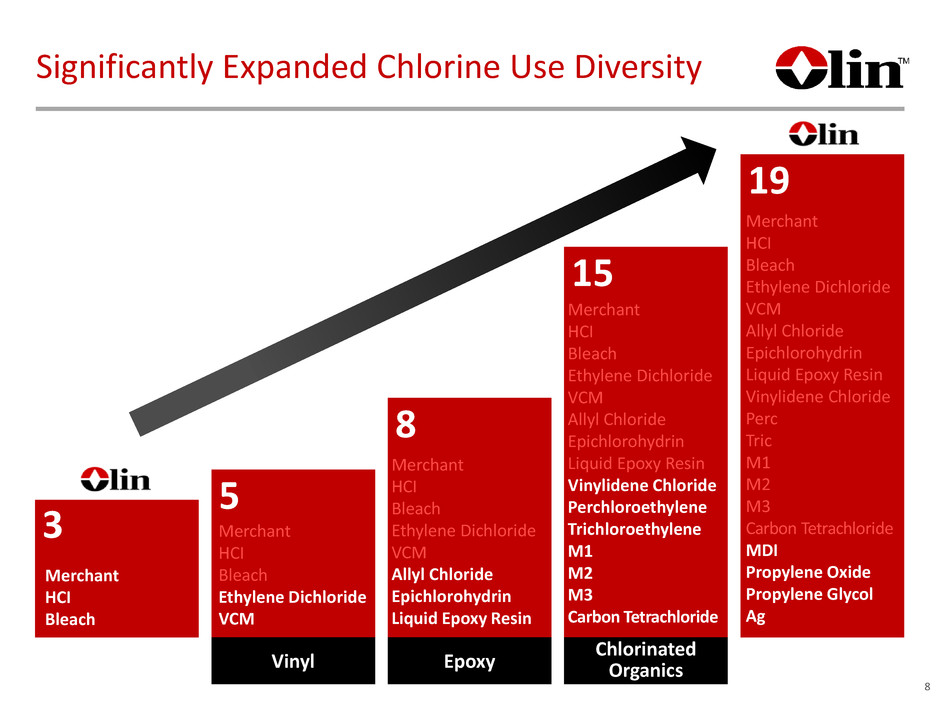
Significantly Expanded Chlorine Use Diversity 8 3 Merchant HCI Bleach 19 Merchant HCI Bleach Ethylene Dichloride VCM Allyl Chloride Epichlorohydrin Liquid Epoxy Resin Vinylidene Chloride Perc Tric M1 M2 M3 Carbon Tetrachloride MDI Propylene Oxide Propylene Glycol Ag 5 Merchant HCI Bleach Ethylene Dichloride VCM Vinyl 8 Merchant HCI Bleach Ethylene Dichloride VCM Allyl Chloride Epichlorohydrin Liquid Epoxy Resin Epoxy 15 Merchant HCI Bleach Ethylene Dichloride VCM Allyl Chloride Epichlorohydrin Liquid Epoxy Resin Vinylidene Chloride Perchloroethylene Trichloroethylene M1 M2 M3 Carbon Tetrachloride Chlorinated Organics
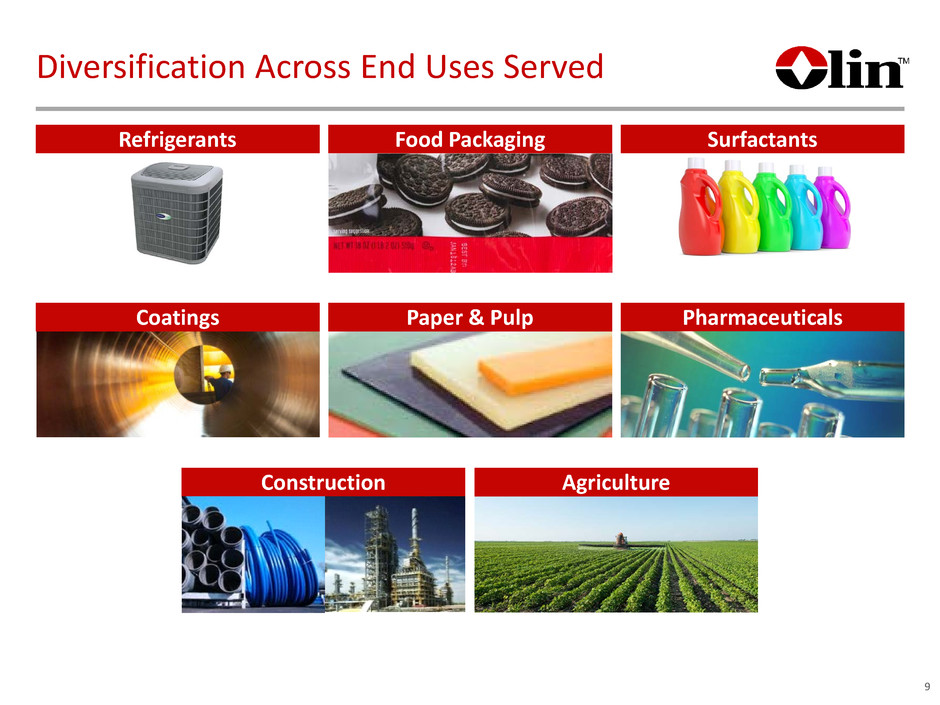
Diversification Across End Uses Served 9 Construction Agriculture Coatings Paper & Pulp Pharmaceuticals Refrigerants Food Packaging Surfactants
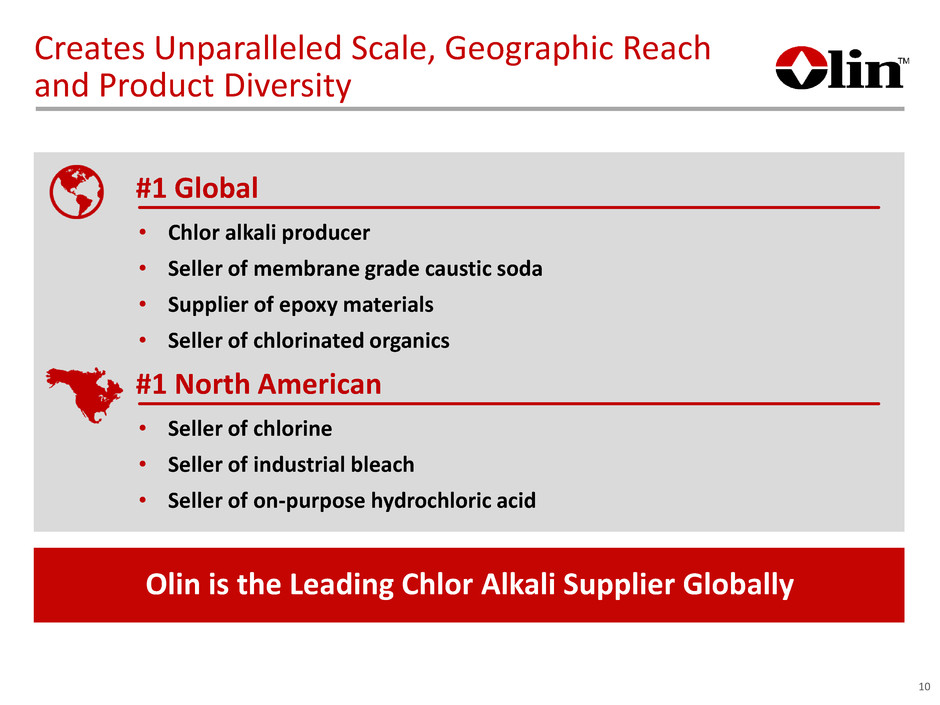
Creates Unparalleled Scale, Geographic Reach and Product Diversity 10 Olin is the Leading Chlor Alkali Supplier Globally • Chlor alkali producer • Seller of membrane grade caustic soda • Supplier of epoxy materials • Seller of chlorinated organics #1 Global • Seller of chlorine • Seller of industrial bleach • Seller of on-purpose hydrochloric acid #1 North American
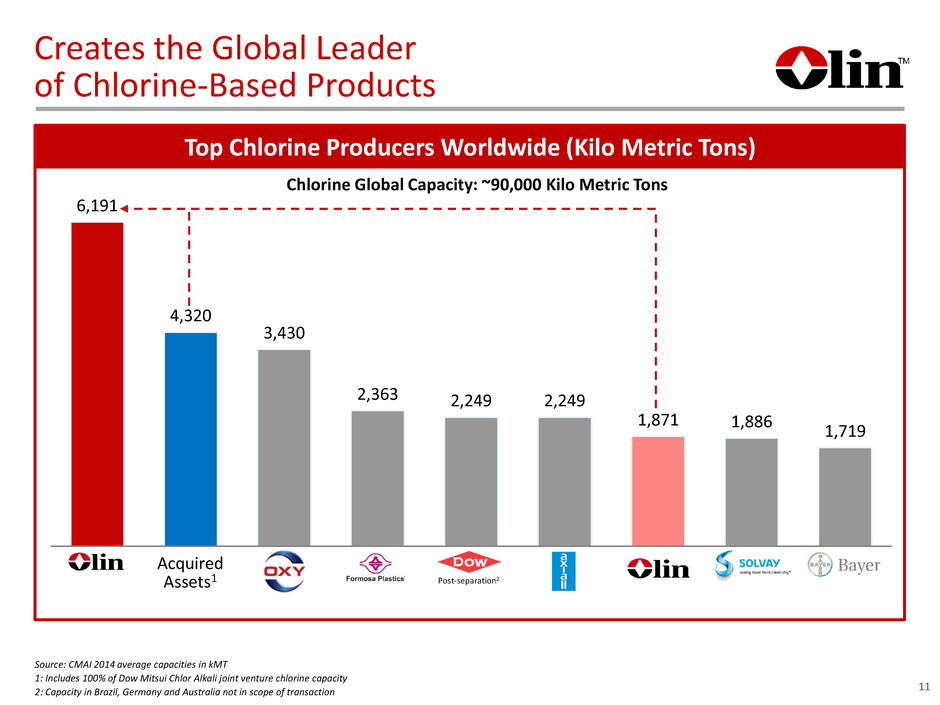
Creates the Global Leader of Chlorine-Based Products 6,191 4,320 3,430 2,363 2,249 2,249 1,871 1,886 1,719 Chlorine Global Capacity: ~90,000 Kilo Metric Tons Source: CMAI 2014 average capacities in kMT 1: Includes 100% of Dow Mitsui Chlor Alkali joint venture chlorine capacity 2: Capacity in Brazil, Germany and Australia not in scope of transaction Post-separation2 Acquired Assets1 Top Chlorine Producers Worldwide (Kilo Metric Tons) 11

Diversified Businesses Drive Portfolio Balance 12 • Chlorine • Caustic • Vinyls • Bleach • Hydrochloric Acid • Chlorinated Organics Segment Breakdown Pro Forma Revenue Winchester 12% Epoxy 33% Chlor Alkali Products and Vinyls 55% Chlor Alkali Products and Vinyls Epoxy Winchester
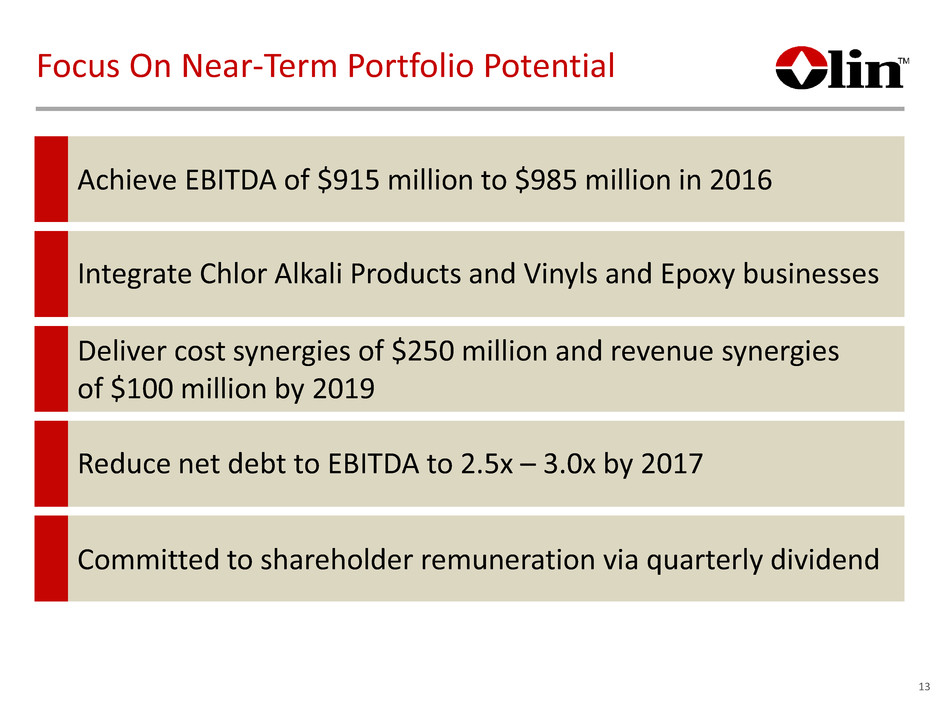
Focus On Near-Term Portfolio Potential 13 TARGET: 2-3 YEARS Achieve EBITDA of $915 million to $985 million in 2016 Integrate Chlor Alkali Products and Vinyls and Epoxy businesses Deliver cost synergies of $250 million and revenue synergies of $100 million by 2019 Reduce net debt to EBITDA to 2.5x – 3.0x by 2017 Committed to shareholder remuneration via quarterly dividend
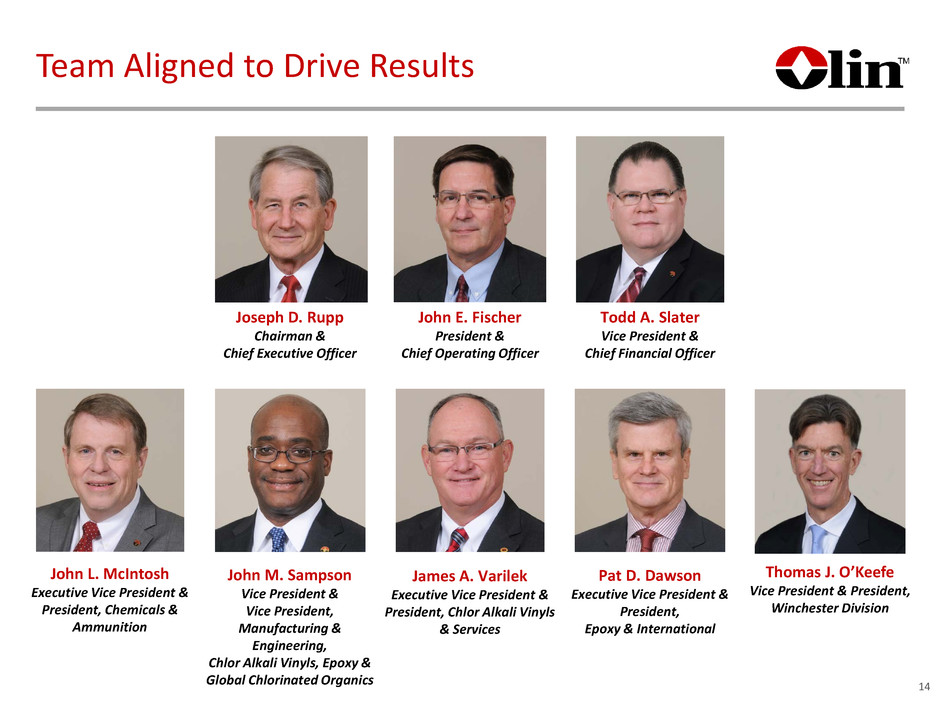
Thomas J. O’Keefe Vice President & President, Winchester Division Team Aligned to Drive Results 14 John L. McIntosh Executive Vice President & President, Chemicals & Ammunition John M. Sampson Vice President & Vice President, Manufacturing & Engineering, Chlor Alkali Vinyls, Epoxy & Global Chlorinated Organics Joseph D. Rupp Chairman & Chief Executive Officer James A. Varilek Executive Vice President & President, Chlor Alkali Vinyls & Services John E. Fischer President & Chief Operating Officer Pat D. Dawson Executive Vice President & President, Epoxy & International Todd A. Slater Vice President & Chief Financial Officer
KEY CONSIDERATIONS FOR SUCCESS John E. Fischer President & Chief Operating Officer

16 Key Considerations for Success 1.Portfolio Balance 3.Cost- Advantaged Position 4.Market Dynamics 5.Synergy Potential 2.Reduced Cyclicality Chlor Alkali Epoxy Winchester Low-Cost Energy Low-Cost Brine Membrane Ethylene • Upside from Caustic • Upside from EDC Prices • $250 million in Cost Synergies • $100 million in Revenue Synergies • Reduced Merchant Chlorine and Caustic Soda Exposure
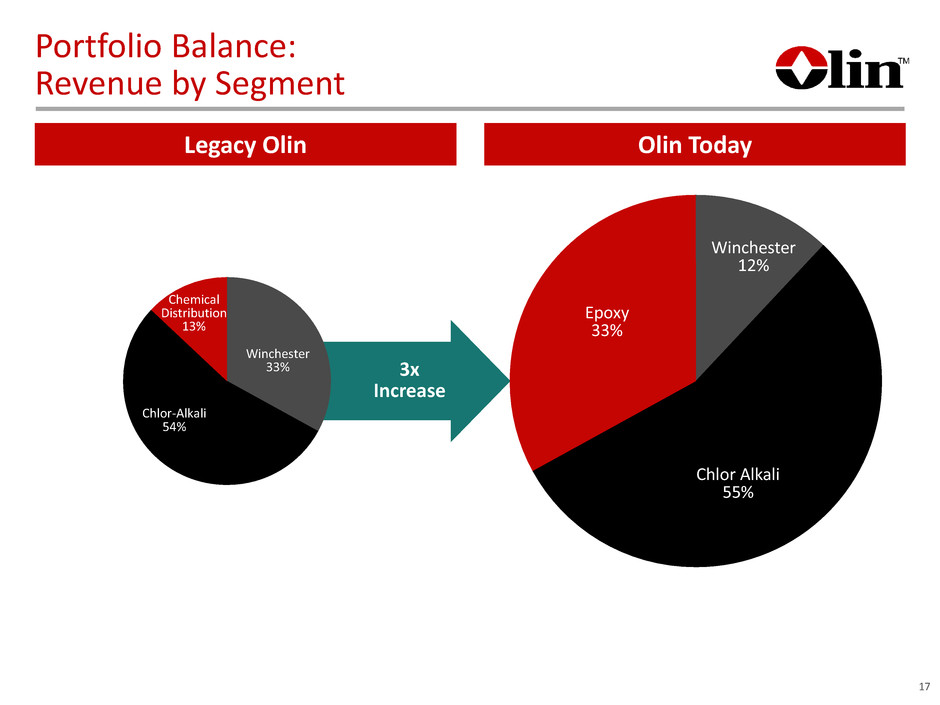
3x Increase Portfolio Balance: Revenue by Segment 17 Legacy Olin Olin Today Winchester 12% Chlor Alkali 55% Epoxy 33% Winchester 33% Chlor-Alkali 54% Chemical Distribution 13%
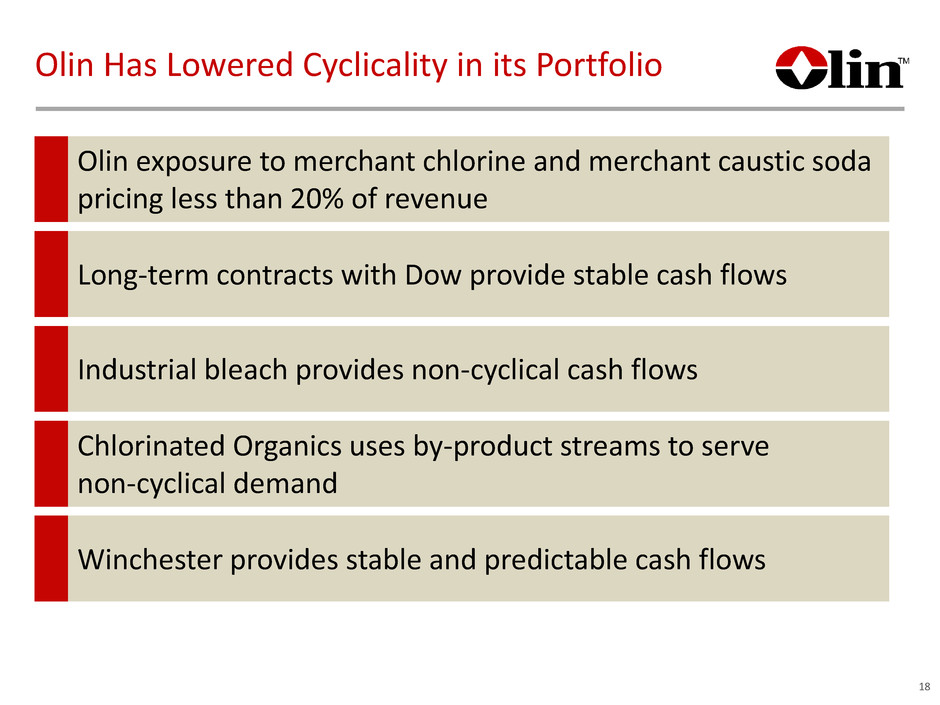
18 Olin Has Lowered Cyclicality in its Portfolio Olin exposure to merchant chlorine and merchant caustic soda pricing less than 20% of revenue Long-term contracts with Dow provide stable cash flows Industrial bleach provides non-cyclical cash flows Chlorinated Organics uses by-product streams to serve non-cyclical demand Winchester provides stable and predictable cash flows
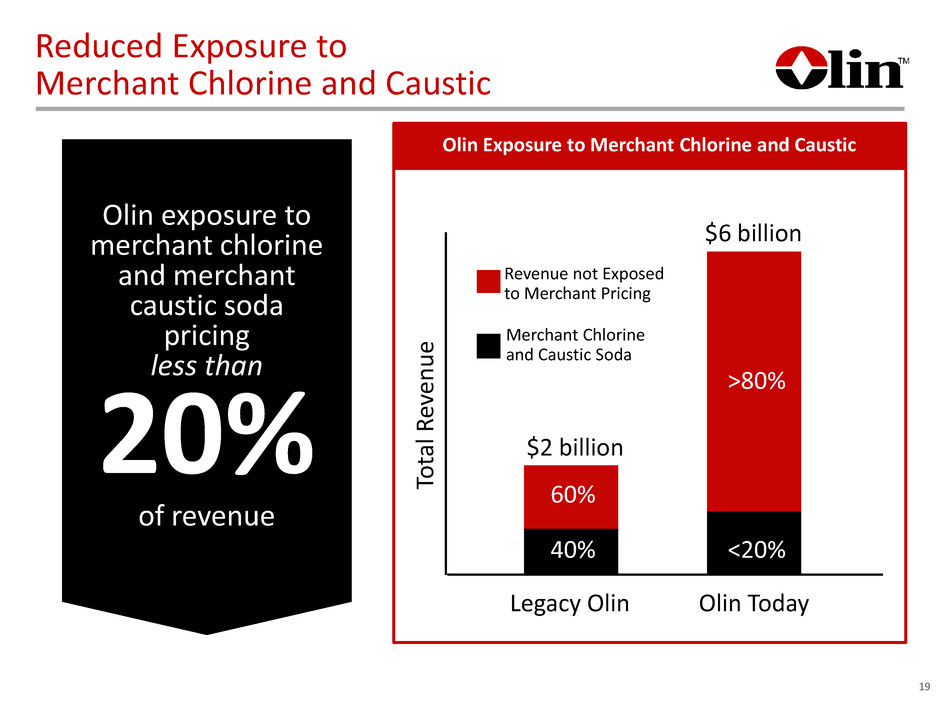
Reduced Exposure to Merchant Chlorine and Caustic Olin exposure to merchant chlorine and merchant caustic soda pricing less than 20% of revenue 19 Legacy Olin To ta l R ev en ue Merchant Chlorine and Caustic Soda Revenue not Exposed to Merchant Pricing 40% 60% $2 billion <20% >80% $6 billion Olin Exposure to Merchant Chlorine and Caustic Olin Today
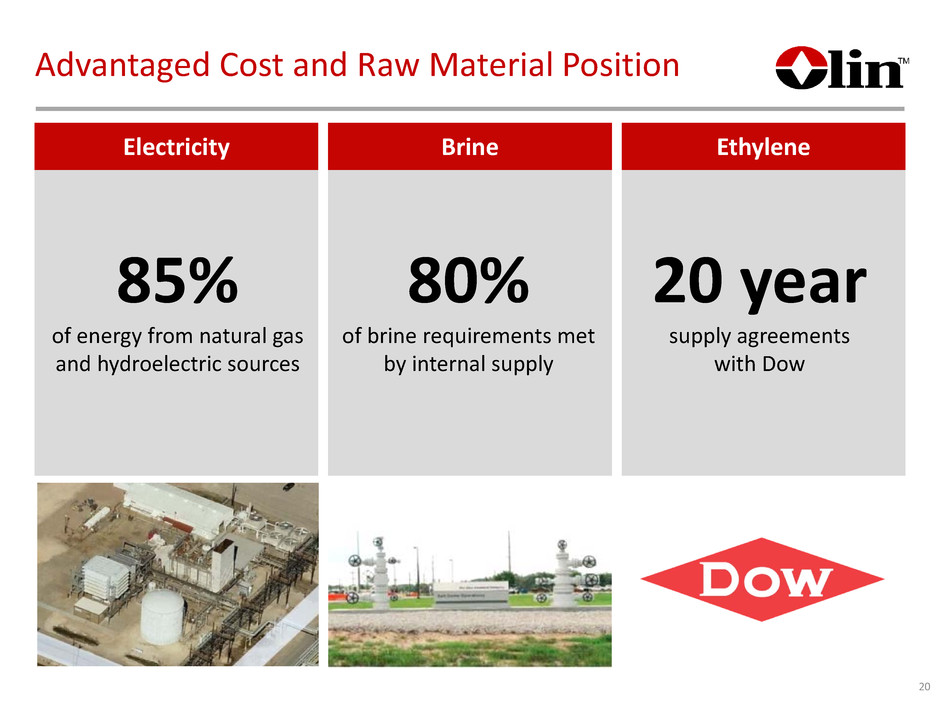
Electricity Brine Ethylene 20 Advantaged Cost and Raw Material Position 85% of energy from natural gas and hydroelectric sources 80% of brine requirements met by internal supply 20 year supply agreements with Dow

21 Facility Capacity Energy Sources Brine Source Freeport, TX 3,289 Natural Gas Owned Plaquemine, LA 1,070 Natural Gas Owned McIntosh, AL 778 Coal & Nuclear Owned Niagara Falls, NY 300 Hydro Brine by Pipeline St. Gabriel, LA 246 Natural Gas Brine by Pipeline Charleston, TN 218 Coal, Hydro & Nuclear Purchase Salt Becancour, QC 175 Hydro Purchase Salt Henderson, NV 152 Natural Gas & Hydro Purchase Salt Total 6,190 85% Natural Gas & Hydro 80% Owned Low Cost Energy and Brine Sources
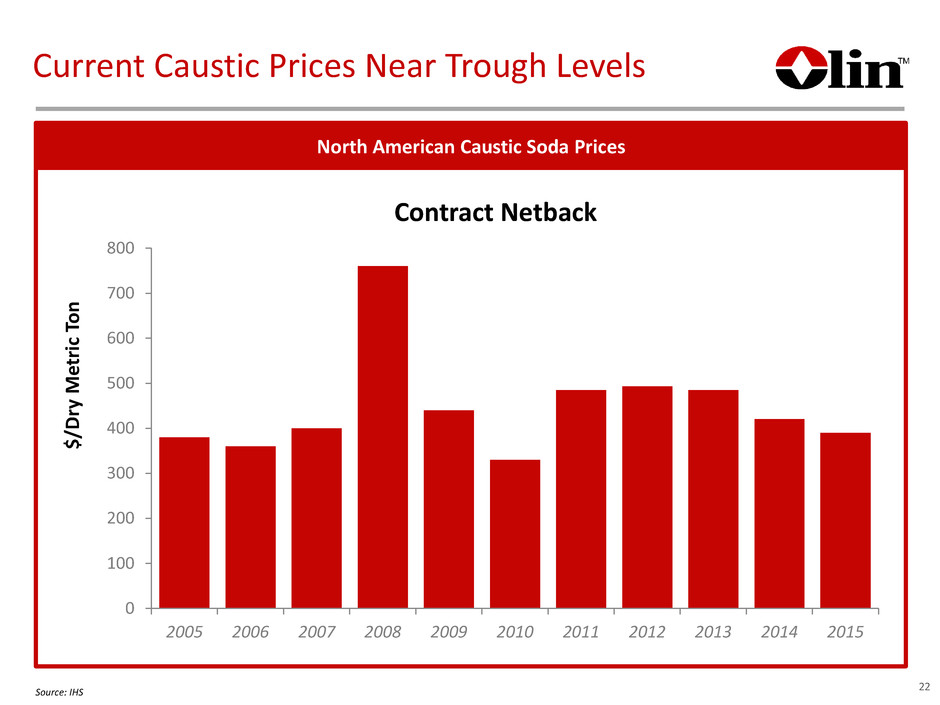
Current Caustic Prices Near Trough Levels 0 100 200 300 400 500 600 700 800 2005 2006 2007 2008 2009 2010 2011 2012 2013 2014 2015 Contract Netback North American Caustic Soda Prices $/ D ry M et ri c To n 22Source: IHS
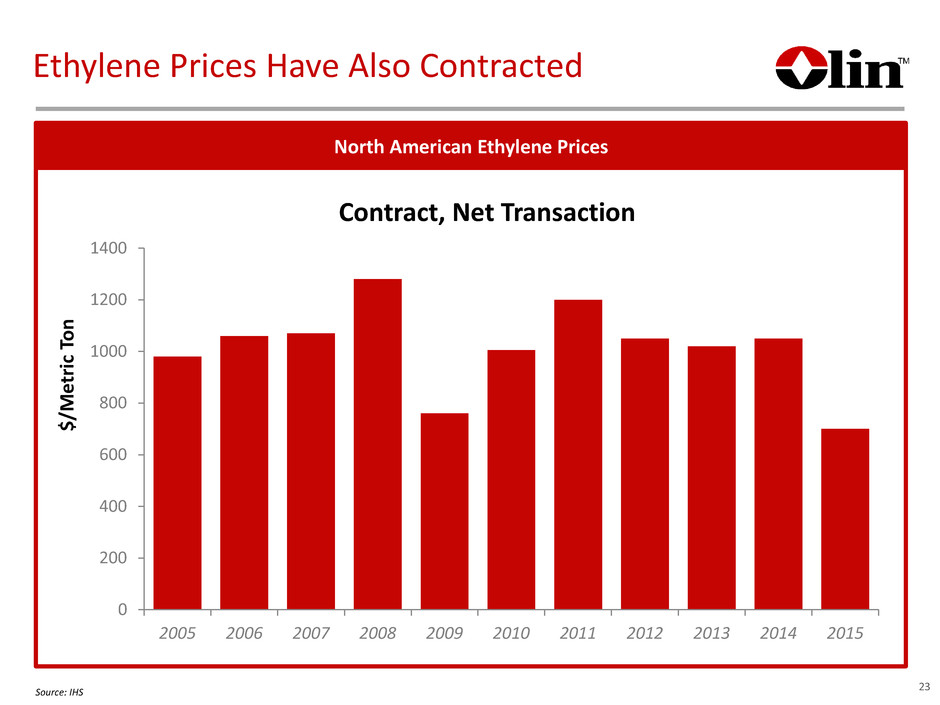
Ethylene Prices Have Also Contracted 0 200 400 600 800 1000 1200 1400 2005 2006 2007 2008 2009 2010 2011 2012 2013 2014 2015 Contract, Net Transaction North American Ethylene Prices $/ M et ri c To n 23Source: IHS
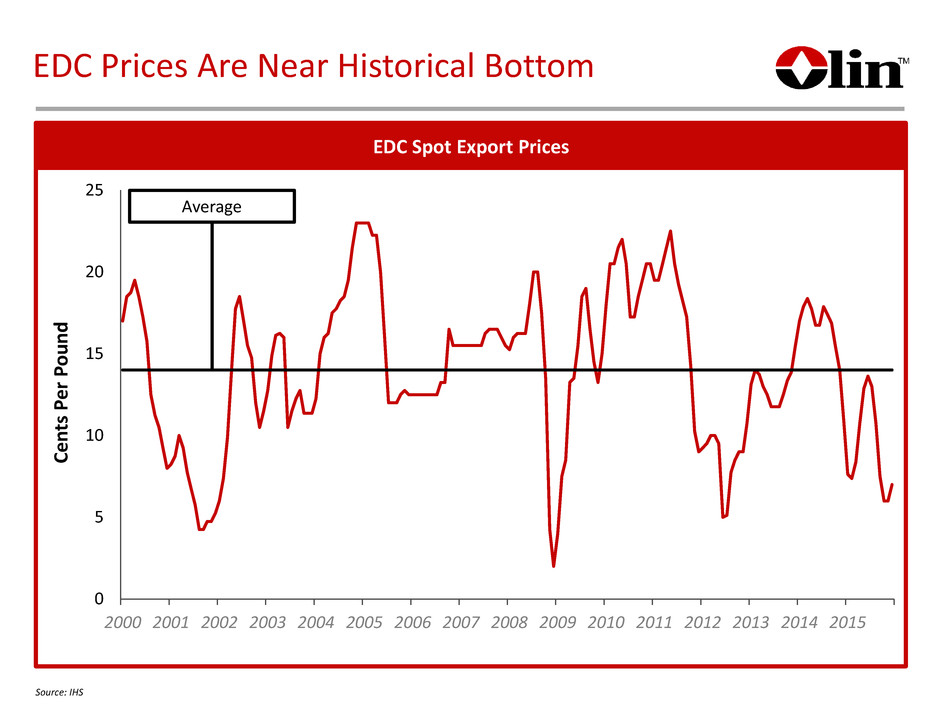
EDC Spot Export Prices Ce nt s Pe r Po un d 0 5 10 15 20 25 2000 2001 2002 2003 2004 2005 2006 2007 2008 2009 2010 2011 2012 2013 2014 2015 Average EDC Prices Are Near Historical Bottom Source: IHS
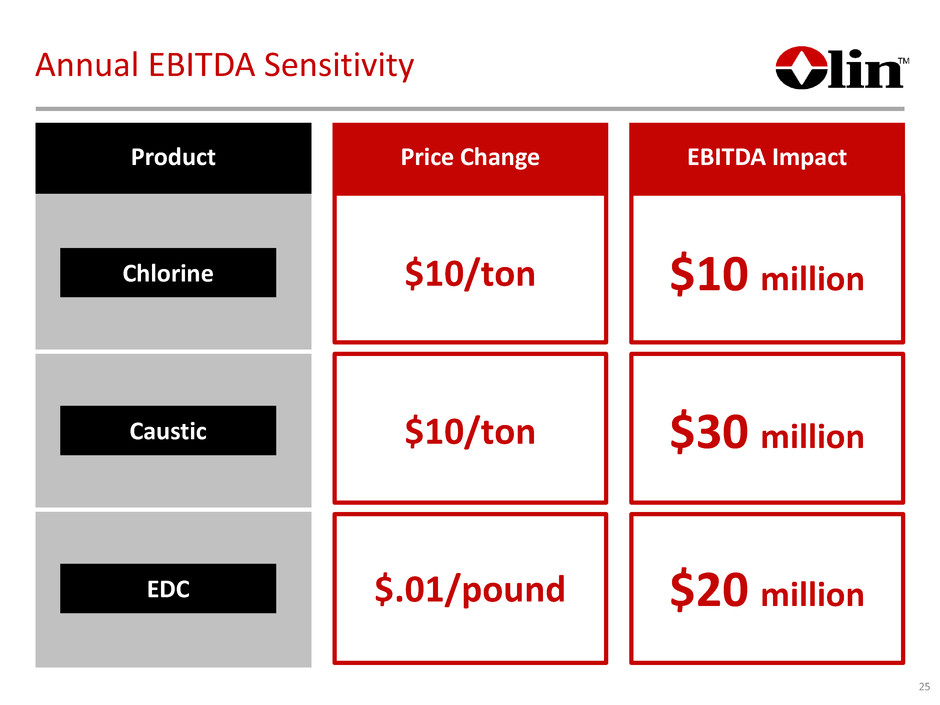
25 Product Price Change EBITDA Impact Chlorine $10/ton $10 million Caustic $10/ton $30 million EDC $.01/pound $20 million Annual EBITDA Sensitivity
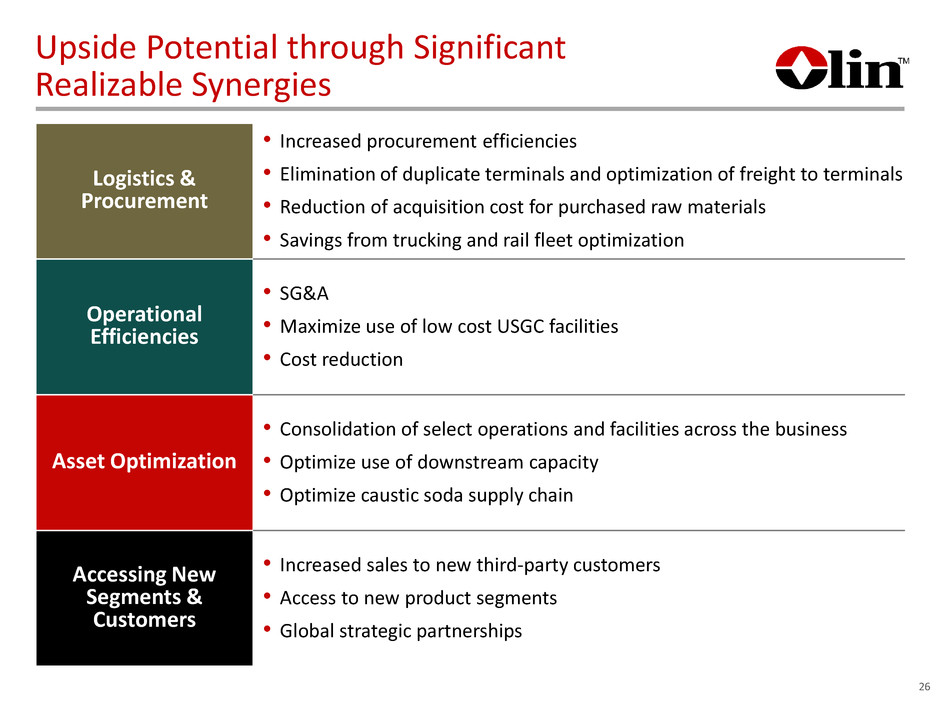
Upside Potential through Significant Realizable Synergies $250 Logistics & Procurement • Increased procurement efficiencies • Elimination of duplicate terminals and optimization of freight to terminals • Reduction of acquisition cost for purchased raw materials • Savings from trucking and rail fleet optimization Operational Efficiencies • SG&A • Maximize use of low cost USGC facilities • Cost reduction Asset Optimization • Consolidation of select operations and facilities across the business • Optimize use of downstream capacity • Optimize caustic soda supply chain Accessing New Segments & Customers • Increased sales to new third-party customers • Access to new product segments • Global strategic partnerships 26

Upside Potential through Significant Realizable Synergies $250 Logistics & Procurement Operational Efficiencies Asset Optimization Accessing New Segments & Customers Capital Investment Synergies Breakdown ($M) 2016 2017 2018 2019 Projected 40-60 100-110 180-200 250 Projected Year-End Run Rate 70-80 135-165 230-250 250 Projected 0-5 15-25 40-50 100 Projected Year-End Run Rate 5 35-50 50 100 Projected CAPEX 60 80 50 0 Projected Cash Integration & Restructuring Costs 60 35 35 20 27
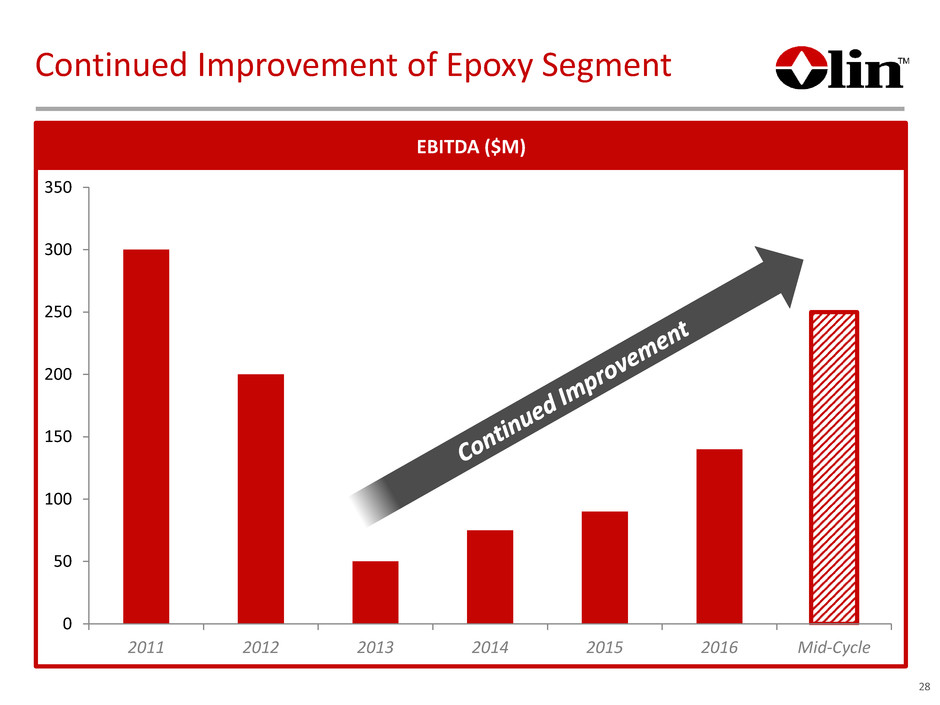
28 Continued Improvement of Epoxy Segment 0 50 100 150 200 250 300 350 2011 2012 2013 2014 2015 2016 Mid-Cycle EBITDA ($M)
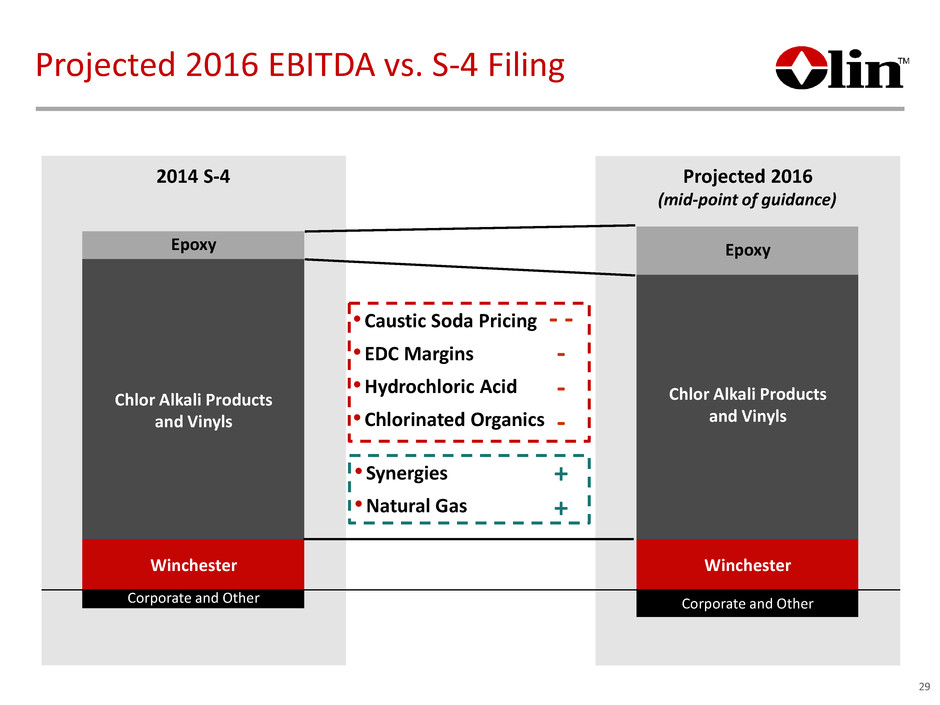
29 Projected 2016 EBITDA vs. S-4 Filing Corporate and Other 2014 S-4 Projected 2016 (mid-point of guidance) Corporate and Other Chlor Alkali Products and Vinyls Epoxy Winchester • Synergies • Natural Gas • Caustic Soda Pricing • EDC Margins • Hydrochloric Acid • Chlorinated Organics - - - - - + + Epoxy Winchester Chlor Alkali Products and Vinyls
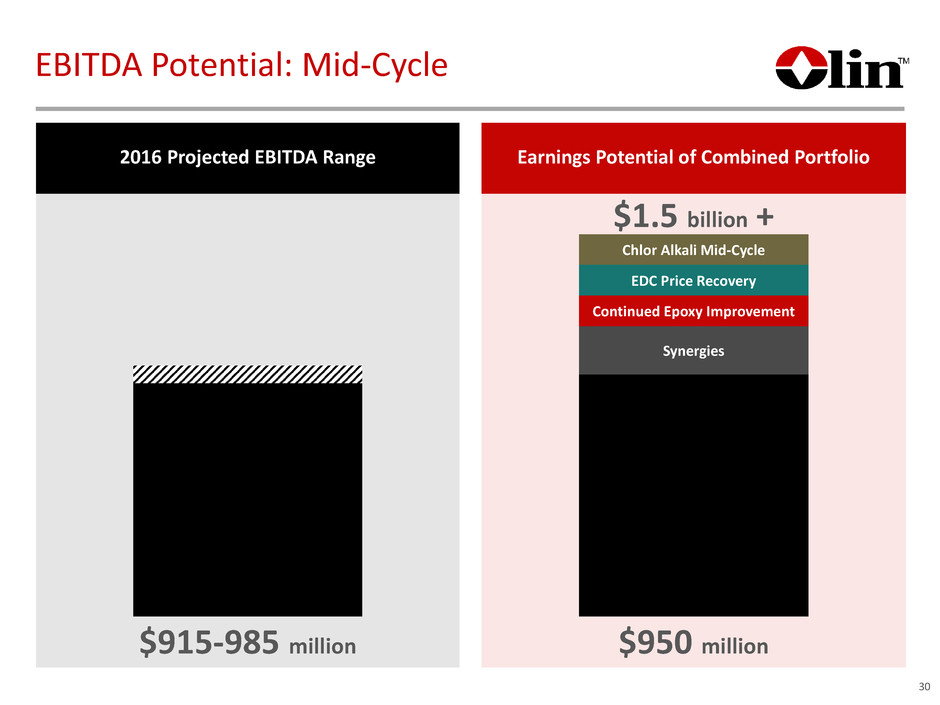
2016 Projected EBITDA Range Earnings Potential of Combined Portfolio 30 EBITDA Potential: Mid-Cycle $915-985 million $1.5 billion + $950 million Chlor Alkali Mid-Cycle EDC Price Recovery Continued Epoxy Improvement Synergies
CHLOR ALKALI INDUSTRY OVERVIEW Joseph D. Rupp Chairman & Chief Executive Officer
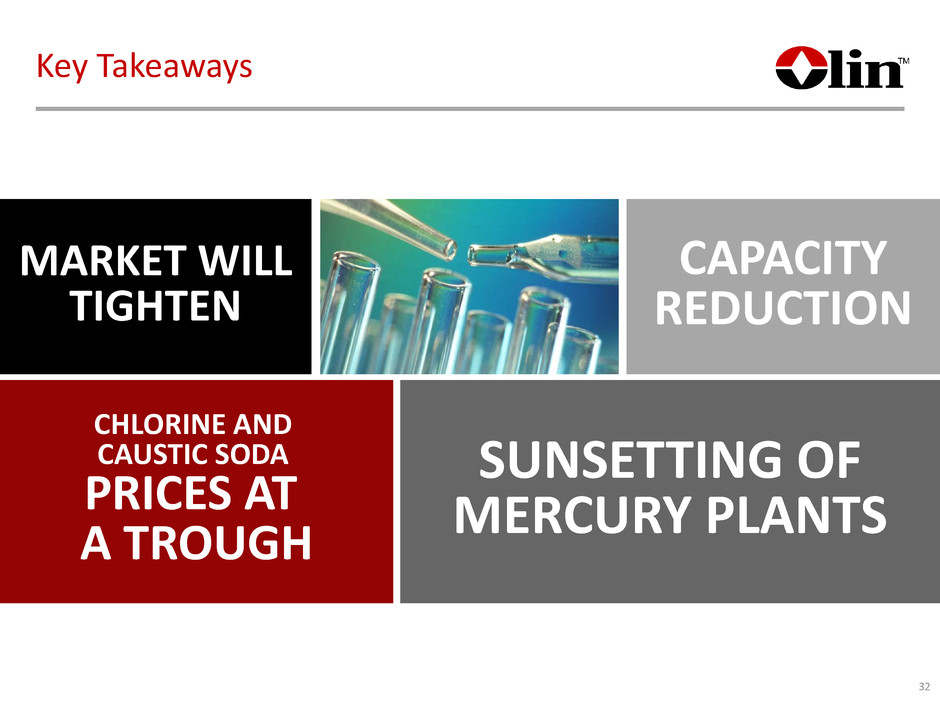
SUNSETTING OF MERCURY PLANTS CHLORINE AND CAUSTIC SODA PRICES AT A TROUGH MARKET WILL TIGHTEN CAPACITY REDUCTION Key Takeaways 32
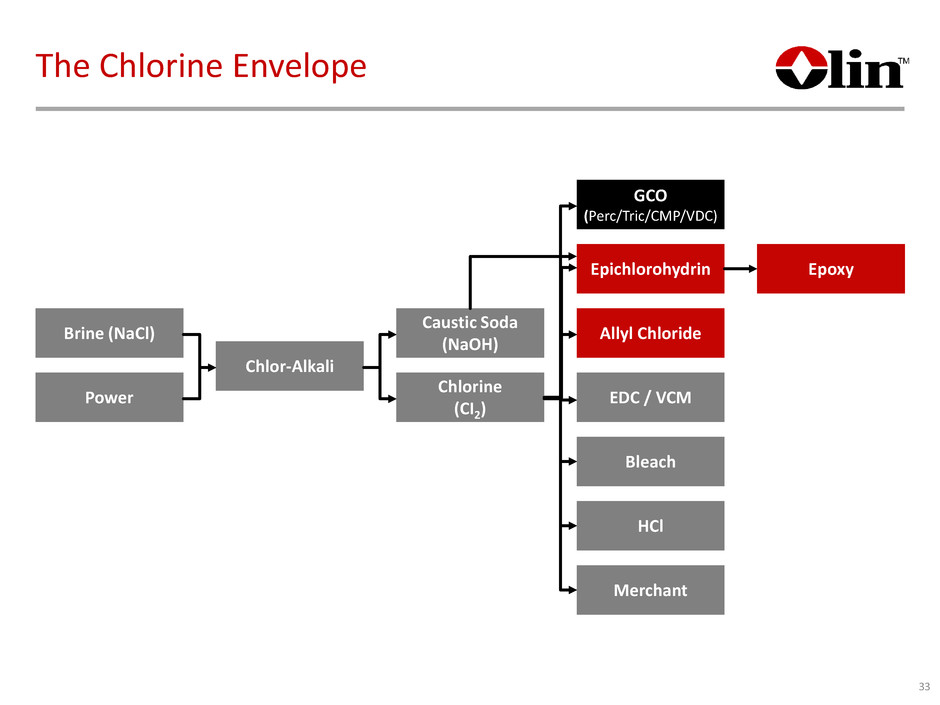
The Chlorine Envelope 33 Epoxy Brine (NaCl) Power Caustic Soda (NaOH) Chlorine (CI2) GCO (Perc/Tric/CMP/VDC) Epichlorohydrin Allyl Chloride EDC / VCM Chlor-Alkali Bleach HCl Merchant
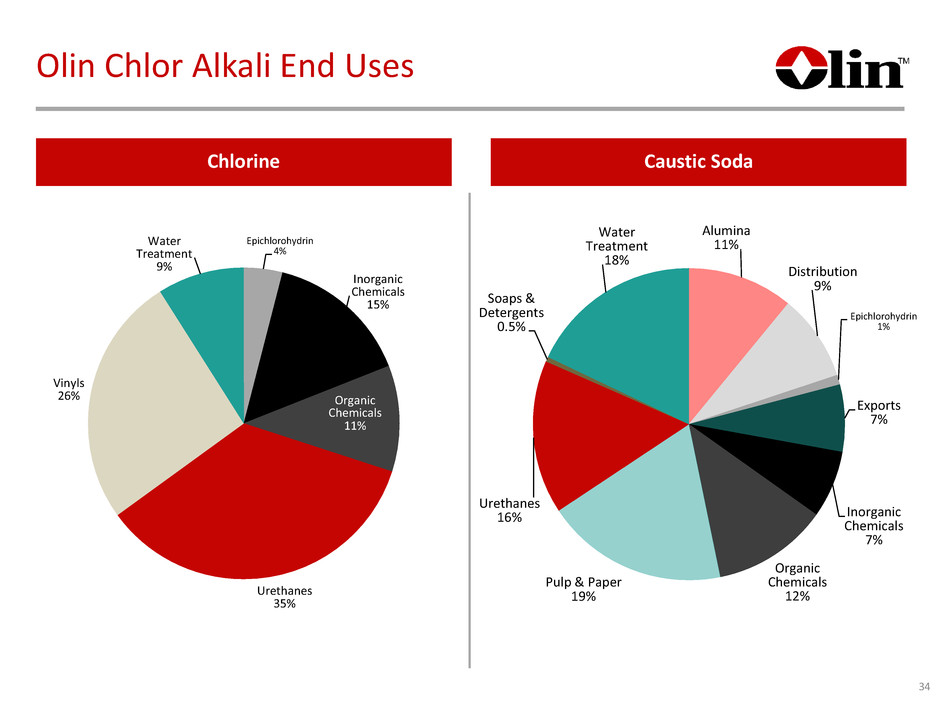
34 Olin Chlor Alkali End Uses Caustic SodaChlorine Epichlorohydrin 4% Inorganic Chemicals 15% Organic Chemicals 11% Urethanes 35% Vinyls 26% Water Treatment 9% Alumina 11% Distribution 9% Epichlorohydrin 1% Exports 7% Inorganic Chemicals 7% Organic Chemicals 12% Pulp & Paper 19% Urethanes 16% Soaps & Detergents 0.5% Water Treatment 18%

35 2015 Global Chlor Alkali Capacity and Operating Rates 0% 10% 20% 30% 40% 50% 60% 70% 80% 90% 100% 0 10,000 20,000 30,000 40,000 50,000 Northeast Asia North America Western Europe Indian Subcont Middle East South America Southeast Asia CIS & Baltic States Central Europe Africa Chlorine Capacity Caustic Capacity Operating Rate (0 00 s M et ri c To ns ) Source: IHS
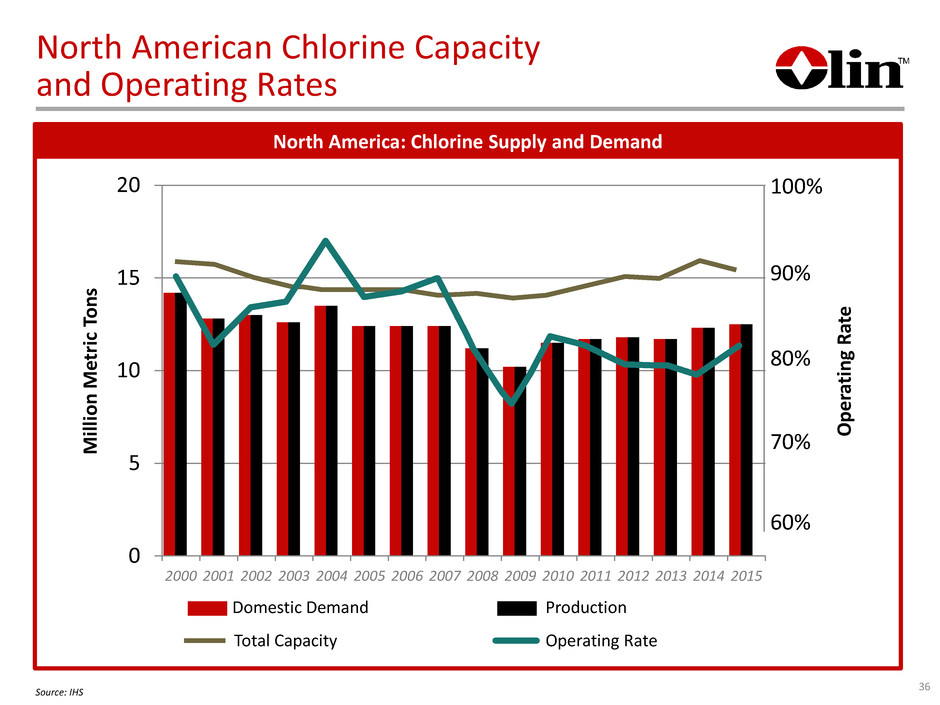
36 North American Chlorine Capacity and Operating Rates North America: Chlorine Supply and Demand 0 5 10 15 20 2000 2001 2002 2003 2004 2005 2006 2007 2008 2009 2010 2011 2012 2013 2014 2015 100% 90% 80% 70% 60% M ill io n M et ri c To ns O pe ra ti ng R at e Domestic Demand Production Operating RateTotal Capacity Source: IHS
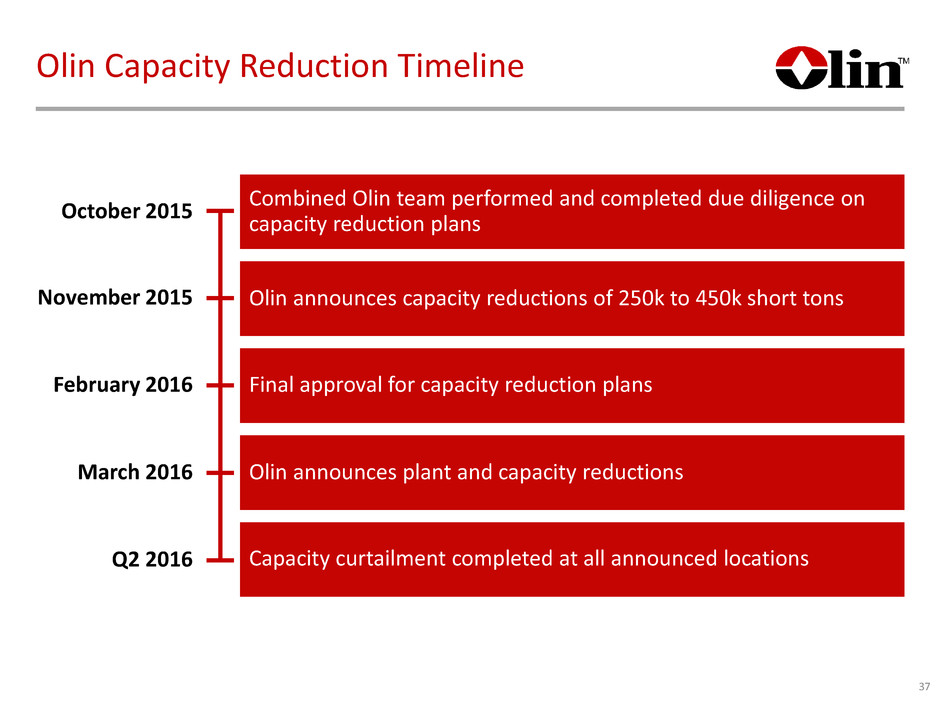
37 Olin Capacity Reduction Timeline Olin announces capacity reductions of 250k to 450k short tonsNovember 2015 March 2016 Q2 2016 Olin announces plant and capacity reductions Final approval for capacity reduction plans Capacity curtailment completed at all announced locations October 2015 February 2016 Combined Olin team performed and completed due diligence on capacity reduction plans
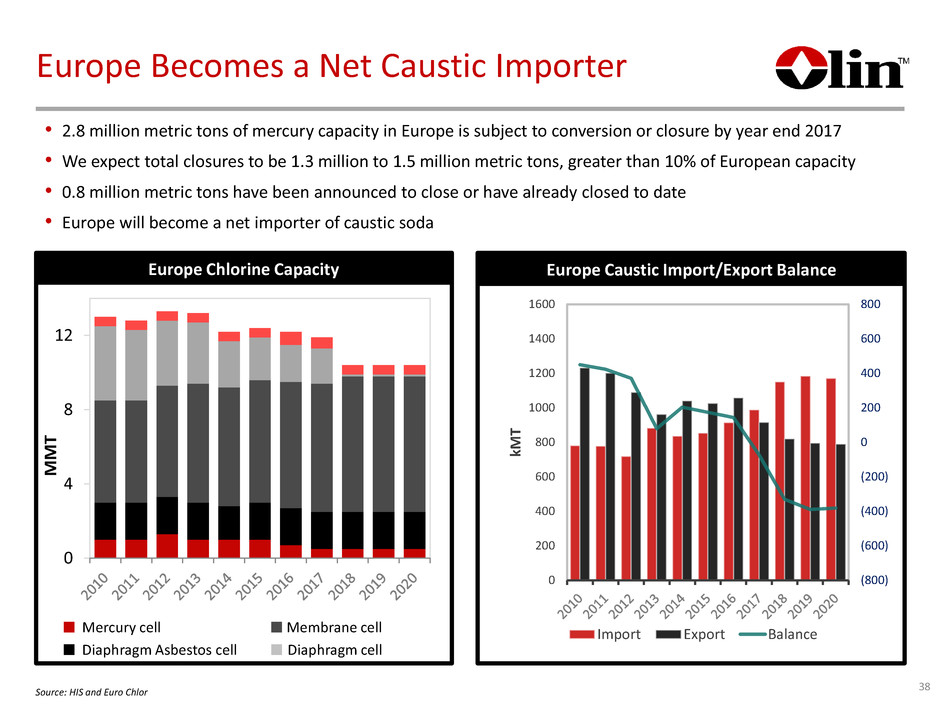
38 Europe Becomes a Net Caustic Importer (800) (600) (400) (200) 0 200 400 600 800 0 200 400 600 800 1000 1200 1400 1600 kM T Import Export Balance Europe Caustic Import/Export Balance 0 4 8 12 M M T Mercury cell Diaphragm Asbestos cell Membrane cell Diaphragm cell Europe Chlorine Capacity • 2.8 million metric tons of mercury capacity in Europe is subject to conversion or closure by year end 2017 • We expect total closures to be 1.3 million to 1.5 million metric tons, greater than 10% of European capacity • 0.8 million metric tons have been announced to close or have already closed to date • Europe will become a net importer of caustic soda Source: HIS and Euro Chlor
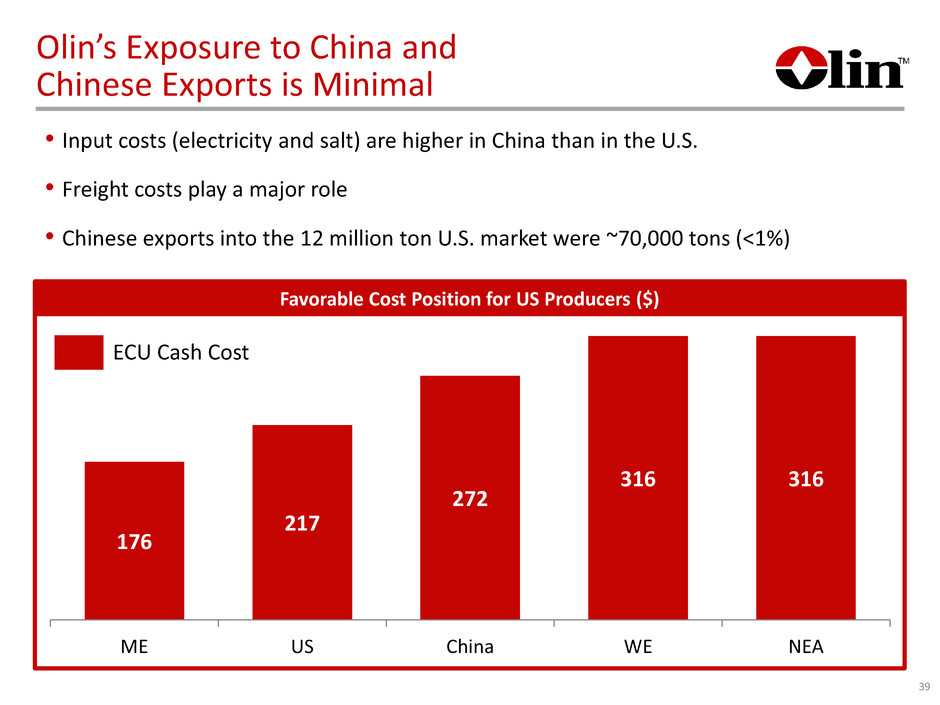
39 Olin’s Exposure to China and Chinese Exports is Minimal 176 217 272 316 316 ME US China WE NEA • Input costs (electricity and salt) are higher in China than in the U.S. • Freight costs play a major role • Chinese exports into the 12 million ton U.S. market were ~70,000 tons (<1%) ECU Cash Cost Favorable Cost Position for US Producers ($)
SUNSETTING OF MERCURY PLANTS CHLORINE AND CAUSTIC SODA PRICES AT A TROUGH MARKET WILL TIGHTEN CAPACITY REDUCTION Key Takeaways 40
LEGACY CHLOR ALKALI BUSINESS OVERVIEW John McIntosh Executive Vice President of Olin Corp. President of Chemicals & Ammunition
PROVIDES A BALANCED ENERGY PORTFOLIO FACILITATES BLEACH, HCl AND KOH BUSINESS PARTICIPATION REGIONAL PLANT PROFILE GEOGRAPHIC ADVANTAGE LOGISTICS ADVANTAGE Legacy Olin Chlor Alkali Value Proposition 42
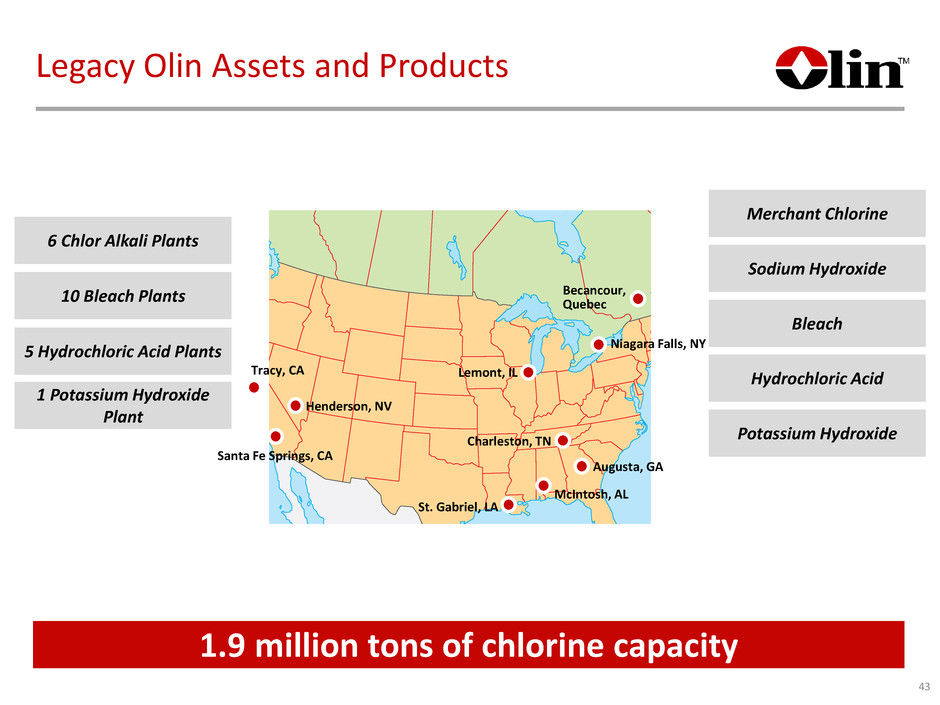
Santa Fe Springs, CA Tracy, CA Henderson, NV Becancour, Quebec Niagara Falls, NY Augusta, GA McIntosh, AL St. Gabriel, LA Charleston, TN Lemont, IL Legacy Olin Assets and Products 6 Chlor Alkali Plants 10 Bleach Plants 1 Potassium Hydroxide Plant 1.9 million tons of chlorine capacity Merchant Chlorine Hydrochloric Acid Bleach Sodium Hydroxide 43 5 Hydrochloric Acid Plants Potassium Hydroxide
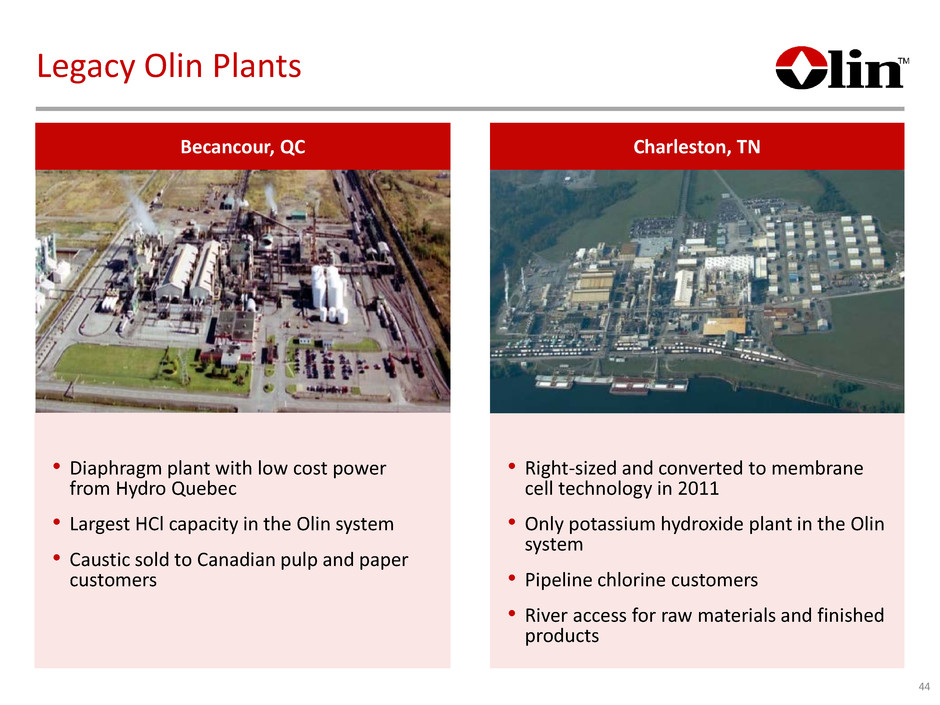
44 Legacy Olin Plants Becancour, QC Charleston, TN • Diaphragm plant with low cost power from Hydro Quebec • Largest HCl capacity in the Olin system • Caustic sold to Canadian pulp and paper customers • Right-sized and converted to membrane cell technology in 2011 • Only potassium hydroxide plant in the Olin system • Pipeline chlorine customers • River access for raw materials and finished products
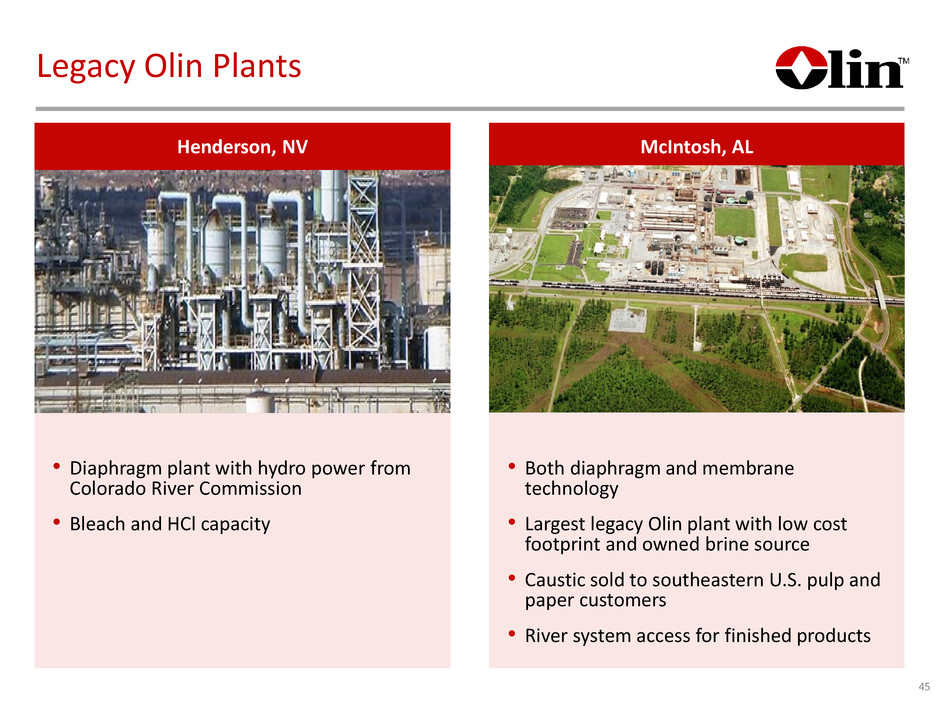
45 Legacy Olin Plants Henderson, NV McIntosh, AL • Diaphragm plant with hydro power from Colorado River Commission • Bleach and HCl capacity • Both diaphragm and membrane technology • Largest legacy Olin plant with low cost footprint and owned brine source • Caustic sold to southeastern U.S. pulp and paper customers • River system access for finished products

46 Legacy Olin Plants Niagara Falls, NY St. Gabriel, LA • Membrane plant with low cost hydro power from NY Power Authority • Brine supplied by pipeline • Largest bleach capacity in the Olin system • Converted to membrane technology in 2008 • Electricity principally natural gas based with brine delivered by pipeline • Chlorine by pipeline to Geismar complex • River access for caustic soda
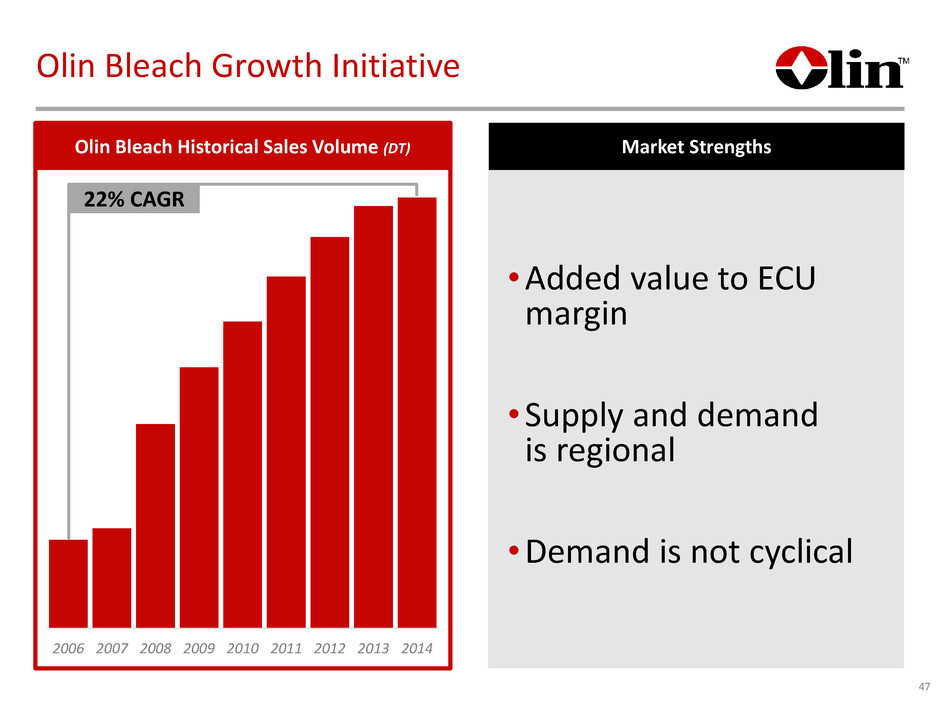
47 Olin Bleach Growth Initiative Market Strengths •Added value to ECU margin •Supply and demand is regional •Demand is not cyclical 2006 2007 2008 2009 2010 2011 2012 2013 2014 22% CAGR Olin Bleach Historical Sales Volume (DT)
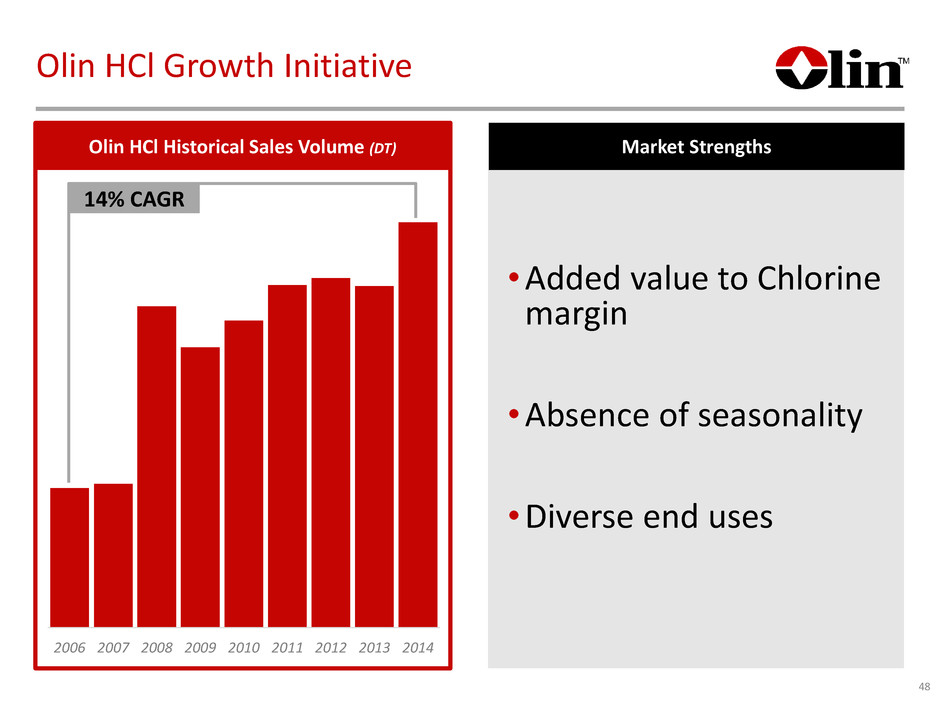
48 Olin HCl Growth Initiative Olin HCl Historical Sales Volume (DT) 2006 2007 2008 2009 2010 2011 2012 2013 2014 Market Strengths •Added value to Chlorine margin •Absence of seasonality •Diverse end uses 14% CAGR
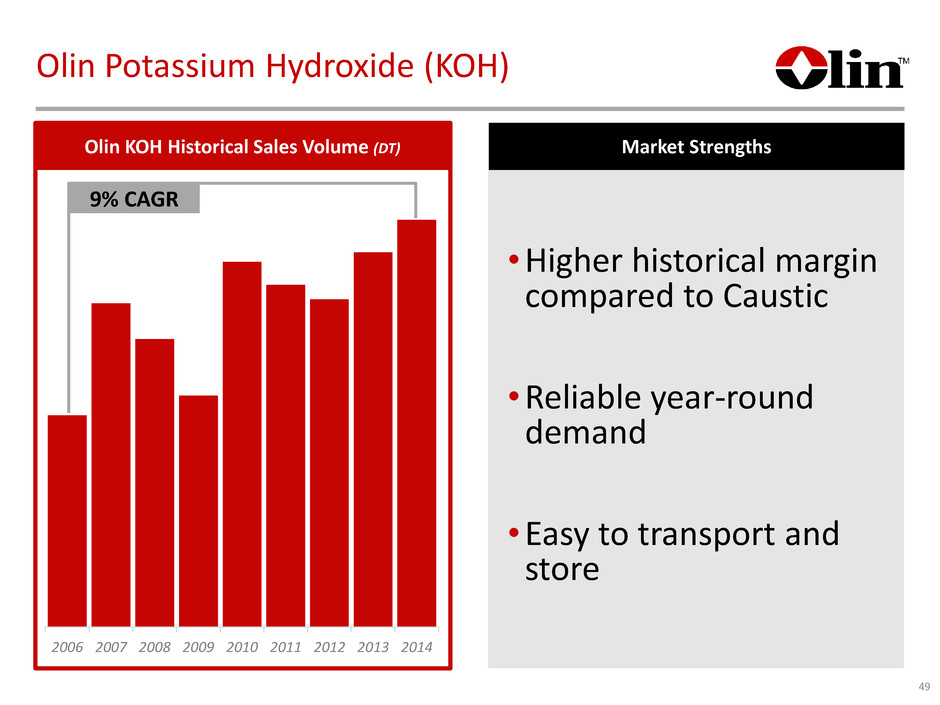
49 Olin Potassium Hydroxide (KOH) Market Strengths •Higher historical margin compared to Caustic •Reliable year-round demand •Easy to transport and store 2006 2007 2008 2009 2010 2011 2012 2013 2014 Olin KOH Historical Sales Volume (DT) 9% CAGR
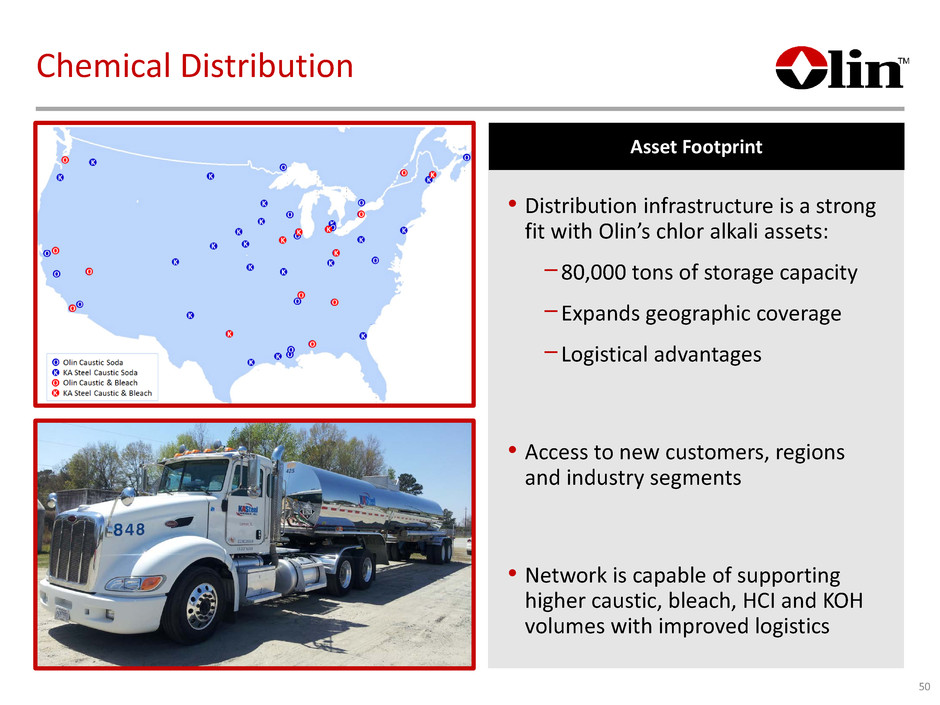
50 Chemical Distribution Asset Footprint • Distribution infrastructure is a strong fit with Olin’s chlor alkali assets: −80,000 tons of storage capacity −Expands geographic coverage −Logistical advantages • Access to new customers, regions and industry segments • Network is capable of supporting higher caustic, bleach, HCI and KOH volumes with improved logistics
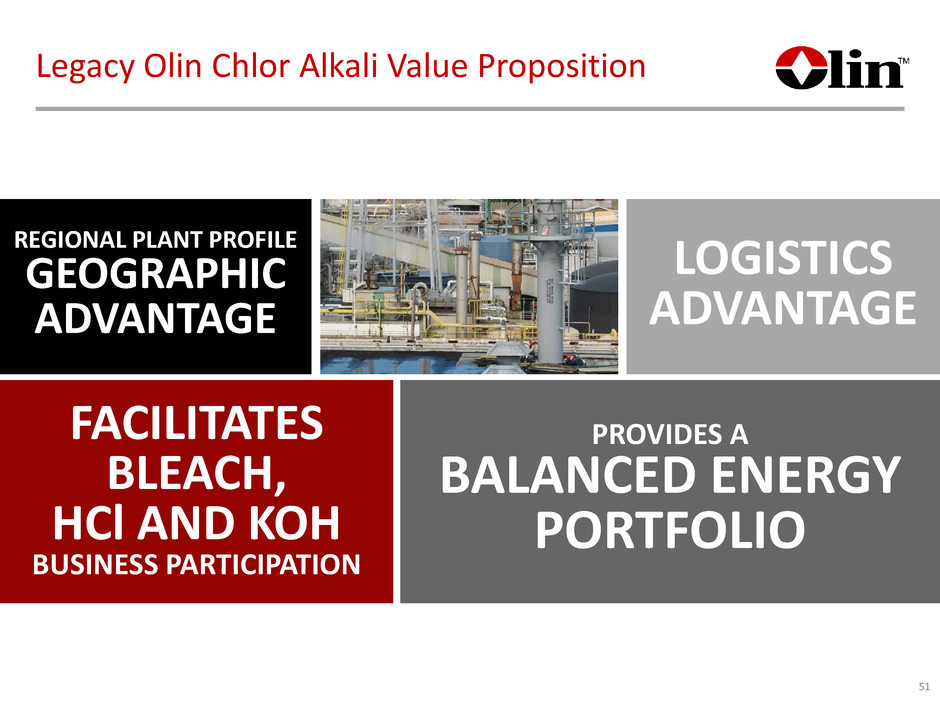
PROVIDES A BALANCED ENERGY PORTFOLIO FACILITATES BLEACH, HCl AND KOH BUSINESS PARTICIPATION REGIONAL PLANT PROFILE GEOGRAPHIC ADVANTAGE LOGISTICS ADVANTAGE Legacy Olin Chlor Alkali Value Proposition 51
ACQUIRED CHLOR ALKALI ASSETS John Sampson Vice President of Olin Corp. Vice President of Manufacturing & Engineering
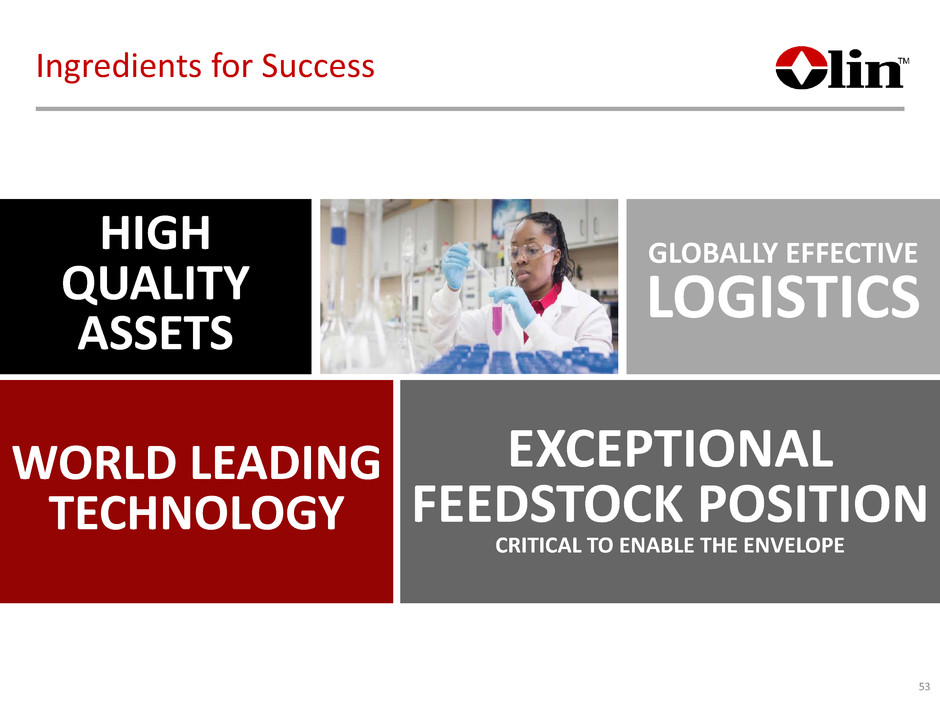
EXCEPTIONAL FEEDSTOCK POSITION CRITICAL TO ENABLE THE ENVELOPE WORLD LEADING TECHNOLOGY HIGH QUALITY ASSETS GLOBALLY EFFECTIVE LOGISTICS Ingredients for Success 53
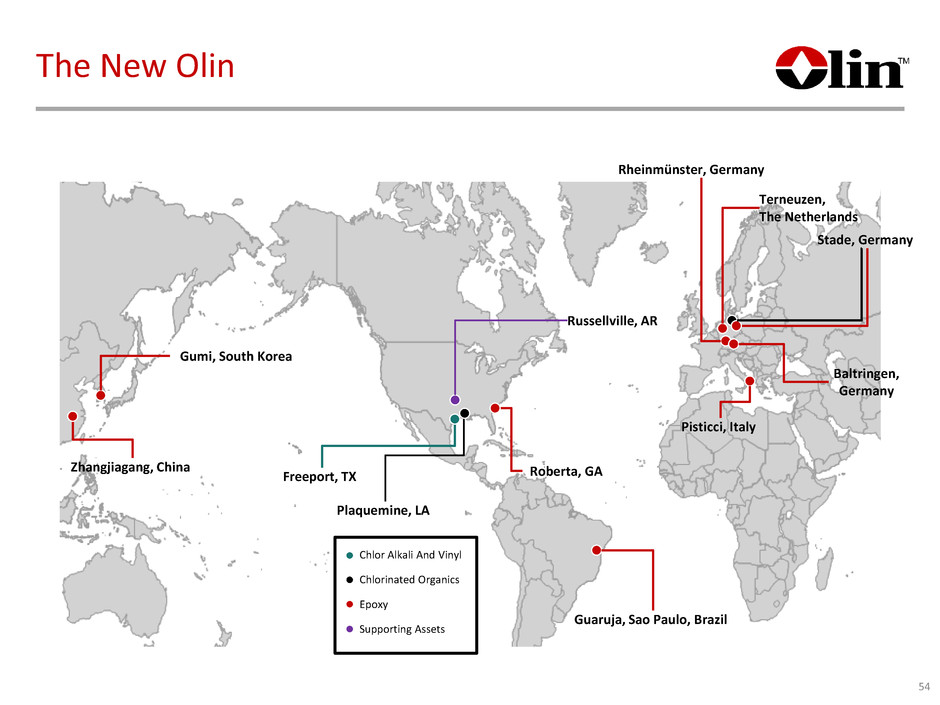
The New Olin 54 Chlor Alkali And Vinyl Chlorinated Organics Epoxy Supporting Assets Zhangjiagang, China Gumi, South Korea Guaruja, Sao Paulo, Brazil Pisticci, Italy Roberta, GA Rheinmünster, Germany Terneuzen, The Netherlands Baltringen, Germany Stade, Germany Freeport, TX Plaquemine, LA Russellville, AR
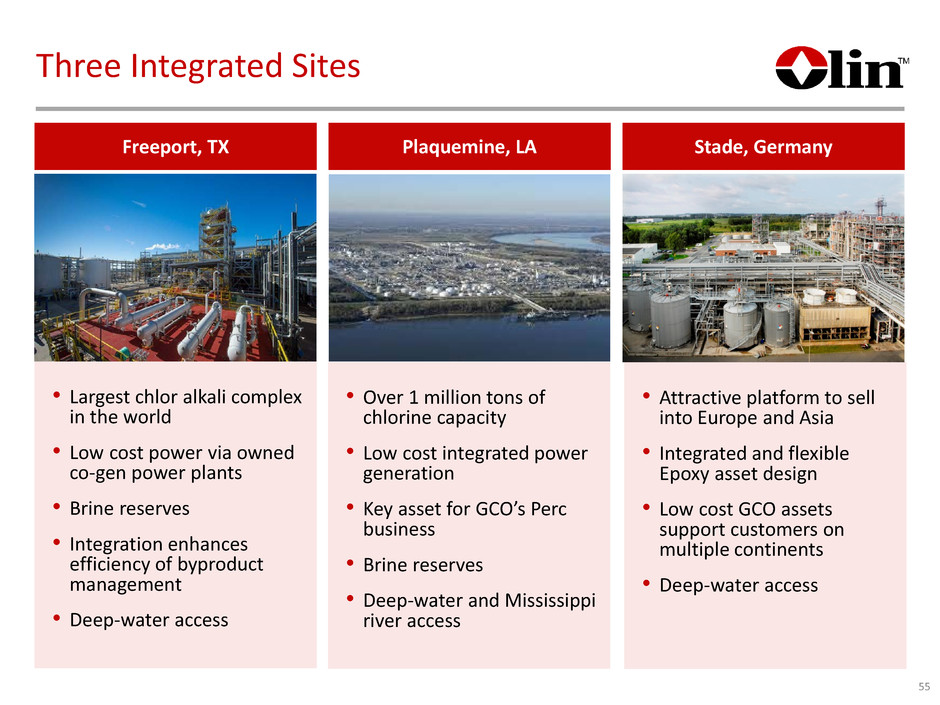
Three Integrated Sites 55 Freeport, TX Plaquemine, LA Stade, Germany • Largest chlor alkali complex in the world • Low cost power via owned co-gen power plants • Brine reserves • Integration enhances efficiency of byproduct management • Deep-water access • Over 1 million tons of chlorine capacity • Low cost integrated power generation • Key asset for GCO’s Perc business • Brine reserves • Deep-water and Mississippi river access • Attractive platform to sell into Europe and Asia • Integrated and flexible Epoxy asset design • Low cost GCO assets support customers on multiple continents • Deep-water access
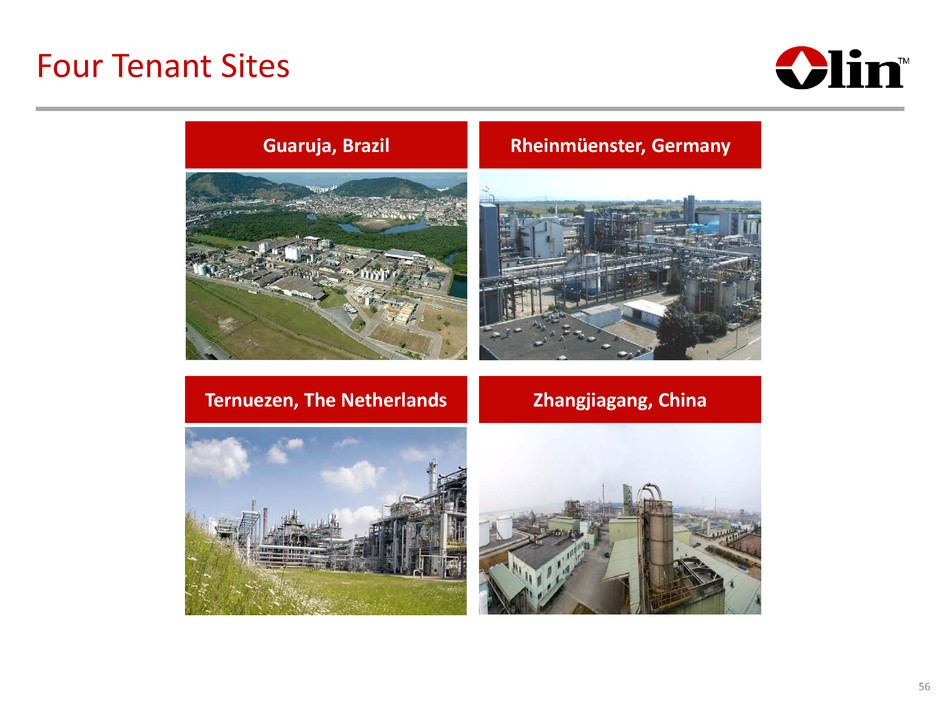
Four Tenant Sites 56 Guaruja, Brazil Rheinmüenster, Germany Ternuezen, The Netherlands Zhangjiagang, China
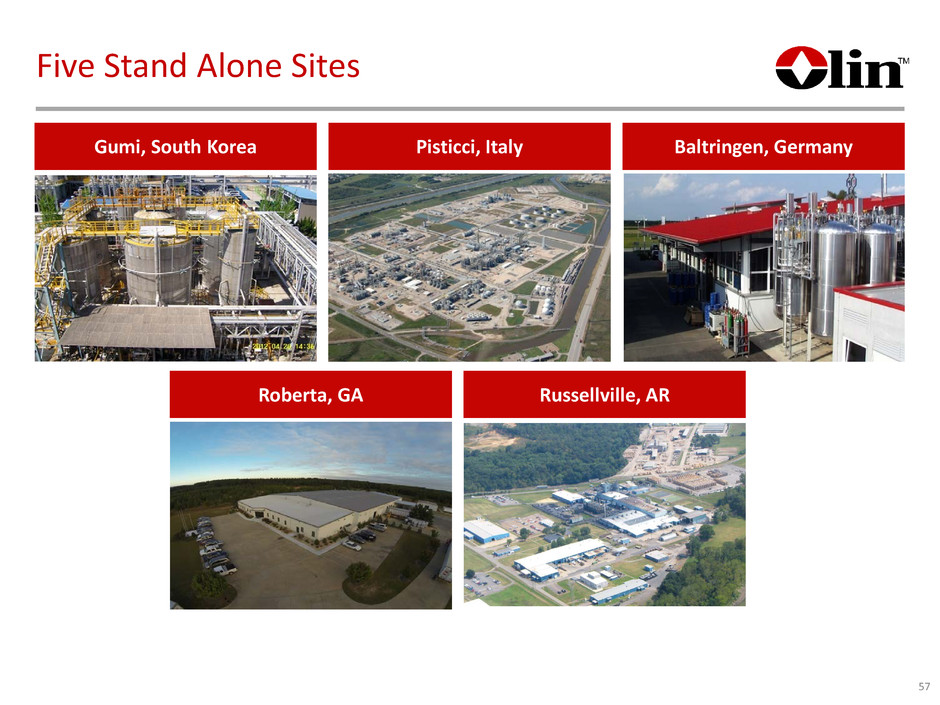
Baltringen, Germany Roberta, GA Five Stand Alone Sites 57 Gumi, South Korea Pisticci, Italy Russellville, AR
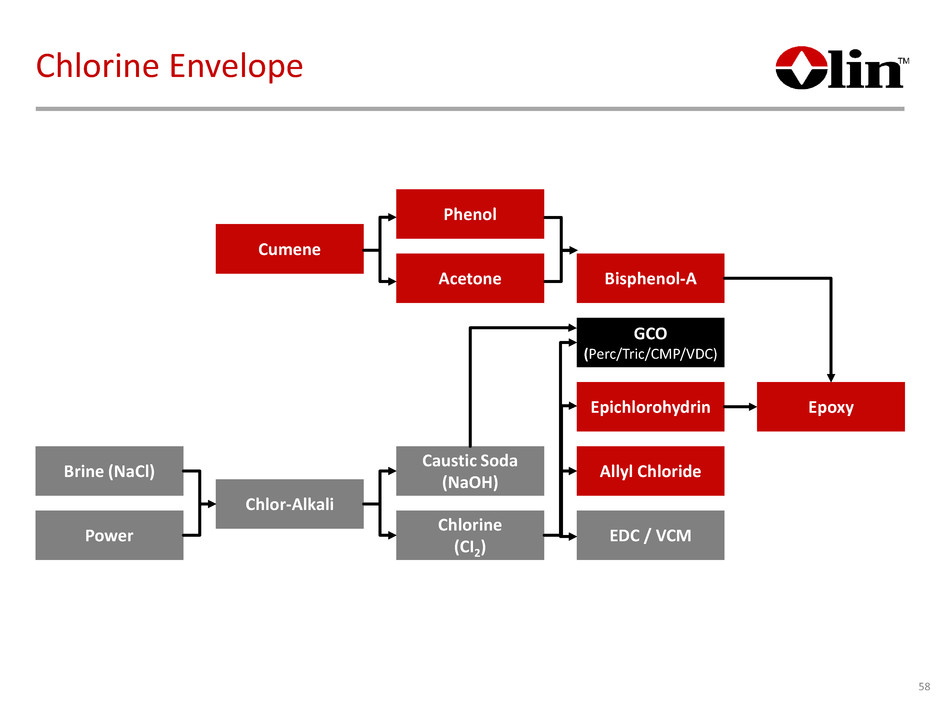
Chlorine Envelope 58 Epoxy Brine (NaCl) Power Phenol Acetone Caustic Soda (NaOH) Chlorine (CI2) Bisphenol-A GCO (Perc/Tric/CMP/VDC) Epichlorohydrin Allyl Chloride EDC / VCM Chlor-Alkali Cumene
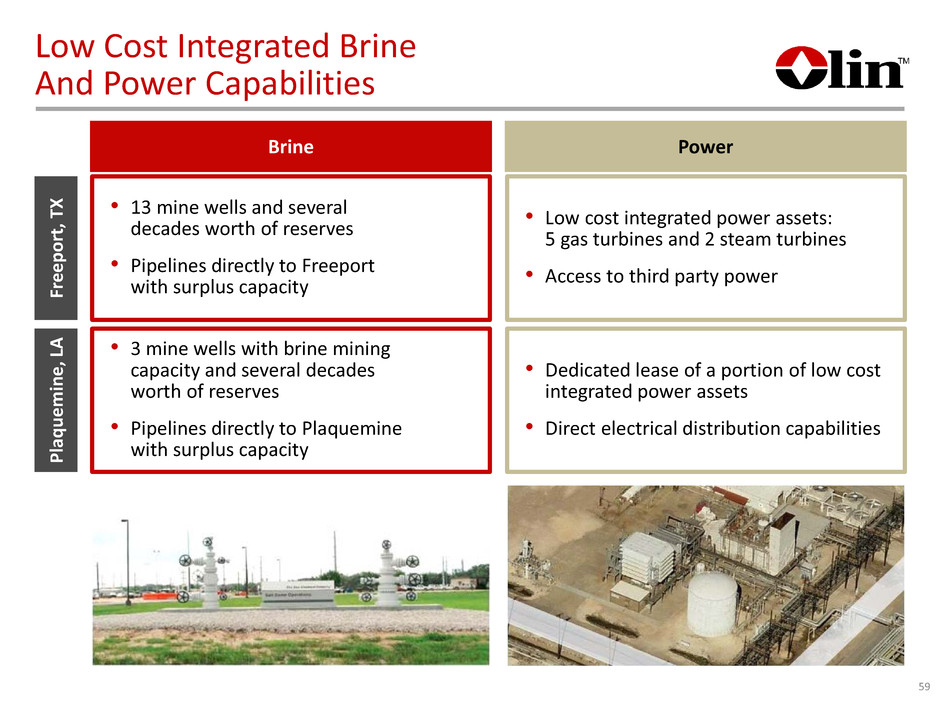
Fr ee po rt , T X Pl aq ue m in e, L A • 13 mine wells and several decades worth of reserves • Pipelines directly to Freeport with surplus capacity • 3 mine wells with brine mining capacity and several decades worth of reserves • Pipelines directly to Plaquemine with surplus capacity • Dedicated lease of a portion of low cost integrated power assets • Direct electrical distribution capabilities • Low cost integrated power assets: 5 gas turbines and 2 steam turbines • Access to third party power Low Cost Integrated Brine And Power Capabilities Brine Power 59

• Industry-leading by-product management • Unique ability to recapture both the chlorine and carbon value - reducing feedstock costs and avoiding disposal costs • Highly experienced team – plant design, technology, and IP management • Designed all of the acquired plants • Supports Chlor Alkali, Epoxy and GCO businesses Technology Centers By-Product Management • Proprietary cell design for both diaphragm and membrane processes Cell Manufacturing and Design • Leader in product innovation and development capabilities as evidenced by its strong positions in high-end epoxy formulations Formulation Expertise Ch lo r A lk al i Ep ox y G CO Outstanding Capabilities and Expertise Across Businesses A ll B us in es s Leader in Technology 60
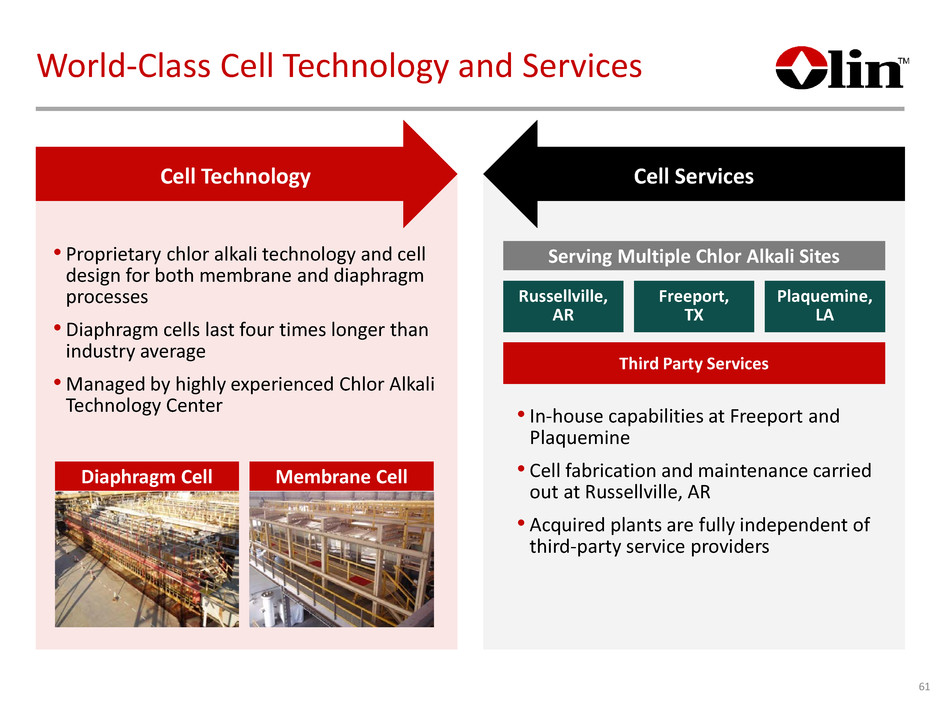
• In-house capabilities at Freeport and Plaquemine • Cell fabrication and maintenance carried out at Russellville, AR • Acquired plants are fully independent of third-party service providers Russellville, AR Plaquemine, LA Freeport, TX Third Party Services Serving Multiple Chlor Alkali Sites World-Class Cell Technology and Services 61 • Proprietary chlor alkali technology and cell design for both membrane and diaphragm processes • Diaphragm cells last four times longer than industry average • Managed by highly experienced Chlor Alkali Technology Center Cell Technology Cell Services Membrane CellDiaphragm Cell
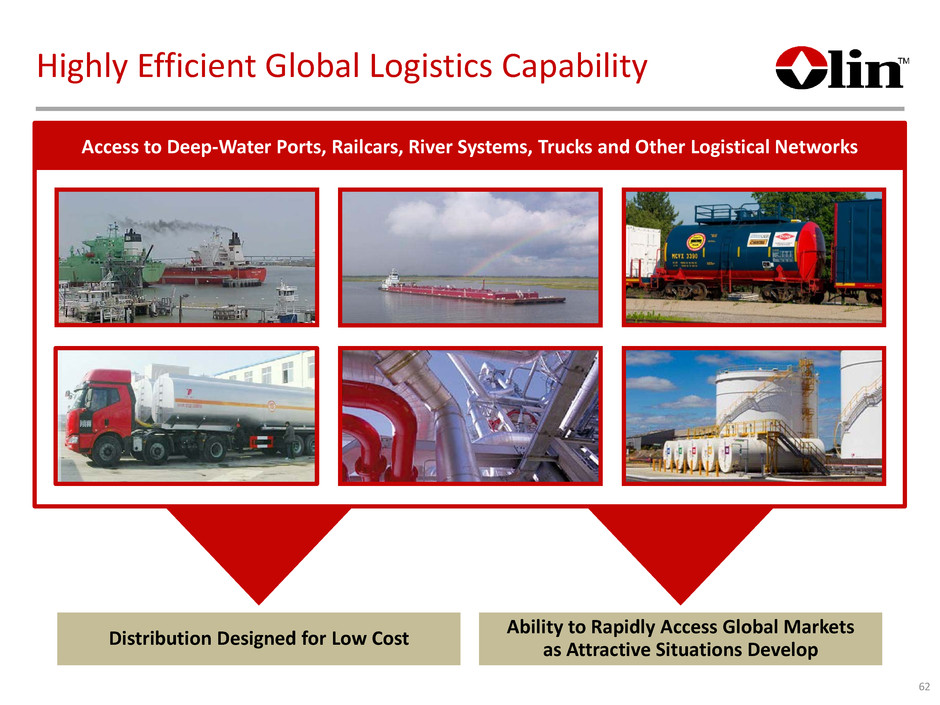
Highly Efficient Global Logistics Capability 62 Ability to Rapidly Access Global Markets as Attractive Situations DevelopDistribution Designed for Low Cost Rail Truck Access to Deep-Water Ports, Railcars, River Systems, Trucks and Other Logistical Networks
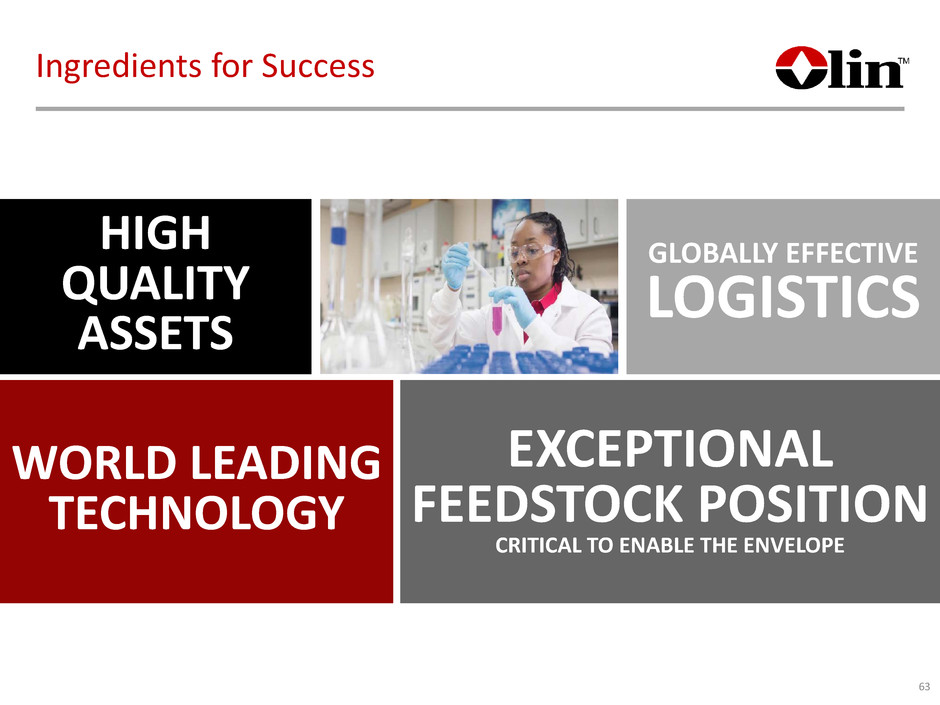
EXCEPTIONAL FEEDSTOCK POSITION CRITICAL TO ENABLE THE ENVELOPE WORLD LEADING TECHNOLOGY HIGH QUALITY ASSETS GLOBALLY EFFECTIVE LOGISTICS Ingredients for Success 63
Jim Varilek Executive Vice President of Olin Corp. President of Chlor Alkali Vinyls & Services ACQUIRED CHLOR ALKALI BUSINESS
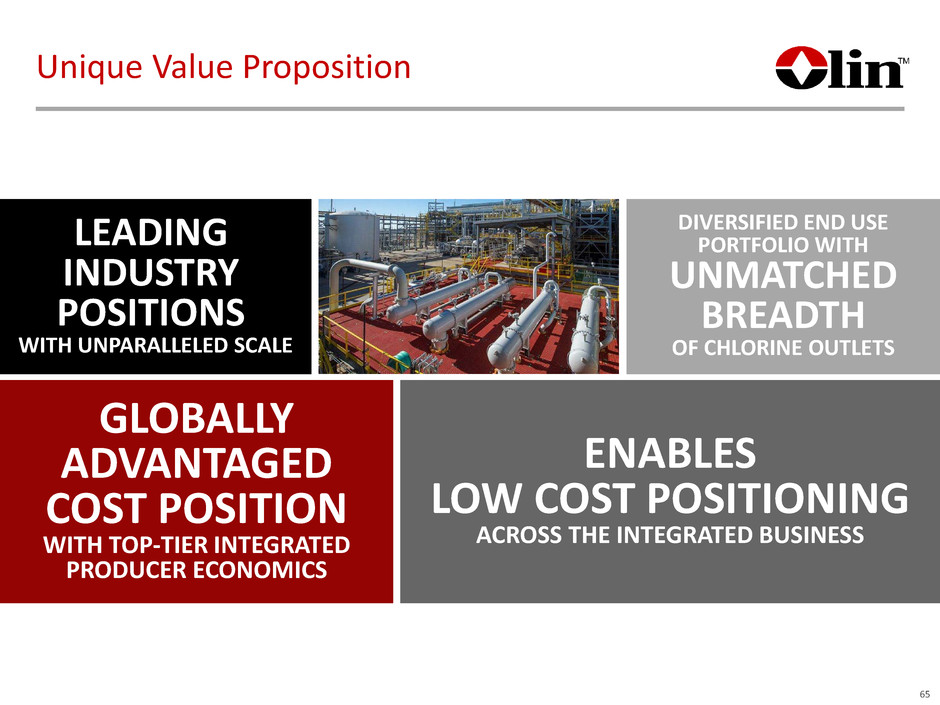
Unique Value Proposition 65 ENABLES LOW COST POSITIONING ACROSS THE INTEGRATED BUSINESS GLOBALLY ADVANTAGED COST POSITION WITH TOP-TIER INTEGRATED PRODUCER ECONOMICS LEADING INDUSTRY POSITIONS WITH UNPARALLELED SCALE DIVERSIFIED END USE PORTFOLIO WITH UNMATCHED BREADTH OF CHLORINE OUTLETS
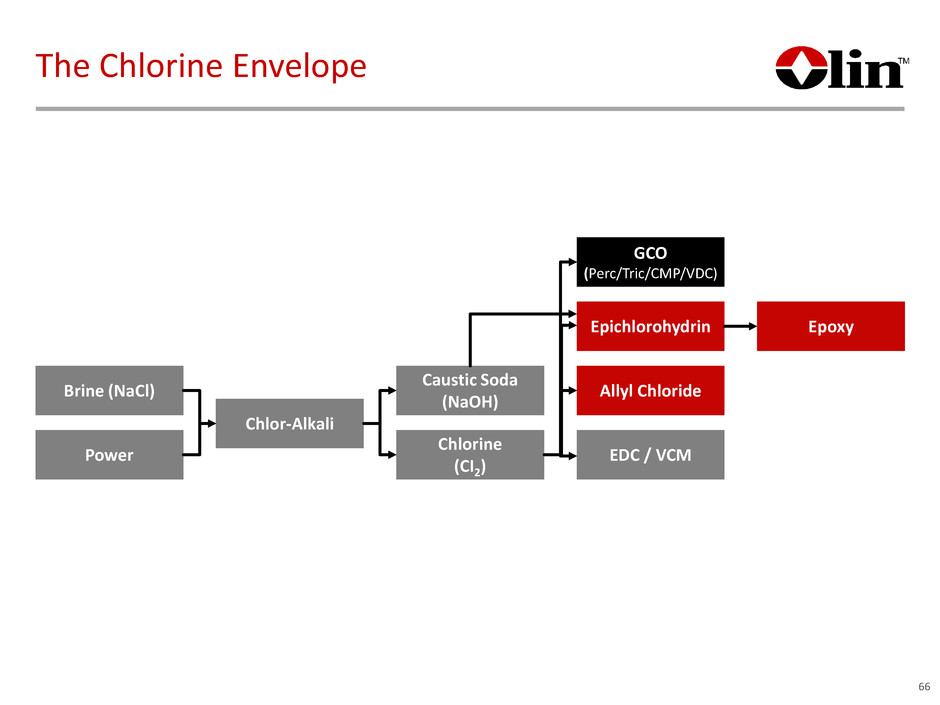
The Chlorine Envelope 66 Epoxy Brine (NaCl) Power Caustic Soda (NaOH) Chlorine (CI2) GCO (Perc/Tric/CMP/VDC) Epichlorohydrin Allyl Chloride EDC / VCM Chlor-Alkali
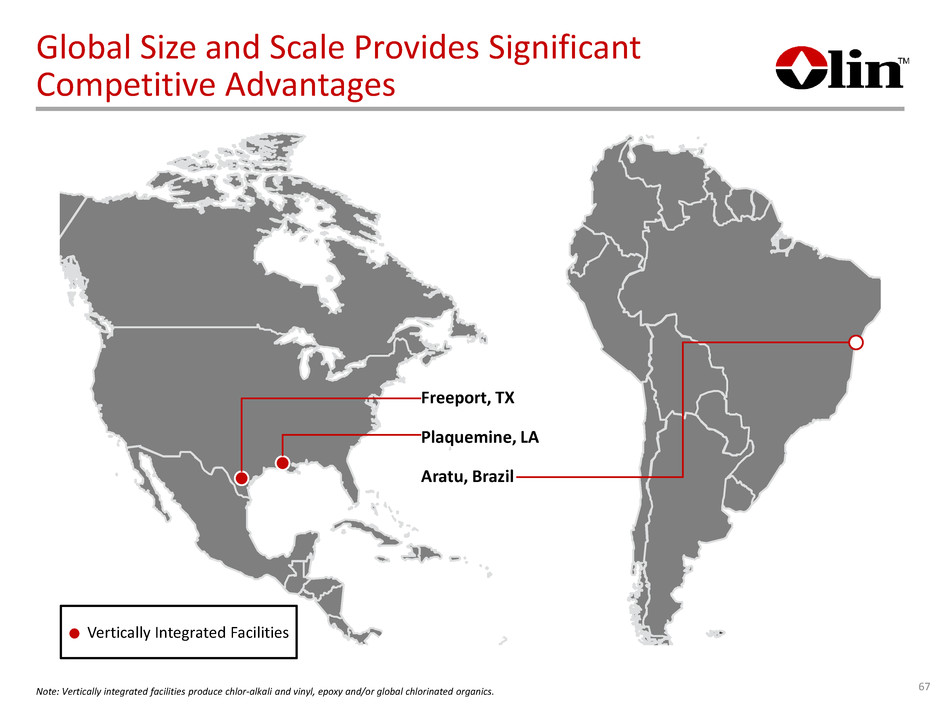
Global Size and Scale Provides Significant Competitive Advantages Note: Vertically integrated facilities produce chlor-alkali and vinyl, epoxy and/or global chlorinated organics. 67 Vertically Integrated Facilities Freeport, TX Plaquemine, LA Aratu, Brazil
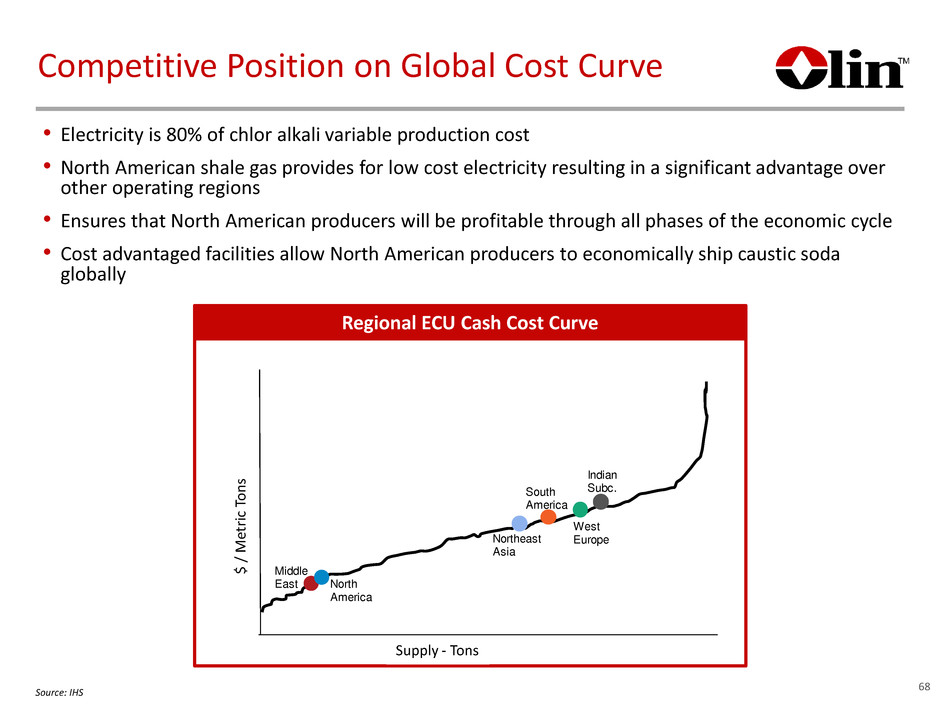
Regional ECU Cash Cost Curve Competitive Position on Global Cost Curve 68 • Electricity is 80% of chlor alkali variable production cost • North American shale gas provides for low cost electricity resulting in a significant advantage over other operating regions • Ensures that North American producers will be profitable through all phases of the economic cycle • Cost advantaged facilities allow North American producers to economically ship caustic soda globally Middle East North America Northeast Asia South America West Europe Indian Subc. $ / M et ri c To ns Supply - Tons Source: IHS
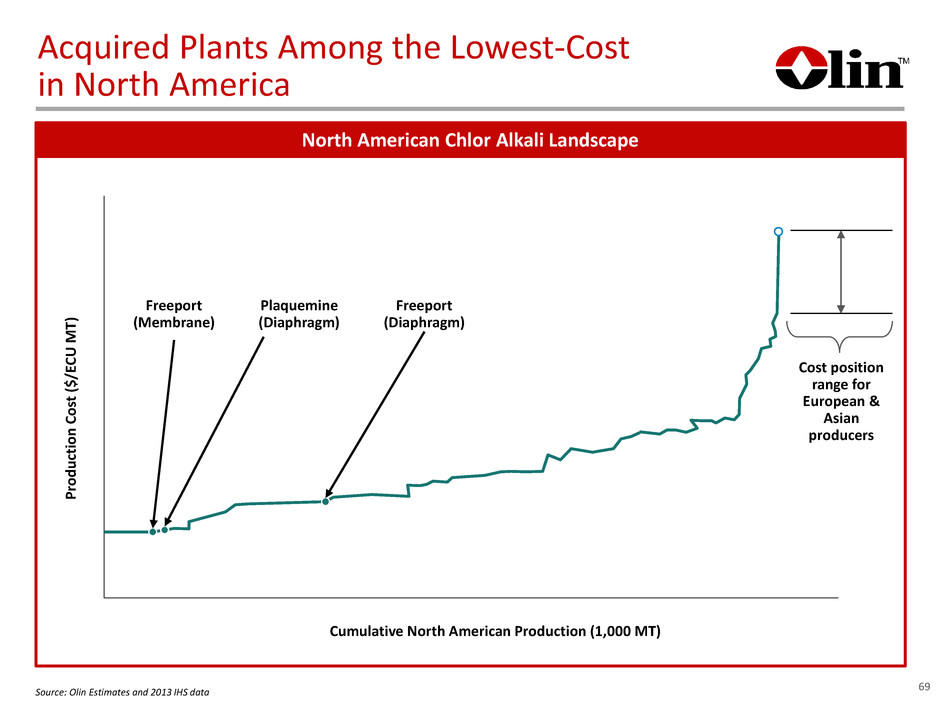
Acquired Plants Among the Lowest-Cost in North America 69 North American Chlor Alkali Landscape Cumulative North American Production (1,000 MT) Pr od uc ti on C os t ($ /E CU M T) Cost position range for European & Asian producers Plaquemine (Diaphragm) Freeport (Diaphragm) Freeport (Membrane) Source: Olin Estimates and 2013 IHS data
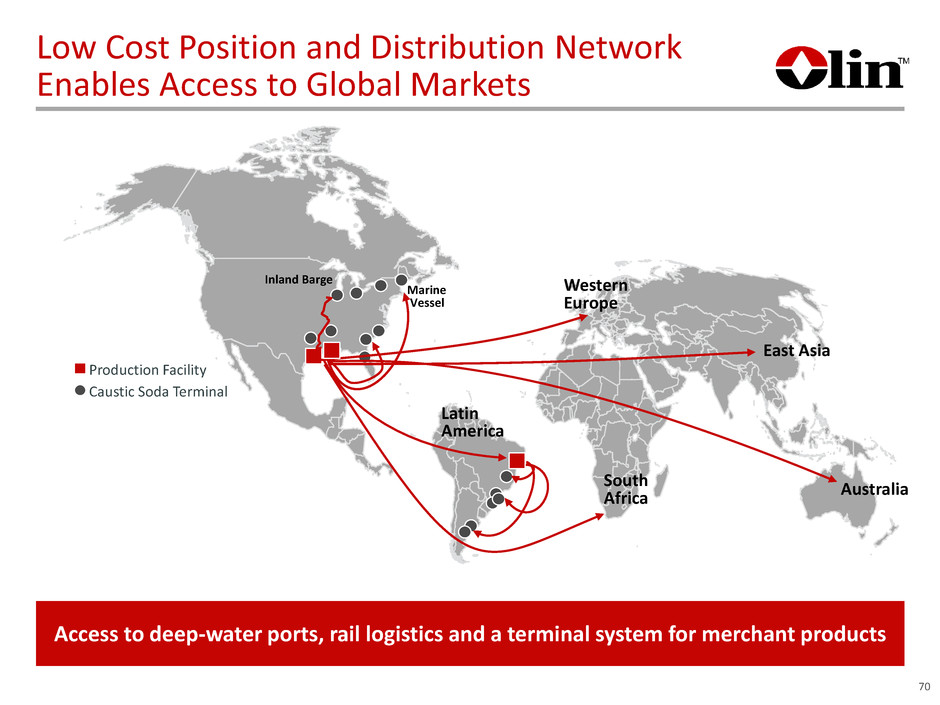
Terminal Facility Low Cost Position and Distribution Network Enables Access to Global Markets 70 Access to deep-water ports, rail logistics and a terminal system for merchant products East Asia South Africa Western Europe Latin America Australia Marine Vessel Inland Barge Caustic Soda Terminal Production Facility
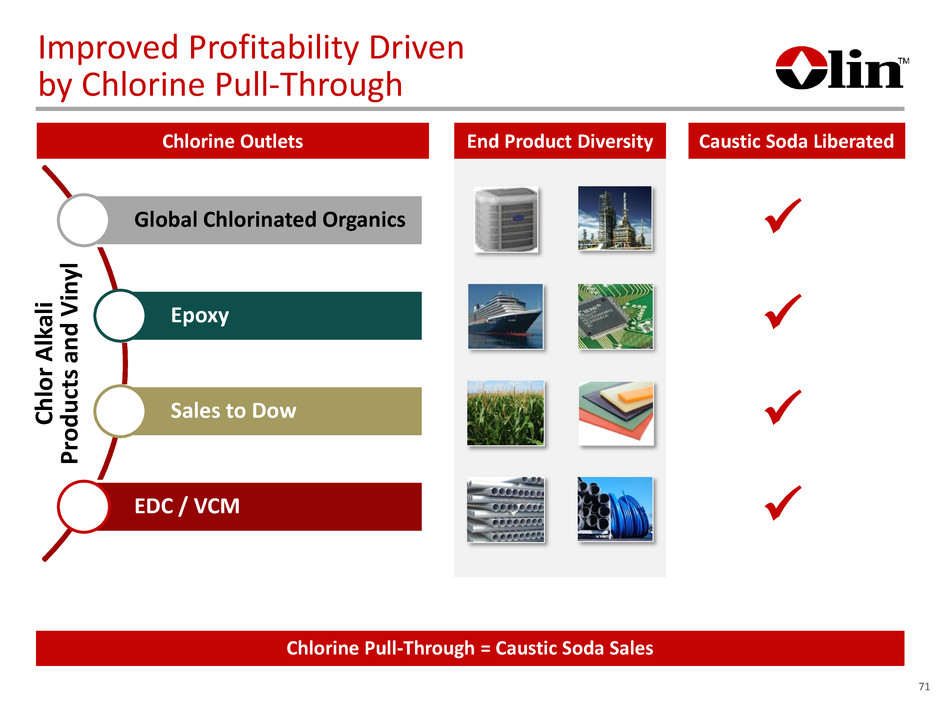
Improved Profitability Driven by Chlorine Pull-Through Chlorine Outlets Caustic Soda LiberatedEnd Product Diversity Global Chlorinated Organics Epoxy Sales to Dow EDC / VCM Ch lo r A lk al i Pr od uc ts a nd V in yl 71 Chlorine Pull-Through = Caustic Soda Sales

Relationship with Dow as a Buyer Primary Product Chlorine / Cell Effluent Aromatics GCO VCM 72 Key Sales Contracts to Dow from New Olin • Executed under long term cost-based contracts • Minimum term of 7 years • Includes minimum and maximum amounts • Predictable and consistent EBITDA
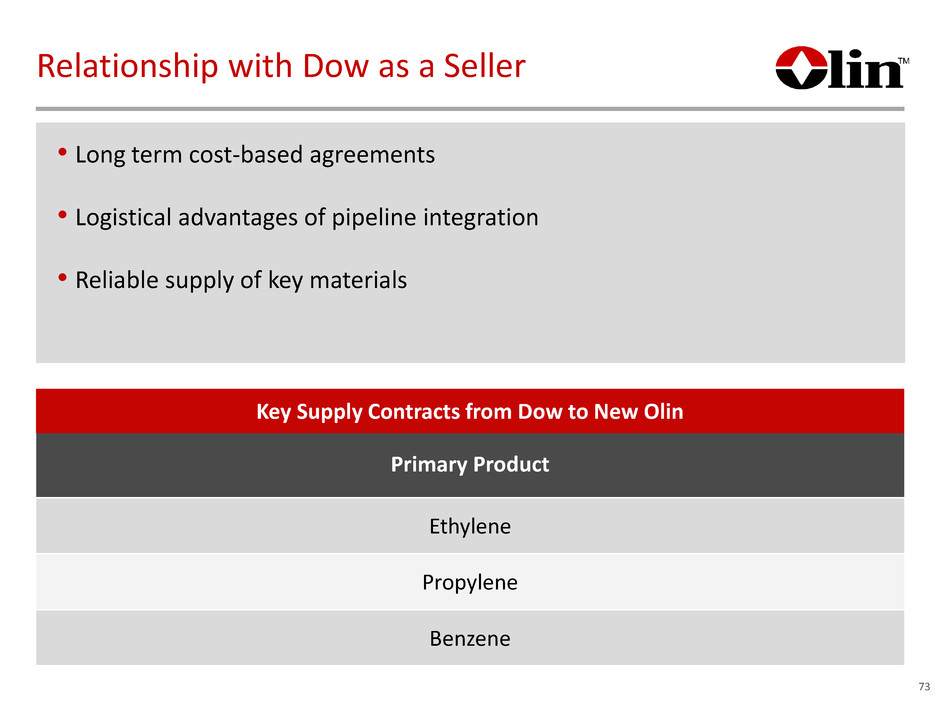
Relationship with Dow as a Seller 73 Primary Product Ethylene Propylene Benzene Key Supply Contracts from Dow to New Olin • Long term cost-based agreements • Logistical advantages of pipeline integration • Reliable supply of key materials
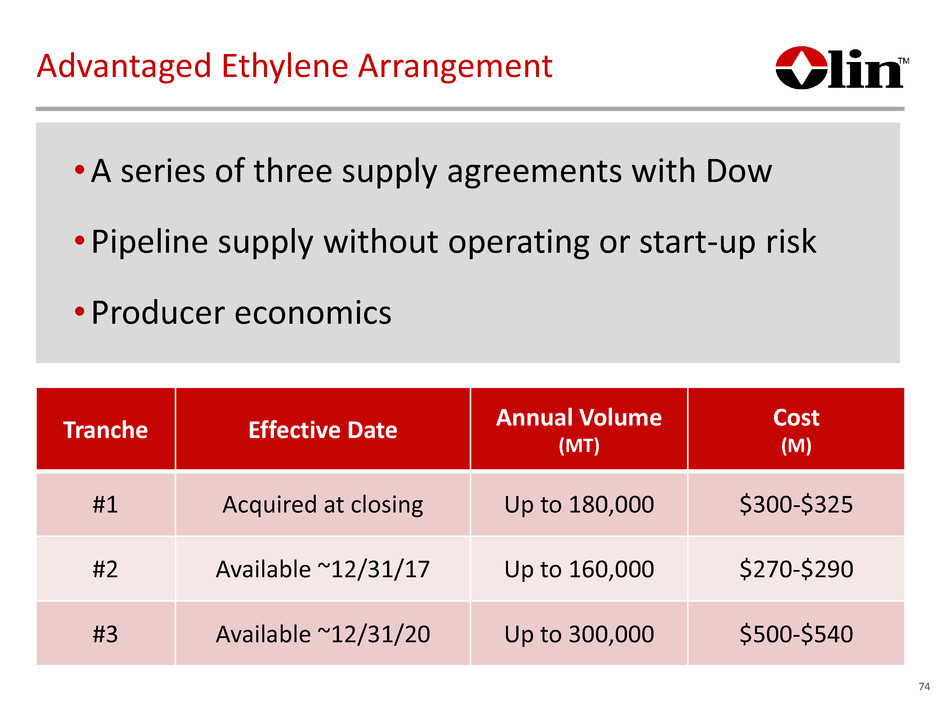
Advantaged Ethylene Arrangement 74 •A series of three supply agreements with Dow •Pipeline supply without operating or start-up risk •Producer economics Tranche Effective Date Annual Volume (MT) Cost (M) #1 Acquired at closing Up to 180,000 $300-$325 #2 Available ~12/31/17 Up to 160,000 $270-$290 #3 Available ~12/31/20 Up to 300,000 $500-$540

Replacement Asset Value of ~$1 Billion Global Chlorinated Organics Business Highlights • Largest global chlorinated organics producer – Low-cost operations – Strong channel relationships – Best-in-class technologies • Diverse product suite anchored by premium products • Uniquely positioned to capitalize on key trends with technology innovation 75
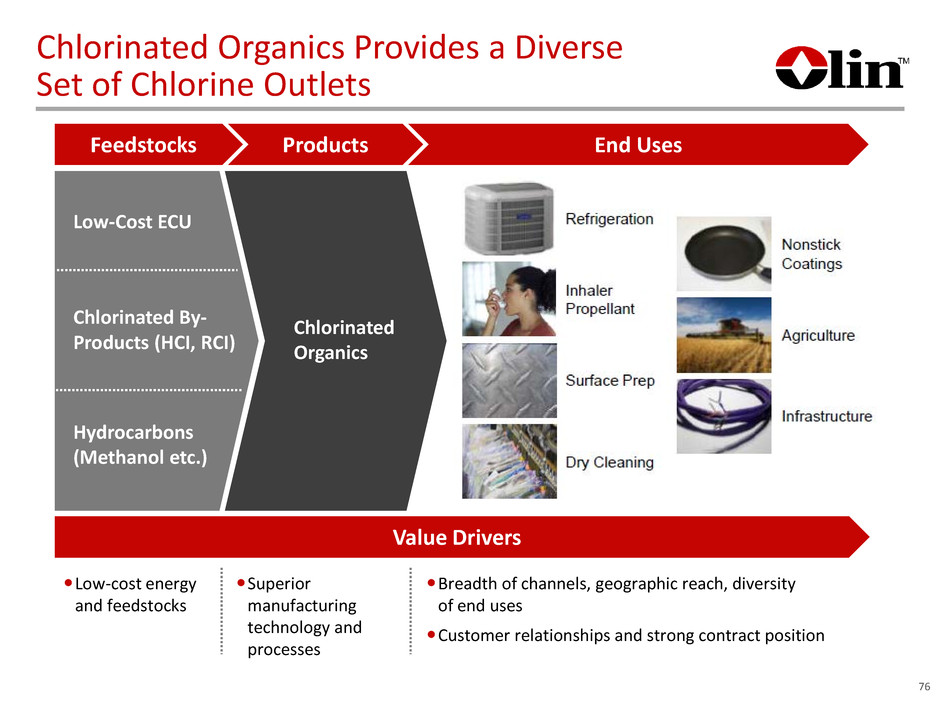
Chlorinated Organics Provides a Diverse Set of Chlorine Outlets 76 Feedstocks Products End Uses Value Drivers Low-Cost ECU Chlorinated By- Products (HCI, RCI) Hydrocarbons (Methanol etc.) Chlorinated Organics Low-cost energy and feedstocks Superior manufacturing technology and processes Breadth of channels, geographic reach, diversity of end uses Customer relationships and strong contract position
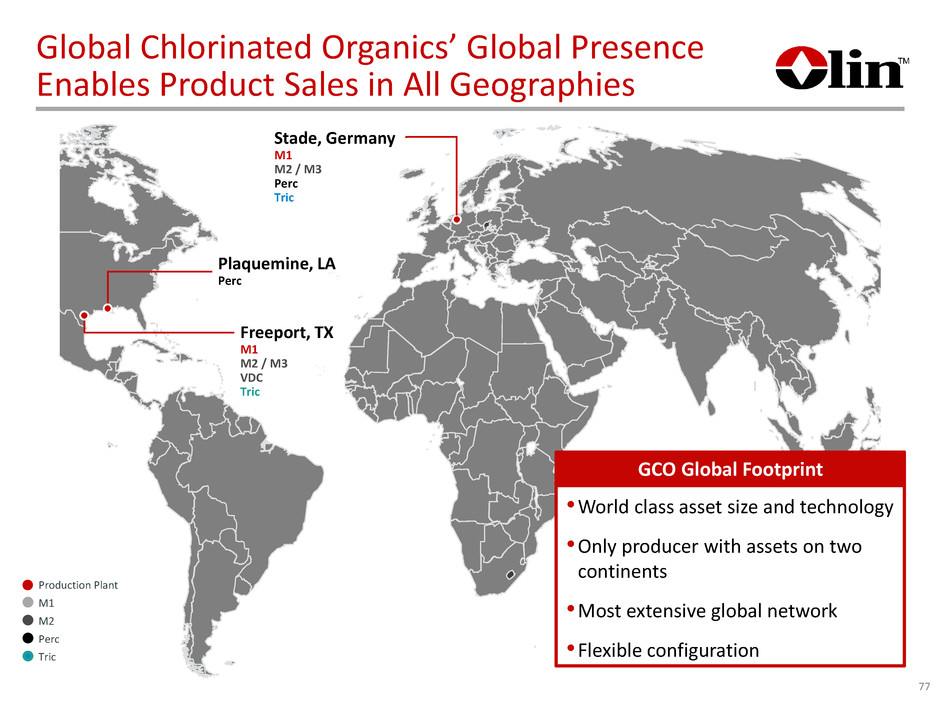
Global Chlorinated Organics’ Global Presence Enables Product Sales in All Geographies 77 Freeport, TX M1 M2 / M3 VDC Tric Stade, Germany M1 M2 / M3 Perc Tric •World class asset size and technology •Only producer with assets on two continents •Most extensive global network •Flexible configuration GCO Global Footprint Tric M1 Perc M2 Production Plant Plaquemine, LA Perc
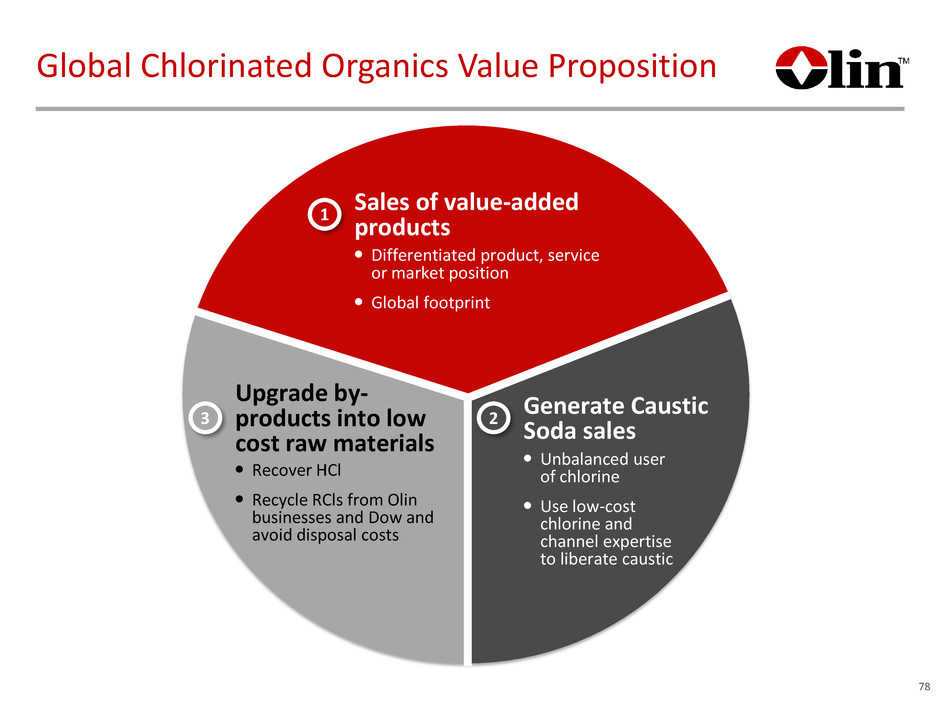
Global Chlorinated Organics Value Proposition 78 Sales of value-added products Differentiated product, service or market position Global footprint 1 Generate Caustic Soda sales Unbalanced user of chlorine Use low-cost chlorine and channel expertise to liberate caustic 2 Upgrade by- products into low cost raw materials Recover HCl Recycle RCls from Olin businesses and Dow and avoid disposal costs 3
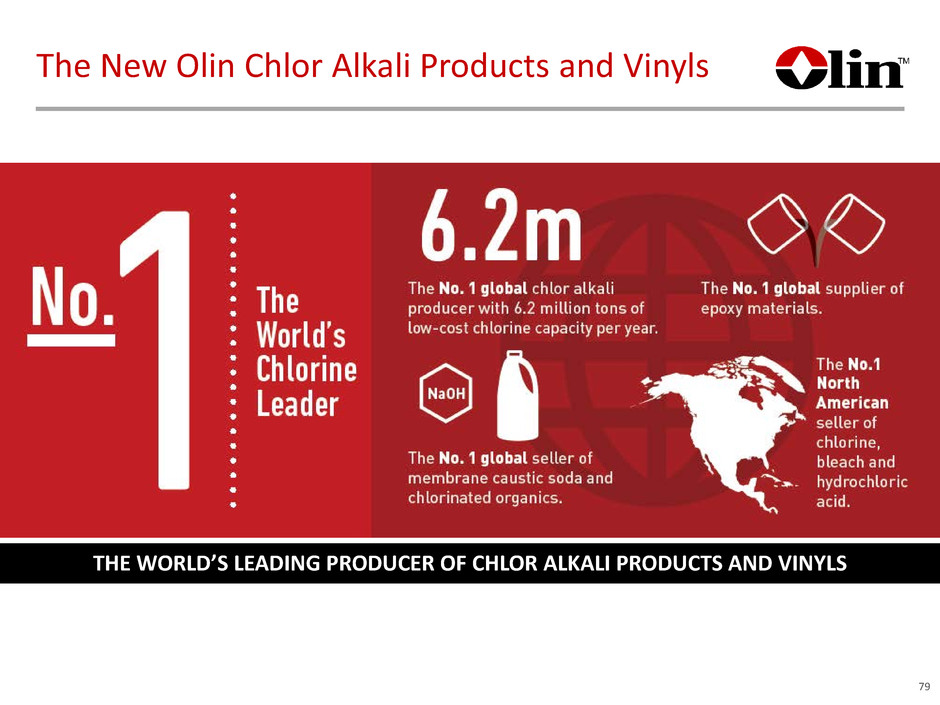
The New Olin Chlor Alkali Products and Vinyls THE WORLD’S LEADING PRODUCER OF CHLOR ALKALI PRODUCTS AND VINYLS 79
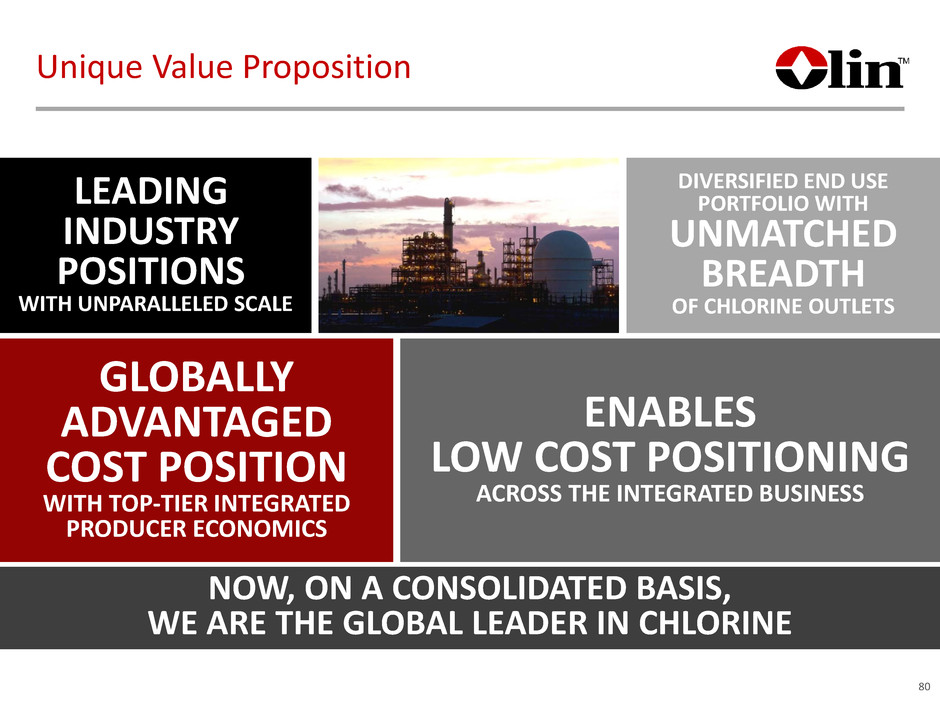
Unique Value Proposition ENABLES LOW COST POSITIONING ACROSS THE INTEGRATED BUSINESS GLOBALLY ADVANTAGED COST POSITION WITH TOP-TIER INTEGRATED PRODUCER ECONOMICS LEADING INDUSTRY POSITIONS WITH UNPARALLELED SCALE DIVERSIFIED END USE PORTFOLIO WITH UNMATCHED BREADTH OF CHLORINE OUTLETS NOW, ON A CONSOLIDATED BASIS, WE ARE THE GLOBAL LEADER IN CHLORINE 80
EPOXY SEGMENT OVERVIEW Pat D. Dawson Executive Vice President of Olin Corp. President of Epoxy & International
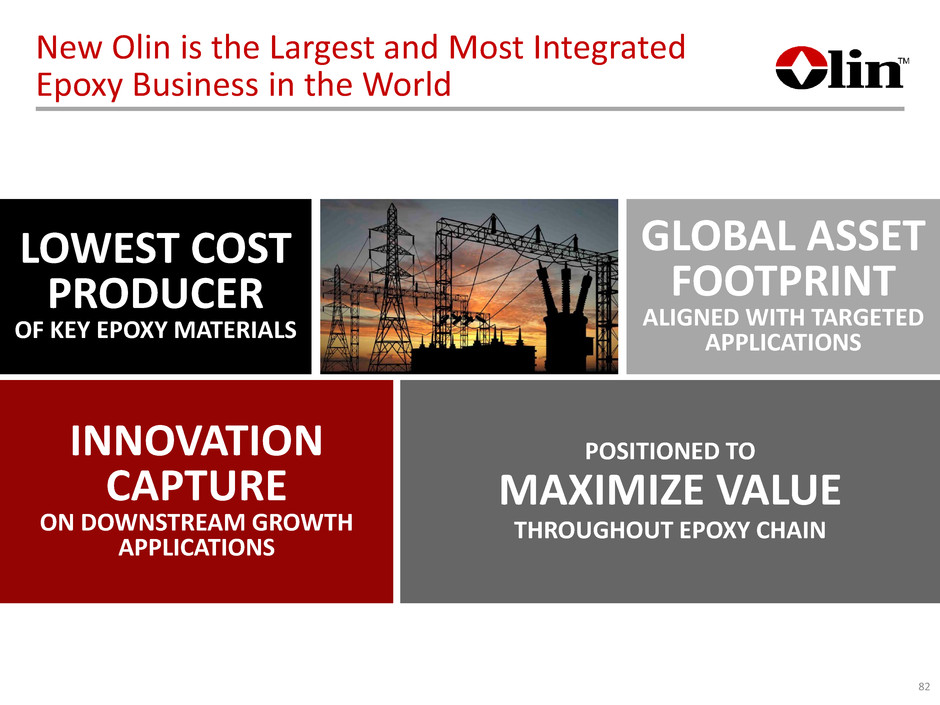
POSITIONED TO MAXIMIZE VALUE THROUGHOUT EPOXY CHAIN INNOVATION CAPTURE ON DOWNSTREAM GROWTH APPLICATIONS LOWEST COST PRODUCER OF KEY EPOXY MATERIALS GLOBAL ASSET FOOTPRINT ALIGNED WITH TARGETED APPLICATIONS New Olin is the Largest and Most Integrated Epoxy Business in the World 82
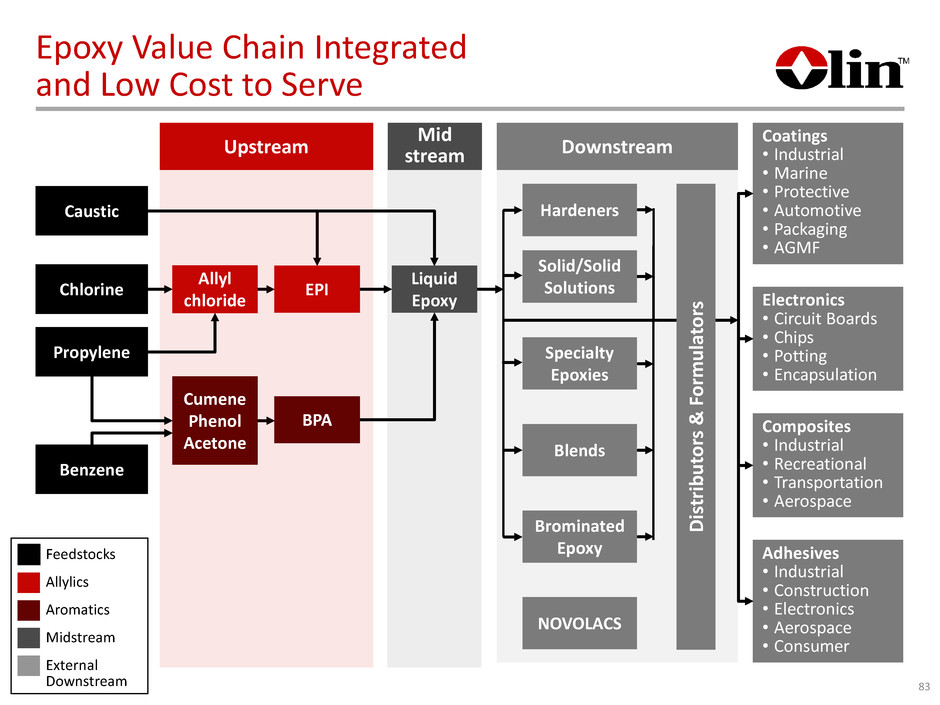
Benzene Caustic Propylene Chlorine Epoxy Value Chain Integrated and Low Cost to Serve 83 Coatings • Industrial • Marine • Protective • Automotive • Packaging • AGMF Electronics • Circuit Boards • Chips • Potting • Encapsulation Composites • Industrial • Recreational • Transportation • Aerospace Adhesives • Industrial • Construction • Electronics • Aerospace • Consumer Downstream D is tr ib ut or s & F or m ul at or s Specialty Epoxies Blends Hardeners Solid/Solid Solutions Brominated Epoxy NOVOLACS Feedstocks Allylics Aromatics Midstream External Downstream Mid stream Liquid Epoxy Upstream Allyl chloride EPI Cumene Phenol Acetone BPA
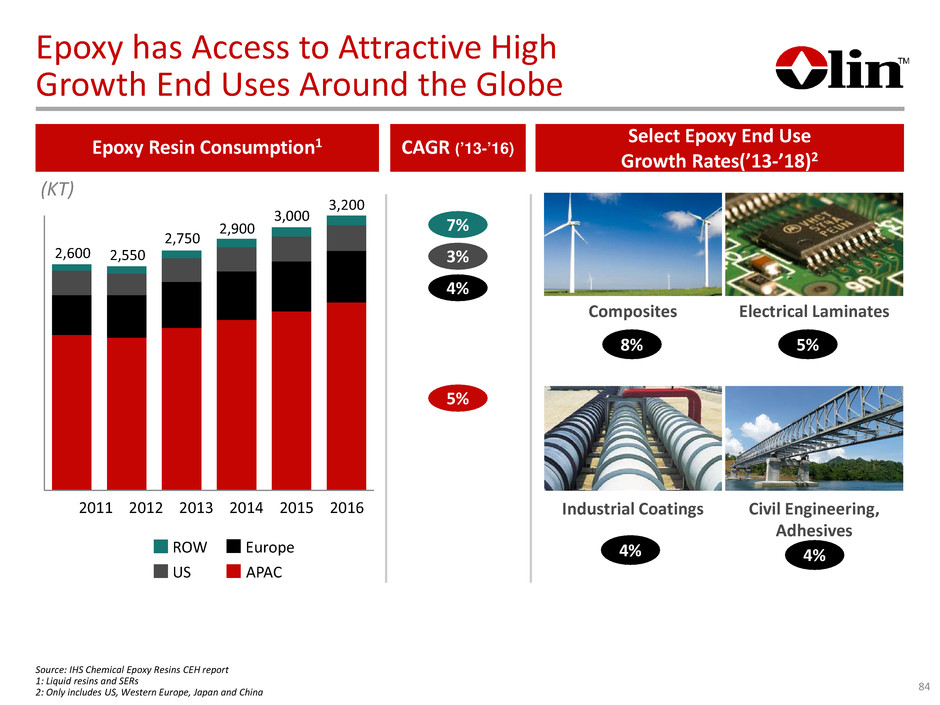
Epoxy has Access to Attractive High Growth End Uses Around the Globe Select Epoxy End Use Growth Rates(’13-’18)2 Composites Civil Engineering, Adhesives Industrial Coatings Electrical Laminates 2016 3,200 2015 3,000 2014 2,900 2013 2,750 2012 2,550 2011 2,600 Epoxy Resin Consumption1 3% CAGR (’13-’16) 4% 5% 7% Source: IHS Chemical Epoxy Resins CEH report 1: Liquid resins and SERs 2: Only includes US, Western Europe, Japan and China (KT) 84 APAC Europe US ROW 4% 8% 5% 4%

Gumi, South Korea CER Zhangjiagang, China CER Pisticci, Italy CER Rheinmünster, Germany CER Baltringen, Germany CER Stade, Germany BisA Allyl / Epi LER CERTerneuzen, The Netherlands Cumene Roberta, GA CER Freeport, TX BisA Phenol / Acetone Allyl / Epi LER CER Assets Strategically Aligned 85 Upstream Midstream Downstream Epoxy assets Guaruja, Sao Paulo, Brazil LER, CER

Integrated Aromatics Enhances Epoxy Profitability 86 Aromatics • Aromatics managed as utility for stable supply • Cost-advantaged raw materials - Savings to epoxy due to lower cost refinery grade C3, propane sales, terminal savings • Cost plus contracts (Bis-A, cumene) provide stable, profitable base load • Make vs. buy flexibility - Facilitates supply negotiations - External sales in peak periods

Leadership Positions in North America and Europe 87 North America Europe China Asia Ex-China Olin 2% Nanya 16% Kukdo 29% Others 53% Olin 3% Nanya 16% Others 81% Olin 48%Hexion 38% Huntsman 14% Olin 38% Hexion 25% Huntsman 21% Others 16% Source: IHS Chemical Epoxy Resins CEH report (2014) Epoxy Resin Capacity By Producer
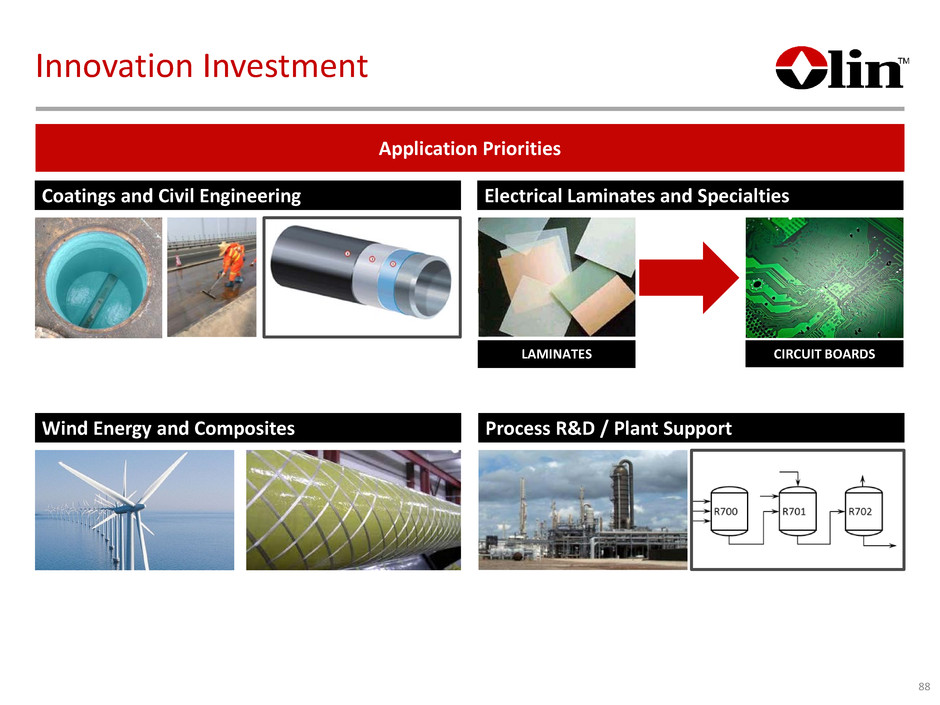
Coatings and Civil Engineering Innovation Investment 88 Wind Energy and Composites Process R&D / Plant Support Application Priorities LAMINATES CIRCUIT BOARDS Electrical Laminates and Specialties
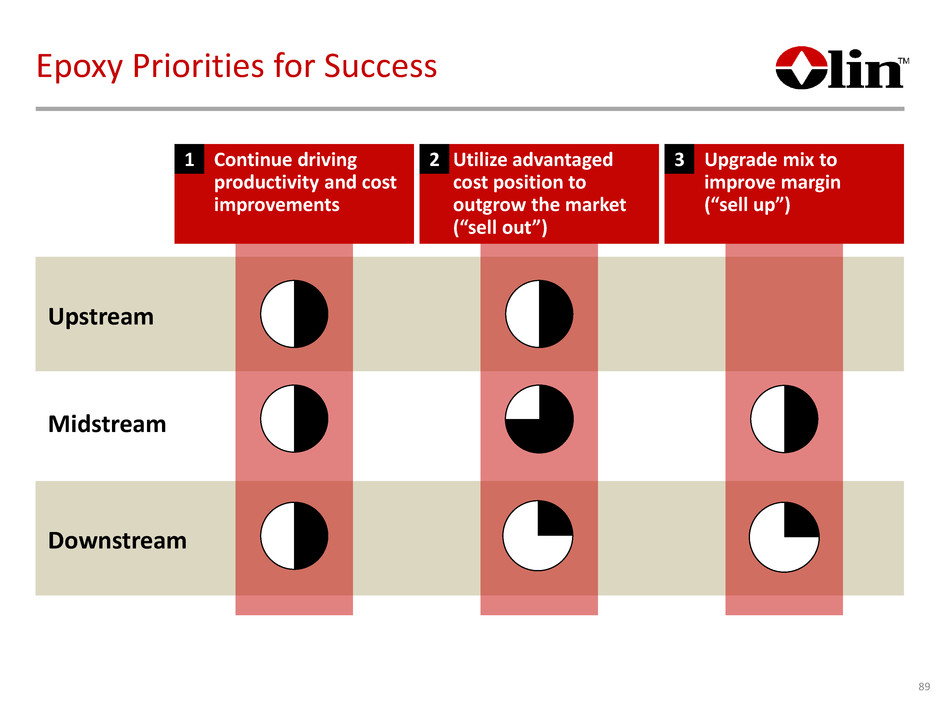
Epoxy Priorities for Success Midstream Downstream Upstream Continue driving productivity and cost improvements Utilize advantaged cost position to outgrow the market (“sell out”) Upgrade mix to improve margin (“sell up”) 1 2 3 89
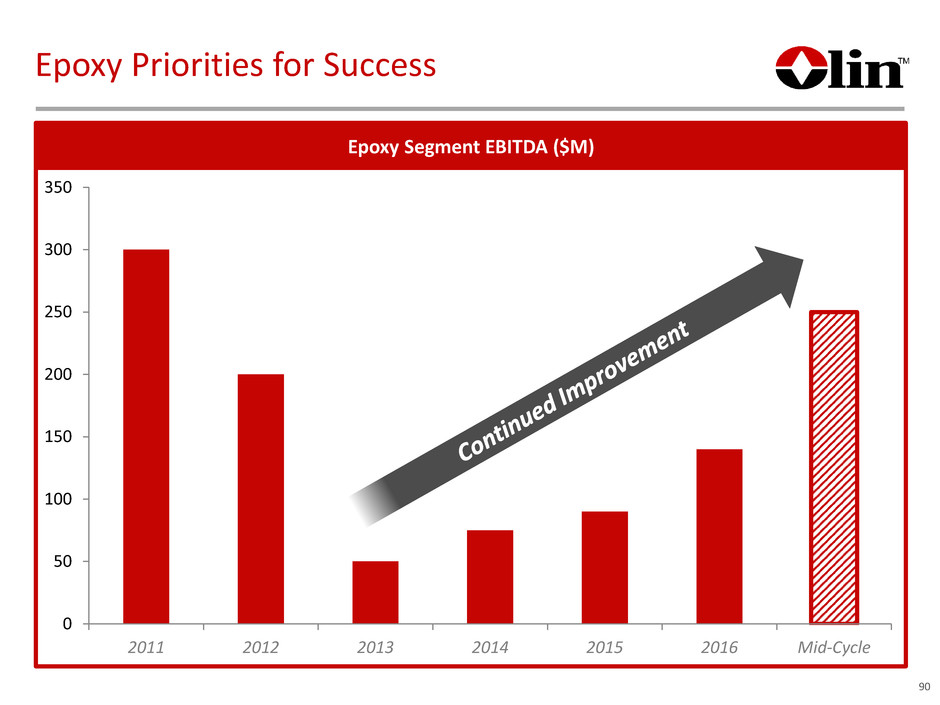
90 Epoxy Priorities for Success 0 50 100 150 200 250 300 350 2011 2012 2013 2014 2015 2016 Mid-Cycle Epoxy Segment EBITDA ($M)
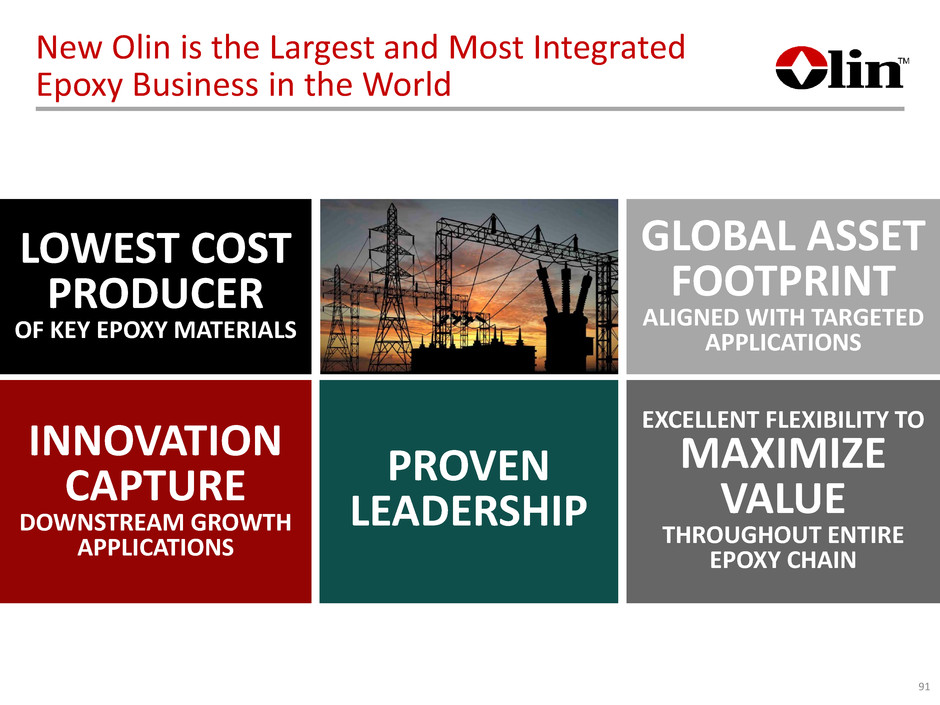
EXCELLENT FLEXIBILITY TO MAXIMIZE VALUE THROUGHOUT ENTIRE EPOXY CHAIN INNOVATION CAPTURE DOWNSTREAM GROWTH APPLICATIONS LOWEST COST PRODUCER OF KEY EPOXY MATERIALS GLOBAL ASSET FOOTPRINT ALIGNED WITH TARGETED APPLICATIONS New Olin is the Largest and Most Integrated Epoxy Business in the World 91 PROVEN LEADERSHIP
WINCHESTER Thomas J. O’Keefe Vice President of Olin Corp. President of Winchester Division
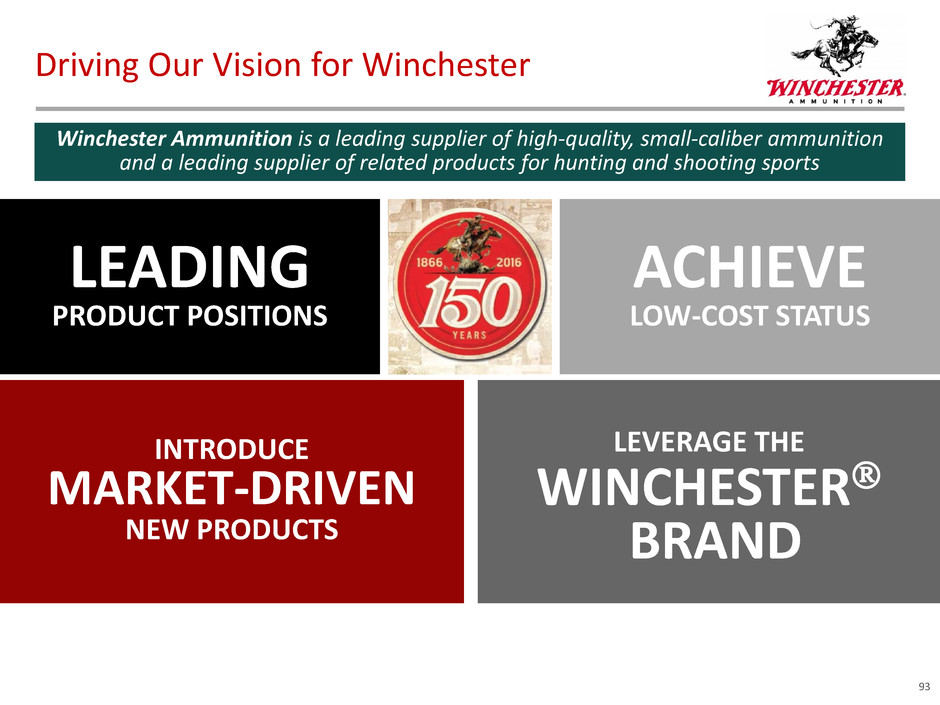
LEVERAGE THE WINCHESTER BRAND INTRODUCE MARKET-DRIVEN NEW PRODUCTS LEADING PRODUCT POSITIONS ACHIEVE LOW-COST STATUS Driving Our Vision for Winchester Winchester Ammunition is a leading supplier of high-quality, small-caliber ammunition and a leading supplier of related products for hunting and shooting sports 93
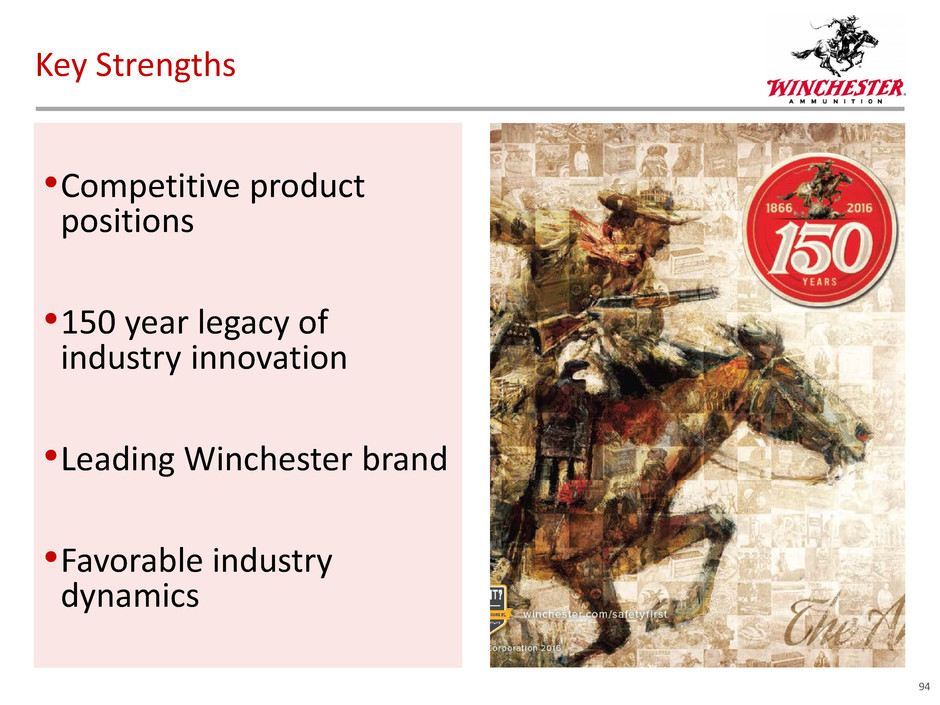
Key Strengths •Competitive product positions •150 year legacy of industry innovation •Leading Winchester brand •Favorable industry dynamics 94
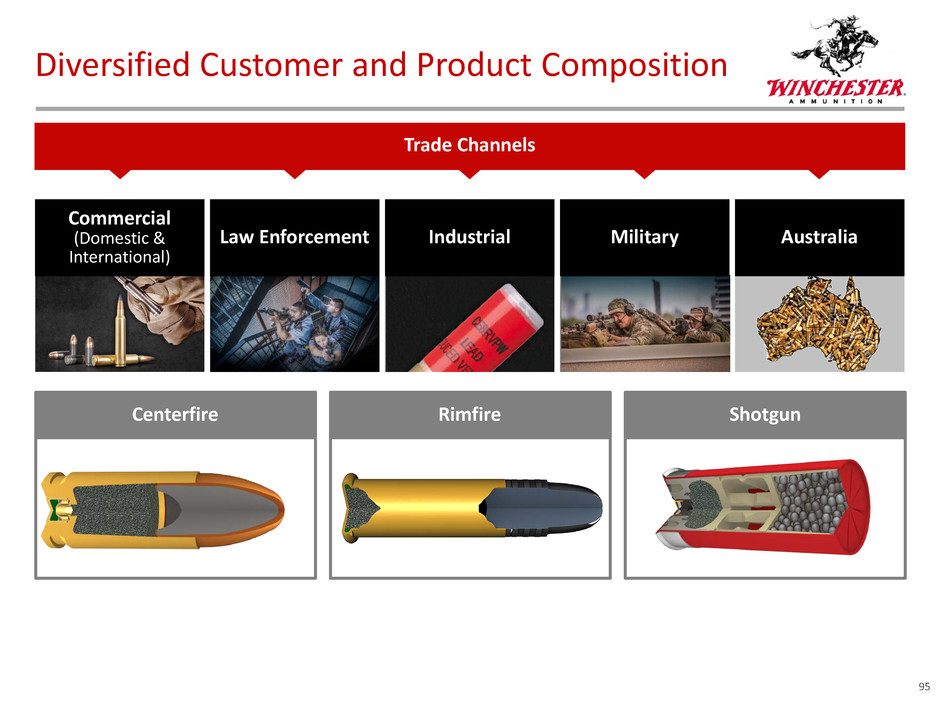
Diversified Customer and Product Composition Trade Channels Centerfire Rimfire Shotgun Commercial (Domestic & International) Law Enforcement Industrial Military Australia 95
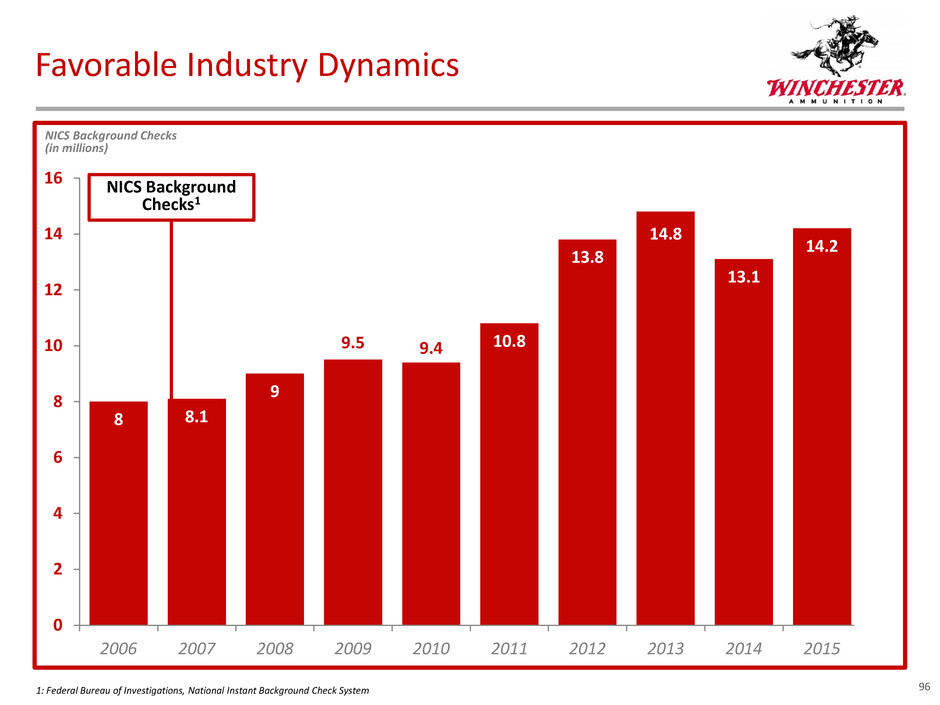
Favorable Industry Dynamics NICS Background Checks (in millions) 96 8 8.1 9 9.5 9.4 10.8 13.8 14.8 13.1 14.2 0 2 4 6 8 10 12 14 16 0 2 4 6 8 10 12 14 16 2006 2007 2008 2009 2010 2011 2012 2013 2014 2015 NICS Background Checks1 1: Federal Bureau of Investigations, National Instant Background Check System

Favorable Industry Dynamics NICS Background Checks (in millions) 971: Federal Bureau of Investigations, National Instant Background Check System 2: Estimated based on the NSSF Trade Statistics Program’s Ammunition Manufacturer Surveys, Department of Commerce U.S. Import Statistics, and internal Winchester estimates 8 8.1 9 9.5 9.4 10.8 13.8 14.8 13.1 14.2 5.7 6.6 6.8 9.3 8.6 8.2 10.1 13.5 13.9 12.9 0 2 4 6 8 10 12 14 16 0 2 4 6 8 10 12 14 16 2006 2007 2008 2009 2010 2011 2012 2013 2014 2015 Industry Units (in billions) U.S. Ammunition Industry Total Domestic Commercial Unit Volume2; Loaded Ammunition NICS Background Checks1
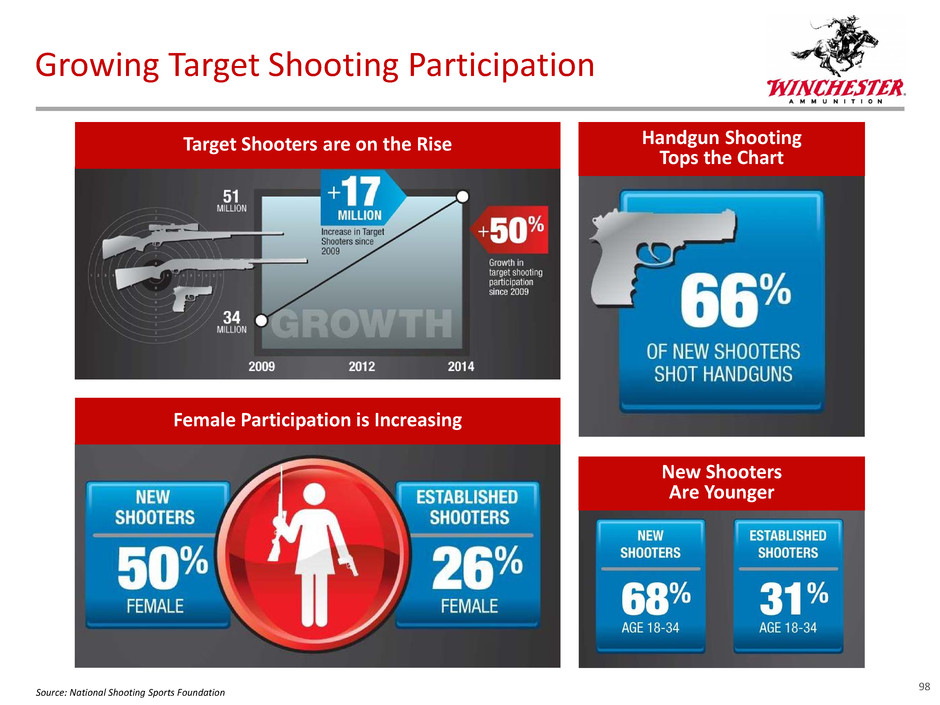
Growing Target Shooting Participation Female Participation is Increasing Target Shooters are on the Rise Handgun Shooting Tops the Chart New Shooters Are Younger 98Source: National Shooting Sports Foundation
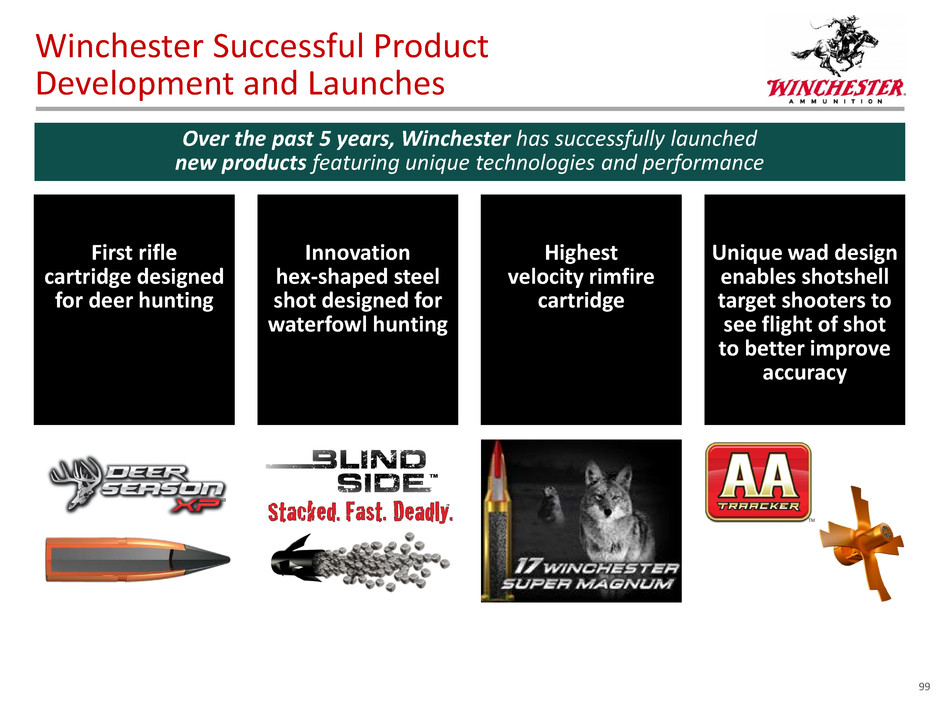
Winchester Successful Product Development and Launches Over the past 5 years, Winchester has successfully launched new products featuring unique technologies and performance First rifle cartridge designed for deer hunting Innovation hex-shaped steel shot designed for waterfowl hunting Highest velocity rimfire cartridge Unique wad design enables shotshell target shooters to see flight of shot to better improve accuracy 99
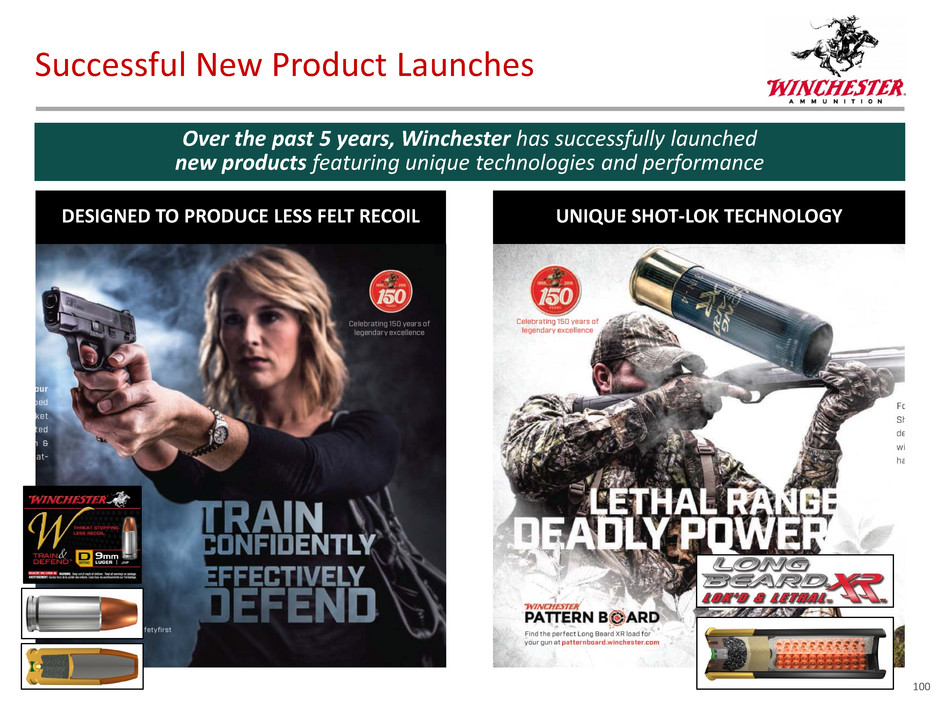
Successful New Product Launches DESIGNED TO PRODUCE LESS FELT RECOIL UNIQUE SHOT-LOK TECHNOLOGY Over the past 5 years, Winchester has successfully launched new products featuring unique technologies and performance 100
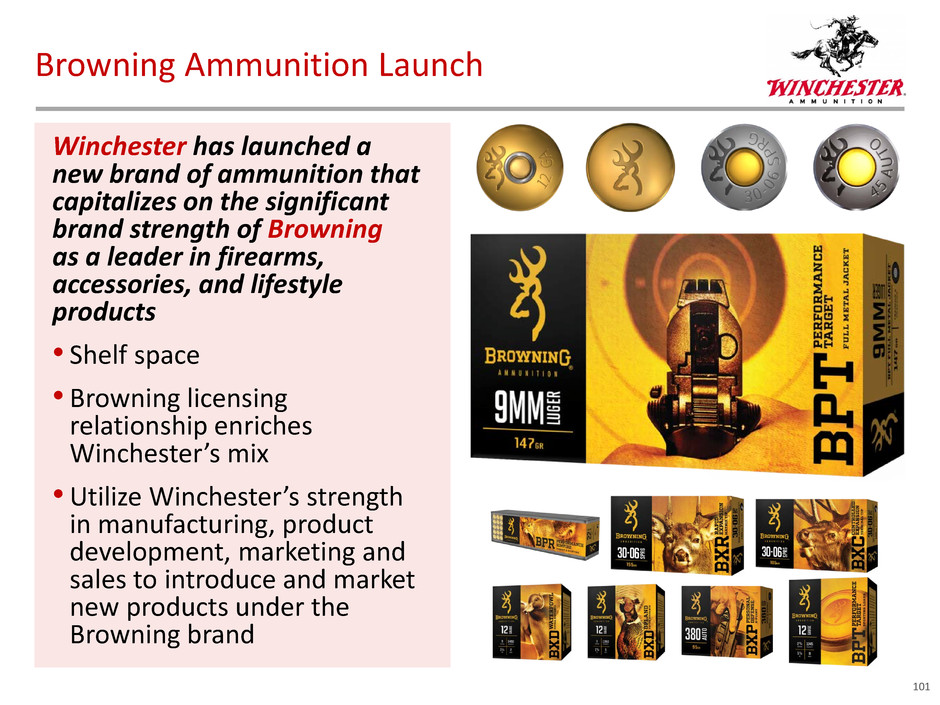
Winchester has launched a new brand of ammunition that capitalizes on the significant brand strength of Browning as a leader in firearms, accessories, and lifestyle products • Shelf space • Browning licensing relationship enriches Winchester’s mix • Utilize Winchester’s strength in manufacturing, product development, marketing and sales to introduce and market new products under the Browning brand Browning Ammunition Launch 101

Winchester has a deep heritage of being a leading supplier to U.S. Armed Forces and Law Enforcement Agencies: Military and Law Enforcement 102 • January 2016 - awarded 5 year 2nd source U.S. Military rifle contract • January 2016 - awarded 5 year Pistol Family U.S. Military contract • December 2015 - awarded 5 year Federal Bureau of Investigation rifle duty and training contract • September 2015 - awarded 5 year Department of Homeland Security rifle training contract • October 2014 - awarded 5 year Department of Homeland Security pistol training contract • Current supplier to numerous major state and local agencies: − Los Angeles Police Department and County Sheriff’s Office − Chicago Police Department − Atlanta Police Department
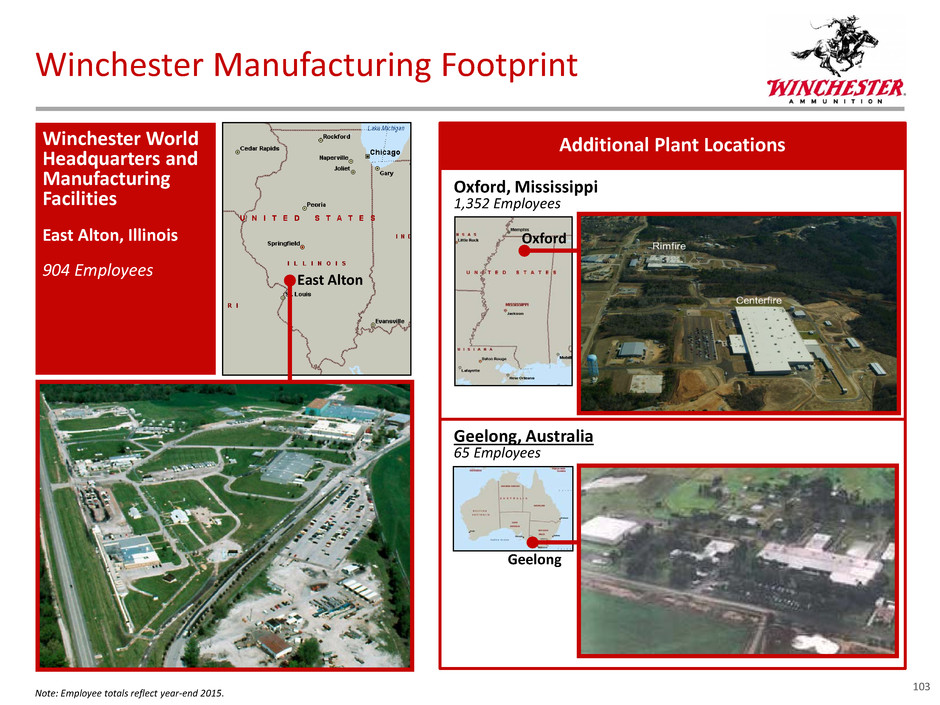
Winchester World Headquarters and Manufacturing Facilities East Alton, Illinois 904 Employees • East Alton Oxford, Mississippi 1,352 Employees Geelong, Australia 65 Employees Oxford Geelong Note: Employee totals reflect year-end 2015. Winchester Manufacturing Footprint Additional Plant Locations 103
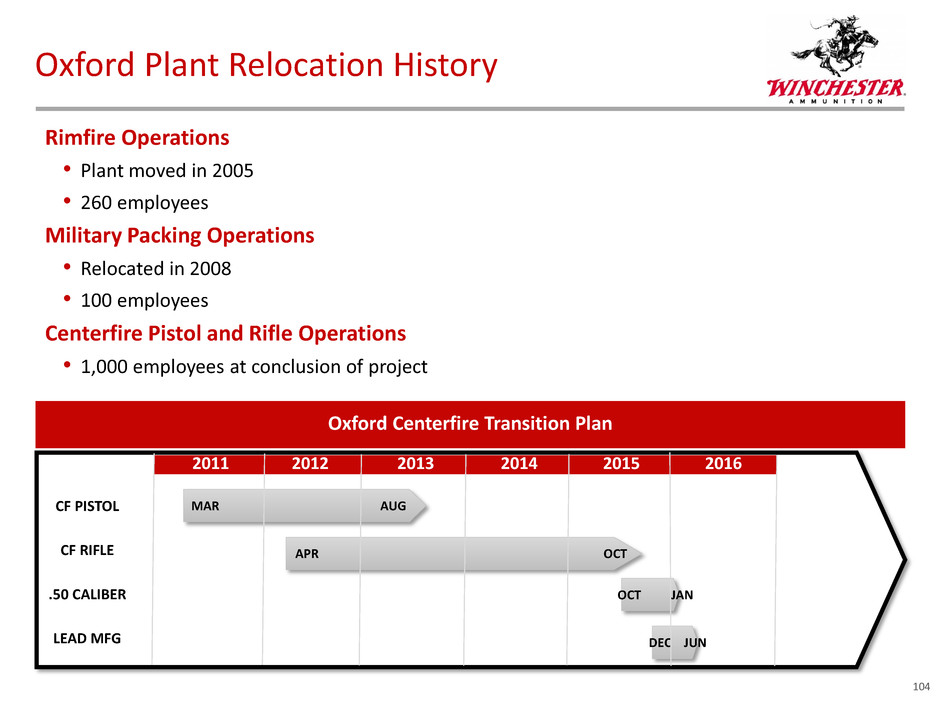
Oxford Plant Relocation History Rimfire Operations • Plant moved in 2005 • 260 employees Military Packing Operations • Relocated in 2008 • 100 employees Centerfire Pistol and Rifle Operations • 1,000 employees at conclusion of project 20132011 2012 2014 2015 2016 OCT JAN DEC JUN MAR AUG OCT LEAD MFG .50 CALIBER CF PISTOL CF RIFLE APR Oxford Centerfire Transition Plan 104
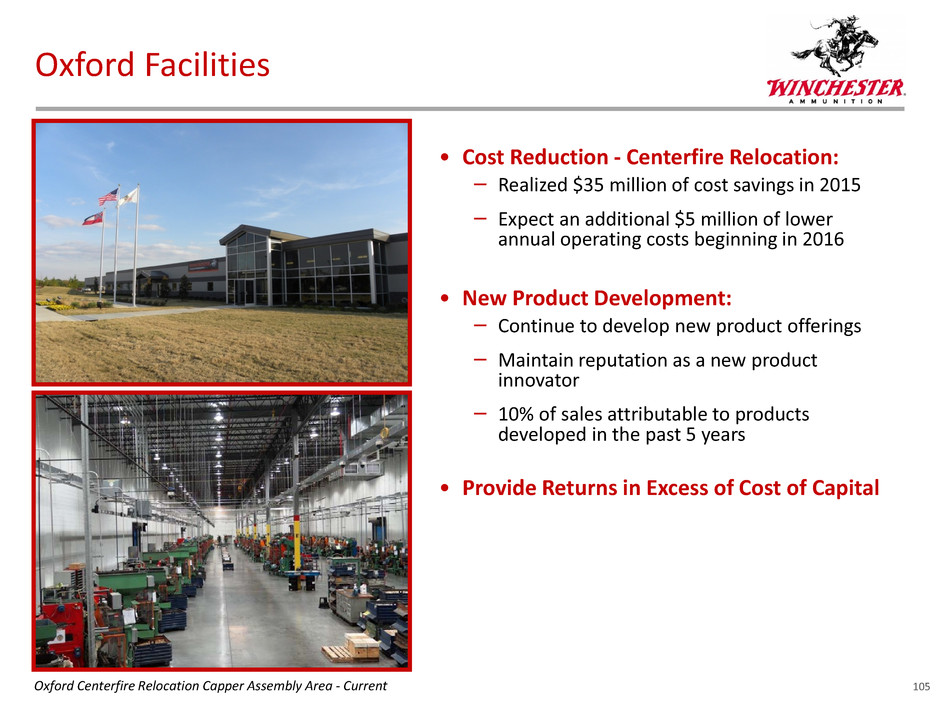
Oxford Facilities Oxford Centerfire Relocation Capper Assembly Area - Current • Cost Reduction - Centerfire Relocation: – Realized $35 million of cost savings in 2015 – Expect an additional $5 million of lower annual operating costs beginning in 2016 • New Product Development: – Continue to develop new product offerings – Maintain reputation as a new product innovator – 10% of sales attributable to products developed in the past 5 years • Provide Returns in Excess of Cost of Capital 105
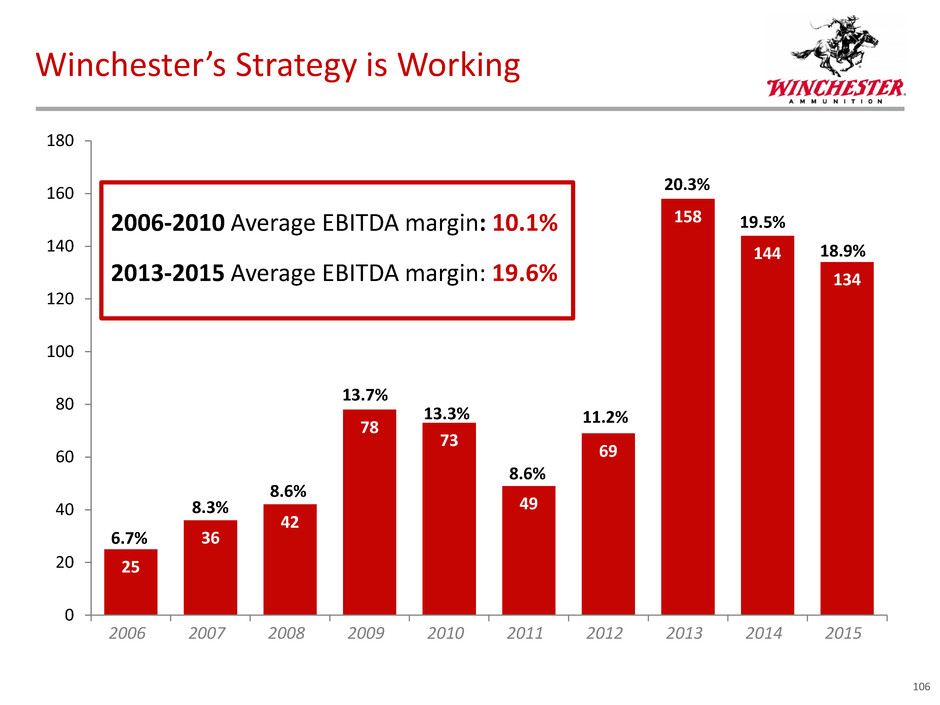
25 36 42 78 73 49 69 158 144 134 0 20 40 60 80 100 120 140 160 180 2006 2007 2008 2009 2010 2011 2012 2013 2014 2015 Winchester’s Strategy is Working 106 6.7% 8.3% 8.6% 13.7% 13.3% 8.6% 11.2% 20.3% 19.5% 18.9% 2006-2010 Average EBITDA margin: 10.1% 2013-2015 Average EBITDA margin: 19.6%
FINANCIAL OVERVIEW Todd Slater Vice President & Chief Financial Officer
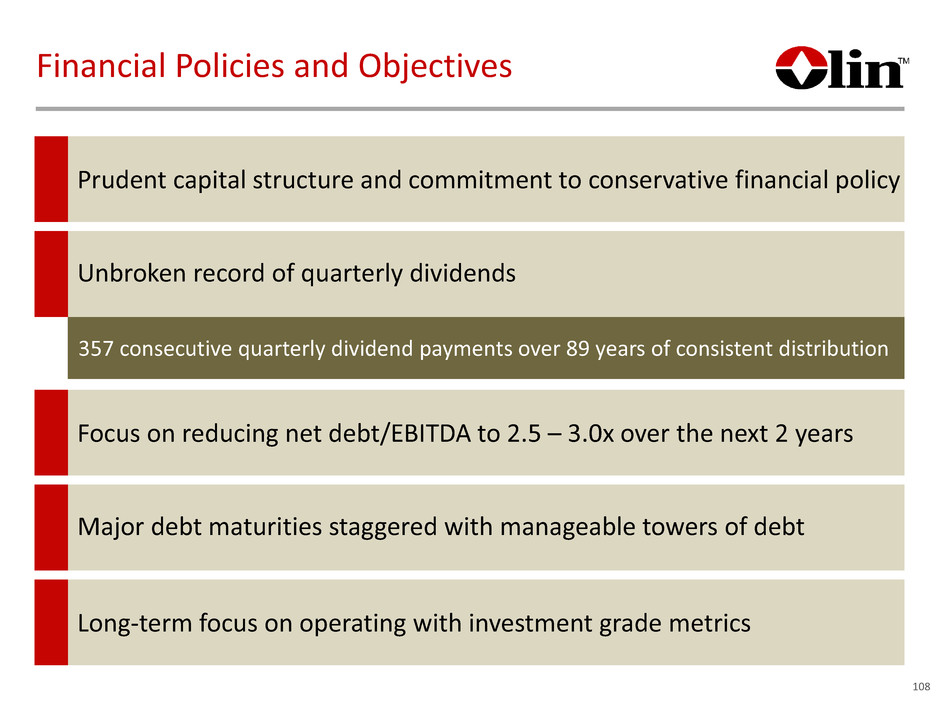
357 consecutive quarterly dividend payments over 89 years of consistent distribution Financial Policies and Objectives 108 Prudent capital structure and commitment to conservative financial policy Unbroken record of quarterly dividends Focus on reducing net debt/EBITDA to 2.5 – 3.0x over the next 2 years TARGET: 2-3 YEARS Major debt maturities staggered with manageable towers of debt Long-term focus on operating with investment grade metrics
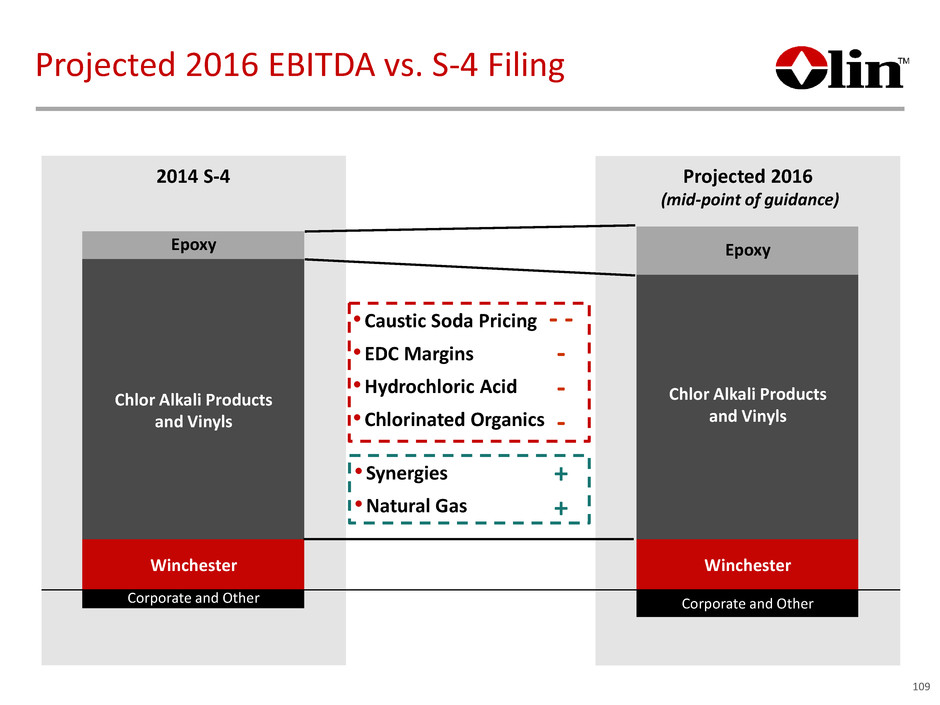
109 Projected 2016 EBITDA vs. S-4 Filing Corporate and Other 2014 S-4 Projected 2016 (mid-point of guidance) Corporate and Other Chlor Alkali Products and Vinyls Epoxy Winchester • Synergies • Natural Gas • Caustic Soda Pricing • EDC Margins • Hydrochloric Acid • Chlorinated Organics - - - - - + + Epoxy Winchester Chlor Alkali Products and Vinyls
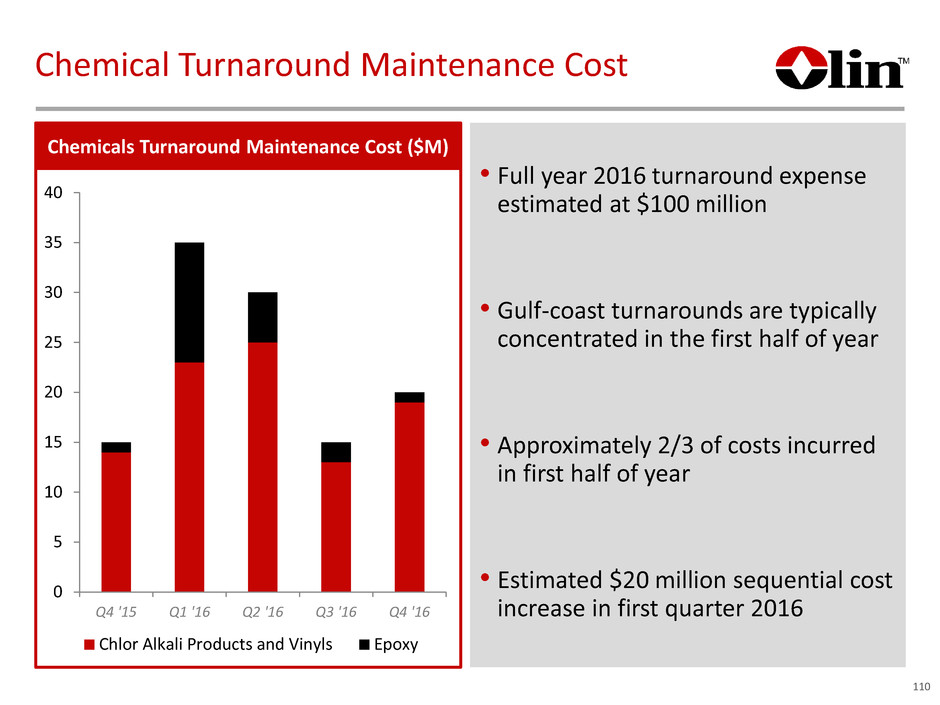
110 Chemical Turnaround Maintenance Cost Chemicals Turnaround Maintenance Cost ($M) 0 5 10 15 20 25 30 35 40 Q4 '15 Q1 '16 Q2 '16 Q3 '16 Q4 '16 Chlor Alkali Products and Vinyls Epoxy • Full year 2016 turnaround expense estimated at $100 million • Gulf-coast turnarounds are typically concentrated in the first half of year • Approximately 2/3 of costs incurred in first half of year • Estimated $20 million sequential cost increase in first quarter 2016
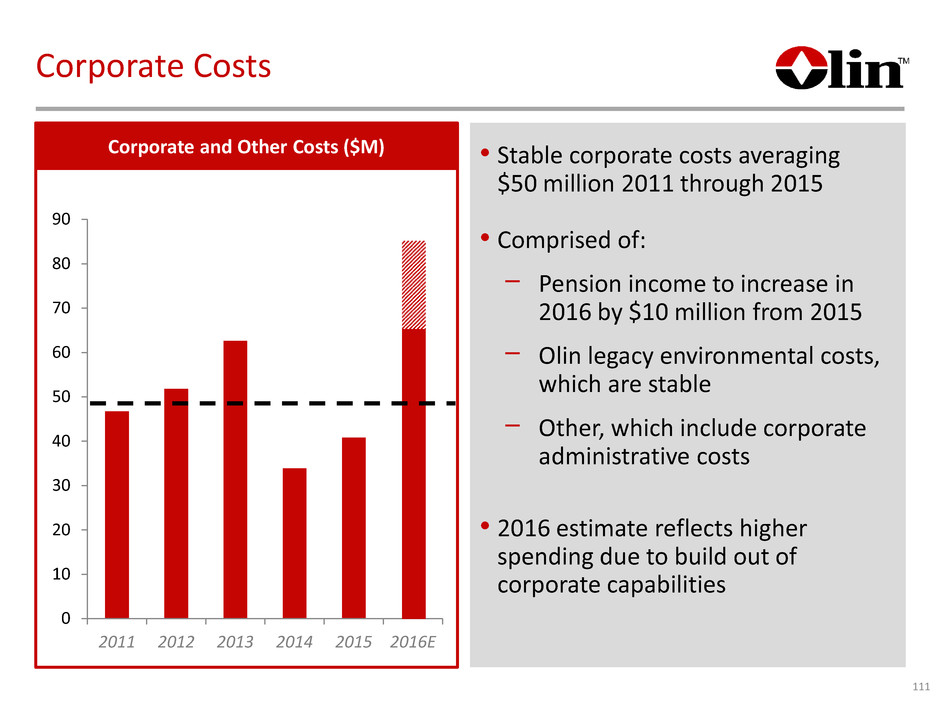
Corporate Costs 111 • Stable corporate costs averaging $50 million 2011 through 2015 • Comprised of: − Pension income to increase in 2016 by $10 million from 2015 − Olin legacy environmental costs, which are stable − Other, which include corporate administrative costs • 2016 estimate reflects higher spending due to build out of corporate capabilities 0 10 20 30 40 50 60 70 80 90 2011 2012 2013 2014 2015 2016E Corporate and Other Costs ($M)
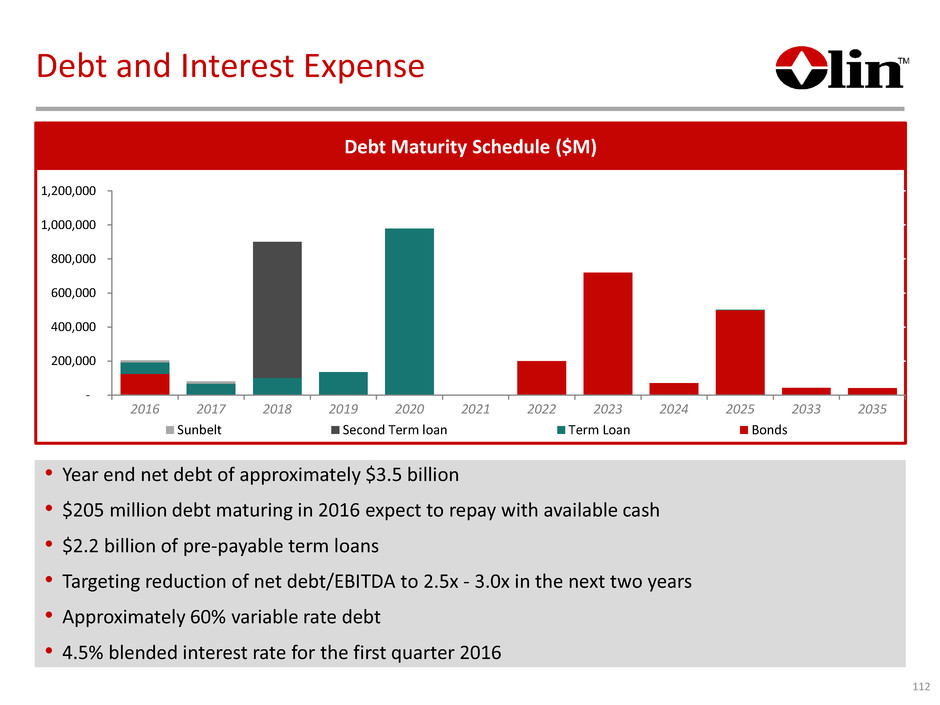
Debt and Interest Expense 112 • Year end net debt of approximately $3.5 billion • $205 million debt maturing in 2016 expect to repay with available cash • $2.2 billion of pre-payable term loans • Targeting reduction of net debt/EBITDA to 2.5x - 3.0x in the next two years • Approximately 60% variable rate debt • 4.5% blended interest rate for the first quarter 2016 Debt Maturity Schedule ($M) - 200,000 400,000 600,000 800,000 1,000,000 1,200,000 2016 2017 2018 2019 2020 2021 2022 2023 2024 2025 2033 2035 Sunbelt Second Term loan Term Loan Bonds
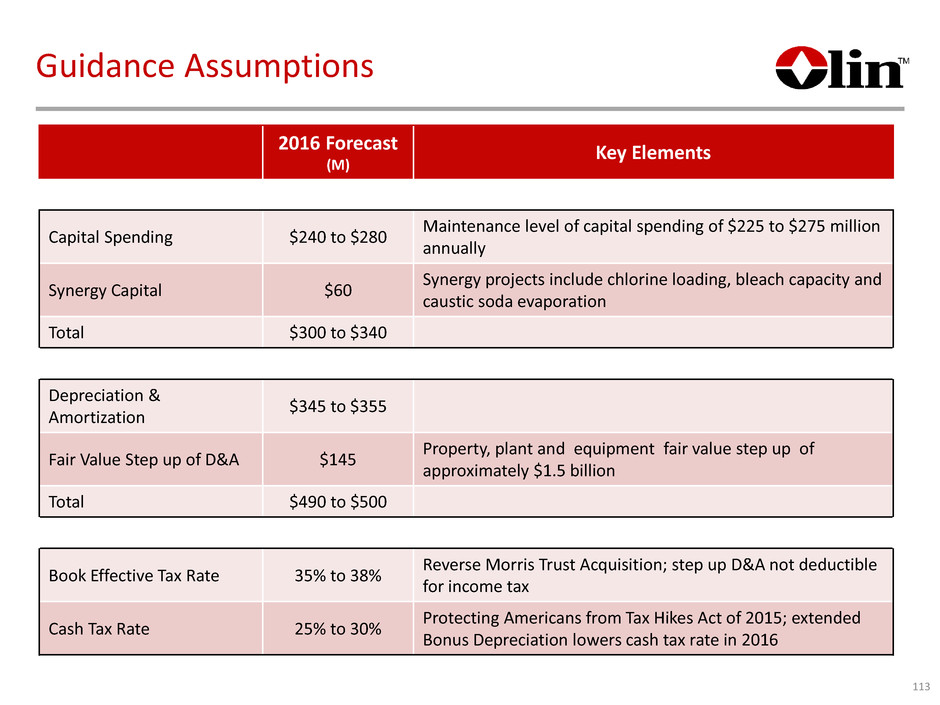
Guidance Assumptions 113 2016 Forecast (M) Key Elements Capital Spending $240 to $280 Maintenance level of capital spending of $225 to $275 million annually Synergy Capital $60 Synergy projects include chlorine loading, bleach capacity and caustic soda evaporation Total $300 to $340 Depreciation & Amortization $345 to $355 Fair Value Step up of D&A $145 Property, plant and equipment fair value step up of approximately $1.5 billion Total $490 to $500 Book Effective Tax Rate 35% to 38% Reverse Morris Trust Acquisition; step up D&A not deductible for income tax Cash Tax Rate 25% to 30% Protecting Americans from Tax Hikes Act of 2015; extended Bonus Depreciation lowers cash tax rate in 2016
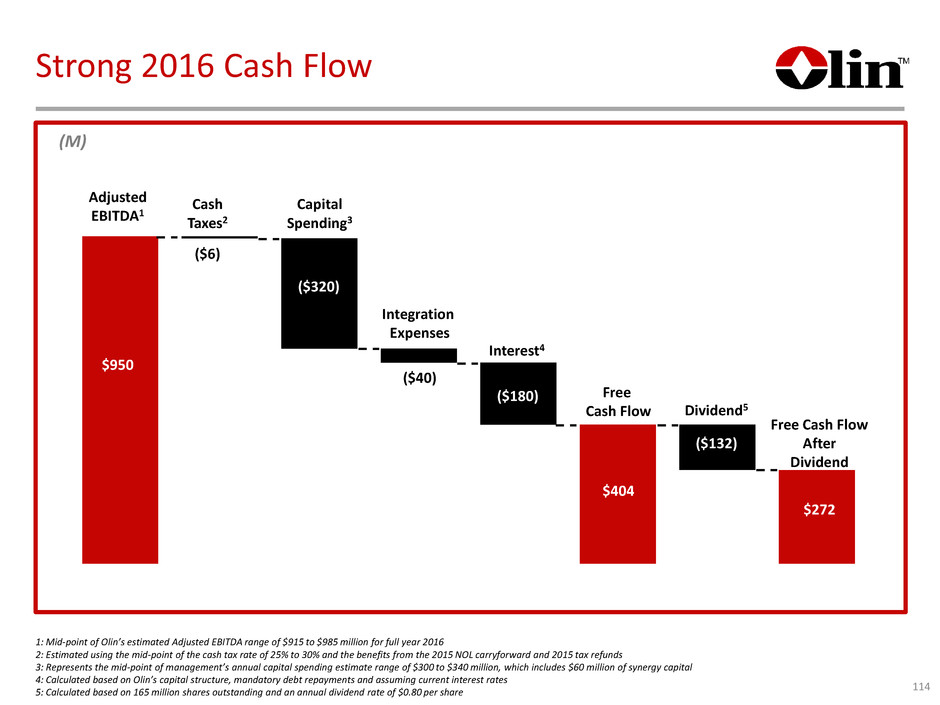
Adjusted EBITDA1 Integration Expenses Interest4 Dividend5 Free Cash Flow After Dividend Cash Taxes2 Capital Spending3 Free Cash Flow $950 ($6) ($6) ($320) ($40) ($180) $404 ($132) $272 (M) 1: Mid-point of Olin’s estimated Adjusted EBITDA range of $915 to $985 million for full year 2016 2: Estimated using the mid-point of the cash tax rate of 25% to 30% and the benefits from the 2015 NOL carryforward and 2015 tax refunds 3: Represents the mid-point of management’s annual capital spending estimate range of $300 to $340 million, which includes $60 million of synergy capital 4: Calculated based on Olin’s capital structure, mandatory debt repayments and assuming current interest rates 5: Calculated based on 165 million shares outstanding and an annual dividend rate of $0.80 per share Strong 2016 Cash Flow 114
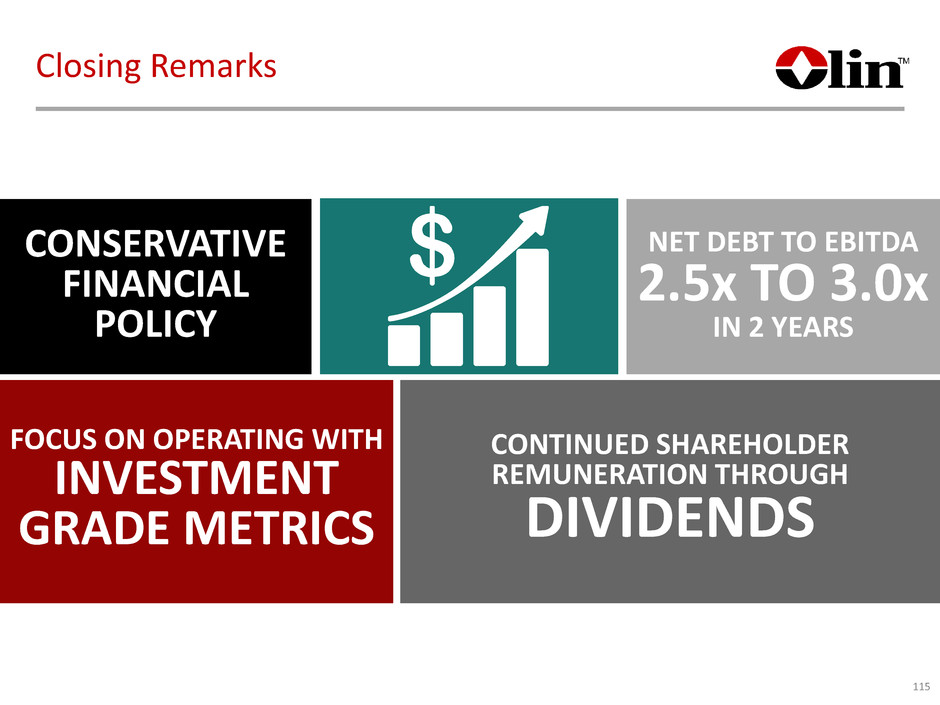
CONTINUED SHAREHOLDER REMUNERATION THROUGH DIVIDENDS FOCUS ON OPERATING WITH INVESTMENT GRADE METRICS CONSERVATIVE FINANCIAL POLICY NET DEBT TO EBITDA 2.5x TO 3.0x IN 2 YEARS Closing Remarks 115
End slide TM


