
TM September 2016 Analyst Conference Slides Exhibit 99.1

Forward-Looking Statements 2 This communication includes forward-looking statements. These statements relate to analyses and other information that are based on management’s beliefs, certain assumptions made by management, forecasts of future results, and current expectations, estimates and projections about the markets and economy in which we and our various segments operate. These statements may include statements regarding our recent acquisition of the U.S. chlor alkali and downstream derivatives businesses (the “Acquired Business”), the expected benefits and synergies of the transaction, and future opportunities for the combined company following the transaction. The statements contained in this communication that are not statements of historical fact may include forward- looking statements that involve a number of risks and uncertainties. We have used the words “anticipate,” “intend,” “may,” “expect,” “believe,” “should,” “plan,” “project,” “estimate,” “forecast,” “optimistic,” and variations of such words and similar expressions in this communication to identify such forward-looking statements. These statements are not guarantees of future performance and involve certain risks, uncertainties and assumptions, which are difficult to predict and many of which are beyond our control. Therefore, actual outcomes and results may differ materially from those matters expressed or implied in such forward-looking statements. Factors that could cause or contribute to such differences include, but are not limited to: factors relating to the possibility that Olin may be unable to achieve expected synergies and operating efficiencies in connection with the transaction within the expected time-frames or at all; the integration of the acquired chlorine products businesses being more difficult, time- consuming or costly than expected; the effect of any changes resulting from the transaction in customer, supplier and other business relationships; general market perception of the transaction; exposure to lawsuits and contingencies associated with the acquired chlorine products business; the ability to attract and retain key personnel; prevailing market conditions; changes in economic and financial conditions of our chlorine products business; uncertainties and matters beyond the control of management; and the other risks detailed in Olin’s Form 10-K for the fiscal year ended December 31, 2015 and Olin’s Form 10-Q for the quarter ended June 30, 2016. The forward-looking statements should be considered in light of these factors. In addition, other risks and uncertainties not presently known to Olin or that Olin considers immaterial could affect the accuracy of our forward-looking statements. The reader is cautioned not to rely unduly on these forward-looking statements. Olin undertakes no obligation to update publicly any forward-looking statements, whether as a result of future events, new information or otherwise. In addition to U.S. GAAP financial measures, this presentation includes certain non-GAAP financial measures including Adjusted EBITDA. These non-GAAP measures are in addition to, not a substitute for or superior to, measures for financial performance prepared in accordance with U.S. GAAP. Definitions of these measures and reconciliation of GAAP to non-GAAP measures are provided in the appendix to this presentation.

All financial data are for the six months ended June 30, 2016. Data are presented in millions of U.S. dollars. Additional information is available at www.olin.com. Winchester Chlor Alkali Products and Vinyls YTD 2016 Revenue: $ 1,437 Adj. EBITDA: $ 304 Revenue: $ 2,712 Adjusted EBITDA: $ 395 Olin YTD 2016 Olin Corporation Epoxy Company Overview YTD 2016 Revenue: $ 910 Adj. EBITDA: $ 53 YTD 2016 Revenue: $ 365 Adj. EBITDA: $ 69 3 1: Olin’s definition of “Adjusted EBITDA” (earnings before interest, taxes, depreciation and amortization) is net (loss) income plus an add-back for depreciation and amortization, interest expense (income), income tax expense (benefit), other expense (income), restructuring charges, acquisition- related costs, fair-value inventory purchase accounting adjustment and other certain non-recurring items 1

Strategic Actions to Create Today’s Olin Leading Chlor Alkali Assets Leading Winchester Business 2007 2008 2010 2011 2012 2015 • Winchester Relocation / Cost Reduction Initiative Announced • Announced Conversion/Closure of Mercury Cell Plants • First Hy-Pure® Bleach Plants Begin Operations • Purchase of KA Steel Distribution Business • Purchase of Dow’s Chlorine Derivatives Businesses • Acquisition of Pioneer • Sale of Metals Business • Buyout of SunBelt Chlor-alkali Partner • Bleach Growth Initiatives Commence 4

Creates Unparalleled Scale, Geographic Reach, and Product Diversity Olin is the Leading Chlor Alkali Supplier Globally • Chlor alkali producer • Seller of membrane grade caustic soda • Supplier of epoxy materials • Seller of chlorinated organics #1 Global • Seller of chlorine • Seller of industrial bleach • Seller of on-purpose hydrochloric acid #1 North American 5

Significantly Expanded Chlorine Use Diversity 3 Merchant HCI Bleach 19 Merchant HCI Bleach Ethylene Dichloride VCM Allyl Chloride Epichlorohydrin Liquid Epoxy Resin Vinylidene Chloride Perc Tric M1 M2 M3 Carbon Tetrachloride MDI Propylene Oxide Propylene Glycol Ag 5 Merchant HCI Bleach Ethylene Dichloride VCM Vinyl 8 Merchant HCI Bleach Ethylene Dichloride VCM Allyl Chloride Epichlorohydrin Liquid Epoxy Resin Epoxy 15 Merchant HCI Bleach Ethylene Dichloride VCM Allyl Chloride Epichlorohydrin Liquid Epoxy Resin Vinylidene Chloride Perchloroethylene Trichloroethylene M1 M2 M3 Carbon Tetrachloride Chlorinated Organics 6
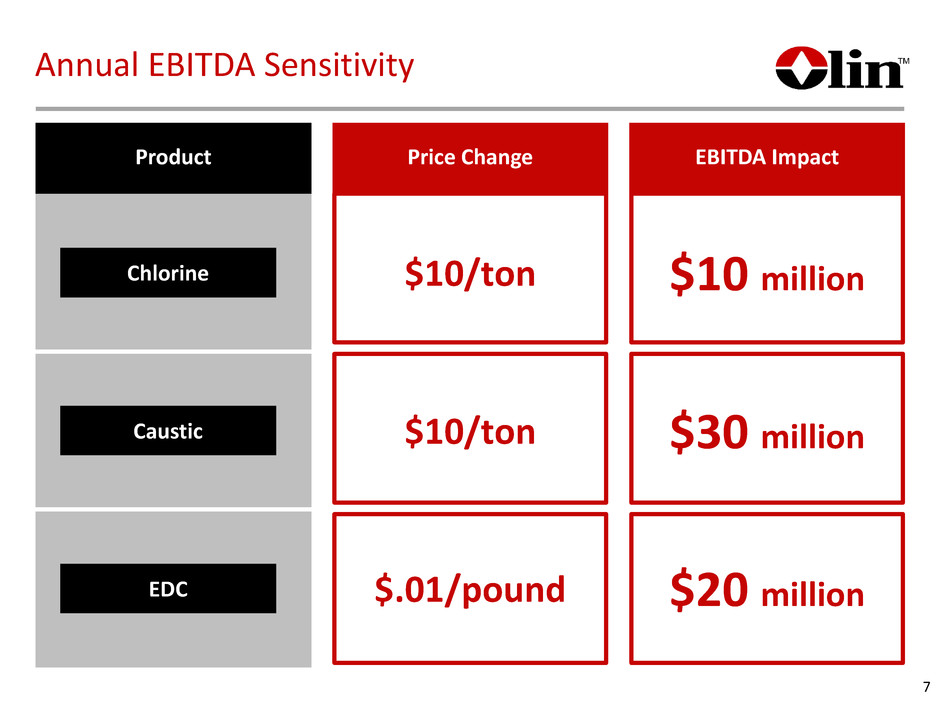
7 Product Price Change EBITDA Impact Chlorine $10/ton $10 million Caustic $10/ton $30 million EDC $.01/pound $20 million Annual EBITDA Sensitivity
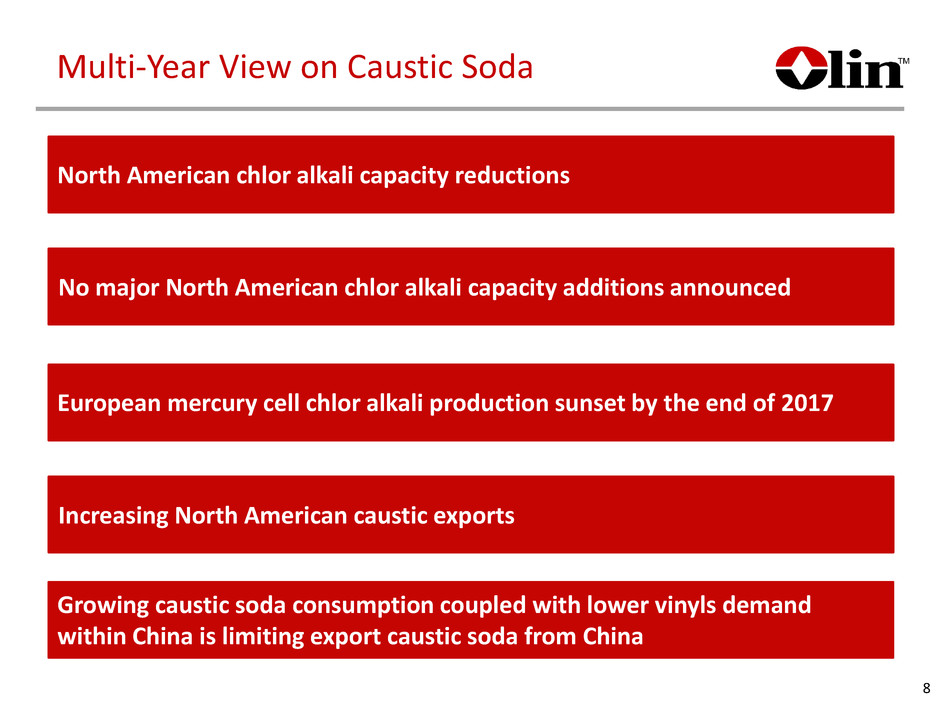
Multi-Year View on Caustic Soda North American chlor alkali capacity reductions No major North American chlor alkali capacity additions announced Increasing North American caustic exports European mercury cell chlor alkali production sunset by the end of 2017 Growing caustic soda consumption coupled with lower vinyls demand within China is limiting export caustic soda from China 8
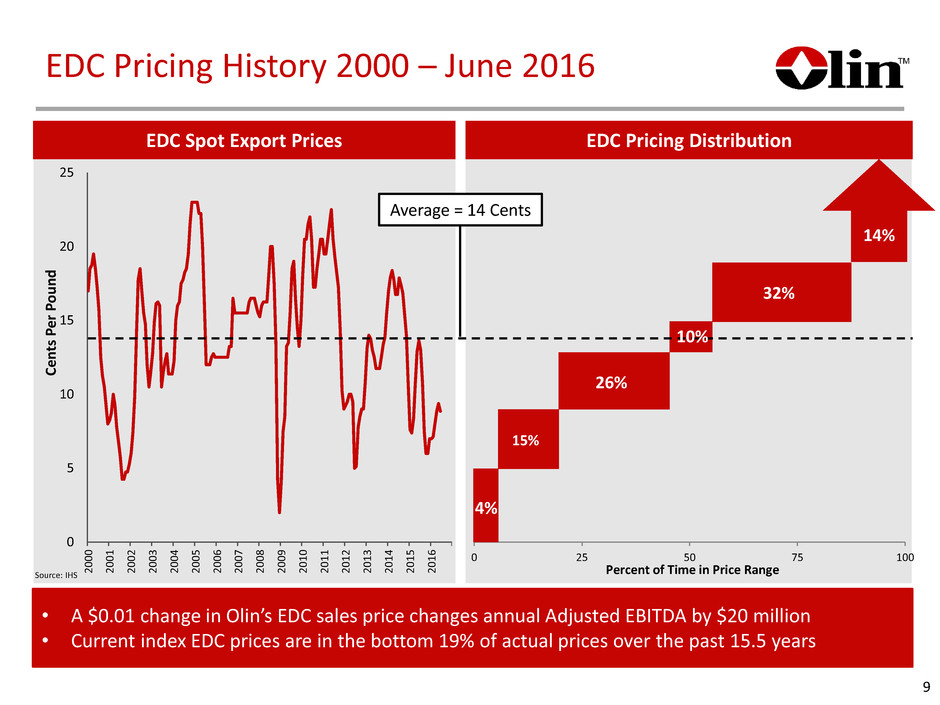
0 25 50 75 100 0 5 10 15 20 25 2 0 0 0 2 0 0 1 2 0 0 2 2 0 0 3 2 0 0 4 2 0 0 5 2 0 0 6 2 0 0 7 2 0 0 8 2 0 0 9 2 0 1 0 2 0 1 1 2 0 1 2 2 0 1 3 2 0 1 4 2 0 1 5 2 0 1 6 EDC Pricing History 2000 – June 2016 EDC Spot Export Prices Ce n ts P er P o u n d Source: IHS EDC Pricing Distribution Percent of Time in Price Range • A $0.01 change in Olin’s EDC sales price changes annual Adjusted EBITDA by $20 million • Current index EDC prices are in the bottom 19% of actual prices over the past 15.5 years 9 Average = 14 Cents 4% 15% 26% 10% 32% 14%

Global Chlorinated Organics Value Proposition 10 Sales of value-added products Differentiated product, service or market position Global footprint 1 Generate Caustic Soda sales Unbalanced user of chlorine Use low-cost chlorine and channel expertise to liberate caustic 2 Upgrade by- products into low cost raw materials Recover HCl Recycle RCls from Olin businesses and Dow and avoid disposal costs 3

Epoxy has Access to Attractive High Growth End Uses Around the Globe Select Epoxy End Use Growth Rates(’13-’18)2 Composites Civil Engineering, Adhesives Industrial Coatings Electrical Laminates 2016 3,200 2015 3,000 2014 2,900 2013 2,750 2012 2,550 2011 2,600 Epoxy Resin Consumption1 3% CAGR (’13-’16) 4% 5% 7% Source: IHS Chemical Epoxy Resins CEH report 1: Liquid resins and SERs 2: Only includes US, Western Europe, Japan and China (Tons in thousands) 11 APAC Europe US ROW 4% 8% 5% 4%

Epoxy Priorities for Success 12 0 50 100 150 200 250 300 350 Epoxy Segment EBITDA ($ in millions) Upstream Midstream Downstream Continue driving productivity and cost improvements Utilize advantaged cost position to outgrow the market (“Sell out”) Upgrade mix to improve margin (“Sell up”) Continued Volume Improvement N/A 1 2 3

Upside Potential through Significant Realizable Synergies $250 Logistics & Procurement Operational Efficiencies Asset Optimization Accessing New Segments & Customers Capital Investment Synergies Breakdown ($ in millions) 2016 2017 2018 2019 Projected Annual Impact 60 100-110 180-200 250 Projected Year-End Run Rate 80 135-165 230-250 250 Projected Annual Impact 0-5 15-25 40-50 100 Projected Year-End Run Rate 5 35-50 50 100 Projected CAPEX and Investments 205 30 20 0 Projected Cash Integration & Restructuring Costs 70 35 35 20 13
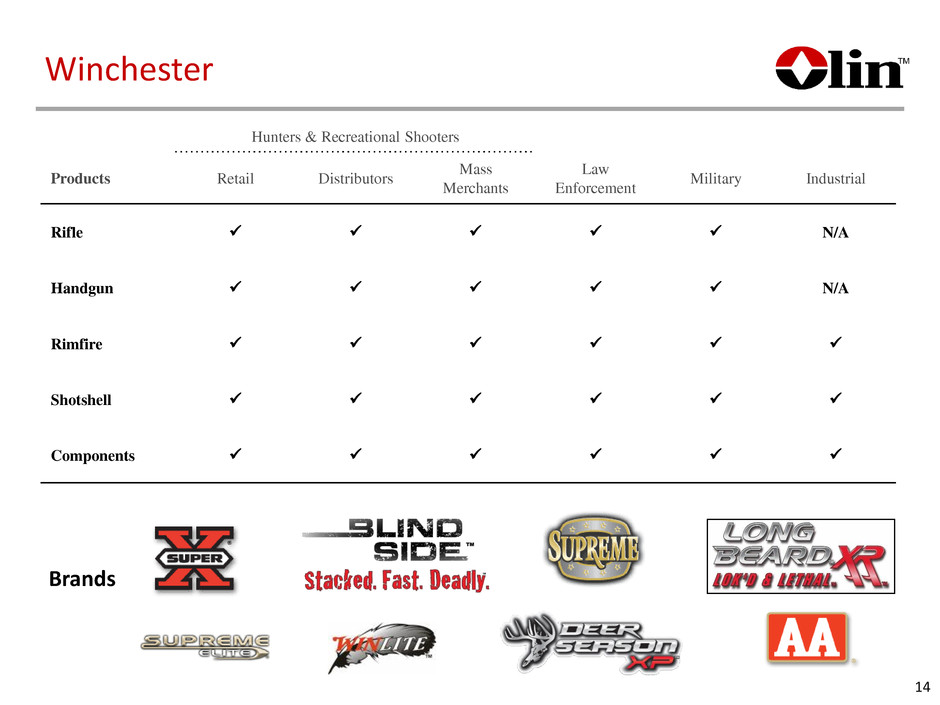
Winchester Brands Hunters & Recreational Shooters Products Retail Distributors Mass Merchants Law Enforcement Military Industrial Rifle N/A Handgun N/A Rimfire Shotshell Components 14
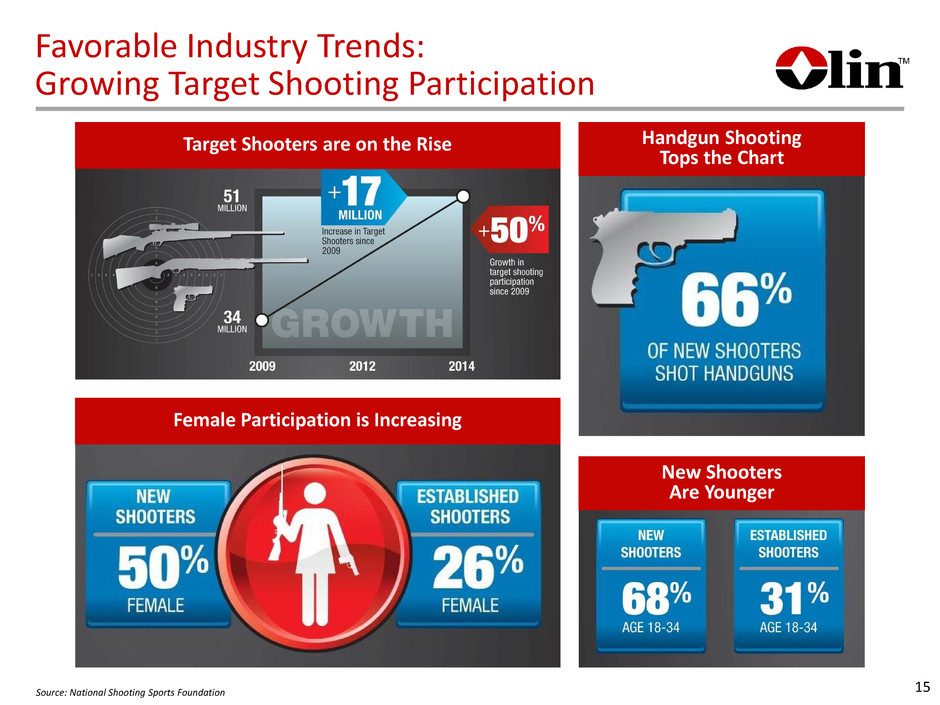
Favorable Industry Trends: Growing Target Shooting Participation Female Participation is Increasing Target Shooters are on the Rise Handgun Shooting Tops the Chart New Shooters Are Younger Source: National Shooting Sports Foundation 15
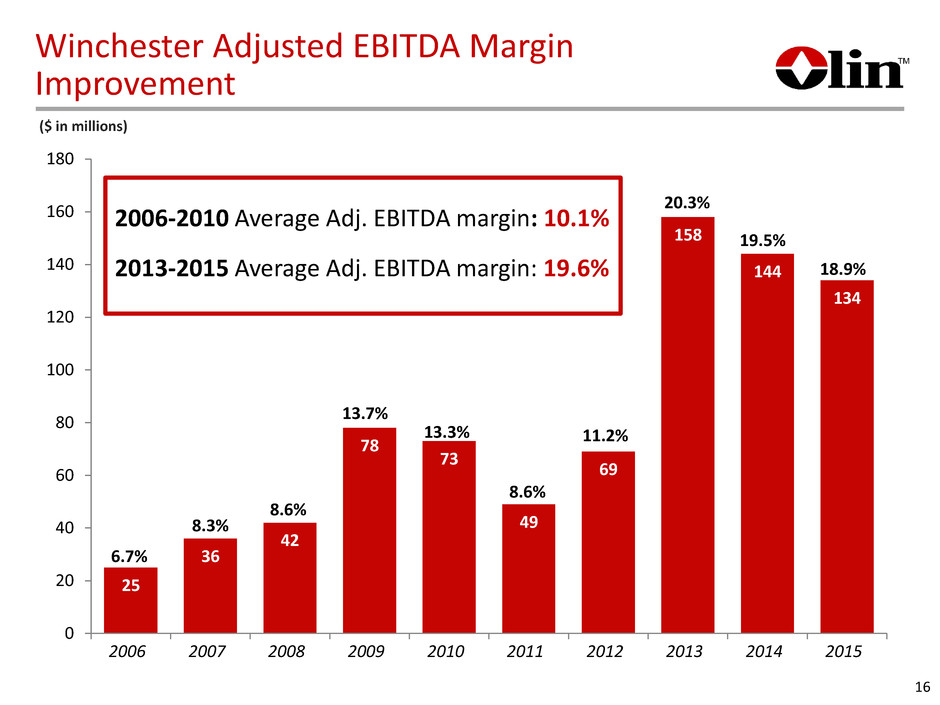
25 36 42 78 73 49 69 158 144 134 0 20 40 60 80 100 120 140 160 180 2006 2007 2008 2009 2010 2011 2012 2013 2014 2015 Winchester Adjusted EBITDA Margin Improvement 6.7% 8.3% 8.6% 13.7% 13.3% 8.6% 11.2% 20.3% 19.5% 18.9% 2006-2010 Average Adj. EBITDA margin: 10.1% 2013-2015 Average Adj. EBITDA margin: 19.6% 16 ($ in millions)
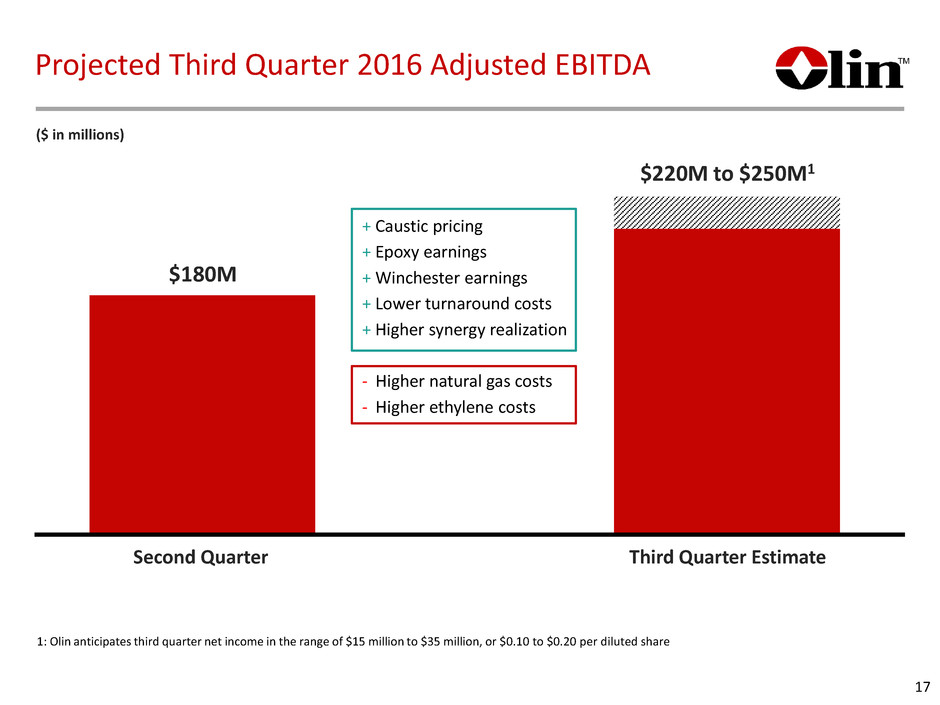
Projected Third Quarter 2016 Adjusted EBITDA ($ in millions) 17 1: Olin anticipates third quarter net income in the range of $15 million to $35 million, or $0.10 to $0.20 per diluted share Second Quarter $180M + Caustic pricing + Epoxy earnings + Winchester earnings + Lower turnaround costs + Higher synergy realization - Higher natural gas costs - Higher ethylene costs Third Quarter Estimate $220M to $250M1

2Q $180 $395 $445 - $505 18 Full Year 2016 Adjusted EBITDA Outlook 1H16 2H16 FY16 $840 - $900 2H $445 – $505 1Q $215 ($ in millions) + Caustic pricing + Epoxy earnings + Winchester earnings + Lower turnaround costs + Higher synergy realization - Higher natural gas costs - Higher ethylene costs

Working Capital4 Adjusted EBITDA1 Free Cash Flow After Dividend Cash Tax Refund2 Capital Spending and Investments3 Free Cash Flow $870 $25 ($475) ($19) ($185) $391 ($132) $259 1: Mid-point of Olin’s estimated Adjusted EBITDA range of $840 to $900 million for full year 2016 2: Estimated using the mid-point of the cash tax rate of 25% to 30% and the benefits from the 2015 NOL carryforward and tax refunds 3: Represents the mid-point of management’s annual capital spending estimate range of $280 to $320 million which includes $30 million of synergy capital and $175 million of investments for additional low cost electricity. The investments improve the manufacturing flexibility at the Freeport, TX and Plaquemine, LA facilities, reduce overall electricity costs and accelerate the realization of cost synergies available from the Acquired Business 4: Net working capital reduction includes a program to accelerate the collection of receivables 5: One-time items include integration expenses and cash restructuring charges of $70 million, partially offset by insurance recovery ($11 million) and asset sales ($40 million) 6: Calculated based on Olin’s capital structure, mandatory debt repayments and assuming current interest rates 7: Calculated based on 165 million shares outstanding and an annual dividend rate of $0.80 per share 2016 Cash Flow Waterfall Forecast One-time Items 5 Dividend 7 Interest 6 ($ in millions) $175 19
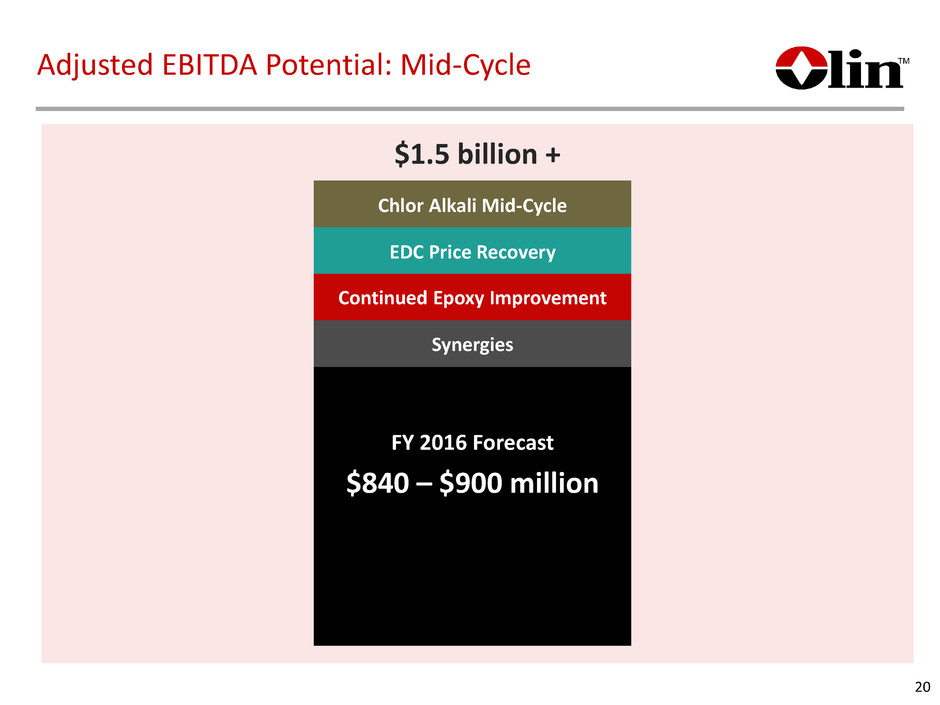
$1.5 billion + FY 2016 Forecast $840 – $900 million Chlor Alkali Mid-Cycle EDC Price Recovery Continued Epoxy Improvement Synergies Adjusted EBITDA Potential: Mid-Cycle 20

Appendix 21

The Chlorine Envelope 22 Epoxy Brine (NaCl) Power Phenol Acetone Caustic Soda (NaOH) Chlorine (CI2) Bisphenol-A GCO (Perc/Tric/CMP/VDC) Epichlorohydrin Allyl Chloride EDC / VCM Chlor-Alkali Cumene Bleach HCl Merchant

2Q16 1Q16 ∆ Q/Q Sales $733.0 $704.3 4.1% Adjusted EBITDA $134.1 $170.0 (21.1)% 2Q16 Performance Lower caustic pricing and unfavorable sales mix Increased raw material costs associated with ethylene and natural gas pricing Lower chlorinated organic volumes and pricing 3Q16 outlook – expected sequential improvement from 2Q16 Expected improvement in caustic soda pricing and volumes Expected increase in raw materials costs associated with natural gas and ethylene Expected improvement in bleach volumes Expected decrease in maintenance turnaround costs ($ in millions) Chlor Alkali Products and Vinyls Segment Performance 23

2Q16 versus 2Q15 1Q16 Chlorine Caustic Soda EDC N/A Bleach HCI Chlorinated Organics N/A Chlor Alkali Products and Vinyls Pricing and Volume Comparisons 2Q16 versus 2Q15 1Q16 Chlorine Caustic Soda N/A EDC N/A Bleach HCI Chlorinated Organics N/A Volume Comparison Pricing Comparison 24

Olin Caustic Soda Price Realization • A $10 per ton change in Olin’s caustic soda selling price changes annual Adjusted EBITDA by approximately $30 million Fundamental Principle Domestic Sales • A significant portion of domestic sales are linked to index prices • Index price changes typically occur 30 to 90 days post our price nomination • Depending on market conditions 30% to 70% of index price changes are realized • Overall price realization lags index price changes by 30 to 120 days Export Sales • Sold on a combination of negotiated sales and export index price • Changes in export index prices are typically realized on a 30 to 90 day lag • Realization of index price changes are typically 80% to 100% 25
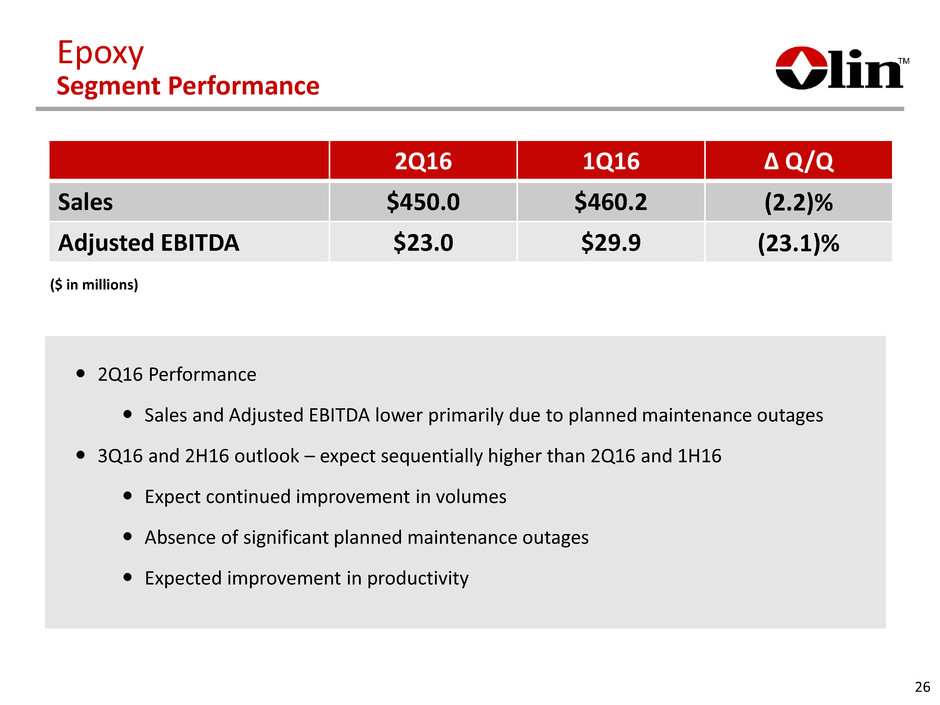
2Q16 1Q16 ∆ Q/Q Sales $450.0 $460.2 (2.2)% Adjusted EBITDA $23.0 $29.9 (23.1)% 2Q16 Performance Sales and Adjusted EBITDA lower primarily due to planned maintenance outages 3Q16 and 2H16 outlook – expect sequentially higher than 2Q16 and 1H16 Expect continued improvement in volumes Absence of significant planned maintenance outages Expected improvement in productivity ($ in millions) Epoxy Segment Performance 26

2Q16 Performance Adjusted EBITDA improvement reflects lower commodity, other material and manufacturing costs partially offset by lower commercial shipments 3Q16 outlook – expect sequential improvement from 2Q16 driven by stronger seasonal demand Full year 2016 earnings are expected to exceed full year 2015 results Operating efficiency initiatives are expected to continue to materialize throughout 2016 Expect favorable trends in NICS background checks Winchester Segment Performance 27 2Q16 1Q16 ∆ Q/Q Sales $181.0 $183.7 (1.5)% Adjusted EBITDA $35.7 $33.3 7.2% ($ in millions)

Corporate & Other 28 2Q16 1Q16 Pension Income $12.6 $12.2 Environmental Expense $(2.4) $(2.7) Other Corporate and Unallocated Costs $(23.9) $(29.6) Restructuring Charges $(8.2) $(92.8) Acquisition-related Costs $(16.3) $(10.2) ($ in millions) Corporate and other unallocated costs are consistent with our full year 2016 expectations that levels will be higher than the full year 2015 due to the build out of our corporate capabilities since the acquisition Corporate and other unallocated costs are lower in 2Q16 due to decreased legal and litigation costs and lower management incentive compensation, partially offset by mark-to-market stock-based compensation Restructuring costs in 1H16 related to the closure of 433,000 tons of chlor alkali capacity, 1Q16 includes $76.6 million of non-cash impairment charges Acquisition-related costs were associated with our integration of the Acquired Business
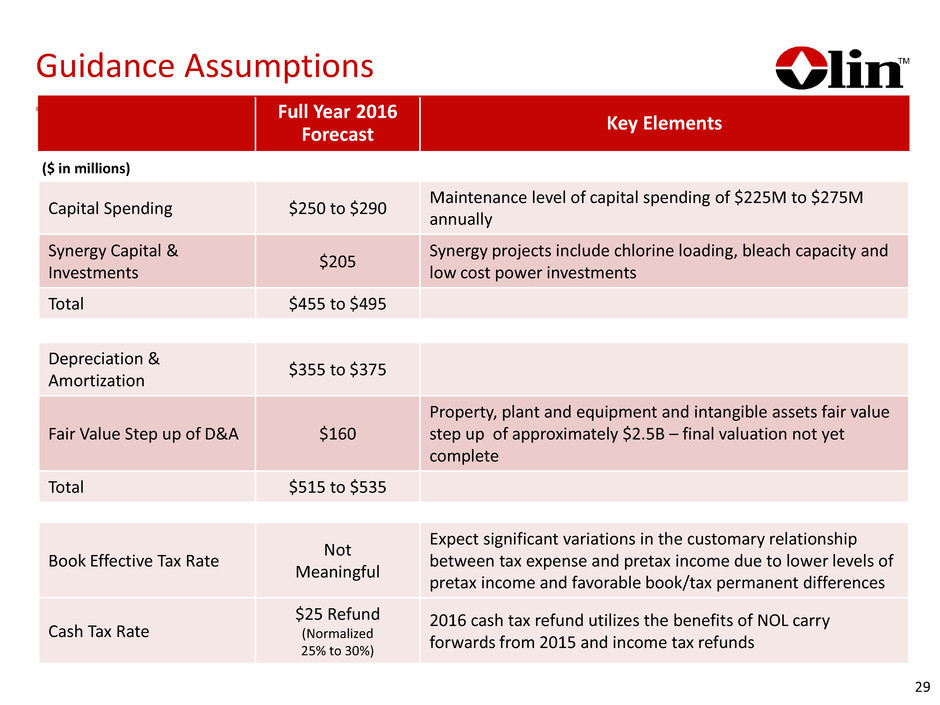
Guidance Assumptions 29 Full Year 2016 Forecast Key Elements Capital Spending $250 to $290 Maintenance level of capital spending of $225M to $275M annually Synergy Capital & Investments $205 Synergy projects include chlorine loading, bleach capacity and low cost power investments Total $455 to $495 Depreciation & Amortization $355 to $375 Fair Value Step up of D&A $160 Property, plant and equipment and intangible assets fair value step up of approximately $2.5B – final valuation not yet complete Total $515 to $535 Book Effective Tax Rate Not Meaningful Expect significant variations in the customary relationship between tax expense and pretax income due to lower levels of pretax income and favorable book/tax permanent differences Cash Tax Rate $25 Refund (Normalized 25% to 30%) 2016 cash tax refund utilizes the benefits of NOL carry forwards from 2015 and income tax refunds ($ in millions)

Advantaged Ethylene Arrangement •A series of three supply agreements with Dow •Pipeline supply without operating or start-up risk •Producer economics Tranche Effective Date Annual Volume (tons) Cost (millions) #1 Acquired at closing Up to 180,000 $433* #2 Available ~ 2H 2017 Up to 160,000 ~$210 #3 Available ~ 4Q 2020 Up to 300,000 $425-$465 * Includes option payments for Tranches #2 and #3 30

Non-GAAP Financial Measures – Adjusted EBITDA (a) (a) Unaudited. (b) Restructuring charges for the three months ended June 30, 2016 and March 31, 2016 and for the six months ended June 30, 2016 were primarily associated with the closure of 433,000 tons of chlor alkali capacity across three separate Olin locations, of which $76.6 million was non-cash impairment charges for equipment and facilities for the three months ended March 31, 2016 and for the six months ended June 30, 2016. (c) Acquisition-related costs for the three months ended June 30, 2016 and March 31, 2016 and for the six months ended June 30, 2016 were associated with our acquisition of the Acquired Business. (d) Certain non-recurring items for the three months ended March 31, 2016 and for the six months ended June 30, 2016 included an $11.0 million insurance recovery for property damage and business interruption related to a 2008 Henderson, NV chlor alkali facility incident. 31 Six Months Ended June 30, March 31, June 30, (In millions) 2016 2016 2016 Reconciliation of Net Loss to Adjusted EBITDA: Net Loss (1.0)$ (37.9)$ (38.9)$ Add Back: Interest Expense 47.6 48.5 96.1 Interest Income (0.5) (0.3) (0.8) Income Tax Benefit (22.6) (17.5) (40.1) Depreciation and Amortization 132.4 129.7 262.1 EBITDA 155.9 122.5 278.4 Add Back: Restructuring Charges (b) 8.2 92.8 101.0 Acquisition-related Costs (c) 16.3 10.2 26.5 Certain Non-recurring Items (d) - (11.0) (11.0) Adjusted EBITDA 180.4$ 214.5$ 394.9$ Three Months Ended Olin's definition of Adjusted EBITDA (Earnings before interest, taxes, depreciation, and amortization) is net (loss) income plus an add-back for depreciation and amortization, interest expense (income), income tax expense (benefit), other expense (income), restructuring charges, acquisition-related costs, fair value inventory purchase accounting adjustments and other certain non-recurring items. Adjusted EBITDA is a non-GAAP financial measure. Management believes that this measure is meaningful to investors as a supplemental financial measure to assess the financial performance of our assets without regard to financing methods, capital structures, taxes, or historical cost basis. The use of non-GAAP financial measures is not intended to replace any measures of performance determined in accordance with GAAP and Adjusted EBITDA presented may not be comparable to similarly titled measures of other companies. Reconciliation of forward-looking non-GAAP financial measures to the most directly comparable GAAP financial measures are omitted from this presentation because Olin is unable to provide such reconciliations without the use of unreasonable efforts. This inability results from the inherent difficulty in forecasting generally and quantifying certain projected amounts that are necessary for such reconciliations. In particular, sufficient information is not available to calculate certain adjustments required for such reconciliations, including interest expense (income), income tax expense (benefit), other expense (income), restructuring charges, and acquisition-related costs. Because of our inability to calculate such adjustments, forward-looking net income guidance is also omitted from this presentation. We expect these adjustments to have a potentially significant impact on our future GAAP financial results.

Non-GAAP Financial Measures – Net Income (loss) from Operations per share (a) (a) Unaudited. (b) Restructuring charges for the three months ended June 30, 2016 and March 31, 2016 and for the six months ended June 30, 2016 were primarily associated with the closure of 433,000 tons of chlor alkali capacity across three separate Olin locations, of which $76.6 million was non-cash impairment charges for equipment and facilities for the three months ended March 31, 2016 and for the six months ended June 30, 2016. (c) Acquisition-related costs for the three months ended June 30, 2016 and March 31, 2016 and for the six months ended June 30, 2016 were associated with our acquisition of the Acquired Business. (d) Certain non-recurring items for the three months ended March 31, 2016 and for the six months ended June 30, 2016 included an $11.0 million insurance recovery for property damage and business interruption related to a 2008 Henderson, NV chlor alkali facility incident. (e) Step-up depreciation and amortization for the three months ended June 30, 2016 and March 31, 2016 and for the six months ended June 30, 2016 was associated with the increase to fair value of property, plant and equipment, acquired intangible assets and long-term supply contracts at the acquisition date related to the purchase accounting of the Acquired Business. (f) The effective tax rate on the pretax adjustments from net loss per share to adjusted net income from operations per share is approximately 37% for the three months ended June 30, 2016 and March 31, 2016 and for the six months ended June 30, 2016. Six Months Ended June 30, March 31, June 30, 2016 2016 2016 Reconciliation of Net Loss Per Share to Adjusted Net Income from Operations Per Share: Net Loss Per Share (0.01)$ (0.23)$ (0.24)$ Add Back: Restructuring Charges (b) 0.05 0.56 0.61 Acquisition-related Costs (c) 0.10 0.06 0.16 Certain Non-recurring Items (d) - (0.07) (0.07) Step-Up Depreciation and Amortization (e) 0.26 0.23 0.49 Income Tax Impact (f) (0.16) (0.29) (0.45) Adjusted Net Income from Operations Per Share 0.24$ 0.26$ 0.50$ Three Months Ended 32 Olin's definition of adjusted net income (loss) from operations per share is net income (loss) per share plus a per dilutive share add-back for step-up depreciation and amortization recorded in conjunction with the Acquired Business, restructuring charges, acquisition-related costs, other certain non-recurring items and the tax impact of the aforementioned adjustments. Adjusted net income (loss) from operations per share is a non-GAAP financial measure excluding certain items that we do not consider part of ongoing operations. Management believes that this supplemental financial measure is meaningful to investors as a financial performance metric which is useful to investors for comparative purposes. The use of non-GAAP financial measures is not intended to replace any measures of performance determined in accordance with GAAP and adjusted net income (loss) from operations per share presented may not be comparable to similarly titled measures of other companies

Non-GAAP Financial Measures by Segment 33 (In millions) Income (loss) before Taxes Depreciation and Amortization Adjusted EBITDA Chlor Alkali Products and Vinyls 30.7$ 103.4$ 134.1$ Epoxy - 23.0 23.0 Winchester 31.2 4.5 35.7 (In millions) Income (loss) before Taxes Depreciation and Amortization Adjusted EBITDA Chlor Alkali Products and Vinyls 68.1$ 101.9$ 170.0$ Epoxy 8.2 21.7 29.9 Winchester 28.7 4.6 33.3 Three Months Ended June 30, 2016 Three Months Ended March 31, 2016


