Exhibit 99.1

Morgan Stanley Presentation
New York City February 24, 2004
1

Attending Today
• Joseph D. Rupp – President and Chief Executive Officer
• Anthony W. Ruggiero – Executive Vice President and Chief Financial Officer
• John L. McIntosh — President, Chlor Alkali Products
• John E. Fischer – Vice President, Finance
• Richard E. Koch – Vice President, Investor Relations and Public Affairs
2
Joseph D. Rupp
President & Chief Executive Officer
3
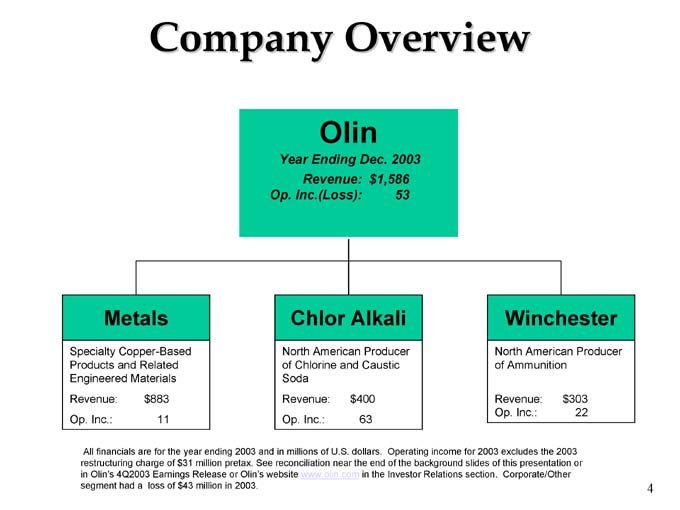
Company Overview
Olin
Year Ending Dec. 2003
Revenue: $1,586
Op. Inc.(Loss): 53
Metals
Specialty Copper-Based Products and Related Engineered Materials
Revenue: $883
Op. Inc.: 11
Chlor Alkali
North American Producer of Chlorine and Caustic Soda
Revenue: $400
Op. Inc.: 63
Winchester
North American Producer of Ammunition
Revenue: $ 303
Op. Inc.: 22
All financials are for the year ending 2003 and in millions of U.S. dollars. Operating income for 2003 excludes the 2003 restructuring charge of $31 million pretax. See reconciliation near the end of the background slides of this presentation or in Olin’s 4Q2003 Earnings Release or Olin’s website www.olin.com in the Investor Relations section. Corporate/Other segment had a loss of $43 million in 2003.
4

Olin Corporate Strategy
Olin Corporation Goal: Superior Shareholder Returns
TRS in Top Third S&P Mid Cap 400 ROCE Over Cost of Capital Over the Cycle
Focused Portfolio of Businesses
• Improve Profitability of the Metals Business
• Increase the Value of and Generate Cash From Chlor Alkali
• Leverage Winchester’s Strengths
Global Market Leadership
• #1 or #2 in the Markets We Choose to Serve
• Strong Technical Innovation in Metals and Winchester
• Increase Metal’s Worldwide Presence
Operational Excellence
• A Low Cost Producer in Our Strategic Businesses
• Continuous Improvement in Operating Margins
5
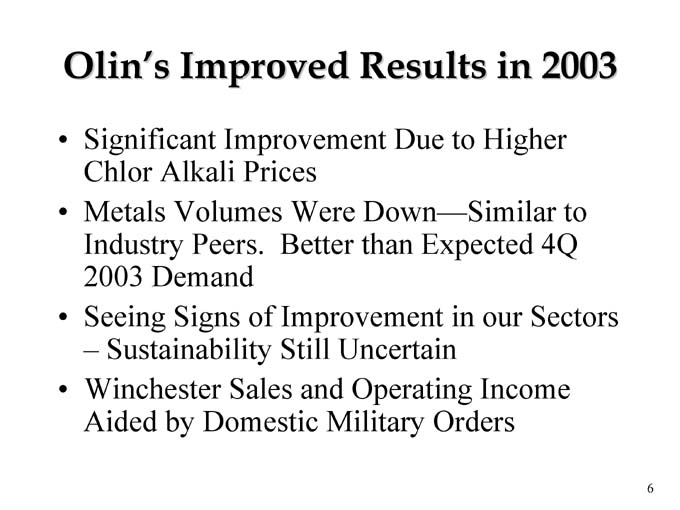
Olin’s Improved Results in 2003
• Significant Improvement Due to Higher Chlor Alkali Prices
• Metals Volumes Were Down—Similar to Industry Peers. Better than Expected 4Q 2003 Demand
• Seeing Signs of Improvement in our Sectors
– Sustainability Still Uncertain
• Winchester Sales and Operating Income Aided by Domestic Military Orders
6
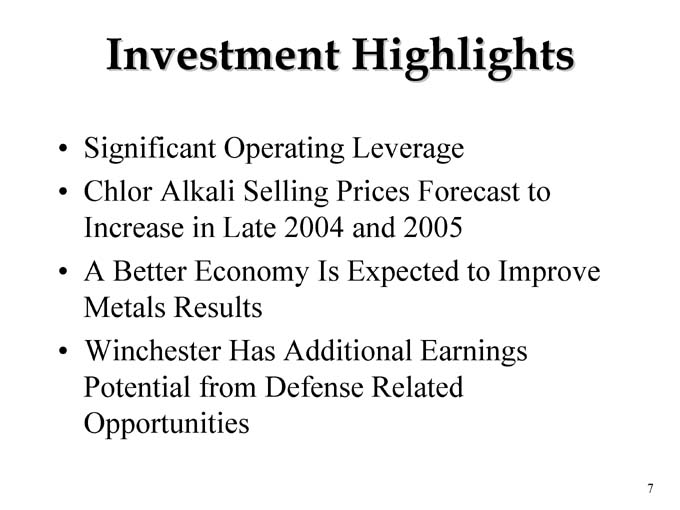
Investment Highlights
• Significant Operating Leverage
• Chlor Alkali Selling Prices Forecast to Increase in Late 2004 and 2005
• A Better Economy Is Expected to Improve Metals Results
• Winchester Has Additional Earnings Potential from Defense Related Opportunities
7
John L. McIntosh
President, Chlor Alkali Products
8
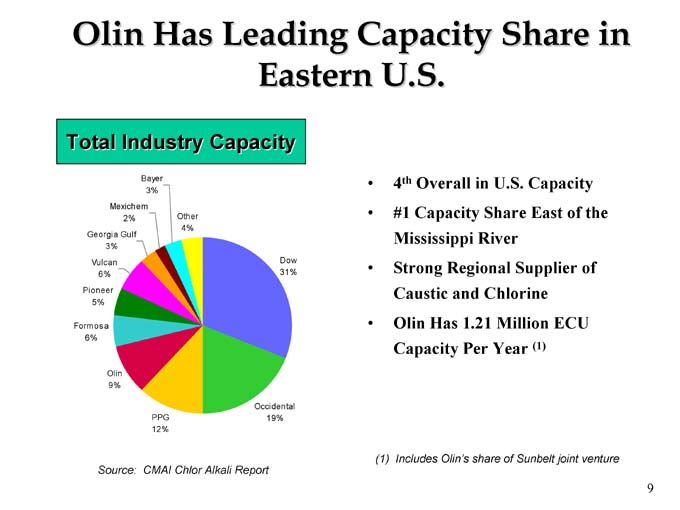
Olin Has Leading Capacity Share in Eastern U.S.
Total Industry Capacity
Other 4%
Bayer 3%
Mexichem 2%
Georgia Gulf 3%
Vulcan 6%
Pioneer 5%
Formosa 6%
Olin 9%
PPG 12%
Occidental 19%
Dow 31%
Source: CMAI Chlor Alkali Report
• 4th Overall in U.S. Capacity
• #1 Capacity Share East of the Mississippi River
• Strong Regional Supplier of Caustic and Chlorine
• Olin Has 1.21 Million ECU Capacity Per Year (1)
(1) Includes Olin’s share of Sunbelt joint venture
9
A $10 Per ECU Change Equates to a $12 Million Change in Pretax Income at Full Capacity, or $.11 Per Share @ 40% Tax Rate
10
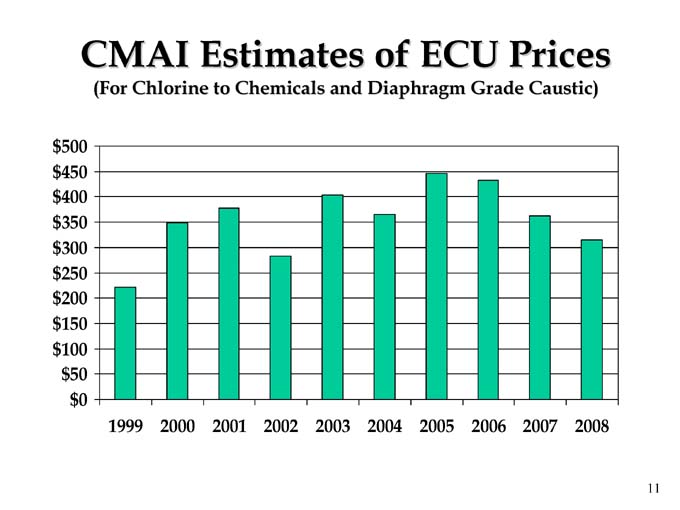
CMAI Estimates of ECU Prices
(For Chlorine to Chemicals and Diaphragm Grade Caustic)
1999 2000 2001 2002 2003 2004 2005 2006 2007 2008
11
Olin Chlor Alkali Factors
• Olin Operating Rates Expected to Be in 90% Range in 2004
• Olin’s Electricity Costs, a Key Component of Manufacturing Costs, Have Remained Relatively Stable
• High Gas Prices Impacting Other Chlor Alkali Producers May Cause Prices to Increase
($1 / MMBTU = $25-$35 / ECU)
• 12% of U.S. Capacity Shut Down Since 2000
12
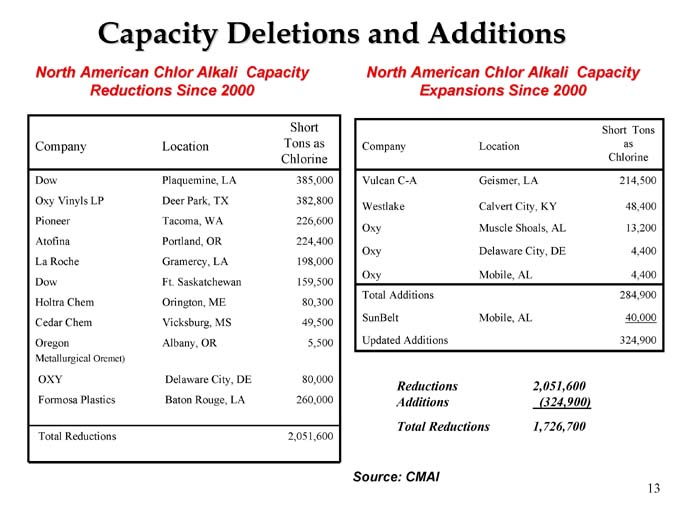
Capacity Deletions and Additions
North American Chlor Alkali Capacity Reductions Since 2000
Short
Company Location Tons as
Chlorine
Dow Plaquemine, LA 385,000
Oxy Vinyls LP Deer Park, TX 382,800
Pioneer Tacoma, WA 226,600
Atofina Portland, OR 224,400
La Roche Gramercy, LA 198,000
Dow Ft. Saskatchewan 159,500
Holtra Chem Orington, ME 80,300
Cedar Chem Vicksburg, MS 49,500
Oregon Albany, OR 5,500
Metallurgical Oremet)
OXY Delaware City, DE 80,000
Formosa Plastics Baton Rouge, LA 260,000
Total Reductions 2,051,600
North American Chlor Alkali Capacity Expansions Since 2000
Short Tons
Company Location as
Chlorine
Vulcan C-A Geismer, LA 214,500
Westlake Calvert City, KY 48,400
Oxy Muscle Shoals, AL 13,200
Oxy Delaware City, DE 4,400
Oxy Mobile, AL 4,400
Total Additions 284,900
SunBelt Mobile, AL 40,000
Updated Additions 324,900
Reductions 2,051,600
Additions (324,900)
Total Reductions 1,726,700
Source: CMAI
13
Chlor Alkali Products
• Full Year 2003 / 2002 Comparative Results:
– Sales Increased $79 million or 25% From 2002
($ 400 M vs. $321 M)
– Operating Income Increased $87 Million (Income of $63 M vs. Loss of $24 M)
– Olin’s ECU Netback for 2003, Excluding Sunbelt Joint Venture, Was $325 Compared With $235 in 2002
14
Chlor Alkali Products
First Quarter 2004
• Seasonal Improvement of Demand From 4Q Levels
• Olin ECU Prices May Be Slightly Below 1Q2003 Due to Falling Caustic Prices
• Demand in January and February Somewhat Better than Expected
• A Chlorine Price Increase of $75 per ton Has Been Announced
15
Metals
• Olin is Leading Manufacturer of Copper Alloy Strip and Brass Rod in the U.S.
• Large Size Provides Economies of Scale and Manufacturing Efficiencies
• Olin Possesses Leading Technology Position
• Olin is the Leading Copper Based Sheet and Strip Distributor in the U.S.
16
Metals
• Significant Earnings Leverage as a Result of Cost Cutting and Capacity Rationalization
• As the Following Slides Show, 2001, 2002 and 2003 Were Well Below Historical Consumption
17
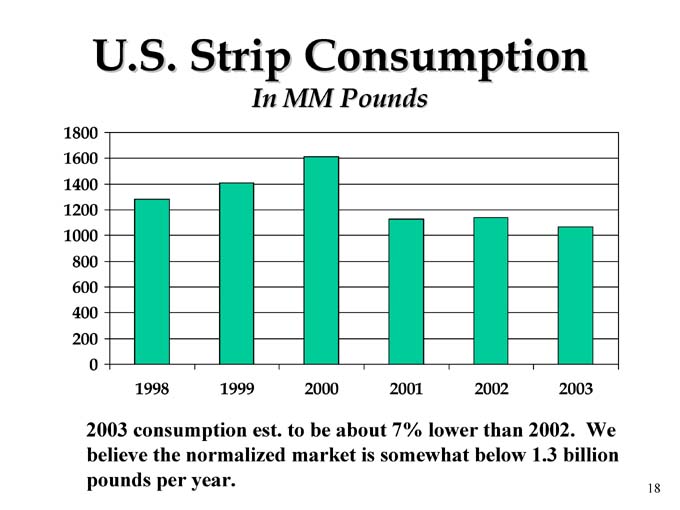
U.S. Strip Consumption
In MM Pounds
1998 1999 2000 2001 002 2003
2003 consumption est. to be about 7% lower than 2002. We believe the normalized market is somewhat below 1.3 billion pounds per year.
18
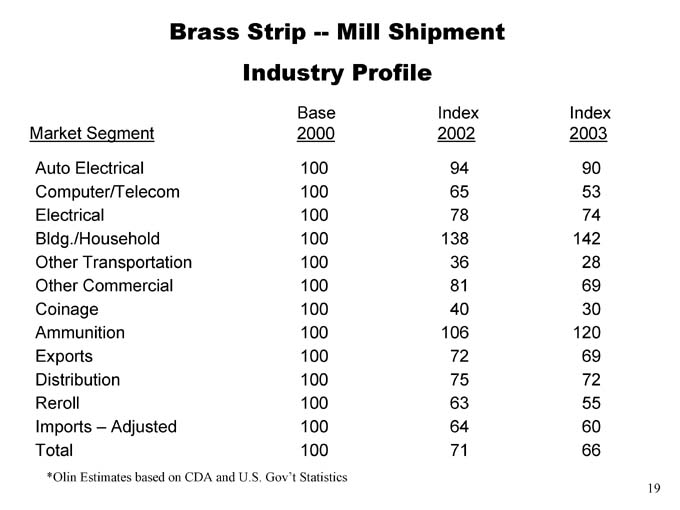
Brass Strip — Mill Shipment Industry Profile
Base Index Index
Market Segment 2000 2002 2003
Auto Electrical 100 94 90
Computer/Telecom 100 65 53
Electrical 100 78 74
Bldg./Household 100 138 142
Other Transportation 100 36 28
Other Commercial 100 81 69
Coinage 100 40 30
Ammunition 100 106 120
Exports 100 72 69
Distribution 100 75 72
Reroll 100 63 55
Imports – Adjusted 100 64 60
Total 100 71 66
*Olin Estimates based on CDA and U.S. Gov’t Statistics
19
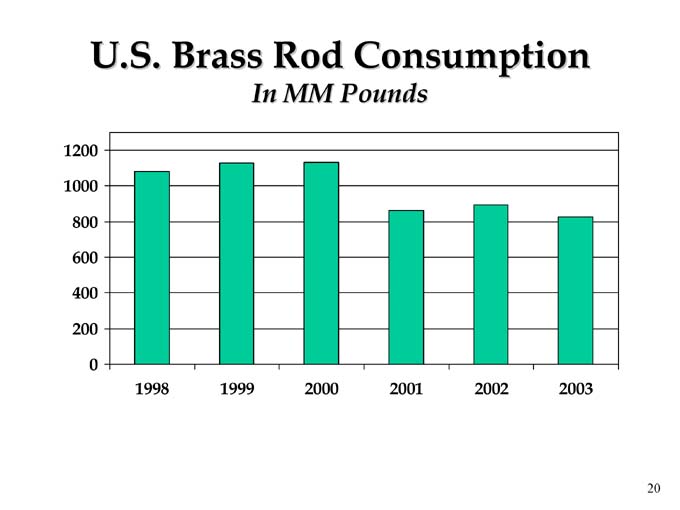
U.S. Brass Rod Consumption
In MM Pounds
1998 1999 2000 2001 2002 2003
20
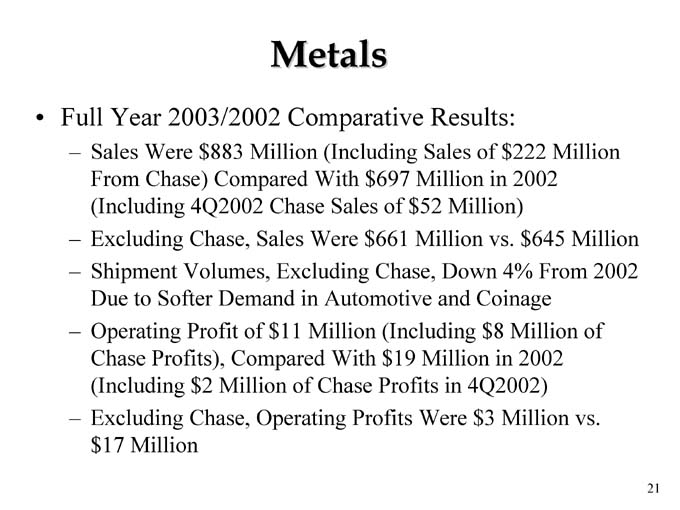
Metals
• Full Year 2003/2002 Comparative Results:
– Sales Were $883 Million (Including Sales of $222 Million From Chase) Compared With $697 Million in 2002 (Including 4Q2002 Chase Sales of $52 Million)
– Excluding Chase, Sales Were $661 Million vs. $645 Million
– Shipment Volumes, Excluding Chase, Down 4% From 2002 Due to Softer Demand in Automotive and Coinage
– Operating Profit of $11 Million (Including $8 Million of Chase Profits), Compared With $19 Million in 2002 (Including $2 Million of Chase Profits in 4Q2002)
– Excluding Chase, Operating Profits Were $3 Million vs. $17 Million
21
Metals Summary
• We See Improving Macro-Economic Factors
• Historically our Businesses Generally Lag the Recovery by About Six Months
• Visibility Has Improved but Remains Limited
• Cost Reduction Initiatives Are Expected to Offset Cost Increases
22
China Joint Venture
• Olin-Loutong Metals (GZ) Ltd., Co.
• Distribution Center in Guangzhou, China
• Will Process and Distribute Both Olin and Luoyang’s Copper Alloy Products
• Expect to be Operational in 1Q’04
23
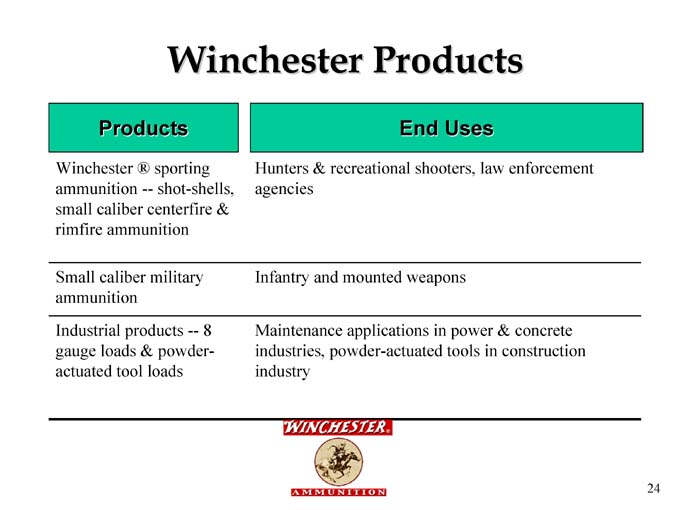
Winchester Products
Products
Winchester ® sporting ammunition — shot-shells, small caliber centerfire & rimfire ammunition
Small caliber military ammunition
Industrial products — 8 gauge loads & powder-actuated tool loads
End Uses
Hunters & recreational shooters, law enforcement agencies
Infantry and mounted weapons
Maintenance applications in power & concrete industries, powder-actuated tools in construction industry
24
Winchester
• Full Year 2003 / 2002 Comparative Results:
– Sales Up 7% Compared to 2002, Primarily Due to Higher Volumes
– Operating Income Increased to $22 Million, From $16 Million in 2002
– Increase Primarily Due From Increased Military Demand
25
Rimfire
• To Improve Its Competitive Position, Winchester is Considering Relocating Its Rimfire Manufacturing Operation from East Alton
• No Final Geographic Decision Made As Yet
26
Corporate Office Moves
• Closing Norwalk, CT Headquarters and Moving to East Alton, IL by End of 2004
• Decision Driven By Organizational, Strategic, Economic Advantages
• One-time Costs of Approximately $12 Million; Annualized Savings of about $6 Million
27
A. W. Ruggiero
Executive Vice President and CFO
28
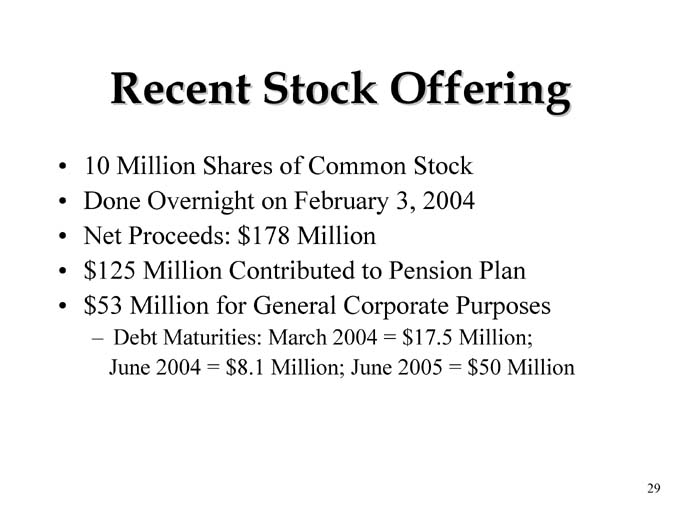
Recent Stock Offering
• 10 Million Shares of Common Stock
• Done Overnight on February 3, 2004
• Net Proceeds: $178 Million
•$ 125 Million Contributed to Pension Plan
•$ 53 Million for General Corporate Purposes
– Debt Maturities: March 2004 = $17.5 Million; June 2004 = $8.1 Million; June 2005 = $50 Million
29

Rationale for Stock Issuance
• Strengthens Balance Sheet and Increase Financial Flexibility
– Companies with Stronger Financial Positions Have Better Multiples
• Company Stock Price Was Close to 52-Week High and Reasonably Close to Its Average High Price for the Past 5 Years
• Market Receptive to Chemical Equity Issuances; Duration of Window Unknown
• Financial Benefits by Pre-funding Pension Plan
30
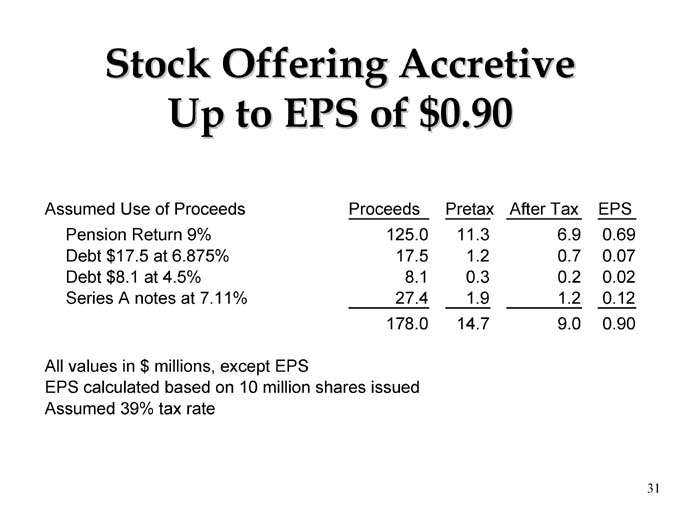
Stock Offering Accretive Up to EPS of $0.90
Assumed Use of Proceeds Proceeds Pretax After Tax EPS
Pension Return 9% 125.0 11.3 6.9 0.69
Debt $17.5 at 6.875% 17.5 1.2 0.7 0.07
Debt $8.1 at 4.5% 8.1 0.3 0.2 0.02
Series A notes at 7.11% 27.4 1.9 1.2 0.12
178.0 14.7 9.0 0.90
All values in $ millions, except EPS
EPS calculated based on 10 million shares issued Assumed 39% tax rate
31
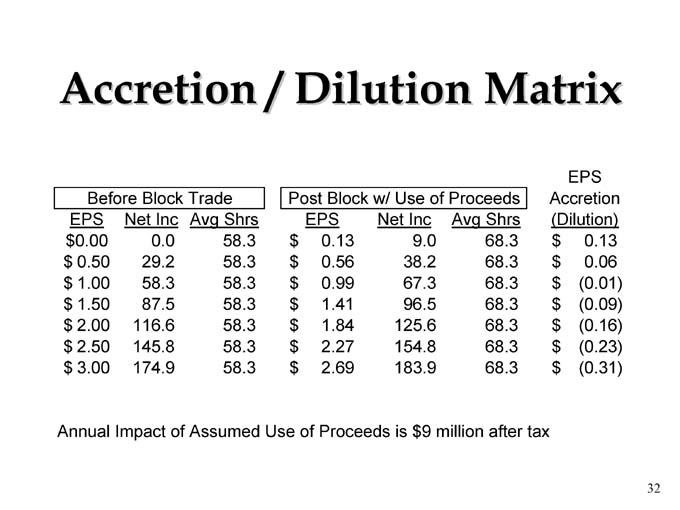
Accretion / Dilution Matrix
EPS
Before Block Trade Post Block w/ Use of Proceeds Accretion
EPS Net Inc Avg Shrs EPS Net Inc Avg Shrs (Dilution)
$ 0.00 0.0 58.3 $ 0.13 9.0 68.3 $ 0.13
$ 0.50 29.2 58.3 $ 0.56 38.2 68.3 $ 0.06
$ 1.00 58.3 58.3 $ 0.99 67.3 68.3 $ (0.01)
$ 1.50 87.5 58.3 $ 1.41 96.5 68.3 $ (0.09)
$ 2.00 116.6 58.3 $ 1.84 125.6 68.3 $ (0.16)
$ 2.50 145.8 58.3 $ 2.27 154.8 68.3 $ (0.23)
$ 3.00 174.9 58.3 $ 2.69 183.9 68.3 $ (0.31)
Annual Impact of Assumed Use of Proceeds is $9 million after tax
32
Pension Plan
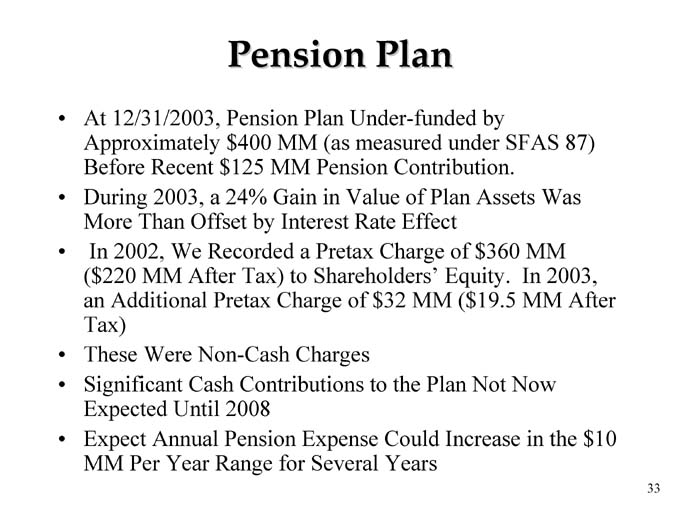
• At 12/31/2003, Pension Plan Under-funded by
Approximately $400 MM (as measured under SFAS 87) Before Recent $125 MM Pension Contribution.
• During 2003, a 24% Gain in Value of Plan Assets Was More Than Offset by Interest Rate Effect
• In 2002, We Recorded a Pretax Charge of $360 MM
($220 MM After Tax) to Shareholders’ Equity. In 2003, an Additional Pretax Charge of $32 MM ($19.5 MM After Tax)
• These Were Non-Cash Charges
• Significant Cash Contributions to the Plan Not Now Expected Until 2008
• Expect Annual Pension Expense Could Increase in the $10 MM Per Year Range for Several Years
33
2003 Overview
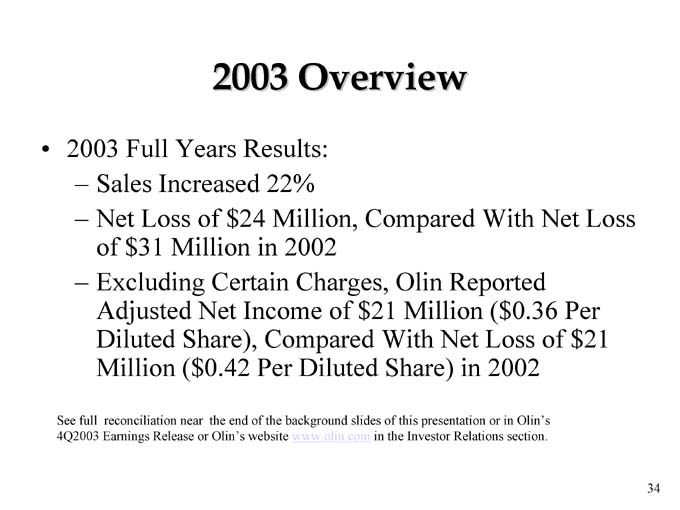
• 2003 Full Years Results:
– Sales Increased 22%
– Net Loss of $24 Million, Compared With Net Loss of $31 Million in 2002
– Excluding Certain Charges, Olin Reported Adjusted Net Income of $21 Million ($0.36 Per Diluted Share), Compared With Net Loss of $21 Million ($0.42 Per Diluted Share) in 2002
See full reconciliation near the end of the background slides of this presentation or in Olin’s 4Q2003 Earnings Release or Olin’s website www.olin.com in the Investor Relations section.
34
Profit Summary From Earnings Release
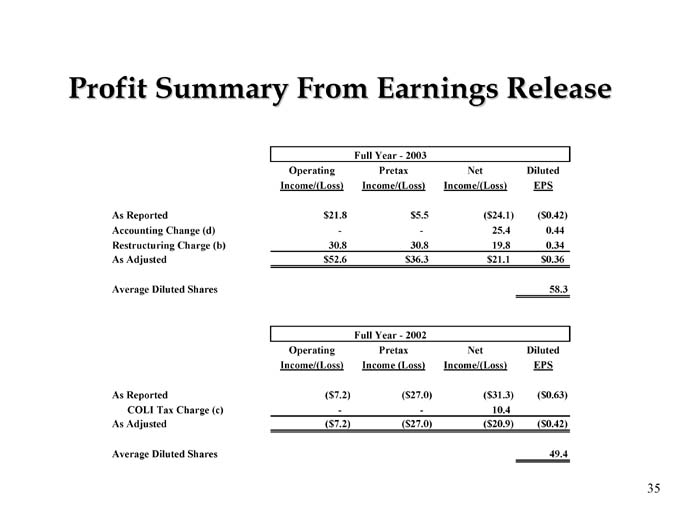
Full Year—2003
Operating Pretax Net Diluted
Income/(Loss) Income/(Loss) Income/(Loss) EPS
As Reported $ 21.8 $ 5.5 ($ 24.1) ($ 0.42)
Accounting Change (d) - - 25.4 0.44
Restructuring Charge (b) 30.8 30.8 19.8 0.34
As Adjusted $ 52.6 $ 36.3 $ 21.1 $ 0.36
Average Diluted Shares 58.3
Full Year—2002
Operating Pretax Net Diluted
Income/(Loss) Income (Loss) Income/(Loss) EPS
As Reported ($ 7.2) ($ 27.0) ($ 31.3) ($ 0.63)
COLI Tax Charge (c) - - 10.4
As Adjusted ($ 7.2) ($ 27.0) ($ 20.9) ($ 0.42)
Average Diluted Shares 49.4
35
First Quarter 2004
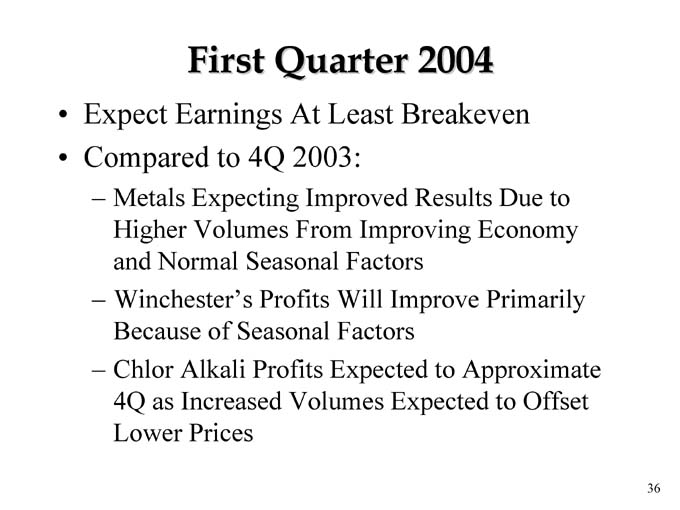
• Expect Earnings At Least Breakeven
• Compared to 4Q 2003:
– Metals Expecting Improved Results Due to Higher Volumes From Improving Economy and Normal Seasonal Factors
– Winchester’s Profits Will Improve Primarily Because of Seasonal Factors
– Chlor Alkali Profits Expected to Approximate 4Q as Increased Volumes Expected to Offset Lower Prices
36
Investment Rationale
• Yield @ $16.00 = 5%; @ $18.00 = 4.4%
• Potential for Improved Performance Based On:
– Higher Expected ECU Prices in the Next Several Years
– A Better Economy Is Expected to Improve Metals Results
– Winchester Is a Solid Business and Provides Profits, Cash Flow and Participation in Increased Military Spending
• Strong Financial Discipline to Meet Our Obligations
37

Cap. Ex. and D&A
($ MM)
76
78
1997
78
78
1998
80
73
1999
95
81
2000
87
65
2001
88
41
2002
82
55
2003
75
60
2004 E
Capital Expenditures D&A
38
Investment Rationale
(continued)
• Commitment to Investment Grade Rating
• Projecting Financial Covenant Compliance under Existing Revolver
39
Forward-Looking Statements
This presentation contains estimates of future performance, which are forward-looking statements and results could differ materially from those anticipated in the forward-looking statements. Some of the factors that could cause actual results to differ are described in the business and outlook sections of Olin’s Form 10-K for the year ended December 31, 2002 and in Olin’s Fourth Quarter 2003 Earnings Release. These reports are filed with the U.S. Securities and Exchange Commission.
40

Proud Heritage … Promising Future
41

The Following Slides Are Provided as Background Information and Come Primarily from Previous Presentations. These Slides May or May Not Be Used in the Presentation. In Some Cases, They Are Duplicate Slides From What Was Covered in the Above Slides.
42
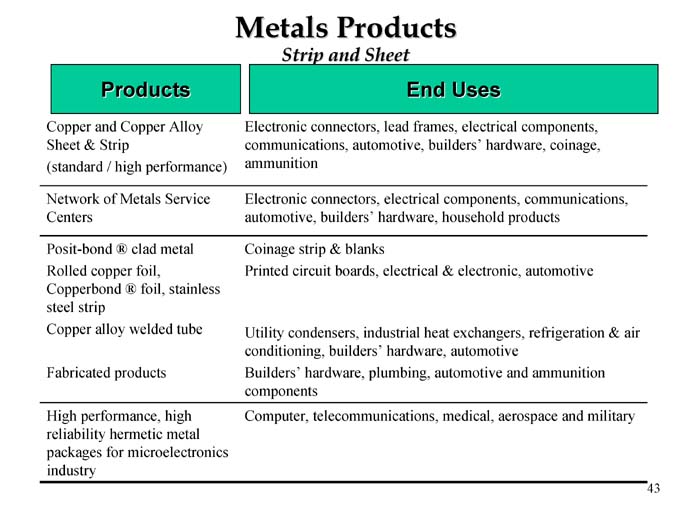
Metals Products
Strip and Sheet
Products
Copper and Copper Alloy Sheet & Strip (standard / high performance)
Network of Metals Service Centers
Posit-bond ® clad metal Rolled copper foil, Copperbond ® foil, stainless steel strip Copper alloy welded tube
Fabricated products
High performance, high reliability hermetic metal packages for microelectronics industry
End Uses
Electronic connectors, lead frames, electrical components, communications, automotive, builders’ hardware, coinage, ammunition
Electronic connectors, electrical components, communications, automotive, builders’ hardware, household products
Coinage strip & blanks
Printed circuit boards, electrical & electronic, automotive
Utility condensers, industrial heat exchangers, refrigeration & air conditioning, builders’ hardware, automotive Builders’ hardware, plumbing, automotive and ammunition components
Computer, telecommunications, medical, aerospace and military
43
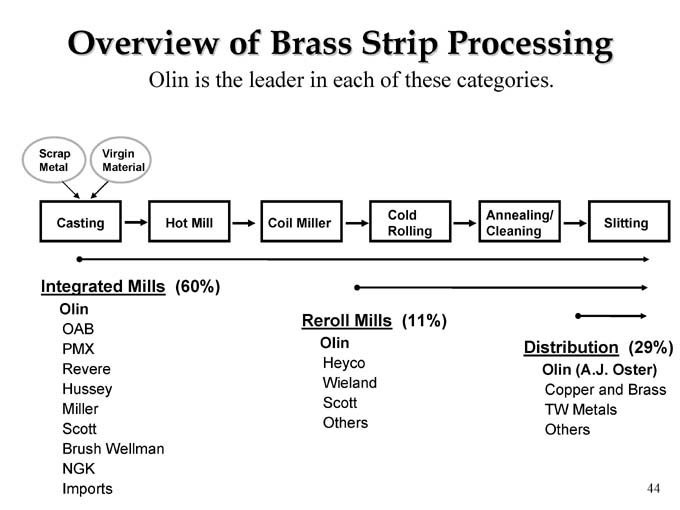
Overview of Brass Strip Processing
Olin is the leader in each of these categories.
Scrap Metal
Virgin Material
Casting
Hot Mill
Coil Miller
Cold Rolling
Annealing/ Cleaning
Slitting
Integrated Mills (60%)
Olin
OAB
PMX
Revere
Hussey
Miller
Scott
Brush Wellman
NGK
Imports
Reroll Mills (11%)
Olin
Heyco
Wieland
Scott
Others
Distribution (29%)
Olin (A.J. Oster)
Copper and Brass
TW Metals
Others
44

Key Drivers – Brass Strip
• Sensitive to Changes in the Economy
• Changes in Demand for Specific Sectors Affect Olin Performance:
– Automotive
– Computers
– Telecommunications
– Housing
• Coinage Market Is Sensitive to Swings in the Economy
45
Olin Brass Competitive Advantages
• Largest Brass Mill in U.S. Provides Economies of Scale
• Outstanding Manufacturing Capabilities
• More Patents Than Competitors
• Largest Distribution Business in U.S. (A.J. Oster)
• High Performance Alloys and Specialty Products
46
Chase Industries
Chase
• Chase is a Leader in Brass Rod
• Competitive Advantages
Manufacturing Excellence, Low Cost, High Quality
“Blue Dot” Trademark
Leading Market Share
Customer Service Focus
• Leverage to Enhance Long-term Profitability and Return on Investment
• Chase has New Efficient Facilities, Future Cash Flow Potential Since Capital Already Spent
48
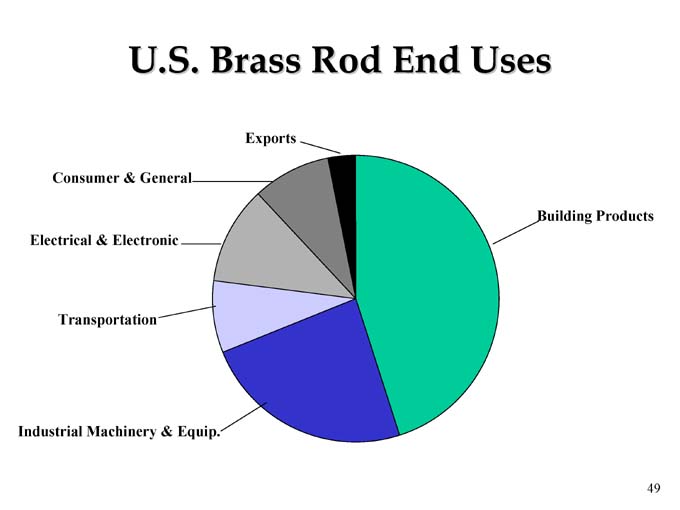
U.S. Brass Rod End Uses
Exports
Consumer & General
Electrical & Electronic
Transportation
Industrial Machinery & Equip.
Building Products
49

Demand Drivers
Building Products
– Housing Starts
– # of Bathrooms – Home
– Intensity of Use
– Product Innovation
– Average Age of Homes
– Existing Home Sales
– Low Mortgage Rates
Industrial Machinery & Equipment
– GDP
– Industrial Production
Transportation
– US Auto Sales
– Class Eight Truck Sales
Consumer & General Products / Electrical & Electronics
– CPI
– Consumer Spending
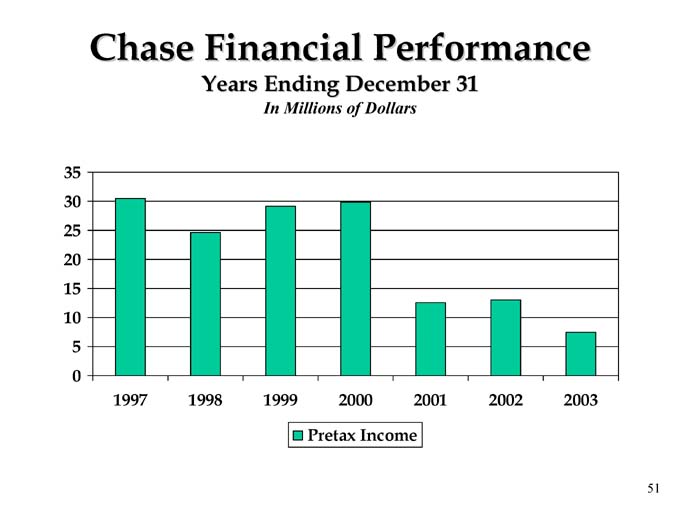
Chase Financial Performance
Years Ending December 31
In Millions of Dollars
1997 1998 1999 2000 2001 2002 2003
Pretax Income
51
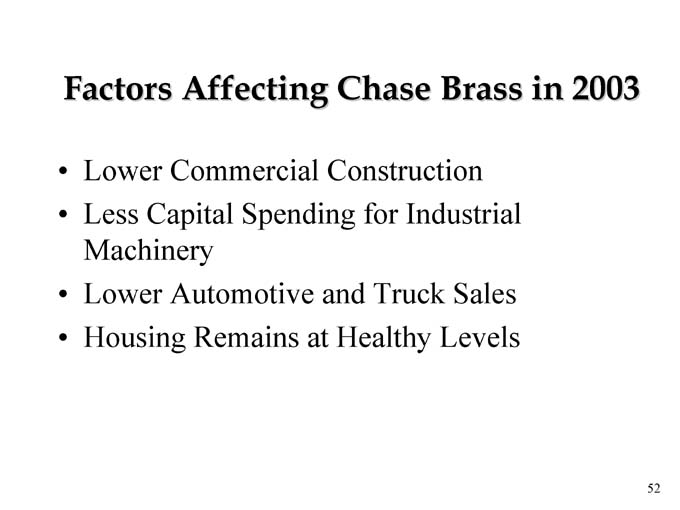
Factors Affecting Chase Brass in 2003
• Lower Commercial Construction
• Less Capital Spending for Industrial Machinery
• Lower Automotive and Truck Sales
• Housing Remains at Healthy Levels
52
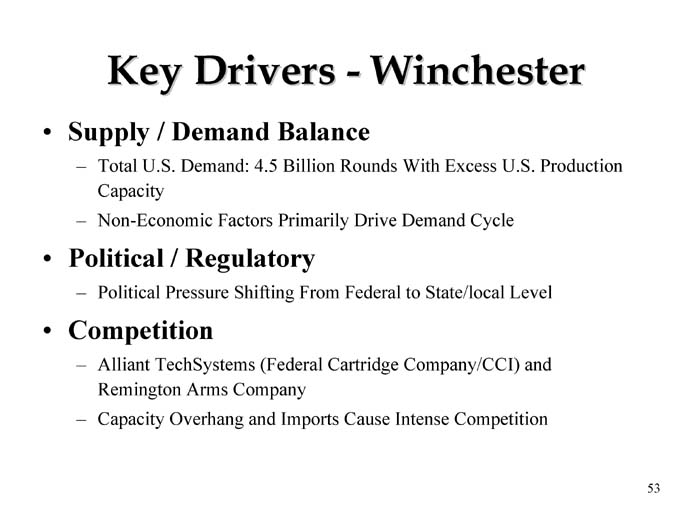
Key Drivers—Winchester
• Supply / Demand Balance
– Total U.S. Demand: 4.5 Billion Rounds With Excess U.S. Production Capacity
– Non-Economic Factors Primarily Drive Demand Cycle
• Political / Regulatory
– Political Pressure Shifting From Federal to State/local Level
• Competition
– Alliant TechSystems (Federal Cartridge Company/CCI) and Remington Arms Company
– Capacity Overhang and Imports Cause Intense Competition
53
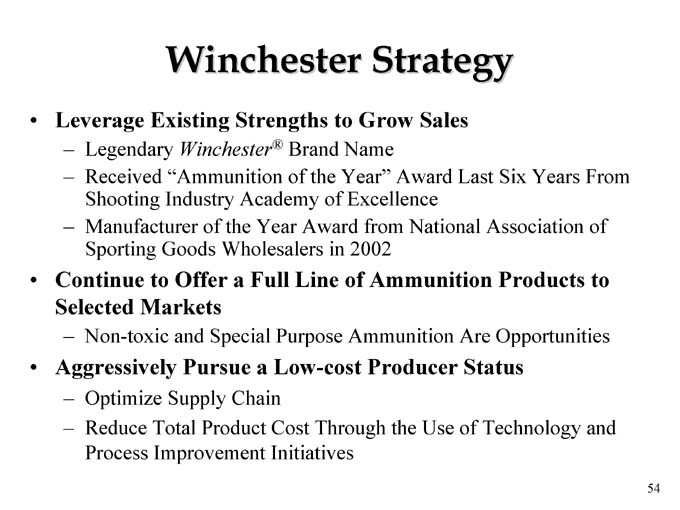
Winchester Strategy
• Leverage Existing Strengths to Grow Sales
– Legendary Winchester® Brand Name
– Received “Ammunition of the Year” Award Last Six Years From Shooting Industry Academy of Excellence
– Manufacturer of the Year Award from National Association of Sporting Goods Wholesalers in 2002
• Continue to Offer a Full Line of Ammunition Products to Selected Markets
– Non-toxic and Special Purpose Ammunition Are Opportunities
• Aggressively Pursue a Low-cost Producer Status
– Optimize Supply Chain
– Reduce Total Product Cost Through the Use of Technology and Process Improvement Initiatives
54
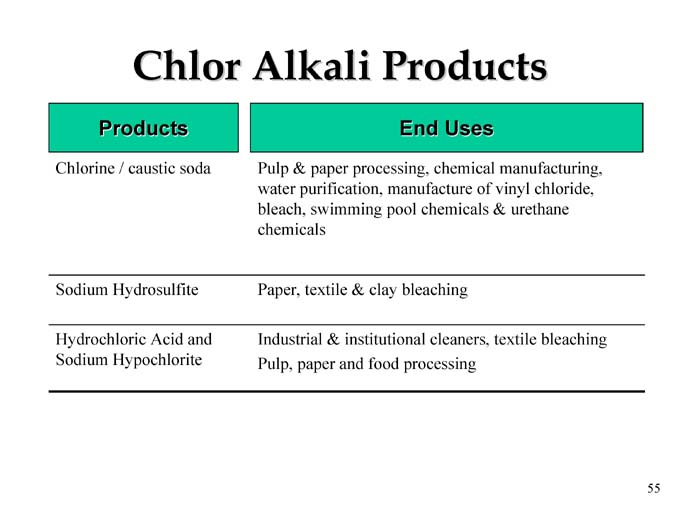
Chlor Alkali Products
Products
Chlorine / caustic soda
Sodium Hydrosulfite
Hydrochloric Acid and Sodium Hypochlorite
End Uses
Pulp & paper processing, chemical manufacturing, water purification, manufacture of vinyl chloride, bleach, swimming pool chemicals & urethane chemicals
Paper, textile & clay bleaching
Industrial & institutional cleaners, textile bleaching Pulp, paper and food processing
55
Chlor Alkali Products
• Chlorine and Caustic Soda Are Co-Products of Salt Electrolysis
• The Production of 1 Ton of Chlorine Results in 1.1 Tons of Caustic Soda
• Together the Two Chemicals Are Called an Electrochemical Unit “ECU”
• Supply / Demand Determine Pricing in This Commodity Business
56
Key Drivers – Chlor Alkali
• Chlorine/caustic Demand Driven by General Economic Conditions
• PVC Is the Largest End-use Market for Chlorine, and Pulp and Paper Is Largest Caustic Market
• Manufacturing Cost Heavily Dependent on Energy (Natural Gas)
• No North American Chlor Alkali Producers Have Announced “Significant” Net Capacity Additions, It Requires 24-36 Months to Build New Capacity
• Reduction of Capacity (~12%) since 2000 Due to Temporary and Permanent Plant Closures
57
Chlor Alkali Products Competitive Advantages / Strategies
• Olin’s Electricity Costs Have Been Relatively Stable Over Time Because We Purchase Electricity From Utilities That Are Primarily Coal, Nuclear and Hydro-Power Based
• Olin’s Sunbelt Joint Venture Has Low Manufacturing Costs Due to Membrane Technology and Low Power Costs
• Olin’s Southeastern U.S. Plants Are Relatively Close to Their Caustic Customers
58
Chlor Alkali Products Competitive Advantages / Strategies
• Focus on Being the Preferred Supplier to the Merchant Chlor Alkali Market
• Continue Our Partnership Philosophy With Our Customers
• Continue to Drive Cost Improvements Through Manufacturing and Logistics Optimization
• Significant Opportunities to Increase the Value of the Business at Modest Capital Cost
• Be a Strong Cash Generator and Value Enhancer to Olin Corporation
59
Why Olin’s ECU Netbacks Differ from Other Chlor Alkali Producers
• Methodologies and Definitions May Differ Among Producers
• Pricing to Customers Can Vary Depending on Customer End Use and Location and Method of Shipment (Pipeline, Railcar, Truck, Barge, Terminal)
• Delivered Price – Freight = Netback
• Contractual Terms: Escalation Provisions, and Duration of Contracts. These Will Change Over Time Due to Market Conditions
60
Olin’s Chlor Alkali System
• Olin Contracts Nearly 100% of Its Chlorine and Caustic Sales
• On About Two-Thirds of the Chlorine Volume and One-Third of the Caustic Volume, Prices Change Quarterly, with a Combination of Formula-based and Negotiated Pricing
• Many Contracts Have a One Quarter Lag in Them, Which Delays Price Increases in a Tightening Market, But Helps in a Softening Market
• Competitive Forces Dictate Contract Duration and Terms
61
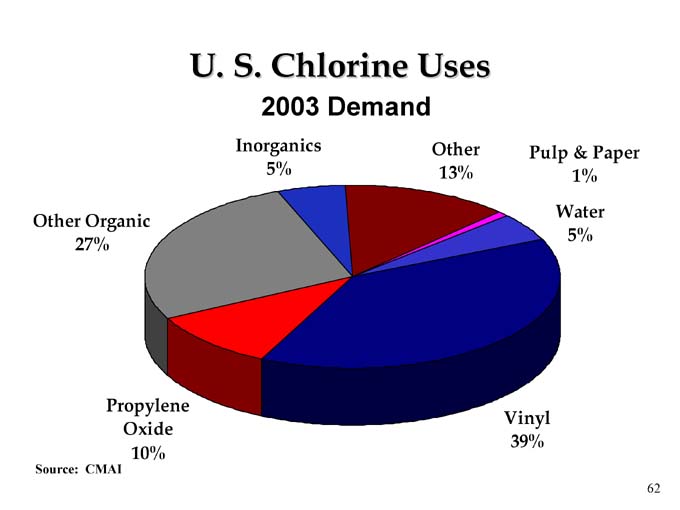
U. S. Chlorine Uses
2003 Demand
Inorganics 5%
Other 13%
Pulp & Paper 1%
Water 5%
Vinyl 39%
Propylene Oxide 10%
Other Organic 27%
Source: CMAI
62
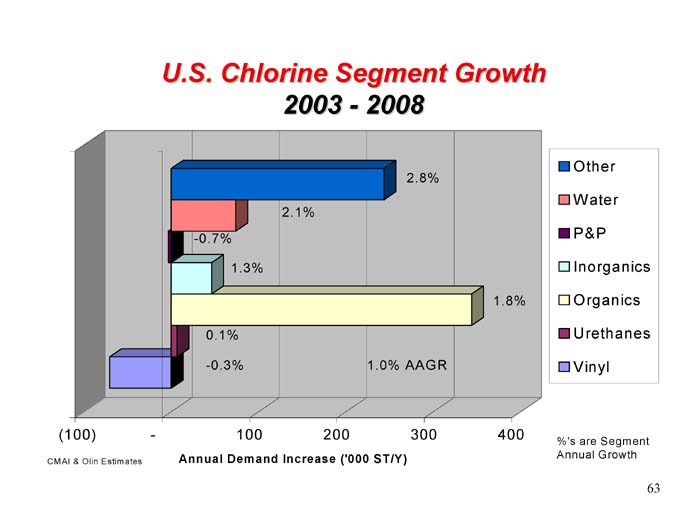
U.S. Chlorine Segment Growth 2003—2008
2.8%
Other
2.1%
Water
-0.7%
P&P
1.3%
Inorganics
1.8%
Organics
0.1%
Urethanes
-0.3%
Vinyl
1.0%
AAGR
%’s are Segment Annual Growth
CMAI & Olin Estimates
Annual Demand Increase (‘000 ST/Y)
63
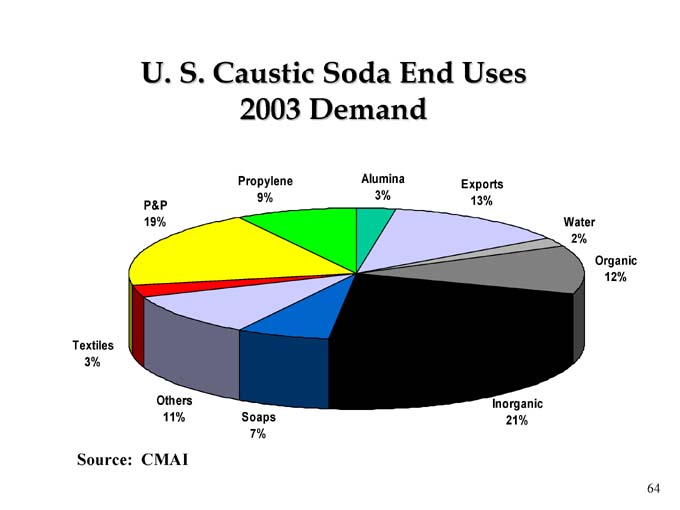
U. S. Caustic Soda End Uses 2003 Demand
P&P 19%
Propylene 9%
Alumina 3%
Exports 13%
Water 2%
Organic 12%
Inorganic 21%
Soaps 7%
Others 11%
Textiles 3%
Source: CMAI
64
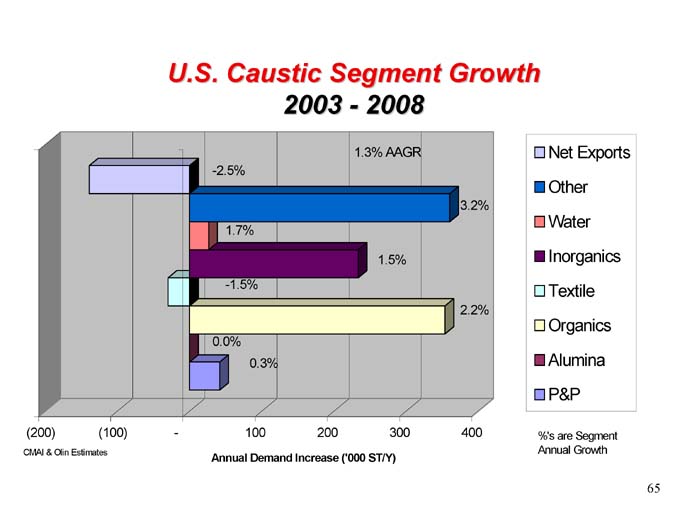
U.S. Caustic Segment Growth 2003—2008
1.3% AAGR
-2.5%
Net Exports
3.2%
Other
1.7%
Water
1.5%
Inorganics
-1.5%
Textile
2.2%
Organics
0.0%
Alumina
0.3%
P&P
%’s are Segment Annual Growth
Annual Demand Increase (‘000 ST/Y)
CMAI & Olin Estimates
65
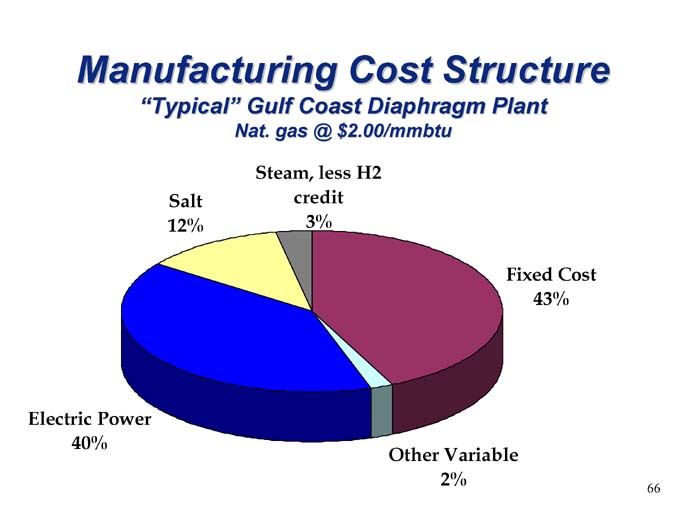
Manufacturing Cost Structure
“Typical” Gulf Coast Diaphragm Plant
Nat. gas @ $2.00/mmbtu
Steam, less H2 credit 3%
Salt 12%
Electric Power 40%
Other Variable 2%
Fixed Cost 43%
66
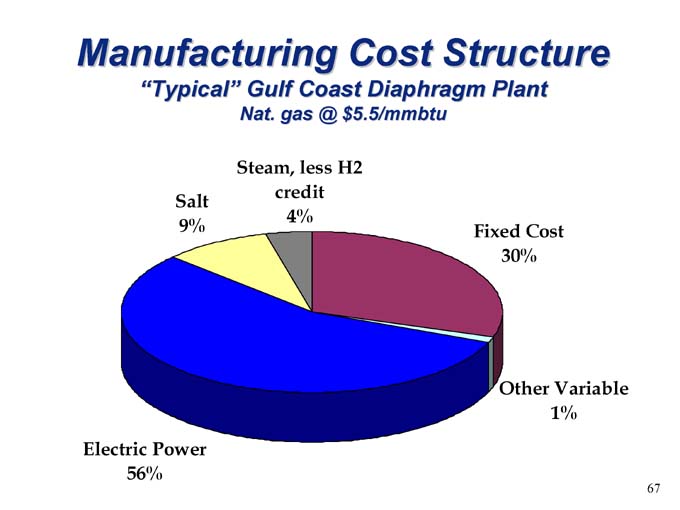
Manufacturing Cost Structure
“Typical” Gulf Coast Diaphragm Plant
Nat. gas @ $5.5/mmbtu
Steam, less H2 credit 4%
Salt 9%
Electric Power 56%
Fixed Cost 30%
Other Variable 1%
67
The Next Slides Provide the Same Information Provided on the Profit Summary Exhibit to Olin’s January 29, 2004 Earnings Release and Reconciles Reported and Adjusted Earnings
68
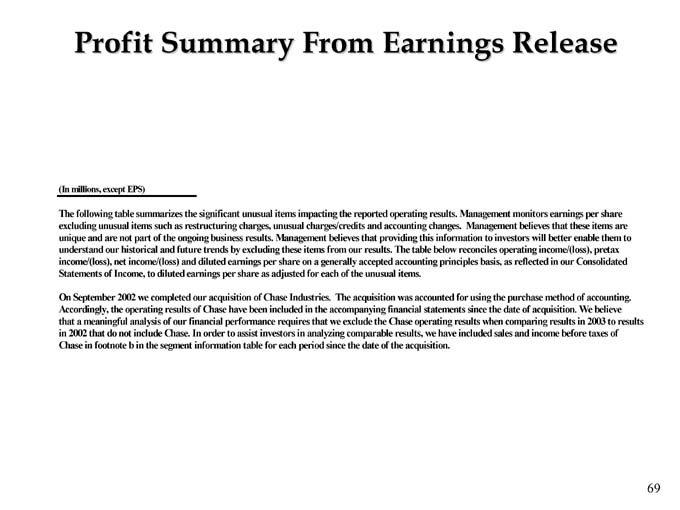
Profit Summary From Earnings Release
(In millions, except EPS)
The following table summarizes the significant unusual items impacting the reported operating results. Management monitors earnings per share excluding unusual items such as restructuring charges, unusual charges/credits and accounting changes. Management believes that these items are unique and are not part of the ongoing business results. Management believes that providing this information to investors will better enable them to understand our historical and future trends by excluding these items from our results. The table below reconciles operating income/(loss), pretax income/(loss), net income/(loss) and diluted earnings per share on a generally accepted accounting principles basis, as reflected in our Consolidated Statements of Income, to diluted earnings per share as adjusted for each of the unusual items.
On September 2002 we completed our acquisition of Chase Industries. The acquisition was accounted for using the purchase method of accounting. Accordingly, the operating results of Chase have been included in the accompanying financial statements since the date of acquisition. We believe that a meaningful analysis of our financial performance requires that we exclude the Chase operating results when comparing results in 2003 to results in 2002 that do not include Chase. In order to assist investors in analyzing comparable results, we have included sales and income before taxes of Chase in footnote b in the segment information table for each period since the date of the acquisition.
69
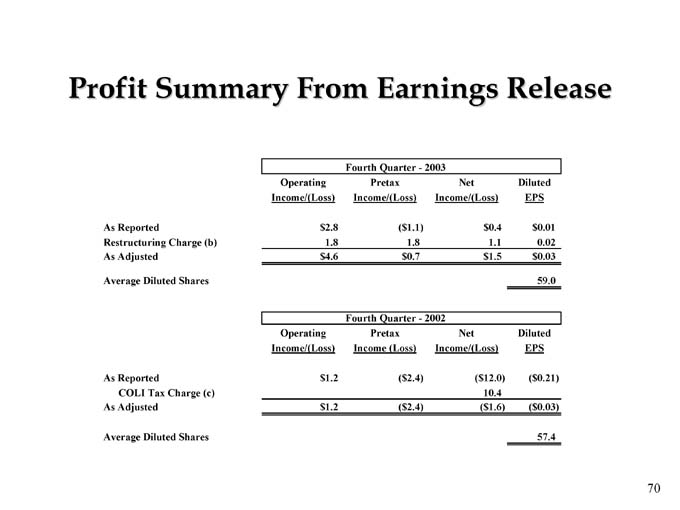
Profit Summary From Earnings Release
Fourth Quarter—2003
Operating Pretax Net Diluted
Income/(Loss) Income/(Loss) Income/(Loss) EPS
As Reported $ 2.8 ($ 1.1) $0.4 $ 0.01
Restructuring Charge (b) 1.8 1.8 1.1 0.02
As Adjusted $ 4.6 $ 0.7 $1.5 $ 0.03
Average Diluted Shares 59.0
Fourth Quarter—2002
Operating Pretax Net Diluted
Income/(Loss) Income (Loss) Income/(Loss) EPS
As Reported $ 1.2 ($ 2.4) ($ 12.0) ($ 0.21)
COLI Tax Charge (c) 10.4
As Adjusted $ 1.2 ($ 2.4) ( $1.6) ($ 0.03)
Average Diluted Shares 57.4
70

Profit Summary From Earnings Release
Full Year—2003
Operating Pretax Net Diluted
Income/(Loss) Income/(Loss) Income/(Loss) EPS
As Reported $ 21.8 $ 5.5 ($ 24.1) ($ 0.42)
Accounting Change (d) - - 25.4 0.44
Restructuring Charge (b) 30.8 30.8 19.8 0.34
As Adjusted $ 52.6 $ 36.3 $ 21.1 $ 0.36
Average Diluted Shares 58.3
Full Year—2002
Operating Pretax Net Diluted
Income/(Loss) Income (Loss) Income/(Loss) EPS
As Reported ($ 7.2) ($ 27.0) ($ 31.3) ($ 0.63)
COLI Tax Charge (c) - - 10.4
As Adjusted ($ 7.2) ($ 27.0) ($ 20.9) ($ 0.42)
Average Diluted Shares 49.4
71
Profit Summary From Earnings Release
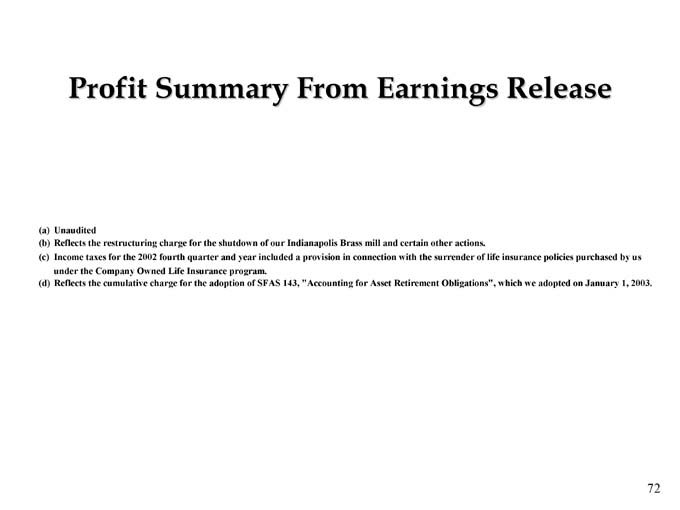
(a) Unaudited
(b) Reflects the restructuring charge for the shutdown of our Indianapolis Brass mill and certain other actions.
(c) Income taxes for the 2002 fourth quarter and year included a provision in connection with the surrender of life insurance policies purchased by us under the Company Owned Life Insurance program.
(d) Reflects the cumulative charge for the adoption of SFAS 143, “Accounting for Asset Retirement Obligations”, which we adopted on January 1, 2003.
72
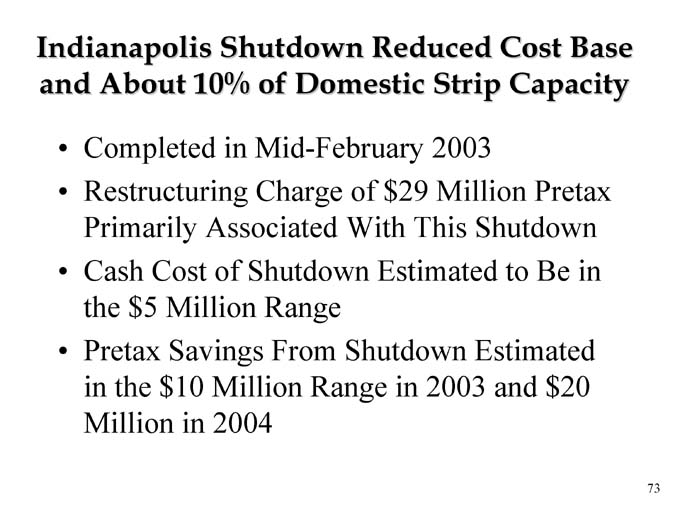
Indianapolis Shutdown Reduced Cost Base and About 10% of Domestic Strip Capacity
• Completed in Mid-February 2003
• Restructuring Charge of $29 Million Pretax Primarily Associated With This Shutdown
• Cash Cost of Shutdown Estimated to Be in the $5 Million Range
• Pretax Savings From Shutdown Estimated in the $10 Million Range in 2003 and $20 Million in 2004
73
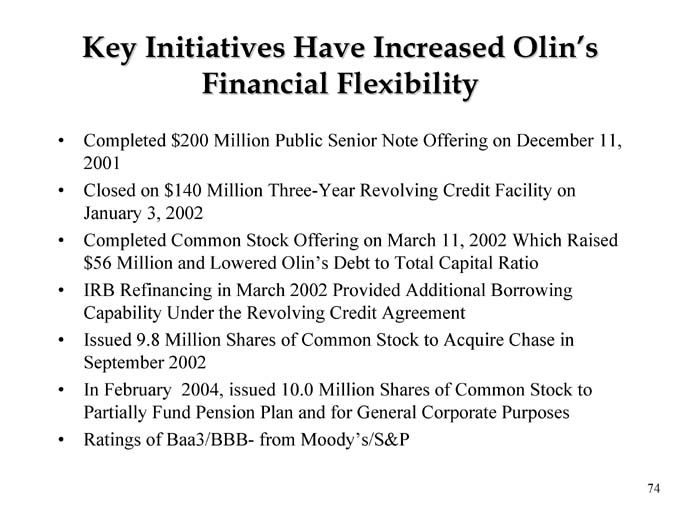
Key Initiatives Have Increased Olin’s Financial Flexibility
• Completed $200 Million Public Senior Note Offering on December 11, 2001
• Closed on $140 Million Three-Year Revolving Credit Facility on January 3, 2002
• Completed Common Stock Offering on March 11, 2002 Which Raised $56 Million and Lowered Olin’s Debt to Total Capital Ratio
• IRB Refinancing in March 2002 Provided Additional Borrowing Capability Under the Revolving Credit Agreement
• Issued 9.8 Million Shares of Common Stock to Acquire Chase in September 2002
• In February 2004, issued 10.0 Million Shares of Common Stock to Partially Fund Pension Plan and for General Corporate Purposes
• Ratings of Baa3/BBB- from Moody’s/S&P
74
Financial Policies and Objectives
• Commitment to Maximizing Total Return to Shareholders (TRS) Over the Long Run
• Commitment to Lower Cost Structure
– Targeted Headcount Reductions
– Optimized Manufacturing
– Reduced Capital Spending
• Commitment to Investment Grade Rating
• Commitment to Maximizing Return on Capital
• Continually Evaluate the Sale of Non-core Assets
75
Olin’s Demonstrated Shareholder Orientation
• Compensation System Assures Alignment With Shareholder Interests
– Long Term Incentive Plan is 100% Stock Options and Performance Shares
– Senior Management Compensation Highly Oriented to Stock Performance
– Stock Ownership Guidelines for Senior Management
– Board of Directors Substantially Paid in Stock
76
FORWARD-LOOKING STATEMENTS
This communication includes forward-looking statements within the meaning of the Private Securities Litigation Reform Act of 1995. These statements relate to analyses and other information that are based on management’s beliefs, certain assumptions made by management, forecasts of future results, and current expectations, estimates and projections about the markets and economy in which we and our various segments operate. The statements contained in this communication that are not statements of historical fact may include forward-looking statements that involve a number of risks and uncertainties.
We have used the words “anticipate,” “intend,” “may,” “expect,” “believe,” “should,” “plan,” “will,” “estimate,” and variations of such words and similar expressions in this communication to identify such forward-looking statements. These statements are not guarantees of future performance and involve certain risks, uncertainties and assumptions, which are difficult to predict and many of which are beyond our control. Therefore, actual outcomes and results may differ materially from those matters expressed or implied in such forward-looking statements. We undertake no obligation to update publicly any forward-looking statements, whether as a result of future events, new information or otherwise. Relative to the dividend, the payment of cash dividends is subject to the discretion of our Board of Directors and will be determined in light of then-current conditions, including our earnings, our operations, our financial conditions, our capital requirements and other factors deemed relevant by our Board of Directors. In the future, our Board of Directors may change our dividend policy, including the frequency or amount of any dividend, in light of then-existing conditions.
The risks, uncertainties and assumptions involved in our forward-looking statements, many of which are discussed in more detail in our filings with the SEC, including our Annual Report on Form 10-K for the year ended December 31, 2002, include, but are not limited to, the following,:
| • | sensitivity to economic, business and market conditions in the United States and overseas, including economic instability or a downturn in the sectors served by us, such as automotive, electronics, coinage, telecommunications, ammunition, housing, vinyls and pulp and paper; |
| • | extraordinary events, such as additional terrorist attacks or war with one or more countries; |
| • | continued or additional economic and industry downturns that result in diminished product demand and excess manufacturing capacity in any of our segments and that, in many cases, result in lower selling prices and profits; |
| • | the cyclical nature of our operating results, particularly declines in average selling prices in the chlor alkali industry and the supply/demand balance for our products, including the impact of excess industry capacity or an imbalance in demand for our chlor alkali products; |
| • | an increase in our indebtedness or higher-than-expected interest rates, affecting our ability to generate sufficient cash flow for debt service; |
| • | unforeseen effects of competition, including the migration by United States customers to low-cost foreign locations; |
| • | costs and other expenditures in excess of those projected for environmental investigation and remediation or other legal proceedings; |
| • | unexpected litigation outcomes or the impact of changes in laws and regulations; |
| • | higher-than-expected raw material and utility or transportation and/or logistics costs; |
| • | the occurrence of unexpected manufacturing interruptions and outages, including those occurring as a result of production hazards; |
| • | unexpected additional taxes and related interest as the result of pending income tax audits; and |
| • | the effects of any declines in global equity markets on asset values and any declines in interest rates used to value the liabilities in our pension plan. |
All of our forward-looking statements should be considered in light of these factors. In addition, other risks and uncertainties not presently known to us or that we consider immaterial could affect the accuracy of our forward-looking statements.