Exhibit 99.1
Presentation on the
North America Chlor Alkali Industry
Prepared for
UBS Warburg
Grass Roots Chemical Conference
New Orleans, LA
February 16, 2005
By
John L. McIntosh
President, Chlor Alkali Products
Olin Corporation
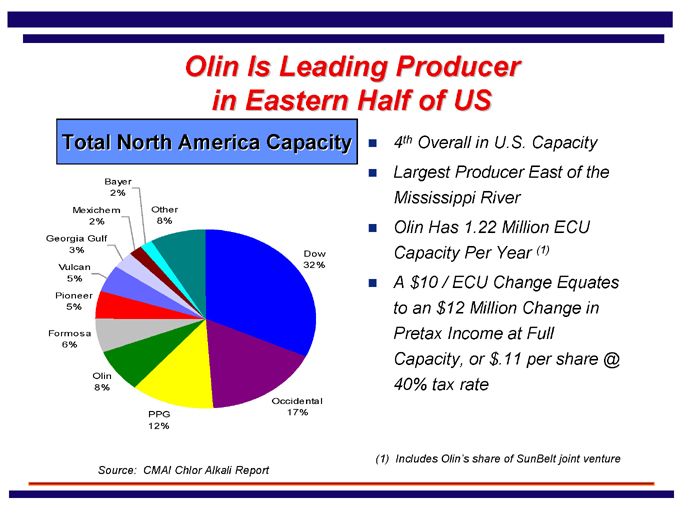
Olin Is Leading Producer
in Eastern Half of US
Source: CMAI Chlor Alkali Report
4th Overall in U.S. Capacity
Largest Producer East of the Mississippi River
Olin Has 1.22 Million ECU Capacity Per Year (1)
A $10 / ECU Change Equates to an $12 Million Change in Pretax Income at Full Capacity, or $.11 per share @ 40% tax rate
(1) Includes Olin’s share of SunBelt joint venture
Total North America Capacity
Bayer 2%
Other 8%
Dow 32%
Occidental 17%
PPG 12%
Olin 8%
Formosa 6%
Pioneer 5%
Vulcan 5%
Georgia Gulf 3%
Mexichem 2%
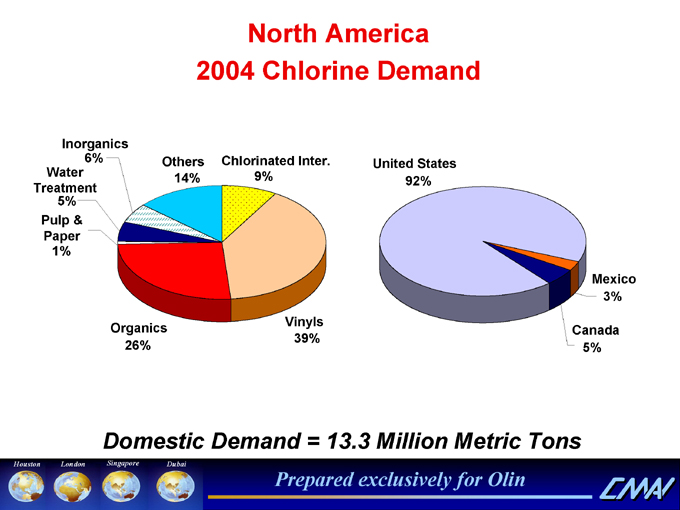
North America
2004 Chlorine Demand
United States 92%
Domestic Demand = 13.3 Million Metric Tons
Inorganics 6%
Others 14%
Chlorinated Inter.
9%
Vinyls 39%
Organics 26%
Pulp & Paper 1%
Water Treatment 5%
Mexico 3%
Canada 5%
Houston London Singapore Dubai
Prepared exclusively for Olin
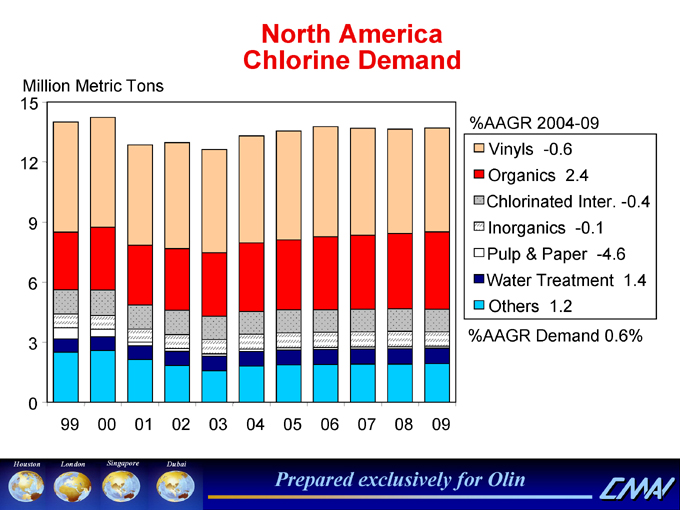
North America
Chlorine Demand
Million Metric Tons
15 12 9 6 3 0
99 00 01 02 03 04 05 06 07 08 09
Houston London Singapore Dubai
Prepared exclusively for Olin
%AAGR 2004-09
Vinyls -0.6
Organics 2.4
Chlorinated Inter. -0.4
Inorganics -0.1
Pulp & Paper -4.6
Water Treatment 1.4
Others 1.2
%AAGR Demand 0.6%
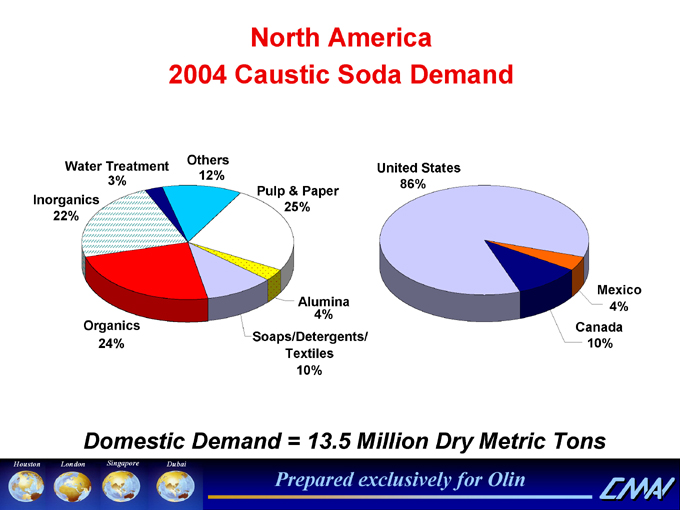
North America
2004 Caustic Soda Demand
Others 12%
Water Treatment 3%
United States 86%
Pulp & Paper 25%
Inorganics 22%
Alumina 4%
Mexico 4%
Organics 24%
Soaps/Detergents/Textiles 10%
Canada 10%
Domestic Demand = 13.5 Million Dry Metric Tons
Houston London Singapore Dubai
Prepared exclusively for Olin
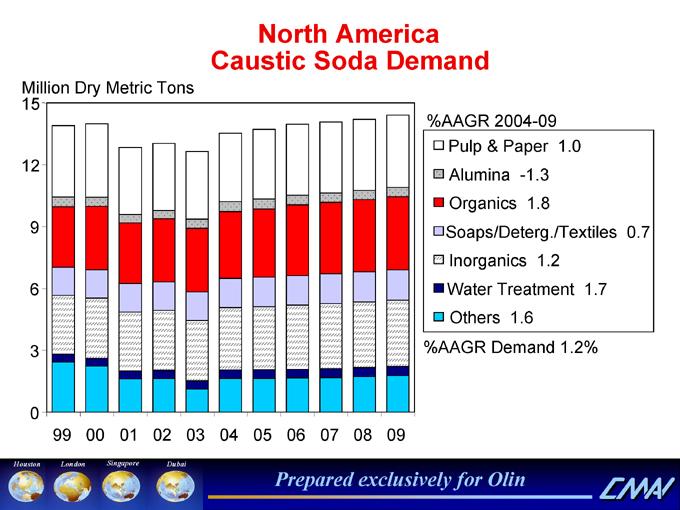
North America
Caustic Soda Demand
Million Dry Metric Tons
%AAGR 2004-09
Pulp & Paper 1.0
Alumina -1.3
Organics 1.8
Soaps/Deterg./Textiles 0.7 Inorganics 1.2
Water Treatment 1.7 Others 1.6
%AAGR Demand 1.2%
15 12 9 6 3 0
99 00 01 02 03 04 05 06 07 08 09
Houston London Singapore Dubai
Prepared exclusively for Olin
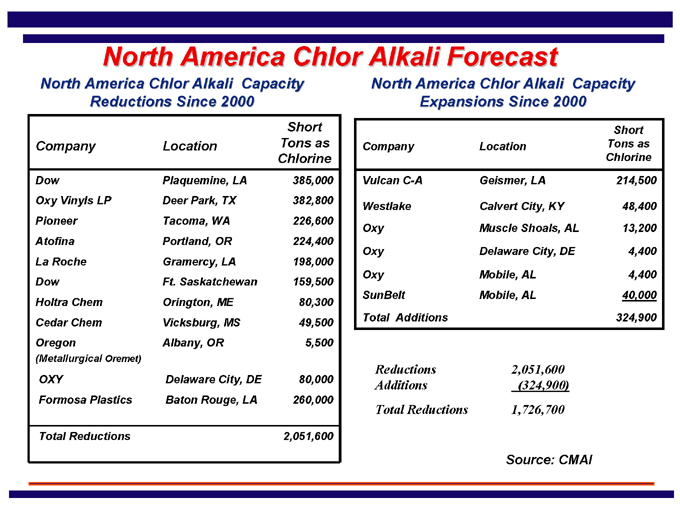
North America Chlor Alkali Forecast
North America Chlor Alkali Capacity Expansions Since 2000
Company Location Short Tons as Chlorine
Vulcan C-A Geismer, LA 214,500
Westlake Calvert City, KY 48,400
Oxy Muscle Shoals, AL 13,200
Oxy Delaware City, DE 4,400
Oxy Mobile, AL 4,400
SunBelt Mobile, AL 40,000
Total Additions 324,900
Reductions 2,051,600
Additions (324,900)
Total Reductions 1,726,700
Source: CMAI
North America Chlor Alkali Capacity
Reductions Since 2000
Company Location Short Tons as Chlorine
Dow Plaquemine, LA 385,000
Oxy Vinyls LP Deer Park, TX 382,800
Pioneer Tacoma, WA 226,600
Atofina Portland, OR 224,400
La Roche Gramercy, LA 198,000
Dow Ft. Saskatchewan 159,500
Holtra Chem Orington, ME 80,300
Cedar Chem Vicksburg, MS 49,500
Oregon Albany, OR 5,500
(Metallurgical Oremet)
OXY Delaware City, DE 80,000
Formosa Plastics Baton Rouge, LA 260,000
Total Reductions 2,051,600
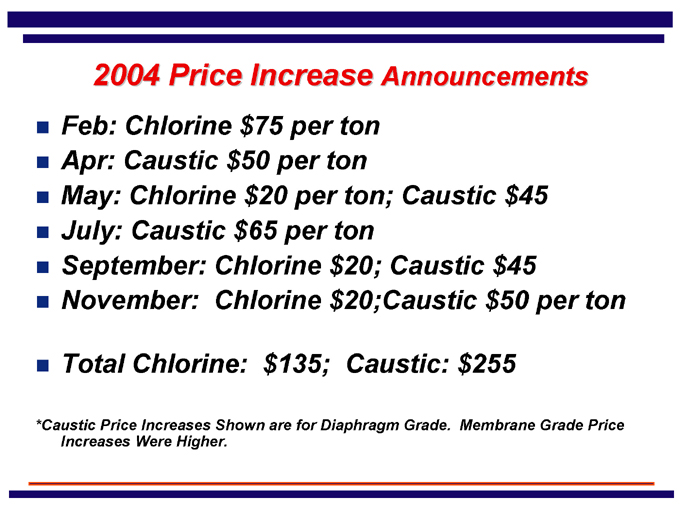
2004 Price Increase Announcements
Feb: Chlorine $75 per ton
Apr: Caustic $50 per ton
May: Chlorine $20 per ton; Caustic $45
July: Caustic $65 per ton
September: Chlorine $20; Caustic $45
November: Chlorine $20;Caustic $50 per ton
Total Chlorine: $135; Caustic: $255
*Caustic Price Increases Shown are for Diaphragm Grade. Membrane Grade Price Increases Were Higher.
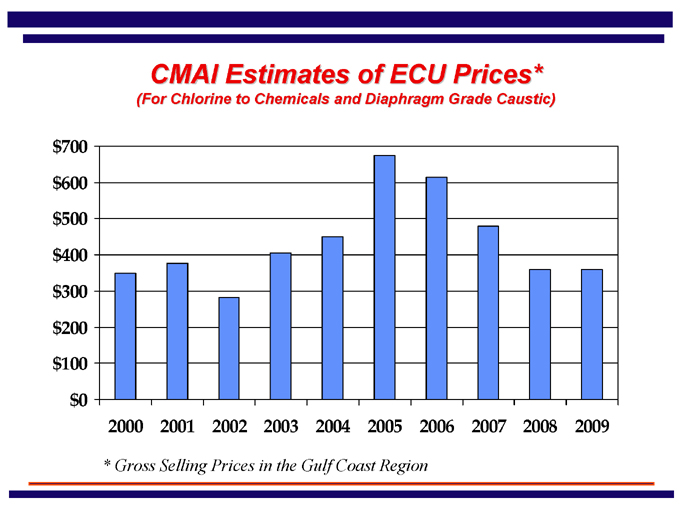
CMAI Estimates of ECU Prices*
(For Chlorine to Chemicals and Diaphragm Grade Caustic)
$700 $600 $500 $400 $300 $200 $100 $0
* Gross Selling Prices in the Gulf Coast Region
2000 2001 2002 2003 2004 2005 2006 2007 2008 2009
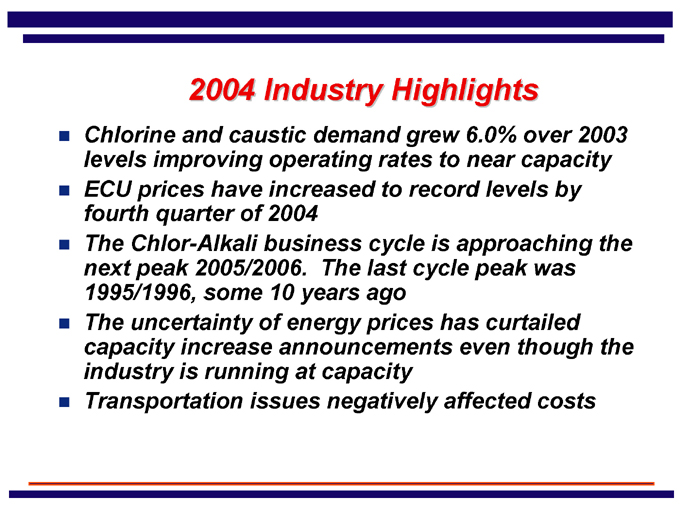
2004 Industry Highlights
Chlorine and caustic demand grew 6.0% over 2003 levels improving operating rates to near capacity
ECU prices have increased to record levels by fourth quarter of 2004
The Chlor-Alkali business cycle is approaching the next peak 2005/2006. The last cycle peak was 1995/1996, some 10 years ago
The uncertainty of energy prices has curtailed capacity increase announcements even though the industry is running at capacity
Transportation issues negatively affected costs
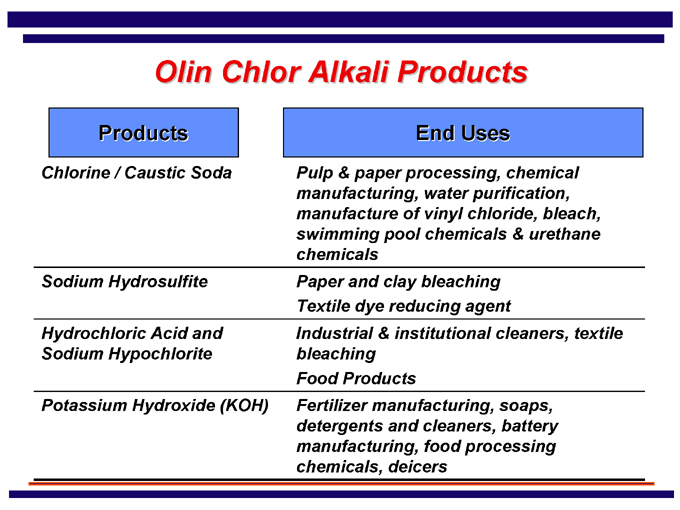
Olin Chlor Alkali Products
Products End Uses
Chlorine / Caustic Soda
Pulp & paper processing, chemical manufacturing, water purification, manufacture of vinyl chloride, bleach, swimming pool chemicals & urethane chemicals
Sodium Hydrosulfite
Paper and clay bleaching Textile dye reducing agent
Hydrochloric Acid and Sodium Hypochlorite
Industrial & institutional cleaners, textile bleaching Food Products
Potassium Hydroxide (KOH)
Fertilizer manufacturing, soaps, detergents and cleaners, battery manufacturing, food processing chemicals, deicers
Impact Of High Chlorine Prices On
Chlor Alkali Profitability
Chlorine Buyers are Highly Concentrated
Some Large Chlorine Buyers Have Contractual Caps and /or Discounts Which Dampen Impact of Price Increases at High End of Contract Range
Chlorine Contracts are Multi-Year and Recognize Cycle Pricing Trends
Olin Has Been Able to Increase Chlorine Selling Prices Above Our Historical Highs
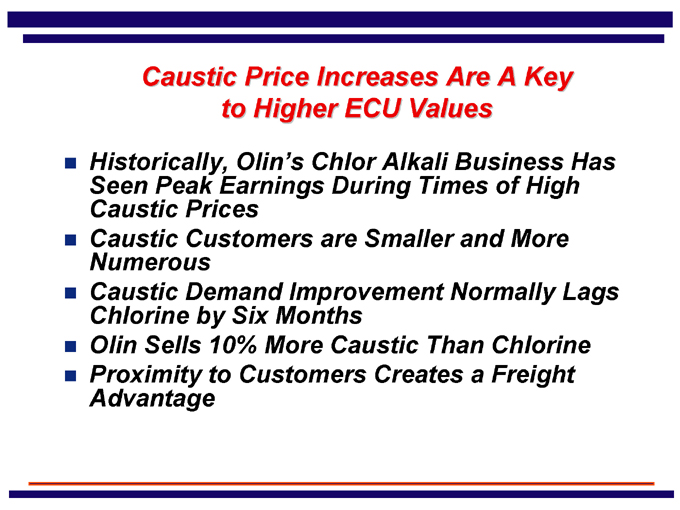
Caustic Price Increases Are A Key
to Higher ECU Values
Historically, Olin’s Chlor Alkali Business Has Seen Peak Earnings During Times of High Caustic Prices
Caustic Customers are Smaller and More Numerous
Caustic Demand Improvement Normally Lags Chlorine by Six Months
Olin Sells 10% More Caustic Than Chlorine
Proximity to Customers Creates a Freight Advantage
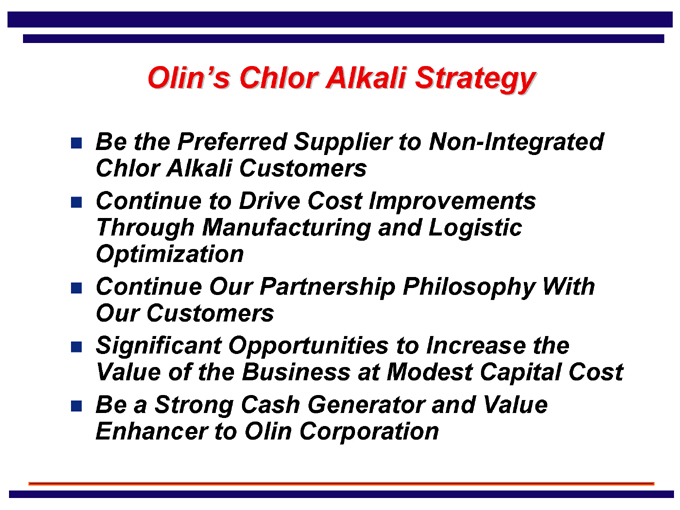
Olin’s Chlor Alkali Strategy
Be the Preferred Supplier to Non-Integrated Chlor Alkali Customers
Continue to Drive Cost Improvements Through Manufacturing and Logistic Optimization
Continue Our Partnership Philosophy With Our Customers
Significant Opportunities to Increase the Value of the Business at Modest Capital Cost
Be a Strong Cash Generator and Value Enhancer to Olin Corporation

Cautionary Language
This presentation includes estimates of future performance. These are forward-looking statements and results could differ materially from those projected. Some of the factors that could cause actual results to differ are described in the outlook section of our most recent 10-K and 10-Q, and our fourth quarter 2004 earnings release.