Exhibit 99.1
Fulcrum Global Partners New York City
May 19, 2005
1

Attending Today
Joseph D. Rupp – President and Chief Executive Officer
John E. Fischer – VP Finance and Controller
John L. McIntosh – President, Chlor Alkali Products
Richard E. Koch – Vice President, Investor Relations and Public Affairs
2
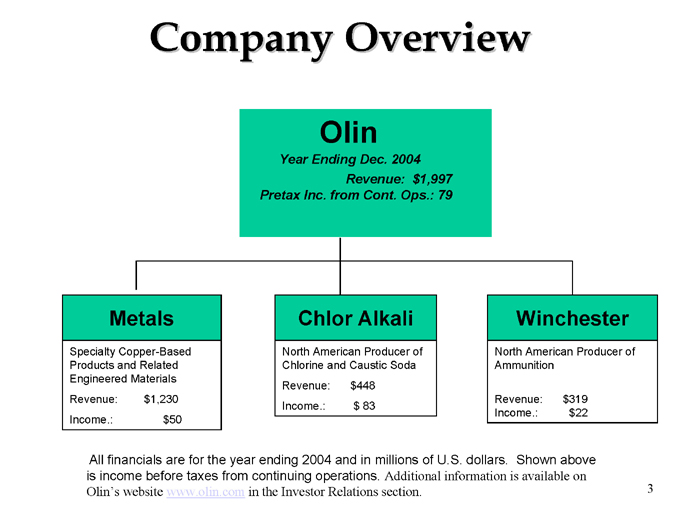
Company Overview Olin Year Ending Dec. 2004 Revenue: $1,997 Pretax Inc. from Cont. Ops.: 79
Metals Specialty Copper-Based Products and Related Engineered Materials Revenue: $1,230 Income.: $50
Chlor Alkali North American Producer of Chlorine and Caustic Soda Revenue: $448 Income.: $ 83
Winchester North American Producer of Ammunition Revenue: $319 Income.: $22
All financials are for the year ending 2004 and in millions of U.S. dollars. Shown above is income before taxes from continuing operations. Additional information is available on Olin’s website www.olin.com in the Investor Relations section.
3
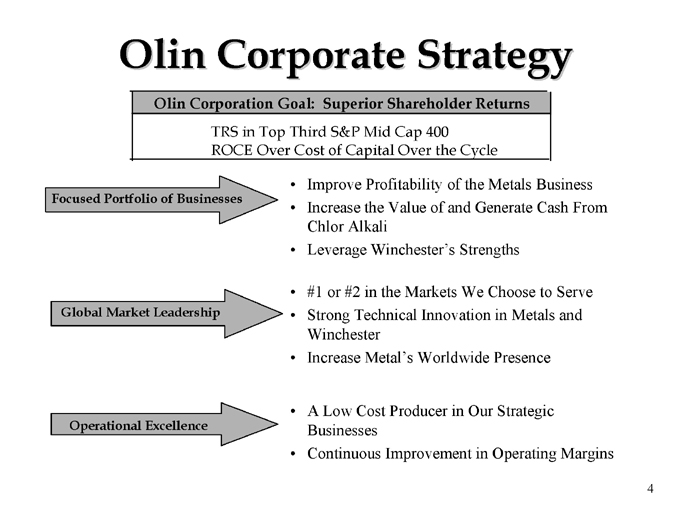
Olin Corporate Strategy
Olin Corporation Goal: Superior Shareholder Returns
TRS in Top Third S&P Mid Cap 400 ROCE Over Cost of Capital Over the Cycle
Focused Portfolio of Businesses Global Market Leadership Operational Excellence
Improve Profitability of the Metals Business Increase the Value of and Generate Cash From Chlor Alkali Leverage Winchester’s Strengths
#1 or #2 in the Markets We Choose to Serve Strong Technical Innovation in Metals and Winchester Increase Metal’s Worldwide Presence
A Low Cost Producer in Our Strategic Businesses Continuous Improvement in Operating Margins
4
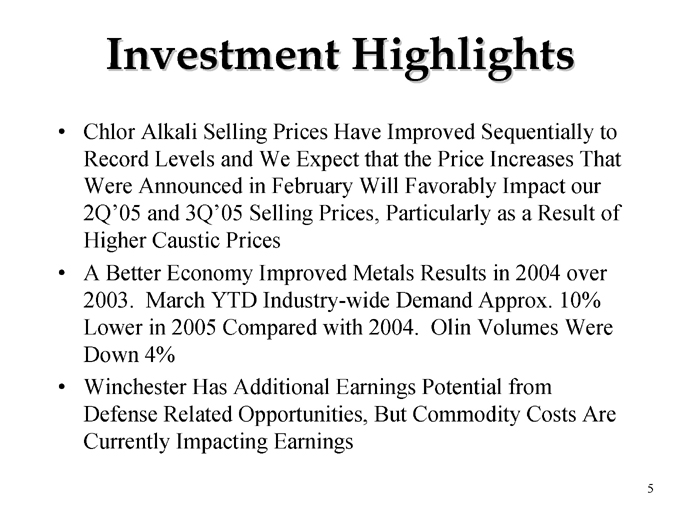
Investment Highlights
Chlor Alkali Selling Prices Have Improved Sequentially to Record Levels and We Expect that the Price Increases That Were Announced in February Will Favorably Impact our 2Q’05 and 3Q’05 Selling Prices, Particularly as a Result of Higher Caustic Prices A Better Economy Improved Metals Results in 2004 over 2003. March YTD Industry-wide Demand Approx. 10% Lower in 2005 Compared with 2004. Olin Volumes Were Down 4% Winchester Has Additional Earnings Potential from Defense Related Opportunities, But Commodity Costs Are Currently Impacting Earnings
5
Olin First Quarter 2005
Reported EPS of $0.52 Per Diluted Share including $0.08 Per Diluted Share Primarily from Real Estate Dispositions and a Tax Benefit Significant Improvement Over 1Q’04
6
Olin’s Second Quarter 2005
On April 28, 2005, Olin Projected Earnings to be in the $0.45 Per Diluted Share Range for 2Q’05 Chlor Alkali Projected to Have Record Earnings in 2Q
This Would Be the Third Consecutive Quarter of Record Earnings
Metals Earnings are Expected to be Lower than 1Q’05 Because of Soft Demand in Most Market Segments Winchester Earnings Expected to Be Lower than 1Q’05 Due to Normal Seasonal Factors and Start-up Costs at Oxford, MS
7
Chlor Alkali Products
1Q’05 vs. 1Q’04
Substantial YOY Profit Improvement
Segment Income Increased from $10.4 Million to $58.6 Million in 1Q’05 Higher Selling Prices Increased our Return on Sales from 10% to 35% in 1Q’05
ROS = Segment Income / Segment Sales
1Q’05 Had Higher Electricity Costs and Slightly Lower Sales Volumes Due to Rail Service Problems and Customer Outages
8
Olin ECU Netbacks
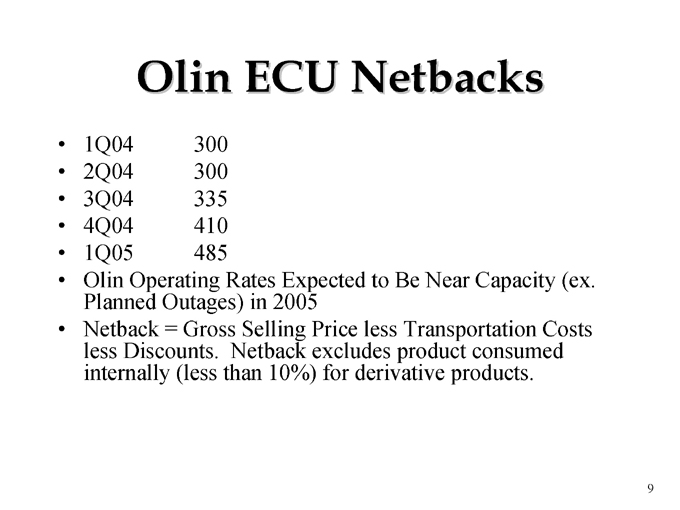
1Q04 300 2Q04 300 3Q04 335 4Q04 410 1Q05 485
Olin Operating Rates Expected to Be Near Capacity (ex. Planned Outages) in 2005 Netback = Gross Selling Price less Transportation Costs less Discounts. Netback excludes product consumed internally (less than 10%) for derivative products.
9
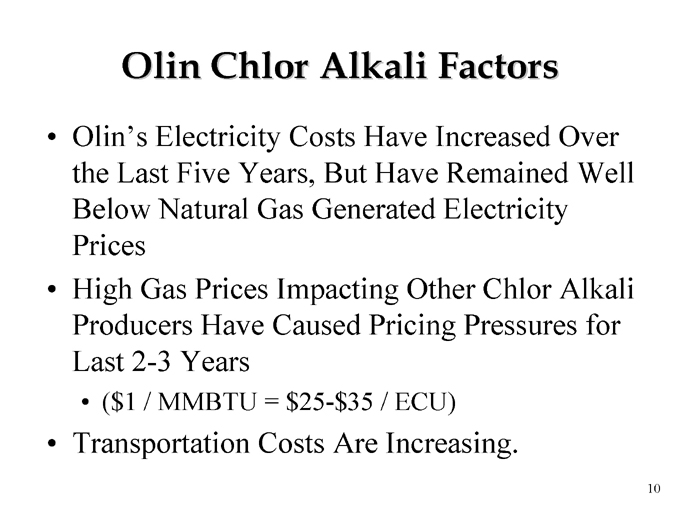
Olin Chlor Alkali Factors
Olin’s Electricity Costs Have Increased Over the Last Five Years, But Have Remained Well Below Natural Gas Generated Electricity Prices High Gas Prices Impacting Other Chlor Alkali Producers Have Caused Pricing Pressures for Last 2-3 Years
($1 / MMBTU = $25-$35 / ECU)
Transportation Costs Are Increasing.
10
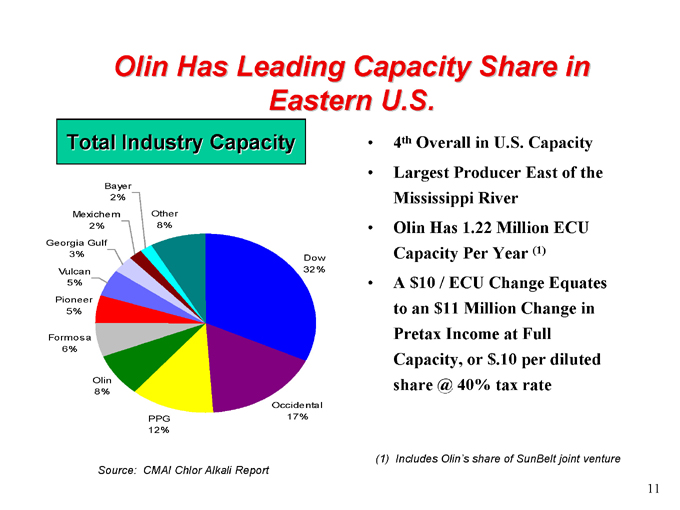
Olin Has Leading Capacity Share in Eastern U.S.
Total Industry Capacity
Bayer 2%
Mexichem 2%
Georgia Gulf 3%
Vulcan 5%
Pioneer 5%
Formosa 6%
Olin 8%
PPG 12%
Occidental 17%
Dow 32%
Other 8%
Source: CMAI Chlor Alkali Report
4(th) Overall in U.S. Capacity Largest Producer East of the Mississippi River Olin Has 1.22 Million ECU Capacity Per Year (1) A $10 / ECU Change Equates to an $11 Million Change in Pretax Income at Full Capacity, or $.10 per diluted share @ 40% tax rate
(1) Includes Olin’s share of SunBelt joint venture 11
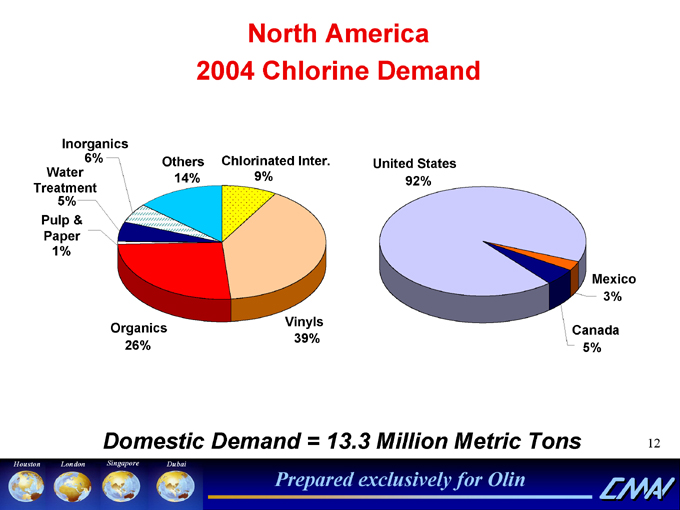
North America 2004 Chlorine Demand
Inorganics 6%
Water Treatment 5%
Pulp & Paper 1%
Others 14%
Chlorinated Inter. 9%
United States 92%
Organics 26%
Vinyls 39%
Mexico 3%
Canada 5%
Domestic Demand = 13.3 Million Metric Tons
Houston London Singapore Dubai Prepared exclusively for Olin
12
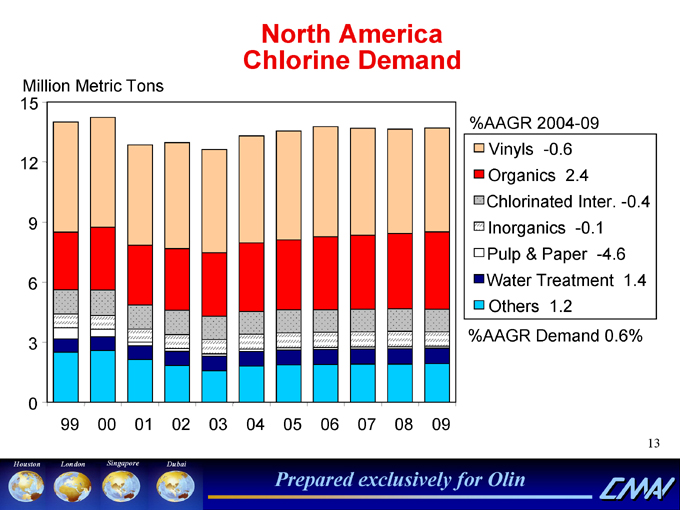
North America Chlorine Demand
Million Metric Tons
15 12 9 6 3 0
99 00 01 02 03 04 05 06 07 08 09
% AAGR 2004-09
Vinyls -0.6 Organics 2.4 Chlorinated Inter. -0.4 Inorganics -0.1 Pulp & Paper -4.6 Water Treatment 1.4 Others 1.2
% AAGR Demand 0.6%
Houston London Singapore Dubai Prepared exclusively for Olin
13
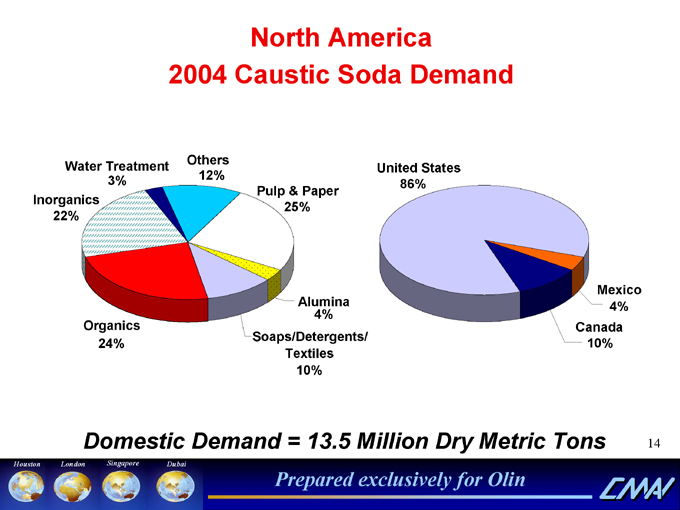
North America 2004 Caustic Soda Demand Others Water Treatment United States 3% 12%86% Pulp & Paper Inorganics 25% 22% Mexico Alumina 4% 4% Organics Canada Soaps/Detergents/ 24% 10% Textiles 10% Domestic Demand = 13.5 Million Dry Metric Tons Houston London Singapore Dubai Prepared exclusively for Olin
14
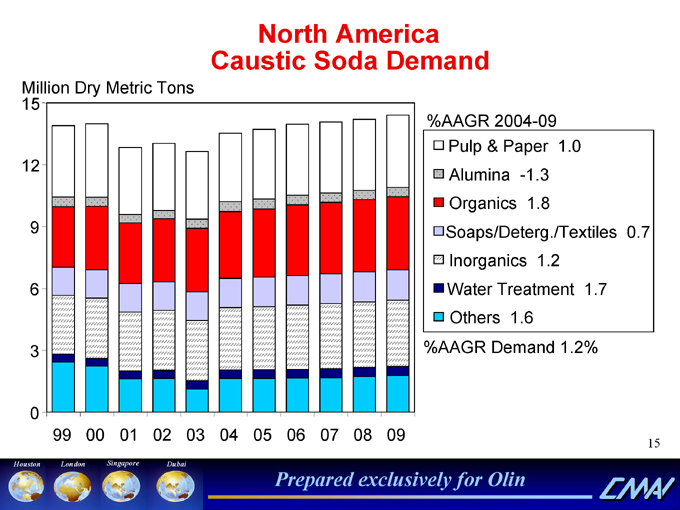
North America Caustic Soda Demand
Million Dry Metric Tons 15
%AAGR 2004-09 Pulp & Paper 1.0 12 Alumina -1.3 Organics 1.8
9 Soaps/Deterg./Textiles 0.7 Inorganics 1.2
6 Water Treatment 1.7 Others 1.6
3 %AAGR Demand 1.2%
0
99 00 01 02 03 04 05 06 07 08 09
15
Houston London Singapore Dubai
Prepared exclusively for Olin
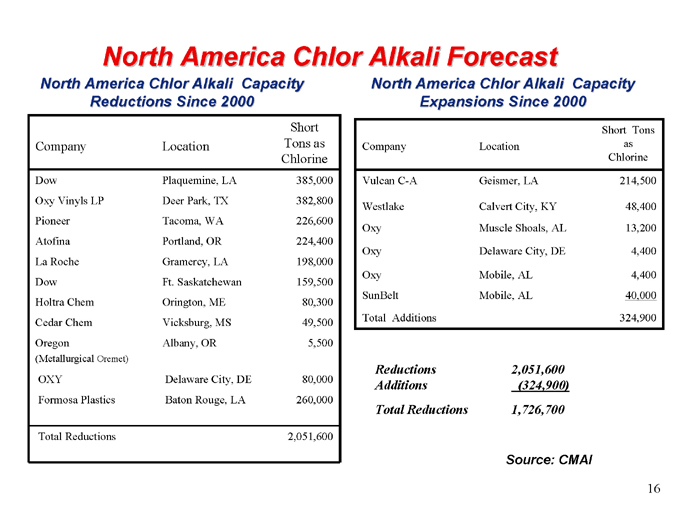
North America Chlor Alkali Forecast
North America Chlor Alkali Capacity Reductions Since 2000
North America Chlor Alkali Capacity Expansions Since 2000
Company Location Short Tons as Chlorine
Dow Plaquemine, LA 385,000
Oxy Vinyls LP Deer Park, TX 382,800
Pioneer Tacoma, WA 226,600
Atofina Portland, OR 224,400
La Roche Gramercy, LA 198,000
Dow Ft. Saskatchewan 159,500
Holtra Chem Orington, ME 80,300
Cedar Chem Vicksburg, MS 49,500
Oregon Albany, OR 5,500
(Metallurgical Oremet)
OXY Delaware City, DE 80,000
Formosa Plastics Baton Rouge, LA 260,000
Total Reductions 2,051,600
Company Location as Short Tons Chlorine
Vulcan C-A Geismer, LA 214,500
Westlake Calvert City, KY 48,400
Oxy Muscle Shoals, AL 13,200
Oxy Delaware City, DE 4,400
Oxy Mobile, AL 4,400
SunBelt Mobile, AL 40,000
Total Additions 324,900
Reductions 2,051,600 Additions (324,900) Total Reductions 1,726,700
Source: CMAI
16
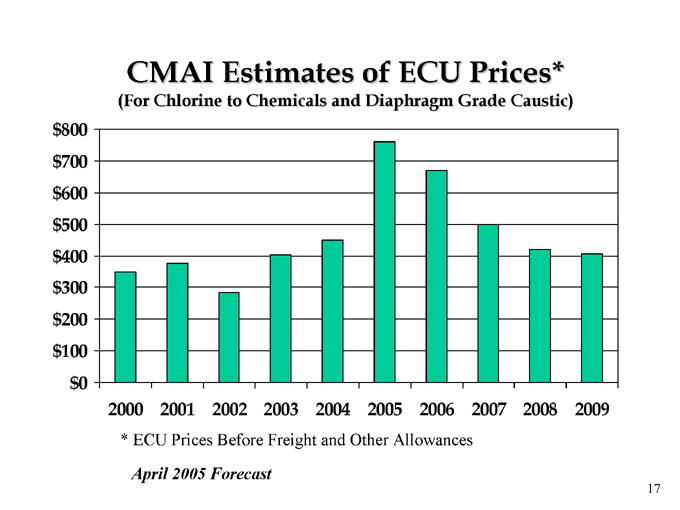
CMAI Estimates of ECU Prices*
(For Chlorine to Chemicals and Diaphragm Grade Caustic) $800 $700 $600 $500 $400 $300 $200 $100 $0 2000 2001 2002 2003 2004 2005 2006 2007 2008
* ECU Prices Before Freight and Other Allowances
April 2005 Forecast
17
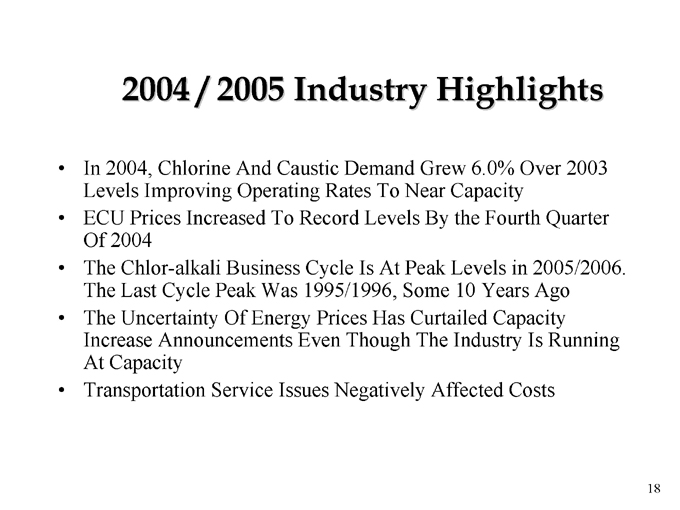
2004 / 2005 Industry Highlights
In 2004, Chlorine And Caustic Demand Grew 6.0% Over 2003 Levels Improving Operating Rates To Near Capacity ECU Prices Increased To Record Levels By the Fourth Quarter Of 2004 The Chlor-alkali Business Cycle Is At Peak Levels in 2005/2006. The Last Cycle Peak Was 1995/1996, Some 10 Years Ago The Uncertainty Of Energy Prices Has Curtailed Capacity Increase Announcements Even Though The Industry Is Running At Capacity Transportation Service Issues Negatively Affected Costs
18
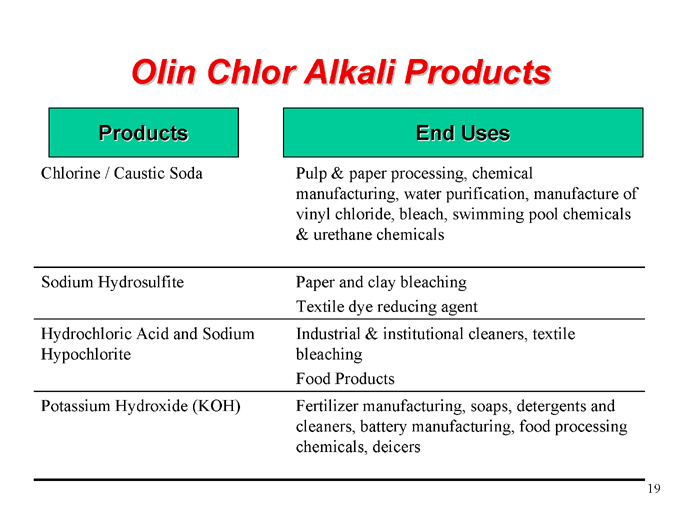
Olin Chlor Alkali Products
Chlorine / Caustic Soda
Sodium Hydrosulfite
Hydrochloric Acid and Sodium Hypochlorite
Potassium Hydroxide (KOH)
End Uses
Pulp & paper processing, chemical manufacturing, water purification, manufacture of vinyl chloride, bleach, swimming pool chemicals & urethane chemicals
Paper and clay bleaching Textile dye reducing agent
Industrial & institutional cleaners, textile bleaching Food Products
Fertilizer manufacturing, soaps, detergents and cleaners, battery manufacturing, food processing chemicals, deicers
19
Products
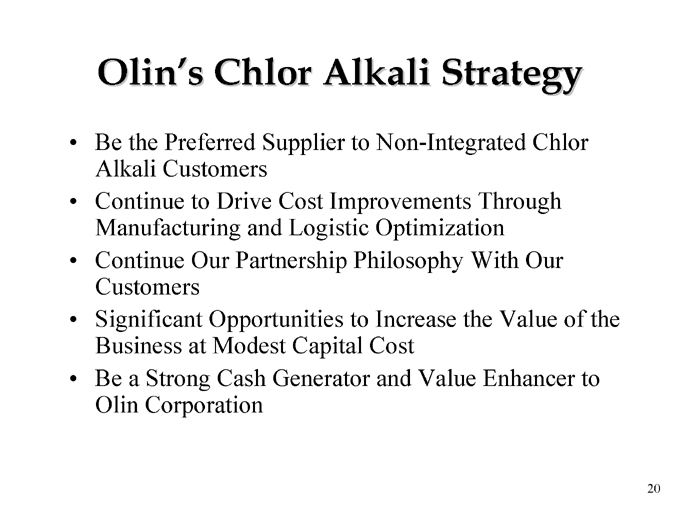
Olin’s Chlor Alkali Strategy
Be the Preferred Supplier to Non-Integrated Chlor Alkali Customers Continue to Drive Cost Improvements Through Manufacturing and Logistic Optimization Continue Our Partnership Philosophy With Our Customers Significant Opportunities to Increase the Value of the Business at Modest Capital Cost Be a Strong Cash Generator and Value Enhancer to Olin Corporation
20
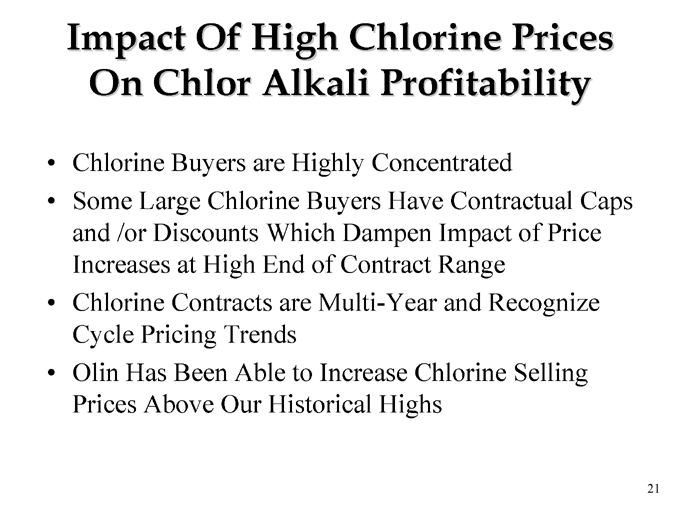
Impact Of High Chlorine Prices On Chlor Alkali Profitability
Chlorine Buyers are Highly Concentrated
Some Large Chlorine Buyers Have Contractual Caps and /or Discounts Which Dampen Impact of Price Increases at High End of Contract Range Chlorine Contracts are Multi-Year and Recognize Cycle Pricing Trends Olin Has Been Able to Increase Chlorine Selling Prices Above Our Historical Highs
21
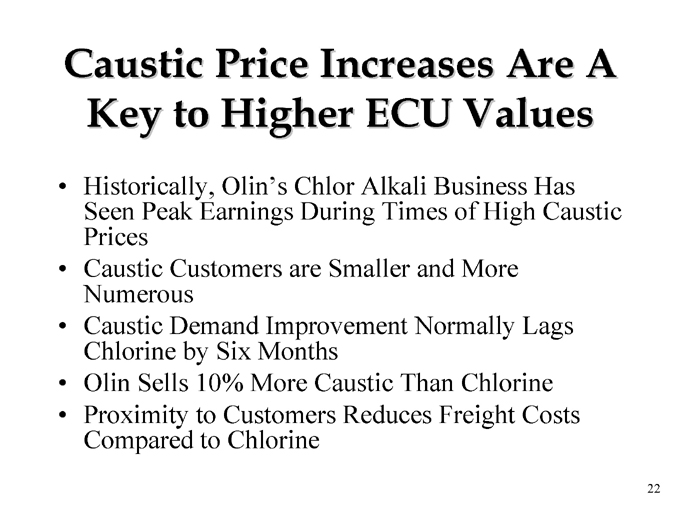
Caustic Price Increases Are A Key to Higher ECU Values
Historically, Olin’s Chlor Alkali Business Has Seen Peak Earnings During Times of High Caustic Prices Caustic Customers are Smaller and More Numerous Caustic Demand Improvement Normally Lags Chlorine by Six Months Olin Sells 10% More Caustic Than Chlorine Proximity to Customers Reduces Freight Costs Compared to Chlorine
22
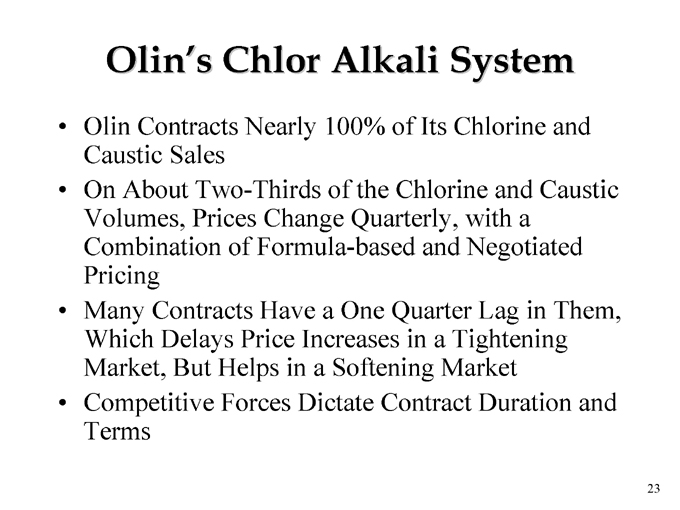
Olin’s Chlor Alkali System
Olin Contracts Nearly 100% of Its Chlorine and Caustic Sales On About Two-Thirds of the Chlorine and Caustic Volumes, Prices Change Quarterly, with a Combination of Formula-based and Negotiated Pricing Many Contracts Have a One Quarter Lag in Them, Which Delays Price Increases in a Tightening Market, But Helps in a Softening Market Competitive Forces Dictate Contract Duration and Terms
23
Chlor Alkali Summary
Our ECU prices will continue to be favorably impacted by the implementation of the price increases announced in February and any future price activity, if any should occur.
24
Metals
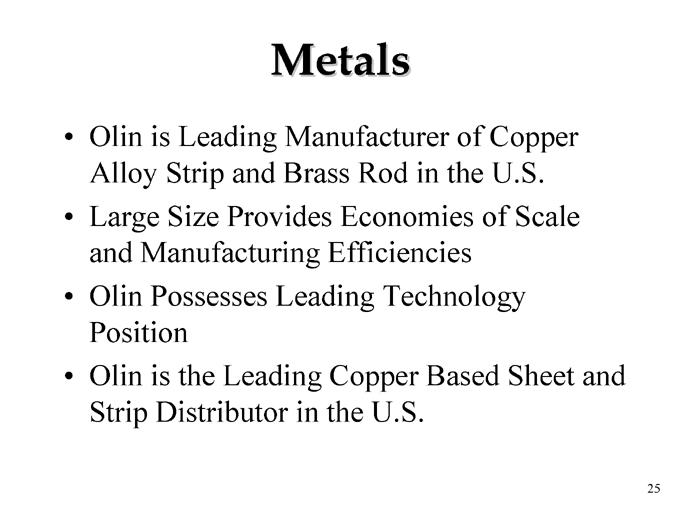
Olin is Leading Manufacturer of Copper Alloy Strip and Brass Rod in the U.S. Large Size Provides Economies of Scale and Manufacturing Efficiencies Olin Possesses Leading Technology Position Olin is the Leading Copper Based Sheet and Strip Distributor in the U.S.
25
Metals
Earnings Leverage as a Result of Cost Cutting and Capacity Rationalization As the Following Slides Show, 2001, 2002 and 2003 Were Well Below Historical Consumption In 2004, Demand Increased Over 2003 for Both Sheet and Rod Products by 13% and 8%, Respectively
26
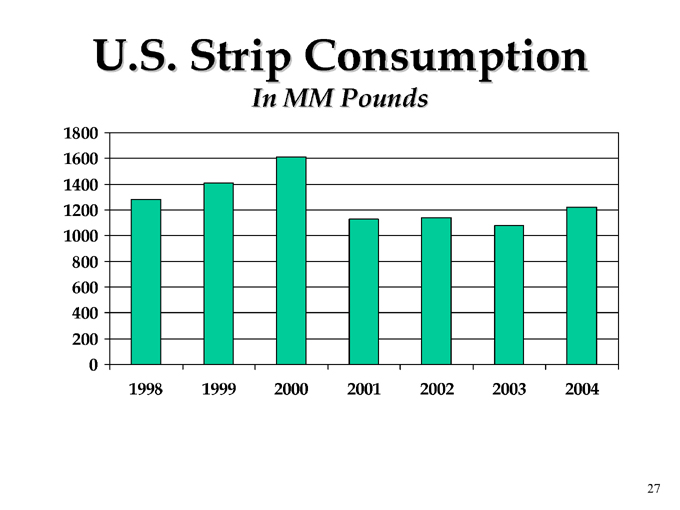
U.S. Strip Consumption
In MM Pounds
1800 1600 1400 1200 1000 800 600 400 200 0
1998 1999 2000 2001 2002 2003 2004
27
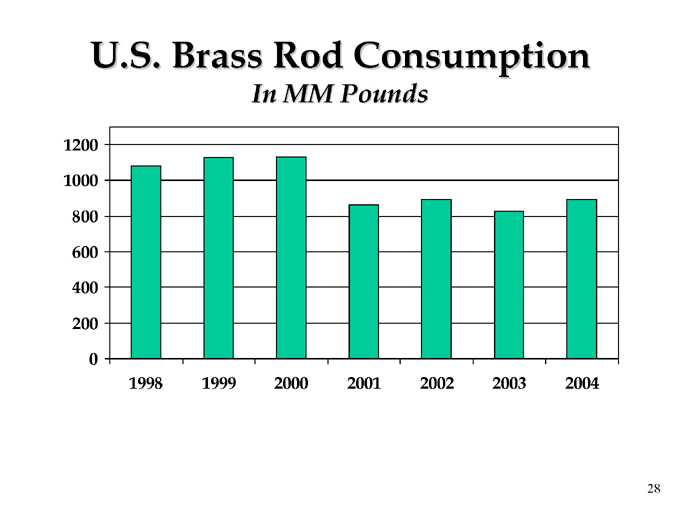
U.S. Brass Rod Consumption
In MM Pounds
1200 1000 800 600 400 200
0
1998 1999 2000 2001 2002 2003 2004
28

2004 Metals Income Increased
vs. 2003
Sales Increased 44% From $854 Million in 2003 to $1.230 Billion in 2004
Shipment Volumes Increased 11%
Higher Copper Prices and Product Mix Accounted for 33% of Increase
Income Increased From $9 Million in 2003 to $50 Million in 2004
Shipments to Automotive Segment up 3%, Coinage up 37%, Ammunition up 25%, Electronics down 3%, Building Products up 3%
29
Metals First Quarter 2005 Results
Industry Demand Was Down by Roughly 10% Each for Strip and Rod
Previous Estimate Was Down 7% Based on Information Through February
Olin’s Total Strip and Rod Demand Was Down 4%
Metals Segment Income Decreased from $14.6 MM in 1Q’04 to $13.7 MM in 1Q’05
30
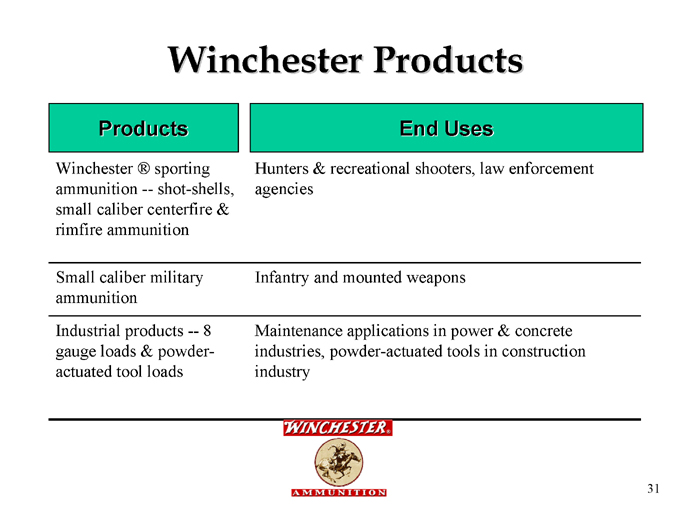
Winchester Products
Products End Uses
Winchester ® sporting ammunition - shot-shells, small caliber centerfire & rimfire ammunition ammunition
Small caliber military ammunition
Industrial products - 8 gauge loads & powder-actuated tool loads
Hunters & recreational shooters, law enforcement agencies
Infantry and mounted weapons
Maintenance applications in power & concrete industries, powder-actuated tools in construction industry
31
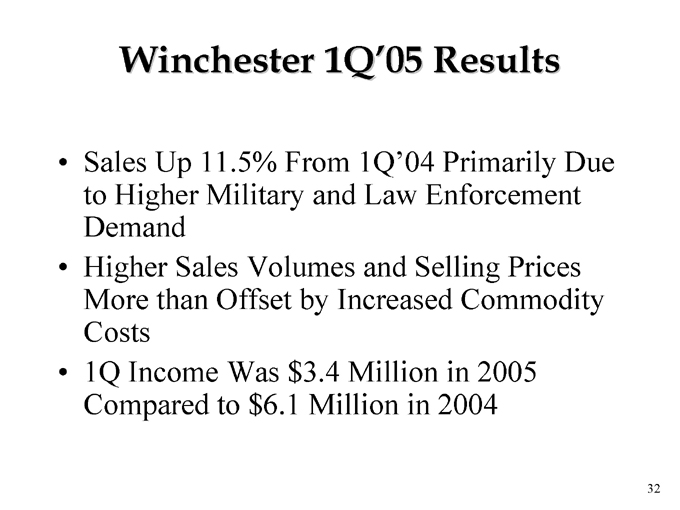
Winchester 1Q’05 Results
Sales Up 11.5% From 1Q’04 Primarily Due to Higher Military and Law Enforcement Demand
Higher Sales Volumes and Selling Prices More than Offset by Increased Commodity Costs
1Q Income Was $3.4 Million in 2005 Compared to $6.1 Million in 2004
32

Rimfire
To Improve Its Competitive Position, Winchester is Relocating Its Rimfire Manufacturing Operation from East Alton to Oxford, MS.
Expect New Facility to be Operational in Second Quarter 2005
33
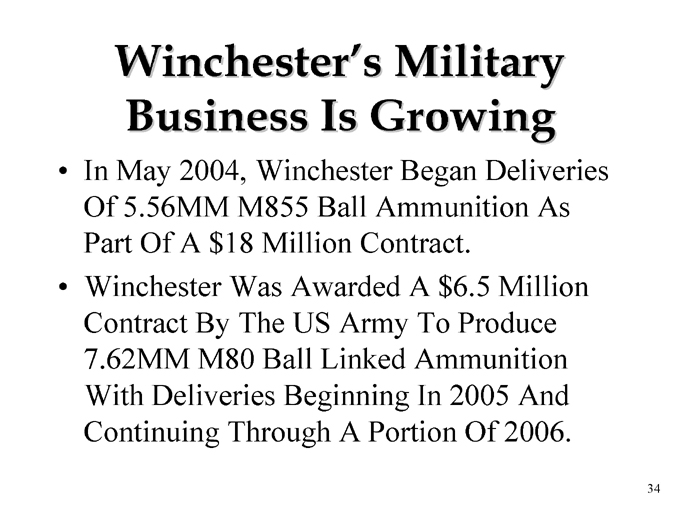
Winchester’s Military Business Is Growing
In May 2004, Winchester Began Deliveries Of 5.56MM M855 Ball Ammunition As Part Of A $18 Million Contract.
Winchester Was Awarded A $6.5 Million Contract By The US Army To Produce 7.62MM M80 Ball Linked Ammunition With Deliveries Beginning In 2005 And Continuing Through A Portion Of 2006.
34
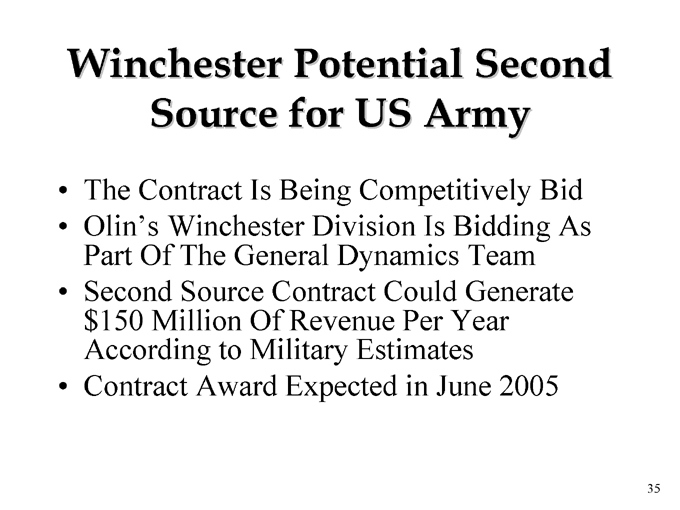
Winchester Potential Second Source for US Army
The Contract Is Being Competitively Bid
Olin’s Winchester Division Is Bidding As Part Of The General Dynamics Team
Second Source Contract Could Generate $150 Million Of Revenue Per Year According to Military Estimates
Contract Award Expected in June 2005
35
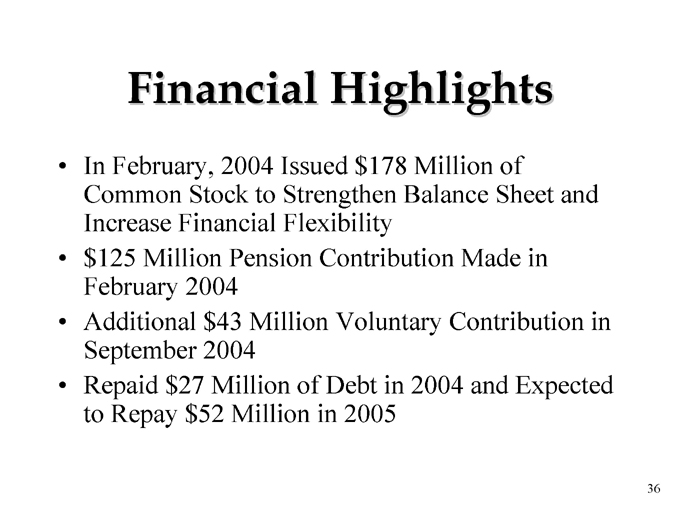
Financial Highlights
In February, 2004 Issued $178 Million of Common Stock to Strengthen Balance Sheet and Increase Financial Flexibility $125 Million Pension Contribution Made in February 2004 Additional $43 Million Voluntary Contribution in September 2004 Repaid $27 Million of Debt in 2004 and Expected to Repay $52 Million in 2005
36
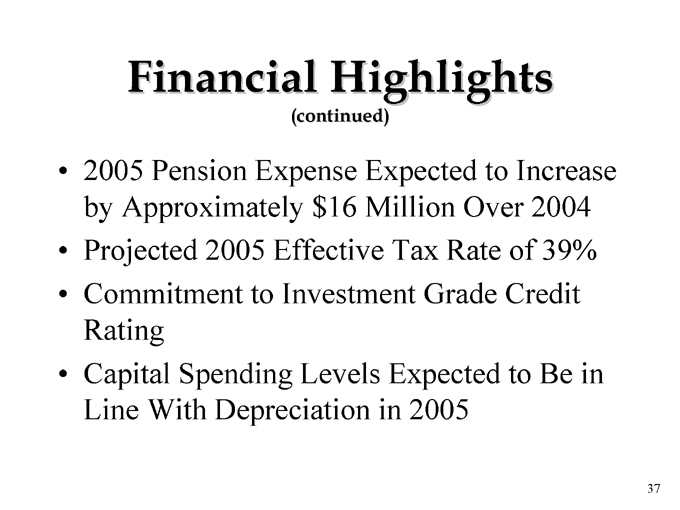
Financial Highlights
(continued)
2005 Pension Expense Expected to Increase by Approximately $16 Million Over 2004 Projected 2005 Effective Tax Rate of 39% Commitment to Investment Grade Credit Rating Capital Spending Levels Expected to Be in Line With Depreciation in 2005
37
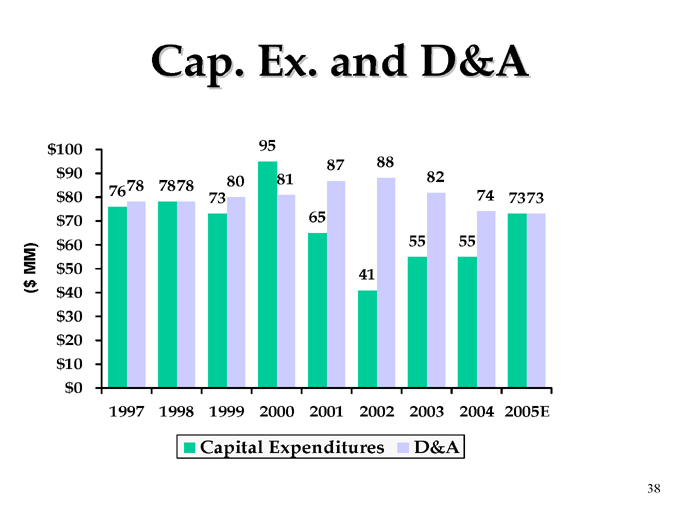
Cap. Ex. and D&A
($ MM)
Capital Expenditures D&A
38 $100 $90 $80 $70 $60 $50 $40 $30 $20 $10 $0
95
87 88
80 81 82
76 78 78 78
73 74 73 73 65
55 55 41
1997 1998 1999 2000 2001 2002 2003 2004 2005E
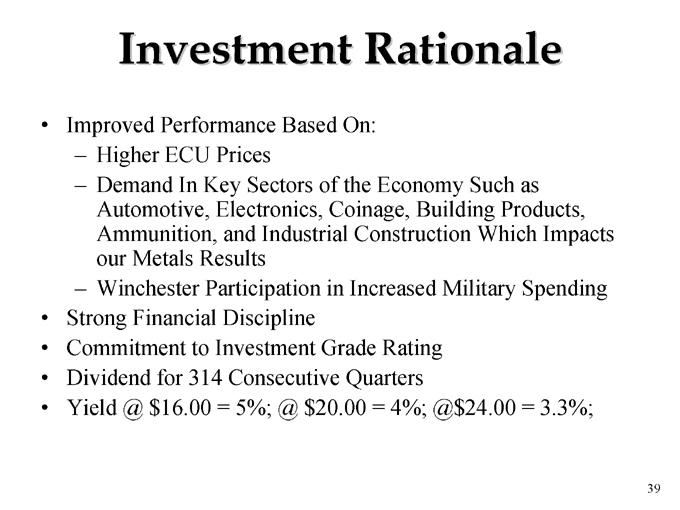
Investment Rationale
Improved Performance Based On:
Higher ECU Prices
Demand In Key Sectors of the Economy Such as Automotive, Electronics, Coinage, Building Products, Ammunition, and Industrial Construction Which Impacts our Metals Results
Winchester Participation in Increased Military Spending Strong Financial Discipline Commitment to Investment Grade Rating Dividend for 314 Consecutive Quarters Yield @ $16.00 = 5%; @ $20.00 = 4%; @$24.00 = 3.3%;
39
Forward-Looking Statements
This presentation contains estimates of future performance, which are forward-looking statements and results could differ materially from those anticipated in the forward-looking statements. Some of the factors that could cause actual results to differ are described in the business and outlook sections of Olin’s Form 10-K for the year ended December 31, 2004 and in Olin’s First Quarter 2005 Earnings Release. These reports are filed with the U.S. Securities and Exchange Commission.
40

Proud Heritage … Promising Future
41