 1 Buckingham Research Group Inc. Buckingham Research Group Inc. Annual Boston Chemical Annual Boston Chemical Technology Conference Technology Conference June 27, 2006 June 27, 2006 Exhibit 99.2 * * * * * * |
2 Attending Today Attending Today Joseph D. Rupp Chairman, President and Chief Executive Officer John E. Fischer Vice President and Chief Financial Officer John L. McIntosh President, Chlor Alkali Products Larry P. Kromidas Assistant Treasurer and Director, Investor Relations * |
 3 Company Overview Company Overview All financial data are for the year ending 2005 and quarter ending March 2006 and are presented in millions of U.S. dollars except for earnings per share. Shown above is income before taxes from continuing operations. Additional information is available on Olin’s website www.olin.com in the Investor Relations section. Winchester Chlor Alkali North American Producer of Chlorine and Caustic Soda FY 2006 Q1 2006 Revenue: $610 $174 Income: $237 $ 74 North American Producer of Ammunition FY 2005 Q1 2006 Revenue: $345 $ 90 Income: $8 $ 4 Metals Specialty Copper-Based Products & Related Engineered Materials FY 2005 Q1 2006 Revenue: $1,403 $461 Income: $34 $ 21 Revenue: $2,358 $725 Pretax Operating Inc.: $ 226 $ 54 EPS (Diluted): $ 1.86 $ .47 Olin FY 2005 Q1 2006 * |
4 Olin Vision Olin Vision To be a leading Basic Materials company delivering attractive, sustainable shareholder returns • Being low cost, high quality producer and #1 or #2 supplier in the markets we choose to serve • Providing excellent customer service and advanced technological solutions • Following our customers globally where we can do it profitably • Generating returns above the cost of capital over the economic cycle * |
 5 Olin Corporate Strategy Olin Corporate Strategy 1. Build on current leadership positions in Chlor-Alkali, Metals and Ammunition • Improve operating efficiency and profitability • Integrate downstream selectively • Expand globally 2. Allocate resources to the businesses that can create the most value 3. Manage financial resources to satisfy legacy liabilities TRS in Top Third S&P Mid Cap 400 ROCE Over Cost of Capital Over the Cycle Olin Corporation Goal: Superior Shareholder Returns * |
6 2005 Highlights 2005 Highlights • Significant improvement in Chlor Alkali Products Pricing • Unprecedented cost increases in natural gas and commodity metals • Corporate restructuring and relocation completed • Environmental recoveries of $50 million for costs incurred and expensed in prior periods • Voluntary pension contribution of $6 million • Debt of $52 million repaid • Increase in cash by $150 million • Hurricane impacts on customers and rail system * |
7 First Quarter 2006 First Quarter 2006 • Record ECU netbacks resulted in record quarterly Chlor Alkali Products earnings of $73.9 million • Continued cost increases for copper and zinc hindered Metals results • Metals restructuring charge of $15.7 million substantially offset by $13.5 million LIFO inventory gain • Higher year-over-year pension costs ($3MM) and expensing of stock options ($1MM) • Earnings per diluted share of $.47 * |
8 Second Quarter 2006 Outlook Second Quarter 2006 Outlook • Chlor Alkali Products lower ECU netbacks in second quarter versus first quarter, but higher than 2005 levels • Metals earnings are projected to be lower than the first quarter of 2006 due to higher copper, natural gas and other costs • Winchester expected second quarter 2006 earnings to be lower than Q1 due to normal seasonal factors, but in line with second quarter of 2005 • On April 28 th we projected our EPS to be in the $.40 per diluted share range in the second quarter * |
9 • Be the preferred merchant supplier to non-integrated chlor alkali customers • Continue to drive cost improvements through manufacturing and logistic optimization • Continue our partnership philosophy with our customers • Significant opportunities to increase the value of the business at modest capital cost • Be a strong cash generator and value enhancer to Olin Corporation Olin’s Chlor Alkali Strategy Olin’s Chlor Alkali Strategy * |
 10 Olin Chlor Alkali Products Olin Chlor Alkali Products Products Products End Uses End Uses Fertilizer, soaps and detergents, cleaning products, food processing, Deicers, CRT Monitors Potassium Hydroxide (KOH) Paper and clay bleaching Textile dye reducing agent Sodium Hydrosulfite Food Products Hydrochloric Acid Industrial & institutional cleaners, Water treatment, consumer bleach Sodium Hypochlorite Pulp & paper processing, chemical manufacturing, water purification, manufacture of vinyl chloride, bleach, swimming pool chemicals & urethane chemicals Chlorine / Caustic Soda * |
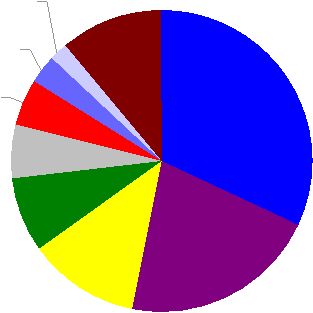 11 Olin Has Leading Capacity Share in Olin Has Leading Capacity Share in Eastern U.S. Eastern U.S. Source: CMAI Chlor Alkali Report • 4 th Overall in U.S. Capacity • Largest Producer East of the Mississippi River • Olin Has 1.24 Million tons ECU Capacity Per Year (1) • A $10 / ECU Change Equates to an $11 Million Change in Pretax Income at Full Capacity, or $.11 per share @ 37% tax rate Dow 32% Occidental 21% PPG 12% Olin 8% Formosa 6% Pioneer 5% Georgia Gulf 3% Bayer 2% Other 11% (1) Includes 50% of SunBelt * |
 North America 2005 Chlorine Demand Domestic Demand = 12.4 Million Metric Tons Prepared exclusively for Olin Houston London Singapore Dubai 12 Mexico 2% Canada 5% United States 93% Vinyls 38% Chlorinated Inter. 9% Inorganics 6% Pulp & Paper 1% Water Treatment 6% Others 14% Organics 26% * |
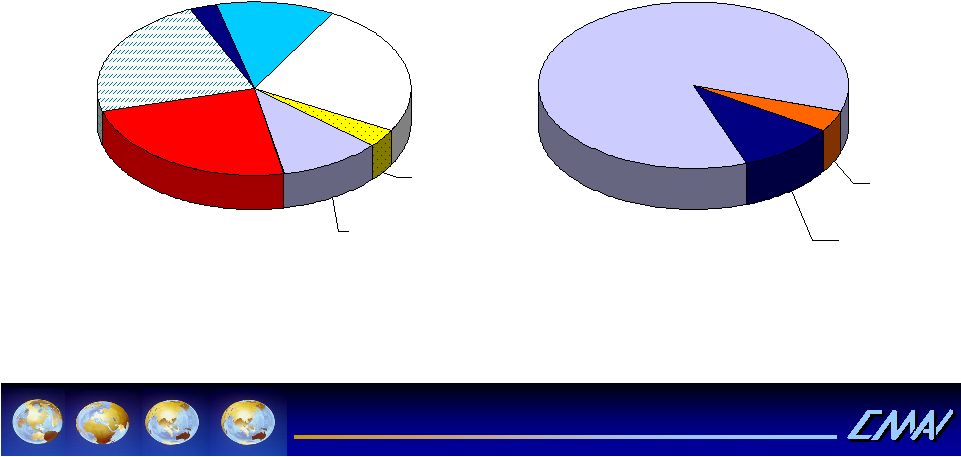 North America 2005 Caustic Soda Demand Domestic Demand = 13.0 Million Dry Metric Tons Prepared exclusively for Olin Houston London Singapore Dubai Mexico 4% Canada 10% United States 86% Pulp & Paper 24% Alumina 4% Soaps/Detergents/ Textiles 11% Organics 25% Inorganics 23% Water Treatment 3% Others 10% 13 * |
 14 North America Chlor Alkali Forecast North America Chlor Alkali Forecast North North America America Chlor Chlor Alkali Alkali Capacity Capacity Reductions 2000 Through 2006 Reductions 2000 Through 2006 North America Chlor Alkali Capacity North America Chlor Alkali Capacity Expansions 2000 Through 2006 Expansions 2000 Through 2006 160,000 Ft. Saskatchewan Dow 201,000 Baton Rouge, LA Formosa Plastics 2,036,000 Total Reductions 5,000 Albany, OR Oremet 40,000 36,000 Vicksburg, MS (3 locations) Cedar Chem Georgia Pacific 80,000 Orrington, ME Holtra Chem 145,000 Delaware City, DE OXY 198,000 Gramercy, LA La Roche 187,000 Portland, OR Atofina 214,000 Tacoma, WA Pioneer 395,000 Deer Park, TX Oxy Vinyls LP 375,000 Plaquemine, LA Dow Short Tons as Chlorine Location Company Source: Olin Data Reductions 2,036,000 Additions (382,000) Total Reductions 1,654,000 382,000 Total Additions 70,000 Mobile, AL SunBelt 22,000 Various Sites Oxy 80,000 Calvert City, KY Westlake 210,000 Geismer, LA Vulcan C-A Short Tons as Chlorine Location Company 484,000* Total Announced Changes 2008 (154,000) Muscle Shoals, AL Oxy 88,000 220,000 330,000 Short Tons as Chlorine 2006 Longview, WA Equachlor Delayed Baytown, TX Bayer 2007/2008 Plaquemine, LA Shintech Timing Location Company Annual demand growth at 0.8%/Yr = 110,000 Short Tons/Yr * Includes delayed capacity Announced Future Capacity Changes Announced Future Capacity Changes * |
15 Chlor Chlor Alkali Alkali Products Products • Chlorine and Caustic contracts resetting in 2006 • Hurricanes did not damage any Olin plants, but disrupted customers and rail lines • Higher transportation and energy costs, Olin system less dependent on natural gas • Co-product strategies / expansions – Bleach - Hydrochloric Acid ECU Netbacks 2005 2006 1st Quarter $ 485 $590 2nd Quarter $ 505 3rd Quarter $ 515 4th Quarter $ 545 * |
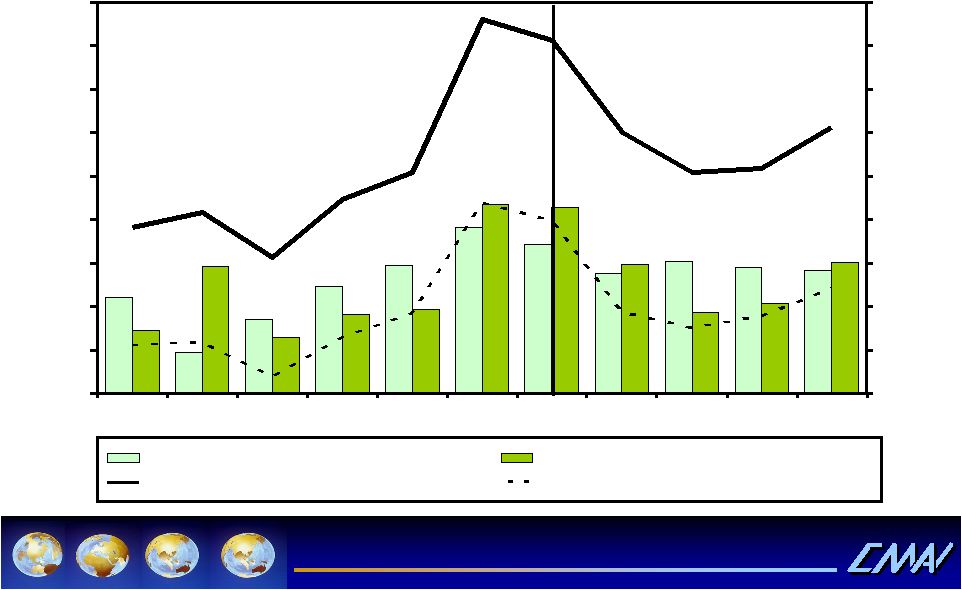 Prepared exclusively for Olin Houston London Singapore Dubai Contract Chlorine (Chem, FOB USGC) Contract Caustic (Diaph, FOB USGC) ECU Value ECU Cash Margin U.S. Chlor-Alkali Annual ECU Economics 0 100 200 300 400 500 600 700 800 900 00 01 02 03 04 05 06 07 08 09 10 0 91 181 272 363 454 544 635 726 816 Forecast Dollars Per Metric Ton Dollars Per Short Ton Market Price Methodology April 2006 Forecast 16 * |
17 Olin’s Chlor Alkali Contracts Olin’s Chlor Alkali Contracts • Olin contracts nearly 100% of its chlorine and caustic sales • On about two-thirds of the chlorine and caustic volumes, prices change quarterly, with a combination of formula-based and negotiated pricing, the balance is renegotiated annually or semi-annually • Many contracts have a one quarter lag in them, which delays price increases in a tightening market, but helps in a softening market • Competitive forces dictate contract duration and terms * |
18 • Olin’s electricity costs have increased over the last five years, but have remained well below Natural Gas generated electricity prices • Olin purchases power from Utilities that generate electricity principally from coal, nuclear and hydro sources • We, and others, believe that higher Natural Gas prices have raised the floor on ECU prices for the future ($1 / MMBTU = $25-$35 / ECU) Olin’s Energy Position Olin’s Energy Position * |
19 Metals Metals • Olin is the leading manufacturer of copper alloy strip and brass rod in the U.S. • Our large size provides economies of scale and manufacturing efficiencies • Olin possesses leading technology position • Olin is a leader in copper alloy R&D • Olin is the leading copper based sheet and strip distributor in the U.S. * |
20 Metals Metals • Volumes in the first quarter were up 11% for the strip business, but down 5% in rod over the fourth quarter of last year • Higher natural gas prices and metal melting losses due to higher copper prices reduced earnings by $4.2 million from first quarter 2005 to first quarter of 2006 • Actions initiated to reduce costs $9 to $10 million annually include the shut down of Waterbury Rolling Mills plant and consolidation of production to East Alton, and overhead reductions. Benefits of these actions to be realized in second half of 2006 * |
21 Metals Outlook Metals Outlook • Earnings improvement opportunities through the likely combination of plant closures, realignments and headcount reductions to be completed in 2006 • Aggressively pursuing energy surcharges and price increases to combat the unprecedented cost increases in copper and zinc • Limited expansion of our China distribution facility by adding stamping capabilities • We believe that we are the low cost metals producer in the U. S. putting us in a preferred position with regards to profitability * |
 22 Winchester Products Winchester Products Products Products End Uses End Uses Maintenance applications in power & concrete industries, powder-actuated tools in construction industry Industrial products -- 8 gauge loads & powder- actuated tool loads Infantry and mounted weapons Small caliber military ammunition Hunters & recreational shooters, law enforcement agencies Winchester ® sporting ammunition -- shot- shells, small caliber centerfire & rimfire ammunition * |
23 Winchester Winchester • Higher sales volumes to commercial, military and law enforcement customers were more than offset by increased copper, lead, steel and resin costs • Price increases announced for 2006 to offset higher commodity prices • Cost improvements through relocation of rimfire operations to Oxford, MS facility • Olin, as part of the General Dynamics team, was awarded the second source small caliber ammunition contract – we expect military sales to increase by about 13% from 2005 to 2006 * |
24 Financial Highlights Financial Highlights • 2005 cash generation supported by use of approximately $60 million of net operating loss carryforwards • Recovery of $50 million of environmental costs offset higher legal and legal related costs • Repaid $52 million of debt in 2005, modest amounts due in 2006 • $6 million voluntary pension contribution in September 2005 * |
25 Financial Highlights Financial Highlights (continued) (continued) • 2006 pension expense expected to increase by approximately $10 million over 2005 • Pension plan frozen to new salaried and East Alton bargain unit employees • Expensing $3 million of stock options begins 2006 • 2006 effective tax rate expected to be in the 37% range • Capital spending levels are expected to be slightly more than 2006 projected depreciation of $74 million * |
26 Investment Rationale Investment Rationale • Improved performance based on – Relatively high ECU prices – Cost reductions and restructuring in Metals – Cost reductions and increased Military revenue in Winchester • Strong financial discipline • Commitment to investment grade credit rating • At recent price levels, dividend yield approximately 4.5% to 4.75% • Dividend for 318 consecutive quarters * |
27 Forward-Looking Statements Forward-Looking Statements This presentation contains estimates of future performance, which are forward-looking statements and results could differ materially from those anticipated in the forward-looking statements. Some of the factors that could cause actual results to differ are described in the business and outlook sections of Olin’s Form 10- K for the year ended December 31, 2005 and in Olin’s First Quarter 2006 Earnings Release. These reports are filed with the U.S. Securities and Exchange Commission. * |