 Armstrong World Industries Investor Presentation February 28, 2011 Exhibit 99.2 |
 2 Safe Harbor Statement This presentation contains “forward-looking statements” related to Armstrong World Industries, Inc.’s, future financial performance. Our results could differ materially from the results discussed in these forward-looking statements due to known and unknown risks and uncertainties. A more detailed discussion of the risks and uncertainties that may affect our ability to achieve the projected performance is included in the “Risk Factors” and “Management’s Discussion and Analysis” sections of our recent reports on Forms 10-K and 10-Q filed with the SEC. We undertake no obligation to update any forward-looking statement beyond what is required by applicable securities law. In addition, we will be referring to non-GAAP financial measures within the meaning of SEC Regulation G. A reconciliation of the differences between these measures with the most directly comparable financial measures calculated in accordance with GAAP is available on the Investor Relations page of our website at www.armstrong.com. |
 3 Company Overview |
 4 Armstrong at a Glance Leading manufacturer of floors and ceilings for use in renovation and new construction. Significant U.S. cabinets’ business. $2.8 billion in sales in 2010 #1 in businesses representing 80% of sales Serving global customers from eight countries 34 manufacturing locations Approximately 9,800 employees Approximately $2.5 billion market capitalization Strong balance sheet - $550 million of net debt at 12/31/10 Significant NOL carry forward 58 million diluted shares outstanding 300K average daily trading volume 64% owned by Armstrong Asbestos Trust and Armor TPG ‘AWI’ on the NYSE Since October 2006 emergence from asbestos-related bankruptcy Company Overview |
 5 History 1998 Sales Mix: Residential/Commercial was 65/35 Significant geographic and product line expansion: • Hardwood floors • Cabinets • DLW (European flooring) Asbestos-related bankruptcy Manufacturing and overhead restructuring Significant growth in Commercial products Strategic review and sale process in declining residential market: • Improved product mix • Increased manufacturing productivity • Commercial volume growth Strategic focus in soft residential and declining commercial markets: • Ensure innovation • Align costs with changing environment Managing for Profitability 1998 2001 - 2006 2007 2008 - 2009 Company Overview 2009 Sales Mix: Residential/Commercial was 40/60 • Expand revenue opportunities • Position company to deliver sustainable profitability • Deliver earnings growth • Ensure ongoing profitability and preserve cash |
 6 AWI Key Strategies Company Overview 1 Enhance the Core Maximize profits in global Floors and Ceilings Increase share and mix selectively 2 Expand the Core Drive growth in China and India Build ceilings and flooring plants in China Expand presence in Eastern Europe and Middle East 3 Drive Lower Costs $150 million cost savings program LEAN investment, SG&A reduction, procurement savings Restructure floor Europe 4 Innovation Leadership Environmental leadership Unmatched product portfolio 5 Organization Vitality Attract, retain and develop the best people in the industry Organizational processes aligned with strategic objectives 6 Efficient Balance Sheet Net debt less than 2x EBITDA No significant maturities until 2015 Sufficient cash to make organic investments |
 7 2010 Business Segment and End-Use Profile Majority of business is renovation – dampens cycles. Cabinets Resilient Flooring (Int'l) Resilient Flooring (N.A.) Hardwood Flooring Building Products (Ceilings) Consolidated Commercial renovation Commercial new Residential renovation Residential new 65% 30% 65% 35% 40% 40% 10% 55% 35% 10% 30% 10% 20% 40% $1,150 $500 $650 $350 $150 $2,800 5% 10% 50 45 5% Company Overview N.A. >75% renovation |
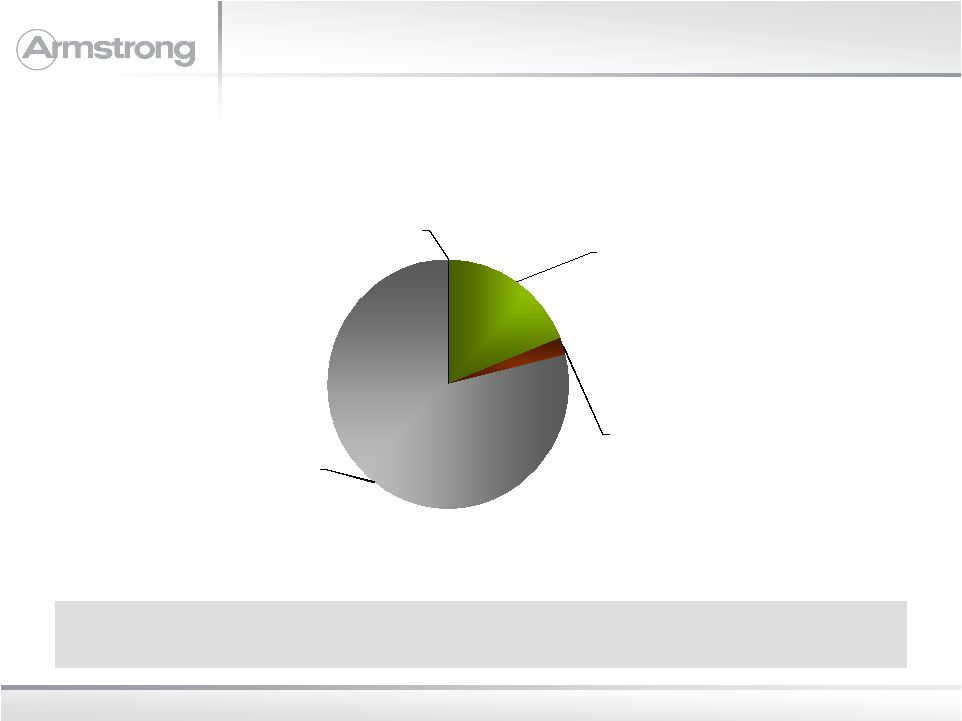 8 Resilient Flooring 19% Wood Flooring 2% Building Products (Ceilings) 79% Cabinets 0% Business Segment Profile Building Products delivers the bulk of worldwide income and has remained profitable through the economic cycle. 2010 EBITDA Adjusted – Excludes unallocated corporate expense Company Overview |
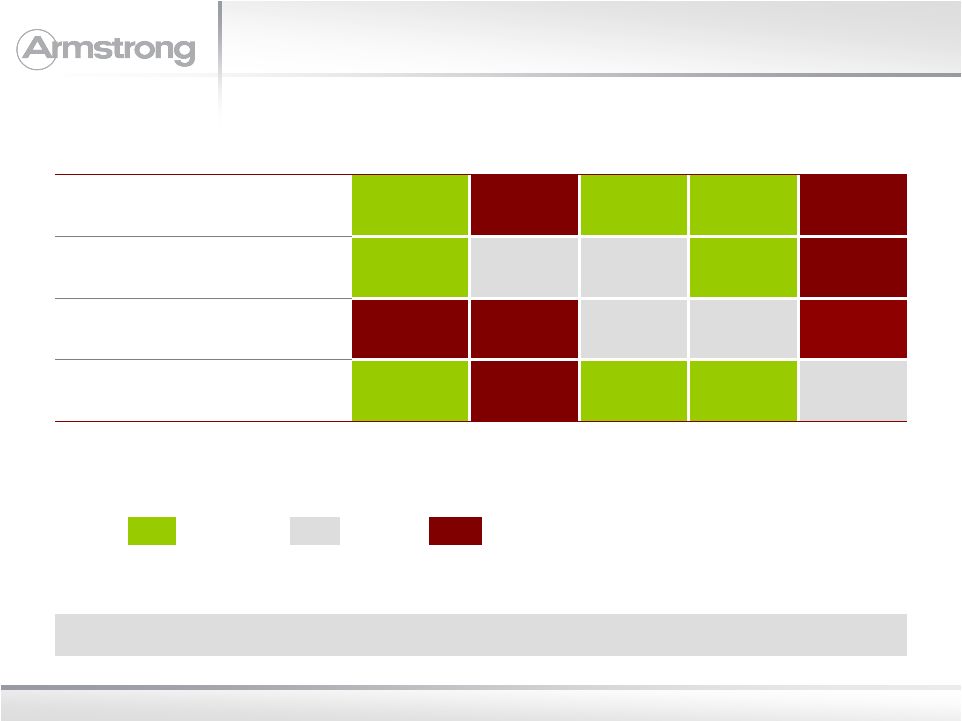 9 Industry Structure/Competitive Position U.S. Resilient European Resilient Hardwood Building Products Cabinets Market Leadership Competitor Concentration Industry Capacity Utilization Low-Cost Manufacturer Armstrong continuously focused on competitive dynamics. Key Favorable Neutral Unfavorable Company Overview |
 Business Segment Overview |
 11 Worldwide Business Overview – Building Products Worldwide market leader in suspended ceilings. Business Segment Overview - Building Products North America Mkt Size (B ft 2 ) AWI Rank Commercial 1.4 1 Residential 0.4 1 Europe, Africa, Middle- East Mkt Size (B ft 2 ) AWI Rank Western 1.2 1 Eastern 0.5 1 Africa / Mid- East 0.3 1 Asia, Australia Mkt Size (B ft 2 ) AWI Rank China 0.2 1 Australia 0.04 1 India 0.05 1 SE Asia 0.08 1 |
 12 ABP Key Strategies 1 Broadest Product Portfolio Complete product offering New product pipeline (Metal, Wood) Win versus soft fiber in Europe 2 Emerging Market Growth Plant #2 in China Distribution in Russia, Middle East Grid plant in India Business Segment Overview - Building Products 4 Best-in-Class Service/Quality Best on-time delivery performance Lowest claims rate Best product availability 3 Innovation Leadership “Sustainability” leadership Custom solutions (Metal, Wood) Recycling program |
 13 Building Products (ABP) Sales by Geography 695 362 $115 0 200 400 600 800 Americas Europe Asia ($-Millions) Contribution of WAVE JV Profit to Operating Margin 4% Worldwide EBITDA Margin 25% New product development and manufacturing technology managed globally. Business Segment Overview - Building Products Global market leader Broadest Product Line Innovation Go-to-Market Best cost, quality, service >90% sales commercial Grid – 50/50 joint venture Ceilings & Grid |
 14 Worldwide Business Overview – Floor Products * Business Segment Overview - Worldwide Floor Products Global presence with market leadership in most regions. Asia, Australia Mkt Size (B ft 2 ) AWI Rank China 0.4 2 Australia 0.1 2 India 0.01 1 SE Asia 0.1 1 Europe, Africa, Middle-East Mkt Size (B ft 2 ) AWI Rank Central 0.3 1 Eastern / Africa / Mid-East 0.3 5 Western Europe 0.9 3-5 North America Mkt Size (B ft 2 ) AWI Rank Commercial 1.0 1 Residential 2.0 1 Wood 0.6 1 * Market figures exclude segments in which we do not participate. |
 15 AFP Key Strategies Business Segment Overview - Worldwide Floor Products 1 Best Product Portfolio Offer broadest assortment Drive mix Quality leadership 2 Complete Market Coverage Brand leadership Merchandising presence Sales coverage effectiveness 3 Low-Cost Manufacturing Lean deployment Capability investment, e.g., glass, wood automation Rationalize footprint 4 Innovation Leadership Environmental solutions Design, performance, and installation 5 Drive China Growth Focus on market development Plant investments to support growth 6 Restructure Europe Exit Residential Simplify Commercial participation Cost-out … plant and SG&A |
 16 Floor Products (AFP) Sales by Geography 474 654 364 91 0 200 400 600 800 Americas Americas Europe Asia ($-Millions) Worldwide Adjusted EBITDA Margin excluding Europe 5% 7% Continued profitability through bottom of residential downturn. Business Segment Overview - Worldwide Floor Products Resilient & Wood Wood Worldwide Resilient |
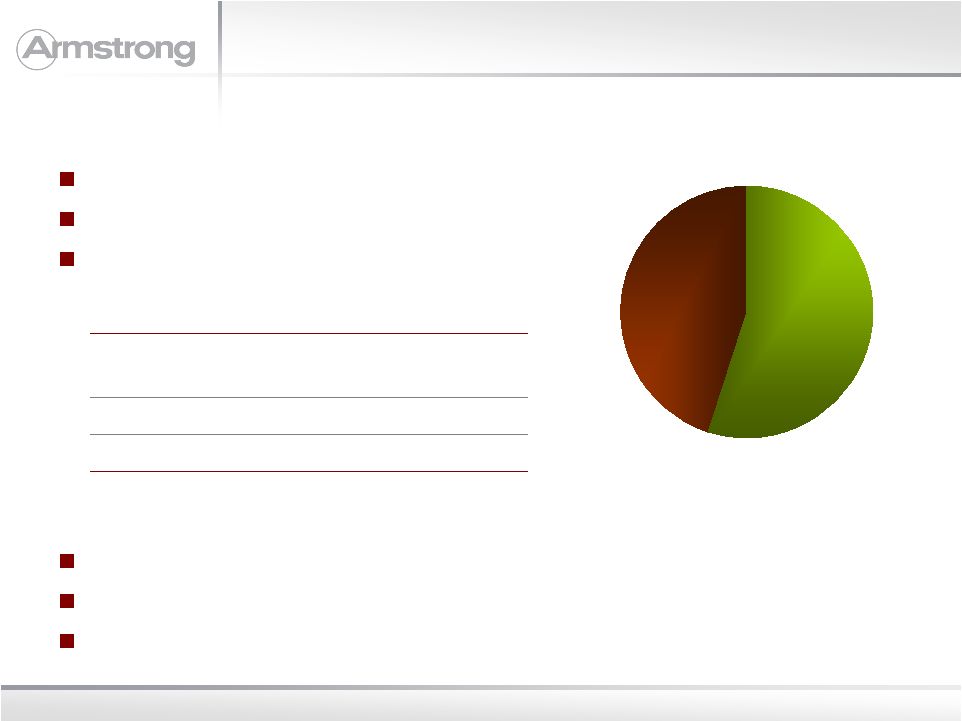
 17 European Floor Products Linoleum 37% Vinyl 34% Other 16% Vinyl 13% Commercial 87% 2010 Sales $364M Operating Loss (1) $ 19M Business Segment Overview - European Floor Products (1) Excludes restructuring expense Challenges Tough markets … Western Europe Scale disadvantage in manufacturing and SG&A Outdated manufacturing processes in all but linoleum Solution Exited Residential segment Simplified Commercial business … country and product participation Close Teesside Plant (complete) and Holmsund (Q2, 2011) SG&A restructuring … 38% decrease in headcount Committed to eliminating loss in 2011. Residential 13% |
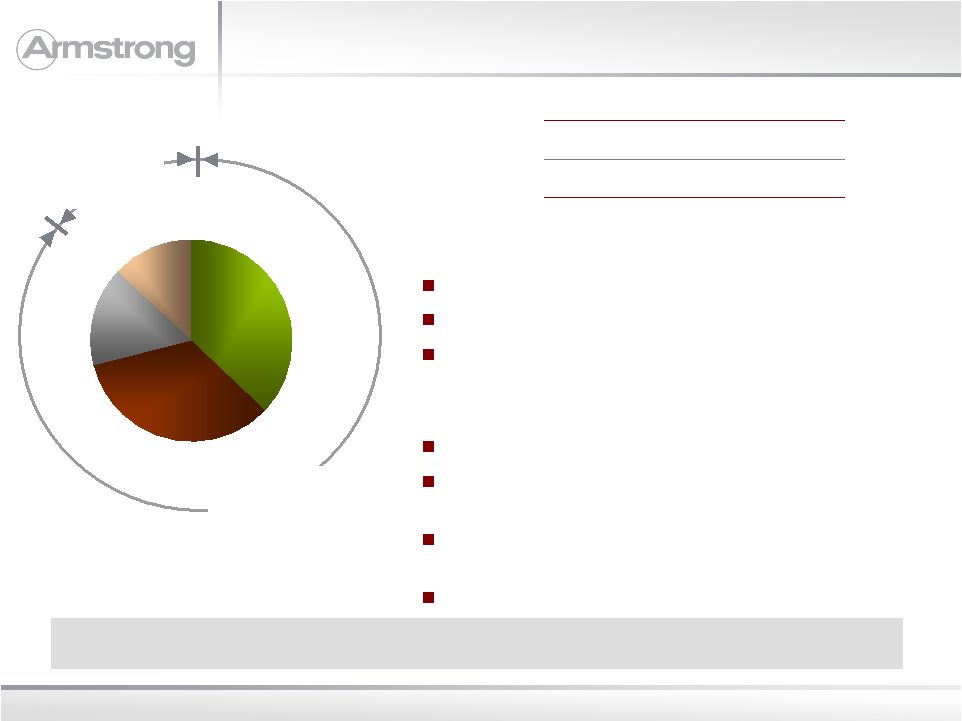
 18 Cabinets Small player…<5% share Focus on small-/medium-size builder Go-to-Market Current Situation 2010 Sales = $139M Niche player… both new and remodel Restructure costs to reflect market reality Non-core business Strategy Remodel 45% New 55% % of Sales Company-Owned Service Centers 51% Distribution 27% Multi-Family 22% Business Segment Overview - Cabinets |
 19 Cabinets Small player…<5% share Focus on small-/medium-size builder Go-to-Market Current Situation 2010 Sales = $139M Niche player … both new and remodel Restructure costs to reflect market reality Non-core business Strategy Remodel 45% New 55% % of Sales Company-Owned Service Centers 51% Distribution 27% Multi-Family 22% Business Segment Overview - Cabinets |
 Financial Overview |
 21 Profitable and cash flow positive through downturn Focus on cost control / productivity Strong free cash flow ROIC greater than cost of capital in 2013, with new home starts at one million Continuing to fully invest in businesses Strong balance sheet: leverage, liquidity and maturity profile Positioned for considerable operational leverage on modest market recovery Financial Summary Financial Overview |
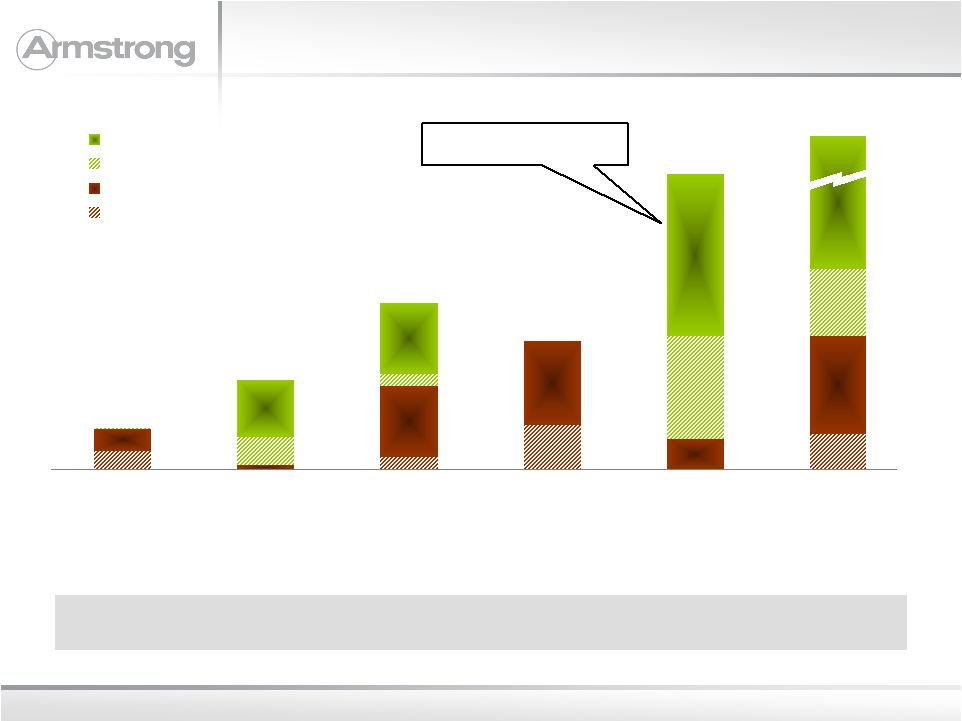
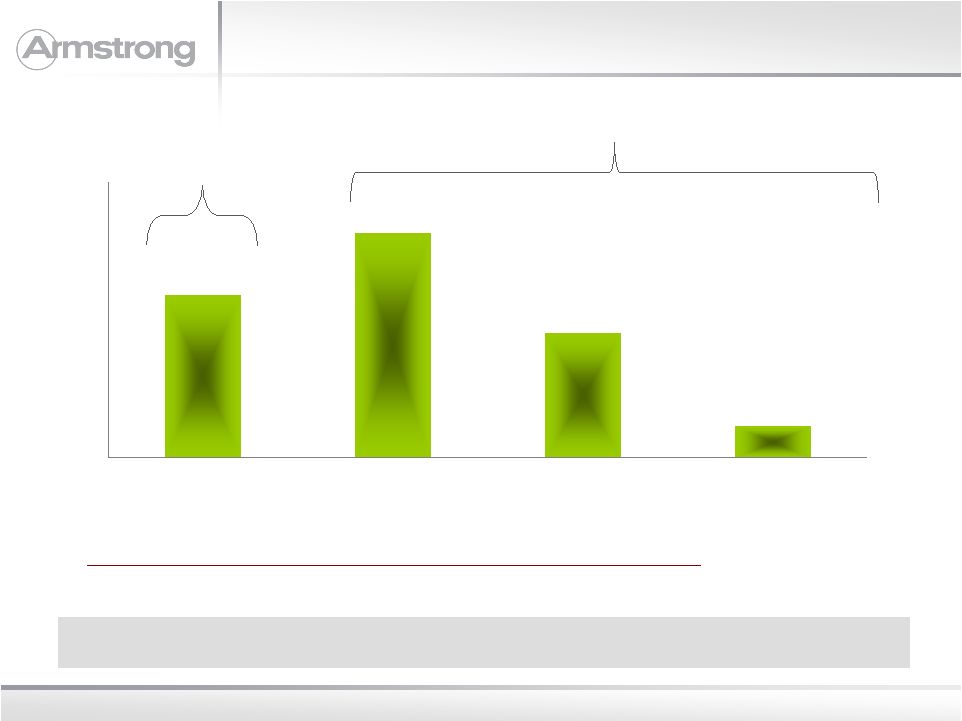
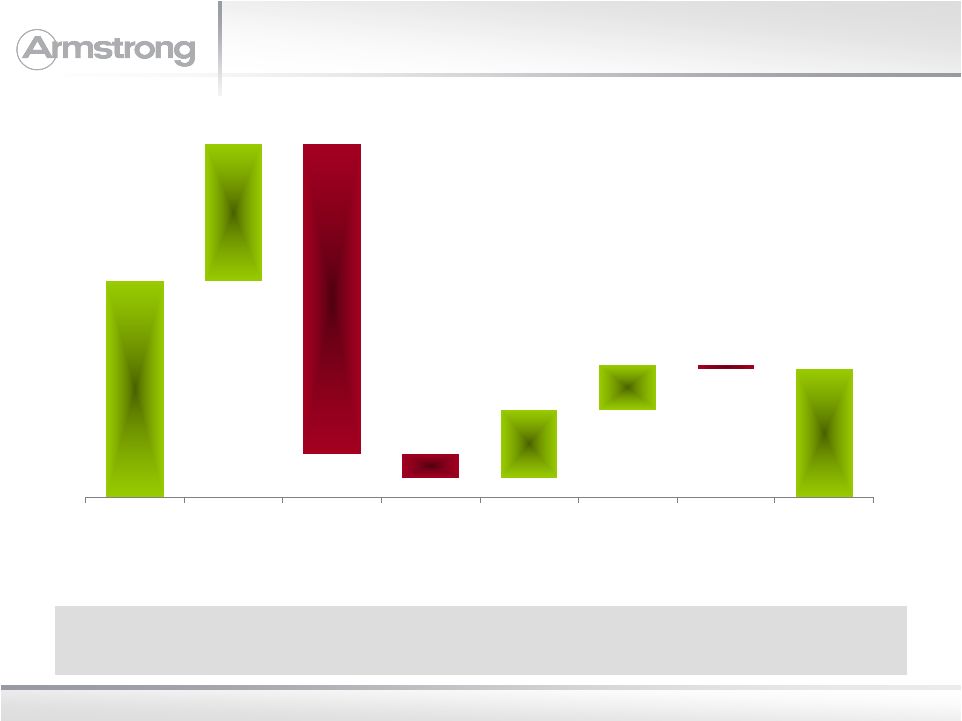 22 $270 $160 $170 $85 $55 ($5) ($385) ($30) 2006 Actual Price / Mix Volume Raw Materials / Energy Mfg Costs SG&A WAVE 2009 Actual (Millions) Figures rounded to nearest $5 million Financial Overview Cost reduction and improved price / mix significantly offset dramatic volume declines. Operating Income Bridge (2006-2009) |
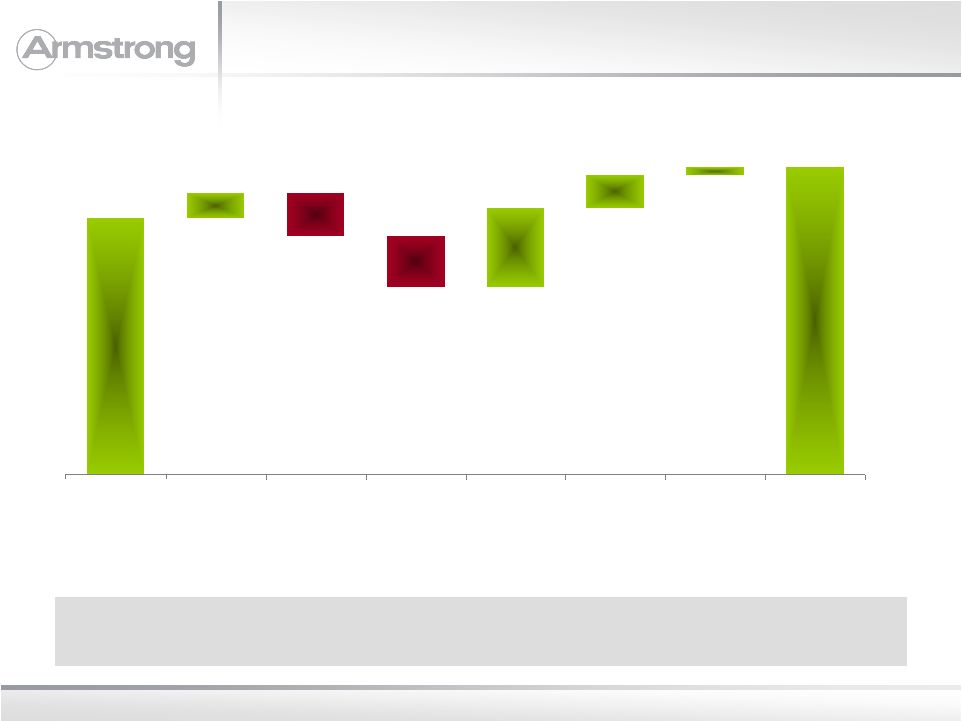 23 $157 $188 $15 $48 $20 $5 ($26) ( $31) 2009 Price / Mix Volume Raw Materials / Energy Mfg Costs SG&A WAVE 2010 Mgmt Acct (Millions) Figures rounded to nearest $1 million Financial Overview Cost reduction offsets volume and input cost headwinds. Operating Income Bridge (2009-2010) |
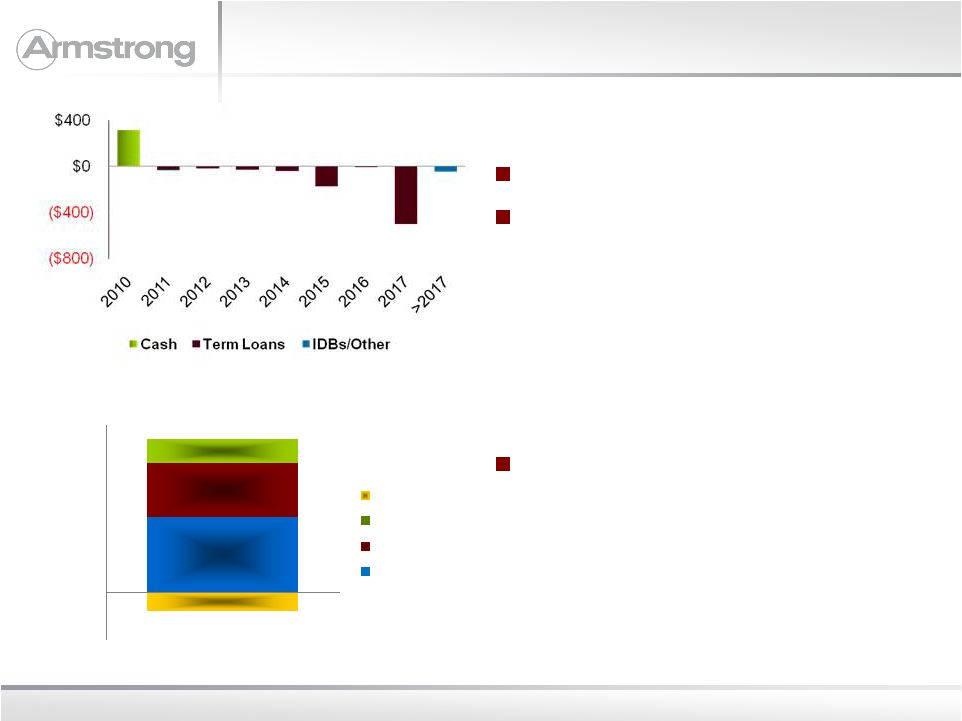 24 315 225 100 (75) ($200) ($100) $0 $100 $200 $300 $400 $500 $600 $700 LCs Securitization Revolver Cash Balance Sheet 12/31/2010 (2%) (14%) Financial Overview $565 (Millions) Maturity Profile No significant maturities until 2015 Considerable covenant flexibility Liquidity Sufficient liquidity to manage operations, and execute capital spend and restructuring plans |
 Financial Overview Appendix |
 26 Key Metrics (1) – Guidance 2011 Financial Overview Appendix 2011 Estimate Range 2010 Variance Net Sales 2,800 to 3,000 2,766 1% to 8% Operating Income (2) 255 to 305 189 35% to 62% EBITDA 360 to 410 303 19% to 35% Earnings Per Share (3), (4) $2.04 to $2.53 $1.73 18% to 47% Free Cash Flow 70 to 120 180 (61%) to (33%) (1) Figures exclude non-recurring items such as charges for cost reduction initiatives, restructuring, etc. (2) As reported Operating Income: $225 - 275 million in 2011 and $81 million 2010. (3) Earnings per share reflect an adjusted tax rate of 42% for both 2011 and 2010. (4) As reported earnings per share: $1.85 - $2.34 in 2011 and $0.19 in 2010. Guidance provided as of February 28, 2011. We undertake no obligation to update guidance, beyond what is required by securities law. |
 27 2011 Financial Outlook Financial Overview Appendix Raw Material & Energy Inflation $35 - $45 million increase Manufacturing Productivity Gross Margin +100 to +200 bps vs. 2010 U.S. Pension Credit ~$25 million, down ~$25 million vs. 2010 60% manufacturing, 40% SG&A Earnings from WAVE $5 - $10 million vs. 2010 Cash Taxes/ETR ~$15 million. Adjusted ETR of 42% Q1 Sales $640 – $705 million EBITDA $72 – $88 million Capital Spending ~$180-$200 million Exclusions from EBITDA ~$18 - 27 million associated with already announced actions |
 28 Full Year 2010 – Adjusted Operating Income to Reported Net Income Financial Overview Appendix 2010 2009 V Operating Income – Adjusted (1) $188 $157 $31 Foreign Exchange Movements 2 - 2 Laminate Duty Refund 7 - 7 Cost Reduction Initiatives (50) (16) (34) Asset Impairments (31) (18) (13) Restructuring (22) - (22) Executive Transition (15) - (15) Gain on Settlement of Note Receivable 2 - 2 Accelerated Vesting - (32) 32 Operating Income – As Reported $81 $91 ($10) Interest (Expense) Income (14) (16) 2 EBT $67 $75 ($8) Tax (Expense) Benefit (56) 3 (59) Net Income $11 $78 ($67) (1) Figures exclude non-recurring items such as charges for cost reduction initiatives, restructuring, etc. Figures also exclude the impact of foreign exchange movements. |
 29 Normalized Operating Income to Free Cash Flow Financial Overview Appendix 2011 Estimate Range Adjusted Operating Income 255 to 305 D&A 105 Adjusted EBITDA 360 to 410 Changes in Working Capital 10 to 30 Capex (180) to (200) Pension Credit (25) Interest Expense (50) Cash Taxes (15) Other, including cash payments for restructuring and one-time items (30) Free Cash Flow 70 to 120 |
 30 Consolidated Results Financial Overview Appendix Fourth Quarter 2010 Reported Comparability (1) Adjustments FX (2) Adj 2010 Adjusted 2009 Reported Comparability (1) Adjustments FX (2) Adj 2009 Adjusted Net Sales 643 - 9 652 653 - 4 657 Operating Income (30) 50 (1) 19 (2) 27 - 26 EPS ($0.36) $0.48 ($0.01) $0.11 ($0.07) $0.30 $ - $0.23 Full Year 2010 2010 Reported Comparability (1) Adjustments FX (2) Adj 2010 Adjusted 2009 Reported Comparability (1) Adjustments FX (2) Adj 2009 Adjusted Net Sales 2,766 - 66 2,833 2,780 - 73 2,853 Operating Income 81 108 (2) 188 91 65 1 157 EPS $0.19 $1.55 ($0.02) $1.72 $1.36 $0.07 $0.01 $1.44 (1) See earnings press release and 10-K for additional detail on comparability adjustments (2) Eliminates impact of foreign exchange movements |
 31 Segment Operating Income (Loss) Financial Overview Appendix (1) Eliminates impact of foreign exchange movements and non-recurring items; see earnings press release and 10-K for additional detail. Fourth Quarter 2010 Reported Comparability (1) Adjustments 2010 Adjusted 2009 Reported Comparability (1) Adjustments 2009 Adjusted Resilient Flooring (2) 3 1 (7) 2 (4) Wood Flooring (32) 28 (4) (10) 20 10 Building Products 16 16 32 24 - 24 Cabinets (1) - (1) (8) 5 (3) Unallocated Corporate (Expense) Income (12) (3) (9) - - - Full Year 2010 2010 Reported Comparability (1) Adjustments 2010 Adjusted 2009 Reported Comparability (1) Adjustments 2009 Adjusted Resilient Flooring 13 18 31 - 6 7 Wood Flooring (46) 39 (7) (6) 20 14 Building Products 171 27 198 156 1 157 Cabinets (6) - (6) (18) 6 (12) Unallocated Corporate (Expense) Income (51) 23 (28) (41) 32 (9) |
 32 Cash Flow Financial Overview Appendix Fourth Quarter Full Year ($-millions) 2010 2009 2010 2009 Net Cash From Operations 49 82 190 260 Plus / (Minus) Net Cash from Investing (37) (29) (41) (41) Add back / (subtract): Restricted Cash 30 - 30 - Divestitures 1 - 1 (8) Equals Free Cash Flow 43 53 180 211 |