![]() Earnings Call Presentation 1 st Quarter 2013 April 29, 2013 Exhibit 99.2 |
![]() Safe Harbor Statement Our disclosures in this presentation, including without limitation, those relating to future financial results guidance, and in our other public documents and comments contain forward-looking statements within the meaning of the Private Securities Litigation Reform Act. Those statements provide our future expectations or forecasts and can be identified by our use of words such as "anticipate," "estimate," "expect," "project," "intend," "plan," "believe," "outlook," and other words or phrases of similar meaning in connection with any discussion of future operating or financial performance. Forward-looking statements, by their nature, address matters that are uncertain and involve risks because they relate to events and depend on circumstances that may or may not occur in the future. As a result, our actual results may differ materially from our expected results and from those expressed in our forward-looking statements. A more detailed discussion of the risks and uncertainties that may affect our ability to achieve the projected performance is included in the “Risk Factors” and “Management’s Discussion and Analysis” sections of our reports on Forms 10-K and 10-Q filed with the SEC. Forward-looking statements speak only as of the date they are made. We undertake no obligation to update any forward-looking statements beyond what is required under applicable securities law. In addition, we will be referring to non-GAAP financial measures within the meaning of SEC Regulation G. A reconciliation of the differences between these measures with the most directly comparable financial measures calculated in accordance with GAAP are included within this presentation and available on the Investor Relations page of our website at www.armstrong.com. The guidance in this presentation is only effective as of the date given, April 29, 2013, and will not be updated or affirmed unless and until we publicly announce updated or affirmed guidance. 2 |
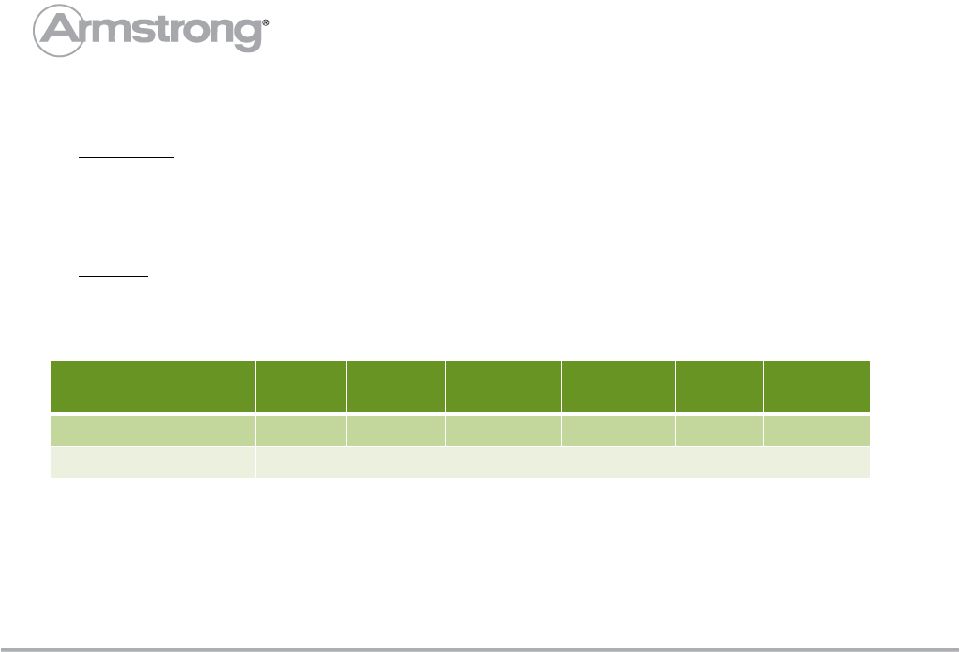
![]() All figures throughout the presentation are in $ millions unless otherwise noted. Figures may not add due to rounding. Basis of Presentation Explanation When reporting our financial results within this presentation, we make several adjustments. Management uses the non-GAAP measures below in managing the business and believes the adjustments provide meaningful comparisons of operating performance between periods. As reported results will be footnoted throughout the presentation. 3 • We report in comparable dollars to remove the effects of currency translation on the P&L. The budgeted exchange rate for 2013 is used for all currency translations in 2013 and prior years. Guidance is presented using the 2013 budgeted exchange rate for the year. • We remove the impact of discrete expenses and income. Examples include plant closures, restructuring actions, and other large unusual items. • Taxes for normalized Net Income and EPS are calculated using a constant 39% for 2013 results and guidance and 40% for 2012, which are based on the full year historical tax rates. • In the fourth quarter of 2012, we completed the sale of Cabinets business. The financial results of the Cabinets business, which were previously shown as a separate reporting segment, have been reclassified and presented as discontinued operations. The financial results included within this presentation, including historical results, are presented on a continuing operations basis unless specifically noted otherwise. Comparable Dollars Other Adjustments Net Sales Yes No Gross Profit Yes Yes SG&A Expense Yes Yes Equity Earnings Yes Yes Operating Income Yes Yes Net Income Yes Yes Cash Flow No No Return on Capital Yes Yes EBITDA Yes Yes What Items Are Adjusted |
![]() (1) As reported Net Sales: $622 million in 2013 and $636 million in 2012 (2) As reported Operating Income: $47 million in 2013 and $43 million in 2012 (3) As reported EPS: $0.05 in 2013 and $0.32 in 2012 (4) Cash flow information includes cash flows attributable to Cabinets (5) Unadjusted Key Metrics – First Quarter 2013 2013 2012 Variance Net Sales (1) $620 $634 (2.3)% Operating Income (2) 54 59 (8.9)% % of Sales 8.7% 9.3% (60 bps) EBITDA 79 84 (5.6)% % of Sales 12.7% 13.1% (40 bps) Earnings Per Share (3) $0.22 $0.49 (55.0)% Free Cash Flow (4) (51) (50) (2.8)% Net Debt 792 409 383 ROIC (5) 10.3% 8.2% 210 bps 4 |
![]() 2013 2012 V EBITDA– Adjusted $79 $84 ($5) Depreciation and Amortization (25) (25) - Operating Income – Adjusted $54 $59 ($5) Foreign Exchange Movements (1) - (1) Cost Reduction Initiatives (5) (2) (3) Accelerated Depreciation (not included above) - (9) 9 Impairments - (5) 5 Restructuring (1) - (1) Operating Income – As Reported $47 $43 $4 Interest (Expense) (32) (11) (21) EBT $15 $32 ($17) Tax (Expense) (12) (13) 1 Net Income $3 $19 ($16) First Quarter 2013 vs. PY– Adjusted EBITDA to Reported Net Income 5 |
![]() First Quarter Sales and EBITDA by Segment – 2013 vs. PY 6 |
![]() $0 $10 $20 $30 $40 $50 $60 $70 $80 $90 $100 2012 Price / Mix Volume Input Costs Mfg Cost SG&A WAVE Pension Credit Change in D&A 2013 $7 ($3) $0 ($13) EBITDA Bridge – First Quarter 2013 vs. Prior Year 7 $3 $0 ($1) $2 $84 $79 |
![]() ($50) ($51) ($8) $20 ($18) ($3) ($3) $11 ($80) ($70) ($60) ($50) ($40) ($30) ($20) ($10) $0 $10 $20 2012 Cash Earnings Working Capital Capex Interest Exp WAVE Dividends Other 2013 Free Cash Flow – First Quarter 2013 vs. Prior Year 8 Cash flow information includes cash flows attributable to Cabinets |
![]() 2013 Estimate Range (1) 2012 (1) Variance Net Sales (2) 2,700 to 2,800 2,623 3% to 7% Operating Income (3) 280 to 310 302 (7)% to 3% EBITDA 390 to 420 402 (3)% to 4% Earnings Per Share (4) $2.15 to $2.45 $2.53 (15)% to (3)% Free Cash Flow 75 to 125 89 (16)% to 40% (1) Guidance and 2012 results are presented using 2013 budgeted foreign exchange rates (2) 2012 and 2013 net sales include the impact of foreign exchange (3) As reported Operating Income: $270- $300 million in 2013 and $271 million 2012 (4) As reported earnings per share: $1.90 - $2.20 in 2013 and $2.41 in 2012 Key Metrics – Guidance 2013 9 |
![]() 2013 Financial Outlook $50 - $60 million vs. 2012 2.5% Annual Gross Productivity target; Adjusted Gross Margin (50) to (100) bps vs. 2012 Down $10 million; 60% manufacturing, 40% SG&A $0 - $5 million vs. 2012 $10 - $30 million; Adjusted long-term ETR of ~39% (2) Sales (1) $680 – $730 million; EBITDA $85 – $105 million $170 - $190 million $5 to $10 million Raw Material & Energy Inflation* Manufacturing Productivity* U.S. Pension Credit Earnings from WAVE Cash Taxes/ETR* Q2 Capital Spending Exclusions from EBITDA* 10 (1) Net sales include foreign exchange impact (2) As reported ETR of 43% for 2013 * Changed from February Outlook |
![]() Appendix 11 |
![]() • Cabinets • Announced sale in Q3 2012 and finalized sale in Q4 2012 • Treated as discontinued operation starting with Q3 2012 • Patriot • Completed sale in Q3 2012 • Results included in the Wood Flooring segment 12 Divested Businesses Patriot impact on Y-o-Y Comparisons Q3 2012 Q4 2012 2012 1H 2013 Q3 2013 2013 Net Sales $3-$4M $7 - $8M $10 - $12M $18 - $20M $6 -$7M $24-$27M EBITDA -- Minimal -- |
![]() 2013 Estimate Range Adjusted Operating Income 280 to 310 D&A 110 Adjusted EBITDA 390 to 420 Changes in Working Capital (10) to (30) Capex (170) to (190) Interest Expense (65) to (70) Cash Taxes (10) to (30) Other, including cash payments for restructuring and one-time items (5) to (10) Free Cash Flow 75 to 125 Adjusted Operating Income to Free Cash Flow 13 |
![]() First Quarter 2013 Reported Comparability (1) Adjustments FX (2) Adj 2013 Adjusted 2012 Reported Comparability (1) Adjustments FX (2) Adj 2012 Adjusted Net Sales 622 - (2) 620 636 - (2) 634 Operating Income 47 6 1 54 43 16 - 59 EPS $0.05 $0.16 $0.01 $0.22 $0.32 $0.17 - $0.49 (1) See earnings press release and 10-Q for additional detail on comparability adjustments (2) Eliminates impact of foreign exchange movements Consolidated Results 14 |
![]() First Quarter 2013 Reported Comparability (1) Adjustments 2013 Adjusted 2012 Reported Comparability (1) Adjustments 2012 Adjusted Building Products 59 1 60 43 15 58 Resilient Flooring 6 6 12 11 1 12 Wood Flooring 1 - 1 2 - 2 Unallocated Corporate (Expense) Income (19) - (19) (13) - (13) Segment Operating Income (Loss) 15 (1) Eliminates impact of foreign exchange movements and non-recurring items; see earnings press release and 10-Q for additional detail |
![]() First Quarter ($ millions) 2013 2012 Net cash from operations ($14) ($33) Net cash provided by (used for) investing (37) (16) Add back (subtract) adjustments to reconcile to free cash flow Restricted cash - (1) Free Cash Flow ($51) ($50) Cash Flow 16 Cash flow information includes cash flows attributable to Cabinets |