139 205 174 0 162 97 0 119 192 91 155 213 April 2018 Investor Presentation
139 205 174 0 162 97 0 119 192 91 155 213 2 Legal Disclaimer Forward Looking Statements This document contains forward-looking statements as defined in the Private Securities Litigation Reform Act of 1995. There are several factors that could cause actual results to differ significantly from expectations described in the forward-looking statements. For a discussion of such factors, please see the Company’s most recent reports on Forms 10-K and 10-Q filed with the Securities and Exchange Commission and available on the SEC’s website at www.sec.gov. The Company does not undertake any obligation to update forward-looking statements. Non-GAAP Financial Statements This document contains certain non-GAAP financial measures in addition to results presented in accordance with Generally Accepted Accounting Principles (“GAAP”). These non-GAAP measures provide supplemental perspectives on operating results, performance trends, and financial condition. They are not a substitute for GAAP measures; they should be read and used in conjunction with the Company’s GAAP financial information. A reconciliation of non-GAAP financial measures to GAAP measures is included in the first quarter earnings release which can be found at www.bhbt.com. In all cases, it should be understood that non-GAAP per share measures do not depict amounts that accrue directly to the benefit of shareholders. The Company utilizes the non-GAAP measure of core earnings in evaluating operating trends, including components for core revenue and expense. These measures exclude items which the Company does not view as related to its normalized operations. These items include securities gains/losses, acquisition costs, restructuring costs, and systems conversion costs. Non-core adjustments are presented net of an adjustment for income tax expense. This adjustment is determined as the difference between the GAAP tax rate and the effective tax rate applicable to core income. The efficiency ratio is adjusted for non-core revenue and expense items and for tax preference items. The Company also calculates measures related to tangible equity, which adjust equity (and assets where applicable) to exclude intangible assets due to the importance of these measures to the investment community.
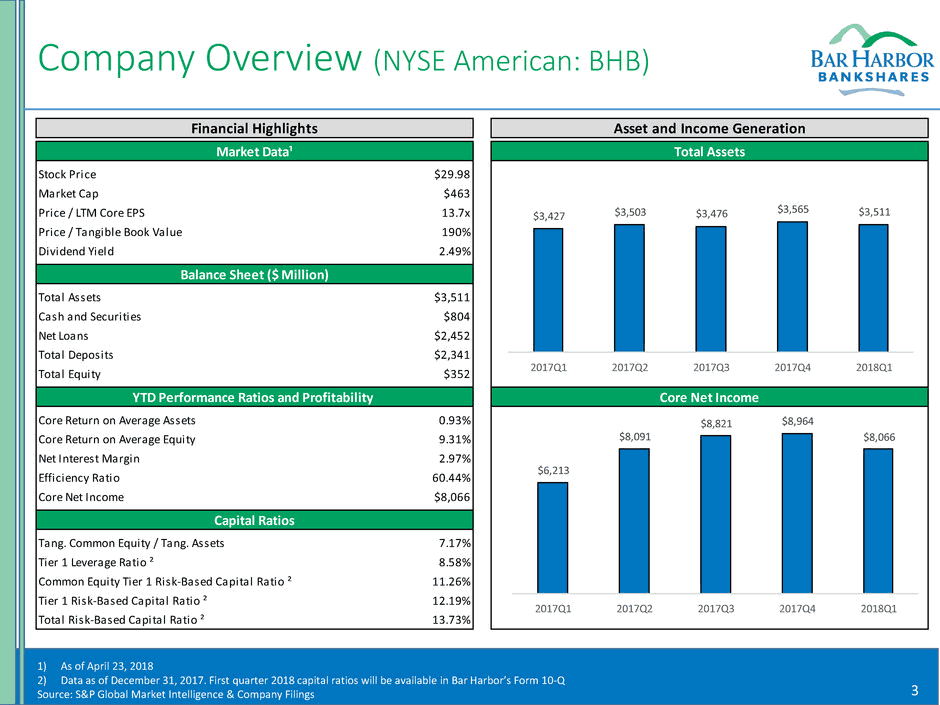
139 205 174 0 162 97 0 119 192 91 155 213 3 Company Overview (NYSE American: BHB) Financial Highlights Asset and Income Generation Market Data¹ Total Assets Stock Price $29.98 Market Cap $463 Price / LTM Core EPS 13.7x Price / Tangible Book Value 190% Dividend Yield 2.49% Balance Sheet ($ Million) Total Assets $3,511 Cash and Securities $804 Net Loans $2,452 Total Deposits $2,341 Total Equity $352 YTD Performance Ratios and Profitability Core Net Income Core Return on Average Assets 0.93% Core Return on Average Equity 9.31% Net Interest Margin 2.97% Efficiency Ratio 60.44% Core Net Income $8,066 Capital Ratios Tang. Common Equity / Tang. Assets 7.17% Tier 1 Leverage Ratio ² 8.58% Common Equity Tier 1 Risk-Based Capital Ratio ² 11.26% Tier 1 Risk-Based Capital Ratio ² 12.19% Total Risk-Based Capital Ratio ² 13.73% $3,427 $3,503 $3,476 $3,565 $3,511 2017Q1 2017Q2 2017Q3 2017Q4 2018Q1 $6,213 $8,091 $8,821 $8,964 $8,066 2017Q1 2017Q2 2017Q3 2017Q4 2018Q1 1) As of April 23, 2018 2) Data as of December 31, 2017. First quarter 2018 capital ratios will be available in Bar Harbor’s Form 10-Q Source: S&P Global Market Intelligence & Company Filings
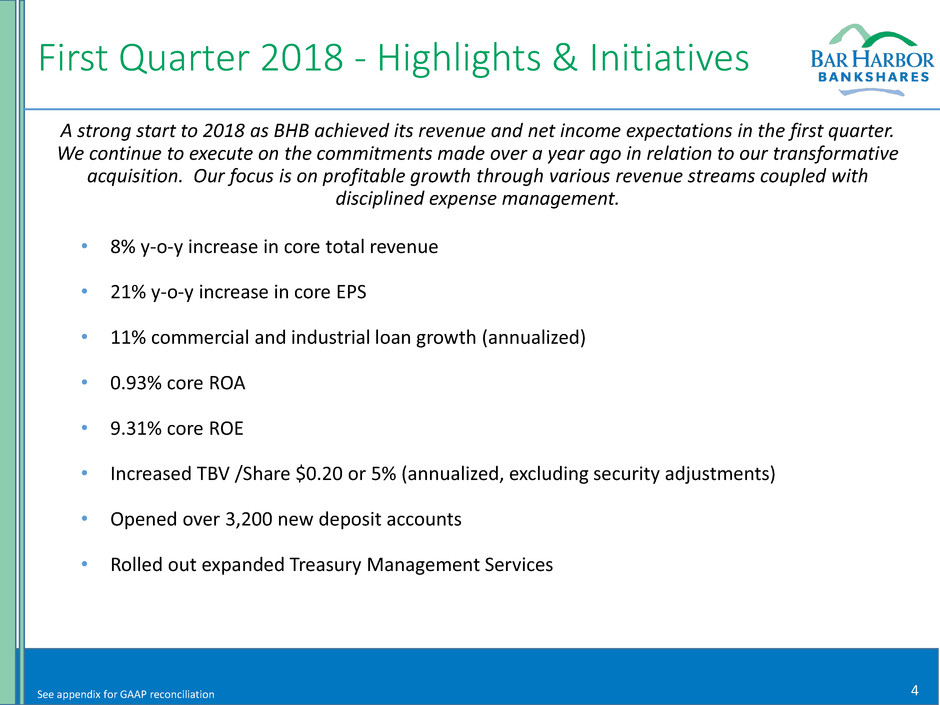
139 205 174 0 162 97 0 119 192 91 155 213 4 First Quarter 2018 - Highlights & Initiatives • 8% y-o-y increase in core total revenue • 21% y-o-y increase in core EPS • 11% commercial and industrial loan growth (annualized) • 0.93% core ROA • 9.31% core ROE • Increased TBV /Share $0.20 or 5% (annualized, excluding security adjustments) • Opened over 3,200 new deposit accounts • Rolled out expanded Treasury Management Services A strong start to 2018 as BHB achieved its revenue and net income expectations in the first quarter. We continue to execute on the commitments made over a year ago in relation to our transformative acquisition. Our focus is on profitable growth through various revenue streams coupled with disciplined expense management. See appendix for GAAP reconciliation
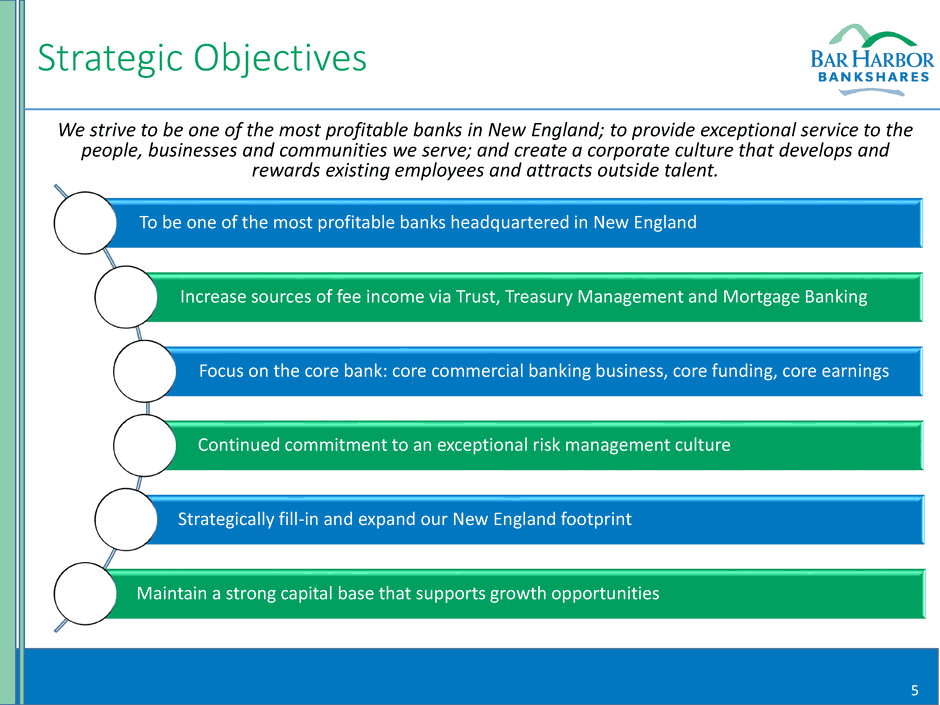
139 205 174 0 162 97 0 119 192 91 155 213 5 Strategic Objectives To be one of the most profitable banks headquartered in New England Increase sources of fee income via Trust, Treasury Management and Mortgage Banking Focus on the core bank: core commercial banking business, core funding, core earnings Continued commitment to an exceptional risk management culture Strategically fill-in and expand our New England footprint Maintain a strong capital base that supports growth opportunities We strive to be one of the most profitable banks in New England; to provide exceptional service to the people, businesses and communities we serve; and create a corporate culture that develops and rewards existing employees and attracts outside talent.
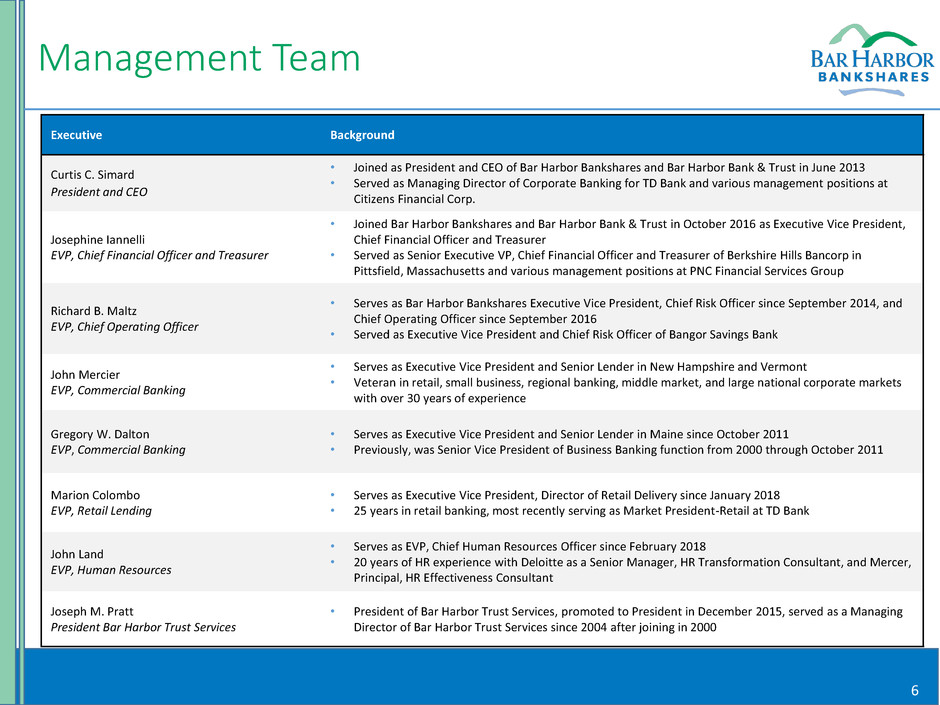
139 205 174 0 162 97 0 119 192 91 155 213 6 Management Team Executive Background Curtis C. Simard President and CEO • Joined as President and CEO of Bar Harbor Bankshares and Bar Harbor Bank & Trust in June 2013 • Served as Managing Director of Corporate Banking for TD Bank and various management positions at Citizens Financial Corp. Josephine Iannelli EVP, Chief Financial Officer and Treasurer • Joined Bar Harbor Bankshares and Bar Harbor Bank & Trust in October 2016 as Executive Vice President, Chief Financial Officer and Treasurer • Served as Senior Executive VP, Chief Financial Officer and Treasurer of Berkshire Hills Bancorp in Pittsfield, Massachusetts and various management positions at PNC Financial Services Group Richard B. Maltz EVP, Chief Operating Officer • Serves as Bar Harbor Bankshares Executive Vice President, Chief Risk Officer since September 2014, and Chief Operating Officer since September 2016 • Served as Executive Vice President and Chief Risk Officer of Bangor Savings Bank John Mercier EVP, Commercial Banking • Serves as Executive Vice President and Senior Lender in New Hampshire and Vermont • Veteran in retail, small business, regional banking, middle market, and large national corporate markets with over 30 years of experience Gregory W. Dalton EVP, Commercial Banking • Serves as Executive Vice President and Senior Lender in Maine since October 2011 • Previously, was Senior Vice President of Business Banking function from 2000 through October 2011 Marion Colombo EVP, Retail Lending • Serves as Executive Vice President, Director of Retail Delivery since January 2018 • 25 years in retail banking, most recently serving as Market President-Retail at TD Bank John Land EVP, Human Resources • Serves as EVP, Chief Human Resources Officer since February 2018 • 20 years of HR experience with Deloitte as a Senior Manager, HR Transformation Consultant, and Mercer, Principal, HR Effectiveness Consultant Joseph M. Pratt President Bar Harbor Trust Services • President of Bar Harbor Trust Services, promoted to President in December 2015, served as a Managing Director of Bar Harbor Trust Services since 2004 after joining in 2000
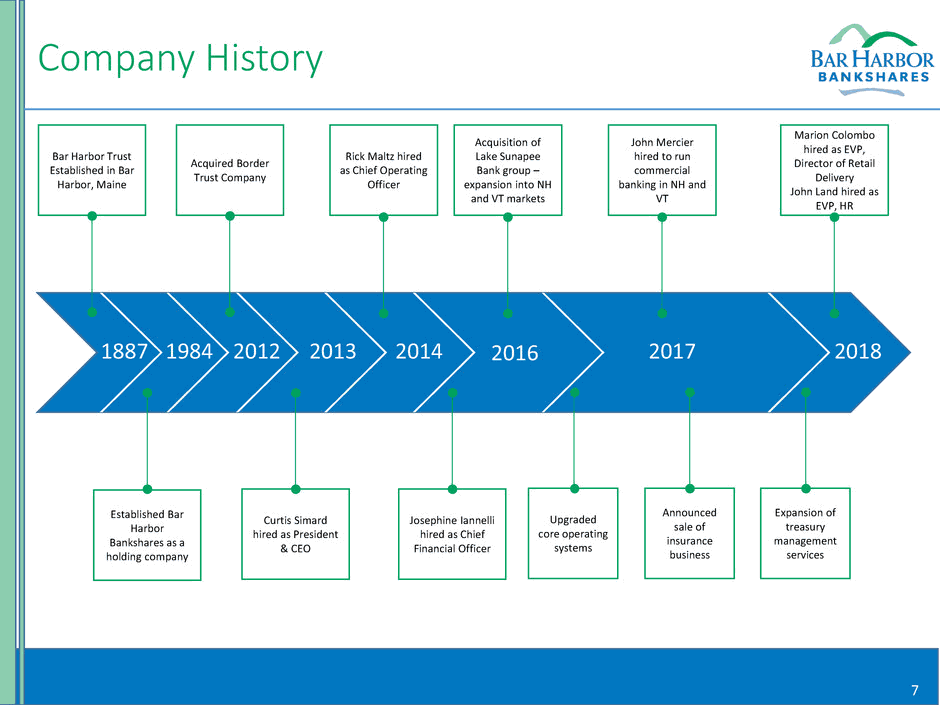
139 205 174 0 162 97 0 119 192 91 155 213 7 Company History Bar Harbor Trust Established in Bar Harbor, Maine 1887 1984 Established Bar Harbor Bankshares as a holding company 2012 Acquired Border Trust Company 2013 Curtis Simard hired as President & CEO 2014 Rick Maltz hired as Chief Operating Officer 2016 Josephine Iannelli hired as Chief Financial Officer Acquisition of Lake Sunapee Bank group – expansion into NH and VT markets John Mercier hired to run commercial banking in NH and VT Announced sale of insurance business 2017 Expansion of treasury management services Upgraded core operating systems 2018 Marion Colombo hired as EVP, Director of Retail Delivery John Land hired as EVP, HR
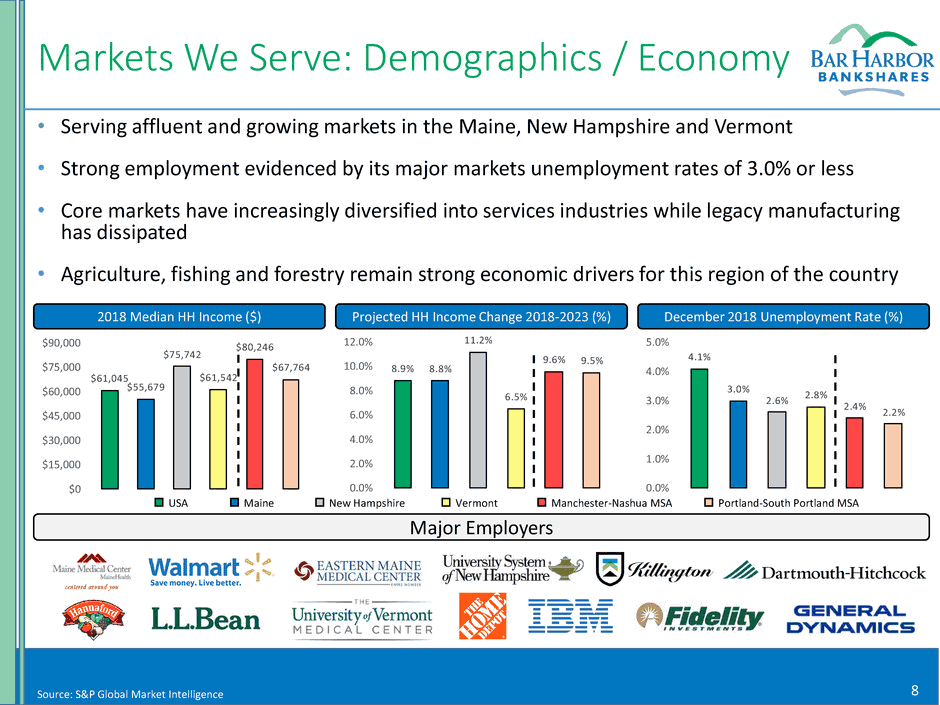
139 205 174 0 162 97 0 119 192 91 155 213 8 Markets We Serve: Demographics / Economy • Serving affluent and growing markets in the Maine, New Hampshire and Vermont • Strong employment evidenced by its major markets unemployment rates of 3.0% or less • Core markets have increasingly diversified into services industries while legacy manufacturing has dissipated • Agriculture, fishing and forestry remain strong economic drivers for this region of the country 2018 Median HH Income ($) Projected HH Income Change 2018-2023 (%) December 2018 Unemployment Rate (%) $61,045 $55,679 $75,742 $61,542 $80,246 $67,764 $0 $15,000 $30,000 $45,000 $60,000 $75,000 $90,000 8.9% 8.8% 11.2% 6.5% 9.6% 9.5% 0.0% 2.0% 4.0% 6.0% 8.0% 10.0% 12.0% 4.1% 3.0% 2.6% 2.8% 2.4% 2.2% 0.0% 1.0% 2.0% 3.0% 4.0% 5.0% Major Employers USA Maine New Hampshire Vermont Manchester-Nashua MSA Portland-South Portland MSA Source: S&P Global Market Intelligence
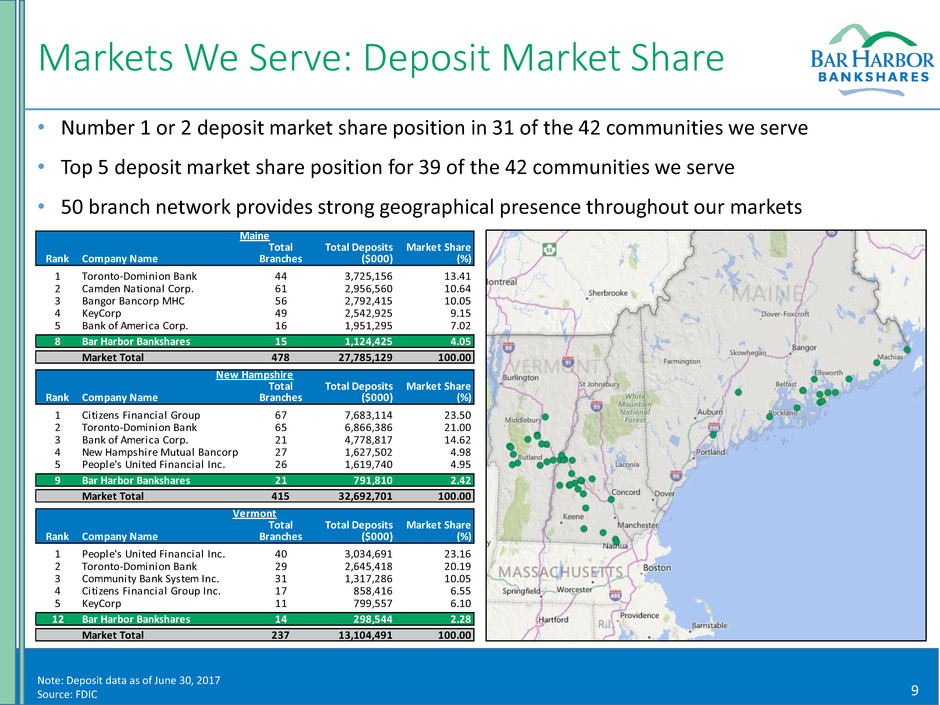
139 205 174 0 162 97 0 119 192 91 155 213 9 Markets We Serve: Deposit Market Share Note: Deposit data as of June 30, 2017 Source: FDIC • Number 1 or 2 deposit market share position in 31 of the 42 communities we serve • Top 5 deposit market share position for 39 of the 42 communities we serve • 50 branch network provides strong geographical presence throughout our markets Maine Total Total Deposits Market Share Ra k Company Name Branches ($000) (%) 1 Toronto-Dominion Bank 44 3,725,156 13.41 2 Camden National Corp. 61 2,956,560 10.64 3 Bangor Bancorp MHC 56 2,792,415 10.05 4 KeyCorp 49 2,542,925 9.15 5 Bank of America Corp. 16 1,951,295 7.02 8 Bar Harbor Bankshares 15 1,124,425 4.05 Market Total 478 27,785,129 100.00 New Hampshire Total Total Deposits Market Share Rank Company Name Branches ($000) (%) 1 Citizens Financial Group 67 7,683,114 23.50 2 Toronto-Dominion Bank 65 6,866,386 21.00 3 Bank of America Corp. 21 4,778,817 14.62 4 New Hampshire Mutual Bancorp 27 1,627,502 4.98 5 People's United Financial Inc. 26 1,619,740 4.95 9 Bar Harbor Bankshares 21 791,810 2.42 Market Total 415 32,692,701 100.00 Vermont Total Total Deposits Market Share Rank Company Name Branches ($000) (%) 1 People's United Financial Inc. 40 3,034,691 23.16 2 Toronto-Dominion Bank 29 2,645,418 20.19 3 Community Bank System Inc. 31 1,317,286 10.05 4 Citizens Financial Group Inc. 17 858,416 6.55 5 KeyCorp 11 799,557 6.10 12 Bar Harbor Bankshares 14 298,544 2.28 Market Total 237 13,104,491 100.00
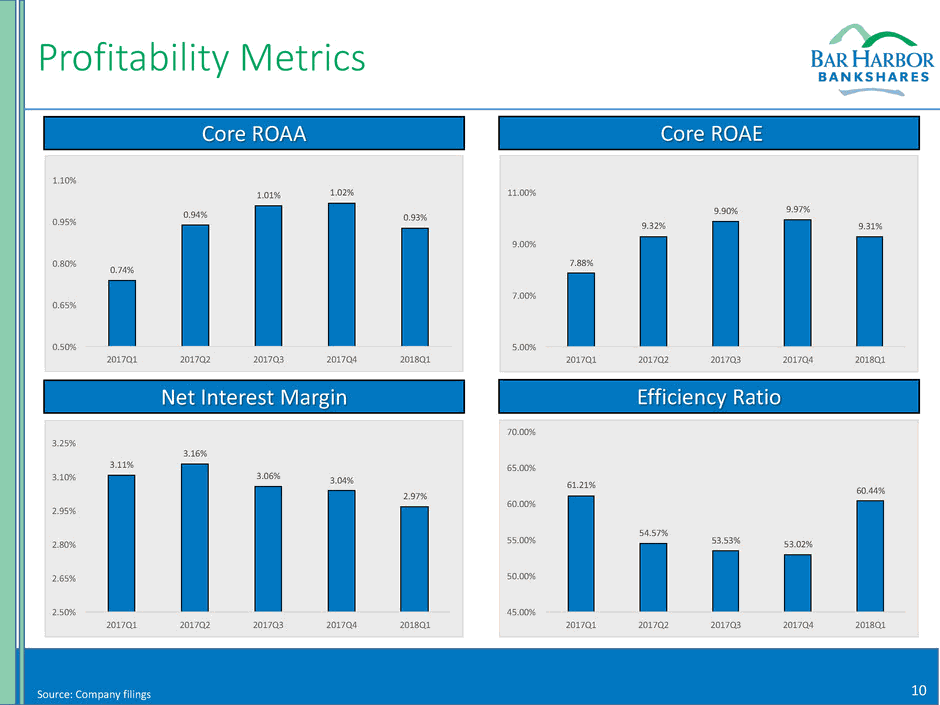
139 205 174 0 162 97 0 119 192 91 155 213 10 Profitability Metrics Efficiency Ratio Net Interest Margin Core ROAE Core ROAA Source: Company filings 0.74% 0.94% 1.01% 1.02% 0.93% 0.50% 0.65% 0.80% 0.95% 1.10% 2017Q1 2017Q2 2017Q3 2017Q4 2018Q1 7.88% 9.32% 9.90% 9.97% 9.31% 5.00% 7.00% 9.00% 11.00% 2017Q1 2017Q2 2017Q3 2017Q4 2018Q1 61.21% 54.57% 53.53% 53.02% 60.44% 45.00% 50.00% 55.00% 60.00% 65 70.00% 2017Q1 2017Q2 2017Q3 2017Q4 2018Q1 3.11% 3.16% 3.06% 3.04% 2.97% 2.50% 2.65% 2.80% 2.95% 3 10 3.25% 2017Q1 2017Q2 2017Q3 2017Q4 2018Q1
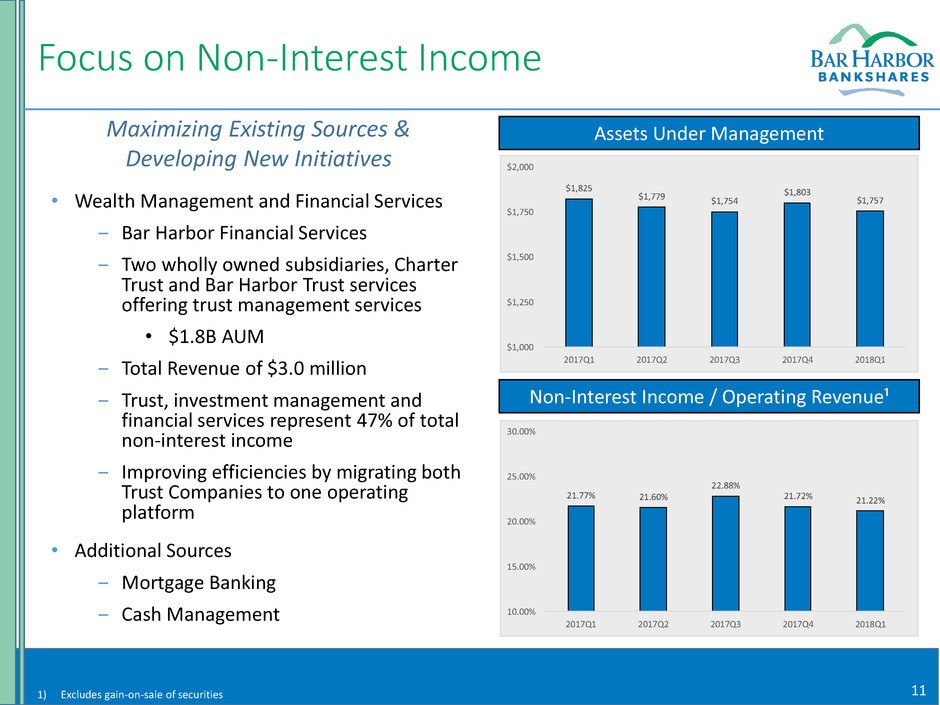
139 205 174 0 162 97 0 119 192 91 155 213 11 Focus on Non-Interest Income • Wealth Management and Financial Services ‒ Bar Harbor Financial Services ‒ Two wholly owned subsidiaries, Charter Trust and Bar Harbor Trust services offering trust management services • $1.8B AUM ‒ Total Revenue of $3.0 million ‒ Trust, investment management and financial services represent 47% of total non-interest income ‒ Improving efficiencies by migrating both Trust Companies to one operating platform • Additional Sources ‒ Mortgage Banking ‒ Cash Management Assets Under Management Non-Interest Income / Operating Revenue¹ Maximizing Existing Sources & Developing New Initiatives 1) Excludes gain-on-sale of securities $1,825 $1,779 $1,754 $1,803 $1,757 $1,000 $1,250 $1,500 $1,750 $2,000 2017Q1 2017Q2 2017Q3 2017Q4 2018Q1 21.77% 21.60% 22.88% 21.72% 21.22% 10.00% 15.00% 20.00% 25.00% 30.00% 2017Q1 2017Q2 2017Q3 2017Q4 2018Q1

139 205 174 0 162 97 0 119 192 91 155 213 12 Loan Portfolio Overview Source: Company filings Highlights Portfolio Composition as of 3/31/18 • Net loans of $2.5 billion as of March 31, 2018 • Yield on loans of 4.16% for the quarter ended March 31, 2018 • Increase of 4bps from 4Q17 • Increase of 16bps from 1Q17 • 11% annualized commercial and industrial loan growth Residential 46% CRE 34% C&I 12% Consumer 5% Tax Exempt & Other 3%
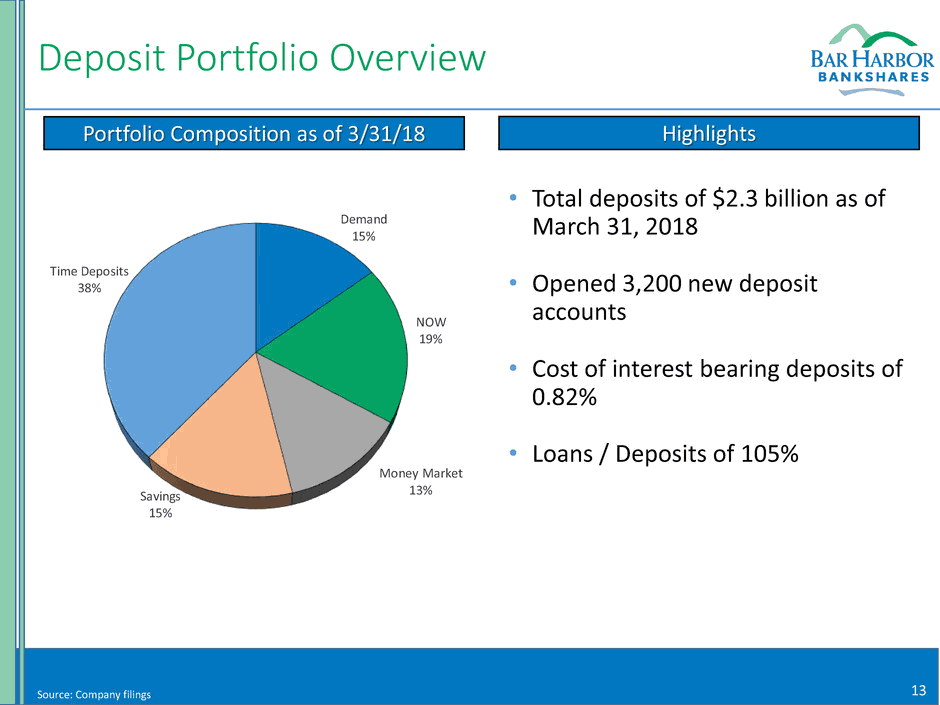
139 205 174 0 162 97 0 119 192 91 155 213 13 Deposit Portfolio Overview Source: Company filings Highlights Portfolio Composition as of 3/31/18 • Total deposits of $2.3 billion as of March 31, 2018 • Opened 3,200 new deposit accounts • Cost of interest bearing deposits of 0.82% • Loans / Deposits of 105% Demand 15% NOW 19% Money Market 13%Savings 15% Time Deposits 38%
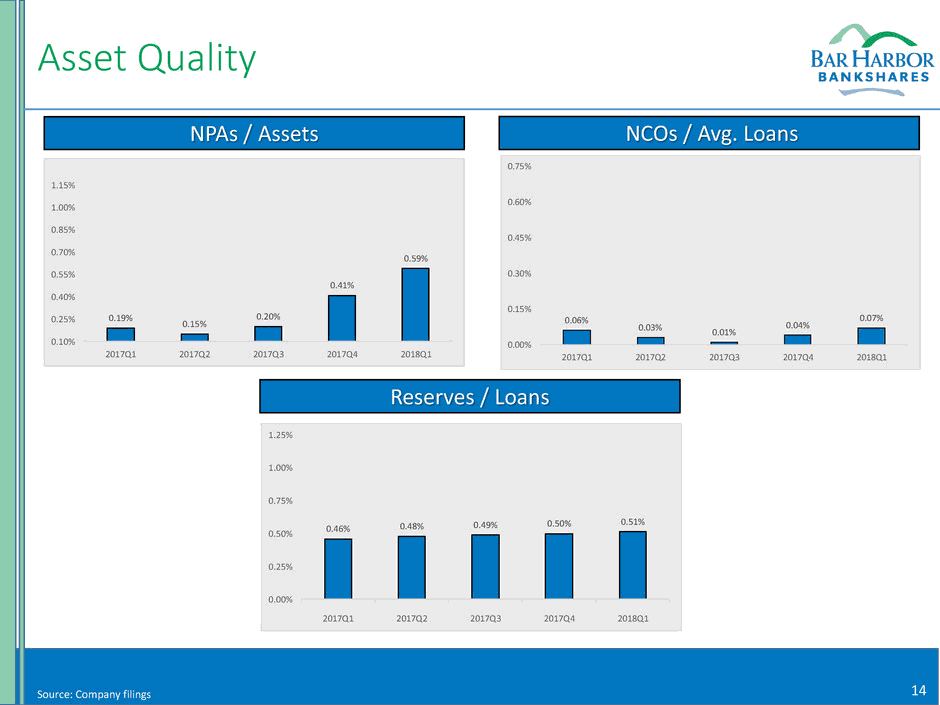
139 205 174 0 162 97 0 119 192 91 155 213 14 Asset Quality Source: Company filings Reserves / Loans NCOs / Avg. Loans NPAs / Assets 0.19% 0.15% 0.20% 0.41% 0.59% 0.10% 0.25% 0.40% 0.55% 0.70% 0.85% 1.00% 1.15% 2017Q1 2017Q2 2017Q3 2017Q4 2018Q1 0.06% 0.03% 0.01% 0.04% 0.07% 0.00% 0.15% 0.30% 0.45% 0.60% 0.75% 2017Q1 2017Q2 2017Q3 2017Q4 2018Q1 0.46% 0.48% 0.49% 0.50% 0.51% 0.00% 0.25% 0.50% 0.75% 1.00% 1.25% 2017Q1 2017Q2 2017Q3 2017Q4 2018Q1
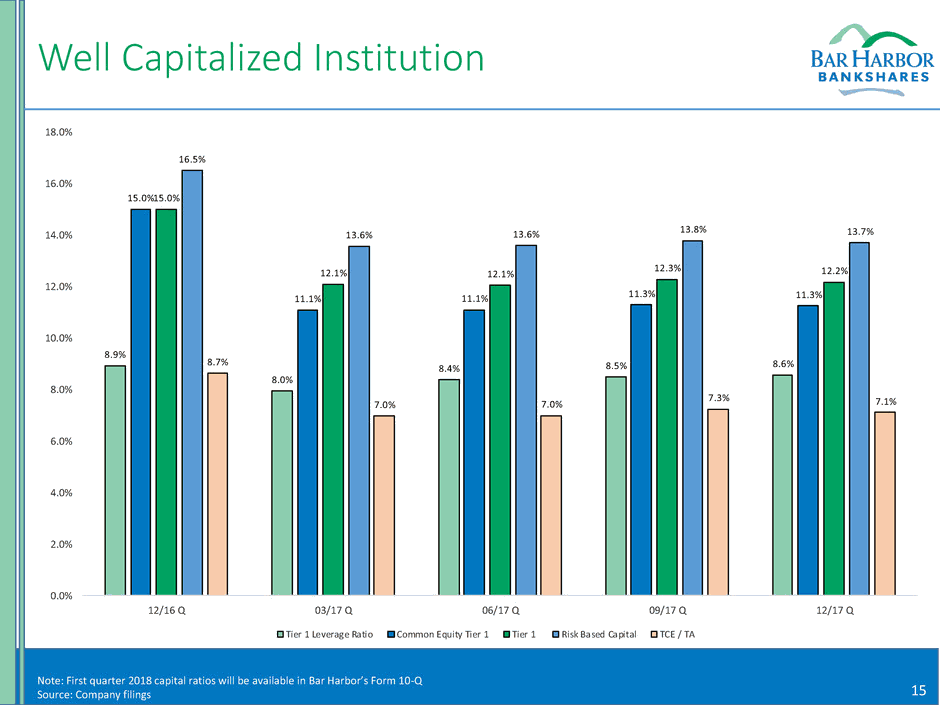
139 205 174 0 162 97 0 119 192 91 155 213 15 Well Capitalized Institution 8.9% 8.0% 8.4% 8.5% 8.6% 15.0% 11.1% 11.1% 11.3% 11.3% 15.0% 12.1% 12.1% 12.3% 12.2% 16.5% 13.6% 13.6% 13.8% 13.7% 8.7% 7.0% 7.0% 7.3% 7.1% 0.0% 2.0% 4.0% 6.0% 8.0% 10.0% 12.0% 14.0% 16.0% 18.0% 12/16 Q 03/17 Q 06/17 Q 09/17 Q 12/17 Q Tier 1 Leverage Ratio Common Equity Tier 1 Tier 1 Risk Based Capital TCE / TA Note: First quarter 2018 capital ratios will be available in Bar Harbor’s Form 10-Q Source: Company filings
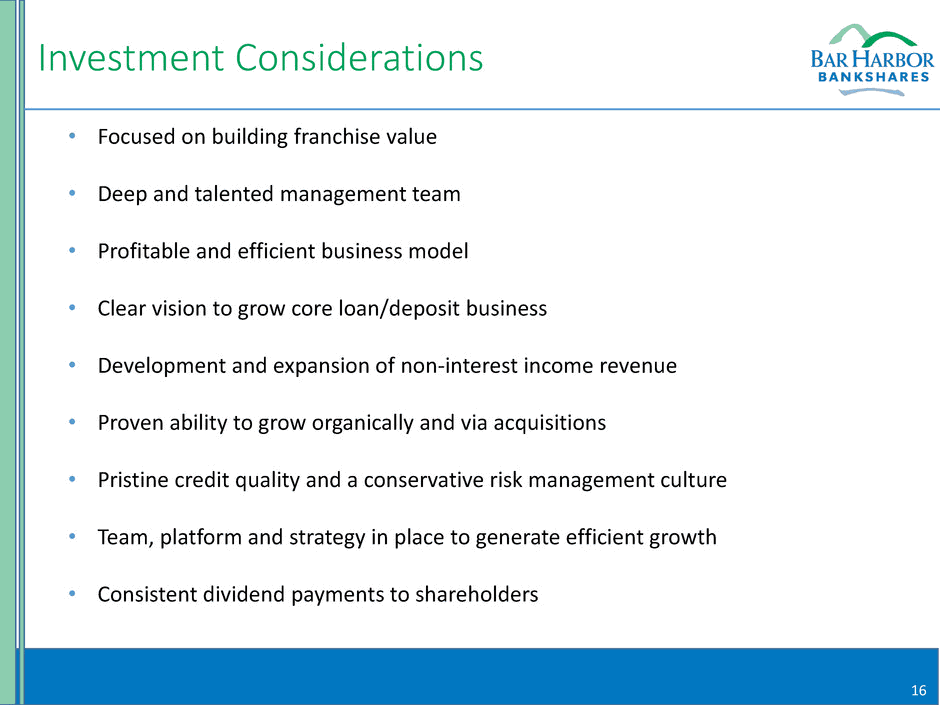
139 205 174 0 162 97 0 119 192 91 155 213 16 Investment Considerations • Focused on building franchise value • Deep and talented management team • Profitable and efficient business model • Clear vision to grow core loan/deposit business • Development and expansion of non-interest income revenue • Proven ability to grow organically and via acquisitions • Pristine credit quality and a conservative risk management culture • Team, platform and strategy in place to generate efficient growth • Consistent dividend payments to shareholders

139 205 174 0 162 97 0 119 192 91 155 213 Appendix
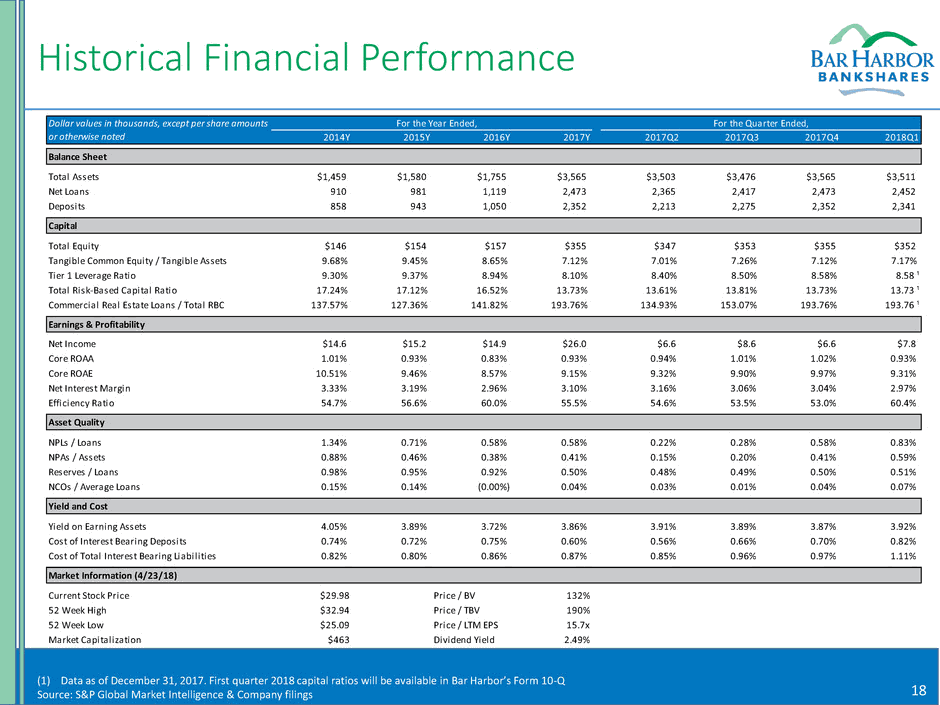
139 205 174 0 162 97 0 119 192 91 155 213 18 Historical Financial Performance (1) Data as of December 31, 2017. First quarter 2018 capital ratios will be available in Bar Harbor’s Form 10-Q Source: S&P Global Market Intelligence & Company filings For the Year Ended, For the Quarter Ended, 2014Y 2015Y 2016Y 2017Y 2017Q2 2017Q3 2017Q4 2018Q1 Balance Sheet Total Assets $1,459 $1,580 $1,755 $3,565 $3,503 $3,476 $3,565 $3,511 Net Loans 910 981 1,119 2,473 2,365 2,417 2,473 2,452 Deposits 858 943 1,050 2,352 2,213 2,275 2,352 2,341 Capital Total Equity $146 $154 $157 $355 $347 $353 $355 $352 Tangible Common Equity / Tangible Assets 9.68% 9.45% 8.65% 7.12% 7.01% 7.26% 7.12% 7.17% Tier 1 Leverage Ratio 9.30% 9.37% 8.94% 8.10% 8.40% 8.50% 8.58% 8.58 ¹ Total Risk-Based Capital Ratio 17.24% 17.12% 16.52% 13.73% 13.61% 13.81% 13.73% 13.73 ¹ Commercial Real Estate Loans / Total RBC 137.57% 127.36% 141.82% 193.76% 134.93% 153.07% 193.76% 193.76 ¹ Earnings & Profitability Net Income $14.6 $15.2 $14.9 $26.0 $6.6 $8.6 $6.6 $7.8 Core ROAA 1.01% 0.93% 0.83% 0.93% 0.94% 1.01% 1.02% 0.93% Core ROAE 10.51% 9.46% 8.57% 9.15% 9.32% 9.90% 9.97% 9.31% Net Interest Margin 3.33% 3.19% 2.96% 3.10% 3.16% 3.06% 3.04% 2.97% Efficiency Ratio 54.7% 56.6% 60.0% 55.5% 54.6% 53.5% 53.0% 60.4% Asset Quality NPLs / Loans 1.34% 0.71% 0.58% 0.58% 0.22% 0.28% 0.58% 0.83% NPAs / Assets 0.88% 0.46% 0.38% 0.41% 0.15% 0.20% 0.41% 0.59% Reserves / Loans 0.98% 0.95% 0.92% 0.50% 0.48% 0.49% 0.50% 0.51% NCOs / Average Loans 0.15% 0.14% (0.00%) 0.04% 0.03% 0.01% 0.04% 0.07% Yield and Cost Yield on Earning Assets 4.05% 3.89% 3.72% 3.86% 3.91% 3.89% 3.87% 3.92% Cost of Interest Bearing Deposits 0.74% 0.72% 0.75% 0.60% 0.56% 0.66% 0.70% 0.82% Cost of Total Interest Bearing Liabilities 0.82% 0.80% 0.86% 0.87% 0.85% 0.96% 0.97% 1.11% Market Information (4/23/18) Current Stock Price $29.98 Price / BV 132% 52 Week High $32.94 Price / TBV 190% 52 Week Low $25.09 Price / LTM EPS 15.7x Market Capitalization $463 Dividend Yield 2.49% Dollar values in thousands, except per share amounts or otherwise noted
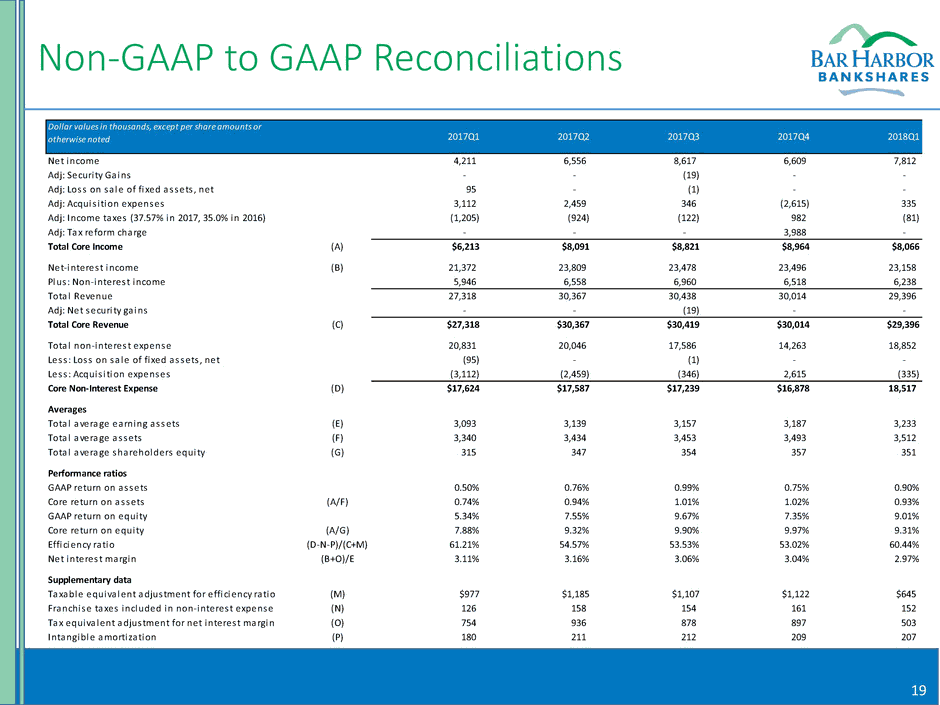
139 205 174 0 162 97 0 119 192 91 155 213 19 Non-GAAP to GAAP Reconciliations Net income 4,211 6,556 8,617 6,609 7,812 Adj: Securi ty Gains - - (19) - - Adj: Loss on sa le of fixed assets , net 95 - (1) - - Adj: Acquis i tion expenses 3,112 2,459 346 (2,615) 335 Adj: Income taxes (37.57% in 2017, 35.0% in 2016) (1,205) (924) (122) 982 (81) Adj: Tax reform charge - - - 3,988 - Total Core Income (A) $6,213 $8,091 $8,821 $8,964 $8,066 Net-interest income (B) 21,372 23,809 23,478 23,496 23,158 Plus : Non-interest income 5,946 6,558 6,960 6,518 6,238 Total Revenue 27,318 30,367 30,438 30,014 29,396 Adj: Net securi ty ga ins - - (19) - - Total Core Revenue (C) $27,318 $30,367 $30,419 $30,014 $29,396 Total non-interest expense 20,831 20,046 17,586 14,263 18,852 Less : Loss on sa le of fixed assets , net (95) - (1) - - Less : Acquis i tion expenses (3,112) (2,459) (346) 2,615 (335) Core Non-Interest Expense (D) $17,624 $17,587 $17,239 $16,878 18,517 Averages Total average earning assets (E) 3,093 3,139 3,157 3,187 3,233 Total average assets (F) 3,340 3,434 3,453 3,493 3,512 Total average shareholders equity (G) 315 347 354 357 351 Performance ratios GAAP return on assets 0.50% 0.76% 0.99% 0.75% 0.90% Core return on assets (A/F) 0.74% 0.94% 1.01% 1.02% 0.93% GAAP return on equity 5.34% 7.55% 9.67% 7.35% 9.01% Core return on equity (A/G) 7.88% 9.32% 9.90% 9.97% 9.31% Efficiency ratio (D-N-P)/(C+M) 61.21% 54.57% 53.53% 53.02% 60.44% Net interest margin (B+O)/E 3.11% 3.16% 3.06% 3.04% 2.97% Supplementary data Taxable equiva lent adjustment for efficiency ratio (M) $977 $1,185 $1,107 $1,122 $645 Franchise taxes included in non-interest expense (N) 126 158 154 161 152 Tax equiva lent adjustment for net interest margin (O) 754 936 878 897 503 Intangible amortization (P) 180 211 212 209 207 2017Q4 2018Q12017Q3 Dollar values in thousands, except per share amounts or otherwise noted 2017Q1 2017Q2
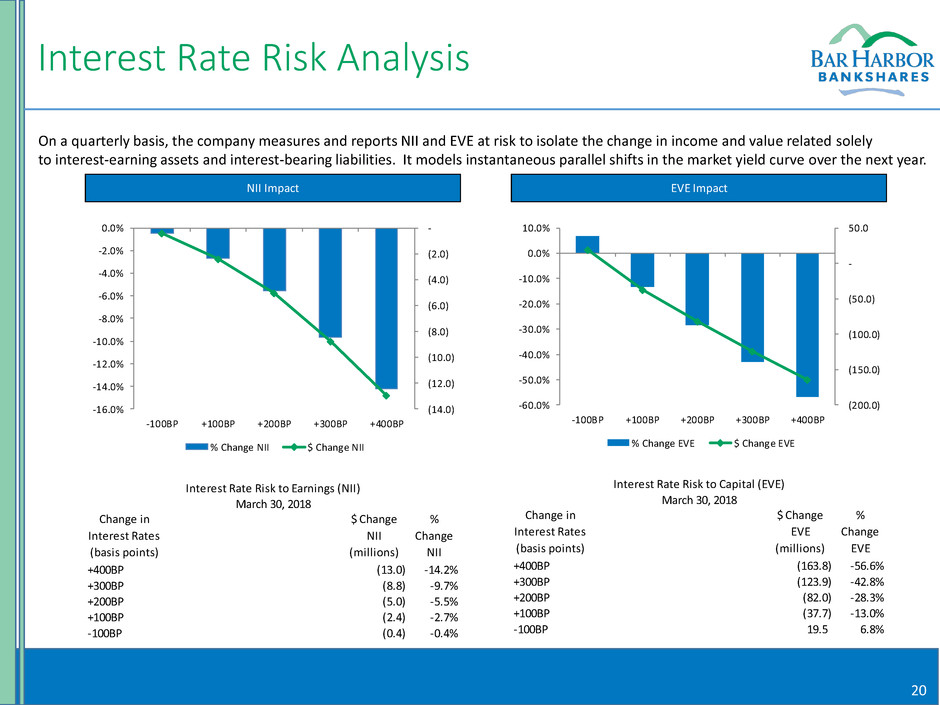
139 205 174 0 162 97 0 119 192 91 155 213 20 Interest Rate Risk Analysis On a quarterly basis, the company measures and reports NII and EVE at risk to isolate the change in income and value related solely to interest-earning assets and interest-bearing liabilities. It models instantaneous parallel shifts in the market yield curve over the next year. Change in Interest Rates (basis points) $ Change NII (millions) % Change NII +400BP (13.0) -14.2% +300BP (8.8) -9.7% +200BP (5.0) -5.5% +100BP (2.4) -2.7% -100BP (0.4) -0.4% Interest Rate Risk to Earnings (NII) March 30, 2018 NII Impact (14.0) (12.0) (10.0) (8.0) (6.0) (4.0) (2.0) - -16.0% -14.0% -12.0% -10.0% -8.0% -6.0% -4.0% -2.0% 0.0% -100BP +100BP +200BP +300BP +400BP % Change NII $ Change NII Change in Interest Rates (basis points) $ Change EVE (millions) % Change EVE +400BP (163.8) -56.6% +300BP (123.9) -42.8% +200BP (82.0) -28.3% +100BP (37.7) -13.0% -100BP 19.5 6.8% EVE Impact Interest Rate Risk to Capital (EVE) March 30, 2018 (200.0) (150.0) (100.0) (50.0) - 50.0 -60.0% -50.0% -40.0% -30.0% -20.0% -10.0% 0.0% 10.0% -100BP +100BP +200BP +300BP +400BP % Change EVE $ Change EVE


