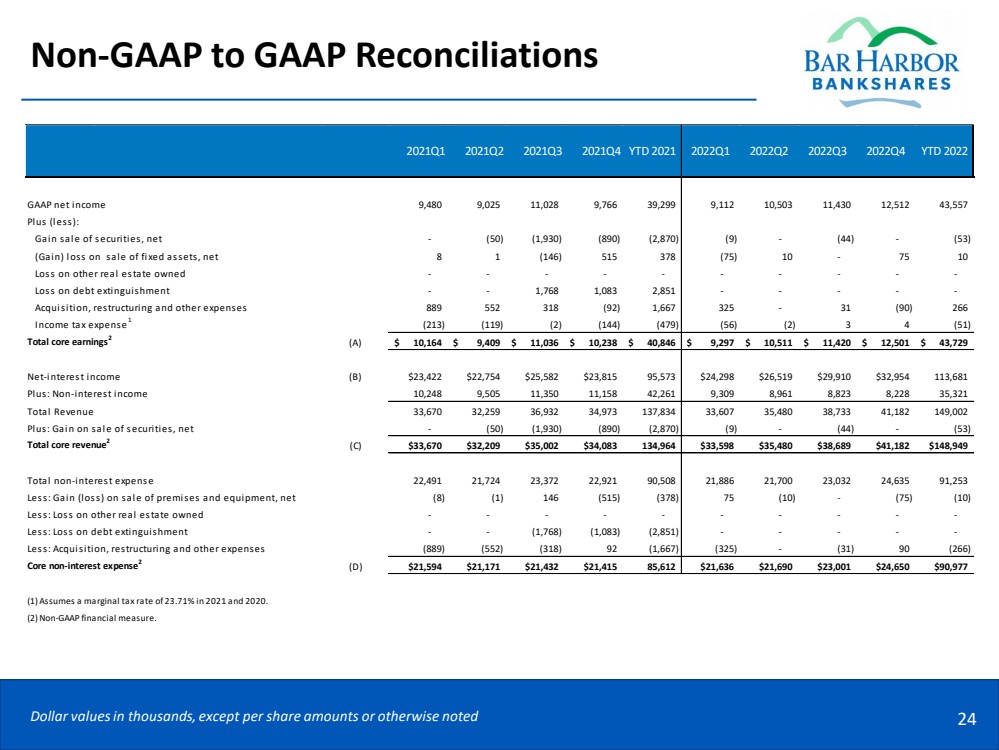
| Non‐GAAP to GAAP Reconciliations Dollar values in thousands, except per share amounts or otherwise noted 24 GAAP net income 9,480 9,025 11,028 9,766 39,299 9,112 10,503 11,430 12,512 43,557 Plus (less): Gain sale of securities, net - (50) (1,930) (890) (2,870) (9) - (44) - (53) (Gain) loss on sale of fixed assets, net 8 1 (146) 515 378 (75) 10 - 75 10 Loss on other real estate owned - - - - - - - - - - Loss on debt extinguishment - - 1,768 1,083 2,851 - - - - - Acquisition, restructuring and other expenses 889 552 318 (92) 1,667 325 - 31 (90) 266 Income tax expense 1 (213) (119) (2) (144) (479) (56) (2) 3 4 (51) Total core earnings2 (A) $ 10,164 $ 9,409 $ 11,036 $ 10,238 $ 40,846 $ 9,297 $ 10,511 $ 11,420 $ 12,501 $ 43,729 Net-interest income (B) $23,422 $22,754 $25,582 $23,815 95,573 $24,298 $26,519 $29,910 $32,954 113,681 Plus: Non-interest income 10,248 9,505 11,350 11,158 42,261 9,309 8,961 8,823 8,228 35,321 Total Revenue 33,670 32,259 36,932 34,973 137,834 33,607 35,480 38,733 41,182 149,002 Plus: Gain on sale of securities, net - (50) (1,930) (890) (2,870) (9) - (44) - (53) Total core revenue2 (C) $33,670 $32,209 $35,002 $34,083 134,964 $33,598 $35,480 $38,689 $41,182 $148,949 Total non-interest expense 22,491 21,724 23,372 22,921 90,508 21,886 21,700 23,032 24,635 91,253 Less: Gain (loss) on sale of premises and equipment, net (8) (1) 146 (515) (378) 75 (10) - (75) (10) Less: Loss on other real estate owned - - - - - - - - - - Less: Loss on debt extinguishment - - (1,768) (1,083) (2,851) - - - - - Less: Acquisition, restructuring and other expenses (889) (552) (318) 92 (1,667) (325) - (31) 90 (266) Core non-interest expense2 (D) $21,594 $21,171 $21,432 $21,415 85,612 $21,636 $21,690 $23,001 $24,650 $90,977 (1) Assumes a marginal tax rate of 23.71% in 2021 and 2020. (2) Non-GAAP financial measure. 2021Q1 2021Q2 2021Q3 2021Q4 YTD 2021 2022Q1 2022Q2 2022Q3 2022Q4 YTD 2022 |