UNITED STATES
SECURITIES AND EXCHANGE COMMISSION
Washington, D.C. 20549
FORM N-CSR
CERTIFIED SHAREHOLDER REPORT OF REGISTERED MANAGEMENT INVESTMENT COMPANIES
Investment Company Act file number 811-4006
CitiFunds Trust I
(Exact name of registrant as specified in charter)
125 Broad Street, New York, NY 10004
(Address of principal executive offices) (Zip code)
Robert I. Frenkel, Esq.
Smith Barney Fund Management LLC
300 First Stamford Place
Stamford, CT 06902
(Name and address of agent for service)
Registrant's telephone number, including area code: (800) 451-2010
Date of fiscal year end: October 31
Date of reporting period: April 30, 2005
ITEM 1. REPORT TO STOCKHOLDERS.
The Semi-Annual Report to Stockholders is filed herewith.
EMERGING MARKETS
EQUITY FUND
SEMI-ANNUAL REPORT | APRIL 30, 2005
![]()
Your Serious Money. Professionally Managed.® is a registered service mark of Citigroup Global Markets Inc.
| N O T F D I C I N S U R E D • N O T B A N K G U A R A N T E E D • M A Y L O S E V A L U E |
 | AQUICO WEN SMITH BARNEY EMERGING MARKETS EQUITY FUND | |||
AQUICO WEN, CFA, CPA | ||||
| What’s Inside | ||||
| Aquico Wen, CFA, CPA, manages the day-to-day operations of the Fund. Mr. Wen has been with Citigroup since 1998 and has 11 years of industry experience. He is supported by a team of investment professionals. | ||||
| Letter from the Chairman | 1 | |||
| Fund at a Glance | 3 | |||
| Fund Expenses | 4 | |||
| FUND OBJECTIVE | ||||
| Schedule of Investments | 6 | |||
| The Fund seeks to provide long-term capital growth. Dividend income, if any, is incidental to this goal. | ||||
| Statement of Assets and Liabilities | 11 | |||
| Statement of Operations | 12 | |||
| Statement of Changes in Net Assets | 13 | |||
| Financial Highlights | 14 | |||
| Notes to Financial Statements | 16 | |||
| L E T T E R F R O M T H E C H A I R M A N |
Dear Shareholder, Overall, the economies in many international countries were weak during the period covered by this report.This, coupled with country-specific events, caused the international equity markets to generate relatively flat returns. International equities, as measured by the MSCI EAFE Index,i returned -0.46% over the reporting period. In contrast, U.S. stocks, as measured by the S&P 500 Index,ii returned -1.74% over the same period. After a period of strong returns in late 2004, thus far in 2005, the equity markets have been volatile. International equities were weak in January and then rallied strongly in February. However, they again fell in March and April.The market’s troubles have been attributed to mixed economic data and continued high oil prices. |  | |
| R. JAY GERKEN, CFA Chairman, President and Chief Executive Officer |
December 31, 2004 through April 30, 2005. Since the Fund’s inception, its unmanaged benchmark, the MSCI Emerging Markets Index,iii returned 2.23% .
| PERFORMANCE SNAPSHOT AS OF APRIL 30, 2005 (excluding sales charges) (unaudited) | |||
| Since Inception On 1/5/05 | |||
| Emerging Markets Equity Fund — Class A Shares | 1.14 | % | |
| MSCI Emerging Markets Index | 2.23 | % | |
| 12/31/04 - 4/30/05 | |||
| Lipper Emerging Markets Funds Category Average | -1.03 | % | |
The performance shown represents past performance. Past performance is no guarantee of future results and current performance may be higher or lower than the performance shown above. Principal value and investment returns will fluctuate and investors’ shares, when redeemed, may be worth more or less than their original cost.
Current reimbursements and/or fee waivers are voluntary, and may be reduced or terminated at any time. Absent these reimbursements or waivers, performance would have been lower.
Class A share returns assume the reinvestment of all distributions, if any, at net asset value and the deduction of all Fund expenses. Returns have not been adjusted to include sales charges that may apply when shares are purchased or the deduction of taxes that a shareholder would pay on fund distributions. Excluding sales charges, Class Y shares returned 1.05% since their inception date of 1/3/05.
| 1 | Lipper, Inc. is a major independent mutual-fund tracking organization. Returns are based on the period from December 31, 2004 through April 30, 2005, including the reinvestment of dividends and capital gains distributions, if any, calculated among the 183 funds in the Fund’s Lipper category, and excluding sales charges. |
Information About Your Fund
As you may be aware, several issues in the mutual fund industry have recently come under the scrutiny of federal and state regulators. The Fund’s Adviser and some of its affiliates have received requests for information from various government regulators regarding market timing, late trading, fees, and other mutual fund issues in connection with various investigations. The regulators appear to be examining, among other things, the Fund’s response to market timing and shareholder exchange activity, including compliance with prospectus disclosure related to these subjects. The Fund has been informed that the Adviser and its affiliates are responding to those information requests, but are not in a position to predict the outcome of these requests and investigations.
Important information concerning the Fund and its Adviser with regard to recent regulatory developments is contained in the “Additional Information” note in the Notes to the Financial Statements included in this report.
As always, thank you for your confidence in our stewardship of your assets.We look forward to helping you continue to meet your financial goals.
Sincerely,

R. Jay Gerken, CFA
Chairman, President and Chief Executive Officer
May 25, 2005
The information provided is not intended to be a forecast of future events, a guarantee of future results or investment advice. Views expressed may differ from those of the firm as a whole.
RISKS: The Fund may invest in foreign securities. Investing in foreign securities is subject to certain risks not associated with domestic investing, such as currency fluctuations, and changes in political and economic conditions. These risks are magnified in emerging or developing markets. The Fund may use derivatives, such as options and futures, which can be illiquid, may disproportionately increase losses and have a potentially large impact of Fund performance. Please see the Fund’s prospectus for more information on these and other risks.
| All index performance reflects no deduction for fees, expenses or taxes. Please note an investor cannot invest directly in an index. | |
| i | The MSCI EAFE Index is an unmanaged index of common stocks of companies located in Europe, Australasia and the Far East. |
| ii | The S&P 500 Index is a market capitalization-weighted index of 500 widely held common stocks. |
| iii | The MSCI Emerging Markets Index is a free float-adjusted market capitalization index that is designed to measure equity market performance in the global emerging markets. The index measures the performance of emerging markets in Argentina, Brazil, Chile, China, Colombia, Czech Republic, Egypt, Hungary, India, Indonesia, Israel, Jordan, Korea, Malaysia, Mexico, Morocco, Pakistan, Peru, Philippines, Poland, Russia, South Africa, Taiwan, Thailand, Turkey and Venezuela. |
| Fund at a Glance (unaudited) |
Investment Breakdown
3 Smith Barney Emerging Markets Equity Fund | 2005 Semi-Annual Report
| Fund Expenses (unaudited) |
Example
As a shareholder of the Fund, you may incur two types of costs: (1) transaction costs, including front-end and back-end sales charges (loads) on purchase payments, reinvested dividends, or other distributions; and (2) ongoing costs, including management fees; distribution and/or service (12b-1) fees; and other Fund expenses.This example is intended to help you understand your ongoing costs (in dollars) of investing in the Fund and to compare these costs with the ongoing costs of investing in other mutual funds.This example is based on an investment of $1,000 invested on January 5, 2005 and January 3, 2005 (inception dates) for Class A and Y shares respectively, and held for the period ended April 30, 2005.
Actual Expenses
The table below titled “Based on Actual Total Return” provides information about actual account values and actual expenses. You may use the information provided in this table, together with the amount you invested, to estimate the expenses that you paid over the period.To estimate the expenses you paid on your account, divide your ending account value by $1,000 (for example, an $8,600 ending account value divided by $1,000 = 8.6), then multiply the result by the number under the heading entitled “Expenses Paid During the Period”.
| Based on Actual Total Return(1) |
| Actual | |||||||||||||||
| Total Return | Beginning | Ending | Annualized | Expenses | |||||||||||
| Without | Account | Account | Expense | Paid During | |||||||||||
| Sales Charges(2) | Value | Value | Ratio | the Period(3) | |||||||||||
| Class A | 1.14 | % | $ | 1,000.00 | $ | 1,011.40 | 2.00 | % | $ | 6.34 | |||||
| Class Y | 1.05 | 1,000.00 | 1,010.50 | 1.35 | 4.35 | ||||||||||
| (1) | For the period January 5, 2005 and January 3, 2005 (inception dates) for Class A and Y shares, respectively, through April 30, 2005. |
| (2) | Assumes reinvestment of all dividends and capital gain distributions, if any, at net asset value and does not reflect the deduction of the applicable sales charge with respect to Class A shares. Total return is not annualized, as it may not be representative of the total return for the year. Performance figures may reflect voluntary fee waivers and/or expense reimbursements. Past performance is no guarantee of future results. In the absence of voluntary fee waivers and/or expense reimbursements, the total return would have been lower. |
| (3) | Expenses (net of voluntary fee waiver and/or expense reimbursements) are equal to each class’ respective annualized expense ratio, multiplied by the average account value over the period, multiplied by the number of days since inception, then divided by 365. |
| Fund Expenses (unaudited) (continued) |
Hypothetical Example for Comparison Purposes
The table below titled “Based on Hypothetical Total Return” provides information about hypothetical account values and hypothetical expenses based on the actual expense ratio and an assumed rate of return of 5.00% per year before expenses, which is not the Fund’s actual return.The hypothetical account values and expenses may not be used to estimate the actual ending account balance or expenses you paid for the period.You may use the information provided in this table to compare the ongoing costs of investing in the Fund and other funds.To do so, compare the 5.00% hypothetical example relating to the Fund with the 5.00% hypothetical examples that appear in the shareholder reports of the other funds.
Please note that the expenses shown in the table below are meant to highlight your ongoing costs only and do not reflect any transactional costs, such as front-end or back-end sales charges (loads).Therefore, the table is useful in comparing ongoing costs only, and will not help you determine the relative total costs of owning different funds. In addition, if these transaction costs were included, your costs would have been higher.
| Based on Hypothetical Total Return(1) |
| Hypothetical | Beginning | Ending | Annualized | Expenses | |||||||||||
| Annualized | Account | Account | Expense | Paid During | |||||||||||
| Total Return | Value | Value | Ratio | the Period(2) | |||||||||||
| Class A | 5.00 | % | $ | 1,000.00 | $ | 1,009.45 | 2.00 | % | $ | 6.33 | |||||
| Class Y | 5.00 | 1,000.00 | 1,011.70 | 1.35 | 4.35 | ||||||||||
| (1) | For the period January 5, 2005 and January 3, 2005 (inception dates) for Class A and Y shares, respectively, through April 30, 2005. |
| (2) | Expenses (net of voluntary waiver and/or expense reimbursements) are equal to each class’ respective annualized expense ratio, multiplied by the average account value over the period, multiplied by the number of days since inception, then divided by 365. |
Schedule of Investments (unaudited) | April 30, 2005 | |
| SHARES | ||||
| COMMON STOCK — 47.7% | ||||
Brazil — 0.2% | ||||
| 300 | Banco do Brasil S.A. | $ | 3,463 | |
| 4,400 | Diagnosticos da America S.A. (a) | 48,619 | ||
| 52,082 | ||||
Chile — 0.6% | ||||
| 2,500 | Banco Santander S.A., ADR | 78,450 | ||
| 14,550,920 | CorpBanca S.A. | 74,146 | ||
| 152,596 | ||||
| Hong Kong (b) — 3.7% | ||||
| 50,000 | China Merchants Holdings International Co., Ltd. | 97,886 | ||
| 34,000 | China Mobile (Hong Kong) Ltd. | 118,703 | ||
| 51,500 | China Netcom Group Corp. (Hong Kong) Ltd. | 69,525 | ||
| 244,000 | China Petroleum & Chemical Corp., Class H Shares | 96,368 | ||
| 94,000 | China Resources Enterprise Ltd. | 133,115 | ||
| 90,000 | China Telecom Corp. Ltd., Class H Shares | 30,642 | ||
| 240,000 | Huaneng Power International, Inc., Class H Shares | 182,877 | ||
| 13,000 | Shanghai Industrial Holdings Ltd. | 26,662 | ||
| 45,000 | Weiqiao Textile Co., Ltd., Class H Shares | 59,458 | ||
| 74,000 | Yanzhou Coal Mining Co., Ltd., Class H Shares | 101,845 | ||
| 917,081 | ||||
Hungary — 0.4% | ||||
| 24,658 | Matav Rt (b)(c) | 108,998 | ||
| Indonesia (b) — 1.0% | ||||
| 60,500 | PT Bank Rakyat Indonesia (a) | 17,019 | ||
| 20,000 | PT Gudang Garam Tbk | 31,617 | ||
| 155,000 | PT Hanjaya Mandala Sampoerna Tbk | 169,188 | ||
| 48,000 | PT Indosat Tbk | 21,711 | ||
| 239,535 | ||||
Israel — 2.7% | ||||
| 49,953 | Bank Hapoalim Ltd. (b) | 171,821 | ||
| 22,811 | Bank Leumi Le-Israel (b) | 64,528 | ||
| 6,300 | Check Point Software Technologies (a) | 131,985 | ||
| 9,638 | Teva Pharmaceutical Industries Ltd., Sponsored ADR | 301,091 | ||
| 669,425 | ||||
| Malaysia (b) — 1.9% | ||||
| 24,000 | Gamuda Berhad | 29,345 | ||
| 24,200 | Genting Berhad | 117,310 | ||
| 42,300 | Magnum Corp. Berhad | 23,071 | ||
| 14,100 | Malakoff Berhad | 27,308 | ||
| 29,300 | PLUS Expressways Berhad | 23,088 | ||
| 39,300 | Public Bank Berhad | 71,449 | ||
| 77,400 | Telekom Malaysia Berhad | 197,007 | ||
| 488,578 | ||||
6 Smith Barney Emerging Markets Equity Fund | 2005 Semi-Annual Report |
Schedule of Investments (unaudited) (continued) | April 30, 2005 | |
| SHARES | | |||
Mexico — 2.7% | ||||
| 5,100 | Coca-Cola Femsa S.A. de C.V., Sponsored ADR | $ | 116,433 | |
| 12,400 | Consorcio ARA S.A. de C.V. | 38,149 | ||
| 9,800 | Corp. GEO S.A. de C.V., Series B Shares (a) | 20,371 | ||
| 43,300 | Grupo Bimbo S.A. de C.V., Series A Shares | 113,289 | ||
| 40,300 | Grupo Modelo S.A. de C.V., Series C Shares | 114,530 | ||
| 8,179 | Telefonos de Mexico S.A. de C.V., Sponsored ADR — Series L Shares | 277,268 | ||
| 680,040 | ||||
Russia — 3.8% | ||||
| 10,894 | AFK Sistema, Sponsored GDR (a)(d) | 168,857 | ||
| 6,307 | AO VimpelCom, Sponsored ADR (a) | 206,365 | ||
| 1,998 | LUKOIL, Sponsored ADR | 270,729 | ||
| 4,600 | Mobile Telesystems, Sponsored ADR | 154,560 | ||
| 4,786 | OAO Gazprom, Sponsored ADR (d) | 161,528 | ||
| 962,039 | ||||
| South Africa (b) — 5.1% | ||||
| 2,772 | Impala Platinum Holdings Ltd. | 230,738 | ||
| 46,502 | MTN Group Ltd. (a) | 330,643 | ||
| 36,218 | Old Mutual Plc | 87,984 | ||
| 11,255 | Sasol Ltd. | 264,246 | ||
| 36,900 | Standard Bank Group Ltd. | 370,964 | ||
| 1,284,575 | ||||
| South Korea — 12.7% | ||||
| 300 | Cheil Communications, Inc. (b) | 49,399 | ||
| 1,930 | Hyundai Mobis (b) | 126,412 | ||
| 5,670 | Kookmin Bank (b) | 240,498 | ||
| 10,720 | Korea Electric Power Corp. (b) | 311,393 | ||
| 8,179 | KT Corp., Sponsored ADR | 165,134 | ||
| 7,130 | KT&G Corp. (b) | 257,249 | ||
| 830 | LG Chem Ltd. (b) | 31,635 | ||
| 1,370 | POSCO (b) | 248,255 | ||
| 2,293 | Samsung Electronics Co., Ltd. (b) | 1,052,019 | ||
| 190 | Samsung Fire & Marine Insurance Co., Ltd. (b) | 12,995 | ||
| 12,760 | Shinhan Financial Group Co., Ltd. (b) | 331,012 | ||
| 420 | Shinsegae Co., Ltd. (b) | 134,490 | ||
| 11,698 | SK Telecom Co., Ltd., ADR | 227,643 | ||
| 3,188,134 | ||||
| Taiwan — 9.5% | ||||
| 228,000 | Advanced Semiconductor Engineering, Inc. (a)(b) | 152,869 | ||
| 129,000 | Cathay Financial Holding Co., Ltd. (b) | 234,587 | ||
| 206,000 | Chinatrust Financial Holding Co., Ltd. (b) | 236,802 | ||
| 318,000 | Eva Airways Corp. (a)(b) | 148,601 | ||
| 118,000 | Far Eastern Textile Ltd. | 80,571 | ||
| 89,000 | Formosa Plastics Corp. (b) | 153,347 | ||
| 21,000 | Hon Hai Precision Industry Co. Ltd. (b) | 100,454 | ||
| 45,000 | Mega Financial Holding Co., Ltd. (b) | 28,317 | ||
| 112,000 | Nan Ya Plastics Corp. (b) | 161,538 | ||
| 19,000 | President Chain Store Corp. (b) | 35,075 | ||
| 101,000 | Quanta Computer, Inc. (b) | 169,451 | ||
7 Smith Barney Emerging Markets Equity Fund | 2005 Semi-Annual Report
Schedule of Investments (unaudited) (continued) | April 30, 2005 | |
| SHARES | VALUE | |||
| Taiwan — 9.5% (continued) | ||||
| 48,000 | Siliconware Precision Industries Co. (a)(b) | $ | 42,065 | |
| 93,000 | SinoPac Financial Holdings Co., Ltd. (b) | 50,594 | ||
| 86,000 | Taiwan Mobile Co., Ltd. (b) | 86,237 | ||
| 294,000 | Taiwan Semiconductor Manufacturing Co., Ltd. (a)(b) | 491,346 | ||
| 47,000 | Unimicron Technology Corp. (b) | 37,185 | ||
| 189,000 | United Microelectronics Corp. (a)(b) | 112,246 | ||
| 154,000 | Yageo Corp. (a)(b) | 47,291 | ||
| 32,000 | Yuanta Core Pacific Securities Co. (b) | 22,892 | ||
| 2,391,468 | ||||
Thailand — 2.3% | ||||
| 398,200 | Asian Property Development PCL | 37,145 | ||
| 532,400 | Italian-Thai Development PCL | 124,834 | ||
| 136,700 | Kasikornbank PCL (b) | 193,309 | ||
| 382,800 | Krung Thai Bank PCL | 81,509 | ||
| 141,400 | Land and Houses PCL, NVDR | 25,269 | ||
| 7,600 | Siam Cement PCL, NVDR | 43,539 | ||
| 63,400 | Thai Airways International PCL | 67,498 | ||
| 573,103 | ||||
Turkey — 1.1% | ||||
| 29,853 | Akbank T.A.S. (b) | 143,779 | ||
| 25,909 | Arcelik A.S. (b) | 117,654 | ||
| 3,698 | Turkiye Is Bankasi A.S., Class C Shares (b) | 18,805 | ||
| 280,238 | ||||
| TOTAL COMMON STOCK | ||||
| (Cost — $12,028,848) | 11,987,892 | |||
| PREFERRED STOCK — 7.1% | ||||
Brazil — 7.1% | ||||
| 1,100 | Bradespar S.A. | 33,946 | ||
| 5,700 | Brasil Telecom Participacoes S.A., ADR | 186,333 | ||
| 300 | Braskem S.A., Sponsored ADR | 11,763 | ||
| 5,700,000 | Centrais Electricas Brasileiras S.A., Series B Shares | 74,343 | ||
| 10,672 | Cia. Brasileira de Distribuicao Grupo Pao de Acucar, Sponsored ADR | 214,507 | ||
| 4,650 | Cia. de Bebidas das Americas, ADR | 126,015 | ||
| 10,000 | Cia. Vale do Rio Doce, Sponsored ADR | 232,000 | ||
| 16,900 | Petroleo Brasileiro S.A., ADR | 621,075 | ||
| 2,700 | Tele Centro Oeste Celular Participacoes S.A., ADR | 28,323 | ||
| 4,384 | Tele Norte Leste Participacoes S.A., ADR | 64,883 | ||
| 4,000 | Telemar Norte Leste S.A., Series A Shares | 87,593 | ||
| 3,058 | Tim Participacoes S.A., ADR | 45,870 | ||
| 1,800,000 | Ultrapar Participacoes S.A. | 32,605 | ||
| 400 | Ultrapar Participacoes S.A., Sponsored ADR | 7,396 | ||
| 4,000 | Unibanco — Uniao de Bancos Brasileiros S.A. | 26,488 | ||
| TOTAL PREFERRED STOCK | ||||
| (Cost — $1,812,133) | 1,793,140 | |||
See Notes to Financial Statements.
8 Smith Barney Emerging Markets Equity Fund | 2005 Semi-Annual Report
Schedule of Investments (unaudited) (continued) | April 30, 2005 | |
| SHARES | SECURITY | |||
| EQUITY-LINKED NOTES (b)(d)(e) — 1.6% | ||||
India — 1.6% | ||||
| 4,693 | UBS HCL Technologies Ltd., 0.000% due 1/20/06 | $ | 36,042 | |
| 2,500 | UBS Hindalco Industries Ltd., 0.000% due 1/17/06 | 68,150 | ||
| 3,500 | UBS Housing Development Finance Corp., Ltd., 0.000% due 1/17/06 | 58,765 | ||
| 4,042 | UBS Infosys Technologies Ltd., 0.000% due 1/17/06 | 175,261 | ||
| 1,700 | UBS ITC Ltd., 0.000% due 1/17/06 | 56,134 | ||
| TOTAL EQUITY-LINKED NOTES | ||||
| (Cost — $400,426) | 394,352 | |||
WARRANTS | ||||
| WARRANTS (a)(b)(d) — 1.5% | ||||
India — 1.5% | ||||
| MSDW Asia Securities Products LLC: | ||||
| 11,100 | Expiring on 3/14/07. Each warrant exercisable for 1 share of Oil and Natural Gas Corp. Ltd. common stock. | 206,815 | ||
| 7,634 | Expiring on 3/21/07. Each warrant exercisable for 1 share of Satyam Computer Services Ltd. common stock. | 70,011 | ||
| 16,100 | Expiring on 8/13/07. Each warrant exercisable for 1 share of Hindustan Petroleum Corp. Ltd. common stock. | 111,976 | ||
| TOTAL WARRANTS | ||||
| (Cost — $402,082) | 388,802 | |||
| FACE | ||||
| REPURCHASE AGREEMENT — 0.5% | ||||
| 135,000 | State Street Bank & Trust Co. dated 4/29/05, 2.600% due 5/2/05; Proceeds at maturity — $135,029; | |||
| (Fully collateralized by U.S. Treasury Bond, 7.250% due 8/15/22; | ||||
| Market value — $140,168) (Cost — $135,000) | 135,000 | |||
| TOTAL INVESTMENTS — 58.4% (Cost — $14,778,489*) | 14,699,186 | |||
| Other Assets in Excess of Liabilities — 41.6% | 10,452,595 | |||
| TOTAL NET ASSETS — 100.0% | $ | 25,151,781 | ||
| (a) | Non-income producing security. | ||
| (b) | Securities are fair valued at April 30, 2005 in accordance with the policies adopted by the Board of Trustees (See Note 1a). | ||
| (c) | Effective 5/10/05, the company name changed from “Matav Rt” to “Magyar Telekom Rt”. | ||
| (d) | Security is exempt from registration under Rule 144A of the Securities Act of 1933. This security may be resold in transactions that are exempt from registration, normally to qualified institutional buyers. This security has been deemed liquid pursuant to guidelines approved by the Board of Trustees. | ||
| (e) | Equity-linked security whereby the coupon, dividend and or redemption amount is linked to the price of an underlying equity security. | ||
| * | Aggregate cost for federal income tax purposes is substantially the same. | ||
| Abbreviations used in this schedule: | ||
| ADR | — American Depositary Receipt | |
| GDR | — Global Depositary Receipt | |
| NVDR | — Non-Voting Depositary Receipt | |
9 Smith Barney Emerging Markets Equity Fund | 2005 Semi-Annual Report
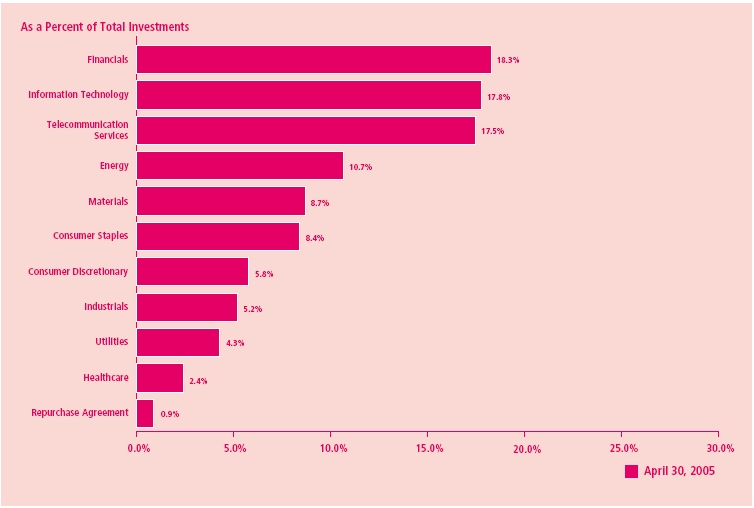
Summary of Investments by Sector* (unaudited) | April 30, 2005 | |
| Financials | 18.3 | % | |
| Information Technology | 17.8 | ||
| Telecommunication Services | 17.5 | ||
| Energy | 10.7 | ||
| Materials | 8.7 | ||
| Consumer Staples | 8.4 | ||
| Consumer Discretionary | 5.8 | ||
| Industrials | 5.2 | ||
| Utilities | 4.3 | ||
| Healthcare | 2.4 | ||
| Repurchase Agreement | 0.9 | ||
| 100.0 | % | ||
* As a percentage of total investments. Please note that Fund holdings are as of April 30, 2005 and are subject to change.
10 Smith Barney Emerging Markets Equity Fund | 2005 Semi-Annual Report
Statement of Assets and Liabilities (unaudited) | April 30, 2005 | |
| ASSETS: | |||
| Investments, at value (Cost — $14,778,489) | $ | 14,699,186 | |
| Foreign currency, at value (Cost — $155,281) | 155,855 | ||
| Cash | 417 | ||
| Receivable for shares of beneficial interest sold | 10,045,321 | ||
| Receivable for securities sold | 335,710 | ||
| Receivable from Manager | 104,968 | ||
| Dividends and interest receivable | 48,579 | ||
| Receivable for foreign currency contracts | 17,388 | ||
| Prepaid expenses | 3,122 | ||
| Total Assets | 25,410,546 | ||
| LIABILITIES: | |||
| Payable for securities purchased | 188,381 | ||
| Payable for foreign currency contracts | 17,432 | ||
| Distribution and service plan fees payable | 2,343 | ||
| Trustees’ fees payable | 240 | ||
| Transfer agency services payable | 205 | ||
| Accrued expenses | 50,164 | ||
| Total Liabilities | 258,765 | ||
| Total Net Assets | $ | 25,151,781 | |
| NET ASSETS: | |||
| Par value of shares of beneficial interest (Note 6) | $ | 22 | |
| Capital paid in excess of par value | 25,083,247 | ||
| Undistributed net investment income | 22,942 | ||
| Accumulated net realized gain from investment transactions and foreign currency transactions | 124,338 | ||
| Net unrealized depreciation of investments and foreign currencies | (78,768 | ) | |
| Total Net Assets | $ | 25,151,781 | |
| NET ASSET VALUE | |||
| Class A Shares: | |||
| Net asset value per share ($11,247,719 ÷ 975,283 shares outstanding) | $11.53 | ||
| Offering price per share (based on a maximum sales charge of 5.00%) | $12.14 | * | |
| Class Y Shares: | |||
| Net asset value, offering price and redemption price per share ($13,904,062 ÷ 1,206,895 shares outstanding) | $11.52 | ||
| * | Based on single purchases of less than $25,000. |
11 Smith Barney Emerging Markets Equity Fund | 2005 Semi-Annual Report
Statement of Operations (unaudited) | For the Period January 3, 2005* through April 30, 2005 | |
| INVESTMENT INCOME: | ||||
| Dividends | $ | 114,415 | ||
| Interest | 5,781 | |||
| Less: Foreign withholding tax | (9,964 | ) | ||
| Total Investment Income | 110,232 | |||
| EXPENSES: | ||||
| Legal fees | 82,019 | |||
| Custody fees | 48,160 | |||
| Management fee (Note 2) | 45,590 | |||
| Shareholder communications (Note 5) | 37,145 | |||
| Audit and tax fees | 12,000 | |||
| Distribution and service plan fees (Notes 2 and 5) | 8,655 | |||
| Trustees’ fees (Note 2) | 786 | |||
| Registration fees | 488 | |||
| Transfer agency services (Notes 2 and 5) | 375 | |||
| Other | 2,630 | |||
| Total Expenses | 237,848 | |||
| Less: Management fee waiver and expense reimbursement (Note 2) | (150,558 | ) | ||
| Net Expenses | 87,290 | |||
| Net Investment Income | 22,942 | |||
REALIZED AND UNREALIZED GAIN (LOSS) ON INVESTMENTS | ||||
| AND FOREIGN CURRENCIES (NOTES 1 AND 3): | ||||
| Realized Gain (Loss) From: | ||||
| Investment transactions | 161,115 | |||
| Foreign currency transactions | (36,777 | ) | ||
| Net Realized Gain | 124,338 | |||
| Net Change in Unrealized Appreciation/Depreciation From: | ||||
| Investments | (79,303 | ) | ||
| Foreign currencies | 535 | |||
| Net Change in Unrealized Appreciation/Depreciation | (78,768 | ) | ||
| Net Gain on Investments and Foreign Currencies | 45,570 | |||
| Increase in Assets From Operations | $ | 68,512 | ||
| * | Commencement of Operations. |
12 Smith Barney Emerging Markets Equity Fund | 2005 Semi-Annual Report
Statement of Changes in Net Assets (unaudited) | For the Period January 3, 2005* through April 30, 2005 | |
| OPERATIONS: | ||||
| Net investment income | $ | 22,942 | ||
| Net realized gain | 124,338 | |||
| Net change in unrealized appreciation/depreciation | (78,768 | ) | ||
| Increase in Net Assets From Operations | 68,512 | |||
| TRANSACTIONS IN SHARES OF BENEFICIAL INTEREST (NOTE 6): | ||||
| Net proceeds from sale of shares | 26,556,370 | |||
| Cost of shares reacquired | (1,473,101 | ) | ||
| Increase in Net Assets From Transactions in Shares of Beneficial Interest | 25,083,269 | |||
| Increase in Net Assets | 25,151,781 | |||
| NET ASSETS: | ||||
| Beginning of period | — | |||
| End of period† | $ | 25,151,781 | ||
| † Includes undistributed net investment income of: | $ | 22,942 | ||
| * | Commencement of Operations. |
13 Smith Barney Emerging Markets Equity Fund | 2005 Semi-Annual Report
| Financial Highlights |
For a share of each class of beneficial interest outstanding for the period ended April 30, 2005:
| Class A Shares | 2005 | (1)(2) | ||
| Net Asset Value, Beginning of Period | $ | 11.40 | ||
| Income From Operations: | ||||
| Net investment income | 0.01 | |||
| Net realized and unrealized gain | 0.12 | |||
| Total Income From Operations | 0.13 | |||
| Net Asset Value, End of Period | $ | 11.53 | ||
| Total Return(3) | 1.14 | %‡ | ||
| Net Assets, End of Period (000s) | $ | 11,248 | ||
| Ratios to Average Net Assets: | ||||
| Expenses(4)(5) | 2.00 | %† | ||
| Net investment income | 0.33 | † | ||
| Portfolio Turnover Rate | 27 | % | ||
| (1 | ) | For the period January 5, 2005 (inception date) to April 30, 2005 (unaudited). |
| (2 | ) | Per share amounts have been calculated using the monthly average shares method. |
| (3 | ) | Performance figures may reflect voluntary fee waivers and/or expense reimbursements. Past performance is no guarantee of future results. In the absence of voluntary fee waivers and/or expense reimbursements, the total return would have been lower. |
| (4 | ) | The investment manager voluntarily waived all of its management fees and reimbursed expenses for the period ended April 30, 2005. If such fees were not voluntarily waived and expenses not reimbursed, the actual expense ratio would have been 5.29% (annualized). |
| (5 | ) | The ratio of expenses to average net assets will not exceed 2.00%, as a result of a voluntary expense limitation, which may be terminated at any time. |
| ‡ | Total return is not annualized, as it may not be representative of the total return for the year. | |
| † | Annualized. |
See Notes to Financial Statements.
14 Smith Barney Emerging Markets Equity Fund | 2005 Semi-Annual Report
| Financial Highlights (continued) |
For a share of each class of beneficial interest outstanding for the period ended April 30, 2005:
| Class Y Shares | 2005 | (1)(2) | |
| Net Asset Value, Beginning of Period | $ | 11.40 | |
| Income From Operations: | |||
| Net investment income | 0.02 | ||
| Net realized and unrealized gain | 0.10 | ||
| Total Income From Operations | 0.12 | ||
| Net Asset Value, End of Period | $ | 11.52 | |
| Total Return(3) | 1.05 | %‡ | |
| Net Assets, End of Period (000s) | $ | 13,904 | |
| Ratios to Average Net Assets: | |||
| Expenses(4)(5) | 1.35 | %† | |
| Net investment income | 0.87 | † | |
| Portfolio Turnover Rate | 27 | % | |
| (1 | ) | For the period January 3, 2005 (inception date) to April 30, 2005 (unaudited). | |
| (2 | ) | Per share amounts have been calculated using the monthly average shares method. | |
| (3 | ) | Performance figures may reflect voluntary fee waivers and/or expense reimbursements. Past performance is no guarantee of future results. In the absence of voluntary fee waivers and/or expense reimbursements, the total return would have been lower. | |
| (4 | ) | The investment manager voluntarily waived all of its management fees and reimbursed expenses for the period ended April 30, 2005. If such fees were not voluntarily waived and expenses not reimbursed, the actual expense ratio would have been 4.09% (annualized). | |
| (5 | ) | The ratio of expenses to average net assets will not exceed 1.35%, as a result of a voluntary expense limitation, which may be terminated at any time. | |
| ‡ | Total return is not annualized, as it may not be representative of the total return for the year. | ||
| † | Annualized. |
15 Smith Barney Emerging Markets Equity Fund | 2005 Semi-Annual Report
| Notes to Financial Statements (unaudited) |
1. Organization and Significant Accounting Policies
Smith Barney Emerging Markets Equity Fund (the “Fund”) is a separate diversified series of CitiFunds Trust I (the “Trust”), a Massachusetts business trust. The Trust is registered under the Investment Company Act of 1940 (the “1940 Act”), as amended, as an open-end management investment company.
The following is a summary of the significant accounting policies consistently followed by the Fund.These policies are in conformity with U.S. generally accepted accounting principles (“GAAP”). Estimates and assumptions are required to be made regarding assets, liabilities and changes in net assets resulting from operations when financial statements are prepared. Changes in the economic environment, financial markets and any other parameters used in determining these estimates could cause actual results to differ.
(a) Investment Valuation. Equity securities for which market quotations are available are valued at the last sale price or official closing price on the primary market or exchange on which they trade. Debt securities are valued at the mean between the bid and asked price provided by an independent pricing service that are based on transactions in debt obligations, quotations from bond dealers, market transactions in comparable securities and various relationships between securities.When prices are not readily available, or are determined not to reflect fair value, such as when the value of a security has been significantly affected by events after the close of the exchange or market on which the security is principally traded, but before the Fund calculates its net asset value, the Fund may value these investments at fair value as determined in accordance with the procedures approved by the Fund’s Board of Trustees. Fair valuing of securities may be determined with the assistance of a pricing service using calculations based on indices of domestic securities and other appropriate indicators, such as prices of relevant ADRs and futures contracts. Short-term obligations maturing within 60 days are valued at amortized cost, which approximates market value.
(b) Repurchase Agreements.When entering into repurchase agreements, it is the Fund’s policy that its custodian or a third party custodian take possession of the underlying collateral securities, the market value of which at least equals the principal amount of the repurchase transaction, including accrued interest.To the extent that any repurchase transaction exceeds one business day, the value of the collateral is marked-to-market to ensure the adequacy of the collateral. If the seller defaults, and the market value of the collateral declines or if bankruptcy proceedings are commenced with respect to the seller of the security, realization of the collateral by the Fund may be delayed or limited.
(c) Equity-Linked Notes. Equity-linked notes, or ELNs, are debt securities that pay interest based upon the performance of one or more equity securities, such as a stock index, a group of stocks or a single stock. ELNs offer investors the opportunity to participate in the appreciation of the underlying equity securities, often subject to a cap on the interest payable. ELNs are typically considered more conservative investments than investments in the equity securities to which they are linked, as ELNs generally provide for the repayment at maturity of the principal amount invested, plus interest (if any). However, in addition to the credit and market risks applicable to debt securities, ELNs are subject to the risk that an investor will receive less than the prevailing rate of interest if the value of the relevant equity securities decline or fail to increase sufficiently.
(d) Security Transactions and Investment Income. Security transactions are accounted for on a trade date basis. Interest income, adjusted for amortization of premium and accretion of discount, is recorded on the accrual basis. Dividend income is recorded on the ex-dividend date. Foreign dividend income is recorded on the ex-dividend date or as soon as practical after the Fund determines the existence of a dividend declaration after exercising reasonable due diligence. The cost of investments sold is determined by use of the specific identification method.
| Notes to Financial Statements (unaudited) (continued) |
(e) Foreign Currency Translation. Investment securities and other assets and liabilities denominated in foreign currencies are translated into U.S. dollar amounts based upon prevailing exchange rates on the date of valuation. Purchases and sales of investment securities and income and expense items denominated in foreign currencies are translated into U.S. dollar amounts based upon prevailing exchange rates on the respective dates of such transactions.
The Fund does not isolate that portion of the results of operations resulting from changes in foreign exchange rates on investments from the fluctuations arising from changes in market prices of securities held. Such fluctuations are included with the net realized and unrealized gain or loss on investments.
Net realized foreign exchange gains or losses arise from sales of foreign currencies, including gains and losses on forward foreign currency contracts, currency gains or losses realized between the trade and settlement dates on securities transactions and the difference between the amounts of dividends, interest and foreign withholding taxes recorded on the Fund’s books and the U.S. dollar equivalent of the amounts actually received or paid. Net unrealized foreign exchange gains and losses arise from changes in the fair values of assets and liabilities, other than investments in securities, at the date of valuation, resulting from changes in exchange rates.
Foreign security and currency transactions may involve certain considerations and risks not typically associated with those of U.S. dollar denominated transactions as a result of, among other factors, the possibility of lower levels of governmental supervision and regulation of foreign securities markets and the possibility of political or economic instability.
(f) Distributions to Shareholders. Distributions from net investment income and distributions of net realized gains, if any, are declared at least annually. Distributions to shareholders of the Fund are recorded on the ex-dividend date and are determined in accordance with income tax regulations, which may differ from GAAP.
(g) Class Accounting. Investment income, common expenses and realized/unrealized gain (loss) on investments are allocated to the various classes of the Fund on the basis of daily net assets of each class. Fees relating to a specific class are charged directly to that class.
(h) Federal and Other Taxes. It is the Fund’s policy to comply with the federal income and excise tax requirements of the Internal Revenue Code of 1986, as amended, applicable to regulated investment companies.Accordingly, the Fund intends to distribute substantially all of its taxable income and net realized gains on investments, if any, to shareholders each year. Therefore, no federal income tax provision is required in the Fund’s financial statements. Under the applicable foreign tax laws, a withholding tax may be imposed on interest, dividends and capital gains at various rates.
(i) Reclassifications. GAAP requires that certain components of net assets be adjusted to reflect permanent differences between financial and tax reporting.These reclassifications have no effect on net assets or net asset values per share.
2. Management Agreement and Other Transactions with Affiliates
Smith Barney Fund Management LLC (“SBFM”), an indirect wholly-owned subsidiary of Citigroup Inc. (“Citigroup”), acts as investment manager to the Fund. SBFM delegates the daily management of the investments of the Fund to its affiliate, Citigroup Asset Management, Ltd., as sub-advisor.The Fund pays SBFM a management fee calculated at the annual rate of 0.95% of the average daily net assets. This fee is calculated daily and paid monthly. Citigroup Asset Management, Ltd. is compensated by SBFM at no additional expense to the Fund.
During the period ended April 30, 2005, the Fund’s Class A and Y shares had voluntary expense limitations in place of 2.00% and 1.35%, respectively, of each class’ respective average daily net assets, resulting in waived management fees of $45,590 and expense reimbursements of $104,968.These expense limitations can be terminated at any time by SBFM.
Citicorp Trust Bank, fsb. (“CTB”), another subsidiary of Citigroup, acts as the Fund’s transfer agent. PFPC Inc. (“PFPC”) acts as the Fund’s sub-transfer agent. CTB receives account fees and asset-based fees that vary according to the size and type
| Notes to Financial Statements (unaudited) (continued) |
of account. PFPC is responsible for shareholder recordkeeping and financial processing for all shareholder accounts and is paid by CTB. For the period ended April 30, 2005, the Fund paid transfer agent fees of $159 to CTB.
Citigroup Global Markets Inc. (“CGM”), another indirect wholly-owned subsidiary of Citigroup, acts as the Fund’s distributor.
There is a maximum initial sales charge of 5.00% for Class A shares.There is a contingent deferred sales charge (“CDSC”) of 5.00% on Class B shares, which applies if redemption occurs within one year from purchase payment and declines thereafter by 1.00% a year until no CDSC is incurred. Class C shares have a 1.00% CDSC, which applies if redemption occurs within one year from purchase payment. In certain cases, Class A shares have a 1.00% CDSC, which applies if redemption occurs within one year from purchase payment.This CDSC only applies to those purchases of Class A shares, which, when combined with current holdings of Class A shares, equal or exceed $1,000,000 in the aggregate.These purchases do not incur an initial sales charge.
For the period ended April 30, 2005, CGM received sales charges of approximately $2,000 on sales of the Fund’s Class A shares. There were no CDSCs incurred on Class A shares for the period. In addition, no shareholders were invested in Class B or C shares of the Fund during the period. As a result, no CDSCs were incurred on Class B or C shares.
All officers and one Trustee of the Trust are employees of Citigroup or its affiliates and do not receive compensation from the Fund.
The Trustees of the Fund have adopted a Retirement Plan (the “Plan”) for all Trustees who are not “interested persons” of the Fund, within the meaning of the 1940 Act. Under the Plan, all Trustees are required to retire from the Board as of the last day of the calendar year in which the applicable Trustee attains age 75.Trustees may retire under the Plan before attaining the mandatory retirement age.Trustees who have served as Trustee of the Trust or any of the investment companies associated with Citigroup for at least ten years when they retire are eligible to receive the maximum retirement benefit under the Plan. The maximum retirement benefit is an amount equal to five times the amount of retainer and regular meeting fees payable to a Trustee during the entirety of the calendar year of the Trustee’s retirement (assuming no change in relevant facts for the balance of the year following the Trustee’s retirement).Amounts under the Plan may be paid in installments or in a lump sum (discounted to present value). Benefits under the Plan are unfunded.Three former Trustees are currently receiving payments under the Plan. In addition, two other Trustees previously elected to receive a lump sum payment under the Plan. At April 30, 2005, $295 was accrued in connection with this Plan.
3. InvestmentsDuring the period ended April 30, 2005, the aggregate cost of purchases and proceeds from sales of investments (excluding short-term securities) were as follows:
| Purchases | $ | 18,532,578 | ||
| Sales | 4,050,204 | |||
At April 30, 2005, the aggregate gross unrealized appreciation and depreciation of investments for federal income tax purposes were substantially as follows:
| Gross unrealized appreciation | $ | 500,001 | ||
| Gross unrealized depreciation | (579,304 | ) | ||
| Net unrealized depreciation | $ | (79,303 | ) | |
| Notes to Financial Statements (unaudited) (continued) |
4. Portfolio Investment Risks
Credit and Market Risk. The Fund invests in emerging market instruments which are subject to certain credit and market risks.The yields of emerging market debt obligations reflect, among other things, perceived credit risk.The consequences of political, social, economic or diplomatic changes may have disruptive effects on the market prices of investments held by the Fund. The Fund’s investment in non-dollar denominated securities may also result in foreign currency losses caused by devaluations and exchange rate fluctuations.Foreign Risk. The Fund’s investments in foreign securities may involve risks not present in domestic investments. Since securities may be denominated in a foreign currency and may require settlement in foreign currencies and pay interest or dividends in foreign currencies, changes in the relationship of these foreign currencies to the U.S. dollar can significantly affect the value of the investments and earnings of the Fund. Foreign investments may also subject the Fund to foreign government exchange restrictions, expropriation, taxation or other political, social or economic developments, all of which affect the market and/or credit risk of the investments.
5. Class Specific Expenses
Pursuant to a Rule 12b-1 Distribution and Service Plan, the Fund pays a distribution and/or service fee calculated at the annual rate of 0.25%, 1.00% and 1.00% of the average daily net assets of Class A, B and C shares, respectively. During the period, no shareholders were invested in Class B or C shares of the Fund. As a result, no Rule 12b-1 Distribution and Service Plan fees were accrued on Class B or C shares.
For the period ended April 30, 2005, total Rule 12b-1 Distribution and Service Plan fees, which are accrued daily and paid monthly, were as follows:
| Rule 12b-1 Distribution and Service Plan fees | ||
For the period ended April 30, 2005, total Transfer Agency Service expenses were as follows:
| Class A | Class Y | |||
| Transfer Agency Service Expenses | $364 | $11 | ||
For the period ended April 30, 2005 total Shareholder Communication expenses were as follows:
| Class A | Class Y | |||
| Shareholder Communication Expenses | $35,827 | $1,318 | ||
6. Shares of Beneficial Interest
At April 30, 2005, the Trust’s Declaration of Trust permits the Trust to issue an unlimited number of full and fractional shares of beneficial interest (par value $0.00001 per share) of each series and to divide or combine the shares of any series into a greater or lesser number of shares of that series without thereby changing the proportionate beneficial interests in that series and to divide such shares into classes.The Trust has reserved the right to create and issue additional series and classes of shares. Each share of a class represents an identical interest in the Fund and has the same rights, except that each class bears certain expenses specifically related to the distribution of its shares.
| Notes to Financial Statements (unaudited) (continued) |
Transactions in shares of each class were as follows:
| For the Period Ended | ||||||
| April 30, 2005 | ||||||
| Shares | Amount | |||||
| Class A† | ||||||
| Shares sold | 1,099,312 | $ | 12,695,049 | |||
| Shares reacquired | (124,029 | ) | (1,473,101 | ) | ||
| Net Increase | 975,283 | $ | 11,221,948 | |||
| Class Y‡ | ||||||
| Shares sold | 1,206,895 | $ | 13,861,321 | |||
| Shares reacquired | — | — | ||||
| Net Increase | 1,206,895 | $ | 13,861,321 | |||
‡ For the period January 3, 2005 (inception date) through April 30, 2005.
7. Additional Information
On May 31, 2005, the U.S. Securities and Exchange Commission (“SEC”) issued an order in connection with the settlement of an administrative proceeding against Smith Barney Fund Management LLC (“SBFM”) and Citigroup Global Markets Inc. (“CGMI”) relating to the appointment of an affiliated transfer agent for the Smith Barney family of mutual funds (the “Funds”).
The SEC order finds that SBFM and CGMI willfully violated Section 206(1) of the Investment Advisers Act of 1940 (“Advisers Act”). Specifically, the order finds that SBFM and CGMI knowingly or recklessly failed to disclose to the boards of the Funds in 1999 when proposing a new transfer agent arrangement with an affiliated transfer agent that: First Data Investors Services Group (“First Data”), the Funds’ then-existing transfer agent, had offered to continue as transfer agent and do the same work for substantially less money than before; and that Citigroup Asset Management (“CAM”), the Citigroup business unit that includes the fund’s investment manager and other investment advisory companies, had entered into a side letter with First Data under which CAM agreed to recommend the appointment of First Data as sub-transfer agent to the affiliated transfer agent in exchange, among other things, for a guarantee by First Data of specified amounts of asset management and investment banking fees to CAM and CGMI.The order also finds that SBFM and CGMI willfully violated Section 206(2) of the Advisers Act by virtue of the omissions discussed above and other misrepresentations and omissions in the materials provided to the Funds’ boards, including the failure to make clear that the affiliated transfer agent would earn a high profit for performing limited functions while First Data continued to perform almost all of the transfer agent functions, and the suggestion that the proposed arrangement was in the Funds’ best interests and that no viable alternatives existed. SBFM and CGMI do not admit or deny any wrongdoing or liability.The settlement does not establish wrongdoing or liability for purposes of any other proceeding.
The SEC censured SBFM and CGMI and ordered them to cease and desist from violations of Sections 206(1) and 206(2) of the Advisers Act.The order requires Citigroup to pay $208.1 million, including $109 million in disgorgement of profits, $19.1 million in interest, and a civil money penalty of $80 million.Approximately $24.4 million has already been paid to the Funds, primarily through fee waivers.The remaining $183.7 million, including the penalty, has been paid to the U.S.Treasury and will be distributed pursuant to a plan to be prepared by Citigroup and submitted within 90 days of the entry of the order for approval by the SEC.The order also requires that transfer agency fees received from the Funds since December 1, 2004 less certain expenses be placed in escrow and provides that a portion of such fees may be subsequently distributed in accordance with the terms of the order.
The order requires SBFM to recommend a new transfer agent contract to the Fund boards within 180 days of the entry of the order; if a Citigroup affiliate submits a proposal to serve as transfer agent or sub-transfer agent, an independent monitor must be engaged at the expense of SBFM and CGMI to oversee a competitive bidding process. Under the order, Citigroup also must comply with an amended version of a vendor policy that Citigroup instituted in August 2004. That policy, as amended, among other things, requires that when requested by a Fund board, CAM will retain at its own expense an
| Notes to Financial Statements (unaudited) (continued) |
independent consulting expert to advise and assist the board on the selection of certain service providers affiliated with Citigroup.
At this time, there is no certainty as to how the proceeds of the settlement will be distributed, to whom such distributions will be made, the methodology by which such distributions will be allocated, and when such distributions will be made. Although there can be no assurance, Citigroup does not believe that this matter will have a material adverse effect on the Funds.
8. Subsequent Event
On June 24, 2005, Citigroup announced that it has signed a definitive agreement under which Citigroup will sell substantially all of its worldwide asset management business to Legg Mason, Inc. (“Legg Mason”).
As part of this transaction, SBFM (the “Manager”), currently an indirect wholly owned subsidiary of Citigroup, would become an indirect wholly owned subsidiary of Legg Mason.The Manager is the investment adviser to the Fund.
The transaction is subject to certain regulatory approvals, as well as other customary conditions to closing. Subject to such approvals and the satisfaction of the other conditions, Citigroup expects the transaction to be completed later this year.
Under the Investment Company Act of 1940, consummation of the transaction will result in the automatic termination of the investment management contract between the Fund and the Manager. Therefore, the Trust’s Board of Trustees will be asked to approve a new investment management contract between the Fund and the Manager. If approved by the Board, the new investment management contract will be presented to the shareholders of the Fund for their approval.
(This page intentionally left blank.)
| SMITH BARNEY EMERGING MARKETS EQUITY FUND |
| TRUSTEES | INVESTMENT MANAGER | ||
| Elliott J. Berv | Smith Barney Fund | ||
| Donald M. Carlton | Management LLC | ||
| A. Benton Cocanougher | |||
| Mark T. Finn | SUBADVISER | ||
| R. Jay Gerken, CFA | Citigroup Asset Management Ltd. | ||
| Chairman | |||
| Stephen Randolph Gross | DISTRIBUTOR | ||
| Diana R. Harrington | Citigroup Global Markets Inc. | ||
| Susan B. Kerley | |||
| Alan G. Merten | CUSTODIAN | ||
| R. Richardson Pettit | State Street Bank | ||
| & Trust Company | |||
| OFFICERS | |||
| R. Jay Gerken, CFA | TRANSFER AGENT | ||
| President and | Citicorp Trust Bank, fsb. | ||
| Chief Executive Officer | 125 Broad Street, 11th Floor | ||
| New York, NY 10004 | |||
| Andrew B. Shoup | |||
| Senior Vice President and | SUB-TRANSFER AGENT | ||
| Chief Administrative Officer | PFPC Inc. | ||
| P.O. Box 9699 | |||
| Frances M. Guggino | Providence, RI 02940-9699 | ||
| Treasurer and | |||
| Chief Financial Officer | |||
| Andrew Beagley | |||
| Chief Anti-Money Laundering | |||
| Compliance Officer and | |||
| Chief Compliance Officer | |||
| Robert I. Frenkel | |||
| Secretary and Chief Legal Officer | |||
| Wendy S. Setnicka | |||
| Controller | |||
| CitiFunds Trust I | |||
Smith Barney Emerging Markets | This report is submitted for general information of the shareholders of CitiFunds Trust I — Smith Barney Emerging Markets Equity Fund but it may also be used as sales literature when preceded or accompanied by the current Prospectus. SMITH BARNEY EMERGING MARKETS EQUITY FUND
www.citigroupam.com | ||
| |||
The Fund files its complete schedule of portfolio holdings with the Securities and Exchange Commission for the first and third quarters of each fiscal year on Form N-Q. The Fund’s Forms N-Q are available on the Commission’s website at www.sec.gov. The Fund’s Forms N-Q may be reviewed and copied at the Commission’s Public Reference Room in Washington, D.C., and information on the operation of the Public Reference Room may be obtained by calling 1-800-SEC-0330. To obtain information on Form N-Q from the Fund, shareholders can call 1-800-451-2010. A description of the policies and procedures that the Fund uses to determine how to vote proxies relating to portfolio securities is available (1) without charge, upon request, by calling 1-800-451-2010, (2) on the Fund’s website at www.citigroupam.com and (3) on the SEC’s website at www.sec.gov. | ©2005 Citigroup Global Markets Inc. Member NASD, SIPC FD03192 6/05 | 05-8705 | |
| ITEM 2 . | CODE OF ETHICS. | ||
| Not Applicable. | |||
| ITEM 3 . | AUDIT COMMITTEE FINANCIAL EXPERT. | ||
| Not Applicable. | |||
| ITEM 4 . | PRINCIPAL ACCOUNTANT FEES AND SERVICES. | ||
| Not Applicable. | |||
| ITEM 5 . | AUDIT COMMITTEE OF LISTED REGISTRANTS. | ||
| Not applicable. | |||
| ITEM 6 . | SCHEDULE OF INVESTMENTS. | ||
| Not applicable. | |||
| ITEM 7 . | DISCLOSURE OF PROXY VOTING POLICIES AND PROCEDURES FOR CLOSED-END MANAGEMENT INVESTMENT COMPANIES. | ||
| Not applicable. | |||
| ITEM 8 . | [RESERVED] | ||
| ITEM 9 . | PURCHASES OF EQUITY SECURITIES BY CLOSED-END MANAGEMENT INVESTMENT COMPANY AND AFFILIATED PURCHASERS. | ||
| Not applicable. | |||
| ITEM 10 . | SUBMISSION OF MATTERS TO A VOTE OF SECURITY HOLDERS. | ||
| Not applicable. | |||
| ITEM 11. | CONTROLS AND PROCEDURES. | ||
| (a) | The registrant’s principal executive officer and principal financial officer have concluded that the registrant’s disclosure controls and procedures (as defined in Rule 30a- 3(c) under the Investment Company Act of 1940, as amended (the “1940 Act”)) are effective as of a date within 90 days of the filing date of this report that includes the disclosure required by this paragraph, based on their evaluation of the disclosure controls and procedures required by Rule 30a-3(b) under the 1940 Act and 15d-15(b) under the Securities Exchange Act of 1934. | ||
| (b) | There were no changes in the registrant’s internal control over financial reporting (as defined in Rule 30a-3(d) under the 1940 Act) that occurred during the registrant’s last fiscal half-year (the registrant’s second fiscal half-year in the case of an annual report) that have materially affected, or are likely to materially affect the registrant’s internal control over financial reporting. | ||
| ITEM 12. | EXHIBITS. | |||||
| (a) Not Applicable. | ||||||
| (b) Attached hereto. | ||||||
| Exhibit 99.CERT | Certifications pursuant to section 302 of the Sarbanes-Oxley Act of 2002 | |||||
| Exhibit 99.906CERT | Certifications pursuant to Section 906 of the Sarbanes-Oxley Act of 2002 | |||||
SIGNATURES
Pursuant to the requirements of the Securities Exchange Act of 1934 and the Investment Company Act of 1940, the registrant has duly caused this Report to be signed on its behalf by the undersigned, there unto duly authorized.
CitiFunds Trust I
| By: | /s/ R. Jay Gerken |
| R. Jay Gerken | |
| Chief Executive Officer of | |
| CitiFunds Trust I |
Date: July 8, 2005
Pursuant to the requirements of the Securities Exchange Act of 1934 and the Investment Company Act of 1940, this report has been signed below by the following persons on behalf of the registrant and in the capacities and on the dates indicated.
| By: | /s/ R. Jay Gerken |
| (R. Jay Gerken) | |
| Chief Executive Officer of | |
| CitiFunds Trust I | |
| Date: | July 8, 2005 |
| By: | /s/ Frances M. Guggino |
| (Frances M. Guggino) | |
| Chief Financial Officer of | |
| CitiFunds Trust I | |
| Date: July 8, 2005 | |