UNITED STATES
SECURITIES AND EXCHANGE COMMISSION
Washington, D.C. 20549
FORM N-CSR
CERTIFIED SHAREHOLDER REPORT OF REGISTERED MANAGEMENT INVESTMENT COMPANIES
Investment Company Act file number 811-4006
CitiFunds Trust I
(Exact name of registrant as specified in charter)
125 Broad Street, New York, NY 10004
(Address of principal executive offices) (Zip code)
Robert I. Frenkel, Esq.
Legg Mason & Co., LLC
300 First Stamford Place, 4th Floor
Stamford, CT 06902
(Name and address of agent for service)
Registrant's telephone number, including area code: (800) 451-2010
Date of fiscal year end: October 31
Date of reporting period: October 31, 2005
| ITEM 1. | REPORT TO STOCKHOLDERS. |
The Annual Report to Stockholders is filed herewith.
| E X P E R I E N C E | Smith Barney Emerging Markets Equity Fund | ||
| A N N UA L R E P O R T | |||
| OCTOBER 31, 2005 | |||
INVESTMENT PRODUCTS: NOT FDIC INSURED • NO BANK GUARANTEE • MAY LOSE VALUE |
| Smith Barney | |
| Emerging Markets Equity Fund |
Annual Report • October 31, 2005
What’s Inside | Letter from the Chairman | 1 | |||
| Manager Overview | 3 | ||||
| Fund at a Glance | 6 | ||||
| Fund Expenses | 7 | ||||
| Fund Performance | 9 | ||||
| Historical Performance | 10 | ||||
| Schedule of Investments | 11 | ||||
| Statement of Assets and Liabilities | 16 | ||||
| Fund Objective The Fund seeks to provide long-term capital growth. Dividend income, if any, is incidental to this goal. | Statement of Operations | 17 | |||
| Statement of Changes in Net Assets | 18 | ||||
| Financial Highlights | 19 | ||||
| Notes to Financial Statements | 23 | ||||
| Report of Independent Registered Public Accounting Firm | 33 | ||||
| Board Approval of Management Agreement | 34 | ||||
| Additional Information | 43 |
Under a licensing agreement between Citigroup and Legg Mason, the names of funds, the names of any classes of shares of funds, and the names of investment advisers of funds, as well as all logos, trademarks and service marks related to Citigroup or any of its affiliates (“Citi Marks”) are licensed for use by Legg Mason. Citi Marks include, but are not limited to, “Smith Barney,” “Salomon Brothers,” “Citi,” “Citigroup Asset Management,” and “Davis Skaggs Investment Management”. Legg Mason and its affiliates, as well as the Fund’s investment manager, are not affiliated with Citigroup.
All Citi Marks are owned by Citigroup, and are licensed for use until no later than one year after the date of the licensing agreement.
| Letter from the Chairman | ||
 R. JAY GERKEN, CFA Chairman, President and Chief Executive Officer | Dear Shareholder, Emerging market equities generated strong results from the inception of the Smith Barney Emerging Markets Equity Fund on January 3, 2005 through the end of the reporting period on October 31, 2005. When the year began, there were fears that rising U.S. interest rates may negatively impact the performance of stocks from emerging markets. However, despite six interest rate hikes from the Federal Reserve Board (“Fed”)i during the reporting period, it did not adversely affect the emerging equity market’s ascent. Continued strength in commodity prices, including metals, agriculture, and oil supported many emerging market countries. In addition, emerging market equities performance was helped by solid economic growth across many regions. This was due, in part, to strengthening domestic demand. With solid business and consumer spending from within these countries, they were less reliant on exports to support their economic growth. Please read on for a more detailed look at prevailing economic and market conditions during the Fund’s fiscal year and to learn how those conditions have affected Fund performance. Special Shareholder Notice On December 1, 2005, Citigroup Inc. (“Citigroup”) completed the sale of substantially all of its asset management business, Citigroup Asset Management (“CAM”), to Legg Mason, Inc. (“Legg Mason”). As a result, the Fund’s investment Manager (the “Manager”), previously an indirect wholly-owned subsidiary of Citigroup, has become a wholly-owned subsidiary of Legg Mason. Completion of the sale caused the Fund’s existing investment management contract and sub-advisory contract to terminate. The Fund’s shareholders previously approved a new investment management contract |
Smith Barney Emerging Markets Equity Fund 1
between the Fund and the Manager and a new sub-advisory contract which became effective on December 1, 2005. Information About Your Fund As you may be aware, several issues in the mutual fund industry have recently come under the scrutiny of federal and state regulators. The Fund’s Manager and some of its affiliates have received requests for information from various government regulators regarding market timing, late trading, fees, and other mutual fund issues in connection with various investigations. The regulators appear to be examining, among other things, the Fund’s response to market timing and shareholder exchange activity, including compliance with prospectus disclosure related to these subjects. The Fund has been informed that the Manager and its affiliates are responding to those information requests, but are not in a position to predict the outcome of these requests and investigations. Important information concerning the Fund and its Manager with regard to recent regulatory developments is contained in the Notes to Financial Statements included in this report. As always, thank you for your confidence in our stewardship of your assets. We look forward to helping you continue to meet your financial goals.
|

| i | The Federal Reserve Board is responsible for the formulation of a policy designed to promote economic growth, full employment, stable prices, and a sustainable pattern of international trade and payments. |
Manager Overview
 ACQUICO WEN Portfolio Manager | Q. What were the overall market conditions during the Fund’s reporting period? Performance Review Since inception on January 5, 2005 through October 31, 2005, Class A shares of the Smith Barney Emerging Markets Equity Fund, excluding sales charges, returned 15.00% . These shares underperformed the Fund’s unmanaged benchmark, the MSCI Emerging Markets Index, which returned 20.58%, for the same period. The Lipper Emerging Markets Funds Category Average1 increased 16.33% from December 31, 2004 through October 31, 2005. |
| 1 | Lipper, Inc. is a major independent mutual-fund tracking organization. Returns are based on the period from 12/31/04-10/31/05, including the reinvestment of distributions, including returns of capital, if any, calculated among the 188 funds in the Fund’s Lipper category, and excluding sales charges. |
Smith Barney Emerging Markets Equity Fund 2005 Annual Report 3
Fund Performance as of October 31, 2005 (excluding sales charges) (unaudited)
| Since Inception on | ||||||
| 6 Months | 1/5/05-10/31/05 | |||||
| Emerging Markets Equity Fund-Class A Shares | 13.70 | % | 15.00 | % | ||
| MSCI Emerging Markets Index | 17.96 | % | 20.58 | % | ||
| 6 Months | 12/31/04-10/31/05 | |||||
| Lipper Emerging Markets Funds Category Average | 17.42 | % | 16.33 | % | ||
The performance shown represents past performance. Past performance is no guarantee of future results and current performance may be higher or lower than the performance shown above. Principal value and investment returns will fluctuate and investors’ shares, when redeemed, may be worth more or less than their original cost. To obtain performance data current to the most recent month-end, please visit our website at www.citigroupam.com.
Current reimbursements and/or fee waivers are voluntary, and may be reduced or terminated at any time. Absent these reimbursements or waivers, the performance would have been lower.
All share class returns assume the reinvestment of all distributions, including returns of capital, if any, at net asset value and the deduction of all Fund expenses. Returns have not been adjusted to include sales charges that may apply when shares are purchased or the deduction of taxes that a shareholder would pay on Fund distributions. Excluding sales charges, Class B shares returned –0.88% since inception on 8/11/05-10/31/05, Class C shares returned –1.75% since inception on 9/7/05-10/31/05 and Class Y shares returned 14.06% over the six months ended October 31, 2005. Excluding sales charges, Class Y shares returned 15.26% since inception on 1/3/05-10/31/05.
Lipper, Inc. is a major independent mutual-fund tracking organization. Returns are based on the period ended October 31, 2005, including the reinvestment of distributions, including returns of capital, if any, calculated among the 192 funds for the six-month period and among the 188 funds in the Fund’s Lipper category and excluding sales charges for the period from 12/31/04-10/31/05.
Q. What were the most significant factors affecting Fund performance? What were the leading contributors to performance?
A. In terms of country allocations, our overweights in Brazil, Russia, and Korea contributed positively to performance as these markets outperformed the Index. Our underweight position in Indonesia also helped relative performance as its market fell over the period.
Stock selection in Turkey, South Africa, Poland, and Indonesia outperformed their respective local markets and, therefore, contributed positively to returns. Within Turkey, the largest contributors were Yapi ve Kredi Bankasi, Turkiye Garanti Bankasi, and Dogan Yayin Holding. Within South Africa, underweights in Sanlam and Old Mutual enhanced results and our Indonesian holding Hanjaya Mandala Sampoerna was another noteworthy contributor to performance. All of the above securities were eliminated from the portfolio over the period.
Other stocks that significantly benefited the Fund were Petroleo Brasileiro and TAM from Brazil, which rose 62.3% and 103.7%, respectively over the reporting period. In Korea, Shinhan Financial Group, KT&G Corp., and Korea Electric Power rose 48.0%, 37.3%, and 25.8%, respectively. Having no exposure to Taiwanese stocks China Steel and China Development Financial Holding helped relative performance as well, as these stocks fell 17.0% and 35.2%, respectively.
What were the leading detractors from performance?
A. From a country perspective, overweights in Taiwan and Thailand were negative contrib utors to performance as they both lagged the Index during the period. In addition, our underweight positions in Mexico, Egypt, Argentina, and Jordan hurt results as these markets outperformed the Index over the same period.
4 Smith Barney Emerging Markets Equity Fund 2005 Annual Report
Stock selection in Brazil, Russia, Korea, Mexico, and China underperformed their respective local indices and, therefore, were negative contributors to relative performance. Not owning Banco Bradesco in Brazil was the largest negative stock contributor. Within Korea, the largest stock detractors were our overweight in SK Telecom and underweight in Hyundai Motor. Our underweight positions in strongly performing Mexican stocks Cemex and America Movil also hurt returns. In China, overweights in Yanzhou Coal Mining and Huaneng Power International, and an underweight in PetroChina detracted from relative performance. PetroChina was eliminated from the portfolio over the period.
Other holdings that negatively impacted results were our overweights in Taiwan-based Quanta Computer Inc., United Microelectronics, Far Eastern Textile, and Cathay Financial Holding. Not owning Orascom Holding (Egypt) and Tenaris (Argentina) also hurt performance as these stocks rose sharply over the period.
Q. Were there any significant changes to the Fund during the reporting period?
A. There were no significant changes to the Fund during the period.
Thank you for your investment in the Smith Barney Emerging Markets Equity Fund. As ever, we appreciate that you have chosen us to manage your assets and we remain focused on achieving the Fund’s investment goals.

Acquico Wen
Portfolio Manager
December 1, 2005
The information provided is not intended to be a forecast of future events, a guarantee of future results or investment advice. Views expressed may differ from those of the firm as a whole.
Portfolio holdings and breakdowns are as of October 31, 2005 and are subject to change and may not be representative of the portfolio manager’s current or future investments. The Fund’s top ten holdings (as a percentage of net assets) as of October 31, 2005 were: Samsung Electronics Co., Ltd. (6.0%), Petroleo Brasileiro SA, Sponsored ADR (5.1%), Taiwan Semiconductor Manufacturing Co., Ltd. (3.1%), Standard Bank Group Ltd. (2.5%), Shinhan Financial Group Co., Ltd. (2.5%), Cathay Financial Holding Co., Ltd. (2.3%), Kookmin Bank (2.0%), Companhia Vale do Rio Doce, Sponsored ADR (1.9%), Hon Hai Precision Industry Co., Ltd. (1.8%) and Chinatrust Financial Holdings Co. Ltd. (1.7%) . Please refer to pages 11 through 15 for a list and percentage breakdown of the Fund’s holdings.
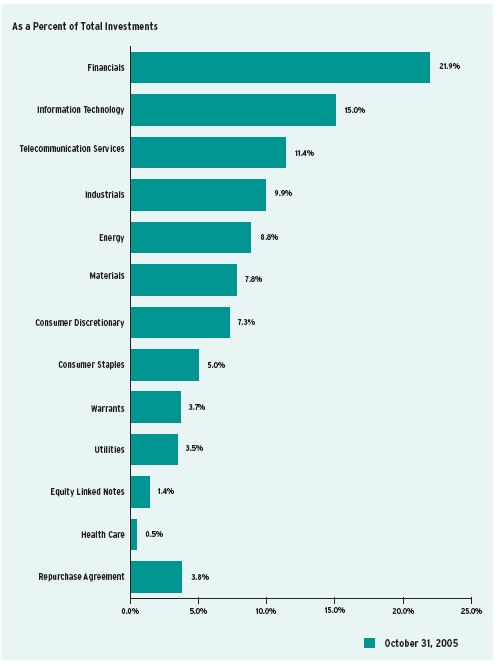
The mention of sector breakdowns is for informational purposes only and should not be construed as a recommendation to purchase or sell any securities. The information provided regarding such sectors is not a sufficient basis upon which to make an investment decision. Investors seeking financial advice regarding the appropriateness of investing in any securities or investment strategies discussed should consult their financial professional. Portfolio holdings are subject to change at any time and may not be representative of the portfolio manager’s current or future investments. The Fund’s top five sector holdings (as a percentage of net assets) as of October 31, 2005 were: Financials (21.9%), Information Technology (15.1%), Telecommunication Services (11.4%), Industrials (10.0%) and Energy (8.8%) . The Fund’s portfolio composition is subject to change at any time.
RISKS: The Fund may invest in foreign securities. Investing in foreign securities is subject to certain risks not associated with domestic investing, such as currency fluctuations, and changes in political and economic conditions. These risks are magnified in emerging or developing markets. The Fund may use derivatives, such as options and futures, which can be illiquid, may disproportionately increase losses and have a potentially large impact of fund performance. Please see the Fund’s prospectus for more information on these and other risks.
All index performance reflects no deduction for fees, expenses or taxes. Please note an investor cannot invest directly in an index.
| i | The MSCI Emerging Markets Index is a free float-adjusted market capitalization index that is designed to measure equity market performance in the global emerging markets. The index measures the performance of emerging markets in Argentina, Brazil, Chile, China, Colombia, Czech Republic, Egypt, Hungary, India, Indonesia, Israel, Jordan, Korea, Malaysia, Mexico, Morocco, Pakistan, Peru, Philippines, Poland, Russia, South Africa, Taiwan, Thailand, Turkey and Venezuela. |
Smith Barney Emerging Markets Equity Fund 2005 Annual Report 5
Fund at a Glance (unaudited)
Investment Breakdown
6 Smith Barney Emerging Markets Equity Fund 2005 Annual Report
Example
As a shareholder of the Fund, you may incur two types of costs: (1) transaction costs, including front-end and back-end sales charges (loads) on purchase payments, reinvested distributions, including returns of capital, if any; and (2) ongoing costs, including management fees; distribution and/or service (12b-1) fees; and other Fund expenses. This example is intended to help you understand your ongoing costs (in dollars) of investing in the Fund and to compare these costs with the ongoing costs of investing in other mutual funds.
This example is based on an investment of $1,000 invested on May 1, 2005 and held for the period ended October 31, 2005.
Actual Expenses
The table below titled “Based on Actual Total Return” provides information about actual account values and actual expenses. You may use the information provided in this table, together with the amount you invested, to estimate the expenses that you paid over the period. To estimate the expenses you paid on your account, divide your ending account value by $1,000 (for example, an $8,600 ending account value divided by $1,000 = 8.6), then multiply the result by the number under the heading entitled “Expenses Paid During the Period”.
| Based on Actual Total Return(1) | ||||||||||||
| Actual | ||||||||||||
| Total Return | Beginning | Ending | Annualized | Expenses | ||||||||
| Without | Account | Account | Expense | Paid During | ||||||||
| Sales Charges(2) | Value | Value | Ratio | the Period(3) | ||||||||
| Class A | 13.70 | % | $1,000.00 | $1,137.00 | 2.00 | % | $10.77 | |||||
| Class B | (0.88 | ) | 1,000.00 | 991.20 | 2.75 | 6.08 | ||||||
| Class C | (1.75 | ) | 1,000.00 | 982.50 | 2.75 | 4.03 | ||||||
| Class Y | 14.06 | 1,000.00 | 1,140.60 | 1.34 | 7.23 | |||||||
| (1) | For the six months ended October 31, 2005 for Class A and Y shares and for the period August 11, 2005, and September 7, 2005 (inception dates) for Class B and C shares, respectively, through October 31, 2005. |
| (2) | Assumes reinvestment of all distributions, including returns of capital, if any, at net asset value and does not reflect the deduction of the applicable sales charge with respect to Class A shares or the applicable contingent deferred sales charges (“CDSC”) with respect to Class B and C shares. Total return is not annualized, as it may not be representative of the total return for the year. Performance figures may reflect voluntary fee waivers and/or expense reimbursements. Past performance is no guarantee of future results. In the absence of voluntary fee waivers and/or expense reimbursements, the total return would have been lower. |
| (3) | Expenses (net of voluntary fee waiver and/or expense reimbursements) are equal to each class’ respective annualized expense ratio, multiplied by the average account value over the period, multiplied by the number of days in the period, then divided by 365. |
Smith Barney Emerging Markets Equity Fund 2005 Annual Report 7
Fund Expenses (unaudited) (continued)
Hypothetical Example for Comparison Purposes
The table below titled “Based on Hypothetical Total Return” provides information about hypothetical account values and hypothetical expenses based on the actual expense ratio and an assumed rate of return of 5.00% per year before expenses, which is not the Fund’s actual return. The hypothetical account values and expenses may not be used to estimate the actual ending account balance or expenses you paid for the period. You may use the information provided in this table to compare the ongoing costs of investing in the Fund and other funds. To do so, compare the 5.00% hypothetical example relating to the Fund with the 5.00% hypothetical examples that appear in the shareholder reports of the other funds.
Please note that the expenses shown in the table below are meant to highlight your ongoing costs only and do not reflect any transactional costs, such as front-end or back-end sales charges (loads). Therefore, the table is useful in comparing ongoing costs only, and will not help you determine the relative total costs of owning different funds. In addition, if these transaction costs were included, your costs would have been higher.
| Based on Hypothetical Total Return(1) | ||||||||||||
| Hypothetical | Beginning | Ending | Annualized | Expenses | ||||||||
| Annualized | Account | Account | Expense | Paid During | ||||||||
| Total Return | Value | Value | Ratio | the Period(2) | ||||||||
| Class A | 5.00 | % | $1,000.00 | $1,015.12 | 2.00 | % | $10.16 | |||||
| Class B | 5.00 | 1,000.00 | 1,004.99 | 2.75 | 6.12 | |||||||
| Class C | 5.00 | 1,000.00 | 1,003.33 | 2.75 | 4.08 | |||||||
| Class Y | 5.00 | 1,000.00 | 1,018.45 | 1.34 | 6.82 | |||||||
| (1) | For the six months ended October 31, 2005 for Class A and Y shares and for the period August 11, 2005, and September 7, 2005 (inception dates) for Class B and C shares, respectively, through October 31, 2005. |
| (2) | Expenses (net of voluntary waiver and/or expense reimbursements) are equal to each class’ respective annualized expense ratio, multiplied by the average account value over the period, multiplied by the number of days in the period, then divided by 365. |
8 Smith Barney Emerging Markets Equity Fund 2005 Annual Report
| Fund Performance | ||||||||||||
| Average Annual Total Returns† (unaudited) | ||||||||||||
| Without Sales Charges(1) | ||||||||||||
| Class A | Class B | Class C | Class Y | |||||||||
| Inception* through 10/31/05 | 15.00 | % | (0.88 | )% | (1.75 | )% | 15.26 | % | ||||
| With Sales Charges(2) | ||||||||||||
| Class A | Class B | Class C | Class Y | |||||||||
| Inception* through 10/31/05 | 9.25 | % | (5.83 | )% | (2.74 | )% | 15.26 | % | ||||
| Cumulative Total Returns† (unaudited) | ||
| Without Sales Charges(1) | ||
| Class A (Inception* through 10/31/05) | 15.00 | % |
| Class B (Inception* through 10/31/05) | (0.88 | ) |
| Class C (Inception* through 10/31/05) | (1.75 | ) |
| Class Y (Inception* through 10/31/05) | 15.26 | |
| † | All figures represent past performance and are not a guarantee of future results. Investment return and principal value of an investment will fluctuate so that an investor’s shares, when redeemed, may be worth more or less than their original cost. The returns shown do not reflect the deduction of taxes that a shareholder would pay on fund distributions or the redemption of fund shares. Performance figures may reflect voluntary fee waivers and/or expense reimbursements. In the absence of voluntary fee waivers and/or expense reimbursements, the total return would have been lower. |
| (1) | Assumes reinvestment of all distributions, including returns of capital, if any, at net asset value and does not reflect deduction of all applicable sales charges with respect to Class A shares or the applicable contingent deferred sales charge (“CDSC”) with respect to Class B and C shares. |
| (2) | Assumes reinvestment of all distributions, including returns of capital, if any, at net asset value. In addition, Class A shares reflect the deduction of the maximum sales charges of 5.00%; Class B shares reflect the deduction of a 5.00% CDSC, which applies if shares are redeemed within one year from purchase payment and declines thereafter by 1.00% per year until no CDSC is incurred. Class C shares also reflect the deduction of 1.00% CDSC, which applies if shares are redeemed within one year of purchase payment. |
| * | Inception dates for Class A, B, C and Y shares are January 5, 2005, August 11, 2005, September 7, 2005 and January 3, 2005, respectively. |
Smith Barney Emerging Markets Equity Fund 2005 Annual Report 9
Historical Performance (unaudited)
Value of $10,000 Invested in Class A Shares of the Smith Barney
Emerging Markets Equity Fund vs. MSCI Emerging Markets Index†
(January 5, 2005 – October 31, 2005)
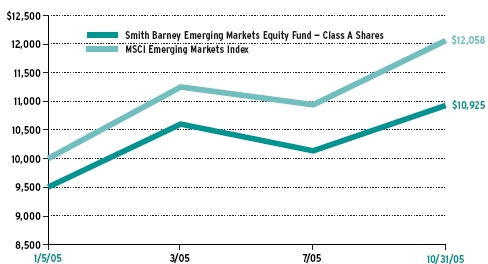
| † | Hypothetical illustration of $10,000 invested in Class A shares at inception on January 5, 2005, assuming deduction of the maximum 5.00% sales charge at the time of investment and reinvestment of all distributions, including returns of capital, if any, through October 31, 2005. The MSCI Emerging Markets Index is a free float-adjusted market capitalization index that is designed to measure equity market performance in the global emerging markets. The index is unmanaged and is not subject to the same management and trading expenses as a mutual fund. The performance of the Fund’s other classes may be greater or less than the performance of Class A shares indicated on this chart, depending on whether greater or lesser sales charges and fees were incurred by shareholders investing in other classes. All figures represent past performance and are not a guarantee of future results. Investment return and principal value of an investment will fluctuate so that an investor’s shares, when redeemed, may be worth more or less than their original cost. The returns shown do not reflect the deduction of taxes that a shareholder would pay on fund distributions or the redemption of fund shares. Performance figures may reflect voluntary fee waivers and/or expense reimbursements. In the absence of voluntary fee waivers and/or expense reimbursements, the total return would have been lower. |
10 Smith Barney Emerging Markets Equity Fund 2005 Annual Report
| Schedule of Investments (October 31, 2005) | ||||
| SMITH BARNEY EMERGING MARKETS EQUITY FUND | ||||
| Shares | Security | Value | ||
| COMMON STOCKS — 89.0% | ||||
| Brazil — 12.6% | ||||
| 4,500 | Banco do Brasil SA | $ | 82,864 | |
| 3,900 | Banco Nossa Caixa SA* | 64,704 | ||
| 4,500 | Brasil Telecom Participacoes SA, Sponsored ADR | 187,245 | ||
| 11,957 | Companhia Brasileira de Distribuicao Grupo | |||
| Pao de Acucar, Sponsored ADR | 329,535 | |||
| 12,800 | Companhia Vale do Rio Doce, Sponsored ADR | 472,320 | ||
| 9,700 | Cyrela Brazil Realty SA | 76,366 | ||
| 900 | EDP — Energias do Brasil SA* | 8,967 | ||
| 18,000 | Grendene SA | 141,790 | ||
| 22,318 | Petroleo Brasileiro SA, Sponsored ADR | 1,280,384 | ||
| 10,400 | Tele Centro Oeste Celular Participacoes SA, Sponsored ADR | 94,120 | ||
| 4,216 | Tele Norte Leste Participacoes SA, Sponsored ADR | 74,623 | ||
| 39,900 | Telesp Celular Participacoes SA, Sponsored ADR | 145,635 | ||
| 4,058 | Tim Participacoes SA, ADR | 82,256 | ||
| 500 | Ultrapar Participacoes SA, Sponsored ADR | 7,830 | ||
| 9,400 | Votorantim Celulose e Papel SA, Sponsored ADR | 112,518 | ||
| Total Brazil | 3,161,157 | |||
| Cayman Islands — 0.5% | ||||
| 1,700 | Netease.com Inc. ADR* | 129,659 | ||
| Chile — 0.6% | ||||
| 25,108,195 | CorpBanca SA | 139,785 | ||
| China — 2.4% | ||||
| 201,500 | China Shenhua Energy Co., Ltd, Class H Shares* (a) | 221,338 | ||
| 382,000 | Huaneng Power International, Inc., Class H Shares (a) | 255,784 | ||
| 59,500 | Weiqiao Textile Co., Ltd., Class H Shares (a) | 72,185 | ||
| 98,800 | Yanzhou Coal Mining Co., Ltd., Class H Shares (a) | 63,470 | ||
| Total China | 612,777 | |||
| Colombia — 0.6% | ||||
| 6,200 | BanColombia SA, Sponsored ADR | 146,940 | ||
| Czech Republic — 1.3% | ||||
| 6,900 | Komercni Banka AS, Sponsored GDR | 321,747 | ||
| Hong Kong — 4.3% | ||||
| 66,000 | China Merchants Holdings International Co., Ltd. (a) | 127,993 | ||
| 45,000 | China Mobile (Hong Kong) Ltd. (a) | 201,355 | ||
| 18,000 | China Netcom Group Corp. (Hong Kong), Ltd. (a) | 28,463 | ||
| 412,000 | China Overseas Land & Investment Ltd. (a) | 126,550 | ||
| 162,000 | China Resources Enterprise Ltd. (a) | 240,223 | ||
| 524,400 | CNOOC Ltd. (a) | 340,544 | ||
| Total Hong Kong | 1,065,128 | |||
See Notes to Financial Statements.
Smith Barney Emerging Markets Equity Fund 2005 Annual Report 11
| Schedule of Investments (October 31, 2005) (continued) | ||||
| Shares | Security | Value | ||
| Indonesia — 0.5% | ||||
| 52,000 | PT Gudang Garam Tbk (a) | $ | 52,455 | |
| 128,000 | PT Indonesian Satellite Corp. Tbk. (a) | 61,640 | ||
| Total Indonesia | 114,095 | |||
| Israel — 2.6% | ||||
| 87,262 | Bank Hapoalim Ltd. (a) | 334,130 | ||
| 100,606 | Bank Leumi Le-Israel (a) | 328,398 | ||
| Total Israel | 662,528 | |||
| Malaysia — 4.3% | ||||
| 200 | British American Tobacco (Malaysia) Berhad (a) | 1,988 | ||
| 97,100 | Gamuda Berhad (a) | 98,321 | ||
| 32,100 | Genting Berhad (a) | 175,274 | ||
| 29,481 | IJM Corp. Berhad (a) | 37,498 | ||
| 156,500 | Magnum Corp. Berhad (a) | 81,668 | ||
| 94,200 | PLUS (Projek Lebuhraya Utara Selatan) Expressways Berhad (a) | 76,318 | ||
| 128,000 | Telekom Malaysia Berhad (a) | 333,762 | ||
| 99,100 | Tenaga Nasional Berhad (a) | 262,107 | ||
| Total Malaysia | 1,066,936 | |||
| Mexico — 3.6% | ||||
| 37,100 | Consorcio ARA SA de CV | 136,881 | ||
| 52,500 | Grupo Bimbo SA de CV, Series A Shares | 173,946 | ||
| 21,269 | Grupo Financiero Banorte SA de CV, Series O Shares | 181,250 | ||
| 49,300 | Grupo Modelo SA de CV, Series C Shares | 151,281 | ||
| 12,900 | Telefonos de Mexico SA de CV, Series L Shares, Sponsored ADR | 260,322 | ||
| Total Mexico | 903,680 | |||
| Netherlands — 0.5% | ||||
| 2,870 | Zentiva NV, GDR (a) | 125,562 | ||
| Russia — 5.8% | ||||
| 16,511 | AFK Sistema, Registered Shares, Sponsored GDR (a) | 369,553 | ||
| 1,999 | AO VimpelCom, Sponsored ADR* | 79,960 | ||
| 830 | Gazprom, Registered Shares, Sponsored GDR | 49,053 | ||
| 5,345 | LUKOIL, Sponsored ADR | 293,975 | ||
| 11,500 | Mobile TeleSystems, Sponsored ADR | 425,385 | ||
| 5,022 | Surgutneftegaz, Sponsored ADR | 236,034 | ||
| Total Russia | 1,453,960 | |||
| South Africa — 6.0% | ||||
| 12,188 | Barloworld Ltd. (a) | 190,806 | ||
| 768 | Impala Platinum Holdings Ltd. (a) | 83,808 | ||
| 13,536 | Massmart Holdings Ltd. (a) | 104,442 | ||
| 45,487 | MTN Group Ltd. (a) | 338,694 | ||
| 17,000 | Sappi Ltd. (a) | 164,887 | ||
| 60,481 | Standard Bank Group Ltd. (a) | 623,301 | ||
| Total South Africa | 1,505,938 | |||
See Notes to Financial Statements.
12 Smith Barney Emerging Markets Equity Fund 2005 Annual Report
| Schedule of Investments (October 31, 2005) (continued) | ||||
| Shares | Value | |||
| South Korea — 21.3% | ||||
| 510 | Cheil Communications, Inc. (a) | $ | 94,038 | |
| 2,530 | Hyundai Mobis (a) | 201,975 | ||
| 5,320 | Hyundai Motor Co. (a) | 392,435 | ||
| 8,930 | Kookmin Bank (a) | 512,369 | ||
| 10,640 | Korea Electric Power Corp. (a) | 347,057 | ||
| 10,850 | KT Corp., Sponsored ADR | 233,818 | ||
| 9,430 | KT&G Corp. (a) | 386,115 | ||
| 3,840 | LG Electronics, Inc. (a) | 251,081 | ||
| 1,419 | POSCO (a) | 289,254 | ||
| 2,814 | Samsung Electronics Co., Ltd. (a) | 1,500,327 | ||
| 18,420 | Shinhan Financial Group Co., Ltd. (a) | 617,588 | ||
| 560 | Shinsegae Co., Ltd. (a) | 201,115 | ||
| 15,518 | SK Telecom Co., Ltd., Sponsored ADR | 313,619 | ||
| Total South Korea | 5,340,791 | |||
| Taiwan — 15.5% | ||||
| 108,881 | Advanced Semiconductor Engineering, Inc. (a) | 66,770 | ||
| 323,000 | Cathay Financial Holding Co., Ltd. (a) | 568,755 | ||
| 558,027 | Chinatrust Financial Holding Co., Ltd. (a) | 434,278 | ||
| 248,412 | EVA Airways Corp. (a) | 96,388 | ||
| 319,680 | Far Eastern Textile Co., Ltd. (a) | 186,720 | ||
| 113,000 | Formosa Chemicals & Fibre Corp. (a) | 181,142 | ||
| 148,240 | Formosa Plastics Corp. (a) | 223,664 | ||
| 101,291 | Hon Hai Precision Industry Co., Ltd. (a) | 439,494 | ||
| 27,000 | President Chain Store Corp. (a) | 49,493 | ||
| 182,700 | Quanta Computer, Inc. (a) | 253,382 | ||
| 26,000 | Siliconware Precision Industries Co. (a) | 23,635 | ||
| 490,498 | Taiwan Semiconductor Manufacturing Co., Ltd. (a) | 767,185 | ||
| 173,583 | Unimicron Technology Corp. (a) | 132,271 | ||
| 700,507 | United Microelectronics Corp. (a) | 377,702 | ||
| 277,000 | Yageo Corp.* (a) | 84,622 | ||
| Total Taiwan | 3,885,501 | |||
| Thailand — 6.2% | ||||
| 1,051,700 | Asian Property Development PCL (a) | 87,180 | ||
| 97,100 | Bangkok Bank Public Co., Ltd., NVDR | 233,373 | ||
| 760,800 | Italian-Thai Development PCL | 164,774 | ||
| 198,200 | Kasikornbank PCL (a) | 306,799 | ||
| 151,000 | Kasikornbank PCL, NVDR | 224,047 | ||
| 758,800 | Krung Thai Bank PCL | 185,164 | ||
| 1,079,600 | Land & Houses PCL, NVDR | 210,492 | ||
| 166,600 | Thai Airways International PCL (a) | 151,176 | ||
| Total Thailand | 1,563,005 | |||
| Turkey — 0.4% | ||||
| 17,369 | Arcelik AS (a) | 103,537 | ||
| TOTAL COMMON STOCKS | ||||
| (Cost — $20,645,460) | 22,302,726 | |||
See Notes to Financial Statements.
Smith Barney Emerging Markets Equity Fund 2005 Annual Report 13
| Schedule of Investments (October 31, 2005) (continued) | ||||
| Shares | Security | Value | ||
| PREFERRED STOCK — 2.4% | ||||
| Brazil — 2.4% | ||||
| 3,300 | Bradespar SA | $ | 86,601 | |
| 700 | Cia Vale do Rio Doce | 25,808 | ||
| 16,700 | Tam SA* | 211,698 | ||
| 5,300 | Telemar Norte Leste SA, Series A Shares | 143,801 | ||
| 8,188 | Ultrapar Participacoes SA | 127,832 | ||
| TOTAL PREFERRED STOCK | ||||
| (Cost — $449,142) | 595,740 | |||
| Warrants | ||||
| WARRANTS (b) — 3.7% | ||||
| 600 | MSDW Asia Securities Products LLC, Each warrant exercisable for 4 shares | |||
| of Infosys Technologies Ltd. common stock, Expires 3/30/07 | 134,303 | |||
| 19,323 | MSDW Asia Securities Products LLC, Each warrant exercisable | |||
| for 1 share of Hindustan Petroleum Corp., common stock, | ||||
| Expires 8/13/07 | 127,455 | |||
| 17,685 | MSDW Asia Securities Products LLC, Each warrant exercisable | |||
| for 1 share of Oil & Natural Gas Corp., Ltd. common stock, | ||||
| Expires 3/14/07 | 364,170 | |||
| 22,741 | MSDW Asia Securities Products LLC, Each warrant exercisable | |||
| for 1 share of Satyam Computer Services, Ltd., common stock, | ||||
| Expires 3/21/07 | 305,616 | |||
| TOTAL WARRANTS | ||||
| (Cost — $876,010) | 931,544 | |||
| Shares | ||||
| EQUITY LINKED NOTES (b)(c) — 1.4% | ||||
| India — 1.4% | ||||
| 33,000 | UBS Hindalco Industry Ltd., 0.000% due 1/17/06 | 83,490 | ||
| 4,857 | UBS Infosys Technology Ltd., 0.000% due 1/17/06 | 271,992 | ||
| TOTAL EQUITY LINKED NOTES | ||||
| (Cost — $312,163) | 355,482 | |||
| TOTAL INVESTMENTS BEFORE SHORT-TERM | ||||
| INVESTMENT | ||||
| (Cost — $22,282,775) | 24,185,492 | |||
See Notes to Financial Statements.
14 Smith Barney Emerging Markets Equity Fund 2005 Annual Report
| Schedule of Investments (October 31, 2005) (continued) | |||||
| Face | |||||
| Amount | Security | Value | |||
| SHORT-TERM INVESTMENT — 3.8% | |||||
| Repurchase Agreement — 3.8% | |||||
| $954,000 | State Street Bank & Trust Co., dated 10/31/05, 3.520% due 11/1/05; | ||||
| Proceeds due at maturity — $954,093; (Fully collateralized by U.S. | |||||
| Treasury Bond, 6.250% due 8/15/23; Market value — $978,841) | |||||
| (Cost — $954,000) | $ | 954,000 | |||
| TOTAL INVESTMENTS — 100.3% | |||||
| (Cost — $23,236,775#) | 25,139,492 | ||||
| Liabilities in Excess of Other Assets — (0.3)% | (72,877 | ) | |||
| TOTAL NET ASSETS — 100.0% | $ | 25,066,615 | |||
| * | Non-income producing security. |
| (a) | Securities are fair valued at October 31, 2005 in accordance with the policies adopted by the Board of Trustees (see Note 1a). |
| (b) | Security is exempt from registration under Rule 144A of the Securities Act of 1933. This security may be resold in transactions that are exempt from registration, normally to qualified institutional buyers. This security has been deemed liquid pursuant to guidelines approved by the Board of Trustees unless otherwise noted. |
| (c) | Equity-linked security whereby the coupon, dividend and or redemption amount is linked to the price of an underlying equity security. |
| # | Aggregate cost for federal income tax purposes is $23,264,326. |
| Abbreviations used in this schedule: | |
| ADR — American Depositary Receipt GDR — Global Depositary Receipt NVDR — Non-Voting Depositary Receipt | |
| Summary of Investments by Sector* | ||
| Financials | 21.9 | % |
| Information Technology | 15.0 | |
| Telecommunication Services | 11.4 | |
| Industrials | 9.9 | |
| Energy | 8.8 | |
| Materials | 7.8 | |
| Consumer Discretionary | 7.3 | |
| Consumer Staples | 5.0 | |
| Warrants | 3.7 | |
| Utilities | 3.5 | |
| Equity Linked Notes | 1.4 | |
| Health Care | 0.5 | |
| Repurchase Agreement | 3.8 | |
| 100.0 | % | |
* As a percentage of total investments. Please note that Fund holdings are as of October 31, 2005 and are subject to change.
Smith Barney Emerging Markets Equity Fund 2005 Annual Report 15
| Statement of Assets and Liabilities (October 31, 2005) | |||
| ASSETS: | |||
| Investments, at value (Cost — $23,236,775) | $ | 25,139,492 | |
| Foreign currency, at value (Cost — $107,942) | 108,275 | ||
| Cash | 171 | ||
| Receivable for securities sold | 135,354 | ||
| Dividends and interest receivable | 45,351 | ||
| Receivable for Fund shares sold | 5,505 | ||
| Prepaid expenses | 4,105 | ||
| Total Assets | 25,438,253 | ||
| LIABILITIES: | |||
| Payable for securities purchased | 215,735 | ||
| Management fee payable | 15,507 | ||
| Payable for foreign capital gains tax | 4,847 | ||
| Payable for Fund shares repurchased | 3,049 | ||
| Distribution fees payable | 2,834 | ||
| Unrealized depreciation on foreign currency contracts (Notes 1 and 3) | 881 | ||
| Trustees’ fees payable | 823 | ||
| Transfer agent fees payable | 433 | ||
| Accrued expenses | 127,529 | ||
| Total Liabilities | 371,638 | ||
| Total Net Assets | $ | 25,066,615 | |
| NET ASSETS: | |||
| Par value (Note 5) | $ | 19 | |
| Paid-in capital in excess of par value | 22,010,156 | ||
| Undistributed net investment income | 126,446 | ||
| Accumulated net realized gain on investments and foreign | |||
| currency transactions | 1,032,067 | ||
| Net unrealized appreciation on investments and foreign | |||
| currency transactions | 1,897,927 | ||
| Total Net Assets | $ | 25,066,615 | |
| Shares Outstanding: | |||
| Class A | 997,013 | ||
| Class B | 2,415 | ||
| Class C | 5,742 | ||
| Class Y | 905,524 | ||
| Net Asset Value: | |||
| Class A (and redemption price) | $ | 13.11 | |
| Class B* | $ | 11.30 | |
| Class C* | $ | 11.20 | |
| Class Y (and redemption price) | $ | 13.14 | |
| Maximum Public Offering Price Per Share: | |||
| Class A (based on maximum sales charge of 5.00%) | $ | 13.80 | ** |
| * | Redemption price is NAV of Class B and C shares reduced by a 5.00% and 1.00% CDSC, respectively, if shares are redeemed within one year from purchase payment (See Note 2). |
| ** | Based upon a single purchase of less than $25,000. |
16 Smith Barney Emerging Markets Equity Fund 2005 Annual Report
| Statement of Operations (For the period January 3, 2005* through October 31, 2005) | |||
| INVESTMENT INCOME: | |||
| Dividends | $ | 491,756 | |
| Interest | 22,549 | ||
| Less: Foreign taxes withheld | (67,977 | ) | |
| Total Investment Income | 446,328 | ||
| EXPENSES: | |||
| Custody fees | 163,158 | ||
| Management fee (Note 2) | 155,295 | ||
| Organization and offering costs (Note 1k) | 92,803 | ||
| Shareholder reports (Note 4) | 44,209 | ||
| Audit and tax | 30,032 | ||
| Distribution fees (Notes 2 and 4) | 24,354 | ||
| Legal fees | 21,660 | ||
| Trustees’ fees (Note 2) | 9,665 | ||
| Registration fees | 6,183 | ||
| Transfer agent fees (Notes 2 and 4) | 1,612 | ||
| Miscellaneous expenses | 4,886 | ||
| Total Expenses | 553,857 | ||
| Less: Management fee waiver and expense reimbursement (Note 2) | (267,404 | ) | |
| Net Expenses | 286,453 | ||
| Net Investment Income | 159,875 | ||
| REALIZED AND UNREALIZED GAIN (LOSS) ON INVESTMENTS AND | |||
| FOREIGN CURRENCY TRANSACTIONS (NOTES 1 AND 3): | |||
| Net Realized Gain (Loss) From: | |||
| Investments | 1,032,068 | ||
| Foreign currency transactions | (92,014 | ) | |
| Net Realized Gain | 940,054 | ||
| Change in Net Unrealized Appreciation/Depreciation From: | |||
| Investments | 1,902,717 | ||
| Foreign currency transactions | (4,790 | ) | |
| Change in Net Unrealized Appreciation/Depreciation | 1,897,927 | ||
| Net Gain on Investments and Foreign Currency Transactions | 2,837,981 | ||
| Increase in Net Assets From Operations | $ | 2,997,856 | |
| * Commencement of Operations. | |||
See Notes to Financial Statements.
Smith Barney Emerging Markets Equity Fund 2005 Annual Report 17
| Statement of Changes in Net Assets | |||
| (For the period January 3, 2005† through October 31, 2005) | |||
| 2005 | |||
| OPERATIONS: | |||
| Net investment income | $ | 159,875 | |
| Net realized gain | 940,054 | ||
| Change in net unrealized appreciation/depreciation | 1,897,927 | ||
| Increase in Net Assets From Operations | 2,997,856 | ||
| FUND SHARE TRANSACTIONS (NOTE 5): | |||
| Net proceeds from sale of shares | 31,638,198 | ||
| Cost of shares repurchased | (9,569,439 | ) | |
| Increase in Net Assets From Fund Share Transactions | 22,068,759 | ||
| Increase in Net Assets | 25,066,615 | ||
| NET ASSETS: | |||
| Beginning of period | — | ||
| End of period* | $ | 25,066,615 | |
| * Includes undistributed net investment income of:` | $ | 126,446 | |
| † Commencement of Operations. | |||
See Notes to Financial Statements.
18 Smith Barney Emerging Markets Equity Fund 2005 Annual Report
Financial Highlights
For a share of each class of beneficial interest outstanding throughout the period ended
October 31:
| Class A Shares(1) | 2005 | (2) | |
| Net Asset Value, Beginning of Period | $ | 11.40 | |
| Income From Operations: | |||
| Net investment income | 0.07 | ||
| Net realized and unrealized gain | 1.64 | ||
| Total Income From Operations | 1.71 | ||
| Net Asset Value, End of Period | $ | 13.11 | |
| Total Return(3) | 15.00 | % | |
| Net Assets, End of Period (000s) | $ | 13,074 | |
| Ratios to Average Net Assets: | |||
| Gross expenses(4) | 3.77 | % | |
| Net expenses(4)(5)(6) | 2.00 | ||
| Net investment income(4)(5) | 0.66 | ||
| Portfolio Turnover Rate | 66 | % | |
| (1) | Per share amounts have been calculated using the average shares method. |
| (2) | For the period January 5, 2005 (inception date) to October 31, 2005. |
| (3) | Performance figures may reflect voluntary fee waivers and/or expense reimbursements. Past performance is no guarantee of future results. In the absence of voluntary fee waivers and/or expense reimbursements, the total return would have been lower. |
| Total returns for periods of less than one year are not annualized. | |
| (4) | Annualized. |
| (5) | The investment manager voluntarily waived all of its fees and reimbursed expenses. Such waivers and expense reimbursements are voluntary and may be reduced or terminated at any time. |
| (6) | As a result of a voluntary expense limitation, the ratio of expenses to average net assets will not exceed 2.00%. |
Smith Barney Emerging Markets Equity Fund 2005 Annual Report 19
| Financial Highlights | |||
| For a share of each class of beneficial interest outstanding throughout the period ended | |||
| October 31: | |||
| Class B Shares(1) | 2005 | (2) | |
| Net Asset Value, Beginning of Period | $ | 11.40 | |
| Loss From Operations: | |||
| Net investment loss | (0.02 | ) | |
| Net realized and unrealized loss | (0.08 | ) | |
| Total Loss From Operations | (0.10 | ) | |
| Net Asset Value, End of Period | $ | 11.30 | |
| Total Return(3) | (0.88 | )% | |
| Net Assets, End of Period (000s) | $ | 27 | |
| Ratios to Average Net Assets: | |||
| Gross expenses(4) | 4.52 | % | |
| Net expenses(4)(5)(6) | 2.75 | ||
| Net investment loss(4)(5) | (0.93 | ) | |
| Portfolio Turnover Rate | 66 | % | |
| (1) | Per share amounts have been calculated using the average shares method. |
| (2) | For the period August 11, 2005 (inception date) to October 31, 2005. |
| (3) | Performance figures may reflect voluntary fee waivers and/or expense reimbursements. Past performance is no guarantee of future results. In the absence of voluntary fee waivers and/or expense reimbursements, the total return would have been lower. |
| Total returns for periods of less than one year are not annualized. | |
| (4) | Annualized. |
| (5) | The investment manager voluntarily waived all of its fees and reimbursed expenses. Such waivers and expense reimbursments are voluntary and may be reduced or terminated at any time. |
| (6) | As a result of a voluntary expense limitation, the ratio of expenses to average net assets will not exceed 2.75%. |
20 Smith Barney Emerging Markets Equity Fund 2005 Annual Report
| Financial Highlights | |||
| For a share of each class of beneficial interest outstanding throughout the period ended | |||
| October 31: | |||
| Class C Shares(1) | 2005 | (2) | |
| Net Asset Value, Beginning of Period | $ | 11.40 | |
| Loss From Operations: | |||
| Net investment loss | (0.02 | ) | |
| Net realized and unrealized loss | (0.18 | ) | |
| Total Loss From Operations | (0.20 | ) | |
| Net Asset Value, End of Period | $ | 11.20 | |
| Total Return(3) | (1.75 | )% | |
| Net Assets, End of Period (000s) | $ | 64 | |
| Ratios to Average Net Assets: | |||
| Gross expenses(4) | 4.53 | % | |
| Net expenses(4)(5)(6) | 2.75 | ||
| Net investment loss(4)(5) | (1.37 | ) | |
| Portfolio Turnover Rate | 66 | % | |
| (1) | Per share amounts have been calculated using the average shares method. |
| (2) | For the period September 7, 2005 (inception date) to October 31, 2005. |
| (3) | Performance figures may reflect voluntary fee waivers and/or expense reimbursements. Past performance is no guarantee of future results. In the absence of voluntary fee waivers and/or expense reimbursements, the total return would have been lower. |
| Total returns for periods of less than one year are not annualized. | |
| (4) | Annualized. |
| (5) | The investment manager voluntarily waived all of its fees and reimbursed expenses. Such waivers and expense reimbursements are voluntary and may be reduced or terminated at any time. |
| (6) | As a result of a voluntary expense limitation, the ratio of expenses to average net assets will not exceed 2.75%. |
Smith Barney Emerging Markets Equity Fund 2005 Annual Report 21
| Financial Highlights | |||
| For a share of each class of beneficial interest outstanding throughout the period ended October 31: | |||
| Class Y Shares(1) | 2005 | (2) | |
| Net Asset Value, Beginning of Period | $ | 11.40 | |
| Income From Operations: | |||
| Net investment income | 0.14 | ||
| Net realized and unrealized gain | 1.60 | ||
| Total Income From Operations | 1.74 | ||
| Net Asset Value, End of Period | $ | 13.14 | |
| Total Return(3) | 15.26 | % | |
| Net Assets, End of Period (000s) | $ | 11,902 | |
| Ratios to Average Net Assets: | |||
| Gross expenses(4) | 2.73 | % | |
| Net expenses(4)(5)(6) | 1.35 | ||
| Net investment income(4)(5) | 1.39 | ||
| Portfolio Turnover Rate | 66 | % | |
| (1) | Per share amounts have been calculated using the average shares method. |
| (2) | For the period January 3, 2005 (inception date) to October 31, 2005. |
| (3) | Performance figures may reflect voluntary fee waivers and/or expense reimbursements. Past performance is no guarantee of future results. In the absence of voluntary fee waivers and/or expense reimbursements, the total return would have been lower. |
| Total returns for periods of less than one year are not annualized. | |
| (4) | Annualized. |
| (5) | The investment manager voluntarily waived all of its fees and reimbursed expenses. Such waivers and expense reimbursements are voluntary and may be reduced or terminated at any time. |
| (6) | As a result of a voluntary expense limitation, the ratio of expenses to average net assets will not exceed 1.35%. |
22 Smith Barney Emerging Markets Equity Fund 2005 Annual Report
Notes to Financial Statements
1. Organization and Significant Accounting Policies
The Smith Barney Emerging Markets Equity Fund (“Fund”), is a separate diversified investment fund of CitiFunds Trust I (“Trust”), a Massachusetts business trust. The Trust is registered as an open-end management investment company under the Investment Company Act of 1940, as amended (“1940 Act”).
The following are significant accounting policies consistently followed by the Fund and are in conformity with U.S. generally accepted accounting principles (“GAAP”). Estimates and assumptions are required to be made regarding assets, liabilities and changes in net assets resulting from operations when financial statements are prepared. Changes in the economic environment, financial markets and any other parameters used in determining these estimates could cause actual results to differ.
(a) Investment Valuation. Equity securities for which market quotations are available are valued at the last sale price or official closing price on the primary market or exchange on which they trade. Debt securities are valued at the mean between the bid and asked prices provided by an independent pricing service that are based on transactions in debt obligations, quotations from bond dealers, market transactions in comparable securities and various relationships between securities. When prices are not readily available, or are determined not to reflect fair value, such as when the value of a security has been significantly affected by events after the close of the exchange or market on which the security is principally traded, but before the Fund calculates its net asset value, the Fund may value these investments at fair value as determined in accordance with the procedures approved by the Fund’s Board of Trustees. Fair valuing of securities may be determined with the assistance of a pricing service using calculations based on indices of domestic securities and other appropriate indicators, such as prices of relevant ADRs and futures contracts. Short-term obligations maturing within 60 days are valued at amortized cost, which approximates market value.
(b) Repurchase Agreements. When entering into repurchase agreements, it is the Fund’s policy that its custodian or a third party custodian takes possession of the underlying collateral securities, the market value of which at least equals the principal amount of the repurchase transaction, including accrued interest. To the extent that any repurchase transaction exceeds one business day, the value of the collateral is marked-to-market to ensure the adequacy of the collateral. If the seller defaults, and the market value of the collateral declines or if bankruptcy proceedings are commenced with respect to the seller of the security, realization of the collateral by the Fund may be delayed or limited.
(c) Equity Linked Notes. Equity-linked notes, or ELNs, are debt securities that pay interest based upon the performance of one or more equity securities, such as a stock index, a group of stocks or a single stock. ELNs offer investors the opportunity to participate in the appreciation of the underlying equity securities, often subject to a cap on the interest payable. ELNs are typically considered more conservative investments than investments in the equity securities to which they are linked, as ELNs generally provide for the repayment at maturity of the principal amount invested, plus interest (if any). However, in addition to the credit and market risks applicable to debt securities, ELNs are subject to the risk that an investor will receive less than the prevailing rate of interest if the value of the relevant equity securities decline or fail to increase sufficiently.
Smith Barney Emerging Markets Equity Fund 2005 Annual Report 23
Notes to Financial Statements (continued)
(d) Concentration Risk. The Fund’s investments in foreign securities may involve risks not present in domestic investments. Since securities may be denominated in foreign currencies and may require settlement in foreign currencies and pay interest or dividends in foreign currencies, changes in the relationship of these foreign currencies to the U.S. dollar can significantly affect the value of the investments and earnings of the Fund. Foreign investments may also subject the Fund to foreign government exchange restrictions, expropriation, taxation or other political, social or economic developments, all of which affect the market and/or credit risk of the investments.
(e) Security Transactions and Investment Income. Security transactions are accounted for on a trade date basis. Interest income, adjusted for amortization of premium and accretion of discount, is recorded on the accrual basis. Dividend income is recorded on the ex-dividend date. Foreign dividend income is recorded on the ex-dividend date or as soon as practical after the Fund determines the existence of a dividend declaration after exercising reasonable due diligence. The cost of investments sold is determined by use of the specific identification method. To the extent any issuer defaults on an expected interest payment, the Fund’s policy is to generally halt any additional interest income accruals and consider the realizability of interest accrued up to the date of default.
(f ) Expenses. The Fund bears all costs of its operations other than expenses specifically assumed by the Manager. Expenses incurred by the Trust with respect to any two or more funds in the series are allocated in proportion to the average net assets of each fund, except when allocations of direct expenses to each fund can otherwise be made fairly. Expenses directly attributable to a fund are charged to that fund.
(g) Foreign Currency Translation. Investment securities and other assets and liabilities denominated in foreign currencies are translated into U.S. dollar amounts based upon prevailing exchange rates on the date of valuation. Purchases and sales of investment securities and income and expense items denominated in foreign currencies are translated into U.S. dollar amounts based upon prevailing exchange rates on the respective dates of such transactions.
The Fund does not isolate that portion of the results of operations resulting from changes in foreign exchange rates on investments from the fluctuations arising from changes in market prices of securities held. Such fluctuations are included with the net realized and unrealized gain or loss on investments.
Net realized foreign exchange gains or losses arise from sales of foreign currencies, including gains and losses on forward foreign currency contracts, currency gains or losses realized between the trade and settlement dates on securities transactions and the difference between the amounts of dividends, interest and foreign withholding taxes recorded on the Fund’s books and the U.S. dollar equivalent of the amounts actually received or paid. Net unrealized foreign exchange gains and losses arise from changes in the fair values of assets and liabilities, other than investments in securities, at the date of valuation, resulting from changes in exchange rates.
Foreign security and currency transactions may involve certain considerations and risks not typically associated with those of U.S. dollar denominated transactions as a result of,
24 Smith Barney Emerging Markets Equity Fund 2005 Annual Report
Notes to Financial Statements (continued)
among other factors, the possibility of lower levels of governmental supervision and regulation of foreign securities markets and the possibility of political or economic instability.
(h) Distributions to Shareholders. Distributions from net investment income and distributions of net realized gains, if any, are declared at least annually. Distributions to shareholders of the Fund are recorded on the ex-dividend date and are determined in accordance with income tax regulations, which may differ from GAAP.
(i) Class Accounting. Investment income, common expenses and realized/unrealized gain (loss) on investments are allocated to the various classes of the Fund on the basis of daily net assets of each class. Fees relating to a specific class are charged directly to that class.
(j) Federal and Other Taxes. It is the Fund’s policy to comply with the federal income and excise tax requirements of the Internal Revenue Code of 1986, as amended, applicable to regulated investment companies. Accordingly, the Fund intends to distribute substantially all of its taxable income and net realized gains on investments, if any, to shareholders each year. Therefore, no federal income tax provision is required in the Fund’s financial statements. Under the applicable foreign tax laws, a withholding tax may be imposed on interest, dividends and capital gains at various rates.
(k) Organization and Offering Costs. It is the Fund’s policy to expense all costs related to the organization and offering of the Fund as they are incurred. For the period ended October 31, 2005, the Fund paid $92,803 for legal and shareholder fees related to the initial registration of the Fund and related activities.
(l) Reclassification. GAAP requires that certain components of net assets be adjusted to reflect permanent differences between financial and tax reporting. These reclassifications have no effect on net assets or net asset values per share. During the current year, the following reclassifications have been made:
| (Over)/ | ||||||||
| Undistributed Net | ||||||||
| Investment | Accumulated Net | |||||||
| Income | Realized Gain | Paid-in Capital | ||||||
| (a) | $ | 58,584 | — | $(58,584 | ) | |||
| (b) | (92,013 | ) | $92,013 | — | ||||
| (a) | Reclassifications are primarily due to non-deductible 12b-1 fees and non-deductible offering costs. |
| (b) | Reclassifications are primarily due to foreign currency transactions treated as ordinary income for tax purposes. |
2. Management Agreement and Other Transactions with Affiliates
Smith Barney Fund Management LLC (“SBFM”), which for the period of this report was an indirect wholly-owned subsidiary of Citigroup Inc. (“Citigroup”), acts as investment manager to the Fund. SBFM delegates the daily management of the investments of the Fund to its affiliate, Citigroup Asset Management, Ltd., as sub-advisor. Effective October 1, 2005, the Fund’s investment management fee, which is calculated daily and payable monthly, was reduced from 0.95% of the Fund’s average daily net assets to a fee calculated in accordance with the following breakpoint schedule:
Smith Barney Emerging Markets Equity Fund 2005 Annual Report 25
Notes to Financial Statements (continued)
| Investment Management | |||
| Average Daily Net Assets | Fee Rate | ||
| First $1 billion | 0.850 | % | |
| Next $1 billion | 0.825 | % | |
| Next $3 billion | 0.800 | % | |
| Next $5 billion | 0.775 | % | |
| Over $10 billion | 0.750 | % | |
During the period ended October 31, 2005, the Fund’s Class A, B, C and Y shares had voluntary expense limitations in place of 2.00%, 2.75%, 2.75% and 1.35%, respectively, of each class’ respective average daily net assets, resulting in waived management fees of $155,295 and expense reimbursements of $112,109. These expense limitations can be terminated at any time by SBFM.
Citicorp Trust Bank, fsb. (“CTB”), another subsidiary of Citigroup, acts as the Fund’s transfer agent. PFPC Inc. (“PFPC”) acts as the Fund’s sub-transfer agent. CTB receives account fees and asset-based fees that vary according to the size and type of account. PFPC is responsible for shareholder recordkeeping and financial processing for all shareholder accounts and is paid by CTB. For the period ended October 31, 2005, the Fund paid transfer agent fees of $711 to CTB.
Citigroup Global Markets Inc. (“CGM”), another indirect wholly-owned subsidiary of Citigroup, acts as the Fund’s distributor.
There is a maximum initial sales charge of 5.00% for Class A shares. There is a contingent deferred sales charge (“CDSC”) of 5.00% on Class B shares, which applies if redemption occurs within one year from purchase payment and declines thereafter by 1.00% a year until no CDSC is incurred. Class C shares have a 1.00% CDSC, which applies if redemption occurs within one year from purchase payment. In certain cases, Class A shares have a 1.00% CDSC, which applies if redemption occurs within one year from purchase payment. This CDSC only applies to those purchases of Class A shares, which, when combined with current holdings of Class A shares, equal or exceed $1,000,000 in the aggregate. These purchases do not incur an initial sales charge.
For the period ended October 31, 2005, CGM received sales charges of approximately $1,000 on sales of the Fund’s Class A shares.
Certain officers and one Trustee of the Trust are employees of SBFM or its affiliates and do not receive compensation from the Fund.
The Trustees of the Fund have adopted a Retirement Plan (the “Plan”) for all Trustees who are not “interested persons” of the Fund, within the meaning of the 1940 Act. Under the Plan, all Trustees are required to retire from the Board as of the last day of the calendar year in which the applicable Trustee attains age 75. Trustees may retire under the Plan before attaining the mandatory retirement age. Trustees who have served as Trustee of the Trust or any of the investment companies associated with the manager for at least ten years when they retire are eligible to receive the maximum retirement benefit under the Plan. The maximum retirement benefit is an amount equal to five times the amount of retainer and regular meeting fees payable to a Trustee during the entirety of the calendar year of the
26 Smith Barney Emerging Markets Equity Fund 2005 Annual Report
Notes to Financial Statements (continued)
Trustee’s retirement. Amounts under the Plan may be paid in installments or in a lump sum (discounted to present value). Benefits under the Plan are unfunded. Three former Trustees are currently receiving payments under the Plan. In addition, two other Trustees previously elected to receive a lump sum payment under the Plan. The Fund’s allocable share of the liability at October 31, 2005 was $477.
3. Investments
During the year ended October 31, 2005, the aggregate cost of purchases and proceeds from sales of investments (excluding short-term investments) were as follows:
| Purchases | $34,236,362 | |
| Sales | 12,985,677 | |
At October 31, 2005, the aggregate gross unrealized appreciation and depreciation of investments for federal income tax purposes were as follows:
| Gross unrealized appreciation | $2,603,412 | |
| Gross unrealized depreciation | (728,246 | ) |
| Net unrealized appreciation | $1,875,166 | |
At October 31, 2005, the Fund had the following open foreign currency contracts as described below. The unrealized loss on the contracts reflected in the accompanying financial statements were as follows:
| Local | Market | Settlement | Unrealized | |||||||
| Foreign Currency | Currency | Value | Date | Gain (Loss) | ||||||
| Contracts to Buy: | ||||||||||
| Brazilian Real (BRL) | 120,900 | $53,775 | 11/1/05 | $ 327 | ||||||
| Indonesian Rupiah (IDR) | 144,666,214 | 14,292 | 11/1/05 | (230 | ) | |||||
| Indonesian Rupiah (IDR) | 201,890,437 | 19,945 | 11/9/05 | (114 | ) | |||||
| Mexican Peso (MXN) | 39,694 | 3,679 | 11/1/05 | (5 | ) | |||||
| South African Rand (ZAR) | 412,100 | 61,412 | 11/2/05 | (600 | ) | |||||
| Contracts to Sell: | ||||||||||
| Brazilian Real (BRL) | 8,826 | 3,926 | 11/3/05 | (13 | ) | |||||
| Hong Kong Dollar (HKD) | 40,331 | 5,203 | 11/1/05 | (1 | ) | |||||
| Malaysian Ringgit (MYR) | 52,136 | 13,811 | 11/2/05 | (9 | ) | |||||
| Malaysian Ringgit (MYR) | 22,401 | 5,934 | 11/7/05 | (4 | ) | |||||
| South African Rand (ZAR) | 402,259 | 59,945 | 11/3/05 | (186 | ) | |||||
| South African Rand (ZAR) | 99,059 | 14,762 | 11/4/05 | (46 | ) | |||||
| Net unrealized loss on open | ||||||||||
| foreign currency contracts | $ (881 | ) | ||||||||
4. Class Specific Expenses
Pursuant to a Distribution Plan, the Fund pays a service fee with respect to its Class A, B and C shares calculated at the annual rate of 0.25%, 1.00% and 1.00% of the average daily net assets of each respective class. For the period ended October 31, 2005, total
Smith Barney Emerging Markets Equity Fund 2005 Annual Report 27
Notes to Financial Statements (continued)
Distribution fees, which are accrued daily and paid monthly, were as follows:
| Class A | Class B | Class C | |||||||
| Distribution Fees | $24,231 | $57 | $66 | ||||||
For the period ended October 31, 2005, total Transfer Agent fees were as follows:
| Class A | Class B | Class C | Class Y | |
| Transfer Agent Fees | $1,504 | $24 | $35 | $49 |
For the period ended October 31, 2005, total Shareholder Reports expenses were as follows:
| Class A | Class B | Class C | Class Y | |
| Shareholder Reports Expenses | $41,590 | $22 | $63 | $2,534 |
5. Shares of Beneficial Interest
At October 31, 2005, the Trust’s Declaration of Trust permits the Trust to issue unlimited number of full and fractional shares of beneficial interest (par value of $0.00001 per share) of each series and to divide or combine the shares of any series into a greater or lesser number of shares of that series without thereby changing the proportionate beneficial interests in that series and to divide such shares into classes. The Trust has reserved the right to create and issue additional series and classes of shares. Each share of a class represents an identical interest in the Fund and has the same rights, except that each class bears certain expenses specifically related to the distribution of its shares.
Transactions in shares if each class were as follows:
| Period Ended | |||||
| October 31, 2005(1) | |||||
| Shares | Amount | ||||
| Class A | |||||
| Shares sold | 1,287,970 | $ | 15,058,191 | ||
| Shares repurchased | (290,957 | ) | (3,553,273 | ) | |
| Net Increase | 997,013 | $ | 11,504,918 | ||
| Class B | |||||
| Shares sold | 2,415 | $ | 27,560 | ||
| Net Increase | 2,415 | $ | 27,560 | ||
| Class C | |||||
| Shares sold | 5,966 | $ | 69,404 | ||
| Shares repurchased | (224 | ) | (2,510 | ) | |
| Net Increase | 5,742 | $ | 66,894 | ||
| Class Y | |||||
| Shares sold | 1,412,497 | $ | 16,483,043 | ||
| Shares repurchased | (506,973 | ) | (6,013,656 | ) | |
| Net Increase | 905,524 | $ | 10,469,387 | ||
| (1) | For the periods January 5, 2005, August 11, 2005, September 7, 2005, and January 3, 2005 through October 31, 2005 for Class A, B, C and Y, respectively. |
28 Smith Barney Emerging Markets Equity Fund 2005 Annual Report
Notes to Financial Statements (continued)
6. Income Tax Information and Distributions to Shareholders
Subsequent to the fiscal year end, the Fund has made the following distributions:
| Record Date | ||||
| Payable Date | Class A | Class B | Class C | Class Y |
| Short-Term Capital Gains | ||||
| 12/8/2005 | ||||
| 12/9/2005 | $0.544762 | $0.544762 | $0.544762 | $0.544762 |
During the fiscal year ended October 31, 2005, the Fund did not make any distributions. As of October 31, 2005, the components of accumulated earnings on a tax basis were as follows:
| Undistributed ordinary income — net | $1,185,541 | |
| Other book/tax temporary differences (a) | 523 | |
| Unrealized appreciation (b) | 1,870,376 | |
| Total Accumulated Earnings/(losses) — net | $3,056,440 | |
| (a) | Other book/tax temporary differences are attributable primarily to realization for tax purposes of unrealized gains/(losses) on certain foreign currency contracts. |
| (b) | The difference between book-basis and tax-basis unrealized appreciation is attributable primarily to the tax deferral of losses on wash sales. |
7. Regulatory Matters
On May 31, 2005, the U.S. Securities and Exchange Commission (“SEC”) issued an order in connection with the settlement of an administrative proceeding against SBFM and CGM relating to the appointment of an affiliated transfer agent for the Smith Barney family of mutual funds (the “Funds”).
The SEC order finds that SBFM and CGM willfully violated Section 206(1) of the Investment Advisers Act of 1940 (“Advisers Act”). Specifically, the order finds that SBFM and CGM knowingly or recklessly failed to disclose to the boards of the Funds in 1999 when proposing a new transfer agent arrangement with an affiliated transfer agent that: First Data Investors Services Group (“First Data”), the Funds’ then-existing transfer agent, had offered to continue as transfer agent and do the same work for substantially less money than before; and that Citigroup Asset Management (“CAM”), the Citigroup business unit that, at the time, included the fund’s investment manager and other investment advisory companies, had entered into a side letter with First Data under which CAM agreed to recommend the appointment of First Data as sub-transfer agent to the affiliated transfer agent in exchange for, among other things, a guarantee by First Data of specified amounts of asset management and investment banking fees to CAM and CGM. The order also finds that SBFM and CGM willfully violated Section 206(2) of the Advisers Act by virtue of the omissions discussed above and other misrepresentations and omissions in the materials pro vided to the Funds’ boards, including the failure to make clear that the affiliated transfer agent would earn a high profit for performing limited functions while First Data continued to perform almost all of the transfer agent functions, and the suggestion that the proposed arrangement was in the Funds’ best interests and that no viable alternatives existed. SBFM and CGM do not admit or deny any wrongdoing or liability. The settlement does not establish wrongdoing or liability for purposes of any other proceeding.
Smith Barney Emerging Markets Equity Fund 2005 Annual Report 29
Notes to Financial Statements (continued)
The SEC censured SBFM and CGM and ordered them to cease and desist from violations of Sections 206(1) and 206(2) of the Advisers Act. The order requires Citigroup to pay $208.1 million, including $109 million in disgorgement of profits, $19.1 million in interest, and a civil money penalty of $80 million. Approximately $24.4 million has already been paid to the Funds, primarily through fee waivers. The remaining $183.7 million, including the penalty, has been paid to the U.S. Treasury and will be distributed pursuant to a plan prepared and submitted for approval by the SEC. The order also requires that transfer agency fees received from the Funds since December 1, 2004 less certain expenses be placed in escrow and provides that a portion of such fees may be subsequently distributed in accordance with the terms of the order.
The order required SBFM to recommend a new transfer agent contract to the Fund boards within 180 days of the entry of the order; if a Citigroup affiliate submitted a proposal to serve as transfer agent or sub-transfer agent, SBFM and CGM would have been required, at their expense, to engage an independent monitor to oversee a competitive bidding process. On November 21, 2005, and within the specified timeframe, the Fund’s Board selected a new transfer agent for the Fund. No Citigroup affiliate submitted a proposal to serve as transfer agent. Under the order, SBFM also must comply with an amended version of a vendor policy that Citigroup instituted in August 2004. At this time, there is no certainty as to how the proceeds of the settlement will be distributed, to whom such distributions will be made, the methodology by which such distributions will be allocated, and when such distributions will be made. Although there can be no assurance, SBFM does not believe that this matter will have a material adverse effect on the Funds.
On December 1, 2005, Citigroup completed the sale of substantially all of its global asset management business, including SBFM, to Legg Mason Inc.
8. Legal Matters
Beginning in August 2005, five class action lawsuits alleging violations of federal securities laws and state law were filed against CGM and SBFM, (collectively, the “Defendants”) based on the May 31, 2005 settlement order issued against the Defendants by the SEC based in Note 7. The complaints seek injunctive relief and compensatory and punitive damages, removal of SBFM as the advisor for the Smith Barney family of funds, rescission of the Funds’ management and other contracts with SBFM, recovery of all fees paid to SBFM pursuant to such contracts, and an award of attorneys’ fees and litigation expenses.
On October 5, 2005, a motion to consolidate the five actions and any subsequently-filed, related action was filed. That motion contemplates that a consolidated amended complaint alleging substantially similar causes of action will be filed in the future.
As of the date of this report, the Fund’s investment manager believes that resolution of the pending lawsuit will not have a material effect on the financial position or results of operations of the Funds or the ability of the Fund’s investment manager and its affiliates to continue to render services to the Funds under their respective contracts.
30 Smith Barney Emerging Markets Equity Fund 2005 Annual Report
Notes to Financial Statements (continued)
Beginning in June 2004, class action lawsuits alleging violations of the federal securities laws were filed against Citigroup Global Markets Inc. (the “Distributor”) and a number of its affiliates, including SBFM and Salomon Brothers Asset Management Inc (the “Advisers”), substantially all of the mutual funds managed by the Advisers, including the Fund (the “Funds”), and directors or trustees of the Funds (collectively, the “Defendants”). The complaints alleged, among other things, that CGM created various undisclosed incentives for its brokers to sell Smith Barney and Salomon Brothers funds. In addition, according to the complaints, the Advisers caused the Funds to pay excessive brokerage commissions to CGM for steering clients towards proprietary funds. The complaints also alleged that the defendants breached their fiduciary duty to the Funds by improperly charging Rule l2b-1 fees and by drawing on fund assets to make undisclosed payments of soft dollars and excessive brokerage commissions. The complaints also alleged that the Funds failed to adequately disclose certain of the allegedly wrongful conduct. The complaints sought injunctive relief and compensatory and punitive damages, rescission of the Funds’ contracts with the Advisers, recovery of all fees paid to the Advisers pursuant to such contracts and an award of attorneys’ fees and litigation expenses.
On December 15, 2004, a consolidated amended complaint (the “Complaint”) was filed alleging substantially similar causes of action. While the lawsuit is in its earliest stages, to the extent that the Complaint purports to state causes of action against the Funds, the Fund’s investment manager believes the Funds have significant defenses to such allegations, which the Funds intend to vigorously assert in responding to the Complaint.
Additional lawsuits arising out of theses circumstances and presenting similar allegations and requests for relief may be filed against the Defendants in the future.
As of the date of this report, the Fund’s investment manager and the Funds believe that the resolution of the pending lawsuit will not have a material effect on the financial position or results of operations of the Funds or the ability of the Advisers and their affiliates to continue to render services to the Funds under their respective contracts.
The Defendants have moved to dismiss the Complaint. Those motions are pending before the court.
9. Other Matters
The Fund has received information concerning SBFM as follows:
On September 16, 2005, the staff of the Securities and Exchange Commission (the “Commission”) informed SBFM that the staff is considering recommending that the Commission institute administrative proceedings against SBFM for alleged violations of Sections 19(a) and 34(b) of the Investment Company Act (and related Rule 19a-1). The notification is a result of an industry wide inspection undertaken by the Commission and is based upon alleged deficiencies in disclosures regarding dividends and distributions paid to shareholders of certain funds. In connection with the contemplated proceedings, the staff may seek a cease and desist order and/or monetary damages from SBFM.
Although there can be no assurance, SBFM believes that this matter is not likely to have a material adverse effect on the Fund or SBFM’s ability to perform investment advisory services relating to the Fund.
Smith Barney Emerging Markets Equity Fund 2005 Annual Report 31
Notes to Financial Statements (continued)
10. Subsequent Events
On December 1, 2005, Citigroup Inc. (“Citigroup”) completed the sale of substantially all of its asset management business, Citigroup Asset Management (“CAM”), to Legg Mason, Inc. (“Legg Mason”). As a result, the fund’s investment adviser (the “Manager”), previously an indirect wholly-owned subsidiary of Citigroup, has become a wholly-owned subsidiary of Legg Mason. Completion of the sale caused the Fund’s existing investment management contract (and sub-advisory contract(s), if applicable) to terminate. The fund’s shareholders previously approved a new investment management contract between the Fund and the Manager (and new sub-advisory contract(s), if applicable) which became effective on December 1, 2005.
Legg Mason, whose principal executive offices are at 100 Light Street, Baltimore, Maryland 21202, is a financial services holding company. As of December 2, 2005, Legg Mason’s asset management operation had aggregate assets under management of approximately $830 billion.
�� The Fund’s Board has appointed the Fund’s current distributor, Citigroup Global Markets Inc. (“CGM”) and Legg Mason Investor Services, LLC (“LMIS”), a wholly-owned broker-dealer subsidiary of Legg Mason, as co-distributors of the Fund. The Fund’s Board has also approved amended and restated Rule 12b-1 Plans. CGM and other broker-dealers, financial intermediaries and financial institutions (each called a “Service Agent”) that currently offer Fund shares will continue to make the Fund’s shares available to their clients. Additional Service Agents may offer fund shares in the future.
Effective December 1, 2005, with respect to those Fund classes subject to a 12b-1 Plan, the Fund pays service and distribution fees to each of LMIS and CGM for the services they provide and expenses they bear under the Distribution Agreements. The expenses intended to be covered by the distribution fees include those of each co-distributor. The co-distributors will provide the Fund’s Board with periodic reports of amounts expended under the Fund’s Rule 12b-1 Plans and the purposes for which such expenditures were made.
Effective December 1, 2005, CGM will no longer be an affiliated person of the Fund under the 1940 Act. As a result, the Fund will be permitted to execute transactions with CGM or an affiliate of CGM as agent (but not as principal) without the restrictions applicable to transactions with affiliated persons. Similarly, the Fund generally will be permitted to purchase securities in underwritings in which CGM or an affiliate of CGM is a member without the restrictions imposed by certain rules of the Securities and Exchange Commission. The Manager’s use of CGM or affiliates of CGM as agent in portfolio transactions with the Fund will be governed by the Fund’s policy of seeking the best overall terms available.
Certain officers and one Trustee of the Fund are employees of Legg Mason or its affiliates and do not receive compensation from the Fund.
The Fund’s Board has approved PFPC Inc. (“PFPC”) to serve as transfer agent for the Fund. The principal business office of PFPC is located at P.O. Box 9699, Providence, RI 02940-9699.
32 Smith Barney Emerging Markets Equity Fund 2005 Annual Report
Report of Independent Registered Public Accounting Firm
The Shareholders and Board of Trustees CitiFunds Trust I:
We have audited the accompanying statement of assets and liabilities, including the schedule of investments, of Smith Barney Emerging Markets Equity Fund, a series of CitiFunds Trust I, as of October 31, 2005, and the related statement of operations, changes in net assets, and the financial highlights for the period from January 3, 2005 (commencement of operations) to October 31, 2005. These financial statements and financial highlights are the responsibility of the Trust’s management. Our responsibility is to express an opinion on these financial statements and financial highlights based on our audit.
We conducted our audit in accordance with the standards of the Public Company Accounting Oversight Board (United States). Those standards require that we plan and perform the audit to obtain reasonable assurance about whether the financial statements and financial highlights are free of material misstatement. An audit includes examining, on a test basis, evidence supporting the amounts and disclosures in the financial statements. Our procedures included confirmation of securities owned as of October 31, 2005, by correspondence with the custodian and brokers or by other appropriate auditing procedures. An audit also includes assessing the accounting principles used and significant estimates made by management, as well as evaluating the overall financial statement presentation. We believe that our audit provides a reasonable basis for our opinion.
In our opinion, the financial statements and financial highlights referred to above present fairly, in all material respects, the financial position of Smith Barney Emerging Markets Equity Fund as of October 31, 2005, and the results of its operations, changes in its net assets, and the financial highlights for the period from January 3, 2005 to October 31, 2005, in conformity with U.S. generally accepted accounting principles.

New York, New York
December 16, 2005
Smith Barney Emerging Markets Equity Fund 2005 Annual Report 33
Board Approval of Management Agreement (unaudited)
Background
The members of the Board of Smith Barney Emerging Markets Equity Fund (the “Fund”), a series of CitiFunds Trust I, including the Fund’s Board members that are not considered to be “interested persons” under the Investment Company Act of 1940, as amended (the “Independent Board Members”), received information from the Fund’s manager (the “Manager”) to assist them in their consideration of the Fund’s management agreement (the “Management Agreement”) and sub-advisory agreement (the “Sub-Advisory Agreement”). The Board received and considered a variety of information about the Manager, Citigroup Asset Management Ltd. (the “Subadviser”) and the Fund’s distributor, as well as the advisory, sub-advisory and distribution arrangements for the Fund and other funds overseen by the Board, certain portions of which are discussed below. The presentation made to the Board encompassed the Fund and all the funds for which the Board has responsibility. The discussion below covers both advisory and administrative functions being rendered by the Manager, each function encompassed by the Management Agreement.
Board Approval of Management Agreement and Sub-Advisory Agreement
In approving the Management Agreement and Sub-Advisory Agreement, the Fund’s Board, including the Independent Board Members, considered the factors below. In all of the Board’s considerations with respect to the approval of the Management Agreement, the Board was mindful of the proposed acquisition of the Manager by Legg Mason, Inc.
Nature, Extent and Quality of the Services under the Management Agreement and Sub-Advisory Agreement
The Board received and considered information regarding the nature, extent and quality of services provided to the Fund by the Manager and the Subadviser under the Management Agreement and the Sub-Advisory Agreement, respectively during the past year. The Board noted information received at regular meetings throughout the year related to the services rendered by the Manager in its management of the Fund’s affairs and the Manager’s role in coordinating the activities of the Fund’s other service providers. The Board’s evaluation of the services provided by the Manager and the Subadviser took into account the Board’s knowledge and familiarity gained as Board members of funds in the Citigroup Asset Management (“CAM”) fund complex, including the scope and quality of the Manager’s investment management and other capabilities and the quality of its administrative and other services. The Board observed that the scope of services provided by the Manager had expanded over time as a result of regulatory and other developments, including maintaining and monitoring its own and the Fund’s expanded compliance programs. The Board also considered the Manager’s response to recent regulatory compliance issues affecting it and the CAM fund complex. The Board reviewed information received from the Manager regarding the Fund’s compliance policies and procedures established pursuant to Rule 38a-1 under the Investment Company Act of 1940, as amended.
The Board reviewed the qualifications, backgrounds and responsibilities of the Fund’s senior personnel and the portfolio management team primarily responsible for the day-today portfolio management of the Fund. The Board also considered the degree to which the
34 Smith Barney Emerging Markets Equity Fund 2005 Annual Report
Board Approval of Management Agreement (unaudited) (continued)
Manager implemented organizational changes to improve investment results and the services provided to the CAM fund complex. The Board also considered, based on its knowledge of the Manager and its affiliates, the financial resources available to CAM and its parent organization, Citigroup Inc.
The Board considered the division of responsibilities between the Manager and the Subadviser and the oversight provided by the Manager. The Board also considered the Manager’s and Subadviser’s brokerage policies and practices, the standards applied in seeking best execution, the Manager’s policies and practices regarding soft dollars, the use of a broker affiliated with the Manager or the Subadviser and the existence of quality controls applicable to brokerage allocation procedures. In addition, management also reported to the Board on, among other things, its business plans, recent organizational changes and portfolio manager compensation plan.
The Board concluded that, overall, the nature, extent and quality of services provided (and expected to be provided) under the Management Agreement and the Sub-Advisory Agreement were acceptable.
Fund Performance
The Board received and considered information for the Fund as well as for a group of funds (the “Performance Universe”) selected by Lipper, Inc. (“Lipper”), an independent provider of investment company data. The Board was provided with a description of the methodology Lipper used to determine the similarity of the Fund with the funds included in the Performance Universe. The Board also noted that it had received and discussed with management information throughout the year at periodic intervals comparing the Fund’s performance against its benchmark(s).
The information comparing the Fund’s performance to that of its Performance Universe has been intentionally omitted because the Fund has less than six months of performance available. The Board noted that the Fund commenced operations in January 2005. Based on their review, which included careful consideration of all of the factors noted above, the Board, mindful of the proposed transaction with Legg Mason, concluded that it will continue to monitor the Fund’s performance.
Management Fees and Expense Ratios
The Board reviewed and considered the contractual management fee (the “Contractual Management Fee”) payable by the Fund to the Manager in light of the nature, extent and quality of the management and sub-advisory services provided by the Manager and the Subadviser. The Board also reviewed and considered that fee waiver and/or expense reimbursement arrangements are currently in place for the Fund and considered the actual fee rate (after taking waivers and reimbursements into account) (the “Actual Management Fee”) and that the Manager had agreed to continue its fee waivers and reimbursements until further notice. In addition, the Board noted that the compensation paid to the Subadviser is paid by the Manager, not the Fund, and, accordingly, that the retention of the Subadviser does not increase the fees or expenses otherwise incurred by the Fund’s shareholders.
Smith Barney Emerging Markets Equity Fund 2005 Annual Report 35
Board Approval of Management Agreement (unaudited) (continued)
Additionally, the Board received and considered information comparing the Fund’s Contractual Management Fees and Actual Management Fee and the Fund’s overall expenses with those of funds in both the relevant expense group and a broader group of funds, each selected and provided by Lipper. The Board also reviewed information regarding fees charged by the Manager to other U.S. clients investing primarily in an asset class similar to that of the Fund including, where applicable, separate accounts. The Manager reviewed with the Board the significant differences in scope of services provided to the Fund and to these other clients, noting that the Fund is provided with administrative services, office facilities, Fund officers (including the Fund’s chief executive, chief financial and chief compliance officers), and that the Manager coordinates and oversees the provision of services to the Fund by other Fund providers. The Board considered the fee comparisons in light of the differences required to manage these different types of accounts. The Board also considered and discussed information about the Subadviser’s fees and comparable information for other subadvised funds, as well as other accounts managed by the Subadviser, and, in this connection, the amount of the Contractual and Actual Management Fees retained by the Manager after payment of the subadvisory fee. The Board received an analysis of complex-wide management fees provided by the Manager, which, among other things, set out a proposed framework of fees based on asset classes.
Management also discussed with the Board the Fund’s distribution arrangements. The Board was provided with information concerning revenues received by and certain expenses incurred by the Fund’s affiliated distributor and how the amounts received by the distributor are paid.
The information comparing the Fund’s Contractual and Actual Management Fees as well as its actual total expense ratio to its Expense Group, consisting of a group of retail front-end load funds (including the Fund) classified as “emerging markets funds” and chosen to be comparable to the Fund by Lipper, showed that the Fund’s Contractual Management Fee and Actual Management Fee (which reflects a fee waiver) were below the median. The Board noted that the Fund’s actual total expense ratio was also below the median, due mostly to fee waivers and the reimbursement of certain operating expenses. The Board also took into account that the Manager had agreed to reduce the Contractual Management Fee and institute fee breakpoints effective October 1, 2005. The Board also noted that the Manager was continuing its voluntary waiver until further notice, resulting in the same net effective fee as currently in place, which is lower than the current contractual fee.
Taking all of the above into consideration, the Board determined that the Management Fee and the subadvisory fee were reasonable in light of the nature, extent and quality of the services provided to the Fund under the Management Agreement and the Sub-Advisory Agreement.
Manager Profitability
The Board received and considered a profitability analysis of the Manager and its affiliates in providing services to the Fund. The Board also received profitability information with respect to the CAM fund complex as a whole. In addition, the Board received information with respect to the Manager’s allocation methodologies used in preparing this profitability
36 Smith Barney Emerging Markets Equity Fund 2005 Annual Report
Board Approval of Management Agreement (unaudited) (continued)
data as well as a report from an outside consultant that had reviewed the Manager’s methodology. To the extent available, the Board also reviewed information provided by the Subadviser with respect to the Subadviser’s profitability in providing subadvisory services to the Fund. However, the profitability to the Subadviser was not considered to be a material factor in the Board’s considerations since the Subadviser’s fee is paid by the Manager, not the Fund. The Manager’s profitability was considered not excessive in light of the nature, extent and quality of the services provided to the Fund.
Economies of Scale
The Board received and discussed information concerning whether the Manager realizes economies of scale as the Fund’s assets grow. The Board noted that the Manager had agreed to institute breakpoints in the Fund’s Contractual Management Fee, reflecting the potential for reducing the Contractual Management Fee as the Fund grows. The Board considered whether the breakpoint fee structure was a reasonable means of sharing any economies of scale or other efficiencies that might accrue from increases in the Fund’s assets levels. The Board noted that the Fund had not yet reached the specified asset level at which a breakpoint to its Contractual Management Fee would be triggered. The Board also noted that as the Fund’s assets increase over time, certain expenses, such as fees for Board members, auditors and legal fees, become a smaller percentage of overall assets. The Board determined that the management fee structure, including the proposed breakpoints, was reasonable.
Other Benefits to the Manager and the Subadviser
The Board considered other benefits received by the Manager, the Subadviser and its affiliates as a result of their relationship with the Fund, including the opportunity to offer additional products and services to Fund shareholders.
In light of the costs of providing investment management and other services to the Fund and the Manager’s ongoing commitment to the Fund, the profits and other ancillary benefits that the Manager and its affiliates received were considered reasonable.
In light of all of the foregoing, the Board approved the Management Agreement and the Sub-Advisory Agreement to continue for another year.
No single factor reviewed by the Board was identified by the Board as the principal factor in determining whether to approve the Management Agreement and Sub-Advisory Agreement, and each Board Member attributed different weight to the various factors. The Independent Board Members were advised by separate independent legal counsel throughout the process. The Board also discussed the proposed continuance of the Management Agreement and the Sub-Advisory Agreement in private sessions with their independent legal counsel at which no representatives of the Manager were present.
Additional Information
On June 23, 2005, Citigroup Inc. entered into a definitive agreement (the “Transaction Agreement”) with Legg Mason, Inc. under which Citigroup agreed to sell substantially all of its asset management business, Citigroup Asset Management (“CAM”), which includes
Smith Barney Emerging Markets Equity Fund 2005 Annual Report 37
Board Approval of Management Agreement (unaudited) (continued)
the Adviser, to Legg Mason in exchange for the broker-dealer and investment banking businesses of Legg Mason and certain other considerations (the “Transaction”). The Transaction closed on December 1, 2005.
The consummation of the Transaction resulted in the automatic termination of the Fund’s current management agreement and subadvisory agreement in accordance with the Investment Company Act of 1940, as amended (the “1940 Act”). Prior to the closing of the Transaction, the Fund’s Board approved a new management agreement between the Fund and the Adviser (the “New Management Agreement”) and a new subadvisory agreement between the Adviser and Citigroup Asset Management Ltd., the Fund’s subadviser (the “Subadviser”) (the “New Subadvisory Agreement”) and authorized the Fund’s officers to submit the New Management Agreement and New Sub-Advisor Agreement to shareholders for the approval.
On July 11, 2005, members of the Board discussed with CAM management and certain Legg Mason representatives the Transaction and Legg Mason’s general plans and intentions regarding the Fund, including the preservation, strengthening and growth of CAM’s business and its combination with Legg Mason’s business. The Board Members also inquired about the plans for and anticipated roles and responsibilities of certain CAM employees and officers after the Transaction.
At a meeting held on August 7, 2005, the Fund’s Board, including a majority of the Board Members who are not “interested persons” of the Fund or the Adviser as defined in the 1940 Act (the “Independent Board Members”), approved the New Management Agreement and the New Subadvisory Agreement. To assist the Board in its consideration of the New Management Agreement, Legg Mason previously provided materials and information about Legg Mason, including its financial condition and asset management capabilities and organization, and CAM provided materials and information about the Transaction between Legg Mason and Citigroup. To assist the Board in its consideration of the New Subadvisory Agreement, the Board received in advance of their meeting certain materials and information. Representatives of CAM and Legg Mason also made presentations to and responded to questions from the Board, including at meetings held prior to the August 2005 meeting. The Independent Board Members, through their independent legal counsel, also requested and received additional information from CAM and Legg Mason in connection with their consideration of the New Management Agreement and the New Subadvisory Agreement. The additional information was provided in advance of and at the August meeting. After the presentations and after reviewing the written materials provided, the Independent Board Members met in executive session with their counsel to consider the New Management Agreement and the New Subadvisory Agreement. The Independent Board Members also conferred separately and with their counsel about the Transaction on a number of occasions, including in connection with the July and August meetings.
In their deliberations concerning the New Management Agreement, among other things, the Board Members considered:
38 Smith Barney Emerging Markets Equity Fund 2005 Annual Report
Board Approval of Management Agreement (unaudited) (continued)
| (i) | the automatic termination of the current management agreement upon completion of the Transaction and the need for continuity of services provided under the current management agreement; | |
| (ii) | the reputation, financial strength and resources of Legg Mason and its investment advisory subsidiaries; | |
| (iii) | that, following the Transaction, CAM will be part of an organization focused on the asset management business; | |
| (iv) | that Legg Mason is an experienced and respected asset management firm, and that Legg Mason has advised the Board Members that (a) it may wish to combine certain CAM operations with those of certain Legg Mason subsidiaries; (b) it is expected that these combination processes will result in changes to portfolio managers or portfolio management teams for a number of the CAM funds, subject to Board consent and appropriate notice to shareholders, and that, in other cases, the current portfolio managers or portfolio management teams will remain in place; and (c) in the future, it may recommend that Legg Mason subsidiaries be appointed as the adviser or subadviser to some or all of the CAM funds, subject to applicable regulatory requirements; | |
| (v) | that CAM management had advised the Board that a number of portfolio managers and other key CAM personnel would be retained after the closing of the Transaction; | |
| (vi) | that CAM management and Legg Mason have advised the Board that following the Transaction, there is not expected to be any diminution in the nature, quality and extent of services provided to the Fund and their shareholders by the Adviser, including compliance services; | |
| (vii) | that Legg Mason has advised the Board that it has no present intention to alter the expense waivers and reimbursements currently in effect and, while it reserves the right to do so in the future, it would consult with the Board before making any changes; | |
| (viii) | that under the Transaction Agreement, Citigroup and Legg Mason have agreed not to take any action that is not contemplated by the Transaction or fail to take any action that to their respective knowledge would cause any of the requirements of Section 15(f) of the 1940 Act not to be met; | |
| (ix) | the assurances from Citigroup and Legg Mason that, for a three year period following the closing of the Transaction, Citigroup-affiliated broker-dealers will continue to offer the Fund as an investment product, and the potential benefits to Fund shareholders from this and other third-party distribution access; | |
| (x) | the division of responsibilities between the Adviser and the Subadviser and the services provided by each of them, and the cost to the Adviser of obtaining those services; | |
| (xi) | the potential benefits to Fund shareholders from being part of a combined fund family with Legg Mason sponsored funds including possible economies of scale and access to investment opportunities; | |
Smith Barney Emerging Markets Equity Fund 2005 Annual Report 39
Board Approval of Management Agreement (unaudited) (continued)
| (xii) | that Citigroup and Legg Mason would derive benefits from the Transaction and that, as a result, they have a financial interest in the matters that were being considered; | |
| (xiii) | the potential effects of regulatory restrictions on the Fund if Citigroup-affiliated broker-dealers remain principal underwriters of the Fund after the closing of the Transaction; | |
| (xiv) | the fact that the Fund’s total advisory and administrative fees will not increase by virtue of the New Management Agreement, but will remain the same; | |
| (xv) | the terms and conditions of the New Management Agreement, including the differences from the current management agreement, and the benefits of a single, uniform form of agreement covering these services; | |
| (xvi) | that the Fund would not bear the costs of obtaining shareholder approval of the New Management Agreement; | |
| (xvii) | that Citigroup and Legg Mason were negotiating a license arrangement that would permit the Fund to maintain its current name for some agreed upon time period after the closing of the Transaction; and | |
| (xviii) | that, as discussed in detail above, within the past year the Board had performed a full annual review of the current management agreement as required by the 1940 Act. In that regard, the Board’s deliberations concerning the New Management Agreement reflected its prior evaluation of relevant factors, including the nature, quality and extent of services provided, costs of services provided, profitability, fall-out benefits, fees and economies of scale and investment performance considered in connection with the renewal of the current management agreement and its determination that information provided by CAM and Legg Mason management prior to and at the August meeting supported the continued appropriateness of such conclusions with respect to the New Management Agreement. | |
In their deliberations concerning the New Subadvisory Agreement, among other things, the Board Members considered:
| (i) | the current responsibilities of the Subadviser and the services currently provided by it; | |
| (ii) | Legg Mason’s combination plans, as described above; | |
| (iii) | that CAM management and Legg Mason have advised the Board that following the Transaction, there is not expected to be any diminution in the nature, quality and extent of services provided to the Fund and its shareholders by the Subadviser, including compliance services; | |
| (iv) | the fact that the fees paid to the Subadviser (which are paid by the Adviser and not the Fund) will not increase by virtue of the New Subadvisory Agreement, but will remain the same; | |
| (v) | the terms and conditions of the New Subadvisory Agreement, and, the benefits of a single, uniform form of agreement covering these services; | |
| (vi) | that, as discussed in greater detail above, within the past year the Board had performed a full annual review of the current subadvisory agreement as required by the 1940 Act. In that regard, the Board, in its deliberations concerning the New | |
40 Smith Barney Emerging Markets Equity Fund 2005 Annual Report
Board Approval of Management Agreement (unaudited) (continued)
| Subadvisory Agreement, considered the same factors regarding the nature, quality and extent of services provided, costs of services provided, fees and economies of scale and investment performance as it did when it renewed the current subadvi-sory agreement, and reached substantially the same conclusions. | ||
| (vii) | that the Fund would not bear the costs of obtaining shareholder approval of the New Subadvisory Agreement; and | |
| (viii) | the factors enumerated and/or discussed above in connection with the approval of the New Management Agreement, to the extent relevant. | |
No single factor reviewed by the Board was identified by the Board as the principal factor in determining whether to approve the New Management Agreement and New Subadvisory Agreement, and each Board Member attributed different weight to the various factors. The Independent Board Members were advised by separate independent legal counsel throughout the process. The Board also discussed the New Management Agreement and New Subadvisory Agreement in private sessions with their independent legal counsel at which no representatives of the Adviser were present. In light of all of the foregoing, the Board approved the New Management Agreement and New Subadvisory Agreement and authorized the Fund’s officers to submit the New Management Agreement and New Subadvisory Agreement to shareholders for their approval.
A condition to the closing of the Transaction required the new management agreements to be approved by CAM advisory clients representing a substantial majority of investment management revenues. This condition was satisfied and the Transaction closed on December 1, 2005, prior to approval of the Fund’s New Management Agreement and New Subadvisory Agreement having been obtained. The Fund’s current management agreement and subadvisory agreement terminated upon consummation of the Transaction. Prior to the closing of the Transaction, the Fund’s Board, at a meeting held on November 21, 2005, approved an interim management agreement and subadvisory agreement for the Fund.
In their deliberations concerning the interim management agreement and subadvisory agreement, the Board Members considered that, as discussed in detail above, within the past year the Board had performed a full annual review of the current management agreement and subadvisory agreement and had approved the New Management Agreement and New Subadvisory Agreement, subject to shareholder approval. In that regard, the Board, in its deliberations concerning the interim management agreement, met with management of CAM and Legg Mason to receive a status report on Legg Mason’s plans and intentions regarding CAM’s business and its combination with Legg Mason, including its plans for Fund portfolio management. On the basis of that report, the Board determined that its evaluation of relevant factors, including the nature, quality and extent of services provided, costs of services provided, profitability, fall out benefits, fees and economies of scale and investment performance and conclusions with respect thereto in connection with its approval of the New Management Agreement would apply to the interim management agreement. However, the Board gave substantial weight to the imminent automatic termination of the current management agreement upon the completion of the Transaction and the need for continuity of the services provided thereunder pending shareholder approval of the New Management Agreement.
Smith Barney Emerging Markets Equity Fund 2005 Annual Report 41
Board Approval of Management Agreement (unaudited) (continued)
In accordance with Rule 15a-4 under the 1940 Act, which regulates the use of interim management agreements, the interim management agreement and subadvisory agreement for the Fund will have a term no longer than 150 days. The terms of the interim management agreement and subadvisory agreement approved by the Board are the same as those of the Fund’s current management agreement and subadvisory agreement, differing only as to the effective date, the termination date and certain additional provisions required by law. Management and subadvisory fees will be held in escrow and not paid to the Manager or Subadviser until shareholders approve the New Management Agreement and New Subadvisory Agreement. If shareholders do not approve the New Management Agreement and New Subadvisory Agreement, the management and subadvisory fees held in escrow will be disbursed in accordance with applicable law.
42 Smith Barney Emerging Markets Equity Fund 2005 Annual Report
Additional Information (unaudited)
Information about Trustees and Officers
The business and affairs of the Smith Barney Emerging Markets Equity Fund are managed under the direction of the Fund’s Board of Trustees. Information pertaining to the Trustees and officers of the Fund is set forth below. The Statement of Additional Information includes additional information about the Trust’s Trustees and is available, without charge, upon request by calling the Fund’s transfer agent Citicorp Trust Bank, fsb. at 1-800-451-2010.
| Term of | Number of | |||||||||
| Office* | Principal | Portfolios in the | Other Board | |||||||
| Position(s) | and Length | Occupation(s) | Fund Complex | Memberships | ||||||
| Name, Address and | Held | of Time | During | Overseen by | Held by | |||||
| Birth Year | with Fund | Served | Past 5 Years | Trustee | Trustee | |||||
| Non-Interested Trustees: | ||||||||||
| Elliott J. Berv | Trustee | Since | Executive Vice President and | 37 | Board Member, | |||||
| c/o R. Jay Gerken | 2001 | Chief Operations Officer, | American Identity | |||||||
| Citigroup Asset | DigiGym Systems (on-line | Corp. (doing | ||||||||
| Management (“CAM”) | personal training systems) | business as | ||||||||
| 399 Park Avenue | (since 2001); Consultant, | Morpheus | ||||||||
| New York, NY 10022 | Catalyst (consulting) (since | Technologies) | ||||||||
| Birth Year: 1943 | 1984); Chief Executive | (biometric | ||||||||
| Officer, Motocity USA | information | |||||||||
| (motorsport racing) (since | management) (since) | |||||||||
| 2004) | 2001); Director, | |||||||||
| Lapoint Industries | ||||||||||
| (industrial filter | ||||||||||
| company) (since | ||||||||||
| 2002); Director, | ||||||||||
| Alzheimer’s | ||||||||||
| Association (New | ||||||||||
| England Chapter) | ||||||||||
| (since 1998) | ||||||||||
| Donald M. Carlton | Trustee | Since | Consultant, URS Corporation | 37 | Director, | |||||
| c/o R. Jay Gerken | 2001 | (engineering) (since 1999); | Temple-Inland | |||||||
| CAM | former Chief Executive Officer, | (forest products) | ||||||||
| 399 Park Avenue | Radian International L.L.C. | (since 2003); | ||||||||
| New York, NY 10022 | (engineering) (from 1996 to | Director, | ||||||||
| Birth Year: 1937 | 1998); Member of the | American Electric | ||||||||
| Management Committee, | Power Co. (electric) | |||||||||
| Signature Science | utility) (since 1999); | |||||||||
| (research and development) | Director, National | |||||||||
| (since 2000) | Instruments Corp. | |||||||||
| (technology) | ||||||||||
| (since 1994); | ||||||||||
| former Director, | ||||||||||
| Valcro Energy | ||||||||||
| (petroleum refining) | ||||||||||
| (from 1999 to 2003) | ||||||||||
Smith Barney Emerging Markets Equity Fund 2005 Annual Report 43
Additional Information (unaudited) (continued)
| Term of | Number of | |||||||||
| Office* | Principal | Portfolios in the | Other Board | |||||||
| Position(s) | and Length | Occupation(s) | Fund Complex | Memberships | ||||||
| Name, Address and | Held | of Time | During | Overseen by | Held by | |||||
| Birth Year | with Fund | Served | Past 5 Years | Trustee | Trustee | |||||
| A. Benton Cocanougher | Trustee | Since | Dean Emeritus and Professor, | 37 | None | |||||
| c/o R. Jay Gerken | 2001 | Texas A&M University (since | ||||||||
| CAM | 2004); former Interim | |||||||||
| 399 Park Avenue | Chancellor, Texas A&M | |||||||||
| New York, NY 10022 | University System (from 2003 | |||||||||
| Birth Year: 1938 | to 2004); former Special | |||||||||
| Advisor to the President, | ||||||||||
| Texas A&M University (from | ||||||||||
| 2002 to 2003); former Dean | ||||||||||
| Emeritus and Wiley Professor, | ||||||||||
| Texas A&M University (from | ||||||||||
| 2001 to 2002); former Dean | ||||||||||
| and Professor of Marketing, | ||||||||||
| College and Graduate School | ||||||||||
| of Business of Texas A&M | ||||||||||
| University (from 1987 | ||||||||||
| to 2001) | ||||||||||
| Mark T. Finn | Trustee | Since | Adjunct Professor, College of | 37 | Former President | |||||
| c/o R. Jay Gerken | 2001 | William & Mary (since 2002); | and Director, Delta | |||||||
| CAM | Principal/Member, Balvan | Financial, Inc. | ||||||||
| 399 Park Avenue | Partners (investment | (investment advisory firm) | ||||||||
| New York, NY 10022 | management) (since 2002); | (from 1983 | ||||||||
| Birth Year: 1943 | Chairman, Chief Executive | to 1999) | ||||||||
| Officer and Owner, Vantage | ||||||||||
| Consulting Group, Inc. | ||||||||||
| (investment advisory and | ||||||||||
| consulting firm) (since 1998); | ||||||||||
| former Vice Chairman and | ||||||||||
| Chief Operating Officer, | ||||||||||
| Lindner Asset Management | ||||||||||
| Company (mutual fund | ||||||||||
| company) (from 1988 to 2001); | ||||||||||
| former General Partner and | ||||||||||
| Shareholder, Greenwich | ||||||||||
| Ventures, L.L.C. (investment | ||||||||||
| partnership) (from 1996 to 2001); | ||||||||||
| former President, Secretary, and | ||||||||||
| Owner, Phoenix Trading Co. | ||||||||||
| (commodity trading advisory | ||||||||||
| firm) (from 1997 to 2000) | ||||||||||
44 Smith Barney Emerging Markets Equity Fund 2005 Annual Report
Additional Information (unaudited) (continued)
| Term of | Number of | |||||||||
| Office* | Principal | Portfolios in the | Other Board | |||||||
| Position(s) | and Length | Occupation(s) | Fund Complex | Memberships | ||||||
| Name, Address and | Held | of Time | During | Overseen by | Held by | |||||
| Birth Year | with Fund | Served | Past 5 Years | Trustee | Trustee | |||||
| Stephen Randolph Gross | Trustee | Since | Chairman, HLB Gross Collins, | 37 | Director, Andersen | |||||
| c/o R. Jay Gerken | 2001 | PC (accounting and consulting | Calhoun (assisted | |||||||
| CAM | firm) (since 1979); Treasurer, | living) (since 1987); | ||||||||
| 399 Park Avenue | Coventry Limited, Inc. (Senior | former Director, Yu | ||||||||
| New York, NY 10022 | Living Facilities) (since 1985); | Save, Inc. (internet | ||||||||
| Birth Year: 1947 | former Managing Director, | company) (from 1998 | ||||||||
| Fountainhead Ventures, L.L.C. | to 2000); former | |||||||||
| (technology accelerator) | Director, Hotpalm.com, | |||||||||
| (from 1998 to 2003); former | Inc. (wireless | |||||||||
| Treasurer, Hank Aaron | applications) (from | |||||||||
| Enterprises (fast food | 1998 to 2000); former | |||||||||
| franchise) (from 1985 to | Director, United | |||||||||
| 2001); former Partner, Capital | Telesis, Inc. | |||||||||
| investment Advisory | (telecommunications) | |||||||||
| Partners (leverage buyout | (from 1997 to 2002); | |||||||||
| consulting) (from 2000 to | former Director, | |||||||||
| 2002); former Secretary, | ebank.com, Inc. | |||||||||
| Carint N.A. (manufacturing) | (from 1997 to 2004) | |||||||||
| (from 1998 to 2002) | ||||||||||
| Diana R. Harrington | Trustee | Since | Professor, Babson College | 37 | None | |||||
| c/o R. Jay Gerken | 1992 | (since 1993) | ||||||||
| CAM | ||||||||||
| 399 Park Avenue | ||||||||||
| New York, NY 10022 | ||||||||||
| Birth Year: 1940 | ||||||||||
| Susan B. Kerley | Trustee | Since | Consultant, Strategic | 37 | Chairperson and | |||||
| c/o R. Jay Gerken | 1992 | Management Advisors, | Independent Board | |||||||
| CAM | LLC (investment consulting) | Member of Eclipse | ||||||||
| 399 Park Avenue | (since 1990) | Fund, Inc. and Eclipse | ||||||||
| New York, NY10022 | Funds (which trade | |||||||||
| Birth Year: 1951 | as Mainstay Funds) | |||||||||
| (currently supervises | ||||||||||
| 16 investment | ||||||||||
| companies in the | ||||||||||
| fund complex) | ||||||||||
| Alan G. Merten | Trustee | Since | President, George Mason | 37 | Director, Xybernaut | |||||
| c/o R. Jay Gerken | 2001 | University (since 1996) | Corporation | |||||||
| CAM | (information | |||||||||
| 399 Park Avenue | technology) | |||||||||
| New York, NY 10022 | (since 2004); Director, | |||||||||
| Birth Year: 1941 | Digital Net Holdings, | |||||||||
| Inc. (since 2003); | ||||||||||
| Director, Comshare, | ||||||||||
| Inc. (information | ||||||||||
| technology) (from | ||||||||||
| 1985 to 2003) | ||||||||||
Smith Barney Emerging Markets Equity Fund 2005 Annual Report 45
Additional Information (unaudited) (continued)
| Term of | Number of | |||||||||
| Office* | Principal | Portfolios in the | Other Board | |||||||
| Position(s) | and Length | Occupation(s) | Fund Complex | Memberships | ||||||
| Name, Address and | Held | of Time | During | Overseen by | Held by | |||||
| Birth Year | with Fund | Served | Past 5 Years | Trustee | Trustee | |||||
| R. Richardson Pettit | Trustee | Since | Professor of Finance, | 37 | None | |||||
| c/o R. Jay Gerken | 2001 | University of Houston | ||||||||
| CAM | (from 1977 to 2002); | |||||||||
| 399 Park Avenue | independent consultant | |||||||||
| New York, NY 10022 | (since 1984) | |||||||||
| Birth Year: 1942 | ||||||||||
| Interested Trustee: | ||||||||||
| R. Jay Gerken, CFA** | Chairman, | Since | Chairman, President, | 171 | N/A | |||||
| CAM | President, | 2002 | Chief Executive Officer | |||||||
| 399 Park Avenue | and Chief | and Director of | ||||||||
| Mezzanine | Executive | Smith Barney Fund | ||||||||
| New York, NY 10022 | Officer | Management LLC | ||||||||
| Birth Year: 1951 | (“SBFM”), Travelers | |||||||||
| Investment Adviser, Inc. | ||||||||||
| (“TIA”) and Citi Fund | ||||||||||
| Management Inc. | ||||||||||
| (“CFM”); President and | ||||||||||
| Chief Executive Officer | ||||||||||
| of certain mutual funds | ||||||||||
| associated with CAM; | ||||||||||
| Formerly Portfolio | ||||||||||
| Manager of Smith Barney | ||||||||||
| Allocation Series Inc. (from | ||||||||||
| 1996 to 2001) and Smith | ||||||||||
| Barney Growth and | ||||||||||
| Income Fund (from 1996 | ||||||||||
| to 2000) | ||||||||||
| Officers: | ||||||||||
| Andrew B. Shoup | Senior | Since | Director of CAM; Senior Vice N/A | N/A | ||||||
| CAM | Vice | 2003 | President and Chief | |||||||
| 125 Broad Street | President | Administrative Officer of | ||||||||
| 11th Floor | and | mutual funds associated with | ||||||||
| New York, NY 10004 | Chief | CAM; Chief Financial Officer | ||||||||
| Birth Year: 1956 | Adminis- | and Treasurer of certain mutual | ||||||||
| trative | funds associated with CAM; | |||||||||
| Officer | Head of International Funds | |||||||||
| Administration of CAM (from | ||||||||||
| 2001 to 2003); Director of | ||||||||||
| Global Funds Administration of CAM | ||||||||||
| (from 2000 to 2001); | ||||||||||
| Head of U.S. Citibank Funds | ||||||||||
| Administration of CAM | ||||||||||
46 Smith Barney Emerging Markets Equity Fund 2005 Annual Report
Additional Information (unaudited) (continued)
| Term of | Number of | |||||||||
| Office* | Principal | Portfolios in the | Other Board | |||||||
| Position(s) | and Length | Occupation(s) | Fund Complex | Memberships | ||||||
| Name, Address and | Held | of Time | During | Overseen by | Held by | |||||
| Birth Year | with Fund | Served | Past 5 Years | Trustee | Trustee | |||||
| Frances M. Guggino | Chief | Since | Chief Financial Officer and | N/A | N/A | |||||
| CAM | Financial | 2004 | Treasurer Since 2004 Director | |||||||
| 125 Broad Street | Officer | of CAM; Chief Financial | ||||||||
| 10th Floor | and | Officer and Treasurer of | ||||||||
| New York, NY 10004 | Treasurer | certain mutual funds | ||||||||
| Birth Year: 1957 | associated with CAM; | |||||||||
| Controller | 2002-2004 | Controller of certain mutual | ||||||||
| funds associated with | ||||||||||
| CAM | ||||||||||
| Andrew Beagley | Chief | Since | Director of CGM (since 2000); | N/A | N/A | |||||
| CAM | Anti- | 2002 | Director of Compliance, North | |||||||
| 399 Park Avenue | Money | America, CAM (since 2000); | ||||||||
| 4th Floor | Laundring | Chief Anti-Money Laundering | ||||||||
| New York, NY 10022 | Compliance | Compliance Officer, Chief | ||||||||
| Birth Year: 1962 | Officer | Compliance Officer and Vice | ||||||||
| President of certain mutual | ||||||||||
| Chief | Since | funds associated with CAM; | ||||||||
| Compliance | 2004 | Director of Compliance, Europe, | ||||||||
| Officer | the Middle East and Africa, | |||||||||
| CAM (from 1999 to 2000); | ||||||||||
| Chief Compliance Officer, | ||||||||||
| SBFM and CFM; Formerly Chief | ||||||||||
| Compliance Officer of TIA | ||||||||||
| (from 2002 to 2005) | ||||||||||
| Wendy S. Setnicka | Controller | Since | Vice President of CAM (since | N/A | N/A | |||||
| CAM | 2004 | 2003); Controller of certain | ||||||||
| 125 Broad Street | mutual funds associated with | |||||||||
| 10th Floor | CAM; Assistant Controller | |||||||||
| New York, NY 10004 | of CAM (from 2002 to 2004); | |||||||||
| Birth Year: 1964 | Accounting Manager of CAM | |||||||||
| (from 1998 to 2002) | ||||||||||
| Robert I. Frenkel | Secretary | Since | Managing Director and | N/A | N/A | |||||
| CAM | and Chief | 2003 | General Counsel, Global | |||||||
| 300 First Stamford Place | Legal | Mutual Funds for CAM | ||||||||
| Stamford, CT 06902 | Officer | and its predecessor (since | ||||||||
| Birth Year: 1954 | 1994); Secretary of certain | |||||||||
| mutual funds associated | ||||||||||
| with CAM; Chief Legal | ||||||||||
| Officer of mutual funds | ||||||||||
| associated with CAM | ||||||||||
| * | Each Trustee and Officer serves until his or her successor has been duly elected and qualified. |
| ** | Mr. Gerken is an “interested person” of the Fund as defined in the Investment Company Act of 1940, as amended, because Mr. Gerken is an officer of the Manager and certain of its affiliates. |
Smith Barney Emerging Markets Equity Fund 2005 Annual Report 47
(This page intentionally left blank.)
Smith Barney | |||
| TRUSTEES | INVESTMENT MANAGER | ||
| Elliott J. Berv | Smith Barney Fund | ||
| Donald M. Carlton | Management LLC | ||
| A. Benton Cocanougher | |||
| Mark T. Finn | SUBADVISER | ||
| R. Jay Gerken, CFA | Citigroup Asset Management Ltd. | ||
| Chairman | |||
| Stephen Randolph Gross | DISTRIBUTORS | ||
| Diana R. Harrington | Citigroup Global Markets Inc. | ||
| Susan B. Kerley | Legg Mason Investor Services, LLC | ||
| Alan G. Merten | |||
| R. Richardson Pettit | CUSTODIAN | ||
| State Street Bank | |||
| OFFICERS | & Trust Company | ||
| R. Jay Gerken, CFA | |||
| President and | TRANSFER AGENT | ||
| Chief Executive Officer | PFPC Inc. | ||
| P.O. Box 9699 | |||
| Andrew B. Shoup | Providence, RI 02940-9699 | ||
| Senior Vice President and | |||
| Chief Administrative Officer | INDEPENDENT | ||
| REGISTERED PUBLIC | |||
| Frances M. Guggino | ACCOUNTING FIRM | ||
| Treasurer and | KPMG LLP | ||
| Chief Financial Officer | 345 Park Avenue | ||
| New York, NY 10154 | |||
| Acquico Wen | |||
| Portfolio Manager | |||
| Andrew Beagley | |||
| Chief Anti-Money Laundering | |||
| Compliance Officer and | |||
| Chief Compliance Officer | |||
| Robert I. Frenkel | |||
| Secretary and Chief Legal Officer | |||
| Wendy S. Setnicka | |||
| Controller | |||
| This report is submitted for | Smith Barney The Fund is a separate investment fund of the CitiFunds Trust I, a Massachusetts business trust. SMITH BARNEY EMERGING MARKETS EQUITY FUND The Fund files its complete schedule of portfolio holdings with the Securities and Exchange Commission for the first and third quarters of each fiscal year on Form N-Q. The Fund’s Forms N-Q are available on the Commission’s website at www.sec.gov. The Fund’s Forms N-Q may be reviewed and copied at the Commission’s Public Reference Room in Washington D.C., and information on the operation of the Public Reference Room may be obtained by calling 1-800-SEC-0330. To obtain information on Form N-Q from the Fund, shareholders can call 1-800-451-2010. Information on how the Fund voted proxies relating to portfolio securities during the most recent 12-month period ended June 30 and a description of the policies and procedures that the Fund uses to determine how to vote proxies relating to portfolio securities is available (1) without charge, upon request, by calling 1-800-451-2010, (2) on the Fund’s website at www.citigroupam.com and (3) on the SEC’s website at www.sec.gov. | |
| the general information of | ||
| the shareholders of | ||
| CitiFunds Trust I �� Smith | ||
| Barney Emerging Markets | ||
| Equity Fund, but it may also | ||
| be used as sales literature | ||
| when preceded or accompa- | ||
| nied by the current | ||
| Prospectus. | ||
| This report must be preceded | ||
| or accompanied by a free | ||
| prospectus. Investors should | ||
| consider the Fund’s | ||
| investment objectives, risks, | ||
| charges and expenses | ||
| carefully before investing. | ||
| The prospectus contains this | ||
| and other important | ||
| information about the Fund. | ||
| Please read the prospectus | ||
| carefully before investing. | ||
| www.citigroupam.com | ||
| ©2005 Legg Mason Investor | ||
| Services, LLC | ||
| Member NASD, SIPC |
FD03333 12/05 05-9459

| ITEM 2. | CODE OF ETHICS. |
| The registrant has adopted a code of ethics that applies to the registrant’s principal executive officer, principal financial officer, principal accounting officer or controller. | |
| ITEM 3. | AUDIT COMMITTEE FINANCIAL EXPERT. |
| The Board of Trustees of the registrant has determined that Stephen Randolph Gross, the Chairman of the Board’s Audit Committee, possesses the attributes identified in Instruction 2(b) of Item 3 to Form N-CSR to qualify as an “audit committee financial expert,” and has designated Mr. Gross as the audit committee financial expert. Mr. Gross is an “independent” Trustee pursuant to paragraph (a)(2) of Item 3 to Form N-CSR. | |
| ITEM 4. | PRINCIPAL ACCOUNTANT FEES AND SERVICES. |
| a) Audit Fees. The aggregate fees billed in the last two fiscal years ending October 31, 2004 and October 31, 2005 (the "Reporting Periods") for professional services rendered by the Registrant's principal accountant (the "Auditor") for the audit of the Registrant's annual financial statements, or services that are normally provided by the Auditor in connection with the statutory and regulatory filings or engagements for the Reporting Periods, were $0 in 2004 and $0 in 2005. | |
| b) Audit-Related Fees. There were no fees billed in the Reporting Periods for assurance and related services by the Auditor that are reasonably related to the performance of the audit of the Registrant's financial statements and are not reported under paragraph (a) of this Item 4. | |
| In addition, there were no Audit-Related Fees billed in the Reporting Period for assurance and related services by the Auditor to the Registrant’s investment adviser (not including any sub-adviser whose role is primarily portfolio management and is subcontracted with or overseen by another investment adviser), and any entity controlling, controlled by or under common control with the investment adviser that provides ongoing services to the Smith Barney Emerging Markets Equity Fund (“service affiliates”), that were reasonably related to the performance of the annual audit of the service affiliates. Accordingly, there were no such fees that required pre-approval by the Audit Committee for the Reporting Periods (prior to May 6, 2003 services provided by the Auditor were not required to be pre-approved). | |
| (c) Tax Fees. The aggregate fees billed in the Reporting Periods for professional services rendered by the Auditor for tax compliance, tax advice and tax planning ("Tax Services") were $0 in 2004 and $0 in 2005. These services consisted of (i) review or preparation of U.S. federal, state, local and excise tax returns; (ii) U.S. federal, state and local tax planning, advice and assistance regarding statutory, regulatory or administrative developments, and (iii) tax advice regarding tax qualification matters and/or treatment of various financial instruments held or proposed to be acquired or held. | |
| There were no fees billed for tax services by the Auditors to service affiliates during the Reporting Periods that required pre-approval by the Audit Committee. | |
| d) All Other Fees. There were no other fees billed in the Reporting Periods for products and services provided by the Auditor, other than the services reported in paragraphs (a) through (c) of this Item for the Smith Barney Emerging Markets Equity Fund | |
| All Other Fees. There were no other non-audit services rendered by the Auditor to Smith Barney Fund Management LLC (“SBFM”), and any entity controlling, controlled by or under common control with SBFM that provided ongoing services to Smith Barney Emerging Markets Equity Fund requiring pre-approval by the Audit Committee in the Reporting Period. |
| (e) Audit Committee’s pre–approval policies and procedures described in paragraph (c) (7) of Rule 2-01 of Regulation S-X. | |
| (1) The Charter for the Audit Committee (the “Committee”) of the Board of each registered investment company (the “Fund”) advised by Smith Barney Fund Management LLC or Salomon Brothers Asset Management Inc. or one of their affiliates (each, an “Adviser”) requires that the Committee shall approve (a) all audit and permissible non-audit services to be provided to the Fund and (b) all permissible non-audit services to be provided by the Fund’s independent auditors to the Adviser and any Covered Service Providers if the engagement relates directly to the operations and financial reporting of the Fund. The Committee may implement policies and procedures by which such services are approved other than by the full Committee. | |
| The Committee shall not approve non-audit services that the Committee believes may impair the independence of the auditors. As of the date of the approval of this Audit Committee Charter, permissible non-audit services include any professional services (including tax services), that are not prohibited services as described below, provided to the Fund by the independent auditors, other than those provided to the Fund in connection with an audit or a review of the financial statements of the Fund. Permissible non-audit services may not include: (i) bookkeeping or other services related to the accounting records or financial statements of the Fund; (ii) financial information systems design and implementation; (iii) appraisal or valuation services, fairness opinions or contribution-in-kind reports; (iv) actuarial services; (v) internal audit outsourcing services; (vi) management functions or human resources; (vii) broker or dealer, investment adviser or investment banking s ervices; (viii) legal services and expert services unrelated to the audit; and (ix) any other service the Public Company Accounting Oversight Board determines, by regulation, is impermissible. | |
| Pre-approval by the Committee of any permissible non-audit services is not required so long as: (i) the aggregate amount of all such permissible non-audit services provided to the Fund, the Adviser and any service providers controlling, controlled by or under common control with the Adviser that provide ongoing services to the Fund (“Covered Service Providers”) constitutes not more than 5% of the total amount of revenues paid to the independent auditors during the fiscal year in which the permissible non-audit services are provided to (a) the Fund, (b) the Adviser and (c) any entity controlling, controlled by or under common control with the Adviser that provides ongoing services to the Fund during the fiscal year in which the services are provided that would have to be approved by the Committee; (ii) the permissible non-audit services were not recognized by the Fund at the time of the engagement to be non-audit services; and (iii) such services are promptly br ought to the attention of the Committee and approved by the Committee (or its delegate(s)) prior to the completion of the audit. | |
| (2) For the Smith Barney Emerging Markets Equity Fund, the percentage of fees that were approved by the audit committee, with respect to: Audit-Related Fees were 100% and 100% for 2004 and 2005; Tax Fees were 100% and 100% for 2004 and 2005; and Other Fees were 100% and 100% for 2004 and 2005. | |
| (f) N/A | |
| (g) Non-audit fees billed by the Auditor for services rendered to Smith Barney Emerging Markets Equity Fund and CAM and any entity controlling, controlled by, or under common control with CAM that provides ongoing services to Smith Barney Emerging Markets Equity Fund during the reporting period were $0 in 2005 for fees related to the transfer agent matter as fully described in the notes the financial statements titled “additional information” and $75,000 for 2004. | |
| (h) Yes. The Smith Barney Emerging Markets Equity Fund‘ Audit Committee has considered whether the provision of non-audit services that were rendered to Service Affiliates which were not pre-approved (not requiring pre-approval) is compatible with maintaining the Accountant's independence. All services provided by the Auditor to the Smith Barney Emerging Markets Equity Fund or to Service Affiliates, which were required to be pre-approved, were pre-approved as required. |
ITEM 5. | AUDIT COMMITTEE OF LISTED REGISTRANTS. | |
| Not applicable. | ||
| ITEM 6. | SCHEDULE OF INVESTMENTS. | |
| Not applicable. | ||
| ITEM 7. | DISCLOSURE OF PROXY VOTING POLICIES AND PROCEDURES FOR CLOSED-END MANAGEMENT INVESTMENT COMPANIES. | |
| Not applicable. | ||
| ITEM 8. | [RESERVED] | |
| ITEM 9. | PURCHASES OF EQUITY SECURITIES BY CLOSED-END MANAGEMENT INVESTMENT COMPANY AND AFFILIATED PURCHASERS. | |
| Not applicable. | ||
| ITEM 10. | SUBMISSION OF MATTERS TO A VOTE OF SECURITY HOLDERS. Not applicable. ITEM 11. CONTROLS AND PROCEDURES. | |
| (a) | The registrant’s principal executive officer and principal financial officer have concluded that the registrant’s disclosure controls and procedures (as defined in Rule 30a- 3(c) under the Investment Company Act of 1940, as amended (the “1940 Act”)) are effective as of a date within 90 days of the filing date of this report that includes the disclosure required by this paragraph, based on their evaluation of the disclosure controls and procedures required by Rule 30a-3(b) under the 1940 Act and 15d-15(b) under the Securities Exchange Act of 1934. | |
| (b) | There were no changes in the registrant’s internal control over financial reporting (as defined in Rule 30a-3(d) under the 1940 Act) that occurred during the registrant’s last fiscal half-year (the registrant’s second fiscal half-year in the case of an annual report) that have materially affected, or are likely to materially affect the registrant’s internal control over financial reporting. | |
| ITEM 12. | EXHIBITS. | |
| (a)(1) | Code of Ethics attached hereto. | |
| Exhibit 99.CODE ETH | ||
| (a)(2) | Certifications pursuant to section 302 of the Sarbanes-Oxley Act of 2002 attached hereto. | |
| Exhibit 99.CERT | ||
| (b) | Certifications pursuant to Section 906 of the Sarbanes-Oxley Act of 2002 attached hereto. | |
| Exhibit 99.906CERT | ||
SIGNATURES
Pursuant to the requirements of the Securities Exchange Act of 1934 and the Investment Company Act of 1940, the registrant has duly caused this Report to be signed on its behalf by the undersigned, there unto duly authorized.
CitiFunds Trust I
| By: | /s/ R. Jay Gerken (R. Jay Gerken) Chief Executive Officer of CitiFunds Trust I |
| Date: | January 9, 2006 |
Pursuant to the requirements of the Securities Exchange Act of 1934 and the Investment Company Act of 1940, this report has been signed below by the following persons on behalf of the registrant and in the capacities and on the dates indicated.
| By: | /s/ R. Jay Gerken (R. Jay Gerken) Chief Executive Officer of CitiFunds Trust I |
| Date: | January 9, 2006 |
| By: | /s/ Frances M. Guggino (Frances M. Guggino) Chief Financial Officer of CitiFunds Trust I |
| Date: | January 9, 2006 |