Table of Contents
Filed pursuant to Rule 424(b)(3)
Registration No. 333-217293
Registration No. 333-217293
Great-West SecureFoundation®
Group Fixed Deferred Annuity Contract
Issued by:
Great-West Life & Annuity Insurance Company
April 26, 2019
This prospectus describes the Great-West SecureFoundation® Group Fixed Deferred Annuity Contract (the “Contract”) issued by Great-West Life & Annuity Insurance Company. The Contract will be offered to sponsors (“Plan Sponsor”) of retirement plans established under Section 403(b) of the Internal Revenue Code (“Retirement Plan”). The Contract describes the Guaranteed Lifetime Withdrawal Benefit (“GLWB”). A certificate (“Certificate”) will be issued to participants in each Retirement Plan who purchase shares of one of the Great-West SecureFoundation® mutual funds offered by Great-West Funds, Inc., which currently consist of the Great-West SecureFoundation® Lifetime 2020 Fund, Great-West SecureFoundation® Lifetime 2025 Fund, Great-West SecureFoundation® Lifetime 2030 Fund, Great-West SecureFoundation® Lifetime 2035 Fund, Great-West SecureFoundation® Lifetime 2040 Fund, Great-West SecureFoundation® Lifetime 2045 Fund, Great-West SecureFoundation® Lifetime 2050 Fund, Great-West SecureFoundation® Lifetime 2055 Fund, Great-West SecureFoundation® Lifetime 2060 Fund (the “Great-West SecureFoundation® Lifetime Funds”), and the Great-West SecureFoundation® Balanced Fund (each, a “Covered Fund” and together, the “Covered Funds”). A Retirement Plan participant who elects the GLWB is referred to as a “GLWB Participant.” The Contract provides for guaranteed income for the life of a designated person based on the GLWB Participant’s investment in one or more of the Covered Funds, provided all conditions specified in the Contract are met, regardless of how long the designated person lives or the actual performance or value of the Covered Funds. The Contract and the Certificate have no cash value and no surrender value. The interests of the Retirement Plan and the GLWB Participant in the Contract and the Certificate, as applicable, may not be transferred, sold, assigned, pledged, charged, encumbered, or alienated in any way, however, if the Retirement Plan is consolidated or merged with another plan or if the assets and liabilities of the Retirement Plan are transferred to another plan, the Contract may be assigned to the new Plan Sponsor and/or trustee.
Plan Sponsors may apply to purchase a Contract through GWFS Equities, Inc. (“GWFS Equities”), the principal underwriter for the Contract or other broker-dealers that have entered into a selling agreement with GWFS Equities. GWFS Equities will use its best efforts to sell the Contracts, but is not required to sell any specific number or dollar amount of Contracts.
This prospectus provides important information that a prospective purchaser of a Contract or a GLWB Participant should know before investing. Please retain this prospectus for future reference.
Neither the Securities and Exchange Commission (“SEC”) nor any state securities commission has approved or disapproved these securities or determined if this prospectus is truthful or complete. Any representation to the contrary is a criminal offense.
This prospectus is not an offer to sell these securities and it is not soliciting an offer to buy these securities in any state where the offer or sale is not permitted.
The Contract/ the Certificate:
| • | Is NOT a bank deposit |
| • | Is NOT FDIC insured |
| • | Is NOT insured or endorsed by a bank or any government agency |
| • | Is NOT available in every state |
The purchase of the Contract is subject to certain risks. See “Risk Factors,” below. The Contract is
i
novel and innovative. While we understand that the Internal Revenue Service may be considering tax issues associated with products similar to the Contract, to date the tax consequences of the Contract have not been addressed in published legal authorities. Under the circumstances, the Plan Sponsor and prospective GLWB Participants should therefore consult a tax advisor before purchasing a Contract or a GLWB.
ii
| 18 | |
| 19 | |
| 19 | |
| 22 | |
| 23 | |
| 23 | |
| 24 | |
| 24 | |
| 24 | |
| 25 | |
| 25 | |
| 25 | |
| 26 | |
| 26 | |
| 26 | |
| 26 | |
| 27 | |
| 29 | |
| 30 | |
| 30 | |
| 30 | |
| 30 | |
| 30 | |
| 31 | |
| 31 | |
| 31 | |
| 31 | |
| 37 | |
| 37 | |
| 38 | |
| 46 | |
| 55 | |
| 57 | |
| 62 | |
| 62 | |
| 64 | |
| A-1 |
iv
v
SUMMARY
Preliminary Note Regarding Terms Used in This Prospectus
Certain terms used in this prospectus have specific and important meanings. Some important terms are explained below, and in most cases the meaning of other important terms is explained the first time they are used in the prospectus. You will also find in the back of this prospectus a listing of all of the terms, with the meaning of each term explained.
| • | The “Contract” is the Great-West SecureFoundation Group Fixed Deferred Contract issued by Great-West Life & Annuity Insurance Company. |
| • | “We,” “us,” “our,” “Great-West,” or the “Company” means Great-West Life & Annuity Insurance Company. |
| • | “Covered Person” or “Covered Persons” means the person or persons, respectively, named in the Contract whose age is used for certain important purposes under the Contract, including determining the amount of the guaranteed income that may be provided by the Contract. The GLWB Participant must be a Covered Person. |
| • | “Covered Fund” or “Covered Funds” refer to the Great-West SecureFoundation® Lifetime 2020 Fund, Great-West SecureFoundation® Lifetime 2025 Fund, Great-West SecureFoundation® Lifetime 2030 Fund, Great-West SecureFoundation® Lifetime 2035 Fund, Great-West SecureFoundation® Lifetime 2040 Fund, Great-West SecureFoundation® Lifetime 2045 Fund, Great-West SecureFoundation® Lifetime 2050 Fund, Great-West SecureFoundation® Lifetime 2055 Fund, Great-West SecureFoundation® Lifetime 2060 Fund and the Great-West SecureFoundation® Balanced Fund. The Covered Funds are not issued by Great-West. Great-West Funds, Inc. is the issuer of the Covered Funds and is an affiliate of Great-West. |
We believe that in most cases the GLWB Participant will be the only Covered Person. Therefore, for ease of reference, most of the discussion in this prospectus assumes that the GLWB Participant is the only Covered Person. In some places in the prospectus, however, we explain how certain features of the GLWB differ if there are joint Covered Persons.
The following is a summary of the GLWB. You should read the entire prospectus in addition to this summary.
What is the GLWB?
The GLWB is the payment of guaranteed minimum lifetime income that the GLWB Participant will receive, regardless of how long the Covered Person lives or how the Covered Fund performs. The GLWB does not have a cash value. Provided all conditions of the Contract are met, if the value of the shares in the GLWB Participant’s Covered Fund (“Covered Fund Value”) equals zero as a result of Covered Fund performance, the Guarantee Benefit Fee, certain other fees that are not directly associated with the Contract (e.g., custodian fees or advisory fees), and/or Guaranteed Annual Withdrawal(s) (“GAW”), we will make annual payments to the GLWB Participant for the rest of his life.
The amount of the GAW that you may take may increase from time to time based on the Covered Fund Value. It may also decrease if the GLWB Participant takes Excess Withdrawals (discussed below).
The guaranteed income that may be provided by the GLWB is based on the age and life of the Covered Person (or if there are joint Covered Persons, on the age of the younger joint Covered Person and the lives of both Covered Persons) as of the date we calculate the first Installment. A joint Covered Person must be the spouse of the GLWB Participant and the spouse must be the GLWB Participant’s sole beneficiary under the Retirement Plan.
How much will the GLWB cost?
While the Contract is in force, a Guarantee Benefit Fee will be calculated and deducted from the Covered Fund Value on a monthly basis. It will be paid by redeeming the number of fund shares of the Covered Fund equal to the Guarantee Benefit Fee. The Guarantee Benefit Fee is calculated as a specified percentage of the Covered Fund Value at the time the Guarantee Benefit Fee is calculated.If we do not receive the Guarantee Benefit Fee (except during the Settlement Phase), including as a result of the failure of the Retirement Plan’s custodian to submit it to us, the GLWB will terminate as of the date that the fee is due. We will not provide notice prior to termination of the Contract or GLWB and we will not refund the Guarantee Benefit Fee paid upon termination of the Contract or GLWB.
The Guarantee Benefit Fee pays for the insurance protections provided by the Contract.
The guaranteed maximum or minimum Guarantee Benefit Fee we can ever charge is shown below. The amount we currently charge is also shown below.
1
| • | The maximum Guarantee Benefit Fee, as a percentage of a GLWB Participant’s Covered Fund Value, on an annual basis, is 1.5%. |
| • | The minimum Guarantee Benefit Fee, as a percentage of a GLWB Participant’s Covered Fund Value, on an annual basis, is 0.70%. |
| • | The current Guarantee Benefit Fee, as a percentage of a GLWB Participant’s Covered Fund Value, on an annual basis, is 0.90%. |
We may change the current Guarantee Benefit Fee at any time within the minimum and maximum range described above upon thirty (30) days prior written notice to the GLWB Participant and the Plan Sponsor. We determine the Guarantee Benefit Fee based on observations of a number of experience factors, including, but not limited to, interest rates, volatility, investment returns, expenses, mortality, and lapse rates. As an example, if mortality experience improves faster than we have anticipated, and the population in general is expected to live longer than initially projected, we might increase the Guarantee Benefit Fee to reflect our increased probability of paying longevity benefits. However, improvements in mortality experience is provided as an example only, we reserve the right to change the Guarantee Benefit Fee at our discretion and for any reason, whether or not these experience factors change (although we will never increase the fee above the maximum or decrease the fee below the minimum). We do not need any particular event to occur before we may change the Guarantee Benefit Fee. Because the Covered Funds are offered by an affiliated company, we may benefit indirectly from the charges imposed by the Covered Funds.
The Guarantee Benefit Fee is in addition to any charges that are imposed in connection with advisory, custodial and other services, and charges imposed by the Covered Funds.
Premium taxes may be applicable in certain states. Premium tax applicability and rates vary by state and may change. We reserve the right to deduct any such tax from premium when received.
Can the GLWB Participant cancel the GLWB?
The GLWB Participant may cancel the GLWB by causing the Covered Fund Value or the Benefit Base of each Covered Fund to be reduced to zero prior to the Settlement Phase due to one or more Excess Withdrawals or by failing to pay the Guarantee Benefit Fee. If the GLWB Participant cancels the GLWB, then the GLWB Participant will be prohibited from making any Transfer into the same Covered Fund for at least ninety (90) calendar days.
What happens if the Contract Owner/Plan Sponsor eliminates a Covered Fund from my Plan?
If your Plan Sponsors eliminates a Covered Fund from your Plan and transfers all Covered Fund assets to another Covered Fund offered in the Plan, Great-West will restore your GLWB Benefit Base and GAW, if applicable, to the same amounts as held by you prior to the transfer of the Covered Fund assets.
Can the Contract Owner/Plan Sponsor cancel the Contract?
As Contract Owner, the Plan Sponsor has the right to cancel the Contract upon 75 days written notice to us without additional charges. If the Plan Sponsor cancels the Contract, then the GLWB Participants in the Retirement Plan will lose their GLWB and all associated benefits. We will not return any portion of the Guarantee Benefit Fee that has been collected. However, for GLWB Participants that have reached the Settlement Phase on or before the date that the Plan Sponsor cancels the Contract, Installments will continue for as long as the GLWB Participant shall live.
What protection does the GLWB provide?
The GLWB provides two basic protections to GLWB Participants who purchase the GLWB as a source or potential source of lifetime retirement income or other long-term purposes. Provided that certain conditions are met, the GLWB protects the GLWB Participant from:
| • | longevity risk, which is the risk that a GLWB Participant will outlive the assets invested in the Covered Fund; and |
| • | income volatility risk, which is the risk of downward fluctuations in a GLWB Participant’s retirement income due to changes in market performance. |
Both of these risks increase as a result of poor market performance early in retirement. Point-in-time risk (which is the risk of retiring on the eve of a down market) significantly contributes to both longevity and income volatility risk.
2
The GLWB does not provide a guarantee that the Covered Fund or the GLWB Participant’s Account will retain a certain value or that the value of the Covered Fund or the GLWB Participant’s Account will remain steady or grow over time. Instead, it provides for a guarantee, under certain specified conditions, that regardless of the performance of the Covered Funds in the Account and regardless of how long the GLWB Participant lives, the GLWB Participant will be able to receive a guaranteed level of annual income for life. Therefore, it is important to understand that while the preservation of capital may be one of the GLWB Participant’s goals, the achievement of that goal is not guaranteed by the GLWB.
How does the GLWB work?
The GLWB has three phases: an “Accumulation Phase,” a “GAW Phase,” and a “Settlement Phase.”
| • | The Accumulation Phase:During the Accumulation Phase, the GLWB Participant may make additional Contract Contributions to the Covered Fund, which establishes the Benefit Base (this is the sum of all Contract Contributions minus any withdrawals and any adjustments made on the “Ratchet Date” as described later in this prospectus), and take Distributions from the Account just as the GLWB Participant otherwise would be permitted to (although Excess Withdrawals will reduce the amount of the Benefit Base under the Contract). The GLWB Participant is responsible for managing withdrawals during the Accumulation Phase. |
| • | The GAW Phase:After the GLWB Participant (or if there are joint Covered Persons, the younger joint Covered Person) has turned age 55, then the GLWB Participant can enter the GAW Phase and begin to take GAWs (which are annual withdrawals that do not exceed a specified amount) without reducing the Benefit Base. GAWs before age 59 1⁄2 may result in certain tax penalties, and may not be permissible in certain circumstances. |
| • | Settlement Phase:If the Covered Fund Value falls to zero as a result of Covered Fund performance, the Guarantee Benefit Fee, certain other fees that are not directly associated with the GLWB or Contract (e.g.,custodian fees or advisory fees), and/or GAWs, the Settlement Phase will begin. During the Settlement Phase, we make Installments to the GLWB Participant for life. However, the Settlement Phase may never occur, depending on how long the GLWB Participant lives and how well the Covered Fund performs. |
The Installments that a GLWB Participant may receive when in the GAW Phase or Settlement Phase are determined by multiplying the vested Benefit Base by the GAW Percentage (GAW%), which is determined by the age of the Covered Person(s) as of the date we calculate the first Installment. As described in more detail below, the amount of the Installments may increase on an annual basis during the GAW Phase due to positive Covered Fund performance, and will decrease as a result of any Excess Withdrawals.
If the GLWB Participant withdraws any of his Covered Fund Value during the Accumulation Phase to satisfy any contribution limitation imposed under federal law, we will consider that to be an Excess Withdrawal. Any withdrawals to satisfy a GLWB Participant’s required distribution obligations under the Code will be considered an Excess Withdrawal if taken during the Accumulation Phase. As a result, those who will be subject to required minimum distributions should consider the appropriateness of this product. Each GLWB Participant should consult a qualified tax advisor regarding contribution limits and other tax implications. We will deem withdrawals taken during the GAW Phase to meet required minimum distribution requirements, in the proportion of the GLWB Participant’s Covered Fund Value to his overall Account balance (and not taking into account any other retirement balances of the GLWB Participant), to be within the contract limits for the Contract and will not treat such withdrawals as Excess Withdrawals.
How does the Contract Owner/Plan Sponsor apply for the Contract?
The Contract Owner/Plan Sponsor may apply for the Contract by completing an application or other form authorized by us and executing the Contract. The Contract Owner/Plan Sponsor is also required to add one or more Covered Funds to the eligible investment options for the Retirement Plan. If the application or form is accepted by us at our Administrative Office, we will issue a Contract to the Contract Owner/Plan Sponsor describing the rights and obligations under the Contract.
How does a Retirement Plan participant elect the GLWB?
A Retirement Plan participant must elect the GLWB in connection with his purchase of shares of a Covered Fund in his Account under the Retirement Plan. However, the actual date of election of the GLWB will depend on which Covered Fund shares are purchased. For the SecureFoundation® Lifetime Funds, a GLWB Participant will not be deemed to have actually elected the GLWB until the first business day of the year that is ten years prior to the date in the name of the fund. There is no minimum initial investment. Subject to federal tax law and Retirement Plan limitations on Section 403(b) contributions, a GLWB Participant may invest any amount in any Covered Fund. However, the Benefit Base is limited to $5,000,000. Any amount over $5,000,000 will not increase the GLWB Participant’s Benefit Base.
3
The GLWB may only be elected by participants in Retirement Plans that offer the Covered Funds.
What are the Designated Investment Options?
The following is a list of the currently available Covered Funds
| Great-West SecureFoundation® Lifetime 2020 Fund |
| Great-West SecureFoundation® Lifetime 2025 Fund |
| Great-West SecureFoundation® Lifetime 2030 Fund |
| Great-West SecureFoundation® Lifetime 2035 Fund |
| Great-West SecureFoundation® Lifetime 2040 Fund |
| Great-West SecureFoundation® Lifetime 2045 Fund |
| Great-West SecureFoundation® Lifetime 2050 Fund |
| Great-West SecureFoundation® Lifetime 2055 Fund |
| Great-West SecureFoundation® Lifetime 2060 Fund |
| Great-West SecureFoundation® Balanced Fund |
In general, if the GLWB Participant purchases shares of one of the Covered Funds, the GLWB Participant is required to purchase the GLWB. However, the actual date of purchase will depend on which Covered Fund shares are purchased. For the Great-West SecureFoundation® Lifetime Funds, the GLWB Participant will not be deemed to have purchased the GLWB until the first business day of the year that is ten years prior to the date in the name of the fund. Thus, it is possible to redeem the shares of a Great-West SecureFoundation® Lifetime Fund prior to the date in which the GLWB Participant would have been deemed to have purchased the GLWB. For example, if a GLWB Participant purchases shares of the Great-West SecureFoundation® Lifetime 2055 Fund today, he will not purchase the GLWB until January 3, 2045, will not have any rights or benefits under the GLWB until January 3, 2045, and will not be charged the Guarantee Benefit Fee until the end of January 2045 and, if the GLWB Participant chooses to redeem all of his shares prior to January 3, 2045, the GLWB Participant will not be charged the Guarantee Benefit Fee.
A GLWB Participant may also later decide not to maintain the GLWB. If so, the GLWB Participant will need to redeem all shares in the Covered Fund in order to cancel the GLWB. A GLWB Participant cannot remain invested in a Covered Fund without owning the GLWB.
Is the GLWB right for Retirement Plan participants?
The GLWB may be right for a Retirement Plan participant if he believes that he may outlive his retirement investments or is concerned about market risk. If a Retirement Plan participant believes that his retirement investments will be sufficient to provide for retirement expenses regardless of market performance or lifespan, then the GLWB may not be right for the Retirement Plan participant.
The GLWB does not protect the actual value of a Retirement Plan participant’s investments in the Account or guarantee the Covered Fund Value. For example, if a Retirement Plan participant invests $500,000 in a Covered Fund, and the Covered Fund Value has dropped to $400,000 on the Initial Installment Date, we are not required to add $100,000 to the Covered Fund Value. Instead, the GLWB guarantees that when a GLWB Participant reaches the Initial Installment Date, he may begin GAWs based upon a Benefit Base of $500,000, rather than $400,000 (so long as specified conditions are met).
The GAWs are made from the GLWB Participant’s own investment. We start using our money to make Installments to a GLWB Participant only if the Covered Fund Value is reduced to zero due to Covered Fund performance, the Guarantee Benefit Fee, certain other fees that are not directly associated with the GLWB (e.g., custodian fees or advisory fees), and/or GAWs. We limit our risk under the GLWB in this regard by limiting the amount a GLWB Participant may withdraw each year to GAWs. If a GLWB Participant needs to take Excess Withdrawals, the GLWB Participant may not receive the full benefit of the GLWB. For further information, see“The Accumulation Phase– Excess Withdrawal During the Accumulation Phase” and“The GAW Phase– Excess Withdrawals During the Accumulation Phase,” below.
If the return on the Covered Fund Value over time is sufficient to generate gains that can sustain constant GAWs, then the GLWB would not have provided any financial gain. Conversely, if the return on the Covered Fund Value over time is not sufficient to generate gains that can sustain constant GAWs, then the GLWB would be beneficial.
4
Each Retirement Plan participant should discuss his investment strategy and risk tolerance with his financial advisor before electing to invest in Covered Funds and the GLWB. You should consider the payment of the Guarantee Benefit Fee (which is in addition to any fee paid for the Covered Fund) relative to the benefits and features of the GLWB, your risk tolerance, and proximity to retirement.
RISK FACTORS REGARDING THE CONTRACT
There are a number of risks associated with the Contract and GLWB as described below.
The guarantee that may be provided is contingent on several conditions being met. In certain circumstances a GLWB Participant may not realize a benefit from the GLWB.
| • | If the Plan Sponsor selects a new record keeper, the GLWB Participant may lose the entire benefit.Currently, the Contracts are only offered to Plan Sponsors of Retirement Plans that select Great-West as their record keeper. If the Plan Sponsor elects a new record keeper, it is likely that this will result in the termination of the Contract and the GLWB Participant will lose the entire benefit unless the GLWB Participant has already reached Settlement Phase. The Guarantee Benefit Fee will not be refunded. |
| • | The Plan Sponsor may cancel the Contract or remove the Covered Funds.The GLWB is an investment option offered by the Retirement Plan and is contingent on the Retirement Plan offering one or more of the Covered Funds. The Plan Sponsor may elect to cancel the Contract at any time or remove the Covered Funds from the Retirement Plan’s investment options. If the Plan Sponsor takes either of these actions, the GLWB Participant will lose the entire benefit unless the GLWB Participant has already reached Settlement Phase. The Guarantee Benefit Fee will not be refunded. |
| • | The GLWB Participant may die before receiving payments from us or may not live long enough to receive enough income to exceed the amount of the Guarantee Benefit Fees paid.If the GLWB Participant (assuming he is the sole Covered Person) dies before the Covered Fund Value is reduced to zero, the GLWB Participant will never receive any payments under the Contract. Neither the Contract nor the GLWB has any cash value or provides a death benefit. Furthermore, even if the GLWB Participant begins to receive Installments in the Settlement Phase, the GLWB Participant may die before receiving an amount equal to or greater than the amount paid in Guarantee Benefit Fees. |
| • | The Covered Funds may perform well enough so that the GLWB Participant may not need the guarantee that may otherwise be provided by the Contract.The Covered Funds are managed by a registered investment adviser, Great-West Capital Management, LLC (“GWCM”), a wholly owned subsidiary of Great-West. GWCM manages the Great-West SecureFoundation® Lifetime Funds to become more conservative as time goes on, which may minimize the likelihood that the GLWB Participant will experience a significant loss of capital at an advanced age. GWCM also has the flexibility to manage the Great-West SecureFoundation® Balanced Fund conservatively. Therefore, there is a good chance that the Covered Funds will perform well enough that GAWs will not reduce Covered Fund Value to zero. As a result, the likelihood that we will make payments to the GLWB Participant is minimal. In this case, the GLWB Participant will have paid us the Guarantee Benefit Fee for the life of the GLWB and received no payments in the Settlement Phase in return. |
| • | The GLWB Participant may need to make Excess Withdrawals, which have the potential to substantially reduce or even terminate the benefits available under the Contract.Because personal financial needs can arise unpredictably (e.g., unexpected medical bills), the GLWB Participant may need to make a withdrawal from a Covered Fund before the start of the GAW Phase or following the start of the GAW Phase in an amount larger than the GAW. These types of withdrawals are Excess Withdrawals that will reduce or eliminate the guarantee that may otherwise be provided by the Contract. There is no provision under the Contract to cure any decrease in the benefits due to Excess Withdrawals. To avoid making Excess Withdrawals, the GLWB Participant will need to carefully manage any withdrawals. The Contract does not require us to warn the GLWB Participant of Excess Withdrawals or other actions with adverse consequences. |
| • | The GLWB Participant may choose to cancel the GLWB prior to a severe market downturn.The GLWB is designed to protect the GLWB Participant from outliving the assets in the Covered Fund. If the GLWB Participant terminates the GLWB before reaching the GAW Phase or Settlement Phase, we will not make payments to the GLWB Participant, even if subsequent Covered Fund performance reduces the Covered Fund Value to zero. |
| • | The GLWB Participant might not begin making GAWs at the most financially beneficial time.Because of decreasing life expectancy as one ages, in certain circumstances, the longer the GLWB Participant waits to start taking GAWs, the less likely it is that the GLWB Participant will benefit from the GLWB. On the other hand, the earlier the GLWB Participant begins taking GAWs, the lower the GAW Percentage the GLWB Participant will receive and therefore the lower the GAWs (if any) will be. Because of the uncertainty of how long the GLWB Participant will live and how the GLWB Participant’s investments will perform over time, it will be difficult to determine the most financially beneficial time to begin making GAWs. |
5
| • | If the GLWB Participant moves his assets out of the Retirement Plan, the GLWB Participant may never receive a benefit from the GLWB.The GLWB is currently available to participants in certain Section 403(b) Plans. The Contract is entered into by the Plan Sponsor. If the GLWB Participant moves his assets out of the Retirement Plan, such as by a full distribution of all of the assets in the Plan, or moves to an IRA provider that does not offer the GLWB, the GLWB Participant will cause the GLWB to terminate. In that case, the GLWB Participant may never receive a benefit from the GLWB, and the Guarantee Benefit Fee will not be refunded. See“IRA Rollovers,”below for further information on how to maintain the Benefit Base after an IRA rollover. |
| • | We reserve the right to increase the Guarantee Benefit Fee at any time.If we increase the Guarantee Benefit Fee, then depending upon how long the GLWB Participant lives, the GLWB Participant may not receive enough income to exceed the amount of total fees paid. |
| • | The deduction of the Guarantee Benefit Fee each month will negatively affect the growth of the Covered Fund Value.The growth of the Plan account value is likely important to the GLWB Participant because the GLWB Participant may never receive Installments during Settlement Phase. Therefore, depending on how long the GLWB Participant lives and how other investment options available to the GLWB Participant under the Retirement Plan perform, the GLWB Participant may be financially better off without electing the Covered Funds and GLWB. |
| • | The Contract limits the GLWB Participant’s investment choices.Only certain funds are available under the Contract. These Covered Funds may be managed in a more conservative fashion than other mutual funds available to the GLWB Participant. If the GLWB Participant does not elect the GLWB, it is possible that the GLWB Participant may invest under the Retirement Plan in other mutual funds (or other types of investments) that experience higher growth or lower losses, depending on the market, than the Covered Funds experience. It is impossible to know how various investments will fare on a comparative basis. |
| • | Covered Funds may become ineligible. If the Covered Fund that the GLWB Participant invests in becomes ineligible for the Contract, the GLWB Participant must Transfer the Covered Fund Value to another Covered Fund in order to keep the Contract in force. We reserve the right to designate Covered Funds that were previously eligible for use with the Contract as ineligible for use with the Contract, for any reason including due to changes to their investment objectives. In the event that all Covered Funds become ineligible or are liquidated, we will designate a new fund as a Covered Fund. The new Covered Fund may have higher fees and charges and different investment objectives/strategies than the ineligible Covered Fund. In addition, designating a new fund as a Covered Fund may result in an increase in the current Guarantee Benefit Fee, which will not exceed the maximum Guarantee Benefit Fee of 1.5%. The Guarantee Benefit Fee will not be refunded if the Covered Funds become ineligible or are liquidated. |
| • | We may terminate the Contract upon 75 days written notice to the Contract Owner.If we terminate the Contract, such termination will not adversely affect the GLWB Participant’s rights under the Contract, except that we will not permit additional Contributions to the Covered Fund. However, we will accept reinvested dividends and capital gains. The GLWB Participant will still be obligated to pay the Guarantee Benefit Fee. |
| • | The Contract will terminate if the Guaranteed Benefit Fee is not paid.If we do not receive the Guarantee Benefit Fee (except during the Settlement Phase), including as a result of the failure of the Retirement Plan custodian to submit it to us, the Contract will terminate as of the date that the fee is due. |
The GLWB Participant’s receipt of payments from us is subject to our claims paying ability.
Any payments we are required to make to the GLWB Participant under the Contract will depend on our long-term ability to make such payments.
We will make all payments under the Contract in the Settlement Phase from our general account, which is not insulated from the claims of our third party creditors. Therefore, the GLWB Participant’s receipt of payments from us is subject to our claims paying ability. The Covered Funds do not make payments under the GLWB.
Currently, our financial strength is rated by three nationally recognized statistical rating organizations (“NRSRO”), ranging from superior to excellent to very strong. Our ratings reflect the NRSROs’ opinions that we have a superior, excellent, or a very strong ability to meet our ongoing obligations. An excellent and very strong rating means that we may have somewhat larger long-term risks than higher rated companies that may impair our ability to pay benefits payable on outstanding insurance policies on time. The financial strength ratings are the NRSROs’ current opinions of our financial strength with respect to our ability to pay under our outstanding insurance policies according to their terms and the timeliness of payments. The NRSRO ratings are not specific to the Contract or Certificate.
6
Additional information regarding our Company and its financial condition may be found in this prospectus under “Additional Information Regarding the Company” and in the most recent audited annual financial statements of the Company included in this prospectus in “Appendix A – Selected Financial Data, Management’s Discussion and Analysis of Financial Condition of Results of Operations, and Financial Statements”.
There may be tax consequences associated with the Contract:
| • | The Contract is novel and innovative and, to date, the tax consequences of the GLWB have not been addressed in published legal authorities. A prospective GLWB Participant should consult a tax advisor before electing the Covered Funds and GLWB. See “Taxation of the Contract and GLWB,” below for further discussion of tax issues relating to the GLWB. |
Other Information
| • | You should be aware of various regulatory protections that do and do not apply to the Contract. The Contract is registered in accordance with the Securities Act of 1933. The issuance and sale of the Contract must be conducted in accordance with the requirements of the Securities Act of 1933. |
| • | We have elected to rely on the exemption provided by Rule 12h-7 under the Securities Exchange Act of 1934 (“1934 Act”) from the requirements to file reports pursuant to Section 15(d) of that Act. In reliance on that exemption, Great-West Life & Annuity Insurance Company will not file the periodic reports that would otherwise be required under the 1934 Act. Annual Audited Financial Statements and other information regarding the Company required by the Securities Act of 1933 will be provided annually in this prospectus. |
| • | We are neither an investment company nor an investment adviser and do not provide investment advice in connection with the Contract. Therefore, we are not governed by the Investment Advisers Act of 1940 (the “Advisers Act”) or the Investment Company Act of 1940 (the “1940 Act”). Accordingly, the protections provided by the Advisers Act and the 1940 Act are not applicable with respect to our sale of the Contract. |
THE CONTRACT
The Contract is a group fixed deferred annuity contract. The GLWB is offered only to Retirement Plan participants whose assets are invested in one or more Covered Funds. The Contract is designed for Retirement Plan participants who intend to use the investments in the Covered Fund in their Account as the basis for periodic withdrawals (such as systematic withdrawal programs involving regular annual withdrawals of a certain percentage of the Covered Fund Value) to provide income payments for retirement or for other purposes. For more information about the Covered Funds, each Retirement Plan participant should talk to his advisor and review the accompanying prospectuses for the Covered Funds.
Provided that specified conditions are met, the Contract provides for a guaranteed income over the remaining life of the GLWB Participant (or, if these are joint Covered Persons, the remaining lives of both joint Covered Persons), should the Covered Fund Value equal zero as a result of GAWs, the Guarantee Benefit Fee, certain other fees that are not directly associated with the Certificate or Contract (e.g., custodian fees or advisory fees), and/or Covered Fund performance.
INVESTMENT OPTIONS—THE COVERED FUNDS
The Contract provides protection relating to Covered Funds by ensuring that, regardless of how the Covered Fund(s) actually performs or the actual Covered Fund Value when the GLWB Participant begins GAWs for retirement or other purposes, the GLWB Participant will receive predictable income payments for as long as the GLWB Participant lives so long as specified conditions are met.
In general, if the GLWB Participant purchases shares of one of the Covered Funds in his Account, the GLWB Participant is required to purchase the GLWB. The actual date of purchase of the GLWB will depend on which Covered Fund shares are purchased. For the Great-West SecureFoundation® Lifetime Funds, the GLWB is not actually purchased until the first Business Day of the year that is ten years prior to the date in the name of the fund, which is known as the “Guarantee Trigger Date.” (The Guarantee Trigger Date is also your Election Date.) Thus, it is possible to redeem the shares of a SecureFoundation Lifetime Fund prior to the Guarantee Trigger Date. For example, if the GLWB Participant purchases shares of the Great-West SecureFoundation® Lifetime 2055 Fund, the GLWB will not be purchased until January 3, 2045, the GLWB Participant will not have any rights or benefits under the GLWB until January 3, 2045, and the GLWB Participant will not be charged the Guarantee Benefit Fee until the end of January 2045, and if the GLWB Participant chooses to redeem all of the shares prior to January 3, 2045, he will not be charged the Guarantee Benefit Fee. The Election Date for the Great-West SecureFoundation® Balanced Fund is date that the GWLB Participant purchases shares.
7
If the GLWB Participant later decides that he does not want to maintain the GLWB, he will need to redeem all of his shares in the Covered Fund in order to cancel the GLWB. The GLWB Participant cannot remain invested in a Covered Fund without owning the GLWB.
The Covered Funds will be held in an Account maintained pursuant to the Retirement Plan. The Company issues the Contracts, but the Company is not the GLWB Participant’s investment adviser and does not provide investment advice to the GLWB Participant in connection with the GLWB.
As described in more detail in the Covered Fund prospectuses, in addition to the Guarantee Benefit Fee, there are certain fees and charges associated with the Covered Funds, which may reduce the Covered Fund Value. These fees may include management fees, distribution fees, acquired fund fees and expenses, redemption fees, exchange fees, advisory fees, and/or administrative fees.
The following information about the Covered Funds is only a summary of important information that the GLWB Participant should know. More detailed information about the Covered Funds' investment strategies and risks are included in each Covered Fund’s prospectus. Please read that separate prospectus carefully before investing in a Covered Fund.
The Covered Funds are managed by an investment adviser affiliated with us, which may have an incentive to manage the funds in a way to reduce volatility of the funds' returns in order to lower the amounts that we have to pay under the Contract. Offering the Contract in connection with your investment in the Covered Funds, therefore, may subject us to a potential conflict of interest. Reducing volatility may have the effect of lowering the returns of the Covered Funds relative to other funds. This may suppress the value of the benefits provided by the Contract because your Benefit Base will reset only when your Covered Fund Value is higher than your Benefit Base. We took into account the Covered Funds' use of strategies to lower volatility when we selected them for use with this Contract. In addition, each of the Covered Funds is a fund of funds, for which you will pay fees at both fund levels, which will reduce your investment return.
GREAT-WEST SECUREFOUNDATION® BALANCED FUND
The fund is designed for investors seeking a professionally designed asset allocation program to simplify the accumulation of assets prior to retirement together with the potential benefit of the guarantee that may be provided by the Contract. The fund strives to provide shareholders with a high level of diversification primarily through both a professionally designed asset allocation model and professionally selected investments in underlying portfolios (the “Underlying Portfolios”). The intended benefit of asset allocation is diversification, which is expected to reduce volatility over the long-term.
The fund is a “fund of funds” that pursues its investment objective by investing in other mutual funds, including Underlying Portfolios that may or may not be affiliated with the Great-West SecureFoundation® Balanced Fund, cash and cash equivalents.
The fund has two classes of shares, Investor Class and Service Class shares. Each class is identical except that Service Class shares have a distribution or “Rule 12b-1” plan. The distribution plan provides for a distribution fee. Because the distribution fee is paid out of Service Class assets on an ongoing basis, over time these fees will increase the cost of the investment and may cost more than paying other types of sales charges.
Investment Objective
The fund seeks long-term capital appreciation and income.
GREAT-WEST SECUREFOUNDATION® LIFETIME FUNDS
There are nine separate Great-West SecureFoundation® Lifetime Funds. These are the:
| Great-West SecureFoundation® Lifetime 2020 Fund |
| Great-West SecureFoundation® Lifetime 2025 Fund |
| Great-West SecureFoundation® Lifetime 2030 Fund |
| Great-West SecureFoundation® Lifetime 2035 Fund |
| Great-West SecureFoundation® Lifetime 2040 Fund |
| Great-West SecureFoundation® Lifetime 2045 Fund |
| Great-West SecureFoundation® Lifetime 2050 Fund |
8
| Great-West SecureFoundation® Lifetime 2055 Fund |
| Great-West SecureFoundation® Lifetime 2060 Fund |
Each Great-West SecureFoundation® Lifetime Fund provides an asset allocation strategy and is designed to meet certain investment goals based on an investor’s investment horizon (such as projected retirement date) and personal objectives.
Each Great-West SecureFoundation® Lifetime Fund is a “fund of funds” that pursues its investment objective by investing in other mutual funds, including mutual funds that may or may not be affiliated with the Great-West SecureFoundation® Lifetime Funds (collectively, “Underlying Portfolios”), a fixed interest contract issued and guaranteed by GWL&A (the “GWL&A Contract”), cash, and cash equivalents. The Great-West SecureFoundation® Lifetime Funds use asset allocation strategies to allocate assets among the Underlying Portfolios.
The Great-West SecureFoundation® Lifetime Funds have two classes of shares, Investor Class and Service Class shares. Each class is identical except that Service Class shares have a distribution or “Rule 12b-1” plan. The distribution plan provides for a distribution fee. Because the distribution fee is paid out of Service Class assets on an ongoing basis, over time these fees will increase the cost of the investment and may cost more than paying other types of sales charges.
Investment Objective
Each Great-West SecureFoundation® Lifetime Fund seeks long-term capital appreciation and income consistent with its current asset allocation.
ADDING AND REMOVING COVERED FUNDS
We may, without the consent of the GLWB Participant or the Contract Owner, offer new Covered Fund(s) or cease offering Covered Fund(s). We will notify the Contract Owner whenever the Covered Fund(s) are changed. If we cease offering a Covered Fund in which the GLWB Participant is invested, then the GLWB Participant must Transfer the Covered Fund Value to another Covered Fund in order to keep the Contract in force. In the event that we cease offering all of the Covered Funds, we will designate a new fund as a Covered Fund. The new Covered Fund may have higher fees and charges and different investment objectives/strategies than the ineligible Covered Fund. In addition, designating a new fund as a Covered Fund, may result in an increase in the current Guarantee Benefit Fee, which will not exceed the maximum Guarantee Benefit Fee of 1.5%. If the Plan Sponsor removes a Covered Fund, we are not obligated to designate a new Covered Fund.
IRA ROLLOVERS
If the SecureFoundation® Group Fixed Deferred Annuity Certificate (or individual contract in certain states) that we issue in connection with IRAs (the “IRA Certificate”) has been approved in the GLWB Participant’s state of residence and he or she is eligible and permitted by the terms of his or her Retirement Plan documents, the GLWB Participant may rollover the proceeds of his or her tax deferred Retirement Plan, including the GLWB, to his or her IRA. To preserve the GLWB in the rollover, the IRA provider must offer one or more of the Covered Funds and the IRA Certificate. If the rollover is from a tax-deferred Retirement Plan and the GLWB Participant has previously elected the GLWB as part of his or her investments in the tax-deferred Retirement Plan, the new Benefit Base may be equal to the Benefit Base as it existed under the GLWB Participant’s prior tax-deferred Retirement Plan immediately prior to the rollover. The new Benefit Base after the IRA rollover will only equal the Benefit Base the GLWB Participant had under the tax-deferred Retirement Plan, if the GLWB Participant: (a) invests the rollover or transfer proceeds covered by the Contract immediately prior to distribution from the tax-deferred Retirement Plan in the Covered Fund(s); (b) invest in a corresponding Covered Fund approved by Great-West, as described in the prospectus for the IRA Certificate, except if the GLWB Participant is in the Settlement Phase; and (c) the GLWB Participant Requests the restoration of the Benefit Base as it existed under the Retirement Plan. To maintain the same Benefit Base, the GLWB Participant must be in the same Phase that the GLWB Participant was in at the time of the rollover or transfer after the rollover or transfer is complete. If the GLWB Participant does not meet these requirements, a new benefit base will be established that is equal to the Covered Fund Value as of the date of the rollover and the Guarantee Benefit Fee will be calculated as a percentage of the Covered Fund Value.
The GLWB Participant’s new Covered Fund Value after the IRA rollover will initially equal the Covered Fund Value as of the date of the rollover. We will calculate the GLWB Participant’s Guarantee Benefit Fee as a specified percentage of the Covered Fund Value.
9
THE ACCUMULATION PHASE
As stated previously in this prospectus, the Contract has three phases: an “Accumulation Phase,” “GAW Phase,” and “Settlement Phase.” The Accumulation Phase is described in the following section of this prospectus.
The Accumulation Phase is the period of time between the Election Date, which is the date the GLWB Participant purchases the GLWB, and the first day of the GAW Phase. During this Phase, the GLWB Participant will establish the GLWB Participant’s Benefit Base which will be used later to determine the amount of GAWs.
Covered Fund Value
The GLWB Participant’s Covered Fund Value is the aggregate value of the shares in each Covered Fund held in the GLWB Participant’s Account. If the GLWB Participant’s Covered Fund Value is reduced to zero as a result of Covered Fund performance, the Guarantee Benefit Fee, certain other fees that are not directly associated with the Contract (e.g., custodian fees or advisory fees), and/or GAWs, we will make annual payments to the GLWB Participant for the rest of his life. See“The Settlement Phase,” below. The GLWB Participant’s Covered Fund Value also determines the amount of the Guarantee Benefit Fee we deduct. See “Guarantee Benefit Fee,” below.
The GLWB Participant’s Covered Fund Value is an actual cash value separate from the Benefit Base (which is only used to calculate Installment Payments during the GAW Phase and the Settlement Phase). The GLWB Participant’s Covered Fund Value and Benefit Base may not be equal to one another.
We do not increase or decrease the GLWB Participant’s Covered Fund Value. Rather, the GLWB Participant’s Covered Fund Value is increased or decreased in the same manner that all mutual fund values increase or decrease. For example, reinvested dividends, settlements, and positive Covered Fund performance (including capital gains) will increase the GLWB Participant’s Covered Fund Value, and fees and expenses associated with the Covered Funds and negative Covered Fund performance (including capital losses) will decrease the GLWB Participant’s Covered Fund Value.
The GLWB Participant’s Covered Fund Value will also increase each time the GLWB Participant purchases additional fund shares, such as by making a Contract Contribution, and will decrease each time the GLWB Participant redeems shares, such as through payment of the Guarantee Benefit Fee or as a result of Distributions, Excess Withdrawals, Installments, and Transfers from a Covered Fund to another investment option offered under the Retirement Plan (other than another Covered Fund). The GLWB Participant’s Covered Fund Value is not affected by any Ratchet or Reset of the Benefit Base (described below).
Benefit Base
The GLWB Participant’s Benefit Base is separate from the Covered Fund Value. It is not a cash value. Rather, the GLWB Participant’s Benefit Base is used to calculate Installment Payments during the GAW Phase and the Settlement Phase. The GLWB Participant’s Benefit Base and Covered Fund Value may not be equal to one another.
On the GLWB Participant’s Election Date, the initial Benefit Base is equal to the GLWB Participant’s Covered Fund Value on that date. Each Covered Fund will have its own Benefit Base. A Covered Fund Benefit Base cannot be transferred to another Covered Fund unless the Covered Fund in which you are invested is eliminated or liquidated by us.
| • | Weincreasethe GLWB Participant’s Benefit Base on a dollar-for-dollar basis each time the GLWB Participant makes a Contribution. |
| • | Wedecreasethe GLWB Participant’s Benefit Base on a proportionate basis each time the GLWB Participant makes an Excess Withdrawal. |
| • | On each Ratchet Date (described below), we willincreasethe GLWB Participant’s Benefit Base to equal the GLWB Participant’s current Covered Fund Value if the GLWB Participant ‘s Covered Fund Value is greater than the GLWB Participant’s Benefit Base. (If so, the GLWB Participant’s Benefit Base will then reflect positive Covered Fund performance.) |
A few things to keep in mind regarding the Benefit Base:
| • | The Benefit Base is used only for purposes of calculating the GLWB Participant’s Installment Payments during the GAW Phase and the Settlement Phase. It has no other purpose. The Benefit Base does not provide and is not available as a cash value or settlement value. |
| • | It is important that the GLWB Participant does not confuse the Benefit Base with the Covered Fund Value. |
10
| • | During the Accumulation Phase and the GAW Phase, the Benefit Base will be re-calculated each time the GLWB Participant makes a Contract Contribution or Excess Withdrawal, as well as on an annual basis as described below, which is known as the Ratchet Date. |
| • | The maximum Benefit Base is $5,000,000. |
Subsequent Contract Contributions to Your Account
During the Accumulation Phase, the GLWB Participant may make additional Contract Contributions to the Covered Funds in addition to the initial Contract Contribution. Subject to the requirements of federal tax law and the terms of the Retirement Plan, subsequent Contract Contributions can be made by cash deposit, Transfers, or rollovers from certain other retirement accounts. Additional Contract Contributions may not be made after the Accumulation Phase ends.
All additional Contract Contributions made after the Election Date will increase the Benefit Base dollar-for-dollar on the date the Contract Contribution is made. We will not consider the additional purchase of shares of a Covered Fund through reinvested dividends, capital gains, and/or settlements to be a Contract Contribution. However, they will increase the Covered Fund Value.
Great-West reserves the right to refuse additional Contract Contributions at any time and for any reason. Exercising this right may limit your ability to increase your Benefit Base by making additional Contract Contributions. If Great-West refuses additional Contract Contributions, the GLWB Participant will retain all other rights under the GLWB.
Ratchet Date Adjustments to the Benefit Base
During the Accumulation Phase, the Benefit Base will be evaluated and, if necessary, adjusted on an annual basis. This is known as the Ratchet Date and it occurs on the anniversary of the Election Date. It is important to be aware that even though the GLWB Participant's Covered Fund Value may increase throughout the year due to dividends, capital gains, or settlements from the underlying Covered Fund, the Benefit Base will not similarly increase until the next Ratchet Date. Unlike Covered Fund Value, the GLWB Participant's Benefit Base will never decrease solely due to negative Covered Fund performance.
On each Ratchet Date during the Accumulation Phase, the Benefit Base is automatically adjusted (“ratcheted”) to thegreater of:
| (a) | the current Benefit Base; or |
| (b) | the current Covered Fund Value. |
Example of Ratchet Date Adjustments during the Accumulation Period
Assume the following:
Benefit Base on Election Date (of January 2) = $100,000
Covered Fund Value on Election Date = $100,000
Increase in Covered Fund Value due to Dividends and Capital Gains paid July 1 = $5,000
Covered Fund Value on July 1 = $105,000
Benefit Base on July 1 = $100,000
No other Contract Contributions, Dividends, or Capital Gains are paid for the rest of the year.
Covered Fund Value on January 2 of the following year = $105,000
So, because the Covered Fund Value is greater than the Benefit Base on the Ratchet Date (January 2 of the following year), the Benefit Base is adjusted to $105,000 effective January 2.
Excess Withdrawals During the Accumulation Phase
Because the GLWB is held in the Account, the GLWB Participant may make withdrawals or change the GLWB Participant’s Account investments at any time and in any amount that the GLWB Participant wishes, subject to any federal tax limitations or Retirement Plan limitations. During the Accumulation Phase, however, any withdrawals or Transfers from the GLWB Participant’s Covered Fund Value will be categorized as Excess Withdrawals. Any withdrawals to satisfy the GLWB Participant’s required distribution obligations under the Code will be considered an Excess Withdrawal if taken during the Accumulation Phase.
The GLWB Participant should carefully consider the effect of an Excess Withdrawal on both the Benefit Base and the Covered Fund Value during the Accumulation Phase, as this may affect the GLWB Participant’s future benefits under the Contract. In the event the GLWB Participant decides to take an Excess Withdrawal, as discussed below, the GLWB Participant’s Covered Fund Value will be reduced dollar-for-dollar in the amount of the Excess Withdrawal. The Benefit Base will be reduced at the time the Excess Withdrawal is made by the ratio of the Covered Fund Value after the Excess Withdrawal reduction is applied.
11
Accordingly, the GLWB Participant’s Benefit Base will be reduced by more than the amount of the withdrawal when the Benefit Base is greater than the Covered Fund Value, which is likely to occur after periods of negative market performance.
Example of Effects of an Excess Withdrawal taken during the Accumulation Period
Assume the following:
Covered Fund Value before the Excess Withdrawal adjustment = $50,000
Benefit Base = $100,000
Excess Withdrawal amount: $10,000
So,
Covered Fund Value after adjustment = $50,000 - $10,000 = $40,000
Covered Fund Value adjustment = $40,000/$50,000 = 0.80
Adjusted Benefit Base = $100,000 x 0.80 = $80,000
Types of Excess Withdrawals
All Distributions and Transfers during the Accumulation Phase, including Transfers from one Covered Fund to another, are treated as Excess Withdrawals. An Excess Withdrawal will reduce the GLWB Participant’s Benefit Base and Covered Fund Value. A Distribution occurs when money is paid to the GLWB Participant from the Covered Fund Value. A Transfer occurs when the GLWB Participant transfers money from a Covered Fund to another investment. A Transfer will occur even if you transfer money from one Covered Fund to a different Covered Fund in the Retirement Plan. If the GLWB Participant Transfers any amount out of out of the Great-West SecureFoundation® Balanced Fund or the Great-West SecureFoundation® Lifetime Funds after the Guarantee Trigger Date, then the GLWB Participant will be prohibited from making any Transfers into the same Covered Fund for at least ninety (90) calendar days.
Note: The Contract does not require us to warn the GLWB Participant or provide the GLWB Participant with notice regarding potentially adverse consequences that may be associated with any withdrawals or other types of transactions involving the GLWB Participant’s Covered Fund. The GLWB Participant should carefully monitor his Covered Fund, any withdrawals from his Covered Fund, and any changes to the GLWB Participant’s Benefit Base. The GLWB Participant may contact us at (866) 317-6586 for information about the GLWB Participant’s Benefit Base.
Treatment of a Distribution During the Accumulation Phase
At the time of any partial or periodic Distribution, if the Covered Person is 55 years of age or older, the GLWB Participant may elect to begin the GAW Phase (as described below) and begin receiving GAWs at that time. If the GLWB Participant chooses not to begin the GAW Phase, the Distribution will be treated as an Excess Withdrawal and will reduce the GLWB Participant's Covered Fund Value and your Benefit Base (as described above).
If the Covered Person is not yet 55 years old, then any partial or periodic Distribution will be treated as an Excess Withdrawal as described above.
Any Distribution made during the Accumulation Phase to satisfy any contribution limitation imposed under federal law will be considered an Excess Withdrawal at all times. The GLWB Participant should consult a qualified tax advisor regarding contribution limits and other tax implications.
Loans
During the Accumulation Phase, the GLWB Participant may take a loan on his or her Account, if allowed by the Retirement Plan and the Code.
Any amount withdrawn from the Covered Fund Value to fund the loan will be treated as an Excess Withdrawal. Loan repayments to the Covered Fund will increase the Benefit Base dollar-for-dollar and are invested in the Covered Fund dollar-for-dollar. If the loan reduces the Covered Fund Value to zero, Transfer(s) will not be permitted into the same Covered Fund for at least ninety (90) calendar days after the loan, but the GLWB Participant may continue to direct other Contract Contributions into the Covered Fund and establish a new Election Date.
If a Retirement Plan loan is outstanding that affects the Covered Fund Value, the GLWB Participant must repay the Plan loan before the GAW Phase can begin and Installments are paid. Retirement Plan loans cannot be made from Covered Fund Value during GAW Phase or Settlement Phase.
12
Death During the Accumulation Phase
If a GLWB Participant dies during the Accumulation Phase, then the GLWB will terminate and the Covered Fund Value will be paid to the Beneficiary in accordance with the terms of the Retirement Plan and the Code (unless an election is permitted and made by a Beneficiary that is the spouse of the GLWB Participant). A Beneficiary that is the spouse of the GLWB Participant may choose either to:
| • | become a new GLWB Participant and maintain the deceased GLWB Participant’s current Benefit Base (or proportionate share if multiple Beneficiaries) as of the date of death; or |
| • | establish a new Account with a new Benefit Base based on the current Covered Fund Value on the date of the deceased GLWB Participant’s death. |
In either situation, the spouse Beneficiary shall become a GLWB Participant and the Ratchet Date will be the date when his or her Account is established.
If permitted by the Retirement Plan and the Code, a Beneficiary who is not the spouse of the GLWB Participant cannot elect to maintain the current Benefit Base, but may elect to establish a new GLWB. The Benefit Base and Election Date will be based on the current Covered Fund Value on the date his or her Account is established.
To the extent to that the Beneficiary becomes a GLWB Participant, he or she will be subject to all terms and conditions of the Contract, the Retirement Plan, and the Code. Any election made by Beneficiary pursuant to this section is irrevocable.
THE GAW PHASE
The GAW Phase begins when the GLWB Participant elects to receive GAWs under the Contract. The GAW Phase continues until the Covered Fund Value reaches zero and the Settlement Phase begins.
The GAW Phase cannot begin until all Covered Persons attain age 55 and are eligible to begin distributions under the Retirement Plan and the Code. If the GLWB Participant is still in the employment of the Plan Sponsor, the Code generally does not permit distributions to commence prior to age 59 1⁄2. The Retirement Plan and the Code may impose other limitations on distributions. Distributions prior to age 59 1⁄2 may be subject to a penalty tax. Installments will not begin until Great-West receives appropriate and satisfactory information about the age of the Covered Person(s) in good order and in manner reasonably satisfactory to Great-West.
In order to initiate the GAW Phase, the GLWB Participant must submit a written Request to Great-West. At that time, the GLWB Participant must provide sufficient documentation for Great-West to determine the age of each Covered Person.
Because the GAW Phase cannot begin until all Covered Persons under the GLWB attain age 55, any Distributions taken before then will be considered Excess Withdrawals and will be deducted from the Covered Fund Value and Benefit Base. See“Accumulation Phase,” below for more information. No Contract Contributions may be made to the Covered Fund(s) on and after the Initial Installment Date, which is the date that GAWs begin.
Because of decreasing life expectancy as the GLWB Participant ages, in certain circumstances, the longer the GLWB Participant waits to start taking GAWs, the less likely it is that the GLWB Participant will benefit from the GLWB. On the other hand, the earlier the GLWB Participant begins taking GAWs, the lower the GAW Percentage the GLWB Participant will receive and therefore the lower the GLWB Participant’s GAWs (if any) will be. The GLWB Participant should talk to his advisor before initiating the GAW Phase to determine the most financially beneficial time for the GLWB Participant to begin taking GAWs.
Installments
It is important that you understand how the GAW is calculated because it will affect the benefits the GLWB Participant receives under the Contract. Once the GAW Phase has been initiated and the age of the Covered Person(s) is verified, we will determine the amount of the GAW.
To determine the amount of the GAW, we will compare the vested portion of the current Benefit Base to the current Covered Fund Value on the Initial Installment Date. To determine the vested portion of (“Vested %”) of the Benefit Base, the vested portion of each Covered Fund is divided by the total Covered Fund Value. If the GLWB Participant is less than fully vested, the GAW will be based upon the Vested % of the Covered Fund Value and Benefit Base. If the vested Covered Fund Value is greater than the Vested % of the Benefit Base, we will increase the Benefit Base to equal the vested Covered Fund Value, and the GAW will be based on the increased Benefit Base amount. See“The GAW Phase– Vesting,” below.
13
During the GAW Phase, the GLWB Participant’s Benefit Base will receive an annual adjustment or “ratchet” just as it did during the Accumulation Phase. The GLWB Participant’s Ratchet Date will become the anniversary of Initial Installment Date and will no longer be the anniversary of the Election Date.
Just like the Accumulation Phase, the Benefit Base will be automatically adjusted on an annual basis, on the Ratchet Date, to the greater of:
| (a) | the current Benefit Base; or |
| (b) | the current Covered Fund Value. |
The GLWB Participant’s Benefit Base is used to calculate the GAW he receives. However, even though the Benefit Base is adjusted annually, the GAW%will not change unless the GLWB Participant requests a Reset of the GAW%. See “The GAW Phase—Optional Resets of the GAW% During the GAW Phase,” below.
It is important to note that Installments during the GAW Phase will reduce the GLWB Participant’s Covered Fund Value on a dollar-for-dollar basis, but they will not reduce the GLWB Participant’s Benefit Base.
Calculation of Installment Amount
The GAW% is based on the age of the Covered Person(s) as of the date we calculate the first Installment. If there are two Covered Persons the percentage is based on the age of the younger Covered Person.
The GAW is based on a percentage of the Benefit Base pursuant to the following schedule:
| Sole Covered Person | Joint Covered Person | |
| 4.0% for life at ages 55-64 | 3.5% for youngest joint life at ages 55-64 | |
| 5.0% for life at ages 65-69 | 4.5% for youngest joint life at ages 65-69 | |
| 6.0% for life at ages 70-79 | 5.5% for youngest joint life at ages 70-79 | |
| 7.0% for life at ages 80+ | 6.5% for youngest joint life at ages 80+ |
The GAW will then be calculated by multiplying the Benefit Base by the GAW%. The amount of the Installment equals the GAW divided by the number of payments per year under the elected Installment Frequency Option, as described below.
Numerical Example of GAW Calculation
Assume the following:
Sole Covered Person - 100% Vested
Age of Covered Person at Initial Installment Date: 60
Covered Fund Value = $120,000
Current Benefit Base = $115,000
Adjusted Benefit Base at Initial Installment Date = $120,000*
GAW% based on Age = 4.0%
GAW% x Vested % x = 4.0% x $120,000 = $4,800
Installment Frequency = Monthly (12 payments per year)
So GAW/Installment Frequency = $4,800/12 = $400
The monthly Installment will be $400
Numerical Example of GAW Calculation, Joint Covered Persons
Assume the following:
Joint Covered Persons - 100% Vested
Age of primary Covered Person at Initial Installment Date: 65
Age of joint Covered Person at Initial Installment Date: 58
Youngest Age for Determination of GAW: 58
14
Covered Fund Value = $120,000
Current Benefit Base = $115,000
Adjusted Benefit Base at Initial Installment Date = $120,000*
GAW% based on Age = 3.5%
GAW% x Vested % x (Adjusted Benefit Base) = 3.5% x $120,000 = $4,200
Installment Frequency = Monthly (12 payments per year)
So GAW/Installment Frequency = $4,200/12 = $350
The monthly Installment will be $350
* On the Initial Installment Date, we compare the current Benefit Base to the current Covered Fund Value. If the Covered Fund Value is greater than the Benefit Base, we will increase the Benefit Base to equal the Covered Fund Value, and the GAW will be based on the increased Benefit Base amount. See “Installments,” above.
Any election which affects the calculation of the GAW is irrevocable. Please consider all relevant factors when making an election to begin the GAW Phase. For example, an election to begin receiving Installments based on a sole Covered Person cannot subsequently be changed to joint Covered Persons once the GAW Phase has begun. Similarly, an election to receive Installments based on joint Covered Persons cannot subsequently be changed to a sole Covered Person, nor may the beneficiary designation of a joint election be changed.
Installment Frequency Options
The GLWB Participant's Installment Frequency Options are as follows:
| (a) | Annual– the GAW will be paid on the Initial Installment Date and each anniversary annually, or next business day, thereafter. |
| (b) | Semi-Annual– half of the GAW will be paid on the Initial Installment Date and in Installments every 6 month anniversary, or next business day, thereafter. |
| (c) | Quarterly– one quarter of the GAW will be paid on the Initial Installment Date and in Installments every 3 month anniversary, or next business day, thereafter. |
| (d) | Monthly– one-twelfth of the GAW will be paid on the Initial Installment Date and in Installments every monthly anniversary, or next business day, thereafter. |
The GLWB Participant may Request to change the Installment Frequency Option starting on each Ratchet Date during the GAW Phase.
Vesting
The GAW for a GLWB Participant who is employed, but not fully vested under the Retirement Plan, is based on the GLWB Participant’s Vested % of the Benefit Base, as determined by dividing the vested portion of each Covered Fund by the total Covered Fund Value. As the GLWB Participant continues to vest, the GAW is proportionately adjusted to reflect additional vested amounts of Covered Fund Value on each Ratchet Date.
Should the GLWB Participant who has elected to begin the GAW Phase not become fully vested because of severance from service or any other reason, any unvested Covered Fund Value shall be returned to the Plan’s forfeiture account and the Benefit Base will adjust proportionately.
Numerical Example of Calculation of GAW where GLWB Participant is not fully vested:
| • | GLWB Participant information: |
| • | $100,000 Benefit Base |
| • | GAWs start at age 62: GAW% at 5% |
| • | Vested % at age 62: 50% |
| • | Vested % at age 63: 60% |
| • | Vested % at age 64: 70% |
| • | Guaranteed Annual Withdrawal = Benefit Base x Vested % x GAW % |
| • | Age 62 (when GAWs start): $100,000 x 50% x 5% = $2,500 |
15
| • | Age 63 (on next Ratchet Date): $100,000 x 60% x 5% = $3,000 |
| • | Age 64 (on next Ratchet Date): $100,000 x 70% x 5% = $3,500 |
A GLWB Participant who has severed service, but is not fully vested in the Plan may elect GAWs, if eligible pursuant to the terms of the Contract and the Plan. The Benefit Base shall be reduced proportionately based on the vested Covered Fund Value with unvested Covered Fund Value returned to the Plan’s forfeiture account.
Numerical Example of Calculation of GAW where non-fully vested GLWB Participant is not eligible for adjustment:
| • | GLWB Participant information: |
| • | $100,000 Benefit Base |
| • | $60,000 Covered Fund Value |
| • | GAWs start at age 62: 5% |
| • | Vested % at age 62: 50% |
| • | When GAWs start: |
| • | Unvested Covered Fund Value is returned to Plan’s forfeiture account |
| • | Unvested Covered Fund Value: 0.50% x $60,000 = $30,000 |
| • | Note: Covered Fund Value is reduced by 50% |
| • | Benefit Base is adjusted proportionately to Covered Fund Value reduction: |
| • | Benefit Base Adjustment: 0.50% x $100,000 = $50,000 |
| • | Note: New Benefit Base is $50,000 |
| • | GAWs start based on new Benefit Base: |
| • | GAW = 5% x $50,000 = $2,500 |
Lump Sum Distribution Option
At any time during the GAW Phase, if the GLWB Participant is receiving Installments more frequently than annually, the GLWB Participant may elect to take a lump sum Distribution up to the remaining scheduled amount of the GAW for that year.
Numerical Example of Lump Sum Distribution
Assume the following:
GAW = $4,800 with a monthly distribution of $400
Three monthly Installments have been made (3 x $400 = $1,200)
Remaining GAW = GAW– paid Installments to date = $4,800 - $1,200 = $3,600
So, a Lump Sum Distribution of $3,600 may be taken.
Suspending and Re-Commencing Installments After a Lump Sum Distribution
It is the GLWB Participant's responsibility to Request the suspension of the remaining Installments that are scheduled to be paid during the year until the next Ratchet Date and to re-establish Installments upon the next Ratchet Date, if applicable. If the GLWB Participant chooses not to suspend the remaining Installments for the year, an Excess Withdrawal may occur. See“Effect of Excess Withdrawals During the GAW Phase,” described below.
After receiving a Lump Sum Distribution and suspending Installments, the GLWB Participant must notify Great-West that the GLWB Participant wishes to recommence Installment payments for the next year. Great-West must receive notice 30 calendar days before the next Ratchet Date that the GLWB Participant wishes to recommence payments; otherwise, Great-West will not make any Installments. The Ratchet Date will not change if Installments are suspended.
Optional Resets of the GAW% During the GAW Phase
The GLWB Participant may Request, on an annual basis, a Reset of the GAW% during the GAW Phase at least thirty (30) calendar days prior to the Ratchet Date.
16
If requested, Great-West will multiply the Covered Fund Value as of the Ratchet Date by the GAW% (based on the GLWB Participant's, or the younger joint Covered Person’s, Attained Age on the Ratchet Date) and determine if it is higher than the current Benefit Base multiplied by the current applicable GAW%. If so, the current GAW% will change to the Attained Age GAW% and the Benefit Base will change to the current Covered Fund Value as of the Ratchet Date. If it does not, the Reset shall be void but a Ratchet may still occur. If the Reset takes effect, it will be effective on the Ratchet Date as the Ratchet Date does not change due to Reset.
| If | (Attained Age GAW%) x (Covered Fund Value as of Ratchet Date)is greater than (Current GAW%) x (Current Benefit Base) |
| Then | (Attained Age GAW%) x (Covered Fund Value as of Ratchet Date)becomes new GAW and (Covered Fund Value) = (New Benefit Base) |
Numerical Example When Reset is Beneficial
Assume the following:
Age at Initial Installment Date: 60
Attained Age: 70
Covered Fund Value = $120,000
Current Benefit Base = $125,000
Current GAW% before Ratchet Date: 4%
Attained Age GAW% after Ratchet Date: 6%
(Current GAW%) x (Current Benefit Base) = 4% x $125,000 = $5,000
(Attained Age GAW%) x (Covered Fund Value) = 6% x $120,000 = $7,200
So, New GAW Amount is $7,200
New Benefit Base is $120,000
New GAW% is 6%
Numerical Example When Reset is NOT Beneficial
Assume the following:
Age at Initial Installment Date: 60
Attained Age: 70
Covered Fund Value = $75,000
Current Benefit Base = $125,000
Current GAW% before Ratchet: 4%
Attained Age GAW% after Ratchet Date: 6%
(Current GAW %) x (Current Benefit Base) = 4% x $125,000 = $5,000
(Attained age withdrawal %) x (Covered Fund Value) = 6% x $75,000 = $4,500
So, because $4,500 is less than current GAW of $5,000, no Reset occurs.
Effect of Excess Withdrawals During the GAW Phase
After the Initial Installment Date, a Distribution or Transfer, including a Transfer from one Covered Fund to another, that is greater than the GAW will be considered an Excess Withdrawal. The Benefit Base will be adjusted by the ratio of the new Covered Fund Value (after the Excess Withdrawal) to the previous Covered Fund Value (after the GAW).
If an Excess Withdrawal occurs, the GAW and current Benefit Base will be adjusted on the next Ratchet Date. When the Benefit Base is greater than the Covered Fund Value, an Excess Withdrawal may reduce your future benefits by more than the dollar amount of the Excess Withdrawal.
17
Numerical Example Effect of Excess Withdrawals During the GAW Phase
Assume the following:
Covered Fund Valuebefore GAW = $55,000
Benefit Base = $100,000
GAW%: 5%
GAW Amount = $100,000 x 5% = $5,000
Total annual withdrawal: $10,000
So,
Excess Withdrawal = $10,000– $5,000 = $5,000
Covered Fund Valueafter GAW = $55,000– $5,000 = $50,000
Covered Fund Valueafter Excess Withdrawal = $50,000– $5,000 = $45,000
Covered Fund Value Adjustment due to Excess Withdrawal = $45,000/$50,000 = 0.90
Adjusted Benefit Base = $100,000 x 0.90 = $90,000
Adjusted GAW Amount (assuming no Benefit Base increase on succeeding Ratchet Date) = $90,000 x 5% = $4,500
Withdrawals taken during the GAW Phase to meet required minimum distribution requirements, in the proportion of the GLWB Participant’s Covered Fund Value to the GLWB Participant’s overall Account balance (and not taking into account any other retirement balances of the GLWB Participant), will be deemed to be within the contract limits for the GLWB Participant and will not be treated as Excess Withdrawals. The required minimum distribution shall not exceed the required minimum distribution amount calculated under the Code and regulations issued thereunder as in effect on the Election Date. In the event of a dispute about the required minimum distribution amount, our determination will govern.
Note: The Contract does not require us to warn the GLWB Participant or provide the GLWB Participant with notice regarding potentially adverse consequences that may be associated with any withdrawals or other types of transactions involving the GLWB Participant’s Covered Fund. The GLWB Participant should carefully monitor the GLWB Participant’s Covered Fund, any withdrawals from the GLWB Participant’s Covered Fund, and any changes to the GLWB Participant’s Benefit Base. The GLWB Participant’s may contact us at 1-866-317-6586 for information about the GLWB Participant’s Benefit Base.
Death During the GAW Phase
If the GLWB Participant Dies After the Initial Installment Date as a Sole Covered Person.
If the GLWB Participant dies after the Initial Installment date without a joint Covered Person, the GLWB will terminate and no further Installments will be paid. The remaining Covered Fund Value shall be distributed in accordance with the Code and the terms of the Retirement Plan and the Account in which the Covered Funds are held. If permitted by the Retirement Plan and the Code, the GLWB Participant’s Beneficiary may elect to become the GLWB Participant in which event an initial Benefit Base shall be established and he or she will be subject to all terms and conditions of the Contract and the Code. This will be a new Election Date. Any election made by the Beneficiary is irrevocable.
If the GLWB Participant Dies After the Initial Installment Date while Joint Covered Person is Living.
Upon the GLWB Participant’s death after the Initial Installment Date, and while the joint Covered Person is still living, the joint Covered Person/Beneficiary will continue to receive GAW Installments based on the GLWB Participant’s original election until his or her death, if permitted by the Retirement Plan and the Code. Installments may continue to be paid to the surviving Covered Person based on the GAW% for joint Covered Persons as described above.
After the joint Covered Person’s death, the GLWB will terminate, no further Installments will be paid, and any remaining Covered Fund Value will be distributed in accordance with the Code and the terms of the Retirement Plan and the Contract. Alternatively, he or she may elect to receive his or her portion of the Covered Fund Value on the date of death as a lump sum Distribution or can separately elect to become an Owner and will be subject to all terms and conditions of the Certificate, the Contract, the Retirement Plan, and the Code. If the surviving Covered Person elects to separately become an Owner, the date of the election will be the new Ratchet Date.
Any election made by the Beneficiary is irrevocable.
18
THE SETTLEMENT PHASE
The Settlement Phase begins when the Covered Fund Value has reduced to zero as a result of negative Covered Fund performance, the Guarantee Benefit Fee, certain other fees that are not directly associated with the Contract (e.g., custodian fees or advisory fees), and/or GAWs, but the Benefit Base is still positive. It is also important to understand that the Settlement Phase is the first time that we use our own money to make Installments to the GLWB Participant. During the GAW Phase, the GAWs are made first from the GLWB Participant’s own investment.
Installments continue for the GLWB Participant’s life under the terms of the Contract, but all other rights and benefits under the Contract will terminate. Installments will continue in the same frequency as previously elected, and cannot be changed during the Settlement Phase. Distributions and Transfers are not permitted during the Settlement Phase.
During the Settlement Phase, the Guarantee Benefit Fee will not be deducted from the Installments.
When the last Covered Person dies during the Settlement Phase, the GLWB will terminate and no Installments will be paid to the Beneficiary.
EXAMPLES OF HOW THE GLWB WORKS
A note about the examples:
| • | All Contract Contributions are assumed to be at the end of the year and occur immediately before the next Ratchet Date. |
| • | All withdrawals are assumed to be at the beginning of the year and occur on the Ratchet Date. |
| • | All GLWB Participants are assumed to be fully vested. |
| • | All positive investment performance of the Covered Fund is assumed to be net of investment management fees. |
| • | In all of the examples, the GLWB Participant has access to his Covered Fund Value until it is depleted: |
| • | If the GLWB Participant dies before the Covered Fund Value is depleted, the remaining Covered Fund Value would be available to beneficiaries. |
| • | If the GLWB Participant needs to take a withdrawal in excess of the GLWB Participant’s GAW, the GLWB Participant may take up to the Covered Fund Value, which will be considered an Excess Withdrawal. |
Example 1– Basic: Assume the GLWB Participant buys the GLWB at age 65 and starts taking GAWs in annual Installments immediately. Also, assume that the Covered Fund Value (net of investment management fees) decreases by 10% in the first two years and increases by 5% every year thereafter.
Details:
| • | Sole Covered Person |
| • | Initial Covered Fund Value: $500,000 |
| • | GAW Percent: 5% |
| • | GAW Amount: $500,000 x 5% = $25,000 |
| • | Guarantee Benefit Fee: 0.90% |
| • | Changes in Covered Fund Value (net of investment management fees): |
| • | Year 1: -10%, Year 2: -10%, Years 3+: 5% |
Result:
| • | The GLWB Participant annually withdraws $25,000 from the GLWB Participant’s Covered Fund until about age 87 when the Covered Fund is depleted: |
| • | At age 87 the GLWB Participant’s Covered Fund Value is $9,474. |
| • | The GLWB Participant withdraws the $9,474 which depletes the Covered Fund and the GLWB Participant is now in Settlement Phase. |
| • | We provide the remaining $15,526 necessary to make the Installment of $25,000. |
| • | We continue to pay Installments of $25,000 each year for the GLWB Participant’s life. |
19
Illustration:
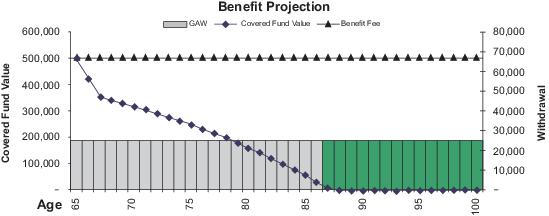
Example 2– Ratchet: Assume the GLWB Participant buys the GLWB at age 55 and starts taking GAWs in annual Installments at age 65. Also, assume that the Covered Fund Value (net of investment management fees) increases by 5% in years 1 through 7, decreases by 10% in years 8 through 11, and increases by 5% thereafter.
Details:
| • | Sole Covered Person |
| • | Initial Covered Fund Value: $500,000 |
| • | GAW Percent: 5% |
| • | Guarantee Benefit Fee: 0.90% |
| • | Changes in Covered Fund Value (net of investment management fees): |
| • | Years 1 through 7: 5%, Years 8 through 11: -10%, Years 12+: 5% |
Result:
| • | Positive Covered Fund performance through year 7 results in a Covered Fund Value of $662,407 on the Ratchet Date. |
| • | The GLWB Participant’s Benefit Base Ratchets to $662,407. |
| • | Covered Fund Value at the beginning of year 10 is $468,552, but GAWs are based on the Benefit Base, which is $662,407. |
| • | GAWs are $662,407 x 5% = $33,120. |
| • | The GLWB Participant annually withdraws $33,120 from the GLWB Participant’s Covered Fund until about age 81 when the Covered Fund is depleted: |
| • | At age 81, the GLWB Participant’s Covered Fund Value is $13,326. |
| • | The GLWB Participant withdraws the $13,326 which depletes the Covered Fund and the GLWB Participant is now in Settlement Phase. We provide the remaining $19,794 necessary to make the Installment $33,120. |
| • | We continue to pay Installments of $33,120 each year for the GLWB Participant’s life. |
20
Illustration:
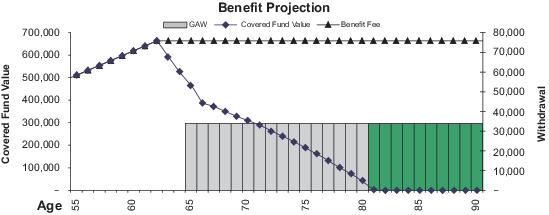
Example 3– Additional Contract Contributions: Assume the GLWB Participant buys the GLWB at age 55 and the GLWB Participant makes annual Contributions of $2,500 until the GLWB Participant starts taking GAWs in annual Installments at age 65. Also, assume that the Covered Fund Value (net of investment management fees) decreases by 5% in years 1 through 10 and increases by 5% thereafter.
Details :
| • | Sole Covered Person |
| • | Initial Covered Fund Value: $500,000 |
| • | Additional Annual Contract Contributions until GAWs Begin: $2,500 |
| • | GAW Percent: 5% |
| • | Guarantee Benefit Fee: 0.90% |
| • | Changes in Covered Fund Value (net of investment management fees): |
| • | Years 1 through 10: -5%, Years 11+: 5% |
Result:
| • | Poor Covered Fund performance in years 1 through 10 results in a Covered Fund Value of $291,493 at the end of year 10. |
| • | The GLWB Participant’s Benefit Base at the end of year 10 is $525,000 as a result of the additional Contract Contributions in years 1 through 10. |
| • | GAWs are $525,000 x 5% = $26,250. |
| • | The GLWB Participant annually withdraws $26,250 from the GLWB Participant’s Covered Fund until about age 79 when the Covered Fund is depleted: |
| • | At age 79, the GLWB Participant’s Covered Fund Value is $8,316. |
| • | The GLWB Participant withdraws the $8,316 which depletes the Covered Fund and the GLWB Participant is now in Settlement Phase. We provide the remaining $17,934 necessary to make the Installment $26,250. |
| • | We continue to pay Installments of $26,250 each year for the GLWB Participant’s life. |
21
Illustration:
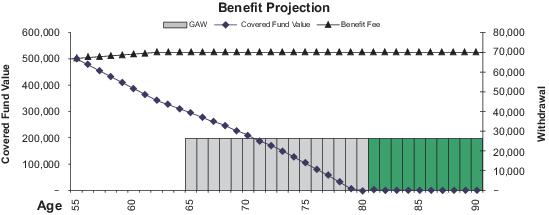
GUARANTEE BENEFIT FEE
After the GLWB Participant purchases the GLWB, the GLWB Participant is required to pay the Guarantee Benefit Fee. The Guarantee Benefit Fee is set forth in the Contract, and is based on the dollar amount of the GLWB Participant’s Covered Fund Value (which may be the same as, higher than, or lower than, the Benefit Base due to factors that affect the Covered Fund Value between Ratchet Dates, such as Covered Fund performance). The Guarantee Benefit Fee will be deducted monthly as a separate charge from the GLWB Participant’s Covered Fund and will be paid by redeeming the number of fund shares of the GLWB Participant’s Covered Fund(s) equal to the Guarantee Benefit Fee.
Pursuant to the terms of the GLWB, we will collect the fee from the custodian on a monthly basis in arrears. We reserve the right to change the frequency of the deduction, but will notify the Plan Sponsor and the GLWB Participant in writing at least thirty (30) days prior to the change. Because the Benefit Base may not exceed $5,000,000, we will not charge the Guarantee Benefit Fee on an amount of the GLWB Participant’s Covered Fund Value that exceeds $5,000,000.
Currently the Guarantee Benefit Fee is 0.90% and is subject to a minimum of 0.70% and a maximum of 1.50%. This is the guaranteed maximum or minimum Guarantee Benefit Fee we can ever charge for the GLWB. We may change the current fee within this minimum and maximum range at any time upon thirty (30) days written notice to the Plan Sponsor and the GLWB Participant. We determine the Guarantee Benefit Fee based on observations of a number of experience factors, including, but not limited to, interest rates, volatility, investment returns, expenses, mortality, and lapse rates. We reserve the right to change the Guarantee Benefit Fee at our discretion and for any reason, whether or not these experience factors change (although we will never increase the fee above the maximum or decrease the fee below the minimum). We do not need any particular event to occur before we may change the Guarantee Benefit Fee.
The Guarantee Benefit Fee is in addition to any charges that are imposed in connection with advisory, custodial, and other services, and charges imposed by the mutual funds in which the GLWB Participant invests.
At the time we calculate the Guarantee Benefit Fee, the Covered Fund Value may be less than the Benefit Base:
Example of how the Guarantee Benefit Fee is Computed (Covered Fund Value is Less Than Benefit Base)
Date: 1/31
Covered Fund Value = $100,000
Benefit Base = $125,000
Guarantee Benefit Fee = 0.90% x Covered Fund Value / 12
Guarantee Benefit Fee = 0.90% x $100,000 / 12 = $75.00
At the time we calculate the Guarantee Benefit Fee, the Covered Fund Value may be greater than the Benefit Base:
Example of how the Guarantee Benefit Fee is Computed (Covered Fund Value is Greater Than Benefit Base)
Date: 1/31
Covered Fund Value = $130,000
Benefit Base = $125,000
Guarantee Benefit Fee = 0.90% x Covered Fund Value / 12
22
Guarantee Benefit Fee = 0.90% x $130,000 / 12 = $97.50
The Guarantee Benefit Fee compensates us for the costs and risks we assume for providing the GLWB (including marketing, administration, and profit).
If we do not receive the Guarantee Benefit Fee (except during Settlement Phase), including as a result of the failure of the Retirement Plan custodian to submit it to us, the Contract will terminate as of the date that the fee is due.
Will a GLWB Participant pay the same amount (in dollars) for the Withdrawal Guarantee every month?
Example 1: Declining Covered Fund Value results in declining Guarantee Benefit Fee
Date: 1/31
Covered Fund Value = $100,000
Benefit Base = $125,000
Guarantee Benefit Fee = 0.90% x Covered Fund Value / 12
Guarantee Benefit Fee = 0.90% x$100,000 / 12 = $75.00
Date: 2/28
Covered Fund Value = $90,000
Benefit Base = $125,000
Guarantee Benefit Fee = 0.90% x Covered Fund Value / 12
Guarantee Benefit Fee = 0.90% x$90,000 / 12 = $67.50
Note: in this example, the Guarantee Benefit Fee declined because the Covered Fund Value declined. This could be the result of negative Covered Fund performance.
Example 2: Increasing Covered Fund Value results in increasing Guarantee Benefit Fee
Date: 1/31
Covered Fund Value = $100,000
Benefit Base = $125,000
Guarantee Benefit Fee = 0.90% x Covered Fund Value / 12
Guarantee Benefit Fee = 0.90% x$100,000 / 12 = $75.00
Date: 2/28
Covered Fund Value = $120,000
Benefit Base = $125,000
Guarantee Benefit Fee = 0.90% x Covered Fund Value / 12
Guarantee Benefit Fee = 0.90% x$120,000 / 12 = $90.00
Note: in this example, the Guarantee Benefit Fee increased because the Covered Fund Value increased. This could be the result of several factors including positive Covered Fund performance, Transfers, or Contract Contributions.
DIVORCE PROVISIONS UNDER THE CONTRACT
In the event of a divorce whose decree affects the GLWB, we will require written notice of the divorce in a manner acceptable to us and a copy of the applicable Qualified Domestic Relations Order (“QDRO”). A QDRO is a domestic relations order that creates or recognizes the existence of an Alternate Payee’s right to receive all or a portion of the benefits payable with respect to a GLWB Participant. A QDRO may also assign an Alternate Payee the right to receive these benefits.
Depending on which phase the GLWB is in when we receive the QDRO, the benefits of the GLWB will be altered to comply with the QDRO. The Alternate Payee under the QDRO may make certain elections during the Accumulation or GAW Phases. Any elections made by the Alternate Payee are irrevocable to the extent that an Alternate Payee becomes a GLWB Participant, he or she will be subject to all terms and conditions of the Certificate, the Contract, the Retirement Plan and the Code.
During the Accumulation Phase
Great-West will make payments to the Alternate Payee and/or establish an Account on behalf of the Alternate Payee named in a QDRO approved during the Accumulation Phase. The Alternate Payee is responsible for submitting a Request to begin Distributions in accordance with the Code.
23
If the Alternate Payee is the GLWB Participant’s spouse during the Accumulation Phase, he or she may elect to become a GLWB Participant, either by:
| (i) | maintaining the current proportionate Benefit Base of the previous GLWB Participant; or |
| (ii) | establishing a new Benefit Base based on the current Covered Fund Value on the date his or her Account is established and he or she will continue as a GLWB Participant. |
If the Alternate Payee elects to maintain the current Benefit Base, the Benefit Base and the Covered Fund Value will be divided between the GLWB Participant and the Alternate Payee. The Covered Fund Value will be divided pursuant to the terms of the QDRO. The Benefit Base will be divided in the same proportion as the Covered Fund Value.
In either situation, the Alternate Payee’s Election Date shall be the date the Account is established.
A non-spouse Alternate Payee cannot elect to maintain the current Benefit Base, or proportionate share, but may elect to establish a new GLWB. The Benefit Base and Election Date will be based on the current Covered Fund Value on the date his or her Account is established. Any election made by an Alternate Payee described in this section is irrevocable.
During the GAW Phase
Great-West will make payment to the Alternate Payee and/or establish an Account on behalf of the Alternate Payee named in a QDRO approved during the GAW Phase. The Alternate Payee is responsible for submitting a Request to begin Distributions in accordance with the Code.
If there is a Sole Covered Person
Pursuant to the instructions in the QDRO, the Benefit Base and GAW will be divided in the same proportion as their respective Covered Fund Values as of the effective date of the QDRO. The GLWB Participant may continue to receive the proportional GAWs after the accounts are split. If the Alternate Payee is the GLWB Participant’s spouse, he or she may elect to receive his or her portion of the Covered Fund Value as a lump sum Distribution or can separately elect to become a GLWB Participant.
If there are two Covered Persons
Pursuant to the instructions in the QDRO, the Benefit Base and GAW will be divided in the same proportion as their respective Covered Fund Values as of the effective date of the QDRO. The GLWB Participant may continue to receive the proportional GAWs after the accounts are split, based on the amounts calculated pursuant to the joint Covered Person GAW%.
If the Alternate Payee is the GLWB Participant’s spouse, he or she may elect to receive his or her portion of the Covered Fund Value as a lump sum Distribution or can separately elect to continue proportionate GAWs in the GAW Phase based on the amounts calculated pursuant to the joint Covered Persons GAW%, described in the “GAW Phase –Calculation of Installment,” after the accounts are split. A new Ratchet Date will be established for the Alternate Payee on the date the Accounts are split. Within thirty (30) days of each person’s Ratchet Date, the GLWB Participant and Alternate Payee can each elect a Reset based on the person’s own Attained Age GAW% for joint Covered Persons.
In the alternative, the Alternate Payee may establish a new GLWB in the Accumulation Phase with the Benefit Base based on the current Covered Fund Value on the date his or her Account is established.
During the Settlement Phase
If a Request in connection with a QDRO is approved during the Settlement Phase, Great-West will divide the Installment pursuant to the terms of the QDRO. Installments will continue pursuant to the lives of each payee.
EFFECT OF ANNUITIZATION
If the Code and the Retirement Plan permit and the GLWB Participant elects to annuitize, prior to the Initial Installment Date, the GLWB will terminate for those Covered Fund assets and the Guarantee Benefit Fee will not be refunded. If, based upon information provided by the Contract Owner, the GLWB Participant is entitled to a Distribution under the applicable terms and provisions of the Retirement Plan and the Code, all or a portion of the Account may be applied to an annuity payment option selected by the GLWB Participant, so long as the requirements of the Code and the Retirement Plan are met. Thereafter, the GLWB shall no longer be applicable with respect to amounts in the annuity payment option.
24
The amount to be applied to an annuity payment option is: (i) the portion of the vested Account value elected by GLWB Participant, less (ii) Applicable Tax, if any, less (iii) any fees and charges described in the Contract. The minimum amount that may be applied under the elected annuity option is $5,000. If any payments to be made under the elected annuity payment option will be less than $50, Great-West may make the payments in the most frequent interval that produces a payment of at least $50.
Great-West will issue a certificate or other statement setting forth in substance the benefits, rights, and privileges to which such person is entitled under the Contract, to each Annuitant describing the benefits payable under the elected annuity payment option.
Election of Annuity Options
An Annuitant is required to elect an annuity payment option. The Annuitant must Request an annuity payment option or change an annuity payment option no later than 30 days prior to the Annuity Commencement Date elected by the GLWB Participant.
To the extent available under the Code and the Retirement Plan, the annuity payment options are:
| • | Income for Single Life Only |
| • | Income for Single Life with Guaranteed Period |
| • | Income for Joint Life Only |
| • | Income for Joint Life with Guaranteed Period |
| • | Income for a Specific Period |
| • | Any other form of annuity payment permitted under the Retirement Plan, if acceptable to Great-West. |
The annuity option that will always be available is the Income for Single Life Only Annuity. If this annuity option is elected, Great-West will make payments to the Annuitant at a frequency specified in the annuity certificate or other statement for the duration of the Annuitant’s lifetime. Payments will cease pursuant to the terms of the certificate or other statement.
Annuity purchase rates will be the same rates that are available for a Single Premium Immediate Annuity currently offered by Great-West at the time of annuitization.
TERMINATION OF THE CONTRACT
Either Great-West or the Plan Sponsor may terminate the Contract with advance written notice to the other party. The Contract termination date shall be the seventy-fifth (75th) or next Business Day after the date written notice is received in the Administrative Offices in good order. Prior to the Contract termination date, Great-West and the Plan Sponsor may agree to an alternate Contract termination date.
If the Plan Sponsor Terminates the Contract
Under the terms of the Contract, the Plan Sponsor may terminate the Contract. In this event, all benefits, rights, and privileges provided by the Contract shall terminate. We will not refund the Guarantee Benefit Fee upon termination of the Contract. If the Plan Sponsor terminates the Contract, the Plan Sponsor may not apply for a new contract until ninety (90) calendar days after the date of the most recent Contract termination. In the event of termination, the GLWB Participant may choose to utilize the Covered Fund Value in the following ways:
If the GLWB Participant is eligible to receive Distributions under the Retirement Plan:
| (a) | the GLWB Participant may elect a direct rollover of the Covered Fund Value to an IRA that offers a Great-West approved GLWB feature, if available. In this situation, the Benefit Base and GAW, if applicable, will be retained as of the date of Distribution from the Covered Fund(s) and will apply to the new GLWB feature. |
| (b) | the GLWB Participant may choose to transfer the Covered Fund Value to any investment vehicle that does not offer a GLWB feature or to an investment vehicle that offers a GLWB feature, but does not permit the GLWB Participant to apply the Benefit Base and GAW to such feature. In this situation, the Benefit Base and GAW, if applicable, will be reduced to zero as of the date of the Distribution from the Covered Fund(s). |
If the GLWB Participantdoes not elect or is not eligible to receive a Distribution:
The Covered Fund Value will be liquidated and invested pursuant to the terms of the Retirement Plan. This liquidation will cause the Benefit Base and the Covered Fund Value to be reduced to zero and any and all other benefits provided under the Contract and GLWB shall terminate on the Contract termination date.
25
For GLWB Participants that have reached the Settlement Phase on or before the date of the termination of the Contract, Installments will continue for as long as the GLWB Participant shall live.
If Great-West Terminates the Contract
If Great-West terminates the Contract, such termination will not adversely affect the GLWB Participant’s rights under the Contract, except that additional Contributions may not be invested in the Covered Fund(s) other than reinvested dividends and capital gains. The GLWB Participant will still be obligated to pay the Guarantee Benefit Fee.
Other Termination
In addition, if the Plan Sponsor terminates the Retirement Plan or moves the Retirement Plan to a provider that does not offer the Contract, the Contract will terminate. We will not refund the Guarantee Benefit Fee upon termination of the Contract.
MISCELLANEOUS PROVISIONS
Periodic Communications to GLWB Participants
Account statements will be provided to GLWB Participants periodically by the Plan Sponsor, or its designated third party.
Amendments to the Contract
The Contract and Certificate may be amended to conform to changes in applicable law or interpretations of applicable law, or to accommodate design changes. Amendments (if any) to accommodate design changes will be applicable only with respect to purchasers of new Contracts, unless the Company reasonably determines the change would be favorable for all existing Contract Owners. Changes in the Contract may need to be approved by the state insurance departments. The consent of the Contract Owner to an amendment will be obtained to the extent required by law.
Assignment
The interests of the Plan Sponsor in the Contract may not be transferred, sold, assigned, pledged, charged, encumbered, or, in any way, alienated. The interests of the GLWB Participant in the GLWB may not be transferred, sold, assigned, pledged, charged, encumbered, or, in any way, alienated.
Cancellation
The GLWB Participant can cancel GLWB by causing the Covered Fund Value or the Benefit Base to be reduced to zero prior to the Settlement Phase due to one or more Excess Withdrawals or by failing to pay the Guarantee Benefit Fee.
Misstatements
We may require adequate proof of the age and death of the Annuitant, GLWB Participant or Covered Person(s) before processing a Request for GAWs and annuity payments. If the age of the Annuitant, GLWB Participant or Covered Person(s) has been misstated, the Installment or annuity payment established for him or her will be made on the basis or his or her correct age.
Any correction required due to misstatements may be corrected by Great-West, including increasing or decreasing future payments, in accordance with applicable law.
FINANCIAL CONDITION OF THE COMPANY
Many financial services companies, including insurance companies, have faced challenges in this low interest rate environment, and we are not immune to those challenges. We know it is important for you to understand how these or similar events may affect our ability to meet guarantees that may be provided under the Contract. The Contract is not a separate account product, which means that no assets are set aside in a segregated or “separate” account to satisfy all obligations under the Contracts. Installments during Settlement Phase (if any) will be paid from our general account and, therefore, are subject to our claims paying ability. We issue other types of insurance policies and financial products as well, such as group variable annuities offered through retirement plans, term and universal life insurance, funding agreements, funding agreements backing notes and guaranteed investment contracts (“GICs”), and we also pay our obligations under these products from our assets in the general account. In the event of an insolvency or receivership, payments we make from our general account to satisfy claims under the Contract would generally receive the same priority as our other policyholder obligations.
26
As an insurance company, we are required by state insurance regulation to hold a specified amount of reserves in order to meet all the contractual obligations of our general account to our contract owners. In order to meet our claims-paying obligations, we regularly monitor our reserves to ensure we hold sufficient amounts to cover actual or expected contract and claims payments. In addition, we actively hedge our investments in our general account. However, it is important to note that there is no guarantee that we will always be able to meet our claims paying obligations, and that there are risks to purchasing any insurance product.
State insurance regulators also require insurance companies to maintain a minimum amount of capital, which acts as a cushion in the event that the insurer suffers a financial impairment, based on the inherent risks in the insurer’s operations. These risks include those associated with losses that we may incur as the result of defaults on the payment of interest or principal on our general account assets, which include bonds, mortgages, general real estate investments, and stocks, as well as the loss in value of these investments resulting from a loss in their market value.
Additional information regarding the Company, its business, senior management, and financial condition, is presented below in “Additional Information Regarding the Company.” We encourage both existing and prospective Contract Owners and GLWB Participants to read and understand our audited financial statements, which are included in this prospectus in “Appendix A – Company Financial Statements and Other Financial Information.” We prepare our audited financial statements on a statutory basis pursuant to laws and regulations promulgated by the Colorado Division of Insurance (this method of accounting is referred to herein as “Statutory” accounting). You may obtain a free copy of our financial statements for the most recent fiscal year by calling (800) 537-2033 or writing to the Administrative Office. In addition, our financial statements filed with this prospectus are available on the SEC’s website at www.sec.govand on our website at www.greatwest.com.
There is also information available on our website on ratings assigned to us by one or more independent rating organizations. These ratings are opinions of an operating insurance company’s financial capacity to meet the obligations of its insurance and annuity contracts based on its financial strength and/or claims-paying ability.
TAXATION OF THE CONTRACT AND GLWB
The following is a general discussion based on our interpretation of current United States federal income tax laws. This discussion does not address all possible circumstances that may be relevant to the tax treatment of a particular GLWB Participant. In general, this discussion does not address the tax treatment of transactions involving investment assets held in your Account except insofar as they may be affected by the holding of a GLWB. Further, it does not address the consequences, if any, of holding a GLWB under applicable federal estate tax laws or state and local income and inheritance tax laws. You should also be aware that the tax laws may change, possibly with retroactive effect. Prospective Contract Owners and GLWB Participants should consult their own tax advisors regarding the potential tax implications of purchasing a Contract or GLWB in light of their particular circumstances.
In General
The Contract is a novel and innovative instrument and, to date, its proper characterization and consequences for federal income tax purposes have not been directly addressed in any cases, administrative rulings or other published authorities.We can give no assurances that the Internal Revenue Service (“IRS”) will agree with our interpretations regarding the proper tax treatment of a Contract or GLWB or the effect (if any) of the purchase of a Contract or GLWB on the tax treatment of any transactions in your Account, or that a court will agree with our interpretations if the IRS challenges them. You should consult a tax advisor before purchasing a Contract or GLWB.
The following discussion generally applies to Contracts and GLWBs treated as annuity contracts maintained as part of a plan qualified under Section 403(b) of the Code.
Section 403(b) Contracts
Section 403(b) of the Code allow employees of certain Section 501(c)(3) organizations and public schools to exclude from their gross income the premium payments made, within certain limits, on a contract that will provide an annuity for the employee’s retirement. These premium payments may be subject to FICA (social security) tax. Distributions of (1) salary reduction contributions made in years beginning after December 31, 1988; (2) earnings on those contributions; and (3) earnings on amounts held as of the last year beginning before January 1, 1989, are not allowed prior to age 59 1⁄2, severance from employment, death or disability. Salary reduction contributions may also be distributed upon hardship, but would generally be subject to penalties.
A GLWB is available only with respect to the Account for which the Contract and Certificate are purchased.
27
| • | A GLWB is intended for purchase only by an employee participating in a Section 403(b) Retirement Plan. |
| • | We are not responsible for determining whether a GLWB complies with the terms and conditions of, or applicable law governing, the Retirement Plan. You are responsible for making that determination. Similarly, unless otherwise agreed, we are not responsible for administering any applicable tax or other legal requirements applicable to the Retirement Plan. The Plan Sponsor, the GLWB Participant or a service provider for the Retirement Plan is responsible for determining that distributions, beneficiary designations, investment restrictions, charges and other transactions under a GLWB are consistent with the terms and conditions of the Retirement Plan and applicable law. |
| • | Among other things, if the Retirement Plan is subject to the Employee Retirement Income Security Act of 1974, as amended (“ERISA”), you should consider how the GLWB will be treated under the ERISA qualified joint and survivor annuity and qualified pre-retirement survivor annuity rules and, if applicable, make provision for complying with those rules in the governing documents and procedures of the Retirement Plan. Guidance published by the Internal Revenue Service on February 21, 2012, may suggest that the GLWB will be treated as an annuity for purposes of those rules. |
| • | If the GLWB Participant’s spouse is a joint Covered Person, that spouse must be the GLWB Participant’s sole beneficiary under the Retirement Plan. |
| • | The GLWB Participant’s Account is subject to required minimum distribution rules. Withdrawals during the GAW Phase from the Covered Fund Value taken to meet required minimum distribution requirements, in the proportion of the GLWB Participant’s Covered Fund Value to the overall Account balance (and not taking into account any other retirement balances of the GLWB Participant), will be deemed to be within the contract limits for the GLWB and will not be treated as Excess Withdrawals. The required minimum distribution shall not exceed the required minimum distribution amount calculated under the Code and regulations issued thereunder as in effect on the Election Date. In the event of a dispute about the required minimum distribution amount, our determination will govern. In some circumstances, compliance with the minimum distribution rules may affect the amount and timing of Installments pursuant to the GLWB. |
| • | We generally are required to confirm, with the Plan Sponsor or otherwise, that surrenders or transfers requested by GLWB Participants comply with applicable tax requirements and to decline requests that are not in compliance. We will defer such payments requested by GLWB Participants until all information required under the tax law has been received. By requesting a surrender or transfer, a GLWB Participant consents to the sharing of confidential information about the GLWB Participant, the Contract and Certificate, and transactions under the Contract, the GLWB and any other 403(b) contracts or accounts the GLWB Participant has under the Retirement Plan among us, the employer or Plan Sponsor, any Plan administrator or recordkeeper, and other product providers. |
| • | The Retirement Plan can be terminated, or the availability of the GLWB under the Retirement Plan otherwise discontinued by persons other than the GLWB Participant. |
Numerous changes have been made to the income tax rules governing Section 403(b) contracts as a result of legislation enacted during the past several years, including rules with respect to: maximum contributions, required distributions, penalty taxes on early or insufficient distributions, and income tax withholding on distributions.
In the case of distributions from a Section 403(b) contract, including payments to a GLWB Participant from a GLWB, a ratable portion of the amount received is taxable, generally based on the ratio of the GLWB Participant’s cost basis (if any) to the GLWB Participant’s total accrued benefit under the Retirement Plan. Section 72(t) of the Code imposes a 10% penalty tax on the taxable portion of any distribution from Section 403(b) contract. To the extent amounts are not includable in gross income because they have been properly rolled over to an IRA or to another eligible qualified plan, no tax penalty will be imposed. The tax penalty also will not apply to: (a) distributions made on or after the date on which the GLWB Participant reaches age 59 1⁄2; (b) distributions following the GLWB Participant’s death or disability (for this purpose disability is as defined in Section 72(m)(7) of the Code); (c) distributions that are part of substantially equal periodic payments made not less frequently than annually for the GLWB Participant’s life (or life expectancy) or the joint lives (or joint life expectancies) of the GLWB Participant and a designated beneficiary; and (d) certain other distributions specified in the Code.
Generally, distributions from a Section 403(b) contract must commence no later than April 1 of the calendar year following the year in which the individual attains age 70 1⁄2 or, if later, retires from employment with the Section 403(b) plan sponsor. Required distributions must be over a period not exceeding the life expectancy of the individual or the joint lives or life expectancies of the individual and his or her designated beneficiary. Distribution requirements also apply to Section 403(b) contracts upon the death of the individual. If the required minimum distributions are not made, a 50% penalty tax is imposed as to the amount not distributed.
28
Distributions from Section 403(b) contracts generally are subject to withholding for the individual’s federal income tax liability, subject to the individual’s election not to have tax withheld. The withholding rate varies according to the type of distribution and the individual’s tax status.
“Eligible rollover distributions” from Section 403(b) contracts and certain other retirement plans are subject to a mandatory federal income tax withholding of 20%. An eligible rollover distribution is any distribution to an employee (or employee’ spouse or former spouse as beneficiary or alternate payee) from such a plan, except certain distributions such as distributions required by the Code, distributions in a specified annuity form, or hardship distributions. The 20% withholding does not apply, however, to nontaxable distributions or if (i) the employee (or employee’s spouse or former spouse as beneficiary or alternate payee) chooses a “direct rollover” from the plan to a tax qualified plan, IRA, Roth IRA or Section 403(b) contract or to a governmental 457 plan that agrees to separately account for rollover contributions; or (ii) non-spouse beneficiary chooses a “direct rollover” from the plan to an IRA established by the direct rollover.
The Certificate provides that upon your death, a surviving spouse may have certain continuation rights that he or she may elect to exercise for the Certificate’s death benefit and any joint-life coverage under the GLWB. All Certificate provisions relating to spousal continuation are available only to a person recognized as a spouse under federal law. The term, Spouse, does not include a party to a registered domestic partnership, civil union, or similar formal relationship recognized under state law that is not denominated a marriage under that state's law. Consult a tax adviser for more information on this subject.
Annuity purchases by nonresident aliens. The discussion above provides general information regarding U.S. federal income tax consequences to annuity purchasers that are U.S. citizens or residents. Purchasers that are not U.S. citizens or residents will generally be subject to U.S. federal withholding tax on taxable distributions from annuity contracts at a 30% rate, unless a lower treaty rate applies. In addition, such purchasers may be subject to state and/or municipal taxes and taxes that may be imposed by the purchaser’s country of citizenship or residence. Prospective purchasers are advised to consult with a qualified tax adviser regarding U.S., state, and foreign taxation with respect to an annuity contract purchase.
Seek Tax Advice. The above description of federal income tax consequences of the Section 403(b) contracts is only a brief summary meant to alert you to the issues and is not intended as tax advice. Anything less than full compliance with the applicable rules, all of which are subject to change, may have adverse tax consequences. Any person considering the purchase of a GLWB should first consult a qualified tax advisor.
SALES OF THE CONTRACTS
We have entered into an underwriting agreement with GWFS Equities for the distribution and sale of the Contracts. Pursuant to this agreement, GWFS Equities serves as principal underwriter for the Contracts, offering them on a continuous basis.
GWFS Equities is located at 8515 East Orchard Road, Greenwood Village, CO 80111. GWFS Equities will use its best efforts to sell the Contracts, but is not required to sell any specific number or dollar amount of Contracts.
GWFS Equities was organized as a corporation under the laws of the State of Delaware in 1984 and is an affiliate of ours. GWFS Equities is registered as a broker-dealer with the SEC under the Securities Exchange Act of 1934, as well as with the securities administrators in the states in which it operates, and is a member of the Financial Industry Regulatory Authority (“FINRA”).
GWFS Equities offers the Contracts through its registered representatives who are registered with FINRA and with the states in which they do business. More information about GWFS Equities and its registered representatives is available at www.finra.org or by calling 800-289-9999. You can also obtain an investor brochure from FINRA describing its Public Disclosure Program. Registered representatives with GWFS Equities are also licensed as insurance agents in the states in which they do business and are appointed with us.
GWFS Equities may also enter into selling agreements with unaffiliated broker-dealers to sell the Contracts. The registered representatives of these selling firms are registered with FINRA and with the states in which they do business, are licensed as insurance agents in the states in which they do business, and are appointed with us.
We do not pay commissions to GWFS Equities or to the unaffiliated broker-dealers in connection with the sale or solicitation of the Contracts. However, we may provide non-cash compensation in the form of training and education programs to registered representatives of GWFS Equities who sell the Contracts as well as registered representatives of unaffiliated broker-dealers. Registered representatives of GWFS Equities also sell other insurance products that we offer and may receive certain non-cash items, such as conferences, trips, prizes and awards under non-cash incentive compensation programs pertaining to those products. None of the items are directly attributable to the sale or solicitation of the Contracts. Such compensation will not be
29
conditioned upon achievement of a sales target. Finally, we and GWFS Equities may provide small gifts and occasional entertainment to registered representatives with GWFS Equities or other selling firms in circumstances in which such items are not preconditioned on achievement of sales targets.
At times, GWFS Equities may make other cash and non-cash payments to selling firms for expenses relating to the recruitment and training of personnel, periodic sales meetings, the production of promotional sales literature and similar expenses. These expenses may also relate to the synchronization of technology between the Company, GWFS Equities, and the selling firm in order to coordinate data for the sale and maintenance of the Contracts. The amount of other cash and non-cash compensation paid by GWFS Equities or its affiliated companies ranges significantly among the selling firms. GWFS Equities and its affiliates may receive payments from affiliates of the selling firms that are unrelated to the sale of the Contracts. Any amounts paid by GWFS Equities to a selling firm or by Great-West to a selling firm are derived from the general account assets of Great-West and are not deducted from the Guarantee Benefit Fee. The Guarantee Benefit Fee does not vary because of such payments to such selling firms.
Although the Company and GWFS Equities do not anticipate discontinuing offering the Contracts, we do reserve the right to discontinue offering the Contracts at any time.
ADDITIONAL INFORMATION REGARDING THE CONTRACT
Owner Questions
The obligations to Contract Owners and Covered Persons under the Contracts are ours. Please direct your questions and concerns to us at our Administrative Office.
Return Privilege
Within the free-look period, if applicable, (up to 30 days under applicable state law) after receiving the Contract, the Contract Owner may cancel it for any reason by delivering or mailing it postage prepaid to:
Great-West Life & Annuity Insurance Company
Annuity Administration
Annuity Administration
8515 East Orchard Road
Greenwood Village, CO 80111
If the Contract Owner cancels the Contract, the Contract will be void.
State Regulation
As a life insurance company organized and operated under the laws of the State of Colorado, we are subject to provisions governing life insurers and to regulation by the Colorado Commissioner of Insurance. Our books and accounts are subject to review and examination by the Colorado Division of Insurance.
Evidence of Death, Age, Gender, or Survival
We may require proof of the age, gender, death, or survival of any person or persons before acting on any applicable Contract provision.
LEGAL MATTERS REGARDING THE CONTRACT
Certain matters regarding the offering of the securities herein have been passed upon by the Chief Compliance Officer, internal counsel for the Company. Eversheds Sutherland (US) LLP has provided advice on certain matters relating to the application of federal securities laws to the Certificates.
Cyber Security Risks
Our variable annuity contract business is highly dependent upon the effective operation of our computer systems and those of our business partners, so that our business is potentially susceptible to operational and information security risks resulting from a cyber-attack. These risks include, among other things, the theft, misuse, corruption, and destruction of data maintained online or digitally, denial of service on our website and other operational disruption, and unauthorized release of confidential owner information. Cyber-attacks affecting us, the Portfolios, intermediaries and other affiliated or third-party service providers may
30
adversely affect us and your Annuity Account Value. For instance, cyber-attacks may interfere with our processing of Contract transactions, including the processing of Transfer Requests from our website or with the Portfolios, impact our ability to calculate accumulation unit values, cause the release and possible destruction of confidential owner or business information, impede order processing, subject us and/or our service providers and intermediaries to regulatory fines and financial losses and/or cause reputational damage. Cyber security risks may also impact the issuers of securities in which the Portfolios invest, which may cause the Portfolios underlying your Contract to lose value. There can be no assurance that we or the Portfolios or our service providers will avoid losses affecting your Contract due to cyber-attacks or information security breaches in the future.
Abandoned Property Requirements
Every state has unclaimed property laws that generally provide for escheatment to the state of unclaimed property (including proceeds of annuity contracts) under various circumstances. This “escheatment” is revocable, however, and the state is obligated to pay the applicable proceeds if the property owner steps forward to claim it with the proper documentation. To help prevent such escheatment, it is important that you keep your contact and other information on file with us up to date, including the names, contact information, and identifying information for owners, annuitants, beneficiaries, and other payees.
ADDITIONAL INFORMATION REGARDING THE COMPANY
Corporate Organization and Overview
Great-West Life & Annuity Insurance Company is a stock life insurance company that was originally organized under the laws of the State of Kansas as the National Interment Association. Our name was changed to Ranger National Life Insurance Company in 1963 and to Insuramerica Corporation prior to changing to our current name in 1982. In September of 1990, we re-domesticated under the laws of the State of Colorado. Our executive office is located at 8515 East Orchard Road, Greenwood Village, Colorado 80111.
The Company is a direct wholly-owned subsidiary of GWL&A Financial Inc. (“GWL&A Financial”), a Delaware holding company. GWL&A Financial is a direct wholly-owned subsidiary of Great-West Lifeco U.S. LLC. (“Lifeco U.S.”) and an indirect wholly-owned subsidiary of Great-West Lifeco Inc. (“Lifeco”), a Canadian holding company. Lifeco operates in the United States primarily through the Company and through Putnam Investments, LLC (“Putnam”), and in Canada and Europe through The Great-West Life Assurance Company (“Great-West Life”) and its subsidiaries, London Life Insurance Company (“London Life”), The Canada Life Assurance Company (“CLAC”), and Irish Life Group Limited. Lifeco is a subsidiary of Power Financial Corporation (“Power Financial”), a Canadian holding company with substantial interests in the financial services industry. Power Corporation of Canada (“Power Corporation”), a Canadian holding and management company, has voting control of Power Financial. The Desmarais Family Residuary Trust, through a group of private holding companies that it controls, has voting control of Power Corporation.
The shares of Lifeco, Power Financial, and Power Corporation are traded publicly in Canada on the Toronto Stock Exchange.
Business of the Company
The Company offers retirement plans and services, investment products, and annuities to individuals, businesses, and other private and public organizations throughout the United States, Puerto Rico, Guam, and the United States Virgin Islands. The Company is authorized to engage in the sale of life insurance, accident and health insurance and annuities. It is qualified to do business in all states in the United States, except New York, and in the District of Columbia, Puerto Rico, Guam and the U.S. Virgin Islands. The Company is also a licensed reinsurer in New York.
The Chief Operating Decision Maker (“CODM”) of the Company is also the Chief Executive Officer (“CEO”) of the Company and Lifeco U.S. The CODM reviews the financial information for the purposes of assessing performance and allocating resources based upon the results of Lifeco U.S. and other U.S. affiliates prepared in accordance with International Financial Reporting Standards. The CODM, in his capacity as CEO of the Company, reviews the Company’s financial information only in connection with the periodic reports that are filed with the Securities and Exchange Commission (“SEC”). Consequently, the Company does not provide its discrete financial information to the CODM to be regularly reviewed to make decisions about resources to be allocated or to assess performance. For purposes of SEC reporting requirements under a statutory basis of accounting, the Company has chosen to present its financial information in three segments, notwithstanding the above. The three segments are: Individual Markets, Empower Retirement, and Other.
Through its Empower Retirement segment, the Company provides various retirement plan products and investment options as well as comprehensive administrative and recordkeeping services for financial institutions and employers which include
31
educational, advisory, enrollment, and communication services for employer-sponsored defined contribution plans and associated defined benefit plans. Effective January 1, 2015, the retirement services businesses of the Company, the acquired J.P. Morgan Retirement Plan Services (“RPS”) and Putnam merged under the Empower Retirement brand, creating the second largest recordkeeping provider in the U.S.
Through its Individual Markets segment, the Company offers various forms of life insurance, annuity, and retirement products. On January 24, 2019, the Company announced that it had that it had entered into an agreement with Protective Life Insurance Company (“Protective”) to sell, via indemnity reinsurance, substantially all of its non-participating individual life insurance and annuity business and group life and health business, including the Contracts. Subject to the provision of certain services by the Company or its affiliates for a transitional period following the closing, Protective will agree to provide administration for the Contracts in accordance with their terms and conditions. The transaction is expected to close in the first half of 2019 subject to regulatory and customary closing conditions.
No customer accounted for 10% or more of the Company’s consolidated revenues during the years 2018, 2017, or 2016. In addition, no segment of the Company’s business is dependent upon a single customer or a few customers, the loss of which would have a significant effect on it or its business segments’ operations. The loss of business from any one, or a few, independent brokers or agents would not have a material adverse effect on the Company or its business segments.
Empower Retirement Segment Principal Products
Through its Empower Retirement segment, the Company provides various retirement plan products and investment options, as well as comprehensive administrative and recordkeeping services for financial institutions and employers, which include educational, advisory, enrollment, and communication services for employer-sponsored defined contribution plans and associated defined benefit plans under Internal Revenue Code Sections 401(a), 401(k), 403(b), 408, and 457. Defined contribution plans provide for benefits based upon the value of contributions to, and investment returns on, an individual’s account. This has been a rapidly growing portion of the retirement marketplace in recent years.
The retirement plan products and investment options offered by the Company include mutual funds and collective trusts, guaranteed interest rate investment products, and variable annuity products designed to meet the specific needs of the customer. In addition, the Company offers both customized annuity and non-annuity products.
IRAs—The Company offers an individual retirement account (“IRA”) product to the public and as a distribution option for employees terminated from employer-sponsored defined contribution plans. The Company earns asset-based fees and per account fees for providing administrative and recordkeeping services for IRA accounts. For those IRAs invested in mutual funds, the Company can be reimbursed by the mutual funds for marketing, sales, and service costs under various revenue sharing agreements.
Mutual funds and collective trusts - The Company earns administration fees under various revenue sharing agreements from mutual funds and collective trusts for marketing, sales, and service costs incurred while providing services to individuals and institutional clients on behalf of the funds. On proprietary collective trusts, the Company, through its wholly-owned subsidiary Great-West Trust Company, LLC (“Great-West Trust Company”), earns an asset-based management fee.
Guaranteed interest rate investment products - On its guaranteed interest rate investment products, the Company earns investment margins on the difference between the income earned on investments in its general account and the interest credited to the participant’s account balance. The Company’s general account assets support the guaranteed investment products. The Company also manages fixed interest rate products known as stable value funds that may be structured as separate accounts, pooled collective trusts, and custom collective trusts for which it is paid a management fee that is earned by the Company either directly or through its wholly-owned subsidiaries Great-West Capital Management, LLC (“Great-West Capital Management”) or Great-West Trust Company.
Variable annuity products - The Company’s variable annuity products provide the opportunity for clients to invest on a tax deferred basis with the ability to annuitize assets. Variable annuities can be made available with GLWB which guarantees that the client is able to take contractually specified withdrawals from their assets that will continue for life regardless of market performance or longevity. The Company earns fees from the separate account for mortality and expense risks pertaining to the variable annuity contract and/or for providing administrative services. For variable annuity assets invested in mutual funds, the Company is reimbursed by the mutual funds for marketing, sales, and service costs under various revenue sharing agreements. There are additional fees charged for election of guaranteed minimum benefits. The GLWB products may be available in variable annuity products or as a stand-alone contract.
32
Administrative and recordkeeping services - The Company receives asset-based and/or participant-based fees for providing third-party administrative and recordkeeping services to financial institutions and employer-sponsored retirement plans. The number of Empower Retirement participant accounts has grown to 8.8 million at December 31, 2018, from over 8.3 million at December 31, 2017.
The Company’s marketing focus is directed toward providing investment management, advisory services, and recordkeeping services under Internal Revenue Code Sections 401(a), 401(k), 403(b), 408, and 457 to private corporations, state and local governments, hospitals, non-profit organizations, and public school districts. Through the Company’s wholly-owned, registered subsidiaries, Great-West Capital Management, and Advised Assets Group, LLC (“Advised Assets Group”), the Company provides investment management and advisory services. Through the Company’s wholly-owned subsidiary FASCore, LLC, the Company targets and partners with other large financial institutions to provide third-party recordkeeping and administration services.
Certain revenues and expenses generated from the above products from the Empower Segment are represented in changes in value of investment in subsidiaries, as discussed further in the statutory financial statements attached.
Individual Markets Segment Principal Products
The Company’s Individual Markets segment distributes life insurance, annuity, and retirement products to both individuals and businesses through various distribution channels. Life insurance products in-force include participating and non-participating term life, whole life, universal life, and variable universal life.
Participating life insurance - Participating policyholders share in the financial results of the participating business in the form of policyholder dividends that reflect the difference between the assumptions used in the premium charged and the actual experience on those policies. The policyholder dividends can be distributed directly to the policyholders in the form of cash or through an increase in benefits such as paid-up additions. The Company no longer actively markets participating products.
Term life - Term life insurance products provide coverage for a stated period and generally do not include the accumulation of cash values. Term life insurance products pay a guaranteed death benefit only if the insured dies within the coverage period. The Company’s term life insurance earnings come from the difference between cumulative premiums collected and actual death claims.
Whole life - Whole life insurance products provide guaranteed death benefits in exchange for level premium payments for the life of the insured. Whole life insurance products include the accumulation of cash values. The policyholder can receive the accumulated cash value as a payment by surrendering the insurance policy before the death of the insured. The Company’s whole life insurance earnings come from investment income earned on assets held as reserve in the General Account and the difference between premiums collected and actual death claims.
Universal life - Universal life insurance products include a cash value component that is credited with interest at regular intervals. The account balances for the universal life products are held in the Company’s general account. The Company’s universal life insurance earnings result from the difference between the investment income and interest credited on customer cash values and from differences between charges for mortality and actual death claims. Universal life cash values are charged for the cost of insurance coverage and for administrative expenses.
Variable universal life - Variable universal life products provide insurance coverage on the same basis as universal life, except that the account balance is directed by the policyholder into either separate account investment options or into the Company’s general account as a fixed option within the variable product. In the separate account investment options, the policyholder bears the entire risk of the investment results. The Company’s variable universal life insurance earnings result from asset-based fees, as well as from the difference between fees collected for mortality as compared to actual death claims paid.
Variable annuity products - The Company’s variable annuity products provide the opportunity for clients to invest on a tax deferred basis with the ability to annuitize assets. Variable annuities can be made available with guaranteed minimum death benefit (“GMDB”) which guarantees the client’s beneficiaries will receive at least a return of premium (less the impact of withdrawals) upon death as well as a guaranteed lifetime withdrawal benefit (“GLWB”) which guarantees that the client is able to take contractually specified withdrawals from their assets that will continue for life regardless of market performance or longevity. The Company earns fees from the separate account for mortality and expense risks pertaining to the variable annuity contract and/or for providing administrative services. For variable annuity assets invested in mutual funds, the Company is reimbursed by the mutual funds for marketing, sales, and service costs under various revenue sharing agreements. There are
33
additional fees charged for election of guaranteed minimum benefits. The guaranteed minimum benefits may be available in variable annuity products or as a stand-alone contract.
Retention is an important factor in profitability and is encouraged through product features. For example, the Company’s life insurance and annuity contracts may impose a surrender charge on policyholder balances withdrawn within the first 10 years of the contract’s inception. The period of time and level of the surrender charge vary by product.
One of the principal markets for the Individual Markets segment is the executive benefits market. The primary executive benefits products are single premium universal life insurance, registered variable universal life insurance, private placement variable universal life insurance (“PPVUL”), and PPVUL with a stable value guarantee feature. These executive benefits life insurance policies indirectly fund employee post-retirement benefits and non-qualified benefit plans for executives.
Community and regional / national banks are the primary purchasers of single premium universal life insurance utilizing the general account and hybrid products. Regional / national banks sometimes buy PPVUL with a stable value guarantee. Corporations indirectly funding executive benefits purchase the registered variable universal life insurance and PPVUL product. The PPVUL products offer a wide array of equity and bond fund investment options.
Another principal market for the Individual Markets segment is the financial institutions market, which is a partnership between the Company and retail financial institutions to distribute individual life and annuity products. Through its institutional partners, the Company has in excess of 182,000 advisors who sell its products. During 2018 and 2017, the Company focused on the needs of the retiree marketplace by providing wealth transfer solutions to its bank partner’s customers via a single premium universal life product and meeting the retirement income needs via its variable annuity products including guaranteed benefits. Additionally, the Company continues its efforts to partner with large financial institutions to provide individual term life insurance.
Future Policy Benefit Liabilities and Life Insurance In-Force
The amount of fixed annuity products in-force is measured by future policy benefits. The following table shows group and individual annuity policy benefits supported by the Company’s general account as well as the annuity balances in Empower Retirement and Individual Markets separate accounts for the years indicated:
| (In millions) | |||
| Year Ended December 31, | General Account Annuity Benefits Liabilities | Empower Retirement Annuity Separate Accounts | Individual Markets Annuity Separate Accounts |
| 2018 | $12,948 | $14,763 | $3,009 |
| 2017 | $12,556 | $18,729 | $2,577 |
| 2016 | $12,279 | $19,157 | $1,957 |
| 2015 | $11,309 | $19,340 | $1,660 |
| 2014 | $10,890 | $20,220 | $1,581 |
For Variable Annuities, the future policy benefit liabilities are computed on the basis of prescribed Statutory valuation interest rates and other assumptions as required by Statutory Valuation Law. For all other annuities policy benefit liabilities are established at the contract holder’s account value, which is equal to cumulative deposits and credited interest, less withdrawals, mortality and certain other charges.
The general account also has immediate annuities. The policy benefit liabilities for the immediate annuities are computed on the basis of prescribed Statutory valuation interest rates and mortality (where payouts are contingent on survivorship). These assumptions generally vary by plan, year of issue, and policy duration. Policy benefit liabilities for immediate annuities without life contingent payouts are computed on the basis prescribed Statutory valuation interest rates.
The following table summarizes Individual Markets life insurance future policy benefits liabilities, Individual Markets life insurance separate account balances, and Individual Markets life insurance in-force prior to reinsurance ceded for the years indicated:
34
| (In millions) | |||
| Year Ended December 31, | Individual Markets Life Insurance Future Policy Benefits Liabilities | Individual Markets Life Insurance Separate Accounts | Individual Markets Life Insurance In-force |
| 2018 | $14,554 | $6,304 | $98,202 |
| 2017 | $14,031 | $6,215 | $97,801 |
| 2016 | $13,397 | $5,771 | $96,711 |
| 2015 | $13,245 | $5,479 | $97,862 |
| 2014 | $12,712 | $5,308 | $97,170 |
For both the Individual Markets life insurance future policy benefits liabilities and life insurance separate accounts, the future policy benefits are computed on the basis of prescribed Statutory valuation interest rates and mortality. These future policy benefits liabilities are calculated as the present value of future benefits (including dividends) less the present value of future net premiums, subject to a cash surrender value floor. The assumptions used in calculating the future policy benefits liabilities generally vary by plan, year of issue, and policy duration.
Additionally, for both the Individual Markets life insurance future policy benefits liabilities and life insurance separate accounts, policy and contract claim liabilities are established for claims that have been incurred but not reported based on factors derived from past experience.
The aforementioned policy benefit liabilities are computed amounts that, with additions from premiums and deposits to be received and with interest on such liabilities, are expected to be sufficient to meet the Company’s policy obligations (such as paying expected death or retirement benefits or surrender requests) and to generate profits.
Method of Distribution of Products Within the Empower Retirement and Individual Markets Segments
The Empower Retirement segment distributes products to plan sponsors through a subsidiary, GWFS Equities, Inc. (“GWFS Equities”), as well as through brokers, consultants, advisors, third-party administrators, and banks. It markets IRAs as a distribution option for employees terminated from employer-sponsored defined contribution plans through its Retirement Solutions Group, which includes a retail sales force. Recordkeeping and administrative services are distributed through institutional clients.
The Individual Markets segment distributes individual life insurance through wholesale and retail sales force, banks, broker-dealers, and investment advisors. Executive benefits products are distributed through wholesalers and specialized consultants.
Competition Within the Empower Retirement and Individual Markets Segments
The retirement plan services, life insurance, and investment marketplaces are highly competitive. The Company’s competitors include insurance companies, banks, investment advisors, mutual fund companies, and certain service and professional organizations. No individual competitor or small group of competitors is dominant. Competition focuses on name recognition, service, technology, cost, variety of investment options, investment performance, product features, and price, in addition to financial strength as indicated by ratings issued by nationally recognized agencies.
Empower Retirement Outlook
As the second largest recordkeeping provider in the U.S., Empower Retirement is positioned for significant growth opportunities with expertise and diversification across all plan types, company sizes and market segments. The Company continually examines opportunities to structure products and develop strategies to stimulate growth in assets under management.
In 2019, Empower Retirement’s strategies to drive sales growth will continue to include active marketing of the brand, investing in product differentiation and offering a best-in-class service model. In 2018, service enhancements were made to this model including standardizing and improving client-facing tools, optimizing advisor relationship management and client alignment as well as adopting best practices for participant communications. In 2019, investments will continue to be made to improve the customer web experiences. This includes Empower Retirement's unique, interactive web-based experience which was launched to help participants understand their retirement income needs. These efforts are expected to increase customer retention and ultimately increase participant retirement savings.
35
The Company will continue to pursue operational efficiencies. Great West Global Business Services India Private Limited (“Great West Global”), an indirect wholly-owned subsidiary of Lifeco U.S. in India, which launched in 2015 and has over 1,000 professionals based in India, will continue to expand with a focus on driving lower unit costs.
Individual Markets Outlook
On January 24, 2019, the Company announced that it had entered into an agreement with Protective Life Insurance Company (“Protective”) to sell, via indemnity reinsurance, substantially all of its non-participating individual life insurance and annuity business and group life and health business. The transaction is in its initial stage, and is expected to close in the first half of 2019 subject to regulatory and customary closing conditions. On the closing date of the proposed transaction, the Company will transfer to Protective assets equal to the statutory liabilities being reinsured and will receive a ceding commission (subject to post-closing adjustments) from Protective in consideration of the transferred business. The Company will retain a small block of participating life insurance policies which will be administered by Protective Life following the close of the transaction.
Post-transaction, the Company will focus on the defined contribution retirement and asset management markets in the U.S.
Other Segment
The Company’s Other reporting segment is substantially comprised of activity not directly allocated to the other operating segments and interest expense on long-term debt.
Reinsurance
The Company enters into reinsurance transactions as a purchaser of reinsurance for its various insurance products and as a provider of reinsurance for some insurance products. Reinsurance transactions are assumed from and ceded to affiliated entities and third parties. When purchasing reinsurance, the Company seeks to limit its exposure to loss on any single insured and to recover a portion of benefits paid by ceding risks to other insurance enterprises under excess coverage, quota share, yearly renewable term, coinsurance, and modified coinsurance contracts. Under the terms of these contracts, the reinsurer agrees to reimburse the Company for the ceded amount in the event a claim is paid. However, the Company remains liable to its policyholders with respect to the ceded insurance if a reinsurer fails to meet the obligations it assumed. Accordingly, the Company strives to cede risks to highly rated, well-capitalized companies. The Company retains an initial maximum of $3.5 million of coverage per individual life. This initial retention limit of $3.5 million may increase due to automatic policy increases in coverage at a maximum rate of $175 thousand per annum, with an overall maximum increase in coverage of $1.0 million. The Company assumes risk from approximately 40 insurers and reinsurers by participating in yearly renewable term and coinsurance pool agreements. When assuming risk, the Company seeks to generate revenue while maintaining reciprocal working relationships with these partners as they also seek to limit their exposure to loss on any single life. Maximum capacity to be accepted or retained by the Company is dictated at the treaty level and is monitored annually to ensure the total risk acquired or retained on any one life is limited to a maximum retention of $4.5 million.
Investment Operations
The Company’s investment division manages and administers the investments of its general and separate accounts in support of the cash and liquidity requirements of its insurance and investment products.
The Company’s principal general account investments are in bonds and mortgage loans, all of which are exposed to three primary sources of investment risk: credit, interest rate, and market valuation. Total investments at December 31, 2018, of $55 billion were comprised of general account investment assets of $30 billion and separate account assets of $25 billion. Total investments at December 31, 2017, of $57 billion were comprised of general account investment assets of $29 billion and separate account assets of $28 billion.
The Company’s general account investments are in a broad range of asset classes, but consist primarily of domestic bonds. Bonds include public and privately placed corporate bonds, government bonds, and mortgage-backed and asset-backed securities. The Company’s mortgage loans are comprised primarily of domestic commercial collateralized loans diversified with regard to geographical markets and commercial mortgage property types.
The Company manages the characteristics of its investment assets, such as liquidity, currency, yield, and duration, to reflect the underlying characteristics of related insurance and policyholder liabilities that vary among its principal product lines. The Company observes strict asset and liability matching guidelines designed to ensure that the investment portfolio will
36
appropriately meet the cash flow requirements of its liabilities. The Company uses derivative financial instruments for risk management purposes associated with certain invested assets and policy liabilities, not for speculative purposes.
The Company routinely monitors and evaluates the status of its investments in light of current economic conditions, trends in capital markets, and other factors. These other factors include investment size, quality, concentration by issuer and industry, and other diversification considerations relevant to the Company’s bonds.
The Company reduces credit risk for the portfolio as a whole by investing primarily in investment grade bonds. At December 31, 2018, and 2017, 99% of the Company’s bond portfolio were designated as investment grade.
Employees
The Company had approximately 6,200 and 5,800 employees at December 31, 2018, and 2017, respectively.
Company Properties
The Company’s corporate office facility is comprised of an 886,000 square foot complex located in Greenwood Village, Colorado. The Company owns its corporate office facilities which are occupied by all of the Company’s segments. The Company also leases approximately 432,000 square feet of sales and administrative offices throughout the United States. At December 31, 2018, the Company leased approximately 188,000 square feet of the complex to CIGNA for a lease period expiring on March 31, 2019. Management believes that the Company’s properties are suitable and adequate for its current and anticipated business operations.
Legal Proceedings Involving the Company
From time to time, the Company may be threatened with, or named as a defendant in, lawsuits, arbitrations, and administrative claims. Any such claims that are decided against the Company could harm the Company’s business. The Company is also subject to periodic regulatory audits and inspections which could result in fines or other disciplinary actions. Unfavorable outcomes in such matters may result in a material impact on the Company's financial position, results of operations, or cash flows.
The Company is defending lawsuits relating to the costs and features of certain retirement or fund products. Management believes the claims are without merit and will defend these actions. Based on the information known, these actions will not have a material adverse effect on the consolidated financial position of the Company.
The Company is involved in other various legal proceedings that arise in the ordinary course of its business. In the opinion of management, after consultation with counsel, the likelihood of loss from the resolution of these proceedings is remote and/or the estimated loss is not expected to have a material effect on the Company’s consolidated financial position, results of its operations, or cash flows.
37
Directors and Executive Officers of the Company
Identification of Directors
| Director | Age | From | Principal Occupation(s) for Last Five Years | |||
| John L. Bernbach(5)(6) | 75 | 2006 | CEO of The Bernbach Group since July 2015; previously Vice Chairman, Engine | |||
| Robin Bienfait(1)(2)(3)(7) | 59 | 2018 | CEO of Emnovate since 2016; previously Executive Vice President and Chief Enterprise Innovation Officer of Samsung Electronics | |||
| Marcel Coutu(1)(2)(4)(6)(7) | 65 | 2014 | Corporate Director | |||
| André Desmarais(1)(2)(4)(6)(7)(8) | 62 | 1997 | Deputy Chairman, President and Co-Chief Executive Officer, Power Corporation; Executive Co-Chairman, Power Financial Corporation | |||
| Paul Desmarais, Jr.(1)(2)(4)(6)(7)(8) | 64 | 1991 | Chairman and Co-Chief Executive Officer, Power Corporation; Executive Co-Chairman, Power Financial Corporation | |||
| Gary A. Doer(1)(2)(6)(7) | 70 | 2016 | Senior Business Advisor, Dentons Canada LLP since August 2016; previously Canada’s Ambassador to the United States | |||
| Gregory J. Fleming(1)(2)(7) | 56 | 2016 | Chief Executive Officer, Rockefeller Capital Management since October 2017; previously Corporate Director since October 2015; previously President of Morgan Stanley Investment Management | |||
| Claude Généreux(1)(2)(4)(7) | 56 | 2015 | Executive Vice President, Power Corporation and Power Financial Corporation | |||
| Alain Louvel(3)(5) | 73 | 2006 | Corporate Director | |||
| Paula B. Madoff(1)(2)(3)(7) | 51 | 2018 | Advisory Director, Goldman Sachs since August 2017; previously Partner and Head of Sales and Distribution for Interest Rate Products and Mortgage, Goldman Sachs | |||
| Paul A. Mahon(1)(2)(4) | 55 | 2013 | President and Chief Executive Officer, Lifeco, Great-West Life, CLAC and London Life | |||
| R. Jeffrey Orr(1)(2)(4)(6)(7) | 60 | 2005 | Chairman of the Board of the Company; Chairman of the Board of Lifeco, Great-West Life, CLAC and London Life; President and Chief Executive Officer, Power Financial Corporation | |||
| Robert L. Reynolds(1) | 67 | 2014 | President and Chief Executive Officer since May 2014; President and Chief Executive Officer of Putnam Investments, LLC | |||
| T. Timothy Ryan, Jr.(1)(2)(4)(6)(7) | 73 | 2009 | Corporate Director since May 2014; previously Vice Chairman of Regulatory Affairs at JP Morgan Chase | |||
| Jerome J. Selitto(1)(2)(7) | 77 | 2012 | President, Avex Funding Corporation since April 2015; previously Chief Executive Officer of PHH Corporation | |||
| Gregory D. Tretiak(1)(2)(3)(7) | 63 | 2012 | Executive Vice President and Chief Financial Officer, Power Corporation | |||
| Brian E. Walsh(1)(2)(4)(6)(7) | 65 | 1995 | Partner and Chief Strategist, Titan Advisors, LLC since July, 2015; previously Chairman and Chief Investment Officer, Saguenay Strathmore Capital, LLC |
| (1) | Member of the Executive Committee. |
| (2) | Member of the Investment and Credit Committee. |
| (3) | Member of the Audit Committee. |
| (4) | Member of the Human Resources Committee. |
| (5) | Member of the Conduct Review Committee. |
| (6) | Member of the Governance and Nominating Committee. |
| (7) | Member of the Risk Committee. |
| (8) | Mr. André Desmarais and Mr. Paul Desmarais, Jr. are brothers. |
Unless otherwise indicated, all of the directors have been engaged for not less than five years in their present principal occupations or in another executive capacity with the companies or firms identified.
The appointments of directors are confirmed annually.
38
The following is a list of directorships currently held or formerly held within the five previous years by the directors of the Company, on companies whose securities are traded publicly in the United States or that are investment companies registered under the Investment Company Act of 1940.
| Director | Current Directorships | Former Directorships and Dates |
| John L. Bernbach | Omnicare, Inc. March 2013– August 2015 | |
| Robin Bienfait | Mitsubishi UFJ Financial Group | |
| Marcel Coutu | Brookfield Asset Management Inc. Enbridge Inc. | Canadian Oil Sands Limited September 2001– December 2014 |
| André Desmarais | CITIC Pacific Limited December 1997– May 2014 | |
| Paul Desmarais, Jr. | Total S.A. May 2002- May 2017 Lafarge S.A. January 2008– July 2015 | |
| Gary Doer | Barrick Gold | |
| Alain Louvel | Worldpoint Terminals, LP May 2008– September 2017 | |
| Paula Madoff | KKR Real Estate Finance Trust | |
| R. Jeffrey Orr | PanAgora Asset Management, Inc. | |
| Jerome Selitto | Better Mortgage | PHH Corporation October 2009– January 2012 |
| T. Timothy Ryan, Jr. | Santander Holdings USA, Inc. | Markit June 2013– October 2014 |
| Gregory D. Tretiak | PanAgora Asset Management, Inc. |
The Company’s Governance and Nominating Committee (the “Nominating Committee”) is charged with recommending to the Board of Directors the qualifications for Directors, including among other things, the competencies, skills, experience and level of commitment required to fulfill Board responsibilities and the personal qualities that should be sought in candidates for Board membership. The Nominating Committee’s duties include identifying and recommending Director candidates to the Board based on a consideration of the competencies and skills that the Board considers appropriate for the Board as a whole to possess, the competencies and skills that the Board considers each existing Director to possess and that each new nominee will bring to the Board, and the appropriate level of representation on the Board by Directors who are independent of management and who are neither officers nor employees of any of the Company’s affiliates.
The Board of Directors has reviewed the qualifications and backgrounds of the members of the Audit Committee and determined that, although no one member of the Audit Committee is an “audit committee financial expert” within the meaning of the Rules under the Securities Exchange Act of 1934, the combined qualifications and experience of the members of the Audit Committee give the Committee collectively the financial expertise necessary to discharge its responsibilities.
The Company’s Directors are elected on an annual basis by the Company’s sole shareholder, GWL&A Financial.
The Company’s Directors are identified below along with an indication of their experience, qualifications, attributes and skills, which leads the Company to believe that they are qualified to serve on the Board of Directors.
John L. Bernbach
Mr. Bernbach is CEO of The Bernbach Group, a business consulting firm. Prior to July 2015, Mr. Bernbach served as Vice Chairman of Engine, one of the largest privately-owned independent marketing services companies, which he joined in January 2010. He was also a co-founder of NTM (Not Traditional Media) Inc., a marketing and media advisory firm created in 2003 to work with clients and media companies to develop strategies integrating nontraditional marketing solutions and new media models. Prior to that, Mr. Bernbach, as CEO of The Bernbach Group, LLC, led this executive management consulting business concentrating on corporate and communications strategies. From 1995 to 2000, Mr. Bernbach served as Director and then CEO and Chairman of North American Television, which produced and distributed news and entertainment programming. In 1994, Mr. Bernbach launched the publication of luxury goods magazines in China, Japan, France and Spain. Prior to 1994, Mr. Bernbach spent 22 years at the advertising firm Doyle Dane Bernbach, the last eight as President/COO of DDB Needham Worldwide. In
39
1986, he was one of five founders of Omnicon, which at that time was the largest marketing services and communications groups in the world. Mr. Bernbach currently serves on the Boards of Putnam, Power Pacific Corporation Limited, Casita Maria, Ai Media Group LLC, Distillier LLC and as an advisor to Mr. Stephen A. Schwarzman, Chairman & CEO of The Blackstone Group.
Robin Bienfait
Robin Bienfait was the Chief Enterprise Innovation Officer and senior advisor for Samsung. Robin joined Samsung with 30 years of experience in mobility, security, business development, enterprise sales, wireless network operations and engineering. As a global entrepreneur, Robin launched Samsung Business Services and advised on the B2B investment strategy. Now as CEO for Emnovate, Robin is advising and providing leadership to emerging businesses. Prior to Samsung, Robin served as chief information officer for BlackBerry, where she led the enterprise business unit and software development team, end to end product security, tier 3 technical customer service, global network services, corporate security and corporate IT. Robin held senior leadership positions across AT&T including Bell Labs, Global Network Services/GNOC, business continuity and disaster recovery, and compliance. As an officer at AT&T, Robin’s last role was leading of global network services and chief compliance officer, environment, health and safety. A global influencer holding 15 patents, she is the recipient of several awards and was recently named as one of the top 100 CIO’s in STEM and Inc.’s top 18 women to watch in 2018. Ms. Bienfait has been a director of the company since June 2018 and is also a director of Putnam.
Marcel Coutu
Mr. Coutu is the former Chairman of Syncrude Canada Ltd., largest Canadian oil sands project and is past President and Chief Executive Officer of Canadian Oil Sands Limited an oil and gas company. He was previously Senior Vice-President and Chief Financial Officer of Gulf Canada Resources Limited, and prior to that held various positions in the areas of corporate finance, investment banking, and mining and oil and gas exploration and development. Mr. Coutu is a Director of Lifeco, Great-West Life, London Life, CLAC and Putnam. He is also a Director of Power Corporation, IGM Financial Inc. (“IGM”), IG Wealth Management, Mackenzie Inc. (“Mackenzie”), Brookfield Asset Management Inc., Enbridge Inc. and the Calgary Exhibition and Stampede Board. He has also held board positions with Gulf Indonesia Resources Limited, TransCanada Power Limited Partnership and the board of governors of the Canadian Association of Petroleum Producers.
Mr. Coutu is a former member of the Association of Professional Engineers, Geologists and Geophysicists of Alberta. He has also held board positions with Gulf Indonesia Resources Limited, TransCanada Power Limited Partnership and the board of governors of the Canadian Association of Petroleum Producers.
André Desmarais
Mr. Desmarais is Deputy Chairman, President and Co-Chief Executive Officer of Power and Executive Co-Chairman of Power Financial. Prior to joining Power in 1983, he was Special Assistant to the Minister of Justice of Canada and an institutional investment counselor at Richardson Greenshields Securities Ltd. He has held a number of senior positions with Power group companies and was named President and Co-Chief Executive Officer of Power in 1996. Mr. Desmarais is a director of many Power group companies in North America, including Power, Power Financial, Lifeco, Great-West Life, London Life, CLAC, Putnam, IGM, IG Wealth Management and Mackenzie Inc. He is also a director and Vice-Chairman of Pargesa Holding SA in Europe. Mr. Desmarais is Honorary Chairman of the Canada China Business Council and is a member of several China-based organizations. Mr. Desmarais is active in cultural, health and other not-for-profit organizations. He is an Officer of the Order of Canada and an Officer of the National Order of Québec. He has received Doctorates Honoris Causa from Concordia University, Université de Montréal and McGill University. Mr. Desmarais is a trustee of the Desmarais Family Residuary Trust.
Paul Desmarais, Jr.
Mr. Desmarais is Chairman and Co-Chief Executive Officer of Power and Executive Co-Chairman of Power Financial. He joined Power in 1981 and assumed the position of Vice-President the following year. He served as Vice-President of Power Financial from 1984 to 1986, as President and Chief Operating Officer from 1986 to 1989, as Executive Vice-Chairman from 1989 to 1990, as Executive Chairman of the board from 1990 to 2005, as Chairman of the Executive Committee from 2006 to 2008 and as Executive Co-Chairman from 2008 until today. He also served as Vice-Chairman of Power from 1991 to 1996. He was named Chairman and Co-Chief Executive Officer of Power in 1996. From 1982 to 1990, he was a member of the Management Committee of Pargesa Holding SA; in 1991, he became Executive Vice-Chairman and then Executive Chairman of the Committee; in 2003, he was appointed Co-Chief Executive Officer; and, in 2013, was named Chairman of the board. He has been a director of Pargesa Holding SA since 1992. He is a director of many Power group companies in North America, including Power, Power Financial, Lifeco, Great-West Life, London Life, CLAC, Putnam, IGM, IG Wealth Management and Mackenzie Inc. In Europe, he is Vice-Chairman of the board of Groupe Bruxelles Lambert and a director of LafargeHolcim Ltd. and SGS SA. He was Vice-Chairman of the board
40
and a director of Imerys until 2008 and a director of GDF Suez until 2014 and Total SA until 2017. Mr. Desmarais is past Chairman and a member of the board of directors of The Business Council of Canada. He is also active on a number of philanthropic advisory councils. In 2005, he was named an Officer of the Order of Canada, in 2009, an Officer of the National Order of Québec and, in 2012, Chevalier de la Légion d’honneur in France. He has received a number of honorary doctorates. Mr. Desmarais is a trustee of the Desmarais Family Residuary Trust.
Gary A. Doer
Mr. Doer has served as a Senior Business Advisor at Dentons Canada LLP, a global law firm, since August, 2016. He previously served as Canada’s Ambassador to the United States from October, 2009 to January, 2016. He was the Premier of Manitoba from 1999 to 2009, and served in a number of positions as a member of the Legislative Assembly of Manitoba from 1986 to 2009, including Minister of Urban Affairs from 1986 to 1988 and Minister of Crown Investments from 1987 to 1988. Mr. Doer is a director of Lifeco, Great-West Life, London Life, CLAC, and Putnam. He is also a director of Power, Power Financial, IGM, IG Wealth Management, Mackenzie Inc. and Air Canada. He previously served as a director of Barrick Gold Corporation. In 2017, Mr. Doer joined the Trilateral Commission as a member of the North American Group. He is a volunteer Co-Chair of the Wilson Centre’s Canada Institute, a non-partisan public policy forum focused on Canada-U.S. relations. Mr. Doer received a distinguished diplomatic service award from the World Affairs Council in 2011 and was inducted into the Order of Manitoba in 2010.
Gregory J. Fleming
Gregory J. Fleming is the founding Chief Executive Officer of Rockefeller Capital Management. He has spent more than 30 years in the financial services industry and has developed a track record of transforming businesses, engendering trust among institutional and individual clients and creating value for colleagues and shareholders. Mr. Fleming assumed the role of CEO of Rockefeller Capital Management in March 2018. The firm is born from the former Rockefeller & Co. and combines wealth management, family office, and asset management with a strategic advisory capability. Mr. Fleming is a shareholder and member of the Board of Directors of Rockefeller Capital Management. Prior to leading Rockefeller Capital Management, Mr. Fleming was the President of Morgan Stanley Wealth Management and Morgan Stanley Investment Management. He served in these roles for 6 years and oversaw the transformation of both businesses. Before joining Morgan Stanley in 2010, he served as President and Chief Operating Officer of Merrill Lynch from 2007 to 2009, and previously ran Merrill Lynch’s Global Investment Banking business. During the course of his career, he has helped clients navigate some of the most complex situations in the most challenging market environments. Mr. Fleming joined Merrill Lynch as an investment banker in 1992. He had also been a principal at Booz Allen Hamilton. Mr. Fleming is a former director of Colgate University; a member of the Board of Advisors for the Yale Law School Center for the Study of Corporate Law, the Council on Foreign Relations and the Economic Club of New York; a director on Turn2 Foundation Board; a trustee at Deerfield Academy; and a member of the Ronald McDonald House Board of Directors. He also serves as an Advisory Director on the board of the Florida Marlins and serves on the Advisory Board of COVR, an innovative financial services startup. He frequently serves as a Visiting Lecturer in Law and a Distinguished Visiting Fellow at the Center for the Study of Corporate Law at Yale Law School. He is a Phi Beta Kappa, summa cum laude graduate in economics from Colgate University and received his J.D. from Yale Law School. Mr. Fleming is also a director of Putnam.
Claude Généreux
Mr. Généreux is Executive Vice-President of Power Corporation and Power Financial, positions he has held since March, 2015. He is Senior Partner Emeritus of McKinsey & Company (“McKinsey”), a global management consulting firm. During his 28 years at McKinsey, Mr. Généreux focused on serving leading global companies in financial services, resources and energy. He held various leadership positions including Global Sector Leadership in energy, Office Leadership in Montreal, Global Personal Committees for partner election and evaluation, and Global Recruiting for Advanced University Degrees candidates. He has been posted in Montreal, Paris, Toronto and Stockholm. Mr. Généreux is a Director of Lifeco, Great-West Life, London Life, CLAC and Putnam. He is also a Director of IGM, IG Wealth Management and Mackenzie. Mr. Généreux is the Vice-Chair of the Board of Governors at McGill University and serves on the Boards of the Jeanne Sauvé Foundation, the Loran Scholars Foundation, Michaëlle Jean Foundation and the Rhodes Scholarships in Canada. He graduated from McGill University and Oxford University where he studied as a Rhodes Scholar.
Alain Louvel
After receiving an MBA from Columbia University, and a masters in Economics and Political Sciences from the Paris University, Mr. Louvel began his professional career in 1970 as an advisor to the Department of Industry and Trade of the Quebec Government. In 1972, he joined Bank Paribas (“Paribas”) and for the next 33 years held various executive positions with Paribas in France, Canada and the United States. He completed his banking career as the Head of Risk Management for the Americas of BNP Paribas, with overall responsibilities over credit, market, counterparty and operational risk. Mr. Louvel serves as a Director of
41
Putnam and Mountain Asset Management. He is also a Honorary Trustee of the French Institute Alliance Francaise and a French Foreign Trade Counselor. Mr. Louvel is a permanent resident of the United States with dual French and Canadian citizenship.
Paula B. Madoff
Ms. Madoff, Corporate Director, has served as an Advisory Director at Goldman Sachs, a global investment banking, securities and investment management firm, since August, 2017. She spent 24 years at Goldman Sachs where she most recently was a Partner and Head of Sales and Distribution for Interest Rate Products and Mortgages from 2006 until her retirement in 2017. Ms. Madoff also held several additional leadership positions at Goldman Sachs including Co-Chair of the Retirement Committee overseeing 401k and pension plan assets, Chief Executive Officer of Goldman Sachs Mitsui Marine Derivatives Products, L.P., and was a member of its Securities Division Operating Committee and Firmwide New Activity Committee. She has 30 years of experience in investing, risk management and capital markets activities. Ms. Madoff is a director of Lifeco, London Life, CLAC and Putnam. She also serves as a director of KKR Real Estate Finance Trust Inc. and ICE Benchmark Administration, where she is also Chair of the ICE LIBOR Oversight Committee. Ms. Madoff is a 2018 David Rockefeller Fellow, a member of the Harvard Business School Alumni Board and Women’s Leadership Board, a director of Hudson River Park Friends and an advisory board member of the NYU Hospital Child Study Center. She received a Masters in Business Administration from Harvard Business School and a Bachelor of Arts degree in Economics from Lafayette College.
Paul A. Mahon
Mr. Mahon is President and Chief Executive Officer of Lifeco, Great-West Life, London Life and CLAC, a position he has held since May, 2013. Prior to that he was President and Chief Operating Officer, Canada of Lifeco, Great-West Life, London Life and CLAC. Mr. Mahon has been with Great-West Life since 1986, and is a Director of Lifeco, Great-West Life, London Life, CLAC and Putnam. He is also a director and past Chair of the board of the Canadian Life and Health Insurance Association and a member of the Canadian Council of Chief Executives, Business Council of Canada, Misericordia Health Centre Corporation and United Way Resource Development Committee. Mr. Mahon previously served as a director of the CancerCare Manitoba Foundation.
R. Jeffrey Orr
Mr. Orr has been Chair of the Boards of Lifeco, Great-West Life, London Life and CLAC since May, 2013, and Chairman of the Board of the Company since July, 2013, and of Putnam since June, 2008. He is also President and Chief Executive Officer of Power Financial, a position he has held since May, 2005. From May, 2001 until May, 2005, Mr. Orr was President and Chief Executive Officer of IGM. Prior to joining IGM, he was Chairman and Chief Executive Officer of BMO Nesbitt Burns Inc. and Vice-Chairman, Investment Banking Group, Bank of Montreal. Mr. Orr is a director of Great-West Life, London Life, CLAC, Putnam and PanAgora Asset Management, Inc. He is also a director and Chair of IGM, IG Wealth Management and Mackenzie Inc., and a director of Power and Power Financial. Mr. Orr is active in a number of community and business organizations.
Robert L. Reynolds
Mr. Reynolds served as President and Chief Executive Officer of the Company from May 2014 through January 2019. He provides leadership and strategic direction for the company's Empower Retirement, Great-West Financial and Great-West Investments business. In addition, Mr. Reynolds serves as President and Chief Executive Officer and director of Great-West Lifeco U.S. LLC. He serves as President and Chief Executive Officer of Putnam since 2008 and is a director of Putnam. Mr. Reynolds has more than 30 years of financial services and investments experience. Before joining Putnam, he spent 24 years at Fidelity Investments, serving as vice chairman and chief operating officer from 2000 to 2007. Among many awards and recognitions, Reynolds received a Lifetime Achievement Award from PLANSPONSOR magazine in 2005 for his contributions to the retirement services industry and was awarded a President's Medal of Excellence from Boston College. He earned a bachelor's degree in business administration/finance from West Virginia University, from which he also received an honorary doctorate in business administration and a Distinguished Alumni Award. Mr. Reynolds serves on the executive committee of the Massachusetts High Technology Council board. Mr. Reynolds serves on the boards of several nonprofits, including West Virginia University Foundation, Concord Museum, Dana-Farber Cancer Institute and the U.S. Ski and Snowboard Team Foundation. He is chairman of the Boston Advisory Board of American Ireland Fund and a member of the Chief Executives Club of Boston and the Council on Competitiveness.
T. Timothy Ryan, Jr.
Mr. Ryan served as a Vice-Chairman of Regulatory Affairs at JPMorgan Chase, a global financial services firm, from 2013 to 2014. Prior to joining JPMorgan, he was President and Chief Executive Officer of the Securities and Financial Markets Association (“SIFMA”) from 2008 to 2013. He is a director of Lifeco, Great-West Life, London Life, CLAC, Putnam, Power Corporation and
42
Power Financial. He previously served as a director of the Company from May 2010 to May 2013. Mr. Ryan is also non-executive Chairman of the Board of Directors of Santander Holdings USA, Inc., Santander Bank, N.A. and Banco Santander International. He previously served as a Director of Markit Ltd. and Lloyds Banking Group plc. He was a private sector member of the Global Markets Advisory Committee for the National Intelligence Council from 2007 to 2011. Mr. Ryan is a graduate of Villanova University and the American University Law School.
Jerome J. Selitto
Mr. Selitto is the President of Better Mortgage Corporation (previously Avex Funding Corporation), a technology focused mortgage lender, a position he has held since April, 2015. Mr. Selitto served as a director and as the President and Chief Executive Officer of PHH Corporation (“PHH”), a provider of mortgage lending and servicing solutions, from October, 2009 to January, 2012. Prior to joining PHH, Mr. Selitto worked at Ellie Mae, Inc. (“Ellie Mae”), a provider of enterprise solutions for the residential mortgage industry. While at Ellie Mae, Mr. Selitto initially served as a senior consultant beginning in 2007 and, later in 2007 through 2009, as Executive Vice-President, Lender Division. He has over 40 years of experience in the mortgage industry and in capital markets. Mr. Selitto is a director of Lifeco, Great-West Life, London Life, CLAC and Putnam. He holds a Bachelor of Science degree in Economics and Marketing from the University of South Florida.
Gregory D. Tretiak
Mr. Tretiak is Executive Vice-President and Chief Financial Officer of Power Corporation and Power Financial, positions he has held since May, 2012. From 1988 to May, 2012, he held various positions with IGM and Investors Group, most recently the position of Executive Vice President and Chief Financial Officer of IGM from April, 1999 to May, 2012. Mr. Tretiak is a Director of Lifeco, Great-West Life, London Life, CLAC, Putnam and PanAgora. He also serves as a Director of IGM, IG Wealth Management and Mackenzie. He holds a Bachelor of Arts in Economics and Political Science from the University of Winnipeg and is a Chartered Professional Accountant, a Fellow of the Chartered Professional Accountants and has been a Certified Financial Planner. Throughout his career, Mr. Tretiak has been active in professional industry groups and associations including the Chartered Professional Accountants, Financial Executives International, the Certified Financial Planners, the Institute of Internal Auditors, the Investment Funds Institute of Canada and the Canadian Chamber of Commerce Economic and Taxation Committee.
Brian E. Walsh
Mr. Walsh is Principal and Chief Strategist of Titan Advisors LLC, an asset management firm, a position he has held since July, 2015. Prior to that, Mr. Walsh was Chairman and Chief Investment Officer of Saguenay Strathmore Capital, LLC, a money management and investment advisory company, a position that he held from September, 2011 to June, 2015. He was previously Managing Partner of Saguenay Capital, LLC from January, 2001 to September, 2011. Mr. Walsh has over 30 years of investment banking, international capital markets and investment management experience. He had a long career at Bankers Trust culminating in his appointment as Co-head of Global Investment Banking and as a member of the Management Committee. Mr. Walsh is a Director of Lifeco, Great-West Life, London Life and CLAC and Putnam. Mr. Walsh also serves on the International Advisory Board of École des Hautes Études Commerciales of Montréal. Mr. Walsh holds a Masters in Business Administration and Bachelor of Arts degree from Queen’s University.
Compensation of Company Directors for 2018
1. Table
The Company compensates Directors who are not also Directors of Lifeco or Great-West Life (“Company Directors”). The following sets out compensation earned in 2018 by the Company Directors.
43
| Name | Fees Earned or Paid in Cash ($)(3) | Stock Awards ($)(4) | All Other Compensation ($)(5) | Total ($) | ||||
| J.L. Bernbach | 89,889 | 68,750 | 148 | 158,787 | ||||
| R. Bienfait(1) | 64,634 | 44,437 | 70 | 109,177 | ||||
| G.J. Fleming | 100,889 | 68,750 | 148 | 169,787 | ||||
| A. Louvel | 103,639 | 68,750 | 148 | 172,537 | ||||
| J.E.A. Nickerson(2) | 32,200 | 19,093 | 52 | 51,345 | ||||
| R.L. Reynolds | 78,389 | 68,750 | 148 | 147,287 | ||||
| R. Royer(2) | — | 58,970 | 13 | 58,983 |
| (1) | Ms. Bienfait was elected to the Board of Directors effective June 26, 2018. |
| (2) | Messrs. Nickerson and Royer retired from the Board of Directors effective May 18, 2018. |
| (3) | Ms. Bienfait and Messrs. Bernbach, Fleming, Louvel, Nickerson and Reynolds elected to receive this portion of their compensation for serving as directors in cash. Amounts payable to Company Directors are paid in the currency of the country of residence. Amounts earned in Canadian dollars have been translated to U.S. dollars at the Conversion Rate. |
| (4) | For Ms. Bienfait and Messrs. Bernbach, Fleming, Louvel, Nickerson and Reynolds, these amounts represent the value of Deferred Share Units granted under the mandatory component of the DSUP. For Mr. Royer, this amount represents the value of Deferred Share Units granted under the mandatory and the voluntary components of the DSUP. See the Narrative Description of Company Director Compensation below for additional information regarding the DSUP. The value of these Deferred Share Units is the aggregate grant date fair value. |
As of December 31, 2018, Ms. Bienfait held 44,437 Deferred Share Units, Mr. Bernbach held 32,121 Deferred Share Units, Mr. Fleming held 5,845 Deferred Share Units, Mr. Louvel held 5,845 Deferred Share Units, Mr. Reynolds held 10,565 Deferred Share Units and Mr. Royer held 71,851 Deferred Share Units.
| (5) | These amounts are life insurance premiums paid under the Great-West Life Director’s Group Life Insurance Plan. Payments are made in Canadian dollars and have been translated to U.S. dollars at the Conversion Rate. |
2. Narrative Description of Company Director Compensation
Through the first and second quarters of 2018, the Company paid Company Directors a pro-rated portion of an annual retainer fee in the amount of $100,000. A Company Director serving on the Audit Committee receives an additional annual retainer fee in the amount of $3,000. The Chair of the Audit Committee receives an additional annual retainer fee in the amount of $20,000. In addition, the Company pays each Company Director a meeting fee in the amount of $2,000 for each meeting of the Board of Directors or a committee thereof that the Company Director attends.
Beginning in the third quarter of 2018, the Company implemented a new compensation program for the Company Directors under which they received pro-rated payments for the 3rd and 4th quarters of 2018. Under the new program, the Company pays Company Directors who are not also directors of Great-West Lifeco Inc. an annual retainer fee of $175,000. In addition, Company Directors receive annual retainer fees for serving as a member or the chairperson of certain committees of the Board. The following tables show the additional annual retainer fees paid for service on committees:
The following sums are paid per annum to the Chairperson of each of the following Company committees:
| Audit | $20,000 |
| Executive | $25,000 |
| Human Resources | $20,000 |
| Investment | $20,000 |
| Risk | $20,000 |
The following sums are paid per annum to members of each of the following Company committees:
44
| Audit | $20,000 |
| Conduct Review | $7,500 |
| Executive | $7,500 |
| Governance & Nominating | $7,500 |
| Human Resources | $10,000 |
| Investment | $15,000 |
| Risk | $10,000 |
| Equity Investment Sub | $7,500 |
In order to promote greater alignment of interests between the Company Directors and shareholders, the Company has implemented a Director Deferred Share Unit Plan, or DSUP, pursuant to which Company Directors are required to receive $87,500 of their annual retainer fee in Deferred Share Units. Under the voluntary portion of the DSUP, each Company Director may elect to receive the balance of his or her annual retainer, as well as committee retainer fees, entirely in form the of Deferred Share Units, entirely in cash, or equally in cash and Deferred Share Units.
Under both the mandatory and voluntary components of the DSUP, the number of Deferred Share Units granted is determined by dividing the amount of remuneration payable to the Company Director by the weighted average Canadian dollar trading price per Lifeco common share on the Toronto Stock Exchange for the last five trading days of the preceding fiscal quarter (such weighted average trading price being the “value of a Deferred Share Unit”) prior to the award grant date. Directors receive additional Deferred Share Units in respect of dividends payable on the Lifeco common shares based on the value of a Deferred Share Unit at that time. Deferred Share Units are redeemable at the time that an individual ceases to be a Director by a lump sum cash payment, based on the value of the Deferred Share Units on the date of redemption.
45
Identification of Executive Officers
| Executive | Age | Officer from | Principal Occupation(s) for Last Five Years | |||
| Edmund F. Murphy III President and Chief Executive Officer | 57 | 2014 | President and Chief Executive Officer of the Company since February 2019, previously President, Empower Retirement since September 2014;previously Head of Defined Contribution, Putnam Investments, LLC | |||
| Scott C. Sipple President, Great-West Investments | 57 | 2017 | President, Great-West Investments of the Company since October 2017; previously Head of Global Investment Strategies, Putnam Investments, LLC | |||
| Robert K. Shaw President, Individual Markets | 63 | 2008 | President, Individual Markets of the Company | |||
| Andra S. Bolotin Executive Vice President and Chief Financial Officer | 56 | 2015 | Executive Vice President and Chief Financial Officer of the Company since July 2016; previously Senior Vice President and Chief Financial Officer of the Company since July 2015; previously Head of Corporate Finance and Controller, Putnam Investments, LLC | |||
| Richard H. Linton Jr. Executive Vice President, Group Distribution & Operations | 51 | 2016 | Executive Vice President, Group Distribution & Operations of the Company; previously Executive Vice President, Empower Operations since May 2016; previously President Retail Wealth, Voya Financial | |||
| Jack E. Brown Senior Vice President, US Chief Investment Officer | 46 | 2015 | Senior Vice President, US Chief Investment Officer of the Company; previously Senior Vice President, Separate Accounts since July 2017; previously Vice President, Investments, since October 2015; previously Vice President, Oppenheimer Funds Inc | |||
| Jeffrey W. Knight Senior Vice President and Chief Technology Officer | 61 | 2014 | Senior Vice President and Chief Technology Officer of the Company | |||
| Suzanne M. Sanchez Chief Human Resources Officer | 44 | 2011 | Chief Human Resources Officer of the Company | |||
| Richard G. Schultz General Counsel and Chief Legal Officer | 58 | 2008 | General Counsel and Chief Legal Officer of the Company |
Unless otherwise indicated, all of the executive officers have been engaged for not less than five years in their present principal occupations or in another executive capacity with the companies or firms identified.
The appointments of executive officers are confirmed annually.
Code of Ethics
The Company has adopted a Code of Conduct (the “Code”) that is applicable to its senior financial officers, as well as to other officers and employees. All of the items identified as elements of a “code of ethics” as defined in Securities and Exchange Commission regulations adopted pursuant to the Sarbanes-Oxley Act of 2002 are substantively covered by the Code. A copy of the Code is available without charge upon written request to Kenneth I. Schindler, Chief Compliance Officer, 8525 East Orchard Road, Greenwood Village, Colorado 80111.
Executive Officer Compensation
Compensation Discussion and Analysis
1. Compensation of the President and Chief Executive Officer
46
Robert L. Reynolds was the President and Chief Executive Officer of the Company for the entirety of the fiscal year ended December 31, 2018. Mr. Reynolds was also President and Chief Executive Officer of Putnam Investments, LLC (“Putnam”), an affiliate of the Company, during that time.
Mr. Reynolds’ compensation is paid by Putnam under Putnam’s compensation program. A portion of Mr. Reynolds’ base salary and annual bonus is allocated to, and reimbursed by, the Company for services provided to the Company. The allocation is determined by the Company’s Human Resources Committee and Putnam’s Human Resources Committee. The portion of Mr. Reynolds’ base salary and annual bonus allocated to the Company is reflected in the Summary Compensation Table (see below).
The information in this Compensation Discussion and Analysis relates to the executive compensation program of the Company applicable to the other named executive officers of the Company and does not apply to Mr. Reynolds.
2. Overview and Objectives of the Company’s Executive Compensation Program
This section provides an overview and describes the objectives of the Company’s compensation program for executives, including the Chief Financial Officer and the three other most highly compensated executive officers of the Company during 2018 (the “Named Executive Officers”).
| • | The executive compensation program adopted by the Company and applied to the Named Executive Officers has been designed to: |
| • | support the Company’s objective of generating value for shareholders and policyholders over the long term; |
| • | attract, retain and reward qualified and experienced executives who will contribute to the success of the Company; |
| • | motivate executive officers to meet annual corporate, divisional, and individual performance goals; |
| • | promote the achievement of goals in a manner consistent with the Company’s Code of Conduct; and |
| • | align with regulatory requirements. |
More specifically, the executive compensation program rewards:
| • | excellence in developing and executing strategies that will produce significant value for shareholders and policyholders over the long term; |
| • | management vision and an entrepreneurial approach; |
| • | quality of decision-making; |
| • | strength of leadership; |
| • | record of performance over the long term; and |
| • | initiating and implementing transactions and activities that create shareholder and policyholder value. |
The Human Resources Committee of the Board of Directors of the Company operates under a charter and is responsible for overseeing the executive compensation program. The Board and the Human Resources Committee recognize the importance of executive compensation decisions and remain committed to awarding compensation that reflects leadership’s ability to deliver on the Company’s strategic goals and to drive strong performance and sustainable value for shareholders and policyholders.
In designing and administering the individual elements of the executive compensation program, the Human Resources Committee strives to balance short-term and long-term incentive objectives and to apply prudent judgment in establishing performance criteria, evaluating performance, and determining actual incentive awards. Total compensation of each Named Executive Officer is reviewed by the Human Resources Committee from time to time for market competitiveness, and reflects each Named Executive Officer’s job responsibilities, experience and proven performance.
The executive compensation programs consist of five primary components:
| • | base salary; |
| • | annual incentive bonus; |
| • | share units; |
| • | options for Lifeco common shares; and |
| • | retirement benefits. |
The primary role of each of these components is presented in the table below:
47
| Base Salary | Reflect skills, competencies, experience and performance of the Named Executive Officers |
| Annual Incentive Bonus | Reflect performance for the year |
| Share Units | More closely align the medium term interests of the Named Executive Officers with the interests of the shareholders |
| Stock Options | More closely align the long term interests of the Named Executive Officers with the interests of the shareholders |
| Retirement Benefits | Provide for appropriate replacement income upon retirement based on years of service with the Company |
Base salary, annual incentive bonus, share units and retirement benefits are determined by the Human Resources Committee for the Named Executive Officers. The long-term compensation component in the form of options for Lifeco common shares is determined and administered by Lifeco’s Human Resources Committee.
The President and Chief Executive Officer participates in the compensation setting process for the other Named Executive Officers by evaluating individual performance, establishing individual performance targets and objectives and recommending salary levels.
3. Base Salary
Base salaries for the Named Executive Officers are set annually, taking into account the individual’s job responsibilities, experience and proven performance, as well as market conditions. The Company gathers market data in relation to the insurance and financial services industries and also considers surveys prepared by external professional compensation consultants with regard to peer groups in these industries. However, the Human Resources Committee does not routinely “benchmark” or review the Company’s salary levels against a consistent group of its peers and does not have any formal policy of matching its salaries to those of certain competitors.
4. Bonuses
(a) Annual Incentive Bonus Plan
To relate the compensation of the Named Executive Officers to the performance of the Company, an annual incentive bonus plan (the “Annual Incentive Bonus Plan”) is provided. Target objectives are set annually and may include earnings, expense or sales targets of the Company and/or a business unit of the Company or specific individual objectives related to strategic initiatives.
See the tables presented below for information on the participation of the Named Executive Officers in the Annual Incentive Bonus Plan and a further description of the terms of the Annual Incentive Bonus Plan.
(b) Special Bonuses
From time to time, special bonuses may be provided related to significant projects such as acquisitions or dispositions or for sign-on or retention purposes.
5. Share Units
To provide a medium term component to the executive compensation program, the Named Executive Officers participate in the Company’s Share Unit Plan for Senior Executives (the “Executive Share Unit Plan”).
The Company’s Human Resources Committee is responsible for the granting of share units to participants under the Executive Share Unit Plan. Share Units are not granted based on the timing of the disclosure of non-public material information with respect to Lifeco or the Company.
The granting of share units is considered annually by the Human Resources Committee. Officer levels are taken into account when new share unit grants are considered. The granting of share units is subject to the terms and conditions contained in the Executive Share Unit Plan and any additional terms and conditions fixed by the Human Resources Committee at the time of the grant.
See the tables presented below for information on the participation of the Named Executive Officers in the Executive Share Unit Plan and a further description of the terms of the Executive Share Unit Plan.
6. Stock Options
48
To provide a long-term component to the executive compensation program, the Named Executive Officers participate in Lifeco’s Stock Option Plan (the “Lifeco Option Plan”).
While the Company’s Human Resources Committee makes recommendations with respect to the granting of Lifeco options, Lifeco’s Human Resources Committee is responsible for the granting of options to participants under the Lifeco Option Plan. Options are not granted based on the timing of the disclosure of non-public material information with respect to Lifeco or the Company.
The granting of Lifeco options is considered annually by the Lifeco Human Resources Committee. Officer levels are taken into account when new option grants are considered. The granting of options is subject to the terms and conditions contained in the Lifeco Stock Option Plan and any additional terms and conditions fixed by the Lifeco Human Resources Committee at the time of the grant.
See the tables presented below for information on the participation of the Named Executive Officers in the Lifeco Option Plan and a further description of the terms of the Lifeco Option Plan.
7. Retirement Benefits
(a) Defined Benefit Plan
GWL&A Financial has a qualified defined benefit pension plan (the “Defined Benefit Plan”) which is available to all employees of the Company hired before January 1, 1999. See the tables presented below for information on the participation of the Named Executive Officers in the Defined Benefit Plan and a description of the terms of the Defined Benefit Plan.
(b) SERP
To provide a competitive retirement benefit to certain key executives, the Company also has a nonqualified supplemental executive retirement plan (the “SERP”), which provides benefits above the compensation limits applicable to the Defined Benefit Plan. See the tables presented below for information on the participation of the Named Executive Officers in the SERP and a description of the terms of the SERP.
(c) 401(k) Plan
All employees, including the Named Executive Officers, may participate in the Company’s qualified defined contribution 401(k) Plan (the “401(k) Plan”). In 2018, employees who participated in the 401(k) Plan could make pre-tax and/or Roth contributions of between 1% and 50% of base salary and annual bonus (collectively “Salary”), subject to applicable Internal Revenue Service (“IRS”) limits. Beginning in 2019, employees who participate in the 401(k) Plan may make contributions of between 1% and 90% of Salary. All new employees are automatically enrolled in the 401(k) Plan at a 4% contribution rate unless the employee elects out or elects a different contribution rate. The Company matches 100% of the first 5% of Salary contributed as pre-tax and/or Roth contributions for all employees.
The 401(k) Plan offers a variety of investment options, including variable funds, collective funds, a stable value fund, Lifeco common shares (company matching contributions only) and a self-directed investment option.
8. Nonqualified Deferred Compensation
To provide market competitive compensation to certain key executives, the Company also has a nonqualified deferred compensation plan (“NQDCP”) and a nonqualified executive deferred compensation plan (“EDCP”). See the tables presented below for information on the participation of the Named Executive Officers in these plans and a description of the terms of the plans.
Human Resources Committee Interlocks and Insider Participation
None.
Compensation Policies and Risk Management
The Company has evaluated its compensation policies and practices applicable to all employees and believes that they do not create risks that are reasonably likely to have a material adverse effect on the Company.
49
Summary Compensation Table
The following table sets out the portion of Robert L. Reynolds’ base salary and annual bonus allocated to the Company for 2018 (See “Compensation Discussion and Analysis” above for further information on this allocation). The table also sets out compensation earned in 2018 by the other Named Executive Officers.
| Name and Principal Position | Year | Salary ($) | Bonus ($)(3) | Stock Awards ($)(4) | Option Awards ($)(5) | Non-Equity Incentive Plan Compensation ($)(6) | Change in Pension Value and Nonqualified Deferred Compensation Earnings ($)(7) | All Other Compensation ($)(8) | Total ($) | |||||||||
| Robert L. Reynolds President and Chief Executive Officer | 2018 | 300,000 | — | — | — | 3,000,000 | — | 147,287 | 3,447,287 | |||||||||
| 2017 | 300,000 | — | — | — | 3,000,000 | — | 116,039 | 3,416,039 | ||||||||||
| 2016 | 300,000 | — | — | — | 3,000,000 | — | 120,039 | 3,420,039 | ||||||||||
| Andra S. Bolotin(1) Executive Vice President and Chief Financial Officer | 2018 | 511,538 | — | 360,006 | 41,610 | 1,176,538 | — | 14,393 | 2,104,085 | |||||||||
| 2017 | 476,923 | — | 269,999 | 66,783 | 1,144,615 | — | 11,443 | 1,969,763 | ||||||||||
| 2016 | 423,077 | — | 249,998 | 134,808 | 900,000 | — | 25,994 | 1,733,877 | ||||||||||
| Robert K. Shaw President, Individual Markets | 2018 | 543,000 | — | 256,557 | 29,640 | 936,675 | — | 14,393 | 1,780,265 | |||||||||
| 2017 | 543,000 | 588,667 | 218,983 | 54,175 | 855,225 | 1,820,465 | 7,393 | 4,087,908 | ||||||||||
| 2016 | 539,942 | — | 244,357 | 87,954 | 675,000 | 1,749,030 | 7,655 | 3,303,938 | ||||||||||
| Edmund F. Murphy President, Empower Retirement | 2018 | 800,000 | — | 689,999 | 79,705 | 1,840,000 | — | 13,750 | 3,423,454 | |||||||||
| 2017 | 800,000 | 1,177,333 | 599,993 | 148,538 | 1,840,000 | — | 10,800 | 4,576,664 | ||||||||||
| 2016 | 761,538 | — | 499,995 | 269,616 | 1,444,000 | — | 10,268 | 2,985,417 | ||||||||||
| Richard H. Linton Jr.(2) Executive Vice President, Empower Operations | 2018 | 500,000 | 300,000 | 329,993 | 38,095 | 880,000 | — | 15,856 | 2,063,945 | |||||||||
| 2017 | 500,000 | 450,000 | 300,014 | 74,269 | 950,000 | — | 263,158 | 2,537,441 |
| (1) | For Ms. Bolotin, the Summary Compensation Table sets forth all compensation paid to Ms. Bolotin by the Company for her service as the Chief Financial Officer of both the Company and Putnam, a portion of which is reimbursed to the Company by Putnam. |
| (2) | Mr. Linton joined the Company as Executive Vice President, Empower Operations in May of 2016. |
| (3) | This column sets forth special bonuses for (a) Mr. Shaw and Mr. Murphy in relation to the integration of certain large case defined contribution business acquired from J.P. Morgan, and (b) Mr. Linton in connection with his joining the Company. |
| (4) | This column sets forth the value of share units granted to each Named Executive Officer under the Executive Share Unit Plan. The amounts shown represent the aggregate grant date fair value of the awards. |
| (5) | This column sets forth the value of Lifeco options granted to each Named Executive Officer under the Lifeco Option Plan. The amounts shown represent the aggregate grant date fair value of the awards. For further information, see Note 17 to the Company’s December 31, 2018 Financial Statements include in Appendix A to this prospectus. |
| (6) | For Ms. Bolotin and Messrs. Murphy, Shaw and Linton, these amounts represent cash bonuses earned under the Company’s Annual Incentive Bonus Plan and paid in February of 2019. |
| (7) | For 2018, Mr. Shaw had a decrease in actuarial present value of his Defined Benefit Plan of $196,906 and a decrease in actuarial present value of his SERP of $132,366, which offset above market earnings under the EDCP of $4,296. Above market earnings under the EDCP equaled the difference between the actual interest earned in 2018 and the amount of interest that would have been earned at a rate of 3.97% (3.97% being 120% of the applicable federal long-term rate at December 31, 2018). |
| (8) | The components of 2018 other compensation reported for each of the Named Executive Officers are as follows: |
| (a) | Mr. Reynolds received $147,287 in respect of directors’ fees. |
| (b) | Ms. Bolotin received (i) a 401(k) Plan employer contribution of $13,750; and (ii) a cell phone stipend of $643. |
| (c) | Mr. Murphy received a 401(k) Plan employer contribution of $13,750. |
| (d) | Mr. Shaw received (i) a 401(k) Plan employer contribution of $13,750; and (ii) a cell phone stipend of $643. |
| (e) | Mr. Linton received (i) a 401(k) plan employer contribution of $13,750; (ii) a relocation benefit payment of $1,859; and (iii) a cell phone stipend of $247. |
Grants of Plan-Based Awards for 2018
1. Table
50
The following table sets out information with respect to grants to the Named Executive Officers under the Annual Incentive Bonus Plan, Executive Share Unit Plan and Lifeco Option Plan.
| Name | Thresolds ($) | Target ($) | Maximum ($) | All Other Stock Awards: Number of Shares of Stock or Units (#)(1) | All Other Option Awards; Securities Underlying Options (#)(2) | Exercise or Base Price of Option Awards ($/Share)(3) | Grant Date Fair Value of Stack and Option awards ($) | |||||||
| A.S. Bolotin | — | 1,023,077 | — | 10,280 | 43,800 | 26.42 | 401,616 | |||||||
| R.K. Shaw | — | 814,500 | — | 7,326 | 31,200 | 26.42 | 286,197 | |||||||
| E.F. Murphy | — | 1,600,000 | — | 19,703 | 83,900 | 26.42 | 769,704 | |||||||
| R.H. Linton | — | 800,000 | — | 9,423 | 40,100 | 26.42 | 368,088 |
| (1) | These are Executive Share Units granted under the Executive Share Unit Plan. The grant date was January 1, 2018. The Company’s Human Resources Committee approved the grants on February 6, 2018. |
| (2) | These are Lifeco options granted under the Lifeco Option Plan. The grant date was March 1, 2018. The Lifeco Human Resources Committee approved the grants on February 6, 2018. |
| (3) | Lifeco options are issued with an exercise price in Canadian dollars, which have been translated to U.S. dollars at 1.00/1.295 which was Lifeco’s average rate for 2018 (the “Conversion Rate”). |
2. Narrative Description of the Annual Incentive Bonus Plan
Under the Annual Incentive Bonus Plan, a bonus pool is established if the Company meets certain earnings targets. The target bonus opportunity for individuals varies by office and is expressed as a percentage of base salary or as a flat amount. Bonus amounts are determined based on each Named Executive Officer’s performance against established objectives. Bonus amounts of greater or lesser than the established target may be awarded. For the Named Executive Officers, there is no minimum or maximum bonus amount.
For 2018:
| (i) | Ms. Bolotin had an opportunity to earn up to 200% of base salary earned in 2018 based on the Company’s financial performance and individual objectives, and an additional amount on a discretionary basis based on individual performance; |
| (ii) | Mr. Murphy had an opportunity to earn up to 200% of base salary earned in 2018 based on the Company’s financial performance and individual objectives, and an additional amount on a discretionary basis based on individual performance; |
| (iii) | Mr. Shaw had an opportunity to earn up to 150% of base salary earned in 2018 based on the Company’s financial performance and individual objectives, and an additional amount on a discretionary basis based on individual performance; and |
| (iv) | Mr. Linton had an opportunity to earn a target bonus of $800,000 in 2018 based on the Company’s financial performance and individual objectives, and an additional amount on a discretionary basis based on individual performance. |
3. Narrative Description of the Executive Share Unit Plan
Under the Executive Share Unit Plan, notional share units (“Executive Share Units”) may be granted to the Named Executive Officers by the Company’s Human Resources Committee. The value of an Executive Share Unit on a grant date in 2018 was based on the average closing price of Lifeco common shares on the Toronto Stock Exchange for the preceding 20 trading days (the “Market Value”). Beginning in 2019, the value of an Executive Share Unit on a grant date is based on the volume-weighted average closing price of Lifeco common shares on the Toronto Stock Exchange for the preceding 5 trading days
The number of Executive Share Units granted is generally related to the base salaries of the Named Executive Officers. Each grant of Executive Share Units has a three year vesting period during which certain conditions (including continued employment) must be satisfied.
The number of Executive Share Units granted is increased during the three year vesting period based on dividends declared on Lifeco common shares, and may be increased or decreased based on Company performance.
Subject to satisfaction of the vesting conditions, the Executive Share Units become payable in cash during the fourth year following the date of the award, at the Market Value as of the vesting date. Named Executive Officers may elect to defer the
51
payment of all or a portion of Executive Share Units granted in 2019 or later years if certain requirements are met. In the event of such an election, the Executive Share Units will be paid within 90 days after the later of (i) the end of the 3-year vesting period or (ii) the Named Executive Officer’s termination of employment.
4. Narrative Description of the Lifeco Option Plan
Under the Lifeco Option Plan, the Lifeco Human Resources Committee sets the exercise price of the options but under no circumstances can it be less than the weighted average trading price per Lifeco common share on the Toronto Stock Exchange for the five trading days preceding the date of the grant.
Options are either regular options or contingent options. Regular options are generally granted in multi-year allotments. Regular options become exercisable at the rate of 20% per year commencing one year after the date of the grant. Contingent options do not become exercisable unless and until conditions prescribed by the Lifeco Human Resources Committee have been satisfied.
Options generally expire ten years after the date of the grant, except that if options would otherwise expire during a blackout period or within ten business days of the end of a blackout period, the expiry date for the options is extended to the tenth business day after the expiry date of the blackout period.
In the event of the death of a participant or the termination of a participant’s employment, then the period within which the options may be exercised is generally reduced depending on the circumstances surrounding the death or termination of employment. Options are not assignable by participants otherwise than by will or pursuant to the laws of succession. Lifeco does not provide any financial assistance to participants to facilitate the purchase of common shares under the Lifeco Option Plan. Subject to any regulatory or shareholder approval required by law, the Lifeco Board of Directors may amend the Lifeco Option Plan or the terms of a grant.
Outstanding Equity Awards at 2018 Fiscal Year End
The following table sets out Lifeco options held by the Named Executive Officers under the Lifeco Option Plan, and Executive Share Units held by the Named Executive Officers under the Executive Share Unit Plan, as of December 31, 2018.
| Name | Option Awards | Stock awards | ||||||||||
| Number of Securities Underlying Unexercised Options (#) Exercisable | Number of Securities Underlying Unexercised Options (#) Unexercisable | Option Exercise Price ($)(6) | Option Expiration Date | Number of Shares or Units of Stock That Have Not Vested (#) | Market Value of Shares or Units of Stock That Have Not Vested ($)(9) | |||||||
| A.S. Bolotin | 19,680 | 29,520(3) | 26.78 | February 28, 2026 | 8,362(7) | 235,637 | ||||||
| 6,780 | 27,120(4) | 28.47 | February 28, 2027 | 10,799(8) | 304,306 | |||||||
| — | 43,800(5) | 26.42 | February 28, 2028 | |||||||||
| R.K. Shaw | 26,600 | — | 20.97 | February 28, 2021 | 6,782(7) | 191,114 | ||||||
| 37,600 | — | 17.89 | February 28, 2022 | 7,696(8) | 216,862 | |||||||
| 31,500 | — | 20.95 | February 28, 2023 | |||||||||
| 20,960 | 4,240(1) | 24.04 | February 29, 2024 | |||||||||
| 16,620 | 11,080(2) | 27.51 | February 28, 2025 | |||||||||
| 12,840 | 19,260(3) | 26.78 | February 28, 2026 | |||||||||
| 5,500 | 22,000(4) | 28.47 | February 28, 2027 | |||||||||
| — | 31,200(5) | 26.42 | February 28, 2028 | |||||||||
| E.F. Murphy | 52,440 | 34,960(2) | 27.51 | February 28, 2025 | 18,582(7) | 523,634 | ||||||
| 39,360 | 59,040(3) | 26.78 | February 28, 2026 | 20,697(8) | 583,243 | |||||||
| 15,080 | 60,320(4) | 28.47 | February 28, 2027 | |||||||||
| — | 83,900(5) | 26.42 | February 28, 2028 | |||||||||
| R.H. Linton | 7,540 | 30,160(4) | 28.47 | February 28, 2027 | 9,291(7) | 202,182 | ||||||
| — | 40,100(5) | 26.42 | February 28, 2028 | 9,898(8) | 215,389 | |||||||
| (1) | These options vest 20% of the total grant on March 1, 2019. |
| (2) | These options vest 20% of the total grant on each of March 1, 2019 and 2020. |
| (3) | These options vest 20% of the total grant on each of March 1, 2019, 2020 and 2021. |
| (4) | These options vest 20% of the total grant on each of March 1, 2019, 2020, 2021 and 2022. |
52
| (5) | These options vest 20% of the total grant on each of March 1, 2019, 2020, 2021, 2022 and 2023. |
| (6) | Lifeco options are issued with an exercise price in Canadian dollars, which have been translated to U.S. dollars at the Conversion Rate. |
| (7) | These Executive Share Unit grants vest on December 31, 2019. |
| (8) | These Executive Share Unit grants vest on December 31, 2020. |
| (9) | The market value of Executive Share Units held as of December 31, 2018 is based on the year-end closing price of Lifeco common shares on the Toronto Stock Exchange. |
Option Exercises and Stock Vested for 2018
The following table sets out Lifeco options exercised by, and Executive Share Units vested for, the Named Executive Officers in 2018.
| Option Awards | Stock Awards | |||
| Number of Shares Acquired on Exercise (#) | Value Realized on Exercise ($) | Number of Shares Acquired on Vesting (#) | Value Realized on Vesting ($) | |
| A.S. Bolotin | — | — | 10,860 | 229,902 |
| R.K. Shaw | — | — | 10,615 | 224,715 |
| E.F. Murphy | — | — | 21,720 | 459,804 |
| R.H. Linton | — | — | 15,433 | 326,701 |
Pension Benefits for 2018
1. Table
The following table sets out information with respect to the participation of the Named Executive Officers in the Defined Benefit Plan and the SERP.
| Name | Plan Name | Number of Years of Credited Service | Present Value of Accumulated Benefit ($)(1) | Payments During Last Fiscal Year ($) | ||||
| R.K. Shaw | Defined Benefit Plan | 35 | 2,061,094 | — | ||||
| SERP | 30 | 8,171,163 | — |
| (1) | The amounts shown in the table are calculated according to the terms of the plans as of December 31, 2018. Benefits under the Defined Benefit Plan were frozen as of December 31, 2017, and no additional benefits will accrue under that plan after that date. The Present Value of Accumulated Benefit under the Defined Benefit Plan equals the annuity earned as of December 31, 2017, payable at age 65 in the normal form of benefit. The Present Value of Accumulated Benefit under the SERP equals the termination benefit earned as of December 31, 2018, payable at age 62 in the normal form of benefit. Benefit amounts under each plan have been discounted to December 31, 2018 at the applicable discount rate for December 31, 2018. The amount payable to Mr. Shaw under the SERP is determined under the normal retirement benefit pay-out formula. |
2. Narrative Description of the Defined Pension Plan
The Defined Benefit Plan is designed to provide regular income at retirement to eligible employees. In general, an eligible employee is any employee hired prior to January 1, 1999. Participants in the Defined Benefit Plan are entitled to benefits at age 65 if they have 5 or more years of service.
The benefit formula for participants hired before January 1, 1992 is 1.5% for each of the first 30 years of service multiplied by the participant’s average annual compensation, plus 0.5% for each of the next 5 years of service multiplied by the participant’s average annual compensation, plus 0.5% for each year of service to retirement up to a maximum of 35 years multiplied by the participant’s average annual compensation minus the covered compensation amount (as determined by the IRS). If a participant made required or voluntary contributions to the Defined Benefit Plan prior to July 1, 1979, the participant’s benefit is increased to reflect these contributions and interest accrued thereon, so long as the employee contributions plus interest have not been withdrawn in a lump sum.
The benefit formula for participants hired on and after January 1, 1992 is 1.0% for each of the first 30 years of service multiplied by the participant’s average annual compensation, plus 0.5% for each of the next 5 years of service multiplied by the participant’s
53
average annual compensation, plus 0.5% for each year of service to retirement up to a maximum of 35 years multiplied by the participant’s average annual compensation minus the covered compensation amount (as determined by the IRS).
Average annual compensation is the highest average of compensation paid during 5 consecutive years of service out of the last 7 years of service.
Participants who have terminated service prior to age 65 and who have at least 5 years of service may begin receiving benefits as early as age 55. Benefits that begin prior to age 65 are reduced by approximately 5% for each year prior to age 65.
The normal form of benefit for a married participant is a joint and 50% survivor annuity. The normal form of benefit for an unmarried participant is a life only annuity. Other optional forms of pension payment are available on an actuarially equivalent basis.
Effective December 31, 2017, the Company amended the Defined Benefit Plan to freeze future benefit accruals. Final benefits are calculated as of December 31, 2017 and will not increase as a result of future service or compensation with the Company. Participants retain all benefits accrued through December 31, 2017. Participants received a full year of service for their anniversary year that began in 2017 regardless of whether they had completed the requisite 1,000 hours of service.
3. Narrative Description of the SERP
The SERP is designed to provide retirement benefits to certain key executive officers who are subject to qualified plan compensation limits. At the Company’s discretion, executive officers may be designated to participate in the SERP. Participants in the SERP are generally entitled to benefits if they have 15 or more years of service.
The following describes the retirement benefit amount under the SERP based on age at the time of separation of service.
| 1. | For participants who separate from service at or after age 62, the normal retirement benefit is equal to 60% of final average compensation if the participant has 30 years of service. The benefit is prorated for less than 30 years of service. Final average compensation is the average of the highest 60 consecutive months of compensation during the last 84 months of employment. Compensation includes salary, bonuses and commissions prior to any deferrals to other benefit plans. Benefits are offset by benefits under the Defined Benefit Plan and 50% of estimated social security benefits as of retirement. |
| 2. | For participants who separate from service between ages 57 and 62, the early retirement benefit is calculated by reducing the bonus used in determining final average compensation by 5/6% for each month prior to age 62 and by further reducing the early retirement benefit by 5/12% for each month prior to age 62. Benefits are offset by benefits under the Defined Benefit Plan and 50% of estimated social security benefits as of age 62. |
| 3. | For participants who separate from service prior to age 57, the termination benefit is equal to 60% of final average salary if the participant has 30 years of service. The benefit is prorated for less than 30 years of service. If the participant has less than 35 years of service, the termination benefit is also reduced by 5% for each of the first three years of service below 35. Final average salary is the average of the highest 60 consecutive months of salary during the last 84 months of employment. Salary includes deferrals of any salary to other benefit plans. Benefits are offset by benefits under the Defined Benefit Plan and 50% of estimated social security benefits payable as of age 62. |
Payments under the normal retirement benefit and the early retirement benefit commence upon retirement. Payments under the termination benefit commence at age 62.
The normal form of benefit under the SERP is a life only annuity. Other optional forms of payment are available on an actuarially equivalent basis.
Nonqualified Deferred Compensation for 2018
1. Table
The following table sets out information with respect to the participation of the Named Executive Officers in the NQDCP and/or EDCP.
54
| Name | Plan Name | Executive Contributions in Last Fiscal Year ($)(1) | Aggregate Earnings in Last Fiscal Year ($) | Aggregate Withdrawals or Distributions ($) | Aggregate Balance at Last Fiscal Year End ($) | |||||
| R.K. Shaw | NQDCP | — | (37,224) | 86,259 | 470,932 | |||||
| EDCP | 155,434 | 26,389 | — | 602,987 |
| (1) | Amounts contributed are included in the Salary column of the Summary Compensation Table. |
2. Narrative Description of the Nonqualified Deferred Compensation Plan and Executive Deferred Compensation Plan
All officers and certain senior employees of the Company, and others at the discretion of the Company, are eligible to participate in the NQDCP. At the Company’s discretion, executive officers may be designated to participate in the EDCP.
A participant in the NQDCP may defer between 1% and 90% of their base salary (including sales related compensation) and bonus. A participant in the EDCP may defer (i) a minimum of the greater of $2,500 or 5% of base salary (including sales related compensation) and a maximum of 90% of base salary; and (ii) a minimum of 5% and a maximum of 90% of bonus.
Under the NQDCP, participants specify one or more investment preferences in which deferrals are deemed to be invested. Participant accounts are adjusted for interest, earnings or losses equal to the actual results of the deemed investment(s). Under the EDCP, participant deferrals earn an interest rate equal to the Moody’s Average Annual Corporate Bond Index rate plus .45% for active participants and fixed rates ranging from 6.37% to 7.91% for participants receiving benefits.
Amounts deferred under both plans and the earnings from the plans are distributed to a participant upon termination of employment, if not distributed earlier. Amounts distributed under the plans are generally paid in either a lump sum or installments over 3, 5, 10 or 15 years at the election of the participant.
Following a change in control of the Company, the Board of Directors may terminate one or both plans in its discretion and pay all amounts due under a terminated plan to participants. Certain payments following termination of employment or after a change in control may be delayed to comply with requirements under the Internal Revenue Code.
Security Ownership of Certain Beneficial Owners and Management
Security Ownership of Certain Beneficial Owners
Set forth below is certain information, as of January 1, 2019, concerning beneficial ownership of the voting securities of the Company by entities and persons who beneficially own more than 5% of the voting securities of the Company. The determinations of “beneficial ownership” of voting securities are based upon Rule 13d-3 under the Securities Exchange Act of 1934, as amended (the “Exchange Act”). This rule provides that securities will be deemed to be “beneficially owned” where a person has, either solely or in conjunction with others, (1) the power to vote or to direct the voting of securities and/or the power to dispose or to direct the disposition of the securities or (2) the right to acquire any such power within 60 days after the date such “beneficial ownership” is determined.
| 1. | 100% of the Company’s 7,320,176 outstanding common shares are owned by GWL&A Financial Inc., 8515 East Orchard Road, Greenwood Village, Colorado 80111. |
| 2. | 100% of the outstanding common shares of GWL&A Financial Inc. are owned by Great-West Lifeco U.S. LLC, 8515 East Orchard Road, Greenwood Village, Colorado 80111. |
| 3. | 100% of the outstanding common shares of Great-West Lifeco U.S. LLC are owned by Great-West Financial (Nova Scotia) Co., Suite 800, 1959 Upper Water Street, Halifax, Nova Scotia, Canada B3J 2X2. |
| 4. | 100% of the outstanding common shares of Great-West Financial (Nova Scotia) Co. are owned by Great-West Financial (Canada) Inc., 100 Osborne Street North, Winnipeg, Manitoba, Canada R3C 3A5. |
| 5. | 100% of the outstanding common shares of Great-West Financial (Canada) Inc. are owned by Great-West Lifeco Inc., 100 Osborne Street North, Winnipeg, Manitoba, Canada R3C 3A5. |
| 6. | 71.81% of the outstanding common shares of Great-West Lifeco Inc. are controlled, directly or indirectly, by Power Financial Corporation, 751 Victoria Square, Montréal, Québec, Canada H2Y 2J3, representing approximately 65% of the voting rights attached to all outstanding voting shares of Great-West Lifeco Inc. |
| 7. | 65.52% of the outstanding common shares of Power Financial Corporation are owned by 171263 Canada Inc., 751 Victoria Square, Montréal, Québec, Canada H2Y 2J3. |
55
| 8. | 100% of the outstanding common shares of 171263 Canada Inc. are owned by Power Corporation of Canada, 751 Victoria Square, Montréal, Québec, Canada H2Y 2J3. |
| 9. | The Desmarais Family Residuary Trust, c/o San Palo Investments Corporation, 759 Victoria Square, Suite 520, Montréal, Québec, Canada H2Y 2J7, directly and through a group of private holding companies which it controls, has voting control of Power Corporation of Canada. |
As a result of the chain of ownership described in paragraphs (1) through (9) above, each of the entities and persons listed in paragraphs (1) through (9) would be considered under Rule 13d-3 of the Exchange Act to be a “beneficial owner” of 100% of the outstanding voting securities of the Company.
Security Ownership of Management
The following tables set out the number of equity securities and exercisable options for equity securities of the Company or any of its parents or subsidiaries, beneficially owned, as of January 1, 2019, by (i) the directors of the Company (ii) the Named Executive Officers and (iii) the directors and executive officers of the Company as a group.
| Directors | Great-West Lifeco Inc.(1) | Power Financial Corporation(2) | Power Corporation of Canada(3) |
| J.L. Bernbach | - | - | - |
| R. Bienfait | - | - | - |
| M.R. Coutu | 10,000 | - | - |
| A. Desmarais | 350,000 | 43,200 549,991 options | 15,118,416 3,884,000 options |
| P. Desmarais, Jr. | 100,000 | - | 15,096,015 3,884,000 options |
| G.A. Doer | - | - | - |
| G.J. Fleming | - | - | - |
| C. Généreux | - | - 205,629 options | 4,821 25,279 options |
| A. Louvel | - | - | - |
| P.B. Madoff | - | - | - |
| P.A. Mahon | 151,566 | - | - |
| R.J. Orr | 20,000 | 400,200 3,622,229 options | 20,000 |
| R.L. Reynolds | - | - | - |
| T. Timothy Ryan, Jr. | - | 16,400 | 18,572 |
| J.J. Selitto | - | - | - |
| G.D. Tretiak | - | - | |
| 145,971 options | 13,001 | ||
| 150,649 options | |||
| B.E. Walsh | - | - | - |
| Named Executive Officers | Great-West Lifeco Inc.(1) | Power Financial Corporation(2) | Power Corporation of Canada(3) |
| R.L. Reynolds | - | - | - |
| A.S. Bolotin | - 26,460 options | - | - |
| R.H. Linton | - 7,540 options | - | - |
| E.F. Murphy | - 106,880 options | - | - |
| R.K. Shaw | 6,052 151,620 options | - | - |
| Directors and Executive Officers as a Group | Great-West Lifeco Inc.(1) | Power Financial Corporation(2) | Power Corporation of Canada(3) |
| 637,618 372,406 options | 459,800 4,523,820 options | 30,270,825 7,943,928 options |
| (1) | All holdings are common shares, or where indicated, exercisable options for common shares of Great-West Lifeco Inc. |
| (2) | All holdings are common shares, or where indicated, exercisable options for common shares of Power Financial Corporation. |
56
| (3) | All holdings are subordinate voting shares, or where indicated, exercisable options for subordinate voting shares of Power Corporation of Canada. |
The number of subordinate voting shares and exercisable options for subordinate voting shares of Power Corporation of Canada held by the directors and executive officers as a group represents 0.79% of the total number of subordinate voting shares and exercisable options for subordinate voting shares of Power Corporation of Canada outstanding.
None of the remaining holdings set out above exceeds 1% of the total number of shares and exercisable options for shares of the class outstanding.
Transactions with Related Persons, Promoters and Certain Control Persons
| (a) | There are no transactions to report. |
| (b) | The Company’s Board of Directors has a Conduct Review Committee which acts pursuant to a written Charter and procedures (together, the “procedures”). Messrs. Bernbach and Louvel serve on the Conduct Review Committee. |
The Conduct Review Committee, in accordance with the procedures, considers and approves transactions between the Company or its subsidiaries and (i) the directors and senior officers of the Company or its affiliates, including their spouses and minor children; (ii) its affiliates; and (iii) companies controlled by a director or senior officer of the Company or its affiliates, or their spouses or minor children. Control and affiliation is defined as a 10% voting interest or 25% ownership interest, but does not include subsidiaries of the Company.
Among other criteria, the Conduct Review Committee considers whether such transactions were on market terms and conditions, including interest rates and fees, as those prevailing at the time for comparable transactions with third parties. Such review also considers the Company’s established conflict of interest guidelines with respect to the transaction, as set forth in the Company’s Code.
There were no reportable related party transactions during the Registrant’s most recently completed fiscal year where the aforementioned procedures did not require review, approval or ratification or where the procedures were not followed.
Risks Associated with the Company and the Financial Services Industry
In the normal course of its business, the Company is exposed to certain operational, regulatory, and financial risks and uncertainties. The most significant risks include the following:
Competition could negatively affect the ability of the Company to maintain or increase market share or profitability.
The industry in which the Company operates is highly competitive. The Company’s competitors include insurance companies, mutual fund companies, banks, investment advisors, and certain service and professional organizations. Although there has been consolidation in some sectors, no one competitor is dominant. Customer retention is a key factor for continued profitability. Management cannot be certain that the Company will be able to maintain its current competitive position in the markets in which it operates, or that it will be able to expand its operations into new markets. If the Company fails to do so, its business, results of operations, and financial condition could be materially and adversely affected.
The insurance and financial services industries are heavily regulated and changes in regulation may reduce profitability.
Federal and state regulatory reform that increases the compliance requirements imposed on the Company or that changes the way that the Company is able to do business may significantly harm its business or adversely impact the results of operations in the future. It is not possible to predict whether future legislation or regulation adversely affecting the Company’s business will be enacted and, if enacted, the extent to which such legislation will have an effect on the Company or its competitors. Furthermore, there can be no assurance as to which of the Company’s specific products would be impacted by any such legislative or regulatory reform.
The Company’s operations and accounts are subject to examination by the Colorado Department of Insurance and other regulators at specified intervals. The NAIC has also prescribed RBC rules and other financial ratios for life insurance companies. The calculations set forth in these rules are used by regulators to assess the sufficiency of an insurer’s capital and measure the risk characteristics of an insurer’s assets, liabilities, and certain off-balance sheet items. RBC is calculated by applying factors to various asset, premium, face amount, and liability items. Although the Company has RBC levels well in excess of those required by its regulators, there can be no assurances made that it will continue to maintain these levels.
57
A downgrade or potential downgrade in the Company’s financial strength or claims paying ratings could result in a loss of business and negatively affect results of operations and financial condition.
The Company is rated by a number of nationally recognized rating agencies. The ratings represent the opinion of the rating agencies regarding the Company’s financial strength and its ability to meet ongoing obligations to policyholders. Claims paying ability and financial strength ratings are factors in establishing the competitive position of insurers. A rating downgrade, or the potential for such a downgrade, of the Company or any of its rated insurance subsidiaries could, among other things, materially increase the number of policy surrenders and withdrawals by policyholders of cash values from their policies, adversely affecting relationships with broker-dealers, banks, agents, wholesalers, and other distributors of its products and services. This may result in cash payments requiring the Company to sell invested assets, including illiquid assets such as privately placed bonds and mortgage loans, at a price that may result in realized investment losses. These cash payments to policyholders result in a decrease in total invested assets and a decrease in net income. In addition, a significant downgrade may negatively impact new sales and adversely affect the Company’s ability to compete and thereby have a material effect on its business, results of operations, and financial condition. Negative changes in credit ratings may also increase the Company’s cost of funding.
Deviations from assumptions regarding future persistency, mortality, and interest rates used in calculating liabilities for future policyholder benefits and claims could adversely affect the Company’s results of operations and financial condition.
The Company establishes and carries, as a liability, reserves based on estimates of how much it will need to pay for future benefits and claims. Future policy benefits do not represent an exact calculation of liability. Rather, future policy benefits represent an estimate of what management expects the ultimate settlement and administration of benefits will cost. These estimates, which generally involve actuarial projections, are based upon management’s assessment of facts and circumstances then known, as well as estimates of future trends in persistency (how long a contract stays with the Company), mortality, judicial theories of liability, interest rates, and other factors. These variables are affected by both internal and external events, such as changes in market and interest rate conditions, catastrophic events, inflation, judicial trends, and legislative changes. Many of these items are not directly quantifiable in advance. The Company’s life insurance products are exposed to the risk of catastrophic events, such as a pandemic, terrorism, or other such events that cause a large number of deaths. Additionally, there may be a significant reporting delay between the occurrence of an insured event and the date it is reported to the Company.
The inherent uncertainties of estimating policy and contract claim liabilities are greater for certain types of liabilities, particularly those in which the various considerations affecting the type of claim are subject to change and in which long periods of time may elapse before a definitive determination of liability is made. Liability estimates including estimated premiums the Company will receive over the assumed life of the policy are continually refined in a regular and ongoing process as experience develops and further claims are reported and settled. Adjustments to policy benefit liabilities are reflected in the Company’s consolidated statement of income in the period in which adjustments are determined. Because setting policy benefit liabilities is inherently uncertain, there can be no assurance that current liabilities will prove to be adequate in light of subsequent events.
If the companies that provide reinsurance default or fail to perform or the Company is unable to obtain adequate reinsurance for some of the risks underwritten, the Company could incur significant losses adversely affecting results of operations and financial condition.
The Company purchases reinsurance by transferring, or ceding, part of the risk it assumes to a reinsurance company in exchange for part of the premium it receives in connection with the risk. The part of the risk the Company retains for its own account is known as the retention. The Company retains an initial maximum of $3.5 million of coverage per individual life. This initial retention limit of $3.5 million may increase due to automatic policy increases in coverage at a maximum rate of $175 thousand per annum, with an overall maximum increase in coverage of $1 million. Through reinsurance, the Company has the contractual right to collect the amount above its retention from its reinsurers. Although reinsurance makes the reinsurer liable to the Company to the extent the risk is transferred or ceded to the reinsurer, it does not relieve it of its liability to its policyholders. Accordingly, the Company bears credit risk with respect to its reinsurers. Management cannot make assurances that the Company’s reinsurers will pay all of their reinsurance claims, or that they will pay claims on a timely basis. If the Company’s reinsurers cease to meet their obligations, whether because they are in a weakened position as a result of incurred losses or otherwise, the Company’s results of operations, financial position, and cash flows could be materially adversely affected.
As related to the Company’s reinsurance facilities, there are no assurances that the Company can maintain its current reinsurance facilities or that it can obtain other reinsurance facilities in adequate amounts and at favorable rates. If the Company is unable to obtain new reinsurance facilities, either its net exposures would increase or, if it is unwilling to bear an increase in net exposures, it would have to reduce the level of its underwriting commitments. Either of these potential developments could have a material adverse effect on the Company’s business, results of operations, and financial position.
58
Interest rate fluctuations could have a negative impact on results of operations and financial condition.
In periods of rapidly increasing interest rates, policy surrenders and withdrawals may increase and premiums in flexible premium policies may decrease as policyholders seek investments with higher perceived returns. This activity may result in the Company’s making cash payments, requiring that it sell invested assets at a time when the prices of those assets are adversely affected by the increase in market interest rates. During periods of sustained low interest rates, life insurance and annuity products may be affected by increased premium payments on products with flexible premium features and a higher percentage of insurance policies remaining in-force from year to year on products with minimum guarantees. During such a period, investment earnings may be lower because the interest earnings on new fixed income investments will likely have declined with the market interest rates. Also there may be increased early repayment on investments held such as mortgage-backed securities, asset-backed securities, and callable bonds. Although the Company invests in a broad range of asset classes, it is primarily invested in domestic fixed income securities. Accordingly, during periods of sustained low interest rates, an adverse effect on the results of operations and financial condition may result from a decrease in the spread between the earned rate on the Company’s assets and either the interest rates credited to policyholders or the rates assumed in reserve calculations. Several products have current credited interest rates that are at or approaching their minimum guaranteed credited rate, which could have an adverse effect on the results of operations and financial condition due to spread compression.
The Company has hedging and other risk mitigating strategies to reduce the risk of a volatile interest rate environment. However, there can be no assurance that it would be fully insulated from realizing any losses on sales of securities. In addition, regardless of whether the Company realized an investment loss, potential withdrawals would produce a decrease in invested assets, with a corresponding adverse effect on the results of operations and financial condition.
Market fluctuations and general economic conditions may adversely affect results of operations and financial condition.
The risk of fluctuations in market value of all of the separate account assets, proprietary mutual funds, proprietary collective trusts, and external mutual funds is borne by the policyholders. The Company’s fee income for administering and/or managing these assets, however, is generally set as a percentage of those assets. Accordingly, fluctuations in the market value of these assets may result in fluctuations in revenue. On certain products, the Company offers guarantees to policyholders to protect them against the risk of adverse market performance, including guaranteed minimum death benefits and guaranteed lifetime withdrawal benefits. When equity markets decline, the Company is at a greater risk of having to pay guaranteed benefits that exceed available policyholder account balances, and will therefore have to increase its reserves for these benefits, resulting in a financial loss. While the Company does have hedging programs in place to reduce the market risk associated with these guarantees, no assurance can be provided that these programs will generate the returns that will be needed to meet policyholder obligations relating to these guarantees.
The Company manages or administers its general and separate accounts in support of cash and liquidity requirements of its insurance and investment products. The Company’s general account investment portfolio is diversified over a broad range of asset classes but consists primarily of domestic fixed income investments. The fair value of these and other general account invested assets fluctuates depending upon, among other factors, general economic and market conditions. In general, the market value of the Company’s general account fixed maturity securities portfolio increases or decreases in inverse relationship with fluctuations in interest rates.
The occurrence of a major economic downturn, acts of corporate malfeasance, or other events that adversely affect the issuers of the Company’s investment securities could cause the value of these securities and net income to decline and the default rate of the fixed maturity securities to increase. A ratings downgrade affecting particular issuers or securities could have a similar effect. Any event reducing the value of these securities other than on a temporary basis could have an adverse effect on the results of operations and financial condition. Ratings downgrades on general account assets may also result in a higher capital charge under RBC, resulting in lower RBC ratio.
Additionally, the Company may, from time to time, for business, regulatory, or other reasons, elect or be required to sell certain of its general account invested assets at a time when their fair values are less than their original cost, resulting in realized capital losses, which would have an adverse effect on the results of operations and financial condition.
Changes in U.S. federal income tax law could make some of the Company’s products less attractive to consumers and increase its tax costs.
| • | Changes in U.S. federal income tax law could make some of the Company’s products less attractive to consumers. For example, the following events could adversely affect the Company’s business: |
59
| • | Changes in tax laws that would reduce or eliminate tax-deferred accumulation of earnings on the premiums paid by the holders of annuities and life insurance products; |
| • | Reductions in the federal income tax that investors are required to pay on long-term capital gains and on some dividends paid on stock that may provide an incentive for some of the Company’s customers and potential customers to shift assets into mutual funds and away from products, including life insurance and annuities, designed to defer taxes payable on investment returns; |
| • | Changes in applicable regulations that could restrict the ability of some companies to purchase certain executive benefits products; |
| • | Changes in the availability of, or rules concerning the establishment, operation, and taxation of, Section 401, 403(b), 408, and 457 plans; and |
| • | Repeal of the federal estate tax or changes in the tax treatment of life insurance death benefits. |
The Company cannot predict whether any other legislation will be enacted, what the specific terms of any such legislation will be, or how, if at all, this legislation or any other legislation could have an adverse effect on its results of operations or financial condition.
Congress, as well as state and local governments, also considers from time to time legislation that could change the Company’s tax costs and increase or decrease its ability to use existing tax credits. If such legislation is adopted, the results of operations could be impacted. Changes to the Company’s tax costs would include changes to tax rates, which could affect the consolidated financial statements in several ways. For example, a decrease in the federal income tax rate could affect the consolidated financial statements as follows:
| • | A lower effective tax rate, which would have a favorable impact on net income over the period that the lower rate remains in effect. |
| • | A reduction in certain deferred tax liabilities, which would have an immediate favorable impact on net income in the period during which the lower rate came into effect. |
| • | A reduction in certain deferred tax assets, which would have an immediate unfavorable impact on net income in the period during which the lower tax rate came into effect. |
| • | A reduction in tax rates could affect the timing of recognizing tax benefits. |
The Company may be subject to litigation resulting in substantial awards or settlements and this may adversely affect its reputation and results of operations.
In recent years, life and accident insurance and financial service companies have been named as defendants in lawsuits, including class actions. A number of these lawsuits have resulted in substantial awards and settlements. There can be no assurance that any future litigation relating to matters such as the provision of insurance coverage or pricing and sales practices will not have a material adverse affect on the Company’s results of operations or financial position.
The Company’s risk management policies and procedures may leave it exposed to unidentified or unanticipated risk, which could adversely affect its business, results of operations, and financial condition.
Management of operational, legal, regulatory, and financial risks requires, among other things, policies and procedures to record properly and verify a large number of transactions and events. Management has devoted significant resources to develop the Company’s risk management and disaster recovery policies and procedures. However, policies and procedures may not be fully effective and may leave the Company exposed to unidentified and unanticipated risks. The Company may be subject to disruptions of its operating systems or its ability to conduct business from events that are wholly or partially beyond its control such as a natural catastrophe, act of terrorism, pandemic, or electrical/telecommunications outage.
The Company may experience difficulty in marketing and distributing products through its current and future distribution channels.
The Company distributes its life and savings products through a variety of distribution channels, including brokers, independent agents, consultants, retail financial institutions, and its own internal sales force. In some areas the Company generates a significant portion of its business through third-party arrangements. Management periodically negotiates provisions and renewals of these relationships and there can be no assurance that such terms will remain acceptable to either party. An interruption in the continuing relationship with a significant number of these third parties could materially affect the Company’s ability to market its products. The Company must attract and retain productive internal sales representatives to sell its products. If the Company is unsuccessful
60
in attracting and retaining sales representatives with demonstrated abilities, its results of operations and financial condition could be adversely affected.
A failure in cyber or information security systems could result in a loss or disclosure of confidential information, damage the Company’s reputation, and could impair its ability to conduct business effectively.
The Company depends heavily upon computer systems to provide reliable service, as a significant portion of the Company’s operations relies on the secure processing, storage, and transmission of confidential or proprietary information and complex transactions. Despite the implementation of a variety of security measures, the Company’s computer systems could be subject to physical and electronic break-ins, cyber attacks, and similar disruptions from unauthorized tampering, including threats that may come from external factors, such as governments, organized crime, hackers and other third parties, or may originate internally from within the Company.
If one or more of these events occurs, it could potentially jeopardize the confidential or proprietary information, including personally identifiable non-public information, processed and stored in, and transmitted through, the computer systems and networks. It could also potentially cause interruptions or malfunctions in the operations of the Company, its customers, or other third parties. This could result in damage to the Company’s reputation, financial losses, litigation, increased costs, regulatory penalties, and/or customer dissatisfaction or loss. Although steps have been taken to prevent and detect such attacks, it is possible that the Company may not become aware of a cyber incident for some time after it occurs, which could increase its exposure to these consequences.
The Company could face difficulties, unforeseen liabilities, or asset impairments arising from business acquisitions or integrations and managing growth of such businesses.
The Company has engaged in acquisitions of businesses in the past and may continue to do so in the future. Such activity exposes the Company to a number of risks. For example, there could be unforeseen liabilities or asset impairments, including goodwill impairments that arise in connection with the businesses that will be acquired in the future.
The Company’s ability to achieve certain benefits which are anticipated from acquisitions of businesses will depend in large part upon the Company’s ability to successfully integrate such businesses in an efficient and cost effective manner. The Company may not be able to integrate such businesses smoothly or successfully, and the process may take longer than expected. The integration of operations and differences in operational culture may require the dedication of significant management resources, which may result in greater expenditures than expected to integrate the acquired businesses. If the Company is unable to successfully integrate the operations of such acquired businesses, it may be unable to realize the benefits it expects to achieve as a result of such acquisitions.
The success with which the Company is able to integrate acquired operations will depend on its ability to manage a variety of issues, including the following:
| • | Loss of key personnel or higher than expected employee attrition rates could adversely affect the performance of the acquired business and the Company’s ability to successfully integrate it. |
| • | Integrating acquired operations with existing operations may require the Company to coordinate geographically separated organizations, address possible differences in culture and management philosophies, merge financial processes and risk and compliance procedures, combine separate information technology platforms, and integrate organizations that were previously closely tied to the former parent of the acquired business or other service provider. |
Counterparties with whom the Company transfers risk may be unable or unwilling to do business with the Company.
The Company mitigates market risks through the use of derivative transactions with approved counterparties. Should some or all of these counterparties be unwilling or unable to continue to offer derivatives to the Company, the cost of purchasing these financial instruments may increase and/or the Company may not be able to continue to transfer certain risks, thereby increasing its exposure to a financial loss.
The Company may not be able to secure financing to meet the liquidity or capital needs of the Company.
While the Company monitors its liquidity and capital on a regular basis, it may need to seek external financing if available internal levels of liquidity or capital are insufficient. Liquidity demands include but are not limited to the payment of policyholder benefits, collateral posting as required under our agreements with counterparties, the payment of operating expenses, and the servicing of debt. Capital demands could result from the growth of new business, a change in investment strategy, an investment in systems or other infrastructure, or a deterioration of the Company’s capital arising from financial losses. The availability of additional
61
financing will depend on a variety of factors such as market conditions, the general availability of credit in financial markets, the overall availability of credit to the financial services industry, the volume of trading activities in financial markets, the Company’s credit ratings and credit capacity, and the perception of customers or lenders of the Company’s long or short term financial strength. If the Company is unable to secure external financing to meet a liquidity or capital shortfall it may be required to curtail its operations, sell assets or reinsure liabilities, make changes to the investment strategy, or discontinue the use of certain derivatives, which could have a detrimental impact on the financial strength of the Company.
Acquisitions, dispositions and business reorganizations, including our announced transaction with Protective Life Corporation, may not produce anticipated benefits and could result in operating difficulties, unforeseen liabilities, asset impairments or rating agency actions, which may adversely affect the Company’s operating results and financial condition.
Acquisitions, dispositions and other business reorganizations, such as the planned disposition of substantially all of the Individual Markets segment to Protective Life Corporation that was announced in January of 2019, could expose the Company to a number of risks. Once completed, acquisitions and dispositions may not perform as projected, expense synergies and savings may not materialize as expected and costs associated with the transaction or related transition services may be greater than anticipated. The Company’s financial results could be adversely affected by:
| • | potential difficulties achieving projected financial results, including the costs and benefits of integration or deconsolidation, due to macroeconomic, business, demographic, actuarial, regulatory, or political factors; |
| • | negative reactions to a transaction by policyholders and contract-holders, distributors, suppliers, plan sponsors and advisors and other clients and potential customers; |
| • | ratings agency warnings or downgrades; |
| • | unanticipated performance issues; |
| • | unforeseen liabilities; |
| • | transaction-related charges; |
| • | diversion of management time and resources to disposition challenges; |
| • | loss of key employees or customers, amortization of expenses related to intangibles; |
| • | inefficiencies as we integrate operations and address differences in cultural, management, information, compliance and financial systems and procedures; and |
| • | charges for impairment of long-term assets or goodwill and indemnifications. |
In addition, factors such as receiving the required governmental or regulatory approvals to close the transaction, delays in implementation or completion of transition activities or a disruption to the Company’s ongoing business could negatively impact results.
Reorganizing or consolidating the legal entities through which the Company conducts its business may raise similar risks. The success with which the Company realizes benefits from legal entity reorganizations will also depend on its ability to manage a variety of issues, including regulatory approvals, modification of operations and changes to investment portfolios.
Any of these risks, if realized, could prevent the Company from achieving the benefits it expects or could otherwise have a material adverse effect on its business, results of operations or financial condition.
EXPERTS
The statutory financial statements included in this Prospectus have been audited by Deloitte & Touche LLP, an independent registered public accounting firm, as stated in their report appearing herein, are included in reliance upon the report of such firm given upon their authority as experts in accounting and auditing.
WHERE YOU CAN FIND MORE INFORMATION
This prospectus, which constitutes part of the registration statement, does not contain all the information set forth in the registration statement.
The registration statement, including exhibits, contains additional relevant information about us. The complete registration statement and our other filings are available to the public from commercial document retrieval services and over the internet at www.sec.gov. (This uniform resource locator (URL) is an inactive textual reference only and is not intended to incorporate the SEC
62
web site into this prospectus.)
63
DEFINITIONS
The following is a listing of defined terms:
Account – A separate record maintained by the Plan Sponsor or its designee in the name of each Retirement Plan participant which reflects his or her interests in the assets in both Covered Fund(s) and other investment options in the Retirement Plan.
Accumulation Phase – The period of time between the Election Date and the Initial Installment Date.
Administrative Offices – 8515 East Orchard Road, Greenwood Village, CO 80111.
Alternate Payee – Any spouse, former spouse, child or other dependent of a Retirement Plan participant, or other person allowed by law, who is recognized by a Qualified Domestic Relations Order as having a right to receive all or a portion of the benefit payable under a Retirement Plan with respect to such Retirement Plan participant.
Annuitant– The person upon whose life the payment of an annuity is based.
Annuity Commencement Date – The date that annuity payments begin to an Annuitant.
Attained Age – The GLWB Participant’s age on the Ratchet Date.
Beneficiary – A person or entity named by the Retirement Plan participant or the terms of the Retirement Plan to receive all or a portion of the Account upon the death of the Retirement Plan participant.
Benefit Base – The amount that is multiplied by the GAW Percentage to calculate the GAW. The Benefit Base increases dollar-for-dollar upon any Contract Contribution and is reduced proportionately for an Excess Withdrawal. The Benefit Base can also increase with positive Covered Fund performance on the Ratchet Date. Each Covered Fund will have its own Benefit Base. A Covered Fund Benefit Base cannot be transferred to another Covered Fund unless we require a Transfer as a result of a Covered Fund being eliminated or liquidated.
Business Day – Any day, and during the hours, on which the New York Stock Exchange is open for trading. Except as otherwise provided, in the event that a date falls on a non-Business Day, the date of the following Business Day will be used.
Contract Contributions – GLWB Participant directed amounts received and allocated to the GLWB Participant’s Covered Fund(s) including rollovers as defined under Section 402 of the Code and Transfers. Reinvested dividends, capital gains, and settlements arising from the Covered Fund(s) will not be considered Contract Contributions for the purpose of calculating the Benefit Base but will affect the Covered Fund Value.
Code – The Internal Revenue Code of 1986, as amended, and all related laws and regulations which are in effect during the term of the Contract and Certificate.
Company – Great-West Life & Annuity Insurance Company, the issuer of the Contract (also referred to as “we,” “us,” “our,” or Great-West).
Contract Owner – The owner of the Contract that is identified on the Contract Data Page, which generally is the Plan Sponsor.
Covered Fund – Interests in the investment options held in the Account designed for the GLWB, as follows:
| • | Great-West SecureFoundation® Balanced Fund |
| • | Great-West SecureFoundation® Lifetime Funds |
| • | Any other fund as approved by Great-West for the Contract and Certificate. |
Covered Fund Value – The aggregate value of each Covered Fund held in the Account.
Covered Person(s) – For purposes of this Contract, the person(s) whose age determines the GAW Percentage and on whose life the GAW Amount will be based. If there are two Covered Persons, the GAW Percentage will be based on the age of the younger life and the Installments can continue until the death of the second life. A joint Covered Person must be the GLWB Participant’s spouse and the 100% primary beneficiary under the Retirement Plan.
64
Distributions – Amounts paid to a GLWB Participant from a Covered Fund pursuant to the terms of the Retirement Plan and the Code.
Election Date – The date on which the Retirement Plan participant, Alternate Payee or Beneficiary elects the GLWB option in the Contract and pursuant to the terms of the Covered Fund(s) prospectus or disclosure document. The Election Date shall be the date upon which the initial Benefit Base is calculated. For the Great-West SecureFoundation® Lifetime Funds, the Election Date is also the Guarantee Trigger Date.
Excess Withdrawal – An amount either distributed or transferred from the Covered Fund(s) during the Accumulation Phase or any amount combined with all other amounts that exceeds the annual GAW during the Withdrawal Phase. The Excess Withdrawal reduces the Benefit Base, as described in the “Accumulation Phase” section. Neither the Guarantee Benefit Fee nor any other fees or charges assessed to the Covered Fund Value as directed by the Plan Sponsor and as agreed to by Great-West shall be treated as a Distribution or Excess Withdrawal for this purpose.
GLWB – A guaranteed lifetime withdrawal benefit.
GLWB Participant – A Retirement Plan participant, Alternate Payee or Beneficiary who is: (i) eligible to elect the GLWB; (ii) invested in a Covered Fund(s); and (iii) a Covered Person.
Guaranteed Annual Withdrawal (GAW) – The annualized withdrawal amount that is guaranteed for the lifetime of the Covered Person(s), subject to the terms of this Contract.
Guaranteed Annual Withdrawal Phase (GAW Phase) – The period of time between the Initial Installment Date and the first day of the Settlement Phase.
Guaranteed Annual Withdrawal Percentage (GAW%) – The percentage of the Benefit Base that determines the amount of the GAW. This percentage is based on the age of the Covered Person(s) as of the date we calculate the first Installment. If there are two Covered Persons the percentage is based on the age of the younger Covered Person, pursuant to Section 5.01.
Guarantee Benefit Fee – The asset charge periodically calculated and deducted from the GLWB Participant’s Covered Fund Value or assessed through another means of payment pursuant to the terms of the Contract and while the Contract is in force.
Guaranteed Lifetime Withdrawal Benefit (GLWB) – A payment option offered by the Retirement Plan that pays Installments during the life of the Covered Person(s). The Covered Person(s) will receive periodic payments in either monthly, quarterly, semiannual, or annual Installments that in total over a twelve month period equal the GAW.
Guarantee Trigger Date – For the Great-West SecureFoundation® Balanced Fund, it is the date that the Covered Fund is purchased. For the Great-West SecureFoundation® Lifetime Funds, the GLWB Participant does not purchase the GLWB until the first Business Day of the year that is ten years prior to the date in the name of the Great-West SecureFoundation® Lifetime Fund. The Guarantee Trigger Date is also the Election Date for the Great-West SecureFoundation® Lifetime Funds.
Initial Installment Date – The date of the first Installment under the GLWB, which must be a Business Day.
Installments – Periodic payments of the GAW during the GAW Phase and Settlement Phase. If the Covered Fund Value is less than the amount of the final Installment in the GAW Phase, Great-West will pay the Installment within 7 days from the Installment Date.
Installment Frequency Options – The options listed in theGAW section.
Plan Sponsor – An entity maintaining the Retirement Plan on behalf of Retirement Plan participants, Alternate Payees and Beneficiaries.
Qualified Domestic Relations Order (QDRO) – A domestic relations order that creates or recognizes the existence of an Alternate Payee’s right to, or assigns to an Alternate Payee the right to receive all or a portion of the benefits payable with respect to a GLWB Participant and that complies with the requirements of the Code, if applicable, that and is accepted and approved by the Contract Owner for the Retirement Plan, except as otherwise agreed.
Ratchet – An increase in the Benefit Base if the Covered Fund Value exceeds the current Benefit Base on the Ratchet Date.
Ratchet Date – During the Accumulation Phase, the Ratchet Date is the anniversary of the GLWB Participant’s Election Date and each anniversary thereafter. During the Withdrawal Phase, the Ratchet Date is the Initial Installment Date and each anniversary
65
thereafter. If any anniversary in the Accumulation and Withdrawal Phase is a non-Business Day, the Ratchet Date shall be the preceding Business Day for that year.
Request – An inquiry or instruction in a form satisfactory to Great-West. A valid Request must be: (i) received by Great-West at the Administrative Office in good order; and (ii) submitted in accordance with the provisions of the Contract, or as required by Great-West. The Request is subject to any action taken by Great-West before the Request was processed.
Reset – An optional GLWB Participant election during the Withdrawal Phase in which the current GAW Percentage and Benefit Base may be changed to the GLWB Participant’s Attained Age GAW Percentage and Covered Fund Value on the Ratchet Date.
Retirement Plan – The name of the plan as noted on the first page of the Contract.
Settlement Phase – The period when the Covered Fund Value has reduced to zero, but the Benefit Base is still positive. Installments continue under the terms of the Contract.
Spouse – A person recognized as a spouse under federal law. The term does not include a party to a registered domestic partnership, civil union, or similar formal relationship recognized under state law that is not denominated a marriage under that state’s law.
Transfer – The reinvestment or exchange of all or a portion of the Covered Fund Value to or from a Covered Fund to: (i) another Covered Fund; or (ii) another investment option offered under the Retirement Plan.
Vested % – The vested portion of each Covered Fund divided by the total Covered Fund Value.
66
APPENDIX A– COMPANY FINANCIAL STATEMENTS AND OTHER FINANCIAL INFORMATION
SELECTED FINANCIAL DATA
MANAGEMENT'S DISCUSSION AND ANALYSIS OF FINANCIAL CONDITION AND RESULTS OF OPERATIONS (FOR THE 12 MONTH PERIOD ENDING DECEMBER 31, 2018)
The following discussion of our financial condition and results of operations should be read in conjunction with our financial statements and notes to those statements included in this Appendix. The discussion and analysis in this Appendix includes certain forward-looking statements that are subject to risks, uncertainties and other factors, as described in “Risk Factors Regarding the Company” and elsewhere in this prospectus, that could cause our actual growth, results of operations, performance, financial position and business prospects and opportunities in 2019 and beyond to differ materially from those expressed in, or implied by, those forward-looking statements. See “Forward-Looking Statements.”
Selected Financial Data
The following is a summary of selected statutory financial information for the Company. The information should be read in conjunction with and is qualified in its entirety by the information contained in “Management’s Discussion and Analysis of Financial Condition and Results of Operations,” and the statutory financial statements and notes thereto appearing in “Financial Statements and Supplementary Data” in this Appendix.
The selected statutory financial information for the years ended December 31, 2018, 2017 and 2016, and at December 31, 2018 and 2017, has been derived in part from the Company’s audited statutory financial statements included in this Appendix. The selected Statement of Operations data for the years ended December 31, 2015, and 2014, and the selected Statutory Statement of Admitted Assets, Liabilities, Capital and Surplus data at December 31, 2016, 2015, and 2014, have been derived in part from the Company’s statutory financial statements not included elsewhere herein.
| As of and for the Year Ended December 31, | |||||||||
| (In millions) | 2018 | 2017 | 2016 | 2015 | 2014 | ||||
| Total income | $7,365 | $6,481 | $6,801 | $7,065 | $6,868 | ||||
| Total benefits and expenses | 7,047 | 6,222 | 6,692 | 6,821 | 6,598 | ||||
| Income from continuing operations | 318 | 259 | 109 | 244 | 270 | ||||
| Dividends to policyholders | 31 | 39 | 46 | 55 | 58 | ||||
| Federal income tax (benefit) expense | (18) | 51 | (39) | (6) | 69 | ||||
| Net realized capital gains (losses) less capital gains tax and transfers to interest maintenance reserve | 305 | 169 | 102 | 195 | 143 | ||||
| Net realized capital gains (losses) less capital gains tax and transfers to interest maintenance reserve | 10 | 1 | (1) | (8) | (6) | ||||
| Net income | $315 | $170 | $101 | $187 | $137 | ||||
| Dividends declared | $152 | $145 | $126 | $140 | $316 | ||||
| Invested assets | $30,035 | $28,849 | $27,871 | $26,399 | $25,444 | ||||
| Separate account assets | 24,655 | 28,197 | 27,495 | 27,048 | 28,081 | ||||
| Total assets | 55,786 | 58,010 | 56,436 | 54,461 | 54,523 | ||||
| Total aggregate reserves | 27,778 | 26,860 | 25,945 | 24,805 | 23,848 | ||||
| Separate account liabilities | 24,655 | 28,197 | 27,495 | 27,048 | 28,082 | ||||
| Total liabilities | 54,459 | 56,881 | 55,383 | 53,346 | 53,523 | ||||
| Total capital and surplus | 1,327 | 1,130 | 1,053 | 1,115 | 1,001 | ||||
Management’s Discussion and Analysis of Financial Condition and Results of Operations
Management’s discussion and analysis of financial condition and results of operations of the Company for the three years ended December 31, 2018, 2017 and 2016, are as follows. This management discussion and analysis should be read in conjunction with the financial data contained in this Appendix in “Selected Financial Data,” and in “Financial Statements and Supplementary Data.”
A-1
Forward Looking Statements
This Management’s Discussion and Analysis of Financial Condition and Results of Operations and other portions of this prospectus contain forward-looking statements. Forward-looking statements are statements not based on historical information and that relate to future operations, strategies, financial results, or other developments. In particular, statements using words such as “may,” “would,” “could,” “should,” “estimates,” “expected,” “anticipate,” “believe,” or words of similar import generally involve forward-looking statements. Without limiting the foregoing, forward-looking statements include statements that represent the Company’s beliefs concerning future or projected levels of sales of its products, investment spreads or yields, or the earnings or profitability of the Company’s activities.
Forward-looking statements are necessarily based upon estimates and assumptions that are inherently subject to significant business, economic, and competitive uncertainties and contingencies, many of which are beyond the Company’s control and many of which, with respect to future business decisions, are subject to change. Some of these risks are described in “Risk Factors” in this Prospectus of this report. These uncertainties and contingencies can affect actual results and could cause actual results to differ materially from those expressed in any forward-looking statements made by, or on behalf of, the Company. Whether or not actual results differ materially from forward-looking statements may depend on numerous foreseeable and unforeseeable events or developments, some of which may be global or national in scope, such as general economic conditions and interest rates, some of which may be related to the insurance industry generally, such as pricing competition, regulatory developments and industry consolidation, and others of which may relate to the Company specifically, such as credit, volatility, and other risks associated with its investment portfolio and other factors.
Executive Summary
The Company and its subsidiaries are providers of insurance and other financial service products to individual, corporate, institutional, and government customers. Management considers the ability to continue to expand its presence in the United States defined contribution and institutional insurance markets to be its primary points of focus. The life insurance, savings, and investments marketplace is highly competitive. Competitors include insurance companies, banks, investment advisors, mutual fund companies, and certain service and professional organizations.
The Individual Markets segment distributes life insurance, annuity, and retirement products to both individuals and businesses through various distribution channels. Life insurance products in-force include participating and non-participating term life, whole life, universal life, and variable universal life. The Empower Retirement segment provides various retirement plan products (including IRAs) and investment options, as well as comprehensive administrative and recordkeeping services for financial institutions and employers, which include educational, advisory, enrollment, and communication services to employer-sponsored defined contribution plans and associated defined benefit plans. Defined contribution plans provide for benefits based upon the value of contributions to, and investment returns on, an individual’s account. The Company’s Other reporting segment is substantially comprised of corporate items not directly allocated to the other operating segments and interest expense on long-term debt.
Recent Events
On April 18, 2018, the Securities and Exchange Commission (“SEC”) released its proposal on the best interest standards applicable to brokers and advisors. The Company provided comments to the SEC in August 2018. The Company will monitor any developments or proposed revisions and is preparing to comply with the standards.
The Tax Reconciliation Act, which was signed in December 2017, among other changes, lowered the U.S. corporate federal income tax rate from 35% to 21% effective on January 1, 2018. As a result, net earnings in 2018 reflect net income, tax effected at the lower 21% rate. Other provisions of the tax bill did not have a material effect on year-to-date taxable income in 2018.
During the second quarter of 2018, the Company issued a surplus note totaling $346 million and redeemed a surplus note totaling $333 million. The Company also recognized an increase in the capital and surplus account of $39 million after-tax on an interest rate swap that was hedging the surplus note that was redeemed.
The Company entered into a coinsurance with funds withheld / modified coinsurance agreement with London Life International Reinsurance Corporation (“LLIRC”), an affiliate, to cede portions of its group annuity, whole life, and universal life policies effective December 31, 2016. On January 1, 2018, the Company terminated this 2016 agreement. On December 31, 2018, the Company entered into a modified coinsurance agreement with LLIRC pursuant to which it ceded portions of its group annuity policies. These transactions had large impacts to financial statement lines, but no material impact to statutory net income.
A-2
On January 24, 2019, the Company announced that it had entered into an agreement with Protective Life Insurance Company (“Protective”) to sell, via indemnity reinsurance, substantially all of its non-participating individual life insurance and annuity business and group life and health business. The transaction is in its initial stage, and is expected to close in the first half of 2019 subject to regulatory and customary closing conditions. On the closing date of the proposed transaction, the Company will transfer to Protective assets equal to the statutory liabilities being reinsured and will receive a ceding commission (subject to post-closing adjustments) from Protective in consideration of the transferred business. The Company will retain a small block of participating life insurance policies which will be administered by Protective Life following the close of the transaction.
Market Conditions
The S&P 500 index ended 2018 down by 6% as compared to 2017, and 2017 was up by 19% when compared to 2016. The average of the S&P 500 index during the year ended December 31, 2018, was up by 12% when compared to the average for the year ended December 31, 2017, and the average was up by 17% for the year ended December 31, 2017, when compared to the average for the year ended December 31, 2016.
| Year Ended December 31, | |||||||||
| S&P 500 Index | 2018 | 2017 | 2016 | 2015 | 2014 | ||||
| Index Close | 2,507 | 2,674 | 2,239 | 2,044 | 2,059 | ||||
| Index Average | 2,744 | 2,448 | 2,094 | 2,061 | 1,931 | ||||
Variable asset-based fees earned by the Company fluctuate with changes in participant account balances. Participant account balances change due to cash flow and market gains and losses, which are primarily associated with changes in the United States equities market. Fee income increased by $31 million, or 8%, to $411 million for the year ended December 31, 2018, when compared to 2017. The increase was primarily related to asset-based variable fee income resulting from increased average asset levels driven by sales and higher average equity market levels.
The 10-year U.S. Treasury rate ended 2018 up by 29 basis points as compared to 2017, while 2017 was down by 5 basis points when compared to 2016. The average of the 10-year U.S. Treasury rate during the year ended December 31, 2018 ended up by 58 basis points when compared to the average for the year ended December 31, 2017, and the average was up by 50 basis points for the year ended December 31, 2017, when compared to the average for the year ended December 31, 2016.
| Year Ended December 31, | |||||||||
| 10-Year Treasury Rate | 2018 | 2017 | 2016 | 2015 | 2014 | ||||
| Close | 2.69% | 2.40% | 2.45% | 2.27% | 2.17% | ||||
| Average | 2.91% | 2.33% | 1.83% | 2.14% | 2.54% | ||||
Summary of Critical Accounting Judgments and Estimates
The Company prepares its statutory financial statements in conformity with accounting practices prescribed or permitted by the Division. The Division requires that insurance companies domiciled in the State of Colorado prepare their statutory financial statements in accordance with the National Association of Insurance Commissioners Accounting Practices and Procedures Manual (“NAIC SAP”), subject to any deviations prescribed or permitted by the State of Colorado Insurance Commissioner.
The only permitted deviation that impacts the Company allows the Company to account for certain separate account products at book value instead of fair value. The Division has not permitted the Company to adopt any other accounting practices that have an impact on the Company’s statutory financial statements as compared to NAIC SAP or the Division’s prescribed accounting practices. There is no impact to either capital and surplus or net income as a result of the prescribed accounting practice.
The Company has identified the following accounting policies, judgments, and estimates as critical in that they involve a higher degree of judgment and are subject to a significant degree of variability:
| • | Valuation of investments; |
| • | Impairment of investments; |
| • | Valuation of derivatives and related hedge accounting; |
| • | Valuation of policy benefits and; |
| • | Valuation of deferred taxes; |
A-3
Valuation of investments
The Company’s investments are in bonds, mortgage loans, real estate, contract loans, and other investments. The Company’s investments are exposed to three primary sources of risk: credit, interest rate, and market valuation. The financial statement risks, stemming from such investment risks, are those associated with the determination of fair values.
The fair values for bonds are generally based upon evaluated prices from independent pricing services. In cases where these prices are not readily available, fair values are estimated by the Company. To determine estimated fair value for these instruments, the Company generally utilizes discounted cash flow models with market observable pricing inputs such as spreads, average life, and credit quality. Fair value estimates are made at a specific point in time, based on available market information and judgments about financial instruments, including estimates of the timing and amounts of expected future cash flows and the credit standing of the issuer or counterparty. The use of different market assumptions and/or estimation methodologies may have a material effect on the estimated fair value amounts of the Company’s financial instruments.
Impairment of investments
The Company evaluates its general account investments on a quarterly basis to determine whether there has been an other-than-temporary decline in fair value below the amortized cost basis. Assumptions and estimates about the issuer’s operations and ability to generate future cash flows are inherent in management’s evaluation of investments for other- than-temporary impairments (“OTTI”). The assessment of whether an OTTI has occurred is based upon management’s case-by-case evaluation of the underlying reasons for the decline in fair value of each individual security. An OTTI is recorded (a) if it is probable that the Company will be unable to collect all amounts due according to the contractual terms in effect at the date of acquisition, (b) if the Company has the intent to sell the investment or (c) for non-interest related declines in value and where the Company does not have the intent and ability at the reporting date, to hold the bond until its recovery. Management considers a wide range of factors regarding the security issuer and uses its best judgment in evaluating the cause of the decline in its estimated fair value and in assessing the prospects for near-term recovery. While all available information is taken into account, it is difficult to predict the ultimate recoverable amount from a distressed or impaired security. The evaluation of impairments is a quantitative and qualitative process, which is subject to risks and uncertainties and is intended to determine whether declines in the fair value of investments should be recognized in current period earnings. The risks and uncertainties include changes in general economic conditions, the issuer’s financial condition or near term recovery prospects, the effects of changes in interest rates or credit spreads, and the recovery period.
If an OTTI has occurred on loan-backed and structured securities, the impairment amount is bifurcated into two components: the amount related to the non-interest loss and the amount attributed to other factors. The calculation of expected cash flows utilized during the impairment evaluation and bifurcation process is determined using judgment and the best information available to the Company including default rates, credit ratings, collateral characteristics, and current levels of subordination.
The determination of the calculation and the adequacy of the mortgage allowance for credit loss and mortgage impairments (when management deems it probable that the Company will be unable to collect all amounts due according to the contractual terms of the loan agreement) involve judgments that incorporate qualitative and quantitative Company and industry mortgage performance data. Management’s periodic evaluation and assessment of the adequacy of the mortgage provision allowance and the need for mortgage impairments is based on known and inherent risks in the portfolio, adverse situations that may affect the borrower’s ability to repay, the fair value of the underlying collateral, composition of the loan portfolio, current economic conditions, loss experience, and other relevant factors.
Valuation of derivatives and related hedge accounting
Derivatives that qualify for hedge accounting treatment are valued using the valuation method (either amortized cost or fair value) consistent with the underlying hedged asset or liability. Derivatives where hedge accounting is either not elected or that are not eligible for hedge accounting are stated at fair value; changes in fair values are recognized in unassigned surplus in the period of change.
The fair value of derivatives is determined by quoted market prices or through the use of pricing models. The determination of fair value, when quoted market values are not available, is based on valuation methodologies and assumptions deemed appropriate under the circumstances. Values can be affected by changes in interest rates, foreign currency exchange rates, financial indices, credit spreads, market volatility, and liquidity. Judgment is applied in determining the availability and application of hedge accounting designations and the appropriate accounting treatment under accounting guidance. If it were determined that hedge accounting designations were not appropriately applied, reported capital and surplus could be materially affected. Differences in judgment as to the availability and application of hedge accounting designations and the appropriate accounting treatment may
A-4
result in a differing impact on the financial statements of the Company from that previously reported. Assessments of hedge effectiveness and measurements of ineffectiveness of hedging relationships are also subject to interpretations and estimations and different interpretations or estimates may have a material effect on the amount reported in capital and surplus.
Policy reserves
Life insurance and annuity policy reserves with life contingencies are computed on the basis of statutory mortality and interest requirements and without consideration for withdrawals. Annuity contract reserves without life contingencies are computed on the basis of statutory interest requirements
Policy reserves for life insurance are valued in accordance with the provision of applicable statutory regulations. Life insurance reserves are determined principally using the Commissioner’s Reserve Valuation Method, using the statutory mortality and interest requirements, without consideration for withdrawals. Some policies contain a surrender value in excess of the reserve as legally computed. This excess is calculated and recorded on a policy-by-policy basis.
Premium stabilization reserves are calculated for certain policies to reflect the Company’s estimate of experience refunds and interest accumulations on these policies. The reserves are invested by the Company. The income earned on these investments is accumulated in this reserve and is used to mitigate future premium rate increases for such policies.
Policy reserves ceded to other insurance companies are recorded as a reduction of the reserve liabilities. The cost of reinsurance related to long-duration contracts is accounted for over the life of the underlying reinsured policies using assumptions consistent with those used to account for the underlying policies.
Policy and contract claims include provisions for reported life and health claims in process of settlement, valued in accordance with the terms of the related policies and contracts, as well as provisions for claims incurred but not reported based primarily on prior experience of the Company. As such, amounts are estimates, and the ultimate liability may differ from the amount recorded. Any changes in estimates will be reflected in the results of operations when additional information becomes known.
The liabilities for health claim reserves are determined using historical run-out rates, expected loss ratios and statistical analysis. The Company provides for significant claim volatility in areas where experience has fluctuated. The liabilities represent estimates of the ultimate net cost of all reported and unreported claims which are unpaid at year-end. Those estimates are subject to considerable variability in claim severity and frequency. The estimates are continually reviewed and adjusted as necessary as experience develops or new information becomes known; such adjustments are included in current operations.
Valuation of deferred taxes
A net deferred tax asset is included in the Statutory Statements of Admitted Assets, Liabilities, Capital and Surplus which is recorded using the asset and liability method in which deferred tax assets and liabilities are recorded for expected future tax consequences of events that have been recognized in either the Company’s statutory financial statements or tax returns. Deferred income tax assets are subject to admissibility limitations prescribed by statutory accounting principles which include estimates of future tax events. The change in deferred income taxes is treated as a component of the change in unassigned funds.
A-5
Company Results of Operations
Year ended December 31, 2018, compared with the year ended December 31, 2017
The following is a summary of certain financial data of the Company:
| Year Ended December 31, | Increase (decrease) | Percentage change | |||||
| Statement of Operations data (In millions) | 2018 | 2017 | |||||
| Premium income and annuity consideration | $7,593 | $5,271 | $2,322 | 44% | |||
| Net investment income | 1,307 | 1,267 | 40 | 3% | |||
| Fee and miscellaneous income | 411 | 380 | 31 | 8% | |||
| Reserve adjustment on reinsurance ceded | (1,976) | (490) | (1,486) | (303)% | |||
| Other | 30 | 53 | (23) | (43)% | |||
| Total income | 7,365 | 6,481 | 884 | 14% | |||
| Policyholder benefits | 6,587 | 5,566 | 1,021 | 18% | |||
| Increase in aggregate reserves for life and accident health policies and contracts | 918 | 916 | 2 | —% | |||
| Other insurance benefits, expenses and commissions | 686 | 724 | (38) | (5)% | |||
| Net transfers from separate accounts | (1,112) | (945) | (167) | (18)% | |||
| Total benefits and expenses | 7,079 | 6,261 | 818 | 13% | |||
| Net gain from operations after dividends to policyholders and before federal income taxes and net realized capital gains | 286 | 220 | 66 | 30% | |||
| Federal income tax (benefit) expense | (18) | 51 | (69) | (135)% | |||
| Net gain from operations before net realized capital gains | 304 | 169 | 135 | 80% | |||
| Net realized capital gains less capital gains tax and transfers to interest maintenance reserve | 11 | 1 | 10 | 1,000% | |||
| Statutory net income | $315 | $170 | $145 | 85% | |||
The Company’s statutory net income increased by $145 million, or 85%, to $315 million. The increase was primarily due to higher net investment income, higher fee income, lower operating expenses and lower income taxes.
Premium income and annuity consideration increased by $2,322 million, or 44%, to $7,593 million due to the LLIRC reinsurance transactions previously discussed. Excluding the LLIRC reinsurance transactions, premiums increased $217 million, or 4%, due to increased sales.
Net investment income increased by $40 million, or 3%, to $1,307 million primarily as a result of higher dividends received from subsidiaries and higher average invested assets.
Fee income increased by $31 million, or 8%, to $411 million primarily related to an increase in asset-based variable fee income resulting from increased average asset levels, which were driven by sales and higher average equity market levels.
The reserve adjustment against income on reinsurance ceded increased by $1,486 million, or 303%, to $1,976 million primarily due to the LLIRC reinsurance transactions.
Policyholder benefits increased by $1,021 million, or 18%, to $6,587 million. Excluding the LLIRC reinsurance transactions, policyholder benefits increased $785 million, or 14%, primarily due to an increase in general account and separate account surrenders.
Other insurance benefits, expenses and commissions decreased by $38 million, or 5%, to $686 million. Excluding the LLIRC reinsurance transactions, other insurance benefits, expenses and commissions decreased by $20 million, or 3%, primarily due to expense management and the completion of integration activities in 2017.
Net transfers from separate accounts changed by $167 million, or 18% to $1,112 million primarily due to higher separate account surrenders in 2018.
A-6
Federal tax expense changed to a benefit of $18 million in 2018 compared to an expense of $51 million in 2017 primarily due to the utilization of tax credits and a lower tax rate.
Year ended December 31, 2017, compared with the year ended December 31, 2016
The following is a summary of certain financial data of the Company:
| Year Ended December 31, | Increase (decrease) | Percentage change | |||||
| Statement of Operations data (In millions) | 2017 | 2016 | |||||
| Premium income and annuity consideration | $5,271 | $(398) | $5,669 | 1,424% | |||
| Net investment income | 1,267 | 1,236 | 31 | 3% | |||
| Fee and miscellaneous income | 380 | 306 | 74 | 24% | |||
| Reserve adjustment on reinsurance ceded | (490) | 5,628 | (6,118) | (109)% | |||
| Other | 53 | 29 | 24 | 83% | |||
| Total income | 6,481 | 6,801 | (320) | (5)% | |||
| Policyholder benefits | 5,566 | 4,971 | 595 | 12% | |||
| Increase in aggregate reserves for life and accident health policies and contracts | 916 | 1,140 | (224) | (20)% | |||
| Other insurance benefits, expenses and commissions | 724 | 727 | (3) | —% | |||
| Net transfers from separate accounts | (945) | (101) | (844) | (836)% | |||
| Total benefits and expenses | 6,261 | 6,737 | (476) | (7)% | |||
| Net gain from operations after dividends to policyholders and before federal income taxes and net realized capital gains | 220 | 64 | 156 | 244% | |||
| Federal income tax expense (benefit) | 51 | (38) | 89 | 234% | |||
| Net gain from operations before net realized capital gains | 169 | 102 | 67 | 66% | |||
| Net realized capital gains (losses) less capital gains tax and transfers to interest maintenance reserve | 1 | (1) | 2 | 200% | |||
| Statutory net income | $170 | $101 | $69 | 68% | |||
The Company’s statutory net income increased by $69 million, or 68%, to $170 million. The increase was primarily due to higher net investment income, higher fee income, and lower operating expenses, partially offset by higher income taxes.
Premium income and annuity consideration increased by $5,669 million, or 1,424%, to $5,271 million primarily due to the LLIRC reinsurance transactions previously discussed. Excluding the LLIRC reinsurance transactions, premium incomes and annuity consideration decreased $772 million, or 13%, due to a decrease in general account and separate account premiums.
Net investment income increased $31 million, or 3%, to $1,267 million primarily as a result of higher average invested assets partially offset by lower yields.
Fee income increased $74 million, or 24%, to $380 million primarily related to an increase in asset-based variable fee income resulting from increased average asset levels, which were driven by sales and higher average equity market levels.
Reserve adjustment on reinsurance ceded decreased by $6,118 million, or 109%, to $(490) million primarily due to the LLIRC reinsurance transactions.
Policyholder benefits increased by $595 million, or 12%, to $5,566 million. Excluding the LLIRC reinsurance transactions, policyholder benefits increased $831 million, or 17%, primarily due to an increase in general account and separate account surrenders.
Net transfers from separate accounts changed by $844 million, or 836%, to $945 million due to lower separate account sales in 2017.
Other insurance benefits, expenses and commissions decreased by $3 million to $724 million. Excluding the LLIRC reinsurance transactions, other insurance benefits, expenses and commissions decreased by $21 million, or 3%, primarily due to a $39 million
A-7
decrease in operating expenses due to expense management and the completion of integration activities in 2017. This was partially offset by an $18 million increase in commissions due to higher commission-based sales.
Federal tax expense changed to an expense of $51 million in 2017 compared to a benefit of $38 million in 2016 primarily due to an increase in gain from operations before federal income tax.
Individual Markets Segment Results of Operations
Year ended December 31, 2018, compared with the year ended December 31, 2017
The following is a summary of certain financial data of the Individual Markets segment:
| Year Ended December 31, | Increase (decrease) | Percentage change | |||||
| Statement of Operations data (In millions) | 2018 | 2017 | |||||
| Premium income and annuity consideration | $5,662 | $1,610 | $4,052 | 252% | |||
| Net investment income | 754 | 749 | 5 | 1% | |||
| Fee and miscellaneous income | 128 | 112 | 16 | 14% | |||
| Reserve adjustment on reinsurance ceded | (3,987) | (340) | (3,647) | (1,073)% | |||
| Other | 32 | 34 | (2) | (6)% | |||
| Total income | 2,589 | 2,165 | 424 | 20% | |||
| Policyholder benefits | 941 | 781 | 160 | 20% | |||
| Increase in aggregate reserves for life and accident health policies and contracts | 484 | 582 | (98) | (17)% | |||
| Other insurance benefits, expenses and commissions | 191 | 207 | (16) | (8)% | |||
| Net transfers from separate accounts | 819 | 449 | 370 | 82% | |||
| Total benefits and expenses | 2,435 | 2,019 | 416 | 21% | |||
| Net gain from operations after dividends to policyholders and before federal income taxes and net realized capital gains | 154 | 146 | 8 | 5% | |||
| Federal income tax expense | — | 49 | (49) | (100)% | |||
| Net gain from operations before net realized capital gains | 154 | 97 | 57 | 59% | |||
| Net realized capital gains (losses) less capital gains tax and transfers to interest maintenance reserve | 6 | 1 | 5 | 500% | |||
| Statutory net income | $160 | $98 | $62 | 63% | |||
Statutory net income for the Individual Markets segment increased by $62 million, or 63%, to $160 million. The increase was primarily due to higher net investment income, higher fee income, lower operating expenses and lower income tax expenses, partially offset by higher policyholder benefits.
Premium income and annuity consideration increased by $4,052 million, or 252%, to $5,662 million primarily due to the LLIRC reinsurance transactions previously discussed. Excluding the LLIRC reinsurance transactions, premiums increased by $7 million.
Net investment income increased by $5 million, or 1%, to $754 million primarily as a result of higher average invested assets.
Fee income increased by $16 million, or 14%, to $128 million primarily related to an increase in asset-based variable fee income resulting from increased average asset levels, which were driven by sales and higher average equity market levels
The reserve adjustment on reinsurance ceded increased by $3,647 million, or 1,073%, to $3,987 million primarily due to the LLIRC reinsurance transactions.
Policyholder benefits increased by $160 million, or 20%, to $941 million. Excluding the LLIRC reinsurance transactions, policyholder benefits increased by $48 million, or 6% due to unfavorable mortality experience.
Net transfers from separate accounts increased by $370 million, or 82%, to $819 million primarily due to lower separate account surrenders in 2018.
A-8
Federal tax expense decreased by $49 million, or 100%, to $0 primarily due to the utilization of tax credits and a lower tax rate.
Year ended December 31, 2017, compared with the year ended December 31, 2016
The following is a summary of certain financial data of the Individual Markets segment:
| Year Ended December 31, | Increase (decrease) | Percentage change | |||||
| Statement of Operations data (In millions) | 2017 | 2016 | |||||
| Premium income and annuity consideration | $1,610 | $(2,656) | $4,266 | 161% | |||
| Net investment income | 749 | 732 | 17 | 2% | |||
| Fee and miscellaneous income | 112 | 95 | 17 | 18% | |||
| Reserve adjustment on reinsurance ceded | (340) | 3,380 | (3,720) | (110)% | |||
| Other | 34 | 26 | 8 | 31% | |||
| Total income | 2,165 | 1,577 | 588 | 37% | |||
| Policyholder benefits | 781 | 831 | (50) | (6)% | |||
| Increase in aggregate reserves for life and accident health policies and contracts | 582 | 117 | 465 | 397% | |||
| Other insurance benefits, expenses and commissions | 207 | 175 | 32 | 18% | |||
| Net transfers from separate accounts | 449 | 358 | 91 | 25% | |||
| Total benefits and expenses | 2,019 | 1,481 | 538 | 36% | |||
| Net gain from operations after dividends to policyholders and before federal income taxes and net realized capital gains | 146 | 96 | 50 | 52% | |||
| Federal income tax expense | 49 | 21 | 28 | 133% | |||
| Net gain from operations before net realized capital gains | 97 | 75 | 22 | 29% | |||
| Net realized capital gains (losses) less capital gains tax and transfers to interest maintenance reserve | 1 | (1) | 2 | 200% | |||
| Statutory net income | $98 | $74 | $24 | 32% | |||
Statutory net income for the Individual Markets segment increased by $24 million, or 32%, to $98 million. The increase was primarily due to higher premium income and annuity consideration, net investment income and fee income.
Premium income and annuity consideration increased by $4,266 million, or 161%, to $1,610 million primarily due to the LLIRC reinsurance transactions previously discussed. Excluding the LLIRC reinsurance transactions, premiums increased $154 million, or 11%, primarily due to increased annuity sales.
Net investment income increased $17 million, or 2%, to $749 million primarily as a result of higher average invested assets partially offset by lower yields.
Fee income increased $17 million, or 18%, to $112 million primarily related to an increase in asset-based variable fee income resulting from increased average asset levels, which were driven by sales and higher average equity market levels.
Reserve adjustment on reinsurance ceded decreased by $3,720 million, or 110%, to $(340) million primarily due to the LLIRC reinsurance transactions.
Increase in aggregate reserves for life and accident health policies and contracts changed by $465 million, or 397%, to $582 million primarily due to the LLIRC reinsurance transactions. Excluding the LLIRC reinsurance transactions, increase in aggregate reserves increased $106 million, or 22%, primarily due to increased premiums.
Other insurance benefits, expenses and commissions increased by $32 million, or 18%, to $207 million. Excluding the LLIRC reinsurance transactions, other insurance benefits, expenses and commissions increased by $16 million, or 9%, primarily due to an $11 million increase in commissions due to higher sales.
Net transfers from separate accounts increased by $91 million, or 25%, to $449 million primarily due to higher separate account premiums in 2017.
A-9
Empower Retirement Segment Results of Operations
Year ended December 31, 2018, compared with the year ended December 31, 2017
The following is a summary of certain financial data of the Empower Retirement segment:
| Year Ended December 31, | Increase (decrease) | Percentage change | |||||
| Statement of Operations data (In millions) | 2018 | 2017 | |||||
| Premium income and annuity consideration | 1,931 | $3,661 | $(1,730) | (47)% | |||
| Net investment income | 537 | 513 | 24 | 5% | |||
| Fee and miscellaneous income | 272 | 257 | 15 | 6% | |||
| Reserve adjustment on reinsurance ceded | 2,011 | (150) | 2,161 | 1,441% | |||
| Other | (2) | 19 | (21) | (111)% | |||
| Total income | 4,749 | 4,300 | 449 | 10% | |||
| Policyholder benefits | 5,646 | 4,785 | 861 | 18% | |||
| Increase in aggregate reserves for life and accident health policies and contracts | 434 | 334 | 100 | 30% | |||
| Other insurance benefits, expenses and commissions | 475 | 477 | (2) | —% | |||
| Net transfers from separate accounts | (1,931) | (1,393) | (538) | (39)% | |||
| Total benefits and expenses | 4,624 | 4,203 | 421 | 10% | |||
| Net gain from operations after dividends to policyholders and before federal income taxes and net realized capital gains | 125 | 97 | 28 | 29% | |||
| Federal income tax expense | (23) | 14 | (37) | (264)% | |||
| Net gain from operations before net realized capital gains | 148 | 83 | 65 | 78% | |||
| Net realized capital gains (losses) less capital gains tax and transfers to interest maintenance reserve | 5 | — | 5 | 100% | |||
| Statutory net income | 153 | $83 | $70 | 84% | |||
Statutory net income for the Empower Retirement segment increased by $70 million, or 84%, to $153 million. The increase was primarily due to higher fee income and lower income taxes.
Premium income and annuity consideration decreased by $1,730 million, or 47% to $1,931 million primarily due to the reinsurance with LLIRC previously mentioned. Excluding the LLIRC reinsurance transactions, premium income increased $219 million, or 6%, due to increased general account sales.
Net investment income increased $24 million, or 5%, to $537 million primarily as a result of higher dividends received from subsidiaries and higher average invested assets.
Fee income increased $15 million, or 6%, to $272 million primarily related to an increase in asset-based variable fee income resulting from increased average asset levels, which were driven by sales and higher average equity market levels
Reserve adjustment on reinsurance ceded increased by $2,161 million, or 1,441%, to $2,011 million primarily due to the LLIRC reinsurance transactions.
Policyholder benefits increased by $861 million, or 18%, to $5,646 million. Excluding the LLIRC reinsurance transactions, policyholder benefits increased $737 million, or 15%, primarily due to an increase in general account and separate account surrenders.
Net transfers from separate accounts changed by $538 million, or 39% to $1,931 million due to higher separate account surrenders.
Federal tax expense changed to a benefit of $23 million in 2018 compared to an expense of $14 million in 2017 primarily due to the utilization of tax credits and a lower tax rate.
A-10
Year ended December 31, 2017, compared with the year ended December 31, 2016
The following is a summary of certain financial data of the Empower Retirement segment:
| Year Ended December 31, | Increase (decrease) | Percentage change | |||||
| Statement of Operations data (In millions) | 2017 | 2016 | |||||
| Premium income and annuity consideration | $3,661 | $2,258 | $1,403 | 62% | |||
| Net investment income | 513 | 509 | 4 | 1% | |||
| Fee and miscellaneous income | 257 | 201 | 56 | 28% | |||
| Reserve adjustment on reinsurance ceded | (150) | 2,248 | (2,398) | (107)% | |||
| Other | 19 | 3 | 16 | 533% | |||
| Total income | 4,300 | 5,219 | (919) | (18)% | |||
| Policyholder benefits | 4,785 | 4,140 | 645 | 16% | |||
| Increase in aggregate reserves for life and accident health policies and contracts | 334 | 1,023 | (689) | (67)% | |||
| Other insurance benefits, expenses and commissions | 477 | 534 | (57) | (11)% | |||
| Net transfers from separate accounts | (1,393) | (459) | (934) | (203)% | |||
| Total benefits and expenses | 4,203 | 5,238 | (1,035) | (20)% | |||
| Net gain (loss) from operations after dividends to policyholders and before federal income taxes and net realized capital gains | 97 | (19) | 116 | 611% | |||
| Federal income tax expense | 14 | (51) | 65 | 127% | |||
| Statutory net income | $83 | $32 | $51 | 159% | |||
Statutory net income for the Empower Retirement segment increased by $51 million, or 159%, to $83 million. The increase was primarily due to higher fee income and lower operating expenses, partially offset by higher income taxes.
Premium income and annuity consideration increased by $1,403 million, or 62%, to $3,661 million primarily due to the reinsurance with LLIRC previously mentioned. Excluding LLIRC reinsurance transactions, premium income and annuity consideration decreased $926 million, or 20%, due to a decrease in general account and separate account premiums.
Fee income increased $56 million, or 28%, to $257 million primarily related to an increase in asset-based variable fee income resulting from increased average asset levels, which were driven by sales and higher average equity market levels
Reserve adjustment on reinsurance ceded decreased by $2,398 million, or 107%, to $(150) million primarily due to the LLIRC reinsurance transactions.
Policyholder benefits increased by $645 million, or 16%, to $4,785 million. Excluding the LLIRC reinsurance transactions, policyholder benefits increased $769 million, or 19%, primarily due to an increase in general account and separate account surrender benefits.
Aggregate reserves for life and accident health policies and contracts decreased by $689 million, or 67%, to $334 million. Excluding the LLIRC reinsurance transactions, aggregate reserves decreased $761 million, or 69%, primarily due to lower premiums and higher policyholder benefits.
Other insurance benefits, expenses and commissions decreased by $57 million, 11%, to $477 million. Excluding the LLIRC reinsurance transactions, other insurance benefits, expenses and commissions decreased by $59 million, or 11%, primarily due to a decrease in operating expenses related to expense management and the completion of integration activities in 2017.
Net transfers from separate accounts changed by $934 million, or 203%, to $1,393 million due to lower separate account premiums.
Federal tax expense changed to an expense of $14 million in 2017 compared to a benefit of $51 million in 2016 primarily due to an increase in gain from operations before federal income tax.
A-11
Other Segment Results of Operations
Year ended December 31, 2018, compared with the year ended December 31, 2017
The following is a summary of certain financial data of the Other segment:
| Year Ended December 31, | Increase (decrease) | Percentage change | |||||
| Statement of Operations data (In millions) | 2018 | 2017 | |||||
| Net investment income | $16 | $5 | $11 | 220% | |||
| Fee and miscellaneous income | 11 | 11 | —% | ||||
| Total income | 27 | 16 | 11 | 69% | |||
| Other expenses and commissions | 20 | 39 | (19) | (49)% | |||
| Total benefits and expenses | 20 | 39 | (19) | (49)% | |||
| Net gain (loss) from operations after dividends to policyholders and before federal income taxes and net realized capital gains | 7 | (23) | 30 | 130% | |||
| Federal income tax expense (benefit) | 5 | (12) | 17 | 142% | |||
| Statutory net income (loss) | $2 | $(11) | $13 | 118% | |||
Statutory net income (loss) for the Other segment increased by $13 million, from a loss of $11 million to a gain of $2 million in 2018. The increase was primarily due to an increase in net investment income related to a one-time interest rate swap gain and a decrease in operating expense with the completion of integration activities in 2017. This was partially offset by an increase in federal income tax expenses primarily due to taxes on the one-time interest rate swap gain.
Year ended December 31, 2017, compared with the year ended December 31, 2016
The following is a summary of certain financial data of the Other segment:
| Year Ended December 31, | Increase (decrease) | Percentage change | |||||
| Statement of Operations data (In millions) | 2017 | 2016 | |||||
| Net investment income (loss) | $5 | $(5) | $10 | 200% | |||
| Fee and miscellaneous income | 11 | 10 | 1 | 10% | |||
| Total income | 16 | 5 | 11 | 220% | |||
| Other expenses and commissions | 39 | 18 | 21 | 117% | |||
| Total benefits and expenses | 39 | 18 | 21 | 117% | |||
| Net loss from operations after dividends to policyholders and before federal income taxes and net realized capital gains | (23) | (13) | (10) | (77)% | |||
| Federal income tax benefit | (12) | (7) | (5) | (71)% | |||
| Statutory net loss | $(11) | $(6) | $(5) | (83)% | |||
Statutory net loss for the Other segment increased by $5 million from a loss of $6 million in 2016 to a loss of $11 million in 2017. The increase is primarily due to higher operating expenses with the integration activities in 2017.
Investment Operations
The Company’s primary investment objective is to acquire assets with duration and cash flow characteristics reflective of its liabilities, while meeting industry, size, issuer, and geographic diversification standards. Formal liquidity and credit quality parameters have also been established.
The Company follows rigorous procedures to control interest rate risk and observes strict asset and liability matching guidelines. These guidelines ensure that even under changing market conditions, the Company’s assets should meet the cash flow and income requirements of its liabilities. Using dynamic modeling to analyze the effects of a range of possible market changes upon
A-12
investments and policyholder benefits, the Company works to ensure that its investment portfolio is appropriately structured to fulfill financial obligations to its policyholders.
The following table presents the percentage distribution of the carrying values of the Company’s general account investment portfolio.
| December 31, | |||||||
| (In millions) | 2018 | 2017 | |||||
| Bonds | $20,654 | 68.7% | $19,945 | 69.1% | |||
| Common stock | 132 | 0.5% | 108 | 0.4% | |||
| Mortgage loans | 4,207 | 14.0% | 3,871 | 13.4% | |||
| Real estate | 38 | 0.1% | 38 | 0.2% | |||
| Contract loans | 4,123 | 13.7% | 4,079 | 14.1% | |||
| Cash, cash equivalents and short-term investments | 229 | 0.8% | 242 | 0.8% | |||
| Securities lending collateral assets | 45 | 0.2% | — | —% | |||
| Other invested assets | 607 | 2.0% | 566 | 2.0% | |||
| Total cash and invested assets | $30,035 | 100.0% | $28,849 | 100.0% | |||
Bonds
Bonds include public and privately placed corporate bonds, government bonds, and mortgage-backed and asset-backed securities. Included in bonds are perpetual debt investments which primarily consist of junior subordinated debt instruments that have no stated maturity date but pay fixed or floating interest in perpetuity. The Company’s strategy related to mortgage-backed and asset-backed securities is to focus on those investments with low prepayment risk and minimal credit risk.
Private placement investments are generally less marketable than publicly traded assets, yet they typically offer enhanced covenant protection that allows the Company, if necessary, to take appropriate action to protect its investment. The Company believes that the cost of the additional monitoring and analysis required by private placement investments is more than offset by their enhanced yield.
One of the Company’s primary objectives is to ensure that its bond portfolio is maintained at a high average credit quality to limit credit risk. All securities are internally rated by the Company on a basis intended to be similar to that of independent external rating agencies.
The percentage distribution of the book adjusted carrying value of the Company’s short-term and long-term bond portfolios by NAIC designation is summarized as follows:
| December 31, | |||
| NAIC Designations | 2018 | 2017 | |
| NAIC 1 | 65.4% | 68.0% | |
| NAIC 2 | 33.4% | 30.5% | |
| NAIC 3 through 6 | 1.2% | 1.5% | |
| Total | 100.0% | 100.0% | |
The percentage distribution of the book adjusted carrying value of the industrial and miscellaneous category of short-term and long-term bond portfolios, calculated as a percentage of total bonds, is summarized as follows:
A-13
| December 31, | |||
| Sector | 2018 | 2017 | |
| Finance | 18.5% | 17.1% | |
| Utility | 15.1% | 17.1% | |
| Consumer | 9.5% | 9.9% | |
| Natural resources | 5.9% | 5.0% | |
| Transportation | 3.0% | 2.8% | |
| Other | 10.3% | 11.0% | |
Mortgage Loans
The Company’s mortgage loans are comprised primarily of domestic commercial collateralized loans. The mortgage loan portfolio is diversified with regard to geographical markets and commercial mortgage property types. The Company originates, directly or through correspondents, mortgages with the intent to hold to maturity. The Company’s portfolio includes loans which are fully amortizing, amortizing with a balloon balance at maturity, interest only to maturity, and interest only for a number of years followed by an amortizing period.
Derivatives
The Company uses certain derivatives, such as futures, swaps, forwards, and interest rate swaptions, for purposes of managing the interest rate, foreign currency exchange rate, and equity market risks impacting the Company’s business. These derivatives, when taken alone, may subject the Company to varying degrees of market and credit risk; however, since used for hedging purposes, these instruments are intended to reduce risk. Derivatives that qualify for hedge accounting treatment are valued using the valuation method (either amortized cost or fair value) consistent with the underlying hedged asset or liability. At inception of a derivative transaction, the hedge relationship and risk management objective is documented and the designation of the derivative is determined based on specific criteria of the transaction. Derivatives where hedge accounting is either not elected or that are not eligible for hedge accounting are stated at fair value with changes in fair value recognized in unassigned surplus in the period of change. Investment gains and losses generally result from the termination of derivative contracts prior to expiration and are generally recognized in net income and may be subject to IMR. For derivative instruments where hedge accounting is either not elected or the transactions are not eligible for hedge accounting, changes in interest rates, foreign currencies, or equity markets may generate derivative gains or losses which may cause the Company to experience volatility in capital and surplus. The Company controls the credit risk of its over-the-counter derivative contracts through credit approvals, limits, monitoring procedures, and in most cases, requiring collateral. Risk of loss is generally limited to the portion of the fair value of derivative instruments that exceeds the value of the collateral held and not to the notional or contractual amounts of the derivatives.
Investment Yield
Net investment income includes interest income, dividends, the amortization of premiums, discounts and origination fees.
To analyze investment performance, the Company excludes net investment income related to derivative instruments in order to assess underlying profitability and results from ongoing operations. Net investment income performance is summarized as follows:
| Year Ended December 31, | |||||
| (In millions) | 2018 | 2017 | 2016 | ||
| Net investment income | $1,307 | $1,267 | $1,236 | ||
| Less: | |||||
| Net investment income from derivative instruments | 16 | 16 | 10 | ||
| Net investment income excluding derivative investments | $1,291 | $1,251 | $1,226 | ||
| Average invested assets, at amortized cost | 29,252 | 28,433 | 27,432 | ||
| Yield on average invested assets | 4.41% | 4.40% | 4.47% | ||
The yield on average invested assets increased in 2018 when compared to 2017. The yield on average invested assets decreased in 2017 when compared to 2016.
A-14
Liquidity and Capital Resources
Liquidity refers to a company’s ability to generate sufficient cash flows to meet the short-term needs of its operations. The Company manages its operations to create stable, reliable, and cost-effective sources of cash flows to meet all of its obligations.
The principal sources of the Company’s liquidity are premiums and contract deposits, fees, investment income, and investment maturities and sales. Funds provided from these sources are reasonably predictable and normally exceed liquidity requirements for payment of policy benefits, payments to policy and contractholders in connection with surrenders and withdrawals, and general expenses. However, since the timing of available funds cannot always be matched precisely to commitments, imbalances may arise when demands for funds exceed those on hand. A primary liquidity concern regarding cash flows from operations is the risk of early policyholder and contractholder withdrawals. A primary liquidity concern regarding investment activity is the risk of defaults and market volatility.
In addition, a demand for funds may arise as a result of the Company taking advantage of current investment opportunities. The sources of the funds that may be required in such situations include the issuance of commercial paper or other debt instruments.
Management believes that the liquidity profile of its assets is sufficient to satisfy the short-term liquidity requirements of reasonably foreseeable scenarios.
Generally, the Company has met its operating requirements by utilizing cash flows from operations and maintaining appropriate levels of liquidity in its investment portfolio. Liquidity for the Company has remained strong, as evidenced by the amounts of short-term investments and cash and cash equivalents that totaled $229 million and $242 million as of December 31, 2018, and 2017, respectively. In addition, 99% of the bond portfolio carried an investment grade rating at December 31, 2018, and 2017, which provides significant liquidity to the Company’s overall investment portfolio.
The Company continues to be well capitalized with sufficient borrowing capacity. Additionally, the Company anticipates that cash on hand and expected net cash generated by operating activities will exceed the forecasted needs of the business over the next 12 months. The Company’s financial strength provides the capacity and flexibility to enable it to raise funds in the capital markets through the issuance of commercial paper. The Company had $99 million and $100 million of commercial paper outstanding as of December 31, 2018, and 2017, respectively. The commercial paper has been given a rating of A-1+ by Standard & Poor’s Ratings Services and a rating of P-1 by Moody’s Investors Service, each being the highest rating available. The Company’s issuance of commercial paper is not used to fund daily operations and does not have a significant impact on the Company’s liquidity.
The Company also has available a revolving credit facility agreement with U.S. Bank, which expires on March 1, 2023, in the amount of $50 million for general corporate purposes. The Company had no borrowings under this credit facility as of or during the year ended December 31, 2018. The Company does not anticipate the need for borrowings under this facility and the loss of its availability would not significantly impact its liquidity.
Capital resources provide protection for policyholders and financial strength to support the underwriting of insurance risks and allow for continued business growth. The amount of capital resources that may be needed is determined by the Company’s senior management and Board of Directors, as well as by regulatory requirements. The allocation of resources to new long-term business commitments is designed to achieve an attractive return, tempered by considerations of risk and the need to support the Company’s existing business.
Risk-based capital (“RBC”) is a regulatory tool for measuring the minimum amount of capital appropriate for a life, accident and health organization to support its overall business operations in consideration of its size and risk profile. The Division requires the Company to maintain minimum capital and surplus equal to the company action level as calculated in the RBC model. The Company exceeds the required amount.
Off-Balance Sheet Arrangements
The Company makes commitments to fund partnership interests, mortgage loans, and other investments in the normal course of its business. The amounts of these unfunded commitments at December 31, 2018 and 2017 were $136 million and $313 million, respectively. The precise timing of the fulfillment of the commitment cannot be predicted; however, all $136 million of the December 31, 2018 balance, and $312 million of the December 31, 2017 balance may be required to be paid within one year of the dates indicated. The remaining $1 million of the December 31, 2017 balance is due within one to three years. There are no other obligations or liabilities arising from such arrangements that are reasonably likely to become material.
The Company participates in a short-term reverse repurchase program for the purpose of enhancing the total return on its investment portfolio. This type of transaction involves the purchase of securities with a simultaneous agreement to sell similar
A-15
securities at a future date at an agreed-upon price. In exchange, the counterparty financial institutions put non-cash collateral on deposit with a third-party custodian on behalf of the Company. The amount of securities purchased in connection with these transactions was $11 million and $23 million at December 31, 2018 and 2017, respectively. Non-cash collateral on deposit with the third-party custodian on the Company’s behalf was $11 million and $24 million at December 31, 2018 and 2017, respectively, which cannot be sold or re-pledged and which has not been recorded on the Statement of Admitted Assets, Liabilities, Capital and Surplus. Collateral related to the reverse repurchase agreements generally consists of U.S. government or U.S. government agency securities.
The Company, as lessee, has entered into various lease and sublease agreements primarily for the rental of office space.
The Company maintains a corporate credit facility agreement in the amount of $50 million for general corporate purposes. The Company had no borrowings under the credit facility either at or during the years ended December 31, 2018 and 2017.
In addition, the Company has other letters of credit with a total amount of $9 million, renewable annually for an indefinite period of time.
Contractual Obligations
The following table summarizes the Company’s major contractual obligations at December 31, 2018:
| Payment due by period | |||||||||
| (in thousands) | Less than one year | One to three years | Three to five years | More than five years | Total | ||||
| Aggregate reserves(1) | $3,169,559 | $5,487,644 | $4,575,744 | $46,864,153 | $60,097,100 | ||||
| Policy and contract claims(2) | 183,749 | 45,798 | 35,087 | 123,460 | 388,094 | ||||
| Provision for policyholder dividends(3) | 31,184 | — | — | — | 31,184 | ||||
| Related party long-term debt - principal(4) | — | — | — | 553,219 | 553,219 | ||||
| Related party long-term debt - interest(5) | 30,335 | 60,670 | 60,670 | 557,094 | 708,769 | ||||
| Commercial paper(6) | 98,859 | — | — | — | 98,859 | ||||
| Payable under securities lending agreements(7) | 45,102 | — | — | — | 45,102 | ||||
| Investment purchase obligations(8) | 136,396 | — | — | — | 136,396 | ||||
| Operating leases(9) | 9,929 | 11,561 | 2,272 | 11,743 | 35,505 | ||||
| Other liabilities(10) | 31,334 | 58,469 | 65,514 | 16,204 | 171,521 | ||||
| Total | $3,736,447 | $5,664,142 | $4,739,287 | $48,125,873 | $62,265,749 | ||||
(1),(2) Aggregate reserves, and policy and contract claims - The Company has estimated payments to be made to policy and contract holders for future policy benefits. Insurance and investment contract liabilities include various investment-type products with contractually scheduled maturities, including periodic payments of a term certain nature. However, a significant portion of policy benefits and claims to be paid do not have stated contractual maturity dates and ultimately may not result in any payment obligation.
Estimated future policyholder obligations have been developed in accordance with industry accepted actuarial standards based upon the estimated timing of cash flows related to the policies or contracts, the Company’s historical experience and its expectation of future payment patterns. Management has incorporated significant assumptions in developing these estimates, many of which are outside of the Company’s control and include assumptions relating to mortality, morbidity, policy renewals and terminations, retirement, inflation, disability recovery rates, investment returns, future interest credited rate levels, policy loans, future premium receipts on current policies in-force, and other contingent events as may be appropriate to the respective product type. Due to the significance of the assumptions used, the amounts presented could materially differ from actual results.
The amounts presented in the table above are undiscounted as to interest. Accordingly, the sum of the estimated cash payment presented significantly exceeds the liability amount on the Company’s Statement of Admitted Assets, Liabilities, Capital and Surplus principally due to the time value of money.
Separate account liabilities have been excluded from the table above. Separate account obligations are legally insulated from general account assets. Separate account liabilities represent funds maintained by the Company to meet the specific investment objectives of the contract holders who bear the related investment risk. It is generally expected that the separate account liabilities will be fully funded by the separate account assets.
Policy and contract claims consist of liabilities associated with installment claims on certain long-term disability policies. Because the timing of the payment of these obligations is based upon assumptions of disability recovery rates, the amounts presented could differ from actual results.
A-16
(3) Provision for policyholders’ dividends - The provision for policyholders’ dividends payable represents the liabilities related to dividends payable in the following year on participating policies. As such, the obligations related to these liabilities are presented in the table above in the less than one year category in the amounts of the liabilities presented in the Company’s Statement of Admitted Assets, Liabilities, Capital and Surplus.
(4) Related party long-term debt principal - Represents contractual maturities of principal due to the Company’s parent, GWL&A Financial, under the terms of three long-term surplus notes. The amounts shown in this table differ from the amounts included in the Company’s Statement of Admitted Assets, Liabilities, Capital and Surplus because the amounts shown above do not consider the discount upon the issuance of one of the surplus notes.
(5) Related party long-term debt interest - Two long-term surplus notes bear interest at a fixed rate through maturity. One surplus note bears a variable interest rate plus the then-current three-month London Interbank Offering Rate (“LIBOR”). The interest payments shown in this table are calculated based upon the contractual rates in effect on December 31, 2018, and do not consider the impact of future interest rate changes.
(6) Commercial paper - The Company’s obligations under its commercial paper program are short-term in nature. The amount presented represents the amount due upon maturity of the instrument. The obligation related to this liability is presented in the table above in the less than one year category as presented in the Company’s Statement of Admitted Assets, Liabilities, Capital and Surplus.
(7) Payable under securities lending agreements - The Company accepts cash collateral in connection with its securities lending program. Since the securities lending transactions generally terminate within one year or the timing of the return of the collateral is uncertain, the obligations related to these liabilities are presented in the table above in the less than one year category in the amounts of the liabilities as presented in the Company’s Statement of Admitted Assets, Liabilities, Capital and Surplus.
(8) Investment purchase obligations - The Company makes commitments to fund partnership interests, mortgage loans, and other investments in the normal course of its business. As the timing of the fulfillment of the commitment to fund partnership interests cannot be predicted, such obligations are presented in the less than one year category. The timing of the funding of mortgage loans is based on the expiration date of the commitment.
(9) Operating leases - The Company is obligated to make payments under various non-cancelable operating leases, primarily for office space. Contractual provisions exist that could increase the lease obligations presented, including operating expense escalation clauses. Management does not consider the impact of any such clauses to be material to the Company’s operating lease obligations. Rent expense for the years ended December 31, 2018, 2017 and 2016 were $27,768, $28,244 and $27,815 respectively.
From time to time, the Company enters into agreements or contracts, including capital leases, to purchase goods or services in the normal course of its business. However, these agreements and contracts are not material and are excluded from the table above.
(10) Other liabilities - Other liabilities include those other liabilities which represent contractual obligations not included elsewhere in the table above. If the timing of the payment of any other liabilities was sufficiently uncertain, the amounts were included in the less than one year category. Other liabilities presented in the table above include:
| • | Liabilities under reinsurance arrangements |
| • | Liabilities related to securities purchased but not yet settled |
| • | Liabilities related to derivative obligations |
| • | Liabilities related to dollar repurchase agreements |
| • | Statutory state escheat liabilities |
| • | Expected contributions to the Company’s defined benefit pension plan, and benefit payments for the post-retirement medical plan and supplemental executive retirement plan through 2023 |
| • | Unrecognized tax benefits |
| • | Miscellaneous purchase obligations to acquire goods and services |
Application of Recent Accounting Pronouncements
See Note 2 to the accompanying financial statements for a further discussion of the application of recent accounting pronouncements.
Quantitative and Qualitative Disclosures About Market Risk
The Company has established processes and procedures to effectively identify, monitor, measure, and manage the risks associated with its invested assets and its interest rate sensitive insurance and annuity products. Management has identified investment portfolio management, including the use of derivative instruments, insurance and annuity product design, and asset/liability management as three critical means to accomplish a successful risk management program.
A-17
The major risks to which the Company is exposed include the following:
| • | Market risk - the potential of loss arising from adverse fluctuations in interest rates and equity market prices and the levels of their volatility. |
| • | Insurance risk - the potential of loss resulting from claims, persistency, and expense experience exceeding that assumed in the liabilities held. |
| • | Credit risk - the potential of loss arising from an obligator’s inability or unwillingness to meet its obligations to the Company. |
| • | Operational and corporate risk - the potential of direct or indirect loss resulting from inadequate or failed internal processes, people and systems, or from other external events. |
Market Risk
The Company’s exposure to interest rate changes results from its significant holdings of floating rate debt, bonds, mortgage loans, and interest rate sensitive liabilities. The bonds primarily consist of direct obligations of the U.S. government and its agencies, direct obligations of U.S. states and their subdivisions, corporate debt securities, and asset-backed and mortgage-backed securities. All of these investments are exposed to changes in interest rates. Interest rate sensitive product liabilities, primarily those liabilities associated with universal life insurance contracts and annuity contracts, have the same type of interest rate risk exposure as bonds and mortgage loans.
To reduce interest rate risk, the Company performs periodic projections of asset and liability cash flows in order to evaluate the interest rate sensitivity of its bonds and its product liabilities to interest rate movements. For determinate liabilities, i.e. liabilities with stable, predictable cash flows on products that can’t be repriced (for example, certificate annuities and payout annuities), asset/liability cash flow mismatches are monitored and the asset portfolios are rebalanced as necessary to keep the mismatches within tolerance limits. For these determinate liabilities, the investment policy predominantly requires assets with stable, predictable cash flows so that changes in interest rates will not cause changes in the timing of asset cash flows resulting in mismatches. For indeterminate liabilities, i.e. liabilities that have less predictable cash flows but that can be repriced (for example, portfolio annuities and universal life insurance), the potential mismatch of assets and liabilities is tested
under a wide variety of interest rate scenarios. The potential cost of this mismatch is calculated. If the potential cost is considered to be too high, actions considered would include rebalancing the asset portfolio and/or purchasing derivatives that reduce the risk as part of the hedging strategy program discussed below. For each major block of indeterminate liabilities, the asset and liability positions are reviewed in senior management meetings to proactively recommend changes in the current investment strategy and/or a rebalance of the asset portfolio.
The Company has strict operating policies which prohibit the use of derivative instruments for speculative purposes, permit derivative transactions only with approved counterparties, specify limits on concentration of risk, and provide requirements of reporting and monitoring systems. The Company supports a hedging strategy program that consists of the use of various derivative instruments including futures, interest rate swaps, and options such as interest rate swaptions. Derivative strategies include the following:
| • | Futures are commitments to either purchase or sell designated financial instruments at a future date for a specified price. |
| • | Interest rate swaps involve the periodic exchange of cash flows with third parties at specified intervals calculated using agreed upon rates or other financial variables. |
| • | Option contracts grant the purchaser, in consideration for the payment of a premium, the right to either purchase from or sell to the issuer a financial instrument at a specified price within a specified time period or on a stated date. Interest rate swaptions grant the purchaser the right to enter into a swap with predetermined fixed-rate payments over a predetermined time period on the exercise date. |
The Company has estimated the possible effects of interest rate changes at December 31, 2018. If interest rates increased by 100 basis points (1.00%), the December 31, 2018 fair value of the fixed income assets in the general account would decrease by approximately $1.7 billion. This calculation uses projected asset cash flows, discounted back to December 31, 2018. The cash flow projections are shown in the table below. The table below shows cash flows rather than expected maturity dates because many of the Company’s assets have substantial expected principal payments prior to the final maturity date. The fair value shown in the table below was calculated using spot discount interest rates that varied by the year in which the cash flows are expected to be received. The spot rates in the benchmark calculation range from 2.647% to 4.237%.
A-18
| Projected cash flows by calendar years (In millions) | Benchmark | Interest rate increase one percent | |
| 2019 | $2,642 | $2,607 | |
| 2020 | 2,328 | 2,289 | |
| 2021 | 2,720 | 2,659 | |
| 2022 | 2,829 | 2,803 | |
| 2023 | 3,428 | 3,413 | |
| Thereafter | 22,855 | 23,285 | |
| Undiscounted total | $36,802 | $37,056 | |
| Fair value | $28,825 | $27,146 |
The Company administers separate account variable annuities and provides other investment and retirement services where fee income is earned based upon a percentage of account balances. Fluctuations in fund asset levels occur as a result of both changes in cash flow and general market conditions. There is a market risk of lower fee income if equity markets decline. If equity markets were to decline by 10% from benchmark levels at December 31, 2018, the Company’s associated net fee income after payment of subadvisor fees in 2018 would decline by approximately $28 million.
The Company’s surplus assets include equity investments, primarily partnership interests. There is a market risk of lower asset values if equity markets decline. If equity markets were to decline by 10%, the Company would have an additional unrealized loss of approximately $7.9 million on equity investments. This unrealized loss would not impact statutory net income but would reduce capital and surplus.
The Company has sold variable annuities with various forms of GMDB and GLWB. The Company is required to hold future policy benefit liabilities for these guaranteed benefits. If equity markets were to decline by 10%, the liability for GMDB and GLWB would increase by approximately $19.5 million. The Company’s dynamic hedging program for the GLWB product would be expected to offset $12.2 million of the $19.5 million change in the benefit liability related to capital markets. Therefore the net impact to variable annuities with various forms of guarantees for a 10% decline in the equity markets is estimated to be $7.3 million.
Insurance Risk
The Company manages the risks associated with its insurance and other contractual liabilities through the use of actuarial modeling techniques. These techniques utilize significant assumptions including morbidity, mortality, persistency, expenses, and the cash flow stream of benefit payments. Through these techniques, the Company attempts to match the anticipated cash flow streams of its invested assets with the anticipated cash flow streams of its insurance and other contractual obligations. The cash flows associated with determinate policy liabilities are not interest rate sensitive but will vary based upon the timing and amount of benefit payments. The primary risks associated with these liabilities are that the benefits will exceed those anticipated in the actuarial modeling or that the actual timing of the payment of benefits will differ from what was anticipated.
The Company utilizes reinsurance programs to control its exposure to general insurance risks. Reinsurance agreements do not relieve the Company from its direct obligations to its insured. However, an effective reinsurance program limits the Company’s exposure to potentially large losses. The failure of reinsurers to honor their obligations could result in losses to the Company. To manage this risk, the Company evaluates the financial condition of its reinsurers and monitors concentrations of credit risk relative to the reinsurers in order to minimize its exposure to significant losses from reinsurer insolvencies. The Company retains an initial maximum of $3.5 million of coverage per individual life. This initial retention limit of $3.5 million may increase due to automatic policy increases in coverage at a maximum rate of $175 thousand per annum, with an overall maximum increase in coverage of $1.0 million. Maximum capacity to be accepted or retained by the Company is dictated at the treaty level and is monitored annually to ensure the total risk acquired or retained on any one life is limited to a maximum retention of $4.5 million.
Credit Risk
Credit risk is the risk the Company assumes if its debtors, customers, reinsurers, or other counterparties and intermediaries may be unable or unwilling to pay their contractual obligations when they come due and may manifest itself through the downgrading of credit ratings of counterparties. It is the Company’s policy to acquire only investment grade assets to enable it to provide for future policy obligations and to minimize undue concentrations of assets in any single geographic area, industry, or entity. To minimize this risk, management regularly reviews the credit ratings of the entities in which the Company invests. These credit ratings are internally derived by the Company, taking into consideration ratings from several external credit rating agencies.
A-19
Operational and Corporate Risk
The Company manages and mitigates internal operational risk through integrated and complementary policies, procedures, processes, and practices. Human Resources hiring practices, performance evaluations and promotion, and compensation practices are designed to attract, retain and develop the skilled personnel required. A comprehensive job evaluation process is in place and training and development programs are supported. Each business area provides training designed for its specific needs and has developed internal controls for significant processes. Processes and controls are monitored and redefined by the business areas and subject to review by the Company’s internal audit staff. The Company applies a robust project management discipline to all significant initiatives.
Appropriate security measures protect premises and information. The Company has emergency procedures in place for short-term incidents and is committed to maintaining business continuity and disaster recovery plans at every business location for the recovery of critical functions in the event of a disaster, including offsite data backup and work facilities. The Company maintains various corporate insurance coverages such as property, general liability, excess liability, automobile liability, workers’ compensation, financial institution bonds, other regulatory bonds, and professional liability insurance to protect its owned property assets and to insure against certain third-party liabilities.
The Company’s businesses are subject to various regulatory requirements imposed by regulation or legislation applicable to insurance companies and companies providing financial services. These regulations are primarily intended to protect policyholders and beneficiaries. Material changes in the regulatory framework or the failure to comply with legal and regulatory requirements could have a material adverse effect on the Company. The Company monitors compliance with legal and regulatory requirements in all jurisdictions in which it conducts business and assesses trends in legal and regulatory change to keep business areas current and responsive.
In the course of its business activities, the Company may be exposed to the risk that some actions may lead to damaging its reputation and hence damage its future business prospects. These actions may include unauthorized activities of employees or others associated with the Company, inadvertent actions of the Company that become publicized and damage its reputation, regular or past business activities of the Company that become the subject of regulatory or media scrutiny or litigation and, due to a change of public perception, cause damage to the Company. To manage or mitigate this risk, the Company has ongoing controls to limit the unauthorized activities of people associated with it. The Company has adopted a Code of Business Conduct and Ethics which sets out the standards of business conduct to be followed by all of its directors, officers, and employees.
A-20
Table of Contents
AUDITED FINANCIAL REPORT
Great-West Life & Annuity Insurance Company
(A wholly-owned subsidiary of GWL&A Financial Inc.) |
Statutory Statements of Admitted Assets, Liabilities, Capital and Surplus as of December 31, 2018 and 2017 and
Related Statutory Statements of Operations,
Changes in Capital and Surplus and Cash Flows for Each of the Three Years in the Period Ended December 31, 2018 and Report of Independent Registered Public Accounting Firm
Table of Contents
Index to Financial Statements, Notes, and Schedules
| Page Number | ||
| 3 | ||
Statutory Financial Statements at December 31, 2018, and 2017 and for the Years Ended December 31, 2018, 2017, and 2016 | ||
Statutory Statements of Admitted Assets, Liabilities, Capital and Surplus | 5 | |
| 7 | ||
| 8 | ||
| 9 | ||
| 11 | ||
| 11 | ||
| 20 | ||
| 21 | ||
| 23 | ||
| 32 | ||
| 36 | ||
| 36 | ||
| 36 | ||
| 37 | ||
| 37 | ||
Note 11 - Liability for Unpaid Claims and Claim Adjustment Expenses | 39 | |
| 40 | ||
| 40 | ||
Note 14 - Capital and Surplus, Dividend Restrictions, and Other Matters | 43 | |
| 44 | ||
| 50 | ||
| 54 | ||
| 58 | ||
| 58 | ||
| 58 | ||
| 59 | ||
2
Table of Contents
 | Deloitte & Touche LLP 1601 Wewatta Street Suite 400 Denver, CO 80202-3942 USA
Tel: 1 303 292 5400 Fax: 1 303 312 4000 www.deloitte.com |
REPORT OF INDEPENDENT REGISTERED PUBLIC ACCOUNTING FIRM
To the Board of Directors and Stockholder of
Great-West Life & Annuity Insurance Company
Greenwood Village, Colorado
Opinion on the Statutory Financial Statements
We have audited the accompanying statutory statements of admitted assets, liabilities, and capital and surplus of Great-West Life & Annuity Insurance Company (the "Company") (a wholly-owned subsidiary of GWL&A Financial Inc.), as of December 31, 2018 and 2017, the related statutory statements of operations, changes in capital and surplus, and cash flows for each of the three years in the period ended December 31, 2018, and the related notes (collectively referred to as the "statutory financial statements"). In our opinion, because of the effects of the matters discussed in the following paragraph, the statutory financial statements do not present fairly, in conformity with accounting principles generally accepted in the United States of America, the financial position of the Company as of December 31, 2018 and 2017, or the results of its operations or its cash flows for each of the three years in the period ended December 31, 2018.
As described in Note 1 to the statutory financial statements, the statutory financial statements are prepared by the Company using the accounting practices prescribed or permitted by the Colorado Division of Insurance, which is a basis of accounting other than accounting principles generally accepted in the United States of America, to meet the requirements of the Colorado Division of Insurance. The effects on the statutory financial statements of the variances between the statutory-basis of accounting described in Note 1 to the statutory financial statements and accounting principles generally accepted in the United States of America, although not reasonably determinable, are presumed to be material.
In our opinion, the statutory financial statements present fairly, in all material respects, the admitted assets, liabilities, and capital and surplus of the Company as of December 31, 2018 and 2017, and the results of its operations and its cash flows for each of the three years in the period ended December 31, 2018 in conformity with accounting practices prescribed or permitted by the Colorado Division of Insurance, as described in Note 1 to the statutory financial statements.
Basis for Opinion
These statutory financial statements are the responsibility of the Company's management. Our responsibility is to express an opinion on the Company's statutory financial statements based on our audits. We are a public accounting firm registered with the Public Company Accounting Oversight Board (United States) (PCAOB) and are required to be independent with respect to the Company in accordance with the U.S. federal securities laws and the applicable rules and regulations of the Securities and Exchange Commission and the PCAOB.
We conducted our audits in accordance with the standards of the PCAOB and in accordance with auditing standards generally accepted in the United States of America. Those standards require that we plan and perform the audit to obtain reasonable assurance about whether the statutory financial statements are free of material misstatement, whether due to error or fraud. The Company is not required to have, nor were we engaged to perform, an audit of its internal control over financial reporting. As part of our audits, we are required to obtain an understanding of internal control over financial reporting but not for the purpose of expressing
3
Table of Contents
an opinion on the effectiveness of the Company’s internal control over financial reporting. Accordingly, we express no such opinion.
Our audits included performing procedures to assess the risks of material misstatement of the statutory financial statements, whether due to error or fraud, and performing procedures that respond to those risks. Such procedures included examining, on a test basis, evidence regarding the amounts and disclosures in the statutory financial statements. Our audits also included evaluating the accounting principles used and significant estimates made by management, as well as evaluating the overall presentation of the statutory financial statements. We believe that our audits provide a reasonable basis for our opinion.
Emphasis of Matter
As discussed in Note 1 to the statutory financial statements, the accompanying statutory financial statements have been prepared from separate records maintained by the Company and may not necessarily be indicative of conditions that would have existed or the results of operations if the Company had been operated as an unaffiliated company, as portions of certain expenses represent allocations made from affiliates.

Denver, Colorado
March 19, 2019
We have served as the Company’s auditor since 1981
4
Table of Contents
GREAT-WEST LIFE & ANNUITY INSURANCE COMPANY
Statutory Statements of Admitted Assets, Liabilities, Capital and Surplus
December 31, 2018 and 2017
(In Thousands, Except Share Amounts)
| December 31, | ||||||||
| 2018 | 2017 | |||||||
Admitted assets: | ||||||||
Cash and invested assets: | ||||||||
Bonds | $ | 20,654,118 | $ | 19,944,862 | ||||
Common stock | 131,883 | 107,977 | ||||||
Mortgage loans (net of allowances of $746 and $746) | 4,206,865 | 3,871,338 | ||||||
Real estate occupied by the company | 37,555 | 36,302 | ||||||
Real estate held for the production of income | 1,407 | 1,466 | ||||||
Contract loans | 4,122,637 | 4,078,669 | ||||||
Cash, cash equivalents and short-term investments | 229,003 | 242,084 | ||||||
Securities lending collateral assets | 45,102 | — | ||||||
Other invested assets | 606,787 | 566,187 | ||||||
|
|
|
|
|
| |||
Total cash and invested assets | 30,035,357 | 28,848,885 | ||||||
|
|
|
|
|
| |||
Investment income due and accrued | 284,303 | 279,822 | ||||||
Premiums deferred and uncollected | 25,795 | 15,919 | ||||||
Reinsurance recoverable | 8,090 | 7,090 | ||||||
Current federal income taxes recoverable | 71,875 | 16,535 | ||||||
Deferred income taxes | 150,497 | 149,315 | ||||||
Due from parent, subsidiaries and affiliates | 50,107 | 67,355 | ||||||
Cash value of company owned life insurance | 272,606 | 264,798 | ||||||
Other assets | 231,965 | 163,388 | ||||||
Assets from separate accounts | 24,654,916 | 28,197,122 | ||||||
|
|
|
|
|
| |||
Total admitted assets | $ | 55,785,511 | $ | 58,010,229 | ||||
|
|
|
|
|
| |||
| See notes to statutory financial statements. | Continued |
5
Table of Contents
GREAT-WEST LIFE & ANNUITY INSURANCE COMPANY
Statutory Statements of Admitted Assets, Liabilities, Capital and Surplus
December 31, 2018 and 2017
(In Thousands, Except Share Amounts)
| December 31, | ||||||||
| 2018 | 2017 | |||||||
Liabilities, capital and surplus: | ||||||||
Liabilities: | ||||||||
Aggregate reserves for life policies and contracts | $ | 27,501,121 | $ | 26,587,834 | ||||
Aggregate reserves for accident and health policies | 276,762 | 272,539 | ||||||
Liability for deposit-type contracts | 189,895 | 206,134 | ||||||
Life and accident and health policy and contract claims | 123,705 | 120,537 | ||||||
Provision for policyholders’ dividends | 31,184 | 38,872 | ||||||
Liability for premiums received in advance | 13,926 | 12,768 | ||||||
Liability for contract deposit funds | 150,981 | 174,296 | ||||||
Unearned investment income | 622 | 4,483 | ||||||
Asset valuation reserve | 204,393 | 203,546 | ||||||
Interest maintenance reserve | 50,674 | 82,238 | ||||||
Due to parent, subsidiaries and affiliates | 41,735 | 52,081 | ||||||
Commercial paper | 98,859 | 99,886 | ||||||
Payable under securities lending agreements | 45,102 | — | ||||||
Repurchase agreements | 664,650 | — | ||||||
Other liabilities | 410,076 | 828,393 | ||||||
Liabilities from separate accounts | 24,654,907 | 28,197,113 | ||||||
|
|
|
|
|
| |||
Total liabilities | 54,458,592 | 56,880,720 | ||||||
|
|
|
|
|
| |||
Commitments and contingencies (see Note 20) | ||||||||
Capital and surplus: | ||||||||
Preferred stock, $1 par value, 50,000,000 shares authorized; none issued and outstanding | — | — | ||||||
Common stock, $1 par value; 50,000,000 shares authorized; 7,320,176 shares issued and outstanding | 7,320 | 7,320 | ||||||
Surplus notes | 591,699 | 539,930 | ||||||
Gross paid in and contributed surplus | 710,271 | 706,178 | ||||||
Unassigned funds | 17,629 | (123,919 | ) | |||||
|
|
|
|
|
| |||
Total capital and surplus | 1,326,919 | 1,129,509 | ||||||
|
|
|
|
|
| |||
Total liabilities, capital and surplus | $ | 55,785,511 | $ | 58,010,229 | ||||
|
|
|
|
|
| |||
| See notes to statutory financial statements. | Concluded |
6
Table of Contents
GREAT-WEST LIFE & ANNUITY INSURANCE COMPANY
Statutory Statements of Operations
Years Ended December 31, 2018, 2017 and 2016
(In Thousands)
| Year Ended December 31, | ||||||||||||
| 2018 | 2017 | 2016 | ||||||||||
|
|
|
|
| ||||||||
Income: | ||||||||||||
Premium income and annuity consideration | $ | 7,592,609 | $ | 5,270,518 | $ | (397,783 | ) | |||||
Net investment income | 1,307,387 | 1,266,963 | 1,235,841 | |||||||||
Amortization of interest maintenance reserve | 24,863 | 22,045 | 23,253 | |||||||||
Commission and expense allowances on reinsurance ceded | 5,211 | 31,582 | 5,785 | |||||||||
Fee income from separate accounts | 160,573 | 160,280 | 151,744 | |||||||||
Reserve adjustment on reinsurance ceded | (1,975,763 | ) | (490,424 | ) | 5,627,638 | |||||||
Miscellaneous income | 250,272 | 220,204 | 154,696 | |||||||||
|
|
|
|
| ||||||||
Total income | 7,365,152 | 6,481,168 | 6,801,174 | |||||||||
|
|
|
|
| ||||||||
Expenses: | ||||||||||||
Death benefits | 380,057 | 276,519 | 341,292 | |||||||||
Annuity benefits | 228,530 | 203,679 | 202,093 | |||||||||
Disability benefits and benefits under accident and health policies | 41,719 | 44,208 | 41,580 | |||||||||
Surrender benefits | 5,895,938 | 4,992,338 | 4,330,313 | |||||||||
Increase in aggregate reserves for life and accident and health policies and contracts | 917,510 | 915,763 | 1,139,669 | |||||||||
Other benefits | 10,528 | 12,032 | 11,991 | |||||||||
|
|
|
|
| ||||||||
Total benefits | 7,474,282 | 6,444,539 | 6,066,938 | |||||||||
|
|
|
|
| ||||||||
Commissions | 196,489 | 199,814 | 181,567 | |||||||||
Other insurance expenses | 488,250 | 522,610 | 544,488 | |||||||||
Net transfers from separate accounts | (1,112,465 | ) | (944,644 | ) | (101,482 | ) | ||||||
|
|
|
|
| ||||||||
Total benefit and expenses | 7,046,556 | 6,222,319 | 6,691,511 | |||||||||
|
|
|
|
| ||||||||
Net gain from operations before dividends to policyholders, federal income taxes and realized capital gains (losses) | 318,596 | 258,849 | 109,663 | |||||||||
Dividends to policyholders | 31,276 | 38,782 | 45,842 | |||||||||
|
|
|
|
| ||||||||
Net gain from operations after dividends to policyholders and before federal income taxes and net realized capital gains (losses) | 287,320 | 220,067 | 63,821 | |||||||||
Federal income tax (benefit) expense | (17,604 | ) | 50,584 | (37,932 | ) | |||||||
|
|
|
|
| ||||||||
Net gain from operations before net realized capital gains (losses) | 304,924 | 169,483 | 101,753 | |||||||||
Net realized capital gains (losses) less capital gains tax and transfers to interest maintenance reserve | 10,576 | 535 | (1,096 | ) | ||||||||
|
|
|
|
| ||||||||
Statutory net income | $ | 315,500 | $ | 170,018 | $ | 100,657 | ||||||
|
|
|
|
| ||||||||
See notes to statutory financial statements.
7
Table of Contents
GREAT-WEST LIFE & ANNUITY INSURANCE COMPANY
Statutory Statements of Changes in Capital and Surplus
Years Ended December 31, 2018, 2017 and 2016
(In Thousands)
| Year Ended December 31, | ||||||||||||
| 2018 | 2017 | 2016 | ||||||||||
Capital and surplus, beginning of year | $ | 1,129,509 | $ | 1,053,333 | $ | 1,114,764 | ||||||
|
|
|
|
|
|
|
|
| ||||
Statutory net income | 315,500 | 170,018 | 100,657 | |||||||||
Dividends to stockholder | (152,295 | ) | (145,301 | ) | (125,691 | ) | ||||||
Change in net unrealized capital (losses) gains, net of income taxes | (11,491 | ) | (17,021 | ) | (32,223 | ) | ||||||
Change in minimum pension liability, net of income taxes | 3,824 | 2,459 | (1,863 | ) | ||||||||
Change in asset valuation reserve | (846 | ) | (18,503 | ) | 6,171 | |||||||
Change innon-admitted assets | 28,921 | 96,814 | (47,306 | ) | ||||||||
Change in net deferred income taxes | (40,732 | ) | (110,528 | ) | 16,605 | |||||||
Change in liability for reinsurance in unauthorized companies | — | 2 | — | |||||||||
Capitalpaid-in | — | 27 | 60 | |||||||||
Surpluspaid-in | 4,093 | 86,480 | 22,359 | |||||||||
Change in capital and surplus as a result of separate accounts | (208 | ) | (211 | ) | (150 | ) | ||||||
Change in unrealized foreign exchange capital (losses) gains | (1,125 | ) | (88 | ) | (78 | ) | ||||||
Change in surplus note | 51,769 | 12,028 | 28 | |||||||||
|
|
|
|
|
|
|
|
| ||||
Net change in capital and surplus for the year | 197,410 | 76,176 | (61,431 | ) | ||||||||
|
|
|
|
|
|
|
|
| ||||
Capital and surplus, end of year | $ | 1,326,919 | $ | 1,129,509 | $ | 1,053,333 | ||||||
|
|
|
|
|
|
|
|
| ||||
See notes to statutory financial statements.
8
Table of Contents
GREAT-WEST LIFE & ANNUITY INSURANCE COMPANY
Statutory Statements of Cash Flows
Years Ended December 31, 2018, 2017 and 2016
(In Thousands)
| Year Ended December 31, | ||||||||||||
| 2018 | 2017 | 2016 | ||||||||||
|
|
|
|
|
| |||||||
Operating activities: | ||||||||||||
Premium income, net of reinsurance | $ | 5,352,630 | $ | 5,208,527 | $ | 5,910,875 | ||||||
Investment income received, net of investment expenses paid | 1,136,338 | 1,111,282 | 1,080,450 | |||||||||
Other miscellaneous expense received (paid) | 160,008 | (77,825 | ) | (23,874 | ) | |||||||
Benefit and loss related payments, net of reinsurance | (6,417,233 | ) | (5,393,966 | ) | (4,671,246 | ) | ||||||
Net transfers to separate accounts | 1,097,423 | 909,388 | 99,783 | |||||||||
Commissions, other expenses and taxes paid | (644,838 | ) | (669,995 | ) | (687,938 | ) | ||||||
Dividends paid to policyholders | (38,959 | ) | (46,583 | ) | (51,521 | ) | ||||||
Federal income taxes (paid) received, net | (38,241 | ) | (15,138 | ) | 15,711 | |||||||
|
|
|
|
|
| |||||||
Net cash provided by operating activities | 607,128 | 1,025,690 | 1,672,240 | |||||||||
|
|
|
|
|
| |||||||
Investing activities: | ||||||||||||
Proceeds from investments sold, matured or repaid: | ||||||||||||
Bonds | 3,351,579 | 5,719,282 | 7,202,702 | |||||||||
Stocks | 3,704 | 14,597 | 1,539 | |||||||||
Mortgage loans | 357,545 | 399,982 | 365,790 | |||||||||
Real estate | — | — | 1,457 | |||||||||
Other invested assets | 25,233 | 14,614 | 9,883 | |||||||||
Net gains on cash, cash equivalents and short-term investments | — | (1 | ) | 13 | ||||||||
Miscellaneous proceeds | 22,212 | — | 40,414 | |||||||||
Cost of investments acquired: | ||||||||||||
Bonds | (3,398,701 | ) | (6,023,940 | ) | (8,434,227 | ) | ||||||
Stocks | (38,742 | ) | (99 | ) | (19 | ) | ||||||
Mortgage loans | (697,245 | ) | (844,304 | ) | (688,991 | ) | ||||||
Real estate | (4,319 | ) | (2,980 | ) | (2,006 | ) | ||||||
Other invested assets | (36,870 | ) | (31,194 | ) | (3,985 | ) | ||||||
Miscellaneous applications | (39,654 | ) | (67,286 | ) | (4,708 | ) | ||||||
Net change in contract loans and premium notes | (1,355 | ) | (12,161 | ) | 6,809 | |||||||
|
|
|
|
|
| |||||||
Net cash used in investing activities | (456,613 | ) | (833,490 | ) | (1,505,329 | ) | ||||||
|
|
|
|
|
| |||||||
Financing and miscellaneous activities: | ||||||||||||
Surplus notes | 51,410 | 12,000 | — | |||||||||
Capital and paid in surplus | 3,325 | 84,944 | 20,306 | |||||||||
Deposit-type contract withdrawals, net of deposits | (18,908 | ) | (21,673 | ) | (22,342 | ) | ||||||
Dividends to stockholder | (152,295 | ) | (145,301 | ) | (125,691 | ) | ||||||
Funds (repaid) borrowed, net | (1,027 | ) | 2,348 | 4,167 | ||||||||
Change in due to/from parent, subsidiaries and affiliates | 6,013 | 1,485 | 5,987 | |||||||||
Employee taxes paid for withheld shares | (78 | ) | (818 | ) | (517 | ) | ||||||
Other | (51,605 | ) | (70,011 | ) | (38,528 | ) | ||||||
|
|
|
|
|
| |||||||
Net cash used in financing and miscellaneous activities | (163,165 | ) | (137,026 | ) | (156,618 | ) | ||||||
|
|
|
|
|
| |||||||
Net (decrease) increase in cash, cash equivalents and short-term investments and restricted cash | (12,650 | ) | 55,174 | 10,293 | ||||||||
Cash, cash equivalents and short-term investments and restricted cash: | ||||||||||||
Beginning of year | 242,084 | 186,910 | 176,617 | |||||||||
|
|
|
|
|
| |||||||
End of year | $ | 229,434 | $ | 242,084 | $ | 186,910 | ||||||
|
|
|
|
|
| |||||||
The cash, cash equivalents and short-term investments and restricted cash balance at December 31, 2018 includes $431 of restricted cash which isnon-admitted and not included in the Statutory Statements of Admitted Assets, Liabilities, Capital and Surplus.
| See notes to statutory financial statements. | Continued |
9
Table of Contents
GREAT-WEST LIFE & ANNUITY INSURANCE COMPANY
Statutory Statements of Cash Flows
Years Ended December 31, 2018, 2017 and 2016
(In Thousands)
| Year Ended December 31, | ||||||||||||
| 2018 | 2017 | 2016 | ||||||||||
|
|
|
|
|
| |||||||
Non-cash investing and financing transactions during the year: | ||||||||||||
Share-based compensation expense | $ | 768 | $ | 1,563 | $ | (2,113 | ) | |||||
Assets received from limited partnership investment distributions | — | — | (10 | ) | ||||||||
Fair value of assets acquired in settlement of bonds | 28,815 | 9,659 | — | |||||||||
| See notes to statutory financial statements. | Concluded |
10
Table of Contents
GREAT-WEST LIFE & ANNUITY INSURANCE COMPANY
Notes to Statutory Financial Statements
(In Thousands, Except Share Amounts)
1. Organization and Significant Accounting Policies
Great-West Life & Annuity Insurance Company (the “Company” or “GWL&A”) is a direct wholly-owned subsidiary of GWL&A Financial Inc. (“GWL&A Financial”), a holding company. GWL&A Financial is a direct wholly-owned subsidiary of Great-West Lifeco U.S. LLC (“Lifeco U.S.”) and an indirect wholly-owned subsidiary of Great-West Lifeco Inc. (“Lifeco”), a Canadian holding company. The Company offers a wide range of life insurance, retirement and investment products to individuals, businesses and other private and public organizations throughout the United States. The Company is an insurance company domiciled in the State of Colorado, and is subject to regulation by the Colorado Division of Insurance (“Division”).
The Company is authorized to engage in the sale of life insurance, accident and health insurance and annuities. It is qualified to do business in all states in the United States, except New York, and in the District of Columbia, Puerto Rico, Guam and the U.S. Virgin Islands. The Company is also a licensed reinsurer in New York.
The statutory financial statements have been prepared from the separate records maintained by the Company and may not necessarily be indicative of the conditions that would have existed or the results of operations if the Company had been operated as an unaffiliated company.
Accounting policies and use of estimates
The Company prepares its statutory financial statements in conformity with accounting practices prescribed or permitted by the Division. The Division requires that insurance companies domiciled in the State of Colorado prepare their statutory financial statements in accordance with the National Association of Insurance Commissioners Accounting Practices and Procedures Manual (“NAIC SAP”), subject to any deviations prescribed or permitted by the State of Colorado Insurance Commissioner.
The only prescribed deviation that impacts the Company allows the Company to account for certain separate account products at book value instead of fair value. The Division has not permitted the Company to adopt any accounting practices that have an impact on the Company’s statutory financial statements as compared to NAIC SAP or the Division’s prescribed accounting practices. There is no impact to either capital and surplus or net income as a result of the prescribed accounting practice.
Statutory accounting principles vary in some respects from accounting principles generally accepted in the United States of America (“GAAP”). The more significant of these differences are as follows:
| • | Bonds, including loan-backed and structured securities (collectively referred to as “bonds”), are carried at statutory adjusted carrying value in accordance with the National Association of Insurance Commissioners (“NAIC”) designation of the security. Carrying value is amortized cost, unless the bond is either (a) designated as a six, in which case it is the lower of amortized cost or fair value or (b) required to be carried at fair value due to the structured securities ratings methodology. Under GAAP, bonds are carried at amortized cost for securities classified asheld-to-maturity and fair value for securities classified asavailable-for-sale andheld-for-trading. |
| • | Short-term investments include all investments whose remaining maturities, at the time of acquisition, are three months to one year. Under GAAP, short-term investments include securities purchased with investment intent and with initial remaining maturities of one year or less. |
| • | As prescribed by the NAIC, the asset valuation reserve (“AVR”) is computed in accordance with a prescribed formula and represents a provision for possiblenon-interest related fluctuations in the value of bonds equity securities, mortgage loans, real estate and other invested assets. Changes to the AVR are charged or credited directly to unassigned surplus. This type of reserve is not necessary or required under GAAP. |
| • | As prescribed by the NAIC, the interest maintenance reserve (“IMR”) consists of net accumulated unamortized realized capital gains and losses, net of income taxes, on sales or interest related impairments of bonds and derivative investments attributable to changes in the general level of interest rates. Such gains or losses are initially deferred and then amortized into income over the remaining period to maturity, based on groupings of individual securities sold in five-year bands. An IMR asset is designated as anon-admitted asset and is recorded as a reduction to capital and surplus. Under GAAP, realized gains and losses are recognized in income in the period in which a security is sold. |
11
Table of Contents
GREAT-WEST LIFE & ANNUITY INSURANCE COMPANY
Notes to Statutory Financial Statements
(In Thousands, Except Share Amounts)
| • | As prescribed by the NAIC, an other-than-temporary impairment (“OTTI”) is recorded (a) if it is probable that the Company will be unable to collect all amounts due according to the contractual terms in effect at the date of acquisition, (b) if the Company has the intent to sell the investment or (c) fornon-interest related declines in value and where the Company does not have the intent and ability at the reporting date, to hold the bond until its recovery. Under GAAP, if either (a) management has the intent to sell a bond investment or (b) it is more likely than not the Company will be required to sell a bond investment before its anticipated recovery, a charge is recorded in net realized investment losses equal to the difference between the fair value and cost or amortized cost basis of the security. If management does not intend to sell the security and it is not more likely than not the Company will be required to sell the bond investment before recovery of its amortized cost basis, but the present value of the cash flows expected to be collected (discounted at the effective interest rate implicit in the bond investment prior to impairment) is less than the amortized cost basis of the bond investment (referred to as the credit loss portion), an OTTI is considered to have occurred. |
Under GAAP, total OTTI is bifurcated into two components: the amount related to the credit loss, which is recognized in current period earnings through realized capital losses; and the amount attributed to other factors (referred to as thenon-credit portion), which is recognized as a separate component in accumulated other comprehensive income (loss). As prescribed by the NAIC,non-interest related OTTI is only bifurcated on loan-backed and structured securities. Factors related to interest and other components do not have a financial statement impact and are disclosed in “Unrealized losses and OTTI” in the notes to the statutory financial statements.
| • | Derivatives that qualify for hedge accounting are carried at the same valuation method as the underlying hedged asset, while derivatives that do not qualify for hedge accounting are carried at fair value. Under GAAP, all derivatives, regardless of hedge accounting treatment, are recorded on the balance sheet in other assets or other liabilities at fair value. As prescribed by the NAIC, for those derivatives which qualify for hedge accounting, the change in the carrying value or cash flow of the derivative is recorded consistently with how the changes in the carrying value or cash flow of the hedged asset, liability, firm commitment or forecasted transaction are recorded. Under GAAP, if the derivative is designated as a cash flow hedge, the effective portions of the changes in the fair value of the derivative are recorded in accumulated other comprehensive income and are recognized in the income statements when the hedged item affects earnings. Changes in fair value resulting from foreign currency translations are recorded in either AOCI or net investment income, consistent with where they are recorded on the underlying hedged asset or liability. Changes in the fair value, including changes resulting from foreign currency translations, of derivatives not eligible for hedge accounting or where hedge accounting is not elected and the over effective portion of cash flow hedges are recognized in investment gains (losses) as a component of net income in the period of the change. Realized foreign currency transactional gains and losses on derivatives subject to hedge accounting are recorded in net investment income, whereas those on derivatives not subject to hedge accounting are recorded in investment gains (losses). As prescribed by the NAIC, upon termination of a derivative that qualifies for hedge accounting, the gain or loss is recognized in income in a manner that is consistent with the hedged item. Alternatively, if the item being hedged is subject to IMR, the gain or loss on the hedging derivative is realized and is subject to IMR upon termination. Under GAAP, gains or losses on terminated contracts that are effective hedges are recorded in earnings in net investment income or other comprehensive income. The gains or losses on terminated contracts where hedge accounting is not elected, or contracts that are not eligible for hedge accounting, are recorded in investment gains (losses). |
| • | The Company enters into dollar repurchase agreements with third party broker-dealers. The Company does not enter into these types of transactions for liquidity purposes, but rather for yield enhancement on its investment portfolio. The dollar repurchase trading strategy involves the sale of securities, with a simultaneous agreement to repurchase similar securities at a future date at an agreed-upon price. Assets to be repurchased are the same, or substantially the same, as the assets transferred, and are accounted for as secured borrowings. Under GAAP, these transactions are recorded as forward settling to be announced (“TBA”) securities that are accounted for as derivative instruments, but hedge accounting is not elected as the Company does not regularly accept delivery of such securities when issued. |
| • | Acquisition costs, such as commissions and other costs incurred in connection with acquiring new business, are charged to operations as incurred, rather than deferred and amortized over the lives of the related contracts as under GAAP. |
| • | Deferred income taxes are recorded using the asset and liability method in which deferred tax assets and liabilities are recorded for expected future tax consequences of events that have been recognized in either the Company’s statutory financial statements or tax returns. Deferred income tax assets are subject to limitations prescribed by statutory accounting |
12
Table of Contents
GREAT-WEST LIFE & ANNUITY INSURANCE COMPANY
Notes to Statutory Financial Statements
(In Thousands, Except Share Amounts)
principles. The change in deferred income taxes is treated as a component of the change in unassigned funds, whereas under GAAP deferred taxes are included in the determination of net income. |
| • | Certain assets, including various receivables, furniture and equipment and prepaid assets, are designated asnon-admitted assets and are recorded as a reduction to capital and surplus, whereas they are recorded as assets under GAAP. |
| • | The excess of the cost of acquiring an entity over the Company’s share of the book value of the acquired entity is recorded as goodwill which is admissible subject to limitations and is amortized over the period in which the Company benefits economically, not to exceed ten years. Under GAAP, the excess of the cost of acquiring an entity over the acquisition-date fair value of identifiable assets acquired and liabilities assumed is allocated between goodwill, indefinite-lived intangible assets and definite-lived intangible assets. Goodwill and indefinite-lived intangible assets are not amortized and definite-lived intangible assets are amortized over their estimated useful lives under GAAP. |
| • | Aggregate reserves for life policies and contracts are based on statutory mortality and interest requirements and without consideration of withdrawals, which differ from reserves established under GAAP that are based on assumptions using Company experience for mortality, interest, and withdrawals. |
| • | As prescribed by the NAIC, ceded reserves are limited to the amount of direct reserves. Ceded aggregate reserves and policy and contract claim liabilities are netted against aggregate reserves for life policies and contracts for statutory accounting purposes. Under GAAP, these items are reported as reinsurance recoverable. |
| • | Surplus notes are reflected as a component of capital and surplus, whereas under GAAP they are reflected as a liability. |
| • | The policyholder’s share of net income on participating policies that has not been distributed to participating policyholders is included in capital and surplus in the statutory financial statements. For GAAP, these amounts are reported as a liability with a charge to net income. |
| • | Changes in separate account values from cash transactions are recorded as premium income and benefit expenses whereas they do not impact the statement of operations under GAAP and are presented only as increases or decreases to account balances. |
| • | Benefit payments and the related decrease in policy reserves are recorded as expenses for all contracts subjecting the Company to any mortality risk. Under GAAP, such benefit payments for life and annuity contracts without significant mortality risks are recorded as direct reductions to the policy reserve liability. |
| • | Premium receipts and the related increase in policy reserves are recorded as revenues and expenses, respectively, for all contracts subjecting the Company to any mortality risk. Under GAAP, such premium receipts for life and annuity contracts without significant mortality risks are recorded as direct credits to the policy reserve liability. |
| • | Comprehensive income and its components are not presented in the statutory financial statements. |
| • | The Statutory Statement of Cash Flows is presented based on a prescribed format for statutory reporting. For purposes of presenting statutory cash flows, cash includes short-term investments. Under GAAP, the statement of cash flows is typically presented based on the indirect method and cash excludes short-term investments. |
The preparation of financial statements in conformity with statutory accounting principles requires the Company’s management to make a variety of estimates and assumptions. These estimates and assumptions affect, among other things, the reported amounts of admitted assets and liabilities, the disclosure of contingent liabilities and the reported amounts of revenues and expenses. Significant estimates are required to account for items and matters such as, but not limited to, the valuation of investments in the absence of quoted market values, impairment of investments, valuation of policy benefit liabilities and the valuation of deferred tax assets. Actual results could differ from those estimates.
13
Table of Contents
GREAT-WEST LIFE & ANNUITY INSURANCE COMPANY
Notes to Statutory Financial Statements
(In Thousands, Except Share Amounts)
Significant statutory accounting policies
Investments
Investments are reported as follows:
| • | In accordance with the NAIC SAP, the adjusted carrying value amounts of certain assets are gross ofnon-admitted assets. |
Bonds are carried at statutory adjusted carrying value in accordance with the NAIC designation of the security. Carrying value is amortized cost, unless the bond is either (a) designated as a six, in which case it is the lower of amortized cost or fair value or (b) required to be carried at fair value due to the structured securities ratings methodology. The Company recognizes the acquisition of its public bonds on a trade date basis and its private placement investments on a funding date basis. Bonds containing call provisions are amortized to the call or maturity value/date which produces the lowest asset value.
Premiums and discounts are recognized as a component of net investment income using the effective interest method. Realized gains and losses not subject to IMR, including those from foreign currency translations, are included in net realized capital gains (losses).
The recognition of income on certain investments (e.g. loan-backed securities, including mortgage-backed and asset-backed securities) is dependent upon market conditions, which may result in prepayments and changes in amounts to be earned. Prepayments on all mortgage-backed and asset-backed securities are monitored monthly, and amortization of the premium and/or the accretion of the discount associated with the purchase of such securities are adjusted by such prepayments. Prepayment assumptions are based on the average of recent historical prepayments and are obtained from broker/dealer survey values or internal estimates. These assumptions are consistent with the current interest rate and economic environment. Significant changes in estimated cash flows from the original purchase assumptions are accounted for using the retrospective method.
| • | Mortgage loans consist primarily of domestic commercial collateralized loans and are carried at their unpaid principal balances adjusted for any unamortized premiums or discounts, allowances for credit losses, and foreign currency translations. Interest income is accrued on the unpaid principal balance for all loans, except for loans onnon-accrual status. Premiums and discounts are amortized to net investment income using the effective interest method. Prepayment penalty and origination fees are recognized in net investment income upon receipt. |
The Company actively manages its mortgage loan portfolio by completing ongoing comprehensive analysis of factors such as debt service coverage ratios,loan-to-value ratios, payment status, default or legal status, annual collateral property evaluations and general market conditions. On a quarterly basis, the Company reviews the above primary credit quality indicators in its internal risk assessment of loan impairment and credit loss. Management’s risk assessment process is subjective and includes the categorization of all loans, based on the above mentioned credit quality indicators, into one of the following categories:
| • | Performing - generally indicates the loan has standard market risk and is within its original underwriting guidelines. |
| • | Non-performing - generally indicates there is a potential for loss due to the deterioration of financial/monetary default indicators or potential foreclosure. Due to the potential for loss, these loans are evaluated for impairment. |
The adequacy of the Company’s allowance for credit loss is reviewed quarterly. The determination of the calculation and the adequacy of the mortgage allowance for credit loss and mortgage impairments involve judgments that incorporate qualitative and quantitative Company and industry mortgage performance data. Management’s periodic evaluation and assessment of the adequacy of the mortgage allowance for credit loss and the need for mortgage impairments is based on known and inherent risks in the portfolio, adverse situations that may affect the borrower’s ability to repay, the fair value of the underlying collateral, composition of the loan portfolio, current economic conditions, loss experience and other relevant factors. Loans included in thenon-performing category and other loans with certain substandard credit quality indicators are individually reviewed to determine if a specific impairment is required. Risk is mitigated primarily through first position collateralization, guarantees, loan covenants and borrower reporting requirements. Since the Company does not originate or hold uncollateralized mortgages, loans are generally not deemed fully uncollectable. Generally, unrecoverable amounts are written off during the final stage of the foreclosure process.
14
Table of Contents
GREAT-WEST LIFE & ANNUITY INSURANCE COMPANY
Notes to Statutory Financial Statements
(In Thousands, Except Share Amounts)
Loan balances are considered past due when payment has not been received based on contractually agreed upon terms. The accrual of interest is discontinued when concerns exist regarding the realization of loan principal or interest. The Company resumes interest accrual on loans when a loan returns to current status or under new terms when loans are restructured or modified.
On a quarterly basis, any loans with terms that were modified during that period are reviewed to determine if the loan modifications constitute a troubled debt restructuring (“TDR”). In evaluating whether a loan modification constitutes a TDR, it must be determined that the modification is a significant concession and the debtor is experiencing financial difficulties.
| • | Real estate properties held for the production of income are valued at depreciated cost less encumbrances. Properties held for sale are carried at the lower of depreciated cost or fair value less encumbrances and estimated costs to sell the property. Real estate is depreciated on a straight-line basis over the estimated life of the building or term of the lease for tenant improvements. |
| • | Real estate properties occupied by the Company are carried at depreciated cost unless the carrying amount of the asset is deemed to be unrecoverable. The Company includes in both net investment income and other operating expenses an amount for rent relating to real estate properties occupied by the Company. Rent is derived from consideration of the repairs, expenses, taxes, interest and depreciation incurred. The reasonableness of the amount of rent recorded is verified by comparison to rent received from other like properties in the same area. |
| • | Limited partnership interests are included in other invested assets and are accounted for using either net asset value per share (“NAV”) as a practical expedient to fair value or the equity method of accounting with changes in these values recognized in unassigned surplus in the period of change. The Company uses NAV as a practical expedient on partnership interests in investment companies where it has a minor equity interest and no significant influence over the entity’s operations. The Company uses the equity method when it has a partnership interest that is considered more than minor, although the Company has no significant influence over the entity’s operations. |
| • | Common stocks, other than stocks of subsidiaries, are recorded at fair value based on the most recent closing price of the common stock as quoted on its exchange. Related party mutual funds, which are carried at fair value, are also included in common stocks. The net unrealized gain or loss on common stocks is reported as a component of surplus. |
| • | Contract loans are carried at their unpaid balance. Contract loans are fully collateralized by the cash surrender value of the associated insurance policy. |
| • | Short-term investments include all investments whose remaining maturities, at the time of acquisition, are three months to one year. Cash equivalent investments include all investments whose remaining maturities, at the time of acquisition, are three months or less. Both short-term and cash equivalent investments, excluding money market mutual funds, are stated at amortized cost, which approximates fair value. Cash equivalent investments also include highly liquid money market securities that are traded in an active market, and are carried at fair value. |
| • | The Company enters into reverse repurchase agreements with third party broker-dealers for the purpose of enhancing the total return on its investment portfolio. The repurchase trading strategy involves the purchase of securities, with a simultaneous agreement to resell similar securities at a future date at an agreed-upon price. Securities purchased under these agreements are accounted for as secured borrowings, and are reported at amortized cost in cash, cash equivalents and short-term investments. Under thesetri-party repurchase agreements, the designated custodian takes possession of the underlying collateral on the Company’s behalf, which is required to be cash or government securities. The fair value of the securities is monitored and additional collateral is obtained, where appropriate, to protect against credit exposure. The collateral cannot be sold orre-pledged and has not been recorded on the Statutory Statements of Admitted Assets, Liabilities, Capital and Surplus. |
The Company enters into dollar repurchase agreements with third party broker-dealers. The Company does not enter into these types of transactions for liquidity purposes, but rather for yield enhancement on its investment portfolio. The dollar repurchase trading strategy involves the sale of securities, with a simultaneous agreement to repurchase similar securities at a future date at an agreed-upon price. Assets to be repurchased are the same, or substantially the same, as the assets transferred, and are accounted for as secured borrowings. Proceeds of the sale are reinvested in other securities and may
15
Table of Contents
GREAT-WEST LIFE & ANNUITY INSURANCE COMPANY
Notes to Statutory Financial Statements
(In Thousands, Except Share Amounts)
enhance the current yield and total return. The difference between the sales price and the future repurchase price is recorded as an adjustment to net investment income. During the period between the sale and repurchase, the Company will not be entitled to receive interest and principal payments on the securities sold. Losses may arise from changes in the value of the securities or if the counterparty enters bankruptcy proceedings or becomes insolvent. In such cases, the Company’s right to repurchase the security may be restricted. Amounts owed to brokers under these arrangements are included as a liability in repurchase agreements.
The Company participates in a securities lending program in which the Company lends securities that are held as part of its general account investment portfolio to third parties. The Company does not enter into these types of transactions for liquidity purposes, but rather for yield enhancement on its investment portfolio. The borrower can return and the Company can request the loaned securities be returned at any time. The Company maintains ownership of the securities at all times and is entitled to receive from the borrower any payments for interest received on such securities during the loan term. Securities lending transactions are accounted for as secured borrowings. The securities on loan are included within bonds and short-term investments in the accompanying Statutory Statements of Admitted Assets, Liabilities, Capital and Surplus. The securities lending agent indemnifies the Company against borrower risk, meaning that the lending agent agrees contractually to replace securities not returned due to a borrower default. The Company generally requires initial cash collateral in an amount greater than or equal to 102% of the fair value of domestic securities loaned and 105% of foreign securities loaned. Such collateral is used to replace the securities loaned in event of default by the borrower. Some cash collateral is reinvested in short-term repurchase agreements which are also collateralized by U.S. Government or U.S. Government Agency securities. Reinvested cash collateral is reported in securities lending reinvested collateral assets, with a corresponding liability in payable for securities lending. Collateral that cannot be sold or repledged is excluded from the Statutory Statements of Admitted Assets, Liabilities, Capital and Surplus.
| • | The Company’s OTTI accounting policy requires that a decline in the value of a bond below its cost or amortized cost basis be assessed to determine if the decline is other-than-temporary. An OTTI is recorded (a) if it is probable that the Company will be unable to collect all amounts due according to the contractual terms in effect at the date of acquisition, (b) if the Company has the intent to sell the investment or (c) fornon-interest related declines in value and where the Company does not have the intent and ability at the reporting date, to hold the bond until its recovery. Management considers a wide range of factors, as described below, regarding the bond issuer and uses its best judgment in evaluating the cause of the decline in its estimated fair value and in assessing the prospects for near-term recovery. Inherent in management’s evaluation of the bond are assumptions and estimates about the operations and ability to generate future cash flows. While all available information is taken into account, it is difficult to predict the ultimate recoverable amount from a distressed or impaired bond. |
Considerations used by the Company in the impairment evaluation process include, but are not limited to, the following:
| • | The extent to which estimated fair value is below cost; |
| • | Whether the decline in fair value is attributable to specific adverse conditions affecting a particular instrument, its issuer, an industry or geographic area; |
| • | The length of time for which the estimated fair value has been below cost; |
| • | Downgrade of a bond investment by a credit rating agency; |
| • | Deterioration of the financial condition of the issuer; |
| • | The payment structure of the bond investment and the likelihood of the issuer being able to make payments in the future; and |
| • | Whether dividends have been reduced or eliminated or scheduled interest payments have not been made. |
For loan-backed and structured securities, if management does not intend to sell the bond and has the intent and ability to hold the bond until recovery of its amortized cost basis, but the present value of the cash flows expected to be collected (discounted at the effective interest rate implicit in the bond prior to impairment) is less than the amortized cost basis of the bond (referred to as thenon-interest loss portion), an OTTI is considered to have occurred. In this instance, total OTTI is bifurcated into two components: the amount related to thenon-interest loss is recognized in current period earnings through realized capital gains (losses); and the amount attributed to other factors does not have any financial impact and is disclosed only in the notes to the statutory financial statements. The calculation of expected cash flows utilized during the impairment evaluation process are determined using judgment and the best information available to the Company including default rates, credit ratings, collateral characteristics and current levels of subordination.
16
Table of Contents
GREAT-WEST LIFE & ANNUITY INSURANCE COMPANY
Notes to Statutory Financial Statements
(In Thousands, Except Share Amounts)
For bonds not backed by other loans or assets, if management does not intend to sell the bond and has the intent and ability to hold, but does not expect to recover the entire cost basis, an OTTI is considered to have occurred. A charge is recorded in net realized capital gains (losses) equal to the difference between the fair value and cost or amortized cost basis of the bond. After the recognition of an OTTI, the bond is accounted for as if it had been purchased on the measurement date of the OTTI, with an amortized cost basis equal to the previous amortized cost basis less the OTTI recognized in net income. The difference between the new amortized cost basis and the expected future cash flows is accreted into net investment income. The Company continues to estimate the present value of cash flows expected to be collected over the life of the bond.
Fair value
Certain assets and liabilities are recorded at fair value on the Company’s Statutory Statements of Admitted Assets, Liabilities, Capital and Surplus. The Company defines fair value as the price that would be received to sell an asset or paid to transfer a liability in the principal or most advantageous market for the asset or liability in an orderly transaction between market participants on the measurement date. The Company categorizes its assets and liabilities measured at fair value into a three-level hierarchy, based on the priority of the inputs to the respective valuation technique. The fair value hierarchy gives the highest priority to quoted prices in active markets for identical assets or liabilities (Level 1) and the lowest priority to unobservable inputs (Level 3). The Company’s assets and liabilities have been categorized based upon the following fair value hierarchy:
| • | Level 1 inputs which are utilized for separate account assets and liabilities, utilize observable, quoted prices (unadjusted) in active markets for identical assets or liabilities that the Company has the ability to access at the measurement date. Financial assets utilizing Level 1 inputs include certain mutual funds. |
| • | Level 2 inputs utilize other than quoted prices included in Level 1 that are observable for the asset or liability, either directly or indirectly. Level 2 inputs, which are utilized for general and separate account assets and liabilities, include quoted prices for similar assets and liabilities in active markets and inputs, other than quoted prices, that are observable for the asset or liability, such as interest rates and yield curves that are observable at commonly quoted intervals. The fair values for some Level 2 securities are obtained from pricing services. The inputs used by the pricing services are reviewed at least quarterly or when the pricing vendor issues updates to its pricing methodology. For bond and separate account assets and liabilities, inputs include benchmark yields, reported trades, broker/dealer quotes, issuer spreads,two-sided markets, benchmark securities, bids, evaluated bids, offers and reference data including market research publications. Additional inputs utilized for assets and liabilities classified as Level 2 are: |
| ○ | Derivative instruments - trading activity, swap curves, credit spreads, currency volatility, net present value of cash flows and news sources. |
| ○ | Separate account assets and liabilities - various index data and news sources, amortized cost (which approximates fair value), trading activity, swap curves, credit spreads, recovery rates, restructuring, net present value of cash flows and quoted prices in markets that are not active or for which all significant inputs are observable, either directly or indirectly. |
| • | Level 3 inputs are unobservable and include situations where there is little, if any, market activity for the asset or liability. In general, the prices of Level 3 securities are obtained from single broker quotes and internal pricing models. If the broker’s inputs are largely unobservable, the valuation is classified as a Level 3. Broker quotes are validated through an internal analyst review process, which includes validation through known market conditions and other relevant data, as noted below. Internal models are usually cash flow based utilizing characteristics of the underlying collateral of the security such as default rate and other relevant data. Inputs utilized for securities classified as Level 3 are as follows: |
| ○ | Corporate debt securities - unadjusted single broker quotes which may be in an illiquid market or otherwise deemed unobservable. |
The fair value of certain investments in the separate accounts and limited partnerships are estimated using net asset value per share as a practical expedient, and are excluded from the fair value hierarchy levels in Note 5. These net asset values are based on the fair value of the underlying investments, less liabilities.
17
Table of Contents
GREAT-WEST LIFE & ANNUITY INSURANCE COMPANY
Notes to Statutory Financial Statements
(In Thousands, Except Share Amounts)
In certain cases, the inputs used to measure fair value may fall into different levels of the fair value hierarchy. In such cases, the level in the fair value hierarchy within which the fair value measurement in its entirety falls has been determined based on the lowest level input that is significant to the fair value measurement in its entirety. The Company’s assessment of the significance of a particular input to the fair value measurement in its entirety requires judgment and considers factors specific to the asset or liability
Overall, transfers between levels are attributable to a change in the observability of inputs. Assets are transferred to a lower level in the hierarchy when a significant input cannot be corroborated with market observable data. This may occur when market activity decreases and underlying inputs cannot be observed, current prices are not available, and/or when there are significant variances in quoted prices, thereby affecting transparency. Assets are transferred to a higher level in the hierarchy when circumstances change such that a significant input can be corroborated with market observable data. This may be due to a significant increase in market activity including recent trades, a specific event, or one or more significant input(s) becoming observable. All transfers between levels are recognized at the beginning of the reporting period in which the transfer occurred. There were no transfers during the year.
The policies and procedures utilized to review, account for, and report on the value and level of the Company’s securities were determined and implemented by the Finance division. The Investments division is responsible for the processes related to security purchases and sales and provides valuation and leveling input to the Finance division when necessary. Both divisions within the Company have worked in conjunction to establish thorough pricing, review, approval, accounting, and reporting policies and procedures around the securities valuation process.
In some instances, securities are priced using external broker quotes. In most cases, when broker quotes are used as pricing inputs, more than one broker quote is obtained. External broker quotes are reviewed internally by comparing the quotes to similar securities in the public market and/or to vendor pricing, if available. Additionally, external broker quotes are compared to market reported trade activity to ascertain whether the price is reasonable, reflective of the current market prices, and takes into account the characteristics of the Company’s securities.
Derivative financial instruments
The Company enters into derivative transactions which include the use of interest rate swaps, interest rate swaptions, cross-currency swaps, foreign currency forwards, U.S. government treasury futures contracts, Eurodollar futures contracts, futures on equity indices and interest rate swap futures. The Company uses these derivative instruments to manage various risks, including interest rate and foreign currency exchange rate risk associated with its invested assets and liabilities. Derivative instruments are not used for speculative reasons. Certain of the Company’sover-the-counter (“OTC”) derivatives are cleared and settled through a central clearing counterparty while others are bilateral contracts between the Company and a counterparty.
Derivatives are reported as other invested assets or other liabilities. Although some derivatives are executed under a master netting arrangement, the Company does not offset in the Statutory Statements of Admitted Assets, Liabilities, Capital and Surplus the carrying value of those derivative instruments and the related cash collateral or net derivative receivables and payables executed with the same counterparty under the same master netting arrangement. Derivatives that qualify for hedge accounting treatment are valued using the valuation method (either amortized cost or fair value) consistent with the underlying hedged asset or liability. At inception of a derivative transaction, the hedge relationship and risk management objective is documented and the designation of the derivative is determined based on specific criteria of the transaction. Derivatives where hedge accounting is either not elected, or that are not eligible for hedge accounting, are stated at fair value with changes in fair value recognized in unassigned surplus in the period of change. Investment gains and losses generally result from the termination of derivative contracts prior to expiration and are generally recognized in net income and may be subject to IMR.
The Company uses derivative financial instruments for risk management purposes associated with certain invested assets and policy liabilities. Derivatives are used to (a) hedge the economic effects of interest rate and stock market movements on the Company’s guaranteed lifetime withdrawal benefit (“GLWB”) liability, (b) hedge the economic effect of a large increase in interest rates on the Company’s general account life insurance, group pension liabilities and certain separate account life insurance liabilities, (c) hedge the economic risks of other transactions such as future asset acquisitions or dispositions, the timing of liability pricing, currency risks onnon-U.S. dollar denominated assets, and (d) convert floating rate assets or debt obligations to fixed rate assets or debt obligations for asset/liability management purposes.
18
Table of Contents
GREAT-WEST LIFE & ANNUITY INSURANCE COMPANY
Notes to Statutory Financial Statements
(In Thousands, Except Share Amounts)
The Company controls the credit risk of its derivative contracts through credit approvals, limits, monitoring procedures and in many cases, requiring collateral. The Company’s exposure is limited to the portion of the fair value of derivative instruments that exceeds the value of the collateral held and not to the notional or contractual amounts of the derivatives.
Derivatives in a net asset position may have cash or securities pledged as collateral to the Company in accordance with the collateral support agreements with the counterparty. This collateral is held in a custodial account for the benefit of the Company. Unrestricted cash collateral is included in other assets and the obligation to return it is included in other liabilities. The cash collateral is reinvested in a government money market fund. Cash collateral pledged by the Company is included in other assets.
The Company may purchase a financial instrument that contains a derivative embedded in the financial instrument. Contracts that do not in their entirety meet the definition of a derivative instrument, may contain “embedded” derivative instruments implicit or explicit terms that affect some or all of the cash flows or the value of other exchanges required by the contract in a manner similar to a derivative instrument. An embedded derivative instrument shall not be separated from the host contract and accounted for separately as a derivative instrument.
Goodwill
Goodwill, resulting from acquisitions of subsidiaries that are reported in common stock and other invested assets, is amortized to unrealized capital gains/(losses) over the period in which the Company benefits economically, not to exceed ten years. Goodwill resulting from assumption reinsurance is reported in goodwill and is amortized to other insurance expenses over the period in which the Company benefits economically, not to exceed ten years. Admissible goodwill is limited in the aggregate to 10% of the Company’s adjusted capital and surplus. The Company tests goodwill for impairment annually or more frequently if events or circumstances indicate that there may be justification for conducting an interim test. If the carrying value of goodwill exceeds its fair value, the excess is recognized as impairment and recorded as a realized loss in the period in which the impairment is identified. There were no impairments of goodwill recognized during the years ended December 31, 2018 and 2017.
Cash value of company owned life insurance
The Company is the owner and beneficiary of life insurance policies which are included in Statutory Statements of Admitted Assets, Liabilities, Capital and Surplus at their cash surrender values. At December 31, 2018, the investments underlying variable life insurance policies utilize various fund structures, with underlying investment characteristics of 8% equity and 92% fixed income.
Net investment income
Interest income from bonds is recognized when earned. Interest income on contract loans is recognized in net investment income at the contract interest rate when earned. All investment income due and accrued with amounts that are deemed uncollectible or that are over 90 days past due, including mortgage loans in default (“in process of foreclosure”), is not included in investment income. Amounts over 90 days past due arenon-admitted assets and are recorded as a reduction to unassigned surplus. Real estate due and accrued income is excluded from net investment income if its collection is uncertain.
Net realized capital gains (losses)
Realized capital gains and losses are reported as a component of net income and are determined on a specific identification basis. Interest-related gains and losses are primarily subject to IMR, whilenon-interest related gains and losses are primarily subject to AVR. Realized capital gains and losses also result from the termination of derivative contracts prior to expiration and may be subject to IMR.
Policy reserves
Life insurance and annuity policy reserves with life contingencies are computed on the basis of statutory mortality and interest requirements and without consideration for withdrawals. Annuity contract reserves without life contingencies are computed on the basis of statutory interest requirements.
19
Table of Contents
GREAT-WEST LIFE & ANNUITY INSURANCE COMPANY
Notes to Statutory Financial Statements
(In Thousands, Except Share Amounts)
Policy reserves for life insurance are valued in accordance with the provision of applicable statutory regulations. Life insurance reserves are determined principally using the Commissioner’s Reserve Valuation Method, using the statutory mortality and interest requirements, without consideration for withdrawals. Some policies contain a surrender value in excess of the reserve as legally computed. This excess is calculated and recorded on apolicy-by-policy basis.
Premium stabilization reserves are calculated for certain policies to reflect the Company’s estimate of experience refunds and interest accumulations on these policies. The reserves are invested by the Company. The income earned on these investments is accumulated in this reserve and is used to mitigate future premium rate increases for such policies.
Policy reserves ceded to other insurance companies are recorded as a reduction of the reserve liabilities. The cost of reinsurance related to long-duration contracts is accounted for over the life of the underlying reinsured policies using assumptions consistent with those used to account for the underlying policies.
Policy and contract claims include provisions for reported life and health claims in process of settlement, valued in accordance with the terms of the related policies and contracts, as well as provisions for claims incurred but not reported based primarily on prior experience of the Company. As such, amounts are estimates, and the ultimate liability may differ from the amount recorded. Any changes in estimates will be reflected in the results of operations when additional information becomes known.
The liabilities for health claim reserves are determined using historicalrun-out rates, expected loss ratios and statistical analysis. The Company provides for significant claim volatility in areas where experience has fluctuated. The liabilities represent estimates of the ultimate net cost of all reported and unreported claims which are unpaid atyear-end. Those estimates are subject to considerable variability in claim severity and frequency. The estimates are continually reviewed and adjusted as necessary as experience develops or new information becomes known; such adjustments are included in current operations.
Premium, fee income and expenses
Life insurance premiums are recognized when due. Annuity considerations are recognized as revenue when received. Accident and health premiums are earned ratably over the terms of the related insurance and reinsurance contracts or policies. Life and accident and health insurance premiums received in advance are recorded as a liability and recognized as income when the premiums become earned. Fees from assets under management, assets under administration, shareholder servicing, mortality and expense risk charges, administration and record-keeping services and investment advisory services are recognized when earned in fee income or other income. Expenses incurred in connection with acquiring new insurance business, including acquisition costs such as sales commissions, are charged to operations as incurred.
Income taxes
The Company is included in the consolidated federal income tax return of Lifeco U.S. The federal income tax expense reported in the Statutory Statements of Operations represent income taxes provided on income that is currently taxable, excluding tax on net realized capital gains and losses. A net deferred tax asset is included in the Statutory Statements of Admitted Assets, Liabilities, Capital and Surplus which is recorded using the asset and liability method in which deferred tax assets and liabilities are recorded for expected future tax consequences of events that have been recognized in either the Company’s statutory financial statements or tax returns. Deferred income tax assets are subject to limitations prescribed by statutory accounting principles. The change in deferred income taxes is treated as a component of the change in unassigned funds.
Changes in Accounting Principles
In 2009, the NAIC introduced Principle-Based Reserving (“PBR”) as a new method for calculating life insurance policy reserves. In cases where the PBR reserve is higher, it will replace the historic formulaic measure with one that more accurately reflects the risks of highly complex products. PBR is effective for 2017; however, companies are permitted to delay implementation until January 1, 2020. The Company will defer implementation for life and fixed annuity contracts until January 1, 2020 and is currently evaluating impact of adoption of PBR on its statutory financial statements.
In 2018, the Statutory Accounting Principles Working Group adopted, as final, a new SSAP No. 108,Derivatives Hedging Variable Annuity Guarantees, and a corresponding Issue Paper No. 159,Special Accounting for Limited Derivatives. The new
20
Table of Contents
GREAT-WEST LIFE & ANNUITY INSURANCE COMPANY
Notes to Statutory Financial Statements
(In Thousands, Except Share Amounts)
SSAP, which prescribes guidance for derivatives that hedge interest rate risk of variable annuity guarantees, was adopted with an effective date of January 1, 2020, with early adoption permitted as of January 1, 2019. The Company is currently evaluating impact of adoption of this elective guidance on its statutory financial statements.
In the normal course of business the Company enters into agreements with related parties whereby it provides and/or receives record-keeping services, investment advisory services, andtax-related services, as well as corporate support services which include general and administrative services, information technology services, sales and service support and marketing services. The following table presents revenue earned, expenses incurred and expense reimbursement from insurance andnon-insurance related parties for services provided and/or received pursuant to the service agreements. These amounts, in accordance with the terms of the contracts, are based upon market price, estimated costs incurred or resources expended as determined by number of policies, certificatesin-force, administered assets or other similar drivers.
| Year Ended December 31, | Financial | |||||||||||||||||
| Description | Related party | 2018 | 2017 | 2016 | statement line | |||||||||||||
| Provides corporate support service | Insurance affiliates: Great-West Life & Annuity Insurance Company of New York (“GWL&A NY”)(1), Great-West Life & Annuity Insurance Company of South Carolina (“GWSC”)(1),The Canada Life Assurance Company (“CLAC”)(2) and Great-West Life Assurance Company (“Great-West Life”)(2) | $ | (15,522 | ) | $ | (14,610 | ) | $ | (14,895 | ) | | Other insurance benefits and expenses | | |||||
| Non-insurance affiliates: FASCore, LLC (“FASCore”)(1), Advised Assets Group, LLC (“AAG”)(1), Great-West Capital Management, LLC (“GWCM”)(1), Great-West Trust Company, LLC (“GWTC”)(1), GWFS Equities, Inc. (“GWFS”)(1), Great-West Financial Retirement Plan Services (“Great-West RPS”)(1), Emjay, Inc.(1), MAM Holding Inc.(2) and Putnam(3) | (142,424 | ) | (113,504 | ) | (102,698 | ) | ||||||||||||
| Total | (157,946 | ) | (128,114 | ) | (117,593 | ) | ||||||||||||
| Receives corporate support services | Insurance affiliates: CLAC( 1) and Great-West Life(1) | 1,711 | 1,966 | 1,999 | | Other insurance | | |||||||||||
| Non-insurance affiliates: Putnam(2) and Great West Global(2) | 3,381 | 3,128 | 5,922 | | benefits and expenses | | ||||||||||||
| Total | 5,092 | 5,094 | 7,921 | |||||||||||||||
| Provides marketing, distribution and administrative services to certain underlying funds and/or mutual funds | Non-insurance affiliate: GWFS(1) | 198,976 | 202,880 | 203,288 | | Other income | | |||||||||||
| Provides record-keeping services | Non-insurance affiliates: GWTC(1) | 38,200 | 30,517 | 21,110 | | Other income | | |||||||||||
| Non-insurance related party: Great-West Funds(4) | 65,281 | 65,743 | 57,867 | |||||||||||||||
| Total | 103,481 | 96,260 | 78,977 | |||||||||||||||
| Receives record-keeping services | Insurance affiliate: GWL&A NY(1) | (2,551 | ) | (2,423 | ) | (2,096 | ) | | Other income | | ||||||||
| Non-insurance affiliates: FASCore(1)and GWTC(1) | (342,803 | ) | (316,923 | ) | (291,945 | ) | ||||||||||||
| Total | (345,354 | ) | (319,346 | ) | (294,041 | ) | ||||||||||||
| Receives custodial services | Non-insurance affiliate: GWTC(1) | (12,410 | ) | (11,854 | ) | (11,125 | ) | | Other income | | ||||||||
| Receives reimbursement from tax sharing indemnification related to state and local tax liabilities | Non-insurance affiliate: Putnam(3) | 9,140 | 9,611 | 12,261 | | Other income | | |||||||||||
(1) A wholly-owned subsidiary of GWL&A
(2) An indirect wholly-owned subsidiary of Lifeco
(3) A wholly-owned subsidiary of Lifeco U.S.
21
Table of Contents
GREAT-WEST LIFE & ANNUITY INSURANCE COMPANY
Notes to Statutory Financial Statements
(In Thousands, Except Share Amounts)
(4) Anopen-end management investment company, a related party of GWL&A
The Company’s separate accounts invest in shares of Great-West Funds, Inc. and Putnam Funds, which are affiliates of the Company and shares of othernon-affiliated mutual funds and government and corporate bonds. The Company’s separate accounts include mutual funds or other investment options that purchase guaranteed interest annuity contracts issued by the Company. During the years ended December 31, 2018, 2017 and 2016, these purchases totaled $169,857, $292,774 and $183,365 respectively. As the general account investment contracts are also included in the separate account balances in the accompanying statutory statements of admitted assets, liabilities, capital and surplus, the Company has included the separate account assets and liabilities of $284,278 and $335,311 at December 31, 2018 and 2017, respectively, which is also included in the assets and liabilities of the general account at those dates.
The following table summarizes amounts due from parent and affiliates:
| December 31, | ||||||||||||
| Related party | Indebtedness | Due date | 2018 | 2017 | ||||||||
GWFS(1) | On account | On demand | $ | 34,394 | $ | 37,770 | ||||||
CLAC(2) | On account | On demand | — | 20,063 | ||||||||
GWTC(1) | On account | On demand | 5,489 | 4,008 | ||||||||
GWCM(1) | On account | On demand | 1,367 | 2,179 | ||||||||
AAG(1) | On account | On demand | 3,088 | 994 | ||||||||
GWSC(1) | On account | On demand | 1,418 | 878 | ||||||||
Putnam(3) | On account | On demand | 4,027 | — | ||||||||
Great-West RPS(1) | On account | On demand | 324 | 595 | ||||||||
Other related party receivables | On account | On demand | — | 868 | ||||||||
|
|
|
|
|
| |||||||
Total | $ | 50,107 | $ | 67,355 | ||||||||
|
|
|
|
|
| |||||||
(1) A wholly-owned subsidiary of GWL&A (2) An indirect wholly-owned subsidiary of Lifeco (3) A wholly-owned subsidiary of Lifeco U.S.
The following table summarizes amounts due to parent and affiliates: | ||||||||||||
| December 31, | ||||||||||||
| Related party | Indebtedness | Due date | 2018 | 2017 | ||||||||
FASCore(1) | On account | On demand | $ | 35,385 | $ | 46,371 | ||||||
Putnam(3) | On account | On demand | 770 | 3,432 | ||||||||
CLAC(2) | On account | On demand | 4,032 | — | ||||||||
Other related party payables | On account | On demand | 1,548 | 2,278 | ||||||||
|
|
|
|
|
| |||||||
Total | $ | 41,735 | $ | 52,081 | ||||||||
|
|
|
|
|
| |||||||
(1) A wholly-owned subsidiary of GWL&A
(2) An indirect wholly-owned subsidiary of Lifeco
(3) A wholly-owned subsidiary of Lifeco U.S.
Included in current federal income taxes recoverable at December 31, 2018 and 2017 is $72,188 and $17,456, respectively, of income tax receivable from Lifeco U.S. related to the consolidated income tax return filed by Lifeco U.S.
The Company (paid) received cash payments of $(42,577) and $171 from its subsidiary, GWSC, in 2018 and 2017, respectively, for the utilization of GWSC’s operating loss carryforward amounts under the terms of its tax sharing agreement. Additionally, during the years ended December 31, 2018, 2017 and 2016, the Company received interest income of $2,527, $3,044 and $2,733, respectively, from GWSC relating to the tax sharing agreement.
During the year ended December 31, 2018, the Company received dividends and return of capital of $106,000 and $680, respectively, from its subsidiaries, the largest being $42,000 from AAG. During the year ended December 31, 2017, the Company received dividends and return of capital of $82,500 and $1,150, respectively, from its subsidiaries, the largest being $35,000 from FASCore.
22
Table of Contents
GREAT-WEST LIFE & ANNUITY INSURANCE COMPANY
Notes to Statutory Financial Statements
(In Thousands, Except Share Amounts)
During the years ended December 31, 2018 and 2017, the Company paid cash dividends to GWL&A Financial in the amounts of $152,295 and $145,301, respectively.
The Company and GWL&A NY have an agreement whereby the Company has committed to provide GWL&A NY financial support related to the maintenance of adequate regulatory surplus and liquidity.
Investments in bonds consist of the following:
| December 31, 2018 | ||||||||||||||||
| Book/adjusted carrying value | Gross unrealized gains | Gross unrealized losses | Fair value | |||||||||||||
U.S. government | $ | 6,306 | $ | 926 | $ | 22 | $ | 7,210 | ||||||||
U.S. states, territories and possessions | 1,025,470 | 91,508 | 672 | 1,116,306 | ||||||||||||
Political subdivisions of states and territories | 842,211 | 63,945 | 2,034 | 904,122 | ||||||||||||
Special revenue and special assessments | 687 | 4 | — | 691 | ||||||||||||
Industrial and miscellaneous | 12,849,382 | 237,900 | 321,254 | 12,766,028 | ||||||||||||
Parent, subsidiaries and affiliates | 15,102 | — | — | 15,102 | ||||||||||||
Hybrid securities | 234,411 | 77 | 31,209 | 203,279 | ||||||||||||
Loan-backed and structured securities | 5,680,549 | 91,517 | 96,761 | 5,675,305 | ||||||||||||
|
|
|
|
|
|
|
|
|
|
|
| |||||
Total bonds | $ | 20,654,118 | $ | 485,877 | $ | 451,952 | $ | 20,688,043 | ||||||||
|
|
|
|
|
|
|
|
|
|
|
| |||||
| December 31, 2017 | ||||||||||||||||
| Book/adjusted carrying value | Gross unrealized gains | Gross unrealized losses | Fair value | |||||||||||||
U.S. government | $ | 11,547 | $ | 1,603 | $ | 12 | $ | 13,138 | ||||||||
U.S. states, territories and possessions | 1,054,936 | 130,027 | 123 | 1,184,840 | ||||||||||||
Political subdivisions of states and territories | 949,988 | 89,898 | 1,486 | 1,038,400 | ||||||||||||
Special revenue and special assessments | 1,993 | 62 | — | 2,055 | ||||||||||||
Industrial and miscellaneous | 12,536,852 | 537,262 | 60,617 | 13,013,497 | ||||||||||||
Parent, subsidiaries and affiliates | 19,912 | — | — | 19,912 | ||||||||||||
Hybrid securities | 236,060 | 6,354 | 8,213 | 234,201 | ||||||||||||
Loan-backed and structured securities | 5,133,574 | 168,214 | 30,288 | 5,271,500 | ||||||||||||
|
|
|
|
|
|
|
|
|
|
|
| |||||
Total bonds | $ | 19,944,862 | $ | 933,420 | $ | 100,739 | $ | 20,777,543 | ||||||||
|
|
|
|
|
|
|
|
|
|
|
| |||||
The book/adjusted carrying value and estimated fair value of bonds and assets receiving bond treatment, based on estimated cash flows, are shown in the table below. Actual maturities will likely differ from these projections because borrowers may have the right to call or prepay obligations with or without call or prepayment penalties.
| December 31, 2018 | ||||||||
| Book/adjusted carrying value | Fair value | |||||||
Due in one year or less | $ | 767,254 | $ | 777,131 | ||||
Due after one year through five years | 3,834,629 | 3,863,897 | ||||||
Due after five years through ten years | 6,883,504 | 6,803,249 | ||||||
Due after ten years | 3,527,628 | 3,607,680 | ||||||
Loan-backed and structured securities | 5,670,623 | 5,665,599 | ||||||
|
|
|
|
|
| |||
Total bonds | $ | 20,683,638 | $ | 20,717,556 | ||||
|
|
|
|
|
| |||
Loan-backed and structured securities include those issued by U.S. government and U.S. agencies.
23
Table of Contents
GREAT-WEST LIFE & ANNUITY INSURANCE COMPANY
Notes to Statutory Financial Statements
(In Thousands, Except Share Amounts)
The following table summarizes information regarding the sales of securities:
| Years ended December 31, | ||||||||||||
| 2018 | 2017 2016 | |||||||||||
Proceeds from sales | $ | 12,788,008 | $ | 17,492,392 | $ | 23,931,241 | ||||||
Gross realized gains from sales | 32,672 | 34,506 | 80,975 | |||||||||
Gross realized losses from sales | 30,960 | 56,354 | 34,646 | |||||||||
Unrealized losses on bonds
The following tables summarize gross unrealized investment losses including thenon-credit-related portion of OTTI losses, by class of investment:
| December 31, 2018 | ||||||||||||||||||||||||
| Less than twelve months | Twelve months or longer | Total | ||||||||||||||||||||||
| Bonds: | Fair value | Unrealized loss and OTTI | Fair value | Unrealized loss and OTTI | Fair value | Unrealized loss and OTTI | ||||||||||||||||||
| U.S. government | $ | 116 | $ | 4 | $ | 818 | $ | 19 | $ | 934 | $ | 23 | ||||||||||||
| U.S. states, territories and possessions | 42,429 | 360 | 11,365 | 312 | 53,794 | 672 | ||||||||||||||||||
| Political subdivisions of states and territories | 103,774 | 1,115 | 28,604 | 919 | 132,378 | 2,034 | ||||||||||||||||||
| Industrial and miscellaneous | 6,334,837 | 235,993 | 2,763,614 | 201,312 | 9,098,451 | 437,305 | ||||||||||||||||||
| Hybrid securities | 104,167 | 13,710 | 88,517 | 17,498 | 192,684 | 31,208 | ||||||||||||||||||
| Loan-backed and structured securities | 2,462,938 | 46,794 | 1,568,844 | 53,417 | 4,031,782 | 100,211 | ||||||||||||||||||
|
|
|
|
|
|
|
|
|
|
|
|
|
|
|
|
|
| |||||||
Total bonds | $ | 9,048,261 | $ | 297,976 | $ | 4,461,762 | $ | 273,477 | $ | 13,510,023 | $ | 571,453 | ||||||||||||
|
|
|
|
|
|
|
|
|
|
|
|
|
|
|
|
|
| |||||||
| Total number of securities in an unrealized loss position | 815 | 475 | 1,290 | |||||||||||||||||||||
|
|
|
|
|
|
|
|
| ||||||||||||||||
| December 31, 2017 | ||||||||||||||||||||||||
| Less than twelve months | Twelve months or longer | Total | ||||||||||||||||||||||
| Bonds: | Fair value | Unrealized loss and OTTI | Fair value | Unrealized loss and OTTI | Fair value | Unrealized loss and OTTI | ||||||||||||||||||
| U.S. government | $ | 860 | $ | 12 | $ | — | $ | — | $ | 860 | $ | 12 | ||||||||||||
| U.S. states, territories and possessions | 11,794 | 125 | — | — | 11,794 | 125 | ||||||||||||||||||
| Political subdivisions of states and territories | 13,114 | 56 | 43,949 | 1,430 | 57,063 | 1,486 | ||||||||||||||||||
| Industrial and miscellaneous | 1,911,630 | 17,016 | 1,708,202 | 74,659 | 3,619,832 | 91,675 | ||||||||||||||||||
| Hybrid securities | — | — | 106,351 | 8,214 | 106,351 | 8,214 | ||||||||||||||||||
| Loan-backed and structured securities | 1,530,747 | 12,379 | 694,016 | 19,586 | 2,224,763 | 31,965 | ||||||||||||||||||
|
|
|
|
|
|
|
|
|
|
|
|
|
|
|
|
|
| |||||||
Total bonds | $ | 3,468,145 | $ | 29,588 | $ | 2,552,518 | $ | 103,889 | $ | 6,020,663 | $ | 133,477 | ||||||||||||
|
|
|
|
|
|
|
|
|
|
|
|
|
|
|
|
|
| |||||||
| Total number of securities in an unrealized loss position | 328 | 257 | 585 | |||||||||||||||||||||
|
|
|
|
|
|
|
|
| ||||||||||||||||
Bonds -Total unrealized losses and OTTI increased by $437,983, or 328%, from December 31, 2017 to December 31, 2018. The increase in unrealized losses was across all asset classes and reflects higher interest rates at December 31, 2018 compared to December 31, 2017, resulting in lower valuations of these bonds.
Total unrealized losses greater than twelve months increased by $169,588 from December 31, 2017 to December 31, 2018. Industrial and miscellaneous account for 74%, or $201,312, of the unrealized losses and OTTI greater than twelve months at December 31, 2018. The majority of these bonds continue to be designated as investment grade. Management does not have the intent to sell these assets; therefore, an OTTI was not recognized in net income.
24
Table of Contents
GREAT-WEST LIFE & ANNUITY INSURANCE COMPANY
Notes to Statutory Financial Statements
(In Thousands, Except Share Amounts)
Loan-backed and structured securities account for 20%, or $53,417, of the unrealized losses and OTTI greater than twelve months at December 31, 2018. Of the $53,417 of unrealized losses and OTTI over twelve months on loan-backed and structured securities, 99% or $52,708 are on securities which continue to be designated as investment grade. The present value of cash flows expected to be collected is not less than amortized cost and management does not have the intent to sell these assets; therefore, an OTTI was not recognized in net income.
Loan-backed and structured securities
The Company had a concentration in loan-backed and structured securities of 19% and 18% of total invested assets at December 31, 2018 and 2017, respectively.
Derivative financial instruments
Derivative transactions are generally entered into pursuant to International Swaps and Derivatives Association (“ISDA”) Master Agreements with approved counterparties that provide for a single net payment to be made by one party to the other on a daily basis, periodic payment dates, or at the due date, expiration, or termination of the agreement.
The ISDA Master Agreements contain provisions that would allow the counterparties to require immediate settlement of all derivative instruments in a net liability position if the Company were to default on any debt obligations over a certain threshold. The aggregate fair value, inclusive of accrued income and expense, of derivative instruments with credit-risk-related contingent features that were in a net liability position was $36,177 and $106,038 as of December 31, 2018 and 2017, respectively. The Company had pledged collateral related to these derivatives of $0 and $42,750 as of December 31, 2018 and 2017, respectively, in the normal course of business. If the credit-risk-related contingent features were triggered on December 31, 2018 the fair value of assets that could be required to settle the derivatives in a net liability position was $36,177.
At December 31, 2018 and 2017, the Company had pledged $30,220 and $42,750, respectively, of unrestricted cash collateral to counterparties in the normal course of business, while other counterparties had pledged $71,280 and $14,332 of unrestricted cash collateral to the Company to satisfy collateral netting arrangements, respectively.
At December 31, 2018 and 2017, the Company had pledged U.S. Treasury bills in the amount of $8,197 and $3,215, respectively, with a broker as collateral for futures contracts.
Types of derivative instruments and derivative strategies
Interest rate contracts
Cash flow hedges
Interest rate swap agreements are used to convert the interest rate on certain debt securities and debt obligations from a floating rate to a fixed rate.
Not designated as hedging instruments
The Company enters into certain transactions in which derivatives are hedging an economic risk but hedge accounting is either not elected or the transactions are not eligible for hedge accounting. These derivative instruments include: exchange-traded interest rate swap futures, OTC interest rate swaptions, OTC interest rate swaps, exchange-traded Eurodollar interest rate futures and treasury interest rate futures. Certain of the Company’s OTC derivatives are cleared and settled through a central clearing counterparty while others are bilateral contracts between the Company and a counterparty.
The derivative instruments mentioned above are economic hedges and used to manage risk. These transactions are used to offset changes in liabilities including those in variable annuity products, hedge the economic effect of a large increase in interest rates, manage the potential variability in future interest payments due to a change in credited interest rates and the related change in cash flows due to increased surrenders, and manage interest rate risks of forecasted acquisitions of bonds and forecasted liability pricing.
25
Table of Contents
GREAT-WEST LIFE & ANNUITY INSURANCE COMPANY
Notes to Statutory Financial Statements
(In Thousands, Except Share Amounts)
Foreign currency contracts
Cross-currency swaps and foreign currency forwards are used to manage the foreign currency exchange rate risk associated with investments denominated in other than U.S. dollars. The Company uses cross-currency swaps to convert interest and principal payments on foreign denominated debt instruments into U.S. dollars. Cross-currency swaps may be designated as cash flow hedges; however, some are not eligible for hedge accounting. The Company uses foreign currency forwards to reduce the risk of foreign currency exchange rate changes on proceeds received on sales of foreign denominated debt instruments; however, hedge accounting is not elected.
Equity contracts
The Company uses futures on equity indices to offset changes in GLWB liabilities; however, they are not eligible for hedge accounting.
The following tables summarize derivative financial instruments:
| December 31, 2018 | ||||||||||||
| Notional amount | Net book/adjusted carrying value (1) | Fair value (2) | ||||||||||
| Hedge designation/derivative type: | ||||||||||||
Derivatives designated as hedges: | ||||||||||||
Cash flow hedges: | ||||||||||||
Interest rate swaps | $ | 22,300 | $ | — | $ | 6,248 | ||||||
Cross-currency swaps | 886,018 | 55,808 | 39,109 | |||||||||
|
|
|
|
|
|
|
|
| ||||
| Total derivatives designated as hedges | 908,318 | 55,808 | 45,357 | |||||||||
|
|
|
|
|
|
|
|
| ||||
| Derivatives not designated as hedges: | ||||||||||||
Interest rate swaps | 636,500 | (13,645 | ) | (12,775 | ) | |||||||
Futures on equity indices | 137,829 | 5,920 | (786 | ) | ||||||||
Interest rate futures | 53,000 | 2,276 | 37 | |||||||||
Interest rate swaptions | 194,330 | 173 | 173 | |||||||||
Cross-currency swaps | 573,703 | 26,208 | 24,945 | |||||||||
|
|
|
|
|
|
|
|
| ||||
| Total derivatives not designated as hedges | 1,595,362 | 20,932 | 11,594 | |||||||||
|
|
|
|
|
|
|
|
| ||||
| Total cash flow hedges, and derivatives not designated as hedges | $ | 2,503,680 | $ | 76,740 | $ | 56,951 | ||||||
|
|
|
|
|
|
|
|
| ||||
(1) The book/adjusted carrying value excludes accrued income and expense. The book/adjusted carrying value of all derivatives in an asset position is reported within other invested assets and the book/adjusted carrying value of all derivatives in a liability position is reported within other liabilities in the Statutory Statements of Admitted Assets, Liabilities, Capital and Surplus.
(2) The fair value includes accrued income and expense.
26
Table of Contents
GREAT-WEST LIFE & ANNUITY INSURANCE COMPANY
Notes to Statutory Financial Statements
(In Thousands, Except Share Amounts)
| December 31, 2017 | ||||||||||||
| Notional amount | Net book/adjusted carrying value | Fair value | ||||||||||
| Hedge designation/derivative type: | ||||||||||||
Derivatives designated as hedges: | ||||||||||||
Cash flow hedges: | ||||||||||||
Interest rate swaps | $ | 388,800 | $ | — | $ | 28,725 | ||||||
Cross-currency swaps | 800,060 | 4,710 | (31,358) | |||||||||
|
|
|
|
|
|
|
|
| ||||
Total cash flow hedges | 1,188,860 | 4,710 | (2,633) | |||||||||
|
|
|
|
|
|
|
|
| ||||
| Derivatives not designated as hedges: | ||||||||||||
Interest rate swaps | 519,100 | (3,911) | (3,911) | |||||||||
Futures on equity indices | 22,074 | 857 | 77 | |||||||||
Interest rate futures | 60,700 | 2,358 | (5) | |||||||||
Interest rate swaptions | 164,522 | 75 | 75 | |||||||||
Cross-currency swaps | 612,733 | (21,279) | (21,279) | |||||||||
|
|
|
|
|
|
|
|
| ||||
| Total derivatives not designated as hedges | 1,379,129 | (21,900) | (25,043) | |||||||||
|
|
|
|
|
|
|
|
| ||||
| Total cash flow hedges and derivatives not designated as hedges | $ | 2,567,989 | $ | (17,190) | $ | (27,676) | ||||||
|
|
|
|
|
|
|
|
| ||||
The following table presents net unrealized gains/(losses) on derivatives not designated as hedging instruments as reported in the Statutory Statements of Changes in Capital and Surplus:
| Net unrealized gain (loss) on derivatives recognized in surplus | ||||||||||||
| Year Ended December 31, | ||||||||||||
| 2018 | 2017 | 2016 | ||||||||||
| Derivatives not designated as hedging instruments: | ||||||||||||
Interest rate swaps | $ | (8,039) | $ | 130 | $ | (4,901) | ||||||
Interest rate swaptions | 198 | (54) | 196 | |||||||||
Futures on equity indices | 297 | (363) | 531 | |||||||||
Interest rate futures | 159 | 48 | (37) | |||||||||
Cross-currency swaps | 32,525 | (39,021) | 44,541 | |||||||||
|
|
|
|
|
|
| ||||||
| Total | $ | 25,140 | $ | (39,260) | $ | 40,330 | ||||||
|
|
|
|
|
|
| ||||||
Securities Lending
Securities classified as industrial and miscellaneous with a cost or amortized cost of $47,218 and estimated fair values of $43,425 were on loan under the program at December 31, 2018. There were no securities on loan at December 31, 2017. The Company received cash of $45,102 as collateral at December 31, 2018.
The Company’s securities lending agreements are open agreements meaning the borrower can return and the Company can recall the loaned securities at any time.
The cash collateral received of $45,102 was reinvested into short-term repurchase agreements which are collateralized by U.S. government or U.S. government agency securities and mature in under 30 days.
27
Table of Contents
GREAT-WEST LIFE & ANNUITY INSURANCE COMPANY
Notes to Statutory Financial Statements
(In Thousands, Except Share Amounts)
Dollar Repurchase Agreements
Dollar repurchase agreements with a book/adjusted carrying value of $688,765 at December 31, 2018, was included with bonds in the Statutory Statement of Admitted Assets, Liabilities, Capital and Surplus. At December 31, 2018, the obligation of $664,650 to repurchase the agreements at a later date was recorded in repurchase agreements liabilities. The following table summarizes the securities underlying the dollar repurchase agreements at December 31, 2018:
| December 31, 2018 | ||||||||||||
Issuer | Book/adjusted carrying value | Fair value | Maturity | |||||||||
FHLMC | $ | 66,283 | $ | 64,754 | 1/1/2034 | |||||||
FHLMC | 482,628 | 471,162 | 1/1/2049 | |||||||||
FNMA | 35,506 | 34,925 | 1/1/2034 | |||||||||
FNMA | 104,348 | 101,971 | 1/1/2049 | |||||||||
|
|
|
|
|
| |||||||
Total | $ | 688,765 | $ | 672,812 | ||||||||
|
|
|
|
|
| �� | ||||||
There were no dollar repurchase agreements open at December 31, 2017.
The cash collateral of $664,791 related to the dollar repurchase agreement program at December 31, 2018 was primarily reinvested into investment grade corporate securities with a book/adjusted carrying value of $664,791 and fair value of $657,553, with maturities greater than 3 years.
Reverse Repurchase Agreements
The Company had short-term reverse repurchase agreements with book/adjusted carrying values of $11,200 and $23,200 at December 31, 2018 and December 31, 2017, respectively, with maturities of 2 days to 1 week. The fair value of securities acquired under thetri-party agreement and held on the Company’s behalf was $11,424 and $23,664 at December 31, 2018 and December 31, 2017, respectively.
28
Table of Contents
GREAT-WEST LIFE & ANNUITY INSURANCE COMPANY
Notes to Statutory Financial Statements
(In Thousands, Except Share Amounts)
Restricted Assets
The following tables summarize collateral pledged by the Company and investments on deposit or in trust accounts controlled by various state insurance departments in accordance with statutory requirements:
| December 31, 2018 | ||||||||||||||||||||||||||||||||||||||||||||
| Gross (Admitted & Non-admitted) Restricted | Percentage | |||||||||||||||||||||||||||||||||||||||||||
| Total General Account (G/A) | G/A Supporting S/A Activity | Total Separate Account (S/A) Restricted Assets | S/A Assets Supporting G/A Activity | Total | Total From Prior Year | Increase/ (Decrease) | Total Non- admitted Restricted | Total Admitted Restricted | Gross (Admitted & Non- admitted) Restricted to Total Assets | Admitted Restricted to Total Admitted Assets | ||||||||||||||||||||||||||||||||||
Restricted Asset Category: | ||||||||||||||||||||||||||||||||||||||||||||
| Collateral held under security lending arrangements | $ | 45,102 | $ | — | $ | — | $ | — | $ | 45,102 | $ | — | $ | 45,102 | $ | — | $ | 45,102 | 0.08% | 0.08% | ||||||||||||||||||||||||
| Subject to repurchase agreements | — | — | — | — | — | — | — | — | — | 0.00% | 0.00% | |||||||||||||||||||||||||||||||||
| Subject to reverse repurchase agreements | 11,200 | — | — | — | 11,200 | 23,200 | (12,000 | ) | — | 11,200 | 0.02% | 0.02% | ||||||||||||||||||||||||||||||||
| Subject to dollar repurchase agreements | 688,765 | — | — | — | 688,765 | — | 688,765 | — | 688,765 | 1.23% | 1.23% | |||||||||||||||||||||||||||||||||
| On deposit with states | 4,443 | — | — | — | 4,443 | 4,351 | 92 | — | 4,443 | 0.01% | 0.01% | |||||||||||||||||||||||||||||||||
| On deposit with other regulatory bodies | 603 | — | — | — | 603 | 627 | (24 | ) | — | 603 | 0.00% | 0.00% | ||||||||||||||||||||||||||||||||
| Pledged as collateral not captured in other categories: | ||||||||||||||||||||||||||||||||||||||||||||
Futures margin deposits | 8,197 | — | — | — | 8,197 | 3,388 | �� | 4,809 | — | 8,197 | 0.02% | 0.02% | ||||||||||||||||||||||||||||||||
Other collateral | 5,320 | — | — | — | 5,320 | — | 5,320 | — | 5,320 | 0.01% | 0.01% | |||||||||||||||||||||||||||||||||
Derivative cash collateral | 30,220 | — | — | — | 30,220 | 42,751 | (12,531 | ) | — | 30,220 | 0.05% | 0.05% | ||||||||||||||||||||||||||||||||
| Other restricted assets | 1,259 | — | — | — | 1,259 | 228 | 1,031 | — | 1,259 | 0.00% | 0.00% | |||||||||||||||||||||||||||||||||
|
|
|
|
|
|
|
|
|
|
|
|
|
|
|
|
|
|
|
|
|
|
|
|
|
|
|
|
|
|
|
| |||||||||||||
| Total Restricted Assets | $ | 795,109 | $ | — | $ | — | $ | — | $ | 795,109 | $ | 74,545 | $ | 720,564 | $ | — | $ | 795,109 | 1.42% | 1.43% | ||||||||||||||||||||||||
|
|
|
|
|
|
|
|
|
|
|
|
|
|
|
|
|
|
|
|
|
|
|
|
|
|
|
|
|
|
|
| |||||||||||||
| December 31, 2017 | ||||||||||||||||||||||||||||||||||||||||||||
| Gross (Admitted & Non-admitted) Restricted | Percentage | |||||||||||||||||||||||||||||||||||||||||||
| Total General Account (G/A) | G/A Supporting S/A Activity | Total Separate Account (S/A) Restricted Assets | S/A Assets Supporting G/A Activity | Total | Total From Prior Year | Increase/ (Decrease) | Total Non- admitted Restricted | Total Admitted Restricted | Gross (Admitted & Non- admitted) Restricted to Total Assets | Admitted Restricted to Total Admitted Assets | ||||||||||||||||||||||||||||||||||
Restricted Asset Category: | ||||||||||||||||||||||||||||||||||||||||||||
| Subject to reverse repurchase agreements | $ | 23,200 | $ | — | $ | — | $ | — | $ | 23,200 | $ | — | $ | 23,200 | $ | — | $ | 23,200 | 0.000% | 0.000% | ||||||||||||||||||||||||
| On deposit with states | 4,351 | — | — | — | 4,351 | 4,350 | 1 | — | 4,351 | 0.000% | 0.000% | |||||||||||||||||||||||||||||||||
| On deposit with other regulatory bodies | 627 | — | — | — | 627 | 513 | 114 | — | 627 | 0.000% | 0.000% | |||||||||||||||||||||||||||||||||
| Other restricted assets | 228 | — | — | — | 228 | 581 | (353 | ) | — | 228 | 0.000% | 0.000% | ||||||||||||||||||||||||||||||||
| Pledged as collateral not captured in other categories: | ||||||||||||||||||||||||||||||||||||||||||||
Futures margin deposits | 3,215 | — | 173 | — | 3,388 | 3,570 | (182 | ) | — | 3,388 | 0.000% | 0.000% | ||||||||||||||||||||||||||||||||
Derivative cash collateral | 42,750 | — | 1 | — | 42,751 | — | 42,751 | — | 42,751 | 0.000% | 0.000% | |||||||||||||||||||||||||||||||||
|
|
|
|
|
|
|
|
|
|
|
|
|
|
|
|
|
|
|
|
|
|
|
|
|
|
|
|
|
|
|
| |||||||||||||
| Total Restricted Assets | $ | 74,371 | $ | — | $ | 174 | $ | — | $ | 74,545 | $ | 9,014 | $ | 65,531 | $ | — | $ | 74,545 | 0.000% | 0.000% | ||||||||||||||||||||||||
|
|
|
|
|
|
|
|
|
|
|
|
|
|
|
|
|
|
|
|
|
|
|
|
|
|
|
|
|
|
|
| |||||||||||||
29
Table of Contents
GREAT-WEST LIFE & ANNUITY INSURANCE COMPANY
Notes to Statutory Financial Statements
(In Thousands, Except Share Amounts)
Net Investment Income
The following table summarizes net investment income:
| Years Ended December 31, | ||||||||||||
| 2018 | 2017 2016 | |||||||||||
| Bonds | $ | 822,645 | $ | 817,282 | $ | 787,272 | ||||||
| Common stock | 221 | 425 | 633 | |||||||||
| Mortgage loans | 169,415 | 164,055 | 151,505 | |||||||||
| Real estate | 26,557 | 25,979 | 25,401 | |||||||||
| Contract loans | 199,507 | 198,672 | 198,846 | |||||||||
| Cash, cash equivalents and short-term investments | 4,749 | 6,556 | 7,030 | |||||||||
| Derivative instruments | 16,308 | 16,216 | 10,029 | |||||||||
| Other invested assets | 125,821 | 100,134 | 116,701 | |||||||||
| Miscellaneous | 1,896 | 4,552 | 1,761 | |||||||||
|
|
|
|
|
|
|
|
| ||||
Gross investment income | 1,367,119 | 1,333,871 | 1,299,178 | |||||||||
| Expenses | (59,732 | ) | (66,908 | ) | (63,337 | ) | ||||||
|
|
|
|
|
|
|
|
| ||||
| Net investment income | $ | 1,307,387 | $ | 1,266,963 | $ | 1,235,841 | ||||||
|
|
|
|
|
|
|
|
| ||||
The amount of interest incurred and charged to investment expense during the years ended December 31, 2018, 2017 and 2016 was $22,070, $29,278 and $31,042, respectively.
The following table summarizes net realized capital gains (losses) on investments net of federal income tax and interest maintenance reserve transfer:
| Year Ended December 31, | ||||||||||||
| 2018 | 2017 | 2016 | ||||||||||
| Net realized capital gains (losses), before federal income tax | $ | 4,905 | $ | (19,270) | $ | 46,048 | ||||||
Less: Federal income tax | 1,030 | (6,745) | 16,117 | |||||||||
|
|
|
|
|
|
|
|
| ||||
| Net realized capital gains (losses), before IMR transfer | 3,875 | (12,525) | 29,931 | |||||||||
Net realized capital gains (losses) transferred to IMR, net of federal income tax of ($1,781), ($7,032) and $16,707, respectively | (6,701) | (13,060) | 31,027 | |||||||||
|
|
|
|
|
|
|
|
| ||||
| Net realized capital gains (losses), net of federal income tax expense (benefit) of $2,811, $287 and ($590), respectively, and IMR transfer | $ | 10,576 | $ | 535 | $ | (1,096) | ||||||
|
|
|
|
|
|
|
|
| ||||
Concentrations
The Company had the following bond concentrations based on total invested assets:
| Concentration by type | ||||
| December 31, | ||||
| 2018 | 2017 | |||
| Industrial and miscellaneous | 56% | 56% | ||
| Concentration by industry | ||||
| December 31, | ||||
| 2018 | 2017 | |||
| Financial services | 14% | 13% | ||
| Utilities | 8% | 10% | ||
30
Table of Contents
GREAT-WEST LIFE & ANNUITY INSURANCE COMPANY
Notes to Statutory Financial Statements
(In Thousands, Except Share Amounts)
Mortgage Loans
The recorded investment of the commercial mortgage loan portfolio categorized as performing was $4,207,611 and $3,872,084 as of December 31, 2018 and 2017, respectively. These mortgages were current as of December 31, 2018 and 2017.
The maximum lending rates for commercial mortgage loans originated during the years ended December 31, 2018 and 2017 were 4.61% and 4.23%, respectively. The minimum lending rates for commercial mortgage loans originated during the years ended December 31, 2018 and 2017 were 3.51% and 3.17%, respectively.
During 2018 and 2017, the maximum percentage of any one loan to the value of security at the time of the loan, exclusive of insured or guaranteed or purchase money mortgages, was 69% and 69%, respectively.
The following table summarizes activity in the commercial mortgage provision allowance for the years ended December 31, 2018 and 2017:
| Year ended December 31, | ||||||||
| 2018 | 2017 | |||||||
Beginning balance | $ | 745 | $ | 2,713 | ||||
Additions charged to operations | — | 157 | ||||||
Direct write-downs charged against the allowances | — | (600 | ) | |||||
Recoveries of amounts previously charged off | — | (1,525 | ) | |||||
|
|
|
|
|
| |||
Ending balance | $ | 745 | $ | 745 | ||||
|
|
|
|
|
| |||
The following tables present concentrations of the total commercial mortgage portfolio:
| Concentration by type | ||||
| December 31, | ||||
| 2018 | 2017 | |||
Multi-family | 37% | 39% | ||
Industrial | 29% | 25% | ||
Office | 17% | 17% | ||
Retail | 10% | 11% | ||
Other | 7% | 8% | ||
|
| |||
| 100% | 100% | |||
|
| |||
| Concentration by geographic area | ||||
| December 31, | ||||
| 2018 | 2017 | |||
Pacific | 35% | 36% | ||
East North Central | 18% | 16% | ||
South Atlantic | 14% | 13% | ||
Middle Atlantic | 10% | 11% | ||
Mountain | 9% | 10% | ||
Other | 8% | 8% | ||
West South Central | 6% | 6% | ||
|
| |||
| 100% | 100% | |||
|
| |||
31
Table of Contents
GREAT-WEST LIFE & ANNUITY INSURANCE COMPANY
Notes to Statutory Financial Statements
(In Thousands, Except Share Amounts)
Troubled Debt Restructuring
After being impaired in 2016, a security classified as industrial and miscellaneous was subject to a troubled debt restructuring in August 2017, under which the original security with a recorded investment, after impairments, of $11,710 was extinguished in exchange for new assets. Cash, equities, receivable and debt in the amounts of $1,887, $6,591, $164 and $3,068, respectively, were acquired in full satisfaction of the original debt. The new debt has extended the maturity date from December 30, 2017 to August 1, 2022 and the interest rate increased from 7% to 8%. Upon consummation of the troubled debt restructuring, a total realized capital loss of $7,789 was recorded in the “Net realized capital gains (losses) less capital gains tax and transfers to interest maintenance reserve” line on the Statutory Statements of Operations. There were no payment defaults recognized on previously restructured investments.
The following tables summarize the fair value hierarchy for all financial instruments and invested assets:
| Fair Value Measurements at Reporting Date | ||||||||||||||||||||||||||||
| Type of financial instrument | December 31, 2018 | |||||||||||||||||||||||||||
Assets: | Aggregate fair value | Admitted assets and liabilities | (Level 1) | (Level 2) | (Level 3) | Net Asset Value (NAV) | Total (All Levels) | |||||||||||||||||||||
Bonds | $ | 20,688,043 | $ | 20,654,118 | $ | — | $ | 20,666,851 | $ | 21,192 | $ | — | $ | 20,688,043 | ||||||||||||||
Common stock | 35,635 | 35,635 | 35,635 | — | — | — | 35,635 | |||||||||||||||||||||
Mortgage loans | 4,176,880 | 4,206,865 | — | 4,176,880 | — | — | 4,176,880 | |||||||||||||||||||||
Real estate | 137,700 | 38,962 | — | — | 137,700 | — | 137,700 | |||||||||||||||||||||
Cash, cash equivalents and short-term investments | 228,997 | 229,003 | 188,283 | 40,714 | — | — | 228,997 | |||||||||||||||||||||
Contract loans | 4,122,637 | 4,122,637 | — | 4,122,637 | — | — | 4,122,637 | |||||||||||||||||||||
Other long-term invested assets | 392,232 | 338,837 | — | 319,299 | 31 | 72,902 | 392,232 | |||||||||||||||||||||
Securities lending collateral assets | 45,102 | 45,102 | — | 45,102 | — | — | 45,102 | |||||||||||||||||||||
Collateral under derivative counterparty collateral agreements | 101,561 | 101,561 | 101,561 | — | — | — | 101,561 | |||||||||||||||||||||
Other collateral | 9,315 | 9,315 | 9,315 | — | — | — | 9,315 | |||||||||||||||||||||
Receivable for securities | 9,654 | 9,654 | — | 9,654 | — | — | 9,654 | |||||||||||||||||||||
Derivative instruments | 114,612 | 115,922 | 66 | 114,546 | — | — | 114,612 | |||||||||||||||||||||
Separate account assets | 24,639,265 | 24,654,916 | 13,236,266 | 10,975,973 | — | 427,026 | 24,639,265 | |||||||||||||||||||||
|
|
|
|
|
|
|
|
|
|
|
|
|
|
|
|
|
|
|
|
| ||||||||
Total assets | $ | 54,701,633 | $ | 54,562,527 | $ | 13,571,126 | $ | 40,471,656 | $ | 158,923 | $ | 499,928 | $ | 54,701,633 | ||||||||||||||
|
|
|
|
|
|
|
|
|
|
|
|
|
|
|
|
|
|
|
|
| ||||||||
Liabilities: | ||||||||||||||||||||||||||||
Deposit-type contracts | $ | 196,778 | $ | 189,895 | $ | — | $ | 196,778 | $ | — | $ | — | $ | 196,778 | ||||||||||||||
Commercial paper | 98,859 | 98,859 | — | 98,859 | — | — | 98,859 | |||||||||||||||||||||
Payable under securities lending agreements | 45,102 | 45,102 | — | 45,102 | — | — | 45,102 | |||||||||||||||||||||
Collateral under derivative counterparty collateral agreements | 71,280 | 71,280 | 71,280 | — | — | — | 71,280 | |||||||||||||||||||||
Other collateral | 3,995 | 3,995 | 3,995 | — | — | — | 3,995 | |||||||||||||||||||||
Payable for securities | 11,096 | 11,096 | — | 11,096 | — | — | 11,096 | |||||||||||||||||||||
Derivative instruments | 57,660 | 47,378 | 814 | 56,846 | — | — | 57,660 | |||||||||||||||||||||
Dollar repurchase agreements | 664,650 | 664,650 | — | 664,650 | — | — | 664,650 | |||||||||||||||||||||
Separate account liabilities | 251,806 | 251,806 | 44 | 251,762 | — | — | 251,806 | |||||||||||||||||||||
|
|
|
|
|
|
|
|
|
|
|
|
|
|
|
|
|
|
|
|
| ||||||||
Total liabilities | $ | 1,401,226 | $ | 1,384,061 | $ | 76,133 | $ | 1,325,093 | $ | — | $ | — | $ | 1,401,226 | ||||||||||||||
|
|
|
|
|
|
|
|
|
|
|
|
|
|
|
|
|
|
|
|
| ||||||||
32
Table of Contents
GREAT-WEST LIFE & ANNUITY INSURANCE COMPANY
Notes to Statutory Financial Statements
(In Thousands, Except Share Amounts)
| Fair Value Measurements at Reporting Date | ||||||||||||||||||||||||
| Type of financial instrument | December 31, 2017 | |||||||||||||||||||||||
Assets: | Aggregate fair value | Admitted assets and liabilities | (Level 1) | (Level 2) | (Level 3) | Total (All Levels) | ||||||||||||||||||
Bonds | $ | 20,777,543 | $ | 19,944,862 | $ | — | $ | 20,750,605 | $ | 26,938 | $ | 20,777,543 | ||||||||||||
Mortgage loans | 3,858,883 | 3,871,338 | — | 3,858,883 | — | 3,858,883 | ||||||||||||||||||
Real estate | 137,526 | 37,768 | — | — | 137,526 | 137,526 | ||||||||||||||||||
Cash, cash equivalents and short-term investments | 242,084 | 242,084 | 198,869 | 43,215 | — | 242,084 | ||||||||||||||||||
Contract loans | 4,078,669 | 4,078,669 | — | 4,078,669 | — | 4,078,669 | ||||||||||||||||||
Other long-term invested assets | 412,019 | 325,181 | — | 363,198 | 48,821 | 412,019 | ||||||||||||||||||
Collateral under derivative counterparty collateral agreements | 57,420 | 57,420 | 57,420 | — | — | 57,420 | ||||||||||||||||||
Receivable for securities | 23,760 | 23,135 | — | 23,760 | — | 23,760 | ||||||||||||||||||
Derivative instruments | 78,431 | 68,439 | 98 | 78,333 | — | 78,431 | ||||||||||||||||||
Separate account assets | 28,222,102 | 28,197,126 | 16,058,519 | 12,163,583 | — | 28,222,102 | ||||||||||||||||||
|
|
|
|
|
|
|
|
|
|
|
|
|
|
|
|
|
| |||||||
Total assets | $ | 57,888,437 | $ | 56,846,022 | $ | 16,314,906 | $ | 41,360,246 | $ | 213,285 | $ | 57,888,437 | ||||||||||||
|
|
|
|
|
|
|
|
|
|
|
|
|
|
|
|
|
| |||||||
Liabilities: | ||||||||||||||||||||||||
Deposit-type contracts | $ | 219,909 | $ | 206,134 | $ | — | $ | 219,909 | $ | — | $ | 219,909 | ||||||||||||
Commercial paper | 99,886 | 99,886 | — | 99,886 | — | 99,886 | ||||||||||||||||||
Collateral under derivative counterparty collateral agreements | 14,332 | 14,332 | 14,332 | — | — | 14,332 | ||||||||||||||||||
Payable for securities | 2,364 | 2,364 | — | 2,364 | — | 2,364 | ||||||||||||||||||
Derivative instruments | 106,106 | 88,843 | 26 | 106,080 | — | 106,106 | ||||||||||||||||||
Separate account liabilities | 409,275 | 409,275 | 9 | 409,266 | — | 409,275 | ||||||||||||||||||
|
|
|
|
|
|
|
|
|
|
|
|
|
|
|
|
|
| |||||||
Total liabilities | $ | 851,872 | $ | 820,834 | $ | 14,367 | $ | 837,505 | $ | — | $ | 851,872 | ||||||||||||
|
|
|
|
|
|
|
|
|
|
|
|
|
|
|
|
|
| |||||||
Bonds and common stock
The fair values for bonds and common stock are generally based upon evaluated prices from independent pricing services. In cases where these prices are not readily available, fair values are estimated by the Company. To determine estimated fair value for these instruments, the Company generally utilizes discounted cash flow models with market observable pricing inputs such as spreads, average life, and credit quality. Fair value estimates are made at a specific point in time, based on available market information and judgments about financial instruments, including estimates of the timing and amounts of expected future cash flows and the credit standing of the issuer or counterparty.
Mortgage loans
Mortgage loan fair value estimates are generally based on discounted cash flows. A discount rate matrix is used where the discount rate valuing a specific mortgage generally corresponds to that mortgage’s remaining term and credit quality. Management believes the discount rate used is comparable to the credit, interest rate, term, servicing costs, and risks of loans similar to the portfolio loans that the Company would make today given its internal pricing strategy.
Real estate
The estimated fair value for real estate is based on the unadjusted appraised value which includes factors such as comparable property sales, property income analysis, and capitalization rates.
33
Table of Contents
GREAT-WEST LIFE & ANNUITY INSURANCE COMPANY
Notes to Statutory Financial Statements
(In Thousands, Except Share Amounts)
Cash, cash equivalents, short-term investments, collateral receivable and payable under securities lending agreements, receivable and payable for securities, dollar repurchase agreements and commercial paper
The amortized cost of cash, cash equivalents, short-term investments, collateral receivable and payable under securities lending agreements, receivable and payable for securities, dollar repurchase agreements and commercial paper is a reasonable estimate of fair value due to their short-term nature and the high credit quality of the issuers, counterparties and obligor. Cash equivalent investments also include money market funds that are valued using unadjusted quoted prices in active markets.
Contract loans
The Company believes the fair value of contract loans approximates book value. Contract loans are funds provided to contract holders in return for a claim on the contract. The funds provided are limited to the cash surrender value of the underlying contract. The nature of contract loans is to have a negligible default risk as the loans are fully collateralized by the value of the contract. Contract loans do not have a stated maturity and the balances and accrued interest are repaid either by the contractholder or with proceeds from the contract. Due to the collateralized nature of contract loans and unpredictable timing of repayments, the Company believes the fair value of contract loans approximates carrying value.
Other long-term invested assets
The fair values of other long-term invested assets are based on the specific asset type. Other invested assets that are held as bonds, such as surplus notes, are primarily valued the same as bonds. Forlow-income housing tax credits, amortized cost approximates fair value.
Limited partnership interests represent the Company’s minority ownership interests in pooled investment funds. These funds employ varying investment strategies that primarily make private equity investments across diverse industries and geographical focuses. The net asset value, determined using the partnership financial statement reported capital account adjusted for other relevant information, which may impact the exit value of the investments, is used as a practical expedient to estimate fair value. Distributions by these investments are generated from investment gains, from operating income generated by the underlying investments of the funds and from liquidation of the underlying assets of the funds, which are estimated to be liquidated over the next one to 10 years. In the absence of permitted sales of its ownership interest, the Company will be redeemed out of the partnership interests through distributions.
Collateral under derivative counterparty collateral agreements and other collateral
Included in other assets is cash collateral received from or pledged to counterparties and included in other liabilities is the obligation to return the cash collateral to the counterparties. The carrying value of the collateral is a reasonable estimate of fair value.
Derivative instruments
The estimated fair values of OTC derivatives, primarily consisting of cross-currency swaps, interest rate swaps and interest rate swaptions, are the estimated amount the Company would receive or pay to terminate the agreements at the end of each reporting period, taking into consideration current interest rates and other relevant factors.
Separate account assets
Separate account assets and liabilities primarily include investments in mutual funds, unregistered funds, most of which are not subject to redemption restrictions, bonds, and short-term securities. Mutual funds and unregistered funds are recorded at net asset value, which approximates fair value, on a daily basis. The bond and short-term investments are valued in the same manner, and using the same pricing sources and inputs as the bond and short-term investments of the Company.
Deposit-type contracts
Fair values for liabilities under deposit-type insurance contracts are estimated using discounted liability calculations, adjusted to approximate the effect of current market interest rates for the assets supporting the liabilities.
34
Table of Contents
GREAT-WEST LIFE & ANNUITY INSURANCE COMPANY
Notes to Statutory Financial Statements
(In Thousands, Except Share Amounts)
Fair value hierarchy
The following tables present information about the Company’s financial assets and liabilities carried at fair value and indicates the fair value hierarchy of the valuation techniques utilized by the Company to determine such fair value:
| Fair Value Measurements at Reporting Date | ||||||||||||||||||||
| December 31, 2018 | ||||||||||||||||||||
| Net Asset Value | Total | |||||||||||||||||||
Assets: | (Level 1) | (Level 2) | (Level 3) | (NAV) | (All Levels) | |||||||||||||||
Bonds | ||||||||||||||||||||
Industrial and miscellaneous | $ | — | $ | — | $ | 1,275 | $ | — | $ | 1,275 | ||||||||||
Common stock | ||||||||||||||||||||
Mutual funds | 30,969 | — | — | — | 30,969 | |||||||||||||||
Industrial and miscellaneous | 4,666 | — | — | — | 4,666 | |||||||||||||||
Other invested assets | ||||||||||||||||||||
Limited partnerships | — | — | — | 72,902 | 72,902 | |||||||||||||||
Derivatives | ||||||||||||||||||||
Interest rate swaps | — | 8,964 | — | — | 8,964 | |||||||||||||||
Cross-currency swaps | — | 39,705 | — | — | 39,705 | |||||||||||||||
Interest rate swaptions | — | 173 | — | — | 173 | |||||||||||||||
Separate account assets(1) | 13,212,700 | 9,887,836 | — | 427,026 | 23,527,562 | |||||||||||||||
|
|
|
|
|
|
|
|
|
|
|
|
|
|
| ||||||
Total assets | $ | 13,248,335 | $ | 9,936,678 | $ | 1,275 | $ | 499,928 | $ | 23,686,216 | ||||||||||
|
|
|
|
|
|
|
|
|
|
|
|
|
|
| ||||||
Liabilities: | ||||||||||||||||||||
Derivatives | ||||||||||||||||||||
Interest rate swaps | $ | — | 21,740 | $ | — | $ | — | $ | 21,740 | |||||||||||
Cross-currency swaps | — | 14,760 | — | — | 14,760 | |||||||||||||||
Separate account liabilities(1) | 44 | 251,762 | — | — | 251,806 | |||||||||||||||
|
|
|
|
|
|
|
|
|
|
|
|
|
|
| ||||||
Total liabilities | $ | 44 | $ | 288,262 | $ | — | $ | — | $ | 288,306 | ||||||||||
|
|
|
|
|
|
|
|
|
|
|
|
|
|
| ||||||
(1)Includes only separate account investments which are carried at the fair value of the underlying invested assets or liabilities owned by the separate accounts.
| Fair Value Measurements at Reporting Date | ||||||||||||||||
| December 31, 2017 | ||||||||||||||||
| Total | ||||||||||||||||
Assets: | (Level 1) | (Level 2) | (Level 3) | (All Levels) | ||||||||||||
Bonds | ||||||||||||||||
Industrial and miscellaneous | $ | — | $ | — | $ | 1,297 | $ | 1,297 | ||||||||
States | — | 228 | — | 228 | ||||||||||||
Derivatives | ||||||||||||||||
Interest rate swaps | — | 9,732 | — | 9,732 | ||||||||||||
Cross-currency swaps | — | 20,320 | — | 20,320 | ||||||||||||
Interest rate swaptions | — | 75 | — | 75 | ||||||||||||
Separate account assets (1) | 16,057,788 | 11,172,811 | — | 27,230,599 | ||||||||||||
|
|
|
|
|
|
|
|
|
|
|
| |||||
Total assets | $ | 16,057,788 | $ | 11,203,166 | $ | 1,297 | $ | 27,262,251 | ||||||||
|
|
|
|
|
|
|
|
|
|
|
| |||||
Liabilities: | ||||||||||||||||
Derivatives | ||||||||||||||||
Interest rate swaps | $ | — | $ | 13,643 | $ | — | $ | 13,643 | ||||||||
Cross-currency swaps | — | 41,599 | — | 41,599 | ||||||||||||
Separate account liabilities(1) | 9 | 409,266 | — | 409,275 | ||||||||||||
|
|
|
|
|
|
|
|
|
|
|
| |||||
Total liabilities | $ | 9 | $ | 464,508 | $ | — | $ | 464,517 | ||||||||
|
|
|
|
|
|
|
|
|
|
|
| |||||
(1) Include only separate account investments which are carried at the fair value of the underlying invested assets or liabilities owned by the separate accounts.
35
Table of Contents
GREAT-WEST LIFE & ANNUITY INSURANCE COMPANY
Notes to Statutory Financial Statements
(In Thousands, Except Share Amounts)
The following table summarizes the Company’snon-admitted assets:
| December 31, 2018 | December 31, 2017 | |||||||||||||||||||||||
Type | Asset | Non- admitted asset | Admitted asset | Asset | Non- admitted asset | Admitted asset | ||||||||||||||||||
Common stock | $ | 131,883 | $ | — | $ | 131,883 | $ | 109,948 | $ | 1,971 | $ | 107,977 | ||||||||||||
Cash, cash equivalents and short-term investments | 229,434 | 431 | 229,003 | 242,084 | — | 242,084 | ||||||||||||||||||
Other invested assets | 607,793 | 1,006 | 606,787 | 569,702 | 3,515 | 566,187 | ||||||||||||||||||
Premiums deferred and uncollected | 25,904 | 109 | 25,795 | 16,232 | 313 | 15,919 | ||||||||||||||||||
Deferred income taxes | 340,645 | 190,148 | 150,497 | 382,188 | 232,873 | 149,315 | ||||||||||||||||||
Due from parent, subsidiaries and affiliate | 94,542 | 44,435 | 50,107 | 110,901 | 43,546 | 67,355 | ||||||||||||||||||
Other prepaid assets | 28,150 | 28,150 | — | 16,478 | 16,478 | — | ||||||||||||||||||
Capitalized internal use software | 58,658 | 58,658 | — | 55,279 | 55,279 | — | ||||||||||||||||||
Furniture, fixtures and equipment | 4,949 | 4,949 | — | 16,182 | 5,196 | 10,986 | ||||||||||||||||||
Reinsurance recoverable | 8,468 | 378 | 8,090 | 7,090 | — | 7,090 | ||||||||||||||||||
Other assets | 234,504 | 2,539 | 231,965 | 152,955 | 553 | 152,402 | ||||||||||||||||||
|
|
|
|
|
|
|
|
|
|
|
|
|
|
|
|
|
| |||||||
Total | $ | 1,764,930 | $ | 330,803 | $ | 1,434,127 | $ | 1,679,039 | $ | 359,724 | $ | 1,319,315 | ||||||||||||
|
|
|
|
|
|
|
|
|
|
|
|
|
|
|
|
|
| |||||||
The following table summarizes the Company’s aggregate Statement of Admitted Assets, Liabilities, Capital and Surplus values of all subsidiary, controlled and affiliated entities (“SCA”), except insurance SCA entities as follows:
| December 31, 2018 | December 31, 2017 | |||||||||||||||||||||||
Type | Asset | Non- admitted asset | Admitted asset | Asset | Non- admitted asset | Admitted asset | ||||||||||||||||||
Common stock | $ | 13,544 | $ | — | $ | 13,544 | $ | 15,636 | $ | 1,971 | $ | 13,665 | ||||||||||||
Other invested assets | 143,533 | 975 | 142,558 | 151,318 | 1,610 | 149,708 | ||||||||||||||||||
|
|
|
|
|
|
|
|
|
|
|
|
|
|
|
|
|
| |||||||
Total | $ | 157,077 | $ | 975 | $ | 156,102 | $ | 166,954 | $ | 3,581 | $ | 163,373 | ||||||||||||
|
|
|
|
|
|
|
|
|
|
|
|
|
|
|
|
|
| |||||||
7. Premiums Deferred and Uncollected
The following table summarizes the Company’s ordinary and group life insurance premiums and annuity considerations deferred and uncollected, both gross and net of loading:
| December 31, 2018 | December 31, 2017 | |||||||||||||||
Type | Gross | Net of loading | Gross | Net of loading | ||||||||||||
Ordinary new business | $ | 427 | $ | 221 | $ | 226 | $ | 64 | ||||||||
Ordinary renewal business | 31,069 | 25,544 | 20,681 | 16,095 | ||||||||||||
Group life | 32 | 30 | (260 | ) | (240 | ) | ||||||||||
|
|
|
|
|
|
|
|
|
|
|
| |||||
Total | $ | 31,528 | $ | 25,795 | $ | 20,647 | $ | 15,919 | ||||||||
|
|
|
|
|
|
|
|
|
|
|
| |||||
8. Business Combination and Goodwill
The Company’s goodwill is the result of two types of transactions.
Goodwill that arises as a result of the acquisition of subsidiary limited liability companies is included in other invested assets in the accompanying Statutory Statement of Admitted Assets, Liabilities and Capital. On August 29, 2014, the Company completed the acquisition of all of the voting equity interests in the J.P. Morgan Retirement Plan Services (“RPS”) large-market
36
Table of Contents
GREAT-WEST LIFE & ANNUITY INSURANCE COMPANY
Notes to Statutory Financial Statements
(In Thousands, Except Share Amounts)
recordkeeping business. This transaction was accounted for as a statutory purchase. Goodwill of $51,098 was recorded in other invested assets, which will be amortized over 10 years. At December 31, 2018 and 2017, the Company has $28,955 and $34,065, respectively, of admitted goodwill related to this acquisition. Goodwill amortization of $5,110 was recorded for the years ended December 31, 2018, 2017 and 2016.
| Acquisition date | Cost of acquired entity | Original amount of admitted goodwill | Admitted goodwill as of December 31, 2018 | Amount of goodwill amortized for the year ended December 31, 2018 | Admitted goodwill as a book/adjusted carrying | |||||||||||||||
August 29, 2014 | $ | 64,169 | $ | 51,098 | $ | 28,955 | $ | 5,110 | 104.4% | |||||||||||
In addition, goodwill that arises as a result of the acquisition of various assumption reinsurance agreements is included in goodwill in the accompanying Statutory Statement of Admitted Assets, Liabilities and Capital. At December 31, 2018 and 2017, this goodwill was fully amortized. During each of the years ended December 31, 2018, 2017 and 2016, the Company recorded $0, $977 and $12,929, respectively, of goodwill amortization related to these acquisitions.
In the normal course of its business, the Company seeks to limit its exposure to loss on any single insured and to recover a portion of benefits paid by ceding risks to other insurance enterprises under excess coverage and coinsurance contracts. The Company retains an initial maximum of $3,500 of coverage per individual life. This initial retention limit of $3,500 may increase due to automatic policy increases in coverage at a maximum rate of $175 per annum, with an overall maximum increase in coverage of $1,000.
Ceded reinsurance contracts do not relieve the Company from its obligations to policyholders. The failure of reinsurers to honor their obligations could result in losses to the Company. The Company evaluates the financial condition of its reinsurers and monitors concentrations of credit risk arising from similar geographic regions, activities or economic characteristics of the reinsurers to minimize its exposure to significant losses from reinsurer insolvencies.
The Company assumes risk from approximately 40 insurers and reinsurers by participating in yearly renewable term and coinsurance pool agreements. When assuming risk, the Company seeks to generate revenue while maintaining reciprocal working relationships with these partners as they also seek to limit their exposure to loss on any single life.
Maximum capacity to be retained by the Company is dictated at the treaty level and is monitored annually to ensure the total risk retained on any one life is limited to a maximum retention of $4,500.
The Company did not have any write-offs for uncollectible reinsurance receivables during the years ended December 31, 2018 and 2017 for losses incurred, loss adjustment expenses incurred or premiums earned.
The Company does not have any uncollectible reinsurance, commutation of ceded reinsurance, or certified reinsurer downgraded of status subject to revocation.
Aggregate reserves are computed in accordance with the Commissioner’s Annuity Reserve Valuation Method (“CARVM”) and the Commissioner’s Reserve Valuation Method (“CRVM”), the standard statutory reserving methodologies.
The significant assumptions used to determine the liability for future life insurance benefits are as follows:
37
Table of Contents
GREAT-WEST LIFE & ANNUITY INSURANCE COMPANY
Notes to Statutory Financial Statements
(In Thousands, Except Share Amounts)
Interest | - Life Insurance | 2.25% to 6.00% | ||
| - Annuity Funds | 3.00% to 11.25% | |||
| - Disability | 2.50% to 6.00% | |||
Mortality | - Life Insurance | Various valuation tables, primarily including 1941, 1958, 1980 and 2001 Commissioners Standard Ordinary (“CSO”) tables, and American Experience | ||
| - Annuity Funds | Various annuity valuation tables, primarily including the GA 1951, 71, 83a and 2012 Individual Annuitant Mortality (“IAM”), Group Annuity Reserve (“GAR”) 94, 1971 and 1983 Group Annuity Mortality (“GAM”), and Annuity 2000 | |||
Morbidity | - Disability | 1970 Intercompany DISA Group Disability Tables | ||
The Company waives deduction of deferred fractional premiums upon the death of the insured. When surrender values exceed aggregate reserves, excess cash value reserves are held.
Policies issued at premium corresponding to ages higher than the true ages are valued at therated-up ages. Policies providing for payment at death during certain periods of an amount less than the full amount of insurance, being policies subject to liens, are valued as if the full amount is payable without any deduction.
For policies issued with, or subsequently subject to, an extra premium payable annually, an extra reserve is held. The extra premium reserve is the unearned gross extra premium payable during the year if the policies are rated for reasons other than medical impairments. For medical impairments, the extra premium reserve is calculated as the excess of the reserve based on rated mortality over that based on standard mortality. All substandard annuities are valued at their true ages.
At December 31, 2018 and 2017, the Company had $3,904,519 and $4,354,703, respectively of insurance in force for which the gross premiums are less than the net premiums according to the standard valuation set by the Division.
Tabular interest, tabular interest on funds not involving life contingencies and tabular cost have been determined from the basic data for the calculation of aggregate reserves. Tabular less actual reserves released has been determined from basic data for the calculation of aggregate reserves and the actual reserves released.
The withdrawal characteristics of annuity reserves and deposit liabilities are as follows:
| December 31, 2018 | ||||||||||||||||||||
| General Account | Separate Account with Guarantees | Separate Account Non- guaranteed | Total | Percent of total gross | ||||||||||||||||
|
|
|
|
|
|
|
|
|
|
|
| |||||||||
Subject to discretionary withdrawal: | ||||||||||||||||||||
With market value adjustment | $ | 850,240 | $ | — | $ | — | $ | 850,240 | 2.8 | % | ||||||||||
At book value less current surrender charges of 5% or more | 779,760 | — | — | 779,760 | 2.5 | % | ||||||||||||||
At fair value | — | 6,460,894 | 11,311,267 | 17,772,161 | 57.5 | % | ||||||||||||||
|
|
|
|
|
|
|
|
|
|
|
| |||||||||
Total with adjustment or at market value | 1,630,000 | 6,460,894 | 11,311,267 | 19,402,161 | 62.8 | % | ||||||||||||||
At book value without adjustment (minimal or no charge adjustment) | 155,150 | — | — | 155,150 | 0.5 | % | ||||||||||||||
Not subject to discretionary withdrawal | 11,355,177 | — | — | 11,355,177 | 36.7 | % | ||||||||||||||
|
|
|
|
|
|
|
|
|
|
|
| |||||||||
Total gross | 13,140,327 | 6,460,894 | 11,311,267 | 30,912,488 | 100.0 | % | ||||||||||||||
|
|
| ||||||||||||||||||
Reinsurance ceded | 1,479 | — | — | 1,479 | ||||||||||||||||
|
|
|
|
|
|
|
|
|
|
|
| |||||||||
Total, net | $ | 13,138,848 | $ | 6,460,894 | $ | 11,311,267 | $ | 30,911,009 | ||||||||||||
|
|
|
|
|
|
|
|
|
|
|
| |||||||||
38
Table of Contents
GREAT-WEST LIFE & ANNUITY INSURANCE COMPANY
Notes to Statutory Financial Statements
(In Thousands, Except Share Amounts)
| December 31, 2017 | ||||||||||||||||||||
General Account | Separate Account with Guarantees | Separate guaranteed | Total | Percent of total gross | ||||||||||||||||
|
|
|
|
|
|
|
|
|
|
|
| |||||||||
Subject to discretionary withdrawal: | ||||||||||||||||||||
With market value adjustment | $ | 780,008 | $ | — | $ | — | $ | 780,008 | 2.3% | |||||||||||
At book value less current surrender charges of 5% or more | 716,402 | — | — | 716,402 | 2.1% | |||||||||||||||
At fair value | — | 6,914,918 | 14,390,470 | 21,305,388 | 62.4% | |||||||||||||||
|
|
|
|
|
|
|
|
|
|
|
| |||||||||
Total with adjustment or at market value | 1,496,410 | 6,914,918 | 14,390,470 | 22,801,798 | 66.8% | |||||||||||||||
At book value without adjustment (minimal or no charge adjustment) | 159,104 | — | — | 159,104 | 0.5% | |||||||||||||||
Not subject to discretionary withdrawal | 11,181,649 | — | — | 11,181,649 | 32.7% | |||||||||||||||
|
|
|
|
|
|
|
|
|
|
|
| |||||||||
Total gross | 12,837,163 | 6,914,918 | 14,390,470 | 34,142,551 | 100.0% | |||||||||||||||
|
|
| ||||||||||||||||||
Reinsurance ceded | 73,007 | — | — | 73,007 | ||||||||||||||||
|
|
|
|
|
|
|
|
|
|
|
| |||||||||
Total, net | $ | 12,764,156 | $ | 6,914,918 | $ | 14,390,470 | $ | 34,069,544 | ||||||||||||
|
|
|
|
|
|
|
|
|
|
|
| |||||||||
The following information is obtained from the applicable exhibit in the Company’s December 31, 2018 and 2017 annual statements and related separate account annual statement, both of which are filed with the Division and is provided to reconcile annuity reserves and deposit funds to amounts reported in the Statutory Statements of Admitted Assets, Liabilities, Capital and Surplus:
| December 31, | ||||||||
| 2018 | 2017 | |||||||
Life and Accident and Health Annual Statement (net of reinsurance): | ||||||||
Annuities included in aggregate reserve for life policies and contracts | $ | 12,936,341 | $ | 12,544,414 | ||||
Supplementary contracts with life contingencies and other contracts included in aggregate reserve for life policies and contracts | 12,611 | 13,608 | ||||||
Liability for deposit-type contracts | 189,896 | 206,134 | ||||||
|
|
|
|
|
| |||
Subtotal - general account | 13,138,848 | 12,764,156 | ||||||
Separate Accounts Annual Statement: | ||||||||
Annuities included in aggregate reserve for life policies and contracts | 17,772,161 | 21,305,388 | ||||||
|
|
|
|
|
| |||
Total | $ | 30,911,009 | $ | 34,069,544 | ||||
|
|
|
|
|
| |||
11. Liability for Unpaid Claims and Claim Adjustment Expenses
Activity in the accident and health liability for unpaid claims and for claim adjustment expenses included in aggregate reserve for life policies and contracts and accident and health policies, excluding unearned premium reserves, is summarized as follows:
| 2018 | 2017 | |||||||
Balance, January 1, net of reinsurance of $25,283 and $28,843 | $ | 243,517 | $ | 240,280 | ||||
Incurred related to: | ||||||||
Current year | 38,844 | 53,969 | ||||||
Prior year | 6,634 | (6,728 | ) | |||||
|
|
|
|
|
| |||
Total incurred | 45,478 | 47,241 | ||||||
|
|
|
|
|
| |||
Paid related to: | ||||||||
Current year | (10,375 | ) | (6,896 | ) | ||||
Prior year | (31,091 | ) | (37,108 | ) | ||||
|
|
|
|
|
| |||
Total paid | (41,466 | ) | (44,004 | ) | ||||
|
|
|
|
|
| |||
Balance, December 31, net of reinsurance of $19,082 and $25,283 | $ | 247,529 | $ | 243,517 | ||||
|
|
|
|
|
| |||
39
Table of Contents
GREAT-WEST LIFE & ANNUITY INSURANCE COMPANY
Notes to Statutory Financial Statements
(In Thousands, Except Share Amounts)
Reserves for incurred claims and claim adjustment expenses attributable to insured events of prior years has increased (decreased) by $6,634 and $(6,728) during the years ended December 31, 2018 and 2017, respectively. The change in both years is the result of ongoing analysis of recent claim development trends.
The Company has a commercial paper program that is partially supported by a $50,000 credit facility agreement. The commercial paper has been given a rating ofA-1+ by Standard & Poor’s Ratings Services and a rating ofP-1 by Moody’s Investors Service, each being the highest rating available. The Company’s issuance of commercial paper is not used to fund daily operations and does not have a significant impact on the Company’s liquidity.
The following table provides information regarding the Company’s commercial paper program:
| December 31, | ||||||||
| 2018 | 2017 | |||||||
Face value | $ | 98,859 | $ | 99,886 | ||||
Carrying value | $ | 98,859 | $ | 99,886 | ||||
Interest expense paid | $ | 1,746 | $ | 974 | ||||
Effective interest rate | 2.5% - 2.7% | 1.4% - 1.7% | ||||||
Maturity range (days) | 16 - 25 | 19 - 67 | ||||||
The Company utilizes separate accounts to record and account for assets and liabilities for particular lines of business and/or transactions. The Company reported assets and liabilities from the following product lines into a separate account:
| • | Individual Annuity Product |
| • | Group Annuity Product |
| • | Variable Life Insurance Product |
| • | Hybrid Ordinary Life Insurance Product |
| • | Individual Indexed-Linked Annuity Product |
In accordance with the domiciliary state procedures for approving items within the separate account, the separate account classification of the following items are supported by Colorado Insurance CodeSection 10-7-402:
| • | Individual Annuity |
| • | Group Annuity |
| • | Variable Life Insurance Product |
The following items are supported by direct approval by the Commissioner:
| • | Hybrid Ordinary Life Insurance Product |
| • | Group Annuity - Custom Stable Value Asset Funds |
| • | Variable Life Insurance Product |
| • | Individual Indexed-Linked Annuity Product |
The Company’s separate accounts invest in shares of Great-West Funds, Inc. and Putnam Funds,open-end management investment companies, which are related parties of the Company, and shares of othernon-affiliated mutual funds. and government and corporate bonds.
Some assets within each of the Company’s separate accounts are considered legally insulated whereas others are not legally insulated from the general account. The legal insulation of the separate accounts prevents such assets from being generally available to satisfy claims resulting from the general account.
40
Table of Contents
GREAT-WEST LIFE & ANNUITY INSURANCE COMPANY
Notes to Statutory Financial Statements
(In Thousands, Except Share Amounts)
At December 31, 2018 and 2017, the Company’s separate account assets that are legally insulated from the general account claims are $24,652,973 and $28,192,883, respectively.
Some separate account liabilities are guaranteed by the general account. In accordance with the guarantees provided, if the investment proceeds are insufficient to cover the rate of return guaranteed for the product, the policyholder proceeds will be remitted by the general account. To compensate the general account for the risk taken, the separate account has paid risk charges of $11,608, $12,581, $12,961, $12,542 and $12,171 for the years ended December 31, 2018, 2017, 2016, 2015 and 2014, respectively. No separate account guarantees were paid by the general account for the years ending December 31, 2018, 2017, 2016, 2015 and 2014, respectively.
Separate accounts with guarantees
The Government Guaranteed Funds are separate accounts investing in fixed income securities backed by the credit of the U.S. Government, its agencies or its instrumentalities.
The Stable Asset Funds invest in investment-grade corporate bonds in addition to the above mentioned securities.
The Company also has separate accounts comprised of assets underlying variable universal life policies issued privately to accredited investors. The accounts invest in investment grade fixed income securities.
The Individual Indexed-Linked Annuity Product provides returns based on the performance of one or more indices and invests in fixed income securities. The returns from these securities are invested in derivative instruments which mimic the returns of select indices. There is also a return of premium death benefit guarantee to policyholders.
The Government Guaranteed Funds and Stable Asset Funds have a guaranteed minimum crediting rate of at least 0%. All of the above separate accounts provide a book value guarantee. Some of them also provide a death benefit of the greater of account balance or premium paid.
Distributions to a participant are based on the participant’s account balance and are permitted for the purpose of paying a benefit to a participant. Distributions for purposes other than paying a benefit to a participant may be restricted. Participants’ distributions are based on the amount of their account balance, whereas, distributions as a result of termination of the group annuity contract are based on net assets attributable to the contract and can be made to the group through (1) transfer of the underlying securities and any remaining cash balance, or (2) transfer of the cash balance after sale of the Fund’s securities.
Most guaranteed separate account assets and related liabilities are carried at fair value. Certain separate account assets are carried at book value based on the prescribed deviation from the Division.
Non-guaranteed separate accounts
Thenon-guaranteed separate accounts include unit investment trusts or series accounts that invest in diversifiedopen-end management investment companies. These separate account assets and related liabilities are carried at fair value.
The investments in shares are valued at the closing net asset value as determined by the appropriate fund/portfolio at the end of each day. The net investment experience of the separate account is credited directly to the policyholder and can be positive or negative. Some of the separate accounts provide an incidental death benefit of the greater of the policyholder’s account balance or premium paid and some provide an incidental annual withdrawal benefit for the life of the policyholder. Certain contracts contain provisions relating to a contingent deferred sales charge. In such contracts, charges will be made for total or partial surrender of a participant annuity account in excess of the “free amount” before the retirement date by a deduction from a participant’s account. The “free amount” is an amount equal to 10% of the participant account value at December 31 of the calendar year prior to the partial or total surrender.
The following tables provide information regarding the Company’s separate accounts:
41
Table of Contents
GREAT-WEST LIFE & ANNUITY INSURANCE COMPANY
Notes to Statutory Financial Statements
(In Thousands, Except Share Amounts)
| Year Ended December 31, 2018 | ||||||||||||
| Non-indexed guaranteed less than/equal to 4% | Non-guaranteed separate account | Total | ||||||||||
Premiums, considerations or deposits | $ | 721,339 | $ | 1,900,171 | $ | 2,621,510 | ||||||
|
|
|
|
|
|
|
|
| ||||
Reserves | ||||||||||||
For accounts with assets at: | ||||||||||||
Fair value | $ | 7,286,636 | $ | 15,682,027 | $ | 22,968,663 | ||||||
Amortized cost | 1,107,812 | — | 1,107,812 | |||||||||
|
|
|
|
|
|
|
|
| ||||
Total reserves | $ | 8,394,448 | $ | 15,682,027 | $ | 24,076,475 | ||||||
|
|
|
|
|
|
|
|
| ||||
By withdrawal characteristics: | ||||||||||||
At fair value | $ | 7,286,636 | $ | 15,682,027 | $ | 22,968,663 | ||||||
At book value without fair value adjustment and with current surrender charge less than 5% | 1,107,812 | — | 1,107,812 | |||||||||
|
|
|
|
|
|
|
|
| ||||
Total subject to discretionary withdrawals | $ | 8,394,448 | $ | 15,682,027 | $ | 24,076,475 | ||||||
|
|
|
|
|
|
|
|
| ||||
| Year Ended December 31, 2017 | ||||||||||||
| Non-indexed guaranteed less than/equal to 4% | Non-guaranteed separate account | Total | ||||||||||
Premiums, considerations or deposits | $ | 560,537 | $ | 1,888,820 | $ | 2,449,357 | ||||||
|
|
|
|
|
|
|
|
| ||||
Reserves | ||||||||||||
For accounts with assets at: | ||||||||||||
Fair value | $ | 7,918,332 | $ | 18,643,242 | $ | 26,561,574 | ||||||
Amortized cost | 958,780 | — | 958,780 | |||||||||
|
|
|
|
|
|
|
|
| ||||
Total reserves | $ | 8,877,112 | $ | 18,643,242 | $ | 27,520,354 | ||||||
|
|
|
|
|
|
|
|
| ||||
By withdrawal characteristics: | ||||||||||||
At fair value | $ | 7,918,332 | $ | 18,643,242 | $ | 26,561,574 | ||||||
At book value without fair value adjustment and with current surrender charge less than 5% | 958,780 | — | 958,780 | |||||||||
|
|
|
|
|
|
|
|
| ||||
Total subject to discretionary withdrawals | $ | 8,877,112 | $ | 18,643,242 | $ | 27,520,354 | ||||||
|
|
|
|
|
|
|
|
| ||||
A reconciliation of the amounts transferred to and from the separate accounts is presented below:
| Year Ended December 31, | ||||||||||||
| 2018 | 2017 | 2016 | ||||||||||
Transfers as reported in the Summary of Operations of the separate account statement: | ||||||||||||
Transfers to separate accounts | $ | 2,621,510 | $ | 2,449,357 | $ | 2,686,225 | ||||||
Transfers from separate accounts | (5,198,817 | ) | (4,417,525 | ) | (3,561,699 | ) | ||||||
|
|
|
|
|
|
|
|
| ||||
Net transfers from separate accounts | (2,577,307 | ) | (1,968,168 | ) | (875,474 | ) | ||||||
Reconciling adjustments: | ||||||||||||
Net transfer of reserves to separate accounts | 1,464,314 | 1,023,384 | 773,253 | |||||||||
Miscellaneous other | 528 | 140 | 739 | |||||||||
|
|
|
|
|
|
|
|
| ||||
Net transfers as reported in the Statements of Operations | $ | (1,112,465 | ) | $ | (944,644 | ) | $ | (101,482 | ) | |||
|
|
|
|
|
|
|
|
| ||||
42
Table of Contents
GREAT-WEST LIFE & ANNUITY INSURANCE COMPANY
Notes to Statutory Financial Statements
(In Thousands, Except Share Amounts)
14. Capital and Surplus, Dividend Restrictions, and Other Matters
On November 15, 2004, the Company issued a surplus note in the face amount of $195,000 to GWL&A Financial. The proceeds were used to redeem a $175,000 surplus note issued May 4, 1999 and for general corporate purposes. The new surplus note bears interest at the rate of 6.675% and is due November 14, 2034. The carrying amount of the surplus note was $194,558 and $194,530 at December 31, 2018 and 2017, respectively. Payments of principal and interest under this surplus note can be made only with prior written approval of the Commissioner of Insurance of the State of Colorado. Such payments are payable only out of surplus funds of the Company and only if at the time of such payment, and after giving effect to the making thereof, the financial condition of the Company is such that its surplus would not fall below two andone-half times the authorized control level as required by the most recent risk-based capital calculations. Subject to the foregoing restrictions on payment of principal and interest, (a) interest is payable on the principal sum of the surplus note semi-annually, in arrears, on May 14 and November 14 of each year, and (b) the surplus note may only be redeemed prior to its stated maturity in connection with (i) a mandatory redemption by the Company in the event of a redemption or acceleration by GWL&A Financial Inc., of its 6.675% junior subordinated deferrable debentures due November 14, 2034, or (ii) an optional redemption by the Company at any time on or after November 15, 2024. Interest paid on the note was $13,016 for all the years ended December 31, 2018, 2017 and 2016, respectively, bringing total interest paid from inception to December 31, 2018 to $182,227. The amount of unapproved principal and interest was $0 at December 31, 2018 and 2017.
On May 19, 2006, the Company issued a surplus note in the face amount and carrying amount of $333,400 to GWL&A Financial Inc. The proceeds were used for general corporate purposes. Initially, the surplus note bore interest at the rate of 7.203% per annum, and was payable on each May 16 and November 16 until May 16, 2016. After May 16, 2016, the surplus note bears an interest rate of 2.588% plus the then current three-month London Interbank Offering Rate. The carrying amount of the surplus note was $0 and $333,400 at December 31, 2018 and 2017. The surplus note became redeemable by the company at the principal amount plus any accrued and unpaid interest after May 16, 2016. On June 15, 2018, this surplus note was redeemed in full. Payments of principal and interest under the surplus note can be made only with prior written approval of the Commissioner of Insurance of the State of Colorado. Such payments are payable out of surplus funds of the Company and only if at the time of such payment, and after giving effect to the making thereof, the financial condition of the Company is such that its surplus would not fall below two andone-half times the authorized control level as required by the most recent risk-based capital calculations. Interest paid on the note was $6,868, $12,721 and $16,137 for the year ended December 31, 2018, 2017 and 2016, respectively, bringing total interest paid from inception to December 31, 2018 to $262,875. The amount of unapproved principal and interest was $0 at December 31, 2018 and 2017.
On December 29, 2017, the Company issued a surplus note in the face amount and carrying amount of $12,000 to GWL&A Financial Inc. The proceeds were used for general corporate purposes. The surplus note bears an interest rate of 3.5% per annum. The note matures of December 29, 2027. Payments of principal and interest under the surplus note can be made only with prior written approval of the Commissioner of Insurance of the State of Colorado. Such payments are payable out of surplus funds of the Company and only if at the time of such payment, and after giving effect to the making thereof, the financial condition of the Company is such that its surplus would not fall below two andone-half times the authorized control level as required by the most recent risk-based capital calculations. Interest paid on the note during 2018, 2017 and 2016 amounted to $420, $2 and $0, respectively, bringing total interest paid from inception to December 31, 2018 to $422. The amount of unapproved principal and interest was $0 at December 31, 2018.
On May 17, 2018, the Company issued a surplus note in the face amount and carrying amount of $346,218 to GWL&A Financial Inc. The proceeds were used to redeem the $333,400 surplus note issued in 2006 and for general corporate purposes. The surplus note bears an interest rate of 4.881% per annum. The note matures on May 17, 2048. Payments of principal and interest under the surplus note can be made only with prior written approval of the Commissioner of Insurance of the State of Colorado. Such payments are payable out of surplus funds of the Company and only if at the time of such payment, and after giving effect to the making thereof, the financial condition of the Company is such that its surplus would not fall below two andone-half times the authorized control level as required by the most recent risk-based capital calculations. Interest paid on the note during 2018 and 2017 amounted to $10,515 and $0, respectively, bringing total interest paid from inception to December 31, 2018 to $10,515 The amount of unapproved principal and interest was $0 at December 31, 2018.
In the first quarter of 2018, the Company realized a $39,921 after tax gain on an interest rate swap that hedged the existing $333,400 surplus note. The Company adjusted the basis of the hedged item, in this case the surplus note, for the amount of the after tax gain. Further, the Company accounted for the redemption of the $333,400 surplus note and the issuance of the $346,218 surplus note in the second quarter as debt modification instead of debt extinguishment. Therefore, the after tax swap
43
Table of Contents
GREAT-WEST LIFE & ANNUITY INSURANCE COMPANY
Notes to Statutory Financial Statements
(In Thousands, Except Share Amounts)
gain will be amortized into income over the 30 year life of the new surplus note. Amortization of the gain during 2018, 2017 and 2016 amounted to $998, $0 and $0, respectively bringing the total amortization from inception to December 31, 2018 amounted to $998, leaving an unamortized balance of $38,923 in surplus as part of the surplus note amounts.
Interest paid to GWL&A Financial attributable to these surplus notes, was $30,819, $25,739 and $29,153 for the years ended December 31, 2018, 2017 and 2016, respectively.
As an insurance company domiciled in the State of Colorado, the Company is required to maintain a minimum of $2,000 of capital and surplus. In addition, the maximum amount of dividends which can be paid to stockholders by insurance companies domiciled in the State of Colorado, without prior approval of the Insurance Commissioner, is subject to restrictions relating to statutory capital and surplus and statutory net gain from operations. The Company may pay an amount less than $132,692 of dividends during the year ended December 31, 2019, without the prior approval of the Colorado Insurance Commissioner. Prior to any payment of dividends, the Company provides notice to the Colorado Insurance Commissioner. Dividends arenon-cumulative.
The Company paid cash dividends on common stock during 2018 as follows: $24,000 on March 30, 2018 (ordinary); $20,000 on May 1, 2018 (extraordinary); $55,895 on May 17, 2018 (extraordinary); $30,000 on September 28, 2018 (extraordinary) and $22,400 on September 29, 2018 (extraordinary). Dividends during 2017 were paid as follows: $77,000 on March 15, 2017 (extraordinary); $60,301 on June 15, 2017 (ordinary); and $8,000 on September 29, 2017 (ordinary). Dividends are paid as determined by the Board of Directors, subject to the limitations described above.
The portion of unassigned funds (surplus) represented or (reduced) by each of the following items is:
| December 31, | ||||||||
| 2018 | 2017 | |||||||
Unrealized gains (losses) | $ | 152,801 | $ | 165,416 | ||||
Non-admitted assets | (330,803 | ) | (359,724 | ) | ||||
Asset valuation reserve | (204,393 | ) | (203,546 | ) | ||||
Provision for reinsurance | (17 | ) | (17 | ) | ||||
Separate account business | (1,076 | ) | (868 | ) | ||||
Risk-based capital (“RBC”) is a regulatory tool for measuring the minimum amount of capital appropriate for a life, accident and health organization to support its overall business operations in consideration of its size and risk profile. The Division requires the Company to maintain minimum capital and surplus equal to the company action level as calculated in the RBC model. The Company exceeds the required amount.
The following table presents the components of the net admitted deferred tax asset (liability):
| December 31, 2018 | December 31, 2017 | Change | ||||||||||||||||||||||||||||||||||
| Ordinary | Capital | Total | Ordinary | Capital | Total | Ordinary | Capital | Total | ||||||||||||||||||||||||||||
Gross deferred tax assets | $ | 368,917 | $ | 2,793 | $ | 371,710 | $ | 388,131 | $ | 16,580 | $ | 404,711 | $ | (19,214 | ) | $ | (13,787 | ) | $ | (33,001 | ) | |||||||||||||||
Valuation allowance adjustment | — | — | — | — | — | — | — | — | — | |||||||||||||||||||||||||||
|
|
|
|
|
|
|
|
|
|
|
|
|
|
|
|
|
|
|
|
|
|
|
|
|
|
| ||||||||||
Adjusted gross deferred tax asset | 368,917 | 2,793 | 371,710 | 388,131 | 16,580 | 404,711 | (19,214 | ) | (13,787 | ) | (33,001 | ) | ||||||||||||||||||||||||
Deferred tax assets non-admitted | (189,578 | ) | (570 | ) | (190,148 | ) | (228,728 | ) | (4,145 | ) | (232,873 | ) | 39,150 | 3,575 | 42,725 | |||||||||||||||||||||
|
|
|
|
|
|
|
|
|
|
|
|
|
|
|
|
|
|
|
|
|
|
|
|
|
|
| ||||||||||
Net admitted deferred tax asset | 179,339 | 2,223 | 181,562 | 159,403 | 12,435 | 171,838 | 19,936 | (10,212 | ) | 9,724 | ||||||||||||||||||||||||||
Gross deferred tax liabilities | (31,065 | ) | — | (31,065 | ) | (22,523 | ) | — | (22,523 | ) | (8,542 | ) | — | (8,542 | ) | |||||||||||||||||||||
|
|
|
|
|
|
|
|
|
|
|
|
|
|
|
|
|
|
|
|
|
|
|
|
|
|
| ||||||||||
Net admitted deferred tax asset | $ | 148,274 | $ | 2,223 | $ | 150,497 | $ | 136,880 | $ | 12,435 | $ | 149,315 | $ | 11,394 | $ | (10,212 | ) | $ | 1,182 | |||||||||||||||||
|
|
|
|
|
|
|
|
|
|
|
|
|
|
|
|
|
|
|
|
|
|
|
|
|
|
| ||||||||||
The Company admits deferred tax assets pursuant to paragraphs 11.a, 11.b.i, 11.b.ii, and 11.c, in SSAP No. 101. The following table presents the amount of deferred tax asset admitted under each component of SSAP No. 101:
44
Table of Contents
GREAT-WEST LIFE & ANNUITY INSURANCE COMPANY
Notes to Statutory Financial Statements
(In Thousands, Except Share Amounts)
| December 31, 2018 | December 31, 2017 | Change | ||||||||||||||||||||||||||||||||||
| Ordinary | Capital | Total | Ordinary | Capital | Total | Ordinary | Capital | Total | ||||||||||||||||||||||||||||
(a) Federal income taxes paid in prior years recoverable through loss carrybacks | $ | — | $ | 2,224 | $ | 2,224 | $ | — | $ | 3,884 | $ | 3,884 | $ | — | $ | (1,660 | ) | $ | (1,660 | ) | ||||||||||||||||
(b) Adjusted gross deferred tax assets expected to be realized (excluding the amount of deferred tax assets from (a) above) after application of the threshold limitation (lesser of (i) and (ii) below) | 148,274 | 148,274 | 136,880 | 8,551 | 145,431 | 11,394 | (8,551 | ) | 2,843 | |||||||||||||||||||||||||||
(i) Adjusted gross deferred tax assets expected to be realized following the balance sheet date | 148,274 | 148,274 | 136,880 | 8,551 | 145,431 | 11,394 | (8,551 | ) | 2,843 | |||||||||||||||||||||||||||
(ii) Adjusted gross deferred tax assets expected allowed per limitation threshold | 175,682 | 145,431 | — | — | 30,251 | |||||||||||||||||||||||||||||||
(c) Adjusted gross deferred tax assets (excluding the amount of deferred tax assets from (a) and (b) above) offset by gross deferred tax liabilities | 31,065 | — | 31,065 | 22,523 | — | 22,523 | 8,542 | — | 8,542 | |||||||||||||||||||||||||||
|
|
|
|
|
|
|
|
|
|
|
|
|
|
|
|
|
|
|
| |||||||||||||||||
Total deferred tax assets admitted as a result of the application of SSAP No. 101 | $ | 179,339 | $ | 2,224 | $ | 181,563 | $ | 159,403 | $ | 12,435 | $ | 171,838 | $ | 19,936 | $ | (10,211 | ) | $ | 9,725 | |||||||||||||||||
|
|
|
|
|
|
|
|
|
|
|
|
|
|
|
|
|
|
|
| |||||||||||||||||
The following table presents the threshold limitations utilized in the admissibility of deferred tax assets under paragraph 11.b of SSAP No. 101:
| 2018 | 2017 | |||||||
Ratio percentage used to determine recovery period and threshold limitation amount | 867.76% | 894.97% | ||||||
Amount of adjusted capital and surplus used to determine recovery period and threshold limitation | $ | 1,171,212 | $ | 969,537 | ||||
The following table presents the impact of tax planning strategies:
| December 31, 2018 December 31, 2017 | Change | |||||||||||||||||||||||
| Ordinary | Capital | Ordinary | Capital | Ordinary | Capital | |||||||||||||||||||
Adjusted gross deferred tax asset | $ | 368,917 | $ | 2,793 | $ | 388,131 | $ | 16,580 | $ | (19,214 | ) | $ | (13,787 | ) | ||||||||||
% of adjusted gross deferred tax asset by character attributable to tax planning strategies | — | % | — | % | — | % | — | % | — | % | — | % | ||||||||||||
Net admitted adjusted gross deferred tax assets | $ | 179,339 | $ | 2,224 | $ | 159,403 | $ | 12,435 | $ | 19,936 | $ | (10,211 | ) | |||||||||||
% of net admitted adjusted gross deferred tax asset by character attributable to tax planning strategies | — | % | — | % | — | % | — | % | — | % | — | % | ||||||||||||
The Company’s tax planning strategies do not include the use of reinsurance.
There are no temporary differences for which deferred tax liabilities are not recognized.
The components of current income taxes incurred include the following:
| Year Ended December 31, | ||||||||||||
| 2018 | 2017 | Change | ||||||||||
Current income tax | $ | (17,604 | ) | $ | 50,584 | $ | (68,188 | ) | ||||
Federal income tax on net capital gains | 1,030 | (6,744 | ) | 7,774 | ||||||||
|
|
|
|
|
|
|
|
| ||||
Total | $ | (16,574 | ) | $ | 43,840 | $ | (60,414 | ) | ||||
|
|
|
|
|
|
|
|
| ||||
45
Table of Contents
GREAT-WEST LIFE & ANNUITY INSURANCE COMPANY
Notes to Statutory Financial Statements
(In Thousands, Except Share Amounts)
| Year Ended December 31, | ||||||||||||
| 2017 | 2016 | Change | ||||||||||
Current income tax | $ | 50,584 | $ | (37,932 | ) | $ | 88,516 | |||||
Federal income tax on net capital gains | (6,744 | ) | 16,117 | (22,861 | ) | |||||||
|
|
|
|
|
|
|
|
| ||||
Total | $ | 43,840 | $ | (21,815 | ) | $ | 65,655 | |||||
|
|
|
|
|
|
|
|
| ||||
46
Table of Contents
GREAT-WEST LIFE & ANNUITY INSURANCE COMPANY
Notes to Statutory Financial Statements
(In Thousands, Except Share Amounts)
The tax effects of temporary differences, which give rise to the deferred income tax assets and liabilities are as follows:
| December 31, | ||||||||||||
Deferred income tax assets: | 2018 | 2017 | Change | |||||||||
Ordinary: | ||||||||||||
Reserves | $ | 80,303 | $ | 65,831 | $ | 14,472 | ||||||
Investments | 4,374 | 1,263 | 3,111 | |||||||||
Deferred acquisition costs | 76,759 | 77,369 | (610 | ) | ||||||||
Provision for dividends | 3,399 | 4,593 | (1,194 | ) | ||||||||
Fixed assets | 3,264 | 2,761 | 503 | |||||||||
Compensation and benefit accrual | 20,890 | 22,065 | (1,175 | ) | ||||||||
Receivables -non-admitted | 13,991 | 12,737 | 1,254 | |||||||||
Tax credit carryforward | 131,409 | 168,567 | (37,158 | ) | ||||||||
Other | 34,527 | 32,945 | 1,582 | |||||||||
|
|
|
|
|
|
|
|
| ||||
Total ordinary gross deferred tax assets | 368,916 | 388,131 | (19,215 | ) | ||||||||
Valuation allowance adjustment | — | — | — | |||||||||
|
|
|
|
|
|
|
|
| ||||
Total adjusted ordinary gross deferred tax assets | 368,916 | 388,131 | (19,215 | ) | ||||||||
Non-admitted ordinary deferred tax assets | (189,578 | ) | (228,728 | ) | 39,150 | |||||||
|
|
|
|
|
|
|
|
| ||||
Admitted ordinary deferred tax assets | 179,338 | 159,403 | 19,935 | |||||||||
|
|
|
|
|
|
|
|
| ||||
Capital: | — | |||||||||||
Investments | 2,793 | 16,580 | (13,787 | ) | ||||||||
|
|
|
|
|
|
|
|
| ||||
Total capital gross deferred tax assets | 2,793 | 16,580 | (13,787 | ) | ||||||||
Valuation allowance adjustment | — | — | — | |||||||||
|
|
|
|
|
|
|
|
| ||||
Total adjusted gross capital deferred tax assets | 2,793 | 16,580 | (13,787 | ) | ||||||||
Non-admitted capital deferred tax assets | (569 | ) | (4,145 | ) | 3,576 | |||||||
|
|
|
|
|
|
|
|
| ||||
Admitted capital deferred tax assets | 2,224 | 12,435 | (10,211 | ) | ||||||||
|
|
|
|
|
|
|
|
| ||||
Total admitted deferred tax assets | $ | 181,562 | $ | 171,838 | $ | 9,724 | ||||||
|
|
|
|
|
|
|
|
| ||||
Deferred income tax liabilities: | ||||||||||||
Ordinary: | ||||||||||||
Investments | $ | — | $ | (4,501 | ) | $ | 4,501 | |||||
Premium receivable | (5,417 | ) | (3,343 | ) | (2,074 | ) | ||||||
Policyholder Reserves | (17,644 | ) | (10,033 | ) | (7,611 | ) | ||||||
Experience Refunds | (5,079 | ) | — | (5,079 | ) | |||||||
Other | (2,925 | ) | (4,646 | ) | 1,721 | |||||||
|
|
|
|
|
|
|
|
| ||||
Total ordinary deferred tax liabilities | (31,065 | ) | (22,523 | ) | (8,542 | ) | ||||||
|
|
|
|
|
|
|
|
| ||||
Net admitted deferred income tax asset | $ | 150,497 | $ | 149,315 | $ | 1,182 | ||||||
|
|
|
|
|
|
|
|
| ||||
47
Table of Contents
GREAT-WEST LIFE & ANNUITY INSURANCE COMPANY
Notes to Statutory Financial Statements
(In Thousands, Except Share Amounts)
The change in deferred income taxes reported in surplus before consideration ofnon-admitted assets is comprised of the following components:
| December 31, |
| |||||||||||
| 2018 | 2017 | Change | |||||||||
Total deferred income tax assets | $ | 371,710 | $ | 404,711 | $ | (33,001 | ) | |||||
Total deferred income tax liabilities | (31,065 | ) | (22,523 | ) | (8,542 | ) | ||||||
|
|
|
|
|
|
|
|
| ||||
Net deferred income tax asset | $ | 340,645 | $ | 382,188 | (41,543 | ) | ||||||
|
|
|
|
|
| |||||||
Tax effect of unrealized capital gains (losses) | (260 | ) | ||||||||||
Other surplus | 1,071 | |||||||||||
Change in net deferred income tax | $ | (40,732 | ) | |||||||||
|
|
| ||||||||||
| December 31, |
| |||||||||||
| 2017 | 2016 | Change | |||||||||
Total deferred income tax assets | $ | 404,711 | $ | 521,431 | $ | (116,720 | ) | |||||
Total deferred income tax liabilities | (22,523 | ) | (20,681 | ) | (1,842 | ) | ||||||
|
|
|
|
|
|
|
|
| ||||
Net deferred income tax asset | $ | 382,188 | $ | 500,750 | (118,562 | ) | ||||||
|
|
|
|
|
| |||||||
Tax effect of unrealized capital gains (losses) | 6,427 | |||||||||||
Other surplus | 1,607 | |||||||||||
|
|
| ||||||||||
Change in net deferred income tax | $ | (110,528 | ) | |||||||||
|
|
| ||||||||||
The provision for federal income taxes and change in deferred income taxes differ from that which would be obtained by applying the statutory federal income tax rate of 21% and 35% to income before income taxes. The significant items causing this difference are as follows:
| December 31, | ||||||||||||
| 2018 | 2017 | 2016 | ||||||||||
Income tax expense at statutory rate | $ | 60,337 | $ | 77,023 | $ | 22,425 | ||||||
Federal tax rate change | — | 132,029 | — | |||||||||
Earnings from subsidiaries | (22,003 | ) | (28,875 | ) | (35,175 | ) | ||||||
Swap gain on debt refinancing | 8,175 | — | — | |||||||||
Dividend received deduction | (6,657 | ) | (7,992 | ) | (7,302 | ) | ||||||
Tax adjustment for interest maintenance reserve | (5,221 | ) | (7,716 | ) | (8,138 | ) | ||||||
Prior year adjustment | (4,124 | ) | (1,881 | ) | (2,032 | ) | ||||||
Tax effect onnon-admitted assets | (3,476 | ) | 2,291 | (1,111 | ) | |||||||
Tax credits | (2,901 | ) | (908 | ) | (21,212 | ) | ||||||
Income tax (benefit) on realized capital gain (loss) | 1,030 | (6,744 | ) | 16,117 | ||||||||
Tax contingency | (607 | ) | 359 | (99 | ) | |||||||
Other | (395 | ) | (3,219 | ) | (1,893 | ) | ||||||
|
|
|
|
|
|
|
|
| ||||
Total | $ | 24,158 | $ | 154,367 | $ | (38,420 | ) | |||||
|
|
|
|
|
|
|
|
| ||||
|
|
| ||||||||||
| 2018 | 2017 | 2016 | ||||||||||
Federal income taxes incurred | $ | (16,574 | ) | $ | 43,839 | $ | (21,815 | ) | ||||
Change in net deferred income taxes | 40,732 | 110,528 | (16,605 | ) | ||||||||
|
|
|
|
|
|
|
|
| ||||
Total income taxes | $ | 24,158 | $ | 154,367 | $ | (38,420 | ) | |||||
|
|
|
|
|
|
|
|
| ||||
On December 22, 2017, H.R. 1, the Tax Cuts and Jobs Act (the “Act”), was enacted. The legislation, which is generally effective for tax years beginning on January 1, 2018, represented significant U.S. tax reform and revised the Internal Revenue Code by, among other items, lowering the federal corporate income tax rate from 35% to 21% and modifying how the U.S.
48
Table of Contents
GREAT-WEST LIFE & ANNUITY INSURANCE COMPANY
Notes to Statutory Financial Statements
(In Thousands, Except Share Amounts)
taxes multinational entities. Further, the Act changed how tax basis policy reserves, capitalized specified policy acquisition expenses, and the company’s share of the dividends received deduction and tax exempt interest are to be calculated.
Shortly after enactment, the Securities and Exchange Commission issued Staff Accounting Bulletin No. 118 (“SAB 118”) which provided US GAAP guidance on the accounting for the Act’s impact at December 31, 2017. A reporting entity could recognize provisional amounts, where the necessary information was not available, prepared or analyzed (including computations) in reasonable detail or where additional guidance was needed from the taxing authority to determine the appropriate application of the Act. A reporting entity’s provisional impact analysis was to be adjusted within the 12 month measurement period provided for under SAB 118. The Statutory Accounting Working Group subsequently provided informal interpretative guidance allowing for statutory accounting conformity with the SAB 118 US GAAP guidance.
The Company’s accounting for the income tax effects of the Act is complete as of the period ended December 31, 2018, and no material measurement period adjustments were recognized during the 2018 reporting period.
As of December 31, 2018, the Company had no operating loss carryforwards.
As of December 31, 2018, the Company has Guaranteed Federal Low Income Housing tax credit carryforwards of $111,328. These credits will begin to expire in 2030.
As of December 31, 2018, the Company has foreign tax credit carryforwards of $20,082. These credits will begin to expire in 2020.
The following are income taxes incurred in prior years that will be available for recoupment in the event of future net losses:
Year Ended December 31, 2018 | $ | 4,146 | ||
Year Ended December 31, 2017 | 13,328 | |||
The Company has no deposits admitted under Section 6603 of the Internal Revenue Code.
The Company’s federal income tax return is consolidated with the following entities (the “U.S. Consolidated Group”):
Great-West Lifeco U.S. LLC
Emjay Corporation
GWFS Equities, Inc.
GWL&A Financial Inc.
Great-West Life & Annuity Insurance Company of South Carolina
Great-West Life & Annuity Insurance Company of New York
Putnam Investments, LLC
Putnam Acquisition Financing, Inc.
Putnam Retail Management, LP
Putnam Retail Management GP, Inc.
Putnam Advisory Company, LLC
Putnam Advisory Holdings, LLC
Putnam Fiduciary Trust Company
Putnam Investor Services, Inc.
PanAgora Holdings, Inc
PanAgora Asset Management, Inc.
Putnam Advisory Holdings II, LLC
FASCore, LLC
Advised Assets Group, LLC
Great-West Trust Company, LLC
Great-West Capital Management, LLC
The Company, GWL&A NY and GWSC (“GWLA Subgroup”) are life insurance companies who form a life subgroup under the consolidated return regulations. These regulations determine whether the taxable income or losses of this subgroup may offset or be offset with the taxable income or losses of othernon-life entities.
49
Table of Contents
GREAT-WEST LIFE & ANNUITY INSURANCE COMPANY
Notes to Statutory Financial Statements
(In Thousands, Except Share Amounts)
The GWLA Subgroup accounts for income taxes on the modified separate return method on each of their separate company, statutory financial statements. Under this method, current and deferred tax expense or benefit is determined on a standalone basis; however the Company also considers taxable income or losses from other members of the GWLA Subgroup when determining its deferred tax assets and liabilities, and in evaluating the realizability of its deferred tax assets.
The method of settling income tax payables and receivables (“Tax Sharing Agreement”) among the U.S. consolidated group is subject to a written agreement approved by the Board of Directors, whereby settlement is made on a separate return basis (i.e., the amount that would be due to or from a jurisdiction had an actual separate return been filed) except for the current utilization of any net operating losses and other tax attributes by members of the U.S. Consolidated Group, which can lead to receiving a payment when none would be received from the jurisdiction had a real separate tax return been required. The GWLA Subgroup has a policy of settling intercompany balances as soon as practical after the filing of the federal consolidated return or receipt of the income tax refund from the Internal Revenue Service (“I.R.S.”).
The Company determines income tax contingencies in accordance with Statement of Statutory Accounting Principles No. 5R,Liabilities, Contingencies and Impairments of Assets(“SSAP No. 5R”) as modified by SSAP 101. As of December 31, 2018 the amount of tax contingencies computed in accordance with SSAP No. 5R is $0, with the exception of interest and penalties. The Company does not expect a significant increase in tax contingencies within the 12 month period following the balance sheet date.
The Company recognizes accrued interest and penalties related to tax contingencies in current income tax expense. During the years ended December 31, 2018 and 2017, the Company recognized approximately $607 and $359 of benefit and expense, respectively, from interest and penalties related to the uncertain tax positions. The Company had $314 and $921 accrued for the payment of interest and penalties at December 31, 2018 and 2017, respectively.
The Company files income tax returns in the U.S. federal jurisdiction and various states. With few exceptions, the Company is no longer subject to U.S. federal income tax examinations by the I.R.S. for years 2014 and prior. Tax years 2015 through 2017 are open to federal examination by the I.R.S. The Company does not expect significant increases or decreases to tax contingencies relating to federal, state or local audits.
The Company does not have any outstanding AMT credits as of the filing of the 2017 tax return.
The Company does not have any foreign operations as of the periods ended December 31, 2017 and December 31, 2018 and therefore is not subject to the Repatriation Transition Tax or the tax on Global IntangibleLow-Taxed Income.
Post-Retirement Medical and Supplemental Executive Retirement Plans
The Company sponsors an unfunded Post-Retirement Medical Plan (the “Medical Plan”) that provides health benefits to retired employees who are not Medicare eligible. The Medical Plan is contributory and contains other cost sharing features which may be adjusted annually for the expected general inflation rate. The Company’s policy is to fund the cost of the Medical Plan benefits in amounts determined at the discretion of management.
The Company also provides Supplemental Executive Retirement Plans to certain key executives. These plans provide key executives with certain benefits upon retirement, disability or death based upon total compensation. The Company has purchased individual life insurance policies with respect to employees covered by these plans. The Company is the owner and beneficiary of the insurance contracts.
A December 31 measurement date is used for the employee benefit plans.
50
Table of Contents
GREAT-WEST LIFE & ANNUITY INSURANCE COMPANY
Notes to Statutory Financial Statements
(In Thousands, Except Share Amounts)
The following tables provide a reconciliation of the changes in the benefit obligations, fair value of plan assets and the underfunded status for the Company’s Post-Retirement Medical and Supplemental Executive Retirement plans:
| Post-Retirement Medical Plan | Supplemental Executive Retirement Plan | Total | ||||||||||||||||||||||
| Year Ended December 31, | Year Ended December 31, | Year Ended December 31, | ||||||||||||||||||||||
| 2018 | 2017 | 2018 | 2017 | 2018 | 2017 | |||||||||||||||||||
Change in projected benefit obligation: | ||||||||||||||||||||||||
Benefit obligation, January 1 | $ | 19,329 | $ | 19,031 | $ | 40,921 | $ | 44,501 | $ | 60,250 | $ | 63,532 | ||||||||||||
Service cost | 1,425 | 1,457 | — | (16 | ) | 1,425 | 1,441 | |||||||||||||||||
Interest cost | 703 | 758 | 1,357 | 1,620 | 2,060 | 2,378 | ||||||||||||||||||
Actuarial (gain) loss | (1,511 | ) | (1,216 | ) | (2,316 | ) | (1,872 | ) | (3,827 | ) | (3,088 | ) | ||||||||||||
Regular benefits paid | (407 | ) | (701 | ) | (2,400 | ) | (3,336 | ) | (2,807 | ) | (4,037 | ) | ||||||||||||
Amendment | — | — | — | 24 | — | 24 | ||||||||||||||||||
|
|
|
|
|
|
|
|
|
|
|
|
|
|
|
|
|
| |||||||
Benefit obligation and under funded status, December 31 | $ | 19,539 | $ | 19,329 | $ | 37,562 | $ | 40,921 | $ | 57,101 | $ | 60,250 | ||||||||||||
|
|
|
|
|
|
|
|
|
|
|
|
|
|
|
|
|
| |||||||
Accumulated benefit obligation | $ | 19,539 | $ | 19,329 | $ | 37,562 | $ | 40,921 | $ | 57,101 | $ | 60,250 | ||||||||||||
| Post-Retirement Medical Plan | Supplemental Executive Retirement Plan | Total | ||||||||||||||||||||||
| Year Ended December 31, | Year Ended December 31, | Year Ended December 31, | ||||||||||||||||||||||
| 2018 | 2017 | 2018 | 2017 | 2018 | 2017 | |||||||||||||||||||
Change in plan assets: | ||||||||||||||||||||||||
Value of plan assets, January 1 | $ | — | $ | — | $ | — | $ | — | $ | — | $ | — | ||||||||||||
Employer contributions | 407 | 701 | 2,400 | 3,337 | 2,807 | 4,038 | ||||||||||||||||||
Regular benefits paid | (407 | ) | (701 | ) | (2,400 | ) | (3,337 | ) | (2,807 | ) | (4,038 | ) | ||||||||||||
|
|
|
|
|
|
|
|
|
|
|
|
|
|
|
|
|
| |||||||
Value of plan assets, December 31 | $ | — | $ | — | $ | — | $ | — | $ | — | $ | — | ||||||||||||
|
|
|
|
|
|
|
|
|
|
|
|
|
|
|
|
|
| |||||||
The following table presents amounts recognized in the Statutory Statements of Admitted Assets, Liabilities, Capital and Surplus for the Company’s Post-Retirement Medical and Supplemental Executive Retirement plans:
| Post-Retirement Medical Plan | Supplemental Executive Retirement Plan | Total | ||||||||||||||||||||||
| December 31, | December 31, | December 31, | ||||||||||||||||||||||
| 2018 | 2017 | 2018 | 2017 | 2018 | 2017 | |||||||||||||||||||
Amounts recognized in the statutory statements of admitted assets, liabilities, capital and surplus: | ||||||||||||||||||||||||
Accrued benefit liability | $ | (20,534 | ) | $ | (18,078 | ) | $ | (40,091 | ) | $ | (40,855 | ) | $ | (60,625 | ) | $ | (58,933 | ) | ||||||
Liability for pension benefits | 995 | (1,251 | ) | 2,529 | (66 | ) | 3,524 | (1,317 | ) | |||||||||||||||
|
|
|
|
|
|
|
|
|
|
|
|
|
|
|
|
|
| |||||||
Total other liabilities | $ | (19,539 | ) | $ | (19,329 | ) | $ | (37,562 | ) | $ | (40,921 | ) | $ | (57,101 | ) | $ | (60,250 | ) | ||||||
|
|
|
|
|
|
|
|
|
|
|
|
|
|
|
|
|
| |||||||
Unassigned surplus (deficit) | $ | 995 | $ | (1,251 | ) | $ | 2,529 | $ | (66 | ) | $ | 3,524 | $ | (1,317 | ) | |||||||||
51
Table of Contents
GREAT-WEST LIFE & ANNUITY INSURANCE COMPANY
Notes to Statutory Financial Statements
(In Thousands, Except Share Amounts)
The following table presents amounts not yet recognized in the statements of financial position for the Company’s Post-Retirement Medical and Supplemental Executive Retirement plans:
| Post-Retirement Medical Plan | Supplemental Executive Retirement Plan | Total | ||||||||||||||||||||||
| December 31, | December 31, | December 31, | ||||||||||||||||||||||
| 2018 | 2017 | 2018 | 2017 | 2018 | 2017 | |||||||||||||||||||
Unrecognized net actuarial gain (loss) | $ | 5,152 | $ | 3,723 | $ | 3,428 | $ | 1,157 | $ | 8,580 | $ | 4,880 | ||||||||||||
Unrecognized prior service cost | (4,157 | ) | (4,974 | ) | (899 | ) | (1,223 | ) | (5,056 | ) | (6,197 | ) | ||||||||||||
The following table presents amounts in unassigned funds recognized as components of net periodic benefit cost for the Company’s Post-Retirement Medical and Supplemental Executive Retirement plans:
| Post-Retirement Medical Plan | Supplemental Executive Retirement Plan | Total | ||||||||||||||||||||||
| Year Ended December 31, | Year Ended December 31, | Year Ended December 31, | ||||||||||||||||||||||
| 2018 | 2017 | 2018 | 2017 | 2018 | 2017 | |||||||||||||||||||
Items not yet recognized as component of net periodic cost on January 1, | $ | (1,251 | ) | $ | (3,021 | ) | $ | (66 | ) | $ | (2,360 | ) | $ | (1,317 | ) | $ | (5,381 | ) | ||||||
Prior service cost recognized in net periodic cost | 817 | 587 | 324 | 501 | 1,141 | 1,088 | ||||||||||||||||||
(Gain) loss recognized in net periodic cost | (82 | ) | (33 | ) | (45 | ) | (54 | ) | (127 | ) | (87 | ) | ||||||||||||
Gain (loss) arising during the year | 1,511 | 1,216 | 2,316 | 1,847 | 3,827 | 3,063 | ||||||||||||||||||
|
|
|
|
|
|
|
|
|
|
|
|
|
|
|
|
|
| |||||||
Items not yet recognized as component of net periodic cost on December 31 | $ | 995 | $ | (1,251 | ) | $ | 2,529 | $ | (66 | ) | $ | 3,524 | $ | (1,317 | ) | |||||||||
|
|
|
|
|
|
|
|
|
|
|
|
|
|
|
|
|
| |||||||
The following table provides information regarding amounts in unassigned funds that are expected to be recognized as components of net periodic benefit costs during the year ended December 31, 2019:
| Post-Retirement Medical Plan | Supplemental Executive Retirement Plan | Total | ||||||||||
Net actuarial gain | $ | 217 | $ | 50 | $ | 267 | ||||||
Prior service cost | (817 | ) | (300 | ) | (1,117 | ) | ||||||
The expected benefit payments for the Company’s Post-Retirement Medical and Supplemental Executive Retirement plans for the years indicated are as follows:
| 2019 | 2020 | 2021 | 2022 | 2023 | 2024 through 2028 | |||||||||||||||||||
Post-retirement medical plan | $ | 961 | $ | 959 | $ | 1,054 | $ | 1,123 | $ | 1,234 | $ | 7,119 | ||||||||||||
Supplemental executive retirement plan | 2,347 | 2,530 | 2,473 | 10,206 | 5,701 | 9,085 | ||||||||||||||||||
52
Table of Contents
GREAT-WEST LIFE & ANNUITY INSURANCE COMPANY
Notes to Statutory Financial Statements
(In Thousands, Except Share Amounts)
The following table presents the components of net periodic cost (benefit):
Post-Retirement Medical Plan | Supplemental Executive Retirement Plan | Total | ||||||||||||||||||||||||||||||||||||||||||||
| Year Ended December 31, | Year Ended December 31, | Year Ended December 31, | ||||||||||||||||||||||||||||||||||||||||||||
| 2018 | 2017 | 2016 | 2018 | 2017 | 2016 | 2018 | 2017 | 2016 | ||||||||||||||||||||||||||||||||||||||
Components of net periodic cost (benefit): | ||||||||||||||||||||||||||||||||||||||||||||||
Service cost | $ | 1,425 | $ | 1,457 | $ | 1,246 | $ | — | $ | (16 | ) | $ | 294 | $ | 1,425 | $ | 1,441 | $ | 1,540 | |||||||||||||||||||||||||||
Interest cost | 703 | 758 | 713 | 1,356 | 1,620 | 1,775 | 2,059 | 2,378 | 2,488 | |||||||||||||||||||||||||||||||||||||
Amortization of unrecognized prior service cost | 817 | 587 | 150 | 324 | 501 | 501 | 1,141 | 1,088 | 651 | |||||||||||||||||||||||||||||||||||||
Amortization of gain from prior periods | (82 | ) | (33 | ) | (137 | ) | (45 | ) | (54 | ) | (61 | ) | (127 | ) | (87 | ) | (198 | ) | ||||||||||||||||||||||||||||
Net periodic cost | $ | 2,863 | $ | 2,769 | $ | 1,972 | $ | 1,635 | $ | 2,051 | $ | 2,509 | $ | 4,498 | $ | 4,820 | $ | 4,481 | ||||||||||||||||||||||||||||
The following tables present the assumptions used in determining benefit obligations of the Post-Retirement Medical and the Supplemental Executive Retirement plans at December 31, 2018 and 2017:
| Post-Retirement Medical Plan | ||||||
| December 31, | ||||||
| 2018 | 2017 | |||||
Discount rate | 4.34% | 3.63% | ||||
Initial health care cost trend | 6.25% | 6.50% | ||||
Ultimate health care cost trend | 5.00% | 5.00% | ||||
Year ultimate trend is reached | 2024 | 2024 | ||||
| Supplemental Executive Retirement Plan | ||||||
| December 31, | ||||||
| 2018 | 2017 | |||||
Discount rate | 4.16% | 3.43% | ||||
Rate of compensation increase | N/A | 4.00% | ||||
During 2018, the Company adopted the Society of Actuaries Morality Improvement Scale(MP-2018).
During 2017, the Company adopted the Society of Actuaries Morality Improvement Scale(MP-2017).
The following tables present the weighted average interest rate assumptions used in determining the net periodic benefit/cost of the Post-Retirement Medical and the Supplemental Executive Retirement plans:
| Post-Retirement Medical Plan | ||||||
| Year Ended December 31, | ||||||
| 2018 | 2017 | |||||
Discount rate | 3.63% | 4.05% | ||||
Initial health care cost trend | 6.50% | 6.75% | ||||
Ultimate health care cost trend | 5.00% | 5.00% | ||||
Year ultimate trend is reached | 2024 | 2024 | ||||
53
Table of Contents
GREAT-WEST LIFE & ANNUITY INSURANCE COMPANY
Notes to Statutory Financial Statements
(In Thousands, Except Share Amounts)
| Supplemental Executive Retirement Plan | ||||||
| Year Ended December 31, | ||||||
| 2018 | 2017 | |||||
Discount rate | 3.43% | 3.80% | ||||
Rate of compensation increase | 4.00% | 4.00% | ||||
The discount rate has been set based on the rates of return on high-quality fixed-income investments currently available and expected to be available during the period the benefits will be paid. In particular, the yields on bonds rated AA or better on the measurement date have been used to set the discount rate.
The following table presents the impact on the Post-Retirement Medical Plan thatone-percentage-point change in assumed health care cost trend rates would have on the following:
| One percentage point increase | One percentage point decrease | |||||||
|
| |||||||
Increase (decrease) on total service and interest cost on components | $ | 357 | $ | (297) | ||||
Increase (decrease) on post-retirement benefit obligations | 2,417 | (2,075) | ||||||
Beginning December 31, 2012, the Company began participation in the pension plan sponsored by GWL&A Financial. During 2017, that plan froze all future benefit accruals for pension-eligible participants as of December 31, 2017. The Company’s share of net expense for the pension plan was $3,057, $0 and $0 during the years ended December 31, 2018, 2017 and 2016.
In August 2017, the Company filed an application for a compliance statement from the IRS under their Voluntary Correction Program with respect to operational matters under the pension plan. The IRS issued a compliance statement approving the Company’s request in November 2018. The corrective measure will result in a payment of approximately $7 million to the plan in 2019.
The Company offers unfunded,non-qualified deferred compensation plans to a select group of executives, management and highly compensated individuals. Participants defer a portion of their compensation and realize potential market gains / losses or interest on the amount deferred. The programs are not qualified under Section 401 of the Internal Revenue Code. Participant balances, which are included in Amounts withheld or retained by company as agent or trustee in the accompanying statutory financial statements, are $35,588 and $33,454 at December 31, 2018 and 2017, respectively.
The Company sponsors a qualified defined contribution benefit plan covering all employees. Under this plan, employees may contribute a percentage of their annual compensation to the plan up to certain maximums, as defined by the plan and by the Internal Revenue Service (“IRS”). Currently, the Company matches a percentage of employee contributions in cash. The Company recognized $11,935, $8,713 and $7,275 in expense related to this plan for the years ended December 31, 2018, 2017 and 2016, respectively.
Equity Awards
Lifeco, of which the Company is an indirect wholly-owned subsidiary, maintains the Great-West Lifeco Inc. Stock Option Plan (the “Lifeco plan”) that provides for the granting of options on its common shares to certain of its officers and employees and those of its subsidiaries, including the Company. Options are granted with exercise prices not less than the average market price of the shares on the five days preceding the date of the grant. The Lifeco plan provides for the granting of options with varying terms and vesting requirements with vesting commencing on the first anniversary of the grant, exercisable within 10 years from the date of grant. Compensation expense is recognized in the Company’s financial statements over the vesting period of these stock options using the accelerated method of recognition.
Termination of employment prior to the vesting of the options results in the forfeiture of the unvested options, unless otherwise determined by the Human Resources Committee. At its discretion, the Human Resources Committee may vest the unvested options of retiring option holders, with the options exercisable within five years from the date of retirement. In such event, the Company
54
Table of Contents
GREAT-WEST LIFE & ANNUITY INSURANCE COMPANY
Notes to Statutory Financial Statements
(In Thousands, Except Share Amounts)
accelerates the recognition period to the date of retirement for any unrecognized share-based compensation cost related thereto and recognizes it in its earnings at that time.
Liability Awards
The Company maintains a Performance Share Unit Plan (“PSU plan”) for officers and employees of the Company. Under the PSU plan, “performance share units” are granted to certain of its officers and employees of the Company. Each performance unit has a value equal to one share of Lifeco common stock and is subject to adjustment for cash dividends paid to Lifeco stockholders, Company earnings results as well as stock dividends and splits, consolidations and the like that affect shares of Lifeco common stock outstanding.
If the performance share units vest, they are payable in cash equal to the average closing price of Lifeco common stock for the 20 trading days prior to the date following the last day of the three-year performance period. The estimated fair value of the performance unit is based on the average closing price of Lifeco common stock for the 20 trading days prior to the grant. The performance share units generally vest in their entirety at the end of the three years performance period based on continued service. The PSU plan contains a provision that permits all unvested performance share units to become vested upon death or retirement. Changes in the fair value of the performance share units that occur during the vesting period is recognized as compensation cost over that period.
Performance share units are settled in cash and are recorded as liabilities until payout is made. Unlike share-settled awards, which have a fixed grant-date fair value, the fair value of unsettled or unvested liabilities awards is remeasured at the end of each reporting period based on the change in fair value of one share of Lifeco common stock. The liability and corresponding expense are adjusted accordingly until the award is settled.
Compensation Expense Related to Share-Based Compensation
The compensation expense related to share-based compensation was as follows:
| Year Ended December 31, | ||||||||||||
|
| |||||||||||
| 2018 | 2017 | 2016 | ||||||||||
|
|
|
| |||||||||
Lifeco Stock Plan | $ | 768 | $ | 1,451 | $ | 2,113 | ||||||
Performance Share Unit Plan | 5,388 | 7,207 | 5,318 | |||||||||
|
|
|
| |||||||||
Total compensation expense | $ | 6,156 | $ | 8,658 | $ | 7,431 | ||||||
|
|
|
| |||||||||
Income tax benefits | $ | 1,243 | $ | 2,831 | $ | 2,445 | ||||||
During the year ended December 31, 2018, 2017 and 2016, the Company had $26, $769 and $555 respectively, income tax benefits realized from stock options exercised.
The following table presents the total unrecognized compensation expense related to share-based compensation at December 31, 2018 and the expected weighted average period over which these expenses will be recognized:
| Expense | Weighted average period (years) | |||||||
|
|
|
| |||||
Lifeco Stock Plan | $ | 819 | 1.6 | |||||
Performance Share Unit Plan | 8,403 | 1.4 | ||||||
Equity Award Activity
During the year ended December 31, 2018, Lifeco granted 473,400 stock options to employees of the Company. These stock options vest over five-year periods ending in 2023. Compensation expense of $448 will be recognized in the Company’s financial statements over the vesting period of these stock options using the accelerated method of recognition.
55
Table of Contents
GREAT-WEST LIFE & ANNUITY INSURANCE COMPANY
Notes to Statutory Financial Statements
(In Thousands, Except Share Amounts)
The following table summarizes the status of, and changes in, the Lifeco plan options granted to Company employees which are outstanding. The options granted relate to underlying stock traded in Canadian dollars on the Toronto Stock Exchange; therefore, the amounts, which are presented in United States dollars, will fluctuate as a result of exchange rate fluctuations.
| Weighted average | ||||||||||||||
|
| |||||||||||||
| Shares under option | Exercise price (Whole dollars) | Remaining contractual term (Years) | Aggregate intrinsic value (1) | |||||||||||
|
|
|
|
|
|
| ||||||||
Outstanding, January 1, 2018 | 3,446,975 | $ | 24.88 | |||||||||||
Granted | 473,400 | 25.15 | ||||||||||||
Exercised | (114,589 | ) | 21.06 | |||||||||||
Cancelled and expired | (156,000 | ) | 24.54 | |||||||||||
|
| |||||||||||||
Outstanding, December 31, 2018 | 3,649,786 | 23.32 | 5.9 | $ | 2,339 | |||||||||
|
| |||||||||||||
Vested and expected to vest, December 31, 2018 | 3,649,786 | 23.32 | 5.9 | 2,144 | ||||||||||
Exercisable, December 31, 2018 | 2,323,353 | 21.95 | 4.7 | 2,144 | ||||||||||
(1) The aggregate intrinsic value is calculated as the difference between the market price of Lifeco common shares on December 31, 2018 and the exercise price of the option (only if the result is positive) multiplied by the number of options.
The following table presents additional information regarding stock options under the Lifeco plan:
| Year Ended December 31, | ||||||||||||
|
| |||||||||||
| 2018 | 2017 | 2016 | ||||||||||
|
|
|
|
|
| |||||||
Weighted average fair value of options granted | $ | 0.95 | $ | 2.75 | $ | 2.74 | ||||||
Intrinsic value of options exercised (1) | 345 | 2,869 | 2,102 | |||||||||
Fair value of options vested | 1,115 | 2,203 | 1,605 | |||||||||
(1)The intrinsic value of options exercised is calculated as the difference between the market price of Lifeco common shares on the date of exercise and the exercise price of the option multiplied by the number of options exercised.
The fair value of the options granted during the years ended December 31, 2018, 2017 and 2016 was estimated on the date of the grant using the Black-Scholes option-pricing model with the following weighted average assumptions:
| Year Ended December 31, | ||||||||||||
|
| |||||||||||
| 2018 | 2017 | 2016 | ||||||||||
|
|
|
|
|
| |||||||
Dividend yield | 4.55 | % | 3.98 | % | 3.99 | % | ||||||
Expected volatility | 9.01 | % | 13.99 | % | 19.03 | % | ||||||
Risk free interest rate | 2.03 | % | 1.25 | % | 0.80 | % | ||||||
Expected duration (years) | 6.0 | 6.0 | 6.0 | |||||||||
Liability Award Activity
The following table summarizes the status of, and changes in, the Performance Share Unit Plan units granted to Company employees which are outstanding:
| Performance Units | ||||
|
|
| ||
Outstanding, January 1, 2018 | 681,510 | |||
Granted | 405,464 | |||
Forfeited | (18,397 | ) | ||
Paid | (157,510 | ) | ||
|
|
| ||
Outstanding, December 31, 2018 | 911,067 | |||
|
|
| ||
Vested and expected to vest, December 31, 2018 | 911,067 | |||
56
Table of Contents
GREAT-WEST LIFE & ANNUITY INSURANCE COMPANY
Notes to Statutory Financial Statements
(In Thousands, Except Share Amounts)
The cash payment in settlement of the Performance Share Unit Plan units was $4,104, $3,398 and $3,988 for the years ended December 31, 2018, 2017 and 2016, respectively.
57
Table of Contents
GREAT-WEST LIFE & ANNUITY INSURANCE COMPANY
Notes to Statutory Financial Statements
(In Thousands, Except Share Amounts)
Individual life insurance premiums paid, net of reinsurance, under individual life insurance participating policies were 1%, 6%, and (2)% of total individual life insurance premiums earned during the years ended December 31, 2018, 2017 and 2016 respectively. The Company accounts for its policyholder dividends based upon the three-factor formula. The Company paid dividends in the amount of $31,276, $38,782 and $45,842 to its policyholders during the years ended December 31, 2018, 2017 and 2016, respectively.
No customer accounted for 10% or more of the Company’s revenues during the year ended December 31, 2018. In addition, neither Individual Markets nor Empower Retirement is dependent upon a single customer or a few customers. The loss of business from any one, or a few, independent brokers or agents would not have a material adverse effect on the Company or any of its business agents.
20. Commitments and Contingencies
Future Contractual Obligations
The following table summarizes the Company’s estimated future contractual obligations:
| Payment due by period | ||||||||||||||||||||||||||||
| 2019 | 2020 | 2021 | 2022 | 2023 | Thereafter | Total | |||||||||||||||||||||
Surplus notes - principal(1) | $ | — | $ | — | $ | — | $ | — | $ | — | $ | 553,219 | $ | 553,219 | ||||||||||||||
Surplus notes - interest(2) | 30,335 | 30,335 | 30,335 | 30,335 | 30,335 | 557,094 | 708,769 | |||||||||||||||||||||
Investment purchase obligations(3) | 136,396 | — | — | — | — | — | 136,396 | |||||||||||||||||||||
Operating leases(4) | 9,929 | 7,844 | 3,717 | 1,235 | 1,037 | 11,743 | 35,505 | |||||||||||||||||||||
Other liabilities(5) | 23,334 | 26,774 | 12,695 | 19,579 | 6,935 | 16,204 | 105,521 | |||||||||||||||||||||
|
|
|
|
|
|
|
|
|
|
|
|
|
|
|
|
|
|
|
|
| ||||||||
Total | $ | 199,994 | $ | 64,953 | $ | 46,747 | $ | 51,149 | $ | 38,307 | $ | 1,138,260 | $ | 1,539,410 | ||||||||||||||
|
|
|
|
|
|
|
|
|
|
|
|
|
|
|
|
|
|
|
|
| ||||||||
(1)Surplus notes principal - Represents contractual maturities of principal due to the Company’s parent, GWL&A Financial, under the terms of three long-term surplus notes. The amounts shown in this table differ from the amounts included in the Company’s Statement of Admitted Assets, Liabilities, Capital and Surplus because the amounts shown above do not consider the discount upon the issuance of one of the surplus notes.
(2)Surplus notes interest - One long-term surplus note bears interest at a fixed rate through maturity. The second surplus note bore interest initially at a fixed rate but changed during 2016 to be based upon the current three-month London Interbank Offering Rate in addition to a spread. The third long-term surplus note bears interest at a fixed rate through maturity. The interest payments shown in this table are calculated based upon the contractual rates in effect on December 31, 2018 and do not consider the impact of future interest rate changes.
(3)Investment purchase obligations -The Company makes commitments to fund partnership interests, mortgage loans, and other investments in the normal course of its business. As the timing of the fulfillment of the commitment to fund partnership interests cannot be predicted, such obligations are presented in the less than one year category. The timing of the funding of mortgage loans is based on the expiration date of the commitment. The amounts of these unfunded commitments at December 31, 2018 and 2017 were $136,396 and $313,242, of which $104,286 and $114,726 were related to cost basis limited partnership interests, respectively. All unfunded commitments at December 31, 2018 were due within one year. At December 31, 2017, $312,152 is due within one year, and $1,090 is due within one to three years.
(4) Operating leases - The Company is obligated to make payments under variousnon-cancelable operating leases, primarily for office space. Contractual provisions exist that could increase the lease obligations presented, including operating expense escalation clauses. Management does not consider the impact of any such clauses to be material to the Company’s operating lease obligations. Rent expense for the years ended December 31, 2018, 2017 and 2016 were $27,768, $28,244 and $27,815 respectively.
58
Table of Contents
GREAT-WEST LIFE & ANNUITY INSURANCE COMPANY
Notes to Statutory Financial Statements
(In Thousands, Except Share Amounts)
From time to time, the Company enters into agreements or contracts, including capital leases, to purchase goods or services in the normal course of its business. However, these agreements and contracts are not material and are excluded from the table above.
(5) Other liabilities - Other liabilities include those other liabilities which represent contractual obligations not included elsewhere in the table above. If the timing of the payment of any other liabilities was sufficiently uncertain, the amounts were included in the less than one year category. Other liabilities presented in the table above include:
| • | Expected benefit payments for the Company’s post-retirement medical plan and supplemental executive retirement plan through 2027 |
| • | Unrecognized tax benefits |
| • | Miscellaneous purchase obligations to acquire goods and services |
The Company has a revolving credit facility agreement in the amount of $50,000 for general corporate purposes. The credit facility expired on March 1, 2018 and was replaced with a revolving credit facility agreement in the amount of $50,000 with an expiration date of March 1, 2023. Interest accrues at a rate dependent on various conditions and terms of borrowings. The agreement requires, among other things, the Company to maintain a minimum adjusted net worth, of $1,022,680, as defined in the credit facility agreement (compiled on the unconsolidated statutory accounting basis prescribed by the NAIC), at any time. The Company was in compliance with all covenants at December 31, 2018 and 2017. At December 31, 2018 and 2017 there were no outstanding amounts related to the current and prior credit facilities.
In addition, the Company has other letters of credit with a total amount of $9,095, renewable annually for an indefinite period of time. At December 31, 2018 and 2017, there were no outstanding amounts related to those letters of credit.
Contingencies
From time to time, the Company may be threatened with, or named as a defendant in, lawsuits, arbitrations, and administrative claims. Any such claims that are decided against the Company could harm the Company’s business. The Company is also subject to periodic regulatory audits and inspections which could result in fines or other disciplinary actions. Unfavorable outcomes in such matters may result in a material impact on the Company’s financial position, results of operations, or cash flows.
The Company is defending lawsuits relating to the costs and features of certain of its retirement or fund products. Management believes the claims are without merit and will defend these actions. Based on the information known, these actions will not have a material adverse effect on the financial position of the Company.
The Company is involved in other various legal proceedings that arise in the ordinary course of its business. In the opinion of management, after consultation with counsel, the likelihood of loss from the resolution of these proceedings is remote and/or the estimated loss is not expected to have a material effect on the Company’s financial position, results of its operations, or cash flows.
The Company and GWL&A NY have an agreement whereby the Company has committed to provide financial support to GWL&A NY related to the maintenance of adequate regulatory surplus and liquidity. The Company is obligated to invest in shares of GWL&A NY in order for GWL&A NY to maintain the capital and surplus at the greater of 1) $6,000, 2) 200% of GWL&A NY RBC minimum capital requirements if GWL&A NY total assets are less than $3,000,000 or 3) 175% of GWL&A NY RBC minimum capital requirements if GWL&A NY total assets are $3,000,000 or more. There is no limitation on the maximum potential future payments under the guarantee. The Company has no liability at December 31, 2018 and 2017 for obligations under the guarantee.
Management has evaluated subsequent events for potential recognition or disclosure in the Company’s statutory financial statements through March 12, 2019, the date on which they were issued.
On January 24, 2019, the Company announced that it had entered into an agreement with Protective Life Insurance Company (“Protective”) to sell, via indemnity reinsurance, substantially all of its non-participating individual life insurance and annuity
59
Table of Contents
GREAT-WEST LIFE & ANNUITY INSURANCE COMPANY
Notes to Statutory Financial Statements
(In Thousands, Except Share Amounts)
business and group life and health business. The transaction is in its initial stage, and is expected to close in the first half of 2019 subject to regulatory and customary closing conditions. On the closing date of the proposed transaction, the Company will transfer to Protective assets equal to the statutory liabilities being reinsured and will receive a ceding commission (subject to post-closing adjustments) from Protective in consideration of the transferred business.
60