As filed with the Securities and Exchange Commission on April 19, 2024
Registration No. 333-271172
UNITED STATES
SECURITIES AND EXCHANGE COMMISSION
Washington, D.C. 20549
Post-Effective Amendment 1
Registration Statement Under The Securities Act Of 1933
Empower Annuity Insurance Company of America
(Exact Name of Registrant as Specified in its Charter)
| | |
(State or other jurisdiction of incorporation or organization) | (Primary Standard Industrial Classification Code) | (I.R.S. Employer Identification Number) |
(8515 East Orchard Road, Greenwood Village, Colorado 80111 (800) 537-2033)
(Address, Including Zip Code, and Telephone Number, Including Area Code, of Registrant’s Principal Executive Offices)
J.D. Kreider Senior Vice President Empower Annuity Insurance Company of America 8515 East Orchard Road Greenwood Village, CO 80111 (800) 537-2033 | Copy to: Stephen E. Roth, Esq Eversheds Sutherland (US) LLP 700 Sixth Street, N.W. Washington, DC 20001-3980 |
(Name, Address, Including Zip Code, and Telephone Number, Including Area Code, of Agent for Service) | |
Approximate date of commencement of proposed sale to the public: Continuously on and after the effective date of this Registration Statement.
If any of the securities being registered on this Form are to be offered on a delayed or continuous basis pursuant to Rule 415 under the Securities Act of 1933, check the following box. x
If this Form is filed to register additional securities for an offering pursuant to Rule 462(b) under the Securities Act, please check the following box and list the Securities Act registration statement number of earlier effective registration statement for the same offering.
If this Form is a post-effective amendment filed pursuant to Rule 462(c) under the Securities Act, check the following box and list the Securities Act registration statement number of the earlier effective registration statement for the same offering.
If this Form is a post-effective amendment filed pursuant to Rule 462(d) under the Securities Act, check the following box and list the Securities Act registration statement number of the earlier effective registration statement for the same offering.
Indicate by check mark whether the registrant is a large accelerated filer, an accelerated filer, a non-accelerated filer, a smaller reporting company, or an emerging growth company. See the definitions of “large accelerated filer,” “accelerated filer,” “smaller reporting company,” and “emerging growth company” in Rule 12b-2 of the Exchange Act.
| |
| Smaller Reporting Company |
| |
|
If an emerging growth company, indicate by check mark if the registrant has elected not to use the extended transition period for complying with any new or revised financial accounting standards provided pursuant to Section 7(a)(2)(B) of the Securities
Act. The Registrant hereby amends this registration statement on such date or dates as may be necessary to delay its effective date until the registrant shall file a further amendment which specifically states that this registration statement shall thereafter become effective in accordance with Section 8(a) of the Securities Act of 1933 or until the registration statement shall become effective on such date as the Commission, acting pursuant to said Section 8(a), may determine.
Registration No. 333-271172
Empower SecureFoundation®
Group Fixed Deferred Annuity ContractEmpower Annuity Insurance Company of America
This prospectus describes the Empower SecureFoundation® Group Fixed Deferred Annuity Contract (the “Contract”) issued by Empower Annuity Insurance Company of America. The Contract will be offered to sponsors (“Plan Sponsor”) of retirement plans established under Section 403(b) of the Internal Revenue Code (“Retirement Plan”). The Contract describes the Guaranteed Lifetime Withdrawal Benefit (“GLWB”). A certificate (“Certificate”) will be issued to participants in each Retirement Plan who purchase shares of the Empower SecureFoundation® Balanced Fund (the “Covered Fund”). A Retirement Plan participant who elects the GLWB is referred to as a “GLWB Participant.” The Contract provides for guaranteed income for the life of a designated person based on the GLWB Participant’s investment in the Covered Fund, provided all conditions specified in the Contract are met, regardless of how long the designated person lives or the actual performance or value of the Covered Fund. As described in further detail throughout this Prospectus, the GLWB payments are made from your own Covered Fund value (i.e., withdrawals are made from your own money) until these GLWB payments reduce the Covered Fund value to $0, at which point we start using our own money to continue making the GLWB payments to you. As a result, it is possible that we may never make GLWB payments to you from our own money.
The Contract and the Certificate have no cash value and no surrender value. The interests of the Retirement Plan and the GLWB Participant in the Contract and the Certificate, as applicable, may not be transferred, sold, assigned, pledged, charged, encumbered, or alienated in any way, however, if the Retirement Plan is consolidated or merged with another plan or if the assets and liabilities of the Retirement Plan are transferred to another plan, the Contract may be assigned to the new Plan Sponsor and/or trustee.
Plan Sponsors may apply to purchase a Contract through Empower Financial Services, Inc. (“Empower Financial Services”), the principal underwriter for the Contract or other broker-dealers that have entered into a selling agreement with Empower Financial Services. Empower Financial Services will use its best efforts to sell the Contracts, but is not required to sell any specific number or dollar amount of Contracts.
This prospectus provides important information that a prospective purchaser of a Contract or a GLWB Participant should know before investing. Please retain this prospectus for future reference.
Important Note: Currently, there is only one available Covered Fund– The SecureFoundation® Balanced Fund. Accordingly, any references to Covered Funds and Variable Accounts are applicable to The SecureFoundation® Balanced Fund only. Transfers can be made only to other investment options under your Account. A Request for a withdrawal or Transfer of your total Covered Fund Value in the SecureFoundation® Balanced Fund will result in termination of your participation in the GLWB and the Certificate, and your Benefit Base will be reduced to zero.
It is generally not beneficial for you to annuitize your Certificate. The Certificate was designed specifically to provide the Guaranteed Lifetime Withdrawal Benefit, and you will have paid a non-refundable fee for such benefit. In addition, the annuity payment amount might be less than the GLWB payout would provide.
Neither the Securities and Exchange Commission (“SEC”) nor any state securities commission has approved or disapproved these securities or determined if this prospectus is truthful or complete. Any representation to the contrary is a criminal offense.
This prospectus is not an offer to sell these securities and it is not soliciting an offer to buy these securities in any state where the offer or sale is not permitted.
The Contract/ the Certificate:
•Is NOT insured or endorsed by a bank or any government agency
•Is NOT available in every state
The purchase of the Contract is subject to certain risks. See “Risk Factors,” below. The Contract is novel and innovative. While we understand that the Internal Revenue Service may be considering tax issues associated with products similar to the Contract, to date the tax consequences of the Contract have not been addressed in published legal authorities. Under the circumstances, the Plan Sponsor and prospective GLWB Participants should therefore consult a tax advisor before purchasing the Contract or the GLWB. You should not purchase the GLWB for the purpose of additional tax deferral.
SUMMARY
Preliminary Note Regarding Terms Used in This Prospectus
Certain terms used in this prospectus have specific and important meanings. Some important terms are explained below, and in most cases the meaning of other important terms is explained the first time they are used in the prospectus. You will also find in the back of this prospectus a listing of all of the terms, with the meaning of each term explained.
•The “Contract” is the Empower SecureFoundation Group Fixed Deferred Contract issued by Empower Annuity Insurance Company of America.
•“We,” “us,” “our,” “Empower,” or the “Company” means Empower Annuity Insurance Company of America.
•“Covered Person” or “Covered Persons” means the person or persons, respectively, named in the Contract whose age is used for certain important purposes under the Contract, including determining the amount of the guaranteed income that may be provided by the Contract. The GLWB Participant must be a Covered Person.
•“Covered Fund” refers to the Empower SecureFoundation® Balanced Fund. The Covered Fund is not issued by Empower. Empower Funds, Inc. is the issuer of the Covered Fund and is an affiliate of Empower.
We believe that in most cases the GLWB Participant will be the only Covered Person. Therefore, for ease of reference, most of the discussion in this prospectus assumes that the GLWB Participant is the only Covered Person. In some places in the prospectus, however, we explain how certain features of the GLWB differ if there are joint Covered Persons.
The following is a summary of the GLWB. You should read the entire prospectus in addition to this summary.
The GLWB is the payment of guaranteed minimum lifetime income that the GLWB Participant will receive, regardless of how long the Covered Person lives or how the Covered Fund performs. The GLWB does not have a cash value. Provided all conditions of the Contract are met, (you are a Retirement Plan participant; you elect to invest in the Covered Fund(s) and are issued a Certificate; and you pay the GLWB fee when due), if the value of the shares in the GLWB Participant’s Covered Fund (“Covered Fund Value”) equals zero as a result of Covered Fund performance, the Guarantee Benefit Fee, certain other fees that are not directly associated with the Contract (e.g., custodian fees or advisory fees), and/or Guaranteed Annual Withdrawal(s) (“GAW”), we will make annual payments to the GLWB Participant for the rest of his/her life. (See “Retirement Plan, Advisory, Custodian and Covered Fund Fees and Charges” later in this prospectus.)
The amount of the GAW that you may take may increase from time to time based on the Covered Fund Value. It may also decrease if the GLWB Participant takes Excess Withdrawals (discussed below).
The guaranteed income that may be provided by the GLWB is based on the age and life of the Covered Person (or if there are joint Covered Persons, on the age of the younger joint Covered Person and the lives of both Covered Persons) as of the date we calculate the first Installment. A joint Covered Person must be the spouse of the GLWB Participant and the spouse must be the GLWB Participant’s sole beneficiary under the Retirement Plan.
How much will the GLWB cost?
While the Contract is in force, a Guarantee Benefit Fee will be calculated and deducted from the Covered Fund Value on a monthly basis. It will be paid by redeeming the number of fund shares of the Covered Fund equal to the Guarantee Benefit Fee. The Guarantee Benefit Fee is calculated as a specified percentage of the Covered Fund Value at the time the Guarantee Benefit Fee is calculated. If we do not receive the Guarantee Benefit Fee (except during the Settlement Phase), including as a result of the failure of the Retirement Plan’s custodian to submit it to us, the GLWB will terminate as of the date that the fee is due. We will not provide notice prior to termination of the Contract or GLWB and we will not refund the Guarantee Benefit Fee paid upon termination of the Contract or GLWB.
The Guarantee Benefit Fee pays for the insurance protections provided by the Contract.
The guaranteed maximum or minimum Guarantee Benefit Fee we can ever charge is shown below. The amount we currently charge is also shown below.
•The maximum Guarantee Benefit Fee, as a percentage of a GLWB Participant’s Covered Fund Value, on an annual basis, is 1.5%.
•The minimum Guarantee Benefit Fee, as a percentage of a GLWB Participant’s Covered Fund Value, on an annual basis, is 0.70%.
•The current Guarantee Benefit Fee, as a percentage of a GLWB Participant’s Covered Fund Value, on an annual basis, is 1.20%.
We may change the current Guarantee Benefit Fee at any time within the minimum and maximum range described above upon thirty (30) days prior written notice to the GLWB Participant and the Plan Sponsor. We determine the Guarantee Benefit Fee based on observations of a number of experience factors, including, but not limited to, interest rates, volatility, investment returns, expenses, mortality, and lapse rates. As an example, if mortality experience improves faster than we have anticipated, and the population in general is expected to live longer than initially projected, we might increase the Guarantee Benefit Fee to reflect our increased probability of paying longevity benefits. However, improvements in mortality experience is provided as an example only, we reserve the right to change the Guarantee Benefit Fee at our discretion and for any reason, whether or not these experience factors change (although we will never increase the fee above the maximum or decrease the fee below the minimum). We do not need any particular event to occur before we may change the Guarantee Benefit Fee. Because the Covered Fund is offered by an affiliated company, we may benefit indirectly from the charges imposed by the Covered Fund.
The Guarantee Benefit Fee is in addition to any charges that are imposed in connection with advisory, custodian and other services, and charges imposed by the Covered Fund. Because the Covered Fund is offered by an affiliated company, we may benefit indirectly from the charges imposed by the Covered Fund.
Premium taxes may be applicable in certain states. Premium tax applicability and rates vary by state and may change. We reserve the right to deduct any such tax from premium when received.
Can the GLWB Participant cancel the GLWB?
The GLWB Participant may cancel the GLWB by causing the Covered Fund Value or the Benefit Base of the Covered Fund to be reduced to zero prior to the Settlement Phase due to one or more Excess Withdrawals or by failing to pay the Guarantee Benefit Fee. However, if the Excess Withdrawal(s) occurs as a result of a same day Transfer between Covered Funds (i.e., shares of the available Covered Fund being eliminated are sold and shares of another Covered Fund offered to replace the eliminated Covered Fund are purchased on the same day), then your Certificate will not be canceled even if the Benefit Base of the Covered Fund is reduced to zero. There is no free-look period if you purchase a Certificate.
What happens if the Contract Owner/Plan Sponsor eliminates the Covered Fund from my Plan?
If your Plan Sponsors eliminates the Covered Fund from your Plan, the GLWB Participant will lose the guaranteed benefit unless there is another Covered Fund offered in the Plan to which the GLWB can transfer the Covered Fund Value. In such case, Empower will restore the GLWB Benefit Base and GAW, if applicable, to the same amounts as held by the GLWB Participant prior to the transfer of the Covered Fund assets. If no other Covered Fund is available, the GLWB Participant will lose the guaranteed benefit (unless already in the Settlement Phase) and must transfer their Covered Fund Value to another investment option available under the Retirement Plan.
Can the Contract Owner/Plan Sponsor cancel the Contract?
As Contract Owner, the Plan Sponsor has the right to cancel the Contract upon 75 days written notice to us without additional charges. If the Plan Sponsor cancels the Contract, then the GLWB Participants in the Retirement Plan will lose their GLWB and all associated benefits. We will not return any portion of the Guarantee Benefit Fee that has been collected. However, for GLWB Participants that have reached the Settlement Phase on or before the date that the Plan Sponsor cancels the Contract, Installments will continue for as long as the GLWB Participant shall live.
What protection does the GLWB provide?
The GLWB provides two basic protections to GLWB Participants who purchase the GLWB as a source or potential source of lifetime retirement income or other long-term purposes. Provided that certain conditions are met (you are a Retirement Plan participant; you elect to invest in the Covered Fund(s) and are issued a Certificate; and you pay the GLWB fee when due), the GLWB protects the GLWB Participant from:
•longevity risk, which is the risk that a GLWB Participant will outlive the assets invested in the Covered Fund; and
•income volatility risk, which is the risk of downward fluctuations in a GLWB Participant’s retirement income due to changes in market performance.
Both of these risks increase as a result of poor market performance early in retirement. Point-in-time risk (which is the risk of retiring on the eve of a down market) significantly contributes to both longevity and income volatility risk.
The GLWB does not provide a guarantee that the Covered Fund or the GLWB Participant’s Account will retain a certain value or that the value of the Covered Fund or the GLWB Participant’s Account will remain steady or grow over time. Instead, it provides for a guarantee, under certain specified conditions, that regardless of the performance of the Covered Fund in the Account and regardless of how long the GLWB Participant lives, the GLWB Participant will be able to receive a guaranteed level of annual income for life. Therefore, it is important to understand that while the preservation of capital may be one of the GLWB Participant’s goals, the achievement of that goal is not guaranteed by the GLWB.
The GLWB has three phases: an “Accumulation Phase,” a “GAW Phase,” and a “Settlement Phase.”
•The Accumulation Phase: During the Accumulation Phase, the GLWB Participant may make additional Contract Contributions to the Covered Fund, which establishes the Benefit Base (this is the sum of all Contract Contributions minus any withdrawals and any adjustments made on the “Ratchet Date” as described later in this prospectus), and take Distributions from the Account just as the GLWB Participant otherwise would be permitted to (although Excess Withdrawals will reduce the amount of the Benefit Base under the Contract). The GLWB Participant is responsible for managing withdrawals during the Accumulation Phase.
•The GAW Phase: After the GLWB Participant (or if there are joint Covered Persons, the younger joint Covered Person) has turned age 55, then the GLWB Participant can enter the GAW Phase and begin to take GAWs (which are annual withdrawals that do not exceed a specified amount) without reducing the Benefit Base. GAWs before age 59 1∕2 may result in certain tax penalties, and may not be permissible in certain circumstances.
•Settlement Phase: If the Covered Fund Value falls to zero as a result of Covered Fund performance, the Guarantee Benefit Fee, certain other fees that are not directly associated with the GLWB or Contract (e.g., custodian fees or advisory fees), and/or GAWs, the Settlement Phase will begin. During the Settlement Phase, we make Installments to the GLWB Participant for life. However, the Settlement Phase may never occur, depending on how long the GLWB Participant lives and how well the Covered Fund performs.
The Installments that a GLWB Participant may receive when in the GAW Phase or Settlement Phase are determined by multiplying the vested Benefit Base by the GAW Percentage (GAW%), which is determined by the age of the Covered Person(s) as of the date we calculate the first Installment. As described in more detail below, the amount of the Installments may increase on an annual basis during the GAW Phase due to positive Covered Fund performance, and will decrease as a result of any Excess Withdrawals.
If the GLWB Participant withdraws any of his Covered Fund Value during the Accumulation Phase to satisfy any contribution limitation imposed under federal law, we will consider that to be an Excess Withdrawal. Any withdrawals to satisfy a GLWB Participant’s required distribution obligations under the Code will be considered an Excess Withdrawal if taken during the Accumulation Phase. As a result, those who will be subject to required minimum distributions should consider the appropriateness of this product. Each GLWB Participant should consult a qualified tax advisor regarding contribution limits and other tax implications. We will deem withdrawals taken during the GAW Phase to meet required minimum distribution requirements, in the proportion of the GLWB Participant’s Covered Fund Value to his overall Account balance (and not taking into account any other retirement balances of the GLWB Participant), to be within the contract limits for the Contract and will not treat such withdrawals as Excess Withdrawals.
How does the Contract Owner/Plan Sponsor apply for the Contract?
The Contract Owner/Plan Sponsor may apply for the Contract by completing an application or other form authorized by us and executing the Contract. The Contract Owner/Plan Sponsor is also required to add the Covered Fund to the eligible investment options for the Retirement Plan. If the application or form is accepted by us at our Administrative Office, we will issue a Contract to the Contract Owner/Plan Sponsor describing the rights and obligations under the Contract. There is a free-look period during which the Contract Owner/Plan Sponsor may return the Contract (see “Return Privilege” later in this Prospectus).
How does a Retirement Plan participant elect the GLWB?
A Retirement Plan participant must elect the GLWB in connection with his purchase of shares of the Covered Fund in his Account under the Retirement Plan. There is no minimum initial investment. Subject to federal tax law and Retirement Plan
limitations on Section 403(b) contributions, a GLWB Participant may invest any amount in the Covered Fund. However, the Benefit Base is limited to $5,000,000. Any amount over $5,000,000 will not increase the GLWB Participant’s Benefit Base.
The GLWB may only be elected by participants in Retirement Plans that offer the Covered Fund. There is no free-look period if you purchase a Certificate.
What is the Designated Investment Option?
The following is the currently available Covered Fund:
Empower SecureFoundation® Balanced Fund |
If the GLWB Participant purchases shares of the Covered Fund, the GLWB Participant is required to purchase the GLWB.
A GLWB Participant may also later decide not to maintain the GLWB. If so, the GLWB Participant will need to redeem all shares in the Covered Fund in order to cancel the GLWB. A GLWB Participant cannot remain invested in the Covered Fund without owning the GLWB.
Is the GLWB right for Retirement Plan participants?
The GLWB may be right for a Retirement Plan participant if he believes that he may outlive his retirement investments or is concerned about market risk. If a Retirement Plan participant believes that his retirement investments will be sufficient to provide for retirement expenses regardless of market performance or lifespan, then the GLWB may not be right for the Retirement Plan participant. In addition, it is generally not in your best interest to annuitize the Certificate rather than using the GLWB, which is provided as a standard feature, as the annuity payout could be less than the GLWB payment and you would forfeit the Guarantee Benefit Fees paid. Once annuity payments begin, the GLWB Participant can no longer take withdrawals from the GLWB.
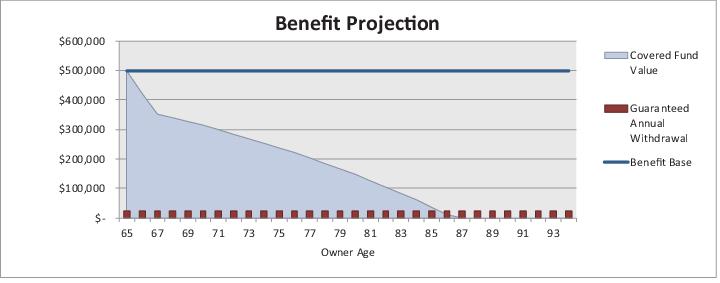
The GLWB does not protect the actual value of a Retirement Plan participant’s investments in the Account or guarantee the Covered Fund Value. For example, if a Retirement Plan participant invests $500,000 in the Covered Fund, and the Covered Fund Value has dropped to $400,000 on the Initial Installment Date, we are not required to add $100,000 to the Covered Fund Value. Instead, the GLWB guarantees that when a GLWB Participant reaches the Initial Installment Date, he may begin GAWs based upon a Benefit Base of $500,000, rather than $400,000 (so long as specified conditions are met).
The GAWs are made from the GLWB Participant’s own investment (i.e., GAWs are made from withdrawals of your own money). We start using our money to make Installments to a GLWB Participant only if the Covered Fund Value is reduced to zero due to Covered Fund performance, the Guarantee Benefit Fee, certain other fees that are not directly associated with the GLWB (e.g., custodian fees or advisory fees), and/or GAWs. We limit our risk under the GLWB in this regard by limiting the amount a GLWB Participant may withdraw each year to GAWs. If a GLWB Participant needs to take Excess Withdrawals, the GLWB Participant may not receive the full benefit of the GLWB, or the GLWB could be cancelled altogether along with the Certificate. For further information, see “The Accumulation Phase– Excess Withdrawal During the Accumulation Phase” and “The GAW Phase– Excess Withdrawals During the Accumulation Phase,” below.
If the return on the Covered Fund Value over time is sufficient to generate gains that can sustain constant GAWs, we may never pay you GAWs from our own money, which means the GLWB would not have provided any financial gain to you. Conversely, if the return on the Covered Fund Value over time is not sufficient to generate gains that can sustain constant GAWs, then the GLWB would be beneficial.
Each Retirement Plan participant should discuss his investment strategy and risk tolerance with his financial advisor before electing to invest in Covered Fund and the GLWB. You should consider the payment of the Guarantee Benefit Fee (which is in addition to any fee paid for the Covered Fund) relative to the benefits and features of the GLWB, your risk tolerance, and proximity to retirement.
RISK FACTORS REGARDING THE CONTRACT
There are a number of risks associated with the Contract and GLWB as described below.
The guarantee that may be provided is contingent on several conditions being met. In certain circumstances a GLWB Participant may not realize a benefit from the GLWB.
•If the Plan Sponsor selects a new record keeper, the GLWB Participant may lose the entire benefit. Currently, the Contracts are only offered to Plan Sponsors of Retirement Plans that select Empower as their record keeper. If the Plan Sponsor elects a new record keeper, it is likely that this will result in the termination of the Contract and the GLWB Participant will lose the entire benefit unless the GLWB Participant has already reached Settlement Phase. The Guarantee Benefit Fee will not be refunded.
•The Plan Sponsor may cancel the Contract or remove the Covered Fund. The GLWB is an investment option offered by the Retirement Plan and is contingent on the Retirement Plan offering the Covered Fund. The Plan Sponsor may elect to cancel the Contract at any time or remove the Covered Fund from the Retirement Plan’s investment options. If the Plan Sponsor takes either of these actions, the GLWB Participant will lose the entire benefit unless the GLWB Participant has already reached Settlement Phase. The Guarantee Benefit Fee will not be refunded.
•The GLWB Participant may die before receiving payments from us or may not live long enough to receive enough income to exceed the amount of the Guarantee Benefit Fees paid. If the GLWB Participant (assuming he is the sole Covered Person) dies before the Covered Fund Value is reduced to zero, the GLWB Participant will never receive any payments under the Contract. Neither the Contract nor the GLWB has any cash value or provides a death benefit. Furthermore, even if the GLWB Participant begins to receive Installments in the Settlement Phase, the GLWB Participant may die before receiving an amount equal to or greater than the amount paid in Guarantee Benefit Fees.
•The Covered Fund may perform well enough so that the GLWB Participant may not need the guarantee that may otherwise be provided by the Contract. The Covered Fund is managed by a registered investment adviser, Empower Capital Management, LLC (“ECM”), a wholly owned subsidiary of Empower. ECM has the flexibility to manage the Empower SecureFoundation® Balanced Fund more conservatively to minimize the likelihood that a GLWB Participant will experience a significant loss of capital. Therefore, there is a good chance that the Covered Fund will perform well enough that GAWs will not reduce Covered Fund Value to zero. As a result, the likelihood that we will make payments to the GLWB Participant is minimal. In this case, the GLWB Participant will have paid us the Guarantee Benefit Fee for the life of the GLWB and received no payments in the Settlement Phase in return.
•The GLWB Participant may need to make Excess Withdrawals, which have the potential to substantially reduce or even terminate the benefits available under the Contract as well as terminate the Certificate. Because personal financial needs can arise unpredictably (e.g., unexpected medical bills), the GLWB Participant may need to make a withdrawal from the Covered Fund before the start of the GAW Phase or following the start of the GAW Phase in an amount larger than the GAW. These types of withdrawals are Excess Withdrawals that will reduce or eliminate the guarantee that may otherwise be provided by the Contract. There is no provision under the Contract to cure any decrease in the benefits due to Excess Withdrawals. To avoid making Excess Withdrawals, the GLWB Participant will need to carefully manage any withdrawals. The Contract does not require us to warn the GLWB Participant of Excess Withdrawals or other actions with adverse consequences.
•The GLWB Participant may choose to cancel the GLWB prior to a severe market downturn. The GLWB Certificate is not a short-term investment. The GLWB is designed as a long-term investment for retirement savings and to provide lifetime withdrawal benefits to protect the GLWB Participant from outliving the assets in the Covered Fund. If the GLWB Participant terminates the GLWB before reaching the GAW Phase or Settlement Phase, we will not make payments to the GLWB Participant, even if subsequent Covered Fund performance would have reduced the Covered Fund Value to zero.
•Excess withdrawals during a time when the Covered Fund is performing poorly. Excess withdrawals during a downturn in market performance could result in termination of your guaranteed payments and termination of the Certificate.
•The GLWB Participant might not begin making GAWs at the most financially beneficial time. Because of decreasing life expectancy as one ages, in certain circumstances, the longer the GLWB Participant waits to start taking GAWs, the less likely it is that the GLWB Participant will benefit from the GLWB. On the other hand, the earlier the GLWB Participant begins taking GAWs, the lower the GAW Percentage the GLWB Participant will receive and therefore the lower the GAWs (if any) will be. Because of the uncertainty of how long the GLWB Participant will live and how the GLWB Participant’s investments will perform over time, it will be difficult to determine the most financially beneficial time to begin making GAWs.
•If the GLWB Participant moves his assets out of the Retirement Plan, the GLWB Participant may never receive a benefit from the GLWB. The GLWB is currently available to participants in certain Section 403(b) Plans. The Contract is entered into by the Plan Sponsor. If the GLWB Participant moves his assets out of the Retirement Plan, such as by a full distribution of all of the assets in the Plan, or moves to an IRA provider that does not offer the GLWB, the GLWB Participant will cause the GLWB to terminate. In that case, the GLWB Participant may never receive a benefit from the GLWB, and the Guarantee Benefit Fee will not be refunded. See “IRA Rollovers,” below for further information on how to maintain the Benefit Base after an IRA rollover.
•We reserve the right to increase the Guarantee Benefit Fee at any time. If we increase the Guarantee Benefit Fee, then depending upon how long the GLWB Participant lives, the GLWB Participant may not receive enough income to exceed the amount of total fees paid.
•The deduction of the Guarantee Benefit Fee each month will negatively affect the growth of the Covered Fund Value. The growth of the Plan account value is likely important to the GLWB Participant because the GLWB Participant may never receive Installments during Settlement Phase. Therefore, depending on how long the GLWB Participant lives and how other investment options available to the GLWB Participant under the Retirement Plan perform, the GLWB Participant may be financially better off without electing the Covered Fund and GLWB.
•The Contract limits the GLWB Participant’s investment choices. Only one fund is available under the Contract. The Covered Fund may be managed in a more conservative fashion than other mutual funds available to the GLWB Participant. If the GLWB Participant does not elect the GLWB, it is possible that the GLWB Participant may invest under the Retirement Plan in other mutual funds (or other types of investments) that experience higher growth or lower losses, depending on the market, than the Covered Fund experiences. It is impossible to know how various investments will fare on a comparative basis.
•The Covered Fund may become ineligible. If the Covered Fund that the GLWB Participant invests in becomes ineligible for the Contract, the GLWB Participant must Transfer the Covered Fund Value to the new Covered Fund in order to keep the Contract in force. There will always be at least one Covered Fund available under the Contract. We reserve the right to designate Covered Funds that were previously eligible for use with the Contract as ineligible for use with the Contract, for any reason including due to changes to their investment objectives. In the event that the Covered Fund becomes ineligible or is liquidated, we will designate a new fund as a Covered Fund. The new Covered Fund may have higher fees and charges and different investment objectives/strategies than the ineligible Covered Fund. In addition, designating a new fund as a Covered Fund may result in an increase in the current Guarantee Benefit Fee, which will not exceed the maximum Guarantee Benefit Fee of 1.5%. The Guarantee Benefit Fee will not be refunded if the Covered Fund becomes ineligible or is liquidated.
•We may terminate the Contract upon 75 days written notice to the Contract Owner. If we terminate the Contract, such termination will not adversely affect the GLWB Participant’s rights under the Contract, except that we will not permit additional Contributions to the Covered Fund. However, we will accept reinvested dividends and capital gains. The GLWB Participant will still be obligated to pay the Guarantee Benefit Fee.
•The Contract will terminate if the Guaranteed Benefit Fee is not paid. If we do not receive the Guarantee Benefit Fee (except during the Settlement Phase), including as a result of the failure of the Retirement Plan custodian to submit it to us, the Contract will terminate as of the date that the fee is due.
•We are also exposed to risks related to natural and man-made disasters and catastrophes, such as storms, fires, earthquakes, epidemics and terrorist acts, which could adversely affect our ability to administer the Certificate. Natural and man-made disasters, such as the recent spread of COVID-19, may require a significant contingent of our employees to work from remote locations. Like many businesses, insurance companies are facing challenges due to COVID-19 and its impact on economic conditions and the financial markets. During these periods, we could experience decreased productivity, and a significant number of our workforce or certain key personnel may be unable to fulfill their duties. In addition, system outages could impair our ability to operate effectively by preventing the workforce from working remotely and impair our ability to process Certificate-related transactions or to calculate Certificate values.
The GLWB Participant’s receipt of payments from us is subject to our claims paying ability.
Any payments we are required to make to the GLWB Participant under the Contract will depend on our long-term ability to make such payments.
We will make all payments under the Contract in the Settlement Phase from our general account, which is not insulated from the claims of our third party creditors. Therefore, the GLWB Participant’s receipt of payments from us is subject to our claims paying ability. The Covered Fund does not make payments under the GLWB.
COVID-19 and the resulting impacts on economic conditions and the financial markets may have a material adverse effect on the Company’s business and financial condition. The extent to which the Company’s business may be impacted depends on future developments, which cannot be predicted at this time.
Currently, our financial strength is rated by three nationally recognized statistical rating organizations (“NRSRO”), ranging from superior to excellent to very strong. Our ratings reflect the NRSROs’ opinions that we have a superior, excellent, or a very strong ability to meet our ongoing obligations. An excellent and very strong rating means that we may have somewhat larger long-term risks than higher rated companies that may impair our ability to pay benefits payable on outstanding insurance policies on time. The financial strength ratings are the NRSROs’ current opinions of our financial strength with respect to our ability to pay under our outstanding insurance policies according to their terms and the timeliness of payments. The NRSRO ratings are not specific to the Contract or Certificate.
Additional information regarding our Company and its financial condition may be found in this prospectus under “Financial Information of the Company” as well as Appendix A, which shows the audited financial statements of the Company.
There may be tax consequences associated with the Contract:
•The Contract is novel and innovative and, to date, the tax consequences of the GLWB have not been addressed in published legal authorities. A prospective GLWB Participant should consult a tax advisor before electing the Covered Fund and GLWB. See “Taxation of the Contract and GLWB,” below for further discussion of tax issues relating to the GLWB.
•You should be aware of various regulatory protections that do and do not apply to the Contract. The Contract is registered in accordance with the Securities Act of 1933. The issuance and sale of the Contract must be conducted in accordance with the requirements of the Securities Act of 1933.
•We have elected to rely on the exemption provided by Rule 12h-7 under the Securities Exchange Act of 1934 (“1934 Act”) from the requirements to file reports pursuant to Section 15(d) of that Act. In reliance on that exemption, Empower Annuity Insurance Company of America will not file the periodic reports that would otherwise be required under the 1934 Act. Annual Audited Financial Statements and other information regarding the Company required by the Securities Act of 1933 will be provided annually in this prospectus.
•We are neither an investment company nor an investment adviser and do not provide investment advice in connection with the Contract. Therefore, we are not governed by the Investment Advisers Act of 1940 (the “Advisers Act”) or the Investment Company Act of 1940 (the “1940 Act”). Accordingly, the protections provided by the Advisers Act and the 1940 Act are not applicable with respect to our sale of the Contract.
The Contract is a group fixed deferred annuity contract. The GLWB is offered only to Retirement Plan participants whose assets are invested in the Covered Fund. The Contract is designed for Retirement Plan participants who intend to use the investments in the Covered Fund in their Account as the basis for periodic withdrawals (such as systematic withdrawal programs involving regular annual withdrawals of a certain percentage of the Covered Fund Value) to provide income payments for retirement or for other purposes. For more information about the Covered Fund, each Retirement Plan participant should talk to his advisor and review the accompanying prospectuses for the Covered Fund.
Provided that specified conditions are met (the Retirement Plan participant elects to invest in the Covered Fund(s); was issued a Certificate (a GLWB Participant); and pays the GLWB Fee when due), the Contract provides for a guaranteed income over the remaining life of the GLWB Participant (or, if these are joint Covered Persons, the remaining lives of both joint Covered Persons), should the Covered Fund Value equal zero as a result of GAWs, the Guarantee Benefit Fee, certain other fees that are not directly associated with the Certificate or Contract (e.g., custodian fees or advisory fees), and/or Covered Fund performance. (See “Retirement Plan, Advisory, Custodian and Covered Fund Fees and Charges” later in this Prospectus”).
INVESTMENT OPTIONS—THE COVERED FUND
The Contract provides protection relating to Covered Fund by ensuring that, regardless of how the Covered Fund actually performs or the actual Covered Fund Value when the GLWB Participant begins GAWs for retirement or other purposes, the GLWB Participant will receive predictable income payments for as long as the GLWB Participant lives so long as specified conditions noted above are met.
In general, if the GLWB Participant purchases shares of the Covered Fund in his Account, the GLWB Participant is required to purchase the GLWB. The actual date of purchase of the GLWB will depend on which Covered Fund shares are purchased. The Election Date for the Empower SecureFoundation® Balanced Fund is date that the GLWB Participant purchases shares.
If the GLWB Participant later decides that he does not want to maintain the GLWB, he will need to redeem all of his shares in the Covered Fund in order to cancel the GLWB. The GLWB Participant cannot remain invested in the Covered Fund without owning the GLWB.
The Covered Fund will be held in an Account maintained pursuant to the Retirement Plan. The Company issues the Contracts, but the Company is not the GLWB Participant’s investment adviser and does not provide investment advice to the GLWB Participant in connection with the GLWB.
As described in more detail in the Covered Fund prospectus, in addition to the Guarantee Benefit Fee, there are certain fees and charges associated with the Covered Fund, which may reduce the Covered Fund Value. These fees may include management fees, distribution fees, acquired fund fees and expenses, redemption fees, exchange fees, advisory fees, and/or administrative fees.
The following information about the Covered Fund is only a summary of important information that the GLWB Participant should know. More detailed information about the Covered Fund's investment strategies and risks are included in the Covered Fund’s prospectus. Please read that separate prospectus carefully before investing in the Covered Fund.
The Covered Fund is managed by an investment adviser affiliated with us, which may have an incentive to manage the fund in a way to reduce volatility of the fund's returns in order to lower the amounts that we have to pay under the Contract. Offering the Contract in connection with your investment in the Covered Fund, therefore, may subject us to a potential conflict of interest. Reducing volatility may have the effect of lowering the return of the Covered Fund relative to other funds. This may suppress the value of the benefits provided by the Contract because your Benefit Base will reset only when your Covered Fund Value is higher than your Benefit Base. We took into account the Covered Fund's use of strategies to lower volatility when we selected them for use with this Contract. In addition, the Covered Funds is a fund of funds, for which you will pay fees at both fund levels, which will reduce your investment return.
EMPOWER SECUREFOUNDATION® BALANCED FUND
The fund is designed for investors seeking a professionally designed asset allocation program to simplify the accumulation of assets prior to retirement together with the potential benefit of the guarantee that may be provided by the Contract. The fund strives to provide shareholders with a high level of diversification primarily through both a professionally designed asset allocation model and professionally selected investments in underlying portfolios (the “Underlying Portfolios”). The intended benefit of asset allocation is diversification, which is expected to reduce volatility over the long-term.
The fund is a “fund of funds” that pursues its investment objective by investing in other mutual funds, including Underlying Portfolios that may or may not be affiliated with the Empower SecureFoundation® Balanced Fund, cash and cash equivalents.
The fund has two classes of shares, Investor Class and Service Class shares. Each class is identical except that Service Class shares have a distribution or “Rule 12b-1” plan. The distribution plan provides for a distribution fee. Because the distribution fee is paid out of Service Class assets on an ongoing basis, over time these fees will increase the cost of the investment and may cost more than paying other types of sales charges.
The fund seeks long-term capital appreciation and income.
ADDING AND REMOVING COVERED FUNDS
We may, without the consent of the GLWB Participant or the Contract Owner, offer new Covered Fund(s) or cease offering the currently available Covered Fund. We will notify the Contract Owner whenever the Covered Fund(s) are changed. If we cease offering the currently available Covered Fund in which the GLWB Participant is invested, then the GLWB Participant must transfer the Covered Fund Value to the new Covered Fund in order to keep the Contract in force. There will always be at least one Covered Fund available. This Transfer must be a same day Transfer between Covered Funds (i.e., shares of a Covered Fund are sold and shares of another Covered Fund are purchased on the same day). If it is not a same day Transfer between Covered Funds, then this is considered an Excess Withdrawal. Excess Withdrawals could cause the Benefit Base of the Covered Fund(s) to be reduced to zero, which would generally cause your Certificate to be canceled. The new Covered Fund may have higher fees and charges and different investment objectives/strategies than the ineligible Covered Fund. In addition, designating a new fund as a Covered Fund, may result in an increase in the current Guarantee Benefit Fee, which will not exceed the maximum Guarantee Benefit Fee of 1.5%.
IRA ROLLOVERS
If the SecureFoundation® Group Fixed Deferred Annuity Certificate (or individual contract in certain states) that we issue in connection with IRAs (the “IRA Certificate”) has been approved in the GLWB Participant’s state of residence and he or she is eligible and permitted by the terms of his or her Retirement Plan documents, the GLWB Participant may rollover the proceeds of his or her tax deferred Retirement Plan, including the GLWB, to his or her IRA. To preserve the GLWB in the rollover, the IRA provider must offer the Covered Fund and the IRA Certificate. If the rollover is from a tax-deferred Retirement Plan and the GLWB Participant has previously elected the GLWB as part of his or her investments in the tax-deferred Retirement Plan, the new Benefit Base may be equal to the Benefit Base as it existed under the GLWB Participant’s prior tax-deferred Retirement Plan immediately prior to the rollover. The new Benefit Base after the IRA rollover will only equal the Benefit Base the GLWB Participant had under the tax-deferred Retirement Plan, if the GLWB Participant: (a) invests the rollover or transfer proceeds covered by the Contract immediately prior to distribution from the tax-deferred Retirement Plan in the Covered Fund(s); (b) invest in a corresponding Covered Fund approved by Empower, as described in the prospectus for the IRA Certificate, except if the GLWB Participant is in the Settlement Phase; and (c) the GLWB Participant requests the restoration of the Benefit Base as it existed under the Retirement Plan. To maintain the same Benefit Base, the GLWB Participant must be in the same Phase that the GLWB Participant was in at the time of the rollover or transfer after the rollover or transfer is complete. If the GLWB Participant does not meet these requirements, a new benefit base will be established that is equal to the Covered Fund Value as of the date of the rollover and the Guarantee Benefit Fee will be calculated as a percentage of the Covered Fund Value.
The GLWB Participant’s new Covered Fund Value after the IRA rollover will initially equal the Covered Fund Value as of the date of the rollover. We will calculate the GLWB Participant’s Guarantee Benefit Fee as a specified percentage of the Covered Fund Value.
As stated previously in this prospectus, the Contract has three phases: an “Accumulation Phase,” “GAW Phase,” and “Settlement Phase.” The Accumulation Phase is described in the following section of this prospectus.
The Accumulation Phase is the period of time between the Election Date, which is the date the GLWB Participant purchases the GLWB, and the first day of the GAW Phase. During this Phase, the GLWB Participant will establish the GLWB Participant’s Benefit Base which will be used later to determine the amount of GAWs.
The GLWB Participant’s Covered Fund Value is the aggregate value of the shares in the Covered Fund held in the GLWB Participant’s Account. If the GLWB Participant’s Covered Fund Value is reduced to zero as a result of Covered Fund performance, the Guarantee Benefit Fee, certain other fees that are not directly associated with the Contract ( e.g., custodian fees or advisory fees), and/or GAWs, we will make annual payments to the GLWB Participant for the rest of his life. See “The Settlement Phase,” below. The GLWB Participant’s Covered Fund Value also determines the amount of the Guarantee Benefit Fee we deduct. See “Guarantee Benefit Fee,” below.
The GLWB Participant’s Covered Fund Value is an actual cash value separate from the Benefit Base (which is only used to calculate Installment Payments during the GAW Phase and the Settlement Phase). The GLWB Participant’s Covered Fund Value and Benefit Base may not be equal to one another.
We do not increase or decrease the GLWB Participant’s Covered Fund Value. Rather, the GLWB Participant’s Covered Fund Value is increased or decreased in the same manner that all mutual fund values increase or decrease. For example, reinvested dividends, settlements, and positive Covered Fund performance (including capital gains) will increase the GLWB Participant’s Covered Fund Value, and fees and expenses associated with the Covered Fund and negative Covered Fund performance (including capital losses) will decrease the GLWB Participant’s Covered Fund Value.
The GLWB Participant’s Covered Fund Value will also increase each time the GLWB Participant purchases additional fund shares, such as by making a Contract Contribution, and will decrease each time the GLWB Participant redeems shares, such as through payment of the Guarantee Benefit Fee or as a result of Distributions, Excess Withdrawals, Installments, and Transfers from the Covered Fund to another investment option offered under the Retirement Plan (other than another Covered Fund). The GLWB Participant’s Covered Fund Value is not affected by any Ratchet or Reset of the Benefit Base (described below).
Benefit Base
The GLWB Participant’s Benefit Base is separate from the Covered Fund Value. It is not a cash value. Rather, the GLWB Participant’s Benefit Base is used to calculate Installment Payments during the GAW Phase and the Settlement Phase. The GLWB Participant’s Benefit Base and Covered Fund Value may not be equal to one another.
On the GLWB Participant’s Election Date, the initial Benefit Base is equal to the GLWB Participant’s Covered Fund Value on that date. The Covered Fund will have its own Benefit Base. The Covered Fund Benefit Base cannot be transferred to another Covered Fund unless the Covered Fund in which you are invested is eliminated or liquidated by us.
•We increase the GLWB Participant’s Benefit Base on a dollar-for-dollar basis each time the GLWB Participant makes a Contribution.
•We decrease the GLWB Participant’s Benefit Base on a proportionate basis each time the GLWB Participant makes an Excess Withdrawal. (See “Example of Effects of an Excess Withdrawal taken during the Accumulation Phase,” later in this Prospectus.)
•On each Ratchet Date (described below), we will increase the GLWB Participant’s Benefit Base to equal the GLWB Participant’s current Covered Fund Value if the GLWB Participant ‘s Covered Fund Value is greater than the GLWB Participant’s Benefit Base. (If so, the GLWB Participant’s Benefit Base will then reflect positive Covered Fund performance.)
A few things to keep in mind regarding the Benefit Base:
•The Benefit Base is used only for purposes of calculating the GLWB Participant’s Installment Payments during the GAW Phase and the Settlement Phase. It has no other purpose. The Benefit Base does not provide and is not available as a cash value or settlement value.
•It is important that the GLWB Participant does not confuse the Benefit Base with the Covered Fund Value.
•During the Accumulation Phase and the GAW Phase, the Benefit Base will be re-calculated each time the GLWB Participant makes a Contract Contribution or Excess Withdrawal, as well as on an annual basis as described below, which is known as the Ratchet Date.
•The maximum Benefit Base is $5,000,000.
Subsequent Contract Contributions to Your Account
During the Accumulation Phase, the GLWB Participant may make additional Contract Contributions to the Covered Fund in addition to the initial Contract Contribution. Subject to the requirements of federal tax law and the terms of the Retirement Plan, subsequent Contract Contributions can be made by cash deposit, Transfers, or rollovers from certain other retirement accounts. Additional Contract Contributions may not be made after the Accumulation Phase ends.
All additional Contract Contributions made after the Election Date will increase the Benefit Base dollar-for-dollar on the date the Contract Contribution is made. We will not consider the additional purchase of shares of the Covered Fund through reinvested dividends, capital gains, and/or settlements to be a Contract Contribution. However, they will increase the Covered Fund Value.
Empower reserves the right to refuse additional Contract Contributions at any time and for any reason. Exercising this right may limit your ability to increase your Benefit Base by making additional Contract Contributions. If Empower refuses additional Contract Contributions, the GLWB Participant will retain all other rights under the GLWB.
Ratchet Date Adjustments to the Benefit Base
During the Accumulation Phase, the Benefit Base will be evaluated and, if necessary, adjusted on an annual basis. This is known as the Ratchet Date and it occurs on the anniversary of the Election Date. It is important to be aware that even though the GLWB Participant's Covered Fund Value may increase throughout the year due to dividends, capital gains, or settlements from the underlying Covered Fund, the Benefit Base will not similarly increase until the next Ratchet Date. Unlike Covered Fund Value, the GLWB Participant's Benefit Base will never decrease solely due to negative Covered Fund performance.
On each Ratchet Date during the Accumulation Phase, the Benefit Base is automatically adjusted (“ratcheted”) to the greater of:
(a)
the current Benefit Base; or
(b)
the current Covered Fund Value.
Example of Ratchet Date Adjustments during the Accumulation Period
Assume the following:
Benefit Base on Election Date (of January 2) = $100,000
Covered Fund Value on Election Date = $100,000
Increase in Covered Fund Value due to Dividends and Capital Gains paid July 1 = $5,000
Covered Fund Value on July 1 = $105,000
Benefit Base on July 1 = $100,000
No other Contract Contributions, Dividends, or Capital Gains are paid for the rest of the year.
Covered Fund Value on January 2 of the following year = $105,000
So, because the Covered Fund Value is greater than the Benefit Base on the Ratchet Date (January 2 of the following year), the Benefit Base is adjusted to $105,000 effective January 2.
Excess Withdrawals During the Accumulation Phase
Because the GLWB is held in the Account, the GLWB Participant may make withdrawals or change the GLWB Participant’s Account investments at any time and in any amount that the GLWB Participant wishes, subject to any federal tax limitations or Retirement Plan limitations. During the Accumulation Phase, however, any withdrawals or Transfers from the GLWB Participant’s Covered Fund Value will be categorized as Excess Withdrawals. Any withdrawals to satisfy the GLWB Participant’s required distribution obligations under the Code will be considered an Excess Withdrawal if taken during the Accumulation Phase.
The GLWB Participant should carefully consider the effect of an Excess Withdrawal on both the Benefit Base and the Covered Fund Value during the Accumulation Phase, as this may negatively affect the GLWB Participant’s future benefits under the Contract, or result in termination of the GAWs and the Contract. In the event the GLWB Participant decides to take an Excess Withdrawal, as discussed below, the GLWB Participant’s Covered Fund Value will be reduced dollar-for-dollar in the amount of the Excess Withdrawal. The Benefit Base will be reduced at the time the Excess Withdrawal is made by the ratio of the Covered Fund Value after the Excess Withdrawal reduction is applied.
Accordingly, the GLWB Participant’s Benefit Base will be reduced by more than the amount of the withdrawal when the Benefit Base is greater than the Covered Fund Value, which is likely to occur after periods of negative market performance. This could also result in termination of the Contract and the GAWs.
Example of Effects of an Excess Withdrawal taken during the Accumulation Period
Covered Fund Value before the Excess Withdrawal adjustment = $50,000
Benefit Base = $100,000
Excess Withdrawal amount: $10,000
So,
Covered Fund Value after adjustment = $50,000 - $10,000 = $40,000
Covered Fund Value adjustment = $40,000/$50,000 = 0.80
Adjusted Benefit Base = $100,000 x 0.80 = $80,000
Types of Excess Withdrawals
All Distributions and Transfers during the Accumulation Phase, including Transfers from the Covered Fund to other investment options, are treated as Excess Withdrawals. An Excess Withdrawal will reduce the GLWB Participant’s Benefit Base and Covered Fund Value. A Distribution occurs when money is paid to the GLWB Participant from the Covered Fund Value. A Transfer occurs when the GLWB Participant transfers money from the Covered Fund to another investment. If the GLWB Participant Transfers any amount out of the Empower SecureFoundation® Balanced Fund after the Guarantee Trigger Date, then the GLWB Participant will be prohibited from making any Transfers into the same Covered Fund for at least ninety (90) calendar days.
Note: The Contract does not require us to warn the GLWB Participant or provide the GLWB Participant with notice regarding potentially adverse consequences that may be associated with any withdrawals or other types of transactions involving the GLWB Participant’s Covered Fund. The GLWB Participant should carefully monitor his Covered Fund, any withdrawals from his Covered Fund, and any changes to the GLWB Participant’s Benefit Base. The GLWB Participant may contact us at (866) 317-6586 for information about the GLWB Participant’s Benefit Base.
Treatment of a Distribution During the Accumulation Phase
At the time of any partial or periodic Distribution, if the Covered Person is 55 years of age or older, the GLWB Participant may elect to begin the GAW Phase (as described below) and begin receiving GAWs at that time. If the GLWB Participant chooses not to begin the GAW Phase, the Distribution will be treated as an Excess Withdrawal and will reduce the GLWB Participant's Covered Fund Value and your Benefit Base (as described above).
If the Covered Person is not yet 55 years old, then any partial or periodic Distribution will be treated as an Excess Withdrawal as described above.
Any Distribution made during the Accumulation Phase to satisfy any contribution limitation imposed under federal law will be considered an Excess Withdrawal at all times. The GLWB Participant should consult a qualified tax advisor regarding contribution limits and other tax implications. Excess Withdrawals could result in federal and/or state taxes.
During the Accumulation Phase, the GLWB Participant may take a loan on his or her Account, if allowed by the Retirement Plan and the Code.
Any amount withdrawn from the Covered Fund Value to fund the loan will be treated as an Excess Withdrawal. Loan repayments to the Covered Fund will increase the Benefit Base dollar-for-dollar and are invested in the Covered Fund dollar-for-dollar. If the loan reduces the Covered Fund Value to zero, Transfer(s) will not be permitted into the same Covered Fund for at least ninety (90) calendar days after the loan, but the GLWB Participant may continue to direct other Contract Contributions into the Covered Fund and establish a new Election Date.
If a Retirement Plan loan is outstanding that affects the Covered Fund Value, the GLWB Participant must repay the Plan loan before the GAW Phase can begin and Installments are paid. Retirement Plan loans cannot be made from Covered Fund Value during GAW Phase or Settlement Phase. No interest is charged on loans.
Death During the Accumulation Phase
If a GLWB Participant dies during the Accumulation Phase, then the GLWB will terminate and the Covered Fund Value will be paid to the Beneficiary in accordance with the terms of the Retirement Plan and the Code (unless an election is permitted and made by a Beneficiary that is the spouse of the GLWB Participant). A Beneficiary that is the spouse of the GLWB Participant may choose either to:
•become a new GLWB Participant and maintain the deceased GLWB Participant’s current Benefit Base (or proportionate share if multiple Beneficiaries) as of the date of death; or
•establish a new Account with a new Benefit Base based on the current Covered Fund Value on the date of the deceased GLWB Participant’s death.
In either situation, the spouse Beneficiary shall become a GLWB Participant and the Ratchet Date will be the date when his or her Account is established.
If permitted by the Retirement Plan and the Code, a Beneficiary who is not the spouse of the GLWB Participant cannot elect to maintain the current Benefit Base, but may elect to establish a new GLWB. The Benefit Base and Election Date will be based on the current Covered Fund Value on the date his or her Account is established.
To the extent to that the Beneficiary becomes a GLWB Participant, he or she will be subject to all terms and conditions of the Contract, the Retirement Plan, and the Code. Any election made by Beneficiary pursuant to this section is irrevocable.
The GAW Phase begins when the GLWB Participant elects to receive GAWs under the Contract. The GAW Phase continues until the Covered Fund Value reaches zero and the Settlement Phase begins.
The GAW Phase cannot begin until all Covered Persons attain age 55 and are eligible to begin distributions under the Retirement Plan and the Code. If the GLWB Participant is still in the employment of the Plan Sponsor, the Code generally does not permit distributions to commence prior to age 59 1∕2. The Retirement Plan and the Code may impose other limitations on distributions.
Distributions prior to age 59 1∕2 may be subject to a penalty tax. Installments will not begin until Empower receives appropriate and satisfactory information about the age of the Covered Person(s) in good order and in manner reasonably satisfactory to Empower.
In order to initiate the GAW Phase, the GLWB Participant must submit a written Request to Empower. At that time, the GLWB Participant must provide sufficient documentation for Empower to determine the age of each Covered Person.
Because the GAW Phase cannot begin until all Covered Persons under the GLWB attain age 55, any Distributions taken before then will be considered Excess Withdrawals and will be deducted from the Covered Fund Value dollar for dollar and Benefit Base on a proportionate basis. See “Accumulation Phase,” above for more information. No Contract Contributions may be made to the Covered Fund(s) on and after the Initial Installment Date, which is the date that GAWs begin.
Because of decreasing life expectancy as the GLWB Participant ages, in certain circumstances, the longer the GLWB Participant waits to start taking GAWs, the less likely it is that the GLWB Participant will benefit from the GLWB. On the other hand, the earlier the GLWB Participant begins taking GAWs, the lower the GAW Percentage the GLWB Participant will receive and therefore the lower the GLWB Participant’s GAWs (if any) will be. The GLWB Participant should talk to his advisor before initiating the GAW Phase to determine the most financially beneficial time for the GLWB Participant to begin taking GAWs.
It is important that you understand how the GAW is calculated because it will affect the benefits the GLWB Participant receives under the Contract. Once the GAW Phase has been initiated and the age of the Covered Person(s) is verified, we will determine the amount of the GAW.
To determine the amount of the GAW, we will compare the vested portion of the current Benefit Base to the current Covered Fund Value on the Initial Installment Date. To determine the vested portion of (“Vested %”) of the Benefit Base, the vested portion of the Covered Fund is divided by the total Covered Fund Value. If the GLWB Participant is less than fully vested, the GAW will be based upon the Vested % of the Covered Fund Value and Benefit Base. If the vested Covered Fund Value is greater than the Vested % of the Benefit Base, we will increase the Benefit Base to equal the vested Covered Fund Value, and the GAW will be based on the increased Benefit Base amount. See “The GAW Phase– Vesting,” below.
During the GAW Phase, the GLWB Participant’s Benefit Base will receive an annual adjustment or “ratchet” just as it did during the Accumulation Phase. The GLWB Participant’s Ratchet Date will become the anniversary of Initial Installment Date and will no longer be the anniversary of the Election Date.
Just like the Accumulation Phase, the Benefit Base will be automatically adjusted on an annual basis, on the Ratchet Date, to the greater of:
(a)
the current Benefit Base; or
(b)
the current Covered Fund Value.
The GLWB Participant’s Benefit Base is used to calculate the GAW he receives. However, even though the Benefit Base is adjusted annually, the GAW% will not change unless the GLWB Participant requests a Reset of the GAW%. See “The GAW Phase—Optional Resets of the GAW% During the GAW Phase,” below.
It is important to note that Installments during the GAW Phase will reduce the GLWB Participant’s Covered Fund Value on a dollar-for-dollar basis, but they will not reduce the GLWB Participant’s Benefit Base.
Calculation of Installment Amount
The GAW% is based on the age of the Covered Person(s) as of the date we calculate the first Installment. If there are two Covered Persons the percentage is based on the age of the younger Covered Person.
The GAW is based on a percentage of the Benefit Base pursuant to the following schedule:
| |
4.0% for life at ages 55-64 | 3.5% for youngest joint life at ages 55-64 |
5.0% for life at ages 65-69 | 4.5% for youngest joint life at ages 65-69 |
6.0% for life at ages 70-79 | 5.5% for youngest joint life at ages 70-79 |
7.0% for life at ages 80+ | 6.5% for youngest joint life at ages 80+ |
The GAW will then be calculated by multiplying the Benefit Base by the GAW%. The amount of the Installment equals the GAW divided by the number of payments per year under the elected Installment Frequency Option, as described below.
Numerical Example of GAW Calculation
Sole Covered Person - 100% Vested
Age of Covered Person at Initial Installment Date: 60
Covered Fund Value = $120,000
Current Benefit Base = $115,000
Adjusted Benefit Base at Initial Installment Date = $120,000*
GAW% based on Age = 4.0%
GAW% x Vested % x = 4.0% x $120,000 = $4,800
Installment Frequency = Monthly (12 payments per year)
So GAW/Installment Frequency = $4,800/12 = $400
The monthly Installment will be $400
Numerical Example of GAW Calculation, Joint Covered Persons
Joint Covered Persons - 100% Vested
Age of primary Covered Person at Initial Installment Date: 65
Age of joint Covered Person at Initial Installment Date: 58
Youngest Age for Determination of GAW: 58
Covered Fund Value = $120,000
Current Benefit Base = $115,000
Adjusted Benefit Base at Initial Installment Date = $120,000*
GAW% based on Age = 3.5%
GAW% x Vested % x (Adjusted Benefit Base) = 3.5% x $120,000 = $4,200
Installment Frequency = Monthly (12 payments per year)
So GAW/Installment Frequency = $4,200/12 = $350
The monthly Installment will be $350
* On the Initial Installment Date, we compare the current Benefit Base to the current Covered Fund Value. If the Covered Fund Value is greater than the Benefit Base, we will increase the Benefit Base to equal the Covered Fund Value, and the GAW will be based on the increased Benefit Base amount. See “Installments,” above.
Any election which affects the calculation of the GAW is irrevocable. Please consider all relevant factors when making an election to begin the GAW Phase. For example, an election to begin receiving Installments based on a sole Covered Person cannot subsequently be changed to joint Covered Persons once the GAW Phase has begun. Similarly, an election to receive Installments based on joint Covered Persons cannot subsequently be changed to a sole Covered Person, nor may the beneficiary designation of a joint election be changed.
Installment Frequency Options
The GLWB Participant's Installment Frequency Options are as follows:
(a)
Annual– the GAW will be paid on the Initial Installment Date and each anniversary annually, or next business day, thereafter.
(b)
Semi-Annual– half of the GAW will be paid on the Initial Installment Date and in Installments every 6 month anniversary, or next business day, thereafter.
(c)
Quarterly– one quarter of the GAW will be paid on the Initial Installment Date and in Installments every 3 month anniversary, or next business day, thereafter.
(d)
Monthly– one-twelfth of the GAW will be paid on the Initial Installment Date and in Installments every monthly anniversary, or next business day, thereafter.
The GLWB Participant may Request to change the Installment Frequency Option starting on each Ratchet Date during the GAW Phase.
The GAW for a GLWB Participant who is employed, but not fully vested under the Retirement Plan, is based on the GLWB Participant’s Vested % of the Benefit Base, as determined by dividing the vested portion of the Covered Fund by the total Covered Fund Value. As the GLWB Participant continues to vest, the GAW is proportionately adjusted to reflect additional vested amounts of Covered Fund Value on each Ratchet Date.
Should the GLWB Participant who has elected to begin the GAW Phase not become fully vested because of severance from service or any other reason, any unvested Covered Fund Value shall be returned to the Plan’s forfeiture account and the Benefit Base will adjust proportionately.
Numerical Example of Calculation of GAW where GLWB Participant is not fully vested:
•GLWB Participant information:
•GAWs start at age 62: GAW% at 5%
•Guaranteed Annual Withdrawal = Benefit Base x Vested % x GAW %
•Age 62 (when GAWs start): $100,000 x 50% x 5% = $2,500
•Age 63 (on next Ratchet Date): $100,000 x 60% x 5% = $3,000
•Age 64 (on next Ratchet Date): $100,000 x 70% x 5% = $3,500
A GLWB Participant who has severed service, but is not fully vested in the Plan may elect GAWs, if eligible pursuant to the terms of the Contract and the Plan. The Benefit Base shall be reduced proportionately based on the vested Covered Fund Value with unvested Covered Fund Value returned to the Plan’s forfeiture account.
Numerical Example of Calculation of GAW where non-fully vested GLWB Participant is not eligible for adjustment:
•GLWB Participant information:
•$60,000 Covered Fund Value
•GAWs start at age 62: 5%
•Unvested Covered Fund Value is returned to Plan’s forfeiture account
•Unvested Covered Fund Value: 0.50% x $60,000 = $30,000
•Note: Covered Fund Value is reduced by 50%
•Benefit Base is adjusted proportionately to Covered Fund Value reduction:
•Benefit Base Adjustment: 0.50% x $100,000 = $50,000
•Note: New Benefit Base is $50,000
•GAWs start based on new Benefit Base:
•GAW = 5% x $50,000 = $2,500
Lump Sum Distribution Option
At any time during the GAW Phase, if the GLWB Participant is receiving Installments more frequently than annually, the GLWB Participant may elect to take a lump sum Distribution up to the remaining scheduled amount of the GAW for that year.
Numerical Example of Lump Sum Distribution
GAW = $4,800 with a monthly distribution of $400
Three monthly Installments have been made (3 x $400 = $1,200)
Remaining GAW = GAW– paid Installments to date = $4,800 - $1,200 = $3,600
So, a Lump Sum Distribution of $3,600 may be taken.
Suspending and Re-Commencing Installments After a Lump Sum Distribution
It is the GLWB Participant's responsibility to Request the suspension of the remaining Installments that are scheduled to be paid during the year until the next Ratchet Date and to re-establish Installments upon the next Ratchet Date, if applicable. If the GLWB Participant chooses not to suspend the remaining Installments for the year, an Excess Withdrawal may occur. See “Effect of Excess Withdrawals During the GAW Phase,” described below.
After receiving a Lump Sum Distribution and suspending Installments, the GLWB Participant must notify Empower that the GLWB Participant wishes to recommence Installment payments for the next year. Empower must receive notice 30 calendar days before the next Ratchet Date that the GLWB Participant wishes to recommence payments; otherwise, Empower will not make any Installments. The Ratchet Date will not change if Installments are suspended.
Optional Resets of the GAW% During the GAW Phase
The GLWB Participant may Request, on an annual basis, a Reset of the GAW% during the GAW Phase at least thirty (30) calendar days prior to the Ratchet Date.
If requested, Empower will multiply the Covered Fund Value as of the Ratchet Date by the GAW% (based on the GLWB Participant's, or the younger joint Covered Person’s, Attained Age on the Ratchet Date) and determine if it is higher than the current Benefit Base multiplied by the current applicable GAW%. If so, the current GAW% will change to the Attained Age GAW% and the Benefit Base will change to the current Covered Fund Value as of the Ratchet Date. If it does not, the Reset shall be void but a Ratchet may still occur. If the Reset takes effect, it will be effective on the Ratchet Date as the Ratchet Date does not change due to Reset.
| (Attained Age GAW%) x (Covered Fund Value as of Ratchet Date) is greater than (Current GAW%) x (Current Benefit Base) |
| (Attained Age GAW%) x (Covered Fund Value as of Ratchet Date) becomes new GAW and (Covered Fund Value) = (New Benefit Base) |
Numerical Example When Reset is Beneficial
Age at Initial Installment Date: 60
Attained Age: 70
Covered Fund Value = $120,000
Current Benefit Base = $125,000
Current GAW% before Ratchet Date: 4%
Attained Age GAW% after Ratchet Date: 6%
(Current GAW%) x (Current Benefit Base) = 4% x $125,000 = $5,000
(Attained Age GAW%) x (Covered Fund Value) = 6% x $120,000 = $7,200
So, New GAW Amount is $7,200
New Benefit Base is $120,000
New GAW% is 6%
Numerical Example When Reset is NOT Beneficial
Age at Initial Installment Date: 60
Attained Age: 70
Covered Fund Value = $75,000
Current Benefit Base = $125,000
Current GAW% before Ratchet: 4%
Attained Age GAW% after Ratchet Date: 6%
(Current GAW %) x (Current Benefit Base) = 4% x $125,000 = $5,000
(Attained age withdrawal %) x (Covered Fund Value) = 6% x $75,000 = $4,500
So, because $4,500 is less than current GAW of $5,000, no Reset occurs.
Effect of Excess Withdrawals During the GAW Phase
After the Initial Installment Date, a Distribution or Transfer that is greater than the GAW will be considered an Excess Withdrawal. The Benefit Base will be adjusted by the ratio of the new Covered Fund Value (after the Excess Withdrawal) to the previous Covered Fund Value (after the GAW).
If an Excess Withdrawal occurs, the GAW and current Benefit Base will be adjusted on the next Ratchet Date. When the Benefit Base is greater than the Covered Fund Value, an Excess Withdrawal may reduce your future benefits by more than the dollar amount of the Excess Withdrawal.
Numerical Example Effect of Excess Withdrawals During the GAW Phase
Covered Fund Value before GAW = $55,000Benefit Base = $100,000GAW%: 5%GAW Amount = $100,000 x 5% = $5,000 Total annual withdrawal: $10,000 So, Excess Withdrawal = $10,000– $5,000 = $5,000Covered Fund Value after GAW = $55,000– $5,000 = $50,000Covered Fund Value after Excess Withdrawal = $50,000– $5,000 = $45,000Covered Fund Value Adjustment due to Excess Withdrawal = $45,000/$50,000 = 0.90Adjusted Benefit Base = $100,000 x 0.90 = $90,000Adjusted GAW Amount (assuming no Benefit Base increase on succeeding Ratchet Date) = $90,000 x 5% = $4,500 Withdrawals taken during the GAW Phase to meet required minimum distribution requirements, in the proportion of the GLWB Participant’s Covered Fund Value to the GLWB Participant’s overall Account balance (and not taking into account any other retirement balances of the GLWB Participant), will be deemed to be within the contract limits for the GLWB Participant and will not be treated as Excess Withdrawals. The required minimum distribution shall not exceed the required minimum distribution amount calculated under the Code and regulations issued thereunder as in effect on the Election Date. In the event of a dispute about the required minimum distribution amount, our determination will govern.
Note: The Contract does not require us to warn the GLWB Participant or provide the GLWB Participant with notice regarding potentially adverse consequences that may be associated with any withdrawals or other types of transactions involving the GLWB
Participant’s Covered Fund. The GLWB Participant should carefully monitor the GLWB Participant’s Covered Fund, any withdrawals from the GLWB Participant’s Covered Fund, and any changes to the GLWB Participant’s Benefit Base. The GLWB Participant’s may contact us at 1-866-317-6586 for information about the GLWB Participant’s Benefit Base.
Death During the GAW Phase
If the GLWB Participant Dies After the Initial Installment Date as a Sole Covered Person.
If the GLWB Participant dies after the Initial Installment date without a joint Covered Person, the GLWB will terminate and no further Installments will be paid. The remaining Covered Fund Value shall be distributed in accordance with the Code and the terms of the Retirement Plan and the Account in which the Covered Fund is held. If permitted by the Retirement Plan and the Code, the GLWB Participant’s Beneficiary may elect to become the GLWB Participant in which event an initial Benefit Base shall be established and he or she will be subject to all terms and conditions of the Contract and the Code. This will be a new Election Date. Any election made by the Beneficiary is irrevocable.
If the GLWB Participant Dies After the Initial Installment Date while Joint Covered Person is Living.
Upon the GLWB Participant’s death after the Initial Installment Date, and while the joint Covered Person is still living, the joint Covered Person/Beneficiary will continue to receive GAW Installments based on the GLWB Participant’s original election until his or her death, if permitted by the Retirement Plan and the Code. Installments may continue to be paid to the surviving Covered Person based on the GAW% for joint Covered Persons as described above.
After the joint Covered Person’s death, the GLWB will terminate, no further Installments will be paid, and any remaining Covered Fund Value will be distributed in accordance with the Code and the terms of the Retirement Plan and the Contract. Alternatively, he or she may elect to receive his or her portion of the Covered Fund Value on the date of death as a lump sum Distribution or can separately elect to become an Owner and will be subject to all terms and conditions of the Certificate, the Contract, the Retirement Plan, and the Code. If the surviving Covered Person elects to separately become an Owner, the date of the election will be the new Ratchet Date.
Any election made by the Beneficiary is irrevocable.
The Settlement Phase begins when the Covered Fund Value has reduced to zero as a result of negative Covered Fund performance, the Guarantee Benefit Fee, certain other fees that are not directly associated with the Contract (e.g., custodian fees or advisory fees), and/or GAWs, but the Benefit Base is still positive. It is also important to understand that the Settlement Phase is the first time that we use our own money to make Installments to the GLWB Participant. During the GAW Phase, the GAWs are made first from the GLWB Participant’s own investment.
Installments continue for the GLWB Participant’s life under the terms of the Contract, but all other rights and benefits (including any death benefit to a Beneficiary) under the Contract will terminate. Installments will continue in the same frequency as previously elected, and cannot be changed during the Settlement Phase. Distributions and Transfers are not permitted during the Settlement Phase.
During the Settlement Phase, the Guarantee Benefit Fee will not be deducted from the Installments.
When the last Covered Person dies during the Settlement Phase, the GLWB will terminate and no Installments or death benefit will be paid to the Beneficiary.
EXAMPLES OF HOW THE GLWB WORKS
A note about the examples:
•All Contract Contributions are assumed to be at the end of the year and occur immediately before the next Ratchet Date.
•All withdrawals are assumed to be at the beginning of the year and occur on the Ratchet Date.
•All GLWB Participants are assumed to be fully vested.
•All positive investment performance of the Covered Fund is assumed to be net of investment management fees.
•In all of the examples, the GLWB Participant has access to his Covered Fund Value until it is depleted:
•If the GLWB Participant dies before the Covered Fund Value is depleted, the remaining Covered Fund Value would be available to beneficiaries.
•If the GLWB Participant needs to take a withdrawal in excess of the GLWB Participant’s GAW, the GLWB Participant may take up to the Covered Fund Value, which will be considered an Excess Withdrawal.
Example 1– Basic: Assume the GLWB Participant buys the GLWB at age 65 and starts taking GAWs in annual Installments immediately. Also, assume that the Covered Fund Value (net of investment management fees) decreases by 10% in the first two years and increases by 5% every year thereafter.
•Initial Covered Fund Value: $500,000
•GAW Amount: $500,000 x 5% = $25,000
•Guarantee Benefit Fee: 1.20%
•Changes in Covered Fund Value (net of investment management fees):
•Year 1: -10%, Year 2: -10%, Years 3+: 5%
•The GLWB Participant annually withdraws $25,000 from the GLWB Participant’s Covered Fund until about age 87 when the Covered Fund is depleted:
•At age 87 the GLWB Participant’s Covered Fund Value is $11,514.
•The GLWB Participant withdraws the $11,514, which depletes the Covered Fund and the GLWB Participant is now in Settlement Phase.
•We provide the remaining $13,486 necessary to make the Installment of $25,000.
•We continue to pay Installments of $25,000 each year for the GLWB Participant’s life.
Example 2– Ratchet: Assume the GLWB Participant buys the GLWB at age 55 and starts taking GAWs in annual Installments at age 65. Also, assume that the Covered Fund Value (net of investment management fees) increases by 5% in years 1 through 7, decreases by 10% in years 8 through 11, and increases by 5% thereafter.
•Initial Covered Fund Value: $500,000
•Guarantee Benefit Fee: 1.20%
•Changes in Covered Fund Value (net of investment management fees):
•Years 1 through 7: 5%, Years 8 through 11: -10%, Years 12+: 5%
•Positive Covered Fund performance through year 7 results in the Covered Fund Value of $649,160 on the Ratchet Date.
•The GLWB Participant’s Benefit Base Ratchets to $649,160.
•Covered Fund Value at the beginning of year 10 is $454,559, but GAWs are based on the Benefit Base, which is $649,160.
•GAWs are $649,160 x 5% = $32,458.
•The GLWB Participant annually withdraws $32,458 from the GLWB Participant’s Covered Fund until about age 80 when the Covered Fund is depleted:
•At age 80, the GLWB Participant’s Covered Fund Value is $23,926.
•The GLWB Participant withdraws the $23,926 which depletes the Covered Fund and the GLWB Participant is now in Settlement Phase. We provide the remaining $8,532 necessary to make the Installment $32,458.
•We continue to pay Installments of $32,458 each year for the GLWB Participant’s life.
Example 3– Additional Contract Contributions: Assume the GLWB Participant buys the GLWB at age 55 and the GLWB Participant makes annual Contributions of $2,500 until the GLWB Participant starts taking GAWs in annual Installments at age 65. Also, assume that the Covered Fund Value (net of investment management fees) decreases by 5% in years 1 through 10 and increases by 5% thereafter.
•Initial Covered Fund Value: $500,000
•Additional Annual Contract Contributions until GAWs Begin: $2,500
•Guarantee Benefit Fee: 1.20%
•Changes in Covered Fund Value (net of investment management fees):
•Years 1 through 10: -5%, Years 11+: 5%
•Poor Covered Fund performance in years 1 through 10 results in the Covered Fund Value of $282,593 at the end of year 10.
•The GLWB Participant’s Benefit Base at the end of year 10 is $525,000 as a result of the additional Contract Contributions in years 1 through 10.
•GAWs are $525,000 x 5% = $26,250.
•The GLWB Participant annually withdraws $26,250 from the GLWB Participant’s Covered Fund until about age 78 when the Covered Fund is depleted:
•At age 78, the GLWB Participant’s Covered Fund Value is $11,531.
•The GLWB Participant withdraws the $11,531, which depletes the Covered Fund and the GLWB Participant is now in Settlement Phase. We provide the remaining $14,719 necessary to make the Installment $26,250.
•We continue to pay Installments of $26,250 each year for the GLWB Participant’s life.
After the GLWB Participant purchases the GLWB, the GLWB Participant is required to pay the Guarantee Benefit Fee. The Guarantee Benefit Fee is set forth in the Contract, and is based on the dollar amount of the GLWB Participant’s Covered Fund Value (which may be the same as, higher than, or lower than, the Benefit Base due to factors that affect the Covered Fund Value between Ratchet Dates, such as Covered Fund performance). The Guarantee Benefit Fee will be deducted monthly as a separate charge from the GLWB Participant’s Covered Fund and will be paid by redeeming the number of fund shares of the GLWB Participant’s Covered Fund equal to the Guarantee Benefit Fee.
Pursuant to the terms of the GLWB, we will collect the fee from the custodian on a monthly basis in arrears. We reserve the right to change the frequency of the deduction, but will notify the Plan Sponsor and the GLWB Participant in writing at least thirty (30) days prior to the change. Because the Benefit Base may not exceed $5,000,000, we will not charge the Guarantee Benefit Fee on an amount of the GLWB Participant’s Covered Fund Value that exceeds $5,000,000.
Currently the Guarantee Benefit Fee is 1.20% and is subject to a minimum of 0.70% and a maximum of 1.50%. This is the guaranteed maximum or minimum Guarantee Benefit Fee we can ever charge for the GLWB. We may change the current fee within this minimum and maximum range at any time upon thirty (30) days written notice to the Plan Sponsor and the GLWB Participant. We determine the Guarantee Benefit Fee based on observations of a number of experience factors, including, but not limited to, interest rates, volatility, investment returns, expenses, mortality, and lapse rates. We reserve the right to change the Guarantee Benefit Fee at our discretion and for any reason, whether or not these experience factors change (although we will never increase the fee above the maximum or decrease the fee below the minimum). We do not need any particular event to occur before we may change the Guarantee Benefit Fee.
The Guarantee Benefit Fee is in addition to any charges that are imposed in connection with advisory, custodial, and other services, and charges imposed by the mutual funds in which the GLWB Participant invests.
At the time we calculate the Guarantee Benefit Fee, the Covered Fund Value may be less than the Benefit Base:
Example of how the Guarantee Benefit Fee is Computed (Covered Fund Value is Less Than Benefit Base)
Covered Fund Value = $100,000
Benefit Base = $125,000
Guarantee Benefit Fee = 1.20% x Covered Fund Value / 12
Guarantee Benefit Fee = 1.20% x $100,000 / 12 = $100.00
At the time we calculate the Guarantee Benefit Fee, the Covered Fund Value may be greater than the Benefit Base:
Example of how the Guarantee Benefit Fee is Computed (Covered Fund Value is Greater Than Benefit Base)
Covered Fund Value = $130,000
Benefit Base = $125,000
Guarantee Benefit Fee = 1.20% x Covered Fund Value / 12
Guarantee Benefit Fee = 1.20% x $130,000 / 12 = $130.00
The Guarantee Benefit Fee compensates us for the costs and risks we assume for providing the GLWB (including marketing, administration, and profit).
If we do not receive the Guarantee Benefit Fee (except during Settlement Phase), including as a result of the failure of the Retirement Plan custodian to submit it to us, the Contract will terminate as of the date that the fee is due.
Will a GLWB Participant pay the same amount (in dollars) for the Withdrawal Guarantee every month?
Example 1: Declining Covered Fund Value results in declining Guarantee Benefit Fee
Covered Fund Value = $100,000
Benefit Base = $125,000
Guarantee Benefit Fee = 1.20% x Covered Fund Value / 12
Guarantee Benefit Fee = 1.20% x $100,000 / 12 = $100.00
Date: 2/28
Covered Fund Value = $90,000
Benefit Base = $125,000
Guarantee Benefit Fee = 1.20% x Covered Fund Value / 12
Guarantee Benefit Fee = 1.20% x $90,000 / 12 = $90.00
Note: in this example, the Guarantee Benefit Fee declined because the Covered Fund Value declined. This could be the result of negative Covered Fund performance.
Example 2: Increasing Covered Fund Value results in increasing Guarantee Benefit Fee
Covered Fund Value = $100,000
Benefit Base = $125,000
Guarantee Benefit Fee = 1.20% x Covered Fund Value / 12
Guarantee Benefit Fee = 1.20% x $100,000 / 12 = $100.00
Date: 2/28
Covered Fund Value = $120,000
Benefit Base = $125,000
Guarantee Benefit Fee = 1.20% x Covered Fund Value / 12
Guarantee Benefit Fee = 1.20% x $120,000 / 12 = $120.00
Note: in this example, the Guarantee Benefit Fee increased because the Covered Fund Value increased. This could be the result of several factors including positive Covered Fund performance, Transfers, or Contract Contributions.
RETIREMENT PLAN, ADVISORY, CUSTODIAN AND COVERED FUND FEES AND CHARGES
In addition to the Guarantee Benefit Fee, we will deduct other fees not associated with the Contract or the GLWB (such as Retirement Plan, advisory, custodian and Covered Fund fees and charges) from the GLWB Participant Covered Fund Value and other investment options (as well as from the GLWB Participant Covered Fund Values and other investment options) on a pro-rata basis by redeeming shares of such funds. These fees will be deducted daily, monthly, or quarterly, and may vary by GLWB Participants and Retirement Plan. Deduction of these fees will reduce the Covered Fund Value dollar-for- dollar but will not affect the Benefit Base.
DIVORCE PROVISIONS UNDER THE CONTRACT
In the event of a divorce whose decree affects the GLWB, we will require written notice of the divorce in a manner acceptable to us and a copy of the applicable Qualified Domestic Relations Order (“QDRO”). A QDRO is a domestic relations order that creates or recognizes the existence of an Alternate Payee’s right to receive all or a portion of the benefits payable with respect to a GLWB Participant. A QDRO may also assign an Alternate Payee the right to receive these benefits.
Depending on which phase the GLWB is in when we receive the QDRO, the benefits of the GLWB will be altered to comply with the QDRO. The Alternate Payee under the QDRO may make certain elections during the Accumulation or GAW Phases. Any elections made by the Alternate Payee are irrevocable to the extent that an Alternate Payee becomes a GLWB Participant, he or she will be subject to all terms and conditions of the Certificate, the Contract, the Retirement Plan and the Code.
During the Accumulation Phase
Empower will make payments to the Alternate Payee and/or establish an Account on behalf of the Alternate Payee named in a QDRO approved during the Accumulation Phase. The Alternate Payee is responsible for submitting a Request to begin Distributions in accordance with the Code.
If the Alternate Payee is the GLWB Participant’s spouse during the Accumulation Phase, he or she may elect to become a GLWB Participant, either by:
(i)
maintaining the current proportionate Benefit Base of the previous GLWB Participant; or
(ii)
establishing a new Benefit Base based on the current Covered Fund Value on the date his or her Account is established and he or she will continue as a GLWB Participant.
If the Alternate Payee elects to maintain the current Benefit Base, the Benefit Base and the Covered Fund Value will be divided between the GLWB Participant and the Alternate Payee. The Covered Fund Value will be divided pursuant to the terms of the QDRO. The Benefit Base will be divided in the same proportion as the Covered Fund Value.
In either situation, the Alternate Payee’s Election Date shall be the date the Account is established.
A non-spouse Alternate Payee cannot elect to maintain the current Benefit Base, or proportionate share, but may elect to establish a new GLWB. The Benefit Base and Election Date will be based on the current Covered Fund Value on the date his or her Account is established. Any election made by an Alternate Payee described in this section is irrevocable.
Empower will make payment to the Alternate Payee and/or establish an Account on behalf of the Alternate Payee named in a QDRO approved during the GAW Phase. The Alternate Payee is responsible for submitting a Request to begin Distributions in accordance with the Code.
If there is a Sole Covered Person
Pursuant to the instructions in the QDRO, the Benefit Base and GAW will be divided in the same proportion as their respective Covered Fund Values as of the effective date of the QDRO. The GLWB Participant may continue to receive the proportional GAWs after the accounts are split. If the Alternate Payee is the GLWB Participant’s spouse, he or she may elect to receive his or her portion of the Covered Fund Value as a lump sum Distribution or can separately elect to become a GLWB Participant.
If there are two Covered Persons
Pursuant to the instructions in the QDRO, the Benefit Base and GAW will be divided in the same proportion as their respective Covered Fund Values as of the effective date of the QDRO. The GLWB Participant may continue to receive the proportional GAWs after the accounts are split, based on the amounts calculated pursuant to the joint Covered Person GAW%.
If the Alternate Payee is the GLWB Participant’s spouse, he or she may elect to receive his or her portion of the Covered Fund Value as a lump sum Distribution or can separately elect to continue proportionate GAWs in the GAW Phase based on the amounts calculated pursuant to the joint Covered Persons GAW%, described in the “GAW Phase – Calculation of Installment,” after the accounts are split. A new Ratchet Date will be established for the Alternate Payee on the date the Accounts are split. Within thirty (30) days of each person’s Ratchet Date, the GLWB Participant and Alternate Payee can each elect a Reset based on the person’s own Attained Age GAW% for joint Covered Persons.
In the alternative, the Alternate Payee may establish a new GLWB in the Accumulation Phase with the Benefit Base based on the current Covered Fund Value on the date his or her Account is established.
During the Settlement Phase
If a Request in connection with a QDRO is approved during the Settlement Phase, Empower will divide the Installment pursuant to the terms of the QDRO. Installments will continue pursuant to the lives of each payee.
If the Code and the Retirement Plan permit and the GLWB Participant elects to annuitize, prior to the Initial Installment Date, the GLWB will terminate for those Covered Fund assets and the Guarantee Benefit Fee will not be refunded. If, based upon information provided by the Contract Owner, the GLWB Participant is entitled to a Distribution under the applicable terms and provisions of the Retirement Plan and the Code, all or a portion of the Account may be applied to an annuity payment option selected by the GLWB Participant, so long as the requirements of the Code and the Retirement Plan are met. Thereafter, the GLWB shall no longer be applicable with respect to amounts in the annuity payment option.
The amount to be applied to an annuity payment option is: (i) the portion of the vested Account Value elected by GLWB Participant, less (ii) Applicable Tax, if any, less (iii) any fees and charges described in the Contract. The minimum amount that may be applied under the elected annuity option is $5,000. If any payments to be made under the elected annuity payment option will be less than $50, Empower may make the payments in the most frequent interval that produces a payment of at least $50. There is no maximum age limitation at which time annuitization may be elected under the Certificate, and annuitization is not required.
Empower will issue a certificate or other statement setting forth in substance the benefits, rights, and privileges to which such person is entitled under the Contract, to each Annuitant describing the benefits payable under the elected annuity payment option.
Election of Annuity Options
An Annuitant is required to elect an annuity payment option and select the frequency of payments. The Annuitant must Request an annuity payment option or change an annuity payment option no later than 30 days prior to the Annuity Commencement Date elected by the GLWB Participant.
To the extent available under the Code and the Retirement Plan, the annuity payment options are:
•Income for Single Life Only
•Income for Single Life with Guaranteed Period
•Income for Joint Life Only
•Income for Joint Life with Guaranteed Period
•Income for a Specific Period
•Any other form of annuity payment permitted under the Retirement Plan, if acceptable to Empower.
The annuity option that will always be available is the Income for Single Life Only Annuity. If this annuity option is elected, Empower will make payments to the Annuitant at a frequency specified in the annuity certificate or other statement for the duration of the Annuitant’s lifetime. Payments will cease pursuant to the terms of the certificate or other statement.
Annuity payment frequency must be selected from the following:
Annuity purchase rates will be the same rates that are available for a Single Premium Immediate Annuity currently offered by Empower at the time of annuitization.
It is generally not beneficial to annuitize this Certificate. The Certificate was designed specifically to provide the GLWB, and the GLWB Participant will have paid a non-refundable fee for such benefit. In addition, the annuity payment amount might be less than the GLWB payout would provide.
TERMINATION OF THE CONTRACT
Either Empower or the Plan Sponsor may terminate the Contract with advance written notice to the other party. The Contract termination date shall be the seventy-fifth (75th) or next Business Day after the date written notice is received in the Administrative Offices in good order. Prior to the Contract termination date, Empower and the Plan Sponsor may agree to an alternate Contract termination date.
If the Plan Sponsor Terminates the Contract
Under the terms of the Contract, the Plan Sponsor may terminate the Contract. In this event, all benefits, rights, and privileges provided by the Contract shall terminate. We will not refund the Guarantee Benefit Fee upon termination of the Contract. If the Plan Sponsor terminates the Contract, the Plan Sponsor may not apply for a new contract until ninety (90) calendar days after the date of the most recent Contract termination. In the event of termination, the GLWB Participant may choose to utilize the Covered Fund Value in the following ways:
If the GLWB Participant is eligible to receive Distributions under the Retirement Plan:
(a)
the GLWB Participant may elect a direct rollover of the Covered Fund Value to an IRA that offers an Empower approved GLWB feature, if available. In this situation, the Benefit Base and GAW, if applicable, will be retained as of the date of Distribution from the Covered Fund(s) and will apply to the new GLWB feature.
(b)
the GLWB Participant may choose to transfer the Covered Fund Value to any investment vehicle that does not offer a GLWB feature or to an investment vehicle that offers a GLWB feature, but does not permit the GLWB Participant to apply the Benefit Base and GAW to such feature. In this situation, the Benefit Base and GAW, if applicable, will be reduced to zero as of the date of the Distribution from the Covered Fund(s).
If the GLWB Participant does not elect or is not eligible to receive a Distribution:
The Covered Fund Value will be liquidated and invested pursuant to the terms of the Retirement Plan. This liquidation will cause the Benefit Base and the Covered Fund Value to be reduced to zero and any and all other benefits provided under the Contract and GLWB shall terminate on the Contract termination date.
Generally, effective January 1, 2020, if the Plan Sponsor eliminates a lifetime income investment from the Retirement Plan, GLWB Participants may be eligible to receive a Distribution 90 days prior to the date such lifetime income investment is no longer available. Please consult with your Plan Sponsor and/or qualified tax advisor.
For GLWB Participants that have reached the Settlement Phase on or before the date of the termination of the Contract, Installments will continue for as long as the GLWB Participant shall live.
If Empower Terminates the Contract
If Empower terminates the Contract, such termination will not adversely affect the GLWB Participant’s rights under the Contract, except that additional Contributions may not be invested in the Covered Fund(s) other than reinvested dividends and capital gains. The GLWB Participant will still be obligated to pay the Guarantee Benefit Fee.
Other Termination
In addition, if the Plan Sponsor terminates the Retirement Plan or moves the Retirement Plan to a provider that does not offer the Contract, the Contract will terminate. We will not refund the Guarantee Benefit Fee upon termination of the Contract.
Periodic Communications to GLWB Participants
Account statements will be provided to GLWB Participants periodically by the Plan Sponsor, or its designated third party.
Amendments to the Contract
The Contract and Certificate may be amended to conform to changes in applicable law or interpretations of applicable law, or to accommodate design changes. Amendments (if any) to accommodate design changes will be applicable only with respect to purchasers of new Contracts, unless the Company reasonably determines the change would be favorable for all existing Contract Owners, in which case the Company will notify the Contract Owner and the GLWB Participants. Changes in the Contract may need to be approved by the state insurance departments. The consent of the Contract Owner to an amendment will be obtained to the extent required by law.
The interests of the Plan Sponsor in the Contract may not be transferred, sold, assigned, pledged, charged, encumbered, or, in any way, alienated. The interests of the GLWB Participant in the GLWB may not be transferred, sold, assigned, pledged, charged, encumbered, or, in any way, alienated.
The GLWB Participant can cancel GLWB by causing the Covered Fund Value or the Benefit Base to be reduced to zero prior to the Settlement Phase due to one or more Excess Withdrawals or by failing to pay the Guarantee Benefit Fee. However, if the Excess Withdrawal occurs as a result of a same day Transfer between Covered Funds (i.e., shares of a Covered Fund are sold and shares of a new replacement Covered Fund are purchased on the same day,) then the GLWB will not be cancelled even if the Benefit Base of the Covered Fund is reduced to zero.
There is no free look provision if a Retirement Plan participant purchases the GLWB. (See “Return Privilege,” later in this prospectus.)
We may require adequate proof of the age and death of the Annuitant, GLWB Participant or Covered Person(s) before processing a Request for GAWs and annuity payments. If the age of the Annuitant, GLWB Participant or Covered Person(s) has been misstated, the Installment or annuity payment established for him or her will be made on the basis or his or her correct age.
Any correction required due to misstatements may be corrected by Empower, including increasing or decreasing future payments, in accordance with applicable law.
FINANCIAL CONDITION OF THE COMPANY
Like many businesses, insurance companies are facing challenges due to COVID-19. We know it is important for you to understand how these or similar events may affect our ability to meet guarantees that may be provided under the Contract. The Contract is not a separate account product, which means that no assets are set aside in a segregated or “separate” account to satisfy all obligations under the Contracts. Installments during Settlement Phase (if any) will be paid from our general account and, therefore, are subject to our claims paying ability. We issue other types of insurance policies and financial products as well, such as group variable annuities offered through retirement plans, term and universal life insurance, funding agreements, funding agreements backing notes and guaranteed investment contracts (“GICs”), and we also pay our obligations under these products from our assets in the general account. In the event of an insolvency or receivership, payments we make from our general account to satisfy claims under the Contract would generally receive the same priority as our other policyholder obligations.
As an insurance company, we are required by state insurance regulation to hold a specified amount of reserves in order to meet all the contractual obligations of our general account to our contract owners. In order to meet our claims-paying obligations, we
regularly monitor our reserves to ensure we hold sufficient amounts to cover actual or expected contract and claims payments. In addition, we actively hedge our investments in our general account. However, it is important to note that there is no guarantee that we will always be able to meet our claims paying obligations, and that there are risks to purchasing any insurance product.
State insurance regulators also require insurance companies to maintain a minimum amount of capital, which acts as a cushion in the event that the insurer suffers a financial impairment, based on the inherent risks in the insurer’s operations. These risks include those associated with losses that we may incur as the result of defaults on the payment of interest or principal on our general account assets, which include bonds, mortgages, general real estate investments, and stocks, as well as the loss in value of these investments resulting from a loss in their market value.
Additional information regarding the Company, its business, senior management, and financial condition, is presented below in “Additional Information Regarding the Company.” We encourage both existing and prospective Contract Owners and GLWB Participants to read and understand our audited financial statements, which are included in this prospectus in “Appendix A – Company Financial Statements and Other Financial Information.” We prepare our audited financial statements on a statutory basis pursuant to laws and regulations promulgated by the Colorado Division of Insurance (this method of accounting is referred to herein as “Statutory” accounting). You may obtain a free copy of our financial statements for the most recent fiscal year by calling (800) 537-2033 or writing to the Administrative Office. In addition, our financial statements filed with this prospectus are available on the SEC’s website at http://www.sec.gov and on our website at http://www.empower.com.
There is also information available on our website on ratings assigned to us by one or more independent rating organizations. These ratings are opinions of an operating insurance company’s financial capacity to meet the obligations of its insurance and annuity contracts based on its financial strength and/or claims-paying ability.
TAXATION OF THE CONTRACT AND GLWB
The following is a general discussion based on our interpretation of current United States federal income tax laws. This discussion does not address all possible circumstances that may be relevant to the tax treatment of a particular GLWB Participant. In general, this discussion does not address the tax treatment of transactions involving investment assets held in your Account except insofar as they may be affected by the holding of a GLWB. Further, it does not address the consequences, if any, of holding a GLWB under applicable federal estate tax laws or state and local income and inheritance tax laws. You should also be aware that the tax laws may change, possibly with retroactive effect. Prospective Contract Owners and GLWB Participants should consult their own tax advisors regarding the potential tax implications of purchasing a Contract or GLWB in light of their particular circumstances. The GLWB should not be purchased for the purpose of additional tax deferral.
The Contract is a novel and innovative instrument and, to date, its proper characterization and consequences for federal income tax purposes have not been directly addressed in any cases, administrative rulings or other published authorities. We can give no assurances that the Internal Revenue Service (“IRS”) will agree with our interpretations regarding the proper tax treatment of a Contract or GLWB or the effect (if any) of the purchase of a Contract or GLWB on the tax treatment of any transactions in your Account, or that a court will agree with our interpretations if the IRS challenges them. You should consult a tax advisor before purchasing a Contract or GLWB.
The following discussion generally applies to Contracts and GLWBs treated as annuity contracts maintained as part of a plan qualified under Section 403(b) of the Code.
Section 403(b) of the Code allow employees of certain Section 501(c)(3) organizations and public schools to exclude from their gross income the premium payments made, within certain limits, on a contract that will provide an annuity for the employee’s retirement. These premium payments may be subject to FICA (social security) tax. Distributions of (1) salary reduction contributions made in years beginning after December 31, 1988; (2) earnings on those contributions; and (3) earnings on amounts held as of the last year beginning before January 1, 1989, are not allowed prior to age 59 1∕2, severance from employment, death or disability. Other exceptions may be applicable under certain circumstances. Salary reduction contributions may also be distributed upon hardship, but would generally be subject to penalties.
A GLWB is available only with respect to the Account for which the Contract and Certificate are purchased.
•A GLWB is intended for purchase only by an employee participating in a Section 403(b) Retirement Plan.
•We are not responsible for determining whether a GLWB complies with the terms and conditions of, or applicable law governing, the Retirement Plan. You are responsible for making that determination. Similarly, unless otherwise agreed, we are not responsible for administering any applicable tax or other legal requirements applicable to the Retirement Plan. The Plan Sponsor, the GLWB Participant or a service provider for the Retirement Plan is responsible for determining that distributions, beneficiary designations, investment restrictions, charges and other transactions under a GLWB are consistent with the terms and conditions of the Retirement Plan and applicable law.
•Among other things, if the Retirement Plan is subject to the Employee Retirement Income Security Act of 1974, as amended (“ERISA”), you should consider how the GLWB will be treated under the ERISA qualified joint and survivor annuity and qualified pre-retirement survivor annuity rules and, if applicable, make provision for complying with those rules in the governing documents and procedures of the Retirement Plan. Guidance published by the Internal Revenue Service on February 21, 2012, may suggest that the GLWB will be treated as an annuity for purposes of those rules.
•If the GLWB Participant’s spouse is a joint Covered Person, that spouse must be the GLWB Participant’s sole beneficiary under the Retirement Plan.
•The GLWB Participant’s Account is subject to required minimum distribution rules. Withdrawals during the GAW Phase from the Covered Fund Value taken to meet required minimum distribution requirements, in the proportion of the GLWB Participant’s Covered Fund Value to the overall Account balance (and not taking into account any other retirement balances of the GLWB Participant), will be deemed to be within the contract limits for the GLWB and will not be treated as Excess Withdrawals. The required minimum distribution shall not exceed the required minimum distribution amount calculated under the Code and regulations issued thereunder as in effect on the Election Date. In the event of a dispute about the required minimum distribution amount, our determination will govern. In some circumstances, compliance with the minimum distribution rules may affect the amount and timing of Installments pursuant to the GLWB.
•We generally are required to confirm, with the Plan Sponsor or otherwise, that surrenders or transfers requested by GLWB Participants comply with applicable tax requirements and to decline requests that are not in compliance. We will defer such payments requested by GLWB Participants until all information required under the tax law has been received. By requesting a surrender or transfer, a GLWB Participant consents to the sharing of confidential information about the GLWB Participant, the Contract and Certificate, and transactions under the Contract, the GLWB and any other 403(b) contracts or accounts the GLWB Participant has under the Retirement Plan among us, the employer or Plan Sponsor, any Plan administrator or recordkeeper, and other product providers.
•The Retirement Plan can be terminated, or the availability of the GLWB under the Retirement Plan otherwise discontinued by persons other than the GLWB Participant.
Numerous changes have been made to the income tax rules governing Section 403(b) contracts as a result of legislation enacted during the past several years, including rules with respect to: maximum contributions, required distributions, penalty taxes on early or insufficient distributions, and income tax withholding on distributions.
In the case of distributions from a Section 403(b) contract, including payments to a GLWB Participant from a GLWB, a ratable portion of the amount received is taxable, generally based on the ratio of the GLWB Participant’s cost basis (if any) to the GLWB Participant’s total accrued benefit under the Retirement Plan. Section 72(t) of the Code imposes a 10% penalty tax on the taxable portion of any distribution from Section 403(b) contract. To the extent amounts are not includable in gross income because they have been properly rolled over to an IRA or to another eligible qualified plan, no tax penalty will be imposed. The tax penalty also will not apply to: (a) distributions made on or after the date on which the GLWB Participant reaches age 59 1∕2; (b) distributions following the GLWB Participant’s death or disability (for this purpose disability is as defined in Section 72(m)(7) of the Code); (c) distributions that are part of substantially equal periodic payments made not less frequently than annually for the GLWB Participant’s life (or life expectancy) or the joint lives (or joint life expectancies) of the GLWB Participant and an eligible designated beneficiary; and (d) certain other distributions specified in the Code.
Generally, distributions from a Section 403(b) contract must commence no later than April 1 of the calendar year following the year in which the individual attains their applicable age or, if later, retires from employment with the Section 403(b) plan sponsor. If the individual attains (1) age 70 1∕2 before 2020, the applicable age is 70 1∕2; (2) age 72 during or after 2020 but before 2023, the applicable age is 72; (3) age 72 during or after 2023 and age 73 before 2033, the applicable age is 73; or (4) age 74 after 2032, the applicable age is 75. Required distributions must be over a period not exceeding the life expectancy of the individual or the joint lives or life expectancies of the individual and his or her designated beneficiary. Distribution requirements also apply to Section 403(b) contracts upon the death of the individual. If the required minimum distributions are not made, a 25% penalty tax is imposed as to the amount not distributed but is reduced to 10% if a distribution of the shortfall is made within two years and to the date the excise tax is assessed or imposed by the IRS.
SECURE Act and SECURE 2.0 Act were passed as part of the comprehensive government appropriations bills in 2019 and 2022, respectively (referred to collectively as the “SECURE Act”). The SECURE Act made significant changes to laws governing individual retirement accounts, individual retirement annuities and defined contribution retirement plans, such as 401(k), 403(b) and 457 (b) plans. Certain of these changes are reflected in this prospectus.
Changes to Timing of Death Benefit Distributions. Prior to the SECURE Act, beneficiaries of an annuity that was part of a defined contribution plan could elect to have the annuity’s death benefit distributed over the beneficiary’s life expectancy. Under the new rule, except for eligible designated beneficiaries (“EDBs”), the beneficiary generally must receive the entire death benefit within 10 years of the annuity owner’s death. EDBs may still elect to take distributions over their life expectancy or over a period not extending beyond their life expectancy, but the 10-year requirement applies when they die. EDBs include: (1) the owner‘s surviving spouse, (2) the owner’s minor children (until they reach the age of majority), (3) a disabled person, (4) a chronically ill person, or (5) an individual who is not more than 10 years younger than the owner. A beneficiary’s status as an EDB is determined on the date of the owner’s death
New Distributable Event. Prior to the SECURE Act, if a plan sponsor eliminated a lifetime income investment from the retirement plan, participants could potentially lose their lifetime income benefits because a participant may not have been eligible to take a distribution from their retirement plan and rollover their assets to an IRA with an Empower approved guaranteed lifetime withdrawal benefit. Under the new rule, generally, if the plan sponsor eliminates a lifetime income investment from the retirement plan, participants may be eligible to receive a distribution 90 days prior to the date such lifetime income investment option is no longer available.
Distributions from Section 403(b) contracts generally are subject to withholding for the individual’s federal income tax liability, subject to the individual’s election not to have tax withheld. The withholding rate varies according to the type of distribution and the individual’s tax status.
“Eligible rollover distributions” from Section 403(b) contracts and certain other retirement plans are subject to a mandatory federal income tax withholding of 20%. An eligible rollover distribution is any distribution to an employee (or employee’ spouse or former spouse as beneficiary or alternate payee) from such a plan, except certain distributions such as distributions required by the Code, distributions in a specified annuity form, or hardship distributions. The 20% withholding does not apply, however, to nontaxable distributions or if (i) the employee (or employee’s spouse or former spouse as beneficiary or alternate payee) chooses a “direct rollover” from the plan to a tax qualified plan, IRA, Roth IRA or Section 403(b) contract or to a governmental 457 plan that agrees to separately account for rollover contributions; or (ii) non-spouse beneficiary chooses a “direct rollover” from the plan to an IRA established by the direct rollover.
Annuity purchases by nonresident aliens. The discussion above provides general information regarding U.S. federal income tax consequences to annuity purchasers that are U.S. citizens or residents. Purchasers that are not U.S. citizens or residents will generally be subject to U.S. federal withholding tax on taxable distributions from annuity contracts at a 30% rate, unless a lower treaty rate applies. In addition, such purchasers may be subject to state and/or municipal taxes and taxes that may be imposed by the purchaser’s country of citizenship or residence. Prospective purchasers are advised to consult with a qualified tax adviser regarding U.S., state, and foreign taxation with respect to an annuity contract purchase.
Seek Tax Advice. The above description of federal income tax consequences of the Section 403(b) contracts is only a brief summary meant to alert you to the issues and is not intended as tax advice. Anything less than full compliance with the applicable rules, all of which are subject to change, may have adverse tax consequences.
We have entered into an underwriting agreement with Empower Financial Services for the distribution and sale of the Contracts. Pursuant to this agreement, Empower Financial Services serves as principal underwriter for the Contracts, offering them on a continuous basis.
Empower Financial Services is located at 8515 East Orchard Road, Greenwood Village, CO 80111. Empower Financial Services will use its best efforts to sell the Contracts, but is not required to sell any specific number or dollar amount of Contracts.
Empower Financial Services was organized as a corporation under the laws of the State of Delaware in 1984 and is an affiliate of ours. Empower Financial Services is registered as a broker-dealer with the SEC under the Securities Exchange Act of 1934, as well as with the securities administrators in the states in which it operates, and is a member of the Financial Industry Regulatory Authority (“FINRA”).
Empower Financial Services offers the Contracts through its registered representatives who are registered with FINRA and with the states in which they do business. More information about Empower Financial Services and its registered representatives is available at www.finra.org or by calling 800-289-9999. You can also obtain an investor brochure from FINRA describing its Public Disclosure Program. Registered representatives with Empower Financial Services are also licensed as insurance agents in the states in which they do business and are appointed with us.
Empower Financial Services may also enter into selling agreements with unaffiliated broker-dealers to sell the Contracts. The registered representatives of these selling firms are registered with FINRA and with the states in which they do business, are licensed as insurance agents in the states in which they do business, and are appointed with us.
We do not pay commissions to Empower Financial Services or to the unaffiliated broker-dealers in connection with the sale or solicitation of the Contracts. However, we may provide non-cash compensation in the form of training and education programs to registered representatives of Empower Financial Services who sell the Contracts as well as registered representatives of unaffiliated broker-dealers. Registered representatives of Empower Financial Services also sell other insurance products that we offer and may receive certain non-cash items, such as conferences, trips, prizes and awards under non-cash incentive compensation programs pertaining to those products. None of the items are directly attributable to the sale or solicitation of the Contracts. Such compensation will not be conditioned upon achievement of a sales target. Finally, we and Empower Financial Services may provide small gifts and occasional entertainment to registered representatives with Empower Financial Services or other selling firms in circumstances in which such items are not preconditioned on achievement of sales targets.
At times, Empower Financial Services may make other cash and non-cash payments to selling firms for expenses relating to the recruitment and training of personnel, periodic sales meetings, the production of promotional sales literature and similar expenses. These expenses may also relate to the synchronization of technology between the Company, Empower Financial Services, and the selling firm in order to coordinate data for the sale and maintenance of the Contracts. The amount of other cash and non-cash compensation paid by Empower Financial Services or its affiliated companies ranges significantly among the selling firms. Empower Financial Services and its affiliates may receive payments from affiliates of the selling firms that are unrelated to the sale of the Contracts. Any amounts paid by Empower Financial Services to a selling firm or by Empower to a selling firm are derived from the general account assets of Empower and are not deducted from the Guarantee Benefit Fee. The Guarantee Benefit Fee does not vary because of such payments to such selling firms.
Although the Company and Empower Financial Services do not anticipate discontinuing offering the Contracts, we do reserve the right to discontinue offering the Contracts at any time.
ADDITIONAL INFORMATION REGARDING THE CONTRACT
The obligations to Contract Owners and Covered Persons under the Contracts are ours. Please direct your questions and concerns to us at our Administrative Office.
Within the free-look period, if applicable, (up to 30 days under applicable state law) after receiving the Contract, the Contract Owner may cancel it for any reason by delivering or mailing it postage prepaid to:
Empower Annuity Insurance Company of America
Annuity Administration
8515 East Orchard Road
Greenwood Village, CO 80111
If the Contract Owner cancels the Contract, the Contract will be void.
As a life insurance company organized and operated under the laws of the State of Colorado, we are subject to provisions governing life insurers and to regulation by the Colorado Commissioner of Insurance. Our books and accounts are subject to review and examination by the Colorado Division of Insurance.
Evidence of Death, Age, Gender, or Survival
We may require proof of the age, gender, death, or survival of any person or persons before acting on any applicable Contract provision.
LEGAL MATTERS REGARDING THE CONTRACT
Certain matters regarding the offering of the securities herein have been passed upon by the Senior Counsel, Employee Benefits, Insurance and Trust for the Company. Eversheds Sutherland (US) LLP has provided advice on certain matters relating to the application of federal securities laws to the Certificates.
Our variable annuity contract business is highly dependent upon the effective operation of our computer systems and those of our business partners, so that our business is potentially susceptible to operational and information security risks resulting from a cyber-attack. These risks include, among other things, the theft, misuse, corruption, and destruction of data maintained online or digitally, denial of service on our website and other operational disruption, and unauthorized release of confidential owner information. Cyber-attacks affecting us, the Portfolios, intermediaries and other affiliated or third-party service providers may adversely affect us and your Annuity Account Value. For instance, cyber-attacks may interfere with our processing of Contract transactions, including the processing of Transfer Requests from our website or with the Portfolios, impact our ability to calculate accumulation unit values, cause the release and possible destruction of confidential owner or business information, impede order processing, subject us and/or our service providers and intermediaries to regulatory fines and financial losses and/or cause reputational damage. Cyber security risks may also impact the issuers of securities in which the Portfolios invest, which may cause the Portfolios underlying your Contract to lose value. There can be no assurance that we or the Portfolios or our service providers will avoid losses affecting your Contract due to cyber-attacks or information security breaches in the future.
We are also exposed to risks related to natural and man-made disasters and catastrophes, such as storms, fires, earthquakes, epidemics and terrorist acts, which could adversely affect our ability to administer the Contracts. Natural and man-made disasters, such as the recent spread of COVID-19, may require a significant contingent of our employees to work from remote locations. During these periods, we could experience decreased productivity, and a significant number of our workforce or certain key personnel may be unable to fulfill their duties. In addition, system outages could impair our ability to operate effectively by preventing the workforce from working remotely and impair our ability to process Contract-related transactions or to calculate Contract values.
The Company outsources certain critical business functions to third parties and, in the event of a natural or man-made disaster, relies upon the successful implementation and execution of the business continuity planning of such entities. While the Company closely monitors the business continuity activities of these third parties, successful implementation and execution of their business continuity strategies are largely beyond the Company’s control. If one or more of the third parties to whom the Company outsources such critical business functions experience operational failures, the Company’s ability to administer the Contract could be impaired.
Abandoned Property Requirements
Every state has unclaimed property laws that generally provide for escheatment to the state of unclaimed property (including proceeds of annuity contracts) under various circumstances. This “escheatment” is revocable, however, and the state is obligated to pay the applicable proceeds if the property owner steps forward to claim it with the proper documentation. To help prevent such escheatment, it is important that you keep your contact and other information on file with us up to date, including the names, contact information, and identifying information for owners, annuitants, beneficiaries, and other payees.
ADDITIONAL INFORMATION REGARDING THE COMPANY
Corporate Organization and Overview
Empower Annuity Insurance Company of America is a stock life insurance company that was originally organized under the laws of the State of Kansas as the National Interment Association. Our name was changed to Ranger National Life Insurance Company in 1963, then to Insuramerica Corporation, and then to Great-West Life & Annuity Insurance Company in 1982, prior to changing to our current name in 2022. In September of 1990, we re-domesticated under the laws of the State of Colorado. Our executive office is located at 8515 East Orchard Road, Greenwood Village, Colorado 80111.
The Company is a direct wholly-owned subsidiary of Empower Holdings, LLC (“Empower Holdings”), a Delaware limited liability company. Empower Holdings is a direct wholly-owned subsidiary of Great-West Lifeco U.S. LLC (“Lifeco U.S.”), a Delaware limited liability company and an indirect wholly-owned subsidiary of Great-West Lifeco Inc. (“Lifeco”), a Canadian holding company. Lifeco operates in the United States primarily through the Company, and in Canada and Europe through The Canada Life Assurance Company (“CLAC”), a Canadian insurance company, and Irish Life Group Limited and their respective subsidiaries. Lifeco is a subsidiary of Power Financial Corporation (“Power Financial”), a Canadian holding company with substantial interests in the financial services industry. Power Corporation of Canada (“Power Corporation”), a Canadian holding and management company, has voting control of Power Financial. The Desmarais Family Residuary Trust, through a group of private holding companies that it controls, has voting control of Power Corporation.
The shares of Lifeco and Power Corporation are traded publicly in Canada on the Toronto Stock Exchange.
The Company and its subsidiaries provide retirement services, insurance, and other financial services and products to individuals, businesses, and other private and public organizations throughout the United States, with the mission of empowering financial freedom for all. The Company is authorized to engage in the sale of life insurance, accident and health insurance and annuities. It is qualified to do business in all states in the United States, except New York, and in the District of Columbia, Puerto Rico, Guam and the U.S. Virgin Islands.
In the spring of 2022, the Company formally launched its “Empower” brand identity representing the consolidated business of it and its subsidiaries, capturing the essence of the Company’s mission: to increase people’s financial confidence and successfully achieve short and long-term financial wellness goals on their path to retirement. The change also simplifies customer connections and better represents the Company’s expansion into financial wellness. The Company believes the new public-facing brand name will help to continue to drive business growth as it more accurately reflects its broadening stature and rapid growth.
In the Company’s audited financial statements filed with this Prospectus, which are prepared in accordance with statutory reporting standards, the Company presents its financial information in three segments. In 2023, the Company modified its segment reporting to more accurately reflect its current business. As a result, the three segments presented in the 2023 audited financial statements are: “Workplace Solutions”, “Personal Wealth” and “Other”. Prior to 2023, the Company presented its business in the segments “Empower”, “Individual Markets” and “Corporate”. As described in greater detail below, the heritage “Empower” segment has been divided into the “Workplace Solutions” and “Personal Wealth” segments. The heritage “Individual Markets” segment, which was discontinued as an active business in 2019, has now been consolidated into the “Other” segment along with other corporate items.
These segments reflect the manner in which the Company’s Board of Directors and management review and manage the business. The President and Chief Executive Officer (the “CEO”) of the Company is also the Chief Operating Decision Maker of the Company. The CEO primarily reviews financial information prepared in accordance with International Financial Reporting Standards for the purposes of assessing the overall financial performance of the enterprise, including the Company, its subsidiaries and other U.S. affiliates. The CEO also reviews the Company’s financial information prepared in accordance with statutory reporting standards that is included in registration statements filed with the Securities and Exchange Commission (the “SEC”), such as this Prospectus.
Through its Workplace Solutions segment, the Company and its subsidiaries provide a range of investment and retirement products and solutions, as well as comprehensive administrative and recordkeeping services for financial institutions and employers. The Workplace Solutions segment includes the heritage Empower workplace retirement products and services businesses, as well as the retirement plan administration and services businesses acquired from Massachusetts Mutual Life Insurance Company (“MassMutual”) in 2020, and Prudential Financial, Inc. (“Prudential”) in 2022. Through these acquisitions and organic growth, Empower has further strengthened its position as a leader in the workplace retirement products and services
market. The Personal Wealth segment represents business under the Empower Personal Wealth brand, which was launched in the first quarter of 2023 through the combination of Empower's legacy IRA rollover and brokerage offerings with the capabilities and customers of the acquired Personal Capital business.
The Company’s Other reporting segment is substantially comprised of legacy insurance and risk solutions as well as corporate items not directly allocated to the other operating segments and interest expense on long-term debt. Prior to June 1, 2019, the Company offered various forms of individual life insurance and annuity products. Effective June 1, 2019, the Company completed the sale, via indemnity reinsurance (the “Protective Transaction”), of substantially all of the Individual Markets segment to Protective Life Insurance Company (“Protective”), which has now assumed the economics and risks associated with the reinsured business. The transferred business included bank-owned and corporate- owned life insurance, single premium life insurance, individual annuities and closed block life insurance and annuities. The Company retained a block of in-force life insurance and annuities, predominantly participating policies which are now administered by Protective. Following the Protective Transaction, the Company has focused on the Empower segment and its defined contribution retirement plan and asset management businesses.
No customer accounted for 10% or more of the Company’s consolidated revenues during the years 2023, 2022, or 2021. In addition, no segment of the Company’s business is dependent upon a single customer or a few customers, the loss of which would have a significant effect on it or its business segments’ operations. The loss of business from any one, or a few, customers, independent brokers or agents would not have a material adverse effect on the Company or its business segments.
Workplace Solutions Segment
Through the Workplace Solutions segment, the Company and its subsidiaries provide investment and retirement planning products and services to individuals and organizations of all sizes, including financial planning tools and services, IRA accounts and insurance and investment products focused on achieving long term financial goals. Workplace Solutions also provides comprehensive administrative and recordkeeping services for financial institutions and employers, including educational, advisory, enrollment, and communication services for employer-sponsored defined contribution plans and associated defined benefit plans.
Workplace Solutions is focused on providing investment products, administrative services, and recordkeeping services to retirement plans organized under Internal Revenue Code Sections 401(a), 401(k), 403(b), 408, and 457 by private corporations, state and local governments, hospitals, non-profit organizations, public school districts, and “Taft Hartley” plans provided to organized labor groups, as well as their participants. Empower had assets under administration (“AUA”) in excess of $1.5 trillion at December 31, 2023, up from approximately $1.3 trillion at December 31, 2022. Empower participant accounts have grown to approximately 18 million at December 31, 2023, up from 17.8 million at December 31, 2022.
Within the Workplace Solutions segment, the Company offers insurance-based investment products, such as variable annuity products and guaranteed interest rate investment products, that are designed to meet the specific needs of the customer. In addition, the Company offers both customized annuity and non-annuity products.
Variable annuity products – The Company’s variable annuity product offerings serve as funding vehicles for retirement plans and individual retirement accounts and provide the option for clients to annuitize assets. Additionally, some variable annuity offerings provide GLWBs, which guarantees that the client is able to take contractually specified withdrawals from their assets that will continue for life regardless of market performance or longevity. Depending on the product, the Company may earn fees from the separate account for GLWB risks, mortality and expense risks pertaining to the variable annuity contract, and/or for providing administrative services. For variable annuity assets invested in mutual funds, the Company may be reimbursed by the mutual funds for marketing, sales, and service costs under various revenue sharing agreements.
Guaranteed interest rate investment products – The Company offers guaranteed interest rate investment products, including the Certificate described in this Prospectus, that provide guaranteed minimum lifetime income to the covered individual under certain specified conditions. On these guaranteed interest rate investment products, the Company earns investment margins on the difference between the income earned on investments in its general account and the interest credited to the participant’s account balance. The Company’s general account assets support the guaranteed investment products. The Company also manages fixed interest rate products known as stable value funds that may be structured as separate accounts, pooled collective trusts, and custom collective trusts for which it is paid a management fee that is earned by the Company either directly or through its wholly-owned subsidiaries Empower Capital Management, LLC (“Empower Capital Management”) or Empower Trust Company, LLC (“Empower Trust Company”).
In addition, through the Company’s wholly-owned subsidiaries, Workplace Solutions offers a variety of non-insurance products and services including defined contribution retirement plans, associated record-keeping and administrative services, and individual retirement accounts (“IRAs”). Revenues and expenses generated from these products are represented within the Company’s audited financial statements as changes in value of its investment in its subsidiaries, and income earned by these subsidiaries is distributed to the Company as periodic dividends, as discussed further in the attached audited statutory financial statements.
Retirement Plan Services – Through the Company’s wholly-owned subsidiary Empower Retirement, LLC (“Empower Retirement”), Workplace Solutions provides defined contribution retirement plans to public, private and non-profit employers and associated administrative services and partners with other large financial institutions to provide third-party recordkeeping and administration services Empower Retirement receives asset-based and/or participant-based fees for providing third-party administrative and recordkeeping services to financial institutions and employer-sponsored retirement plans.
The Personal Wealth segment offers individual product solutions and provides retail wealth management products and services to individuals, including individual retirement accounts and after-tax investment accounts, with an expanded focus on retail wealth management. This segment is working to make money management simpler, clearer, and more accessible by bringing together everything a customer owns and owes in one comprehensive dashboard that they and their advisor can leverage to take control of their personal wealth. The results of the business acquired from Personal Capital are now included within this segment's results.
Within the Personal Wealth segment, the Company’s subsidiaries provide the following products and services:
Asset Management Services – Through the Company’s wholly-owned, registered investment advisor subsidiaries, Empower Capital Management, and Empower Advisory Group, LLC, the Company provides investment management and advisory services to institutions, plan sponsors and individuals.
Consumer Accounts and Advisory Services – Empower offers investment management services, investments products and IRA accounts to consumers and as a roll-over option for employees rolling out of employer-sponsored defined contribution retirement plans. Empower earns asset-based fees from managed accounts and products, as well as and per account fees for providing administrative and recordkeeping services. For those accounts invested in mutual funds, Empower can be reimbursed by the mutual funds for marketing, sales, and service costs under various revenue sharing agreements.
Mutual funds and collective trusts – Empower earns administration fees under various revenue sharing agreements from mutual funds and collective trusts for marketing, sales, and service costs incurred while providing services to individuals and institutional clients on behalf of the funds. On proprietary collective trusts, Empower earns an asset-based management fee through Empower Trust Company.
The Company’s Other reporting segment is substantially comprised of insurance and risk solutions as well as corporate items not directly allocated to the other operating segments and interest expense on long-term debt. Prior to completion of the Protective Transaction in 2019, the Company’s Individual Markets segment distributed life insurance, annuity, and retirement products to both individuals and businesses through various distribution channels. Life insurance products in-force include participating and non-participating term life, whole life, universal life, and variable universal life. Following the close of the Protective Transaction, the Company wound down the Individual Markets segment and ceased producing or distributing new individual life insurance and annuity products. The Company retained a block of in-force life insurance and annuities, predominantly participating policies which are now administered by Protective. In 2023, the Company combined the remaining elements of the Individual Markets segment with other corporate and non-operating expenses into the Other segment within its audited financial statements.
Future Policy Benefit Liabilities and Life Insurance In-Force
The amount of fixed annuity products in-force is measured by future policy benefits. The following table shows group and individual annuity policy benefits supported by the Company’s general account net of ceded reinsurance, as well as the annuity balances in Workplace Solutions and legacy individual markets separate accounts for the years indicated:
| |
| General Account Annuity Benefits Liabilities | Workplace Solutions Annuity Separate Accounts | Individual Markets Annuity Separate Accounts |
| | | |
| | | |
| | | |
| | | |
| | | |
For Variable Annuities, the future policy benefit liabilities are computed on the basis of prescribed Statutory valuation interest rates and other assumptions as required by Statutory Valuation Law. For all other annuities policy benefit liabilities are established at the contract holder’s account value, which is equal to cumulative deposits and credited interest, less withdrawals, mortality and certain other charges.
The general account also has immediate annuities. The policy benefit liabilities for the immediate annuities are computed on the basis of prescribed Statutory valuation interest rates and mortality (where payouts are contingent on survivorship). These assumptions generally vary by plan, year of issue, and policy duration. Policy benefit liabilities for immediate annuities without life contingent payouts are computed on the basis prescribed Statutory valuation interest rates.
The following table summarizes legacy individual markets life insurance future policy benefits liabilities net of ceded reinsurance, life insurance separate account balances, and life insurance in-force net of ceded reinsurance for the years indicated:
| |
| Individual Markets Life Insurance Future Policy Benefits Liabilities | Individual Markets Life Insurance Separate Accounts | Individual Markets Life Insurance In-force |
| | | |
| | | |
| | | |
| | | |
| | | |
For both the individual markets life insurance future policy benefits liabilities and life insurance separate accounts, the future policy benefits are computed on the basis of prescribed Statutory valuation interest rates and mortality. These future policy benefits liabilities are calculated as the present value of future benefits (including dividends) less the present value of future net premiums, subject to a cash surrender value floor. The assumptions used in calculating the future policy benefits liabilities generally vary by plan, year of issue, and policy duration.
Additionally, for both the individual markets life insurance future policy benefits liabilities and life insurance separate accounts, policy and contract claim liabilities are established for claims that have been incurred but not reported based on factors derived from past experience.
The aforementioned policy benefit liabilities are computed amounts that, with additions from premiums and deposits to be received and with interest on such liabilities, are expected to be sufficient to meet the Company’s policy obligations (such as paying expected death or retirement benefits or surrender requests) and to generate profits.
Method of Distribution of Products Within the Empower and Individual Markets Segments
The Workplace Solutions and Personal Wealth segments distribute products to plan sponsors through the Company’s subsidiary, Empower Financial Services, Inc., as well as through brokers, consultants, advisors, third-party administrators, and banks. They also market IRAs as a distribution option for employees terminated from employer-sponsored defined contribution plans and
consumers, which includes a retail sales force. Recordkeeping and administrative services are sold directly through the Company’s sales force and distributed through advisors and institutional clients.
The Other segment does not produce or distribute new products.
Competition Within the Workplace Solutions and Personal Wealth Segments
The investment product, wealth management, and retirement services marketplaces are highly competitive. Empower’s competitors include insurance companies, banks, investment advisors, broker/dealers, mutual fund companies, and certain service and professional organizations. No individual competitor or small group of competitors is dominant. Competition focuses on name recognition, service, technology, cost, variety of investment options, investment performance, product features, and price, in addition to financial strength as indicated by ratings issued by nationally recognized agencies.
In 2024, the Company is continuing to focus on its core strategies: delivering financial security and wellness through the workplace, providing advice-centered wealth management, delivering strong investment and asset management and leveraging risk and capital management expertise. The Company intends to invest strategically to drive growth and productivity, while maintaining strong risk and expense discipline, to deliver sustainable long-term value to its customers and shareholders.
Workplace Solutions Segment
Workplace Solutions is positioned for significant growth opportunities with expertise and diversification across all plan types, company sizes and market segments. With its growth by acquisitions starting in 2020, Empower has added significant expertise, a broader set of capabilities and an expanded product portfolio. Empower continues to be firmly positioned as the second largest player in the U.S. retirement market with anticipated organic growth at one and a half to two time the industry. Empower also expects continued consolidation in the workplace retirement market and will assess acquisition opportunities as they emerge.
In 2024, Empower’s strategies to drive sales growth will continue to include active marketing of the Empower brand, investing in product differentiation and offering a best-in-class service model. In the first half of 2024, Empower anticipates the completion of the integration of the Prudential business acquired in 2022 resulting in additional cost synergies.
Empower remains focused on continuously improving the plan and participant experience. This includes continued investment in technology solutions to enhance the customer web experience including the Empower Personal Dashboard, adding innovative capabilities, and investing in artificial intelligence. These efforts are expected to increase customer retention and ultimately increase participant retirement savings.
In 2024, Empower Personal Wealth will continue to serve its existing customers and stimulate growth through a focus on advice and digital tools and continued active marketing of the Empower brand. It will continue to develop and offer a broad range of product solutions that leverage the Empower Personal Dashboard. Those products include individual retirement accounts and other retirement solutions, taxable solutions including brokerage account products, personalized financial advice and high net worth solutions. Management has identified key areas of focus for these initiatives to facilitate the object of organic growth, include continuing to invest in digital solutions to support advisors and customers and addressing its legacy of administration systems and processes to unlock the potential for future growth.
Effective June 1, 2019, all risks on non-participating policies issued by the Company below the retention limit of in-force reinsurance were ceded to Protective in the Protective Transaction. As a result, the Company is no longer actively pursuing reinsurance transactions in connection with its Individual Markets business. The Company retains a small block of in-force assumed reinsurance transactions with highly rated, well capitalized counterparties.
In connection with the MassMutual Transaction, the Company entered into an indemnity reinsurance transaction with MassMutual through which the Company assumed 100% of the risk associated with certain blocks of group insurance contracts issued by MassMutual. The acquired contracts are similar to contracts issued by the Company in the Empower segment.
In connection with the Prudential Transaction, the Company entered into an indemnity reinsurance transaction with The Prudential Insurance Company of America (“PICA”) through which the Company assumed 100% of the risk associated with
certain blocks of group insurance contracts issued by PICA. The acquired contracts are similar to contracts issued by the Company in the Empower segment.
On December 31, 2022, the Company and Hannover Life Reassurance Company of America (Bermuda) LTD (“Hannover”) entered into a coinsurance with funds withheld transaction in which the Company ceded a portion of its closed in-force block of participating whole life insurance policies and established a funds withheld payable to Hannover. The Company received a ceding commission and is eligible for experience refunds. The Company will receive expense allowances and will pay risk charges over time. The reinsurance agreement has an automatic experience refund termination date of January 1, 2035. The Company may recapture the ceded reinsurance policies at any time prior to the experience refund termination date, subject to certain fees payable to Hannover.
The Company’s investment division manages and administers the investments of its general and separate accounts in support of the cash and liquidity requirements of its insurance and investment products.
The Company’s principal general account investments are in bonds and mortgage loans, all of which are exposed to three primary sources of investment risk: credit, interest rate, and market valuation. Total cash and investments at December 31, 2023, of approximately $65 billion were comprised of general account investment assets of $42 billion and separate account assets of $23 billion. Total investments at December 31, 2022, of approximately $67 billion were comprised of general account investment assets of $44 billion and separate account assets of $23 billion.
The Company’s general account investments are in a broad range of asset classes, with a majority being domestic bonds. Bonds include public and privately placed corporate bonds, government bonds, and mortgage-backed and asset-backed securities. The Company’s mortgage loans are comprised primarily of domestic commercial collateralized loans diversified with regard to geographical markets and commercial mortgage property types.
The Company manages the characteristics of its investment assets, such as liquidity, currency, yield, and duration, to reflect the underlying characteristics of related insurance and policyholder liabilities that vary among its principal product lines. The Company observes strict asset and liability matching guidelines designed to ensure that the investment portfolio will appropriately meet the cash flow requirements of its liabilities. The Company uses derivative financial instruments for risk management purposes associated with certain invested assets and policy liabilities, not for speculative purposes.
The Company routinely monitors and evaluates the status of its investments in light of current economic conditions, trends in capital markets, and other factors. These other factors include investment size, quality, concentration by issuer and industry, and other diversification considerations relevant to the Company’s bonds.
The Company reduces credit risk for the portfolio as a whole by investing primarily in investment grade bonds. At December 31, 2023, and 2022, 98% and 98%, respectively, of the Company’s bond portfolio were designated as investment grade.
Empower Retirement, the Company’s wholly owned subsidiary, is the employer of all of the Company’s officers and associates. These employees provide services to the Company to manage and operate its business and the Company reimburses Empower Retirement for such services pursuant to an intercompany services agreement. As a result, at December 31, 2023, Empower Retirement had approximately 10,024 employees. At December 31, 2022, Empower Retirement had approximately 9,832 employees.
Diversity/Equity/Inclusion
We are empowered by our differences and believe doing the right thing means understanding, supporting and leveraging the inherent and acquired differences that make each of us unique and valuable. We foster an inclusive workforce and workplace with a diversity council that drives and champions our strategy; business resource groups that facilitate inclusion, collaboration, development of under-represented groups and support in our communities; education and awareness programs to help our associates understand how they can contribute to a culture of diversity, equity, inclusion and belonging; and a talent strategy aimed at attracting, developing and mentoring diverse talent. We also champion diversity, equity, inclusion and belonging in our industry and communities through thought leadership, social advocacy and volunteer efforts.
Talent Attraction/Development/Retention
We have a solid track record of supporting career growth and internal mobility. Associates are encouraged to own their career and take advantage of a variety of growth opportunities, including training and skill development, leadership development programs, mentorship programs, business resource group member and leader opportunities, as well as job advancement opportunities. Investing in our talent throughout all career stages is critical to attracting and retaining talent, and to our success.
The Company owns an 882,000 square foot complex located in Greenwood Village, Colorado, which is occupied by all of the Company’s segments. The Company also leases or licenses approximately 309,234 square feet of sales and administrative offices throughout the United States. Management believes that the Company’s properties are suitable and adequate for its current and anticipated business operations.
Legal Proceedings Involving the Company
From time to time, the Company may be threatened with, or named as a defendant in, lawsuits, arbitrations, and administrative claims. Any such claims that are decided against the Company could harm the Company’s business. The Company is also subject to periodic regulatory audits and inspections which could result in fines or other disciplinary actions. Unfavorable outcomes in such matters may result in a material impact on the Company’s financial position, results of operations, or cash flows.
The Company and certain of its subsidiaries are defendants in legal actions, including class actions, relating to the costs and features of their retirement and fund products and the conduct of their businesses. Management believes the claims are without merit and will be vigorously defending these actions. Based on the information presently known, these actions will not have a material adverse effect on the consolidated financial position of the Company.
The Company is involved in other various legal proceedings that arise in the ordinary course of its business. In the opinion of management, after consultation with counsel, the likelihood of loss from the resolution of these proceedings is remote and/or the estimated loss is not expected to have a material effect on the Company’s consolidated financial position, results of its operations, or cash flows.
Directors and Executive Officers of the Company
Identification of Directors
| | | Principal Occupation(s) for Last Five Years |
| | | Chief Executive Officer of Emnovate |
| | | |
| | | Deputy Chairman, Power Corporation and Power Financial Corporation; previously President and Co-Chief Executive Officer, Power Corporation until February 2020 |
Paul Desmarais, Jr.(1)(4)(6) | | | Chairman, Power Corporation and Power Financial Corporation; previously Co- Chief Executive Officer, Power Corporation until February 2020 |
| | | Senior Business Advisor, Dentons Canada LLP |
| | | Chief Executive Officer, Rockefeller Capital Management |
| | | Executive Vice President, Power Corporation; previously Executive Vice President, Power Financial Corporation until March 2020 |
| | | |
| | | Corporate Director; Advisory Director, Goldman Sachs |
| | | President and Chief Executive Officer, Lifeco and CLAC |
| | | President and Chief Executive Officer of the Company |
| | | Chairman of the Board of the Company; Chairman of the Board of Lifeco and CLAC; President and Chief Executive Officer, Power Corporation since February 2020; President and Chief Executive Officer, Power Financial Corporation |
| | | Corporate Directors; previously President and Chief Executive Officer of Putnam Investments, LLC until December 2023 |
T. Timothy Ryan, Jr.(4)(5) | | | |
| | | President, Better Mortgage Corporation |
| | | Group Vice President and Chief Investment Officer, JM Family Enterprises, Inc. since December 2020; previously Chief Investment Officer, Illinois Municipal Retirement Fund |
| | | Executive Vice President and Chief Financial Officer, Power Corporation and Power Financial Corporation |
| | | Principal and Chief Advisor, Titan Advisors, LLC; previously Principal and Chief Strategist until March 2023 |
(1) Member of the Investment Committee.
(2) Member of the Audit Committee.
(3) Member of the Conduct Review Committee.
(4) Member of the Nominating Committee.
(5) Member of the Risk Committee.
(6) Mr. André Desmarais is the uncle of Mr. Paul Desmarais III.
Unless otherwise indicated, all of the directors have been engaged for not less than five years in their present principal occupations or in another executive capacity with the companies or firms identified.
The appointments of directors are confirmed annually.
The following is a list of directorships currently held or formerly held within the five previous years by the directors of the Company, on companies whose securities are traded publicly in the United States or that are investment companies registered under the Investment Company Act of 1940.
| | Former Directorships and Dates |
| | Mitsubishi UFJ Financial Group July 2018– December 2022 |
| Brookfield Asset Management Inc. | Enbridge Inc. August 2014– November 2021 |
| | |
| KKR Real Estate Finance Trust Tradeweb Markets | Motive Capital Corp II through June 2023 |
| PanAgora Asset Management, Inc. | |
| Better Mortgage Corporation | |
| Santander Holdings USA, Inc. | |
| PanAgora Asset Management, Inc. | |
The Company’s Nominating Committee (the “Nominating Committee”) is charged with recommending to the Board of Directors the qualifications for Directors, including among other things, the competencies, skills, experience and level of commitment required to fulfill Board responsibilities and the personal qualities that should be sought in candidates for Board membership. The Nominating Committee’s duties include identifying and recommending Director candidates to the Board based on a consideration of the competencies and skills that the Board considers appropriate for the Board as a whole to possess, the competencies and skills that the Board considers each existing Director to possess and that each new nominee will bring to the Board, and the appropriate level of representation on the Board by Directors who are independent of management and who are neither officers nor employees of any of the Company’s affiliates.
The Board of Directors has reviewed the qualifications and backgrounds of the members of the Audit Committee and determined that, although no one member of the Audit Committee is an “audit committee financial expert” within the meaning of the Rules under the Securities Exchange Act of 1934, the combined qualifications and experience of the members of the Audit Committee give the Committee collectively the financial expertise necessary to discharge its responsibilities.
The Company’s Directors are elected on an annual basis by the Company’s sole shareholder, Empower Holdings, LLC.
The Company’s Directors are identified below along with an indication of their experience, qualifications, attributes and skills, which leads the Company to believe that they are qualified to serve on the Board of Directors.
Ms. Bienfait is Chief Executive Officer of Emnovate, an executive advisory firm delivering enterprise-class services to emerging businesses, a position she has held since 2017, and is the founder of Atlanta Tech Park, a global technology accelerator. She previously served as Executive Vice-President and Chief Enterprise Innovation Officer at Samsung Electronics from 2014 to 2017 and, prior to that, she was Chief Information Officer at BlackBerry from 2007 to 2014. Ms. Bienfait is a director of Lifeco and CLAC, and a former director of Putnam Investments, LLC (“Putnam”) through December, 2023. She is also a director and Chair of the board of Global Aviation and a trustee of the Georgia Institute of Technology Industry Applied Research Corporation, a director of Quantum Valley Ideas Lab and a director of the Atlanta Chapter of the National Association of Corporate Directors. She previously served as an independent director and Chair of the Nominating and Governance Committee for Mitsubishi UFJ Financial Group, Inc. from July 2018 to December 2022, and as a member of the Cisco Strategic Advisory Board and the Hewlett-Packard Advisory Board. Ms. Bienfait holds a Masters in Technology Management from the Georgia Institute of Technology and a bachelor’s degree in engineering from Central Missouri State University.
Mr. Coutu, Corporate Director, is the former Chairman of Syncrude Canada Ltd., a Canadian oil sands project and is past President and Chief Executive Officer of Canadian Oil Sands Limited an oil and gas company. He was previously Senior Vice-President and Chief Financial Officer of Gulf Canada Resources Limited, and prior to that held various positions in the areas of corporate finance, investment banking, and mining and oil and gas exploration and development. Mr. Coutu is a director of Lifeco and CLAC, and a former director of Putnam through December, 2023. He is also a director of Power Corporation, IGM, IG Wealth Management, Mackenzie Inc., Brookfield Asset Management Ltd. and the Calgary Stampede Foundation Board. He has also held board positions with Enbridge, Inc., Brookfield Corporation, Gulf Indonesia Resources Limited, the Calgary Exhibition and Stampede and the board of governors of the Canadian Association of Petroleum Producers. Mr. Coutu is a former member of the Association of Professional Engineers, Geologists and Geophysicists of Alberta.
André Desmarais
Mr. Desmarais is Deputy Chairman of Power Corporation and of Power Financial. He previously served as President and Co-Chief Executive Officer of Power Corporation from 1996 until his retirement in February, 2020. He also served as Executive Co-Chairman of Power Financial until 2020. Prior to joining Power Corporation in 1983, he was Special Assistant to the Minister of Justice of Canada and an institutional investment counselor at Richardson Greenshields Securities Ltd. Mr. Desmarais has held a number of senior positions with Power group companies and is a director of many Power group companies in North America, including Power Corporation, Power Financial, Lifeco, CLAC, IGM, IG Wealth Management and Mackenzie. He is also a director of Rockefeller Capital Management General Partner L.L.C. since 2023, and was a former director of Putnam through December, 2023. Mr. Desmarais is Honorary Chairman of the Canada China Business Council and is a member of several China-based organizations. Mr. Desmarais is active in cultural, health and other not-for-profit organizations. He is an Officer of the Order of Canada and an Officer of the National Order of Québec. He has received honorary doctorates from Concordia University, Université de Montréal and McGill University. In May 2022, Mr. Desmarais was inducted into the Order of the Canadian Business Hall of Fame. Mr. Desmarais is a trustee of the Desmarais Family Residuary Trust.
Mr. Desmarais is Senior Vice President of Power Corporation. He also serves as Chairman and CEO of Sagard, an alternative asset management firm active in venture capital, private equity, private credit, real estate, healthcare royalties and private wealth. Within the Sagard ecosystem, Mr. Desmarais is the Executive Chairman and Co-Founder of Portage Ventures and the Chairman and Co-Founder of Diagram. Within the investment portfolios, he is the Chairman of Wealthsimple, Dialogue and Novisto, the Executive Chairman of Grayhawk, and a director of Nesto. Mr. Desmarais is dedicated to helping build a better business world. He is Co-Founder of the Black Wealth Club and the Indigenous Leadership Circle, where emerging Black and Indigenous leaders go to learn about creating wealth and networks giving them tools and resources that can be reinvested in their communities. Under Mr. Desmarais’ leadership, Sagard has committed to a more sustainable financial system by becoming a signatory of the United Nations Principles for Responsible Investment, enlisting as a CREO participant, and embarking on its journey to carbon neutrality. Paul was also co-chair of the Centraide (United Way) campaign in 2022 and will chair the large donors campaign for the same organization in 2024-2027. Prior to his current role, Mr. Desmarais worked at Goldman Sachs in the Investment Banking Division, Investment Strategy Group and Special Situations Group, Imerys S.A. in supply management and strategy and at Lifeco in risk management. He has earned a B.A. in Economics from Harvard College and holds an MBA from INSEAD. In 2017, he was recognized as one of the Top 40 Under 40 in Canada.
Mr. Doer is a Senior Business Advisor at Dentons Canada LLP, a global law firm, a position he has held since August, 2016. He previously served as Canada’s Ambassador to the United States from October, 2009 to January, 2016. Mr. Doer was the Premier of Manitoba from 1999 to 2009, and served in a number of positions as a member of the Legislative Assembly of Manitoba from 1986 to 2009. In 2005, as Premier, he was named by Business Week magazine as one of the top 20 international leaders on climate change. Mr. Doer is a director of Lifeco and CLAC, and a former director of Putnam through December, 2023. He is also a director of Power Corporation, Power Financial, IGM, IG Wealth Management, Mackenzie and Air Canada. Mr. Doer is a member of the Canadian American Business Council Advisory Board and a director of The Climate Group Inc. In 2017, Mr. Doer joined the Trilateral Commission as a member of the North American Group. He is a volunteer Co-Chair of the Wilson Centre’s Canada Institute, a non-partisan public policy forum focused on Canada-U.S. relations. Mr. Doer received a distinguished diplomatic service award from the World Affairs Council in 2011 and was inducted into the Order of Manitoba in 2010. In 2010, Mr. Doer received an Honorary Doctorate from the University of Winnipeg and, in 2011, he received an Honorary Law Degree from the University of Manitoba. Mr. Doer is a trustee of the Desmarais Family Residuary Trust.
Gregory J. Fleming is the founding Chief Executive Officer of Rockefeller Capital Management. He has spent more than 30 years in the financial services industry and has developed a track record of transforming businesses, engendering trust among institutional and individual clients and creating value for colleagues and shareholders. In March 2018, Mr. Fleming became the CEO of Rockefeller Capital Management, a firm that combines wealth management, family office, asset management and strategic advisory. The firm arose from the March 2018 acquisition of the former Rockefeller & Co. Mr. Fleming is a shareholder and member of the Board of Directors of Rockefeller Capital Management. Prior to leading Rockefeller Capital Management, Mr. Fleming was the President of Morgan Stanley Wealth Management and Morgan Stanley Investment Management. He joined Morgan Stanley in 2010 and served in these roles for 6 years. During that time, he oversaw the transformation of both businesses. Before joining Morgan Stanley, Mr. Fleming served as President and Chief Operating Officer of Merrill Lynch and before that ran Merrill Lynch’s Global Investment Banking business. Before joining Merrill Lynch as an investment banker in 1992, Mr. Fleming
was a principal at Booz Allen Hamilton. Mr. Fleming is a former director of Colgate University; a member of the Board of Advisors for the Yale Law School Center for the Study of Corporate Law, the Council on Foreign Relations and the Economic Club of New York; a trustee at Deerfield Academy; a member of the Ronald McDonald House Board of Directors; an Advisory Director on the board of the Florida Marlins; a member of the Turn2 Resource Council; and a member of the Advisory Board of COVR, an innovative financial services startup. He frequently serves as a Visiting Lecturer in Law at Yale Law School. He is a Phi Beta Kappa, summa cum laude graduate in economics from Colgate University and received his J.D. from Yale Law School. Mr. Fleming was also a director of Putnam through December, 2023. Mr. Fleming is a trustee of the Desmarais Family Residuary Trust.
Mr. Généreux is Executive Vice-President of Power Corporation, a position he has held since March, 2015. He was Executive Vice-President of Power Financial from March, 2015 until March, 2020. He is Senior Partner Emeritus of McKinsey & Company (“McKinsey”), a global management consulting firm. During his 28 years at McKinsey, Mr. Généreux focused on serving leading global companies in financial services, resources and energy. He held various leadership positions including Global Sector Leadership in energy, Office Leadership in Montreal, Global Personal Committees for partner election and evaluation, and Global Recruiting for Advanced University Degrees candidates. He has been posted in Montreal, Paris, Toronto and Stockholm. Mr. Généreux is a director of Lifeco and CLAC, and a former director of Putnam through December, 2023. He is also a director of IGM, IG Wealth Management, Mackenzie and Group Bruxelles Lambert. Mr. Généreux is Governor Emeritus of the Board of Governors at McGill University, on which he served between 2010 and 2023. He is a Board member of the Sauvé Foundation and the Rhodes Scholarships in Canada. Mr. Généreux has received the Queen Elizabeth II Golden Jubilee Medal for outstanding and exemplary contributions to his community. He graduated from McGill University and Oxford University, where he studied as a Rhodes Scholar.
After receiving an MBA from Columbia University, and a masters in Economics and Political Sciences from the Paris University, Mr. Louvel began his professional career in 1970 as an advisor to the Department of Industry and Trade of the Quebec Government. In 1972, he joined Bank Paribas (“Paribas”) and for the next 33 years held various executive positions with Paribas in France, Canada and the United States. He completed his banking career as the Head of Risk Management for the Americas of BNP Paribas, with overall responsibilities over credit, market, counterparty and operational risk. Mr. Louvel serves as a Director of Mountain Asset Management and was a former director of Putnam through December 2023. He is also an Honorary Trustee of the French Institute Alliance Francaise and a French Foreign Trade Counselor. Mr. Louvel is a permanent resident of the United States with dual French and Canadian citizenship.
Ms. Madoff, Corporate Director, is an Advisor to The Goldman Sachs Group, a global investment banking, securities and investment management firm. She has spent 30 years at Goldman Sachs where she was a Partner leading Interest Rate Products and Mortgage businesses until her retirement from that role in August, 2017. Ms. Madoff held additional leadership positions at Goldman Sachs including Co-Chair of the Retirement Committee overseeing 401k and pension plan assets, Chief Executive Officer of Goldman Sachs Mitsui Marine Derivatives Products, L.P., and was a member of its Securities Division Operating Committee and Firmwide New Activity Committee. She brings experience in global markets, risk management and capital markets activities. Ms. Madoff is a director of Power Corporation, Lifeco and CLAC, and a former director of Putnam through December, 2023. She also serves as a director of Tradeweb Markets Inc., KKR Real Estate Finance Trust Inc., Beacon Platform Inc., Santander Holdings USA, Inc. and Santander Bank, N.A. She previously served as a director of Motive Capital Corp I and II, and ICE Benchmark Administration, where she was also Chair of the ICE LIBOR Oversight Committee. Ms. Madoff is a David Rockefeller Fellow, an Executive Committee member and Vice President of the Harvard Business School Alumni Board, and a member of the Harvard Kennedy School Woman and Public Policy Women’s Leadership Board. She received a Master’s degree in Business Administration from Harvard Business School and a Bachelor of Arts degree in Economics from Lafayette College.
Mr. Mahon is President and Chief Executive Officer of Lifeco and CLAC, positions he has held since May, 2013. Prior to that he was President and Chief Operating Officer, Canada of Lifeco and CLAC. Mr. Mahon has been with CLAC since 1986, and is a director of Lifeco, CLAC and Empower Holdings. He is also a member of the Board of Directors of the Canadian Life and Health Insurance Association and the Misericordia Health Centre Corporation as well as a member of the Business Council of Canada and the United Way Resource Development Committee. Mr. Mahon previously served as a director of the CancerCare Manitoba Foundation.
Edmund F. Murphy III
Mr. Murphy is President and Chief Executive Officer of the Company, a leading provider of financial services for consumers including retirement services, wealth management, advice and asset management. He is a strategic advisor to Diagram Ventures. Mr. Murphy brings 30 years of broad leadership experience to his role. He was appointed as the inaugural President of Empower upon its formation in 2014 and has led the organization through a period of strong and sustained growth, positioning the firm as the go-to provider of financial services for more than 17 million investors. Under his leadership, Empower has grown into a national leader serving working Americans across all sectors of the U.S. Economy and across the spectrum of wealth segments. Empower has completed several strategic acquisitions, including the retirement businesses of J.P. Morgan, Prudential, MassMutual, Truist Bank and Fifth Third Bank. In 2020, Empower acquired Personal Capital Corporation, a registered investment adviser and wealth manager. Empower has assets under administration of more than $1.2 trillion and serves some 71,000 corporate, government and not-for-profit plans. A much sought-after thought leader as an advocate for investors and the defined contribution system, Mr. Murphy is regarded as a driving force for industry innovation and public policy reform. Mr. Murphy meets regularly with policymakers in Washington, D.C. and has testified before Congress, the Department of Labor, the Treasury Department and the Internal Revenue Service. He speaks and writes on financial topics ranging from retirement issues and public policy to investment advice and lifetime income strategies. He has been interviewed by CNBC, Bloomberg News, Market Watch, The Wall Street Journal, Barron’s, The Financial Times and many other media outlets. Before his appointment as Chief Executive Officer of Empower, Mr. Murphy served as Managing Director at Putnam and was a member of the firm’s operating committee. Prior to Putnam, Mr. Murphy held executive leadership roles at Fidelity Investments in its institutional, private equity and retail businesses. During his time at Fidelity Investments he also served as CEO of Veritude, LLC and as a board member of several Fidelity-owned businesses. He spent the early portion of his career at Merrill Lynch. Mr. Murphy is a board member of the Employee Benefit Research Institute, Boston College Wall Street Council, the New England Council, Colorado Inclusive Economy, and the American Enterprise Institute (AEI) National Council and a member of the Wall Street Journal CEO Council. He is active in supporting numerous not-for-profit and charitable causes, including The Ireland Funds, Boston Healthcare for the Homeless, the Dana-Farber Cancer Institute and Cristo Rey High School in Boston, where he serves on the board. Mr. Murphy holds a bachelor’s degree from Boston College and is a graduate of the General Manager Program at Harvard Business School.
Mr. Orr has been Chair of the Boards of Lifeco and CLAC since May, 2013, of the Company since July, 2013 and of Empower Holdings since June, 2008. He is also President and Chief Executive Officer of Power Corporation and Power Financial, positions he has held since February, 2020 and May, 2005 respectively. From May, 2001 until May, 2005, Mr. Orr was President and Chief Executive Officer of IGM. Prior to joining IGM, he was Chairman and Chief Executive Officer of BMO Nesbitt Burns Inc. and Vice-Chairman, Investment Banking Group, Bank of Montreal. Mr. Orr is a director of CLAC, Empower Holdings and PanAgora Asset Management, Inc. He is also a director and Chair of IGM, IG Wealth Management and Mackenzie, and a director of Power Corporation and Power Financial. Mr. Orr is active in a number of community and business organizations.
Mr. Reynolds served as President and Chief Executive Officer of the Company from May 2014 through January 2019. He served as President and Chief Executive Officer of Putnam from 2008 through December 2023 and was a director of Putnam through December, 2023. Respected as an industry statesman, Mr. Reynolds is regarded as a driving force of innovation and progress in institutional and retail financial services. Mr. Reynolds is a director and the Chair of Great-West Lifeco U.S. LLC, one of the nation’s top providers of retirement savings products and services, life insurance, annuities, and executive benefits products. Prior to joining Putnam in 2008, he was Vice Chairman and Chief Operating Officer of Fidelity Investments. Mr. Reynolds’ accomplishments have earned multiple industry honors over time. He was named Fund Leader of the Year at the Mutual Fund Industry Awards in 2010 for the strategic improvements he initiated at Putnam. The following year, under the leadership of Mr. Reynolds, Putnam was honored as Retirement Leader of the Year for initiatives and innovative solutions in the workplace savings arena. Mr. Reynolds has also received a Lifetime Achievement Award from PLANSPONSOR magazine for popularizing employer-sponsored 401(k) plans. Mr. Reynolds serves as a Director on several not-for-profit boards, including the Concord Museum, the Dana-Farber Cancer Institute, and the U.S. Ski & Snowboard Foundation. Additionally, he serves as Chair of the Boston Advisory Board of the American Ireland Fund and National Council Co-Chair of the American Enterprise Institute. Mr. Reynolds is a Member of the U.S. Chamber of Commerce, Center for Capital Markets Competitiveness; Chair of the Massachusetts High Technology Council; Member of the Chief Executives Club of Boston; Member of the Massachusetts General Hospital President’s Council; Chairman of the Board of Directors of the Ron Burton Training Village; Director and former Chair of the Massachusetts Competitive Partnership; former Chair of the West Virginia University Foundation; and former Executive Committee Member of the Greater Boston Chamber of Commerce. Mr. Reynolds earned a B.S. in Business Administration, Finance from West Virginia University where he also received an Honorary Doctorate in Business Administration and a
Distinguished Alumni Award. In addition, Mr. Reynolds is a recipient of the Boston College President’s Medal of Excellence, an honorary Doctor of Commercial Science degree from Bentley University and the Manhattan College De La Salle Medal.
Mr. Ryan, Corporate Director, served as Vice-Chairman of Regulatory Affairs at JPMorgan Chase (“JPMorgan”), a global financial services firm, from 2013 to 2014. Prior to joining JPMorgan, he was President and Chief Executive Officer of the Securities and Financial Markets Association from 2008 to 2013. He is a director of Lifeco, CLAC, Power Corporation and Power Financial, and a former director of Putnam through December, 2023. Mr. Ryan is also non-executive Chairman of the Board of Directors of Santander Holdings USA, Inc., Santander Bank, N.A. and Banco Santander International. He previously served as a Director of Markit Ltd. and Lloyds Banking Group plc. He was a private sector member of the Global Markets Advisory Committee for the National Intelligence Council from 2007 to 2011. Mr. Ryan is a graduate of Villanova University and the American University Law School and was an officer in the US Army from 1967 to 1970.
Mr. Selitto is the President of Better Mortgage Corporation (previously Avex Funding Corporation), a technology focused mortgage lender, a position he has held since April, 2015. Mr. Selitto served as a director and as President and Chief Executive Officer of PHH Corporation (“PHH”), a provider of mortgage lending and servicing solutions, from October, 2009 to January, 2012. Prior to joining PHH, Mr. Selitto worked at Ellie Mae, Inc. (“Ellie Mae”), a provider of enterprise solutions for the residential mortgage industry. While at Ellie Mae, Mr. Selitto initially served as a senior consultant beginning in 2007 and, later in 2007 through 2009, as Executive Vice-President, Lender Division. He has over 40 years of experience in the mortgage industry and in capital markets. Mr. Selitto is a former director of Lifeco, and CLAC through May, 2020, and a former director of Putnam through December, 2023. He holds a Bachelor of Science degree in Economics and Marketing from the University of South Florida.
Ms. Shah is Group Vice President and Chief Investment Officer of JM Family Enterprises, Inc., a privately held diversified company, a position she has held since December 2020. Between December 2011 and December 2020, she served as Chief Investment Officer of the Illinois Municipal Retirement Fund, and, prior to that, she worked at the New York State Teachers’ Retirement System, Bank of America and the Northwestern University Investment Office. Ms. Shah is a director of CLAC and Lifeco. She is a member of The Robert Toigo Foundation Board, the Pension Real Estate Association Foundation Board and the Pension Real Estate Association Board. Ms. Shah received a Bachelor’s Degree in Business Administration, Magna Cum Laude, from Loyola University and a Master’s Degree in Business Administration from The University of Chicago Booth School of Business. She is a member of the CFA Institute and the CFA Society Chicago.
Mr. Tretiak served as Executive Vice-President and Chief Financial Officer of Power Corporation and Power Financial from May, 2012 through February, 2024. From 1988 to May, 2012, he held various positions with IGM and IG Wealth Management, most recently the position of Executive Vice President and Chief Financial Officer of IGM from April, 1999 to May, 2012. Mr. Tretiak is a director of CLAC and PanAgora Asset Management, Inc, and was a former director of Lifeco through April, 2024 and of Putnam through December, 2023. He also serves as a director of IGM, IG Wealth Management and Mackenzie. He holds a Bachelor of Arts in Economics and Political Science from the University of Winnipeg and is a Chartered Professional Accountant, a Fellow of the Chartered Professional Accountants and a Certified Financial Planner. Throughout his career, Mr. Tretiak has been active in professional industry groups and associations including the Chartered Professional Accountants, Financial Executives International, the Certified Financial Planners, the Institute of Internal Auditors, the Investment Funds Institute of Canada and the Canadian Chamber of Commerce Economic and Taxation Committee.
Mr. Walsh is Principal and Senior Advisor at Titan Advisors LLC (“Titan”), an asset management firm. From July, 2015 to March, 2023, he was Principal and Chief Strategist at Titan. Prior to that, Mr. Walsh was Chairman and Chief Investment Officer of Saguenay Strathmore Capital, LLC, a money management and investment advisory company, a position that he held from September, 2011 to June, 2015. He was previously Managing Partner of Saguenay Capital, LLC from January, 2001 to September, 2011. Mr. Walsh has over 30 years of investment banking, international capital markets and investment management experience. He had a long career at Bankers Trust culminating in his appointment as Co-head of Global Investment Banking and as a member of the Management Committee. Mr. Walsh is a Director of Lifeco, CLAC and Sagard Holdings Inc., and a former director of
Putnam through December, 2023. He also serves on the International Advisory Board of École des Hautes Études Commerciales of Montréal. Mr. Walsh holds a Master’s in Business Administration and Bachelor of Arts degree from Queen’s University.
Compensation of Company Directors for 2023
The Company compensates Directors who are not also Directors of Lifeco or Canada Life (“Company Directors”). The following sets out compensation earned in 2022 by the Company Directors.
| Fees Earned or Paid in Cash | | | |
| | | | |
| | | | |
| | | | |
| | | | |
| | | | |
| | | | |
| | | | |
(1) Mr. Bernbach retired as a Company Director effective December 29, 2023. As a result, his fees earned as a Company Director were pro-rated for 2023.
(2) Messrs. Bernbach, Fleming, Louvel, Murphy, Reynolds and Selitto elected to receive this portion of their compensation for serving as directors in cash.
(3) For Messrs. Bernbach, Carney, Fleming, Louvel, Murphy, Reynolds and Selitto, these amounts represent the value of Deferred Share Units granted under the mandatory component of the DSUP. See the Narrative Description of Company Director Compensation below for additional information regarding the DSUP. The value of these Deferred Share Units is the aggregate grant date fair value. As of December 31, 2023, Mr. Bernbach held 63,159 Deferred Share Units, Mr. Fleming held 28,356 Deferred Share Units, Mr. Louvel held 62,849 Deferred Share Units, Mr. Murphy held 18,175 Deferred Share Units, Mr. Reynolds held 34,607 Deferred Share Units and Mr. Selitto held 50,074 Deferred Share Units.
(4) These amounts are life insurance premiums paid under the Great-West Life Director’s Group Life Insurance Plan. Payments are made in Canadian dollars and have been translated to U.S. dollars at 1.00USD/1.36CAD for 2023 (the “Conversion Rate”).
(5) Mr. Desmarais receives director’s fees paid in cash from the Company, however, Lifeco retains the liability for his DSUP compensation. He was elected as a Company Director effective July 25, 2023, and as a result his fees earned as a Company Director were pro-rated for 2023.
2. Narrative Description of Company Director Compensation
The Company pays Company Directors who are not also directors of Great-West Lifeco Inc. an annual retainer fee of $175,000. In addition, Company Directors receive annual retainer fees for serving as a member or the chairperson of certain committees of the Board. The following tables show the additional annual retainer fees paid for service on committees:
The following sums are paid per annum to the Chairperson of each of the following committees:
The following sums are paid per annum to members of each of the following committees:
(1)
The Human Resources Committee is a committee of the Company’s wholly-owned subsidiary, Empower Retirement. As described below in “Executive Officer Compensation”, the Human Resources Committee remains responsible for determining the compensation of the executive officers of the Company. All compensation paid to the members of the Human Resources Committee both prior to and after the transition is reported herein.
In order to promote greater alignment of interests between the Company Directors and shareholders, the Company has implemented a Director Deferred Share Unit Plan, or DSUP, pursuant to which Company Directors are required to receive $87,500 of their annual retainer fee in Deferred Share Units. Under the voluntary portion of the DSUP, each Company Director may elect to receive the balance of his or her annual retainer, as well as committee retainer fees, entirely in form the of Deferred Share Units, entirely in cash, or equally in cash and Deferred Share Units.
Under both the mandatory and voluntary components of the DSUP, the number of Deferred Share Units granted is determined by dividing the amount of remuneration payable to the Company Director by the volume-weighted average Canadian dollar trading price per Lifeco common share on the Toronto Stock Exchange for the last five trading days of the fiscal quarter (such volume-weighted average trading price being the “value of a Deferred Share Unit”) prior to the award grant date. Directors receive additional Deferred Share Units in respect of dividends payable on the Lifeco common shares based on the value of a Deferred Share Unit at that time. Deferred Share Units are redeemable at the time that an individual ceases to be a Director by a lump sum cash payment, based on the value of the Deferred Share Units on the date of redemption.
Identification of Executive Officers
| | | Principal Occupation(s) for Last Five Years |
Edmund F. Murphy III President and Chief Executive Officer | | | President and Chief Executive Officer of the Company |
Christine M. Moritz Executive Vice President and Chief Financial Officer | | | Executive Vice President and Chief Financial Officer of the Company as of June of 2023; previously Senior Vice President and Chief Financial Officer, Empower |
Richard H. Linton Jr. President and Chief Operating Officer, Empower | | | President and Chief Operating Officer |
Carol E. Waddell President, Empower Personal Wealth | | | President, Empower Personal Wealth as of January 2023; previously Executive Vice President, Retirement Solutions |
Carol J. Kline Executive Vice President and Chief Information Officer | | | Executive Vice President and Chief Information Officer as of February 2022, Chief Information Officer since October 2019 |
Unless otherwise indicated, all of the executive officers have been engaged for not less than five years in their present principal occupations or in another executive capacity with the companies or firms identified.
The appointments of executive officers are confirmed annually.
The Company has adopted a Code of Conduct (the “Code”) that is applicable to its senior financial officers, as well as to other officers and employees. All of the items identified as elements of a “code of ethics” as defined in SEC regulations adopted pursuant to the Sarbanes-Oxley Act of 2002 are substantively covered by the Code. A copy of the Code is available without charge upon written request to Empower Annuity Insurance Company of America, ATTN: Chief Compliance Officer, 8525 East Orchard Road, Greenwood Village, Colorado 80111.
Executive Officer Compensation
Compensation Discussion and Analysis
1. Overview and Objectives of the Company’s Executive Compensation Program
This section provides an overview and describes the objectives of the Company’s compensation program for executives, including the Chief Executive Officer, the current Chief Financial Officer, the former Chief Financial Officer, and the three other most highly compensated executive officers of the Company during 2023 (the “Named Executive Officers”).
The executive compensation program adopted by the Company and applied to the Named Executive Officers has been designed to:
•support the Company’s objective of generating value for shareholders and policyholders over the long term;
•attract, retain and reward qualified and experienced executives who will contribute to the success of the Company;
•motivate executive officers to meet annual corporate, divisional, and individual performance goals;
•promote the achievement of goals in a manner consistent with the Company’s Code of Conduct; and
•align with regulatory requirements.
More specifically, the executive compensation program rewards:
•excellence in developing and executing strategies that will produce significant value for shareholders and policyholders over the long term;
•management vision and an entrepreneurial approach;
•quality of decision-making;
•record of performance over the long term; and
•initiating and implementing transactions and activities that create shareholder and policyholder value.
All of the Named Executive Officers are employees of Empower Retirement and receive their compensation from Empower Retirement. The Human Resources Committee of the Board of Directors of Empower Retirement (the “Human Resources Committee”) operates under a charter and is responsible for overseeing the executive compensation program. The Human Resources Committee recognizes the importance of executive compensation decisions and is committed to awarding compensation that reflects leadership’s ability to deliver on the Company’s strategic goals and to drive strong performance and sustainable value for shareholders and policyholders.
In designing and administering the individual elements of the executive compensation program, the Human Resources Committee strives to balance short-term and long-term incentive objectives and to apply prudent judgment in establishing performance criteria, evaluating performance, and determining actual incentive awards. The total compensation of each Named Executive Officer is reviewed by the Human Resources Committee from time to time for market competitiveness, and reflects each Named Executive Officer’s job responsibilities, experience and performance.
The executive compensation programs consist of four primary components:
• annual incentive bonus;
The primary role of each of these components is presented in the table below:
| Reflect skills, competencies, experience and performance of the Named Executive Officers |
| Reflect performance for the year |
| More closely align the longer-term interests of the Named Executive Officers with the interests of the Company ownership |
| Provide for appropriate replacement income upon retirement based on years of service with the Company |
Base salary, annual incentive bonus, share units and retirement benefits for the Named Executive Officers are determined by the Human Resources Committee.
The President and Chief Executive Officer, while not a member of the Human Resources Committee, participates in the compensation setting process for our other executive officers, including some of the other Named Executive Officers, by evaluating individual performance, establishing individual performance targets and objectives, and recommending salary levels for such other executive officers.
Base salaries for the Named Executive Officers are set annually, taking into account the individual’s job responsibilities, skills, competencies, experience and performance, as well as market conditions. In addition, salaries may also take into consideration market data gathered by Empower Retirement or by external compensation consultants. Empower Retirement gathers market data in relation to the U.S. financial services industry, including data from the public disclosures of Empower Retirement’s peer companies, which is used to benchmark target compensation for the Named Executive Officers.
(a) Annual Incentive Bonus Plan
To relate the compensation of the Named Executive Officers to the performance of Empower, an annual incentive bonus plan (the “Annual Incentive Bonus Plan”) is provided. Target objectives are set annually and may include earnings, expense or sales targets of Empower and/or a business unit of Empower or specific individual objectives related to strategic initiatives.
See the tables presented below for information on the participation of the Named Executive Officers in the Annual Incentive Bonus Plan and a further description of the terms of the Annual Incentive Bonus Plan.
From time to time, special bonuses may be provided related to significant projects such as acquisitions or dispositions or for sign-on or retention purposes.
To provide a longer-term component to the executive compensation program, the Named Executive Officers participate in the Unit Plan for Senior Executives of Empower Retirement (the “Executive Share Unit Plan”).
The Human Resources Committee is responsible for the granting of share units to participants under the Executive Share Unit Plan. Share Units are not granted based on the timing of the disclosure of non-public material information with respect to Lifeco or the Company.
The Human Resources Committee typically considers and approves grants under the Executive Share Unit Plan on an annual basis. Officers’ base salaries and career levels are taken into account when new share unit grants are considered, as well as past performance and expectations regarding future contributions to the organization. The granting of share units is subject to the terms and conditions contained in the Executive Share Unit Plan and any additional terms and conditions fixed by the Human Resources Committee at the time of the grant.
See the tables presented below for information on the participation of the Named Executive Officers in the Executive Share Unit Plan and a further description of the terms of the Executive Share Unit Plan.
All employees, including the Named Executive Officers, may participate in Empower’s qualified defined contribution 401(k) Plan (the “401(k) Plan”). In 2023, employees who participate in the 401(k) Plan may make contributions of between 1% and 90% of base salary and annual bonus (collectively “Salary”), subject to applicable IRS limits. All new employees are automatically enrolled in the 401(k) Plan at a 3% contribution rate, increased 1% each year up to a maximum 12% contribution rate, unless the employee elects out or elects a different contribution rate. Effective January 1, 2022, Empower increased its matching contribution to match 100% of the first 6% (up from 5%) of Salary contributed as pre-tax and/or Roth contributions for all employees. At the
discretion of the Human Resources Committee, Empower may also make one-time profit-sharing contributions to the 401(k) accounts of all employees as a uniform percentage of each employee’s salary, determined on an annual basis.
The 401(k) Plan offers a variety of investment options, including variable funds, collective funds, a stable value fund, Lifeco common shares (company matching contributions only) and a self-directed investment option. Vesting of all 401(k) Plan contributions is immediate.
6. Nonqualified Deferred Compensation
To provide market competitive compensation to certain key executives, the Company also has a nonqualified deferred compensation plan (“NQDCP”). See the table presented below for information on the participation of the Named Executive Officers in this plan and a description of the terms of the plan.
Human Resources Committee Interlocks and Insider Participation
During 2023, no officer or employee served as a member of the Human Resources Committee and none of the members of the Human Resources Committee had any relationship required to be disclosed by Section 407(e)(4) of Regulation S-K.
Compensation Policies and Risk Management
The Company has evaluated its compensation policies and practices applicable to all employees and believes that they do not create risks that are reasonably likely to have a material adverse effect on the Company.
Summary Compensation Table
The following table sets out compensation earned by the Named Executive Officers during the last three fiscal years.
Name and Principal Position | | | | | | Non-Equity Incentive Plan Compensation | |
Edmund F. Murphy III President and Chief Executive Officer | | | | | | | |
| | | | | | |
| | | | | | |
Christine M. Moritz Executive Vice President and Chief Financial Officer(1) | | | | | | | |
| | | | | | |
| | | | | | |
Former Executive Vice President and Chief Financial Officer | | | | | | | |
| | | | | | |
| | | | | | |
Richard H. Linton Jr. President and Chief Operating Officer | | | | | | | |
| | | | | | |
| | | | | | |
Carol J. Kline Executive Vice President and Chief Information Officer | | | | | | | |
| | | | | | |
| | | | | | |
Carol E. Waddell President, Empower Personal Wealth | | | | | | | |
| | | | | | |
| | | | | | |
(1)
Ms. Moritz was appointed Executive Vice President and Chief Financial Officer of the Company effective July 25, 2023. Ms. Moritz was previously the Chief Financial Officer, Empower.
(2)
Ms. Bolotin resigned as the Chief Executive Officer of the Company effective June 1, 2023. For Ms. Bolotin, the Summary Compensation Table sets forth all compensation paid to Ms. Bolotin by the Company for her service as the Chief Financial Officer of both the Company and Putnam, a portion of which is reimbursed to the Company by Putnam.
(3)
This column sets forth special bonuses paid (a) in 2023 to Mr. Murphy, Ms. Moritz, Ms. Kline and Ms. Waddell in relation to the completion of the integration of the Personal Capital business; (b) in 2022 (i) to Mr. Murphy, Ms. Moritz, Ms. Kline and Ms. Waddell in relation to the successful integration of the Personal Capital business; (ii) to Mr. Murphy, Ms. Moritz, Mr. Linton and Ms. Kline in relation to the successful integration of the MassMutual business; (iii) to Mr. Murphy, Ms. Moritz, Ms. Bolotin, Mr. Linton and Ms. Kline in relation to the successful acquisition of the retirement services business of Prudential; and (iv) to each of the Named Executive Officers for their contribution to the growth of the Empower business; and (c) in 2021 (i) to Mr. Murphy, Ms. Moritz, Ms. Bolotin, Mr. Linton and Ms. Kline in relation to the successful acquisition of the retirement services business of MassMutual and (ii) to each of the Named Executive Officers for their contribution to the growth of the Empower business.
(4)
This column sets forth the value of share units granted to each Named Executive Officer under the Executive Share Unit Plan. The amounts shown represent the aggregate grant date fair value of the awards, and do not represent cash payments made to individuals or amounts realized, or amounts that may be realized, upon vesting and payout. As described below under “Grants of Plan-Based Awards for 2023– 3. Narrative Description of the Executive Share Unit Plan”, the final payment upon vesting is dependent on the value of Lifeco’s common stock at the time of vesting and the Company’s performance during the vesting period. For example, see “Option Exercises and Stock Vested for 2023”, which discloses the final value upon vesting of the executive share units that were granted with respect to 2021 and vested effective December 31, 2023.
(5)
These amounts represent cash bonuses earned under the Company’s Annual Incentive Bonus Plan and paid in February of 2024.
(6)
The components of 2023 other compensation reported for each of the Named Executive Officers are as follows:
(a) Mr. Murphy received (i) a 401(k) Plan employer contribution of $31,350, (ii) $190,031 in respect of directors’ fees, and (iii) travel benefits of $4,372.
(b) Ms. Moritz received a 401(k) Plan employer contribution of $31,350.
(c) Ms. Bolotin received a 401(k) Plan employer contribution of $31,350.
(d) Mr. Linton received a 401(k) Plan employer contribution of $31,350.
(e) Ms. Kline received a 401(k) Plan employer contribution of $31,350.
(f) Ms. Waddell received a 401(k) Plan employer contribution of $31,350.
Grants of Plan-Based Awards for 2023
The following table sets out information with respect to grants to the Named Executive Officers under the Annual Incentive Bonus Plan and the Executive Share Unit Plan
| | | | All Other Stock Awards: Number of Shares of Stock or |
| | | | |
| | | | |
| | | | |
| | | | |
| | | | |
(1)
These are Executive Share Units granted under the Executive Share Unit Plan. The grant date was March 1, 2023 for all awards. The Human Resources Committee approved the grants on February 1, 2023.
2. Narrative Description of the Annual Incentive Bonus Plan
Under the Annual Incentive Bonus Plan, a bonus pool is established if the Company meets certain earnings targets. The target bonus opportunity for individuals varies by office and is expressed as a percentage of base salary or as a flat amount. Bonus amounts are determined based on each Named Executive Officer’s performance against established objectives. Bonus amounts of greater or lesser than the established target may be awarded. For the Named Executive Officers, there is no minimum or maximum bonus amount. Annual Incentive Bonuses are paid only to Named Executive Officers who are employed with the Company at the end of the year being reported.
(i)
Mr. Murphy had an opportunity to earn up to 200% of base salary earned in 2023 based on the Company’s financial performance and individual objectives, and an additional amount on a discretionary basis based on individual performance;
(ii)
Ms. Moritz had an opportunity to earn up to 125% of base salary earned in 2023 based on the Company’s financial performance and individual objectives, and an additional amount on a discretionary basis based on individual performance;
(iii)
Ms. Bolotin had an opportunity to earn up to 200% of base salary earned in 2023 based on the Company’s financial performance and individual objectives, and an additional amount on a discretionary basis based on individual performance;
(iv)
Mr. Linton had an opportunity to earn up to 200% of base salary earned in 2023 based on the Company’s financial performance and individual objectives, and an additional amount on a discretionary basis based on individual performance;
(v)
Ms. Kline had an opportunity to earn up to 100% of base salary earned in 2023 based on the Company’s financial performance and individual objectives, and an additional amount on a discretionary basis based on individual performance; and
(vi)
Ms. Waddell had an opportunity to earn up to 150% of base salary earned in 2023 based on the Company’s financial performance and individual objectives, and an additional amount on a discretionary basis based on individual performance.
3. Narrative Description of the Executive Share Unit Plan
Under the Executive Share Unit Plan, notional share units (the “Executive Share Units”) may be granted to the Named Executive Officers by the Human Resources Committee. The value of an Executive Share Unit on a grant date is based on the volume-weighted average closing price of Lifeco’s common shares on the Toronto Stock Exchange for the preceding five trading days (the “Market Value”).
The number of Executive Share Units granted is based on each Named Executive Officer’s long-term incentive target, which is derived from the Named Executive Officer’s base salary. Individual grants also take into account the Named Executive Officer’s past performance and expected future impact on the organization’s performance. Each grant of Executive Share Units has a three-year vesting period during which certain conditions (including continued employment) must be satisfied. The number of Executive Share Units held by a Named Executive Officer increases during the three-year vesting period based on any dividends declared on Lifeco’s common shares.
Subject to satisfaction of the vesting conditions, the Executive Share Units generally vest and become payable in cash at the end of the three-year vesting period. Executive Share Units vest earlier upon death, disability or attaining normal retirement age. Upon vesting, the final number of vested Executive Share Units is adjusted up or down based on a performance factor that is designed to measure the performance of Empower Retirement during the three-year vesting period. The value of each vested Executive Share Unit is determined from the Market Value of Lifeco’s common shares as of the vesting date.
Named Executive Officers may elect to defer the payment of all or a portion of Executive Share Units granted in 2023 if certain requirements are met. Such an election must defer payment no less than five years from the original payment date.
4. Narrative Description of the Lifeco Stock Option Plan
The Company’s participation in the Lifeco Stock Option Plan was discontinued following the 2019 fiscal year and no options were granted to any Named Executive Officer of the Company in 2023. However, several of the Named Executive Officers hold vested and unvested options granted under the Lifeco Stock Option Plan, as described in the Outstanding Equity Awards at 2023 Fiscal Year End table below.
Options are generally granted in multi-year allotments. Options granted prior to 2019 become exercisable at the rate of twenty percent (20%) per year commencing one year after the date of the grant. For options granted in 2019 and thereafter, fifty percent (50%) of the options become exercisable three years from the date of grant, and the remaining fifty percent (50%) become exercisable four years from the date of grant.
Options generally expire ten years after the date of the grant, except that if options would otherwise expire during a blackout period or within ten business days of the end of a blackout period, the expiry date for the options is extended to the tenth business day after the expiry date of the blackout period.
In the event of the death of a participant or the termination of a participant’s employment, then the period within which the options may be exercised is generally reduced depending on the circumstances surrounding the death or termination of employment. Options are not assignable by participants otherwise than by will or pursuant to the laws of succession. Lifeco does not provide any financial assistance to participants to facilitate the purchase of common shares under the Lifeco Stock Option Plan. Subject to any regulatory or shareholder approval required by law, the Lifeco Board of Directors may amend the Lifeco Stock Option Plan or the terms of a grant.
Outstanding Equity Awards at 2023 Fiscal Year End
The following table sets out Lifeco options held by the Named Executive Officers under the Lifeco Stock Option Plan, and Executive Share Units held by the Named Executive Officers under the Executive Share Unit Plan, as of December 31, 2023.
| | |
| Number of Securities Underlying Unexercised Options (#) Exercisable | Number of Securities Underlying Unexercised Options (#) Unexercisable | | | Number of Shares or Units of Stock That Have Not Vested (#) | Market Value of Shares or Units of Stock That Have |
| | | | | | |
| | | | | | |
| | | | | | |
| | | | | | |
| | | | | | |
| | | | | | |
| | | | | | |
| | | | | | |
| | | | | | |
| | | | | | |
| | | | | | |
| | | | | | |
| | | | | | |
| | | | | | |
| | | | | | |
| | | | | | |
| | | | | | |
| | | | | | |
| | | | | | |
| | | | | | |
| | | | | | |
| | | | | | |
| | | | | | |
(1) Lifeco options are issued with an exercise price in Canadian dollars, which have been translated to U.S. dollars at the Conversion Rate.
(2) These Executive Share Unit grants vest on December 31, 2024.
(3) These Executive Share Unit grants vest on December 31, 2025.
(4) The market value of Executive Share Units held as of December 31, 2023 is based on the year-end closing price of Lifeco common shares on the Toronto Stock Exchange.
Option Exercises and Stock Vested for 2023
The following table sets out Lifeco options exercised by and Executive Share Units vested for the Named Executive Officers in 2023.
| | |
| Number of Shares Acquired on Exercise (#) | Value Realized on Exercise ($) | Number of Shares Acquired on Vesting (#) | Value Realized on Vesting ($) |
| | | | |
| | | | |
| | | | |
| | | | |
| | | | |
| | | | |
Nonqualified Deferred Compensation for 2023
The following table sets out information with respect to the participation of the Named Executive Officers in the NQDCP.
| | Executive Contributions in Last Fiscal Year ($)(1) | Aggregate Earnings in Last Fiscal Year ($) | Aggregate Withdrawals or Distributions ($) | Aggregate Balance at Last Fiscal Year End ($) |
| | | | | |
| | | | | |
(1) Amounts contributed are included in the Salary column of the Summary Compensation Table.
2. Narrative Description of the NQDCP
All officers and certain senior employees of the Company, and others at the discretion of the Company, are eligible to participate in the NQDCP. A participant in the NQDCP may defer between 1% and 90% of their base salary (including sales related compensation) and bonus.
Under the NQDCP, participants specify one or more investment preferences in which deferrals are deemed to be invested. Participant accounts are adjusted for interest, earnings or losses equal to the actual results of the deemed investment(s). Amounts deferred under the NQDCP and the earnings from the plan are distributed to a participant upon termination of employment, if not distributed earlier. Amounts distributed under the plans are generally paid in either a lump sum or installments over three, five, 10 or 15 years at the election of the participant.
Following a change in control of the Company, the Board of Directors may terminate the plan in its discretion and pay all amounts due under the plan to participants. Certain payments following termination of employment or after a change in control may be delayed to comply with requirements under the Internal Revenue Code.
In accordance with SEC rules, we are providing the ratio of the annual total compensation of our CEO to the annual total compensation of our median employee.
For 2023, the annual total compensation of our CEO, as reported in the Summary Compensation Table, was $7,960,236 and the annual total compensation of our median employee was $102,196. Based on this information, we reasonably estimate that, for 2023, our CEO’s annual total compensation was approximately 78 times that of our median employee’s annual total compensation.
We determined our median employee by using target total compensation, which includes base salary, target annual cash incentive, target sales incentive and target long-term incentive, where applicable, as our consistently applied compensation measure. We applied this measure to the employee population of the Company and its controlled subsidiaries as of December 31, 2022, the last day of our fiscal 2022. We excluded all of our non-U.S. employees in Canada, Guam and Puerto Rico (who represent less than 5% of our entire work force) as permitted under the applicable SEC de minimis rule. We also excluded 13 employees that receive compensation from one of the Company’s subsidiaries on behalf of a foreign affiliate but do not provide services to the Company
or its subsidiaries. We calculated the median employee’s 2023 annual total compensation using the same methodology that is used to calculate our CEO’s annual total compensation in the Summary Compensation Table.
The SEC rules for identifying the median employee and calculating the pay ratio based on that employee’s annual total compensation allow companies to adopt a variety of methodologies, to apply certain exclusions, and to make reasonable estimates and assumptions that reflect their compensation practices. As such, the pay ratio reported by us may not be comparable to the pay ratio reported by other companies, which may have employed other permitted methodologies or assumptions.
Security Ownership of Certain Beneficial Owners and Management
Security Ownership of Certain Beneficial Owners
Set forth below is certain information, as of January 1, 2024, concerning beneficial ownership of the voting securities of the Company by entities and persons who beneficially own more than 5% of the voting securities of the Company. The determinations of “beneficial ownership” of voting securities are based upon Rule 13d-3 under the Securities Exchange Act of 1934, as amended (the “Exchange Act”). This rule provides that securities will be deemed to be “beneficially owned” where a person has, either solely or in conjunction with others, (1) the power to vote or to direct the voting of securities and/or the power to dispose or to direct the disposition of the securities or (2) the right to acquire any such power within 60 days after the date such “beneficial ownership” is determined.
1.
100% of the Company’s 19,599,243 outstanding common shares are owned by Empower Holdings, LLC, 8515 East Orchard Road, Greenwood Village, Colorado 80111.
2.
100% of the outstanding common shares of Empower Holdings, LLC are owned by Great-West Lifeco U.S. LLC, 8515 East Orchard Road, Greenwood Village, Colorado 80111.
3.
100% of the outstanding common shares of Great-West Lifeco U.S. LLC are owned by Great-West Financial (Nova Scotia) Co., 600-1741 Lower Water Street, Halifax, Nova Scotia, Canada B3J 0J2.
4.
100% of the outstanding common shares of Great-West Financial (Nova Scotia) Co. are owned by Great-West Lifeco Inc., 100 Osborne Street North, Winnipeg, Manitoba, Canada R3C 1V3.
5.
70.486% of the outstanding common shares of Great-West Lifeco Inc. are controlled, directly or indirectly, by Power Financial Corporation, 751 Victoria Square, Montréal, Québec, Canada H2Y 2J3, representing approximately 65% of the voting rights attached to all outstanding voting shares of Great-West Lifeco Inc.
6.
100% of the outstanding common shares of Power Financial Corporation are owned by Power Corporation of Canada, 751 Victoria Square, Montréal, Québec, Canada H2Y 2J3.
7.
The Desmarais Family Residuary Trust, c/o San Palo Investments Corporation, 759 Square Victoria, Suite 520, Montréal, Québec, Canada H2Y 2J7, directly and through a group of private holding companies which it controls, has voting control of Power Corporation of Canada.
As a result of the chain of ownership described in paragraphs (1) through (7) above, each of the entities and persons listed in paragraphs (1) through (7) would be considered under Rule 13d-3 of the Exchange Act to be a “beneficial owner” of 100% of the outstanding voting securities of the Company. As described above, the Company’s ultimate controlling person is the Desmarais Family Residuary Trust (the “Trust”), which controls the Company’s ultimate parent company, Power Corporation. As of December 31, 2023, the outstanding capital stock of Power Corporation consists of 597,387,873 Subordinate Voting Shares (“SVS”) carrying one vote per share and 54,860,866 Participating Preferred Shares (“PPS”) carrying 10 votes per share; hence the total voting rights are 1,145,996,533. The Trust exercises control over Pansolo Holding Inc. (“Pansolo”), which directly and indirectly owns 46,944,592 SVS and 54,715,456 PPS, entitling Pansolo to an aggregate percentage of voting rights of 595,517,952 or 51.30% of the total voting rights attached to the shares of Power Corporation.
As of December 31, 2023, under customary credit facilities of Pansolo, Pansolo has pledged 54,697,962 Participating Preferred Shares and 19,363,392 Subordinate Voting Shares of Power Corporation to certain Canadian bank lenders as security for its obligations thereunder. Immediately before and after such pledge, Pansolo directly and indirectly owned 54,715,456 Participating Preferred Shares and 46,944,592 Subordinate Voting Shares in the aggregate.
Security Ownership of Management
The following tables set out the number of equity securities and exercisable options for equity securities of the Company or any of its parents or subsidiaries, beneficially owned, as of January 1, 2024, by (i) the directors of the Company (ii) the Named Executive Officers and (iii) the directors and executive officers of the Company as a group.
| | |
| | |
| | |
| | 15,991,444 5,078,303 options |
| | |
| | |
| | |
| | |
| | |
| | |
| | |
| | |
| | |
| | |
| | |
| | |
| | |
| | |
| | |
Directors and Executive Officers as a Group | | |
| | 16,776,870 10,646,827 options |
(1)
All holdings are common shares, or where indicated, exercisable options for common shares of Great-West Lifeco Inc.
(2)
All holdings are subordinate voting shares, or where indicated, exercisable options for subordinate voting shares of Power Corporation of Canada.
The subordinate voting shares and exercisable options for subordinate voting shares of Power Corporation of Canada held by the directors and executive officers as a group represent 4.4% of the total number of subordinate voting shares and exercisable options for subordinate voting shares of Power Corporation of Canada outstanding.
None of the remaining holdings set out above exceeds 1% of the total number of shares and exercisable options for shares of the class outstanding.
Transactions with Related Persons, Promoters and Certain Control Persons
(a)
There are no transactions to report.
(b)
The Company’s Board of Directors has a Conduct Review Committee which acts pursuant to a written Charter and procedures (together, the “procedures”). Mr. Louvel serves on the Conduct Review Committee.
The Conduct Review Committee, in accordance with the procedures, considers and approves transactions between the Company or its subsidiaries and (i) the directors and senior officers of the Company or its affiliates, including their spouses and minor children; (ii) its affiliates; and (iii) companies controlled by a director or senior officer of the Company or its affiliates, or their spouses or minor children. Control and affiliation is defined as a 10% voting interest or 25% ownership interest, but does not include subsidiaries of the Company.
Among other criteria, the Conduct Review Committee considers whether such transactions were on market terms and conditions, including interest rates and fees, as those prevailing at the time for comparable transactions with third parties. Such review also considers the Company’s established conflict of interest guidelines with respect to the transaction, as set forth in the Company’s Code.
There were no reportable related party transactions during the Registrant’s most recently completed fiscal year where the aforementioned procedures did not require review, approval or ratification or where the procedures were not followed.
Risks Associated with the Company
The following provides a description of certain material risks that could affect the Company’s business, reputation, financial condition or results of operations. These risks are not exclusive, and additional risks to which we are subject include, but are not limited to, the risks related to our businesses and products described elsewhere in this Prospectus. Many of these risks are interrelated and occur under similar business and economic conditions, and the occurrence of certain of them may in turn cause the emergence, or exacerbate the effect, of others. Such a combination could materially increase the severity of the impact on our business, liquidity, financial condition and results of operations.
Macroenvironmental risks may negatively affect the Company’s results of operations and financial condition.
Challenging current and future global economic conditions, including elevated levels of inflation, supply chain disruptions, geopolitical uncertainties stemming from the Russia-Ukraine conflict, and liquidity concerns with respect to certain banks and financial servies companies, continue to cause significant uncertainty and volatility in global financial markets and the economic environment in which the Company operates. Throughout 2023, commercial real estate markets in North America showed signs of slowdown. In particular, the office markets are experiencing dampened demand from a continued lag faced by employers on return-to-office plans, leading to higher vacancy rates and deteriorating operating performance, driven as well by challenging economic and capital market conditions.
The outlook for financial markets and real estate markets over the short and medium-term remains highly uncertain and the Company actively monitors events and information globally. The Company continues to manage risks of changes to mortality and longevity rates and monitor financial market conditions, heightened cyber and domestic real estate markets, any of which could negatively affect the Company’s financial outlook, results and operations.
Competitive factors may adversely affect the Company’s market share and profitability.
The industry in which the Company operates is highly competitive. The Company’s competitors include insurance companies, mutual fund companies, banks, investment advisors, and certain service and professional organizations. Although there has been consolidation in some sectors, no one competitor is dominant. Customer retention is a key factor for continued profitability. Our customers could shift their funds to competitors’ products or services for any number of reasons, including investment performance, changes in prevailing interest rates, changes in customer investment preferences, changes in our reputation in the marketplace, changes in customer management or ownership, loss of key investment management personnel and financial market performance. In addition, technological advances, changing customer expectations, including related to digital offerings, or other changes in the marketplace may present opportunities for new or smaller competitors without established products or distribution channels to meet consumers’ increased expectations more efficiently than us. New market entrants, including Fintech and Insurtech companies, have the potential to disrupt the global financial services industries and continue to make gains in the domestic financial services industry.
As with all financial services companies, our ability to conduct business depends on consumer confidence in the industry and our financial strength. Actions of competitors, and financial difficulties of other companies in the industry, and related adverse publicity, could undermine consumer confidence and harm our reputation. Management cannot be certain that the Company will be able to maintain its current competitive position in the markets in which it operates, or that it will be able to grow its business or
expand its operations into new markets. If the Company fails to do so, its business, results of operations, and financial condition could be materially and adversely affected.
Acquisitions, dispositions and business reorganizations may not produce anticipated benefits and could result in operating difficulties, unforeseen liabilities, asset impairments or rating agency actions, which may adversely affect the Company’s operating results and financial condition.
The Company has engaged in material disposition and acquisitions of businesses in the past and may continue to do so in the future. Such activity exposes the Company to a number of risks. For example, there could be unforeseen liabilities or asset impairments, including goodwill impairments that arise in connection with acquired businesses or those that may be acquired in the future. Factors such as receiving the required governmental or regulatory approvals to close the transaction, delays in implementation or completion of transition activities or a disruption to the Company’s ongoing business could negatively impact results.
The Company’s ability to achieve certain benefits which are anticipated from acquisitions of businesses will depend in large part upon the Company’s ability to successfully integrate such businesses in an efficient and cost-effective manner. The Company may not be able to integrate such businesses smoothly or successfully, and the process may take longer than expected. The integration of operations and differences in operational culture may require the dedication of significant management resources, which may result in greater expenditures than expected to integrate the acquired businesses. Integrating acquired operations with existing operations may require the Company to coordinate geographically separated organizations, address possible differences in culture and management philosophies, merge financial processes and risk and compliance procedures, combine separate information technology platforms, and integrate organizations that were previously closely tied to the former parent of the acquired business or other service provider. If the Company is unable to successfully integrate the operations of acquired businesses, it may be unable to realize the benefits it expects to achieve as a result of such acquisitions.
Once completed, acquisitions and dispositions may not perform as projected, expense synergies and savings may not materialize as expected and costs associated with the transaction or related transition services may be greater than anticipated. The Company’s financial results could be adversely affected by:
•potential difficulties achieving projected financial results, including the costs and benefits of integration or deconsolidation, due to macroeconomic, business, demographic, actuarial, regulatory, or political factors;
•negative reactions to a transaction by policyholders and contract-holders, participants, distributors, suppliers, plan sponsors and advisors and other clients and potential customers;
•ratings agency warnings or downgrades;
•unanticipated performance issues;
•transaction-related charges;
•diversion of management time and resources;
•loss of key personnel or higher than expected employee attrition rates;
•inefficiencies as we integrate operations and address differences in cultural, management, information, compliance and financial systems and procedures; and
•charges for indemnification and impairment of long-term assets or goodwill.
Restructuring or consolidating the legal entities through which the Company conducts its business may raise similar risks. The Company’s ability to realize benefits from such restructuring will depend on its ability to address those risks, including regulatory approvals, modification of operations and changes to investment portfolios. Any of these risks, if realized, could prevent the Company from achieving the benefits it expects or could otherwise have a material adverse effect on its business, results of operations or financial condition.
The Company may experience difficulty in marketing and distributing products through its current and future distribution channels.
The Company distributes its products and services through a variety of distribution channels, advisors and consultants, retail financial institutions, and its own internal sales force. In some areas, the Company generates a significant portion of its business through third-party arrangements. The Company’s management periodically negotiates provisions and renewals of these relationships and there can be no assurance that such terms will remain acceptable to either party. The loss of access to a
distribution channel or an interruption in the continuing relationship with a significant number of these third parties could materially affect the Company’s ability to market and sell its products.
The Company must attract and retain productive internal sales representatives to sell its products. If the Company is unsuccessful in attracting and retaining sales representatives with demonstrated abilities, its results of operations and financial condition could be adversely affected.
If the Company is unable to attract and retain key officers and employees, its ability to meet its business objectives could be adversely affected.
The Company depends on its ability to attract, retain, train and develop the right talent through recruitment, talent management and succession planning programs and practices in order to meet its business objectives. Due to the intense competition within the financial services industry for key employees with necessary and demonstrated skills and abilities, the Company and its subsidiaries may be unable to hire or retain such employees. In addition, the Company may experience higher than expected employee turnover and difficulty attracting new employees,. Inability to retain the Company’s key officers and employees could have an adverse effect on operations that could be material, given their skills, knowledge of the Company’s business, years of industry experience and the potential difficulty of promptly finding qualified replacement employees. The Company’s results of operations and financial condition could be adversely affected if it is unsuccessful in attracting and retaining such key employees.
Deviations from assumptions regarding future persistency, mortality, morbidity, longevity, credit experience, equity market and interest rates used in calculating liabilities for future policyholder benefits and claims could adversely affect the Company’s results of operations and financial condition.
The Company establishes and carries, as a liability, reserves based on estimates of how much it will need to pay for future benefits and claims. Future policy benefits do not represent an exact calculation of liability. Rather, future policy benefits represent an estimate of what management expects the ultimate settlement and administration of benefits will cost. These estimates, which generally involve actuarial projections, are based upon management’s assessment of facts and circumstances then known, as well as estimates of future trends in persistency (how long a contract stays with the Company), mortality, judicial theories of liability, interest rates, and other factors. These variables are affected by both internal and external events, such as changes in market and interest rate conditions, catastrophic events, inflation, judicial trends, and legislative changes. Many of these items are not directly quantifiable in advance. For example, the increased occurrence of near-zero or negative interest rates can make it difficult to model future interest rates as interest rate models have been generally calibrated in an environment of positive interest rates. As a result, these methods may be less effective in forecasting future exposures than they were historically.
The inherent uncertainties of estimating policy and contract claim liabilities are greater for certain types of liabilities, particularly those in which the various considerations affecting the type of claim are subject to change and in which long periods of time may elapse before a definitive determination of liability is made. Liability estimates including estimated premiums the Company will receive over the assumed life of the policy are continually refined in a regular and ongoing process as experience develops and further claims are reported and settled. Adjustments to policy benefit liabilities are reflected in the Company’s consolidated statement of income in the period in which adjustments are determined. Because setting policy benefit liabilities is inherently uncertain, there can be no assurance that current liabilities will prove to be adequate in light of subsequent events.
A downgrade or potential downgrade in the Company’s financial strength or claims paying ratings could result in a loss of business and negatively affect results of operations and financial condition.
The Company is rated by a number of nationally recognized rating agencies. The ratings represent the opinion of the rating agencies regarding the Company’s financial strength and its ability to meet ongoing obligations to policyholders. Claims paying ability and financial strength ratings are factors in establishing the competitive position of insurers. A rating downgrade, or the potential for such a downgrade, may negatively impact new sales and adversely affect the Company’s ability to compete and thereby have a material effect on its business, results of operations, and financial condition. Such a downgrade of the Company or any of its rated insurance subsidiaries could, among other things, materially increase the number of policy surrenders and withdrawals by policyholders of cash values from their policies, adversely affecting relationships with broker-dealers, banks, agents, wholesalers, and other distributors of its products and services. This may result in cash payments requiring the Company to sell invested assets, including illiquid assets such as privately placed bonds and mortgage loans, at a price that may result in realized investment losses. These cash payments to policyholders result in a decrease in total invested assets and a decrease in net income. In addition, negative changes in the Company’s credit ratings may increase the Company’s cost of borrowing or result in borrowing being unavailable to the Company on terms that are acceptable to it.
Counterparties with whom the Company transfers risk may be unable or unwilling to do business with the Company.
The Company mitigates market risks through the use of derivative transactions with approved counterparties. Should some or all of these counterparties be unwilling or unable to continue to offer derivatives to the Company, the cost of purchasing these financial instruments may increase and/or the Company may not be able to continue to transfer certain risks, thereby increasing its exposure to a financial loss.
Vendors and suppliers that fail to meet the Company’s performance standards or suffer losses due to information security breaches, fraud or negative events may adversely affect our results and reputation.
The Company depends on a large number of third-party vendors and suppliers to successfully operate its business and deliver on its commitments to its clients and participants. The Company and its subsidiaries strategically engage these vendors to maintain cost efficiency, to optimize internal resources and capital and to utilize skills, expertise and resources not otherwise available within the Company. Vendors are engaged based on our prescribed vendor risk management principles in our Vendor Risk Management Policy. Vendors that do not meet the Company’s standards or expectations for performance, or that suffer losses or failures due to information security breaches, fraud or other external events, may have a negative impact on the Company’s ability to operate its business, its financial results and its reputation.
Market volatility and general economic conditions may adversely affect the Company’s results of operations and financial condition.
The risk of fluctuations in market value of the separate account assets, proprietary mutual funds, proprietary collective trusts, and external mutual funds is borne by the Company’s policyholders. Fee income for administering and/or managing these assets, however, is generally set as a percentage of those assets. Accordingly, fluctuations in the market value of these assets may result in fluctuations in revenue. On certain products, the Company offers guarantees to policyholders to protect them against the risk of adverse market performance, including guaranteed minimum death benefits and guaranteed lifetime withdrawal benefits. When equity markets decline, the Company is at a greater risk of having to pay guaranteed benefits that exceed available policyholder account balances, and will therefore have to increase its reserves for these benefits, resulting in a financial loss. While the Company does have hedging programs in place to reduce the market risk associated with these guarantees, no assurance can be provided that these programs will generate the returns that will be needed to meet policyholder obligations relating to these guarantees.
The Company manages or administers its general and separate accounts in support of cash and liquidity requirements of its insurance and investment products. The Company’s general account investment portfolio is diversified over a broad range of asset classes but consists primarily of domestic fixed income investments. The fair value of these and other general account invested assets fluctuates depending upon, among other factors, general economic and market conditions. In general, the market value of the Company’s general account fixed maturity securities portfolio is expected to increase or decrease in inverse relationship with fluctuations in interest rates.
Additionally, the Company may, from time to time, for business, regulatory, or other reasons, elect or be required to sell certain of its general account invested assets at a time when their fair values are less than their original cost, resulting in realized capital losses, which would have an adverse effect on the results of operations and financial condition.
Interest rate fluctuations could have a negative impact on the Company’s results of operations and financial condition.
Interest rate risk is the risk of loss resulting from the effect of the volatility and uncertainty of future interest rates on asset cash flows relative to liability cash flows and on assets backing surplus. This also includes changes in the amount and timing of cash flows related to asset and liability optionality, including interest rate guarantees and book value surrender benefits in the liabilities. During periods of prolonged low interest rates, investment earnings may be lower because the interest earned on new fixed income investments will likely have declined with the market interest rates. Also, early repayment on certain investments held such as mortgage-backed securities, asset-backed securities, and callable bonds, may occur and proceeds reinvested at lower yields, which will reduce investment margins.
On the other hand, an increase in interest rates or a “higher for longer” interest rate environment may result in increased lapse risk (driven by changes in policyholder behavior) in some of our products, together with potential second order impacts on equity prices. This risk is most material for the Company’s general account stable value investment products. While the Company attempts to mitigate this risk with contractual exit provisions for plan sponsors to delay timing and/or adjust amount of discretionary withdrawal for the exit of a plan sponsor, a large volume of discretionary withdrawals by plan sponsors or plan
participants may adversely affect the Company’s liquidity and financial position. In addition, asset and liability matching strategies may not be sufficient to fund potential exits or reinvest at prevailing rates.
The Company has hedging and other risk mitigating strategies to reduce the risk of a volatile interest rate environment. However, there can be no assurance that it would be fully insulated from realizing any losses on sales of securities. In addition, regardless of whether the Company realized an investment loss, potential withdrawals would produce a decrease in invested assets, with a corresponding adverse effect on the results of operations and financial condition.
Ratings downgrades and/or increased default rates on our investment portfolios may adversely affect the Company’s results and financial position.
The occurrence of a major economic downturn, widening credit risk spreads, acts of corporate malfeasance or other events that adversely affect the issuers or guarantors of securities or the underlying collateral of structured securities could cause the estimated fair value of the Company’s bond portfolio to decline and/or cause the default rate of the bonds in its investment portfolio to increase, which could cause a corresponding decrease to earnings. A ratings downgrade affecting issuers or guarantors of particular securities, or similar trends that could worsen the credit quality of issuers of securities in the Company’s investment portfolio, could also have a similar effect on earnings. Similarly, a ratings downgrade affecting a security the Company holds could indicate the credit quality of that security has deteriorated and could increase the capital the Company must hold to support that security to maintain regulatory capital ratios and cause them to increase reserves.
The Company may not be able to secure financing to meet the liquidity or capital needs of the Company.
While the Company monitors its liquidity and capital on a regular basis, it may need to seek external financing if available internal levels of liquidity or capital are insufficient. Liquidity demands include but are not limited to the payment of policyholder benefits, collateral posting as required under our agreements with counterparties, the payment of operating expenses, and the servicing of debt. Capital demands could result from the growth of new business, a change in investment strategy, an investment in systems or other infrastructure, or a deterioration of the Company’s capital arising from financial losses. The availability of additional financing will depend on a variety of factors such as market conditions, the general availability of credit in financial markets, the overall availability of credit to the financial services industry, the volume of trading activities in financial markets, the Company’s credit ratings and credit capacity, and the perception of customers or lenders of the Company’s long or short-term financial strength. If the Company is unable to secure external financing to meet a liquidity or capital shortfall, it may be required to curtail its operations, sell assets or reinsure liabilities, make changes to the investment strategy, or discontinue the use of certain derivatives, which could have a detrimental impact on the financial strength of the Company.
Legal, Regulatory and Compliance Risks
The insurance and financial services industries are heavily regulated and changes in regulation may reduce profitability.
The Company and certain of its subsidiaries are subject to extensive Federal and state legal and regulatory requirements in the jurisdictions in which they operate. These requirements cover most aspects of the Company’s operations including capital adequacy, privacy, cyber security, liquidity and solvency, investments, the sale and marketing of insurance and retirement plans and financial products and securities, as well as the business conduct of insurers, broker/dealers asset managers and investment advisors. Material changes in the legal or regulatory framework or the failure to comply with legal and regulatory requirements could have an adverse effect on the Company that could be material.
Federal and State regulators regularly re-examine existing laws and regulations applicable to financial and retirement services providers, insurance companies, investment advisors, broker-dealers and their products and distribution methods. Compliance with applicable laws and regulations can be time and resource intensive, and changes in these laws and regulations or in the interpretation or enforcement thereof, may materially increase direct and indirect compliance costs and other expenses of doing business, thus having an adverse effect on the Company’s results of operations and financial condition. It is not possible to predict whether future legislation or regulation adversely affecting the Company’s business will be enacted and, if enacted, the extent to which such legislation will have an effect on the Company or its competitors. Furthermore, there can be no assurance as to which of the Company’s specific products would be impacted by any such legislative or regulatory reform.
The business, operations and accounts of the Company and its key operating subsidiaries are subject to examination by the Colorado Department of Insurance and other regulators. These regulators may from time to time raise issues during examinations or audits of the Company and its subsidiaries that could have a negative impact on the Company. In addition, the National Association of Insurance Commissioners, a national regulatory coordination organization among state insurance regulators, has also prescribed Risk-Based Capital (“RBC”) rules and other financial ratios for life insurance companies. The calculations set
forth in these rules are used by regulators to assess the sufficiency of an insurer’s capital and measure the risk characteristics of an insurer’s assets, liabilities, and certain off-balance sheet items. RBC is calculated by applying factors to various asset, premium, face amount, and liability items. Although the Company’s RBC levels are currently well in excess of those required by its regulators, there can be no assurances made that the Company would continue to maintain these levels.
Changes in U.S. federal income tax law could make some of the Company’s products less attractive to consumers and increase its tax costs.
Congress, as well as state and local governments, considers from time-to-time legislation that could change the Company’s tax costs and increase or decrease its ability to use existing tax credits. Future changes in U.S. federal income tax law could lessen or eliminate some of the tax advantages currently benefitting the Company, its policyholders or its other clients or could make some of the Company’s products less attractive to consumers. For example, the following events could adversely affect the Company’s business:
•Changes in tax laws that would reduce or eliminate tax-deferred accumulation of earnings on the premiums paid by the holders of annuities products;
•Reductions in the federal income tax that investors are required to pay on long-term capital gains and on some dividends paid on stock that may provide an incentive for some of the Company’s customers and potential customers to shift assets into mutual funds and away from products, including life insurance and annuities, designed to defer taxes payable on investment returns;
•Changes in the availability of, or rules concerning the establishment, operation, and taxation of, Section 401, 403(b), 408, and 457 plans; and
•Changes to the federal estate tax or changes in the tax treatment of life insurance death benefits.
Further, future changes in tax rates could impact the Company’s tax costs, which could affect the consolidated financial statements in several ways. For example, an increase in the federal corporate income tax rate could affect the consolidated financial statements as follows, and a decrease in the rate could have the opposite impacts:
•A higher effective tax rate could have an unfavorable impact on net income over the period that the higher rate remains in effect;
•An increase in certain deferred tax liabilities, which would have an immediate unfavorable impact on net income in the period during which the higher rate came into effect;
•An increase in certain deferred tax assets, which would have an immediate favorable impact on net income in the period during which the lower tax rate came into effect; and
•An increase in tax rates could affect the timing of recognizing tax benefits.
The Company cannot predict whether any legislation will be enacted, what the specific terms of any such legislation will be, or how, if at all, such legislation could have an adverse effect. However, should this risk materialize, it could have an adverse effect on the Company’s future results of operations and financial position, potentially through lower product sales, changes in investor preferences and behavior, and increased lapses of policies.
On August 16, 2022, the U.S. enacted the Inflation Reduction Act of 2022 (the “IRA”) which is generally effective for years beginning after December 31, 2022. The IRA established a new 15% corporate alternative minimum tax for corporations whose average adjusted net income for any consecutive three-year period beginning after December 31, 2022, exceeds $1.0 billion. The Company’s 2023 tax accrual includes a provision for corporate alternative minimum tax. The impact on our financial position, results of operations and cash flows is dependent on future guidance from the Internal Revenue Service, which to date has issued limited guidance.
The Company’s risk management policies and procedures may not be fully effective, which may leave us exposed to unidentified or unanticipated risks that could adversely affect its business, results of operations, and financial condition.
Management of operational, legal, regulatory, and financial risks requires, among other things, policies and procedures to record properly and verify a large number of transactions and events. Management has devoted significant resources to develop the Company’s risk management and disaster recovery policies and procedures. However, policies and procedures may not be fully effective and may leave the Company exposed to unidentified and unanticipated risks. The Company may be subject to disruptions of its operating systems or its ability to conduct business from events that are wholly or partially beyond its control such as a natural catastrophe, act of terrorism, pandemic, or electrical/telecommunications outage.
A failure in cyber or information security systems could result in a loss or disclosure of confidential information, damage the Company’s reputation, and could impair its ability to conduct business effectively.
The Company depends heavily upon computer systems to provide reliable service, as a significant portion of the Company’s operations relies on the secure processing, storage, and transmission of confidential or proprietary information and complex transactions. Despite the implementation of a variety of security measures, the Company’s computer systems could be subject to physical and electronic break-ins, cyber attacks, and similar disruptions from unauthorized tampering, including threats that may come from external factors, such as governments, organized crime, hackers and other third parties, or may originate internally from within the Company.
If one or more of these events occurs, it could potentially jeopardize the confidential or proprietary information, including personally identifiable non-public information, processed and stored in, and transmitted through, the computer systems and networks. It could also potentially cause interruptions or malfunctions in the operations of the Company, its customers, or other third parties. This could result in damage to the Company’s reputation, financial losses, litigation, increased costs, regulatory penalties, and/or customer dissatisfaction or loss. Although steps have been taken to prevent and detect such attacks, it is possible that the Company may not become aware of a cyber incident for some time after it occurs, which could increase its exposure to these consequences.
In addition, the Company is subject to a variety of laws and regulations in the United States and abroad regarding privacy, data protection and data security, and may become subject to further such laws and regulations in the future. These laws and regulations are continuously evolving and developing. The scope and interpretation of the laws that are or may be applicable to the Company are often uncertain and may be conflicting, particularly with respect to foreign laws. For example, in April 2016 the European Commission adopted the General Data Protection Regulation (“GDPR”), which greatly increases the jurisdictional reach of its laws and adds a broad array of requirements for handling personal data, such as the public disclosure of significant data breaches, privacy impact assessments, data portability and the appointment of data protection officers. Even though the Company does not operate in or sell its products within the European Union, the Company believes it is required to comply with certain requirements of the GDPR.
In the U.S., several states have recently enacted new laws and regulations regarding privacy and cybersecurity. The California Consumer Privacy Act, which is effective as of January 1, 2020, contains similar consumer protections to those in the E.U. GDPR and applies to companies doing business in California. The New York State Department of Financial Services (“NYDFS”) issued cybersecurity regulations, which became effective in March 2017, imposes an array of detailed security measures on covered entities. Both of these laws impact the Company’s and its subsidiaries’ businesses and they have taken steps designed to comply with them. In October 2017, the NAIC adopted a new Insurance Data Security Model Law, which is intended to establish the standards for data security and standards for the investigation and notification of data breaches applicable to insurance licensees in states adopting such law, with provisions that are generally consistent with the NYDFS cybersecurity regulation. All of these evolving compliance and operational requirements impose costs that are likely to increase over time and may restrict the way services involving data are offered, all of which may adversely affect our results of operations.
The Company may be subject to litigation resulting in substantial awards or settlements and this may adversely affect its reputation and results of operations.
In recent years, life and accident insurance and financial service companies have been named as defendants in lawsuits, including class actions. A number of these lawsuits have resulted in substantial awards and settlements. There can be no assurance that any future litigation relating to matters such as the provision of insurance coverage or pricing and sales practices will not have a material adverse effect on the Company’s results of operations or financial position.
The financial statements of Empower Annuity Insurance Company of America as of December 31, 2023 and 2022, and for each of the three years in the period ended December 31, 2023, included in this Prospectus, have been audited by Deloitte & Touche LLP, an independent auditor, as stated in their report. Such financial statements are included in reliance upon the report of such firm given their authority as experts in accounting and auditing.
WHERE YOU CAN FIND MORE INFORMATION
This Prospectus, which constitutes part of the registration statement, does not contain all the information set forth in the registration statement.
The registration statement, including exhibits, contains additional relevant information about us. The complete registration statement and our other filings are available to the public from commercial document retrieval services and over the internet at http://www.sec.gov. (This uniform resource locator (URL) is an inactive textual reference only and is not intended to incorporate the SEC web site into this Prospectus.)
DEFINITIONS
The following is a listing of defined terms:
Account – A separate record maintained by the Plan Sponsor or its designee in the name of each Retirement Plan participant which reflects his or her interests in the assets in both Covered Fund(s) and other investment options in the Retirement Plan.
Accumulation Phase – The period of time between the Election Date and the Initial Installment Date.
Administrative Offices – 8515 East Orchard Road, Greenwood Village, CO 80111.
Alternate Payee – Any spouse, former spouse, child or other dependent of a Retirement Plan participant, or other person allowed by law, who is recognized by a Qualified Domestic Relations Order as having a right to receive all or a portion of the benefit payable under a Retirement Plan with respect to such Retirement Plan participant.
Annuitant – The person upon whose life the payment of an annuity is based.
Annuity Commencement Date – The date that annuity payments begin to an Annuitant.
Attained Age – The GLWB Participant’s age on the Ratchet Date.
Beneficiary – A person or entity named by the Retirement Plan participant or the terms of the Retirement Plan to receive all or a portion of the Account upon the death of the Retirement Plan participant.
Benefit Base – The amount that is multiplied by the GAW Percentage to calculate the GAW. The Benefit Base increases dollar-for-dollar upon any Contract Contribution and is reduced proportionately for an Excess Withdrawal. The Benefit Base can also increase with positive Covered Fund performance on the Ratchet Date. The Covered Fund Benefit Base cannot be transferred to another Covered Fund unless we require a Transfer as a result of the existing Covered Fund being eliminated or liquidated.
Business Day – Any day, and during the hours, on which the New York Stock Exchange is open for trading. Except as otherwise provided, in the event that a date falls on a non-Business Day, the date of the following Business Day will be used.
Contract Contributions – GLWB Participant directed amounts received and allocated to the GLWB Participant’s Covered Fund(s) including rollovers as defined under Section 402 of the Code and Transfers. Reinvested dividends, capital gains, and settlements arising from the Covered Fund(s) will not be considered Contract Contributions for the purpose of calculating the Benefit Base but will affect the Covered Fund Value.
Code – The Internal Revenue Code of 1986, as amended, and all related laws and regulations which are in effect during the term of the Contract and Certificate.
Company – Empower Annuity Insurance Company of America, the issuer of the Contract (also referred to as “we,” “us,” “our,” or Empower).
Contract Owner – The owner of the Contract that is identified on the Contract Data Page, which generally is the Plan Sponsor.
Covered Fund – Interests in the investment options held in the Account designed for the GLWB, as follows:
•Empower SecureFoundation® Balanced Fund
•Any other fund as approved by Empower for the Contract and Certificate.
Covered Fund Value – The value of the Covered Fund held in the Account.
Covered Person(s) – For purposes of this Contract, the person(s) whose age determines the GAW Percentage and on whose life the GAW Amount will be based. If there are two Covered Persons, the GAW Percentage will be based on the age of the younger life and the Installments can continue until the death of the second life. A joint Covered Person must be the GLWB Participant’s spouse and the 100% primary beneficiary under the Retirement Plan.
Distributions – Amounts paid to a GLWB Participant from the Covered Fund pursuant to the terms of the Retirement Plan and the Code.
Election Date – The date on which the Retirement Plan participant, Alternate Payee or Beneficiary elects the GLWB option in the Contract and pursuant to the terms of the Covered Fund(s) prospectus or disclosure document. The Election Date shall be the date upon which the initial Benefit Base is calculated.
Excess Withdrawal – An amount either distributed or transferred from the Covered Fund(s) during the Accumulation Phase or any amount combined with all other amounts that exceeds the annual GAW during the Withdrawal Phase. The Excess Withdrawal reduces the Benefit Base, as described in the “Accumulation Phase” section. Neither the Guarantee Benefit Fee nor any other fees or charges assessed to the Covered Fund Value as directed by the Plan Sponsor and as agreed to by Empower shall be treated as a Distribution or Excess Withdrawal for this purpose.
GLWB – A guaranteed lifetime withdrawal benefit.
GLWB Participant – A Retirement Plan participant, Alternate Payee or Beneficiary who is: (i) eligible to elect the GLWB; (ii) invested in the Covered Fund; and (iii) a Covered Person.
Guaranteed Annual Withdrawal (GAW) – The annualized withdrawal amount that is guaranteed for the lifetime of the Covered Person(s), subject to the terms of this Contract.
Guaranteed Annual Withdrawal Phase (GAW Phase) – The period of time between the Initial Installment Date and the first day of the Settlement Phase.
Guaranteed Annual Withdrawal Percentage (GAW%) – The percentage of the Benefit Base that determines the amount of the GAW. This percentage is based on the age of the Covered Person(s) as of the date we calculate the first Installment. If there are two Covered Persons the percentage is based on the age of the younger Covered Person, pursuant to Section 5.01.
Guarantee Benefit Fee – The asset charge periodically calculated and deducted from the GLWB Participant’s Covered Fund Value or assessed through another means of payment pursuant to the terms of the Contract and while the Contract is in force.
Guaranteed Lifetime Withdrawal Benefit (GLWB) – A payment option offered by the Retirement Plan that pays Installments during the life of the Covered Person(s). The Covered Person(s) will receive periodic payments in either monthly, quarterly, semiannual, or annual Installments that in total over a twelve month period equal the GAW.
Guarantee Trigger Date – For the Empower SecureFoundation® Balanced Fund, it is the date that the Covered Fund is purchased.
Initial Installment Date – The date of the first Installment under the GLWB, which must be a Business Day.
Installments – Periodic payments of the GAW during the GAW Phase and Settlement Phase. If the Covered Fund Value is less than the amount of the final Installment in the GAW Phase, Empower will pay the Installment within 7 days from the Installment Date.
Installment Frequency Options – The options listed in the GAW section.
Plan Sponsor – An entity maintaining the Retirement Plan on behalf of Retirement Plan participants, Alternate Payees and Beneficiaries.
Qualified Domestic Relations Order (QDRO) – A domestic relations order that creates or recognizes the existence of an Alternate Payee’s right to, or assigns to an Alternate Payee the right to receive all or a portion of the benefits payable with respect to a GLWB Participant and that complies with the requirements of the Code, if applicable, that and is accepted and approved by the Contract Owner for the Retirement Plan, except as otherwise agreed.
Ratchet – An increase in the Benefit Base if the Covered Fund Value exceeds the current Benefit Base on the Ratchet Date.
Ratchet Date – During the Accumulation Phase, the Ratchet Date is the anniversary of the GLWB Participant’s Election Date and each anniversary thereafter. During the GAW Phase, the Ratchet Date is the Initial Installment Date and each anniversary thereafter. If any anniversary in the Accumulation and GAW Phase is a non-Business Day, the Ratchet Date shall be the preceding Business Day for that year.
Request – An inquiry or instruction in a form satisfactory to Empower. A valid Request must be: (i) received by Empower at the Administrative Office in good order; and (ii) submitted in accordance with the provisions of the Contract, or as required by Empower. The Request is subject to any action taken by Empower before the Request was processed.
Reset – An optional GLWB Participant election during the GAW Phase in which the current GAW Percentage and Benefit Base may be changed to the GLWB Participant’s Attained Age GAW Percentage and Covered Fund Value on the Ratchet Date.
Retirement Plan – The name of the plan as noted on the first page of the Contract.
Settlement Phase – The period when the Covered Fund Value has reduced to zero, but the Benefit Base is still positive. Installments continue under the terms of the Contract.
Spouse – A person recognized as a spouse under federal law. The term does not include a party to a registered domestic partnership, civil union, or similar formal relationship recognized under state law that is not denominated a marriage under that state’s law.
Transfer – The reinvestment or exchange of all or a portion of the Covered Fund Value to or from the Covered Fund to: (i) another Covered Fund; or (ii) another investment option offered under the Retirement Plan.
Vested % – The vested portion of the Covered Fund divided by the total Covered Fund Value.
APPENDIX A– COMPANY FINANCIAL STATEMENTS AND OTHER FINANCIAL INFORMATION
MANAGEMENT'S DISCUSSION AND ANALYSIS OF FINANCIAL CONDITION AND RESULTS OF OPERATIONS (FOR THE 12 MONTH PERIOD ENDING DECEMBER 31, 2023)
Management’s discussion and analysis of financial condition and results of operations of the Company for the three years ended December 31, 2023, 2022 and 2021, are as follows. This management discussion and analysis should be read in conjunction with the financial data contained below in “Financial Statements and Supplementary Data” and our audited financial statements and notes to those statements included in this Appendix. The discussion and analysis in this Appendix includes certain forward-looking statements that are subject to risks, uncertainties and other factors, as described in “Risk Factors Regarding the Company” and elsewhere in this prospectus, that could cause our actual growth, results of operations, performance, financial position and business prospects and opportunities in 2023 and beyond to differ materially from those expressed in, or implied by, those forward-looking statements.
The Company and its subsidiaries are providers of retirement services, insurance, and other financial service products to corporate, institutional, government and individual customers. Management considers the ability to continue to expand its presence in the United States defined contribution market to be its primary point of focus. The retirement services, savings, and investments marketplace is highly competitive. Competitors include insurance companies, banks, investment advisors, mutual fund companies, and certain service and professional organizations.
The Workplace Solutions segment provides various retirement plan products (including IRAs) and investment options, as well as comprehensive administrative and recordkeeping services for financial institutions and employers, which include educational, advisory, enrollment, and communication services to employer-sponsored defined contribution plans and associated defined benefit plans. Defined contribution plans provide for benefits based upon the value of contributions to, and investment returns on, an individual’s account.
The Personal Wealth segment offers individual product solutions and provides retail wealth management products and services to individuals, including individual retirement accounts and after-tax investment accounts, with an expanded focus on retail wealth management. This segment is working to make money management simpler, clearer, and more accessible by bringing together everything a customer owns and owes in one comprehensive dashboard that they and their advisor can leverage to take control of their personal wealth. The results of the business acquired from Empower Personal Wealth, LLC, formerly known as Personal Capital Corporation, (“EPW”) are now included within this segment's results.
The Company’s Other reporting segment is substantially comprised of insurance and risk solutions as well as corporate items not directly allocated to the other operating segments and interest expense on long-term debt. It previously distributed life insurance, annuity, and retirement products to both individuals and businesses. Direct life insurance products in-force include participating and non-participating term life, whole life, universal life, and variable universal life.
On December 31, 2022, the Company and Hannover Life Reassurance Company of America (Bermuda) LTD (“Hannover”) engaged in a coinsurance with funds withheld transaction in which the Company cedes a portion of its closed in-force block of participating whole life insurance policies and established a funds withheld payable to Hannover.
On August 1, 2022, in an effort to further strengthen recognition and customer alignment with the Empower brand, Great-West Life & Annuity Insurance Company changed its legal name to Empower Annuity Insurance Company of America.
Effective April 1, 2022, the Company completed the acquisition, via share purchase and indemnity reinsurance (“the Prudential transaction”), of the full-service retirement services business of Prudential Financial, Inc. (“Prudential”) for $1.9 billion. The transaction includes acquisition via the equity purchase of the business within Empower Annuity Insurance Company, (“EAIC”) and its subsidiaries, as well as reinsurance of certain business within The Prudential Insurance Company of America (“PICA”). The business assumed is primarily group annuities. The Company has now assumed the economics and risks associated with the reinsured business, and the Company paid a $224 million reinsurance ceding commission, net of working capital adjustments. Per the PICA reinsurance transaction agreement, the Company acquired Statutory assets equal to liabilities.
The Company issued 2,591,253 additional common shares and received $810 million from EHI in March 2022 to fund the Prudential acquisition.
On August 26, 2021, the Company issued a surplus note in the face amount of $1.2 billion to EHI. The proceeds were used to partially fund the acquisition of certain businesses from Prudential Financial, Inc. The note matures on December 31, 2051. The surplus note bears an interest rate of 4.2% per annum until December 31, 2026. Starting on December 31, 2026 and on every fifth anniversary of such date thereafter, the interest rate on the note is reset to equal the five-year U.S. Treasury Rate plus 3.4%.
On August 17, 2020, the Company completed the acquisition of Personal Capital Corporation, a hybrid wealth manager that combines leading-edge digital experience with personalized advice delivered by human advisors. Under the terms of the agreement, the Company acquired the equity of Personal Capital for $825 million on closing and deferred consideration of up to $175 million subject to achievement of target growth objectives. An initial contingent consideration earn-out value of $20 million was recorded at December 31, 2020. The contingent consideration provision was increased by $80 million in 2021 for a total contingent consideration provision of $100 million at December 31, 2021. The increases in 2021 were due to growth in net new assets above the amount assumed at the date of acquisition. In 2022, the Company paid $59,000 of the contingent consideration based on metrics achieved in 2021 and then subsequently released the remaining $41,000 contingent consideration previously accrued as the current growth in net new assets was below the level where further contingent consideration would be payable. Changes in the fair value of the contingent consideration measured in accordance with the Merger Agreement subsequent to the completion of the purchase price allocation are recognized in operating and administrative expenses in the Consolidated Statements of Earnings.
On August 12, 2020, the Company issued a surplus note in the face amount of $528 million to EHI. The proceeds were used to finance the Personal Capital transaction. The surplus note bears an interest rate of 1.260% per annum and matures on August 12, 2025.
The Company and an affiliate have engaged in a modified coinsurance (“ModCo”) reinsurance agreement since 2018. The affiliate, Canada Life International Reinsurance Corporation Limited (“CLIRC”), novated the contract to Canada Life International Reinsurance (Barbados) Corporation (“CLIRBC”) and upon transfer, on December 31, 2020, increased the ceding percentage for this block of group annuity insurance policies from 40% to 90%. The Company and CLIRBC amended this agreement on December 31, 2022, which increased the ceding percentage for this block of group annuity insurance policies from 90% to 100%, increased the expense allowance rate, and increased the risk charge rate.
The Company and an affiliate have engaged in a ModCo reinsurance agreement since 2011. The affiliate, CLIRC, novated the contract to CLIRBC on December 31, 2020. Per the terms of the agreement, the Company cedes 90% of its closed in-force block of participating life insurance policies. On July 1, 2022, the Company terminated its reinsurance agreement with CLIRBC.
The S&P 500 index ended 2023 up by 24% as compared to 2022, while 2022 was down by 19% when compared to 2021. The average of the S&P 500 index during the year ended December 31, 2023, was up by 4% when compared to the average for the year ended December 31, 2022, and the average was up by 4% for the year ended December 31, 2022, when compared to the average for the year ended December 31, 2021.
Variable asset-based fees earned by the Company fluctuate with changes in participant account balances. Participant account balances change due to cash flow and market gains and losses, which are primarily associated with changes in the United States equities market. Fee income decreased by $3.6 million, or 1.5%, to $230.8 million for the year ended December 31, 2023, when compared to 2022.
The 10-year U.S. Treasury rate ended 2023 with a 0 basis point change as compared to 2022, while 2022 was up by 236 basis points when compared to 2021. The average of the 10-year U.S. Treasury rate during the year ended December 31, 2023 ended up by 101 basis points when compared to the average for the year ended December 31, 2022, and the average was up by 150 basis points for the year ended December 31, 2022, when compared to the average for the year ended December 31, 2021.
Summary of Critical Accounting Judgments and Estimates
The Company prepares its statutory financial statements in conformity with accounting practices prescribed or permitted by the Colorado Division of Insurance (“The Division”). The Division requires that insurance companies domiciled in the State of Colorado prepare their statutory financial statements in accordance with the National Association of Insurance Commissioners Accounting Practices and Procedures Manual (“NAIC SAP”), subject to any deviations prescribed or permitted by the State of Colorado Insurance Commissioner.
The only prescribed deviation that impacts the Company allows the Company to account for certain separate account products at book value instead of fair value. The Division has not permitted the Company to adopt any other accounting practices that have an impact on the Company’s statutory financial statements as compared to NAIC SAP or the Division’s prescribed accounting practices. There is no impact to either capital and surplus or net income as a result of the prescribed accounting practice.
The Company has identified the following accounting policies, judgments, and estimates as critical in that they involve a higher degree of judgment and are subject to a significant degree of variability:
•Valuation of investments
•Impairment of investments
•Valuation of derivatives and related hedge accounting
•Valuation of policy benefits
•Valuation of deferred taxes
The Company’s investments are in bonds, mortgage loans, real estate, contract loans, and other investments. The Company’s investments are exposed to three primary sources of risk: credit, interest rate, and market valuation. The financial statement risks, stemming from such investment risks, are those associated with the determination of fair values.
The fair values for bonds are generally based upon evaluated prices from independent pricing services. In cases where these prices are not readily available, fair values are estimated by the Company. To determine estimated fair value for these instruments, the Company generally utilizes discounted cash flow models with market observable pricing inputs such as spreads, average life and credit quality. Fair value estimates are made at a specific point in time, based on available market information and judgments about financial instruments, including estimates of the timing and amounts of expected future cash flows and the credit standing of the issuer or counterparty. The use of different market assumptions and/or estimation methodologies may have a material effect on the estimated fair value amounts of the Company’s financial instruments.
Impairment of investments
The Company evaluates its general account investments on a quarterly basis to determine whether there has been an other-than-temporary decline in fair value below the amortized cost basis. Assumptions and estimates about the issuer’s operations and ability to generate future cash flows are inherent in management’s evaluation of investments for other- than-temporary impairments (“OTTI”). The assessment of whether an OTTI has occurred is based upon management’s case-by-case evaluation of the underlying reasons for the decline in fair value of each individual security. An OTTI is recorded (a) if it is probable that the Company will be unable to collect all amounts due according to the contractual terms in effect at the date of acquisition, (b) if the Company has the intent to sell the investment or (c) for non-interest related declines in value and where the Company does not have the intent and ability at the reporting date, to hold the bond until its recovery. Management considers a wide range of factors regarding the security issuer and uses its best judgment in evaluating the cause of the decline in its estimated fair value and in assessing the prospects for near-term recovery. While all available information is taken into account, it is difficult to predict the ultimate recoverable amount from a distressed or impaired security. The evaluation of impairments is a quantitative and qualitative process, which is subject to risks and uncertainties and is intended to determine whether declines in the fair value of investments
should be recognized in current period earnings. The risks and uncertainties include changes in general economic conditions, the issuer’s financial condition or near term recovery prospects, the effects of changes in interest rates or credit spreads, and the recovery period.
If an OTTI has occurred on loan-backed and structured securities, the impairment amount is bifurcated into two components: the amount related to the non-interest loss and the amount attributed to other factors. The calculation of expected cash flows utilized during the impairment evaluation and bifurcation process is determined using judgment and the best information available to the Company including default rates, credit ratings, collateral characteristics, and current levels of subordination.
The determination of the calculation and the adequacy of the mortgage allowance for credit loss and mortgage impairments (when management deems it probable that the Company will be unable to collect all amounts due according to the contractual terms of the loan agreement) involve judgments that incorporate qualitative and quantitative Company and industry mortgage performance data. Management’s periodic evaluation and assessment of the adequacy of the mortgage provision allowance and the need for mortgage impairments is based on known and inherent risks in the portfolio, adverse situations that may affect the borrower’s ability to repay, the fair value of the underlying collateral, composition of the loan portfolio, current economic conditions, loss experience, and other relevant factors.
Valuation of derivatives and related hedge accounting
Derivatives that qualify for hedge accounting treatment are valued using the valuation method (either amortized cost or fair value) consistent with the underlying hedged asset or liability. Derivatives where hedge accounting is either not elected or that are not eligible for hedge accounting are stated at fair value; changes in fair values are recognized in unassigned surplus in the period of change.
The fair value of derivatives is determined by quoted market prices or through the use of pricing models. The determination of fair value, when quoted market values are not available, is based on valuation methodologies and assumptions deemed appropriate under the circumstances. Values can be affected by changes in interest rates, foreign currency exchange rates, financial indices, credit spreads, market volatility, and liquidity. Judgment is applied in determining the availability and application of hedge accounting designations and the appropriate accounting treatment under accounting guidance. If it were determined that hedge accounting designations were not appropriately applied, reported capital and surplus could be materially affected. Differences in judgment as to the availability and application of hedge accounting designations and the appropriate accounting treatment may result in a differing impact on the financial statements of the Company from that previously reported. Assessments of hedge effectiveness and measurements of ineffectiveness of hedging relationships are also subject to interpretations and estimations and different interpretations or estimates may have a material effect on the amount reported in capital and surplus.
Goodwill is from acquisitions of subsidiaries that are reported in common stock and other invested assets and is the excess of the purchase price over the book value of the entity acquired. Statutory goodwill is amortized to unrealized capital gains/(losses) over the period in which the Company benefits economically, not to exceed ten years. Admissible goodwill is limited in the aggregate to 10% of the Company’s adjusted capital and surplus. The Company tests goodwill for impairment annually or more frequently if events or circumstances indicate that there may be justification for conducting an interim test. If the carrying value of goodwill exceeds its fair value, the excess is recognized as impairment and recorded as a realized loss in the period in which the impairment is identified.
Life insurance and annuity policy reserves with life contingencies are computed on the basis of statutory mortality and interest requirements and without consideration for withdrawals. Annuity contract reserves without life contingencies are computed on the basis of statutory interest requirements.
Policy reserves for life insurance are valued in accordance with the provision of applicable statutory regulations. Life insurance reserves are determined principally using the Commissioner’s Reserve Valuation Method, using the statutory mortality and interest requirements, without consideration for withdrawals. Some policies contain a surrender value in excess of the reserve as legally computed. This excess is calculated and recorded on a policy-by-policy basis.
Premium stabilization reserves are calculated for certain policies to reflect the Company’s estimate of experience refunds and interest accumulations on these policies. The reserves are invested by the Company. The income earned on these investments is accumulated in this reserve and is used to mitigate future premium rate increases for such policies.
Policy reserves ceded to other insurance companies are recorded as a reduction of the reserve liabilities. The cost of reinsurance related to long-duration contracts is accounted for over the life of the underlying reinsured policies using assumptions consistent with those used to account for the underlying policies.
Policy and contract claims include provisions for reported life and health claims in process of settlement, valued in accordance with the terms of the related policies and contracts, as well as provisions for claims incurred but not reported based primarily on prior experience of the Company. As such, amounts are estimates, and the ultimate liability may differ from the amount recorded. Any changes in estimates will be reflected in the results of operations when additional information becomes known.
The liabilities for health claim reserves are determined using historical run-out rates, expected loss ratios and statistical analysis. The Company provides for significant claim volatility in areas where experience has fluctuated. The liabilities represent estimates of the ultimate net cost of all reported and unreported claims which are unpaid at year-end. Those estimates are subject to considerable variability in claim severity and frequency. The estimates are continually reviewed and adjusted as necessary as experience develops or new information becomes known; such adjustments are included in current operations.
Liability reserves for variable annuities with guarantees and universal life without secondary guarantees are valued in accordance with Principle-Based Reserving (PBR) methods, outlined in NAIC Valuation Manual Sections 20 and 21. PBR utilizes stochastic models to calculate levels of reserves to cover future benefits that would occur under potentially adverse conditions.
Valuation of deferred taxes
A net deferred tax asset is included in the Statutory Statements of Admitted Assets, Liabilities, Capital and Surplus which is recorded using the asset and liability method in which deferred tax assets and liabilities are recorded for expected future tax consequences of events that have been recognized in either the Company’s statutory financial statements or tax returns. Deferred income tax assets are subject to admissibility limitations prescribed by statutory accounting principles which include estimates of future tax events. The change in deferred income taxes is treated as a component of the change in unassigned deficit.
Company Results of Operations
Year ended December 31, 2023, compared with the year ended December 31, 2022
The following is a summary of certain financial data of the Company:
Statement of Operations data (In millions) | | |
| | |
Premium income and annuity consideration | | | |
| | | |
Reserve adjustment on reinsurance ceded | | | |
| | | |
| | | |
| | | |
| | | |
Increase (decrease) in aggregate reserves for life and accident health policies and contracts | | | |
Other insurance benefits, expenses and commissions | | | |
Net transfers from separate accounts | | | |
Total benefits and expenses | | | |
| | | |
Net gain (loss) from operations before dividends to policyholders, federal income taxes, and net realized capital gains (losses) | | | |
Dividends to policyholders | | | |
Net gain (loss) from operations after dividends to policyholders and before federal income taxes and net realized capital gains (losses) | | | |
Federal income tax expense (benefit) | | | |
Net gain (loss) from operations before net realized capital gains (losses) | | | |
Net realized capital (gains) losses less capital gains tax and transfers to interest maintenance reserve | | | |
| | | |
The Company’s net income increased by $517 million, to $1,026 million. The increase was primarily due to increased investment income and the non-recurrence of the initial ceding commission for the Prudential acquisition.
Net investment income increased by $450 million, to $1,969 million primarily due to the dividends from investments in subsidiaries.
Premium income and annuity consideration, reserve adjustment on reinsurance ceded, and change in aggregate reserves for life and accident health policies and contracts all decreased due to the non-recurrence of the Prudential acquisition in 2022 as well as additional reinsurance agreements changes associated with CLIRBC and Hannover.
Policyholder benefits increased by $4,442 million, to $16,509 million primarily due to additional surrender benefit claims incurred from participants.
Year ended December 31, 2022, compared with the year ended December 31, 2021
The following is a summary of certain financial data of the Company:
Statement of Operations data (In millions) | | |
| | | |
Premium income and annuity consideration | | | | |
| | | | |
Reserve adjustment on reinsurance ceded | | | | |
| | | | |
| | | | |
| | | | |
| | | | |
Increase (decrease) in aggregate reserves for life and accident health policies and contracts | | | | |
Other insurance benefits, expenses and commissions | | | | |
Net transfers from separate accounts | | | | |
Total benefits and expenses | | | | |
| | | | |
Net gain (loss) from operations before dividends to policyholders, federal income taxes, and net realized capital gains (losses) | | | | |
Dividends to policyholders | | | | |
Net gain (loss) from operations after dividends to policyholders and before federal income taxes and net realized capital gains (losses) | | | | |
Federal income tax expense (benefit) | | | | |
Net gain from operations before net realized capital gains | | | | |
Net realized capital (gains) losses less capital gains tax and transfers to interest maintenance reserve | | | | |
| | | | |
The Company’s net income increased by $210 million, to $509 million. The increase was primarily due to increased investment income and acquired assets as a result of the Prudential acquisition.
Premium income and annuity consideration increased by $6,750 million, to $13,077 million primarily due to the inclusion of Prudential premium income acquired in 2022, as well as the recapture of premiums associated with the termination of the modified coinsurance agreement with CLIRBC.
Net investment income increased by $256 million, to $1,519 million primarily due to the income earned on the invested assets transferred from Prudential.
The reserve adjustment on reinsurance ceded changed by $3,684 million, to $(5,203) million primarily due to EAICA terminating the participating insurance modified coinsurance agreement with CLIRBC.
Change in aggregate reserves for life and accident health policies and contracts changed by $3,669 million, to $2,630 million primarily due to the non-recurrence of initial reserves transferred as part of the acquired Prudential business.
Workplace Solutions Segment Results of Operations
Year ended December 31, 2023, compared with the year ended December 31, 2022
The following is a summary of certain financial data of the Workplace Solutions(1) segment:
Statement of Operations data (In millions) | | |
| | |
Premium income and annuity consideration | | | |
| | | |
Reserve adjustment on reinsurance ceded | | | |
| | | |
| | | |
| | | |
| | | |
(Decrease) increase in aggregate reserves for life and accident health policies and contracts | | | |
Other insurance benefits, expenses and commissions | | | |
Net transfers from separate accounts | | | |
Total benefits and expenses | | | |
| | | |
Net gain (loss) from operations before dividends to policyholders, federal income taxes, and net realized capital gains (losses) | | | |
Dividends to policyholders | | | |
Net gain (loss) from operations after dividends to policyholdersand before federal income taxes and net realized capital gains (losses) | | | |
Federal income tax expense (benefit) | | | |
Net gain from operations before net realized capital (losses) gains | | | |
Net realized capital losses (gains) less capital gains tax and transfers to interest maintenance reserve | | | |
| | | |
Net income for the Workplace Solutions segment increased by $95 million, to $767 million. The increase is primarily due to the dividends from investments in subsidiaries.
Premium income and annuity consideration decreased by $2,766 million, to $5,432 million primarily due to the non-recurrence of the prior year acquisition of Prudential as well as the termination and recapture of premiums and related commissions associated with the termination of the modified coinsurance agreement with CLIRBC.
Reserve adjustment on reinsurance ceded changed by $2,458 million, to $(1,673) million primarily due to the prior year acquisition of Prudential as well as the termination of its modified coinsurance agreement with CLIRBC and recapture of underlying policies and their related obligations and liabilities.
Change in aggregate reserves for life and accident health policies and contracts decreased by $6,539 million, to $(3,205) million primarily due to the prior year termination of its modified coinsurance agreement with CLIRBC and recapture of underlying policies and their related obligations and liabilities.
Year ended December 31, 2022, compared with the year ended December 31, 2021
The following is a summary of certain financial data of the Workplace Solutions(1) segment:
Statement of Operations data (In millions) | | |
| | |
Premium income and annuity consideration | | | |
| | | |
Reserve adjustment on reinsurance ceded | | | |
| | | |
| | | |
| | | |
| | | |
(Decrease) increase in aggregate reserves for life and accident health policies and contracts | | | |
Other insurance benefits, expenses and commissions | | | |
Net transfers from separate accounts | | | |
Total benefits and expenses | | | |
| | | |
Net gain (loss) from operations before dividends to policyholders, federal income taxes, and net realized capital gains (losses) | | | |
Dividends to policyholders | | | |
Net gain (loss) from operations after dividends to policyholders and before federal income taxes and net realized capital gains (losses) | | | |
Federal income tax benefit | | | |
Net gain from operations before net realized capital gains | | | |
Net realized capital (gains) losses less capital gains tax and transfers to interest maintenance reserve | | | |
| | | |
Net income for the Workplace Solutions segment increased by $419 million, to $672 million. The increase is primarily due to net investment income.
Premium income and annuity consideration increased by $1,920 million, to $8,198 million primarily due to the acquisition of Prudential as well as the termination and recapture of premiums and related commissions associated with the termination of the modified coinsurance agreement with CLIRBC.
Reserve adjustment on reinsurance ceded changed by $1,889 million, to $785 million primarily due to the termination of its modified coinsurance agreement with CLIRBC and recapture of underlying policies and their related obligations and liabilities.
Change in aggregate reserves for life and accident health policies and contracts changed by $4,218 million, to $3,334 million primarily due to the termination of its modified coinsurance agreement with CLIRBC.
Net transfers from separate accounts changed by $2,546 million, to $(5,587) million. The change is primarily due to the market environment.
Personal Wealth Segment Results of Operations
Year ended December 31, 2023, compared with the year ended December 31, 2022
The following is a summary of certain financial data of the Personal Wealth(1) segment:
Statement of Operations data (In millions) | | |
| | |
Premium income and annuity consideration | | | |
| | | |
Reserve adjustment on reinsurance ceded | | | |
| | | |
| | | |
| | | |
| | | |
(Decrease) increase in aggregate reserves for life and accident health policies and contracts | | | |
Other insurance benefits, expenses and commissions | | | |
Net transfers from separate accounts | | | |
Total benefits and expenses | | | |
| | | |
Net gain (loss) from operations before dividends to policyholders, federal income taxes, and net realized capital gains (losses) | | | |
Dividends to policyholders | | | |
Net gain (loss) from operations after dividends to policyholders and before federal income taxes and net realized capital gains (losses) | | | |
Federal income tax benefit | | | |
Net gain from operations before net realized capital gains | | | |
Net realized capital losses (gains) less capital gains tax and transfers to interest maintenance reserve | | | |
| | | |
Net income for the Personal Wealth segment increased by $125 million, to $133 million. The increase was primarily due to increased investment income and lower operating expenses.
Policyholder benefits increased by $2,144 million, to $2,161 million primarily due to the transfer of retail plans and policies in to this segment and the related claims from policyholders.
Change in aggregate reserves for life and accident health policies and contracts changed by $4,265 million, to $(2,120) million primarily due to the prior year initial reserves transferred as part of the acquired Prudential business.
Year ended December 31, 2022, compared with the year ended December 31, 2021
The following is a summary of certain financial data of the Personal Wealth(1) segment:
Statement of Operations data (In millions) | | |
| | |
Premium income and annuity consideration | | | |
| | | |
Reserve adjustment on reinsurance ceded | | | |
| | | |
| | | |
| | | |
| | | |
Increase in aggregate reserves for life and accident health policies and contracts | | | |
Other insurance benefits, expenses and commissions | | | |
Net transfers from separate accounts | | | |
Total benefits and expenses | | | |
| | | |
Net gain (loss) from operations before dividends to policyholders, federal income taxes, and net realized capital gains (losses) | | | |
Dividends to policyholders | | | |
Net gain (loss) from operations after dividends to policyholders and before federal income taxes and net realized capital gains (losses) | | | |
Federal income tax benefit | | | |
Net gain from operations before net realized capital gains | | | |
Net realized capital losses (gains) less capital gains tax and transfers to interest maintenance reserve | | | |
| | | |
Net income for the Personal Wealth segment increased by $6 million, to $8 million. The increase was primarily due to increased investment income, partially offset by increases in higher operating expenses.
Premium income and annuity consideration increased by $2,120 million, to $2,120 million primarily due to the initial premiums acquired as part of the Prudential business acquisition.
Change in aggregate reserves for life and accident health policies and contracts changed by $2,145 million, to $2,145 million primarily due to the initial reserves transferred as part of the Prudential business acquisition.
Other Segment Results of Operations
Year ended December 31, 2023, compared with the year ended December 31, 2022
The following is a summary of certain financial data of the Other(1) segment:
Statement of Operations data (In millions) | | |
| | |
Premium income and annuity consideration | | | |
| | | |
Reserve adjustment on reinsurance ceded | | | |
| | | |
| | | |
| | | |
| | | |
Increase in aggregate reserves for life and accident health policies and contracts | | | |
Other expenses and commissions | | | |
Net transfers from separate accounts | | | |
Total benefits and expenses | | | |
| | | |
Net gain (loss) from operations before dividends to policyholders, federal income taxes, and net realized capital gains (losses) | | | |
Dividends to policyholders | | | |
Net gain (loss) from operations after dividends to policyholders and before federal income taxes and net realized capital gains (losses) | | | |
Federal income tax benefit | | | |
Net gain from operations before net realized capital gains | | | |
Net realized capital losses (gains) less capital gains tax and transfers to interest maintenance reserve | | | |
| | | |
Net income for the Other segment increased by $297 million, to $126 million. The increase was primarily due to increased net investment income as well as prior year reinsurance agreements terminated and recaptured with CLIRBC.
Premium income and annuity consideration decreased by $2,662 million to $97 million primarily due to the prior year acquired premiums as the result of the recapture of premiums associated with the terminated reinsurance agreement with CLIRBC.
Reserve adjustment on reinsurance ceded decreased by $5,987 million to $0 million primarily due to the prior year termination and recapture of the reinsurance agreement with CLIRBC.
Change in aggregate reserves for life and accident health policies and contracts changed by $2,732 million to $(117) million primarily due to the reinsurance agreements in the prior year which were terminated and recaptured with CLIRBC.
Year ended December 31, 2022, compared with the year ended December 31, 2021
The following is a summary of certain financial data of the Other(1) segment:
Statement of Operations data (In millions) | | |
| | |
Premium income and annuity consideration | | | |
| | | |
Reserve adjustment on reinsurance ceded | | | |
| | | |
| | | |
| | | |
| | | |
Increase in aggregate reserves for life and accident health policies and contracts | | | |
Other expenses and commissions | | | |
Net transfers from separate accounts | | | |
Total benefits and expenses | | | |
| | | |
Net gain (loss) from operations before dividends to policyholders, federal income taxes, and net realized capital gains (losses) | | | |
Dividends to policyholders | | | |
Net gain (loss) from operations after dividends to policyholders and before federal income taxes and net realized capital gains (losses) | | | |
Federal income tax benefit | | | |
Net gain from operations before net realized capital gains | | | |
Net realized capital losses (gains) less capital gains tax and transfers to interest maintenance reserve | | | |
| | | |
Net income for the Other segment decreased by $213 million, to $(171) million. The decrease was primarily due to decreased net investment income as well as reinsurance agreements terminated and recaptured with CLIRBC.
Premium income and annuity consideration increased by $2,710 million to $2,759 million primarily due to the acquired premiums as the result of the recapture of premiums associated with the terminated reinsurance agreement with CLIRBC.
Reserve adjustment on reinsurance ceded decreased by $5,572 million to $(5,987) million primarily due to termination and recapture of the reinsurance agreement with CLIRBC.
Change in aggregate reserves for life and accident health policies and contracts changed by $2,694 million to $(2,849) million primarily due to the reinsurance agreements which were terminated and recaptured with CLIRBC.
The Company’s primary investment objective is to acquire assets with duration and cash flow characteristics reflective of its liabilities, while meeting industry, size, issuer and geographic diversification standards. Formal liquidity and credit quality parameters have also been established.
The Company follows rigorous procedures to control interest rate risk and observes strict asset and liability matching guidelines. These guidelines ensure that even under changing market conditions, the Company’s assets should meet the cash flow and income requirements of its liabilities. Using dynamic modeling to analyze the effects of a range of possible market changes upon investments and policyholder benefits, the Company works to ensure that its investment portfolio is appropriately structured to fulfill financial obligations to its policyholders.
The following table presents the percentage distribution of the admitted values of the Company’s general account investment portfolio:
| |
| |
| | | | |
| | | | |
| | | | |
| | | | |
| | | | |
| | | | |
Cash, cash equivalents and short-term investments | | | | |
Securities lending collateral assets | | | | |
| | | | |
Total cash and invested assets | | | | |
Bonds include public and privately placed corporate bonds, government bonds, and mortgage-backed and asset-backed securities. Included in bonds are perpetual debt investments which primarily consist of junior subordinated debt instruments that have no stated maturity date but pay fixed or floating interest in perpetuity. The Company’s strategy related to mortgage-backed and asset-backed securities is to focus on those investments with low prepayment risk and minimal credit risk.
Private placement investments are generally less marketable than publicly traded assets, yet they typically offer enhanced covenant protection that allows the Company, if necessary, to take appropriate action to protect its investment. The Company believes that the cost of the additional monitoring and analysis required by private placement investments is more than offset by their enhanced yield.
One of the Company’s primary objectives is to ensure that its bond portfolio is maintained at a high average credit quality to limit credit risk. All securities are internally rated by the Company on a basis intended to be similar to that of independent external rating agencies.
The percentage distribution of the book adjusted carrying value of the Company’s long-term bond portfolio by NAIC designation is summarized as follows:
The percentage distribution of the book adjusted carrying value of the industrial and miscellaneous category of the long-term bond portfolio, calculated as a percentage of total bonds, is summarized as follows:
Common Stocks
The Company’s common stocks are comprised primarily of investments in subsidiaries. Investments in domestic life subsidiaries and certain other subsidiaries are carried at their statutory equity value whereas investments in majority owned subsidiaries are generally carried at their Statutory or US GAAP equity value.
The Company’s mortgage loans are comprised primarily of domestic commercial collateralized loans. The mortgage loan portfolio is diversified with regard to geographical markets and commercial mortgage property types. The Company originates, directly or through correspondents, or acquires mortgages in the secondary market with the intent to hold to maturity. The Company’s portfolio includes loans which are fully amortizing, amortizing with a balloon balance at maturity, interest only to maturity, and interest only for a number of years followed by an amortizing period.
The Company uses certain derivatives, such as futures, swaps, forwards, options, and interest rate swaptions, for purposes of managing the interest rate, foreign currency exchange rate, and equity market risks impacting the Company’s business. These derivatives, when taken alone, may subject the Company to varying degrees of market and credit risk; however, since used for hedging purposes, these instruments are intended to reduce risk. Derivatives that qualify for hedge accounting treatment are valued using the valuation method (either amortized cost or fair value) consistent with the underlying hedged asset or liability. At inception of a derivative transaction, the hedge relationship and risk management objective is documented and the designation of the derivative is determined based on specific criteria of the transaction. Derivatives where hedge accounting is either not elected or that are not eligible for hedge accounting are stated at fair value with changes in fair value recognized in unassigned surplus in the period of change. Investment gains and losses generally result from the termination of derivative contracts prior to expiration and are generally recognized in net income and may be subject to IMR. For derivative instruments where hedge accounting is either not elected or the transactions are not eligible for hedge accounting, changes in interest rates, foreign currencies, or equity markets may generate derivative gains or losses which may cause the Company to experience volatility in capital and surplus. The Company controls the credit risk of its over-the-counter derivative contracts through credit approvals, limits, monitoring procedures, and in most cases, requiring collateral. Risk of loss is generally limited to the portion of the fair value of derivative instruments that exceeds the value of the collateral held and not to the notional or contractual amounts of the derivatives.
Net investment income includes interest income, dividends, the amortization of premiums, discounts and origination fees.
To analyze investment performance, the Company excludes net investment income related to derivative instruments in order to assess underlying profitability and results from ongoing operations. Net investment income performance is summarized as follows:
| |
| | | |
| | | |
| | | |
Net investment income from derivative instruments | | | |
Net investment income excluding derivative investments | | | |
Average invested assets, at amortized cost | | | |
Yield on average invested assets | | | |
Liquidity and Capital Resources
Liquidity refers to a company’s ability to generate sufficient cash flows to meet the short-term needs of its operations. The Company manages its operations to create stable, reliable, and cost-effective sources of cash flows to meet all of its obligations. The liquidity of the Company’s investment portfolio is regularly monitored to ensure that a sufficient amount of liquid assets are held to meet its obligations under a variety of market stress scenarios.
The principal sources of the Company’s liquidity are premiums and contract deposits, fees, investment income, and investment maturities and sales. Funds provided from these sources are reasonably predictable and normally exceed liquidity requirements for payment of policy benefits, payments to policy and contract holders in connection with surrenders and withdrawals, and general expenses. However, since the timing of available funds cannot always be matched precisely to commitments, imbalances may arise when demands for funds exceed those on hand. A primary liquidity concern regarding cash flows from operations is the risk of early policyholder and contract holder withdrawals. To mitigate that risk the Company’s group annuity contracts include provisions to protect the Company against a sudden redemption by group customers through either market value adjustments applicable to the redemption value or the ability to defer payments over a period time. A primary liquidity concern regarding investment activity is the risk of defaults and market volatility.
In addition, a demand for funds may arise as a result of the Company taking advantage of current investment opportunities. The sources of the funds that may be required in such situations include the issuance of commercial paper or other debt instruments.
Management believes that the liquidity profile of its assets is sufficient to satisfy the short-term liquidity requirements of reasonably foreseeable scenarios.
Generally, the Company has met its operating requirements by utilizing cash flows from operations and maintaining appropriate levels of liquidity in its investment portfolio. Liquidity for the Company is evidenced by the amounts of short-term investments and cash and cash equivalents that totaled $1,649 million and $375 million as of December 31, 2023 and 2022, respectively. In addition, 98% and 98% of the bond portfolio carried an investment grade rating at December 31, 2023 and 2022, respectively, which provides liquidity to the Company’s overall investment portfolio.
The Company continues to be well capitalized with sufficient borrowing capacity. Additionally, the Company anticipates that liquid investments and the borrowing capacity, as well as the net cash generated by operating activities will be sufficient to meet the forecasted needs of the business. The Company’s financial strength provides the capacity and flexibility to enable it to raise funds in the capital markets through the issuance of commercial paper. The Company had $100 million and $100 million of commercial paper outstanding as of December 31, 2023 and 2022, respectively. The commercial paper has been given a rating of A-1+ by Standard & Poor’s Ratings Services and a rating of P-1 by Moody’s Investors Service, each being the highest rating available. The Company’s issuance of commercial paper is not used to fund daily operations and does not have a significant impact on the Company’s liquidity.
The Company also has available a revolving credit facility agreement with U.S. Bank, which expires on November 1, 2028, in the amount of $50 million for general corporate purposes. The Company had no borrowings under this credit facility as of or during the year ended December 31, 2023. The Company does not anticipate the need for borrowings under this facility and the loss of its availability would not significantly impact its liquidity.
The Company is a member of the Federal Home Loan Bank of Topeka (“FHLB”) which provides access to billions of low-cost funding dollars to banks, credit unions, insurance companies and community development financial institutions in the United States. At December 31, 2023, the Company had assets of approximately $442 million that could be used as collateral for any draw with the FHLB. No amounts were borrowed as of December 31, 2023.
The Company's indirect parent, Great-West Lifeco U.S., maintains a line of credit which could be drawn on as an alternate source of liquidity.
Capital resources provide protection for policyholders and financial strength to support the underwriting of insurance risks and allow for continued business growth. The amount of capital resources that may be needed is determined by the Company’s senior management and Board of Directors, as well as by regulatory requirements. The allocation of resources to new long-term business commitments is designed to achieve an attractive return, tempered by considerations of risk and the need to support the Company’s existing business.
Risk-based capital (“RBC”) is a regulatory tool for measuring the minimum amount of capital appropriate for a life, accident and health organization to support its overall business operations in consideration of its size and risk profile. The Division requires the Company to maintain minimum capital and surplus equal to the company action level as calculated in the RBC model. The Company exceeds the required amount.
Off-Balance Sheet Arrangements
The Company makes commitments to fund partnership interests, mortgage loans, and other investments in the normal course of its business. The amounts of these unfunded commitments at December 31, 2023 and 2022 were $762 million and $889 million, respectively. The precise timing of the fulfillment of the commitment cannot be predicted; however, these amounts may be required to be paid within one year of the dates indicated. There are no other obligations or liabilities arising from such arrangements that are reasonably likely to become material.
The Company enters into derivative transactions to manage various risks, including interest rate and foreign currency exchange risk associated with its invested assets and liabilities. Derivatives in a net asset position may have cash or securities pledged as collateral to the Company in accordance with the collateral support agreements with the counterparty. Securities pledged to the Company were $121 million and $2 million at December 31, 2023 and 2022, respectively, are held in a custodial account for the benefit of the Company, and generally consist of U.S. government or U.S. government agency securities. These securities have not been recorded on the Statutory Statements of Admitted Assets, Liabilities, Capital and Surplus.
The Company, as lessee, has entered into various lease and sublease agreements primarily for the rental of office space.
The Company maintains a corporate credit facility agreement in the amount of $50 million for general corporate purposes. The Company had no borrowings under the credit facility either at or during the years ended December 31, 2023 and 2022.
In addition, the Company has other letters of credit with a total amount of $9 million, renewable annually for an indefinite period of time.
As part of the Personal Capital acquisition, the Company included contingent consideration based on the potential achievement of certain key metrics. An initial contingent consideration earn-out value of $20 million represented management’s best estimate, which could be up to $175 million based on the achievement of growth in assets under management metrics defined in the Merger Agreement, payable following measurements through December 31, 2021 and December 31, 2022.
The contingent consideration provision was increased by $80,000 in 2021 for a total contingent consideration provision of $100,000 at December 31, 2021. The increase in 2021 was due to growth in net new assets above the amount assumed at the date of acquisition. In 2022, the Company paid $59,000 of the contingent consideration based on metrics achieved in 2021 and then subsequently released the remaining $41,000 contingent consideration previously accrued as the current growth in net new assets was below the level where further contingent consideration would be payable. Changes in the fair value of the contingent consideration measured in accordance with the Merger Agreement subsequent to the completion of the purchase price allocation are recognized in operating and administrative expenses in the Consolidated Statements of Earnings.
Rent expense for the years ended December 31, 2023, 2022 and 2021 were $29,844, $29,024 and $30,243 respectively.
From time to time, the Company enters into agreements or contracts, including capital leases, to purchase goods or services in the normal course of its business. However, these agreements and contracts are not material and are excluded from the table above.
Application of Recent Accounting Pronouncements
See Note 2 to the accompanying financial statements for a further discussion of the application of recent accounting pronouncements.
Quantitative and Qualitative Disclosures About Market Risk
The Company has established processes and procedures to effectively identify, monitor, measure, and manage the risks associated with its invested assets and its interest rate sensitive insurance and annuity products. Management has identified investment portfolio management, including the use of derivative instruments, insurance and annuity product design, and asset/liability management as three critical means to accomplish a successful risk management program.
The major risks to which the Company is exposed include the following:
•Market risk - the potential of loss arising from adverse fluctuations in interest rates and equity market prices and the levels of their volatility.
•Insurance risk - the potential of loss resulting from claims, persistency, and expense experience exceeding that assumed in the liabilities held.
•Credit risk - the potential of loss arising from an obligor’s failure to meet its obligations to the Company.
•Operational and corporate risk - the potential of direct or indirect loss resulting from inadequate or failed internal processes, people and systems, or from other external events.
The Company’s exposure to interest rate changes results from its significant holdings of floating rate debt, bonds, mortgage loans, and interest rate sensitive liabilities. The bonds primarily consist of direct obligations of the U.S. government and its agencies, direct obligations of U.S. states and their subdivisions, corporate debt securities, and asset-backed and mortgage-backed securities. All of these investments are exposed to changes in interest rates. Interest rate sensitive product liabilities, primarily those liabilities associated with annuity contracts and universal life insurance contracts,, have the same type of interest rate risk exposure as bonds and mortgage loans.
To reduce interest rate risk, the Company performs periodic projections of asset and liability cash flows in order to evaluate the interest rate sensitivity of its bonds and its product liabilities to interest rate movements. For determinate liabilities, i.e. liabilities with stable, predictable cash flows on products that can’t be repriced (for example, certificate annuities and payout annuities), asset/liability cash flow mismatches are monitored and the asset portfolios are rebalanced as necessary to keep the mismatches within tolerance limits. For these determinate liabilities, the investment policy predominantly requires assets with stable, predictable cash flows so that changes in interest rates will not cause changes in the timing of asset cash flows resulting in mismatches. For indeterminate liabilities, i.e. liabilities that have less predictable cash flows but that can be repriced (for example, portfolio annuities), the potential mismatch of assets and liabilities is tested under a wide variety of interest rate scenarios. The potential cost of this mismatch is calculated. If the potential cost is considered to be too high, actions considered would include rebalancing the asset portfolio and/or purchasing derivatives that reduce the risk as part of the hedging strategy program discussed below. For each major block of indeterminate liabilities, the asset and liability positions are reviewed in senior management meetings to proactively recommend changes in the current investment strategy and/or a rebalance of the asset portfolio.
The Company has strict operating policies which prohibit the use of derivative instruments for speculative purposes, permit derivative transactions only with approved counterparties, specify limits on concentration of risk, and provide requirements of reporting and monitoring systems. The Company supports a hedging strategy program that consists of the use of various derivative instruments including futures, interest rate swaps, and options such as interest rate swaptions. Derivative strategies include the following:
Futures are commitments to either purchase or sell designated financial instruments at a future date for a specified price.
Interest rate swaps involve the periodic exchange of cash flows with third parties at specified intervals calculated using agreed upon rates or other financial variables.
Option contracts grant the purchaser, in consideration for the payment of a premium, the right to either purchase from or sell to the issuer a financial instrument at a specified price within a specified time period or on a stated date. Interest rate swaptions grant the purchaser the right to enter into a swap with predetermined fixed-rate payments over a predetermined time period on the exercise date.
The Company has estimated the possible effects of interest rate changes at December 31, 2023. If interest rates increased by 100 basis points (1.00%), the December 31, 2023 fair value of the fixed income assets in the general account would decrease by approximately $1.8 billion. If interest rates decreased by 100 basis points (1.00%), the December 31, 2022 fair value of the fixed income assets in the general account would increase by approximately $1.9 billion. These calculations use projected asset cash flows, discounted back to December 31, 2023. The cash flow projections are shown in the table below. The table below shows cash flows rather than expected maturity dates because many of the Company’s assets have substantial expected principal payments prior to the final maturity date. The fair value shown in the table below was calculated using spot discount interest rates that varied by the year in which the cash flows are expected to be received. The spot rates in the benchmark calculation range from 4.26% to 5.51%.
Projected cash flows by calendar years (In millions) | | Interest rate increase one percent | Interest rate decrease one percent |
| | | |
| | | |
| | | |
| | | |
| | | |
| | | |
| | | |
| | | |
The Company administers separate account variable annuities and provides other investment and retirement services where fee income is earned based upon a percentage of account balances. Fluctuations in fund asset levels occur as a result of both changes in cash flow and general market conditions. There is a market risk of lower fee income if equity markets decline. If equity markets were to decline by 10% from benchmark levels at December 31, 2023, the Company’s associated net fee income after payment of subadvisor fees in 2023 would decline by approximately $9 million.
The Company’s surplus assets include equity investments, primarily partnership interests. There is a market risk of lower asset values if equity markets decline. If equity markets were to decline by 10%, the Company would have an additional unrealized loss of approximately $14 million on equity investments. This unrealized loss would not impact statutory net income but would reduce capital and surplus.
The Company manages the risks associated with its insurance and other contractual liabilities through the use of actuarial modeling techniques. These techniques utilize significant assumptions including morbidity, mortality, persistency, expenses, and the cash flow stream of benefit payments. Through these techniques, the Company attempts to match the anticipated cash flow streams of its invested assets with the anticipated cash flow streams of its insurance and other contractual obligations. The cash flows associated with determinate policy liabilities are not interest rate sensitive but will vary based upon the timing and amount of benefit payments. The primary risks associated with these liabilities are that the benefits will exceed those anticipated in the actuarial modeling or that the actual timing of the payment of benefits will differ from what was anticipated.
The Company utilizes reinsurance programs to control its exposure to general insurance risks. Reinsurance agreements do not relieve the Company from its direct obligations to its insured. However, an effective reinsurance program limits the Company’s exposure to potentially large losses. The failure of reinsurers to honor their obligations could result in losses to the Company. To manage this risk, the Company evaluates the financial condition of its reinsurers and monitors concentrations of credit risk relative to the reinsurers in order to minimize its exposure to significant losses from reinsurer insolvencies.
Credit risk is the risk the Company assumes if its debtors, customers, reinsurers, or other counterparties and intermediaries may fail to pay their contractual obligations when they come due and may manifest itself through the downgrading of credit ratings of counterparties. It is the Company’s general policy to acquire only investment grade assets to enable it to provide for future policy obligations and to minimize undue concentrations of assets in any single geographic area, industry, or entity. To minimize this risk, management regularly reviews the credit ratings of the entities in which the Company invests. These credit ratings are internally derived by the Company, taking into consideration ratings from several external credit rating agencies.
Operational and corporate risk
The Company manages and mitigates internal operational risk through integrated and complementary policies, procedures, processes, and practices. Human Resources hiring practices, performance evaluations and promotion, and compensation practices are designed to attract, retain and develop the skilled personnel required. A comprehensive job evaluation process is in place and training and development programs are supported. Each business area provides training designed for its specific needs and has developed internal controls for significant processes. Processes and controls are monitored and redefined by the business areas and subject to review by the Company’s internal audit staff. The Company applies a robust project management discipline to all significant initiatives.
Appropriate security measures protect premises and information. The Company has emergency procedures in place for short-term incidents and is committed to maintaining business continuity and disaster recovery plans at every business location for the recovery of critical functions in the event of a disaster, including offsite data backup and work facilities. The Company maintains various corporate insurance coverages such as property, general liability, excess liability, automobile liability, workers’ compensation, financial institution bonds, other regulatory bonds, and professional liability insurance to protect its owned property assets and to insure against certain third-party liabilities.
The Company’s businesses are subject to various regulatory requirements imposed by regulation or legislation applicable to insurance companies and companies providing financial services. These regulations are primarily intended to protect policyholders and beneficiaries. Material changes in the regulatory framework or the failure to comply with legal and regulatory requirements could have a material adverse effect on the Company. The Company monitors compliance with legal and regulatory requirements in all jurisdictions in which it conducts business and assesses trends in legal and regulatory change to keep business areas current and responsive.
In the course of its business activities, the Company may be exposed to the risk that some actions may lead to damaging its reputation and hence damage its future business prospects. These actions may include unauthorized activities of employees or others associated with the Company, inadvertent actions of the Company that become publicized and damage its reputation, regular or past business activities of the Company that become the subject of regulatory or media scrutiny or litigation and, due to a change of public perception, cause damage to the Company. To manage or mitigate this risk, the Company has ongoing controls to limit the unauthorized activities of people associated with it. The Company has adopted a Code of Business Conduct and Ethics which sets out the standards of business conduct to be followed by all of its directors, officers, and employees.
AUDITED FINANCIAL REPORT
|
Empower Annuity Insurance Company of America Audited Annual Statutory Financial Statements |
Statutory Statements of Admitted Assets, Liabilities, Capital and Surplus as of December 31, 2023 and 2022 and Related Statutory Statements of Operations, Changes in Capital and Surplus and Cash Flows and Notes to the Financial Statements for Each of the Three Years in the Period Ended December 31, 2023 and Independent Auditor’s Report
| Item 8. | Financial Statements and Supplementary Data |
Index to Financial Statements, Notes, and Schedules
2
| | |
 | | Deloitte & Touche LLP 1601 Wewatta Street, Suite 400 Denver, CO,80202 USA Tel: +1 303-292-5400 Fax: 303 312 4000 www.Deloitte.com |
INDEPENDENT AUDITOR’S REPORT To the Board of Directors and Stockholder of Empower Annuity Insurance Company of America Greenwood Village, Colorado |
Opinions
We have audited the statutory-basis financial statements of Empower Annuity Insurance Company of America (the “Company”) (a wholly-owned subsidiary of Empower Holdings, Inc.), which comprise the statutory-basis statements of admitted assets, liabilities, and capital and surplus as of December 31, 2023 and 2022, and the related statutory-basis statements of operations, changes in capital and surplus, and cash flows for each of the three years in the period ended December 31, 2023, and the related notes to the statutory-basis financial statements (collectively referred to as the “statutory-basis financial statements”).
Unmodified Opinion on Statutory-Basis of Accounting
In our opinion, the accompanying statutory-basis financial statements present fairly, in all material respects, the admitted assets, liabilities, and capital and surplus of the Company as of December 31, 2023 and 2022, and the results of its operations and its cash flows for each of the three years in the period ended December 31, 2023 in accordance with the accounting practices prescribed or permitted by the Colorado Division of Insurance described in Note 1.
Adverse Opinion on Accounting Principles Generally Accepted in the United States of America
In our opinion, because of the significance of the matter described in the Basis for Adverse Opinion on Accounting Principles Generally Accepted in the United States of America section of our report, the statutory-basis financial statements do not present fairly, in accordance with accounting principles generally accepted in the United States of America, the financial position of the Company as of December 31, 2023 and 2022, or the results of its operations or its cash flows for each of the three years in the period ended December 31, 2023.
Basis for Opinions
We conducted our audits in accordance with auditing standards generally accepted in the United States of America (GAAS). Our responsibilities under those standards are further described in the Auditor’s Responsibilities for the Audit of the Statutory-Basis Financial Statements section of our report. We are required to be independent of the Company and to meet our other ethical responsibilities, in accordance with the relevant ethical requirements relating to our audits. We believe that the audit evidence we have obtained is sufficient and appropriate to provide a basis for our audit opinions.
3
Basis for Adverse Opinion on Accounting Principles Generally Accepted in the United States of America
As described in Note 1 to the statutory-basis financial statements, the statutory-basis financial statements are prepared by the Company using the accounting practices prescribed or permitted by the Colorado Division of Insurance, which is a basis of accounting other than accounting principles generally accepted in the United States of America, to meet the requirements of the Colorado Division of Insurance. The effects on the statutory-basis financial statements of the variances between the statutory-basis of accounting described in Note 1 and accounting principles generally accepted in the United States of America, although not reasonably determinable, are presumed to be material and pervasive.
Emphasis of Matter
The Company engages in various related-party transactions with affiliates under common control as discussed in Note 3 to the statutory-basis financial statements. The accompanying statutory-basis financial statements are not necessarily indicative of the conditions that would have existed or the results of operations that would prevail if the Company had been operated as an unaffiliated company. Our opinion is not modified with respect to this matter.
Responsibilities of Management for the Statutory-Basis Financial Statements
Management is responsible for the preparation and fair presentation of the statutory-basis financial statements in accordance with the accounting practices prescribed or permitted by the Colorado Division of Insurance. Management is also responsible for the design, implementation, and maintenance of internal control relevant to the preparation and fair presentation of statutory-basis financial statements that are free from material misstatement, whether due to fraud or error.
In preparing the statutory-basis financial statements, management is required to evaluate whether there are conditions or events, considered in the aggregate, that raise substantial doubt about the Company’s ability to continue as a going concern for one year after the date that the statutory-basis financial statements are issued.
Auditor’s Responsibilities for the Audit of the Statutory-Basis Financial Statements
Our objectives are to obtain reasonable assurance about whether the statutory-basis financial statements as a whole are free from material misstatement, whether due to fraud or error, and to issue an auditor’s report that includes our opinion. Reasonable assurance is a high level of assurance but is not absolute assurance and therefore is not a guarantee that an audit conducted in accordance with GAAS will always detect a material misstatement when it exists. The risk of not detecting a material misstatement resulting from fraud is higher than for one resulting from error, as fraud may involve collusion, forgery, intentional omissions, misrepresentations, or the override of internal control. Misstatements are considered material if there is a substantial likelihood that, individually or in the aggregate, they would influence the judgment made by a reasonable user based on the statutory-basis financial statements.
In performing an audit in accordance with GAAS, we:
| | • | | Exercise professional judgment and maintain professional skepticism throughout the audit. |
| | • | | Identify and assess the risks of material misstatement of the statutory-basis financial statements, whether due to fraud or error, and design and perform audit procedures responsive to those risks. |
4
| | Such procedures include examining, on a test basis, evidence regarding the amounts and disclosures in the statutory-basis financial statements. |
| | • | | Obtain an understanding of internal control relevant to the audit in order to design audit procedures that are appropriate in the circumstances, but not for the purpose of expressing an opinion on the effectiveness of the Company’s internal control. Accordingly, no such opinion is expressed. |
| | • | | Evaluate the appropriateness of accounting policies used and the reasonableness of significant accounting estimates made by management, as well as evaluate the overall presentation of the statutory-basis financial statements. |
| | • | | Conclude whether, in our judgment, there are conditions or events, considered in the aggregate, that raise substantial doubt about the Company’s ability to continue as a going concern for a reasonable period of time. |
We are required to communicate with those charged with governance regarding, among other matters, the planned scope and timing of the audit, significant audit findings, and certain internal control-related matters that we identified during the audit.
Other Information Included in the Annual Report
Management is responsible for the other information included in the annual report. The other information comprises the information included in the annual report but does not include the statutory-basis financial statements and our auditor’s report thereon. Our opinion on the statutory-basis financial statements does not cover the other information, and we do not express an opinion or any form of assurance thereon.
In connection with our audits of the statutory-basis financial statements, our responsibility is to read the other information and consider whether a material inconsistency exists between the other information and the statutory-basis financial statements, or the other information otherwise appears to be materially misstated. If, based on the work performed, we conclude that an uncorrected material misstatement of the other information exists, we are required to describe it in our report.
5
Report on Supplemental Schedules
Our 2023 audit was conducted for the purpose of forming an opinion on the 2023 statutory-basis financial statements as a whole. The supplemental schedule of selected statutory financial data, and the supplemental schedule regarding reinsurance contracts with risk-limiting features as of and for the year ended December 31, 2023, are presented for purposes of additional analysis and are not a required part of the 2023 statutory-basis financial statements. These schedules are the responsibility of the Company’s management and were derived from and relate directly to the underlying accounting and other records used to prepare the statutory-basis financial statements. Such schedules have been subjected to the auditing procedures applied in our audit of the 2023 statutory-basis financial statements and certain additional procedures, including comparing and reconciling such schedules directly to the underlying accounting and other records used to prepare the statutory-basis financial statements or to the statutory-basis financial statements themselves, and other additional procedures in accordance with auditing standards generally accepted in the United States of America. In our opinion, such schedules are fairly stated in all material respects in relation to the 2023 statutory-basis financial statements as a whole.

March 29, 2024
6
EMPOWER ANNUITY INSURANCE COMPANY OF AMERICA
Statutory Statements of Admitted Assets, Liabilities, Capital and Surplus
December 31, 2023 and 2022
(In Thousands, Except Share Amounts)
| | | | | | | | |
| | | December 31, |
| | | 2023 | | 2022 |
| | |
Admitted assets: | | | | | | | | |
| | |
Cash and invested assets: | | | | | | | | |
| | |
Bonds | | $ | 26,591,735 | | | $ | 29,868,677 | |
| | |
Preferred stock | | | 82,263 | | | | 82,247 | |
| | |
Common stock | | | 1,666,819 | | | | 2,111,584 | |
| | |
Mortgage loans (net of allowances of $56,112 and $646) | | | 5,840,441 | | | | 6,132,049 | |
| | |
Real estate occupied by the company | | | 31,467 | | | | 34,952 | |
| | |
Real estate held for the production of income | | | 17,914 | | | | 18,449 | |
| | |
Real estate held for sale | | | — | | | | 1,656 | |
| | |
Contract loans | | | 3,711,737 | | | | 3,805,700 | |
| | |
Cash, cash equivalents and short-term investments | | | 1,648,651 | | | | 375,173 | |
| | |
Securities lending collateral assets | | | 317,362 | | | | 107,068 | |
| | |
Other invested assets | | | 1,238,844 | | | | 1,077,698 | |
| | | | | | | | |
| | |
Total cash and invested assets | | | 41,147,233 | | | | 43,615,253 | |
| | | | | | | | |
| | |
Investment income due and accrued | | | 327,604 | | | | 346,993 | |
| | |
Premiums deferred and uncollected | | | 11,767 | | | | 13,467 | |
| | |
Reinsurance recoverable | | | 350,653 | | | | 259,114 | |
| | |
Funds held or deposited with reinsured companies | | | 5,781,961 | | | | 6,489,137 | |
| | |
Current federal income taxes recoverable | | | — | | | | 19,581 | |
| | |
Deferred income taxes | | | 152,180 | | | | 101,992 | |
| | |
Due from parent, subsidiaries and affiliates | | | 423,790 | | | | 234,738 | |
| | |
Other assets | | | 750,599 | | | | 1,293,986 | |
| | |
Assets from separate accounts | | | 23,147,893 | | | | 22,913,246 | |
| | | | | | | | |
| | |
Total admitted assets | | $ | 72,093,680 | | | $ | 75,287,507 | |
| | | | | | | | |
| | |
| See notes to statutory financial statements. | | Continued |
7
EMPOWER ANNUITY INSURANCE COMPANY OF AMERICA
Statutory Statements of Admitted Assets, Liabilities, Capital and Surplus
December 31, 2023 and 2022
(In Thousands, Except Share Amounts)
| | | | | | | | |
| | | December 31, | |
| | | 2023 | | | 2022 | |
| | |
Liabilities, capital and surplus: | | | | | | | | |
| | |
Liabilities: | | | | | | | | |
| | |
Reserves for life insurance and annuities and accident and health policies | | $ | 30,990,307 | | | $ | 36,433,935 | |
| | |
Liability for deposit-type contracts | | | 9,585,838 | | | | 8,051,601 | |
| | |
Provision for policyholders’ dividends | | | 4,365 | | | | 5,103 | |
| | |
Liability for premiums received in advance | | | 43 | | | | 47 | |
| | |
Unearned investment income | | | 248 | | | | 351 | |
| | |
Asset valuation reserve | | | 299,764 | | | | 262,562 | |
| | |
Interest maintenance reserve | | | — | | | | 120,537 | |
| | |
Due to parent, subsidiaries and affiliates | | | 120,810 | | | | 6,681 | |
| | |
Commercial paper | | | 99,718 | | | | 99,760 | |
| | |
Current federal income taxes payable | | | 51,205 | | | | — | |
| | |
Payable under securities lending agreements | | | 317,362 | | | | 107,068 | |
| | |
Other liabilities | | | 3,694,121 | | | | 3,766,038 | |
| | |
Liabilities from separate accounts | | | 23,147,893 | | | | 22,913,246 | |
| | | | | | | | |
| | |
Total liabilities | | | 68,311,674 | | | | 71,766,929 | |
| | |
Commitments and contingencies (see Note 18) | | | | | | | | |
| | |
Capital and surplus: | | | | | | | | |
| | |
Preferred stock, $ 1 par value, 50,000,000 shares authorized; none issued and outstanding | | | — | | | | — | |
| | |
Common stock, $ 1 par value; 50,000,000 shares authorized; 19,599,243 and 19,453,463 shares issued and outstanding in 2023 and 2022, respectively | | | 19,599 | | | | 19,453 | |
| | |
Surplus notes | | | 2,109,995 | | | | 2,111,325 | |
| | |
Gross paid in and contributed surplus | | | 4,643,237 | | | | 4,596,284 | |
| | |
Unassigned deficit | | | (2,990,825 | ) | | | (3,206,484 | ) |
| | | | | | | | |
| | |
Total capital and surplus | | | 3,782,006 | | | | 3,520,578 | |
| | | | | | | | |
| | |
Total liabilities, capital and surplus | | $ | 72,093,680 | | | $ | 75,287,507 | |
| | | | | | | | |
| | |
| See notes to statutory financial statements. | | Concluded |
8
EMPOWER ANNUITY INSURANCE COMPANY OF AMERICA
Statutory Statements of Operations
Years Ended December 31, 2023, 2022 and 2021
(In Thousands)
| | | | | | | | | | | | |
| | | Year Ended December 31, |
| | | 2023 | | 2022 | | 2021 |
| | | | | | | | | | | | |
Income: | | | | | | | | | | | | |
| | | |
Premium income and annuity consideration | | $ | 5,567,710 | | | $ | 13,076,730 | | | $ | 6,326,927 | |
| | | |
Net investment income | | | 1,969,201 | | | | 1,518,554 | | | | 1,262,737 | |
| | | |
Amortization of interest maintenance reserve | | | 2,113 | | | | 56,131 | | | | 68,148 | |
| | | |
Commission and expense allowances on reinsurance ceded | | | 259,378 | | | | 256,754 | | | | 195,658 | |
| | | |
Reserve adjustment on reinsurance ceded | | | (1,672,963 | ) | | | (5,202,723 | ) | | | (1,518,822 | ) |
| | | |
Other income | | | 478,656 | | | | 486,940 | | | | 519,882 | |
| | | | | | | | |
| | | |
Total income | | | 6,604,095 | | | | 10,192,386 | | | | 6,854,530 | |
| | | | | | | | |
| | | |
Expenses: | | | | | | | | | | | | |
| | | |
Death benefits | | | 281,360 | | | | 123,027 | | | | 74,119 | |
| | | |
Annuity benefits | | | 323,701 | | | | 249,200 | | | | 202,893 | |
| | | |
Disability benefits and benefits under accident and health policies | | | 207 | | | | 131 | | | | 68 | |
| | | |
Surrender benefits | | | 15,770,211 | | | | 11,577,685 | | | | 14,800,797 | |
| | | |
(Decrease) increase in aggregate reserves for life and accident and health policies and contracts | | | (5,442,498 | ) | | | 2,630,025 | | | | (1,038,595 | ) |
| | | |
Other benefits | | | 134,062 | | | | 116,731 | | | | 125,116 | |
| | | | | | | | |
| | | |
Total benefits | | | 11,067,043 | | | | 14,696,799 | | | | 14,164,398 | |
| | | | | | | | |
| | | |
Commissions | | | 50,225 | | | | 298,348 | | | | 38,460 | |
| | | |
Other insurance expenses | | | 561,610 | | | | 396,033 | | | | 543,438 | |
| | | |
Net transfers from separate accounts | | | (6,165,670 | ) | | | (5,591,198 | ) | | | (8,135,847 | ) |
| | | |
Interest maintenance reserve reinsurance activity | | | 2,883 | | | | (118,906 | ) | | | (83,737 | ) |
| | | | | | | | |
| | | |
Total benefit and expenses | | | 5,516,091 | | | | 9,681,076 | | | | 6,526,712 | |
| | | | | | | | |
| | | |
Net gain from operations before dividends to policyholders, federal income taxes and realized capital gains (losses) | | | 1,088,004 | | | | 511,310 | | | | 327,818 | |
| | | |
Dividends to policyholders | | | 4,432 | | | | 5,108 | | | | 9,847 | |
| | | | | | | | |
| | | |
Net gain from operations after dividends to policyholders and before federal income taxes and net realized capital gains (losses) | | | 1,083,572 | | | | 506,202 | | | | 317,971 | |
| | | |
Federal income tax expense | | | 34,274 | | | | 20,399 | | | | 22,402 | |
| | | | | | | | |
| | | |
Net gain from operations before net realized capital gains (losses) | | | 1,049,298 | | | | 485,803 | | | | 295,569 | |
| | | |
Net realized capital (losses) gains, net of federal income tax (benefit) expense of $(6,203), $6,281 and $904, respectively and transfers to interest maintenance reserve. | | | (23,336 | ) | | | 23,630 | | | | 3,399 | |
| | | | | | | | |
| | | |
Net income | | $ | 1,025,962 | | | $ | 509,433 | | | $ | 298,968 | |
| | | | | | | | | | | | |
| | |
| See notes to statutory financial statements. | | |
9
EMPOWER ANNUITY INSURANCE COMPANY OF AMERICA
Statutory Statements of Changes in Capital and Surplus
Years Ended December 31, 2023, 2022 and 2021
(In Thousands)
| | | | | | | | | | | | |
| | | Year Ended December 31, |
| | | 2023 | | 2022 | | 2021 |
| Capital and surplus, beginning of year | | $ | 3,520,578 | | | $ | 2,919,366 | | | $ | 2,161,307 | |
| | | | | | | | | | | | |
| | | |
Net income | | | 1,025,962 | | | | 509,433 | | | | 298,968 | |
| | | |
Dividends to stockholders | | | (350,000 | ) | | | (231,000 | ) | | | (506,000 | ) |
| | | |
Change in net unrealized capital losses, net of income taxes | | | (587,858 | ) | | | (197,630 | ) | | | (57,312 | ) |
| | | |
Change in minimum pension liability, net of income taxes | | | (608 | ) | | | 3,828 | | | | 1,054 | |
| | | |
Correction of prior period error | | | 35,418 | | | | — | | | | — | |
| | | |
Change in asset valuation reserve | | | (37,202 | ) | | | (26,271 | ) | | | (34,288 | ) |
| | | |
Change in non-admitted assets | | | 371,347 | | | | (416,925 | ) | | | (26,148 | ) |
| | | |
Change in net deferred income taxes | | | 1,468 | | | | (13,785 | ) | | | (23,502 | ) |
| | | |
Capital paid-in | | | 146 | | | | 2,591 | | | | 3 | |
| | | |
Surplus paid-in | | | 46,953 | | | | 810,055 | | | | 4,210 | |
| | | |
Change in surplus as a result of reinsurance | | | (142,606 | ) | | | 176,860 | | | | (83,840 | ) |
| | | |
Change in goodwill | | | (101,575 | ) | | | — | | | | — | |
| | | |
Change in capital and surplus as a result of separate accounts | | | — | | | | 10 | | | | — | |
| | | |
Change in unrealized foreign exchange capital gains (losses) | | | 1,313 | | | | (14,623 | ) | | | (5,762 | ) |
| | | |
Change in surplus notes | | | (1,330 | ) | | | (1,331 | ) | | | 1,190,676 | |
| | | | | | | | | | | | |
| | | |
Net change in capital and surplus for the year | | | 261,428 | | | | 601,212 | | | | 758,059 | |
| | | | | | | | | | | | |
| | | |
Capital and surplus, end of year | | $ | 3,782,006 | | | $ | 3,520,578 | | | $ | 2,919,366 | |
| | | | | | | | | | | | |
| | |
| See notes to statutory financial statements. | | |
10
EMPOWER ANNUITY INSURANCE COMPANY OF AMERICA
Statutory Statements of Cash Flows
Years Ended December 31, 2023, 2022 and 2021
(In Thousands)
| | | | | | | | | | | | |
| | | Year Ended December 31, |
| | | 2023 | | 2022 | | 2021 |
| | | | | | | | |
Operating activities: | | | | | | | | |
Premium income, net of reinsurance | | $ | 5,486,499 | | | $ | 10,733,447 | | | $ | 6,111,400 | |
Investment income received, net of investment expenses paid | | | 1,952,880 | | | | 1,420,420 | | | | 1,268,121 | |
Other miscellaneous income received | | | 1,232,932 | | | | 639,538 | | | | 676,928 | |
Benefit and loss related payments, net of reinsurance | | | (17,641,156 | ) | | | (16,948,045 | ) | | | (17,574,577 | ) |
Net transfers from separate accounts | | | 6,165,922 | | | | 5,591,014 | | | | 8,135,856 | |
Commissions, other expenses and taxes paid | | | (552,974 | ) | | | (821,008 | ) | | | (516,711 | ) |
Dividends paid to policyholders | | | (5,181 | ) | | | (10,114 | ) | | | (18,101 | ) |
Federal income taxes received, net | | | 79,445 | | | | 36,840 | | | | 120,217 | |
| | | | | | | | |
Net cash (used in) provided by operating activities | | | (3,281,633 | ) | | | 642,092 | | | | (1,796,867 | ) |
| | | | | | | | |
| | | |
Investing activities: | | | | | | | | | | | | |
| | | |
Proceeds from investments sold, matured or repaid: | | | | | | | | | | | | |
| | | |
Bonds | | | 4,599,292 | | | | 4,571,491 | | | | 5,229,242 | |
| | | |
Stocks | | | 153,830 | | | | 71,442 | | | | 11,589 | |
| | | |
Mortgage loans | | | 539,266 | | | | 301,006 | | | | 452,409 | |
| | | |
Real estate | | | 3,639 | | | | — | | | | — | |
| | | |
Other invested assets | | | 210,759 | | | | 71,959 | | | | 14,017 | |
| | | |
Net losses on cash, cash equivalents and short-term investments | | | (109 | ) | | | (3,442 | ) | | | (1,134 | ) |
| | | |
Miscellaneous proceeds | | | 36 | | | | 912,872 | | | | 58,571 | |
| | | |
Cost of investments acquired: | | | | | | | | | | | | |
| | | |
Bonds | | | (1,440,075 | ) | | | (4,916,161 | ) | | | (6,607,132 | ) |
| | | |
Stocks | | | (88,643 | ) | | | (2,152,015 | ) | | | (4,554 | ) |
| | | |
Mortgage loans | | | (298,613 | ) | | | (1,021,075 | ) | | | (655,511 | ) |
| | | |
Real estate | | | (105 | ) | | | (18,500 | ) | | | — | |
| | | |
Other invested assets | | | (392,362 | ) | | | (374,267 | ) | | | (351,303 | ) |
| | | |
Miscellaneous applications | | | (3,516 | ) | | | (1,034,574 | ) | | | (220,740 | ) |
| | | |
Net change in contract loans and premium notes | | | (7,938 | ) | | | 488 | | | | 170,563 | |
| | | | | | | | |
| | | |
Net cash provided by (used in) investing activities | | | 3,275,461 | | | | (3,590,776 | ) | | | (1,903,983 | ) |
| | | | | | | | | | | | |
Financing and miscellaneous activities: | | | | | | | | | | | | |
Surplus notes | | | (1,330 | ) | | | — | | | | 1,192,007 | |
Capital and paid in surplus | | | 47,099 | | | | 812,422 | | | | 3,756 | |
Deposit-type contracts, net of withdrawals | | | 1,400,174 | | | | 723,946 | | | | 1,865,132 | |
Dividends to stockholder | | | (350,000 | ) | | | (231,000 | ) | | | (506,000 | ) |
Funds (repaid) borrowed, net | | | (41 | ) | | | 3,772 | | | | (2,995 | ) |
Other | | | 183,748 | | | | (433,839 | ) | | | 126,580 | |
| | | | | | | | |
Net cash provided by financing and miscellaneous activities | | | 1,279,650 | | | | 875,301 | | | | 2,678,480 | |
| | | | | | | | |
Net increase (decrease) in cash, cash equivalents and short-term investments and restricted cash | | | 1,273,478 | | | | (2,073,383 | ) | | | (1,022,370 | ) |
Cash, cash equivalents and short-term investments and restricted cash: | | | | | | | | | | | | |
Beginning of year | | | 375,173 | | | | 2,448,556 | | | | 3,470,926 | |
| | | | | | | | |
End of year | | $ | 1,648,651 | | | $ | 375,173 | | | $ | 2,448,556 | |
| | | | | | | | |
The cash, cash equivalents and short-term investments and restricted cash balance includes $1 and $1 of restricted cash as of December 31, 2023 and 2022, respectively, which is non-admitted and not included in the Statutory Statements of Admitted Assets, Liabilities, Capital and Surplus.
| | |
| See notes to statutory financial statements. | | Continued |
11
EMPOWER ANNUITY INSURANCE COMPANY OF AMERICA
Statutory Statements of Cash Flows
Years Ended December 31, 2023, 2022 and 2021
(In Thousands)
The Statutory Statement of Cash Flows excludes the following non-cash transactions;
| | | | | | | | | | | | |
| | | Year Ended December 31, |
| | | 2023 | | 2022 | | 2021 |
| | | | | | | | |
| | | |
Share-based compensation expense | | $ | — | | | $ | 223 | | | $ | 457 | |
| | | |
Transfer of assets and liabilities under reinsurance agreements(1) | | $ | — | | | $ | 5,670,290 | | | $ | — | |
(1) Above amount reflects reinsurance agreements entered in to with Prudential and Hannover in 2022. See Note 8 for additional details
| | |
| See notes to statutory financial statements. | | Concluded |
12
EMPOWER ANNUITY INSURANCE COMPANY OF AMERICA
Notes to Statutory Financial Statements
(In Thousands, Except Share Amounts)
1. Organization and Significant Accounting Policies
Empower Annuity Insurance Company of America, (the “Company” or “EAICA”) is a direct wholly-owned subsidiary of Empower Holdings, Inc., (“EHI”), a holding company. EHI is a direct wholly-owned subsidiary of Great-West Lifeco U.S. LLC (“Lifeco U.S.”) and an indirect wholly-owned subsidiary of Great-West Lifeco Inc. (“Lifeco”), a Canadian holding company. The Company offers a wide range of retirement and investment products to individuals, businesses and other private and public organizations throughout the United States. The Company is an insurance company domiciled in the State of Colorado and is subject to regulation by the Colorado Division of Insurance (“Division”).
On August 1, 2022, in an effort to further strengthen recognition and customer alignment with the Empower brand, Great-West Life & Annuity Insurance Company changed its legal name to Empower Annuity Insurance Company of America.
The Company is authorized to engage in the sale of life insurance, accident and health insurance and annuities. It is qualified to do business in all states in the United States, except New York, and in the District of Columbia, Puerto Rico, Guam and the U.S. Virgin Islands. The Company is also a licensed reinsurer in New York.
Effective April 1, 2022, the Company completed the acquisition, via share purchase and indemnity reinsurance (“the Prudential transaction”), of the full-service retirement services business of Prudential Financial, Inc. (“Prudential”) for $1.9 billion. The transaction includes acquisition via the equity purchase of the business within Empower Annuity Insurance Company, (“EAIC”), as well as reinsurance of certain business within The Prudential Insurance Company of America (“PICA”). The Company has now assumed the economics and risks associated with the reinsured business, and the Company paid a $224 million reinsurance ceding commission. The business assumed is primarily group annuities. See Notes 7 and 8 for further discussion of the Prudential transaction.
The statutory financial statements have been prepared from the separate records maintained by the Company and may not necessarily be indicative of the conditions that would have existed or the results of operations if the Company had been operated as an unaffiliated company.
Accounting policies and use of estimates
The Company prepares its statutory financial statements in conformity with accounting practices prescribed or permitted by the Division. The Division requires that insurance companies domiciled in the State of Colorado prepare their statutory financial statements in accordance with the National Association of Insurance Commissioners Accounting Practices and Procedures Manual (“NAIC SAP”), subject to any deviations prescribed or permitted by the State of Colorado Insurance Commissioner.
The only prescribed difference that impacts the Company allows the Company to account for certain separate account products at book value instead of fair value. The Division has not permitted the Company to adopt any accounting practices that have an impact on the Company’s statutory financial statements as compared to NAIC SAP or the Division’s prescribed accounting practices. There is no impact to either capital and surplus or net income as a result of the prescribed accounting practice.
Statutory accounting principles vary in some respects from accounting principles generally accepted in the United States of America (“GAAP”). The more significant of these differences are as follows:
| • | | Bonds, including loan-backed and structured securities (collectively referred to as “bonds”), are carried at statutory adjusted carrying value in accordance with the National Association of Insurance Commissioners (“NAIC”) designation of the security. Carrying value is amortized cost, unless the bond is either (a) designated as a six, in which case it is the lower of amortized cost or fair value or (b) required to be carried at fair value due to the structured securities ratings methodology, or (c) for perpetual bonds that do not possess an effective call option, is carried at fair value regardless of NAIC designation. Under GAAP, bonds are carried at amortized cost for securities classified as held-to-maturity and fair value for securities classified as available-for-sale and held-for-trading. |
| • | | Redeemable preferred stocks are carried at statutory carrying value in accordance with the NAIC designation of the security. Carrying value is amortized cost, unless the redeemable preferred stock is designated a four to six, in which case it is reported at the lower of amortized cost or fair value. Under GAAP, redeemable preferred stocks are carried at amortized cost for securities classified as held-to-maturity and fair value for securities classified as available-for-sale and held-for-trading. |
13
EMPOWER ANNUITY INSURANCE COMPANY OF AMERICA
Notes to Statutory Financial Statements
(In Thousands, Except Share Amounts)
| • | | Short-term investments include all investments whose remaining maturities, at the time of acquisition, are three months to one year. Under GAAP, short-term investments include securities purchased with investment intent and with remaining maturities, at the time of acquisition, of one year or less. |
| • | | As prescribed by the NAIC, the asset valuation reserve (“AVR”) is computed in accordance with a prescribed formula and represents a provision for possible non-interest related fluctuations in the value of bonds, equity securities, mortgage loans, real estate and other invested assets. Changes to the AVR are charged or credited directly to unassigned surplus. This type of reserve is not necessary or required under GAAP. |
| • | | As prescribed by the NAIC, the interest maintenance reserve (“IMR”) consists of net accumulated unamortized realized capital gains and losses, net of income taxes, on sales or interest related impairments of bonds and derivative investments attributable to changes in the general level of interest rates. Such gains or losses are initially deferred and then amortized into income over the remaining period to maturity, based on groupings of individual securities sold in five-year bands. An IMR asset is designated as an admitted asset for net negative (disallowed) IMR up to 10% of adjusted capital and surplus, and is recorded as an increase to capital and surplus. An IMR asset is designated as a non-admitted asset for net negative (disallowed) IMR above this threshold and is recorded as a reduction to capital and surplus. Under GAAP, realized gains and losses are recognized in income in the period in which a security is sold. |
| • | | As prescribed by the NAIC, an other-than-temporary impairment (“OTTI”) is recorded (a) if it is probable that the Company will be unable to collect all amounts due according to the contractual terms in effect at the date of acquisition, (b) if the Company has the intent to sell the investment or (c) for non-interest related declines in value and where the Company does not have the intent and ability at the reporting date, to hold the bond until its recovery. Under GAAP, if either (a) management has the intent to sell a bond investment or (b) it is more likely than not the Company will be required to sell a bond investment before its anticipated recovery, a charge is recorded in net realized investment losses equal to the difference between the fair value and cost or amortized cost basis of the security. If management does not intend to sell the security and it is not more likely than not the Company will be required to sell the bond investment before recovery of its amortized cost basis, but the present value of the cash flows expected to be collected (discounted at the effective interest rate implicit in the bond investment prior to impairment) is less than the amortized cost basis of the bond investment (referred to as the credit loss portion), an OTTI is considered to have occurred. |
Under GAAP, total OTTI is bifurcated into two components: the amount related to the credit loss, which is recognized in current period earnings through realized capital losses; and the amount attributed to other factors (referred to as the non-credit portion), which is recognized as a separate component in accumulated other comprehensive income (loss). As prescribed by the NAIC, non-interest related OTTI is only bifurcated on loan-backed and structured securities. Factors related to interest and other components do not have a financial statement impact and are disclosed in “Unrealized losses” in the notes to the statutory financial statements.
| • | | Derivatives that qualify for hedge accounting are carried at the same valuation method as the underlying hedged asset, while derivatives that do not qualify for hedge accounting are carried at fair value. Under GAAP, all derivatives, regardless of hedge accounting treatment, are recorded on the balance sheet in other assets or other liabilities at fair value. As prescribed by the NAIC, for those derivatives which qualify for hedge accounting, the change in the carrying value or cash flow of the derivative is recorded consistently with how the changes in the carrying value or cash flow of the hedged asset, liability, firm commitment or forecasted transaction are recorded. Under GAAP, if the derivative is designated as a cash flow hedge, the effective portions of the changes in the fair value of the derivative are recorded in accumulated other comprehensive income and are recognized in the income statements when the hedged item affects earnings. Changes in fair value resulting from foreign currency translations are recorded in either AOCI or net investment income, consistent with where they are recorded on the underlying hedged asset or liability. Changes in the fair value, including changes resulting from foreign currency translations, of derivatives not eligible for hedge accounting or where hedge accounting is not elected and the over effective portion of cash flow hedges are recognized in investment gains (losses) as a component of net income in the period of the change. Realized foreign currency transactional gains and losses on derivatives subject to hedge accounting are recorded in net investment income, whereas those on derivatives not subject to hedge accounting are recorded in investment gains (losses). As prescribed by the NAIC, upon termination of a derivative that qualifies for hedge accounting, the gain or loss is recognized in income in a manner that is consistent with the hedged item. Alternatively, if the item being hedged is subject to IMR, the gain or loss on the hedging derivative is realized and is subject to IMR upon termination. Under GAAP, gains or losses on terminated contracts that are effective hedges are |
14
EMPOWER ANNUITY INSURANCE COMPANY OF AMERICA
Notes to Statutory Financial Statements
(In Thousands, Except Share Amounts)
recorded in earnings in net investment income or other comprehensive income. The gains or losses on terminated contracts where hedge accounting is not elected, or contracts that are not eligible for hedge accounting, are recorded in investment gains (losses).
| • | | The Company enters into dollar repurchase agreements with third party broker-dealers. The Company does not enter into these types of transactions for liquidity purposes, but rather for yield enhancement on its investment portfolio. The dollar repurchase trading strategy involves the sale of securities, with a simultaneous agreement to repurchase similar securities at a future date at an agreed-upon price. If the assets to be repurchased are the same, or substantially the same, as the assets transferred, the transactions are accounted for as secured borrowings. Transactions that do not meet the secured borrowing requirements are accounted for as bond purchases and sales. Under GAAP, these transactions are recorded as forward settling to be announced (“TBA”) securities that are accounted for as derivative instruments, but hedge accounting is not elected as the Company does not regularly accept delivery of such securities when issued. |
| • | | Acquisition costs, such as commissions and other costs incurred in connection with acquiring new business, are charged to operations as incurred, rather than deferred and amortized over the lives of the related contracts as under GAAP. |
| • | | Deferred income taxes are recorded using the asset and liability method in which deferred tax assets and liabilities are recorded for expected future tax consequences of events that have been recognized in either the Company’s statutory financial statements or tax returns. Deferred income tax assets are subject to limitations prescribed by statutory accounting principles. The change in deferred income taxes is treated as a component of the change in unassigned deficit, whereas under GAAP deferred taxes are included in the determination of net income. |
| • | | Certain assets, including various receivables, furniture and equipment and prepaid assets, are designated as non-admitted assets and are recorded as a reduction to capital and surplus, whereas they are recorded as assets under GAAP. |
| • | | For statutory accounting, business combinations must either create a parent-subsidiary relationship (statutory purchase) or there must be an exchange of equity with one surviving entity (statutory merger). Under GAAP, an integrated set of activities and assets that are capable of being conducted and managed for the purpose of providing economic benefits to its investors can meet the definition of a business. As such, under GAAP, certain reinsurance agreements could be accounted for as a business acquisition. |
| • | | For statutory purchases, the excess of the cost of acquiring an entity over the Company’s share of the book value of the acquired entity is recorded as goodwill which is admissible subject to limitations and is amortized over the period in which the Company benefits economically, not to exceed ten years. For statutory mergers, no acquisition is recognized because it is accomplished without exchanging resources. As such, the recorded assets, liabilities, and surplus of the acquired company (adjusted to conform to statutory accounting principles) will be carried forward into the combined company. Under GAAP in a business combination, the excess of the cost of acquiring an entity over the acquisition-date fair value of identifiable assets acquired and liabilities assumed is allocated between goodwill, indefinite-lived intangible assets and definite-lived intangible assets. Goodwill and indefinite-lived intangible assets are not amortized and definite-lived intangible assets are amortized over their estimated useful lives under GAAP. |
| • | | Aggregate reserves for life policies and contracts are based on statutory mortality and interest requirements and without consideration of withdrawals, which differ from reserves established under GAAP that are based on assumptions using Company experience for mortality, interest, and withdrawals. |
| • | | Surplus notes are reflected as a component of capital and surplus, whereas under GAAP they are reflected as a liability. |
| • | | The policyholder’s share of net income on participating policies that has not been distributed to participating policyholders is included in capital and surplus in the statutory financial statements. For GAAP, these amounts are reported as a liability with a charge to net income. |
| • | | Changes in separate account values from cash transactions are recorded as premium income and benefit expenses whereas they do not impact the statement of operations under GAAP and are presented only as increases or decreases to account balances. |
15
EMPOWER ANNUITY INSURANCE COMPANY OF AMERICA
Notes to Statutory Financial Statements
(In Thousands, Except Share Amounts)
| • | | Benefit payments and the related decrease in policy reserves are recorded as expenses for all contracts subjecting the Company to any mortality risk. Under GAAP, such benefit payments for life and annuity contracts without significant mortality risks are recorded as direct reductions to the policy reserve liability. |
| • | | Premium receipts and the related increase in policy reserves are recorded as revenues and expenses, respectively, for all contracts subjecting the Company to any mortality risk. Under GAAP, such premium receipts for life and annuity contracts without significant mortality risks are recorded as direct credits to the policy reserve liability. |
| • | | Comprehensive income and its components are not presented in the statutory financial statements. |
| • | | The Statutory Statement of Cash Flows is presented based on a prescribed format for statutory reporting. For purposes of presenting statutory cash flows, cash includes cash equivalents and short-term investments. Under GAAP, the statement of cash flows is typically presented based on the indirect method and cash excludes short-term investments. |
| • | | For statutory accounting purposes, policy and contract liabilities ceded to reinsurers are reported as reductions of the related reserves. Losses generated in certain reinsurance transaction are recognized immediately in income, with gains reported as a separate component of surplus and amortized over the remaining life of the business. As prescribed by the Division, ceded reserves are limited to the amount of direct reserves. Under GAAP, ceded future policy benefits and contract owner liabilities are reported as reinsurance recoverables. Only those reinsurance recoverable balances deemed probable of recovery are reflected as assets on the balance sheet and are stated net of allowance for uncollectible reinsurance, which are charged to earnings. Costs of reinsurance (i.e. the net cash flows which include reinsurance premiums, ceding commissions, etc.) are deferred and amortized over the remaining life of the business. |
The preparation of financial statements in conformity with statutory accounting principles requires the Company’s management to make a variety of estimates and assumptions. These estimates and assumptions affect, among other things, the reported amounts of admitted assets and liabilities, the disclosure of contingent liabilities and the reported amounts of revenues and expenses. Significant estimates are required to account for items and matters such as, but not limited to, the valuation of investments and derivatives in the absence of quoted market values, impairment of investments and derivatives, valuation of policy benefit liabilities and the valuation of deferred tax assets. Actual results could differ from those estimates.
Significant statutory accounting policies
Investments
Investments are reported as follows:
| • | | In accordance with the NAIC SAP, the adjusted carrying value amounts of certain assets are gross of non-admitted assets. |
| • | | Bonds are carried at statutory adjusted carrying value in accordance with the NAIC designation of the security. Carrying value is amortized cost, unless the bond is either (a) designated as a six, in which case it is the lower of amortized cost or fair value or (b) required to be carried at fair value due to the structured securities ratings methodology, or (c) for perpetual bonds that do not possess or no longer possess an effective call option, is carried at fair value regardless of NAIC designation. The Company recognizes the acquisition of its public bonds on a trade date basis and its private placement investments on a funding date basis. Bonds containing call provisions, except make-whole call provisions, are amortized to the call or maturity value/date which produces the lowest asset value. Make-whole call provisions, which allow the bond to be called at any time, are not considered in determining the timeframe for amortizing the premium or discount unless the Company has information indicating the issuer is expected to invoke the make-whole call provision. |
| • | | Premiums and discounts are recognized as a component of net investment income using the effective interest method. Realized gains and losses not subject to IMR, including those from foreign currency translations, are included in net realized capital gains (losses). |
16
EMPOWER ANNUITY INSURANCE COMPANY OF AMERICA
Notes to Statutory Financial Statements
(In Thousands, Except Share Amounts)
| • | | The recognition of income on certain investments (e.g. loan-backed securities, including mortgage-backed and asset-backed securities) is dependent upon market conditions, which may result in prepayments and changes in amounts to be earned. Prepayments on all mortgage-backed and asset-backed securities are monitored monthly, and amortization of the premium and/or the accretion of the discount associated with the purchase of such securities are adjusted by such prepayments. Prepayment assumptions are based on the average of recent historical prepayments and are obtained from broker/dealer survey values or internal estimates. These assumptions are consistent with the current interest rate and economic environment. Significant changes in estimated cash flows from the original purchase assumptions are accounted for using the retrospective method. |
| • | | Mortgage loans consist primarily of domestic commercial collateralized loans and are carried at their unpaid principal balances adjusted for any unamortized premiums or discounts, allowances for credit losses, and foreign currency translations. Interest income is accrued on the unpaid principal balance for all loans, except for loans on non-accrual status. Premiums and discounts are amortized to net investment income using the effective interest method. Nonrefundable prepayment penalty and origination fees are recognized in net investment income upon receipt. |
The Company actively manages its mortgage loan portfolio by completing ongoing comprehensive analysis of factors such as debt service coverage ratios, loan-to-value ratios, payment status, default or legal status, annual collateral property evaluations and general market conditions. On a quarterly basis, the Company reviews the above primary credit quality indicators in its internal risk assessment of loan impairment and credit loss. Management’s risk assessment process is subjective and includes the categorization of all loans, based on the above mentioned credit quality indicators, into one of the following categories:
| | • | | Performing - generally indicates the loan has standard market risk and is within its original underwriting guidelines. |
| | • | | Non-performing - generally indicates there is a potential for loss due to the deterioration of financial/monetary default indicators or potential foreclosure. Due to the potential for loss, these loans are evaluated for impairment. |
The adequacy of the Company’s allowance for credit loss is reviewed quarterly. The determination of the calculation and the adequacy of the mortgage allowance for credit loss and mortgage impairments involve judgments that incorporate qualitative and quantitative Company and industry mortgage performance data. Management’s periodic evaluation and assessment of the adequacy of the mortgage allowance for credit loss and the need for mortgage impairments is based on known and inherent risks in the portfolio, adverse situations that may affect the borrower’s ability to repay, the fair value of the underlying collateral, composition of the loan portfolio, current economic conditions, loss experience and other relevant factors. Loans included in the non-performing category and other loans with certain substandard credit quality indicators are individually reviewed to determine if a specific impairment is required. Risk is mitigated primarily through first position collateralization, guarantees, loan covenants and borrower reporting requirements. Since the Company does not originate or hold uncollateralized mortgages, loans are generally not deemed fully uncollectible. Generally, unrecoverable amounts are written off during the final stage of the foreclosure process.
Loan balances are considered past due when payment has not been received based on contractually agreed upon terms. The accrual of interest is discontinued when concerns exist regarding the realization of loan principal or interest. The Company resumes interest accrual on loans when a loan returns to current status or under new terms when loans are restructured or modified.
On a quarterly basis, any loans with terms that were modified during that period are reviewed to determine if the loan modifications constitute a troubled debt restructuring (“TDR”). In evaluating whether a loan modification constitutes a TDR, it must be determined that the modification is a significant concession and the debtor is experiencing financial difficulties.
| • | | Real estate properties held for the production of income are valued at depreciated cost less encumbrances. Real estate is depreciated on a straight-line basis over the estimated life of the building or term of the lease for tenant improvements. |
| • | | Real estate properties occupied by the Company are carried at depreciated cost less encumbrances unless the carrying amount of the asset is deemed to be unrecoverable. The Company includes in both net investment income and other operating expenses an amount for rent relating to real estate properties occupied by the Company. Rent is derived from |
17
EMPOWER ANNUITY INSURANCE COMPANY OF AMERICA
Notes to Statutory Financial Statements
(In Thousands, Except Share Amounts)
| | consideration of the repairs, expenses, taxes, interest and depreciation incurred. The reasonableness of the amount of rent recorded is verified by comparison to rent received from other like properties in the same area. |
| • | | Properties held for sale are carried at the lower of depreciated cost or fair value less encumbrances and estimated costs to sell the property. |
| • | | Limited partnership interests are included in other invested assets and are accounted for using net asset value per share (“NAV”) as a practical expedient to fair value. The Company uses NAV as a practical expedient on partnership interests in investment companies where it has a minority equity interest and no significant influence over the entity’s operations. |
| • | | Residual tranches or interests in CLOs are included in other invested assets and are carried at the lower of amortized cost or fair value. |
| • | | Redeemable preferred stocks, other than shares in Empower CLOs, are carried at statutory carrying value in accordance with the NAIC designation of the security. Carrying value is amortized cost, unless the redeemable preferred stock is designated a four to six, in which case it is reported at the lower of amortized cost or fair value. Preferred shares of Empower CLOs are reported at cost. |
| • | | Common stocks, other than stocks of subsidiaries and stocks of the Federal Home Loan Bank (“FHLB”), are recorded at fair value based on the most recent closing price of the common stock as quoted on its exchange. Common stocks of the FHLB are reported at cost. Related party mutual funds, which are carried at fair value, are also included in common stocks. The net unrealized gain or loss on common stocks is reported as a component of surplus. |
| • | | Investments in domestic life subsidiaries and certain other subsidiaries are carried at their statutory equity value with unrealized changes in value recorded directly in surplus. Investments in majority owned subsidiaries are generally carried at their Statutory or US GAAP equity with dividends received being recorded in investment income. |
| • | | Contract loans are carried at their unpaid balance. Contract loans are fully collateralized by the cash surrender value of the associated insurance policy. |
| • | | Short-term investments include all investments whose remaining maturities, at the time of acquisition, are three months to one year. Cash equivalent investments include all investments whose remaining maturities, at the time of acquisition, are three months or less. Both short-term and cash equivalent investments, excluding money market mutual funds, are stated at amortized cost, which approximates fair value. Cash equivalent investments also include highly liquid money market funds that are traded in an active market and are carried at fair value. |
| • | | The Company enters into reverse repurchase agreements with third party broker-dealers for the purpose of enhancing the total return on its investment portfolio. The repurchase trading strategy involves the purchase of securities, with a simultaneous agreement to resell similar securities at a future date at an agreed-upon price. Securities purchased under these agreements are accounted for as secured borrowings, and are reported at amortized cost in cash, cash equivalents and short-term investments. |
Under these tri-party repurchase agreements, the designated custodian takes possession of the underlying collateral on the Company’s behalf, which is required to be cash or government securities. The fair value of the securities is monitored and additional collateral is obtained, where appropriate, to protect against credit exposure. The collateral cannot be sold or repledged and has not been recorded on the Statutory Statements of Admitted Assets, Liabilities, Capital and Surplus.
| • | | The Company enters into dollar repurchase agreements with third party broker-dealers. The Company does not enter into these types of transactions for liquidity purposes, but rather for yield enhancement on its investment portfolio. The dollar repurchase trading strategy involves the sale of securities, with a simultaneous agreement to repurchase similar securities at a future date at an agreed-upon price. If the assets to be repurchased are the same, or substantially the same, as the assets transferred, the transactions are accounted for as secured borrowings. Transactions that do not meet the secured borrowing requirements are accounted for as bond purchases and sales. Proceeds of the sale are reinvested in other securities and may enhance the current yield and total return. The difference between the sales price and the future repurchase price is recorded as an adjustment to net investment income. During the period between the sale and repurchase, the Company will not be entitled to receive interest and principal payments on the securities sold. Losses may arise from changes in the value of the securities or if the counterparty enters bankruptcy proceedings or becomes insolvent. In such cases, the Company’s |
18
EMPOWER ANNUITY INSURANCE COMPANY OF AMERICA
Notes to Statutory Financial Statements
(In Thousands, Except Share Amounts)
| | right to repurchase the security may be restricted. Amounts owed to brokers under these arrangements are included as a liability in repurchase agreements. The Company discontinued the dollar repurchase agreement program in the fourth quarter of 2022. |
| • | | The Company participates in a securities lending program in which the Company lends securities that are held as part of its general account investment portfolio to third parties. The Company does not enter into these types of transactions for liquidity purposes, but rather for yield enhancement on its investment portfolio. The borrower can return and the Company can request the loaned securities be returned at any time. The Company maintains ownership of the securities at all times and is entitled to receive from the borrower any payments for interest received on such securities during the loan term. Securities lending transactions are accounted for as secured borrowings. The securities on loan are included within bonds and short-term investments in the accompanying Statutory Statements of Admitted Assets, Liabilities, Capital and Surplus. The securities lending agent indemnifies the Company against borrower risk, meaning that the lending agent agrees contractually to replace securities not returned due to a borrower default. The Company generally requires initial cash collateral in an amount greater than or equal to 102% of the fair value of domestic securities loaned, and 105% of foreign securities loaned. Such collateral is used to replace the securities loaned in event of default by the borrower. Some cash collateral is reinvested in money market funds or short-term repurchase agreements which are also collateralized by U.S. Government or U.S. Government Agency securities. Reinvested cash collateral is reported in securities lending reinvested collateral assets, with a corresponding liability in payable for securities lending collateral. Collateral that cannot be sold or repledged is excluded from the Statutory Statements of Admitted Assets, Liabilities, Capital and Surplus. |
| • | | Surplus notes, which are recorded in other invested assets, are carried at statutory carrying value in accordance with the NAIC designation of the security. Carrying value is amortized cost, unless the surplus note is unrated or has a NAIC designation of three to six, in which case it is reported at the lower of amortized cost or fair value. |
| • | | The Company’s OTTI accounting policy requires that a decline in the value of a bond below its cost or amortized cost basis be assessed to determine if the decline is other-than-temporary. An OTTI is recorded (a) if it is probable that the Company will be unable to collect all amounts due according to the contractual terms in effect at the date of acquisition, (b) if the Company has the intent to sell the investment or (c) for non-interest related declines in value and where the Company does not have the intent and ability at the reporting date, to hold the bond until its recovery. Management considers a wide range of factors, as described below, regarding the bond issuer and uses its best judgment in evaluating the cause of the decline in its estimated fair value and in assessing the prospects for near-term recovery. Inherent in management’s evaluation of the bond are assumptions and estimates about the operations and ability to generate future cash flows. While all available information is taken into account, it is difficult to predict the ultimate recoverable amount from a distressed or impaired bond. |
Considerations used by the Company in the impairment evaluation process include, but are not limited to, the following:
| | • | | The extent to which estimated fair value is below cost; |
| | • | | Whether the decline in fair value is attributable to specific adverse conditions affecting a particular instrument, its issuer, an industry or geographic area; |
| | • | | The length of time for which the estimated fair value has been below cost; |
| | • | | Downgrade of a bond investment by a credit rating agency; |
| | • | | Deterioration of the financial condition of the issuer; |
| | • | | The payment structure of the bond investment and the likelihood of the issuer being able to make payments in the future; and |
| | • | | Whether dividends have been reduced or eliminated or scheduled interest payments have not been made. |
For loan-backed and structured securities, if management does not intend to sell the bond and has the intent and ability to hold the bond until recovery of its amortized cost basis, but the present value of the cash flows expected to be collected (discounted at the effective interest rate implicit in the bond prior to impairment) is less than the amortized cost basis of the bond (referred to as the non-interest loss portion), an OTTI is considered to have occurred. In this instance, total OTTI is bifurcated into two components: the amount related to the non-interest loss is recognized in current period earnings through
19
EMPOWER ANNUITY INSURANCE COMPANY OF AMERICA
Notes to Statutory Financial Statements
(In Thousands, Except Share Amounts)
realized capital gains (losses); and the amount attributed to other factors does not have any financial impact and is disclosed only in the notes to the statutory financial statements. The calculation of expected cash flows utilized during the impairment evaluation process are determined using judgment and the best information available to the Company including default rates, credit ratings, collateral characteristics and current levels of subordination.
For bonds not backed by other loans or assets, if management does not intend to sell the bond and has the intent and ability to hold but does not expect to recover the entire cost basis, an OTTI is considered to have occurred. A charge is recorded in net realized capital gains (losses) equal to the difference between the fair value and cost or amortized cost basis of the bond. After the recognition of an OTTI, the bond is accounted for as if it had been purchased on the measurement date of the OTTI, with an amortized cost basis equal to the previous amortized cost basis less the OTTI recognized in net income. The difference between the new amortized cost basis and the expected future cash flows is accreted into net investment income. The Company continues to estimate the present value of cash flows expected to be collected over the life of the bond.
Fair value
Certain assets and liabilities are recorded at fair value on the Company’s Statutory Statements of Admitted Assets, Liabilities, Capital and Surplus. The Company defines fair value as the price that would be received to sell an asset or paid to transfer a liability in the principal or most advantageous market for the asset or liability in an orderly transaction between market participants on the measurement date. The Company categorizes its assets and liabilities measured at fair value into a three level hierarchy, based on the priority of the inputs to the respective valuation technique. The fair value hierarchy gives the highest priority to quoted prices in active markets for identical assets or liabilities (Level 1) and the lowest priority to unobservable inputs (Level 3). The Company’s assets and liabilities have been categorized based upon the following fair value hierarchy:
| | • | | Level 1 inputs which are utilized for general and separate account assets and liabilities, utilize observable, quoted prices (unadjusted) in active markets for identical assets or liabilities that the Company has the ability to access at the measurement date. Financial assets utilizing Level 1 inputs include certain mutual funds. |
| | • | | Level 2 inputs utilize other than quoted prices included in Level 1 that are observable for the asset or liability, either directly or indirectly. Level 2 inputs, which are utilized for general and separate account assets and liabilities, include quoted prices for similar assets and liabilities in active markets and inputs, other than quoted prices, that are observable for the asset or liability, such as interest rates and yield curves that are observable at commonly quoted intervals. The fair values for some Level 2 securities are obtained from pricing services. The inputs used by the pricing services are reviewed at least quarterly or when the pricing vendor issues updates to its pricing methodology. For general and separate account assets and liabilities, inputs include benchmark yields, reported trades, broker/dealer quotes, issuer spreads, two-sided markets, benchmark securities, bids, evaluated bids, offers and reference data including market research publications. Additional inputs utilized for assets and liabilities classified as Level 2 are: |
| | ○ | | Derivative instruments - trading activity, swap curves, credit spreads, currency volatility, net present value of cash flows and news sources. |
| | ○ | | Separate account assets and liabilities - various index data and news sources, amortized cost (which approximates fair value), trading activity, swap curves, credit spreads, recovery rates, restructuring, net present value of cash flows and quoted prices in markets that are not active or for which all significant inputs are observable, either directly or indirectly. |
| | • | | Level 3 inputs are unobservable and include situations where there is little, if any, market activity for the asset or liability. In general, the prices of Level 3 securities are obtained from single broker quotes and internal pricing models. If the broker’s inputs are largely unobservable, the valuation is classified as a Level 3. Broker quotes are validated through an internal analyst review process, which includes validation through known market conditions and other relevant data, as noted below. Internal models are usually cash flow based utilizing characteristics of the underlying collateral of the security such as default rate and other relevant data. |
Foreign exchange rates are determined at a time that corresponds to the closing of the NYSE.
20
EMPOWER ANNUITY INSURANCE COMPANY OF AMERICA
Notes to Statutory Financial Statements
(In Thousands, Except Share Amounts)
The fair value of certain investments in the separate accounts and limited partnerships are estimated using net asset value per share as a practical expedient and are excluded from the fair value hierarchy levels in Note 5. These net asset values are based on the fair value of the underlying investments, less liabilities.
In certain cases, the inputs used to measure fair value may fall into different levels of the fair value hierarchy. In such cases, the level in the fair value hierarchy within which the fair value measurement in its entirety falls has been determined based on the lowest level input that is significant to the fair value measurement in its entirety. The Company’s assessment of the significance of a particular input to the fair value measurement in its entirety requires judgment and considers factors specific to the asset or liability.
Overall, transfers between levels are attributable to a change in the observability of inputs. Assets and liabilities are transferred to a lower level in the hierarchy when a significant input cannot be corroborated with market observable data. This may occur when market activity decreases and underlying inputs cannot be observed, current prices are not available, and/or when there are significant variances in quoted prices, thereby affecting transparency. Assets and liabilities are transferred to a higher level in the hierarchy when circumstances change such that a significant input can be corroborated with market observable data. This may be due to a significant increase in market activity including recent trades, a specific event, or one or more significant input(s) becoming observable.
In some instances, securities are priced using external broker quotes. In most cases, when broker quotes are used as pricing inputs, more than one broker quote is obtained. External broker quotes are reviewed internally by comparing the quotes to similar securities in the public market and/or to vendor pricing, if available. Additionally, external broker quotes are compared to market reported trade activity to ascertain whether the price is reasonable, reflective of the current market prices, and takes into account the characteristics of the Company’s securities.
Derivative financial instruments
The Company enters into derivative transactions which include the use of interest rate swaps, interest rate swaptions, interest rate floor and equity options, cross-currency swaps, foreign currency forwards, U.S. government treasury futures contracts, futures on equity indices and interest rate swap futures. The Company uses these derivative instruments to manage various risks, including interest rate and foreign currency exchange rate risk associated with its invested assets and liabilities. Derivative instruments are not used for speculative reasons. Certain of the Company’s over-the-counter (“OTC”) derivatives are cleared and settled through a central clearing counterparty while others are bilateral contracts between the Company and a counterparty.
Derivatives are reported as other invested assets or other liabilities. Although some derivatives are executed under a master netting arrangement, the Company does not offset in the Statutory Statements of Admitted Assets, Liabilities, Capital and Surplus the carrying value of those derivative instruments and the related cash collateral or net derivative receivables and payables executed with the same counterparty under the same master netting arrangement. Derivatives that qualify for hedge accounting treatment are valued using the valuation method (either amortized cost or fair value) consistent with the underlying hedged asset or liability. At inception of a derivative transaction, the hedge relationship and risk management objective is documented and the designation of the derivative is determined based on specific criteria of the transaction. Derivatives where hedge accounting is either not elected or that are not eligible for hedge accounting are stated at fair value with changes in fair value recognized in unassigned surplus in the period of change. Investment gains and losses generally result from the termination of derivative contracts prior to expiration and are generally recognized in net income and may be subject to IMR.
The Company uses derivative financial instruments for risk management purposes associated with certain invested assets and policy liabilities. Derivatives are used to (a) hedge the economic effects of interest rate and stock market movements on the Company’s guaranteed lifetime withdrawal benefit (“GLWB”) liability, (b) hedge the economic effect of a large increase in interest rates on the Company’s general account life insurance, group pension liabilities and certain separate account life insurance liabilities, (c) hedge the economic risks of other transactions such as future asset acquisitions or dispositions, the timing of liability pricing, currency risks on non-U.S. dollar denominated assets, and (d) convert floating rate assets or debt obligations to fixed rate assets or debt obligations for asset/liability management purposes.
The Company controls the credit risk of its derivative contracts through credit approvals, limits, monitoring procedures and in many cases, requiring collateral. The Company’s exposure is limited to the portion of the fair value of derivative instruments that exceeds the value of the collateral held and not to the notional or contractual amounts of the derivatives.
21
EMPOWER ANNUITY INSURANCE COMPANY OF AMERICA
Notes to Statutory Financial Statements
(In Thousands, Except Share Amounts)
Derivatives in a net asset position may have cash or securities pledged as collateral to the Company in accordance with the collateral support agreements with the counterparty. This collateral is held in a custodial account for the benefit of the Company. Unrestricted cash collateral is included in other assets and the obligation to return it is included in other liabilities. The cash collateral is reinvested in a money market fund. Securities pledged to the Company generally consist of U.S. government agency securities and are not recorded on the Statutory Statements of Admitted Assets, Liabilities, Capital and Surplus.
Cash collateral pledged by the Company is included in other assets.
The Company may purchase a financial instrument that contains a derivative embedded in the financial instrument. Contracts that do not in their entirety meet the definition of a derivative instrument, may contain “embedded” derivative instruments implicit or explicit terms that affect some or all of the cash flows or the value of other exchanges required by the contract in a manner similar to a derivative instrument. An embedded derivative instrument shall not be separated from the host contract and accounted for separately as a derivative instrument.
Funds held or deposited with reinsured companies
Funds held by reinsurers are receivables from ceding entities. Interest earned on the funds withheld receivable are included as a component of miscellaneous income.
Goodwill
Goodwill, resulting from acquisitions of subsidiaries that are reported in common stock and other invested assets, is amortized to unrealized capital gains/(losses) over the period in which the Company benefits economically, not to exceed ten years. Goodwill resulting from assumption reinsurance is reported in goodwill and is amortized to other insurance expenses over the period in which the Company benefits economically, not to exceed ten years. Admissible goodwill is limited in the aggregate to 10% of the Company’s adjusted capital and surplus. The Company tests goodwill for impairment annually or more frequently if events or circumstances indicate that there may be justification for conducting an interim test. If the carrying value of goodwill exceeds its fair value, the excess is recognized as impairment and recorded as a realized loss in the period in which the impairment is identified. There were no impairments of goodwill recognized during the years ended December 31, 2023, 2022 and 2021.
Reinsurance
Reinsurance premiums, commissions, expense reimbursements, and reserves related to reinsured business are accounted for on a basis consistent with those used in accounting for the original policies issued and the terms of the reinsurance contracts. Reserves are based on the terms of the reinsurance contracts and are consistent with the risks assumed. Life contract premiums and benefits ceded to other companies have been reported as a reduction of the premium revenue and benefit expense. Life contract premiums and benefits assumed from other companies have been reported as an increase in premium revenue and benefit expense. Invested assets and reserves ceded or assumed on deposit type contracts are accounted for using deposit accounting. The Company establishes a receivable for amounts due from reinsurers for claims paid and other amounts recoverable under the terms of the reinsurance contract.
Cash value of company owned life insurance
The Company is the owner and beneficiary of life insurance policies which are included in Statutory Statements of Admitted Assets, Liabilities, Capital and Surplus at their cash surrender values. At December 31, 2023, the investments underlying variable life insurance policies utilize various fund structures, with underlying investment characteristics of 26% equity, 36% fixed income, 17% cash and short terms, and 21% other. At December 31, 2022, the investments underlying variable life insurance policies utilize various fund structures, with underlying investment characteristics of 25% equity, 38% fixed income, 24% cash and short terms, 1% real estate and 12% other.
22
EMPOWER ANNUITY INSURANCE COMPANY OF AMERICA
Notes to Statutory Financial Statements
(In Thousands, Except Share Amounts)
Net investment income
Interest income from bonds is recognized when earned. Interest income on contract loans is recognized in net investment income at the contract interest rate when earned. All investment income due and accrued with amounts that are deemed uncollectible or that are over 90 days past due, including mortgage loans in default (“in process of foreclosure”), is not included in investment income. Amounts over 90 days past due are non-admitted assets and are recorded as a reduction to unassigned surplus. Real estate due and accrued income is excluded from net investment income if its collection is uncertain.
Net realized capital gains (losses)
Realized capital gains and losses are reported as a component of net income and are determined on a specific identification basis. Interest-related gains and losses are primarily subject to IMR, while non-interest related gains and losses are primarily subject to AVR. Realized capital gains and losses also result from the termination of derivative contracts prior to expiration and may be subject to IMR.
Policy reserves
Life insurance and annuity policy reserves with life contingencies are computed on the basis of statutory mortality and interest requirements and without consideration for withdrawals. Annuity contract reserves without life contingencies are computed on the basis of statutory interest requirements.
Policy reserves for life insurance are valued in accordance with the provision of applicable statutory regulations. Life insurance reserves are determined principally using the Commissioner’s Reserve Valuation Method, using the statutory mortality and interest requirements, without consideration for withdrawals. Some policies contain a surrender value in excess of the reserve as legally computed. This excess is calculated and recorded on a policy-by-policy basis.
Premium stabilization reserves are calculated for certain policies to reflect the Company’s estimate of experience refunds and interest accumulations on these policies. The reserves are invested by the Company. The income earned on these investments is accumulated in this reserve and is used to mitigate future premium rate increases for such policies.
Policy reserves ceded to other insurance companies are recorded as a reduction of the reserve liabilities. The cost of reinsurance related to long-duration contracts is accounted for over the life of the underlying reinsured policies using assumptions consistent with those used to account for the underlying policies.
Policy and contract claims include provisions for reported life, accident and health claims in process of settlement, valued in accordance with the terms of the related policies and contracts, as well as provisions for claims incurred but not reported based primarily on prior experience of the Company. As such, amounts are estimates, and the ultimate liability may differ from the amount recorded. Any changes in estimates will be reflected in the results of operations when additional information becomes known.
The liabilities for health claim reserves are determined using historical run-out rates, expected loss ratios and statistical analysis. The Company provides for significant claim volatility in areas where experience has fluctuated. The liabilities represent estimates of the ultimate net cost of all reported and unreported claims which are unpaid at year-end. Those estimates are subject to considerable variability in claim severity and frequency. The estimates are continually reviewed and adjusted as necessary as experience develops or new information becomes known; such adjustments are included in current operations.
Liability reserves for variable annuities with guarantees and universal life without secondary guarantees are valued in accordance with Principle-Based Reserving (“PBR”) methods, outlined in NAIC Valuation Manual Sections 20 and 21. PBR utilizes stochastic models to calculate levels of reserves to cover future benefits that would occur during possible poor future economic conditions. Reserve estimates are determined using both company experience and prescribed assumptions, with the final liability reserve being the greatest of the two estimates and floored at the aggregate surrender value.
23
EMPOWER ANNUITY INSURANCE COMPANY OF AMERICA
Notes to Statutory Financial Statements
(In Thousands, Except Share Amounts)
Premium, fee income and expenses
Life insurance premiums are recognized when due. Annuity considerations are recognized as revenue when received. Accident and health premiums are earned ratably over the terms of the related insurance and reinsurance contracts or policies. Life and accident and health insurance premiums received in advance are recorded as a liability and recognized as income when the premiums become earned. Fees from assets under management, assets under administration, shareholder servicing, mortality and expense risk charges, administration and record-keeping services and investment advisory services are recognized when earned in fee income or other income. Expenses incurred in connection with acquiring new insurance business, including acquisition costs such as sales commissions, are charged to operations as incurred.
Income taxes
The Company is included in the consolidated federal income tax return of Lifeco U.S. The federal income tax expense reported in the Statutory Statements of Operations represent income taxes provided on income that is currently taxable, excluding tax on net realized capital gains and losses. A net deferred tax asset is included in the Statutory Statement of Admitted Assets, Liabilities, Capital and Surplus which is recorded using the asset and liability method in which deferred tax assets and liabilities are recorded for expected future tax consequences of events that have been recognized in either the Company’s statutory financial statements or tax returns. Deferred income tax assets are subject to limitations prescribed by statutory accounting principles. The change in deferred income taxes is treated as a component of the change in unassigned deficit.
2. Recently Adopted Accounting Pronouncements
In 2023, the Statutory Accounting Principles Working Group (“SAPWG”) adopted as final, a new concept Issue Paper No. 167 – Derivatives and Hedging. This issue paper details the historical actions of the authoritative guidance resulting in new SAP concepts within SSAP No. 86 – Derivatives related to a) hedge documentation and initial assessment efficiencies, b) hedge effectiveness and measurement methods for excluded components and c) portfolio layer method and partial term hedging. As the statutory accounting guidance has already been adopted, the issue paper adoption is for historical documentation and does not change authoritative guidance. The adoption of this concept in March 2023 did not have a material effect on the Company’s financial statements.
In 2023, the SAPWG adopted as final, a new concept INT 23-01: Net Negative (Disallowed) Interest Maintenance Reserve. This interpretation provides optional, limited-time guidance, which allows the admittance of net negative (disallowed) interest maintenance reserve (IMR) up to 10% of adjusted capital and surplus. It will be effective until December 31, 2025, and automatically nullified on January 1, 2026, but the effective date can be adjusted (e.g., nullified earlier or extended). The Company adopted this guidance in August 2023 and the admitted net negative (disallowed) IMR is reflected within other assets on the Statutory Statements of Admitted Assets, Liabilities, Capital and Surplus.
In 2023, the SAPWG adopted as final, a new concept 2019-21 Bond Definition. This adoption revises SSAP No. 26R – Bonds and SSAP No. 43R – Loan-Backed and Structured Securities for the principles-based bond definition, the accounting for bonds (issuer credit obligations and asset-backed securities), as well as revisions to various SSAPs that have been updated to reflect the revised definition and/or SSAP references. This concept was adopted in August 2023 with a January 1, 2025 effective date. The Company is currently evaluating the effects on its financial statements and footnote disclosures of the future implementation of the concept.
In 2023, the SAPWG adopted as final, a new concept 2023-17: Short-Term Investments under SSAP No. 2R – Cash, Cash Equivalents, Drafts, and Short-Term investments. This issue paper further restricts the investments that are permitted for cash equivalent and short-term investment reporting. The revisions also exclude all Schedule BA: Other Long-Term Investments and mortgage loans. The Company adopted this concept in December 2023 with a January 1, 2025 effective date, to coincide with the bond project noted above. The Company is currently evaluating the effects on its financial statements and footnote disclosures of the future implementation of the concept.
In 2020, Statutory Accounting Principles Working Group (“SAPWG”) adopted a revised SSAP 32R, Preferred Stock, and a corresponding Issue Paper No. 164, Preferred Stock. The revised SSAP improves the definition of preferred stock, revises the measurement guidance based on the type and terms of preferred stock held, and clarifies the impairment and dividend recognition guidance. The standard was adopted with an effective date of January 1, 2021. The adoption of this standard did not have a material effect on the Company’s financial statements.
24
EMPOWER ANNUITY INSURANCE COMPANY OF AMERICA
Notes to Statutory Financial Statements
(In Thousands, Except Share Amounts)
In 2021, the SAPWG adopted revisions to SSAP No. 26R, Bonds. The SSAP revisions clarify that perpetual bonds are within scope of SSAP No. 26R. Those with an effective call option shall be amortized under the yield-to-worst concept, and those that do not possess, or no longer possess, a call feature shall be reported at fair value. Additional revisions expand current called bond disclosures to include bonds terminated through a tender offer. The revisions were adopted with an effective date of January 1, 2021. The adoption of these revisions did not have a material effect on the Company’s financial statements.
In 2022, the SAPWG adopted updated, summarized financial modeling guidance for residential mortgage-backed securities and commercial mortgage-backed securities in SSAP No. 43R – Loan-Backed and Structured Securities. This guidance continues to refer users to the detailed financial modeling guidance in the Purposes and Procedures Manual of the Investment Analysis Office, and was adopted on April 1, 2022. The adoption of this standard did not have a material effect on the Company’s financial statements.
In 2022, the SAPWG adopted a new concept under SSAP No. 86 Derivatives. The revisions adopt elements from Financial Accounting Standards Board (FASB) Accounting Standards Update (ASU) 2017-12: Derivatives and Hedging: Targeted Improvements to Accounting for Hedging Activities for determining hedge effectiveness. The revisions also incorporate statutory-specific measurement methods for excluded components in hedging instruments. These revisions were adopted with an effective date of January 1, 2023. The adoption of this accounting pronouncement did not have a material effect on the Company’s financial statements.
In 2022, the SAPWG adopted a new concept under SSAP No. 86 Derivatives. The revisions adopt with modification derivative guidance from ASU 2017-12, Derivatives and Hedging and ASU 2022-01, Fair Value Hedging – Portfolio Layer to include guidance for the portfolio layer method and partial-term hedges. These revisions were adopted with an effective date of January 1, 2023. The adoption of this accounting pronouncement did not have a material effect on the Company’s financial statements.
3. Related Party Transactions
In the normal course of business the Company enters into agreements with related parties whereby it provides and/or receives record-keeping services, investment advisory services, and tax-related services, as well as corporate support services which include general and administrative services, information technology services, sales and service support and marketing services.
On April 1, 2022, the Company completed the acquisition of all of the voting equity interests in Prudential Retirement Insurance and Annuity Company as part of the acquisition of Prudential’s Full Service retirement business. This transaction was accounted for as a statutory acquisition. On August 2, 2022, it was announced that the entity was renamed to Empower Annuity Insurance Company (“EAIC”). Additionally, on April 1, 2022, the Company completed the acquisition, via indemnity reinsurance, of the retirement services business of Prudential Insurance Company of America (“PICA”). As a result of the acquisitions, EAICA made the following changes:
| | • | | All employees of PICA acquired by EAICA were transferred to Empower. |
| | • | | Substantially all vendor contracts were assigned to Empower. |
The Company’s separate accounts invest in shares of Empower Funds, Inc., and Putnam Funds, which are affiliates of the Company and shares of other non-affiliated mutual funds and government and corporate bonds. The Company’s separate accounts include mutual funds or other investment options that purchase guaranteed interest annuity contracts issued by the Company. During the years ended December 31, 2023, 2022 and 2021, these purchases totaled $334,812, $108,285 and $232,833 respectively. As the general account investment contracts are also included in the separate account balances in the accompanying statutory statements of admitted assets, liabilities, capital and surplus, the Company has included the separate account assets and liabilities of $173,142 and $211,670 at December 31, 2023 and 2022, respectively, which is also included in the assets and liabilities of the general account at those dates.
During June of 2018, the Company invested $35,000 to fund the initial creation of five mutual funds offered by its subsidiary, Empower Capital Management LLC, (“ECM”). When the funds met certain targets for customer investment, the Company began redeeming its interests. The remaining investments were $26 and $22 at December 31, 2023 and 2022, respectively.
During the years ended December 31, 2023 and 2022, the Company contributed $200,273 and $187,948 to partnership funds controlled by Great-West Lifeco, Inc., respectively. The total invested amount in these partnerships as of December 31, 2023 was $94,544. The remaining Company commitments for these partnership funds through subsequent years total $761,793 (Refer to Note 18 for additional details).
25
EMPOWER ANNUITY INSURANCE COMPANY OF AMERICA
Notes to Statutory Financial Statements
(In Thousands, Except Share Amounts)
The following table summarizes amounts due from parent and affiliates:
| | | | | | | | | | | | |
| | | | | | | December 31, |
| | | | |
| Related party | | Indebtedness | | Due date | | 2023 | | 2022 |
| | | | |
Empower(1) | | On account | | On demand | | $ | 351,723 | | | $ | 172,841 | |
| | | | |
Great-West South Carolina (“GWSC”)(1) | | On account | | On demand | | | 25,881 | | | | 13,869 | |
| | | | |
ELAINY(1) | | On account | | On demand | | | — | | | | 10,773 | |
| | | | |
ETC(1) | | On account | | On demand | | | 264 | | | | 10,251 | |
| | | | |
CLAC(2) | | On account | | On demand | | | 19,723 | | | | 9,631 | |
| | | | |
EAG(1) | | On account | | On demand | | | — | | | | 8,000 | |
| | | | |
EFSI (1) | | On account | | On demand | | | 4,671 | | | | 5,853 | |
| | | | |
EAIC(1) | | On account | | On demand | | | — | | | | 3,476 | |
| | | | |
EPS(1) | | On account | | On demand | | | 25 | | | | 24 | |
| | | | |
ECM(1) | | On account | | On demand | | | 20,200 | | | | — | |
| | | | |
Empower Personal Wealth, LLC (“EPW”)(1) | | On account | | On demand | | | 988 | | | | — | |
| | | | |
Other related party receivables | | On account | | On demand | | | 315 | | | | 20 | |
| | | | | | | | | | | | |
| | | | |
Total | | | | | | $ | 423,790 | | | $ | 234,738 | |
| | | | | | | | | | | | |
(1) A wholly-owned subsidiary of EAICA
(2) An indirect wholly-owned subsidiary of Lifeco
The following table summarizes amounts due to parent and affiliates:
| | | | | | | | | | | | |
| | | |
| | | | | | | December 31, | |
| | | | |
| Related party | | Indebtedness | | Due date | | 2023 | | | 2022 | |
| | | | |
ECM(1) | | On account | | On demand | | $ | 1,410 | | | $ | 6,184 | |
| | | | |
EAG(1) | | On account | | On demand | | | 2 | | | | — | |
| | | | |
ELAINY(1) | | On account | | On demand | | | 12,764 | | | | — | |
| | | | |
EAIC(1) | | On account | | On demand | | | 105,294 | | | | — | |
| | | | |
Other related party payables | | On account | | On demand | | | 1,340 | | | | 497 | |
| | | | | | | | | | | | |
| | | | |
Total | | | | | | $ | 120,810 | | | $ | 6,681 | |
| | | | | | | | | | | | |
(1) A wholly-owned subsidiary of EAICA
Included in current federal income taxes owed at December 31, 2023 is $51,453 of income tax payable to Lifeco U.S. related to the consolidated income tax return filed by Lifeco U.S. Included in prior federal income taxes recoverable at December 31, 2022 is $19,519 of income tax receivable from Lifeco U.S. related to the consolidated income tax return filed by Lifeco U.S.
The Company received cash payments of $22,170, $19,004 and $13,470 from its subsidiary, GWSC, in 2023, 2022 and 2021 respectively, under the terms of its tax sharing agreement. During the years ended December 31, 2023, 2022 and 2021, the Company received interest income of $1,363, $1,841 and $1,326 respectively, from GWSC relating to the tax sharing agreement.
During the year ended December 31, 2023, the Company received dividends of $529,364 from its subsidiaries, the largest being $419,631 from EAIC. During the year ended December 31, 2022, the Company received dividends of $222,600 from its subsidiaries, the largest being $120,000 from Empower. During the year ended December 31, 2021, the Company received dividends of $151,075 from its subsidiaries, the largest being $96,675 from Empower.
During the years ended December 31, 2023 and 2022, the Company paid cash dividends to EHI in the amounts of $350,000 and $231,000 respectively.
26
EMPOWER ANNUITY INSURANCE COMPANY OF AMERICA
Notes to Statutory Financial Statements
(In Thousands, Except Share Amounts)
For the year ended December 31, 2022, the Prudential transaction resulted in an additional amount of $18,614 which was determined to be owed to the Company from ELAINY and is related to reinsurance trust activity associated with PICA. This amount was included within the Other Assets in the Statutory Statements of Admitted Assets, Liabilities, Capital and Surplus.
The Company and ELAINY have an agreement whereby the Company has committed to provide ELAINY financial support related to the maintenance of adequate regulatory surplus and liquidity.
4. Summary of Invested Assets
Investments in bonds consist of the following:
| | | | | | | | | | | | | | | | |
| | | December 31, 2023 |
| | | Book/adjusted
carrying value | | Fair value greater
than
book/adjusted
carrying value | | Fair value less
than
book/adjusted
carrying value | | Fair value |
| | | | |
U.S. government | | $ | 92,408 | | | $ | 1,282 | | | $ | 744 | | | $ | 92,946 | |
| | | | |
All other governments | | | 164,811 | | | | 795 | | | | 15,723 | | | | 149,883 | |
| | | | |
U.S. states, territories and possessions | | | 272,743 | | | | 7,085 | | | | 3,051 | | | | 276,777 | |
| | | | |
Political subdivisions of states and territories | | | 28,471 | | | | 114 | | | | 1,638 | | | | 26,947 | |
| | | | |
Special revenue and special assessments | | | 363,841 | | | | 1,058 | | | | 24,641 | | | | 340,258 | |
| | | | |
Industrial and miscellaneous | | | 19,756,280 | | | | 34,892 | | | | 2,129,647 | | | | 17,661,525 | |
| | | | |
Parent, subsidiaries and affiliates | | | 558 | | | | — | | | | — | | | | 558 | |
| | | | |
Hybrid securities | | | 66,720 | | | | 844 | | | | 1,626 | | | | 65,938 | |
| | | | |
Loan-backed and structured securities | | | 5,845,903 | | | | 6,293 | | | | 402,867 | | | | 5,449,329 | |
| | | | | | | | | | | | | | | | |
| | | | |
Total bonds | | $ | 26,591,735 | | | $ | 52,363 | | | $ | 2,579,937 | | | $ | 24,064,161 | |
| | | | | | | | | | | | | | | | |
| |
| | | December 31, 2022 |
| | | Book/adjusted
carrying value | | Fair value greater
than
book/adjusted
carrying value | | Fair value less
than
book/adjusted
carrying value | | Fair value |
| | | | |
U.S. government | | $ | 42,956 | | | $ | 253 | | | $ | 1,171 | | | $ | 42,038 | |
| | | | |
All other governments | | | 165,140 | | | | 217 | | | | 19,482 | | | | 145,875 | |
| | | | |
U.S. states, territories and possessions | | | 343,827 | | | | 7,972 | | | | 6,685 | | | | 345,114 | |
| | | | |
Political subdivisions of states and territories | | | 35,969 | | | | 112 | | | | 2,510 | | | | 33,571 | |
| | | | |
Special revenue and special assessments | | | 432,065 | | | | 791 | | | | 32,697 | | | | 400,159 | |
| | | | |
Industrial and miscellaneous | | | 21,774,565 | | | | 14,230 | | | | 2,987,352 | | | | 18,801,443 | |
| | | | |
Parent, subsidiaries and affiliates | | | 1,654 | | | | — | | | | — | | | | 1,654 | |
| | | | |
Hybrid securities | | | 126,575 | | | | — | | | | 12,432 | | | | 114,143 | |
| | | | |
Loan-backed and structured securities | | | 6,945,926 | | | | 4,935 | | | | 632,936 | | | | 6,317,925 | |
| | | | | | | | | | | | | | | | |
| | | | |
Total bonds | | $ | 29,868,677 | | | $ | 28,510 | | | $ | 3,695,265 | | | $ | 26,201,922 | |
| | | | | | | | | | | | | | | | |
The book/adjusted carrying value and estimated fair value of bonds and assets receiving bond treatment, based on estimated cash flows, are shown in the table below. Actual maturities will likely differ from these projections because borrowers may have the right to call or prepay obligations with or without call or prepayment penalties.
27
EMPOWER ANNUITY INSURANCE COMPANY OF AMERICA
Notes to Statutory Financial Statements
(In Thousands, Except Share Amounts)
| | | | | | | | |
| | | December 31, 2023 | |
| | | Book/adjusted
carrying value | | | Fair value | |
| | |
Due in one year or less | | $ | 1,845,132 | | | $ | 1,819,789 | |
| | |
Due after one year through five years | | | 8,185,988 | | | | 7,794,236 | |
| | |
Due after five years through ten years | | | 7,763,376 | | | | 6,789,168 | |
| | |
Due after ten years | | | 3,585,994 | | | | 2,846,543 | |
| | |
Loan-backed and structured securities | | | 5,845,903 | | | | 5,449,329 | |
| | | | | | | | |
| | |
Total bonds | | $ | 27,226,393 | | | $ | 24,699,065 | |
| | | | | | | | |
Loan-backed and structured securities include those issued by U.S. government and U.S. agencies.
The following table summarizes information regarding the sales of securities:
| | | | | | | | | | | | |
| | | Years ended December 31, | |
| | | 2023 | | | 2022 | | | 2021 | |
| | | |
Consideration from sales | | $ | 3,556,834 | | | $ | 17,782,699 | | | $ | 16,279,609 | |
| | | |
Gross realized gains from sales | | | 6,466 | | | | 53,961 | | | | 67,784 | |
| | | |
Gross realized losses from sales | | | 172,254 | | | | 281,028 | | | | 128,841 | |
Unrealized losses on bonds and preferred stock
The following tables summarize gross unrealized investment losses (amount by which amortized cost exceeds fair value and inclusive of foreign exchange related unrealized losses recorded to surplus) by class of investment:
| | | | | | | | | | | | | | | | | | | | | | | | |
| | | December 31, 2023 |
| | | Less than twelve months | | Twelve months or longer | | Total |
| Bonds: | | Fair value | | Unrealized
loss | | Fair value | | Unrealized
loss | | Fair value | | Unrealized
loss |
| | | | | | |
| U.S. government | | $ | — | | | $ | — | | | $ | 26,104 | | | $ | 744 | | | $ | 26,104 | | | $ | 744 | |
| | | | | | |
| All other governments | | | 795 | | | | 37 | | | | 133,685 | | | | 15,686 | | | | 134,480 | | | | 15,723 | |
| | | | | | |
| U.S. states, territories and possessions | | | 13,016 | | | | 48 | | | | 106,245 | | | | 3,003 | | | | 119,261 | | | | 3,051 | |
| | | | | | |
| Political subdivisions of states and territories | | | — | | | | — | | | | 11,832 | | | | 1,638 | | | | 11,832 | | | | 1,638 | |
| | | | | | |
| Special revenue and special assessments | | | 3,829 | | | | 445 | | | | 258,556 | | | | 23,822 | | | | 262,385 | | | | 24,267 | |
| | | | | | |
| Industrial and miscellaneous | | | 208,321 | | | | 6,098 | | | | 16,199,386 | | | | 2,386,721 | | | | 16,407,707 | | | | 2,392,819 | |
| | | | | | |
| Hybrid securities | | | 12,568 | | | | 95 | | | | 24,438 | | | | 4,908 | | | | 37,006 | | | | 5,003 | |
| | | | | | |
| Loan-backed and structured securities | | | 171,746 | | | | 12,023 | | | | 4,892,509 | | | | 401,639 | | | | 5,064,255 | | | | 413,662 | |
| | | | | | | | | | | | | | | | | | | | | | | | |
| | | | | | |
Total bonds | | $ | 410,275 | | | $ | 18,746 | | | $ | 21,652,755 | | | $ | 2,838,161 | | | $ | 22,063,030 | | | $ | 2,856,907 | |
| | | | | | | | | | | | | | | | | | | | | | | | |
| | | | | | |
Preferred stock | | $ | — | | | $ | — | | | $ | 74,751 | | | $ | 5,530 | | | $ | 74,751 | | | $ | 5,530 | |
| | | | | | | | | | | | | | | | | | | | | | | | |
| | | | | | |
Total number of securities in an unrealized loss position | | | | | | | 118 | | | | | | | | 4,029 | | | | | | | | 4,147 | |
| | | | | | | | | | | | | | | | | | | | | | | | |
28
EMPOWER ANNUITY INSURANCE COMPANY OF AMERICA
Notes to Statutory Financial Statements
(In Thousands, Except Share Amounts)
| | | | | | | | | | | | | | | | | | | | | | | | |
| | | December 31, 2022 | |
| | | Less than twelve months | | | Twelve months or longer | | | Total | |
| Bonds: | | Fair value | | | Unrealized
loss | | | Fair value | | | Unrealized
loss | | | Fair value | | | Unrealized
loss | |
| | | | | | |
| U.S. government | | $ | 37,679 | | | $ | 1,160 | | | $ | 96 | | | $ | 11 | | | $ | 37,775 | | | $ | 1,171 | |
| | | | | | |
| All other governments | | | 103,357 | | | | 10,217 | | | | 38,864 | | | | 9,265 | | | | 142,221 | | | | 19,482 | |
| | | | | | |
| U.S. states, territories and possessions | | | 153,571 | | | | 5,325 | | | | 5,841 | | | | 1,360 | | | | 159,412 | | | | 6,685 | |
| | | | | | |
| Political subdivisions of states and territories | | | 6,874 | | | | 1,119 | | | | 6,585 | | | | 1,391 | | | | 13,459 | | | | 2,510 | |
| | | | | | |
| Special revenue and special assessments | | | 203,333 | | | | 12,146 | | | | 130,425 | | | | 20,551 | | | | 333,758 | | | | 32,697 | |
| | | | | | |
| Industrial and miscellaneous | | | 11,777,186 | | | | 1,660,166 | | | | 6,460,755 | | | | 1,730,054 | | | | 18,237,941 | | | | 3,390,220 | |
| | | | | | |
| Hybrid securities | | | 16,858 | | | | 677 | | | | 97,284 | | | | 16,475 | | | | 114,142 | | | | 17,152 | |
| | | | | | |
| Loan-backed and structured securities | | | 4,286,875 | | | | 360,948 | | | | 1,959,396 | | | | 276,309 | | | | 6,246,271 | | | | 637,257 | |
| | | | | | | | | | | | | | | | | | | | | | | | |
| | | | | | |
Total bonds | | $ | 16,585,733 | | | $ | 2,051,758 | | | $ | 8,699,246 | | | $ | 2,055,416 | | | $ | 25,284,979 | | | $ | 4,107,174 | |
| | | | | | | | | | | | | | | | | | | | | | | | |
| | | | | | |
Preferred stock | | $ | 50,017 | | | $ | 4,306 | | | $ | 25,597 | | | $ | 2,327 | | | $ | 75,614 | | | $ | 6,633 | |
| | | | | | | | | | | | | | | | | | | | | | | | |
| | | | | | |
Total number of securities in an
unrealized loss position | | | | | | | 2,447 | | | | | | | | 2,407 | | | | | | | | 4,854 | |
| | | | | | | | | | | | | | | | | | | | | | | | |
Bonds and preferred stock - Total unrealized losses decreased by ($1,251,370), or (30%), from December 31, 2022 to December 31, 2023. The decrease in unrealized losses was across most asset classes and was primarily driven by higher valuations as a result of lower rates at December 31, 2023 compared to December 31, 2022.
Total unrealized losses greater than twelve months increased by $785,948 from December 31, 2022 to December 31, 2023. Industrial and miscellaneous account for 84%, or $2,386,721 of the unrealized losses greater than twelve months at December 31, 2023. The majority of these bonds continue to be designated as investment grade. Management does not have the intent to sell these assets; therefore, an OTTI was not recognized in net income.
Loan-backed and structured securities account for 14%, or $401,639, of the unrealized losses greater than twelve months at December 31, 2023. Of the $401,639 of unrealized losses over twelve months on loan-backed and structured securities, 97% or $390,694 are securities which continue to be designated as investment grade. The present value of cash flows expected to be collected is not less than amortized cost and management does not have the intent to sell these assets; therefore, an OTTI was not recognized in net income.
Loan-backed and structured securities
The Company had a concentration in loan-backed and structured securities of 14% and 16% of total invested assets at December 31, 2023 and 2022, respectively.
Derivative financial instruments
Derivative transactions are generally entered into pursuant to International Swaps and Derivatives Association (“ISDA”) Master Agreements with approved counterparties that provide for a single net payment to be made by one party to the other on a daily basis, periodic payment dates, or at the due date, expiration, or termination of the agreement.
The ISDA Master Agreements contain provisions that would allow the counterparties to require immediate settlement of all derivative instruments in a net liability position if the Company were to default on any debt obligations over a certain threshold. The aggregate fair value of derivative instruments with credit-risk-related contingent features that were in a net liability position was $14,908 and $63,264 as of December 31, 2023 and 2022, respectively. The Company had pledged collateral related to these derivatives of $53 and $29,830 as of December 31, 2023 and 2022, respectively, in the normal course of business. If the credit-risk-related contingent features were triggered on December 31, 2023 the fair value of assets that could be required to settle the derivatives in a net liability position was $14,855.
29
EMPOWER ANNUITY INSURANCE COMPANY OF AMERICA
Notes to Statutory Financial Statements
(In Thousands, Except Share Amounts)
At December 31, 2023 and 2022, the Company had pledged $53 and $29,830, respectively, of unrestricted cash collateral to counterparties in the normal course of business, while other counterparties had pledged $307,014 and $506,700 unrestricted cash and securities collateral to the Company to satisfy collateral netting arrangements, respectively.
At December 31, 2023 and 2022, the Company had pledged U.S. Treasury notes in the amount of $308 and $3,158, respectively, with a broker as collateral for futures contracts.
Types of derivative instruments and derivative strategies
Interest rate contracts
Cash flow hedges
Interest rate swap agreements are used to convert the interest rate on certain debt securities and debt obligations from a floating rate to a fixed rate.
Not designated as hedging instruments
The Company enters into certain transactions in which derivatives are hedging an economic risk but hedge accounting is either not elected or the transactions are not eligible for hedge accounting. These derivative instruments include: exchange-traded interest rate swap futures, OTC interest rate swaptions, OTC interest rate swaps, treasury interest rate futures, and interest rate floors. Certain of the Company’s OTC derivatives are cleared and settled through a central clearing counterparty while others are bilateral contracts between the Company and a counterparty.
The derivative instruments mentioned above are economic hedges and used to manage risk. These transactions are used to offset changes in liabilities including those in variable annuity products, hedge the economic effect of a large increase in interest rates, manage the potential variability in future interest payments due to a change in credited interest rates and the related change in cash flows due to increased surrenders, and manage interest rate risks of forecasted acquisitions of bonds and forecasted liability pricing.
Foreign currency contracts
Cross-currency swaps and foreign currency forwards are used to manage the foreign currency exchange rate risk associated with investments denominated in other than U.S. dollars. The Company uses cross-currency swaps to convert interest and principal payments on foreign denominated debt instruments into U.S. dollars. Cross-currency swaps may be designated as cash flow hedges; however, some are not eligible for hedge accounting. The Company uses foreign currency forwards to reduce the risk of foreign currency exchange rate changes on proceeds received on sales of foreign denominated debt instruments; however, hedge accounting is not elected.
Equity contracts
The Company uses futures and options on equity indices to offset changes in GLWB liabilities; however, they are not eligible for hedge accounting.
30
EMPOWER ANNUITY INSURANCE COMPANY OF AMERICA
Notes to Statutory Financial Statements
(In Thousands, Except Share Amounts)
The following tables summarize derivative financial instruments:
| | | | | | | | | | | | |
| | | December 31, 2023 |
| | | Notional
amount | | Net book/
adjusted
carrying
value (1) | | Fair value |
| | | |
| Hedge designation/derivative type: | | | | | | | | | | | | |
| | | |
Derivatives designated as hedges: | | | | | | | | | | | | |
| | | |
Cash flow hedges: | | | | | | | | | | | | |
| | | |
Interest rate swaps | | $ | 13,300 | | | $ | — | | | $ | 774 | |
| | | |
Cross-currency swaps | | | 2,603,665 | | | | 150,104 | | | | 209,048 | |
| | | | | | | | | | | | |
| | | |
Total cash flow hedges | | | 2,616,965 | | | | 150,104 | | | | 209,822 | |
| | | | | | | | | | | | |
| | | |
| Derivatives not designated as hedges: | | | | | | | | | | | | |
| | | |
Interest rate swaps | | | 50,980 | | | | 335 | | | | 335 | |
| | | |
Futures on equity indices | | | 857 | | | | 308 | | | | 5 | |
| | | |
Cross-currency swaps | | | 584,947 | | | | 81,385 | | | | 81,385 | |
| | | |
Foreign currency forwards | | | 88,620 | | | | (2,336 | ) | | | (2,336 | ) |
| | | | | | | | | | | | |
| | | |
| Total derivatives not designated as hedges | | | 725,404 | | | | 79,692 | | | | 79,389 | |
| | | | | | | | | | | | |
| | | |
| Total cash flow hedges, and derivatives not designated as hedges | | $ | 3,342,369 | | | $ | 229,796 | | | $ | 289,211 | |
| | | | | | | | | | | | |
(1) The book/adjusted carrying value excludes accrued income and expense. The book/adjusted carrying value of all derivatives in an asset position is reported within other invested assets and the book/adjusted carrying value of all derivatives in a liability position is reported within other liabilities in the Statutory Statements of Admitted Assets, Liabilities, Capital and Surplus.
| | | | | | | | | | | | |
| | | December 31, 2022 |
| | | Notional
amount | | Net book/
adjusted
carrying
value (1) | | Fair value |
| | | |
| Hedge designation/derivative type: | | | | | | | | | | | | |
| | | |
Derivatives designated as hedges: | | | | | | | | | | | | |
| | | |
Cash flow hedges: | | | | | | | | | | | | |
| | | |
Interest rate swaps | | $ | 18,300 | | | $ | — | | | $ | 1,971 | |
| | | |
Cross-currency swaps | | | 2,826,016 | | | | 279,839 | | | | 399,835 | |
| | | | | | | | | | | | |
| | | |
Total cash flow hedges | | | 2,844,316 | | | | 279,839 | | | | 401,806 | |
| | | | | | | | | | | | |
| | | |
Derivatives not designated as hedges: | | | | | | | | | | | | |
| | | |
Interest rate swaps | | | 714,954 | | | | (25,504 | ) | | | (26,656 | ) |
| | | |
Futures on equity indices | | | 40,036 | | | | 2,487 | | | | 242 | |
| | | |
Interest rate futures | | | 10,800 | | | | 671 | | | | (14 | ) |
| | | |
Cross-currency swaps | | | 551,359 | | | | 109,353 | | | | 108,941 | |
| | | |
Foreign currency forwards | | | 61,106 | | | | (1,009 | ) | | | (1,009 | ) |
| | | | | | | | | | | | |
| | | |
| Total derivatives not designated as hedges | | | 1,378,255 | | | | 85,998 | | | | 81,504 | |
| | | | | | | | | | | | |
| | | |
| Total cash flow hedges and derivatives not designated as hedges | | $ | 4,222,571 | | | $ | 365,837 | | | $ | 483,310 | |
| | | | | | | | | | | | |
(1) The book/adjusted carrying value excludes accrued income and expense. The book/adjusted carrying value of all derivatives in an asset position is reported within other invested assets and the book/adjusted carrying value of all derivatives in a liability position is reported within other liabilities in the Statutory Statements of Admitted Assets, Liabilities, Capital and Surplus.
31
EMPOWER ANNUITY INSURANCE COMPANY OF AMERICA
Notes to Statutory Financial Statements
(In Thousands, Except Share Amounts)
The following table presents net unrealized capital gains (losses) on derivatives not designated as hedging instruments as reported in the Statutory Statements of Changes in Capital and Surplus:
| | | | | | | | | | | | |
| | | Net unrealized capital gains (losses) on derivatives
recognized in surplus | |
| | | Year Ended December 31, | |
| | | 2023 | | | 2022 | | | 2021 |
| | | |
| Derivatives not designated as hedging instruments: | | | | | | | | | | | | |
| | | |
Interest rate swaps | | $ | 19,797 | | | $ | (21,543) | | | | (7,646) | |
| | | |
Interest rate swaptions | | | — | | | | 38 | | | | 403 | |
| | | |
Futures on equity indices | | | (803) | | | | 1,055 | | | | (306) | |
| | | |
Interest rate futures | | | (73) | | | | 73 | | | | (21) | |
| | | |
Cross-currency swaps | | | (26,913) | | | | 45,691 | | | | 11,669 | |
| | | |
Foreign currency forwards | | | (1,049) | | | | (797) | | | | 20 | |
| | | | | | | | | | | | |
| | | |
| Total | | $ | (9,041) | | | $ | 24,517 | | | $ | 4,119 | |
| | | | | | | | | | | | |
Securities lending
Securities with a cost or amortized cost of $617,821 and $117,997, and estimated fair values of $602,090 and $102,545 were on loan under the program at December 31, 2023 and 2022, respectively.
The following table summarizes securities on loan by category:
| | | | | | | | | | | | | | | | |
| | | December 31, | | | December 31, | |
| | | 2023 | | | 2022 | |
| | | Book/adjusted
carrying value | | | Fair value | | | Book/adjusted
carrying value | | | Fair value | |
| | | | |
| Hybrid securities | | $ | 4 | | | $ | 4 | | | $ | — | | | $ | — | |
| | | | |
| Industrial and miscellaneous | | | 149,222 | | | | 133,182 | | | | 117,997 | | | | 102,545 | |
| | | | |
| U.S. government | | | 468,595 | | | | 468,904 | | | | — | | | | — | |
| | | | | | | | | | | | | | | | |
| | | | |
| | $ | 617,821 | | | $ | 602,090 | | | $ | 117,997 | | | $ | 102,545 | |
| | | | | | | | | | | | | | | | |
The Company’s securities lending agreements are open agreements meaning the borrower can return and the Company can recall the loaned securities at any time.
The Company received cash of $317,362 and $107,068, and securities of $299,686 and $0 as collateral related to the securities lending program at December 31, 2023 and 2022, respectively. None of the securities are permitted to be sold or repledged and all of the cash was reinvested. This cash was reinvested into money market funds and short-term repurchase agreements which are collateralized by U.S. government or U.S. government agency securities and mature in under 30 days.
32
EMPOWER ANNUITY INSURANCE COMPANY OF AMERICA
Notes to Statutory Financial Statements
(In Thousands, Except Share Amounts)
Restricted assets
The following tables summarize investments on deposit or trust accounts controlled by various state insurance departments in accordance with statutory requirements as well as other deposits and collateral pledged by the Company:
| | | | | | | | | | | | | | | | | | | | | | | | | | | | | | | | | | | | | | | | | | | | |
| | | December 31, 2023 | |
| | | Gross (Admitted & Non-admitted) Restricted | | | Percentage | |
| | | Total
General
Account
(G/A) | | | G/A
Supporting
S/A
Activity | | | Total
Separate
Account
(S/A)
Restricted
Assets | | | S/A Assets
Supporting
G/A
Activity | | | Total | | | Total
From
Prior
Year | | | Increase/
(Decrease) | | | Total
Non-admitted
Restricted | | | Total
Admitted
Restricted | | | Gross
(Admitted &
Non-admitted)
Restricted to
Total Assets | | | Admitted
Restricted
to Total
Admitted
Assets | |
Restricted Asset
Category: |
| | | | | | | | | | | |
| Collateral held under security lending arrangements | | $ | 317,362 | | | $ | — | | | $ | — | | | $ | — | | | $ | 317,362 | | | $ | 107,068 | | | $ | 210,294 | | | $ | — | | | $ | 317,362 | | | | 0.43% | | | | 0.44% | |
| | | | | | | | | | | |
| FHLB capital stock | | | 551 | | | | — | | | | — | | | | — | | | | 551 | | | | 509 | | | | 42 | | | | — | | | | 551 | | | | 0.00% | | | | 0.00% | |
| | | | | | | | | | | |
| On deposit with states | | | 4,299 | | | | — | | | | — | | | | — | | | | 4,299 | | | | 4,213 | | | | 86 | | | | — | | | | 4,299 | | | | 0.01% | | | | 0.01% | |
| | | | | | | | | | | |
| On deposit with other regulatory bodies | | | 535 | | | | — | | | | — | | | | — | | | | 535 | | | | 503 | | | | 32 | | | | — | | | | 535 | | | | 0.00% | | | | 0.00% | |
| | | | | | | | | | | |
| Pledged as collateral not captured in other categories: | | | | | | | | | | | | | | | | | | | | | | | | | | | | | | | | | | | | | | | | | | | | |
| | | | | | | | | | | |
Futures margin deposits | | | 308 | | | | — | | | | 2,417 | | | | — | | | | 2,725 | | | | 4,960 | | | | (2,235) | | | | — | | | | 2,725 | | | | 0.00% | | | | 0.00% | |
| | | | | | | | | | | |
Derivative cash collateral | | | 17 | | | | — | | | | 432 | | | | — | | | | 449 | | | | 30,172 | | | | (29,723) | | | | — | | | | 449 | | | | 0.00% | | | | 0.00% | |
| | | | | | | | | | | |
| Other restricted assets | | | 1,041 | | | | — | | | | — | | | | — | | | | 1,041 | | | | 1,088 | | | | (47) | | | | — | | | | 1,041 | | | | 0.00% | | | | 0.00% | |
| | | | | | | | | | | | | | | | | | | | | | | | | | | | | | | | | | | | | | | | | | | | |
| | | | | | | | | | | |
| Total Restricted Assets | | $ | 324,113 | | | $ | — | | | $ | 2,849 | | | $ | — | | | $ | 326,962 | | | $ | 148,513 | | | $ | 178,449 | | | $ | — | | | $ | 326,962 | | | | 0.45% | | | | 0.45% | |
| | | | | | | | | | | | | | | | | | | | | | | | | | | | | | | | | | | | | | | | | | | | |
| | | | | | | | | | | | | | | | | | | | | | | | | | | | | | | | | | | | | | | | | | | | |
| | | December 31, 2022 | |
| | | Gross (Admitted & Non-admitted) Restricted | | | Percentage | |
| | | Total
General
Account
(G/A) | | | G/A
Supporting
S/A
Activity | | | Total
Separate
Account
(S/A)
Restricted
Assets | | | S/A Assets
Supporting
G/A
Activity | | | Total | | | Total
From
Prior
Year | | | Increase/
(Decrease) | | | Total
Non-
admitted
Restricted | | | Total
Admitted
Restricted | | | Gross
(Admitted &
Non-
admitted)
Restricted to
Total Assets | | | Admitted
Restricted
to Total
Admitted
Assets | |
| Restricted Asset Category: |
| | | | | | | | | | | |
| Collateral held under security lending arrangements | | $ | 107,068 | | | $ | — | | | $ | — | | | $ | — | | | $ | 107,068 | | | $ | 126,254 | | | $ | (19,186) | | | $ | — | | | $ | 107,068 | | | | 0.14% | | | | 0.14% | |
| | | | | | | | | | | |
| FHLB Capital | | | | | | | | | | | | | | | | | | | | | | | | | | | | | | | | | | | | | | | | | | | | |
| | | | | | | | | | | |
| Stock | | | 509 | | | | — | | | | — | | | | — | | | | 509 | | | | 501 | | | | 8 | | | | — | | | | 509 | | | | 0.00% | | | | 0.00% | |
| | | | | | | | | | | |
| On deposit with states | | | 4,213 | | | | — | | | | — | | | | — | | | | 4,213 | | | | 4,246 | | | | (33) | | | | — | | | | 4,213 | | | | 0.01% | | | | 0.01% | |
| | | | | | | | | | | |
| On deposit with other regulatory bodies | | | 503 | | | | — | | | | — | | | | — | | | | 503 | | | | 529 | | | | (26) | | | | — | | | | 503 | | | | 0.00% | | | | 0.00% | |
| | | | | | | | | | | |
| Pledged as collateral not captured in other categories: | | | | | | | | | | | | | | | | | | | | | | | | | | | | | | | | | | | | | | | | | | | | |
| | | | | | | | | | | |
Futures margin deposits | | | 3,158 | | | | — | | | | 1,802 | | | | — | | | | 4,960 | | | | 3,477 | | | | 1,483 | | | | — | | | | 4,960 | | | | 0.02% | | | | 0.02% | |
| | | | | | | | | | | |
Derivative cash collateral | | | 29,830 | | | | — | | | | 342 | | | | — | | | | 30,172 | | | | 11,033 | | | | 19,139 | | | | — | | | | 30,172 | | | | 0.04% | | | | 0.04% | |
| | | | | | | | | | | |
| Other restricted assets | | | 1,088 | | | | — | | | | — | | | | — | | | | 1,088 | | | | 1,132 | | | | (44) | | | | — | | | | 1,088 | | | | 0.00% | | | | 0.00% | |
| | | | | | | | | | | | | | | | | | | | | | | | | | | | | | | | | | | | | | | | | | | | |
| | | | | | | | | | | |
| Total Restricted Assets | | $ | 146,369 | | | $ | — | | | $ | 2,144 | | | $ | — | | | $ | 148,513 | | | $ | 147,172 | | | $ | 1,341 | | | $ | — | | | $ | 148,513 | | | | 0.20% | | | | 0.20% | |
| | | | | | | | | | | | | | | | | | | | | | | | | | | | | | | | | | | | | | | | | | | | |
33
EMPOWER ANNUITY INSURANCE COMPANY OF AMERICA
Notes to Statutory Financial Statements
(In Thousands, Except Share Amounts)
Net investment income
The following table summarizes net investment income:
| | | | | | | | | | | | |
| | | Years Ended December 31, |
| | | 2023 | | 2022 | | 2021 |
| | | |
| Bonds | | $ | 1,010,128 | | | $ | 928,803 | | | $ | 747,549 | |
| | | |
| Preferred stock | | | 5,917 | | | | 4,377 | | | | 4,249 | |
| | | |
| Common stock | | | 52 | | | | 629 | | | | 964 | |
| | | |
| Mortgage loans | | | 204,415 | | | | 186,997 | | | | 141,323 | |
| | | |
| Real estate | | | 32,253 | | | | 29,693 | | | | 31,241 | |
| | | |
| Contract loans | | | 182,531 | | | | 184,184 | | | | 186,842 | |
| | | |
| Cash, cash equivalents and short-term investments | | | 49,548 | | | | 9,763 | | | | 6,249 | |
| | | |
| Derivative instruments | | | 41,131 | | | | 39,585 | | | | 31,105 | |
| | | |
| Other invested assets | | | 567,873 | | | | 247,053 | | | | 181,987 | |
| | | |
| Miscellaneous | | | 7,959 | | | | (1,564 | ) | | | 8,619 | |
| | | | | | | | | | | | |
| | | |
Gross investment income | | | 2,101,807 | | | | 1,629,520 | | | | 1,340,128 | |
| | | |
| Expenses | | | (132,606 | ) | | | (110,966 | ) | | | (77,391 | ) |
| | | | | | | | | | | | |
| | | |
| Net investment income | | $ | 1,969,201 | | | $ | 1,518,554 | | | $ | 1,262,737 | |
| | | | | | | | | | | | |
The amount of interest incurred and charged to investment expense during the years ended December 31, 2023, 2022 and 2021 was $78,482, $74,797 and $40,395, respectively.
The following table summarizes net realized capital gains (losses) on investments net of federal income tax and interest maintenance reserve transfer:
| | | | | | | | | | | | |
| | | Year Ended December 31, |
| | | 2023 | | 2022 | | 2021 |
| | | |
| Net realized capital (losses) gains, before federal income tax | | $ | (205,215 | ) | | $ | (200,418 | ) | | $ | (55,369 | ) |
| | | |
Less: Federal income tax (benefit) expense | | | (43,095 | ) | | | (42,088 | ) | | | (11,628 | ) |
| | | | | | | | | | | | |
| | | |
| Net realized capital (losses) gains, before IMR transfer | | | (162,120 | ) | | | (158,330 | ) | | | (43,741 | ) |
| | | |
Net realized capital (losses) gains transferred to IMR, net of federal income tax (benefit) expense of ($36,892), ($48,369) and ($12,531), respectively | | | (138,784 | ) | | | (181,960 | ) | | | (47,140 | ) |
| | | | | | | | | | | | |
| | | |
Net realized capital gains (losses), net of federal income tax (benefit) expense of ($6,203), $6,281 and $904, respectively, and IMR transfer | | $ | (23,336 | ) | | $ | 23,630 | | | $ | 3,399 | |
| | | | | | | | | | | | |
34
EMPOWER ANNUITY INSURANCE COMPANY OF AMERICA
Notes to Statutory Financial Statements
(In Thousands, Except Share Amounts)
Interest maintenance reserve
The Company does not have any unamortized balances in IMR for allocated gains and losses from derivatives that were reported at fair value prior to the termination of the derivative. The Company’s net negative (disallowed) IMR in aggregate and allocated between the general account and insulated separate accounts is $18,992 at December 31, 2023. Of this amount, $17,477 is admitted in the general account and $1,515 is reported as an asset in the insulated separate account. The calculated adjusted capital and surplus is $3,517,345 at December 31, 2023. The admitted net negative (disallowed) IMR, including amounts admitted in the general account and recognized as an asset in the separate accounts, represents 0.54% of adjusted capital and surplus. Fixed income investments generating IMR losses comply with the Company’s documented investment or liability management policies. Any deviation was either because of a temporary and transitory timing issue or related to a specific event, such as a reinsurance transaction, that mechanically made the cause of IMR losses not reflective of reinvestment activities. IMR losses for fixed income related derivatives are all in accordance with prudent and documented risk management procedures, in accordance with the Company’s derivative use plans and reflect symmetry with historical treatment in which unrealized derivative gains were reversed to IMR and amortization in lieu of being recognized as realized gains upon derivative termination. Asset sales that were generating admitted negative IMR were not compelled by liquidity pressures (e.g., to fund significant cash outflows including, but not limited to excess withdrawals and collateral calls).
Concentrations
The Company had the following bond concentrations based on total invested assets:
| | | | |
| | | Concentration by type |
| | | December 31, |
| | | 2023 | | 2022 |
| | |
| Industrial and miscellaneous | | 60% | | 64% |
| |
| | | Concentration by industry |
| | | December 31, |
| | | 2023 | | 2022 |
| | |
| Financial services | | 15% | | 16% |
Mortgage loans
The following table summarizes the recorded investment of the commercial all other mortgage loan portfolio by risk assessment category:
| | | | | | | | |
| | | December 31, |
| | | 2023 | | 2022 |
| | |
| Performing: | | | | | | | | |
| | |
Non-Participation agreements | | $ | 3,461,108 | | | $ | 3,592,633 | |
| | |
Participation agreements | | | 2,376,432 | | | | 2,540,062 | |
| | | | | | | | |
| | |
| Total Performing | | | 5,837,540 | | | | 6,132,695 | |
| | |
| Non-Performing: | | | | | | | | |
| | |
Participation agreements | | | 59,013 | | | | — | |
| | | | | | | | |
| | |
| Total Non-Performing | | | 59,013 | | | | — | |
| | | | | | | | |
| | |
| Total recorded investment of commercial mortgage loans | | $ | 5,896,553 | | | $ | 6,132,695 | |
| | | | | | | | |
All of the performing loans were current as of December 31, 2023 and 2022. The non-performing loans are considered impaired, with one loan in the amount of $4,844 in the process of foreclosure, and a corresponding specific provision of $17,822 was recorded due to the estimated loss anticipated to be recognized in 2024.
35
EMPOWER ANNUITY INSURANCE COMPANY OF AMERICA
Notes to Statutory Financial Statements
(In Thousands, Except Share Amounts)
The maximum lending rates for commercial mortgage loans originated during the years ended December 31, 2023 and 2022 were 8.0% and 7.2%, respectively. The minimum lending rates for commercial mortgage loans originated during the years ended December 31, 2023 and 2022 were 5.3% and 2.8%, respectively.
During 2023 and 2022, the maximum percentage of any one loan to the value of security at the time of the loan, exclusive of insured or guaranteed or purchase money mortgages, was 53% and 71%, respectively.
The following table summarizes activity in the commercial mortgage provision allowance for the years ended December 31, 2023 and 2022:
| | | | | | | | |
| |
| | | December 31, | |
| | |
| | | 2023 | | | 2022 | |
| | |
Beginning balance | | $ | 646 | | | $ | 745 | |
| | |
Additions charged to operations - general provision | | | 37,644 | | | | — | |
| | |
Additions charged to operations - specific provision | | | 17,822 | | | | — | |
| | |
Recoveries of amounts previously charged off | | | — | | | | (99 | ) |
| | | | | | | | |
| | |
Ending balance | | $ | 56,112 | | | $ | 646 | |
| | | | | | | | |
The following tables present concentrations of the total commercial mortgage portfolio:
| | | | |
| |
| | | Concentration by type |
| |
| | | December 31, |
| | |
| | | 2023 | | 2022 |
| | |
Industrial | | 35% | | 33% |
| | |
Multi-family | | 33% | | 36% |
| | |
Office | | 16% | | 14% |
| | |
Retail | | 10% | | 10% |
| | |
Other | | 6% | | 7% |
| | | | |
| | |
| | 100% | | 100% |
| | | | |
| |
| | Concentration by geographic area |
| |
| | December 31, |
| | |
| | 2023 | | 2022 |
| | |
Pacific | | 30% | | 31% |
| | |
East North Central | | 18% | | 18% |
| | |
South Atlantic | | 16% | | 15% |
| | |
Other | | 10% | | 10% |
| | |
Middle Atlantic | | 10% | | 9% |
| | |
Mountain | | 7% | | 8% |
| | |
West South Central | | 6% | | 6% |
| | |
New England | | 3% | | 3% |
| | | | |
| | |
| | 100% | | 100% |
| | | | |
36
EMPOWER ANNUITY INSURANCE COMPANY OF AMERICA
Notes to Statutory Financial Statements
(In Thousands, Except Share Amounts)
5. Fair Value Measurements
Fair value hierarchy
The following tables present information about the Company’s financial assets and liabilities carried at fair value and indicates the fair value hierarchy of the valuation techniques utilized by the Company to determine such fair value:
| | | | | | | | | | | | | | | | | | | | |
| | | Fair Value Measurements at Reporting Date |
| | | December 31, 2023 |
| | | | | | | | | Net Asset Value | | Total |
Assets: | | (Level 1) | | (Level 2) | | (Level 3) | | (NAV) | | (All Levels) |
| | | | | |
Bonds | | | | | | | | | | | | | | | | | | | | |
| | | | | |
Industrial and miscellaneous | | $ | — | | | $ | 2,348 | | | $ | — | | | $ | — | | | $ | 2,348 | |
| | | | | |
Hybrid securities | | | — | | | | 11,906 | | | | — | | | | — | | | | 11,906 | |
| | | | | |
Preferred stock | | | | | | | | | | | | | | | | | | | | |
| | | | | |
Redeemable preferred stock | | | — | | | | 500 | | | | — | | | | — | | | | 500 | |
| | | | | |
Common stock | | | | | | | | | | | | | | | | | | | | |
| | | | | |
Mutual funds | | | 26 | | | | — | | | | — | | | | — | | | | 26 | |
| | | | | |
Other invested assets | | | | | | | | | | | | | | | | | | | | |
| | | | | |
Limited partnerships | | | — | | | | — | | | | — | | | | 719,547 | | | | 719,547 | |
| | | | | |
Residual tranche | | | — | | | | 40,829 | | | | — | | | | — | | | | 40,829 | |
| | | | | |
Derivatives | | | | | | | | | | | | | | | | | | | | |
| | | | | |
Interest rate swaps | | | — | | | | 2,309 | | | | — | | | | — | | | | 2,309 | |
| | | | | |
Cross-currency swaps | | | — | | | | 81,385 | | | | — | | | | — | | | | 81,385 | |
| | | | | |
Separate account assets (1) | | | 11,474,482 | | | | 9,628,887 | | | | — | | | | 825,699 | | | | 21,929,068 | |
| | | | | | | | | | | | | | | | | | | | |
| Total assets at fair value/NAV | | $ | 11,474,508 | | | $ | 9,768,164 | | | $ | — | | | $ | 1,545,246 | | | $ | 22,787,918 | |
| | | | | | | | | | | | | | | | | | | | |
| | | | | |
Liabilities: | | | | | | | | | | |
| | | | | |
Derivatives | | | | | | | | | | | | | | | | | | | | |
| | | | | |
Interest rate swaps | | $ | — | | | $ | 1,974 | | | $ | — | | | $ | — | | | $ | 1,974 | |
| | | | | |
Foreign currency forwards | | | — | | | | 2,336 | | | | — | | | | — | | | | 2,336 | |
| | | | | |
Separate account liabilities (1) | | | 47,658 | | | | 950,338 | | | | — | | | | — | | | | 997,996 | |
| | | | | | | | | | | | | | | | | | | | |
| | | | | |
Total liabilities | | $ | 47,658 | | | $ | 954,648 | | | $ | — | | | $ | — | | | $ | 1,002,306 | |
| | | | | | | | | | | | | | | | | | | | |
(1) Includes only separate account investments which are carried at the fair value of the underlying invested assets or liabilities owned by the separate accounts.
37
EMPOWER ANNUITY INSURANCE COMPANY OF AMERICA
Notes to Statutory Financial Statements
(In Thousands, Except Share Amounts)
| | | | | | | | | | | | | | | | | | | | |
| | | Fair Value Measurements at Reporting Date |
| | | December 31, 2022 |
| | | | | | | | | Net Asset Value | | Total |
Assets: | | (Level 1) | | (Level 2) | | (Level 3) | | (NAV) | | (All Levels) |
| | | | | |
Bonds | | | | | | | | | | | | | | | | | | | | |
| | | | | |
Hybrid securities | | $ | — | | | $ | 15,313 | | | $ | — | | | $ | — | | | $ | 15,313 | |
| | | | | |
Common stock | | | | | | | | | | | | | | | | | | | | |
| | | | | |
Mutual funds | | | 22 | | | | — | | | | — | | | | — | | | | 22 | |
| | | | | |
Other invested assets | | | | | | | | | | | | | | | | | | | | |
| | | | | |
Limited partnerships | | | — | | | | — | | | | — | | | | 514,208 | | | | 514,208 | |
| | | | | |
Residual tranche | | | — | | | | 38,661 | | | | — | | | | — | | | | 38,661 | |
| | | | | |
Industrial and miscellaneous | | | — | | | | 4,040 | | | | — | | | | — | | | | 4,040 | |
| | | | | |
Derivatives | | | | | | | | | | | | | | | | | | | | |
| | | | | |
Interest rate swaps | | | — | | | | 36,872 | | | | — | | | | — | | | | 36,872 | |
| | | | | |
Cross-currency swaps | | | — | | | | 109,386 | | | | — | | | | — | | | | 109,386 | |
| | | | | |
Separate account assets (1) | | | 11,268,706 | | | | 10,772,128 | | | | — | | | | 762,841 | | | | 22,803,674 | |
| | | | | | | | | | | | | | | | | | | | |
Total assets at fair value/NAV | | $ | 11,268,728 | | | $ | 10,976,400 | | | $ | — | | | $ | 1,277,049 | | | $ | 23,522,176 | |
| | | | | | | | | | | | | | | | | | | | |
| | | | | |
Liabilities: | | | | | | | | | | |
| | | | | |
Derivatives | | | | | | | | | | | | | | | | | | | | |
| | | | | |
Interest rate swaps | | $ | — | | | $ | 62,376 | | | $ | — | | | $ | — | | | $ | 62,376 | |
| | | | | |
Foreign currency forwards | | | — | | | | 1,009 | | | | — | | | | — | | | | 1,009 | |
| | | | | |
Separate account liabilities (1) | | | 172 | | | | 874,161 | | | | — | | | | — | | | | 874,336 | |
| | | | | | | | | | | | | | | | | | | | |
| | | | | |
Total liabilities | | $ | 172 | | | $ | 937,546 | | | $ | — | | | $ | — | | | $ | 937,721 | |
| | | | | | | | | | | | | | | | | | | | |
(1) Include only separate account investments which are carried at the fair value of the underlying invested assets or liabilities owned by the separate accounts.
38
EMPOWER ANNUITY INSURANCE COMPANY OF AMERICA
Notes to Statutory Financial Statements
(In Thousands, Except Share Amounts)
The following tables summarize the fair value hierarchy for all financial instruments and invested assets:
| | | | | | | | | | | | | | | | | | | | | | | | | | | | |
| | | |
| | | | | | | Fair Value Measurements at Reporting Date |
| Type of financial instrument | | | | | | December 31, 2023 |
Assets: | | Aggregate
fair value | | Admitted
assets and
liabilities | | (Level 1) | | (Level 2) | | (Level 3) | | Net Asset
Value (NAV) | | Total
(All Levels) |
| | | | | | | |
Bonds | | $ | 24,064,161 | | | $ | 26,591,735 | | | $ | — | | | $ | 24,063,603 | | | $ | 558 | | | $ | — | | | $ | 24,064,161 | |
| | | | | | | |
Preferred stock | | | 76,751 | | | | 82,263 | | | | — | | | | 76,751 | | | | — | | | | — | | | | 76,751 | |
| | | | | | | |
Common stock (1) | | | 577 | | | | 577 | | | | 26 | | | | 551 | | | | — | | | | — | | | | 577 | |
| | | | | | | |
Mortgage loans | | | 5,420,327 | | | | 5,840,441 | | | | — | | | | 5,420,327 | | | | — | | | | — | | | | 5,420,327 | |
| | | | | | | |
Real estate | | | 240,405 | | | | 49,381 | | | | — | | | | — | | | | 240,405 | | | | — | | | | 240,405 | |
| | | | | | | |
Cash, cash equivalents and short-term investments | | | 1,648,896 | | | | 1,648,651 | | | | 1,013,992 | | | | 634,904 | | | | — | | | | — | | | | 1,648,896 | |
| | | | | | | |
Contract loans | | | 3,711,737 | | | | 3,711,737 | | | | — | | | | — | | | | 3,711,737 | | | | — | | | | 3,711,737 | |
| | | | | | | |
Other long-term invested assets | | | 799,197 | | | | 807,798 | | | | — | | | | 79,650 | | | | — | | | | 719,547 | | | | 799,197 | |
| | | | | | | |
Securities lending reinvested collateral assets | | | 317,362 | | | | 317,362 | | | | — | | | | 317,362 | | | | — | | | | — | | | | 317,362 | |
| | | | | | | |
Collateral under derivative counterparty collateral agreements | | | 185,543 | | | | 185,543 | | | | 185,543 | | | | — | | | | — | | | | — | | | | 185,543 | |
| | | | | | | |
Receivable for securities | | | 47,064 | | | | 38,683 | | | | — | | | | 47,064 | | | | — | | | | — | | | | 47,064 | |
| | | | | | | |
Derivative instruments | | | 304,119 | | | | 248,542 | | | | 5 | | | | 304,114 | | | | — | | | | — | | | | 304,119 | |
| | | | | | | |
Separate account assets | | | 23,068,195 | | | | 23,147,893 | | | | 11,510,611 | | | | 10,731,885 | | | | — | | | | 825,699 | | | | 23,068,195 | |
| | | | | | | | | | | | | | | | | | | | | | | | | | | | |
| | | | | | | |
Total assets | | $ | 59,884,334 | | | $ | 62,670,606 | | | $ | 12,710,177 | | | $ | 41,676,211 | | | $ | 3,952,700 | | | $ | 1,545,246 | | | $ | 59,884,334 | |
| | | | | | | | | | | | | | | | | | | | | | | | | | | | |
| | | | | | | |
Liabilities: | | | | | | | | | | | | | | |
| | | | | | | |
Deposit-type contracts | | $ | 8,310,113 | | | $ | 9,585,838 | | | $ | — | | | $ | 8,310,113 | | | $ | — | | | $ | — | | | $ | 8,310,113 | |
| | | | | | | |
Commercial paper | | | 99,718 | | | | 99,718 | | | | — | | | | 99,718 | | | | — | | | | — | | | | 99,718 | |
| | | | | | | |
Payable under securities lending agreements | | | 317,362 | | | | 317,362 | | | | — | | | | 317,362 | | | | — | | | | — | | | | 317,362 | |
| | | | | | | |
Collateral under derivative counterparty collateral agreements | | | 185,526 | | | | 185,526 | | | | 185,526 | | | | — | | | | — | | | | — | | | | 185,526 | |
| | | | | | | |
Payable for securities | | | 21,771 | | | | 21,771 | | | | — | | | | 21,771 | | | | — | | | | — | | | | 21,771 | |
| | | | | | | |
Derivative instruments | | | 14,908 | | | | 19,053 | | | | — | | | | 14,908 | | | | — | | | | — | | | | 14,908 | |
| | | | | | | |
Separate account liabilities | | | 997,996 | | | | 997,996 | | | | 47,658 | | | | 950,338 | | | | — | | | | — | | | | 997,996 | |
| | | | | | | | | | | | | | | | | | | | | | | | | | | | |
| | | | | | | |
Total liabilities: | | $ | 9,947,394 | | | $ | 11,227,264 | | | $ | 233,184 | | | $ | 9,714,210 | | | $ | — | | | $ | — | | | $ | 9,947,394 | |
| | | | | | | | | | | | | | | | | | | | | | | | | | | | |
(1) Per NAIC guidelines, investments accounted for under the equity method are excluded.
39
EMPOWER ANNUITY INSURANCE COMPANY OF AMERICA
Notes to Statutory Financial Statements
(In Thousands, Except Share Amounts)
| | | | | | | | | | | | | | | | | | | | | | | | | | | | |
| | | |
| | | | | | | Fair Value Measurements at Reporting Date |
| Type of financial instrument | | | | | | December 31, 2022 |
Assets: | | Aggregate
fair value | | Admitted
assets and
liabilities | | (Level 1) | | (Level 2) | | (Level 3) | | Net Asset
Value (NAV) | | Total
(All Levels) |
| | | | | | | |
Bonds | | $ | 26,201,923 | | | $ | 29,868,677 | | | $ | — | | | $ | 26,200,270 | | | $ | 1,653 | | | $ | — | | | $ | 26,201,923 | |
| | | | | | | |
Preferred Stock | | | 75,614 | | | | 82,247 | | | | — | | | | 75,614 | | | | — | | | | — | | | | 75,614 | |
| | | | | | | |
Common Stock (1) | | | 531 | | | | 531 | | | | 22 | | | | 509 | | | | — | | | | — | | | | 531 | |
| | | | | | | |
Mortgage loans | | | 5,557,512 | | | | 6,132,049 | | | | — | | | | 5,557,512 | | | | — | | | | — | | | | 5,557,512 | |
| | | | | | | |
Real estate | | | 246,852 | | | | 55,057 | | | | — | | | | — | | | | 246,852 | | | | — | | | | 246,852 | |
| | | | | | | |
Cash, cash equivalents and short-term investments | | | 375,014 | | | | 375,173 | | | | 325,986 | | | | 49,028 | | | | — | | | | — | | | | 375,014 | |
| | | | | | | |
Contract loans | | | 3,805,700 | | | | 3,805,700 | | | | — | | | | — | | | | 3,805,700 | | | | — | | | | 3,805,700 | |
| | | | | | | |
Other long-term invested assets | | | 616,325 | | | | 626,227 | | | | — | | | | 102,117 | | | | — | | | | 514,208 | | | | 616,325 | |
| | | | | | | |
Securities lending reinvested collateral assets | | | 107,068 | | | | 107,068 | | | | 7,312 | | | | 99,756 | | | | — | | | | — | | | | 107,068 | |
| | | | | | | |
Collateral under derivative counterparty collateral agreements | | | 534,828 | | | | 534,828 | | | | 534,828 | | | | — | | | | — | | | | — | | | | 534,828 | |
| | | | | | | |
Receivable for securities | | | 51,601 | | | | 35,680 | | | | — | | | | 51,601 | | | | — | | | | — | | | | 51,601 | |
| | | | | | | |
Derivative instruments | | | 539,602 | | | | 426,767 | | | | 242 | | | | 539,360 | | | | — | | | | — | | | | 539,602 | |
| | | | | | | |
Separate account assets | | | 22,803,674 | | | | 22,913,246 | | | | 11,268,707 | | | | 10,772,127 | | | | — | | | | 762,840 | | | | 22,803,674 | |
| | | | | | | | | | | | | | | | | | | | | | | | | | | | |
| | | | | | | |
Total assets | | $ | 60,916,244 | | | $ | 64,963,250 | | | $ | 12,137,097 | | | $ | 43,447,894 | | | $ | 4,054,205 | | | $ | 1,277,048 | | | $ | 60,916,244 | |
| | | | | | | | | | | | | | | | | | | | | | | | | | | | |
| | | | | | | |
Liabilities: | | | | | | | | | | | | | | |
| | | | | | | |
Deposit-type contracts | | $ | 6,328,975 | | | $ | 8,051,601 | | | $ | — | | | $ | 6,328,975 | | | $ | — | | | $ | — | | | $ | 6,328,975 | |
| | | | | | | |
Commercial paper | | | 99,760 | | | | 99,760 | | | | — | | | | 99,760 | | | | — | | | | — | | | | 99,760 | |
| | | | | | | |
Payable under securities lending agreements | | | 107,068 | | | | 107,068 | | | | 7,312 | | | | 99,756 | | | | — | | | | — | | | | 107,068 | |
| | | | | | | |
Collateral under derivative counterparty collateral agreements | | | 504,590 | | | | 504,590 | | | | 504,590 | | | | — | | | | — | | | | — | | | | 504,590 | |
| | | | | | | |
Payable for securities | | | 22,284 | | | | 22,284 | | | | — | | | | 22,284 | | | | — | | | | — | | | | 22,284 | |
| | | | | | | |
Derivative instruments | | | 63,545 | | | | 64,054 | | | | 14 | | | | 63,531 | | | | — | | | | — | | | | 63,545 | |
| | | | | | | |
Separate account liabilities | | | 874,336 | | | | 874,336 | | | | 172 | | | | 874,164 | | | | — | | | | — | | | | 874,336 | |
| | | | | | | | | | | | | | | | | | | | | | | | | | | | |
| | | | | | | |
Total liabilities | | $ | 8,000,558 | | | $ | 9,723,693 | | | $ | 512,088 | | | $ | 7,488,470 | | | $ | — | | | $ | — | | | $ | 8,000,558 | |
| | | | | | | | | | | | | | | | | | | | | | | | | | | | |
(1) Per NAIC guidelines, investments accounted for under the equity method are excluded.
Bonds, preferred and common stock
The fair values for bonds, preferred and common stock are generally based upon evaluated prices from independent pricing services. In cases where these prices are not readily available, fair values are estimated by the Company. To determine estimated fair value for these instruments, the Company generally utilizes discounted cash flow models with market observable pricing inputs such as spreads, average life, and credit quality. Fair value estimates are made at a specific point in time, based on available market information and judgments about financial instruments, including estimates of the timing and amounts of expected future cash flows and the credit standing of the issuer or counterparty.
Mortgage loans
Mortgage loan fair value estimates are generally based on discounted cash flows. A discount rate matrix is used where the discount rate valuing a specific mortgage generally corresponds to that mortgage’s remaining term and credit quality. Management believes the discount rate used is comparable to the credit, interest rate, term, servicing costs, and risks of loans similar to the portfolio loans that the Company would make today given its internal pricing strategy.
Real estate
The estimated fair value for real estate is based on the unadjusted appraised value which includes factors such as comparable property sales, property income analysis, and capitalization rates.
40
EMPOWER ANNUITY INSURANCE COMPANY OF AMERICA
Notes to Statutory Financial Statements
(In Thousands, Except Share Amounts)
Cash, cash equivalents, short-term investments, collateral receivable and payable under securities lending agreements, receivable and payable for securities, and commercial paper
The amortized cost of cash, cash equivalents, short-term investments, collateral receivable and payable under securities lending agreements, receivable and payable for securities, and commercial paper is a reasonable estimate of fair value due to their short-term nature and the high credit quality of the issuers, counterparties and obligor. Cash equivalent investments also include money market funds that are valued using unadjusted quoted prices in active markets.
Contract loans
Contract loans are funds provided to contract holders in return for a claim on the contract. The funds provided are limited to the cash surrender value of the underlying contract. The nature of contract loans is to have a negligible default risk as the loans are fully collateralized by the value of the contract. Contract loans do not have a stated maturity and the balances and accrued interest are repaid either by the contract holder or with proceeds from the contract.
Other long-term invested assets
The fair values of other long-term invested assets are based on the specific asset type. Other invested assets that are held as bonds, such as surplus notes, are primarily valued the same as bonds. The fair values for residual tranches are generally based upon evaluated prices from independent pricing services.
Limited partnership interests represent the Company’s minority ownership interests in pooled investment funds. These funds employ varying investment strategies that primarily make private equity investments across diverse industries and geographical focuses. The net asset value, determined using the partnership financial statement reported capital account adjusted for other relevant information, which may impact the exit value of the investments, is used as a practical expedient to estimate fair value. Distributions by these investments are generated from investment gains, from operating income generated by the underlying investments of the funds and from liquidation of the underlying assets of the funds, of which the timing is unknown. In the absence of permitted sales of its ownership interest, the Company will be redeemed out of the partnership interests through distributions.
Collateral under derivative counterparty collateral agreements
Included in other assets is cash collateral received from or pledged to counterparties and included in other liabilities is the obligation to return the cash collateral to the counterparties. The carrying value of the collateral is a reasonable estimate of fair value.
Derivative instruments
The estimated fair values of OTC derivatives, primarily consisting of cross-currency swaps, foreign currency forwards, interest rate swaps, interest rate swaptions, U.S. government treasury futures contracts, Eurodollar futures contracts, futures on equity indices, and interest rate swap futures are the estimated amount the Company would receive or pay to terminate the agreements at the end of each reporting period, taking into consideration current interest rates and other relevant factors.
Separate account assets and liabilities
Separate account assets and liabilities primarily include investments in mutual funds, unregistered funds, most of which are not subject to redemption restrictions, bonds, and short-term securities. Mutual funds and unregistered funds are recorded at net asset value, which approximates fair value, on a daily basis. The bond and short-term investments are valued in the same manner, and using the same pricing sources and inputs as the bond and short-term investments of the Company.
Deposit-type contracts
Fair values for liabilities under deposit-type insurance contracts are estimated using discounted liability calculations, adjusted to approximate the effect of current market interest rates for the assets supporting the liabilities.
41
EMPOWER ANNUITY INSURANCE COMPANY OF AMERICA
Notes to Statutory Financial Statements
(In Thousands, Except Share Amounts)
6. Non-Admitted Assets
The following table summarizes the Company’s non-admitted assets:
| | | | | | | | | | | | | | | | | | | | | | | | |
| | | December 31, 2023 | | | December 31, 2022 | |
Type | | Asset | | | Non-admitted
asset | | | Admitted
asset | | | Asset | | | Non-admitted
asset | | | Admitted
asset | |
| | | | | | |
Other invested assets | | $ | 1,700,076 | | | $ | 461,232 | | | $ | 1,238,844 | | | $ | 1,718,980 | | | $ | 641,282 | | | $ | 1,077,698 | |
| | | | | | |
Common stocks | | | 1,848,986 | | | | 182,167 | | | | 1,666,819 | | | | 2,439,929 | | | | 328,345 | | | | 2,111,584 | |
| | | | | | |
Deferred income taxes | | | 425,592 | | | | 273,412 | | | | 152,180 | | | | 419,535 | | | | 317,543 | | | | 101,992 | |
| | | | | | |
Due from parent, subsidiaries and affiliate | | | 497,032 | | | | 73,242 | | | | 423,790 | | | | 305,180 | | | | 70,442 | | | | 234,738 | |
| | | | | | |
Other assets | | | 760,187 | | | | 9,588 | | | | 750,599 | | | | 1,311,031 | | | | 17,045 | | | | 1,293,986 | |
| | | | | | |
Furniture, fixtures and equipment | | | 15,074 | | | | 15,074 | | | | — | | | | 9,863 | | | | 9,863 | | | | — | |
| | | | | | |
Reinsurance recoverable | | | 350,732 | | | | 79 | | | | 350,653 | | | | 261,045 | | | | 1,931 | | | | 259,114 | |
| | | | | | |
Other prepaid assets | | | 3,651 | | | | 3,651 | | | | — | | | | 3,063 | | | | 3,063 | | | | — | |
| | | | | | |
Premiums deferred and uncollected | | | 11,928 | | | | 161 | | | | 11,767 | | | | 13,905 | | | | 438 | | | | 13,467 | |
| | | | | | |
Cash, cash equivalents and short-term investments | | | 1,648,652 | | | | 1 | | | | 1,648,651 | | | | 375,173 | | | | — | | | | 375,173 | |
The following table summarizes the Company’s aggregate Statement of Admitted Assets, Liabilities, Capital and Surplus values of all subsidiary, controlled and affiliated entities (“SCA”), except insurance SCA entities as follows:
| | | | | | | | | | | | | | | | | | | | | | | | |
| | | December 31, 2023 | | | December 31, 2022 | |
Type | | Asset | | | Non-admitted
asset | | | Admitted
asset | | | Asset | | | Non-admitted
asset | | | Admitted
asset | |
| | | | | | |
Common stock | | $ | 14,114 | | | $ | — | | | $ | 14,114 | | | $ | 42,993 | | | $ | 2,748 | | | $ | 40,245 | |
| | | | | | |
Other invested assets | | | 605,055 | | | | 461,232 | | | | 143,823 | | | | 630,309 | | | | 641,282 | | | | (10,973 | ) |
7. Business Combination and Goodwill
Goodwill that arises as a result of the acquisition of subsidiary limited liability companies is included in other invested assets in the accompanying Statutory Statement of Admitted Assets, Liabilities and Capital.
On August 29, 2014, the Company completed the acquisition of all of the voting equity interests in the Empower Plan Services, (“EPS”), large-market recordkeeping business. This transaction was accounted for as a statutory purchase. Goodwill of $51,098 was recorded in other invested assets, which is being amortized over 10 years. At December 31, 2023 and 2022, the Company has $0 and $0, respectively, of admitted goodwill related to this acquisition. During each of the years ended December 31, 2023, 2022 and 2021, the Company recorded $5,110, $5,110 and $5,110, respectively, of goodwill amortization related to this acquisition.
On August 17, 2020, the Company completed the acquisition of all of the voting equity interests in EPW, an industry-leading registered investment adviser and digital wealth manager. This transaction was accounted for as a statutory acquisition. Goodwill of $819,403 was recorded in other invested assets, which is being amortized over 10 years. On April 1, 2023, Personal Capital Advisors Corporation, a subsidiary of EPW, merged with Empower Advisory Group, another wholly-owned subsidiary of the Company. In conjunction with that merger, the Company reduced goodwill by $102 million through a charge to surplus. At December 31, 2023 and 2022, the Company has $0 and $0, respectively, of admitted goodwill related to this acquisition. During each of the years ended December 31, 2023, 2022 and 2021, the Company recorded $71,100, $81,940 and $81,940, respectively, of goodwill amortization related to this acquisition.
On April 1, 2022, the Company completed the acquisition of all of the voting equity interests in Empower Annuity Insurance Company, (“EAIC”) as part of the acquisition of Prudential’s full service retirement business. This transaction was accounted for as a statutory acquisition. Goodwill of $645,941 was recorded in other invested assets, which will be amortized over ten
42
EMPOWER ANNUITY INSURANCE COMPANY OF AMERICA
Notes to Statutory Financial Statements
(In Thousands, Except Share Amounts)
years. At December 31, 2023 and 2022, the Company has $351,735 and $276,897, respectively, of admitted goodwill related to this acquisition. Goodwill amortization of $64,594 and $48,446, respectively, was recorded for the periods ended December 31, 2023 and 2022.
| | | | | | | | | | | | | | | | | | | | | | | | |
| | | | | | |
| Purchased entity | | Acquisition date | | | Cost of acquired entity | | | Original amount of admitted goodwill | | | Admitted goodwill as of December 31, 2023 | | | Amount of goodwill amortized for the year ended December 31, 2023 | | | Admitted goodwill as a % of SCA book/adjusted carrying value, gross of admitted goodwill | |
| | | | | | |
Empower Plan Services | | | August 29, 2014 | | | $ | 64,169 | | | $ | 51,098 | | | $ | — | | | $ | 5,110 | | | | — | % |
Empower Personal Wealth | | | August 17, 2020 | | | | 854,190 | | | | 819,403 | | | | — | | | | 71,100 | | | | — | % |
Empower Annuity Insurance Company | | | April 1, 2022 | | | | 1,930,036 | | | | 645,941 | | | | 351,735 | | | | 64,594 | | | | 27 | % |
8. Reinsurance
In the normal course of its business, the Company seeks to limit its exposure to loss on any single insured and to recover a portion of benefits paid by ceding risks to other insurance enterprises under excess coverage and coinsurance contracts.
Ceded reinsurance contracts do not relieve the Company from its obligations to policyholders. The failure of reinsurers to honor their obligations could result in losses to the Company. The Company evaluates the financial condition of its reinsurers and monitors concentrations of credit risk arising from similar geographic regions, activities or economic characteristics of the reinsurers to minimize its exposure to significant losses from reinsurer insolvencies.
The Company assumes risk from approximately 35 insurers and reinsurers by participating in yearly renewable term and coinsurance pool agreements. The Company no longer solicits new assumed reinsurance.
The Company did not have any write-offs for uncollectible reinsurance receivables during the years ended December 31, 2023, 2022 and 2021 for losses incurred, loss adjustment expenses incurred or premiums earned.
The Company does not have any uncollectible reinsurance, commutation of ceded reinsurance, or certified reinsurer downgraded of status subject to revocation.
On April 1, 2022 the Company completed the acquisition, via indemnity reinsurance, of the retirement services business of PICA. The PICA transaction impacted the following financial statement lines, excluding the non-admitted deferred tax asset:
| | | | |
| | | (In millions) | |
| |
| Statutory Statements of Admitted Assets, Liabilities, Capital and Surplus | | April 1, | |
| | | 2022 | |
| |
Admitted assets: | | | | |
| |
Cash and invested assets: | | | | |
| |
Bonds | | $ | 4,158 | |
| |
Mortgage loans | | | 1,150 | |
| |
Cash, cash equivalents, and short-term investments | | | 60 | |
| | | | |
Total cash and invested assets | | | 5,368 | |
| | | | |
| |
Investment income due and accrued | | | 32 | |
| |
Reinsurance receivables | | | 45 | |
| |
Other assets | | | 7 | |
| |
| | | | |
| |
Total admitted assets | | $ | 5,452 | |
| | | | |
43
EMPOWER ANNUITY INSURANCE COMPANY OF AMERICA
Notes to Statutory Financial Statements
(In Thousands, Except Share Amounts)
| | | | |
| | | (In millions) | |
| |
| | | April 1, | |
| | | 2022 | |
| |
Liabilities, capital and surplus: | | | | |
| |
Liabilities: | | | | |
| |
Aggregate reserves for life policies and contracts | | $ | 5,762 | |
| |
Interest maintenance reserve | | | (103 | ) |
| |
Other liabilities | | | (18 | ) |
| | | | |
| |
Total liabilities | | | 5,641 | |
| | | | |
| |
Capital and surplus: | | | | |
| |
Unassigned deficit | | | (189 | ) |
| | | | |
Total capital and surplus | | | (189 | ) |
| | | | |
| |
Total liabilities, capital and surplus | | $ | 5,452 | |
| | | | |
| |
| | | (In millions) | |
| |
| Statutory Statements of Operations | | April 1, | |
| | | 2022 | |
| | | | |
Income: | | | | |
| |
Premium income and annuity consideration | | $ | 5,694 | |
| | | | |
| |
Total income | | | 5,694 | |
| | | | |
| |
Expenses: | | | | |
| |
Increase in aggregate reserves for life and accident and health policies and contracts | | | 5,762 | |
| | | | |
| |
Total benefits | | | 5,762 | |
| | | | |
| |
Commissions and expense allowances on reinsurance assumed | | | 224 | |
| |
Interest maintenance reserve reinsurance activity | | | (103 | ) |
| | | | |
| |
Total benefit and expenses | | | 5,883 | |
| | | | |
| |
Net loss from operations before federal income taxes | | $ | (189) | |
The Prudential transaction also included $1,362.6 million of separate account assets acquired under modified coinsurance. While PICA holds the respective asset and liability under the modified coinsurance agreement, the economics are assumed by the Company, as discussed in Note 11.
In August 2021, the Company was funded with $1,193.0 million of limited recourse capital notes and in March 2022, the Company additionally received $810.0 million of capital contributions from EHI to finance the Prudential transaction. In consideration for the capital contribution, the Company issued $2.6 million of common stock, and recorded the remainder as gross paid in and contributed surplus, as discussed in Note 12.
The Company and an affiliate have engaged in a modified coinsurance (“ModCo”) reinsurance agreement since 2018. The affiliate, Canada Life International Reinsurance Corporation Limited (“CLIRC”), novated the contract to Canada Life International Reinsurance (Barbados) Corporation (“CLIRBC”) and upon transfer, on December 31, 2020, increased the ceding percentage for this block of group annuity insurance policies from 40% to 90%. The Company and CLIRBC amended this agreement on December 31, 2022, which increased the ceding percentage for this block of group annuity insurance policies from 90% to 100%, increased the expense allowance rate, and increased the risk charge rate. The Company has ceded ModCo
44
EMPOWER ANNUITY INSURANCE COMPANY OF AMERICA
Notes to Statutory Financial Statements
(In Thousands, Except Share Amounts)
reserves of $11,061,700 and $12,232,487 as of December 31, 2023 and 2022, respectively. The reinsurance agreement is unlimited in duration. However, the Company may recapture the ceded reinsurance policies at any time by sending notice to the reinsurer at least 90 days prior to the intended termination date.
The Company and an affiliate have engaged in a ModCo reinsurance agreement since 2011. The affiliate, CLIRC, novated the contract to CLIRBC on December 31, 2020. Per the terms of the agreement, the Company cedes 90% of its closed in-force block of participating life insurance policies. The Company had ceded modified coinsurance reserves of $5,865,988 as of December 31, 2021. On July 1, 2022, the Company terminated its reinsurance agreement with CLIRBC. As a result of that termination, the Company recaptured $5,835,855 of ceded premium income and annuity consideration and reserve adjustment on reinsurance ceded.
The Company and Hannover have engaged in a coinsurance with funds withheld and yearly renewable term transactions on December 31, 2022 in which the Company cedes a portion of its closed in-force block of participating whole life insurance policies and established a funds withheld payable to Hannover. The Company received a ceding commission, will receive expense allowances and is eligible for experience refunds, and will pay risk charges over time. The Company has ceded reserves of $2,942,846 and $3,021,172 as of December 31, 2023 and 2022, respectively. The reinsurance agreement has an automatic experience refund termination date of January 1, 2035. The Company may recapture the ceded reinsurance policies at any time prior to the experience refund termination date, subject to certain fees payable to Hannover. The ceding commission is accounted for in the ‘Commissions and expense allowances on reinsurance ceded’ within the Statement of Operations.
9. Aggregate Reserves
Aggregate reserves are computed in accordance with the Commissioner’s Annuity Reserve Valuation Method (“CARVM”) and the Commissioner’s Reserve Valuation Method (“CRVM”), the standard statutory reserving methodologies.
The significant assumptions used to determine the liability for future life insurance benefits are as follows:
| | | | |
| | |
Interest | | - Life Insurance | | 2.25% to 6.00% |
| | |
| | - Annuity Funds | | 1% to 11.25% |
| | |
| | - Disability | | 2.50% to 6.00% |
| | |
Mortality | | - Life Insurance | | Various valuation tables, primarily including 1941, 1958, 1980, 2001, and 2017 Commissioners Standard Ordinary (“CSO”) tables, and American Experience |
| | |
| | - Annuity Funds | | Various annuity valuation tables, primarily including the GA 1971 and 83a Individual Annuitant Mortality (“IAM”), Group Annuity Reserve (“GAR”) 94, 1951, 1971 and 1983 Group Annuity Mortality (“GAM”), Annuity 2000, Group Annuity Reserving table (“1994-GAR”), and 2012 Individual Annuity Reserving table (“2012 IAR”). |
| | |
Morbidity | | - Disability | | 1970 Intercompany DISA Group Disability Tables |
The Company waives deduction of deferred fractional premiums upon the death of the insured. When surrender values exceed aggregate reserves, excess cash value reserves are held.
Policies issued at premium corresponding to ages higher than the true ages are valued at the rated-up ages. Policies providing for payment at death during certain periods of an amount less than the full amount of insurance, being policies subject to liens, are valued as if the full amount is payable without any deduction.
For policies issued with, or subsequently subject to, an extra premium payable annually, an extra reserve is held. The extra premium reserve is the unearned gross extra premium payable during the year if the policies are rated for reasons other than medical impairments. For medical impairments, the extra premium reserve is calculated as the excess of the reserve based on rated mortality over that based on standard mortality. All substandard annuities are valued at their true ages.
At December 31, 2023 and 2022, the Company had $3,541,716 and $2,467,921, respectively of insurance in force for which the gross premiums are less than the net premiums according to the standard valuation set by the Division.
Tabular interest, tabular interest on funds not involving life contingencies and tabular cost have been determined from the basic data for the calculation of aggregate reserves. Tabular less actual reserves released has been determined from basic data for the calculation of aggregate reserves and the actual reserves released.
45
EMPOWER ANNUITY INSURANCE COMPANY OF AMERICA
Notes to Statutory Financial Statements
(In Thousands, Except Share Amounts)
The withdrawal characteristics of annuity reserves and deposit liabilities are as follows:
| | | | | | | | | | | | | | | | | | | | |
| | | December 31, 2023 |
| | | General
Account | | Separate
Account with
Guarantees | | Separate
Account Non-
Guaranteed | | Total | | Percent of
Total Gross |
| | | | | | | | | | | | | | | | |
| | | | | |
Subject to discretionary withdrawal: | | | | | | | | | | | | | | | | | | | | |
| | | | | |
With market value adjustment | | $ | — | | | $ | — | | | $ | — | | | $ | — | | | | — | % |
| | | | | |
At book value less current surrender charges of 5% or more | | | — | | | | — | | | | — | | | | — | | | | — | % |
| | | | | |
At fair value | | | — | | | | 131,751 | | | | 3,221,331 | | | | 3,353,082 | | | | 98.6 | % |
| | | | | | | | | | | | | | | | |
| | | | | |
Total with adjustment or at market value | | | — | | | | 131,751 | | | | 3,221,331 | | | | 3,353,082 | | | | 98.6 | % |
| | | | | |
At book value without adjustment (minimal or no charge adjustment) | | | 29,108 | | | | — | | | | — | | | | 29,108 | | | | 0.9 | % |
| | | | | |
Not subject to discretionary withdrawal | | | 18,697 | | | | — | | | | — | | | | 18,697 | | | | 0.5 | % |
| | | | | | | | | | | | | | | | | | | | |
| | | | | |
Total gross | | | 47,805 | | | | 131,751 | | | | 3,221,331 | | | | 3,400,887 | | | | 100.0 | % |
| | | | | | | | | | | | | | | | | | | | |
| | | | | |
Reinsurance ceded | | | 47,379 | | | | — | | | | — | | | | 47,379 | | | | | |
| | | | | | | | | | | | | | | | | | | | |
| | | | | |
Total, net | | $ | 426 | | | $ | 131,751 | | | $ | 3,221,331 | | | $ | 3,353,508 | | | | | |
| | | | | | | | | | | | | | | | | | | | |
| | | | | | | | | | | | | | | | | | | | |
| | | December 31, 2022 |
| | | General
Account | | Separate
Account with
Guarantees | | Separate
Account Non-
Guaranteed | | Total | | Percent of
Total Gross |
| | | | | | | | | | | | | | | | |
| | | | | |
Subject to discretionary withdrawal: | | | | | | | | | | | | | | | | | | | | |
| | | | | |
With market value adjustment | | $ | — | | | $ | — | | | $ | — | | | $ | — | | | | — | % |
| | | | | |
At book value less current surrender charges of 5% or more | | | — | | | | — | | | | — | | | | — | | | | — | % |
| | | | | |
At fair value | | | — | | | | 128,603 | | | | 3,192,772 | | | | 3,321,375 | | | | 98.3 | % |
| | | | | | | | | | | | | | | | |
| | | | | |
Total with adjustment or at market value | | | — | | | | 128,603 | | | | 3,192,772 | | | | 3,321,375 | | | | 98.3 | % |
| | | | | |
At book value without adjustment (minimal or no charge adjustment) | | | 30,392 | | | | — | | | | — | | | | 30,392 | | | | 0.9 | % |
| | | | | |
Not subject to discretionary withdrawal | | | 26,056 | | | | — | | | | — | | | | 26,056 | | | | 0.8 | % |
| | | | | | | | | | | | | | | | | | | | |
| | | | | |
Total gross | | | 56,448 | | | | 128,603 | | | | 3,192,772 | | | | 3,377,823 | | | | 100.0 | % |
| | | | | | | | | | | | | | | | | | | | |
| | | | | |
Reinsurance ceded | | | 55,994 | | | | — | | | | — | | | | 55,994 | | | | | |
| | | | | | | | | | | | | | | | | | | | |
| | | | | |
Total, net | | $ | 454 | | | $ | 128,603 | | | $ | 3,192,772 | | | $ | 3,321,829 | | | | | |
| | | | | | | | | | | | | | | | | | | | |
46
EMPOWER ANNUITY INSURANCE COMPANY OF AMERICA
Notes to Statutory Financial Statements
(In Thousands, Except Share Amounts)
2. Group Annuities
| | | | | | | | | | | | | | | | | | | | |
| | | December 31, 2023 | |
| | | General Account | | | Separate
Account with
Guarantees | | | Separate
Account Non-
Guaranteed | | | Total | | | Percent of
Total Gross | |
| | | | | | | | | | | | | | | | |
| | | | | |
Subject to discretionary withdrawal: | | | | | | | | | | | | | | | | | | | | |
| | | | | |
With market value adjustment | | $ | 25,191,286 | | | $ | — | | | $ | — | | | $ | 25,191,286 | | | | 64.5% | |
| | | | | |
At book value less current surrender charges of 5% or more | | | — | | | | — | | | | — | | | | — | | | | —% | |
| | | | | |
At fair value | | | — | | | | 6,220,950 | | | | 5,243,087 | | | | 11,464,037 | | | | 29.3% | |
| | | | | | | | | | | | | | | | | | | | |
| | | | | |
Total with adjustment or at market value | | | 25,191,286 | | | | 6,220,950 | | | | 5,243,087 | | | | 36,655,323 | | | | 93.8% | |
| | | | | |
At book value without adjustment (minimal or no charge adjustment) | | | 1,880,373 | | | | — | | | | — | | | | 1,880,373 | | | | 4.8% | |
| | | | | |
Not subject to discretionary withdrawal | | | 542,867 | | | | — | | | | — | | | | 542,867 | | | | 1.4% | |
| | | | | | | | | | | | | | | | | | | | |
| | | | | |
Total gross | | | 27,614,526 | | | | 6,220,950 | | | | 5,243,087 | | | | 39,078,563 | | | | 100.0% | |
| | | | | | | | | | | | | | | | | | | | |
| | | | | |
Reinsurance ceded | | | 1,123 | | | | — | | | | — | | | | 1,123 | | | | | |
| | | | | | | | | | | | | | | | | | | | |
| | | | | |
Total, net | | $ | 27,613,403 | | | $ | 6,220,950 | | | $ | 5,243,087 | | | $ | 39,077,440 | | | | | |
| | | | | | | | | | | | | | | | | | | | |
| |
| | | December 31, 2022 | |
| | | General Account | | | Separate
Account with
Guarantees | | | Separate
Account Non-
Guaranteed | | | Total | | | Percent of
Total Gross | |
| | | | | | | | | | | | | | | | |
| | | | | |
Subject to discretionary withdrawal: | | | | | | | | | | | | | | | | | | | | |
| | | | | |
With market value adjustment | | $ | 28,019,274 | | | $ | — | | | $ | — | | | $ | 28,019,274 | | | | 62.6% | |
| | | | | |
At book value less current surrender charges of 5% or more | | | 205 | | | | — | | | | — | | | | 205 | | | | —% | |
| | | | | |
At fair value | | | — | | | | 6,557,028 | | | | 5,287,580 | | | | 11,844,608 | | | | 26.4% | |
| | | | | | | | | | | | | | | | | | | | |
| | | | | |
Total with adjustment or at market value | | | 28,019,479 | | | | 6,557,028 | | | | 5,287,580 | | | | 39,864,087 | | | | 89.0% | |
| | | | | |
At book value without adjustment (minimal or no charge adjustment) | | | 4,344,917 | | | | — | | | | — | | | | 4,344,917 | | | | 9.7% | |
| | | | | |
Not subject to discretionary withdrawal | | | 578,424 | | | | — | | | | — | | | | 578,424 | | | | 1.3% | |
| | | | | | | | | | | | | | | | | | | | |
| | | | | |
Total gross | | | 32,942,820 | | | | 6,557,028 | | | | 5,287,580 | | | | 44,787,428 | | | | 100.0% | |
| | | | | | | | | | | | | | | | | | | | |
| | | | | |
Reinsurance ceded | | | 970 | | | | — | | | | — | | | | 970 | | | | | |
| | | | | | | | | | | | | | | | | | | | |
| | | | | |
Total, net | | $ | 32,941,850 | | | $ | 6,557,028 | | | $ | 5,287,580 | | | $ | 44,786,458 | | | | | |
| | | | | | | | | | | | | | | | | | | | |
47
EMPOWER ANNUITY INSURANCE COMPANY OF AMERICA
Notes to Statutory Financial Statements
(In Thousands, Except Share Amounts)
3. Deposit-type Contracts
| | | | | | | | | | | | | | | | | | | | |
| | | December 31, 2023 |
| | | General
Account | | Separate
Account with
Guarantees | | Separate
Account Non-
Guaranteed | | Total | | Percent of
Total Gross |
| | | | | | | | | | | | | | | | |
| | | | | |
Subject to discretionary withdrawal: | | | | | | | | | | | | | | | | | | | | |
| | | | | |
With market value adjustment | | $ | 9,375,307 | | | $ | — | | | $ | — | | | $ | 9,375,307 | | | | 97.7 | % |
| | | | | |
At book value less current surrender charges of 5% or more | | | — | | | | — | | | | — | | | | — | | | | — | % |
| | | | | |
At fair value | | | — | | | | — | | | | — | | | | — | | | | — | % |
| | | | | | | | | | | | | | | | |
| | | | | |
Total with adjustment or at market value | | | 9,375,307 | | | | — | | | | — | | | | 9,375,307 | | | | 97.7 | % |
| | | | | |
At book value without adjustment (minimal or no charge adjustment) | | | 169,243 | | | | — | | | | — | | | | 169,243 | | | | 1.8 | % |
| | | | | |
Not subject to discretionary withdrawal | | | 48,612 | | | | — | | | | — | | | | 48,612 | | | | 0.5 | % |
| | | | | | | | | | | | | | | | |
| | | | | |
Total gross | | | 9,593,162 | | | | — | | | | — | | | | 9,593,162 | | | | 100.0 | % |
| | | | | | | | | | | | | | | | | | | | |
| | | | | |
Reinsurance ceded | | | 7,324 | | | | — | | | | — | | | | 7,324 | | | | | |
| | | | | | | | | | | | | | | | | | | | |
| | | | | |
Total, net | | $ | 9,585,838 | | | $ | — | | | $ | — | | | $ | 9,585,838 | | | | | |
| | | | | | | | | | | | | | | | | | | | |
| | | | | | | | | | | | | | | | | | | | |
| | | December 31, 2022 |
| | | General
Account | | Separate
Account with
Guarantees | | Separate
Account Non-
Guaranteed | | Total | | Percent of
Total Gross |
| | | | | | | | | | | | | | | | |
| | | | | |
Subject to discretionary withdrawal: | | | | | | | | | | | | | | | | | | | | |
| | | | | |
With market value adjustment | | $ | 7,718,720 | | | $ | — | | | $ | — | | | $ | 7,718,720 | | | | 95.7 | % |
| | | | | |
At book value less current surrender charges of 5% or more | | | — | | | | — | | | | — | | | | — | | | | — | % |
| | | | | |
At fair value | | | — | | | | — | | | | — | | | | — | | | | — | % |
| | | | | | | | | | | | | | | | |
| | | | | |
Total with adjustment or at market value | | | 7,718,720 | | | | — | | | | — | | | | 7,718,720 | | | | 95.7 | % |
| | | | | |
At book value without adjustment (minimal or no charge adjustment) | | | 293,831 | | | | — | | | | — | | | | 293,831 | | | | 3.6 | % |
| | | | | |
Not subject to discretionary withdrawal | | | 48,949 | | | | — | | | | — | | | | 48,949 | | | | 0.7 | % |
| | | | | | | | | | | | | | | | |
| | | | | |
Total gross | | | 8,061,500 | | | | — | | | | — | | | | 8,061,500 | | | | 100.0 | % |
| | | | | | | | | | | | | | | | | | | | |
| | | | | |
Reinsurance ceded | | | 9,899 | | | | — | | | | — | | | | 9,899 | | | | | |
| | | | | | | | | | | | | | | | | | | | |
| | | | | |
Total, net | | $ | 8,051,601 | | | $ | — | | | $ | — | | | $ | 8,051,601 | | | | | |
| | | | | | | | | | | | | | | | | | | | |
Annuity actuarial reserves, deposit-type contract funds and other liabilities without life or disability contingencies at December 31, were as follows:
| | | | | | | | |
| | | 2023 | | 2022 |
General Account: | | | | | | | | |
Annuities | | $ | 27,613,166 | | | $ | 32,941,611 | |
Miscellaneous reserves | | | 663 | | | | 693 | |
Deposit-type contracts | | | 9,585,838 | | | | 8,051,601 | |
| | | | | | | | |
Subtotal | | | 37,199,667 | | | | 40,993,905 | |
Separate Account: | | | | | | | | |
Annuities (excluding supplementary contracts) | | | 14,817,119 | | | | 15,165,983 | |
| | | | | | | | |
Total | | $ | 52,016,786 | | | $ | 56,159,888 | |
| | | | | | | | |
48
EMPOWER ANNUITY INSURANCE COMPANY OF AMERICA
Notes to Statutory Financial Statements
(In Thousands, Except Share Amounts)
The withdrawal characteristics of life reserves are as follows:
| | | | | | | | | | | | | | | | | | | | | | | | |
| |
| | | December 31, 2023 | |
| | | General Account | | | Separate Account - Guaranteed | |
| | | | | | | | |
Subject to discretionary withdrawal, surrender values, or
policy loans: | | Account
Value | | | Cash Value | | | Reserve | | | Account
Value | | | Cash
Value | | | Reserve | |
| | | | | | | | | | | | | | | | | | | | | | | | |
| | | | | | |
Universal life | | $ | 6,253,598 | | | $ | 6,687,875 | | | $ | 6,722,372 | | | $ | 1,056,016 | | | $ | 1,056,016 | | | $ | 1,056,016 | |
| | | | | | |
Other permanent cash value life insurance | | | — | | | | 6,364,107 | | | | 6,632,321 | | | | — | | | | — | | | | — | |
| | | | | | |
Variable universal life | | | 529,476 | | | | 569,524 | | | | 569,592 | | | | — | | | | — | | | | — | |
| | | | | | |
Not subject to discretionary withdrawal or no cash values: | | | | | | | | | | | | | | | | | | | | | | | | |
| | | | | | |
Term policies with cash value | | | N/A | | | | N/A | | | | 85,376 | | | | N/A | | | | N/A | | | | — | |
| | | | | | |
Accidental death benefits | | | N/A | | | | N/A | | | | 58 | | | | N/A | | | | N/A | | | | — | |
| | | | | | |
Disability - active lives | | | N/A | | | | N/A | | | | 326 | | | | N/A | | | | N/A | | | | — | |
| | | | | | |
Disability - disabled lives | | | N/A | | | | N/A | | | | 99,723 | | | | N/A | | | | N/A | | | | — | |
| | | | | | |
Miscellaneous reserves | | | N/A | | | | N/A | | | | 40,269 | | | | N/A | | | | N/A | | | | — | |
| | | | | | | | | | | | | | | | | | | | | | | | |
| | | | | | |
Total, gross | | | 6,783,074 | | | | 13,621,506 | | | | 14,150,037 | | | | 1,056,016 | | | | 1,056,016 | | | | 1,056,016 | |
| | | | | | |
Reinsurance ceded | | | 6,782,069 | | | | 10,251,661 | | | | 10,793,379 | | | | 1,056,016 | | | | 1,056,016 | | | | 1,056,016 | |
| | | | | | | | | | | | | | | | | | | | | | | | |
| | | | | | |
Total, net of reinsurance ceded | | $ | 1,005 | | | $ | 3,369,845 | | | $ | 3,356,658 | | | $ | — | | | $ | — | | | $ | — | |
| | | | | | | | | | | | | | | | | | | | | | | | |
| | | | | | | | | | | | |
| |
| | | December 31, 2023 | |
| | | Separate Account - Nonguaranteed | |
| Subject to discretionary withdrawal, surrender values, or policy loans: | | Account
Value | | | Cash
Value | | | Reserve | |
| | | |
Universal life | | $ | — | | | $ | — | | | $ | — | |
| | | |
Other permanent cash value life insurance | | | — | | | | — | | | | — | |
| | | |
Variable universal life | | | 6,225,180 | | | | 6,225,180 | | | | 6,225,180 | |
| | | |
| Not subject to discretionary withdrawal or no cash values: | | | | | | | | | | | | |
| | | |
Term policies with cash value | | | N/A | | | | N/A | | | | — | |
| | | |
Accidental death benefits | | | N/A | | | | N/A | | | | — | |
| | | |
Disability - active lives | | | N/A | | | | N/A | | | | — | |
| | | |
Disability - disabled lives | | | N/A | | | | N/A | | | | — | |
| | | |
Miscellaneous reserves | | | N/A | | | | N/A | | | | — | |
| | | | | | | | | | | | |
| | | |
| Total, gross | | | 6,225,180 | | | | 6,225,180 | | | | 6,225,180 | |
| | | |
| Reinsurance ceded | | | 6,225,180 | | | | 6,225,180 | | | | 6,225,180 | |
| | | | | | | | | | | | |
| | | |
| Total, net of reinsurance ceded | | $ | — | | | $ | — | | | $ | — | |
| | | | | | | | | | | | |
49
EMPOWER ANNUITY INSURANCE COMPANY OF AMERICA
Notes to Statutory Financial Statements
(In Thousands, Except Share Amounts)
| | | | | | | | | | | | | | | | | | | | | | | | |
| |
| | | December 31, 2022 | |
| | | General Account | | | Separate Account - Nonguaranteed | |
| | | | | | | | |
Subject to discretionary withdrawal, surrender values, or
policy loans: | | Account
Value | | | Cash Value | | | Reserve | | | Account
Value | | | Cash
Value | | | Reserve | |
| | | | | | | | | | | | | | | | | | | | | | | | |
| | | | | | |
Universal life | | $ | 6,370,324 | | | $ | 6,767,757 | | | $ | 6,801,480 | | | $ | 1,057,103 | | | $ | 1,057,103 | | | $ | 1,057,103 | |
| | | | | | |
Other permanent cash value life insurance | | | — | | | | 6,554,010 | | | | 6,840,373 | | | | — | | | | — | | | | — | |
| | | | | | |
Variable universal life | | | 442,557 | | | | 470,856 | | | | 470,920 | | | | — | | | | — | | | | — | |
| | | | | | |
Not subject to discretionary withdrawal or no cash values: | | | | | | | | | | | | | | | | | | | | | | | | |
| | | | | | |
Term policies with cash value | | | N/A | | | | N/A | | | | 96,247 | | | | — | | | | — | | | | — | |
| | | | | | |
Accidental death benefits | | | N/A | | | | N/A | | | | 59 | | | | — | | | | — | | | | — | |
| | | | | | |
Disability - active lives | | | N/A | | | | N/A | | | | 337 | | | | — | | | | — | | | | — | |
| | | | | | |
Disability - disabled lives | | | N/A | | | | N/A | | | | 105,392 | | | | — | | | | — | | | | — | |
| | | | | | |
Miscellaneous reserves | | | N/A | | | | N/A | | | | 40,412 | | | | — | | | | — | | | | — | |
| | | | | | | | | | | | | | | | | | | | | | | | |
| | | | | | |
Total, gross | | | 6,812,881 | | | | 13,792,623 | | | | 14,355,220 | | | | 1,057,103 | | | | 1,057,103 | | | | 1,057,103 | |
| | | | | | |
Reinsurance ceded | | | 6,805,793 | | | | 10,318,727 | | | | 10,884,538 | | | | 1,057,103 | | | | 1,057,103 | | | | 1,057,103 | |
| | | | | | | | | | | | | | | | | | | | | | | | |
| | | | | | |
Total, net of reinsurance ceded | | $ | 7,088 | | | $ | 3,473,896 | | | $ | 3,470,682 | | | $ | — | | | $ | — | | | $ | — | |
| | | | | | | | | | | | | | | | | | | | | | | | |
| | | | | | | | | | | | |
| |
| | | December 31, 2022 | |
| | | Separate Account - Nonguaranteed | |
| Subject to discretionary withdrawal, surrender values, or policy loans: | | Account
Value | | | Cash
Value | | | Reserve | |
| | | |
Universal life | | $ | — | | | $ | — | | | $ | — | |
| | | |
Other permanent cash value life insurance | | | — | | | | — | | | | — | |
| | | |
Variable universal life | | | 5,765,699 | | | | 5,865,699 | | | | 5,765,699 | |
| | | |
| Not subject to discretionary withdrawal or no cash values: | | | | | | | | | | | | |
| | | |
Term policies with cash value | | | — | | | | — | | | | — | |
| | | |
Accidental death benefits | | | — | | | | — | | | | — | |
| | | |
Disability - active lives | | | — | | | | — | | | | — | |
| | | |
Disability - disabled lives | | | — | | | | — | | | | — | |
| | | |
Miscellaneous reserves | | | — | | | | — | | | | — | |
| | | | | | | | | | | | |
| | | |
| Total, gross | | | 5,765,699 | | | | 5,765,699 | | | | 5,765,699 | |
| | | |
| Reinsurance ceded | | | 5,765,699 | | | | 5,765,699 | | | | 5,765,699 | |
| | | | | | | | | | | | |
| | | |
| Total, net of reinsurance ceded | | $ | — | | | $ | — | | | $ | — | |
| | | | | | | | | | | | |
50
EMPOWER ANNUITY INSURANCE COMPANY OF AMERICA
Notes to Statutory Financial Statements
(In Thousands, Except Share Amounts)
Life actuarial reserves at December 31, were as follows:
| | | | | | | | |
| | | 2023 | | | 2022 | |
General Account: | | | | | | | | |
Life insurance | | $ | 3,345,069 | | | $ | 3,470,682 | |
Accidental death benefits | | | — | | | | — | |
Active lives | | | — | | | | — | |
Disability - disabled lives | | | — | | | | — | |
Miscellaneous reserves | | | 11,589 | | | | — | |
| | | | | | | | |
Total | | $ | 3,356,658 | | | $ | 3,470,682 | |
| | | | | | | | |
10. Commercial Paper
The Company has a commercial paper program that is partially supported by a $50,000 credit facility agreement. The commercial paper has been given a rating of A-1+ by Standard & Poor’s Ratings Services and a rating of P-1 by Moody’s Investors Service, each being the highest rating available. The Company’s issuance of commercial paper is not used to fund daily operations and does not have a significant impact on the Company’s liquidity.
The following table provides information regarding the Company’s commercial paper program:
| | | | | | | | |
| | | December 31, |
| | | 2023 | | 2022 |
| | |
Face value | | $ | 100,000 | | | $ | 100,000 | |
| | |
Carrying value | | $ | 99,718 | | | $ | 99,760 | |
| | |
Interest expense paid | | $ | 4,844 | | | $ | 1,121 | |
| | |
Effective interest rate | | | 5.57% | | | | 4.52% | |
| | |
Maturity range (days) | | | 19 | | | | 20 | |
11. Separate Accounts
The Company utilizes separate accounts to record and account for assets and liabilities for particular lines of business and/or transactions. The Company reported assets and liabilities from the following product lines into a separate account:
| | • | | Individual Annuity Product |
| | • | | Variable Life Insurance Product |
| | • | | Hybrid Ordinary Life Insurance Product |
| | • | | Individual Indexed-Linked Annuity Product |
In accordance with the domiciliary state procedures for approving items within the separate account, the separate account classification of the following items are supported by Colorado Insurance Code Section 10-7-402:
| | • | | Variable Life Insurance Product |
The following items are supported by direct approval by the Commissioner:
| | • | | Hybrid Ordinary Life Insurance Product |
| | • | | Group Annuity - Custom Stable Value Asset Funds |
| | • | | Variable Life Insurance Product |
| | • | | Individual Indexed-Linked Annuity Product |
51
EMPOWER ANNUITY INSURANCE COMPANY OF AMERICA
Notes to Statutory Financial Statements
(In Thousands, Except Share Amounts)
The Company’s separate accounts invest in shares of Empower Funds, LLC, and Putnam Funds, open-end management investment companies which are affiliates of the Company, and shares of other non-affiliated mutual funds and government and corporate bonds.
Some assets within each of the Company’s separate accounts are considered legally insulated whereas others are not legally insulated from the general account. The legal insulation of the separate accounts prevents such assets from being generally available to satisfy claims resulting from the general account.
At December 31, 2023 and 2022, the Company’s separate account assets that are legally insulated from the general account claims are $23,118,856 and $22,904,604.
As of December 31, 2023 and 2022, $10,601,515 and $10,116,069, respectively, of separate account reserves were ceded under modified coinsurance to Protective. While the Company holds the respective asset and liability under the modified coinsurance agreement, the economics are ceded to Protective, resulting in no impact to net income.
As of December 31, 2023 and 2022, $5,138,030 and $44,961,757, respectively, of separate account reserves were acquired under modified coinsurance from MassMutual. While MassMutual holds the respective asset and liability under the modified coinsurance agreement, the economics are assumed by the Company.
As of December 31, 2023 and 2022, $73,525 and $743,381 of separate account reserves were acquired under modified coinsurance from PICA. While PICA holds the respective asset and liability under the modified coinsurance agreement, the economics are assumed by the Company.
Some separate account liabilities are guaranteed by the general account. In accordance with the guarantees provided, if the investment proceeds are insufficient to cover the rate of return guaranteed for the product, the policyholder proceeds will be remitted by the general account. To compensate the general account for the risk taken, the separate account has paid risk charges of $16,620, $10,785, $10,723, $11,325, and $11,649 for the years ended December 31, 2023, 2022, 2021, 2020 and 2019, respectively. No separate account guarantees were paid by the general account for the years ending December 31, 2023, 2022, 2021, 2020 and 2019, respectively.
Separate accounts with guarantees
The Government Guaranteed Funds are separate accounts investing in fixed income securities backed by the credit of the U.S. Government, its agencies or its instrumentalities.
The Stable Asset Funds invest in investment-grade corporate bonds in addition to the above mentioned securities.
The Company also has separate accounts comprised of assets underlying variable universal life policies issued privately to accredited investors. The accounts invest in investment grade fixed income securities.
The Individual Indexed-Linked Annuity Product provides returns based on the performance of one or more indices and invests in fixed income securities. The returns from these securities are invested in derivative instruments which mimic the returns of select indices. There is also a return of premium death benefit guarantee to policyholders.
The Government Guaranteed Funds and Stable Asset Funds have a guaranteed minimum crediting rate of at least 0%. All of the above separate accounts provide a book value guarantee. Some of them also provide a death benefit of the greater of account balance or premium paid.
Distributions to a participant are based on the participant’s account balance and are permitted for the purpose of paying a benefit to a participant. Distributions for purposes other than paying a benefit to a participant may be restricted. Participants’ distributions are based on the amount of their account balance, whereas, distributions as a result of termination of the group annuity contract are based on net assets attributable to the contract and can be made to the group through (1) transfer of the underlying securities and any remaining cash balance, or (2) transfer of the cash balance after sale of the Fund’s securities.
Most guaranteed separate account assets and related liabilities are carried at fair value. Certain separate account assets are carried at book value based on the prescribed deviation from the Division.
52
EMPOWER ANNUITY INSURANCE COMPANY OF AMERICA
Notes to Statutory Financial Statements
(In Thousands, Except Share Amounts)
Non-guaranteed separate accounts
The non-guaranteed separate accounts include unit investment trusts or series accounts that invest in diversified open-end management investment companies. These separate account assets and related liabilities are carried at fair value.
The investments in shares are valued at the closing net asset value as determined by the appropriate fund/portfolio at the end of each day. The net investment experience of the separate account is credited directly to the policyholder and can be positive or negative. Some of the separate accounts provide an incidental death benefit of the greater of the policyholder’s account balance or premium paid and some provide an incidental annual withdrawal benefit for the life of the policyholder. Certain contracts contain provisions relating to a contingent deferred sales charge. In such contracts, charges will be made for total or partial surrender of a participant annuity account in excess of the “free amount” before the retirement date by a deduction from a participant’s account. The “free amount” is an amount equal to 10% of the participant account value at December 31 of the calendar year prior to the partial or total surrender.
The following tables provide information regarding the Company’s separate accounts:
| | | | | | | | | | | | |
| | | Year Ended December 31, 2023 | |
| | | Non-indexed
guaranteed less
than/equal to 4% | | | Non-guaranteed
separate account | | | Total | |
| | | |
Premiums, considerations or deposits | | $ | 297,069 | | | $ | 505,552 | | | $ | 802,621 | |
| | | | | | | | | | | | |
| | | |
Reserves | | | | | | | | | | | | |
| | | |
For accounts with assets at: | | | | | | | | | | | | |
| | | |
Fair value | | $ | 6,469,505 | | | $ | 14,445,834 | | | $ | 20,915,339 | |
| | | |
Amortized cost | | | 1,185,200 | | | | — | | | | 1,185,200 | |
| | | | | | | | | | | | |
| | | |
Total reserves | | $ | 7,654,705 | | | $ | 14,445,834 | | | $ | 22,100,539 | |
| | | | | | | | | | | | |
| | | |
By withdrawal characteristics: | | | | | | | | | | | | |
| | | |
At fair value | | $ | 6,469,505 | | | $ | 14,445,834 | | | $ | 20,915,339 | |
| | | |
At book value without fair value adjustment and with current surrender charge less than 5% | | | 1,185,200 | | | | — | | | | 1,185,200 | |
| | | | | | | | | | | | |
| | | |
Total subject to discretionary withdrawals | | $ | 7,654,705 | | | $ | 14,445,834 | | | $ | 22,100,539 | |
| | | | | | | | | | | | |
| |
| | | Year Ended December 31, 2022 | |
| | | Non-indexed
guaranteed less
than/equal to 4% | | | Non-guaranteed
separate account | | | Total | |
| | | |
Premiums, considerations or deposits | | $ | 334,030 | | | $ | 593,856 | | | $ | 927,886 | |
| | | | | | | | | | | | |
| | | |
Reserves | | | | | | | | | | | | |
| | | |
For accounts with assets at: | | | | | | | | | | | | |
| | | |
Fair value | | $ | 6,810,908 | | | $ | 13,996,032 | | | $ | 20,806,940 | |
| | | |
Amortized cost | | | 1,185,706 | | | | — | | | | 1,185,706 | |
| | | | | | | | | | | | |
| | | |
Total reserves | | $ | 7,996,614 | | | $ | 13,996,032 | | | $ | 21,992,646 | |
| | | | | | | | | | | | |
| | | |
By withdrawal characteristics: | | | | | | | | | | | | |
| | | |
At fair value | | $ | 6,810,908 | | | $ | 13,996,032 | | | $ | 20,806,940 | |
| | | |
At book value without fair value adjustment and with current surrender charge less than 5% | | | 1,185,706 | | | | — | | | | 1,185,706 | |
| | | | | | | | | | | | |
| | | |
Total subject to discretionary withdrawals | | $ | 7,996,614 | | | $ | 13,996,032 | | | $ | 21,992,646 | |
| | | | | | | | | | | | |
53
EMPOWER ANNUITY INSURANCE COMPANY OF AMERICA
Notes to Statutory Financial Statements
(In Thousands, Except Share Amounts)
A reconciliation of the amounts transferred to and from the separate accounts is presented below:
| | | | | | | | | | | | |
| | | Year Ended December 31, | |
| | | 2023 | | | 2022 | | | 2021 | |
| | | |
Transfers as reported in the Summary of Operations of the separate account statement: | | | | | | | | | | | | |
| | | |
Transfers to separate accounts | | $ | 802,621 | | | $ | 927,886 | | | $ | 1,060,561 | |
| | | |
Transfers from separate accounts | | | (2,874,149 | ) | | | (2,367,236 | ) | | | (2,907,674 | ) |
| | | | | | | | | | | | |
Net transfers from separate accounts | | | (2,071,528) | | | | (1,439,350) | | | | (1,847,113) | |
Reconciling adjustments: | | | | | | | | | | | | |
| | | |
Net transfer of reserves to separate accounts | | | 524,666 | | | | 308,625 | | | | 473,021 | |
| | | |
Miscellaneous other | | | 6,264 | | | | 4,017 | | | | 281 | |
| | | |
CARVM allowance reinsured | | | (16,418 | ) | | | (22,149 | ) | | | (15,221 | ) |
| | | |
Reinsurance | | | (4,608,654 | ) | | | (4,442,341 | ) | | | (6,746,815 | ) |
| | | | | | | | | | | | |
| | | |
Net transfers as reported in the Statements of Operations | | $ | (6,165,670 | ) | | $ | (5,591,198 | ) | | $ | (8,135,847 | ) |
| | | | | | | | | | | | |
12. Capital and Surplus, Dividend Restrictions, and Other Matters
The payment of principal and interest under all surplus notes can be made only with prior written approval of the Commissioner of Insurance of the State of Colorado. Such payments are payable only out of surplus funds of the Company and only if at the time of such payment, and after giving effect to the making thereof, the financial condition of the Company is such that its surplus would not fall below two and one-half times the authorized control level as required by the most recent risk-based capital calculations.
On December 29, 2017, the Company issued a surplus note in the face amount and carrying amount of $12,000 to EHI. The proceeds were used for general corporate purposes. The surplus note bears an interest rate of 3.5% per annum. The note matures on December 29, 2027. Interest paid on the note during 2023, 2022 and 2021 amounted to $420, $420 and $420, respectively, bringing total interest paid from inception to December 31, 2023 to $2,522. The amount of unapproved principal and interest was $0 at December 31, 2023.
On May 17, 2018, the Company issued a surplus note in the face amount and carrying amount of $346,218 to EHI. The proceeds were used to redeem the $333,400 surplus note issued in 2006 and for general corporate purposes. The surplus note bears an interest rate of 4.881% per annum. The note matures on May 17, 2048. Interest paid on the note during 2023, 2022, and 2021 amounted to $16,899, $16,899 and $16,899, respectively, bringing total interest paid from inception to December 31, 2023 to $95,010. The amount of unapproved principal and interest was $0 at December 31, 2023.
In the first quarter of 2018, the Company realized a $39,921 after tax gain on an interest rate swap that hedged the existing $333,400 surplus note. The Company adjusted the basis of the hedged item, in this case the surplus note, for the amount of the after tax gain. Further, the Company accounted for the redemption of the $333,400 surplus note and the issuance of the $346,218 surplus note in the second quarter as debt modification instead of debt extinguishment. Therefore, the after tax swap gain will be amortized into income over the 30 year life of the new surplus note. Amortization of the gain during 2023, 2022, and 2021 amounted to $1,331, $1,331 and $1,331, respectively bringing the total amortization from inception to December 31, 2023 amounted to $7,651, leaving an unamortized balance of $32,270 in surplus as part of the surplus note amounts.
On August 12, 2020, the Company issued a surplus note in the face amount and carrying amount of $527,500 to EHI. The proceeds were used to finance the EPW transaction. The surplus note bears an interest rate of 1.260% per annum. The note matures on August 12, 2025. Interest paid on the note during 2023, 2022, and 2021 amounted to $6,647, $6,647 and $6,647, respectively, bringing total interest paid from inception to December 31, 2023 to $19,940. The amount of unapproved principal and interest was $0 at December 31, 2023.
54
EMPOWER ANNUITY INSURANCE COMPANY OF AMERICA
Notes to Statutory Financial Statements
(In Thousands, Except Share Amounts)
On August 26, 2021, the Company issued a surplus note in the face amount and carrying amount of $1,192,007 to EHI. The proceeds were used to partially fund the acquisition of certain businesses from Prudential. The note matures on December 31, 2051. The surplus note bears an interest rate of 4.2% per annum until December 31, 2026. Starting on December 31, 2026 and on every fifth anniversary of such date thereafter, the interest rate on the note is reset to rate equal to the five-year U.S. Treasury Rate plus 3.4% . Interest paid on the note during 2023, 2022 and 2021 amounted to $50,064, $50,064 and $17,384, respectively, bringing total interest paid at December 31, 2023 to $117,686. The amount of unapproved principal and interest was $0 at December 31, 2023.
The Company issued 2,591,253 additional common shares and received $810 million from EHI in March 2022 to fund the Prudential acquisition.
The Company issued 145,780 additional common shares and received $45 million from EHI in December 2023.
As an insurance company domiciled in the State of Colorado, the Company is required to maintain a minimum of $2,000 of capital and surplus. In addition, the maximum amount of dividends which can be paid to stockholders by insurance companies domiciled in the State of Colorado, without prior approval of the Insurance Commissioner, is subject to restrictions relating to statutory capital and surplus and statutory net gain from operations. The Company may pay an amount less than $378,201 of dividends during the year ended December 31, 2024, without the prior approval of the Colorado Insurance Commissioner. Prior to any payment of dividends, the Company provides notice to the Colorado Insurance Commissioner. Dividends are non-cumulative and paid as determined by the Board of Directors, subject to the limitations described above. During the years ended December 31, 2023, 2022 and 2021 the Company paid dividends to EHI, totaling $350,000, $231,000, and $506,000, respectively.
The portion of unassigned deficit (surplus) represented or (reduced) by each of the following items is:
| | | | | | | | |
| | | December 31, |
| | | 2023 | | 2022 |
| | |
Unrealized (losses) gains | | | (1,031,703 | ) | | | (445,158 | ) |
| | |
Non-admitted assets | | | (1,018,607 | ) | | | (1,389,954 | ) |
| | |
Surplus as regards reinsurance | | | 404,458 | | | | 547,064 | |
| | |
Asset valuation reserve | | | (299,764 | ) | | | (262,562 | ) |
| | |
Separate accounts | | | (1,556 | ) | | | (1,556 | ) |
Risk-based capital (“RBC”) is a regulatory tool for measuring the minimum amount of capital appropriate for a life, accident and health organization to support its overall business operations in consideration of its size and risk profile. The Division requires the Company to maintain minimum capital and surplus equal to the company action level as calculated in the RBC model. The Company exceeds the required amount.
13. Federal Income Taxes
The following table presents the components of the net admitted deferred tax asset:
| | | | | | | | | | | | | | | | | | | | | | | | | | | | | | | | | | | | |
| | | December 31, 2023 | | | December 31, 2022 | | | Change | |
| | | Ordinary | | | Capital | | | Total | | | Ordinary | | | Capital | | | Total | | | Ordinary | | | Capital | | | Total | |
| | | | | | | | | |
Gross deferred tax assets | | $ | 468,179 | | | $ | 14,904 | | | $ | 483,083 | | | $ | 462,234 | | | $ | — | | | $ | 462,234 | | | $ | 5,945 | | | $ | 14,904 | | | $ | 20,849 | |
| | | | | | | | | |
Valuation allowance adjustment | | | — | | | | (14,904 | ) | | | (14,904 | ) | | | — | | | | — | | | | — | | | | — | | | | (14,904 | ) | | | (14,904 | ) |
| | | | | | | | | | | | | | | | | | | | | | | | | | | | | | | | | | | | |
| | | | | | | | | |
Adjusted gross deferred tax asset | | | 468,179 | | | | — | | | | 468,179 | | | | 462,234 | | | | — | | | | 462,234 | | | | 5,945 | | | | — | | | | 5,945 | |
| | | | | | | | | |
Deferred tax assets non-admitted | | | (273,412 | ) | | | — | | | | (273,412 | ) | | | (317,543 | ) | | | — | | | | (317,543 | ) | | | 44,131 | | | | — | | | | 44,131 | |
| | | | | | | | | | | | | | | | | | | | | | | | | | | | | | | | | | | | |
| | | | | | | | | |
Net admitted deferred tax asset | | | 194,767 | | | | — | | | | 194,767 | | | | 144,691 | | | | — | | | | 144,691 | | | | 50,076 | | | | — | | | | 50,076 | |
| | | | | | | | | |
Gross deferred tax liabilities | | | (29,324 | ) | | | (13,263 | ) | | | (42,587 | ) | | | (23,346 | ) | | | (19,353 | ) | | | (42,699 | ) | | | (5,978 | ) | | | 6,090 | | | | 112 | |
| | | | | | | | | | | | | | | | | | | | | | | | | | | | | | | | | | | | |
| | | | | | | | | |
Net admitted deferred tax asset | | $ | 165,443 | | | $ | (13,263 | ) | | $ | 152,180 | | | $ | 121,345 | | | $ | (19,353 | ) | | $ | 101,992 | | | $ | 44,098 | | | $ | 6,090 | | | $ | 50,188 | |
| | | | | | | | | | | | | | | | | | | | | | | | | | | | | | | | | | | | |
55
EMPOWER ANNUITY INSURANCE COMPANY OF AMERICA
Notes to Statutory Financial Statements
(In Thousands, Except Share Amounts)
The Company admits deferred tax assets pursuant to paragraphs 11.a, 11.b.i, 11.b.ii, and 11.c, in SSAP No. 101. The following table presents the amount of deferred tax asset admitted under each component of SSAP No. 101:
| | | | | | | | | | | | | | | | | | | | | | | | | | | | | | | | | | | | |
| | | December 31, 2023 | | | December 31, 2022 | | | Change | |
| | | Ordinary | | | Capital | | | Total | | | Ordinary | | | Capital | | | Total | | | Ordinary | | | Capital | | | Total | |
| | | | | | | | | |
(a) Federal income taxes paid in prior years recoverable through loss carrybacks | | $ | — | | | $ | — | | | $ | — | | | $ | — | | | $ | — | | | $ | — | | | $ | — | | | $ | — | | | $ | — | |
| | | | | | | | | |
(b) Adjusted gross deferred tax assets expected to be realized (excluding the amount of deferred tax assets from (a) above) after application of the threshold limitation (lesser of (i) and (ii) below) | | | 152,180 | | | | — | | | | 152,180 | | | | 101,992 | | | | — | | | | 101,992 | | | | 50,188 | | | | — | | | | 50,188 | |
| | | | | | | | | |
(i) Adjusted gross deferred tax assets expected to be realized following the balance sheet date | | | 152,180 | | | | — | | | | 152,180 | | | | 101,992 | | | | — | | | | 101,992 | | | | 50,188 | | | | — | | | | 50,188 | |
| | | | | | | | | |
(ii) Adjusted gross deferred tax assets expected allowed per limitation threshold | | | — | | | | — | | | | 544,474 | | | | — | | | | — | | | | 512,788 | | | | — | | | | — | | | | 31,686 | |
| | | | | | | | | |
(c) Adjusted gross deferred tax assets (excluding the amount of deferred tax assets from (a) and (b) above) offset by gross deferred tax liabilities | | | 42,587 | | | | — | | | | 42,587 | | | | 42,699 | | | | — | | | | 42,699 | | | | (112 | ) | | | — | | | | (112 | ) |
| | | | | | | | | | | | | | | | | | | | | | | | | | | | | | | | | | | | |
| | | | | | | | | |
Total deferred tax assets admitted as a result of the application of SSAP No. 101 | | $ | 194,767 | | | $ | — | | | $ | 194,767 | | | $ | 144,691 | | | $ | — | | | $ | 144,691 | | | $ | 50,076 | | | $ | — | | | $ | 50,076 | |
| | | | | | | | | | | | | | | | | | | | | | | | | | | | | | | | | | | | |
The following table presents the threshold limitations utilized in the admissibility of deferred tax assets under paragraph 11.b of SSAP No. 101:
| | | | | | | | |
| | | 2023 | | 2022 |
| | |
Ratio percentage used to determine recovery period and threshold limitation amount | | | 969.43 | % | | | 864.94 | % |
| | |
Amount of adjusted capital and surplus used to determine recovery period and threshold limitation | | $ | 3,629,825 | | | $ | 3,418,586 | |
The following table presents the impact of tax planning strategies:
| | | | | | | | | | | | | | | | | | | | | | | | |
| | | December 31, 2023 | | | December 31, 2022 | | | Change | |
| | | Ordinary | | | Capital | | | Ordinary | | | Capital | | | Ordinary | | | Capital | |
| | | | | | |
Adjusted gross deferred tax asset | | $ | 468,179 | | | $ | — | | | $ | 462,234 | | | $ | — | | | $ | 5,945 | | | $ | — | |
| | | | | | |
% of adjusted gross deferred tax asset by character attributable to tax planning strategies | | | — | % | | | — | % | | | — | % | | | — | % | | | — | % | | | — | % |
| | | | | | |
Net admitted adjusted gross deferred tax assets | | $ | 194,767 | | | $ | — | | | $ | 144,691 | | | $ | — | | | $ | 50,076 | | | $ | — | |
| | | | | | |
% of net admitted adjusted gross deferred tax asset by character attributable to tax planning strategies | | | — | % | | | — | % | | | 67.71 | % | | | — | % | | | (67.71 | )% | | | — | % |
The Company’s tax planning strategies do not include the use of reinsurance.
There are no temporary differences for which deferred tax liabilities are not recognized.
The components of current income taxes incurred include the following:
56
EMPOWER ANNUITY INSURANCE COMPANY OF AMERICA
Notes to Statutory Financial Statements
(In Thousands, Except Share Amounts)
| | | | | | | | | | | | |
| | | Year Ended December 31, | | | | |
| | | 2023 | | | 2022 | | | Change | |
| | | |
Current income tax | | $ | 36,238 | | | $ | 20,399 | | | $ | 15,839 | |
| | | |
Federal income tax on net capital gains | | | (43,095 | ) | | | (42,088 | ) | | | (1,007 | ) |
| | | | | | | | | | | | |
| | | |
Total | | $ | (6,857 | ) | | $ | (21,689 | ) | | $ | 14,832 | |
| | | | | | | | | | | | |
| | |
| | | Year Ended December 31, | | | | |
| | | 2022 | | | 2021 | | | Change | |
| | | |
Current income tax | | $ | 20,399 | | | $ | 22,402 | | | $ | (2,003 | ) |
| | | |
Federal income tax on net capital gains | | | (42,088 | ) | | | (11,628 | ) | | | (30,460 | ) |
| | | | | | | | | | | | |
| | | |
Total | | $ | (21,689 | ) | | $ | 10,774 | | | $ | (32,463 | ) |
| | | | | | | | | | | | |
57
EMPOWER ANNUITY INSURANCE COMPANY OF AMERICA
Notes to Statutory Financial Statements
(In Thousands, Except Share Amounts)
The tax effects of temporary differences, which give rise to the deferred income tax assets and liabilities are as follows:
| | | | | | | | | | | | |
| | | December 31, | | |
Deferred income tax assets: | | 2023 | | 2022 | | Change |
| | | |
Ordinary: | | | | | | | | | | | | |
| | | |
Reserves | | $ | 11,777 | | | $ | 16,981 | | | $ | (5,204 | ) |
| | | |
Investments | | | 2,219 | | | | 2,338 | | | | (119 | ) |
| | | |
Provision for dividends | | | — | | | | 22 | | | | (22 | ) |
| | | |
Fixed assets | | | 4,133 | | | | 2,765 | | | | 1,368 | |
| | | |
Compensation and benefit accrual | | | 22,623 | | | | 22,797 | | | | (174 | ) |
| | | |
Receivables - non-admitted | | | 17,905 | | | | 18,776 | | | | (871 | ) |
| | | |
Tax credit carryforward | | | 88,372 | | | | 139,671 | | | | (51,299 | ) |
| | | |
Intangible | | | 227,519 | | | | 244,114 | | | | (16,595 | ) |
| | | |
NOL | | | 72,213 | | | | — | | | | 72,213 | |
| | | |
Other | | | 21,418 | | | | 14,770 | | | | 6,648 | |
| | | | | | | | | | | | |
| | | |
Total ordinary gross deferred tax assets | | | 468,179 | | | | 462,234 | | | | 5,945 | |
| | | |
Valuation allowance adjustment | | | — | | | | — | | | | — | |
| | | | | | | | | | | | |
| | | |
Total adjusted ordinary gross deferred tax assets | | | 468,179 | | | | 462,234 | | | | 5,945 | |
| | | |
Non-admitted ordinary deferred tax assets | | | (273,412 | ) | | | (317,543 | ) | | | 44,131 | |
| | | | | | | | | | | | |
| | | |
Admitted ordinary deferred tax assets | | | 194,767 | | | | 144,691 | | | | 50,076 | |
| | | | | | | | | | | | |
| | | |
Capital: | | | | | | | | | | | | |
| | | |
Investments | | | — | | | | — | | | | — | |
| | | |
Net Capital Loss Carryforward | | | 14,904 | | | | — | | | | 14,904 | |
| | | | | | | | | | | | |
| | | |
Total capital gross deferred tax assets | | | 14,904 | | | | — | | | | 14,904 | |
| | | |
Valuation allowance adjustment | | | (14,904 | ) | | | — | | | | (14,904 | ) |
| | | | | | | | | | | | |
| | | |
Total adjusted gross capital deferred tax assets | | | — | | | | — | | | | — | |
| | | |
Non-admitted capital deferred tax assets | | | — | | | | — | | | | — | |
| | | | | | | | | | | | |
| | | |
Admitted capital deferred tax assets | | | — | | | | — | | | | — | |
| | | | | | | | | | | | |
| | | |
Total admitted deferred tax assets | | $ | 194,767 | | | $ | 144,691 | | | $ | 50,076 | |
| | | | | | | | | | | | |
| | | |
Deferred income tax liabilities: | | | | | | | | | | | | |
| | | |
Ordinary: | | | | | | | | | | | | |
| | | |
Investments | | $ | (19,392 | ) | | $ | (10,781 | ) | | $ | (8,611 | ) |
| | | |
Premium receivable | | | (2,471 | ) | | | (2,828 | ) | | | 357 | |
| | | |
Policyholder reserves | | | (4,212 | ) | | | (6,318 | ) | | | 2,106 | |
| | | |
Experience refunds | | | — | | | | — | | | | — | |
| | | |
Other | | | (3,249 | ) | | | (3,419 | ) | | | 170 | |
| | | | | | | | | | | | |
| | | |
Total ordinary deferred tax liabilities | | | (29,324 | ) | | | (23,346 | ) | | | (5,978 | ) |
| | | | | | | | | | | | |
| | | |
Capital | | | | | | | | | | | | |
| | | |
Investments | | $ | (13,263 | ) | | $ | (19,353 | ) | | $ | 6,090 | |
| | | | | | | | | | | | |
| | | |
Total capital deferred tax liabilities | | | (13,263 | ) | | | (19,353 | ) | | | 6,090 | |
| | | | | | | | | | | | |
| | | |
Total deferred tax liabilities | | $ | (42,587 | ) | | $ | (42,699 | ) | | $ | 112 | |
| | | | | | | | | | | | |
| | | |
Net admitted deferred income tax asset | | $ | 152,180 | | | $ | 101,992 | | | $ | 50,188 | |
| | | | | | | | | | | | |
58
EMPOWER ANNUITY INSURANCE COMPANY OF AMERICA
Notes to Statutory Financial Statements
(In Thousands, Except Share Amounts)
The change in deferred income taxes reported in surplus before consideration of non-admitted assets is comprised of the following components:
| | | | | | | | | | | | |
| | | December 31, | | | | |
| | 2023 | | | 2022 | | | Change | |
| | | |
Total deferred income tax assets | | $ | 468,179 | | | $ | 462,234 | | | $ | 5,945 | |
| | | |
Total deferred income tax liabilities | | | (42,587 | ) | | | (42,699 | ) | | | 112 | |
| | | | | | | | | | | | |
| | | |
Net deferred income tax asset | | $ | 425,592 | | | $ | 419,535 | | | | 6,057 | |
| | | | | | | | | | | | |
| | | |
Tax effect of unrealized capital gains (losses) | | | | | | | | | | | (4,427 | ) |
| | | |
Tax-effect of change in minimum pension liability | | | | | | | | | | | (162 | ) |
| | | |
Other Surplus | | | | | | | | | | | 5,888 | |
| | | | | | | | | | | | |
| | | |
Change in net deferred income tax | | | | | | | | | | $ | 7,356 | |
| | | | | | | | | | | | |
| | |
| | | December 31, | | | | |
| | 2022 | | | 2021 | | | Change | |
| | | |
Total deferred income tax assets | | $ | 462,234 | | | $ | 461,912 | | | $ | 322 | |
| | | |
Total deferred income tax liabilities | | | (42,699 | ) | | | (36,206 | ) | | | (6,493 | ) |
| | | | | | | | | | | | |
| | | |
Net deferred income tax asset | | $ | 419,535 | | | $ | 425,706 | | | | (6,171 | ) |
| | | | | | | | | | | | |
| | | |
Tax effect of unrealized capital gains (losses) | | | | | | | | | | | (8,631 | ) |
| | | |
Other Surplus | | | | | | | | | | | 1,017 | |
| | | | | | | | | | | | |
| | | |
Change in net deferred income tax | | | | | | | | | | $ | (13,785 | ) |
| | | | | | | | | | | | |
59
EMPOWER ANNUITY INSURANCE COMPANY OF AMERICA
Notes to Statutory Financial Statements
(In Thousands, Except Share Amounts)
The provision for federal income taxes and change in deferred income taxes differ from that which would be obtained by applying the statutory federal income tax rate of 21% to income before income taxes. The significant items causing this difference are as follows:
| | | | | | | | | | | | |
| | | December 31, | |
| | | 2023 | | | 2022 | | | 2021 | |
| | | |
Income tax expense at statutory rate | | $ | 227,550 | | | $ | 106,303 | | | $ | 66,774 | |
| | | |
Earnings from subsidiaries | | | (111,166 | ) | | | (46,746 | ) | | | (31,726 | ) |
| | | |
Tax exempt investment income | | | (2,072 | ) | | | 262 | | | | (4,430 | ) |
| | | |
Ceding commission net of transaction expenses | | | (30,716 | ) | | | 37,141 | | | | (17,606 | ) |
| | | |
Change in statutory valuation allowance adjustment | | | 14,904 | | | | — | | | | | |
| | | |
Dividend received deduction | | | (4,140 | ) | | | (4,220 | ) | | | (4,751 | ) |
| | | |
Tax adjustment for interest maintenance reserve | | | 630 | | | | (37,223 | ) | | | (31,757 | ) |
| | | |
Prior year adjustment | | | 3,264 | | | | 90 | | | | 101 | |
| | | |
Non-deductible Personal Capital contingent consideration | | | — | | | | (5,171 | ) | | | 12,986 | |
| | | |
Statutory purchase accounting adjustment | | | — | | | | (14,415 | ) | | | 65,891 | |
| | | |
Tax effect on non-admitted assets | | | 1,722 | | | | 1,587 | | | | (5,382 | ) |
| | | |
Tax credits | | | (840 | ) | | | (3,122 | ) | | | (1,419 | ) |
| | | |
Income tax on realized capital gain (loss) | | | (43,095 | ) | | | (42,088 | ) | | | (11,627 | ) |
| | | |
Tax contingency | | | — | | | | (448 | ) | | | (1,926 | ) |
| | | |
Net Operating Loss | | | (72,213 | ) | | | — | | | | — | |
| | | |
Other | | | 1,959 | | | | 146 | | | | (852 | ) |
| | | | | | | | | | | | |
| | | |
Total | | $ | (14,213 | ) | | $ | (7,904 | ) | | $ | 34,276 | |
| | | | | | | | | | | | |
| | | |
| | | | | | | | | | | | |
| | | | |
| | | 2023 | | | 2022 | | | 2021 | |
| | | |
Federal income taxes incurred | | $ | (6,857 | ) | | $ | (21,689 | ) | | $ | 10,774 | |
| | | |
Change in net deferred income taxes | | | (7,356 | ) | | | 13,785 | | | | 23,502 | |
| | | | | | | | | | | | |
| | | |
Total income taxes | | $ | (14,213 | ) | | $ | (7,904 | ) | | $ | 34,276 | |
| | | | | | | | | | | | |
As of December 31, 2023, there is $343,870 of net operating loss carryforwards available for tax purposes.
As of December 31, 2023, the Company has Guaranteed Federal Low Income Housing tax credit carryforwards of $68,867. These credits will begin to expire in 2033.
As of December 31, 2023, the Company has $70,972 of capital loss carryforward.
The Company has no deposits admitted under Section 6603 of the Internal Revenue Code.
The Company’s federal income tax return is consolidated with the following entities (the “U.S. Consolidated Group”):
Great West Lifeco US LLC
Empower Financial Services, Inc.
Empower Holdings, Inc.
Great-West Life & Annuity Insurance Company of South Carolina
Empower Life & Annuity Insurance Company of New York
Putnam Investments LLC
Putnam Acquisition Financing, Inc.
Putnam Retail Management, LP
Putnam Retail Management GP, Inc.
Putnam Investors Services, Inc.
PanAgora Holdings, Inc.
PanAgora Asset Management, Inc.
60
EMPOWER ANNUITY INSURANCE COMPANY OF AMERICA
Notes to Statutory Financial Statements
(In Thousands, Except Share Amounts)
Putnam Advisory Holdings, LLC
Putnam Advisory Holdings II, LLC
Empower Retirement, LLC
Empower Advisory Group, LLC
Empower Trust Company, LLC
Empower Capital Management, LLC
Personal Capital Services Corporation
TBG Insurance Services Corporation
The Company, Great-West life & Annuity Insurance Company of South Carolina and Empower Life & Annuity Insurance Company of New York (“ELAINY”) are life insurance companies who form a life subgroup under the consolidated return regulations. These regulations determine whether taxable income or losses of this subgroup may offset or be offset with the taxable income or losses of other non-life entities.
The EAICA Subgroup accounts for income taxes on the modified separate return method on its separate company, statutory financial statements. Under this method, current and deferred tax expense or benefit is determined on a standalone basis; however the Company also considers taxable income or losses from other members of the EAICA Subgroup when determining its deferred tax assets and liabilities, and in evaluating the realizability of its deferred tax assets.
The method of settling income tax payables and receivables (“Tax Sharing Agreement”) among the US consolidated group is subject to a written agreement approved by the Board of Directors, whereby settlement is made on a separate return basis (i.e., the amount that would be due to or from a jurisdiction had an actual separate return been filed) except for the current utilization of any net operating losses and other tax attributes by members of the US Consolidated Group, which can lead to receiving a payment when none would be received from the jurisdiction had a real separate tax return been required. The EAICA Subgroup has a policy of settling intercompany balances as soon as practical after the filing of the federal consolidated return or receipt of the income tax refund from the Internal Revenue Service (“I.R.S.”).
The Company determines income tax contingencies in accordance with Statement of Statutory Accounting Principles No. 5R, Liabilities, Contingencies and Impairments of Assets (“SSAP No. 5R”) as modified by SSAP No. 101. As of December 31, 2023 the amount of tax contingencies computed in accordance with SSAP No. 5R is $0, with the exception of interest and penalties. The Company does not expect a significant increase in tax contingencies within the 12 month period following the balance sheet date.
The Company recognizes accrued interest and penalties related to tax contingencies in current income tax expense. During the years ended December 31, 2023 and 2022, the Company recognized approximately $0 and $(448) of benefit and expense, respectively, from interest and penalties related to the uncertain tax positions. The Company had $0 and $0 accrued for the payment of interest and penalties at December 31, 2023 and 2022, respectively.
The Company files income tax returns in the U.S. federal jurisdiction and various states. With few exceptions, the Company is no longer subject to U.S. federal income tax examinations by tax authorities for years 2019 and prior. The Company does not expect significant increases or decreases to unrecognized tax benefits relating to federal, state or local audits.
The valuation allowance adjustment to gross deferred tax assets as of December 31, 2023 and 2022 was $14,904 and $0 respectively. The valuation allowance adjustment relates to Management’s uncertainty as to the Company’s ability to use the Capital Loss carryforwards, therefore, a valuation allowance has been recognized with respect to the Company’s Capital Loss carryforward DTA.
The reporting entity is an applicable reporting entity with respect to the Corporate Alternative Minimum Tax (“CAMT”). The reporting entity may be charged with a portion of the CAMT incurred by the consolidated group or credited with a portion of the consolidated group’s CAMT credit utilization. The reporting entity has made an accounting policy election to disregard CAMT when evaluating the need for a valuation allowance. There have been NO material modifications to the methodology used to project future regular tax liability as a result of the CAMT. The credit generated as of December 31, 2023 was $19,504.
61
EMPOWER ANNUITY INSURANCE COMPANY OF AMERICA
Notes to Statutory Financial Statements
(In Thousands, Except Share Amounts)
| | | | |
| |
Gross AMT Credit Recognized as: Current year recoverable | | | — | |
| |
Gross AMT Credit Recognized as: Deferred tax asset (DTA) | | | 19,504 | |
| |
Beginning Balance of AMT Credit Carryforward | | | — | |
| |
Amounts Recovered | | | — | |
| |
Adjustments | | | (19,504 | ) |
| | | | |
| |
Ending Balance of AMT Credit Carryforward (5=2-3-4) | | | 19,504 | |
| |
Reduction for Sequestration | | | — | |
| |
Nonadmitted by Reporting Entity | | | 19,504 | |
| | | | |
| |
Reporting Entity Ending Balance (8=5-6-7) | | | — | |
| | | | |
The Company does not have any foreign operations as of the periods ended December 31, 2023 and December 31, 2022 and therefore is not subject to the tax on Global Intangible Low-Taxed Income.
14. Employee Benefit Plans
Supplemental Executive Retirement Plans
The Company provides a Supplemental Executive Retirement Plan to certain key executives. This plan provides key executives with certain benefits upon retirement, disability or death based upon total compensation. The Company has purchased individual life insurance policies with respect to each employee covered by this plan. The Company is the owner and beneficiary of the insurance contracts.
A December 31 measurement date is used for the employee benefit plans.
The following table provide a reconciliation of the changes in the benefit obligations, fair value of plan assets and the underfunded status for the Company’s Supplemental Executive Retirement plan, where applicable:
| | | | | | | | |
| | | Supplemental Executive
Retirement Plan |
| | | Year Ended
December 31, |
| | | 2023 | | 2022 |
| Change in projected benefit obligation: | | | | | | | | |
Benefit obligation, January 1 | | $ | 23,862 | | | $ | 39,408 | |
Service cost | | | — | | | | — | |
Interest cost | | | 985 | | | | 1,009 | |
Actuarial (gain) loss | | | 771 | | | | (5,184 | ) |
Settlement | | | (3,299 | ) | | | (1,237 | ) |
Regular benefits paid | | | (2,348 | ) | | | (10,134 | ) |
| | | | | | | | |
Benefit obligation and under funded status, December 31 | | $ | 19,971 | | | $ | 23,862 | |
| | | | | | | | |
Accumulated benefit obligation | | | 19,971 | | | | 23,862 | |
During 2020, the Company adopted the Society of Actuaries Mortality Improvement Scale (MP-2020) which the Company elected to continue to use for 2023.
62
EMPOWER ANNUITY INSURANCE COMPANY OF AMERICA
Notes to Statutory Financial Statements
(In Thousands, Except Share Amounts)
The Company offers unfunded, non-qualified deferred compensation plans to a select group of executives, management and highly compensated individuals. Participants defer a portion of their compensation and realize potential market gains / losses or interest on the amount deferred. The programs are not qualified under Section 401 of the Internal Revenue Code. Participant balances, which are included in Other liabilities in the accompanying statutory financial statements, are $48,098 and $47,402 at December 31, 2023 and 2022, respectively.
15. Share-Based Compensation
Equity Awards
Lifeco, of which the Company is an indirect wholly-owned subsidiary, maintains the Great-West Lifeco Inc. Stock Option Plan (the “Lifeco Plan”) that provides for the granting of options on its common shares to certain of its officers and employees. The Company’s participation in the Lifeco plan was discontinued following the 2019 fiscal year and no options were granted to the Company’s officers and employees in the current year. However, several of the Company’s officers hold vested and unvested options granted under the Lifeco Plan.
Options are either regular options or contingent options. Regular options are generally granted in multi-year allotments. Regular options granted prior to 2019 become exercisable at the rate of twenty percent (20%) per year commencing one year after the date of the grant. For options granted in 2019 and thereafter, fifty percent (50%) of the regular options become exercisable three years from the date of grant, and the remaining fifty percent (50%) become exercisable four years from the date of grant. Contingent options do not become exercisable unless and until conditions prescribed by the Human Resources Committee have been satisfied.
Options generally expire ten years after the date of the grant, except that if options would otherwise expire during a blackout period or within ten business days of the end of a blackout period, the expiry date for the options is extended to the tenth business day after the expiry date of the blackout period.
In the event of the death of a participant or the termination of a participant’s employment, then the period within which the options may be exercised is generally reduced depending on the circumstances surrounding the death or termination of employment. Options are not assignable by participants otherwise than by will or pursuant to the laws of succession. Lifeco does not provide any financial assistance to participants to facilitate the purchase of common shares under the Lifeco Plan. Subject to any regulatory or shareholder approval required by law, the Lifeco Board of Directors may amend the Lifeco Plan or the terms of a grant.
16. Participating Insurance
Individual life insurance premiums paid, net of reinsurance, under individual life insurance participating policies were 75%, 99%, and 30% total individual life insurance premiums earned during the years ended December 31, 2023, 2022 and 2021 respectively. The Company accounts for its policyholder dividends based upon the contribution method. The Company paid dividends in the amount of $5,170, $10,047 and $18,129 to its policyholders during the years ended December 31, 2023, 2022 and 2021, respectively.
17. Concentrations
No customer accounted for 10% or more of the Company’s revenues during the year ended December 31, 2023. In addition, the Company is not dependent upon a single customer or a few customers. The loss of business from any one, or a few, independent brokers or agents would not have a material adverse effect on the Company or any of its business agents.
18. Commitments and Contingencies
Future Contractual Obligations
The following table summarizes the Company’s estimated future contractual obligations:
63
EMPOWER ANNUITY INSURANCE COMPANY OF AMERICA
Notes to Statutory Financial Statements
(In Thousands, Except Share Amounts)
| | | | | | | | | | | | | | | | | | | | | | | | | | | | |
| | | Payment due by period | |
| | 2024 | | | 2025 | | | 2026 | | | 2027 | | | 2028 | | | Thereafter | | | Total | |
| | | | | | | |
Surplus notes - principal (1) | | $ | — | | | $ | 527,500 | | | $ | — | | | $ | 12,000 | | | $ | — | | | $ | 1,538,225 | | | $ | 2,077,725 | |
| | | | | | | |
Surplus notes - interest (2) | | | 74,030 | | | | 72,368 | | | | 67,383 | | | | 67,383 | | | | 66,963 | | | | 1,481,007 | | | | 1,829,134 | |
| | | | | | | |
Investment purchase obligations (3) | | | 756,793 | | | | — | | | | — | | | | — | | | | — | | | | 5,000 | | | | 761,793 | |
| | | | | | | |
Other liabilities (4) | | | 41,722 | | | | — | | | | — | | | | — | | | | — | | | | — | | | | 41,722 | |
| | | | | | | | | | | | | | | | | | | | | | | | | | | | |
| | | | | | | |
Total | | $ | 872,545 | | | $ | 599,868 | | | $ | 67,383 | | | $ | 79,383 | | | $ | 66,963 | | | $ | 3,024,232 | | | $ | 4,710,374 | |
| | | | | | | | | | | | | | | | | | | | | | | | | | | | |
(1) Surplus notes principal - Represents contractual maturities of principal due to the Company’s parent, EHI, under the terms of four long-term surplus notes. The amounts shown in this table differ from the amounts included in the Company’s Statement of Admitted Assets, Liabilities, Capital and Surplus because of the $32,270 of unamortized debt modification gain as discussed in Note 12.
(2) Surplus notes interest - All surplus notes bear interest at a fixed rate through maturity. The interest payments shown in this table are calculated based upon the contractual rates in effect on December 31, 2023.
(3) Investment purchase obligations - The Company makes commitments to fund partnership interests, mortgage loans, and other investments in the normal course of its business. As the timing of the fulfillment of the commitment to fund partnership interests cannot be predicted, such obligations are presented in the less than one year category. The timing of the funding of mortgage loans is based on the expiration date of the commitment. The amounts of these unfunded commitments at December 31, 2023 was $761,793, of which $714,375 were related to limited partnership interests. Related party transactions comprise $57,020 of the unfunded limited partnership interests at December 31, 2023. At December 31, 2023, $756,793 was due within one year, and $5,000 was due after five years.
(4) Other liabilities - Other liabilities include those other liabilities which represent contractual obligations not included elsewhere in the table above. If the timing of the payment of any other liabilities was sufficiently uncertain, the amounts were included in the less than one year category. Other liabilities presented in the table above include:
| • | | Expected benefit payments for the Company’s supplemental executive retirement plan through 2023 |
Rent expense for the years ended December 31, 2023, 2022 and 2021 were $29,844, $29,024 and $30,243 respectively.
The Company has a replacement revolving credit facility agreement in the amount of $50,000 for general corporate purposes effective November 1, 2023, and expires on November 1, 2028. The original agreement entered on March 1, 2018, and subsequently amended, expired on October 31, 2023. Interest accrues at a rate dependent on various conditions and terms of borrowings. The agreement requires, among other things, the Company to maintain a minimum adjusted net worth, of $2,664,522, as defined in the credit facility agreement (compiled on the unconsolidated statutory accounting basis prescribed by the NAIC), at any time. The Company was in compliance with all covenants at December 31, 2023 and 2022. At December 31, 2023 and 2022, there were no outstanding amounts related to the current and prior credit facilities.
In addition, the Company has other letters of credit with a total amount of $8,595, renewable annually for an indefinite period of time. At December 31, 2023 and 2022, there were no outstanding amounts related to those letters of credit.
In October 2020, the Company became a member of the FHLB of Topeka. FHLB provides access to billions of low-cost funding dollars to banks, credit unions, insurance companies and community development financial institutions in the United States. At December 31, 2023, the Company had an estimated borrowing capacity of approximately $442,426. All borrowings must be collateralized and the required collateral amount is based on the type of investment securities pledged. No amounts were borrowed as of December 31, 2023 and 2022. Additionally, the Company was required to purchase FHLB of Topeka stock and, at December 31, 2023 and 2022, owns $500 and $501, respectively, of Class A stock which are currently not eligible for redemption.
64
EMPOWER ANNUITY INSURANCE COMPANY OF AMERICA
Notes to Statutory Financial Statements
(In Thousands, Except Share Amounts)
Contingencies
From time to time, the Company may be threatened with, or named as a defendant in, lawsuits, arbitrations, and administrative claims. Any such claims that are decided against the Company could harm the Company’s business. The Company is also subject to periodic regulatory audits and inspections which could result in fines or other disciplinary actions. Unfavorable outcomes in such matters may result in a material impact on the Company’s financial position, results of operations, or cash flows.
The liabilities transferred and ceding commission received at the closing of the MassMutual transaction are subject to future adjustments. In December 2021, MassMutual provided the Company with its listing of proposed adjustments with respect to the liabilities transferred. In December 2021, the Company formally objected to these proposed adjustments. The Master Transaction Agreement requires the parties to attempt to resolve these differences in an informal manner. As of December 2022, the disputed amounts were resolved and the adjustments were not significant to the overall financial statements.
The Company and certain of its subsidiaries are defendants in legal actions, including class actions, relating to the costs and features of their retirement and fund products and the conduct of their businesses. Management believes the claims are without merit and will be vigorously defending these actions. Based on the information presently known these actions will not have a material adverse effect on the financial position of the Company.
On June 1, 2019, the Company sold, via indemnity reinsurance, substantially all of its individual life insurance and annuity business to Protective Life Insurance Company (Protective Life). In connection with that transaction, the Company provided standard indemnities to the buyer. In 2022, Protective Life made claims under those indemnities. Although it is continuing to review the claims, the Company has established in the second quarter of 2023 a provision for $42,500 in other liabilities for the aggregate potential liability for the claims using available information.
The Company is involved in other various legal proceedings that arise in the ordinary course of its business. In the opinion of management, after consultation with counsel, the likelihood of loss from the resolution of these proceedings is remote and/or the estimated loss is not expected to have a material effect on the Company’s financial position, results of its operations, or cash flows.
The Company and ELAINY have an agreement whereby the Company has committed to provide financial support to ELAINY related to the maintenance of adequate regulatory surplus and liquidity. The Company is obligated to invest in shares of ELAINY in order for ELAINY to maintain the capital and surplus at the greater of 1) $6,000, 2) 200% of ELAINY RBC minimum capital requirements if ELAINY total assets are less than $3,000,000 or 3) 175% of ELAINY RBC minimum capital requirements if ELAINY total assets are $3,000,000 or more. There is no limitation on the maximum potential future payments under the guarantee. The Company has no liability at December 31, 2023 and 2022 for obligations under the guarantee.
65
EMPOWER ANNUITY INSURANCE COMPANY OF AMERICA
Notes to Statutory Financial Statements
(In Thousands, Except Share Amounts)
19. Reconciliation between Annual Statement and Audited Financial Statements
The following table presents as reported in the Annual Statement filed with the Department and the adjustments made to the audited statutory financial statement as of December 31, 2023.
| | | | | | | | | | | | |
| | | Annual
Statement | | | Adjustment | | | Audited Statutory
Financial Statements | |
Balance Sheet: | | | | | | | | | | | | |
Total admitted assets | | $ | 72,153,033 | | | $ | (59,353) | | | $ | 72,093,680 | |
Capital and surplus | | | 3,843,276 | | | | (61,270) | | | | 3,782,006 | |
| | | |
Statutory Statement of Operations: | | | | | | | | | | | | |
Net income | | | 1,088,263 | | | | (62,301) | | | | 1,025,962 | |
| | | |
Statutory Statement of Cash Flows: | | | | | | | | | | | | |
Operating activities | | | (3,206,370) | | | | (75,263) | | | | (3,281,633) | |
| | | | | | | | | | | | |
| | | |
Financing and miscellaneous activities | | | 1,204,387 | | | | 75,263 | | | | 1,279,650 | |
| | | | | | | | | | | | |
20. Subsequent Events
The Company was part of a legal entity reorganization which took place on January 1, 2024. As a result of the reorganization, the Company is now a direct wholly-owned subsidiary of Empower Holdings, LLC (“EHL”), a holding company. EHL is a direct wholly-owned subsidiary of Lifeco U.S. The Company is now the owner of additional U.S. noninsurance subsidiaries, primarily a quantitative asset manager. The Company is in the process of assessing the impact of the reorganization on the Company’s investment in subsidiaries and risk based capital.
Management has evaluated subsequent events for potential recognition or disclosure in the Company’s statutory financial statements through March 29, 2024, the date on which they were issued.
66
SUPPLEMENTAL SCHEDULES
(See Independent Auditors’ Report)
67
EMPOWER ANNUITY INSURANCE COMPANY OF AMERICA
Supplemental Schedule of Selected Statutory Financial Data
As of and for the Year Ended December 31, 2023
| | | | |
| |
Investment income earned: | | | | |
| |
U.S. Government bonds | | $ | 3,360 | |
| |
Other bonds (unaffiliated) | | | 1,006,912 | |
| |
Bonds of affiliates | | | (144 | ) |
| |
Preferred stocks (unaffiliated) | | | 2,946 | |
| |
Preferred stocks of affiliates | | | 2,971 | |
| |
Common stocks (unaffiliated) | | | 52 | |
| |
Mortgage loans | | | 204,415 | |
| |
Real estate | | | 32,253 | |
| |
Contract loans | | | 182,531 | |
| |
Cash, cash equivalents and short-term investments | | | 49,548 | |
| |
Derivative instruments | | | 41,131 | |
| |
Other invested assets | | | 567,873 | |
| |
Aggregate write-ins for investment income | | | 7,959 | |
| | | | |
| |
Gross investment income | | $ | 2,101,807 | |
| | | | |
| |
Real estate owned - Book value less encumbrances: | | $ | 49,381 | |
| |
Mortgage loans - Book value: | | | | |
| |
Commercial mortgages | | $ | 5,840,441 | |
| |
Mortgage loans by standing - Book value: | | | | |
| |
Good standing | | $ | 5,799,249 | |
| |
Interest overdue more than 90 days, not in foreclosure | | | 37,669 | |
| |
Foreclosure in process | | | 3,523 | |
| |
Other long-term invested assets - Statement value: | | $ | 963,360 | |
| |
Contract loans | | $ | 3,711,737 | |
| |
Bonds and stocks of parents, subsidiaries and affiliates - Book value: | | | | |
| |
Bonds | | $ | 558 | |
| |
Common stocks | | $ | 1,848,339 | |
| |
Bonds and short-term investments by maturity and NAIC designation: | | | | |
| |
Bonds by maturity - Statement value: | | | | |
| |
Due within one year or less | | $ | 2,406,820 | |
| |
Over 1 year through 5 years | | | 10,997,389 | |
| |
Over 5 years through 10 years | | | 9,923,206 | |
| |
Over 10 years through 20 years | | | 2,280,146 | |
| |
Over 20 years | | | 1,618,832 | |
| | | | |
| |
Total by maturity | | $ | 27,226,393 | |
| | | | |
(Continued)
68
EMPOWER ANNUITY INSURANCE COMPANY OF AMERICA
Supplemental Schedule of Selected Statutory Financial Data
As of and for the Year Ended December 31, 2023
| | | | |
| |
Bonds and short-term investments by NAIC designation - Statement value: | | | | |
| |
NAIC 1 | | $ | 14,442,033 | |
| |
NAIC 2 | | | 12,257,352 | |
| |
NAIC 3 | | | 502,004 | |
| |
NAIC 4 | | | 20,967 | |
| |
NAIC 5 | | | 4,037 | |
| | | | |
| |
Total by NAIC designation | | $ | 27,226,393 | |
| | | | |
| |
Total bonds publicly traded | | $ | 14,379,269 | |
| |
Total bonds privately placed | | $ | 12,847,124 | |
| |
Preferred stocks - Statement value | | $ | 82,263 | |
| |
Common stocks - Market value | | $ | 1,848,916 | |
| |
Short-term investments - Book value | | $ | 361,775 | |
| |
Collar, swap and forward agreements open - Statement value | | $ | 229,489 | |
| |
Futures contracts open - Current value | | $ | 3,141 | |
| |
Cash on deposit | | $ | 71,244 | |
| |
Life insurance in-force: | | | | |
| |
Ordinary | | $ | 5,420,687 | |
| |
Group life | | | — | |
| |
Life insurance policies with disability provisions in-force: | | | | |
| |
Ordinary | | $ | 10,294 | |
| |
Group life | | | 15,310 | |
| |
Supplementary contracts in-force: | | | | |
| |
Ordinary - not involving life contingencies: | | | | |
| |
Amount on deposit | | $ | — | |
| |
Income payable | | | — | |
| |
Ordinary - involving life contingencies: | | | | |
| |
Income payable | | | — | |
| |
Group - not involving life contingencies: | | | | |
| |
Amount on deposit | | | — | |
| |
Income payable | | | — | |
| |
Group - involving life contingencies: | | | | |
| |
Income payable | | | 118 | |
| |
Annuities: | | | | |
| |
Ordinary: | | | | |
| |
Immediate - amount of income payable | | $ | — | |
| |
Deferred - fully paid account balance | | | 137 | |
| |
Deferred - not fully paid - account balance | | | — | |
(Continued)
69
EMPOWER ANNUITY INSURANCE COMPANY OF AMERICA
Supplemental Schedule of Selected Statutory Financial Data
As of and for the Year Ended December 31, 2023
| | | | |
| |
Group: | | | | |
| |
Certificates - amount of income payable | | $ | — | |
| |
Certificates - fully paid account balance | | | 28 | |
| |
Certificates - not fully paid account balance | | | 47,992,734 | |
| |
Accident and health insurance - equivalent premiums in-force: | | | | |
| |
Group | | $ | — | |
| |
Deposit funds and dividend accumulations | | | | |
| |
Deposit funds - account balance | | | 9,529,406 | |
| |
Deposit accumulations - account balance | | | 15,144 | |
| |
Claim payments: | | | | |
| |
Group accident and health: | | | | |
| |
2023 | | $ | — | |
| |
2022 | | | — | |
| |
2021 | | | 4,009 | |
| |
2020 | | | 9,856 | |
| |
2019 | | | 5,917 | |
| |
Prior | | | 22,706 | |
(Concluded)
70
EMPOWER ANNUITY INSURANCE COMPANY OF AMERICA
Supplemental Schedule Regarding Reinsurance Contracts with Risk-Limiting Features
As of and for the Year Ended December 31, 2023
Supplemental Schedule of the Annual Audit Report
Supplemental Schedule Regarding Reinsurance Contracts with Risk-Limiting Features
Reinsurance contracts subject to Appendix A-791—Life and Health Reinsurance Agreements of the NAIC Accounting Practices and Procedures Manual:
The Company has not entered into, renewed or amended reinsurance contracts on or after January 1, 1996, which include risk-limiting features, as described in SSAP No. 61R—Life, Deposit-Type and Accident and Health Reinsurance (SSAP No. 61R). Deposit accounting, as described in SSAP No. 61R was not applied for reinsurance contracts, which include risk-limiting features since the Company does not have applicable contracts.
Reinsurance contracts NOT subject to Appendix A-791—Life and Health Reinsurance Agreements of the NAIC Accounting Practices and Procedures Manual:
The Company has not applied reinsurance accounting, as described in in SSAP No. 61R, to reinsurance contracts entered into, renewed or amended on or after January 1, 1996, which include risk-limiting features, as described in SSAP No. 61R since the Company does not have applicable contracts. As such, the reinsurance reserve credit, as described in SSAP No. 61R, was not reduced.
Payments to reinsurers (excluding reinsurance contracts with a federal or state facility):
The Company has not entered into, renewed or amended reinsurance contracts on or after January 1, 1996, which contain provisions that allow (1) the reporting of losses or settlements with the reinsurer to occur less frequently than quarterly or (2) payments due from the reinsurer to not be made in cash within ninety days of the settlement date unless there is no activity during the period.
The Company has not entered into, renewed or amended reinsurance contracts on or after January 1, 1996, which contain a payment schedule, accumulating retentions from multiple years or any features inherently designed to delay timing of the reimbursement to the ceding company.
Reinsurance contracts NOT subject to Appendix A-791—Life and Health Reinsurance Agreements of the NAIC Accounting Practices and Procedures Manual and NOT yearly-renewable term that meet the risk transfer requirements under SSAP No. 61R:
The Company has not reflected reinsurance reserve credit for any reinsurance contracts entered into, renewed or amended on or after January 1, 1996 for the following:
| | b. | Non-proportional reinsurance that does not result in significant surplus relief |
The Company does not prepare financial information under generally accepted accounting principles (“GAAP”). As such, the Company has not ceded any risk during the period ended December 31, 2023 under any reinsurance contracts entered into, renewed or amended on or after January 1, 1996, that applies reinsurance accounting, as described under SSAP No. 61R for statutory accounting principles (SAP) and applies deposit accounting under GAAP.
The Company has not ceded any risk during the period ended December 31, 2023 under any reinsurance contracts entered into, renewed or amended on or after January 1, 1996, accounted for as reinsurance under GAAP and as a deposit under SSAP No. 61R.
71
PART II
INFORMATION NOT REQUIRED IN PROSPECTUS
Item 13.
Other Expenses of Issuance and Distribution.
The expenses in connection with the issuance and distribution of the Contracts, other than any underwriting discounts and commissions, are as follows (except for the Securities and Exchange Commission Filing Fee, all amounts shown are estimates):
Securities and Exchange Commission Registration Fees | |
| |
Accounting fees and expenses | |
| |
| |
Total expenses (approximate) | |
* Registration fees were previously paid for File No. 333-169563.
Insofar as indemnification for liability arising under the Securities Act of 1933 may be permitted to directors, officers and controlling persons of the Registrant pursuant to the foregoing provisions, or otherwise, the Registrant has been advised that in the opinion of the Securities and Exchange Commission such indemnification is against public policy as expressed in the Act and is, therefore, unenforceable. In the event that a claim for indemnification against such liabilities (other than the payment by the Registrant of expenses incurred or paid by a director officer or controlling person of the Registrant in the successful defense of any action, suit or proceeding) is asserted by such director, officer or controlling person in connection with the securities being registered, the Registrant will, unless in the opinion of its counsel the matter has been settled by controlling precedent, submit to a court of appropriate jurisdiction the question whether such indemnification by it is against public policy as expressed in the Act and will be governed by the final adjudication of such issue.
Provisions exist under the Colorado Business Corporation Act and the Bylaws of Empower Annuity Insurance Company of America whereby Empower Annuity Insurance Company of America may indemnify a director, officer or controlling person of Empower Annuity Insurance Company of America against liabilities arising under the Securities Act of 1933. The following excerpts contain the substance of these provisions:
Colorado Business Corporation Act
Article 109 – INDEMNIFICATION
Section 7-109-101. Definitions.
As used in this article 109:
| “Corporation” includes any domestic or foreign entity that is a predecessor of a corporation by reason of a merger or other transaction in which the predecessor’s existence ceased upon consummation of the transaction. |
| “Director” means an individual who is or was a director of a corporation or an individual who, while a director of a corporation, is or was serving at the corporation's request as a director, an officer, an agent, an associate, an employee, a fiduciary, a manager, a member, a partner, a promoter, or a trustee of, or in any other capacity with, another person or an employee benefit plan. A director is considered to be serving an employee benefit plan at the corporation's request if the director's duties to the corporation also impose duties on, or otherwise involve services by, the director to the plan or to participants in or beneficiaries of the plan. “Director” includes, unless the context requires otherwise, the estate or personal representative of a deceased director. |
| “Expenses” includes counsel fees. |
| “Liability” means the obligation incurred with respect to a proceeding to pay a judgment, settlement, penalty, fine, including an excise tax assessed with respect to an employee benefit plan, or reasonable expenses. |
| “Official capacity” means, when used with respect to a director, the office of director in a corporation and, when used with respect to a person other than a director as contemplated in section 7-109-107, the office in a corporation held by the officer or the employment, fiduciary, or agency relationship undertaken by the employee, fiduciary, or agent on behalf of the corporation. “Official capacity” does not include service for any other domestic or foreign corporation or other person or employee benefit plan. |
| “Party” includes a person who was, is, or is threatened to be made a named defendant or respondent in a proceeding. |
| “Proceeding” means any threatened, pending, or completed action, suit, or proceeding, whether civil, criminal, administrative, arbitrative, or investigative and whether formal or informal. |
Section 7-109-102. Authority to indemnify directors.
| Except as provided in subsection (4) of this section, a corporation may indemnify an individual made a party to a proceeding, because the individual is or was a director, against liability incurred in the proceeding if: |
| | The individual's conduct was in good faith; and |
| | The individual reasonably believed: |
| | | In the case of conduct in an official capacity with the corporation, that the conduct was in the corporation's best interests; and |
| | | In all other cases, that the conduct was at least not opposed to the corporation's best interests; and |
| | In the case of any criminal proceeding, the individual had no reasonable cause to believe the individual's conduct was unlawful. |
| A director’s conduct with respect to an employee benefit plan for a purpose the director reasonably believed to be in the interests of the participants in or beneficiaries of the plan is conduct that satisfies the requirement of subparagraph (II) of paragraph (b) of subsection (1) of this section. A director’s conduct with respect to an employee benefit plan for a purpose that the director did not reasonably believe to be in the interests of the participants in or beneficiaries of the plan shall be deemed not to satisfy the requirements of paragraph (a) of subsection (1) of this section. |
| The termination of a proceeding by judgment, order, settlement, or conviction, or upon a plea of nolo contendere or its equivalent does not, of itself, create a presumption that the director did not meet the relevant standard of conduct described in this section. |
| A corporation may not indemnify a director under this section: |
| | In connection with a proceeding by or in the right of the corporation in which the director was adjudged liable to the corporation except for reasonable expenses incurred in connection with the proceeding if it is determined that the director has met the relevant standard of conduct under subsection (1) of this section; or |
| | In connection with any other proceeding charging that the director derived an improper personal benefit, whether or not involving action in an official capacity, in which proceeding the director was adjudged liable on the basis that the director derived an improper personal benefit. |
| Indemnification permitted under this section in connection with a proceeding by or in the right of the corporation is limited to reasonable expenses incurred in connection with the proceeding. |
Section 7-109-103. Mandatory Indemnification of Directors.
Unless limited by its articles of incorporation, a corporation shall indemnify an individual who was wholly successful, on the merits or otherwise, in the defense of any proceeding to which the individual was a party because the individual is or was a director, against reasonable expenses incurred by the individual in connection with the proceeding.
Section 7-109-104. Advance of Expenses to Directors.
| A corporation may, before final disposition of a proceeding, pay for or reimburse the reasonable expenses incurred by an individual who is a party to a proceeding because that person is a director if: |
| | The director delivers to the corporation a written affirmation of the director's good faith belief that; |
| | | The director has met the relevant standard of conduct described in section 7-109-102; or |
| | | The proceeding involves conduct for which liability has been eliminated under a provision in the articles of incorporation as authorized by section 7-102-102(2)(d); and |
| | The director delivers to the corporation a written undertaking, executed personally or on the director's behalf, to repay any funds advanced if the director is not entitled to mandatory indemnification under section 7-109-103 and it is ultimately determined under section 7-109-105 or 7-109-106 that the director has not met the relevant standard of conduct described in section 7-109-102. |
| The undertaking required by subsection (1)(b) of this section is an unlimited general obligation of the director but need not be secured and may be accepted without reference to financial ability to make repayment. |
| Authorizations of payments under this section shall be made in the manner specified in section 7-109-106. |
Section 7-109-105. Court-Ordered Indemnification of Directors.
| Unless otherwise provided in the articles of incorporation, a director who is or was a party to a proceeding may apply for indemnification or an advance of expenses to the court conducting the proceeding or to another court of competent jurisdiction. After receipt of an application and after giving any notice the court considers necessary, the court may order indemnification or an advance of expenses in the following manner: |
| | If it determines that the director is entitled to mandatory indemnification under section 7-109-103, the court shall order indemnification, in which case the court shall also order the corporation to pay the director's reasonable expenses incurred to obtain court-ordered indemnification. |
| | If it determines that the director is entitled to indemnification or an advance of expenses under section 7- 109-109(1), the court shall order indemnification or an advance of expenses, as applicable, in which case the court shall also order the corporation to pay the director's reasonable expenses incurred to obtain court- ordered indemnification or advance of expenses. |
| | If it determines that the director is fairly and reasonably entitled to indemnification or an advance of expenses in view of all the relevant circumstances, whether or not the director met the standard of conduct set forth in section 7-109-102(1), failed to comply with section 7-109-104, or was adjudged liable in the circumstances described in section 7-109-102(4), the court may order such indemnification or advance of expenses as the court deems proper; except that the indemnification with respect to any proceeding in which liability has been adjudged in the circumstances described in section 7-109-102(4) is limited to reasonable expenses incurred in connection with the proceeding and reasonable expenses incurred to obtain court-ordered indemnification. |
Section 7-109-106. Determination and Authorization of Indemnification of Directors.
| A corporation may not indemnify a director under section 7-109-102 unless authorized in the specific case after a determination has been made that indemnification of the director is permissible in the circumstances because the director has met the standard of conduct set forth in section 7-109-102. A corporation shall not advance expenses to a director under section 7-109-104 unless authorized in the specific case after the written affirmation and undertaking required by section 7-109-104(1)(a) and (1)(b) are received. |
| The determinations required by subsection (1) of this section must be made: |
| | If there are two or more disinterested directors, by the board of directors by a majority vote of all the disinterested directors, a majority of whom constitute a quorum for this purpose, or by a majority vote of a committee of the board of directors appointed by such a vote, which committee consists of two or more disinterested directors; |
| | By independent legal counsel selected in the manner specified in subsection (2)(a) of this section or, if there are fewer than two disinterested directors, by independent legal counsel selected by a majority vote of the full board of directors; or |
| | By the shareholders, but shares owned by or voted under the control of a director who at the time is not a disinterested director may not be voted on the determination. |
| Authorization of indemnification and an advance of expenses must be made in the same manner as the determination that indemnification or an advance of expenses is permissible; except that, if the determination that indemnification or an advance of expenses is permissible is made by independent legal counsel, authorization of indemnification and an advance of expenses must be made by the body that selected the counsel. |
Section 7-109-107. Indemnification of Officers, Employees, Fiduciaries, and Agents.
| An officer is entitled to mandatory indemnification or an advance of expenses under section 7-109-103, and is entitled to apply for court-ordered indemnification or an advance of expenses under section 7-109-105, in each case to the same extent as a director. |
| A corporation may indemnify and advance expenses to an officer, employee, fiduciary, or agent of the corporation to the same extent as to a director. |
| A corporation may also indemnify and advance expenses to an officer, employee, fiduciary, or agent who is not a director to such further extent as may be provided for by its articles of incorporation, bylaws, general or specific action of its board of directors or shareholders, or contract. This subsection (3) applies to an officer who is also a director if the basis on which the officer is made a party to the proceeding is an act or omission solely as an officer. |
Section 7-109-108. Insurance.
A corporation may purchase and maintain insurance on behalf of a person who is or was a director, officer, employee, fiduciary, or agent of the corporation, or who, while a director, officer, employee, fiduciary, or agent of the corporation, is or was serving at the request of the corporation as a director, officer, agent, associate, employee, fiduciary, manager, member, partner, promoter, or trustee of, or in any other capacity with, another person or an employee benefit plan, against liability asserted against or incurred by the person in that capacity or arising from the person's status as a director, officer, employee, fiduciary, or agent, whether or not the corporation would have power to indemnify the person against the same liability under section 7-109-102, 7-109-103, or 7-109-107. Any such insurance may be procured from any insurance company designated by the board of directors, whether the insurance
company is formed under the law of this state or any other jurisdiction of the United States or elsewhere, including any insurance company in which the corporation has an equity or any other interest through stock ownership or otherwise.
Section 7-109-109. Variation by corporate action.
| A corporation may, by a provision in its articles of incorporation or bylaws or in a resolution adopted or a contract approved by its board of directors or shareholders, obligate itself in advance of the act or omission giving rise to a proceeding to provide indemnification in accordance with section 7-109-102 or advance funds to pay for or reimburse expenses in accordance with section 7-109-104. Such an obligatory provision; |
| | Satisfies the requirements for authorization, but not determination, referred to in section 7-109-106. |
| | That obligates the corporation to provide indemnification to the fullest extent permitted by law obligates the corporation to advance funds to pay for or reimburse expenses in accordance with section 7-109-104 to the fullest extent permitted by law, unless the provision specifically provides otherwise. |
| A right of indemnification or to advances of expenses created by this article 109 or under subsection (1) of this section and in effect at the time of an act or omission must not be eliminated or impaired with respect to the act or omission by an amendment of the articles of incorporation or bylaws or a resolution of the board of directors or shareholders, adopted after the occurrence of the act or omission, unless, in the case of a right created under subsection (1) of this section, the provision creating the right and in effect at the time of the act or omission explicitly authorizes the elimination or impairment after the act or omission has occurred. |
| A provision specified in subsection (1) of this section does not obligate the corporation to indemnify or advance expenses to a director of a predecessor of the corporation pertaining to conduct with respect to the predecessor, unless otherwise specifically provided. A provision for indemnification or an advance of expenses in the articles of incorporation, bylaws, or a resolution of the board of directors or shareholders of a predecessor of the corporation in a merger or in a contract to which the predecessor is a party, existing at the time the merger takes effect, is governed by section 7-90-204(1). |
| Subject to subsection (2) of this section, a corporation may, by a provision in its articles of incorporation, limit any of the rights to indemnification or an advance of expenses created by or pursuant to this article 109. |
| Sections 7-109-101 to 7-109-108 do not limit a corporation's power to pay or reimburse expenses incurred by a director in connection with an appearance as a witness in a proceeding at a time when the director has not been made a named defendant or respondent in the proceeding. |
Section 7-109-110. Notice to Shareholders of Indemnification of Director.
If a corporation indemnifies or advances expenses to a director under this article 109 in connection with a proceeding by or in the right of the corporation, the corporation shall give notice of the indemnification or advance to the shareholders with or before the notice of the next shareholders' meeting. If the next shareholder action is taken without a meeting at the instigation of the board of directors, the corporation shall give the notice to the shareholders at or before the time the first shareholder signs a document consenting to the action.
Section 7-109-111. Exclusivity
A corporation may provide indemnification or an advance of expenses to a director or an officer only as permitted by this article 109.
Bylaws of Empower Annuity Insurance Company of America
Article IV. Indemnification
SECTION 1. In this Article, the following terms shall have the following meanings:
| | “expenses” means reasonable expenses incurred in a proceeding, including expenses of investigation and preparation, expenses in connection with an appearance as a witness, and fees and disbursement of counsel, accountants or other experts; |
| | “liability” means an obligation incurred with respect to a proceeding to pay a judgment, settlement, penalty or fine; |
| | “party” includes a person who was, is, or is threatened to be made a named defendant or respondent in a proceeding; |
| | “proceeding” means any threatened, pending or completed action, suit, or proceeding whether civil, criminal, administrative or investigative, and whether formal or informal. |
SECTION 2. Subject to applicable law, if any person who is or was a director, officer or employee of the corporation is made a party to a proceeding because the person is or was a director, officer or employee of the corporation, the corporation shall indemnify the person, or the estate or personal representative of the person, from and against all liability and expenses incurred by the person in the proceeding (and advance to the person expenses incurred in the proceeding) if, with respect to the matter(s) giving rise to the proceeding:
| | the person conducted himself or herself in good faith; and |
| | the person reasonably believed that his or her conduct was in the corporation’s best interests; and |
| | in the case of any criminal proceeding, the person had no reasonable cause to believe that his or her conduct was unlawful; and |
| | if the person is or was an employee of the corporation, the person acted in the ordinary course of the person’s employment with the corporation. |
SECTION 3. Subject to applicable law, if any person who is or was serving as a director, officer, trustee or employee of another company or entity at the request of the corporation is made a party to a proceeding because the person is or was serving as a director, officer, trustee or employee of the other company or entity, the corporation shall indemnify the person, or the estate or personal representative of the person, from and against all liability and expenses incurred by the person in the proceeding (and advance to the person expenses incurred in the proceeding) if:
| | the person is or was appointed to serve at the request of the corporation as a director, officer, trustee or employee of the other company or entity in accordance with Indemnification Procedures approved by the Board of Directors of the corporation; and |
| | with respect to the matter(s) giving rise to the proceeding: |
| | | the person conducted himself or herself in good faith; and |
| | | the person reasonably believed that his or her conduct was at least not opposed to the corporation’s best interests (in the case of a trustee of one of the corporation’s staff benefits plans, this means that the person’s conduct was for a purpose the person reasonably believed to be in the interests of the plan participants); and |
| | | in the case of any criminal proceeding, the person had no reasonable cause to believe that his or her conduct was unlawful; and |
| | | if the person is or was an employee of the other company or entity, the person acted in the ordinary course of the person’s employment with the other company or entity. |
Item 15.
Recent Sales of Unregistered Securities.
Item 16.
Exhibits and Financial Statement Schedules.
| |
| |
| |
| |
| |
| |
| |
| |
| See Opinion of Empower Annuity Insurance Company of America included in Exhibit 5. |
| |
| |
| |
| |
| |
| |
| |
| |
| |
| |
| |
| |
| |
| |
| |
| |
| |
| |
| |
| |
| |
| |
(b) Financial Statement Schedules |
None
(a) The undersigned registrant hereby undertakes:
(1) To file, during any period in which offers or sales are being made of the securities registered hereby, a post-effective amendment to this registration statement:
(i) To include any prospectus required by section 10(a)(3) of the Securities Act of 1933;
(ii) To reflect in the prospectus any facts or events arising after the effective date of this registration statement (or the most recent post-effective amendment hereof) which, individually or in the aggregate, represent a fundamental change in the information set forth in this registration statement. Notwithstanding the foregoing, any increase or decrease in volume of securities offered (if the total dollar value of securities offered would not exceed that which was registered) and any deviation from low or high end estimated offering range may be reflected in the form of prospectus filed with the Commission pursuant to Rule 424(b), if, in the aggregate, the changes in volume and price represent no more than 20 percent change in maximum aggregate offering price set forth in the “Calculation of Registration Fee” table in the effective registration statement; and
(iii) To include any material information with respect to the plan of distribution not previously disclosed in this registration statement or any material change to such information in this registration statement.
(2) That, for the purpose of determining any liability under the Securities Act of 1933, each such post-effective amendment shall be deemed to be a new registration statement relating to the securities offered therein, and the offering of such securities at that time shall be deemed to be the initial bona fide offering thereof.
(3) To remove from registration by means of a post-effective amendment any of the securities being registered which remain unsold at the termination of the offering.
(4) That, for the purpose of determining liability under the Securities Act of 1933 to any purchaser:
(i) If the registrant is subject to Rule 430C (§230.430C of this chapter), each prospectus filed pursuant to Rule 424(b) as part of a registration statement relating to an offering, other than registration statements relying on Rule 430B or other than prospectuses filed in reliance on Rule 430A (§230.430A of this chapter), shall be deemed to be part of and included in the registration statement as of the date it is first used after effectiveness. Provided, however, that no statement made in a registration statement or prospectus that is part of the registration statement or made in a document incorporated or deemed incorporated by reference into the registration statement or prospectus that is part of the registration statement will, as to a purchaser with a time of contract of sale prior to such first use, supersede or modify any statement that was made in the registration statement or prospectus that was part of the registration or made in any such document immediately prior to such date of first use.
(5) That, for the purpose of determining liability of the registrant under the Securities Act of 1933 to any purchaser in the initial distribution of the securities: The undersigned registrant undertakes that in a primary offering of securities of the undersigned registrant pursuant to this registration statement, regardless of the underwriting method used to sell the securities to the purchaser, if the securities are offered or sold to such purchaser by means of any of the following communications, the undersigned registrant will be seller to the purchaser and will be considered to offer or sell such securities to such purchaser:
(i) Any preliminary prospectus or prospectus of the undersigned registrant relating to the offering required to be filed pursuant to Rule 424;
(ii) Any free writing prospectus relating to the offering prepared by or on behalf of the undersigned registrant or used or referred to by the undersigned registrant;
(iii) The portion of any other free writing prospectus relating to the offering containing materials or information about the undersigned registrant or their securities provided by or on behalf of the undersigned registrant; and
(iv) Any other communication that is an offer in the offering made by the undersigned registrant to the purchaser.
(b) In so far as indemnification for liability arising under the Securities Act of 1933 (the “Act”) may be permitted to directors, officers and controlling persons of the Registrant pursuant to the foregoing provisions, or otherwise, the registrant has been advised that, in the opinion of the Securities and Exchange Commission, such indemnification is against public policy as expressed in the Act and is, therefore, unenforceable. In the event that a claim for indemnification against such liabilities (other than the payment by the registrant of expenses incurred or paid by a director, officer or controlling person of the registrant in the successful defense of any action, suit or proceeding) is asserted by such director, officer or controlling person in connection with the securities being registered, the registrant will, unless in the opinion of its counsel the matter has been settled by controlling precedent, submit to a court of appropriate jurisdiction the question whether such indemnification by it is against public policy as expressed in the Act and will be governed by the final adjudication of such issue.
SIGNATURES
Pursuant to the requirements of the Securities Act of 1933, the registrant has caused this Registration Statement to be signed on its behalf by the undersigned, thereunto duly authorized, in the City of Greenwood Village, and State of Colorado on this 19th day of April, 2024.
EMPOWER ANNUITY INSURANCE COMPANY OF AMERICA (Registrant) |
| |
| J.D. Kreider Senior Vice President |
Pursuant to the requirements of the Securities Act of 1933, this Registration Statement has been signed by the following persons in the capacities and on the dates indicated.
| | |
| | |
|
| President and Chief Executive Officer | |
|
| | |
| | |
| | |
| | |
| | |
| | |
/s/ Paul G. Desmarais III | | |
| | |
| | |
| | |
| | |
| | |
| | |
| | |
| | |
| | |
| | |
| | |
| | |
| | |
| | |
| | |
| | |
| | |
| | |
| | |
| | |
| | |
| | |
| | |
| | |
| | |
| | |
| Senior Vice President & Chief Financial Officer | |
| | |
| | |
| | |
| | *Attorney-in-fact pursuant to Power of Attorney | |
| |